Embed Size (px)
Citation preview
Senior Community Service Employment Program Analysis of Service to Minority Individuals, PY 2018
Volume II
US Department of Labor
Employment and Training Administration
Office of Workforce Investment
Submitted by:
The Charter Oak Group, LLC
June 30, 2020
Page 2 of 199
Table of Contents
Technical Notes on Reading the Tables in Appendices A and B ................................................3
Appendix A: Participation Tables, Grantees ................................................................................4 Table 1: Grantees by Minority Overall ...................................................................................4
Table 2: Grantees by Hispanic ................................................................................................7 Table 3. Grantees by Black ................................................................................................... 10
Table 4. Grantees by Asian .................................................................................................... 13 Table 5. Grantees by American Indian ................................................................................... 16
Table 6. Grantees by Pacific Islander ..................................................................................... 19
Appendix B: Participation Tables, National Grantee by State ................................................... 22
Technical Notes on Reading the Tables in Appendices C-H ....................................................... 67
Appendix C: Employment in Q2 Tables, Grantees ..................................................................... 68
Table 1: Employment in Q2, Grantees by Race ..................................................................... 68 Table 2: Employment in Q2, Grantees by Ethnicity ............................................................... 80
Table 3: Employment in Q2, Grantees by Minority Status ..................................................... 85
Appendix D: Employment in Q4 Tables, Grantees ..................................................................... 90
Table 1: Employment in Q4, Grantees by Race ..................................................................... 90 Table 2: Employment in Q4, Grantees by Ethnicity ............................................................. 102 Table 3: Employment in Q4, Grantees by Minority Status ................................................... 107
Appendix E: Median Earnings Tables, Grantees ..................................................................... 112 Table 1: Median Earnings, Grantees by Race....................................................................... 112
Table 2: Median Earnings, Grantees by Ethnicity ................................................................ 114 Table 3: Median Earnings, Grantees by Minority Status ...................................................... 116
Appendix F: Employment in Q2 Tables, National Grantees by State ........................................ 118 Table 1: Employment in Q2, National Grantees by State, by Race ....................................... 118
Table 2: Employment in Q2, National Grantees by State, by Ethnicity ................................ 137 Table 3: Employment in Q2, National Grantees by State, by Minority Status ...................... 145
Appendix G: Employment in Q4, National Grantees by State .................................................. 153 Table 1: Employment in Q4, National Grantees by State, by Race ....................................... 153
Table 2: Employment in Q4, National Grantees by State, by Ethnicity ................................ 172 Table 3: Employment in Q4, National Grantees by State, by Minority Status ...................... 180
Appendix H: Median Earnings Tables, National Grantees by State ......................................... 188 Table 1: Median Earnings, National Grantees by State, by Race .......................................... 188
Table 2: Median Earnings, National Grantees by State, by Ethnicity ................................... 192 Table 3: Median Earnings, National Grantees by State, by Minority Status.......................... 196
Page 3 of 199
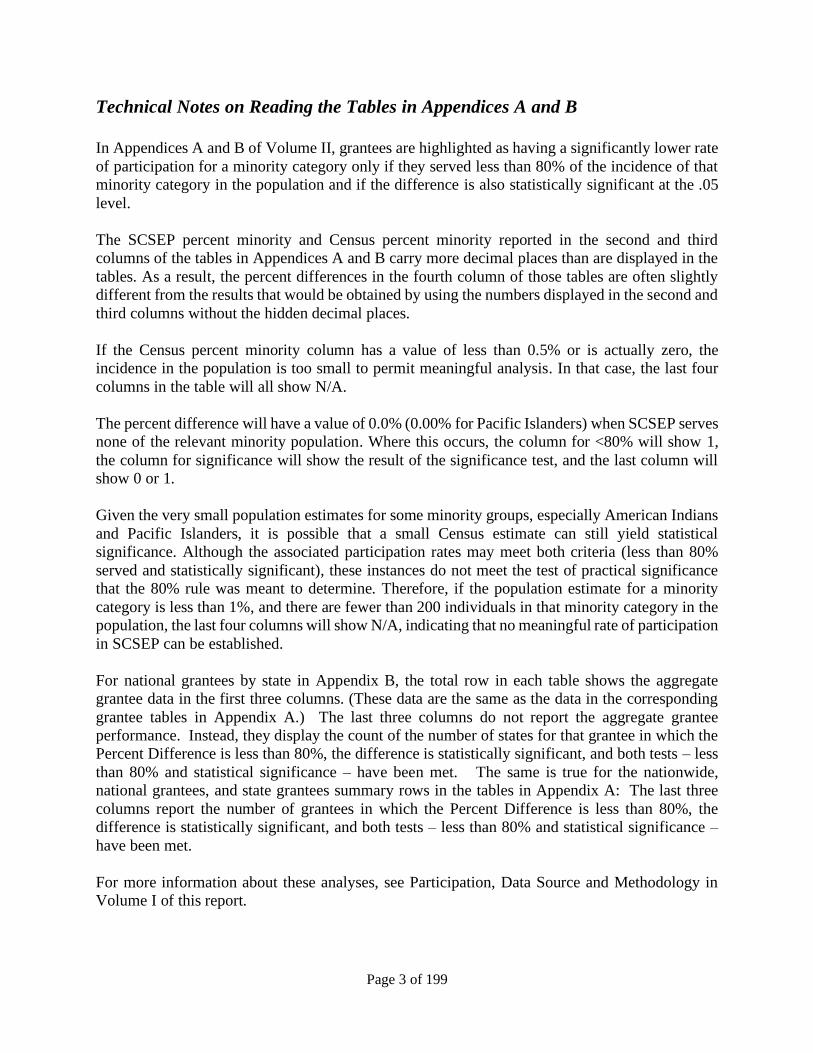
Technical Notes on Reading the Tables in Appendices A and B
In Appendices A and B of Volume II, grantees are highlighted as having a significantly lower rate
of participation for a minority category only if they served less than 80% of the incidence of that
minority category in the population and if the difference is also statistically significant at the .05
level.
The SCSEP percent minority and Census percent minority reported in the second and third
columns of the tables in Appendices A and B carry more decimal places than are displayed in the
tables. As a result, the percent differences in the fourth column of those tables are often slightly
different from the results that would be obtained by using the numbers displayed in the second and
third columns without the hidden decimal places.
If the Census percent minority column has a value of less than 0.5% or is actually zero, the
incidence in the population is too small to permit meaningful analysis. In that case, the last four
columns in the table will all show N/A.
The percent difference will have a value of 0.0% (0.00% for Pacific Islanders) when SCSEP serves
none of the relevant minority population. Where this occurs, the column for <80% will show 1,
the column for significance will show the result of the significance test, and the last column will
show 0 or 1.
Given the very small population estimates for some minority groups, especially American Indians
and Pacific Islanders, it is possible that a small Census estimate can still yield statistical
significance. Although the associated participation rates may meet both criteria (less than 80%
served and statistically significant), these instances do not meet the test of practical significance
that the 80% rule was meant to determine. Therefore, if the population estimate for a minority
category is less than 1%, and there are fewer than 200 individuals in that minority category in the
population, the last four columns will show N/A, indicating that no meaningful rate of participation
in SCSEP can be established.
For national grantees by state in Appendix B, the total row in each table shows the aggregate
grantee data in the first three columns. (These data are the same as the data in the corresponding
grantee tables in Appendix A.) The last three columns do not report the aggregate grantee
performance. Instead, they display the count of the number of states for that grantee in which the
Percent Difference is less than 80%, the difference is statistically significant, and both tests – less
than 80% and statistical significance – have been met. The same is true for the nationwide,
national grantees, and state grantees summary rows in the tables in Appendix A: The last three
columns report the number of grantees in which the Percent Difference is less than 80%, the
difference is statistically significant, and both tests – less than 80% and statistical significance –
have been met.
For more information about these analyses, see Participation, Data Source and Methodology in
Volume I of this report.
Page 4 of 199
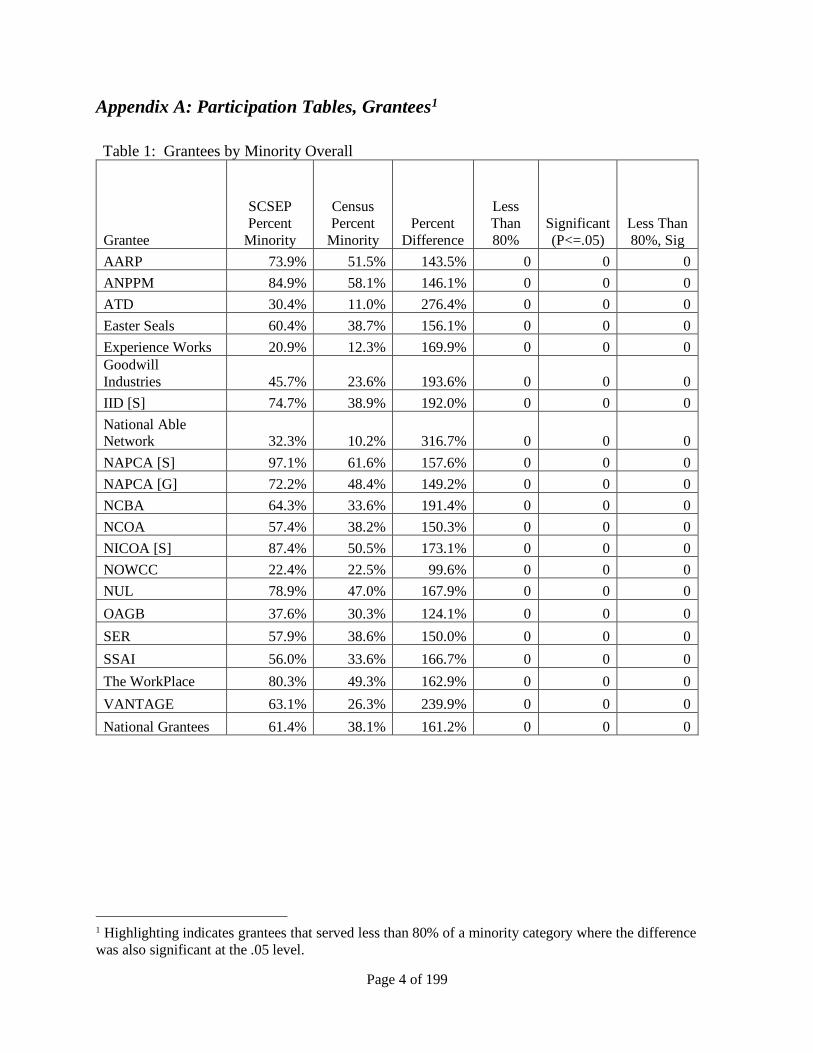
Appendix A: Participation Tables, Grantees1
Table 1: Grantees by Minority Overall
Grantee
SCSEP
Percent
Minority
Census
Percent
Minority
Percent
Difference
Less
Than
80%
Significant
(P<=.05)
Less Than
80%, Sig
AARP 73.9% 51.5% 143.5% 0 0 0
ANPPM 84.9% 58.1% 146.1% 0 0 0
ATD 30.4% 11.0% 276.4% 0 0 0
Easter Seals 60.4% 38.7% 156.1% 0 0 0
Experience Works 20.9% 12.3% 169.9% 0 0 0
Goodwill
Industries 45.7% 23.6% 193.6% 0 0 0
IID [S] 74.7% 38.9% 192.0% 0 0 0
National Able Network 32.3% 10.2% 316.7% 0 0 0
NAPCA [S] 97.1% 61.6% 157.6% 0 0 0
NAPCA [G] 72.2% 48.4% 149.2% 0 0 0
NCBA 64.3% 33.6% 191.4% 0 0 0
NCOA 57.4% 38.2% 150.3% 0 0 0
NICOA [S] 87.4% 50.5% 173.1% 0 0 0
NOWCC 22.4% 22.5% 99.6% 0 0 0
NUL 78.9% 47.0% 167.9% 0 0 0
OAGB 37.6% 30.3% 124.1% 0 0 0
SER 57.9% 38.6% 150.0% 0 0 0
SSAI 56.0% 33.6% 166.7% 0 0 0
The WorkPlace 80.3% 49.3% 162.9% 0 0 0
VANTAGE 63.1% 26.3% 239.9% 0 0 0
National Grantees 61.4% 38.1% 161.2% 0 0 0
1 Highlighting indicates grantees that served less than 80% of a minority category where the difference
was also significant at the .05 level.
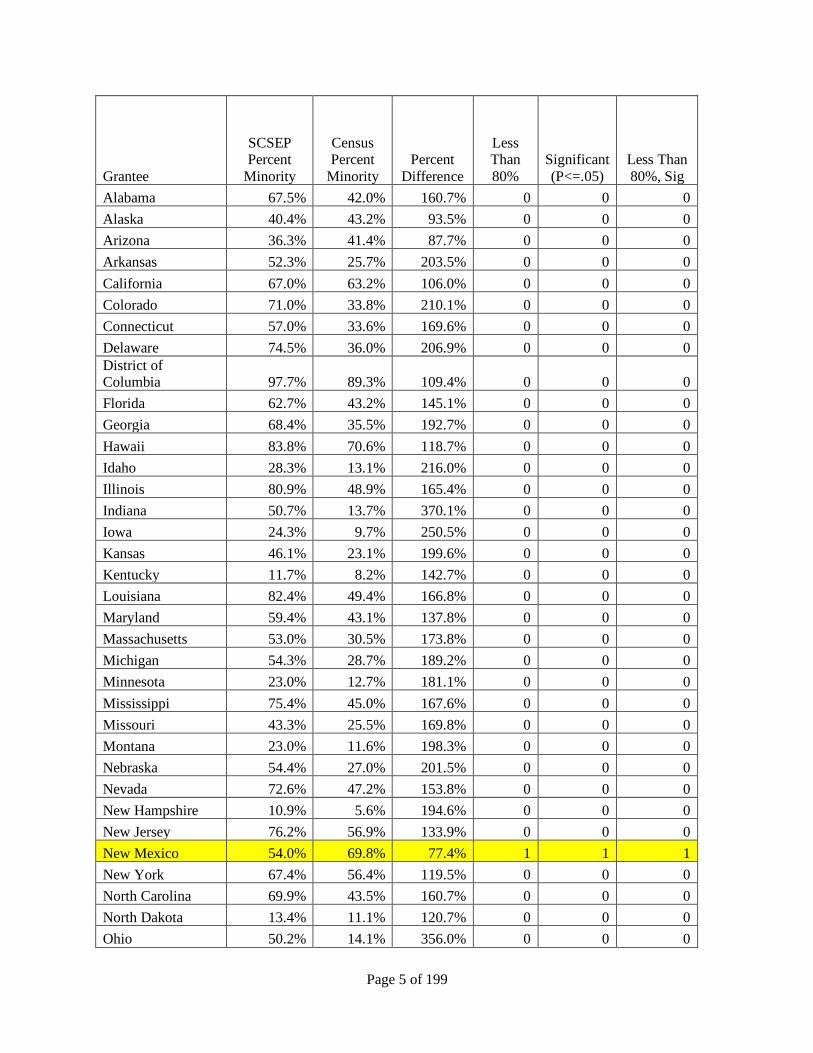
Page 5 of 199
Grantee
SCSEP Percent
Minority
Census Percent
Minority
Percent
Difference
Less Than
80%
Significant
(P<=.05)
Less Than
80%, Sig
Alabama 67.5% 42.0% 160.7% 0 0 0
Alaska 40.4% 43.2% 93.5% 0 0 0
Arizona 36.3% 41.4% 87.7% 0 0 0
Arkansas 52.3% 25.7% 203.5% 0 0 0
California 67.0% 63.2% 106.0% 0 0 0
Colorado 71.0% 33.8% 210.1% 0 0 0
Connecticut 57.0% 33.6% 169.6% 0 0 0
Delaware 74.5% 36.0% 206.9% 0 0 0
District of Columbia 97.7% 89.3% 109.4% 0 0 0
Florida 62.7% 43.2% 145.1% 0 0 0
Georgia 68.4% 35.5% 192.7% 0 0 0
Hawaii 83.8% 70.6% 118.7% 0 0 0
Idaho 28.3% 13.1% 216.0% 0 0 0
Illinois 80.9% 48.9% 165.4% 0 0 0
Indiana 50.7% 13.7% 370.1% 0 0 0
Iowa 24.3% 9.7% 250.5% 0 0 0
Kansas 46.1% 23.1% 199.6% 0 0 0
Kentucky 11.7% 8.2% 142.7% 0 0 0
Louisiana 82.4% 49.4% 166.8% 0 0 0
Maryland 59.4% 43.1% 137.8% 0 0 0
Massachusetts 53.0% 30.5% 173.8% 0 0 0
Michigan 54.3% 28.7% 189.2% 0 0 0
Minnesota 23.0% 12.7% 181.1% 0 0 0
Mississippi 75.4% 45.0% 167.6% 0 0 0
Missouri 43.3% 25.5% 169.8% 0 0 0
Montana 23.0% 11.6% 198.3% 0 0 0
Nebraska 54.4% 27.0% 201.5% 0 0 0
Nevada 72.6% 47.2% 153.8% 0 0 0
New Hampshire 10.9% 5.6% 194.6% 0 0 0
New Jersey 76.2% 56.9% 133.9% 0 0 0
New Mexico 54.0% 69.8% 77.4% 1 1 1
New York 67.4% 56.4% 119.5% 0 0 0
North Carolina 69.9% 43.5% 160.7% 0 0 0
North Dakota 13.4% 11.1% 120.7% 0 0 0
Ohio 50.2% 14.1% 356.0% 0 0 0
Page 6 of 199
Grantee
SCSEP Percent
Minority
Census Percent
Minority
Percent
Difference
Less Than
80%
Significant
(P<=.05)
Less Than
80%, Sig
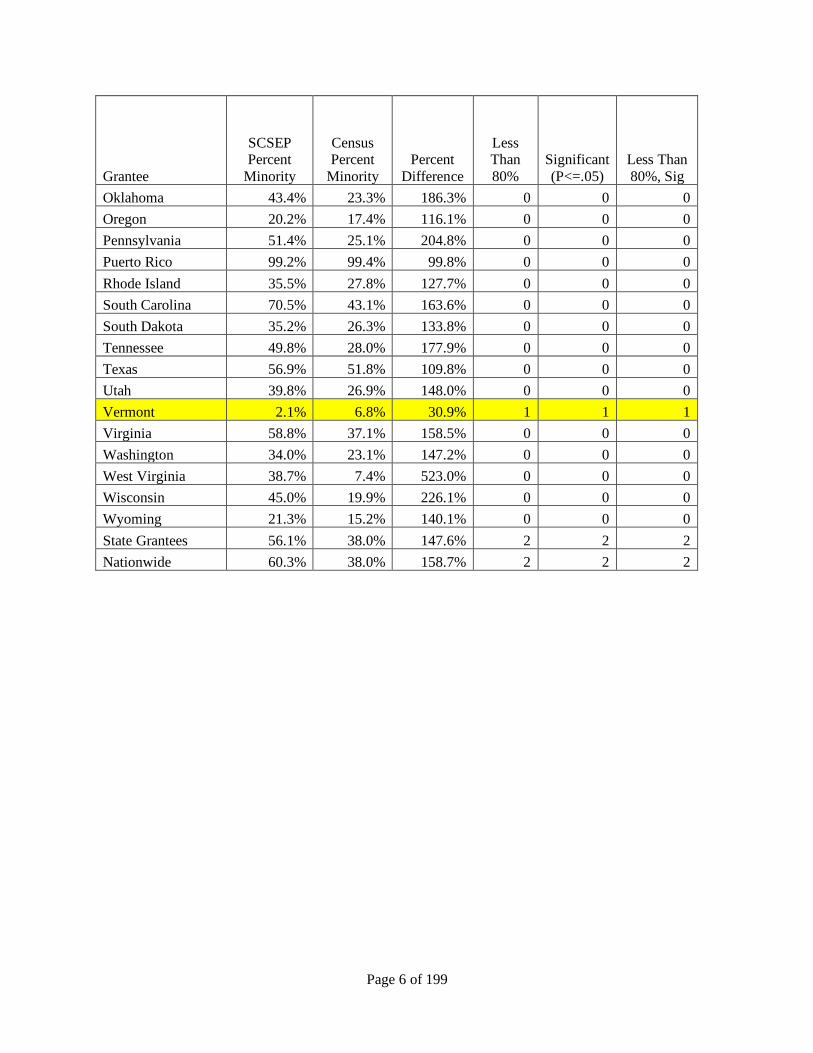
Oklahoma 43.4% 23.3% 186.3% 0 0 0
Oregon 20.2% 17.4% 116.1% 0 0 0
Pennsylvania 51.4% 25.1% 204.8% 0 0 0
Puerto Rico 99.2% 99.4% 99.8% 0 0 0
Rhode Island 35.5% 27.8% 127.7% 0 0 0
South Carolina 70.5% 43.1% 163.6% 0 0 0
South Dakota 35.2% 26.3% 133.8% 0 0 0
Tennessee 49.8% 28.0% 177.9% 0 0 0
Texas 56.9% 51.8% 109.8% 0 0 0
Utah 39.8% 26.9% 148.0% 0 0 0
Vermont 2.1% 6.8% 30.9% 1 1 1
Virginia 58.8% 37.1% 158.5% 0 0 0
Washington 34.0% 23.1% 147.2% 0 0 0
West Virginia 38.7% 7.4% 523.0% 0 0 0
Wisconsin 45.0% 19.9% 226.1% 0 0 0
Wyoming 21.3% 15.2% 140.1% 0 0 0
State Grantees 56.1% 38.0% 147.6% 2 2 2
Nationwide 60.3% 38.0% 158.7% 2 2 2
Page 7 of 199
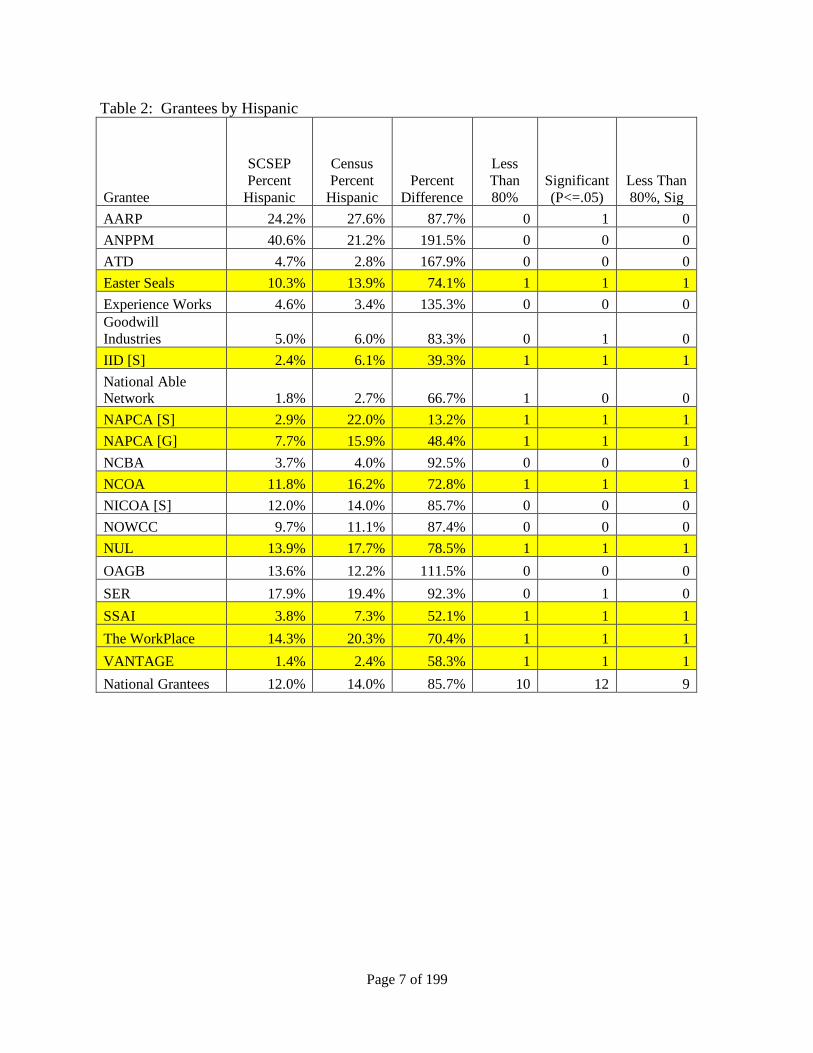
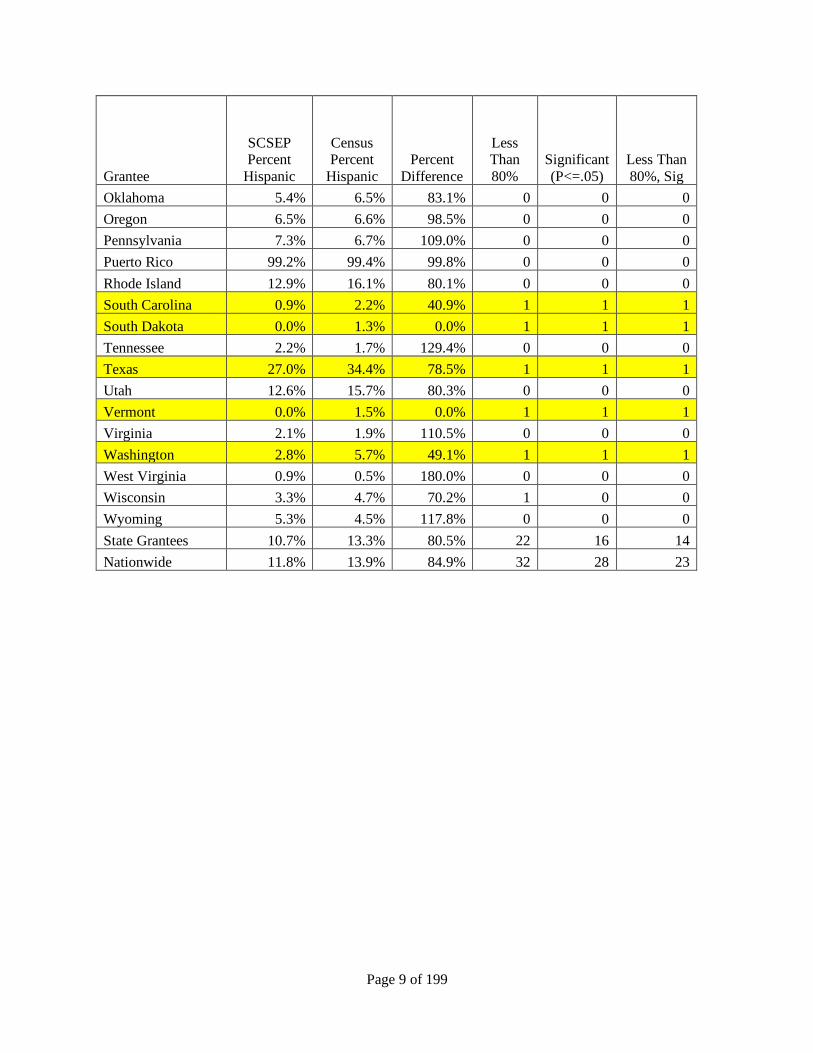
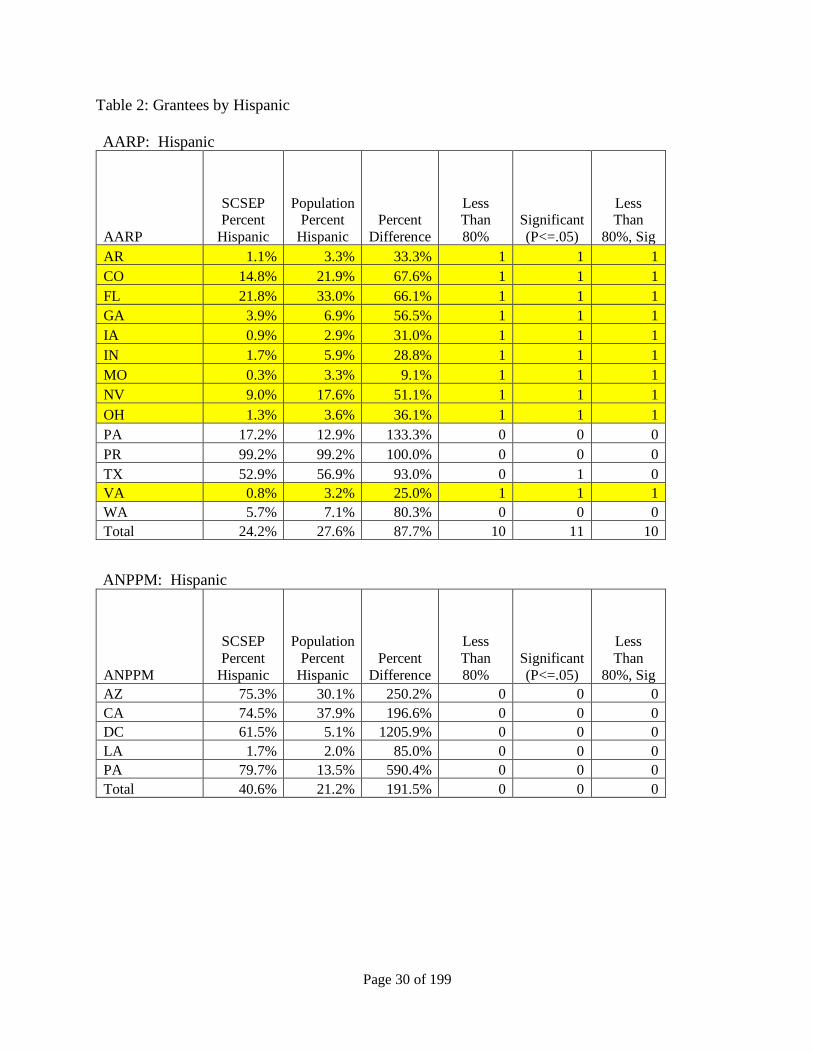
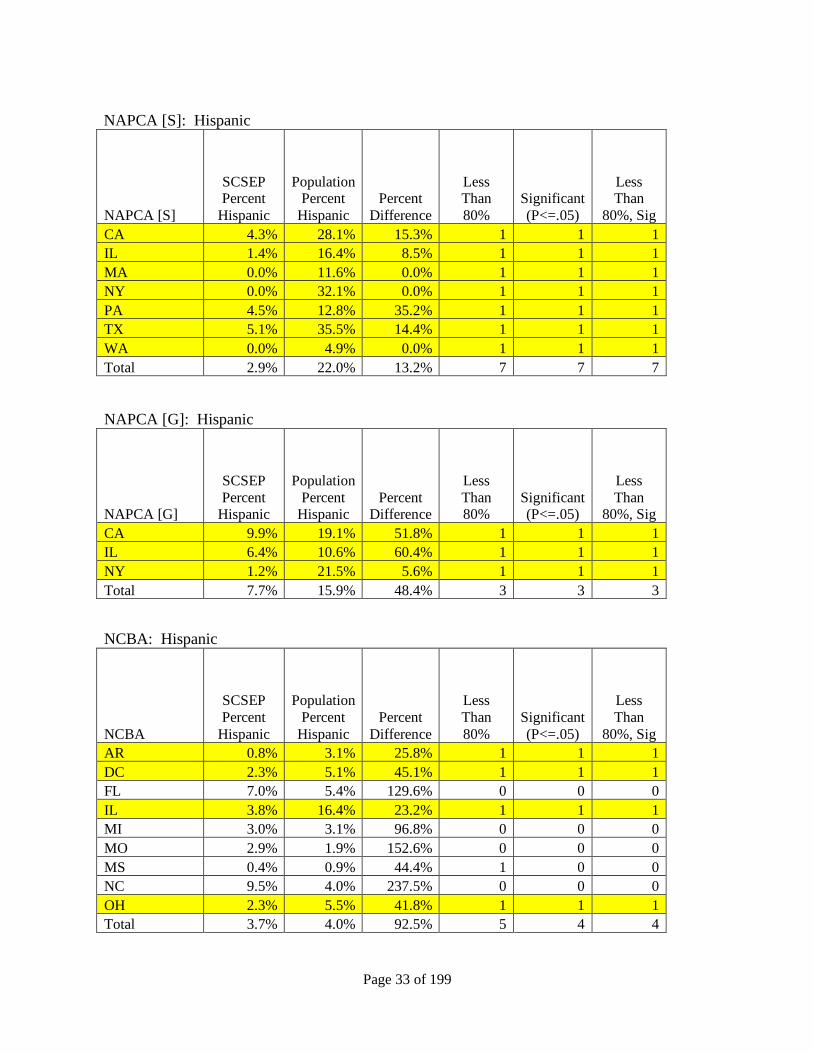
Table 2: Grantees by Hispanic
Grantee
SCSEP
Percent
Hispanic
Census
Percent
Hispanic
Percent
Difference
Less
Than
80%
Significant
(P<=.05)
Less Than
80%, Sig
AARP 24.2% 27.6% 87.7% 0 1 0
ANPPM 40.6% 21.2% 191.5% 0 0 0
ATD 4.7% 2.8% 167.9% 0 0 0
Easter Seals 10.3% 13.9% 74.1% 1 1 1
Experience Works 4.6% 3.4% 135.3% 0 0 0
Goodwill
Industries 5.0% 6.0% 83.3% 0 1 0
IID [S] 2.4% 6.1% 39.3% 1 1 1
National Able Network 1.8% 2.7% 66.7% 1 0 0
NAPCA [S] 2.9% 22.0% 13.2% 1 1 1
NAPCA [G] 7.7% 15.9% 48.4% 1 1 1
NCBA 3.7% 4.0% 92.5% 0 0 0
NCOA 11.8% 16.2% 72.8% 1 1 1
NICOA [S] 12.0% 14.0% 85.7% 0 0 0
NOWCC 9.7% 11.1% 87.4% 0 0 0
NUL 13.9% 17.7% 78.5% 1 1 1
OAGB 13.6% 12.2% 111.5% 0 0 0
SER 17.9% 19.4% 92.3% 0 1 0
SSAI 3.8% 7.3% 52.1% 1 1 1
The WorkPlace 14.3% 20.3% 70.4% 1 1 1
VANTAGE 1.4% 2.4% 58.3% 1 1 1
National Grantees 12.0% 14.0% 85.7% 10 12 9
Page 8 of 199
Grantee
SCSEP Percent
Hispanic
Census Percent
Hispanic
Percent
Difference
Less Than
80%
Significant
(P<=.05)
Less Than
80%, Sig
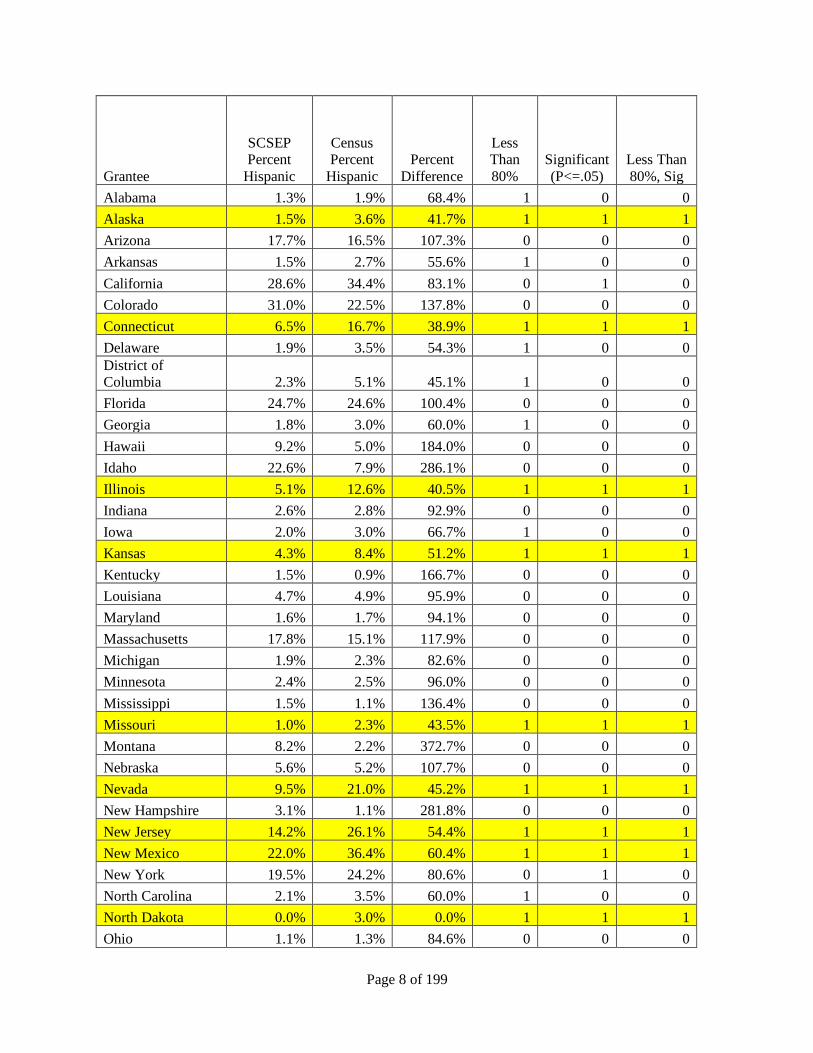
Alabama 1.3% 1.9% 68.4% 1 0 0
Alaska 1.5% 3.6% 41.7% 1 1 1
Arizona 17.7% 16.5% 107.3% 0 0 0
Arkansas 1.5% 2.7% 55.6% 1 0 0
California 28.6% 34.4% 83.1% 0 1 0
Colorado 31.0% 22.5% 137.8% 0 0 0
Connecticut 6.5% 16.7% 38.9% 1 1 1
Delaware 1.9% 3.5% 54.3% 1 0 0
District of Columbia 2.3% 5.1% 45.1% 1 0 0
Florida 24.7% 24.6% 100.4% 0 0 0
Georgia 1.8% 3.0% 60.0% 1 0 0
Hawaii 9.2% 5.0% 184.0% 0 0 0
Idaho 22.6% 7.9% 286.1% 0 0 0
Illinois 5.1% 12.6% 40.5% 1 1 1
Indiana 2.6% 2.8% 92.9% 0 0 0
Iowa 2.0% 3.0% 66.7% 1 0 0
Kansas 4.3% 8.4% 51.2% 1 1 1
Kentucky 1.5% 0.9% 166.7% 0 0 0
Louisiana 4.7% 4.9% 95.9% 0 0 0
Maryland 1.6% 1.7% 94.1% 0 0 0
Massachusetts 17.8% 15.1% 117.9% 0 0 0
Michigan 1.9% 2.3% 82.6% 0 0 0
Minnesota 2.4% 2.5% 96.0% 0 0 0
Mississippi 1.5% 1.1% 136.4% 0 0 0
Missouri 1.0% 2.3% 43.5% 1 1 1
Montana 8.2% 2.2% 372.7% 0 0 0
Nebraska 5.6% 5.2% 107.7% 0 0 0
Nevada 9.5% 21.0% 45.2% 1 1 1
New Hampshire 3.1% 1.1% 281.8% 0 0 0
New Jersey 14.2% 26.1% 54.4% 1 1 1
New Mexico 22.0% 36.4% 60.4% 1 1 1
New York 19.5% 24.2% 80.6% 0 1 0
North Carolina 2.1% 3.5% 60.0% 1 0 0
North Dakota 0.0% 3.0% 0.0% 1 1 1
Ohio 1.1% 1.3% 84.6% 0 0 0
Page 9 of 199
Grantee
SCSEP Percent
Hispanic
Census Percent
Hispanic
Percent
Difference
Less Than
80%
Significant
(P<=.05)
Less Than
80%, Sig
Oklahoma 5.4% 6.5% 83.1% 0 0 0
Oregon 6.5% 6.6% 98.5% 0 0 0
Pennsylvania 7.3% 6.7% 109.0% 0 0 0
Puerto Rico 99.2% 99.4% 99.8% 0 0 0
Rhode Island 12.9% 16.1% 80.1% 0 0 0
South Carolina 0.9% 2.2% 40.9% 1 1 1
South Dakota 0.0% 1.3% 0.0% 1 1 1
Tennessee 2.2% 1.7% 129.4% 0 0 0
Texas 27.0% 34.4% 78.5% 1 1 1
Utah 12.6% 15.7% 80.3% 0 0 0
Vermont 0.0% 1.5% 0.0% 1 1 1
Virginia 2.1% 1.9% 110.5% 0 0 0
Washington 2.8% 5.7% 49.1% 1 1 1
West Virginia 0.9% 0.5% 180.0% 0 0 0
Wisconsin 3.3% 4.7% 70.2% 1 0 0
Wyoming 5.3% 4.5% 117.8% 0 0 0
State Grantees 10.7% 13.3% 80.5% 22 16 14
Nationwide 11.8% 13.9% 84.9% 32 28 23
Page 10 of 199
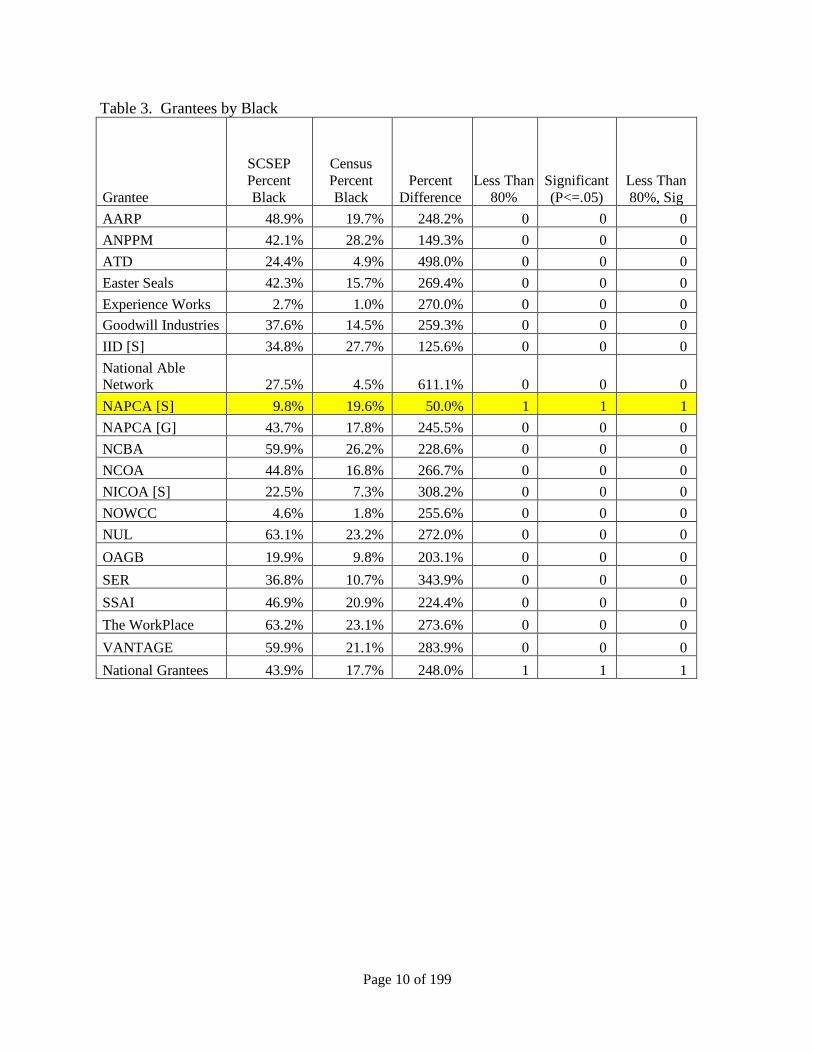
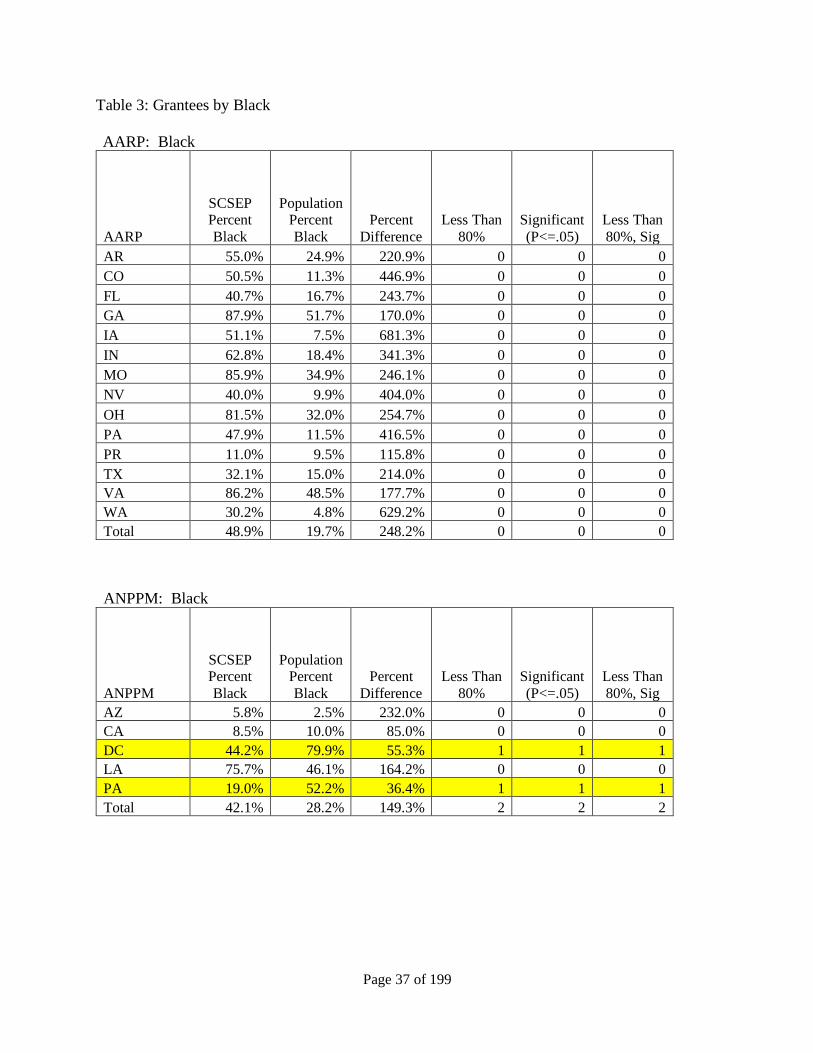
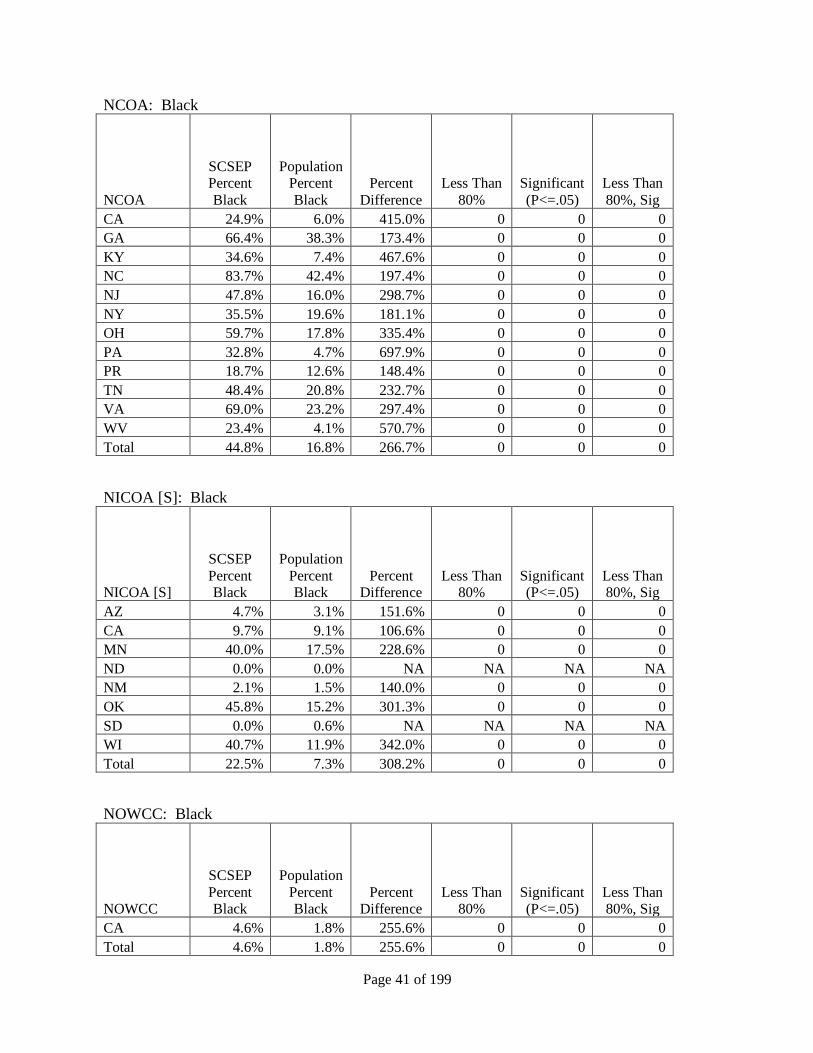
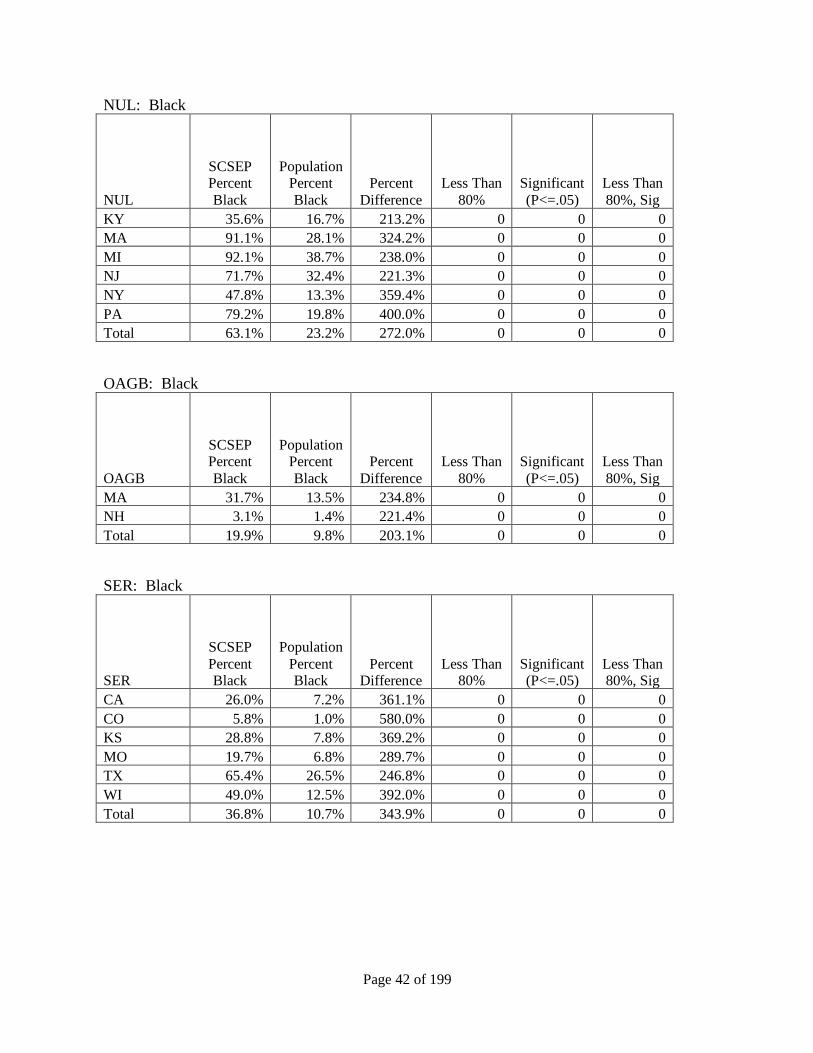
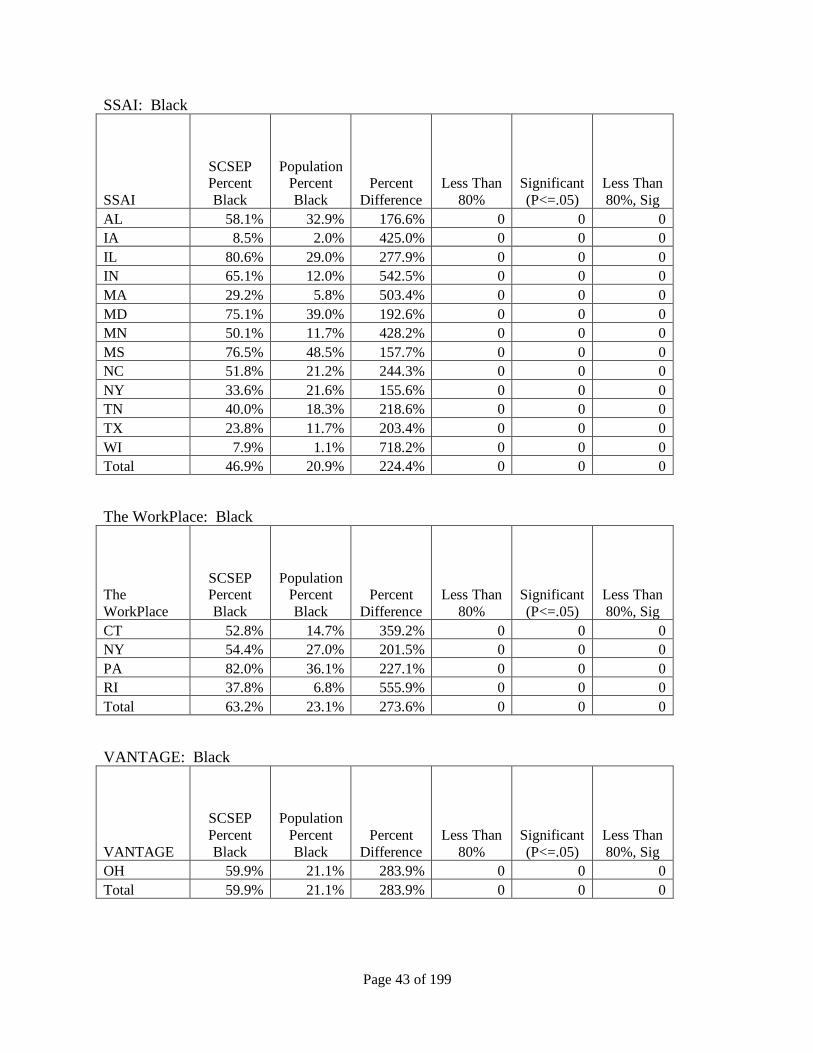
Table 3. Grantees by Black
Grantee
SCSEP
Percent
Black
Census
Percent
Black
Percent
Difference
Less Than
80%
Significant
(P<=.05)
Less Than
80%, Sig
AARP 48.9% 19.7% 248.2% 0 0 0
ANPPM 42.1% 28.2% 149.3% 0 0 0
ATD 24.4% 4.9% 498.0% 0 0 0
Easter Seals 42.3% 15.7% 269.4% 0 0 0
Experience Works 2.7% 1.0% 270.0% 0 0 0
Goodwill Industries 37.6% 14.5% 259.3% 0 0 0
IID [S] 34.8% 27.7% 125.6% 0 0 0
National Able Network 27.5% 4.5% 611.1% 0 0 0
NAPCA [S] 9.8% 19.6% 50.0% 1 1 1
NAPCA [G] 43.7% 17.8% 245.5% 0 0 0
NCBA 59.9% 26.2% 228.6% 0 0 0
NCOA 44.8% 16.8% 266.7% 0 0 0
NICOA [S] 22.5% 7.3% 308.2% 0 0 0
NOWCC 4.6% 1.8% 255.6% 0 0 0
NUL 63.1% 23.2% 272.0% 0 0 0
OAGB 19.9% 9.8% 203.1% 0 0 0
SER 36.8% 10.7% 343.9% 0 0 0
SSAI 46.9% 20.9% 224.4% 0 0 0
The WorkPlace 63.2% 23.1% 273.6% 0 0 0
VANTAGE 59.9% 21.1% 283.9% 0 0 0
National Grantees 43.9% 17.7% 248.0% 1 1 1
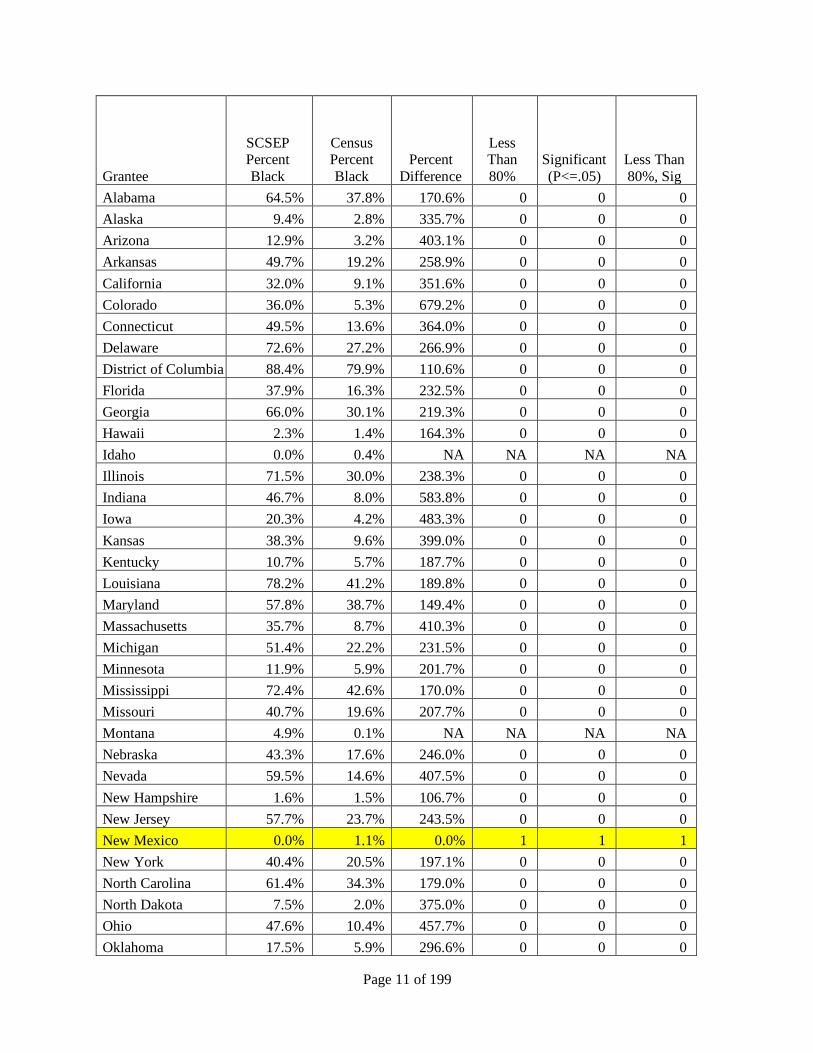
Page 11 of 199
Grantee
SCSEP Percent
Black
Census Percent
Black
Percent
Difference
Less Than
80%
Significant
(P<=.05)
Less Than
80%, Sig
Alabama 64.5% 37.8% 170.6% 0 0 0
Alaska 9.4% 2.8% 335.7% 0 0 0
Arizona 12.9% 3.2% 403.1% 0 0 0
Arkansas 49.7% 19.2% 258.9% 0 0 0
California 32.0% 9.1% 351.6% 0 0 0
Colorado 36.0% 5.3% 679.2% 0 0 0
Connecticut 49.5% 13.6% 364.0% 0 0 0
Delaware 72.6% 27.2% 266.9% 0 0 0
District of Columbia 88.4% 79.9% 110.6% 0 0 0
Florida 37.9% 16.3% 232.5% 0 0 0
Georgia 66.0% 30.1% 219.3% 0 0 0
Hawaii 2.3% 1.4% 164.3% 0 0 0
Idaho 0.0% 0.4% NA NA NA NA
Illinois 71.5% 30.0% 238.3% 0 0 0
Indiana 46.7% 8.0% 583.8% 0 0 0
Iowa 20.3% 4.2% 483.3% 0 0 0
Kansas 38.3% 9.6% 399.0% 0 0 0
Kentucky 10.7% 5.7% 187.7% 0 0 0
Louisiana 78.2% 41.2% 189.8% 0 0 0
Maryland 57.8% 38.7% 149.4% 0 0 0
Massachusetts 35.7% 8.7% 410.3% 0 0 0
Michigan 51.4% 22.2% 231.5% 0 0 0
Minnesota 11.9% 5.9% 201.7% 0 0 0
Mississippi 72.4% 42.6% 170.0% 0 0 0
Missouri 40.7% 19.6% 207.7% 0 0 0
Montana 4.9% 0.1% NA NA NA NA
Nebraska 43.3% 17.6% 246.0% 0 0 0
Nevada 59.5% 14.6% 407.5% 0 0 0
New Hampshire 1.6% 1.5% 106.7% 0 0 0
New Jersey 57.7% 23.7% 243.5% 0 0 0
New Mexico 0.0% 1.1% 0.0% 1 1 1
New York 40.4% 20.5% 197.1% 0 0 0
North Carolina 61.4% 34.3% 179.0% 0 0 0
North Dakota 7.5% 2.0% 375.0% 0 0 0
Ohio 47.6% 10.4% 457.7% 0 0 0
Oklahoma 17.5% 5.9% 296.6% 0 0 0
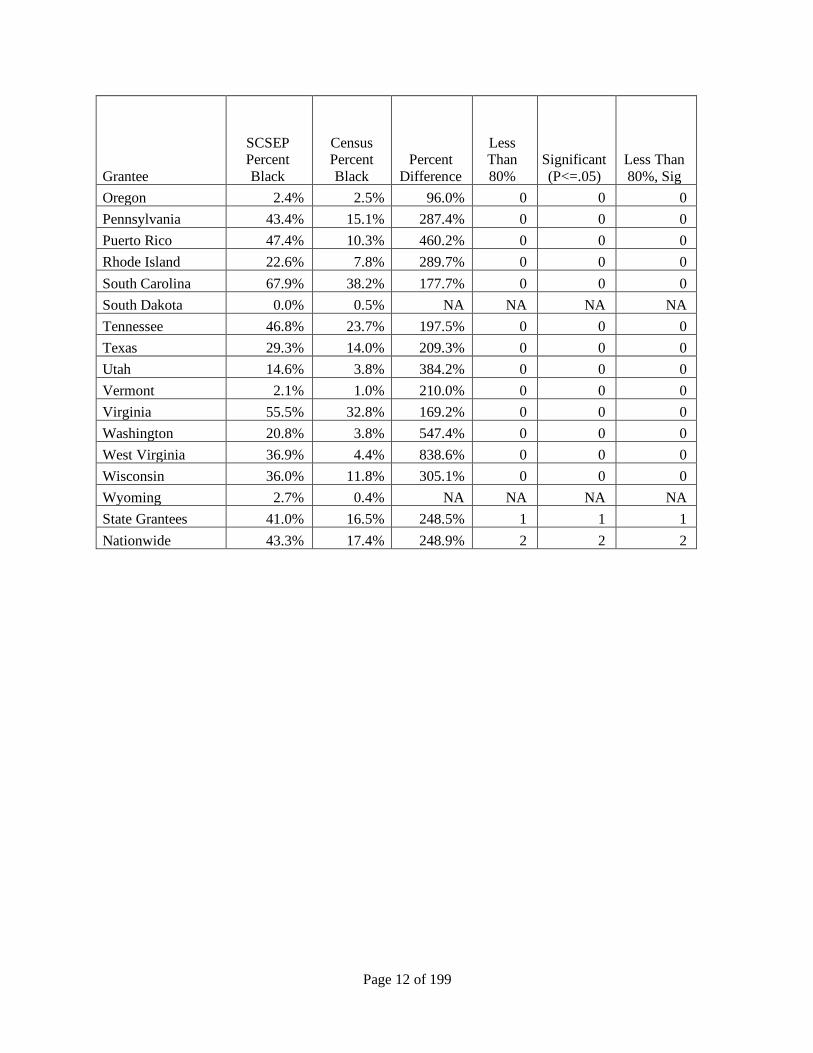
Page 12 of 199
Grantee
SCSEP Percent
Black
Census Percent
Black
Percent
Difference
Less Than
80%
Significant
(P<=.05)
Less Than
80%, Sig
Oregon 2.4% 2.5% 96.0% 0 0 0
Pennsylvania 43.4% 15.1% 287.4% 0 0 0
Puerto Rico 47.4% 10.3% 460.2% 0 0 0
Rhode Island 22.6% 7.8% 289.7% 0 0 0
South Carolina 67.9% 38.2% 177.7% 0 0 0
South Dakota 0.0% 0.5% NA NA NA NA
Tennessee 46.8% 23.7% 197.5% 0 0 0
Texas 29.3% 14.0% 209.3% 0 0 0
Utah 14.6% 3.8% 384.2% 0 0 0
Vermont 2.1% 1.0% 210.0% 0 0 0
Virginia 55.5% 32.8% 169.2% 0 0 0
Washington 20.8% 3.8% 547.4% 0 0 0
West Virginia 36.9% 4.4% 838.6% 0 0 0
Wisconsin 36.0% 11.8% 305.1% 0 0 0
Wyoming 2.7% 0.4% NA NA NA NA
State Grantees 41.0% 16.5% 248.5% 1 1 1
Nationwide 43.3% 17.4% 248.9% 2 2 2
Page 13 of 199
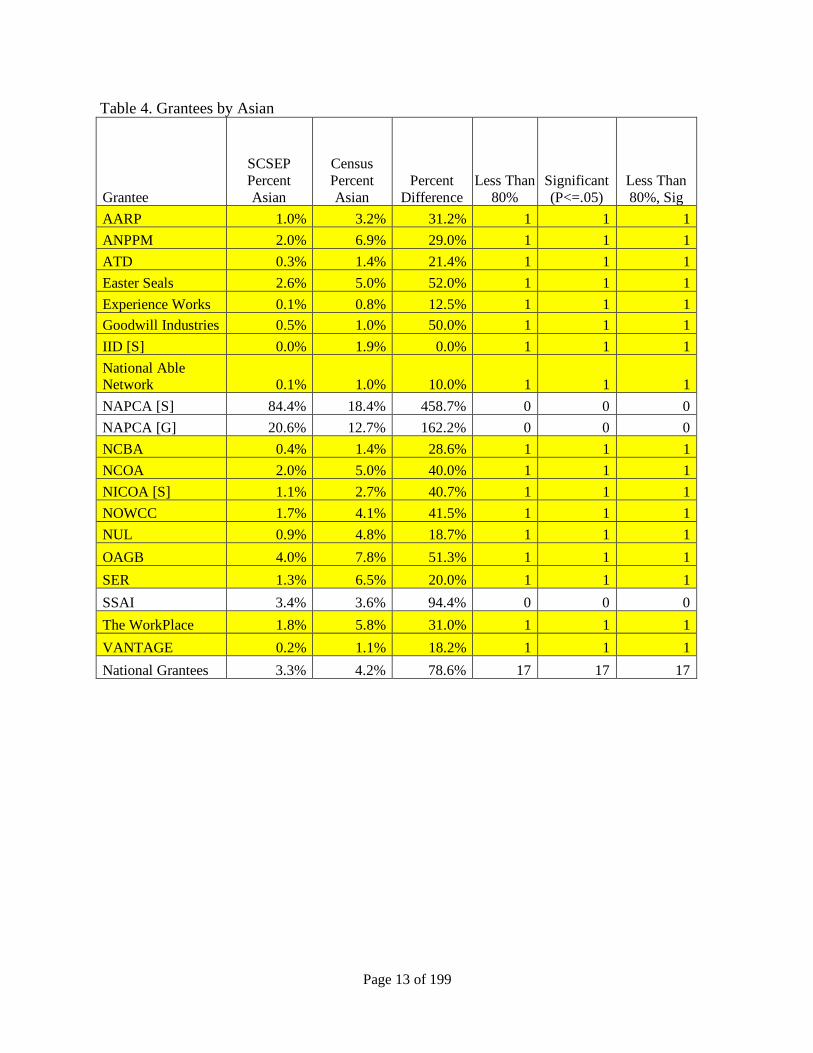
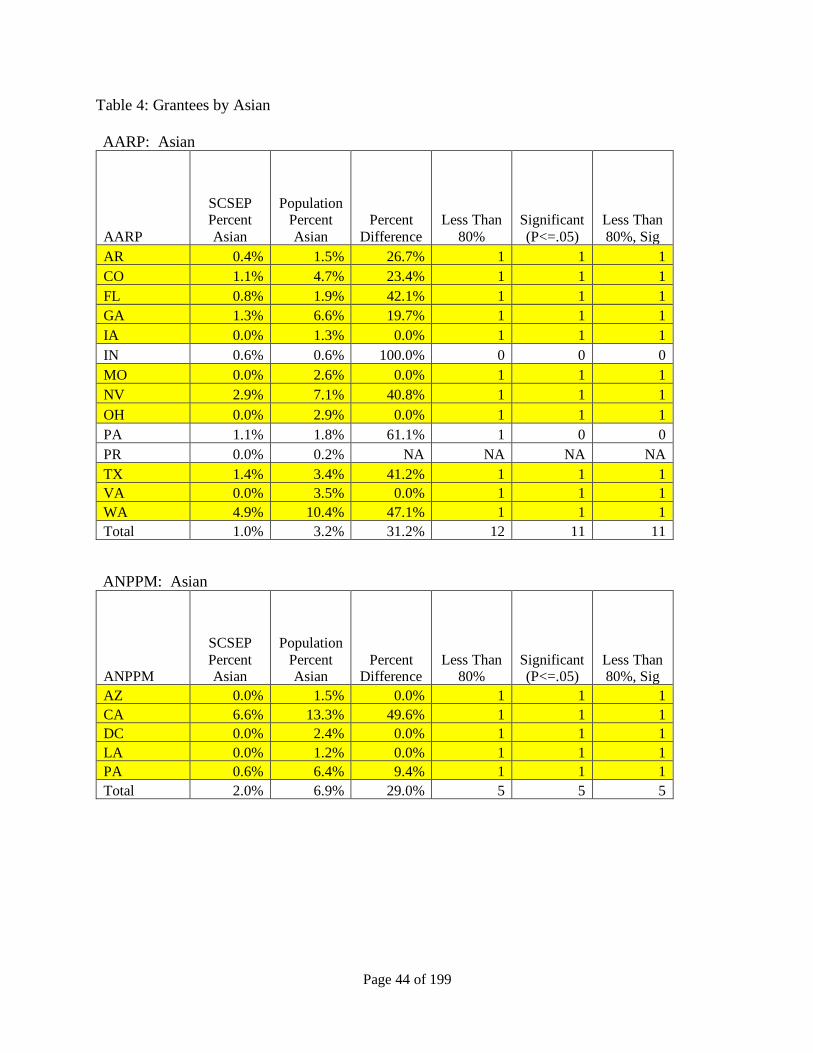
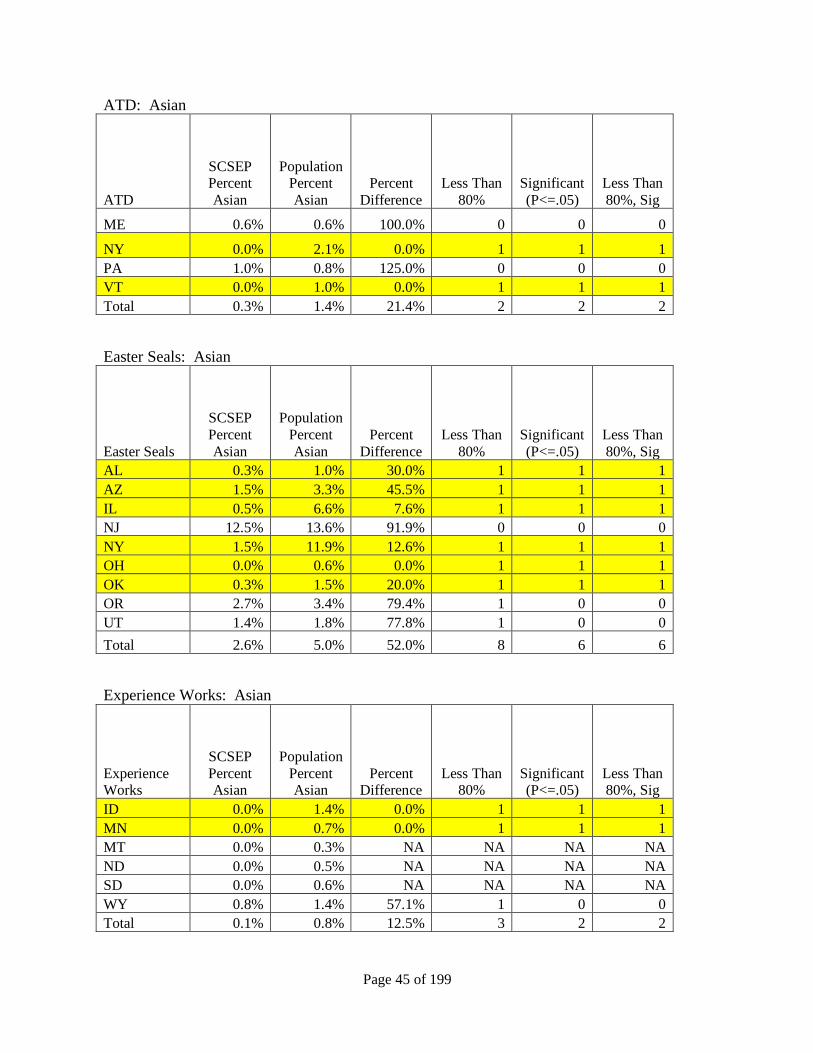
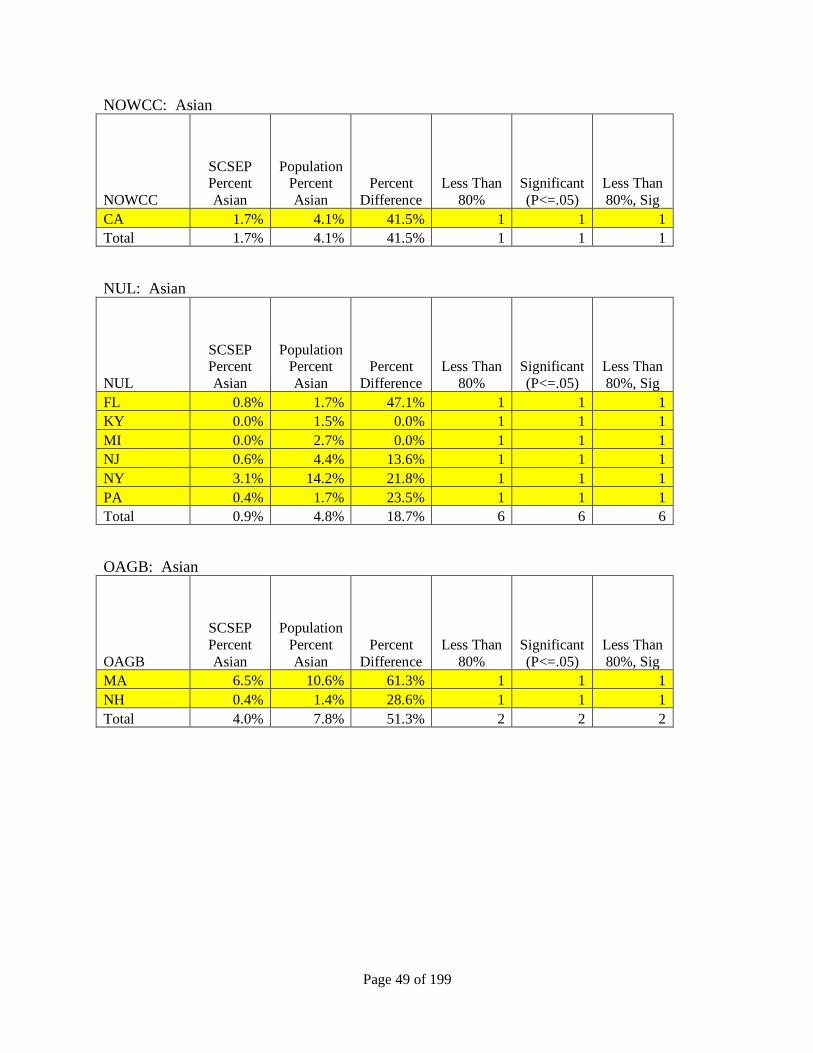
Table 4. Grantees by Asian
Grantee
SCSEP
Percent
Asian
Census
Percent
Asian
Percent
Difference
Less Than
80%
Significant
(P<=.05)
Less Than
80%, Sig
AARP 1.0% 3.2% 31.2% 1 1 1
ANPPM 2.0% 6.9% 29.0% 1 1 1
ATD 0.3% 1.4% 21.4% 1 1 1
Easter Seals 2.6% 5.0% 52.0% 1 1 1
Experience Works 0.1% 0.8% 12.5% 1 1 1
Goodwill Industries 0.5% 1.0% 50.0% 1 1 1
IID [S] 0.0% 1.9% 0.0% 1 1 1
National Able Network 0.1% 1.0% 10.0% 1 1 1
NAPCA [S] 84.4% 18.4% 458.7% 0 0 0
NAPCA [G] 20.6% 12.7% 162.2% 0 0 0
NCBA 0.4% 1.4% 28.6% 1 1 1
NCOA 2.0% 5.0% 40.0% 1 1 1
NICOA [S] 1.1% 2.7% 40.7% 1 1 1
NOWCC 1.7% 4.1% 41.5% 1 1 1
NUL 0.9% 4.8% 18.7% 1 1 1
OAGB 4.0% 7.8% 51.3% 1 1 1
SER 1.3% 6.5% 20.0% 1 1 1
SSAI 3.4% 3.6% 94.4% 0 0 0
The WorkPlace 1.8% 5.8% 31.0% 1 1 1
VANTAGE 0.2% 1.1% 18.2% 1 1 1
National Grantees 3.3% 4.2% 78.6% 17 17 17
Page 14 of 199
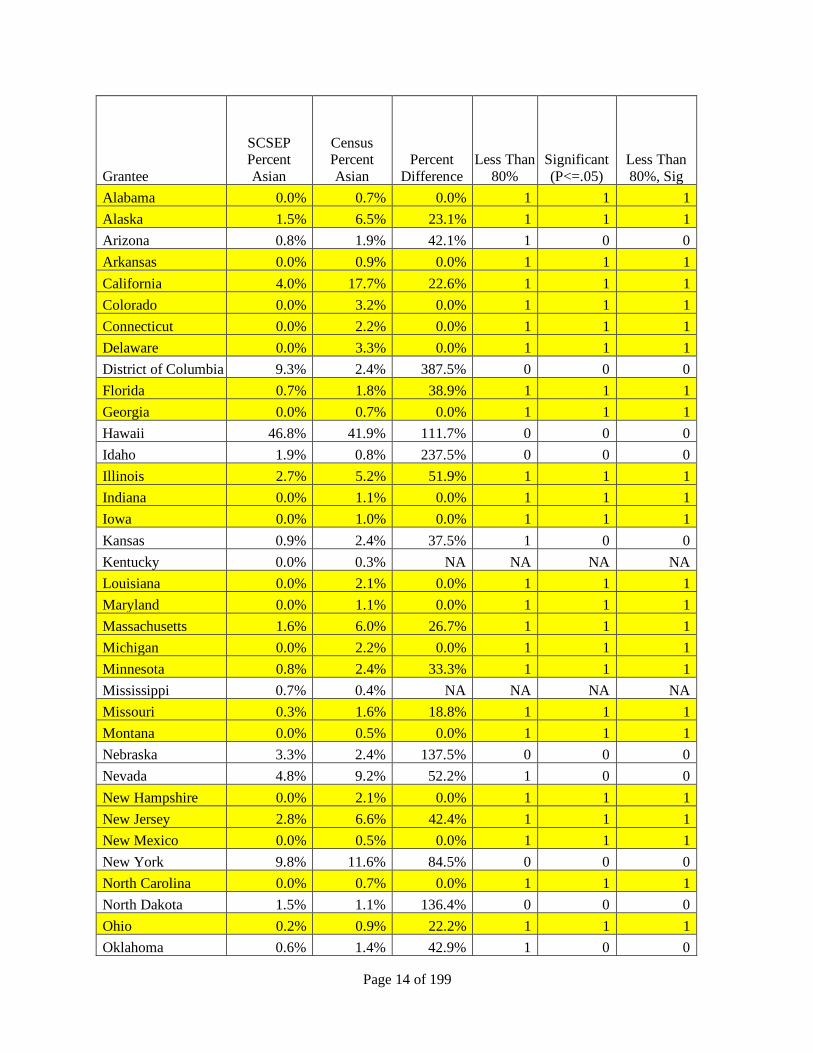
Grantee
SCSEP Percent
Asian
Census Percent
Asian
Percent
Difference
Less Than
80%
Significant
(P<=.05)
Less Than
80%, Sig
Alabama 0.0% 0.7% 0.0% 1 1 1
Alaska 1.5% 6.5% 23.1% 1 1 1
Arizona 0.8% 1.9% 42.1% 1 0 0
Arkansas 0.0% 0.9% 0.0% 1 1 1
California 4.0% 17.7% 22.6% 1 1 1
Colorado 0.0% 3.2% 0.0% 1 1 1
Connecticut 0.0% 2.2% 0.0% 1 1 1
Delaware 0.0% 3.3% 0.0% 1 1 1
District of Columbia 9.3% 2.4% 387.5% 0 0 0
Florida 0.7% 1.8% 38.9% 1 1 1
Georgia 0.0% 0.7% 0.0% 1 1 1
Hawaii 46.8% 41.9% 111.7% 0 0 0
Idaho 1.9% 0.8% 237.5% 0 0 0
Illinois 2.7% 5.2% 51.9% 1 1 1
Indiana 0.0% 1.1% 0.0% 1 1 1
Iowa 0.0% 1.0% 0.0% 1 1 1
Kansas 0.9% 2.4% 37.5% 1 0 0
Kentucky 0.0% 0.3% NA NA NA NA
Louisiana 0.0% 2.1% 0.0% 1 1 1
Maryland 0.0% 1.1% 0.0% 1 1 1
Massachusetts 1.6% 6.0% 26.7% 1 1 1
Michigan 0.0% 2.2% 0.0% 1 1 1
Minnesota 0.8% 2.4% 33.3% 1 1 1
Mississippi 0.7% 0.4% NA NA NA NA
Missouri 0.3% 1.6% 18.8% 1 1 1
Montana 0.0% 0.5% 0.0% 1 1 1
Nebraska 3.3% 2.4% 137.5% 0 0 0
Nevada 4.8% 9.2% 52.2% 1 0 0
New Hampshire 0.0% 2.1% 0.0% 1 1 1
New Jersey 2.8% 6.6% 42.4% 1 1 1
New Mexico 0.0% 0.5% 0.0% 1 1 1
New York 9.8% 11.6% 84.5% 0 0 0
North Carolina 0.0% 0.7% 0.0% 1 1 1
North Dakota 1.5% 1.1% 136.4% 0 0 0
Ohio 0.2% 0.9% 22.2% 1 1 1
Oklahoma 0.6% 1.4% 42.9% 1 0 0
Page 15 of 199
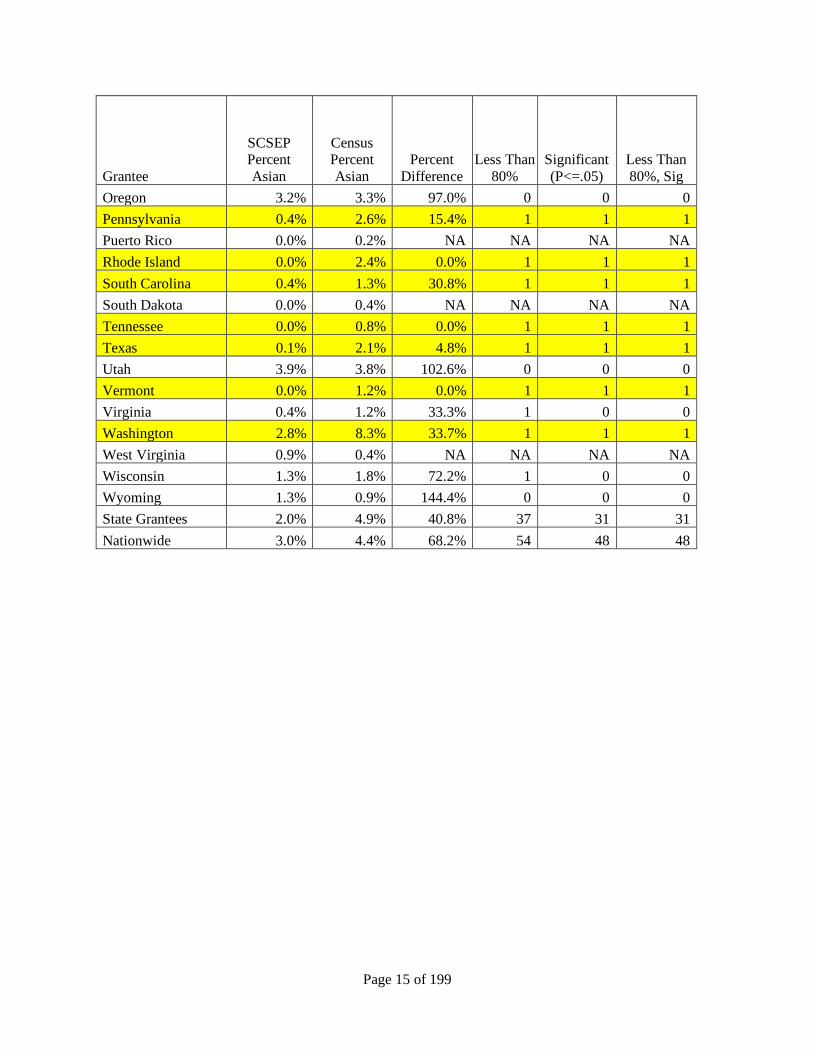
Grantee
SCSEP Percent
Asian
Census Percent
Asian
Percent
Difference
Less Than
80%
Significant
(P<=.05)
Less Than
80%, Sig
Oregon 3.2% 3.3% 97.0% 0 0 0
Pennsylvania 0.4% 2.6% 15.4% 1 1 1
Puerto Rico 0.0% 0.2% NA NA NA NA
Rhode Island 0.0% 2.4% 0.0% 1 1 1
South Carolina 0.4% 1.3% 30.8% 1 1 1
South Dakota 0.0% 0.4% NA NA NA NA
Tennessee 0.0% 0.8% 0.0% 1 1 1
Texas 0.1% 2.1% 4.8% 1 1 1
Utah 3.9% 3.8% 102.6% 0 0 0
Vermont 0.0% 1.2% 0.0% 1 1 1
Virginia 0.4% 1.2% 33.3% 1 0 0
Washington 2.8% 8.3% 33.7% 1 1 1
West Virginia 0.9% 0.4% NA NA NA NA
Wisconsin 1.3% 1.8% 72.2% 1 0 0
Wyoming 1.3% 0.9% 144.4% 0 0 0
State Grantees 2.0% 4.9% 40.8% 37 31 31
Nationwide 3.0% 4.4% 68.2% 54 48 48
Page 16 of 199
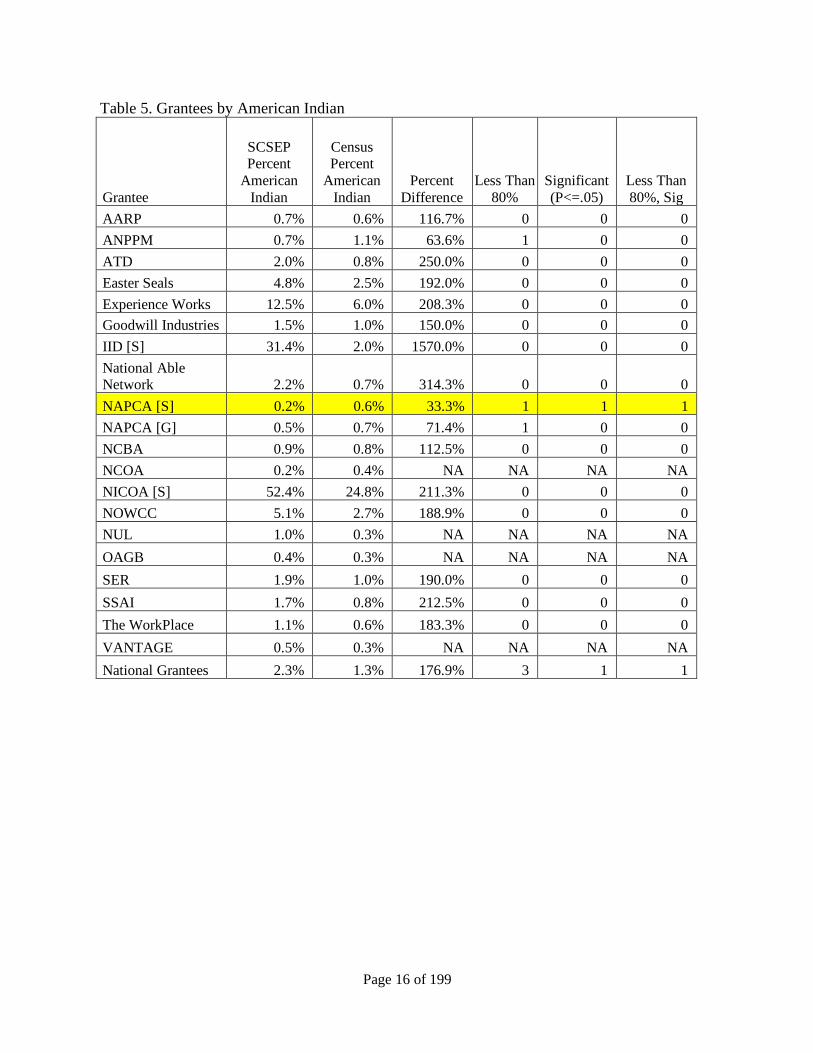
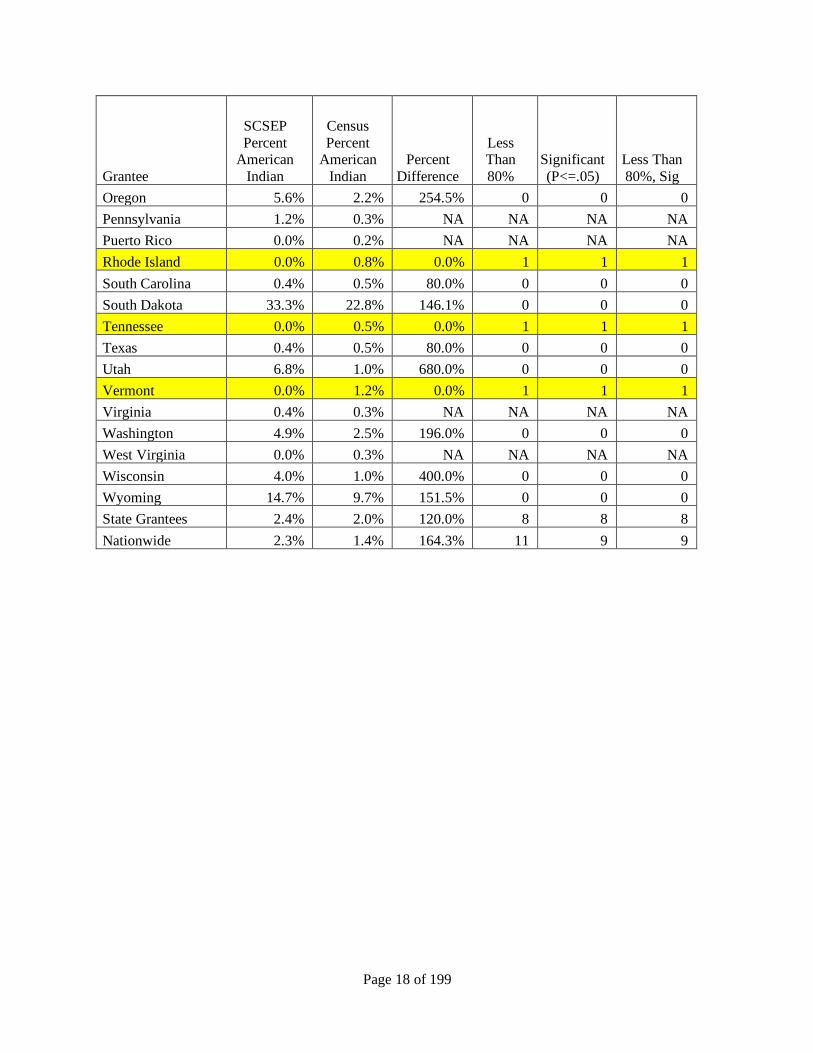
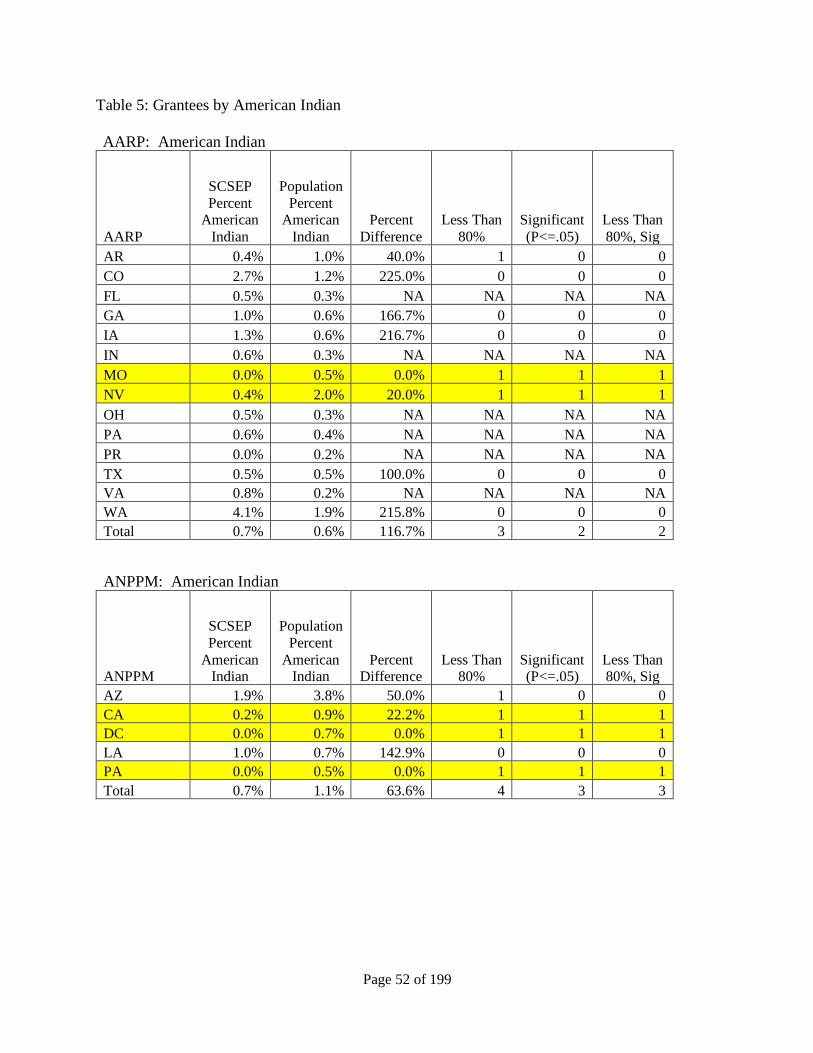
Table 5. Grantees by American Indian
Grantee
SCSEP Percent
American
Indian
Census Percent
American
Indian
Percent
Difference
Less Than
80%
Significant
(P<=.05)
Less Than
80%, Sig
AARP 0.7% 0.6% 116.7% 0 0 0
ANPPM 0.7% 1.1% 63.6% 1 0 0
ATD 2.0% 0.8% 250.0% 0 0 0
Easter Seals 4.8% 2.5% 192.0% 0 0 0
Experience Works 12.5% 6.0% 208.3% 0 0 0
Goodwill Industries 1.5% 1.0% 150.0% 0 0 0
IID [S] 31.4% 2.0% 1570.0% 0 0 0
National Able Network 2.2% 0.7% 314.3% 0 0 0
NAPCA [S] 0.2% 0.6% 33.3% 1 1 1
NAPCA [G] 0.5% 0.7% 71.4% 1 0 0
NCBA 0.9% 0.8% 112.5% 0 0 0
NCOA 0.2% 0.4% NA NA NA NA
NICOA [S] 52.4% 24.8% 211.3% 0 0 0
NOWCC 5.1% 2.7% 188.9% 0 0 0
NUL 1.0% 0.3% NA NA NA NA
OAGB 0.4% 0.3% NA NA NA NA
SER 1.9% 1.0% 190.0% 0 0 0
SSAI 1.7% 0.8% 212.5% 0 0 0
The WorkPlace 1.1% 0.6% 183.3% 0 0 0
VANTAGE 0.5% 0.3% NA NA NA NA
National Grantees 2.3% 1.3% 176.9% 3 1 1
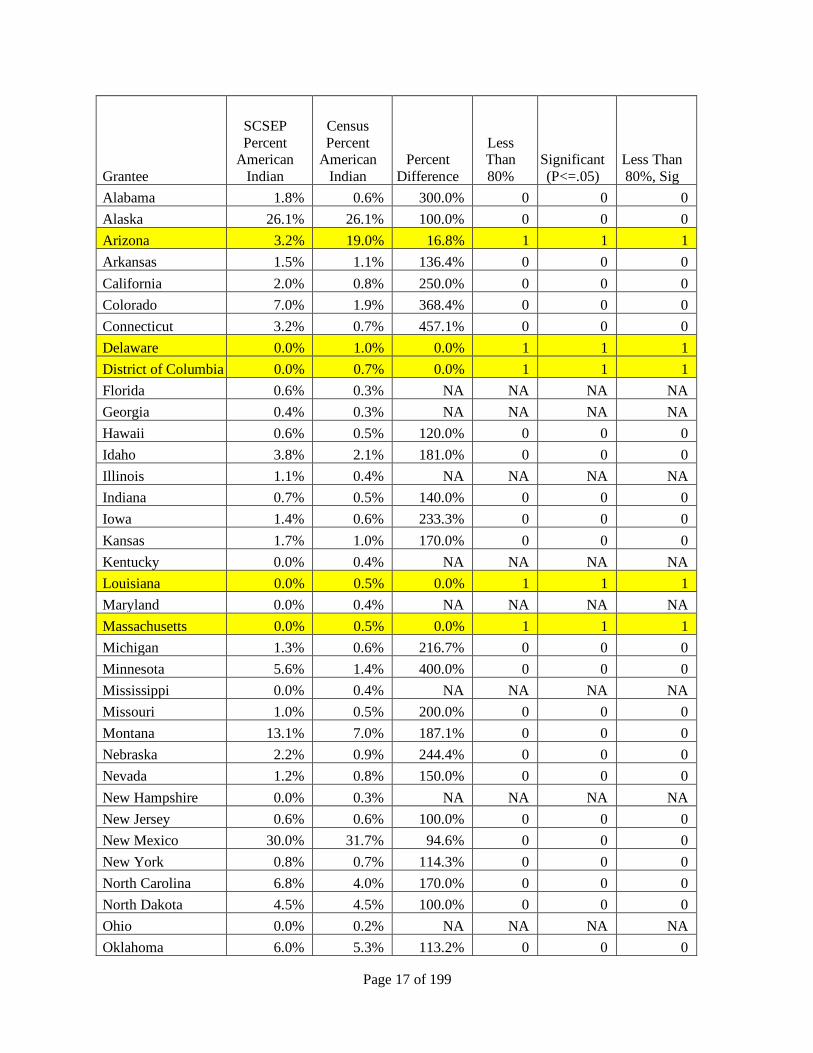
Page 17 of 199
Grantee
SCSEP
Percent American
Indian
Census
Percent American
Indian
Percent
Difference
Less Than
80%
Significant
(P<=.05)
Less Than
80%, Sig
Alabama 1.8% 0.6% 300.0% 0 0 0
Alaska 26.1% 26.1% 100.0% 0 0 0
Arizona 3.2% 19.0% 16.8% 1 1 1
Arkansas 1.5% 1.1% 136.4% 0 0 0
California 2.0% 0.8% 250.0% 0 0 0
Colorado 7.0% 1.9% 368.4% 0 0 0
Connecticut 3.2% 0.7% 457.1% 0 0 0
Delaware 0.0% 1.0% 0.0% 1 1 1
District of Columbia 0.0% 0.7% 0.0% 1 1 1
Florida 0.6% 0.3% NA NA NA NA
Georgia 0.4% 0.3% NA NA NA NA
Hawaii 0.6% 0.5% 120.0% 0 0 0
Idaho 3.8% 2.1% 181.0% 0 0 0
Illinois 1.1% 0.4% NA NA NA NA
Indiana 0.7% 0.5% 140.0% 0 0 0
Iowa 1.4% 0.6% 233.3% 0 0 0
Kansas 1.7% 1.0% 170.0% 0 0 0
Kentucky 0.0% 0.4% NA NA NA NA
Louisiana 0.0% 0.5% 0.0% 1 1 1
Maryland 0.0% 0.4% NA NA NA NA
Massachusetts 0.0% 0.5% 0.0% 1 1 1
Michigan 1.3% 0.6% 216.7% 0 0 0
Minnesota 5.6% 1.4% 400.0% 0 0 0
Mississippi 0.0% 0.4% NA NA NA NA
Missouri 1.0% 0.5% 200.0% 0 0 0
Montana 13.1% 7.0% 187.1% 0 0 0
Nebraska 2.2% 0.9% 244.4% 0 0 0
Nevada 1.2% 0.8% 150.0% 0 0 0
New Hampshire 0.0% 0.3% NA NA NA NA
New Jersey 0.6% 0.6% 100.0% 0 0 0
New Mexico 30.0% 31.7% 94.6% 0 0 0
New York 0.8% 0.7% 114.3% 0 0 0
North Carolina 6.8% 4.0% 170.0% 0 0 0
North Dakota 4.5% 4.5% 100.0% 0 0 0
Ohio 0.0% 0.2% NA NA NA NA
Oklahoma 6.0% 5.3% 113.2% 0 0 0
Page 18 of 199
Grantee
SCSEP
Percent American
Indian
Census
Percent American
Indian
Percent
Difference
Less Than
80%
Significant
(P<=.05)
Less Than
80%, Sig
Oregon 5.6% 2.2% 254.5% 0 0 0
Pennsylvania 1.2% 0.3% NA NA NA NA
Puerto Rico 0.0% 0.2% NA NA NA NA
Rhode Island 0.0% 0.8% 0.0% 1 1 1
South Carolina 0.4% 0.5% 80.0% 0 0 0
South Dakota 33.3% 22.8% 146.1% 0 0 0
Tennessee 0.0% 0.5% 0.0% 1 1 1
Texas 0.4% 0.5% 80.0% 0 0 0
Utah 6.8% 1.0% 680.0% 0 0 0
Vermont 0.0% 1.2% 0.0% 1 1 1
Virginia 0.4% 0.3% NA NA NA NA
Washington 4.9% 2.5% 196.0% 0 0 0
West Virginia 0.0% 0.3% NA NA NA NA
Wisconsin 4.0% 1.0% 400.0% 0 0 0
Wyoming 14.7% 9.7% 151.5% 0 0 0
State Grantees 2.4% 2.0% 120.0% 8 8 8
Nationwide 2.3% 1.4% 164.3% 11 9 9
Page 19 of 199
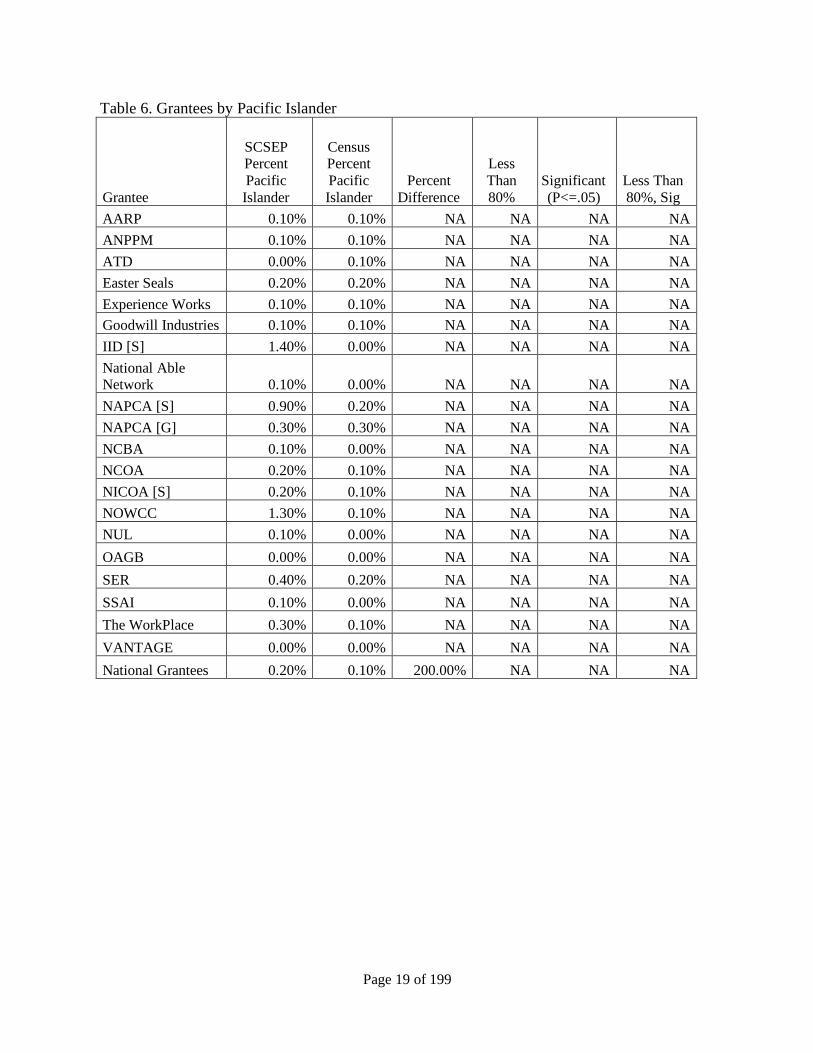
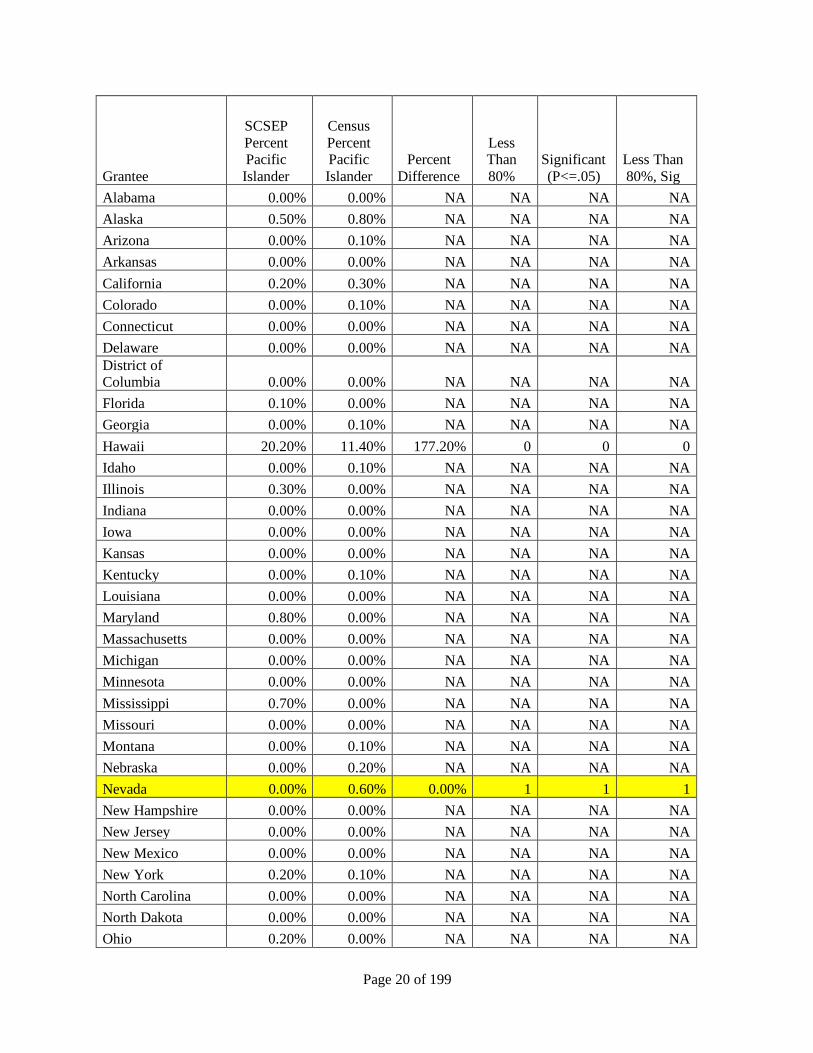
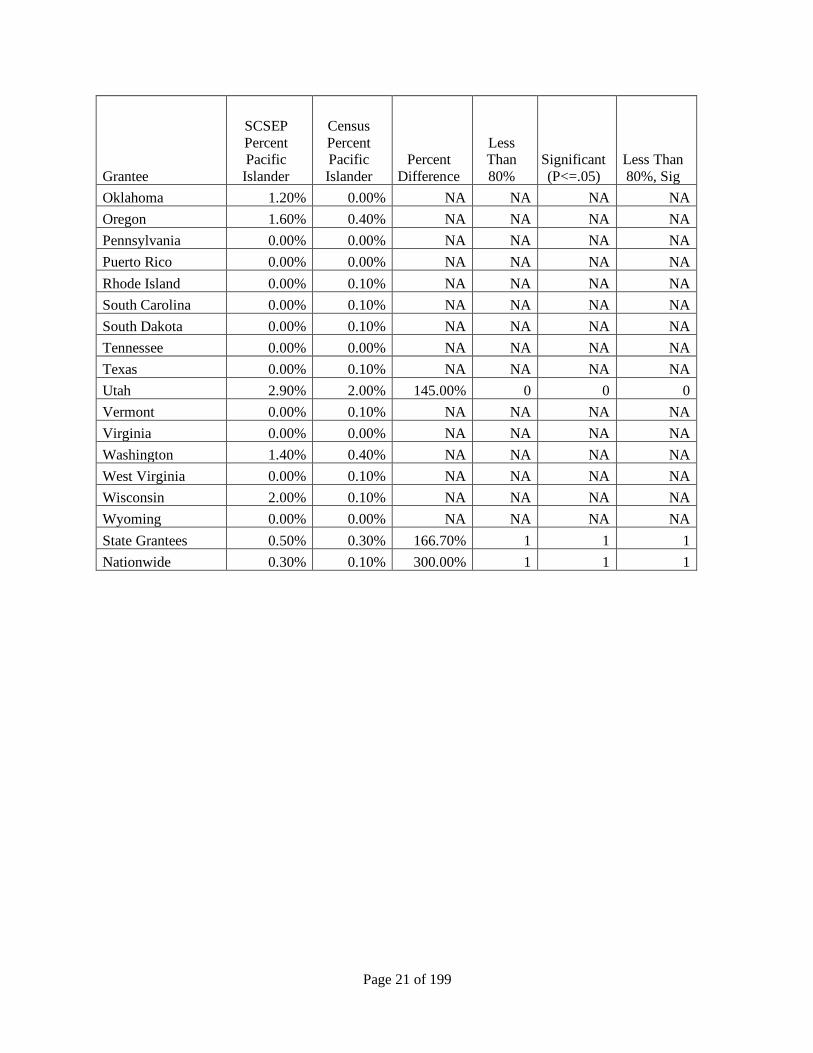
Table 6. Grantees by Pacific Islander
Grantee
SCSEP Percent
Pacific
Islander
Census Percent
Pacific
Islander
Percent
Difference
Less
Than
80%
Significant
(P<=.05)
Less Than
80%, Sig
AARP 0.10% 0.10% NA NA NA NA
ANPPM 0.10% 0.10% NA NA NA NA
ATD 0.00% 0.10% NA NA NA NA
Easter Seals 0.20% 0.20% NA NA NA NA
Experience Works 0.10% 0.10% NA NA NA NA
Goodwill Industries 0.10% 0.10% NA NA NA NA
IID [S] 1.40% 0.00% NA NA NA NA
National Able Network 0.10% 0.00% NA NA NA NA
NAPCA [S] 0.90% 0.20% NA NA NA NA
NAPCA [G] 0.30% 0.30% NA NA NA NA
NCBA 0.10% 0.00% NA NA NA NA
NCOA 0.20% 0.10% NA NA NA NA
NICOA [S] 0.20% 0.10% NA NA NA NA
NOWCC 1.30% 0.10% NA NA NA NA
NUL 0.10% 0.00% NA NA NA NA
OAGB 0.00% 0.00% NA NA NA NA
SER 0.40% 0.20% NA NA NA NA
SSAI 0.10% 0.00% NA NA NA NA
The WorkPlace 0.30% 0.10% NA NA NA NA
VANTAGE 0.00% 0.00% NA NA NA NA
National Grantees 0.20% 0.10% 200.00% NA NA NA
Page 20 of 199
Grantee
SCSEP
Percent Pacific
Islander
Census
Percent Pacific
Islander
Percent
Difference
Less Than
80%
Significant
(P<=.05)
Less Than
80%, Sig
Alabama 0.00% 0.00% NA NA NA NA
Alaska 0.50% 0.80% NA NA NA NA
Arizona 0.00% 0.10% NA NA NA NA
Arkansas 0.00% 0.00% NA NA NA NA
California 0.20% 0.30% NA NA NA NA
Colorado 0.00% 0.10% NA NA NA NA
Connecticut 0.00% 0.00% NA NA NA NA
Delaware 0.00% 0.00% NA NA NA NA
District of Columbia 0.00% 0.00% NA NA NA NA
Florida 0.10% 0.00% NA NA NA NA
Georgia 0.00% 0.10% NA NA NA NA
Hawaii 20.20% 11.40% 177.20% 0 0 0
Idaho 0.00% 0.10% NA NA NA NA
Illinois 0.30% 0.00% NA NA NA NA
Indiana 0.00% 0.00% NA NA NA NA
Iowa 0.00% 0.00% NA NA NA NA
Kansas 0.00% 0.00% NA NA NA NA
Kentucky 0.00% 0.10% NA NA NA NA
Louisiana 0.00% 0.00% NA NA NA NA
Maryland 0.80% 0.00% NA NA NA NA
Massachusetts 0.00% 0.00% NA NA NA NA
Michigan 0.00% 0.00% NA NA NA NA
Minnesota 0.00% 0.00% NA NA NA NA
Mississippi 0.70% 0.00% NA NA NA NA
Missouri 0.00% 0.00% NA NA NA NA
Montana 0.00% 0.10% NA NA NA NA
Nebraska 0.00% 0.20% NA NA NA NA
Nevada 0.00% 0.60% 0.00% 1 1 1
New Hampshire 0.00% 0.00% NA NA NA NA
New Jersey 0.00% 0.00% NA NA NA NA
New Mexico 0.00% 0.00% NA NA NA NA
New York 0.20% 0.10% NA NA NA NA
North Carolina 0.00% 0.00% NA NA NA NA
North Dakota 0.00% 0.00% NA NA NA NA
Ohio 0.20% 0.00% NA NA NA NA
Page 21 of 199
Grantee
SCSEP
Percent Pacific
Islander
Census
Percent Pacific
Islander
Percent
Difference
Less Than
80%
Significant
(P<=.05)
Less Than
80%, Sig
Oklahoma 1.20% 0.00% NA NA NA NA
Oregon 1.60% 0.40% NA NA NA NA
Pennsylvania 0.00% 0.00% NA NA NA NA
Puerto Rico 0.00% 0.00% NA NA NA NA
Rhode Island 0.00% 0.10% NA NA NA NA
South Carolina 0.00% 0.10% NA NA NA NA
South Dakota 0.00% 0.10% NA NA NA NA
Tennessee 0.00% 0.00% NA NA NA NA
Texas 0.00% 0.10% NA NA NA NA
Utah 2.90% 2.00% 145.00% 0 0 0
Vermont 0.00% 0.10% NA NA NA NA
Virginia 0.00% 0.00% NA NA NA NA
Washington 1.40% 0.40% NA NA NA NA
West Virginia 0.00% 0.10% NA NA NA NA
Wisconsin 2.00% 0.10% NA NA NA NA
Wyoming 0.00% 0.00% NA NA NA NA
State Grantees 0.50% 0.30% 166.70% 1 1 1
Nationwide 0.30% 0.10% 300.00% 1 1 1
Page 22 of 199
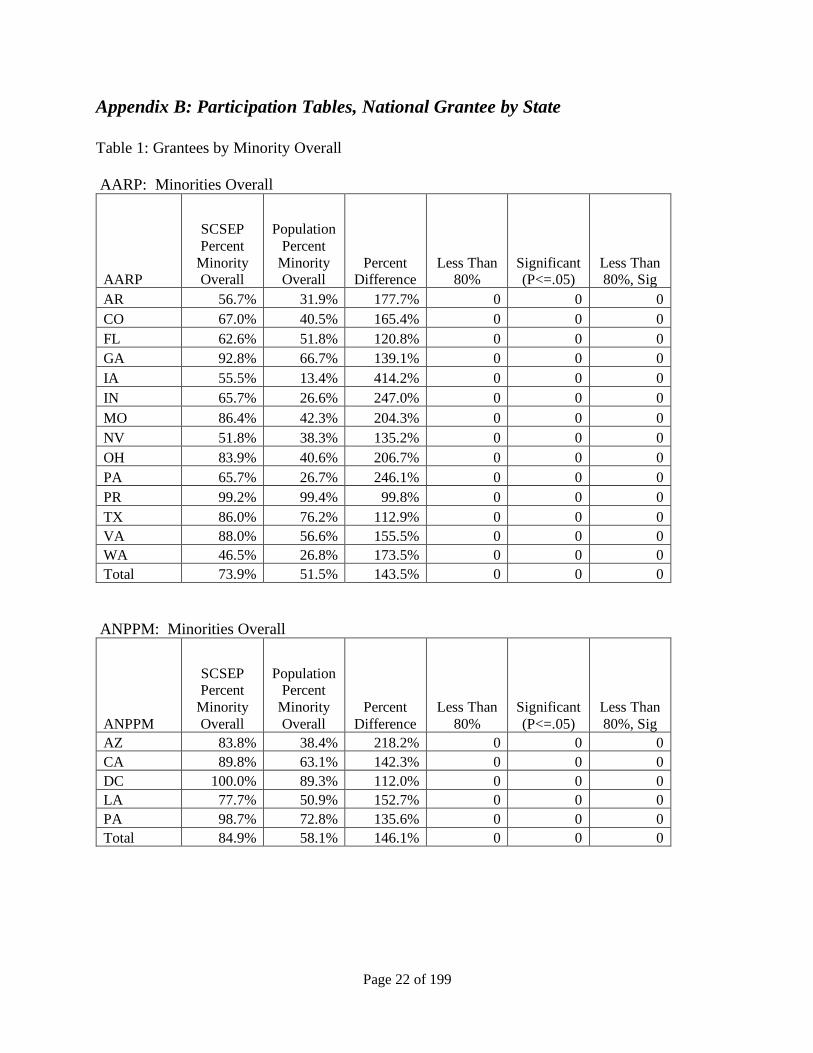
Appendix B: Participation Tables, National Grantee by State
Table 1: Grantees by Minority Overall
AARP: Minorities Overall
AARP
SCSEP
Percent
Minority Overall
Population
Percent
Minority Overall
Percent Difference
Less Than 80%
Significant (P<=.05)
Less Than 80%, Sig
AR 56.7% 31.9% 177.7% 0 0 0
CO 67.0% 40.5% 165.4% 0 0 0
FL 62.6% 51.8% 120.8% 0 0 0
GA 92.8% 66.7% 139.1% 0 0 0
IA 55.5% 13.4% 414.2% 0 0 0
IN 65.7% 26.6% 247.0% 0 0 0
MO 86.4% 42.3% 204.3% 0 0 0
NV 51.8% 38.3% 135.2% 0 0 0
OH 83.9% 40.6% 206.7% 0 0 0
PA 65.7% 26.7% 246.1% 0 0 0
PR 99.2% 99.4% 99.8% 0 0 0
TX 86.0% 76.2% 112.9% 0 0 0
VA 88.0% 56.6% 155.5% 0 0 0
WA 46.5% 26.8% 173.5% 0 0 0
Total 73.9% 51.5% 143.5% 0 0 0
ANPPM: Minorities Overall
ANPPM
SCSEP Percent
Minority
Overall
Population Percent
Minority
Overall
Percent
Difference
Less Than
80%
Significant
(P<=.05)
Less Than
80%, Sig
AZ 83.8% 38.4% 218.2% 0 0 0
CA 89.8% 63.1% 142.3% 0 0 0
DC 100.0% 89.3% 112.0% 0 0 0
LA 77.7% 50.9% 152.7% 0 0 0
PA 98.7% 72.8% 135.6% 0 0 0
Total 84.9% 58.1% 146.1% 0 0 0
Page 23 of 199
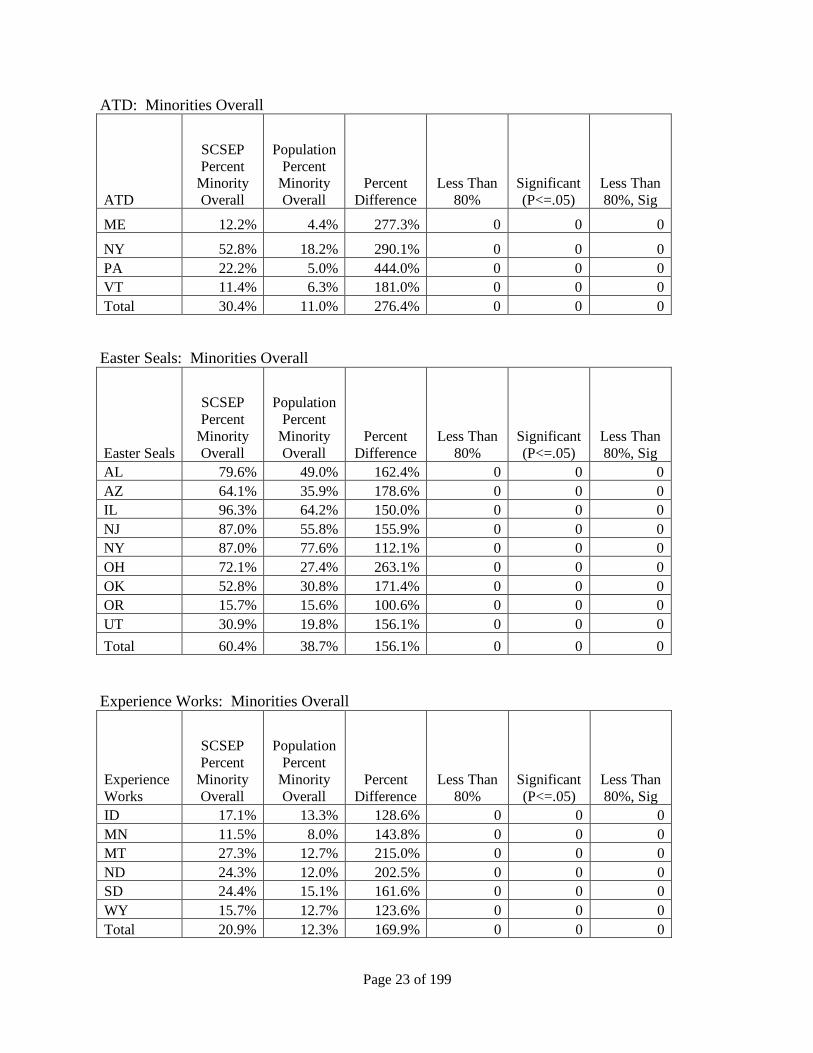
ATD: Minorities Overall
ATD
SCSEP
Percent Minority
Overall
Population
Percent Minority
Overall
Percent
Difference
Less Than
80%
Significant
(P<=.05)
Less Than
80%, Sig
ME 12.2% 4.4% 277.3% 0 0 0
NY 52.8% 18.2% 290.1% 0 0 0
PA 22.2% 5.0% 444.0% 0 0 0
VT 11.4% 6.3% 181.0% 0 0 0
Total 30.4% 11.0% 276.4% 0 0 0
Easter Seals: Minorities Overall
Easter Seals
SCSEP
Percent
Minority
Overall
Population
Percent
Minority
Overall
Percent
Difference
Less Than
80%
Significant
(P<=.05)
Less Than
80%, Sig
AL 79.6% 49.0% 162.4% 0 0 0
AZ 64.1% 35.9% 178.6% 0 0 0
IL 96.3% 64.2% 150.0% 0 0 0
NJ 87.0% 55.8% 155.9% 0 0 0
NY 87.0% 77.6% 112.1% 0 0 0
OH 72.1% 27.4% 263.1% 0 0 0
OK 52.8% 30.8% 171.4% 0 0 0
OR 15.7% 15.6% 100.6% 0 0 0
UT 30.9% 19.8% 156.1% 0 0 0
Total 60.4% 38.7% 156.1% 0 0 0
Experience Works: Minorities Overall
Experience
Works
SCSEP
Percent
Minority
Overall
Population
Percent
Minority
Overall
Percent
Difference
Less Than
80%
Significant
(P<=.05)
Less Than
80%, Sig
ID 17.1% 13.3% 128.6% 0 0 0
MN 11.5% 8.0% 143.8% 0 0 0
MT 27.3% 12.7% 215.0% 0 0 0
ND 24.3% 12.0% 202.5% 0 0 0
SD 24.4% 15.1% 161.6% 0 0 0
WY 15.7% 12.7% 123.6% 0 0 0
Total 20.9% 12.3% 169.9% 0 0 0
Page 24 of 199
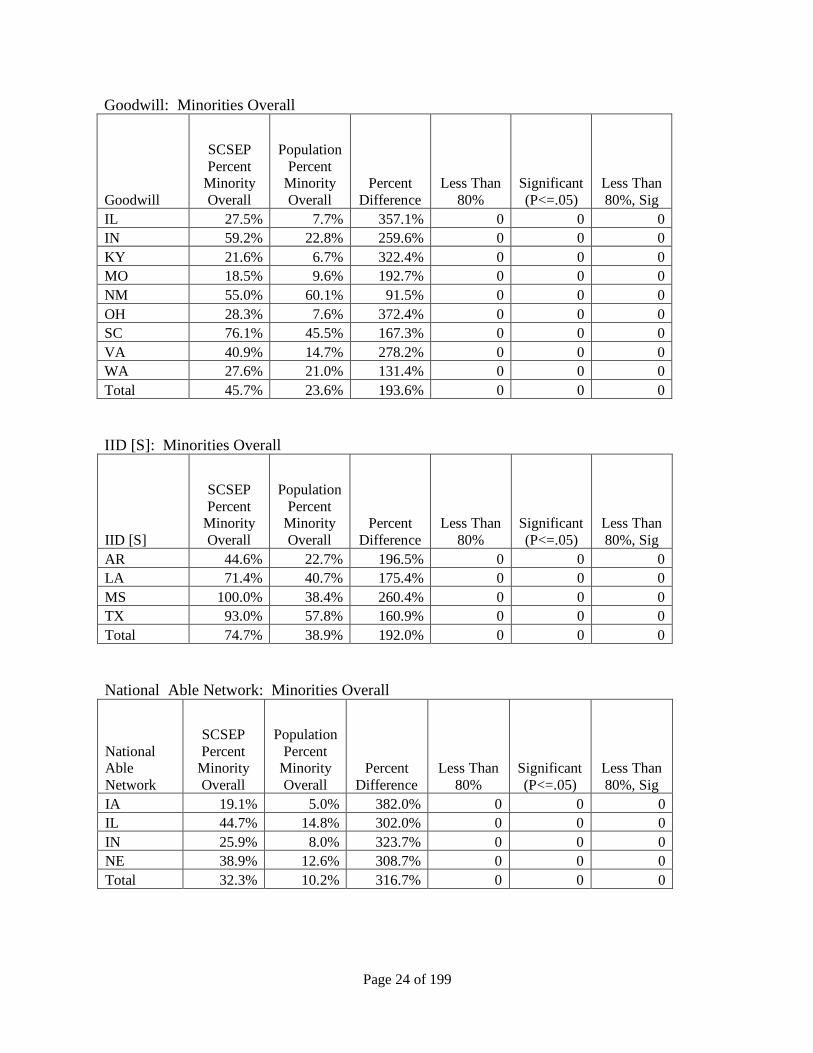
Goodwill: Minorities Overall
Goodwill
SCSEP
Percent Minority
Overall
Population
Percent Minority
Overall
Percent
Difference
Less Than
80%
Significant
(P<=.05)
Less Than
80%, Sig
IL 27.5% 7.7% 357.1% 0 0 0
IN 59.2% 22.8% 259.6% 0 0 0
KY 21.6% 6.7% 322.4% 0 0 0
MO 18.5% 9.6% 192.7% 0 0 0
NM 55.0% 60.1% 91.5% 0 0 0
OH 28.3% 7.6% 372.4% 0 0 0
SC 76.1% 45.5% 167.3% 0 0 0
VA 40.9% 14.7% 278.2% 0 0 0
WA 27.6% 21.0% 131.4% 0 0 0
Total 45.7% 23.6% 193.6% 0 0 0
IID [S]: Minorities Overall
IID [S]
SCSEP
Percent Minority
Overall
Population
Percent Minority
Overall
Percent
Difference
Less Than
80%
Significant
(P<=.05)
Less Than
80%, Sig
AR 44.6% 22.7% 196.5% 0 0 0
LA 71.4% 40.7% 175.4% 0 0 0
MS 100.0% 38.4% 260.4% 0 0 0
TX 93.0% 57.8% 160.9% 0 0 0
Total 74.7% 38.9% 192.0% 0 0 0
National Able Network: Minorities Overall
National Able
Network
SCSEP
Percent Minority
Overall
Population
Percent Minority
Overall
Percent
Difference
Less Than
80%
Significant
(P<=.05)
Less Than
80%, Sig
IA 19.1% 5.0% 382.0% 0 0 0
IL 44.7% 14.8% 302.0% 0 0 0
IN 25.9% 8.0% 323.7% 0 0 0
NE 38.9% 12.6% 308.7% 0 0 0
Total 32.3% 10.2% 316.7% 0 0 0
Page 25 of 199
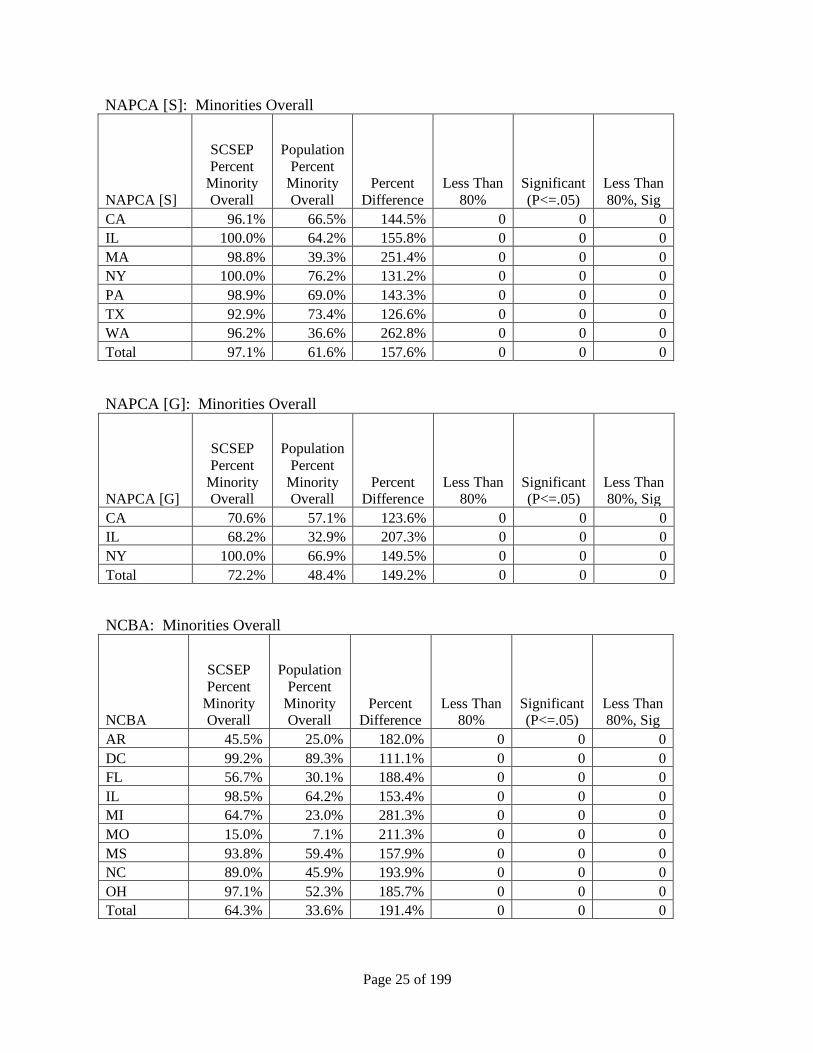
NAPCA [S]: Minorities Overall
NAPCA [S]
SCSEP
Percent Minority
Overall
Population
Percent Minority
Overall
Percent
Difference
Less Than
80%
Significant
(P<=.05)
Less Than
80%, Sig
CA 96.1% 66.5% 144.5% 0 0 0
IL 100.0% 64.2% 155.8% 0 0 0
MA 98.8% 39.3% 251.4% 0 0 0
NY 100.0% 76.2% 131.2% 0 0 0
PA 98.9% 69.0% 143.3% 0 0 0
TX 92.9% 73.4% 126.6% 0 0 0
WA 96.2% 36.6% 262.8% 0 0 0
Total 97.1% 61.6% 157.6% 0 0 0
NAPCA [G]: Minorities Overall
NAPCA [G]
SCSEP
Percent
Minority Overall
Population
Percent
Minority Overall
Percent Difference
Less Than 80%
Significant (P<=.05)
Less Than 80%, Sig
CA 70.6% 57.1% 123.6% 0 0 0
IL 68.2% 32.9% 207.3% 0 0 0
NY 100.0% 66.9% 149.5% 0 0 0
Total 72.2% 48.4% 149.2% 0 0 0
NCBA: Minorities Overall
NCBA
SCSEP
Percent
Minority Overall
Population
Percent
Minority Overall
Percent Difference
Less Than 80%
Significant (P<=.05)
Less Than 80%, Sig
AR 45.5% 25.0% 182.0% 0 0 0
DC 99.2% 89.3% 111.1% 0 0 0
FL 56.7% 30.1% 188.4% 0 0 0
IL 98.5% 64.2% 153.4% 0 0 0
MI 64.7% 23.0% 281.3% 0 0 0
MO 15.0% 7.1% 211.3% 0 0 0
MS 93.8% 59.4% 157.9% 0 0 0
NC 89.0% 45.9% 193.9% 0 0 0
OH 97.1% 52.3% 185.7% 0 0 0
Total 64.3% 33.6% 191.4% 0 0 0
Page 26 of 199
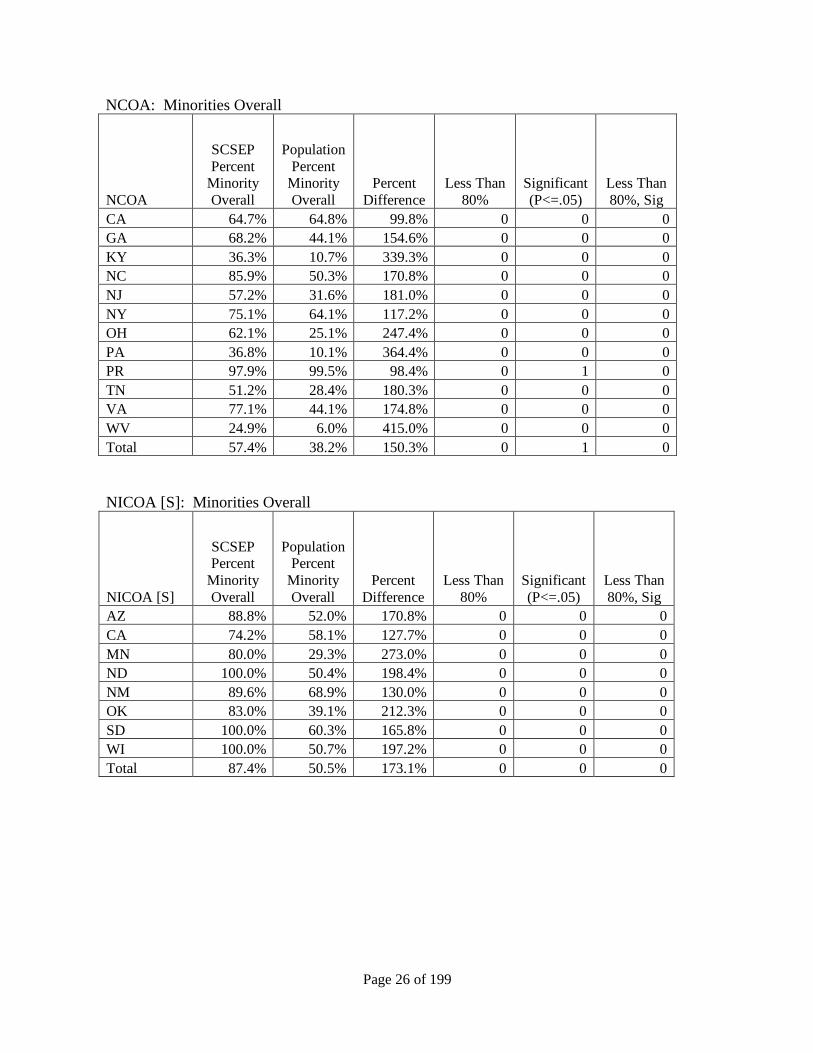
NCOA: Minorities Overall
NCOA
SCSEP
Percent Minority
Overall
Population
Percent Minority
Overall
Percent
Difference
Less Than
80%
Significant
(P<=.05)
Less Than
80%, Sig
CA 64.7% 64.8% 99.8% 0 0 0
GA 68.2% 44.1% 154.6% 0 0 0
KY 36.3% 10.7% 339.3% 0 0 0
NC 85.9% 50.3% 170.8% 0 0 0
NJ 57.2% 31.6% 181.0% 0 0 0
NY 75.1% 64.1% 117.2% 0 0 0
OH 62.1% 25.1% 247.4% 0 0 0
PA 36.8% 10.1% 364.4% 0 0 0
PR 97.9% 99.5% 98.4% 0 1 0
TN 51.2% 28.4% 180.3% 0 0 0
VA 77.1% 44.1% 174.8% 0 0 0
WV 24.9% 6.0% 415.0% 0 0 0
Total 57.4% 38.2% 150.3% 0 1 0
NICOA [S]: Minorities Overall
NICOA [S]
SCSEP Percent
Minority
Overall
Population Percent
Minority
Overall
Percent
Difference
Less Than
80%
Significant
(P<=.05)
Less Than
80%, Sig
AZ 88.8% 52.0% 170.8% 0 0 0
CA 74.2% 58.1% 127.7% 0 0 0
MN 80.0% 29.3% 273.0% 0 0 0
ND 100.0% 50.4% 198.4% 0 0 0
NM 89.6% 68.9% 130.0% 0 0 0
OK 83.0% 39.1% 212.3% 0 0 0
SD 100.0% 60.3% 165.8% 0 0 0
WI 100.0% 50.7% 197.2% 0 0 0
Total 87.4% 50.5% 173.1% 0 0 0
Page 27 of 199
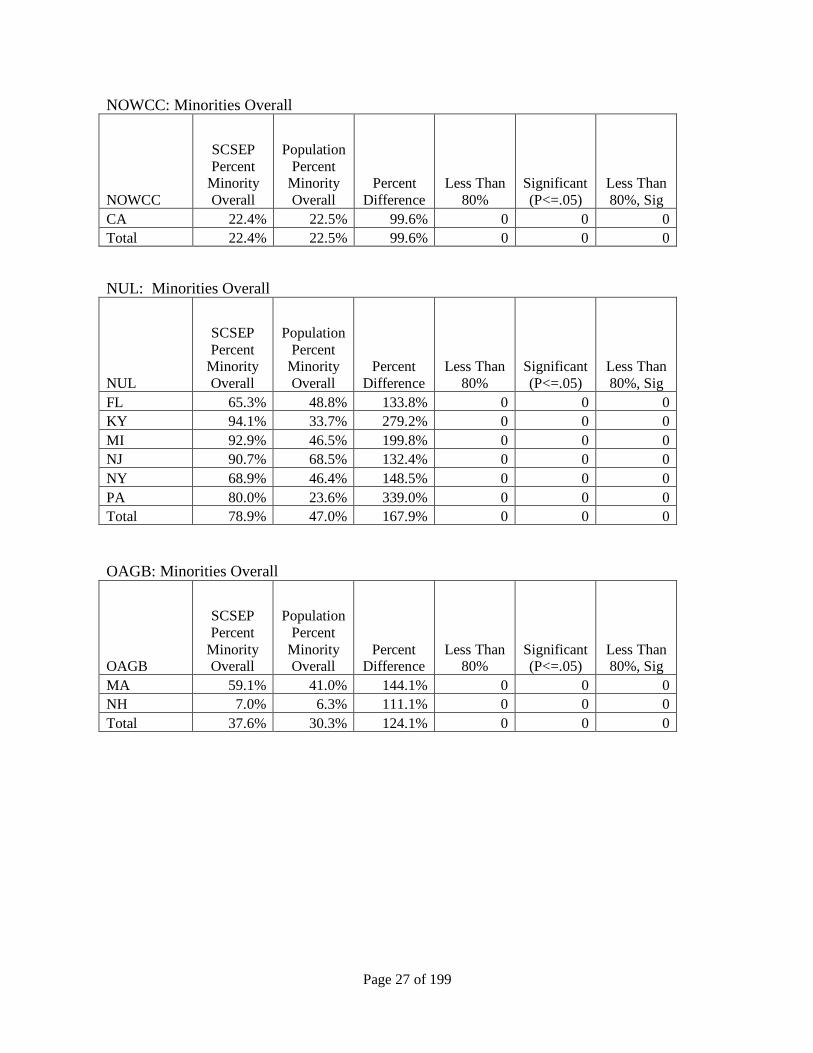
NOWCC: Minorities Overall
NOWCC
SCSEP
Percent Minority
Overall
Population
Percent Minority
Overall
Percent
Difference
Less Than
80%
Significant
(P<=.05)
Less Than
80%, Sig
CA 22.4% 22.5% 99.6% 0 0 0
Total 22.4% 22.5% 99.6% 0 0 0
NUL: Minorities Overall
NUL
SCSEP
Percent Minority
Overall
Population
Percent Minority
Overall
Percent
Difference
Less Than
80%
Significant
(P<=.05)
Less Than
80%, Sig
FL 65.3% 48.8% 133.8% 0 0 0
KY 94.1% 33.7% 279.2% 0 0 0
MI 92.9% 46.5% 199.8% 0 0 0
NJ 90.7% 68.5% 132.4% 0 0 0
NY 68.9% 46.4% 148.5% 0 0 0
PA 80.0% 23.6% 339.0% 0 0 0
Total 78.9% 47.0% 167.9% 0 0 0
OAGB: Minorities Overall
OAGB
SCSEP
Percent
Minority Overall
Population
Percent
Minority Overall
Percent Difference
Less Than 80%
Significant (P<=.05)
Less Than 80%, Sig
MA 59.1% 41.0% 144.1% 0 0 0
NH 7.0% 6.3% 111.1% 0 0 0
Total 37.6% 30.3% 124.1% 0 0 0
Page 28 of 199
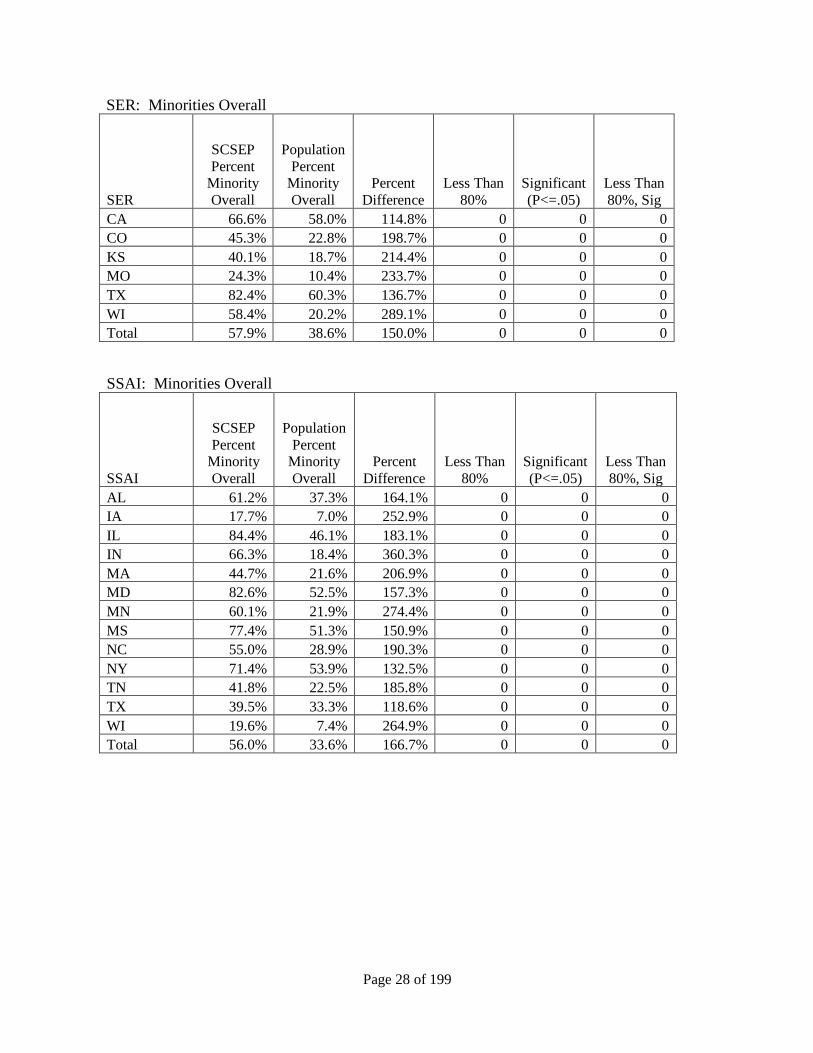
SER: Minorities Overall
SER
SCSEP
Percent Minority
Overall
Population
Percent Minority
Overall
Percent
Difference
Less Than
80%
Significant
(P<=.05)
Less Than
80%, Sig
CA 66.6% 58.0% 114.8% 0 0 0
CO 45.3% 22.8% 198.7% 0 0 0
KS 40.1% 18.7% 214.4% 0 0 0
MO 24.3% 10.4% 233.7% 0 0 0
TX 82.4% 60.3% 136.7% 0 0 0
WI 58.4% 20.2% 289.1% 0 0 0
Total 57.9% 38.6% 150.0% 0 0 0
SSAI: Minorities Overall
SSAI
SCSEP
Percent Minority
Overall
Population
Percent Minority
Overall
Percent
Difference
Less Than
80%
Significant
(P<=.05)
Less Than
80%, Sig
AL 61.2% 37.3% 164.1% 0 0 0
IA 17.7% 7.0% 252.9% 0 0 0
IL 84.4% 46.1% 183.1% 0 0 0
IN 66.3% 18.4% 360.3% 0 0 0
MA 44.7% 21.6% 206.9% 0 0 0
MD 82.6% 52.5% 157.3% 0 0 0
MN 60.1% 21.9% 274.4% 0 0 0
MS 77.4% 51.3% 150.9% 0 0 0
NC 55.0% 28.9% 190.3% 0 0 0
NY 71.4% 53.9% 132.5% 0 0 0
TN 41.8% 22.5% 185.8% 0 0 0
TX 39.5% 33.3% 118.6% 0 0 0
WI 19.6% 7.4% 264.9% 0 0 0
Total 56.0% 33.6% 166.7% 0 0 0
Page 29 of 199
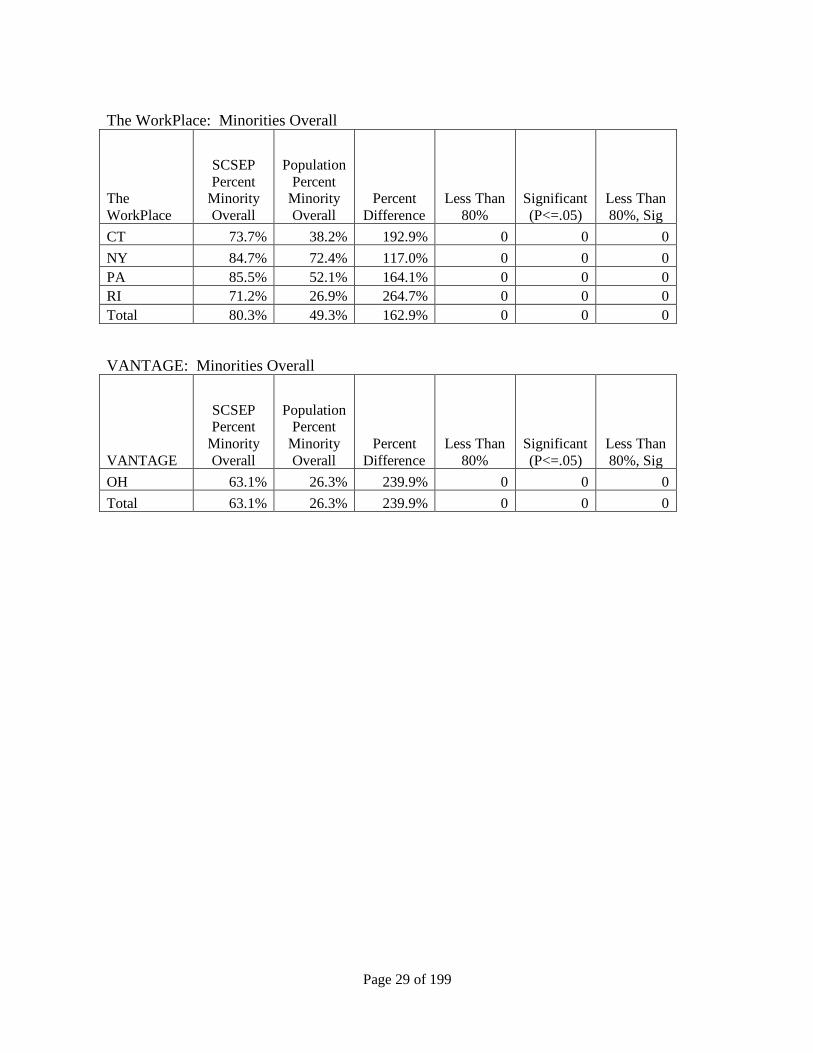
The WorkPlace: Minorities Overall
The
WorkPlace
SCSEP
Percent Minority
Overall
Population
Percent Minority
Overall
Percent
Difference
Less Than
80%
Significant
(P<=.05)
Less Than
80%, Sig
CT 73.7% 38.2% 192.9% 0 0 0
NY 84.7% 72.4% 117.0% 0 0 0
PA 85.5% 52.1% 164.1% 0 0 0
RI 71.2% 26.9% 264.7% 0 0 0
Total 80.3% 49.3% 162.9% 0 0 0
VANTAGE: Minorities Overall
VANTAGE
SCSEP Percent
Minority
Overall
Population Percent
Minority
Overall
Percent
Difference
Less Than
80%
Significant
(P<=.05)
Less Than
80%, Sig
OH 63.1% 26.3% 239.9% 0 0 0
Total 63.1% 26.3% 239.9% 0 0 0
Page 30 of 199
Table 2: Grantees by Hispanic
AARP: Hispanic
AARP
SCSEP Percent
Hispanic
Population Percent
Hispanic
Percent
Difference
Less Than
80%
Significant
(P<=.05)
Less Than
80%, Sig
AR 1.1% 3.3% 33.3% 1 1 1
CO 14.8% 21.9% 67.6% 1 1 1
FL 21.8% 33.0% 66.1% 1 1 1
GA 3.9% 6.9% 56.5% 1 1 1
IA 0.9% 2.9% 31.0% 1 1 1
IN 1.7% 5.9% 28.8% 1 1 1
MO 0.3% 3.3% 9.1% 1 1 1
NV 9.0% 17.6% 51.1% 1 1 1
OH 1.3% 3.6% 36.1% 1 1 1
PA 17.2% 12.9% 133.3% 0 0 0
PR 99.2% 99.2% 100.0% 0 0 0
TX 52.9% 56.9% 93.0% 0 1 0
VA 0.8% 3.2% 25.0% 1 1 1
WA 5.7% 7.1% 80.3% 0 0 0
Total 24.2% 27.6% 87.7% 10 11 10
ANPPM: Hispanic
ANPPM
SCSEP
Percent
Hispanic
Population
Percent
Hispanic
Percent
Difference
Less
Than
80%
Significant
(P<=.05)
Less
Than
80%, Sig
AZ 75.3% 30.1% 250.2% 0 0 0
CA 74.5% 37.9% 196.6% 0 0 0
DC 61.5% 5.1% 1205.9% 0 0 0
LA 1.7% 2.0% 85.0% 0 0 0
PA 79.7% 13.5% 590.4% 0 0 0
Total 40.6% 21.2% 191.5% 0 0 0
Page 31 of 199
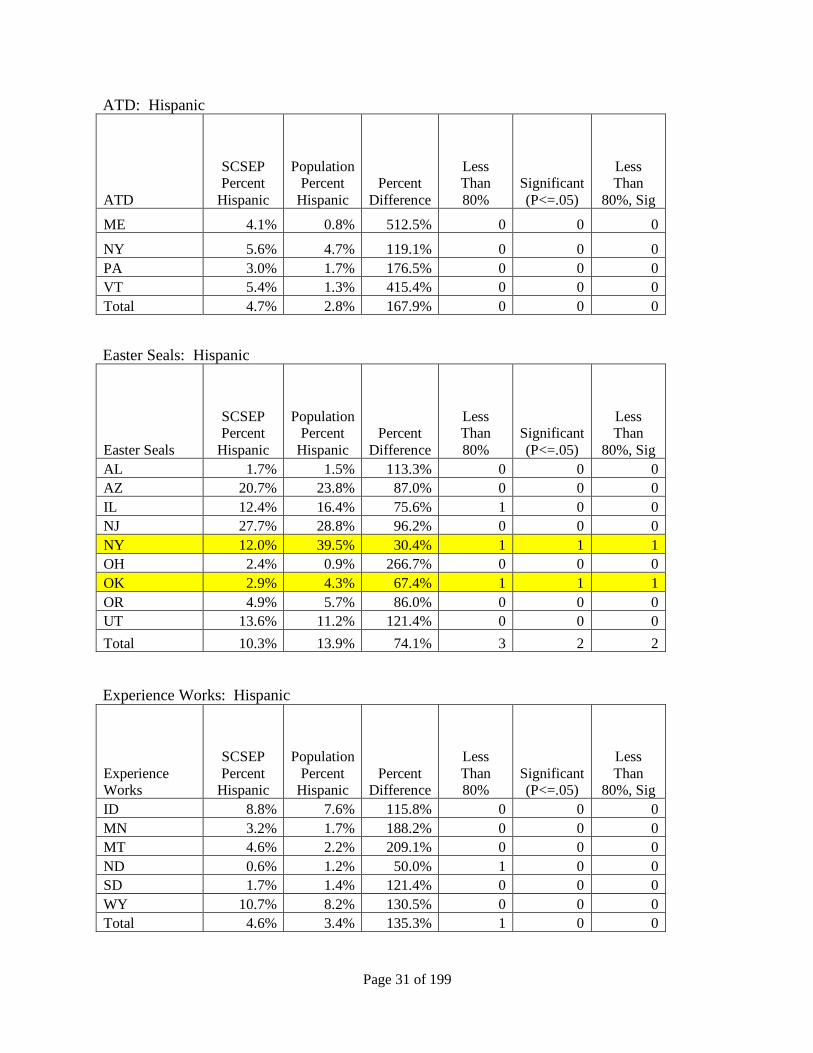
ATD: Hispanic
ATD
SCSEP Percent
Hispanic
Population Percent
Hispanic
Percent
Difference
Less Than
80%
Significant
(P<=.05)
Less Than
80%, Sig
ME 4.1% 0.8% 512.5% 0 0 0
NY 5.6% 4.7% 119.1% 0 0 0
PA 3.0% 1.7% 176.5% 0 0 0
VT 5.4% 1.3% 415.4% 0 0 0
Total 4.7% 2.8% 167.9% 0 0 0
Easter Seals: Hispanic
Easter Seals
SCSEP Percent
Hispanic
Population Percent
Hispanic
Percent
Difference
Less Than
80%
Significant
(P<=.05)
Less Than
80%, Sig
AL 1.7% 1.5% 113.3% 0 0 0
AZ 20.7% 23.8% 87.0% 0 0 0
IL 12.4% 16.4% 75.6% 1 0 0
NJ 27.7% 28.8% 96.2% 0 0 0
NY 12.0% 39.5% 30.4% 1 1 1
OH 2.4% 0.9% 266.7% 0 0 0
OK 2.9% 4.3% 67.4% 1 1 1
OR 4.9% 5.7% 86.0% 0 0 0
UT 13.6% 11.2% 121.4% 0 0 0
Total 10.3% 13.9% 74.1% 3 2 2
Experience Works: Hispanic
Experience Works
SCSEP
Percent Hispanic
Population
Percent Hispanic
Percent Difference
Less
Than 80%
Significant (P<=.05)
Less
Than 80%, Sig
ID 8.8% 7.6% 115.8% 0 0 0
MN 3.2% 1.7% 188.2% 0 0 0
MT 4.6% 2.2% 209.1% 0 0 0
ND 0.6% 1.2% 50.0% 1 0 0
SD 1.7% 1.4% 121.4% 0 0 0
WY 10.7% 8.2% 130.5% 0 0 0
Total 4.6% 3.4% 135.3% 1 0 0
Page 32 of 199
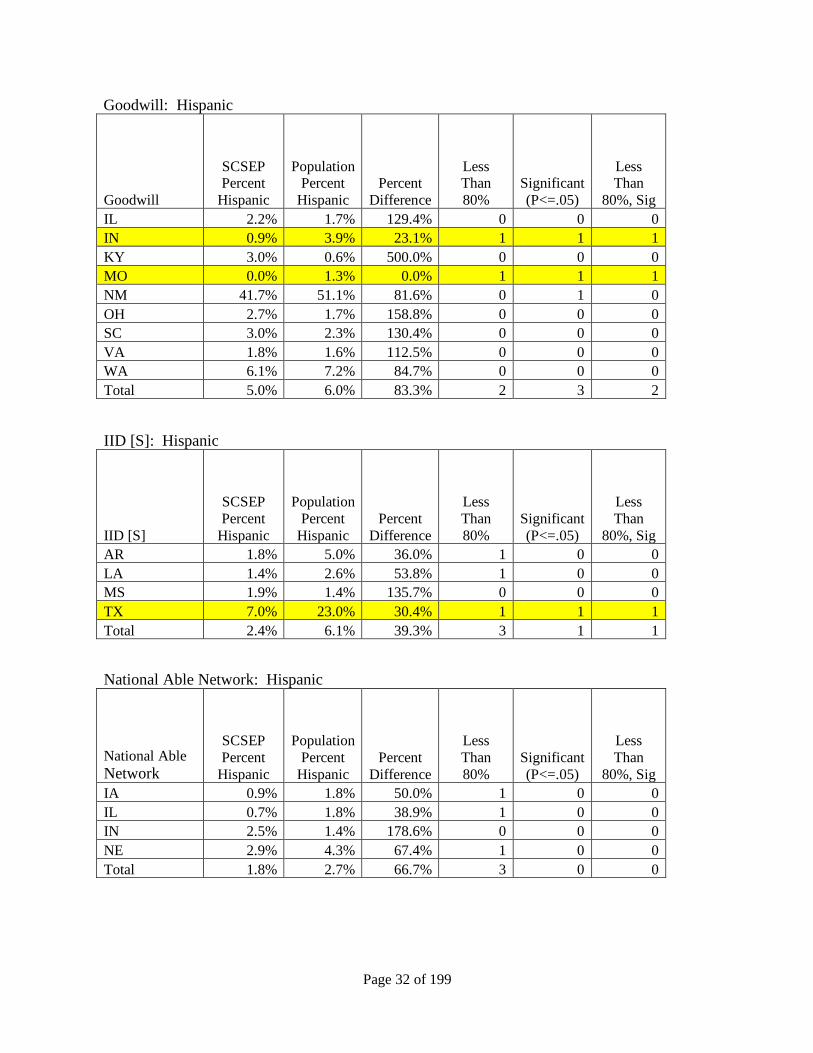
Goodwill: Hispanic
Goodwill
SCSEP Percent
Hispanic
Population Percent
Hispanic
Percent
Difference
Less Than
80%
Significant
(P<=.05)
Less Than
80%, Sig
IL 2.2% 1.7% 129.4% 0 0 0
IN 0.9% 3.9% 23.1% 1 1 1
KY 3.0% 0.6% 500.0% 0 0 0
MO 0.0% 1.3% 0.0% 1 1 1
NM 41.7% 51.1% 81.6% 0 1 0
OH 2.7% 1.7% 158.8% 0 0 0
SC 3.0% 2.3% 130.4% 0 0 0
VA 1.8% 1.6% 112.5% 0 0 0
WA 6.1% 7.2% 84.7% 0 0 0
Total 5.0% 6.0% 83.3% 2 3 2
IID [S]: Hispanic
IID [S]
SCSEP
Percent
Hispanic
Population
Percent
Hispanic
Percent
Difference
Less
Than
80%
Significant
(P<=.05)
Less
Than
80%, Sig
AR 1.8% 5.0% 36.0% 1 0 0
LA 1.4% 2.6% 53.8% 1 0 0
MS 1.9% 1.4% 135.7% 0 0 0
TX 7.0% 23.0% 30.4% 1 1 1
Total 2.4% 6.1% 39.3% 3 1 1
National Able Network: Hispanic
National Able
Network
SCSEP
Percent
Hispanic
Population
Percent
Hispanic
Percent
Difference
Less
Than
80%
Significant
(P<=.05)
Less
Than
80%, Sig
IA 0.9% 1.8% 50.0% 1 0 0
IL 0.7% 1.8% 38.9% 1 0 0
IN 2.5% 1.4% 178.6% 0 0 0
NE 2.9% 4.3% 67.4% 1 0 0
Total 1.8% 2.7% 66.7% 3 0 0
Page 33 of 199
NAPCA [S]: Hispanic
NAPCA [S]
SCSEP Percent
Hispanic
Population Percent
Hispanic
Percent
Difference
Less Than
80%
Significant
(P<=.05)
Less Than
80%, Sig
CA 4.3% 28.1% 15.3% 1 1 1
IL 1.4% 16.4% 8.5% 1 1 1
MA 0.0% 11.6% 0.0% 1 1 1
NY 0.0% 32.1% 0.0% 1 1 1
PA 4.5% 12.8% 35.2% 1 1 1
TX 5.1% 35.5% 14.4% 1 1 1
WA 0.0% 4.9% 0.0% 1 1 1
Total 2.9% 22.0% 13.2% 7 7 7
NAPCA [G]: Hispanic
NAPCA [G]
SCSEP
Percent Hispanic
Population
Percent Hispanic
Percent Difference
Less
Than 80%
Significant (P<=.05)
Less
Than 80%, Sig
CA 9.9% 19.1% 51.8% 1 1 1
IL 6.4% 10.6% 60.4% 1 1 1
NY 1.2% 21.5% 5.6% 1 1 1
Total 7.7% 15.9% 48.4% 3 3 3
NCBA: Hispanic
NCBA
SCSEP
Percent
Hispanic
Population
Percent
Hispanic
Percent
Difference
Less
Than
80%
Significant
(P<=.05)
Less
Than
80%, Sig
AR 0.8% 3.1% 25.8% 1 1 1
DC 2.3% 5.1% 45.1% 1 1 1
FL 7.0% 5.4% 129.6% 0 0 0
IL 3.8% 16.4% 23.2% 1 1 1
MI 3.0% 3.1% 96.8% 0 0 0
MO 2.9% 1.9% 152.6% 0 0 0
MS 0.4% 0.9% 44.4% 1 0 0
NC 9.5% 4.0% 237.5% 0 0 0
OH 2.3% 5.5% 41.8% 1 1 1
Total 3.7% 4.0% 92.5% 5 4 4
Page 34 of 199
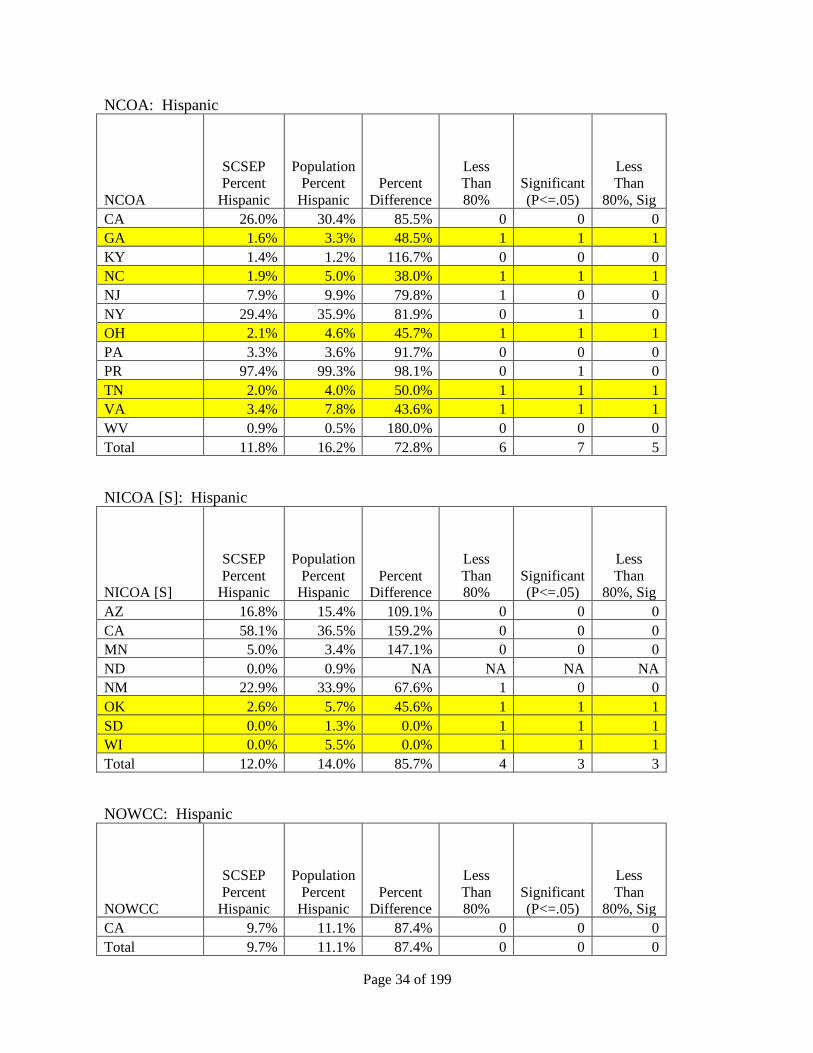
NCOA: Hispanic
NCOA
SCSEP Percent
Hispanic
Population Percent
Hispanic
Percent
Difference
Less Than
80%
Significant
(P<=.05)
Less Than
80%, Sig
CA 26.0% 30.4% 85.5% 0 0 0
GA 1.6% 3.3% 48.5% 1 1 1
KY 1.4% 1.2% 116.7% 0 0 0
NC 1.9% 5.0% 38.0% 1 1 1
NJ 7.9% 9.9% 79.8% 1 0 0
NY 29.4% 35.9% 81.9% 0 1 0
OH 2.1% 4.6% 45.7% 1 1 1
PA 3.3% 3.6% 91.7% 0 0 0
PR 97.4% 99.3% 98.1% 0 1 0
TN 2.0% 4.0% 50.0% 1 1 1
VA 3.4% 7.8% 43.6% 1 1 1
WV 0.9% 0.5% 180.0% 0 0 0
Total 11.8% 16.2% 72.8% 6 7 5
NICOA [S]: Hispanic
NICOA [S]
SCSEP
Percent Hispanic
Population
Percent Hispanic
Percent Difference
Less
Than 80%
Significant (P<=.05)
Less
Than 80%, Sig
AZ 16.8% 15.4% 109.1% 0 0 0
CA 58.1% 36.5% 159.2% 0 0 0
MN 5.0% 3.4% 147.1% 0 0 0
ND 0.0% 0.9% NA NA NA NA
NM 22.9% 33.9% 67.6% 1 0 0
OK 2.6% 5.7% 45.6% 1 1 1
SD 0.0% 1.3% 0.0% 1 1 1
WI 0.0% 5.5% 0.0% 1 1 1
Total 12.0% 14.0% 85.7% 4 3 3
NOWCC: Hispanic
NOWCC
SCSEP
Percent Hispanic
Population
Percent Hispanic
Percent Difference
Less
Than 80%
Significant (P<=.05)
Less
Than 80%, Sig
CA 9.7% 11.1% 87.4% 0 0 0
Total 9.7% 11.1% 87.4% 0 0 0
Page 35 of 199
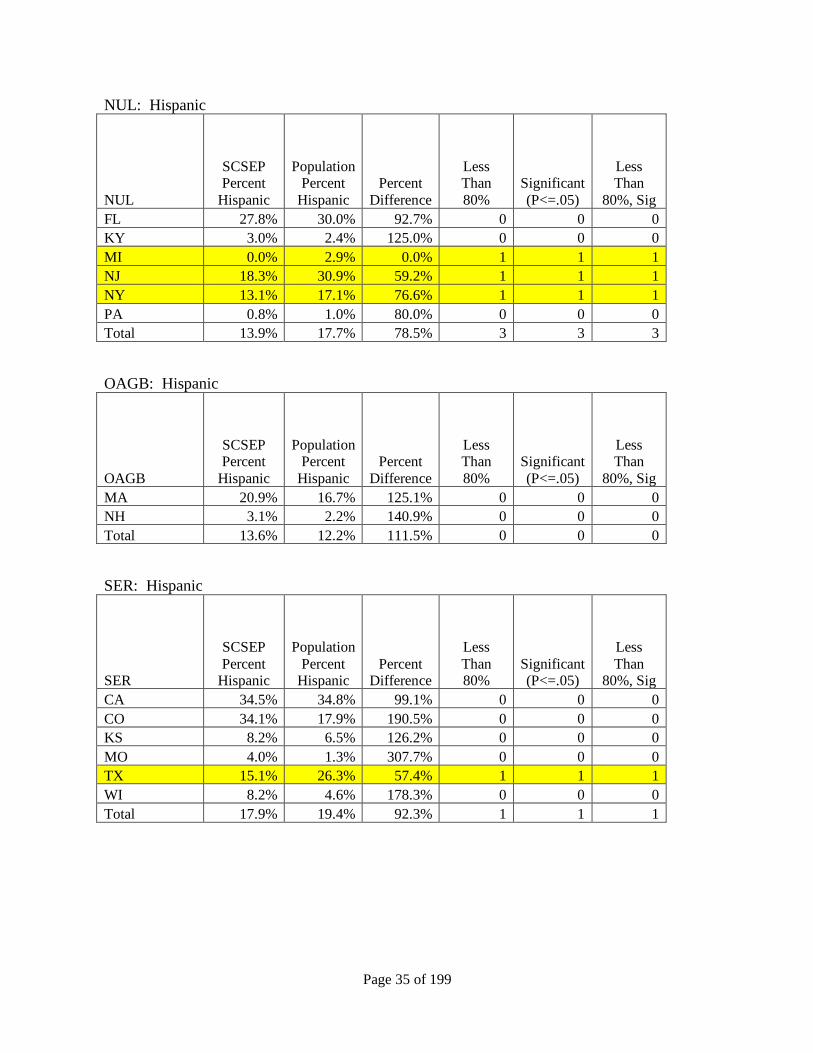
NUL: Hispanic
NUL
SCSEP Percent
Hispanic
Population Percent
Hispanic
Percent
Difference
Less Than
80%
Significant
(P<=.05)
Less Than
80%, Sig
FL 27.8% 30.0% 92.7% 0 0 0
KY 3.0% 2.4% 125.0% 0 0 0
MI 0.0% 2.9% 0.0% 1 1 1
NJ 18.3% 30.9% 59.2% 1 1 1
NY 13.1% 17.1% 76.6% 1 1 1
PA 0.8% 1.0% 80.0% 0 0 0
Total 13.9% 17.7% 78.5% 3 3 3
OAGB: Hispanic
OAGB
SCSEP Percent
Hispanic
Population Percent
Hispanic
Percent
Difference
Less Than
80%
Significant
(P<=.05)
Less Than
80%, Sig
MA 20.9% 16.7% 125.1% 0 0 0
NH 3.1% 2.2% 140.9% 0 0 0
Total 13.6% 12.2% 111.5% 0 0 0
SER: Hispanic
SER
SCSEP
Percent Hispanic
Population
Percent Hispanic
Percent Difference
Less
Than 80%
Significant (P<=.05)
Less
Than 80%, Sig
CA 34.5% 34.8% 99.1% 0 0 0
CO 34.1% 17.9% 190.5% 0 0 0
KS 8.2% 6.5% 126.2% 0 0 0
MO 4.0% 1.3% 307.7% 0 0 0
TX 15.1% 26.3% 57.4% 1 1 1
WI 8.2% 4.6% 178.3% 0 0 0
Total 17.9% 19.4% 92.3% 1 1 1
Page 36 of 199
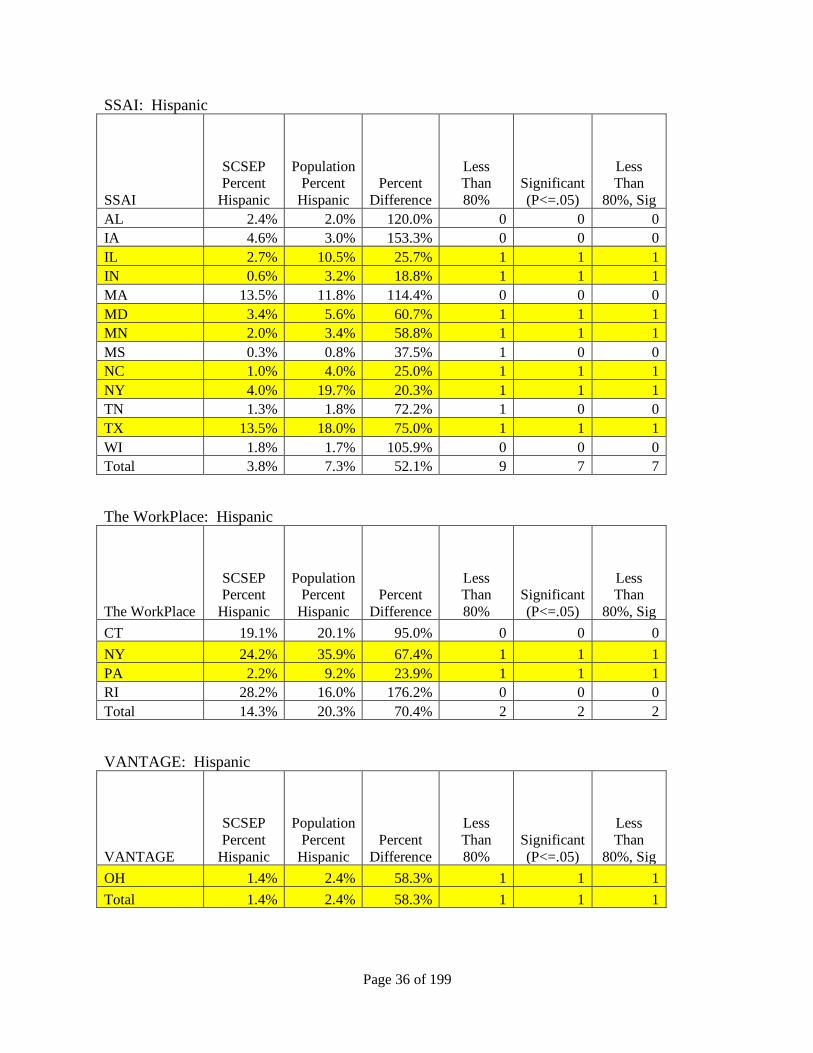
SSAI: Hispanic
SSAI
SCSEP Percent
Hispanic
Population Percent
Hispanic
Percent
Difference
Less Than
80%
Significant
(P<=.05)
Less Than
80%, Sig
AL 2.4% 2.0% 120.0% 0 0 0
IA 4.6% 3.0% 153.3% 0 0 0
IL 2.7% 10.5% 25.7% 1 1 1
IN 0.6% 3.2% 18.8% 1 1 1
MA 13.5% 11.8% 114.4% 0 0 0
MD 3.4% 5.6% 60.7% 1 1 1
MN 2.0% 3.4% 58.8% 1 1 1
MS 0.3% 0.8% 37.5% 1 0 0
NC 1.0% 4.0% 25.0% 1 1 1
NY 4.0% 19.7% 20.3% 1 1 1
TN 1.3% 1.8% 72.2% 1 0 0
TX 13.5% 18.0% 75.0% 1 1 1
WI 1.8% 1.7% 105.9% 0 0 0
Total 3.8% 7.3% 52.1% 9 7 7
The WorkPlace: Hispanic
The WorkPlace
SCSEP Percent
Hispanic
Population Percent
Hispanic
Percent
Difference
Less Than
80%
Significant
(P<=.05)
Less Than
80%, Sig
CT 19.1% 20.1% 95.0% 0 0 0
NY 24.2% 35.9% 67.4% 1 1 1
PA 2.2% 9.2% 23.9% 1 1 1
RI 28.2% 16.0% 176.2% 0 0 0
Total 14.3% 20.3% 70.4% 2 2 2
VANTAGE: Hispanic
VANTAGE
SCSEP
Percent
Hispanic
Population
Percent
Hispanic
Percent
Difference
Less
Than
80%
Significant
(P<=.05)
Less
Than
80%, Sig
OH 1.4% 2.4% 58.3% 1 1 1
Total 1.4% 2.4% 58.3% 1 1 1
Page 37 of 199
Table 3: Grantees by Black
AARP: Black
AARP
SCSEP Percent
Black
Population Percent
Black
Percent
Difference
Less Than
80%
Significant
(P<=.05)
Less Than
80%, Sig
AR 55.0% 24.9% 220.9% 0 0 0
CO 50.5% 11.3% 446.9% 0 0 0
FL 40.7% 16.7% 243.7% 0 0 0
GA 87.9% 51.7% 170.0% 0 0 0
IA 51.1% 7.5% 681.3% 0 0 0
IN 62.8% 18.4% 341.3% 0 0 0
MO 85.9% 34.9% 246.1% 0 0 0
NV 40.0% 9.9% 404.0% 0 0 0
OH 81.5% 32.0% 254.7% 0 0 0
PA 47.9% 11.5% 416.5% 0 0 0
PR 11.0% 9.5% 115.8% 0 0 0
TX 32.1% 15.0% 214.0% 0 0 0
VA 86.2% 48.5% 177.7% 0 0 0
WA 30.2% 4.8% 629.2% 0 0 0
Total 48.9% 19.7% 248.2% 0 0 0
ANPPM: Black
ANPPM
SCSEP Percent
Black
Population Percent
Black
Percent
Difference
Less Than
80%
Significant
(P<=.05)
Less Than
80%, Sig
AZ 5.8% 2.5% 232.0% 0 0 0
CA 8.5% 10.0% 85.0% 0 0 0
DC 44.2% 79.9% 55.3% 1 1 1
LA 75.7% 46.1% 164.2% 0 0 0
PA 19.0% 52.2% 36.4% 1 1 1
Total 42.1% 28.2% 149.3% 2 2 2
Page 38 of 199
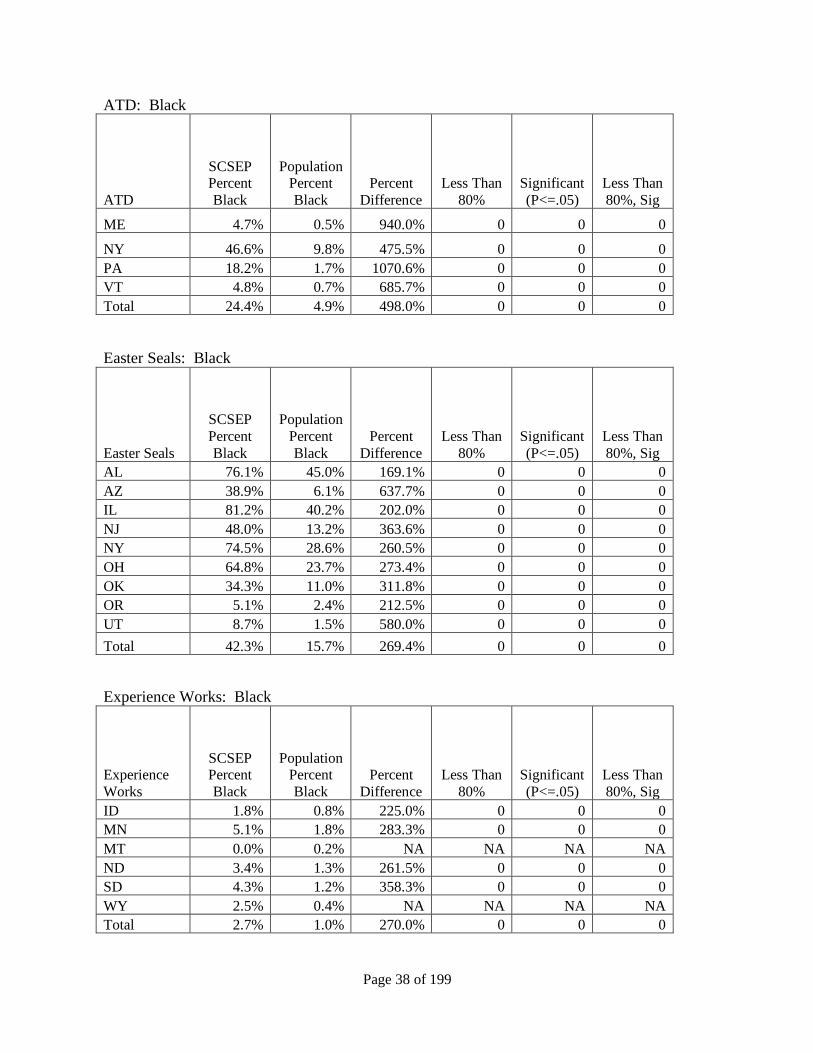
ATD: Black
ATD
SCSEP Percent
Black
Population Percent
Black
Percent
Difference
Less Than
80%
Significant
(P<=.05)
Less Than
80%, Sig
ME 4.7% 0.5% 940.0% 0 0 0
NY 46.6% 9.8% 475.5% 0 0 0
PA 18.2% 1.7% 1070.6% 0 0 0
VT 4.8% 0.7% 685.7% 0 0 0
Total 24.4% 4.9% 498.0% 0 0 0
Easter Seals: Black
Easter Seals
SCSEP
Percent
Black
Population
Percent
Black
Percent
Difference
Less Than
80%
Significant
(P<=.05)
Less Than
80%, Sig
AL 76.1% 45.0% 169.1% 0 0 0
AZ 38.9% 6.1% 637.7% 0 0 0
IL 81.2% 40.2% 202.0% 0 0 0
NJ 48.0% 13.2% 363.6% 0 0 0
NY 74.5% 28.6% 260.5% 0 0 0
OH 64.8% 23.7% 273.4% 0 0 0
OK 34.3% 11.0% 311.8% 0 0 0
OR 5.1% 2.4% 212.5% 0 0 0
UT 8.7% 1.5% 580.0% 0 0 0
Total 42.3% 15.7% 269.4% 0 0 0
Experience Works: Black
Experience
Works
SCSEP Percent
Black
Population Percent
Black
Percent
Difference
Less Than
80%
Significant
(P<=.05)
Less Than
80%, Sig
ID 1.8% 0.8% 225.0% 0 0 0
MN 5.1% 1.8% 283.3% 0 0 0
MT 0.0% 0.2% NA NA NA NA
ND 3.4% 1.3% 261.5% 0 0 0
SD 4.3% 1.2% 358.3% 0 0 0
WY 2.5% 0.4% NA NA NA NA
Total 2.7% 1.0% 270.0% 0 0 0
Page 39 of 199
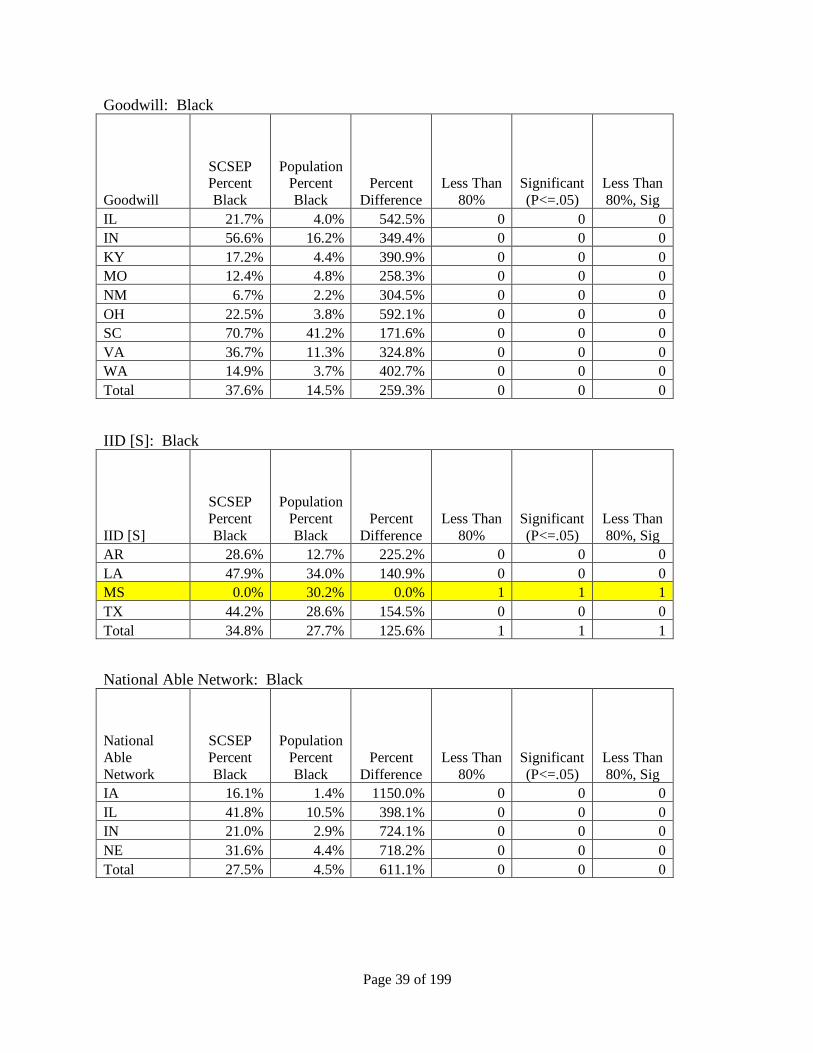
Goodwill: Black
Goodwill
SCSEP Percent
Black
Population Percent
Black
Percent
Difference
Less Than
80%
Significant
(P<=.05)
Less Than
80%, Sig
IL 21.7% 4.0% 542.5% 0 0 0
IN 56.6% 16.2% 349.4% 0 0 0
KY 17.2% 4.4% 390.9% 0 0 0
MO 12.4% 4.8% 258.3% 0 0 0
NM 6.7% 2.2% 304.5% 0 0 0
OH 22.5% 3.8% 592.1% 0 0 0
SC 70.7% 41.2% 171.6% 0 0 0
VA 36.7% 11.3% 324.8% 0 0 0
WA 14.9% 3.7% 402.7% 0 0 0
Total 37.6% 14.5% 259.3% 0 0 0
IID [S]: Black
IID [S]
SCSEP
Percent
Black
Population
Percent
Black
Percent
Difference
Less Than
80%
Significant
(P<=.05)
Less Than
80%, Sig
AR 28.6% 12.7% 225.2% 0 0 0
LA 47.9% 34.0% 140.9% 0 0 0
MS 0.0% 30.2% 0.0% 1 1 1
TX 44.2% 28.6% 154.5% 0 0 0
Total 34.8% 27.7% 125.6% 1 1 1
National Able Network: Black
National
Able
Network
SCSEP
Percent
Black
Population
Percent
Black
Percent
Difference
Less Than
80%
Significant
(P<=.05)
Less Than
80%, Sig
IA 16.1% 1.4% 1150.0% 0 0 0
IL 41.8% 10.5% 398.1% 0 0 0
IN 21.0% 2.9% 724.1% 0 0 0
NE 31.6% 4.4% 718.2% 0 0 0
Total 27.5% 4.5% 611.1% 0 0 0
Page 40 of 199
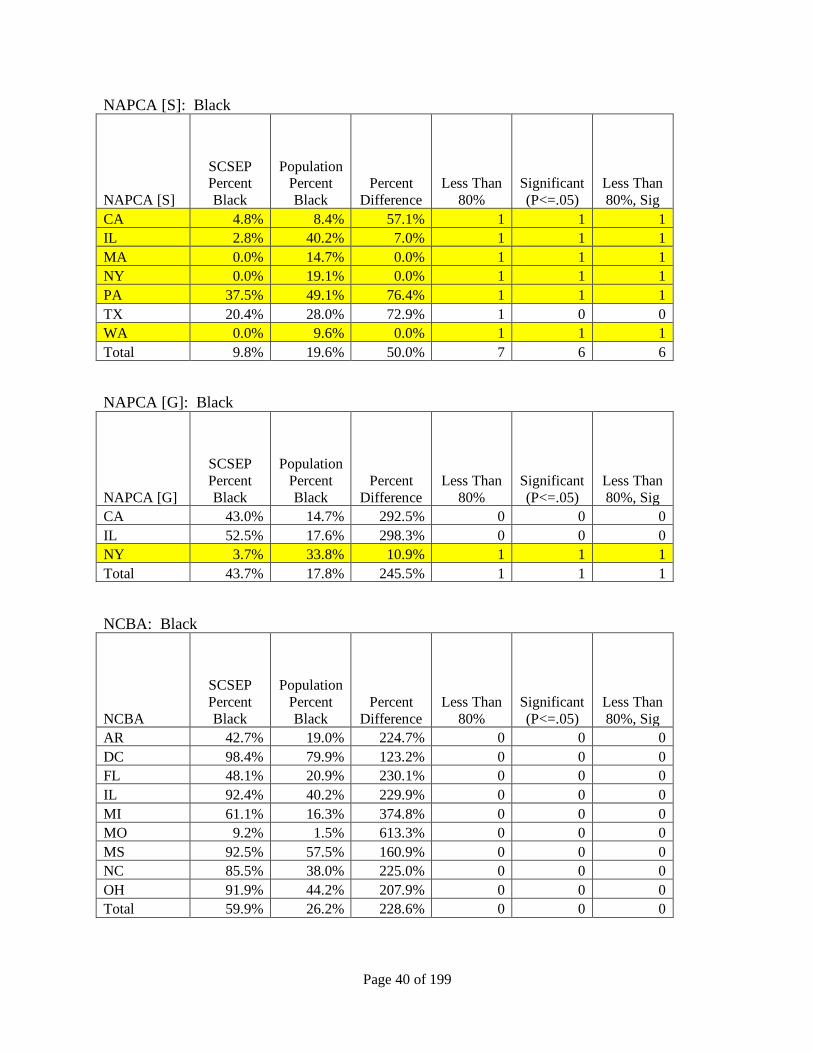
NAPCA [S]: Black
NAPCA [S]
SCSEP Percent
Black
Population Percent
Black
Percent
Difference
Less Than
80%
Significant
(P<=.05)
Less Than
80%, Sig
CA 4.8% 8.4% 57.1% 1 1 1
IL 2.8% 40.2% 7.0% 1 1 1
MA 0.0% 14.7% 0.0% 1 1 1
NY 0.0% 19.1% 0.0% 1 1 1
PA 37.5% 49.1% 76.4% 1 1 1
TX 20.4% 28.0% 72.9% 1 0 0
WA 0.0% 9.6% 0.0% 1 1 1
Total 9.8% 19.6% 50.0% 7 6 6
NAPCA [G]: Black
NAPCA [G]
SCSEP
Percent
Black
Population
Percent
Black
Percent
Difference
Less Than
80%
Significant
(P<=.05)
Less Than
80%, Sig
CA 43.0% 14.7% 292.5% 0 0 0
IL 52.5% 17.6% 298.3% 0 0 0
NY 3.7% 33.8% 10.9% 1 1 1
Total 43.7% 17.8% 245.5% 1 1 1
NCBA: Black
NCBA
SCSEP
Percent
Black
Population
Percent
Black
Percent
Difference
Less Than
80%
Significant
(P<=.05)
Less Than
80%, Sig
AR 42.7% 19.0% 224.7% 0 0 0
DC 98.4% 79.9% 123.2% 0 0 0
FL 48.1% 20.9% 230.1% 0 0 0
IL 92.4% 40.2% 229.9% 0 0 0
MI 61.1% 16.3% 374.8% 0 0 0
MO 9.2% 1.5% 613.3% 0 0 0
MS 92.5% 57.5% 160.9% 0 0 0
NC 85.5% 38.0% 225.0% 0 0 0
OH 91.9% 44.2% 207.9% 0 0 0
Total 59.9% 26.2% 228.6% 0 0 0
Page 41 of 199
NCOA: Black
NCOA
SCSEP Percent
Black
Population Percent
Black
Percent
Difference
Less Than
80%
Significant
(P<=.05)
Less Than
80%, Sig
CA 24.9% 6.0% 415.0% 0 0 0
GA 66.4% 38.3% 173.4% 0 0 0
KY 34.6% 7.4% 467.6% 0 0 0
NC 83.7% 42.4% 197.4% 0 0 0
NJ 47.8% 16.0% 298.7% 0 0 0
NY 35.5% 19.6% 181.1% 0 0 0
OH 59.7% 17.8% 335.4% 0 0 0
PA 32.8% 4.7% 697.9% 0 0 0
PR 18.7% 12.6% 148.4% 0 0 0
TN 48.4% 20.8% 232.7% 0 0 0
VA 69.0% 23.2% 297.4% 0 0 0
WV 23.4% 4.1% 570.7% 0 0 0
Total 44.8% 16.8% 266.7% 0 0 0
NICOA [S]: Black
NICOA [S]
SCSEP
Percent Black
Population
Percent Black
Percent Difference
Less Than 80%
Significant (P<=.05)
Less Than 80%, Sig
AZ 4.7% 3.1% 151.6% 0 0 0
CA 9.7% 9.1% 106.6% 0 0 0
MN 40.0% 17.5% 228.6% 0 0 0
ND 0.0% 0.0% NA NA NA NA
NM 2.1% 1.5% 140.0% 0 0 0
OK 45.8% 15.2% 301.3% 0 0 0
SD 0.0% 0.6% NA NA NA NA
WI 40.7% 11.9% 342.0% 0 0 0
Total 22.5% 7.3% 308.2% 0 0 0
NOWCC: Black
NOWCC
SCSEP
Percent Black
Population
Percent Black
Percent Difference
Less Than 80%
Significant (P<=.05)
Less Than 80%, Sig
CA 4.6% 1.8% 255.6% 0 0 0
Total 4.6% 1.8% 255.6% 0 0 0
Page 42 of 199
NUL: Black
NUL
SCSEP Percent
Black
Population Percent
Black
Percent
Difference
Less Than
80%
Significant
(P<=.05)
Less Than
80%, Sig
KY 35.6% 16.7% 213.2% 0 0 0
MA 91.1% 28.1% 324.2% 0 0 0
MI 92.1% 38.7% 238.0% 0 0 0
NJ 71.7% 32.4% 221.3% 0 0 0
NY 47.8% 13.3% 359.4% 0 0 0
PA 79.2% 19.8% 400.0% 0 0 0
Total 63.1% 23.2% 272.0% 0 0 0
OAGB: Black
OAGB
SCSEP Percent
Black
Population Percent
Black
Percent
Difference
Less Than
80%
Significant
(P<=.05)
Less Than
80%, Sig
MA 31.7% 13.5% 234.8% 0 0 0
NH 3.1% 1.4% 221.4% 0 0 0
Total 19.9% 9.8% 203.1% 0 0 0
SER: Black
SER
SCSEP
Percent Black
Population
Percent Black
Percent Difference
Less Than 80%
Significant (P<=.05)
Less Than 80%, Sig
CA 26.0% 7.2% 361.1% 0 0 0
CO 5.8% 1.0% 580.0% 0 0 0
KS 28.8% 7.8% 369.2% 0 0 0
MO 19.7% 6.8% 289.7% 0 0 0
TX 65.4% 26.5% 246.8% 0 0 0
WI 49.0% 12.5% 392.0% 0 0 0
Total 36.8% 10.7% 343.9% 0 0 0
Page 43 of 199
SSAI: Black
SSAI
SCSEP Percent
Black
Population Percent
Black
Percent
Difference
Less Than
80%
Significant
(P<=.05)
Less Than
80%, Sig
AL 58.1% 32.9% 176.6% 0 0 0
IA 8.5% 2.0% 425.0% 0 0 0
IL 80.6% 29.0% 277.9% 0 0 0
IN 65.1% 12.0% 542.5% 0 0 0
MA 29.2% 5.8% 503.4% 0 0 0
MD 75.1% 39.0% 192.6% 0 0 0
MN 50.1% 11.7% 428.2% 0 0 0
MS 76.5% 48.5% 157.7% 0 0 0
NC 51.8% 21.2% 244.3% 0 0 0
NY 33.6% 21.6% 155.6% 0 0 0
TN 40.0% 18.3% 218.6% 0 0 0
TX 23.8% 11.7% 203.4% 0 0 0
WI 7.9% 1.1% 718.2% 0 0 0
Total 46.9% 20.9% 224.4% 0 0 0
The WorkPlace: Black
The
WorkPlace
SCSEP Percent
Black
Population Percent
Black
Percent
Difference
Less Than
80%
Significant
(P<=.05)
Less Than
80%, Sig
CT 52.8% 14.7% 359.2% 0 0 0
NY 54.4% 27.0% 201.5% 0 0 0
PA 82.0% 36.1% 227.1% 0 0 0
RI 37.8% 6.8% 555.9% 0 0 0
Total 63.2% 23.1% 273.6% 0 0 0
VANTAGE: Black
VANTAGE
SCSEP
Percent
Black
Population
Percent
Black
Percent
Difference
Less Than
80%
Significant
(P<=.05)
Less Than
80%, Sig
OH 59.9% 21.1% 283.9% 0 0 0
Total 59.9% 21.1% 283.9% 0 0 0
Page 44 of 199
Table 4: Grantees by Asian
AARP: Asian
AARP
SCSEP Percent
Asian
Population Percent
Asian
Percent
Difference
Less Than
80%
Significant
(P<=.05)
Less Than
80%, Sig
AR 0.4% 1.5% 26.7% 1 1 1
CO 1.1% 4.7% 23.4% 1 1 1
FL 0.8% 1.9% 42.1% 1 1 1
GA 1.3% 6.6% 19.7% 1 1 1
IA 0.0% 1.3% 0.0% 1 1 1
IN 0.6% 0.6% 100.0% 0 0 0
MO 0.0% 2.6% 0.0% 1 1 1
NV 2.9% 7.1% 40.8% 1 1 1
OH 0.0% 2.9% 0.0% 1 1 1
PA 1.1% 1.8% 61.1% 1 0 0
PR 0.0% 0.2% NA NA NA NA
TX 1.4% 3.4% 41.2% 1 1 1
VA 0.0% 3.5% 0.0% 1 1 1
WA 4.9% 10.4% 47.1% 1 1 1
Total 1.0% 3.2% 31.2% 12 11 11
ANPPM: Asian
ANPPM
SCSEP
Percent Asian
Population
Percent Asian
Percent Difference
Less Than 80%
Significant (P<=.05)
Less Than 80%, Sig
AZ 0.0% 1.5% 0.0% 1 1 1
CA 6.6% 13.3% 49.6% 1 1 1
DC 0.0% 2.4% 0.0% 1 1 1
LA 0.0% 1.2% 0.0% 1 1 1
PA 0.6% 6.4% 9.4% 1 1 1
Total 2.0% 6.9% 29.0% 5 5 5
Page 45 of 199
ATD: Asian
ATD
SCSEP Percent
Asian
Population Percent
Asian
Percent
Difference
Less Than
80%
Significant
(P<=.05)
Less Than
80%, Sig
ME 0.6% 0.6% 100.0% 0 0 0
NY 0.0% 2.1% 0.0% 1 1 1
PA 1.0% 0.8% 125.0% 0 0 0
VT 0.0% 1.0% 0.0% 1 1 1
Total 0.3% 1.4% 21.4% 2 2 2
Easter Seals: Asian
Easter Seals
SCSEP
Percent
Asian
Population
Percent
Asian
Percent
Difference
Less Than
80%
Significant
(P<=.05)
Less Than
80%, Sig
AL 0.3% 1.0% 30.0% 1 1 1
AZ 1.5% 3.3% 45.5% 1 1 1
IL 0.5% 6.6% 7.6% 1 1 1
NJ 12.5% 13.6% 91.9% 0 0 0
NY 1.5% 11.9% 12.6% 1 1 1
OH 0.0% 0.6% 0.0% 1 1 1
OK 0.3% 1.5% 20.0% 1 1 1
OR 2.7% 3.4% 79.4% 1 0 0
UT 1.4% 1.8% 77.8% 1 0 0
Total 2.6% 5.0% 52.0% 8 6 6
Experience Works: Asian
Experience Works
SCSEP
Percent Asian
Population
Percent Asian
Percent Difference
Less Than 80%
Significant (P<=.05)
Less Than 80%, Sig
ID 0.0% 1.4% 0.0% 1 1 1
MN 0.0% 0.7% 0.0% 1 1 1
MT 0.0% 0.3% NA NA NA NA
ND 0.0% 0.5% NA NA NA NA
SD 0.0% 0.6% NA NA NA NA
WY 0.8% 1.4% 57.1% 1 0 0
Total 0.1% 0.8% 12.5% 3 2 2
Page 46 of 199
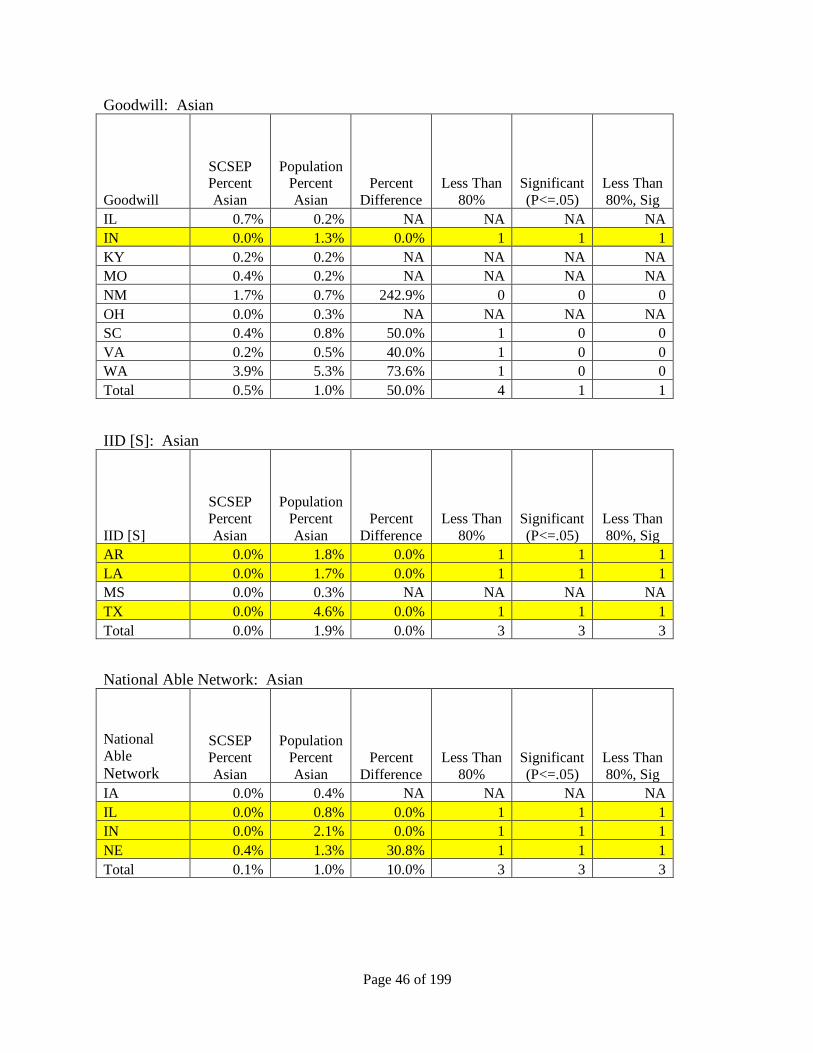
Goodwill: Asian
Goodwill
SCSEP Percent
Asian
Population Percent
Asian
Percent
Difference
Less Than
80%
Significant
(P<=.05)
Less Than
80%, Sig
IL 0.7% 0.2% NA NA NA NA
IN 0.0% 1.3% 0.0% 1 1 1
KY 0.2% 0.2% NA NA NA NA
MO 0.4% 0.2% NA NA NA NA
NM 1.7% 0.7% 242.9% 0 0 0
OH 0.0% 0.3% NA NA NA NA
SC 0.4% 0.8% 50.0% 1 0 0
VA 0.2% 0.5% 40.0% 1 0 0
WA 3.9% 5.3% 73.6% 1 0 0
Total 0.5% 1.0% 50.0% 4 1 1
IID [S]: Asian
IID [S]
SCSEP
Percent
Asian
Population
Percent
Asian
Percent
Difference
Less Than
80%
Significant
(P<=.05)
Less Than
80%, Sig
AR 0.0% 1.8% 0.0% 1 1 1
LA 0.0% 1.7% 0.0% 1 1 1
MS 0.0% 0.3% NA NA NA NA
TX 0.0% 4.6% 0.0% 1 1 1
Total 0.0% 1.9% 0.0% 3 3 3
National Able Network: Asian
National
Able
Network
SCSEP
Percent
Asian
Population
Percent
Asian
Percent
Difference
Less Than
80%
Significant
(P<=.05)
Less Than
80%, Sig
IA 0.0% 0.4% NA NA NA NA
IL 0.0% 0.8% 0.0% 1 1 1
IN 0.0% 2.1% 0.0% 1 1 1
NE 0.4% 1.3% 30.8% 1 1 1
Total 0.1% 1.0% 10.0% 3 3 3
Page 47 of 199
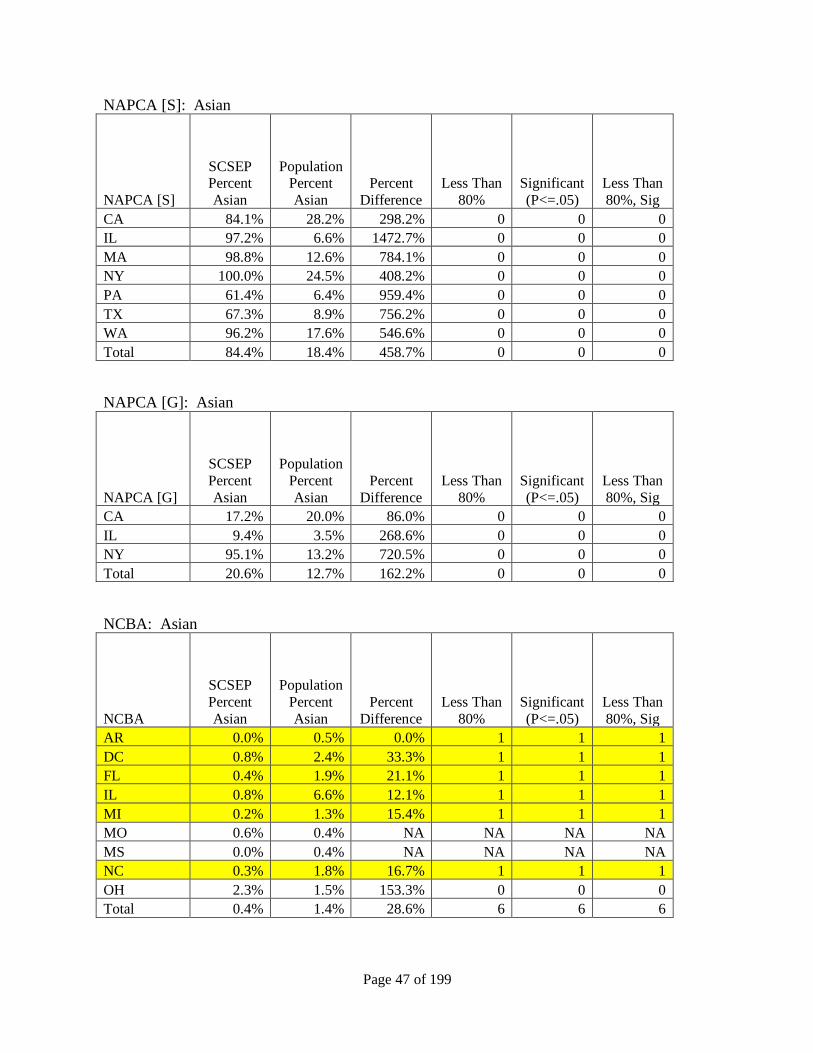
NAPCA [S]: Asian
NAPCA [S]
SCSEP Percent
Asian
Population Percent
Asian
Percent
Difference
Less Than
80%
Significant
(P<=.05)
Less Than
80%, Sig
CA 84.1% 28.2% 298.2% 0 0 0
IL 97.2% 6.6% 1472.7% 0 0 0
MA 98.8% 12.6% 784.1% 0 0 0
NY 100.0% 24.5% 408.2% 0 0 0
PA 61.4% 6.4% 959.4% 0 0 0
TX 67.3% 8.9% 756.2% 0 0 0
WA 96.2% 17.6% 546.6% 0 0 0
Total 84.4% 18.4% 458.7% 0 0 0
NAPCA [G]: Asian
NAPCA [G]
SCSEP
Percent
Asian
Population
Percent
Asian
Percent
Difference
Less Than
80%
Significant
(P<=.05)
Less Than
80%, Sig
CA 17.2% 20.0% 86.0% 0 0 0
IL 9.4% 3.5% 268.6% 0 0 0
NY 95.1% 13.2% 720.5% 0 0 0
Total 20.6% 12.7% 162.2% 0 0 0
NCBA: Asian
NCBA
SCSEP
Percent
Asian
Population
Percent
Asian
Percent
Difference
Less Than
80%
Significant
(P<=.05)
Less Than
80%, Sig
AR 0.0% 0.5% 0.0% 1 1 1
DC 0.8% 2.4% 33.3% 1 1 1
FL 0.4% 1.9% 21.1% 1 1 1
IL 0.8% 6.6% 12.1% 1 1 1
MI 0.2% 1.3% 15.4% 1 1 1
MO 0.6% 0.4% NA NA NA NA
MS 0.0% 0.4% NA NA NA NA
NC 0.3% 1.8% 16.7% 1 1 1
OH 2.3% 1.5% 153.3% 0 0 0
Total 0.4% 1.4% 28.6% 6 6 6
Page 48 of 199
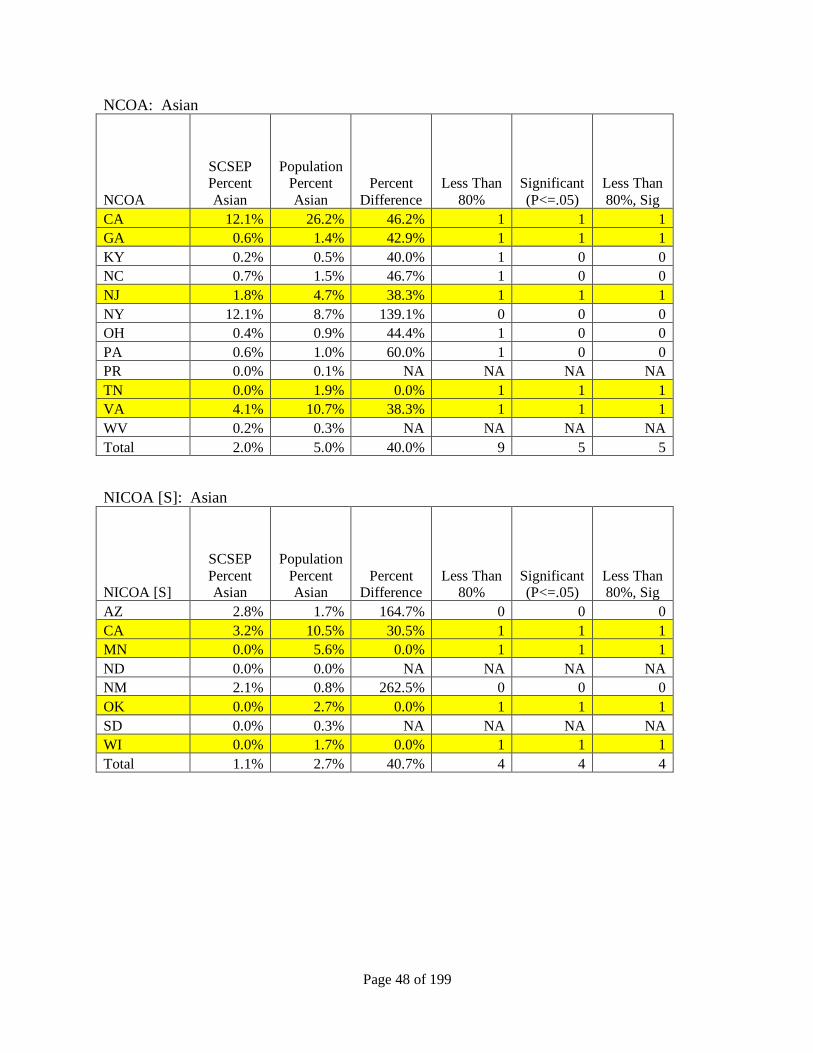
NCOA: Asian
NCOA
SCSEP Percent
Asian
Population Percent
Asian
Percent
Difference
Less Than
80%
Significant
(P<=.05)
Less Than
80%, Sig
CA 12.1% 26.2% 46.2% 1 1 1
GA 0.6% 1.4% 42.9% 1 1 1
KY 0.2% 0.5% 40.0% 1 0 0
NC 0.7% 1.5% 46.7% 1 0 0
NJ 1.8% 4.7% 38.3% 1 1 1
NY 12.1% 8.7% 139.1% 0 0 0
OH 0.4% 0.9% 44.4% 1 0 0
PA 0.6% 1.0% 60.0% 1 0 0
PR 0.0% 0.1% NA NA NA NA
TN 0.0% 1.9% 0.0% 1 1 1
VA 4.1% 10.7% 38.3% 1 1 1
WV 0.2% 0.3% NA NA NA NA
Total 2.0% 5.0% 40.0% 9 5 5
NICOA [S]: Asian
NICOA [S]
SCSEP
Percent Asian
Population
Percent Asian
Percent Difference
Less Than 80%
Significant (P<=.05)
Less Than 80%, Sig
AZ 2.8% 1.7% 164.7% 0 0 0
CA 3.2% 10.5% 30.5% 1 1 1
MN 0.0% 5.6% 0.0% 1 1 1
ND 0.0% 0.0% NA NA NA NA
NM 2.1% 0.8% 262.5% 0 0 0
OK 0.0% 2.7% 0.0% 1 1 1
SD 0.0% 0.3% NA NA NA NA
WI 0.0% 1.7% 0.0% 1 1 1
Total 1.1% 2.7% 40.7% 4 4 4
Page 49 of 199
NOWCC: Asian
NOWCC
SCSEP Percent
Asian
Population Percent
Asian
Percent
Difference
Less Than
80%
Significant
(P<=.05)
Less Than
80%, Sig
CA 1.7% 4.1% 41.5% 1 1 1
Total 1.7% 4.1% 41.5% 1 1 1
NUL: Asian
NUL
SCSEP Percent
Asian
Population Percent
Asian
Percent
Difference
Less Than
80%
Significant
(P<=.05)
Less Than
80%, Sig
FL 0.8% 1.7% 47.1% 1 1 1
KY 0.0% 1.5% 0.0% 1 1 1
MI 0.0% 2.7% 0.0% 1 1 1
NJ 0.6% 4.4% 13.6% 1 1 1
NY 3.1% 14.2% 21.8% 1 1 1
PA 0.4% 1.7% 23.5% 1 1 1
Total 0.9% 4.8% 18.7% 6 6 6
OAGB: Asian
OAGB
SCSEP
Percent
Asian
Population
Percent
Asian
Percent
Difference
Less Than
80%
Significant
(P<=.05)
Less Than
80%, Sig
MA 6.5% 10.6% 61.3% 1 1 1
NH 0.4% 1.4% 28.6% 1 1 1
Total 4.0% 7.8% 51.3% 2 2 2
Page 50 of 199
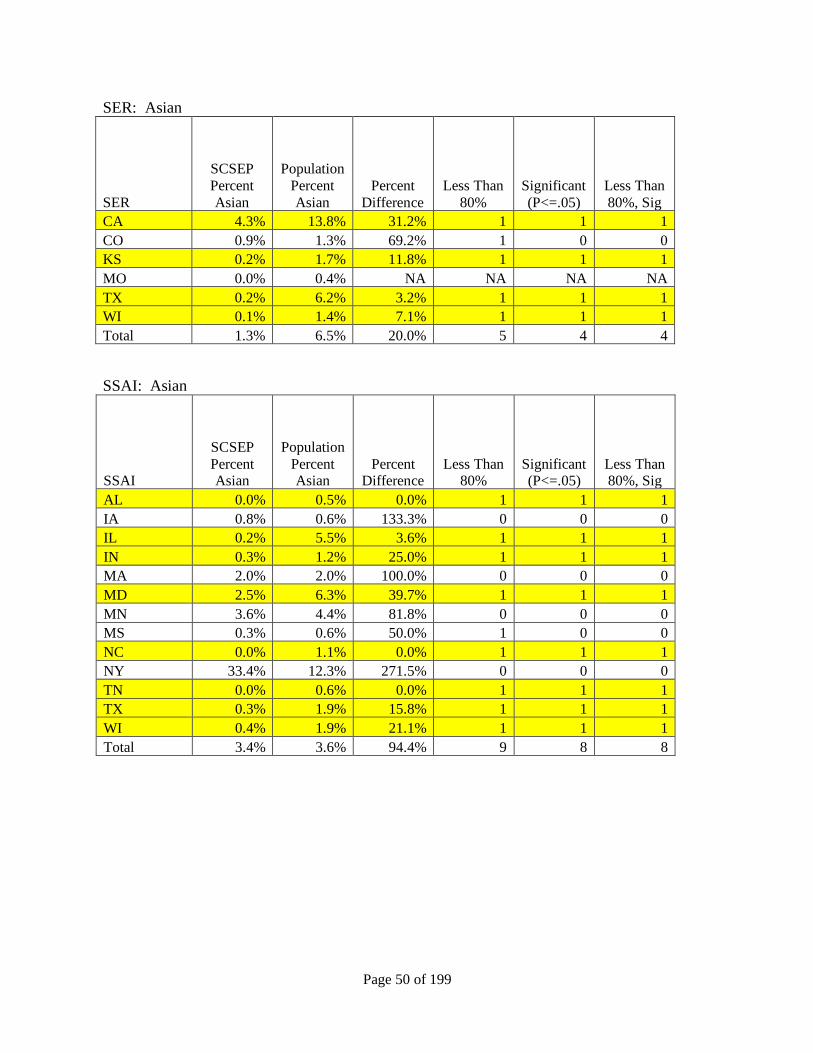
SER: Asian
SER
SCSEP
Percent
Asian
Population
Percent
Asian
Percent
Difference
Less Than
80%
Significant
(P<=.05)
Less Than
80%, Sig
CA 4.3% 13.8% 31.2% 1 1 1
CO 0.9% 1.3% 69.2% 1 0 0
KS 0.2% 1.7% 11.8% 1 1 1
MO 0.0% 0.4% NA NA NA NA
TX 0.2% 6.2% 3.2% 1 1 1
WI 0.1% 1.4% 7.1% 1 1 1
Total 1.3% 6.5% 20.0% 5 4 4
SSAI: Asian
SSAI
SCSEP
Percent Asian
Population
Percent Asian
Percent Difference
Less Than 80%
Significant (P<=.05)
Less Than 80%, Sig
AL 0.0% 0.5% 0.0% 1 1 1
IA 0.8% 0.6% 133.3% 0 0 0
IL 0.2% 5.5% 3.6% 1 1 1
IN 0.3% 1.2% 25.0% 1 1 1
MA 2.0% 2.0% 100.0% 0 0 0
MD 2.5% 6.3% 39.7% 1 1 1
MN 3.6% 4.4% 81.8% 0 0 0
MS 0.3% 0.6% 50.0% 1 0 0
NC 0.0% 1.1% 0.0% 1 1 1
NY 33.4% 12.3% 271.5% 0 0 0
TN 0.0% 0.6% 0.0% 1 1 1
TX 0.3% 1.9% 15.8% 1 1 1
WI 0.4% 1.9% 21.1% 1 1 1
Total 3.4% 3.6% 94.4% 9 8 8
Page 51 of 199
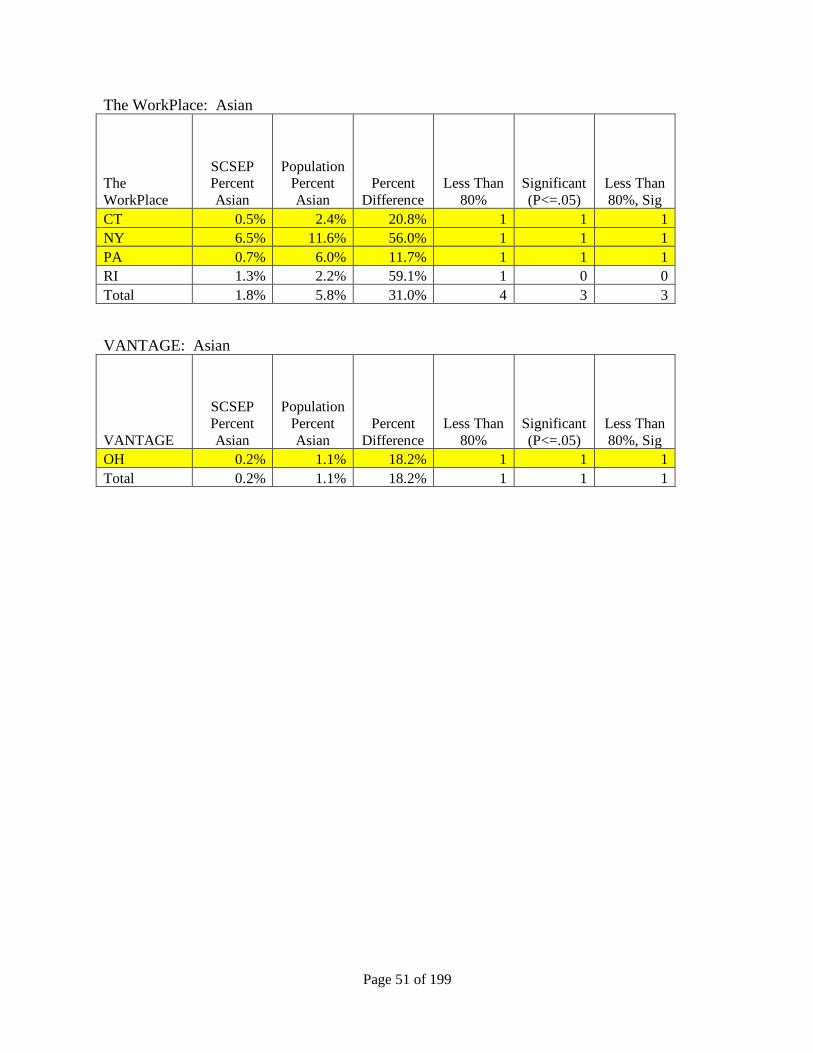
The WorkPlace: Asian
The
WorkPlace
SCSEP Percent
Asian
Population Percent
Asian
Percent
Difference
Less Than
80%
Significant
(P<=.05)
Less Than
80%, Sig
CT 0.5% 2.4% 20.8% 1 1 1
NY 6.5% 11.6% 56.0% 1 1 1
PA 0.7% 6.0% 11.7% 1 1 1
RI 1.3% 2.2% 59.1% 1 0 0
Total 1.8% 5.8% 31.0% 4 3 3
VANTAGE: Asian
VANTAGE
SCSEP
Percent
Asian
Population
Percent
Asian
Percent
Difference
Less Than
80%
Significant
(P<=.05)
Less Than
80%, Sig
OH 0.2% 1.1% 18.2% 1 1 1
Total 0.2% 1.1% 18.2% 1 1 1
Page 52 of 199
Table 5: Grantees by American Indian
AARP: American Indian
AARP
SCSEP
Percent American
Indian
Population
Percent American
Indian
Percent
Difference
Less Than
80%
Significant
(P<=.05)
Less Than
80%, Sig
AR 0.4% 1.0% 40.0% 1 0 0
CO 2.7% 1.2% 225.0% 0 0 0
FL 0.5% 0.3% NA NA NA NA
GA 1.0% 0.6% 166.7% 0 0 0
IA 1.3% 0.6% 216.7% 0 0 0
IN 0.6% 0.3% NA NA NA NA
MO 0.0% 0.5% 0.0% 1 1 1
NV 0.4% 2.0% 20.0% 1 1 1
OH 0.5% 0.3% NA NA NA NA
PA 0.6% 0.4% NA NA NA NA
PR 0.0% 0.2% NA NA NA NA
TX 0.5% 0.5% 100.0% 0 0 0
VA 0.8% 0.2% NA NA NA NA
WA 4.1% 1.9% 215.8% 0 0 0
Total 0.7% 0.6% 116.7% 3 2 2
ANPPM: American Indian
ANPPM
SCSEP
Percent
American Indian
Population
Percent
American Indian
Percent Difference
Less Than 80%
Significant (P<=.05)
Less Than 80%, Sig
AZ 1.9% 3.8% 50.0% 1 0 0
CA 0.2% 0.9% 22.2% 1 1 1
DC 0.0% 0.7% 0.0% 1 1 1
LA 1.0% 0.7% 142.9% 0 0 0
PA 0.0% 0.5% 0.0% 1 1 1
Total 0.7% 1.1% 63.6% 4 3 3
Page 53 of 199
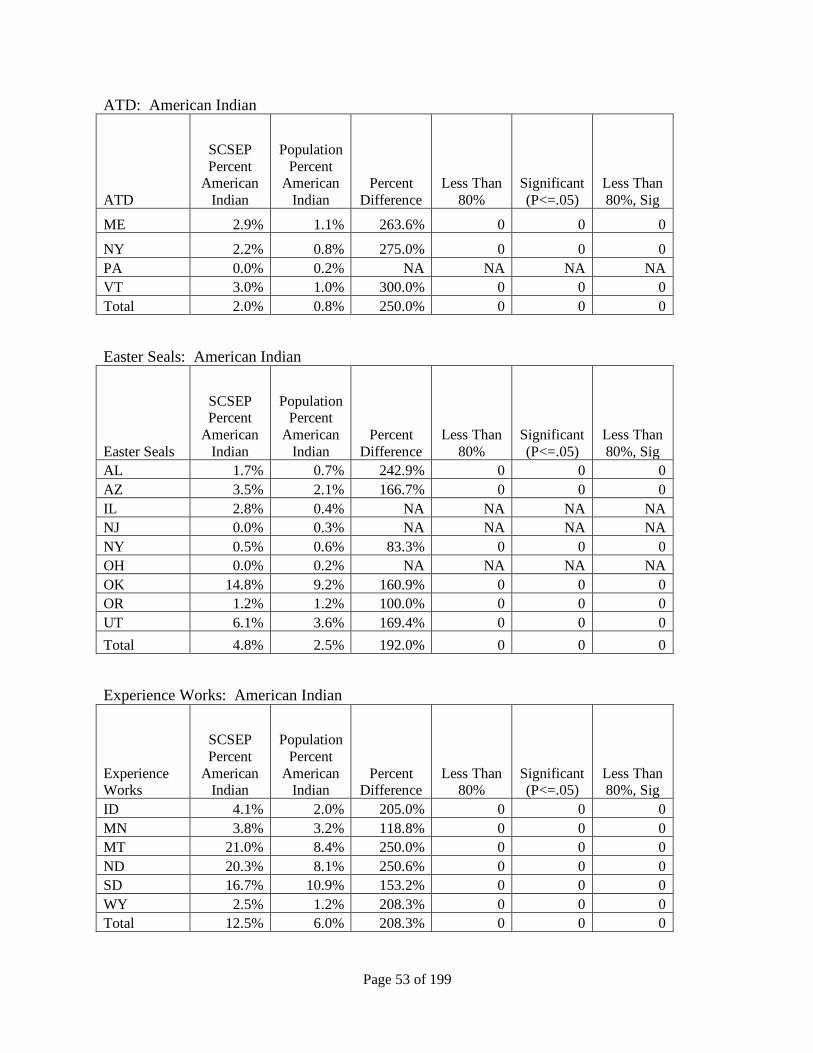
ATD: American Indian
ATD
SCSEP
Percent American
Indian
Population
Percent American
Indian
Percent
Difference
Less Than
80%
Significant
(P<=.05)
Less Than
80%, Sig
ME 2.9% 1.1% 263.6% 0 0 0
NY 2.2% 0.8% 275.0% 0 0 0
PA 0.0% 0.2% NA NA NA NA
VT 3.0% 1.0% 300.0% 0 0 0
Total 2.0% 0.8% 250.0% 0 0 0
Easter Seals: American Indian
Easter Seals
SCSEP Percent
American
Indian
Population Percent
American
Indian
Percent
Difference
Less Than
80%
Significant
(P<=.05)
Less Than
80%, Sig
AL 1.7% 0.7% 242.9% 0 0 0
AZ 3.5% 2.1% 166.7% 0 0 0
IL 2.8% 0.4% NA NA NA NA
NJ 0.0% 0.3% NA NA NA NA
NY 0.5% 0.6% 83.3% 0 0 0
OH 0.0% 0.2% NA NA NA NA
OK 14.8% 9.2% 160.9% 0 0 0
OR 1.2% 1.2% 100.0% 0 0 0
UT 6.1% 3.6% 169.4% 0 0 0
Total 4.8% 2.5% 192.0% 0 0 0
Experience Works: American Indian
Experience Works
SCSEP
Percent
American Indian
Population
Percent
American Indian
Percent Difference
Less Than 80%
Significant (P<=.05)
Less Than 80%, Sig
ID 4.1% 2.0% 205.0% 0 0 0
MN 3.8% 3.2% 118.8% 0 0 0
MT 21.0% 8.4% 250.0% 0 0 0
ND 20.3% 8.1% 250.6% 0 0 0
SD 16.7% 10.9% 153.2% 0 0 0
WY 2.5% 1.2% 208.3% 0 0 0
Total 12.5% 6.0% 208.3% 0 0 0
Page 54 of 199
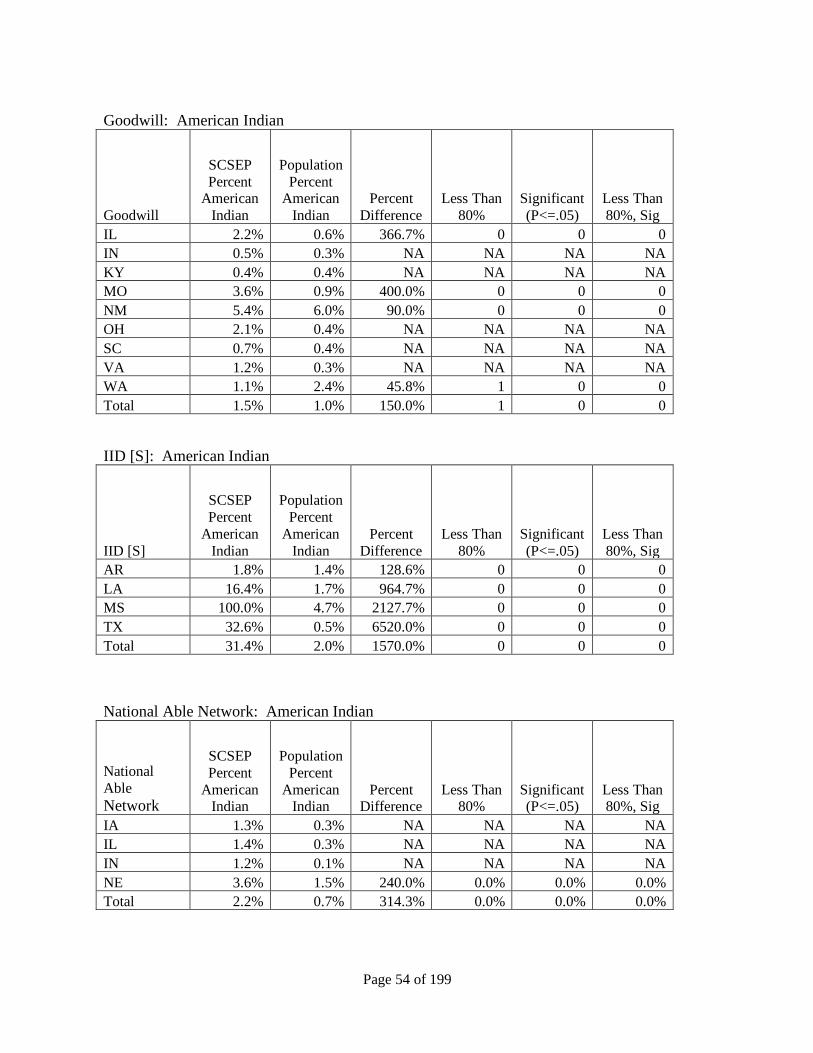
Goodwill: American Indian
Goodwill
SCSEP
Percent American
Indian
Population
Percent American
Indian
Percent
Difference
Less Than
80%
Significant
(P<=.05)
Less Than
80%, Sig
IL 2.2% 0.6% 366.7% 0 0 0
IN 0.5% 0.3% NA NA NA NA
KY 0.4% 0.4% NA NA NA NA
MO 3.6% 0.9% 400.0% 0 0 0
NM 5.4% 6.0% 90.0% 0 0 0
OH 2.1% 0.4% NA NA NA NA
SC 0.7% 0.4% NA NA NA NA
VA 1.2% 0.3% NA NA NA NA
WA 1.1% 2.4% 45.8% 1 0 0
Total 1.5% 1.0% 150.0% 1 0 0
IID [S]: American Indian
IID [S]
SCSEP
Percent
American
Indian
Population
Percent
American
Indian
Percent
Difference
Less Than
80%
Significant
(P<=.05)
Less Than
80%, Sig
AR 1.8% 1.4% 128.6% 0 0 0
LA 16.4% 1.7% 964.7% 0 0 0
MS 100.0% 4.7% 2127.7% 0 0 0
TX 32.6% 0.5% 6520.0% 0 0 0
Total 31.4% 2.0% 1570.0% 0 0 0
National Able Network: American Indian
National
Able
Network
SCSEP
Percent
American Indian
Population
Percent
American Indian
Percent Difference
Less Than 80%
Significant (P<=.05)
Less Than 80%, Sig
IA 1.3% 0.3% NA NA NA NA
IL 1.4% 0.3% NA NA NA NA
IN 1.2% 0.1% NA NA NA NA
NE 3.6% 1.5% 240.0% 0.0% 0.0% 0.0%
Total 2.2% 0.7% 314.3% 0.0% 0.0% 0.0%
Page 55 of 199
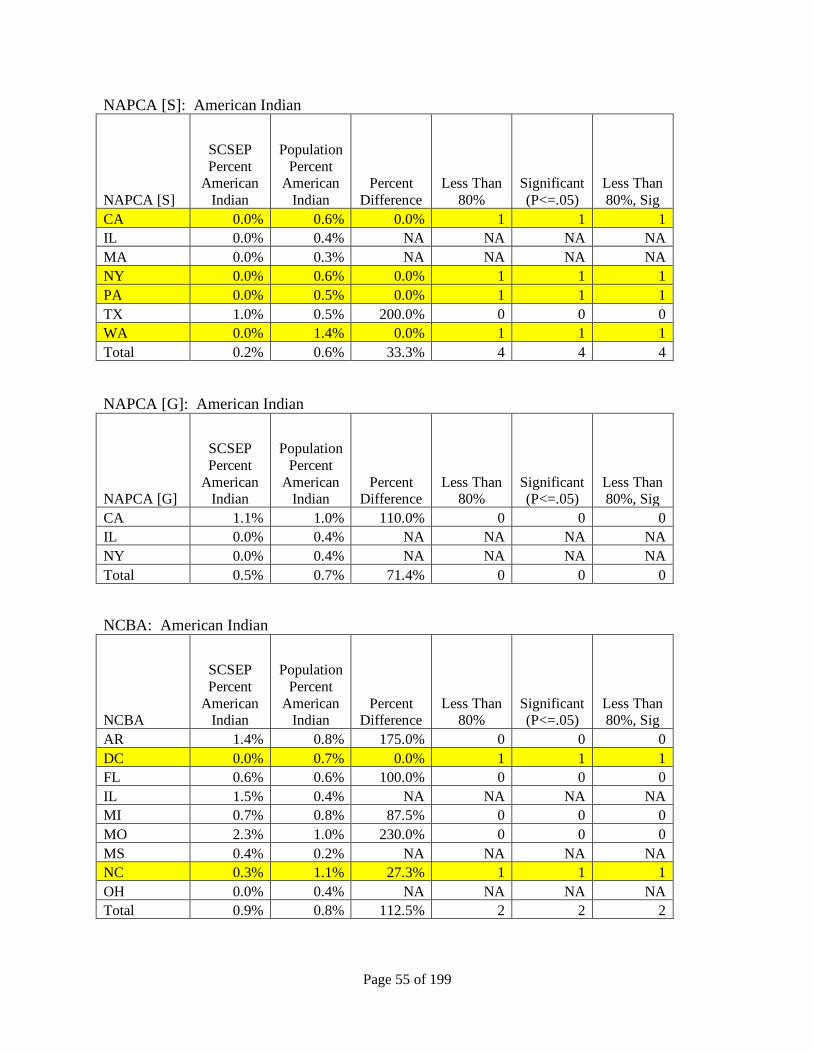
NAPCA [S]: American Indian
NAPCA [S]
SCSEP
Percent American
Indian
Population
Percent American
Indian
Percent
Difference
Less Than
80%
Significant
(P<=.05)
Less Than
80%, Sig
CA 0.0% 0.6% 0.0% 1 1 1
IL 0.0% 0.4% NA NA NA NA
MA 0.0% 0.3% NA NA NA NA
NY 0.0% 0.6% 0.0% 1 1 1
PA 0.0% 0.5% 0.0% 1 1 1
TX 1.0% 0.5% 200.0% 0 0 0
WA 0.0% 1.4% 0.0% 1 1 1
Total 0.2% 0.6% 33.3% 4 4 4
NAPCA [G]: American Indian
NAPCA [G]
SCSEP
Percent
American Indian
Population
Percent
American Indian
Percent Difference
Less Than 80%
Significant (P<=.05)
Less Than 80%, Sig
CA 1.1% 1.0% 110.0% 0 0 0
IL 0.0% 0.4% NA NA NA NA
NY 0.0% 0.4% NA NA NA NA
Total 0.5% 0.7% 71.4% 0 0 0
NCBA: American Indian
NCBA
SCSEP
Percent
American Indian
Population
Percent
American Indian
Percent Difference
Less Than 80%
Significant (P<=.05)
Less Than 80%, Sig
AR 1.4% 0.8% 175.0% 0 0 0
DC 0.0% 0.7% 0.0% 1 1 1
FL 0.6% 0.6% 100.0% 0 0 0
IL 1.5% 0.4% NA NA NA NA
MI 0.7% 0.8% 87.5% 0 0 0
MO 2.3% 1.0% 230.0% 0 0 0
MS 0.4% 0.2% NA NA NA NA
NC 0.3% 1.1% 27.3% 1 1 1
OH 0.0% 0.4% NA NA NA NA
Total 0.9% 0.8% 112.5% 2 2 2
Page 56 of 199
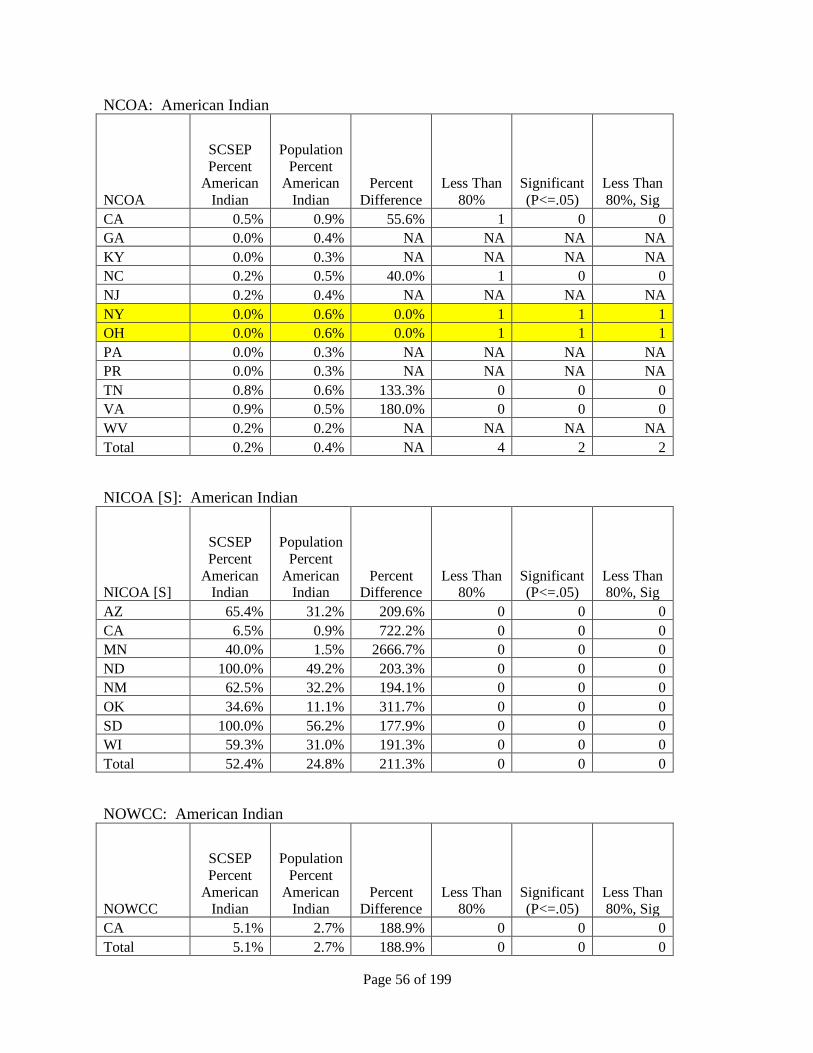
NCOA: American Indian
NCOA
SCSEP
Percent American
Indian
Population
Percent American
Indian
Percent
Difference
Less Than
80%
Significant
(P<=.05)
Less Than
80%, Sig
CA 0.5% 0.9% 55.6% 1 0 0
GA 0.0% 0.4% NA NA NA NA
KY 0.0% 0.3% NA NA NA NA
NC 0.2% 0.5% 40.0% 1 0 0
NJ 0.2% 0.4% NA NA NA NA
NY 0.0% 0.6% 0.0% 1 1 1
OH 0.0% 0.6% 0.0% 1 1 1
PA 0.0% 0.3% NA NA NA NA
PR 0.0% 0.3% NA NA NA NA
TN 0.8% 0.6% 133.3% 0 0 0
VA 0.9% 0.5% 180.0% 0 0 0
WV 0.2% 0.2% NA NA NA NA
Total 0.2% 0.4% NA 4 2 2
NICOA [S]: American Indian
NICOA [S]
SCSEP
Percent
American Indian
Population
Percent
American Indian
Percent Difference
Less Than 80%
Significant (P<=.05)
Less Than 80%, Sig
AZ 65.4% 31.2% 209.6% 0 0 0
CA 6.5% 0.9% 722.2% 0 0 0
MN 40.0% 1.5% 2666.7% 0 0 0
ND 100.0% 49.2% 203.3% 0 0 0
NM 62.5% 32.2% 194.1% 0 0 0
OK 34.6% 11.1% 311.7% 0 0 0
SD 100.0% 56.2% 177.9% 0 0 0
WI 59.3% 31.0% 191.3% 0 0 0
Total 52.4% 24.8% 211.3% 0 0 0
NOWCC: American Indian
NOWCC
SCSEP
Percent
American Indian
Population
Percent
American Indian
Percent Difference
Less Than 80%
Significant (P<=.05)
Less Than 80%, Sig
CA 5.1% 2.7% 188.9% 0 0 0
Total 5.1% 2.7% 188.9% 0 0 0
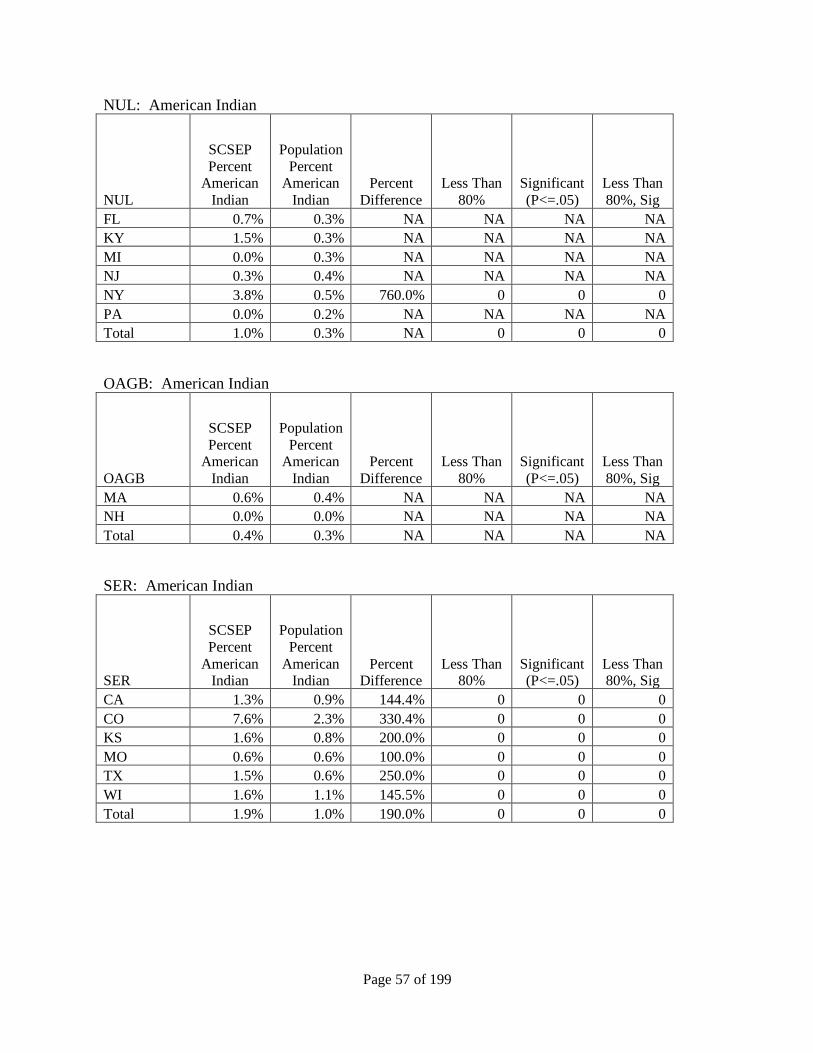
Page 57 of 199
NUL: American Indian
NUL
SCSEP
Percent American
Indian
Population
Percent American
Indian
Percent
Difference
Less Than
80%
Significant
(P<=.05)
Less Than
80%, Sig
FL 0.7% 0.3% NA NA NA NA
KY 1.5% 0.3% NA NA NA NA
MI 0.0% 0.3% NA NA NA NA
NJ 0.3% 0.4% NA NA NA NA
NY 3.8% 0.5% 760.0% 0 0 0
PA 0.0% 0.2% NA NA NA NA
Total 1.0% 0.3% NA 0 0 0
OAGB: American Indian
OAGB
SCSEP
Percent American
Indian
Population
Percent American
Indian
Percent
Difference
Less Than
80%
Significant
(P<=.05)
Less Than
80%, Sig
MA 0.6% 0.4% NA NA NA NA
NH 0.0% 0.0% NA NA NA NA
Total 0.4% 0.3% NA NA NA NA
SER: American Indian
SER
SCSEP
Percent
American Indian
Population
Percent
American Indian
Percent Difference
Less Than 80%
Significant (P<=.05)
Less Than 80%, Sig
CA 1.3% 0.9% 144.4% 0 0 0
CO 7.6% 2.3% 330.4% 0 0 0
KS 1.6% 0.8% 200.0% 0 0 0
MO 0.6% 0.6% 100.0% 0 0 0
TX 1.5% 0.6% 250.0% 0 0 0
WI 1.6% 1.1% 145.5% 0 0 0
Total 1.9% 1.0% 190.0% 0 0 0
Page 58 of 199
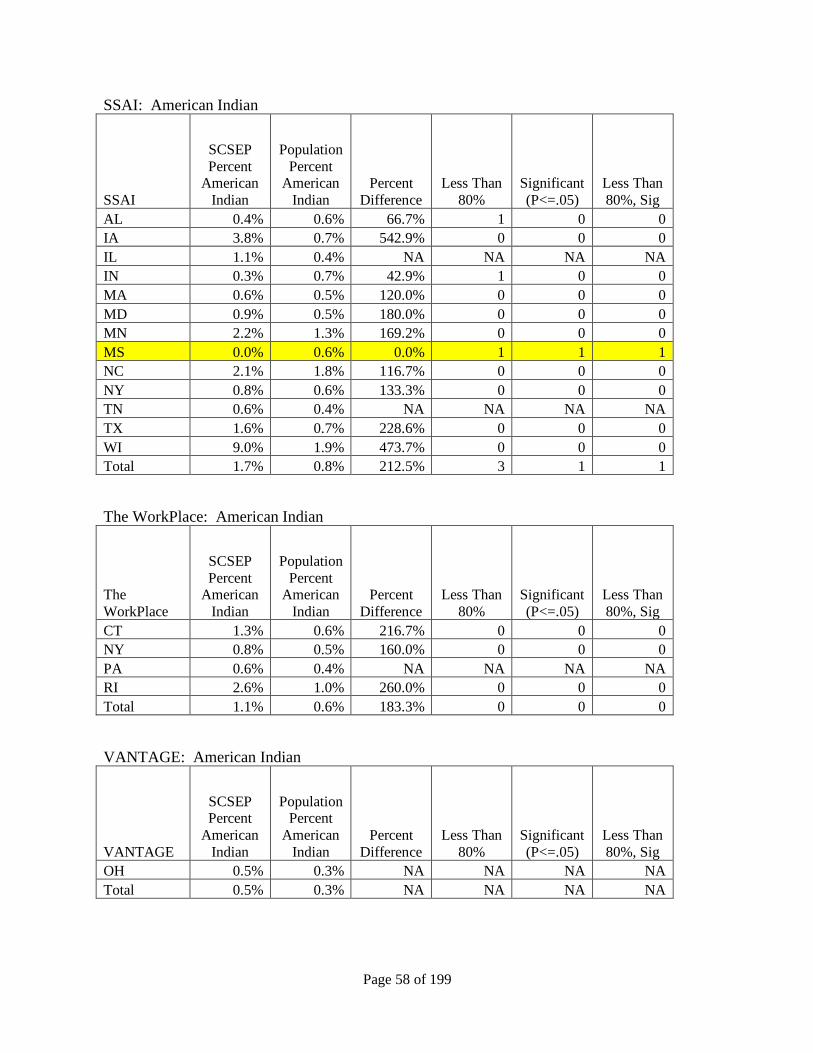
SSAI: American Indian
SSAI
SCSEP
Percent American
Indian
Population
Percent American
Indian
Percent
Difference
Less Than
80%
Significant
(P<=.05)
Less Than
80%, Sig
AL 0.4% 0.6% 66.7% 1 0 0
IA 3.8% 0.7% 542.9% 0 0 0
IL 1.1% 0.4% NA NA NA NA
IN 0.3% 0.7% 42.9% 1 0 0
MA 0.6% 0.5% 120.0% 0 0 0
MD 0.9% 0.5% 180.0% 0 0 0
MN 2.2% 1.3% 169.2% 0 0 0
MS 0.0% 0.6% 0.0% 1 1 1
NC 2.1% 1.8% 116.7% 0 0 0
NY 0.8% 0.6% 133.3% 0 0 0
TN 0.6% 0.4% NA NA NA NA
TX 1.6% 0.7% 228.6% 0 0 0
WI 9.0% 1.9% 473.7% 0 0 0
Total 1.7% 0.8% 212.5% 3 1 1
The WorkPlace: American Indian
The
WorkPlace
SCSEP
Percent American
Indian
Population
Percent American
Indian
Percent
Difference
Less Than
80%
Significant
(P<=.05)
Less Than
80%, Sig
CT 1.3% 0.6% 216.7% 0 0 0
NY 0.8% 0.5% 160.0% 0 0 0
PA 0.6% 0.4% NA NA NA NA
RI 2.6% 1.0% 260.0% 0 0 0
Total 1.1% 0.6% 183.3% 0 0 0
VANTAGE: American Indian
VANTAGE
SCSEP Percent
American
Indian
Population Percent
American
Indian
Percent
Difference
Less Than
80%
Significant
(P<=.05)
Less Than
80%, Sig
OH 0.5% 0.3% NA NA NA NA
Total 0.5% 0.3% NA NA NA NA
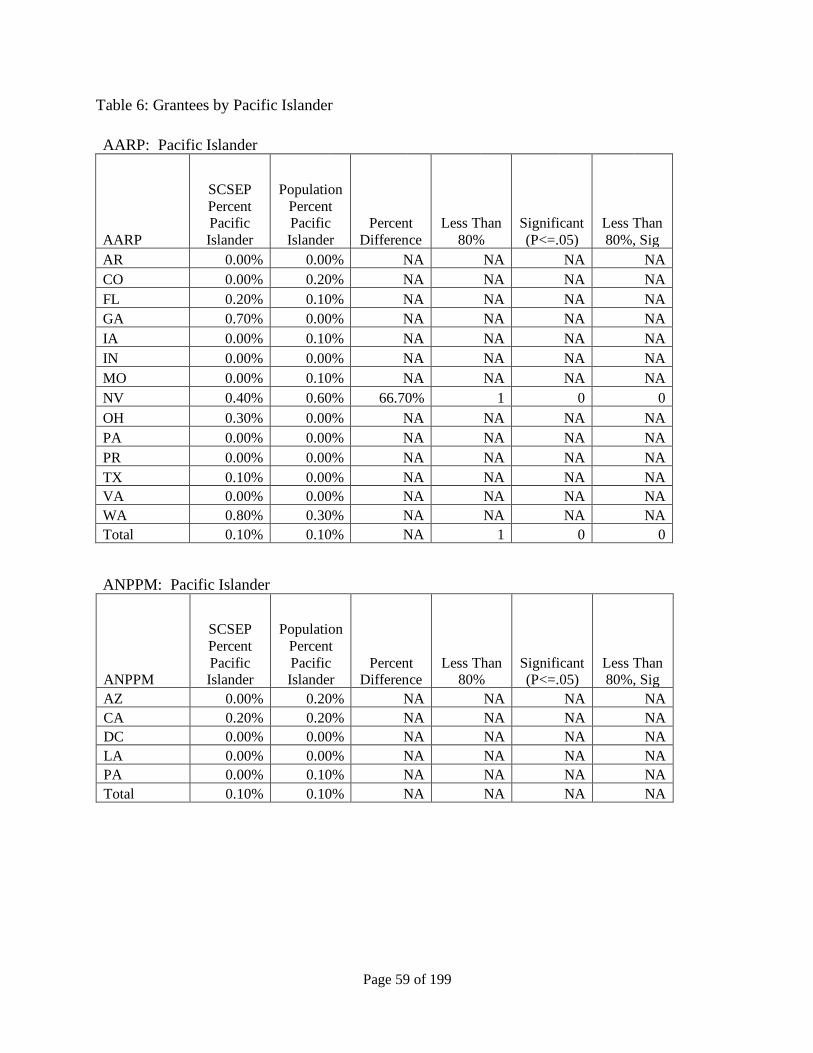
Page 59 of 199
Table 6: Grantees by Pacific Islander
AARP: Pacific Islander
AARP
SCSEP
Percent Pacific
Islander
Population
Percent Pacific
Islander
Percent
Difference
Less Than
80%
Significant
(P<=.05)
Less Than
80%, Sig
AR 0.00% 0.00% NA NA NA NA
CO 0.00% 0.20% NA NA NA NA
FL 0.20% 0.10% NA NA NA NA
GA 0.70% 0.00% NA NA NA NA
IA 0.00% 0.10% NA NA NA NA
IN 0.00% 0.00% NA NA NA NA
MO 0.00% 0.10% NA NA NA NA
NV 0.40% 0.60% 66.70% 1 0 0
OH 0.30% 0.00% NA NA NA NA
PA 0.00% 0.00% NA NA NA NA
PR 0.00% 0.00% NA NA NA NA
TX 0.10% 0.00% NA NA NA NA
VA 0.00% 0.00% NA NA NA NA
WA 0.80% 0.30% NA NA NA NA
Total 0.10% 0.10% NA 1 0 0
ANPPM: Pacific Islander
ANPPM
SCSEP
Percent
Pacific Islander
Population
Percent
Pacific Islander
Percent Difference
Less Than 80%
Significant (P<=.05)
Less Than 80%, Sig
AZ 0.00% 0.20% NA NA NA NA
CA 0.20% 0.20% NA NA NA NA
DC 0.00% 0.00% NA NA NA NA
LA 0.00% 0.00% NA NA NA NA
PA 0.00% 0.10% NA NA NA NA
Total 0.10% 0.10% NA NA NA NA
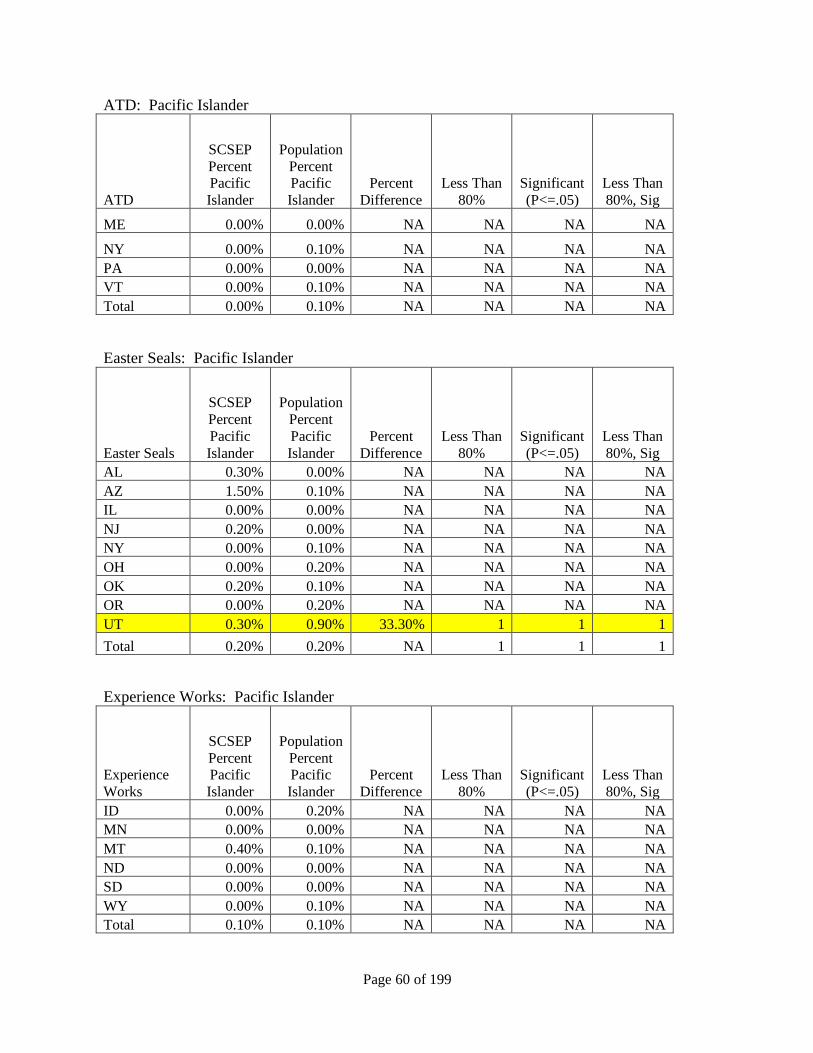
Page 60 of 199
ATD: Pacific Islander
ATD
SCSEP
Percent Pacific
Islander
Population
Percent Pacific
Islander
Percent
Difference
Less Than
80%
Significant
(P<=.05)
Less Than
80%, Sig
ME 0.00% 0.00% NA NA NA NA
NY 0.00% 0.10% NA NA NA NA
PA 0.00% 0.00% NA NA NA NA
VT 0.00% 0.10% NA NA NA NA
Total 0.00% 0.10% NA NA NA NA
Easter Seals: Pacific Islander
Easter Seals
SCSEP
Percent
Pacific
Islander
Population
Percent
Pacific
Islander
Percent
Difference
Less Than
80%
Significant
(P<=.05)
Less Than
80%, Sig
AL 0.30% 0.00% NA NA NA NA
AZ 1.50% 0.10% NA NA NA NA
IL 0.00% 0.00% NA NA NA NA
NJ 0.20% 0.00% NA NA NA NA
NY 0.00% 0.10% NA NA NA NA
OH 0.00% 0.20% NA NA NA NA
OK 0.20% 0.10% NA NA NA NA
OR 0.00% 0.20% NA NA NA NA
UT 0.30% 0.90% 33.30% 1 1 1
Total 0.20% 0.20% NA 1 1 1
Experience Works: Pacific Islander
Experience
Works
SCSEP
Percent Pacific
Islander
Population
Percent Pacific
Islander
Percent
Difference
Less Than
80%
Significant
(P<=.05)
Less Than
80%, Sig
ID 0.00% 0.20% NA NA NA NA
MN 0.00% 0.00% NA NA NA NA
MT 0.40% 0.10% NA NA NA NA
ND 0.00% 0.00% NA NA NA NA
SD 0.00% 0.00% NA NA NA NA
WY 0.00% 0.10% NA NA NA NA
Total 0.10% 0.10% NA NA NA NA
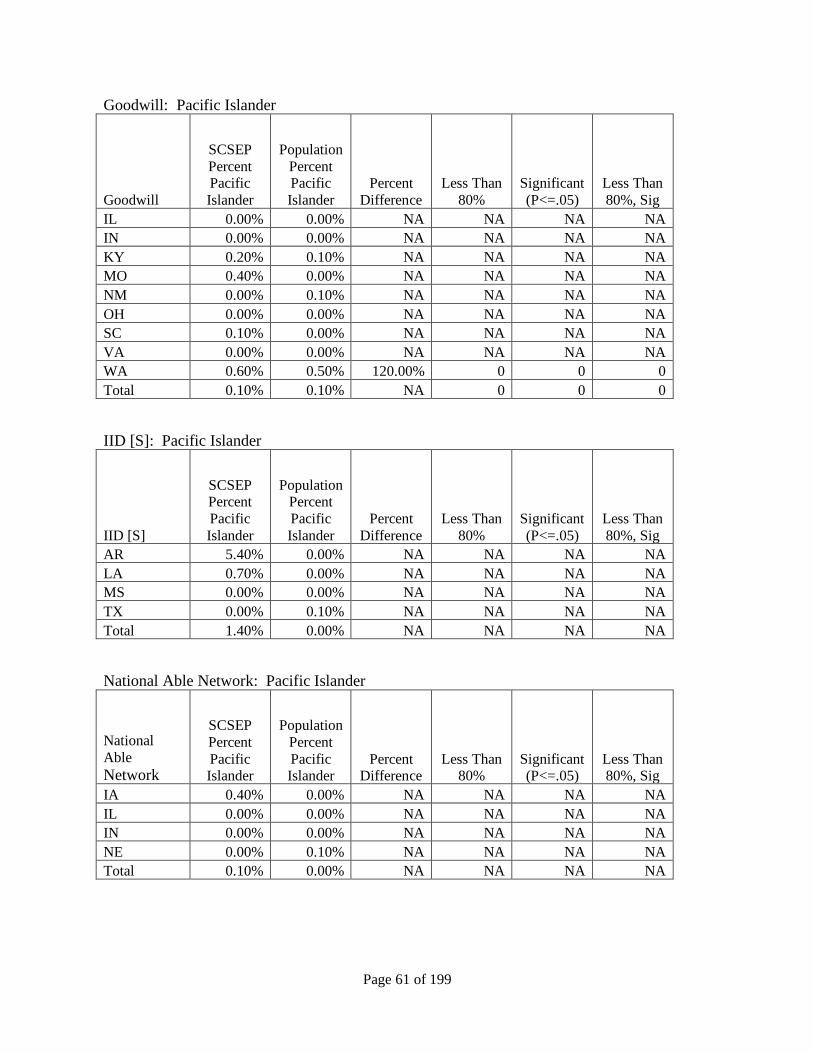
Page 61 of 199
Goodwill: Pacific Islander
Goodwill
SCSEP
Percent Pacific
Islander
Population
Percent Pacific
Islander
Percent
Difference
Less Than
80%
Significant
(P<=.05)
Less Than
80%, Sig
IL 0.00% 0.00% NA NA NA NA
IN 0.00% 0.00% NA NA NA NA
KY 0.20% 0.10% NA NA NA NA
MO 0.40% 0.00% NA NA NA NA
NM 0.00% 0.10% NA NA NA NA
OH 0.00% 0.00% NA NA NA NA
SC 0.10% 0.00% NA NA NA NA
VA 0.00% 0.00% NA NA NA NA
WA 0.60% 0.50% 120.00% 0 0 0
Total 0.10% 0.10% NA 0 0 0
IID [S]: Pacific Islander
IID [S]
SCSEP Percent
Pacific
Islander
Population Percent
Pacific
Islander
Percent
Difference
Less Than
80%
Significant
(P<=.05)
Less Than
80%, Sig
AR 5.40% 0.00% NA NA NA NA
LA 0.70% 0.00% NA NA NA NA
MS 0.00% 0.00% NA NA NA NA
TX 0.00% 0.10% NA NA NA NA
Total 1.40% 0.00% NA NA NA NA
National Able Network: Pacific Islander
National
Able
Network
SCSEP
Percent
Pacific Islander
Population
Percent
Pacific Islander
Percent Difference
Less Than 80%
Significant (P<=.05)
Less Than 80%, Sig
IA 0.40% 0.00% NA NA NA NA
IL 0.00% 0.00% NA NA NA NA
IN 0.00% 0.00% NA NA NA NA
NE 0.00% 0.10% NA NA NA NA
Total 0.10% 0.00% NA NA NA NA
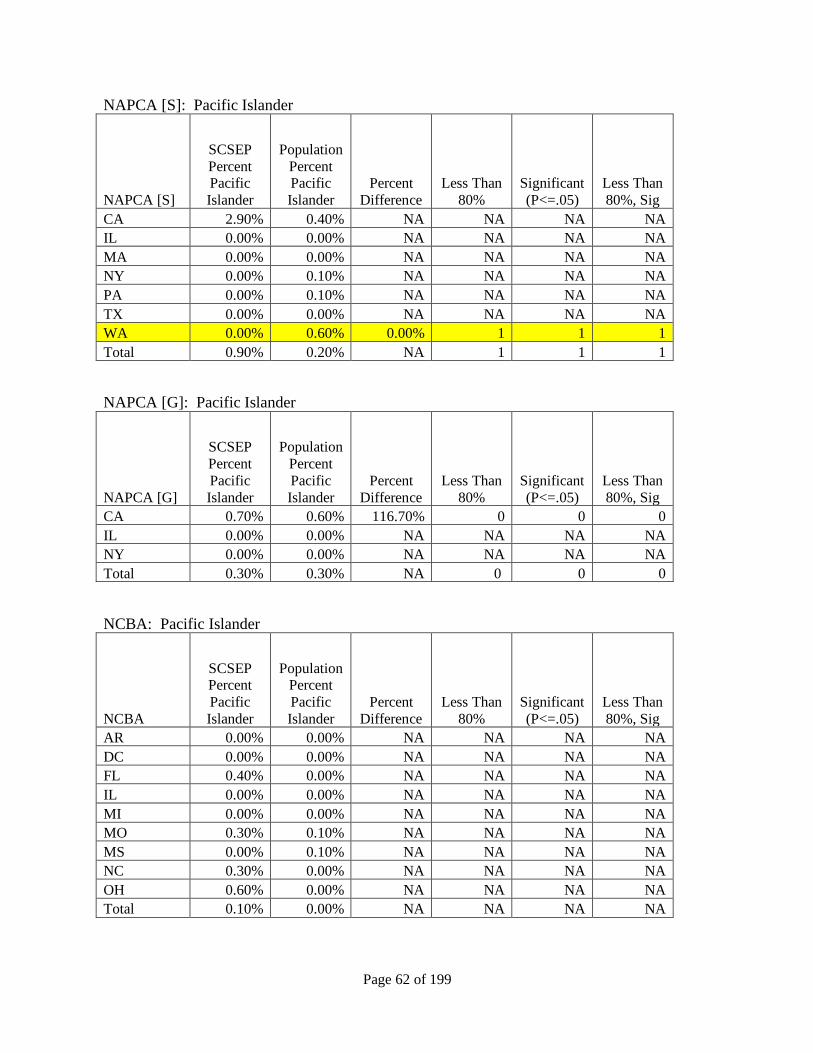
Page 62 of 199
NAPCA [S]: Pacific Islander
NAPCA [S]
SCSEP
Percent Pacific
Islander
Population
Percent Pacific
Islander
Percent
Difference
Less Than
80%
Significant
(P<=.05)
Less Than
80%, Sig
CA 2.90% 0.40% NA NA NA NA
IL 0.00% 0.00% NA NA NA NA
MA 0.00% 0.00% NA NA NA NA
NY 0.00% 0.10% NA NA NA NA
PA 0.00% 0.10% NA NA NA NA
TX 0.00% 0.00% NA NA NA NA
WA 0.00% 0.60% 0.00% 1 1 1
Total 0.90% 0.20% NA 1 1 1
NAPCA [G]: Pacific Islander
NAPCA [G]
SCSEP
Percent
Pacific
Islander
Population
Percent
Pacific
Islander
Percent
Difference
Less Than
80%
Significant
(P<=.05)
Less Than
80%, Sig
CA 0.70% 0.60% 116.70% 0 0 0
IL 0.00% 0.00% NA NA NA NA
NY 0.00% 0.00% NA NA NA NA
Total 0.30% 0.30% NA 0 0 0
NCBA: Pacific Islander
NCBA
SCSEP Percent
Pacific
Islander
Population Percent
Pacific
Islander
Percent
Difference
Less Than
80%
Significant
(P<=.05)
Less Than
80%, Sig
AR 0.00% 0.00% NA NA NA NA
DC 0.00% 0.00% NA NA NA NA
FL 0.40% 0.00% NA NA NA NA
IL 0.00% 0.00% NA NA NA NA
MI 0.00% 0.00% NA NA NA NA
MO 0.30% 0.10% NA NA NA NA
MS 0.00% 0.10% NA NA NA NA
NC 0.30% 0.00% NA NA NA NA
OH 0.60% 0.00% NA NA NA NA
Total 0.10% 0.00% NA NA NA NA
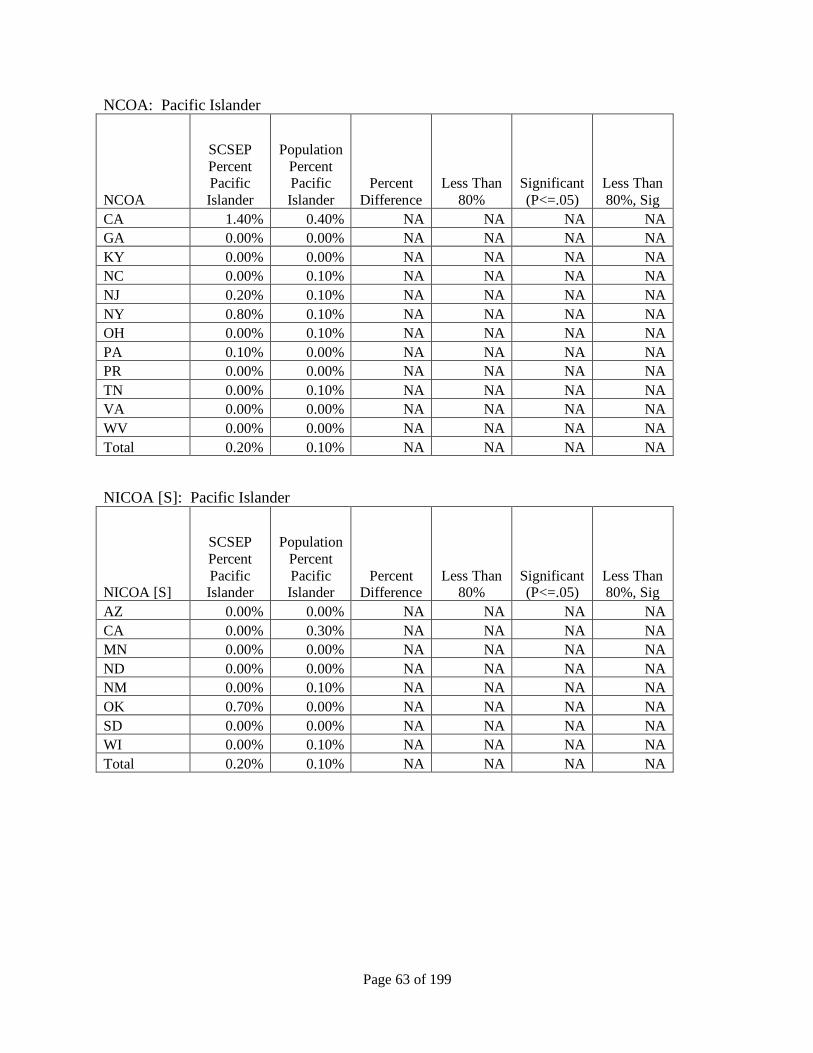
Page 63 of 199
NCOA: Pacific Islander
NCOA
SCSEP
Percent Pacific
Islander
Population
Percent Pacific
Islander
Percent
Difference
Less Than
80%
Significant
(P<=.05)
Less Than
80%, Sig
CA 1.40% 0.40% NA NA NA NA
GA 0.00% 0.00% NA NA NA NA
KY 0.00% 0.00% NA NA NA NA
NC 0.00% 0.10% NA NA NA NA
NJ 0.20% 0.10% NA NA NA NA
NY 0.80% 0.10% NA NA NA NA
OH 0.00% 0.10% NA NA NA NA
PA 0.10% 0.00% NA NA NA NA
PR 0.00% 0.00% NA NA NA NA
TN 0.00% 0.10% NA NA NA NA
VA 0.00% 0.00% NA NA NA NA
WV 0.00% 0.00% NA NA NA NA
Total 0.20% 0.10% NA NA NA NA
NICOA [S]: Pacific Islander
NICOA [S]
SCSEP
Percent
Pacific Islander
Population
Percent
Pacific Islander
Percent Difference
Less Than 80%
Significant (P<=.05)
Less Than 80%, Sig
AZ 0.00% 0.00% NA NA NA NA
CA 0.00% 0.30% NA NA NA NA
MN 0.00% 0.00% NA NA NA NA
ND 0.00% 0.00% NA NA NA NA
NM 0.00% 0.10% NA NA NA NA
OK 0.70% 0.00% NA NA NA NA
SD 0.00% 0.00% NA NA NA NA
WI 0.00% 0.10% NA NA NA NA
Total 0.20% 0.10% NA NA NA NA
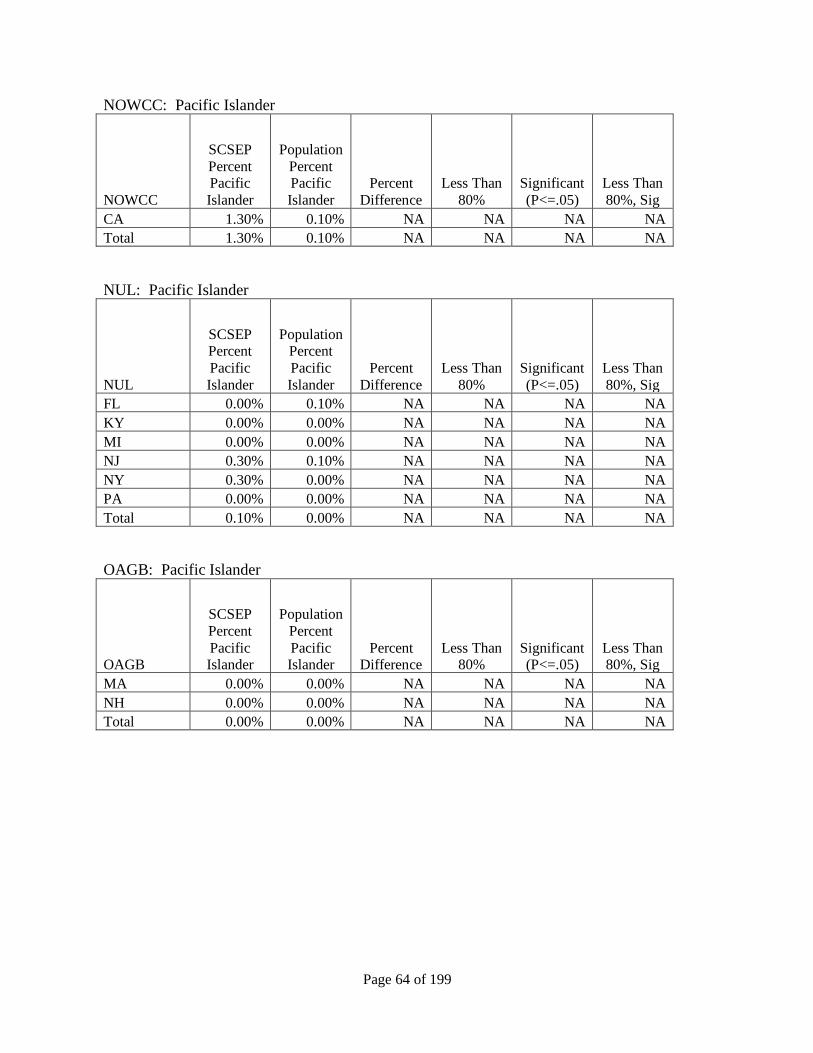
Page 64 of 199
NOWCC: Pacific Islander
NOWCC
SCSEP
Percent Pacific
Islander
Population
Percent Pacific
Islander
Percent
Difference
Less Than
80%
Significant
(P<=.05)
Less Than
80%, Sig
CA 1.30% 0.10% NA NA NA NA
Total 1.30% 0.10% NA NA NA NA
NUL: Pacific Islander
NUL
SCSEP Percent
Pacific
Islander
Population Percent
Pacific
Islander
Percent
Difference
Less Than
80%
Significant
(P<=.05)
Less Than
80%, Sig
FL 0.00% 0.10% NA NA NA NA
KY 0.00% 0.00% NA NA NA NA
MI 0.00% 0.00% NA NA NA NA
NJ 0.30% 0.10% NA NA NA NA
NY 0.30% 0.00% NA NA NA NA
PA 0.00% 0.00% NA NA NA NA
Total 0.10% 0.00% NA NA NA NA
OAGB: Pacific Islander
OAGB
SCSEP
Percent
Pacific Islander
Population
Percent
Pacific Islander
Percent Difference
Less Than 80%
Significant (P<=.05)
Less Than 80%, Sig
MA 0.00% 0.00% NA NA NA NA
NH 0.00% 0.00% NA NA NA NA
Total 0.00% 0.00% NA NA NA NA
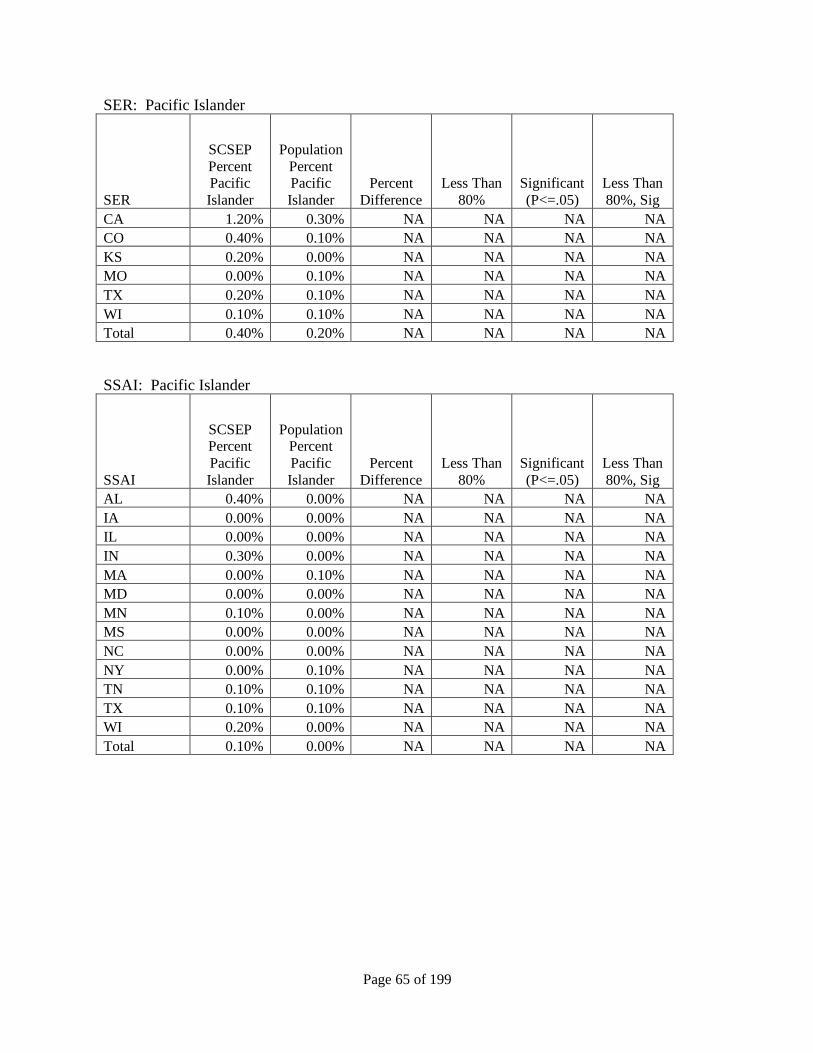
Page 65 of 199
SER: Pacific Islander
SER
SCSEP
Percent Pacific
Islander
Population
Percent Pacific
Islander
Percent
Difference
Less Than
80%
Significant
(P<=.05)
Less Than
80%, Sig
CA 1.20% 0.30% NA NA NA NA
CO 0.40% 0.10% NA NA NA NA
KS 0.20% 0.00% NA NA NA NA
MO 0.00% 0.10% NA NA NA NA
TX 0.20% 0.10% NA NA NA NA
WI 0.10% 0.10% NA NA NA NA
Total 0.40% 0.20% NA NA NA NA
SSAI: Pacific Islander
SSAI
SCSEP Percent
Pacific
Islander
Population Percent
Pacific
Islander
Percent
Difference
Less Than
80%
Significant
(P<=.05)
Less Than
80%, Sig
AL 0.40% 0.00% NA NA NA NA
IA 0.00% 0.00% NA NA NA NA
IL 0.00% 0.00% NA NA NA NA
IN 0.30% 0.00% NA NA NA NA
MA 0.00% 0.10% NA NA NA NA
MD 0.00% 0.00% NA NA NA NA
MN 0.10% 0.00% NA NA NA NA
MS 0.00% 0.00% NA NA NA NA
NC 0.00% 0.00% NA NA NA NA
NY 0.00% 0.10% NA NA NA NA
TN 0.10% 0.10% NA NA NA NA
TX 0.10% 0.10% NA NA NA NA
WI 0.20% 0.00% NA NA NA NA
Total 0.10% 0.00% NA NA NA NA
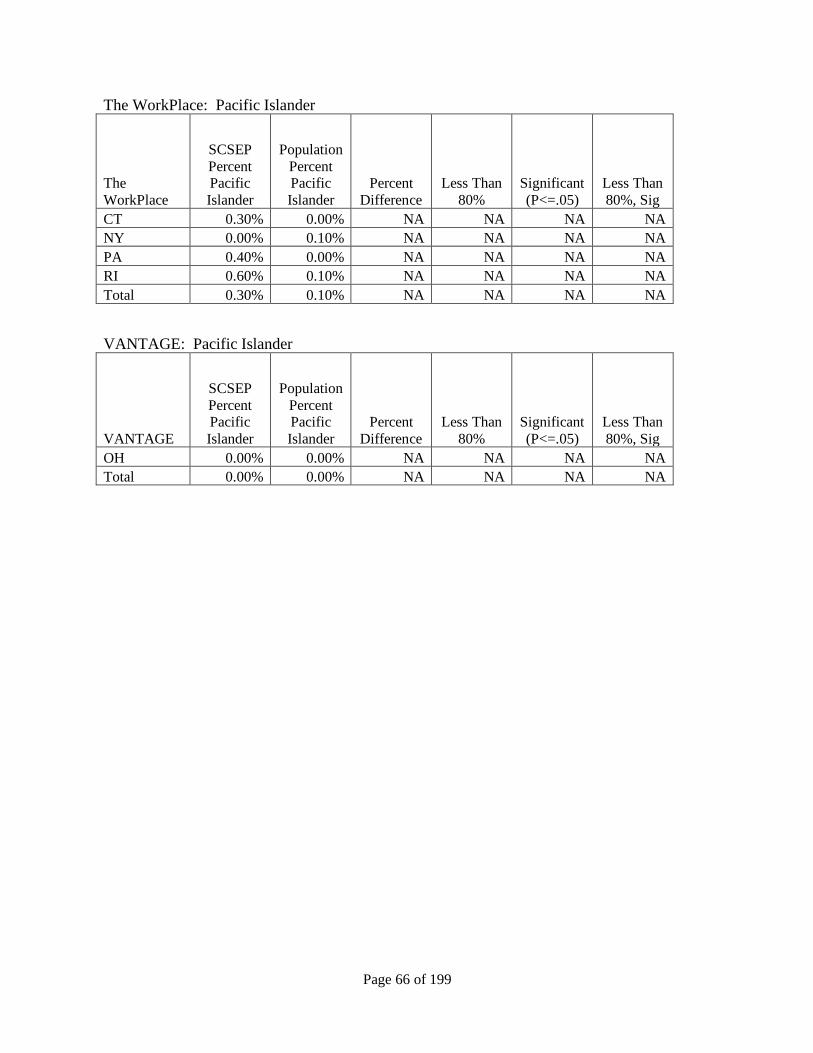
Page 66 of 199
The WorkPlace: Pacific Islander
The
WorkPlace
SCSEP
Percent Pacific
Islander
Population
Percent Pacific
Islander
Percent
Difference
Less Than
80%
Significant
(P<=.05)
Less Than
80%, Sig
CT 0.30% 0.00% NA NA NA NA
NY 0.00% 0.10% NA NA NA NA
PA 0.40% 0.00% NA NA NA NA
RI 0.60% 0.10% NA NA NA NA
Total 0.30% 0.10% NA NA NA NA
VANTAGE: Pacific Islander
VANTAGE
SCSEP
Percent Pacific
Islander
Population
Percent Pacific
Islander
Percent
Difference
Less Than
80%
Significant
(P<=.05)
Less Than
80%, Sig
OH 0.00% 0.00% NA NA NA NA
Total 0.00% 0.00% NA NA NA NA
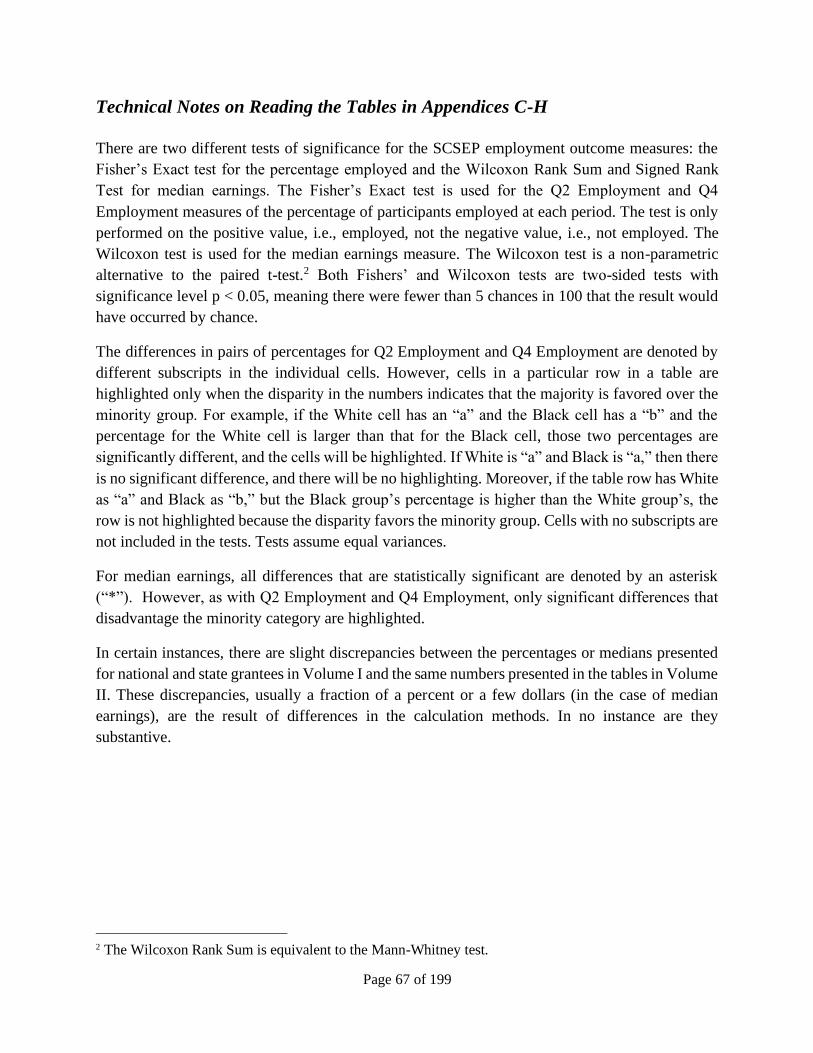
Page 67 of 199
Technical Notes on Reading the Tables in Appendices C-H
There are two different tests of significance for the SCSEP employment outcome measures: the
Fisher’s Exact test for the percentage employed and the Wilcoxon Rank Sum and Signed Rank
Test for median earnings. The Fisher’s Exact test is used for the Q2 Employment and Q4
Employment measures of the percentage of participants employed at each period. The test is only
performed on the positive value, i.e., employed, not the negative value, i.e., not employed. The
Wilcoxon test is used for the median earnings measure. The Wilcoxon test is a non-parametric
alternative to the paired t-test.2 Both Fishers’ and Wilcoxon tests are two-sided tests with
significance level p < 0.05, meaning there were fewer than 5 chances in 100 that the result would
have occurred by chance.
The differences in pairs of percentages for Q2 Employment and Q4 Employment are denoted by
different subscripts in the individual cells. However, cells in a particular row in a table are
highlighted only when the disparity in the numbers indicates that the majority is favored over the
minority group. For example, if the White cell has an “a” and the Black cell has a “b” and the
percentage for the White cell is larger than that for the Black cell, those two percentages are
significantly different, and the cells will be highlighted. If White is “a” and Black is “a,” then there
is no significant difference, and there will be no highlighting. Moreover, if the table row has White
as “a” and Black as “b,” but the Black group’s percentage is higher than the White group’s, the
row is not highlighted because the disparity favors the minority group. Cells with no subscripts are
not included in the tests. Tests assume equal variances.
For median earnings, all differences that are statistically significant are denoted by an asterisk
(“*”). However, as with Q2 Employment and Q4 Employment, only significant differences that
disadvantage the minority category are highlighted.
In certain instances, there are slight discrepancies between the percentages or medians presented
for national and state grantees in Volume I and the same numbers presented in the tables in Volume
II. These discrepancies, usually a fraction of a percent or a few dollars (in the case of median
earnings), are the result of differences in the calculation methods. In no instance are they
substantive.
2 The Wilcoxon Rank Sum is equivalent to the Mann-Whitney test.
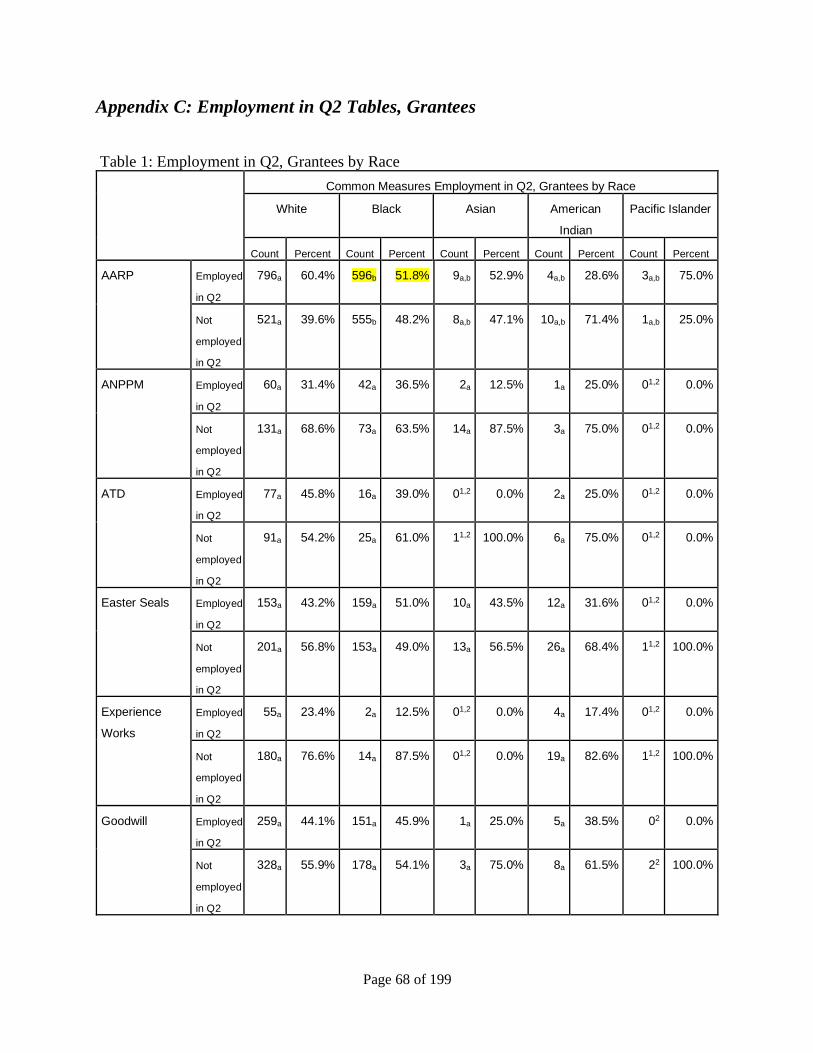
Page 68 of 199
Appendix C: Employment in Q2 Tables, Grantees
Table 1: Employment in Q2, Grantees by Race
Common Measures Employment in Q2, Grantees by Race
White Black Asian American
Indian
Pacific Islander
Count Percent Count Percent Count Percent Count Percent Count Percent
AARP Employed
in Q2
796a 60.4% 596b 51.8% 9a,b 52.9% 4a,b 28.6% 3a,b 75.0%
Not
employed
in Q2
521a 39.6% 555b 48.2% 8a,b 47.1% 10a,b 71.4% 1a,b 25.0%
ANPPM Employed
in Q2
60a 31.4% 42a 36.5% 2a 12.5% 1a 25.0% 01,2 0.0%
Not
employed
in Q2
131a 68.6% 73a 63.5% 14a 87.5% 3a 75.0% 01,2 0.0%
ATD Employed
in Q2
77a 45.8% 16a 39.0% 01,2 0.0% 2a 25.0% 01,2 0.0%
Not
employed
in Q2
91a 54.2% 25a 61.0% 11,2 100.0% 6a 75.0% 01,2 0.0%
Easter Seals Employed
in Q2
153a 43.2% 159a 51.0% 10a 43.5% 12a 31.6% 01,2 0.0%
Not
employed
in Q2
201a 56.8% 153a 49.0% 13a 56.5% 26a 68.4% 11,2 100.0%
Experience
Works
Employed
in Q2
55a 23.4% 2a 12.5% 01,2 0.0% 4a 17.4% 01,2 0.0%
Not
employed
in Q2
180a 76.6% 14a 87.5% 01,2 0.0% 19a 82.6% 11,2 100.0%
Goodwill Employed
in Q2
259a 44.1% 151a 45.9% 1a 25.0% 5a 38.5% 02 0.0%
Not
employed
in Q2
328a 55.9% 178a 54.1% 3a 75.0% 8a 61.5% 22 100.0%
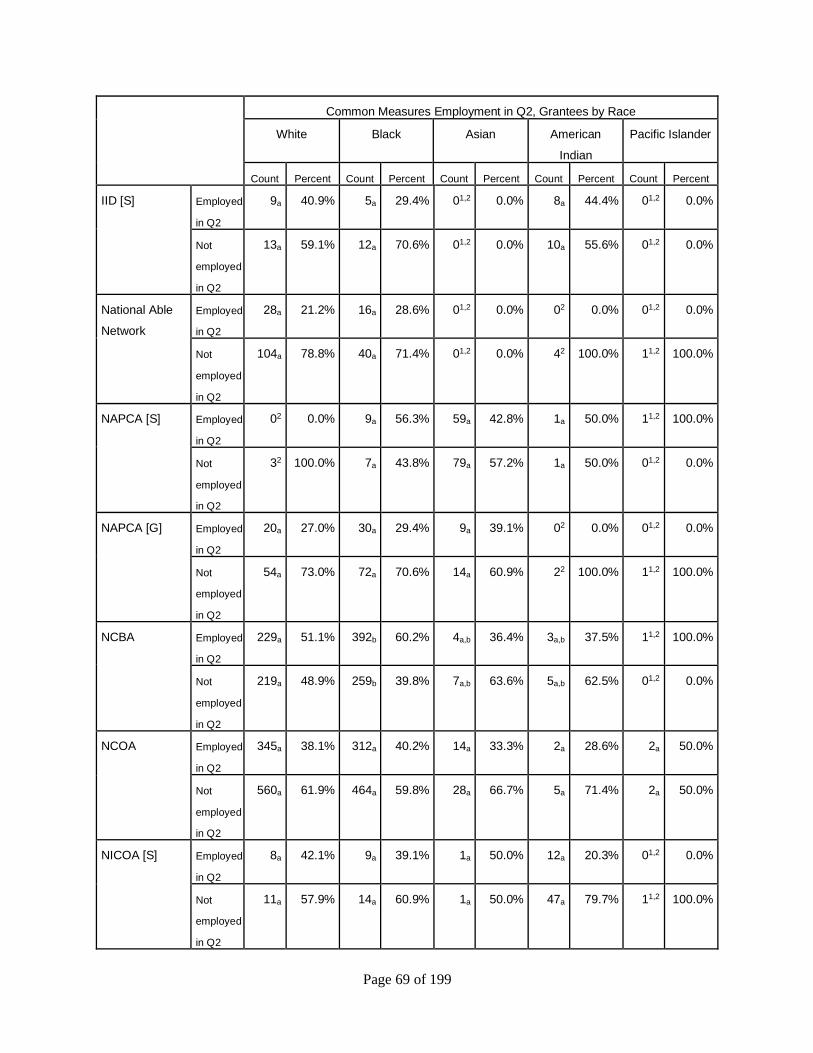
Page 69 of 199
Common Measures Employment in Q2, Grantees by Race
White Black Asian American
Indian
Pacific Islander
Count Percent Count Percent Count Percent Count Percent Count Percent
IID [S] Employed
in Q2
9a 40.9% 5a 29.4% 01,2 0.0% 8a 44.4% 01,2 0.0%
Not
employed
in Q2
13a 59.1% 12a 70.6% 01,2 0.0% 10a 55.6% 01,2 0.0%
National Able
Network
Employed
in Q2
28a 21.2% 16a 28.6% 01,2 0.0% 02 0.0% 01,2 0.0%
Not
employed
in Q2
104a 78.8% 40a 71.4% 01,2 0.0% 42 100.0% 11,2 100.0%
NAPCA [S] Employed
in Q2
02 0.0% 9a 56.3% 59a 42.8% 1a 50.0% 11,2 100.0%
Not
employed
in Q2
32 100.0% 7a 43.8% 79a 57.2% 1a 50.0% 01,2 0.0%
NAPCA [G] Employed
in Q2
20a 27.0% 30a 29.4% 9a 39.1% 02 0.0% 01,2 0.0%
Not
employed
in Q2
54a 73.0% 72a 70.6% 14a 60.9% 22 100.0% 11,2 100.0%
NCBA Employed
in Q2
229a 51.1% 392b 60.2% 4a,b 36.4% 3a,b 37.5% 11,2 100.0%
Not
employed
in Q2
219a 48.9% 259b 39.8% 7a,b 63.6% 5a,b 62.5% 01,2 0.0%
NCOA Employed
in Q2
345a 38.1% 312a 40.2% 14a 33.3% 2a 28.6% 2a 50.0%
Not
employed
in Q2
560a 61.9% 464a 59.8% 28a 66.7% 5a 71.4% 2a 50.0%
NICOA [S] Employed
in Q2
8a 42.1% 9a 39.1% 1a 50.0% 12a 20.3% 01,2 0.0%
Not
employed
in Q2
11a 57.9% 14a 60.9% 1a 50.0% 47a 79.7% 11,2 100.0%
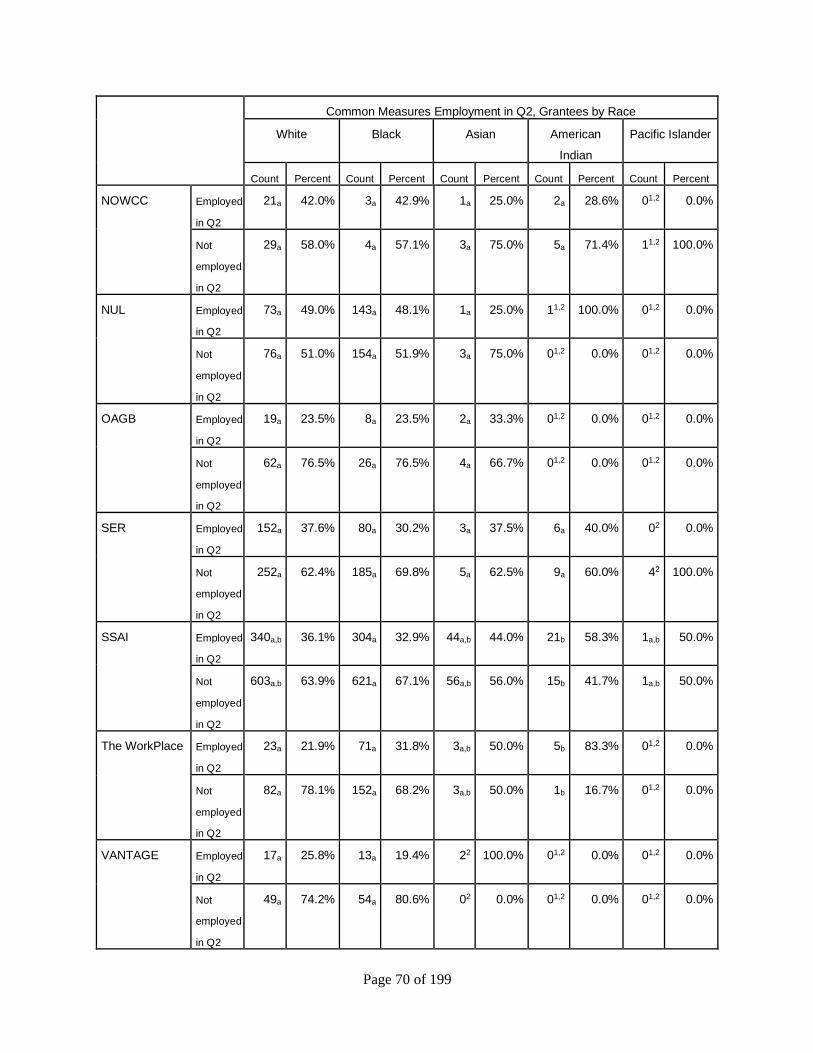
Page 70 of 199
Common Measures Employment in Q2, Grantees by Race
White Black Asian American
Indian
Pacific Islander
Count Percent Count Percent Count Percent Count Percent Count Percent
NOWCC Employed
in Q2
21a 42.0% 3a 42.9% 1a 25.0% 2a 28.6% 01,2 0.0%
Not
employed
in Q2
29a 58.0% 4a 57.1% 3a 75.0% 5a 71.4% 11,2 100.0%
NUL Employed
in Q2
73a 49.0% 143a 48.1% 1a 25.0% 11,2 100.0% 01,2 0.0%
Not
employed
in Q2
76a 51.0% 154a 51.9% 3a 75.0% 01,2 0.0% 01,2 0.0%
OAGB Employed
in Q2
19a 23.5% 8a 23.5% 2a 33.3% 01,2 0.0% 01,2 0.0%
Not
employed
in Q2
62a 76.5% 26a 76.5% 4a 66.7% 01,2 0.0% 01,2 0.0%
SER Employed
in Q2
152a 37.6% 80a 30.2% 3a 37.5% 6a 40.0% 02 0.0%
Not
employed
in Q2
252a 62.4% 185a 69.8% 5a 62.5% 9a 60.0% 42 100.0%
SSAI Employed
in Q2
340a,b 36.1% 304a 32.9% 44a,b 44.0% 21b 58.3% 1a,b 50.0%
Not
employed
in Q2
603a,b 63.9% 621a 67.1% 56a,b 56.0% 15b 41.7% 1a,b 50.0%
The WorkPlace Employed
in Q2
23a 21.9% 71a 31.8% 3a,b 50.0% 5b 83.3% 01,2 0.0%
Not
employed
in Q2
82a 78.1% 152a 68.2% 3a,b 50.0% 1b 16.7% 01,2 0.0%
VANTAGE Employed
in Q2
17a 25.8% 13a 19.4% 22 100.0% 01,2 0.0% 01,2 0.0%
Not
employed
in Q2
49a 74.2% 54a 80.6% 02 0.0% 01,2 0.0% 01,2 0.0%
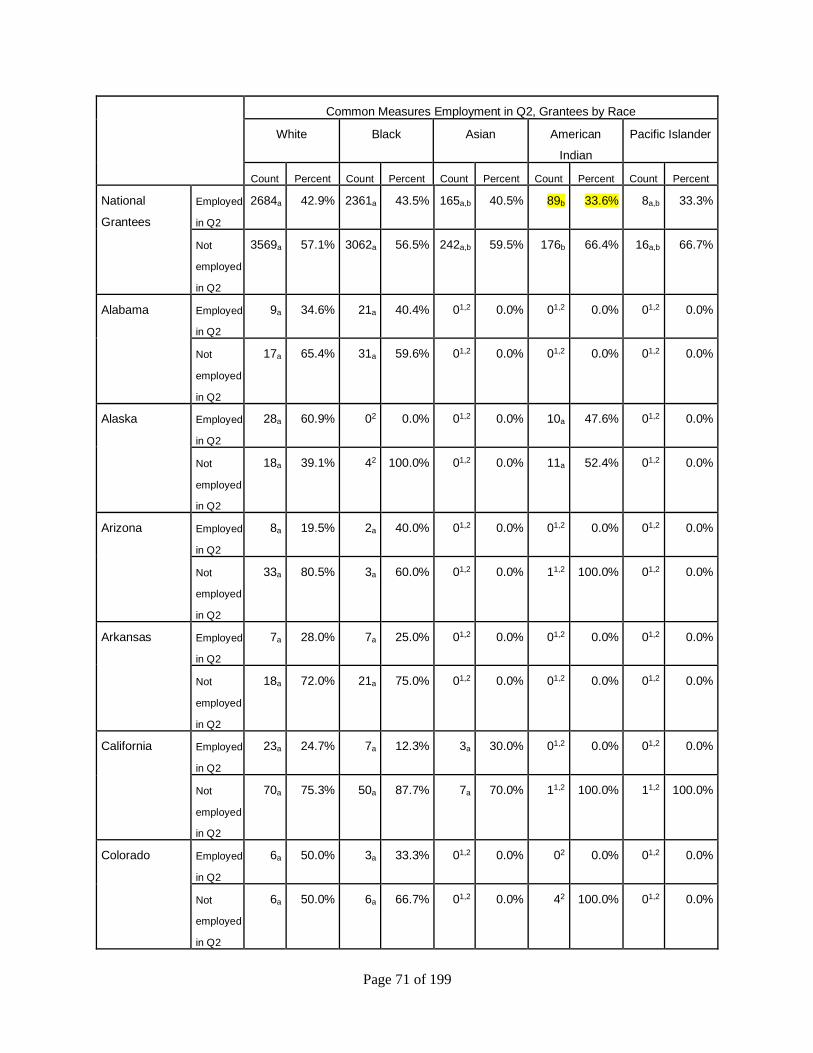
Page 71 of 199
Common Measures Employment in Q2, Grantees by Race
White Black Asian American
Indian
Pacific Islander
Count Percent Count Percent Count Percent Count Percent Count Percent
National
Grantees
Employed
in Q2
2684a 42.9% 2361a 43.5% 165a,b 40.5% 89b 33.6% 8a,b 33.3%
Not
employed
in Q2
3569a 57.1% 3062a 56.5% 242a,b 59.5% 176b 66.4% 16a,b 66.7%
Alabama Employed
in Q2
9a 34.6% 21a 40.4% 01,2 0.0% 01,2 0.0% 01,2 0.0%
Not
employed
in Q2
17a 65.4% 31a 59.6% 01,2 0.0% 01,2 0.0% 01,2 0.0%
Alaska Employed
in Q2
28a 60.9% 02 0.0% 01,2 0.0% 10a 47.6% 01,2 0.0%
Not
employed
in Q2
18a 39.1% 42 100.0% 01,2 0.0% 11a 52.4% 01,2 0.0%
Arizona Employed
in Q2
8a 19.5% 2a 40.0% 01,2 0.0% 01,2 0.0% 01,2 0.0%
Not
employed
in Q2
33a 80.5% 3a 60.0% 01,2 0.0% 11,2 100.0% 01,2 0.0%
Arkansas Employed
in Q2
7a 28.0% 7a 25.0% 01,2 0.0% 01,2 0.0% 01,2 0.0%
Not
employed
in Q2
18a 72.0% 21a 75.0% 01,2 0.0% 01,2 0.0% 01,2 0.0%
California Employed
in Q2
23a 24.7% 7a 12.3% 3a 30.0% 01,2 0.0% 01,2 0.0%
Not
employed
in Q2
70a 75.3% 50a 87.7% 7a 70.0% 11,2 100.0% 11,2 100.0%
Colorado Employed
in Q2
6a 50.0% 3a 33.3% 01,2 0.0% 02 0.0% 01,2 0.0%
Not
employed
in Q2
6a 50.0% 6a 66.7% 01,2 0.0% 42 100.0% 01,2 0.0%
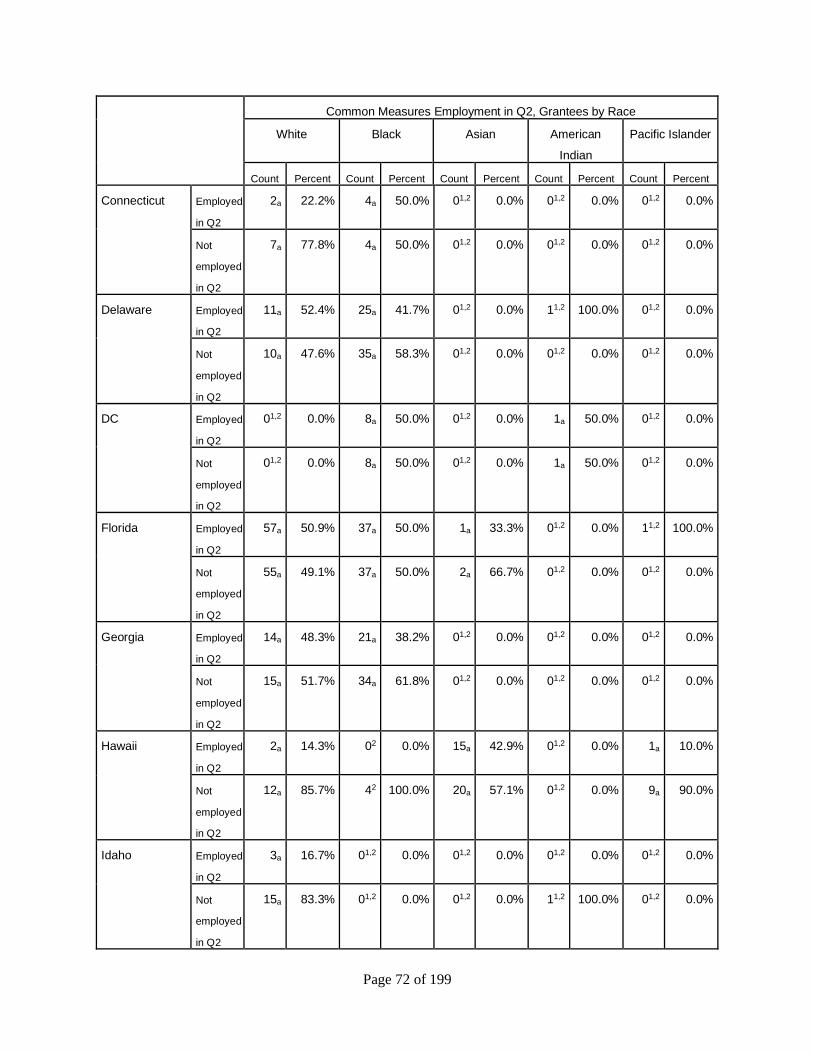
Page 72 of 199
Common Measures Employment in Q2, Grantees by Race
White Black Asian American
Indian
Pacific Islander
Count Percent Count Percent Count Percent Count Percent Count Percent
Connecticut Employed
in Q2
2a 22.2% 4a 50.0% 01,2 0.0% 01,2 0.0% 01,2 0.0%
Not
employed
in Q2
7a 77.8% 4a 50.0% 01,2 0.0% 01,2 0.0% 01,2 0.0%
Delaware Employed
in Q2
11a 52.4% 25a 41.7% 01,2 0.0% 11,2 100.0% 01,2 0.0%
Not
employed
in Q2
10a 47.6% 35a 58.3% 01,2 0.0% 01,2 0.0% 01,2 0.0%
DC Employed
in Q2
01,2 0.0% 8a 50.0% 01,2 0.0% 1a 50.0% 01,2 0.0%
Not
employed
in Q2
01,2 0.0% 8a 50.0% 01,2 0.0% 1a 50.0% 01,2 0.0%
Florida Employed
in Q2
57a 50.9% 37a 50.0% 1a 33.3% 01,2 0.0% 11,2 100.0%
Not
employed
in Q2
55a 49.1% 37a 50.0% 2a 66.7% 01,2 0.0% 01,2 0.0%
Georgia Employed
in Q2
14a 48.3% 21a 38.2% 01,2 0.0% 01,2 0.0% 01,2 0.0%
Not
employed
in Q2
15a 51.7% 34a 61.8% 01,2 0.0% 01,2 0.0% 01,2 0.0%
Hawaii Employed
in Q2
2a 14.3% 02 0.0% 15a 42.9% 01,2 0.0% 1a 10.0%
Not
employed
in Q2
12a 85.7% 42 100.0% 20a 57.1% 01,2 0.0% 9a 90.0%
Idaho Employed
in Q2
3a 16.7% 01,2 0.0% 01,2 0.0% 01,2 0.0% 01,2 0.0%
Not
employed
in Q2
15a 83.3% 01,2 0.0% 01,2 0.0% 11,2 100.0% 01,2 0.0%
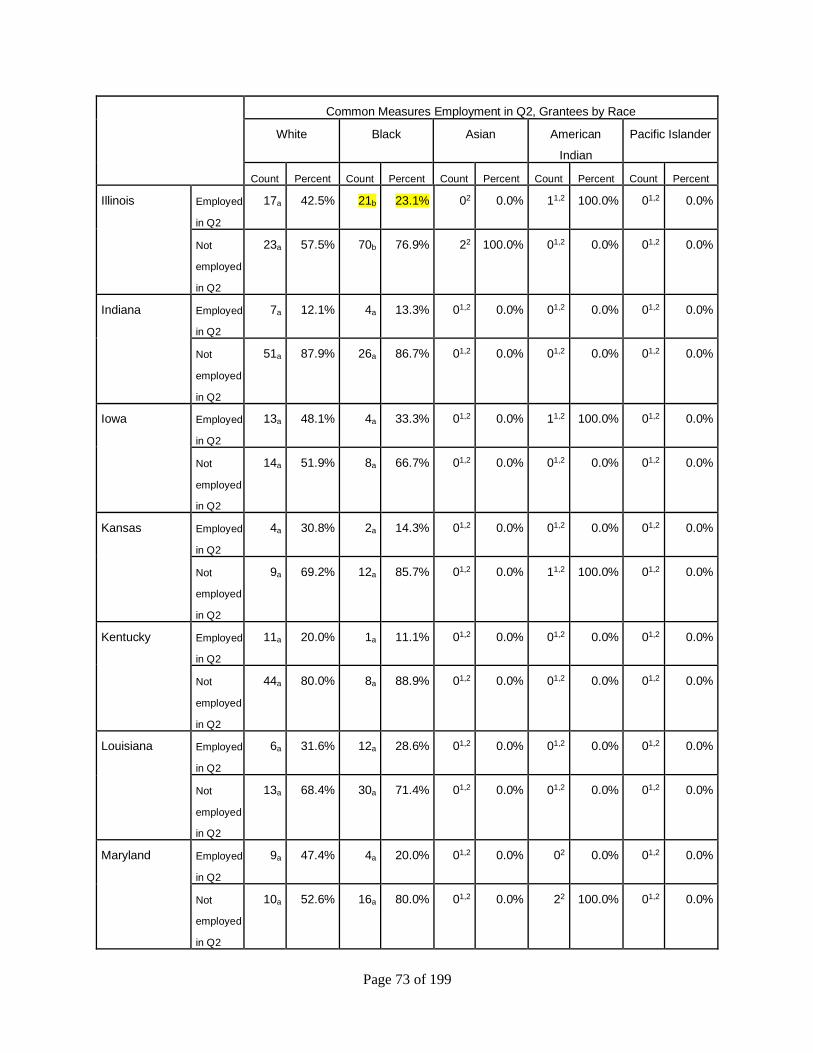
Page 73 of 199
Common Measures Employment in Q2, Grantees by Race
White Black Asian American
Indian
Pacific Islander
Count Percent Count Percent Count Percent Count Percent Count Percent
Illinois Employed
in Q2
17a 42.5% 21b 23.1% 02 0.0% 11,2 100.0% 01,2 0.0%
Not
employed
in Q2
23a 57.5% 70b 76.9% 22 100.0% 01,2 0.0% 01,2 0.0%
Indiana Employed
in Q2
7a 12.1% 4a 13.3% 01,2 0.0% 01,2 0.0% 01,2 0.0%
Not
employed
in Q2
51a 87.9% 26a 86.7% 01,2 0.0% 01,2 0.0% 01,2 0.0%
Iowa Employed
in Q2
13a 48.1% 4a 33.3% 01,2 0.0% 11,2 100.0% 01,2 0.0%
Not
employed
in Q2
14a 51.9% 8a 66.7% 01,2 0.0% 01,2 0.0% 01,2 0.0%
Kansas Employed
in Q2
4a 30.8% 2a 14.3% 01,2 0.0% 01,2 0.0% 01,2 0.0%
Not
employed
in Q2
9a 69.2% 12a 85.7% 01,2 0.0% 11,2 100.0% 01,2 0.0%
Kentucky Employed
in Q2
11a 20.0% 1a 11.1% 01,2 0.0% 01,2 0.0% 01,2 0.0%
Not
employed
in Q2
44a 80.0% 8a 88.9% 01,2 0.0% 01,2 0.0% 01,2 0.0%
Louisiana Employed
in Q2
6a 31.6% 12a 28.6% 01,2 0.0% 01,2 0.0% 01,2 0.0%
Not
employed
in Q2
13a 68.4% 30a 71.4% 01,2 0.0% 01,2 0.0% 01,2 0.0%
Maryland Employed
in Q2
9a 47.4% 4a 20.0% 01,2 0.0% 02 0.0% 01,2 0.0%
Not
employed
in Q2
10a 52.6% 16a 80.0% 01,2 0.0% 22 100.0% 01,2 0.0%
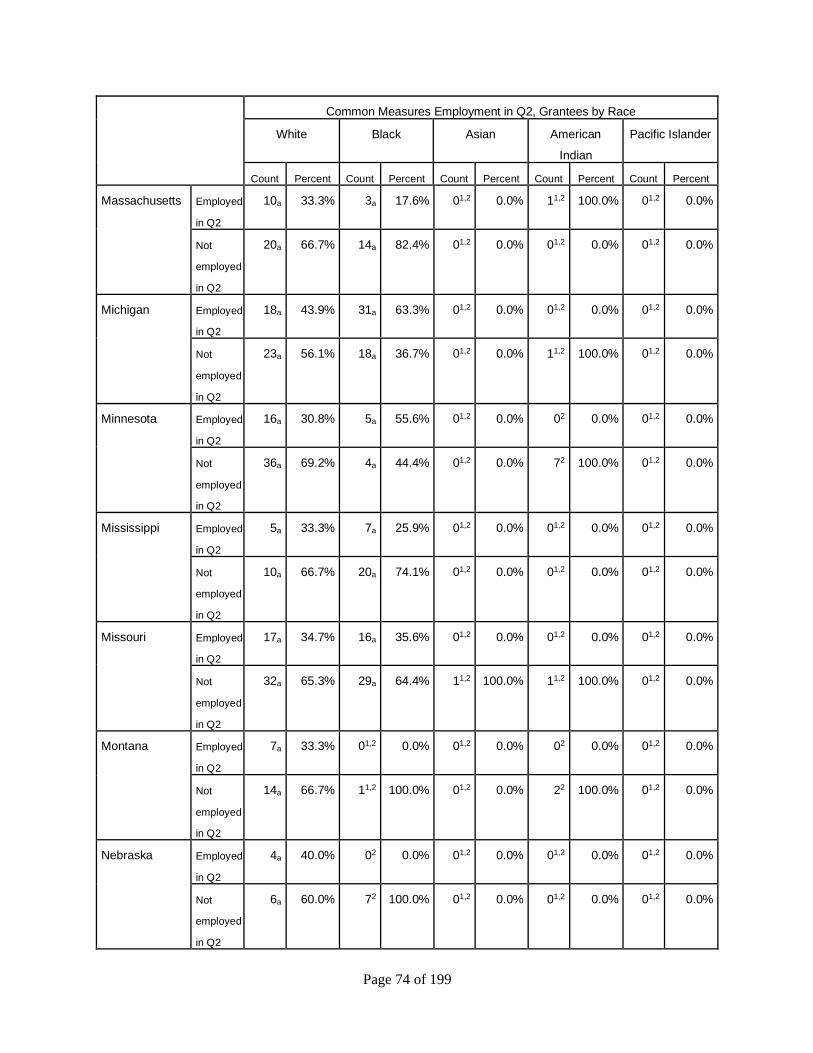
Page 74 of 199
Common Measures Employment in Q2, Grantees by Race
White Black Asian American
Indian
Pacific Islander
Count Percent Count Percent Count Percent Count Percent Count Percent
Massachusetts Employed
in Q2
10a 33.3% 3a 17.6% 01,2 0.0% 11,2 100.0% 01,2 0.0%
Not
employed
in Q2
20a 66.7% 14a 82.4% 01,2 0.0% 01,2 0.0% 01,2 0.0%
Michigan Employed
in Q2
18a 43.9% 31a 63.3% 01,2 0.0% 01,2 0.0% 01,2 0.0%
Not
employed
in Q2
23a 56.1% 18a 36.7% 01,2 0.0% 11,2 100.0% 01,2 0.0%
Minnesota Employed
in Q2
16a 30.8% 5a 55.6% 01,2 0.0% 02 0.0% 01,2 0.0%
Not
employed
in Q2
36a 69.2% 4a 44.4% 01,2 0.0% 72 100.0% 01,2 0.0%
Mississippi Employed
in Q2
5a 33.3% 7a 25.9% 01,2 0.0% 01,2 0.0% 01,2 0.0%
Not
employed
in Q2
10a 66.7% 20a 74.1% 01,2 0.0% 01,2 0.0% 01,2 0.0%
Missouri Employed
in Q2
17a 34.7% 16a 35.6% 01,2 0.0% 01,2 0.0% 01,2 0.0%
Not
employed
in Q2
32a 65.3% 29a 64.4% 11,2 100.0% 11,2 100.0% 01,2 0.0%
Montana Employed
in Q2
7a 33.3% 01,2 0.0% 01,2 0.0% 02 0.0% 01,2 0.0%
Not
employed
in Q2
14a 66.7% 11,2 100.0% 01,2 0.0% 22 100.0% 01,2 0.0%
Nebraska Employed
in Q2
4a 40.0% 02 0.0% 01,2 0.0% 01,2 0.0% 01,2 0.0%
Not
employed
in Q2
6a 60.0% 72 100.0% 01,2 0.0% 01,2 0.0% 01,2 0.0%

Page 75 of 199
Common Measures Employment in Q2, Grantees by Race
White Black Asian American
Indian
Pacific Islander
Count Percent Count Percent Count Percent Count Percent Count Percent
Nevada Employed
in Q2
5a 55.6% 2a 25.0% 01,2 0.0% 01,2 0.0% 01,2 0.0%
Not
employed
in Q2
4a 44.4% 6a 75.0% 01,2 0.0% 01,2 0.0% 01,2 0.0%
New Hampshire Employed
in Q2
6a 28.6% 01,2 0.0% 01,2 0.0% 01,2 0.0% 01,2 0.0%
Not
employed
in Q2
15a 71.4% 01,2 0.0% 01,2 0.0% 01,2 0.0% 01,2 0.0%
New Jersey Employed
in Q2
23a 63.9% 33a 56.9% 11,2 100.0% 01,2 0.0% 01,2 0.0%
Not
employed
in Q2
13a 36.1% 25a 43.1% 01,2 0.0% 11,2 100.0% 01,2 0.0%
New Mexico Employed
in Q2
3a 42.9% 01,2 0.0% 01,2 0.0% 02 0.0% 01,2 0.0%
Not
employed
in Q2
4a 57.1% 01,2 0.0% 01,2 0.0% 52 100.0% 01,2 0.0%
New York Employed
in Q2
13a 24.1% 20a 36.4% 4a 30.8% 01,2 0.0% 1a 50.0%
Not
employed
in Q2
41a 75.9% 35a 63.6% 9a 69.2% 11,2 100.0% 1a 50.0%
North Carolina Employed
in Q2
11a 39.3% 23a 41.1% 01,2 0.0% 4a 80.0% 01,2 0.0%
Not
employed
in Q2
17a 60.7% 33a 58.9% 01,2 0.0% 1a 20.0% 01,2 0.0%
North Dakota Employed
in Q2
4a 28.6% 01,2 0.0% 01,2 0.0% 1a 50.0% 01,2 0.0%
Not
employed
in Q2
10a 71.4% 01,2 0.0% 11,2 100.0% 1a 50.0% 01,2 0.0%
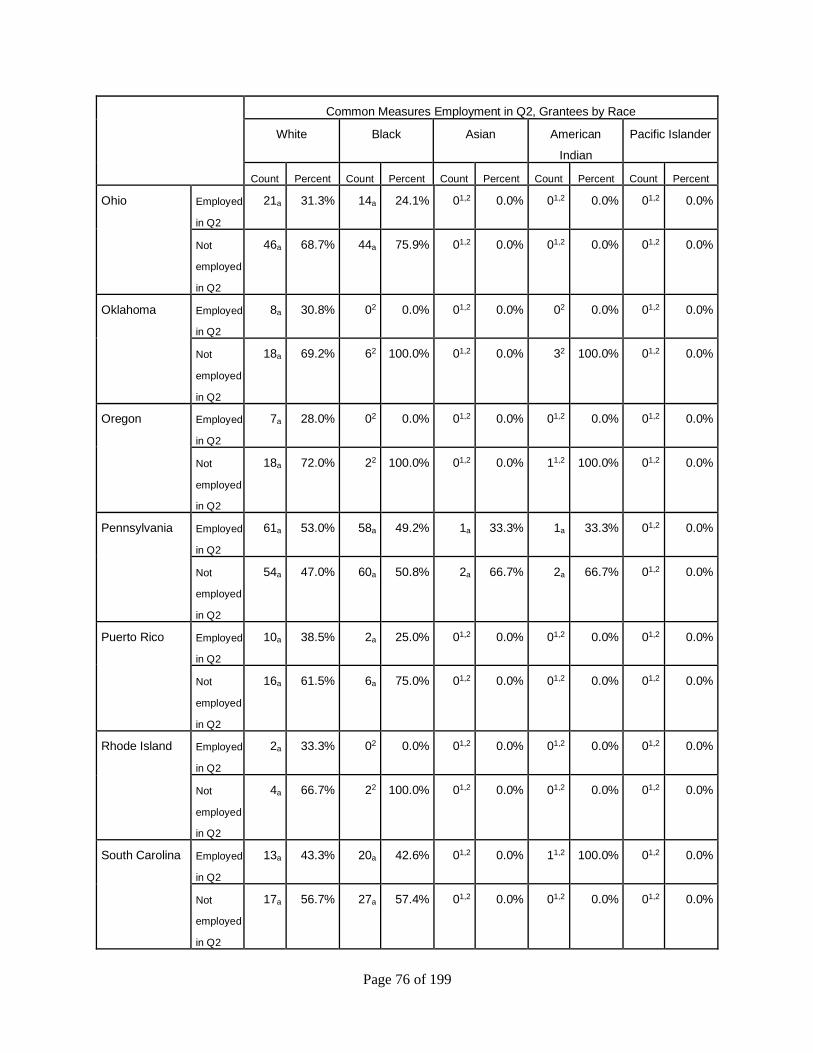
Page 76 of 199
Common Measures Employment in Q2, Grantees by Race
White Black Asian American
Indian
Pacific Islander
Count Percent Count Percent Count Percent Count Percent Count Percent
Ohio Employed
in Q2
21a 31.3% 14a 24.1% 01,2 0.0% 01,2 0.0% 01,2 0.0%
Not
employed
in Q2
46a 68.7% 44a 75.9% 01,2 0.0% 01,2 0.0% 01,2 0.0%
Oklahoma Employed
in Q2
8a 30.8% 02 0.0% 01,2 0.0% 02 0.0% 01,2 0.0%
Not
employed
in Q2
18a 69.2% 62 100.0% 01,2 0.0% 32 100.0% 01,2 0.0%
Oregon Employed
in Q2
7a 28.0% 02 0.0% 01,2 0.0% 01,2 0.0% 01,2 0.0%
Not
employed
in Q2
18a 72.0% 22 100.0% 01,2 0.0% 11,2 100.0% 01,2 0.0%
Pennsylvania Employed
in Q2
61a 53.0% 58a 49.2% 1a 33.3% 1a 33.3% 01,2 0.0%
Not
employed
in Q2
54a 47.0% 60a 50.8% 2a 66.7% 2a 66.7% 01,2 0.0%
Puerto Rico Employed
in Q2
10a 38.5% 2a 25.0% 01,2 0.0% 01,2 0.0% 01,2 0.0%
Not
employed
in Q2
16a 61.5% 6a 75.0% 01,2 0.0% 01,2 0.0% 01,2 0.0%
Rhode Island Employed
in Q2
2a 33.3% 02 0.0% 01,2 0.0% 01,2 0.0% 01,2 0.0%
Not
employed
in Q2
4a 66.7% 22 100.0% 01,2 0.0% 01,2 0.0% 01,2 0.0%
South Carolina Employed
in Q2
13a 43.3% 20a 42.6% 01,2 0.0% 11,2 100.0% 01,2 0.0%
Not
employed
in Q2
17a 56.7% 27a 57.4% 01,2 0.0% 01,2 0.0% 01,2 0.0%
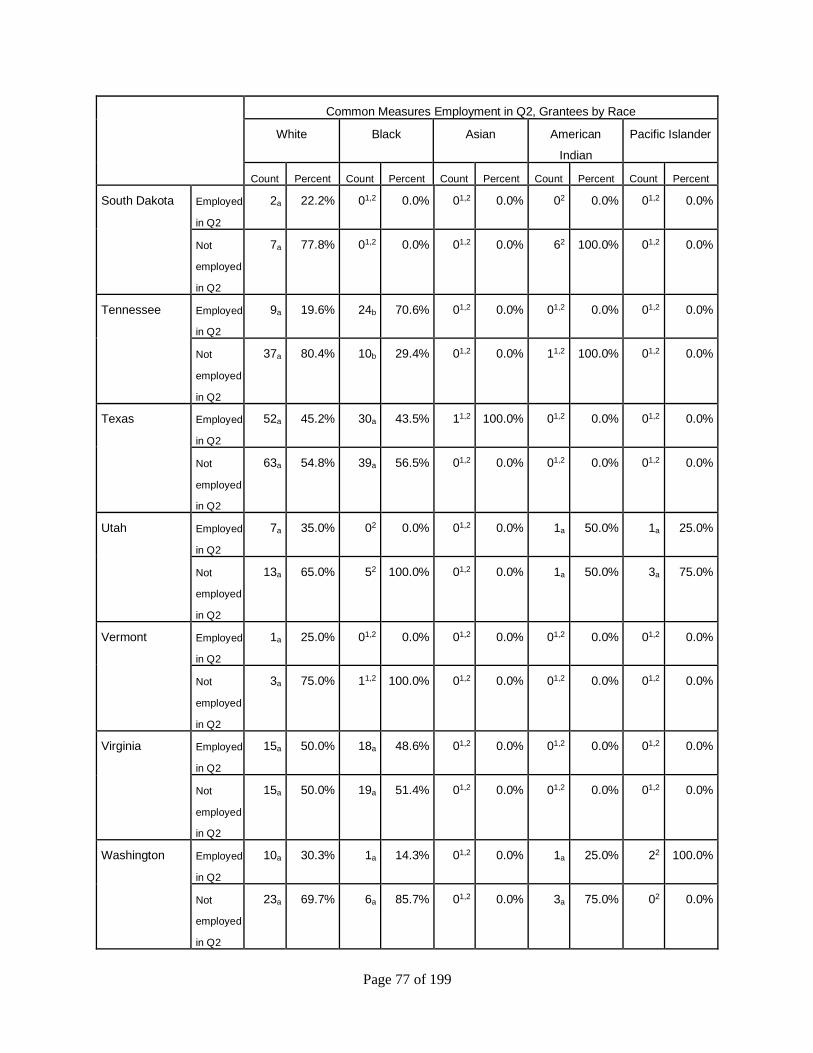
Page 77 of 199
Common Measures Employment in Q2, Grantees by Race
White Black Asian American
Indian
Pacific Islander
Count Percent Count Percent Count Percent Count Percent Count Percent
South Dakota Employed
in Q2
2a 22.2% 01,2 0.0% 01,2 0.0% 02 0.0% 01,2 0.0%
Not
employed
in Q2
7a 77.8% 01,2 0.0% 01,2 0.0% 62 100.0% 01,2 0.0%
Tennessee Employed
in Q2
9a 19.6% 24b 70.6% 01,2 0.0% 01,2 0.0% 01,2 0.0%
Not
employed
in Q2
37a 80.4% 10b 29.4% 01,2 0.0% 11,2 100.0% 01,2 0.0%
Texas Employed
in Q2
52a 45.2% 30a 43.5% 11,2 100.0% 01,2 0.0% 01,2 0.0%
Not
employed
in Q2
63a 54.8% 39a 56.5% 01,2 0.0% 01,2 0.0% 01,2 0.0%
Utah Employed
in Q2
7a 35.0% 02 0.0% 01,2 0.0% 1a 50.0% 1a 25.0%
Not
employed
in Q2
13a 65.0% 52 100.0% 01,2 0.0% 1a 50.0% 3a 75.0%
Vermont Employed
in Q2
1a 25.0% 01,2 0.0% 01,2 0.0% 01,2 0.0% 01,2 0.0%
Not
employed
in Q2
3a 75.0% 11,2 100.0% 01,2 0.0% 01,2 0.0% 01,2 0.0%
Virginia Employed
in Q2
15a 50.0% 18a 48.6% 01,2 0.0% 01,2 0.0% 01,2 0.0%
Not
employed
in Q2
15a 50.0% 19a 51.4% 01,2 0.0% 01,2 0.0% 01,2 0.0%
Washington Employed
in Q2
10a 30.3% 1a 14.3% 01,2 0.0% 1a 25.0% 22 100.0%
Not
employed
in Q2
23a 69.7% 6a 85.7% 01,2 0.0% 3a 75.0% 02 0.0%
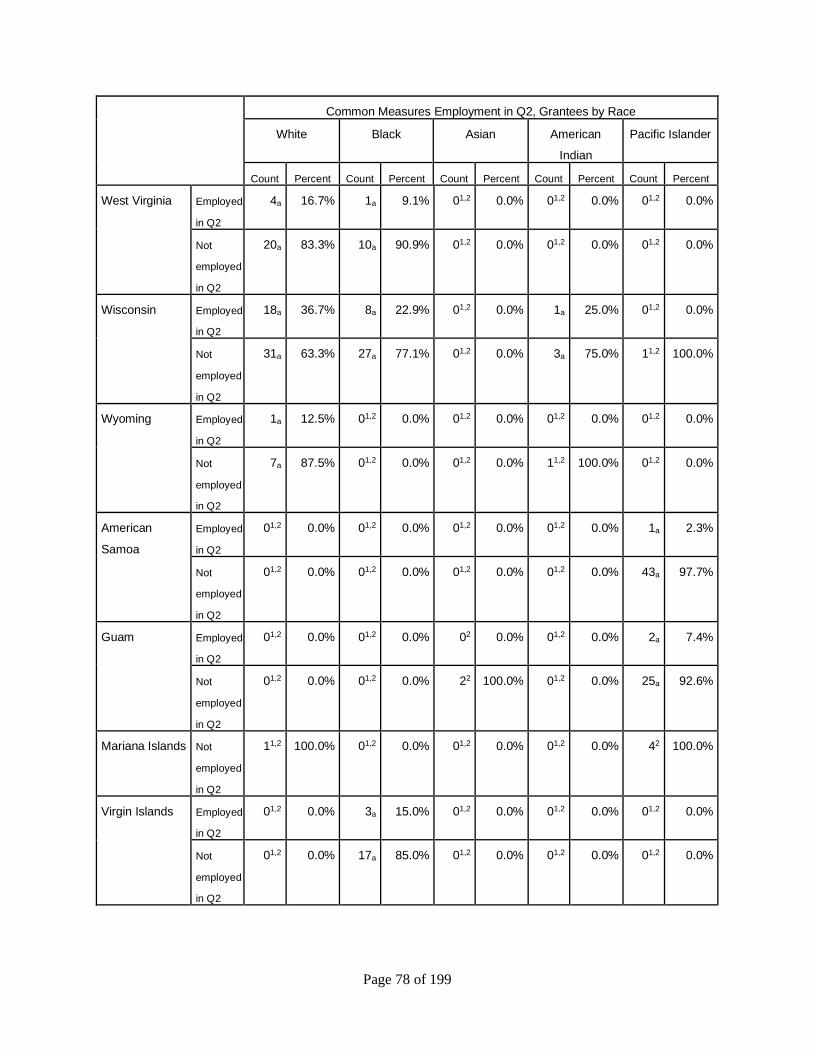
Page 78 of 199
Common Measures Employment in Q2, Grantees by Race
White Black Asian American
Indian
Pacific Islander
Count Percent Count Percent Count Percent Count Percent Count Percent
West Virginia Employed
in Q2
4a 16.7% 1a 9.1% 01,2 0.0% 01,2 0.0% 01,2 0.0%
Not
employed
in Q2
20a 83.3% 10a 90.9% 01,2 0.0% 01,2 0.0% 01,2 0.0%
Wisconsin Employed
in Q2
18a 36.7% 8a 22.9% 01,2 0.0% 1a 25.0% 01,2 0.0%
Not
employed
in Q2
31a 63.3% 27a 77.1% 01,2 0.0% 3a 75.0% 11,2 100.0%
Wyoming Employed
in Q2
1a 12.5% 01,2 0.0% 01,2 0.0% 01,2 0.0% 01,2 0.0%
Not
employed
in Q2
7a 87.5% 01,2 0.0% 01,2 0.0% 11,2 100.0% 01,2 0.0%
American
Samoa
Employed
in Q2
01,2 0.0% 01,2 0.0% 01,2 0.0% 01,2 0.0% 1a 2.3%
Not
employed
in Q2
01,2 0.0% 01,2 0.0% 01,2 0.0% 01,2 0.0% 43a 97.7%
Guam Employed
in Q2
01,2 0.0% 01,2 0.0% 02 0.0% 01,2 0.0% 2a 7.4%
Not
employed
in Q2
01,2 0.0% 01,2 0.0% 22 100.0% 01,2 0.0% 25a 92.6%
Mariana Islands Not
employed
in Q2
11,2 100.0% 01,2 0.0% 01,2 0.0% 01,2 0.0% 42 100.0%
Virgin Islands Employed
in Q2
01,2 0.0% 3a 15.0% 01,2 0.0% 01,2 0.0% 01,2 0.0%
Not
employed
in Q2
01,2 0.0% 17a 85.0% 01,2 0.0% 01,2 0.0% 01,2 0.0%
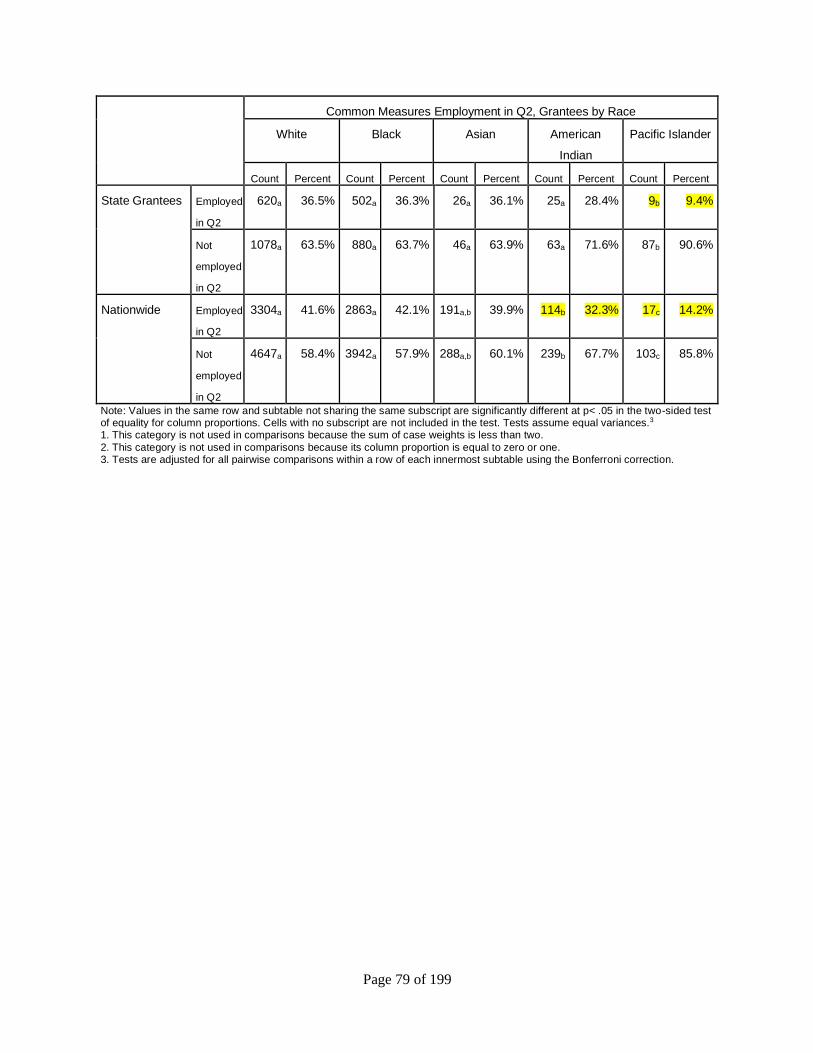
Page 79 of 199
Common Measures Employment in Q2, Grantees by Race
White Black Asian American
Indian
Pacific Islander
Count Percent Count Percent Count Percent Count Percent Count Percent
State Grantees Employed
in Q2
620a 36.5% 502a 36.3% 26a 36.1% 25a 28.4% 9b 9.4%
Not
employed
in Q2
1078a 63.5% 880a 63.7% 46a 63.9% 63a 71.6% 87b 90.6%
Nationwide Employed
in Q2
3304a 41.6% 2863a 42.1% 191a,b 39.9% 114b 32.3% 17c 14.2%
Not
employed
in Q2
4647a 58.4% 3942a 57.9% 288a,b 60.1% 239b 67.7% 103c 85.8%
Note: Values in the same row and subtable not sharing the same subscript are significantly different at p< .05 in the two-sided test of equality for column proportions. Cells with no subscript are not included in the test. Tests assume equal variances.3 1. This category is not used in comparisons because the sum of case weights is less than two.
2. This category is not used in comparisons because its column proportion is equal to zero or one. 3. Tests are adjusted for all pairwise comparisons within a row of each innermost subtable using the Bonferroni correction.
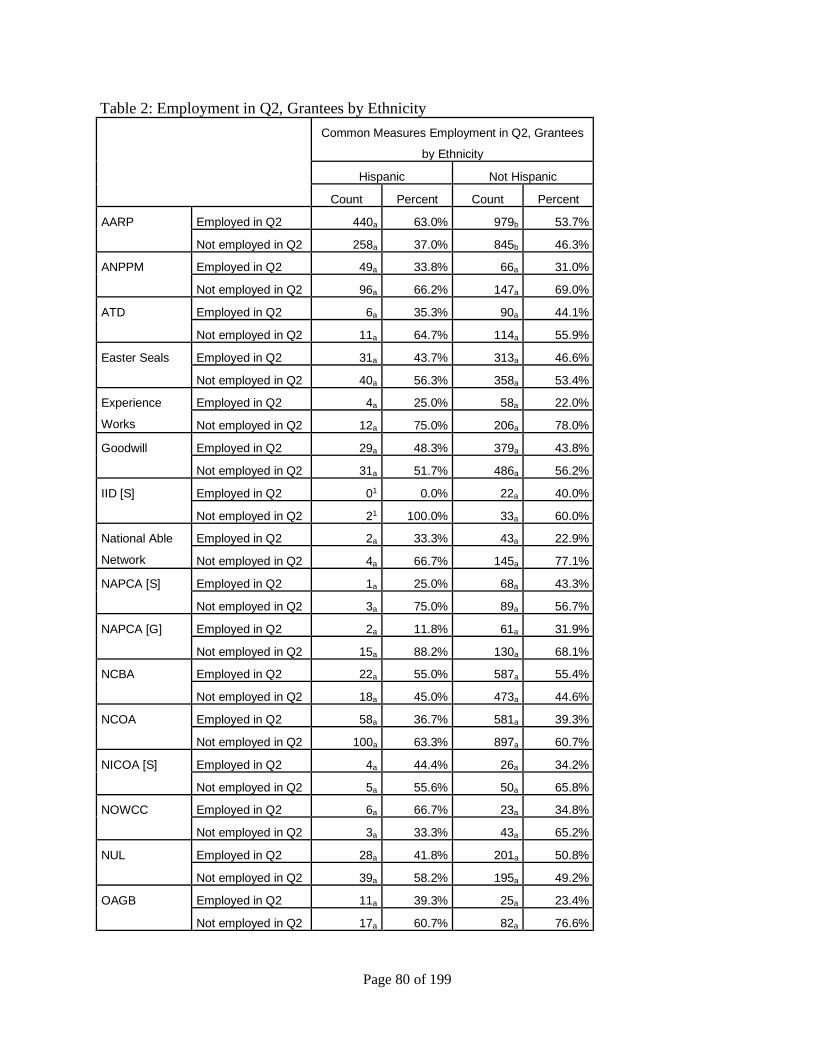
Page 80 of 199
Table 2: Employment in Q2, Grantees by Ethnicity
Common Measures Employment in Q2, Grantees
by Ethnicity
Hispanic Not Hispanic
Count Percent Count Percent
AARP Employed in Q2 440a 63.0% 979b 53.7%
Not employed in Q2 258a 37.0% 845b 46.3%
ANPPM Employed in Q2 49a 33.8% 66a 31.0%
Not employed in Q2 96a 66.2% 147a 69.0%
ATD Employed in Q2 6a 35.3% 90a 44.1%
Not employed in Q2 11a 64.7% 114a 55.9%
Easter Seals Employed in Q2 31a 43.7% 313a 46.6%
Not employed in Q2 40a 56.3% 358a 53.4%
Experience
Works
Employed in Q2 4a 25.0% 58a 22.0%
Not employed in Q2 12a 75.0% 206a 78.0%
Goodwill Employed in Q2 29a 48.3% 379a 43.8%
Not employed in Q2 31a 51.7% 486a 56.2%
IID [S] Employed in Q2 01 0.0% 22a 40.0%
Not employed in Q2 21 100.0% 33a 60.0%
National Able
Network
Employed in Q2 2a 33.3% 43a 22.9%
Not employed in Q2 4a 66.7% 145a 77.1%
NAPCA [S] Employed in Q2 1a 25.0% 68a 43.3%
Not employed in Q2 3a 75.0% 89a 56.7%
NAPCA [G] Employed in Q2 2a 11.8% 61a 31.9%
Not employed in Q2 15a 88.2% 130a 68.1%
NCBA Employed in Q2 22a 55.0% 587a 55.4%
Not employed in Q2 18a 45.0% 473a 44.6%
NCOA Employed in Q2 58a 36.7% 581a 39.3%
Not employed in Q2 100a 63.3% 897a 60.7%
NICOA [S] Employed in Q2 4a 44.4% 26a 34.2%
Not employed in Q2 5a 55.6% 50a 65.8%
NOWCC Employed in Q2 6a 66.7% 23a 34.8%
Not employed in Q2 3a 33.3% 43a 65.2%
NUL Employed in Q2 28a 41.8% 201a 50.8%
Not employed in Q2 39a 58.2% 195a 49.2%
OAGB Employed in Q2 11a 39.3% 25a 23.4%
Not employed in Q2 17a 60.7% 82a 76.6%
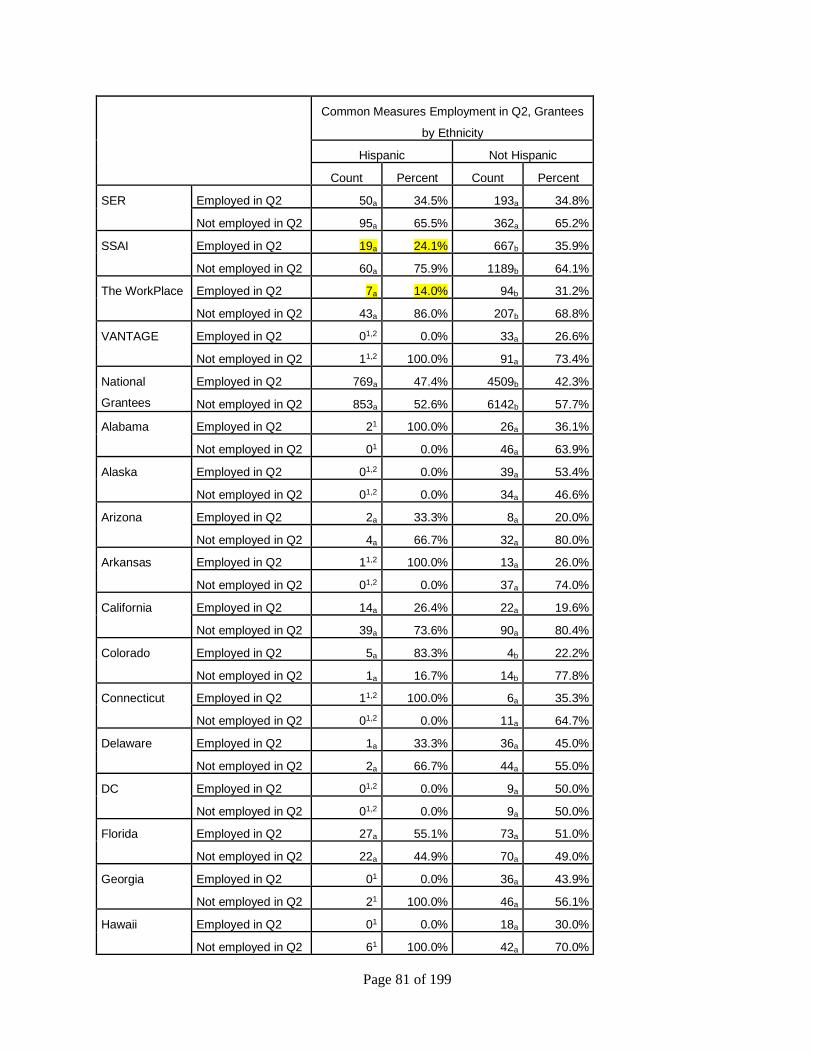
Page 81 of 199
Common Measures Employment in Q2, Grantees
by Ethnicity
Hispanic Not Hispanic
Count Percent Count Percent
SER Employed in Q2 50a 34.5% 193a 34.8%
Not employed in Q2 95a 65.5% 362a 65.2%
SSAI Employed in Q2 19a 24.1% 667b 35.9%
Not employed in Q2 60a 75.9% 1189b 64.1%
The WorkPlace Employed in Q2 7a 14.0% 94b 31.2%
Not employed in Q2 43a 86.0% 207b 68.8%
VANTAGE Employed in Q2 01,2 0.0% 33a 26.6%
Not employed in Q2 11,2 100.0% 91a 73.4%
National
Grantees
Employed in Q2 769a 47.4% 4509b 42.3%
Not employed in Q2 853a 52.6% 6142b 57.7%
Alabama Employed in Q2 21 100.0% 26a 36.1%
Not employed in Q2 01 0.0% 46a 63.9%
Alaska Employed in Q2 01,2 0.0% 39a 53.4%
Not employed in Q2 01,2 0.0% 34a 46.6%
Arizona Employed in Q2 2a 33.3% 8a 20.0%
Not employed in Q2 4a 66.7% 32a 80.0%
Arkansas Employed in Q2 11,2 100.0% 13a 26.0%
Not employed in Q2 01,2 0.0% 37a 74.0%
California Employed in Q2 14a 26.4% 22a 19.6%
Not employed in Q2 39a 73.6% 90a 80.4%
Colorado Employed in Q2 5a 83.3% 4b 22.2%
Not employed in Q2 1a 16.7% 14b 77.8%
Connecticut Employed in Q2 11,2 100.0% 6a 35.3%
Not employed in Q2 01,2 0.0% 11a 64.7%
Delaware Employed in Q2 1a 33.3% 36a 45.0%
Not employed in Q2 2a 66.7% 44a 55.0%
DC Employed in Q2 01,2 0.0% 9a 50.0%
Not employed in Q2 01,2 0.0% 9a 50.0%
Florida Employed in Q2 27a 55.1% 73a 51.0%
Not employed in Q2 22a 44.9% 70a 49.0%
Georgia Employed in Q2 01 0.0% 36a 43.9%
Not employed in Q2 21 100.0% 46a 56.1%
Hawaii Employed in Q2 01 0.0% 18a 30.0%
Not employed in Q2 61 100.0% 42a 70.0%
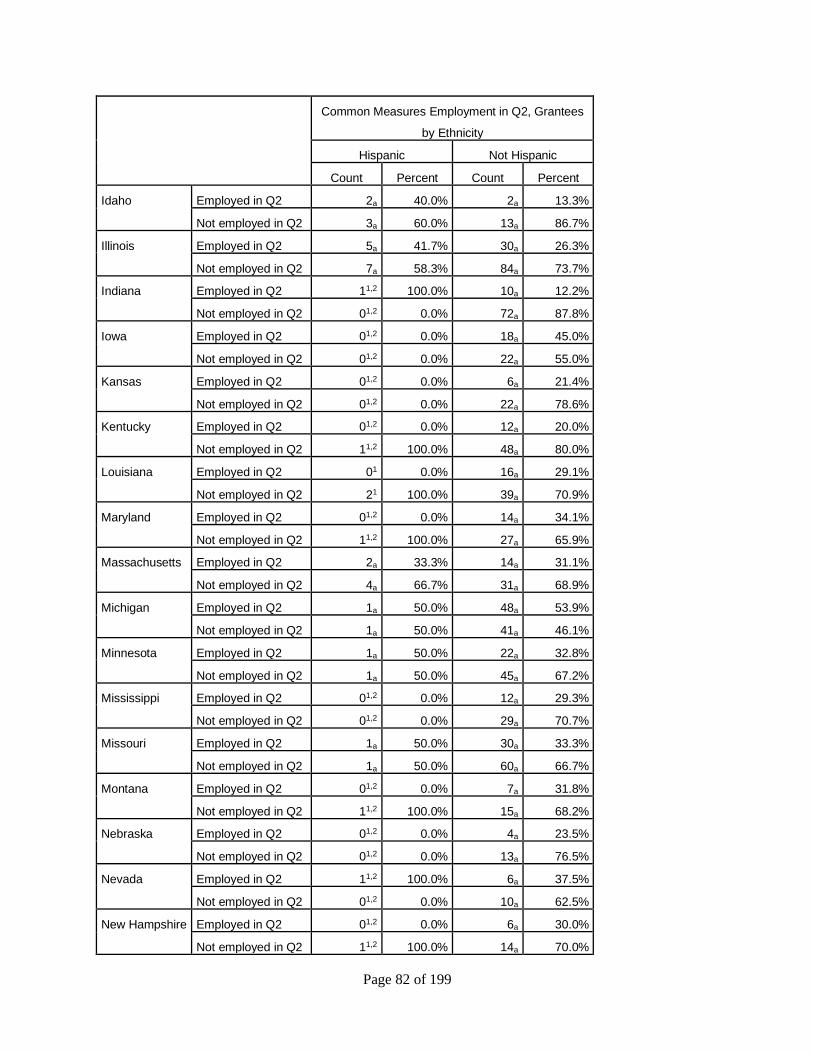
Page 82 of 199
Common Measures Employment in Q2, Grantees
by Ethnicity
Hispanic Not Hispanic
Count Percent Count Percent
Idaho Employed in Q2 2a 40.0% 2a 13.3%
Not employed in Q2 3a 60.0% 13a 86.7%
Illinois Employed in Q2 5a 41.7% 30a 26.3%
Not employed in Q2 7a 58.3% 84a 73.7%
Indiana Employed in Q2 11,2 100.0% 10a 12.2%
Not employed in Q2 01,2 0.0% 72a 87.8%
Iowa Employed in Q2 01,2 0.0% 18a 45.0%
Not employed in Q2 01,2 0.0% 22a 55.0%
Kansas Employed in Q2 01,2 0.0% 6a 21.4%
Not employed in Q2 01,2 0.0% 22a 78.6%
Kentucky Employed in Q2 01,2 0.0% 12a 20.0%
Not employed in Q2 11,2 100.0% 48a 80.0%
Louisiana Employed in Q2 01 0.0% 16a 29.1%
Not employed in Q2 21 100.0% 39a 70.9%
Maryland Employed in Q2 01,2 0.0% 14a 34.1%
Not employed in Q2 11,2 100.0% 27a 65.9%
Massachusetts Employed in Q2 2a 33.3% 14a 31.1%
Not employed in Q2 4a 66.7% 31a 68.9%
Michigan Employed in Q2 1a 50.0% 48a 53.9%
Not employed in Q2 1a 50.0% 41a 46.1%
Minnesota Employed in Q2 1a 50.0% 22a 32.8%
Not employed in Q2 1a 50.0% 45a 67.2%
Mississippi Employed in Q2 01,2 0.0% 12a 29.3%
Not employed in Q2 01,2 0.0% 29a 70.7%
Missouri Employed in Q2 1a 50.0% 30a 33.3%
Not employed in Q2 1a 50.0% 60a 66.7%
Montana Employed in Q2 01,2 0.0% 7a 31.8%
Not employed in Q2 11,2 100.0% 15a 68.2%
Nebraska Employed in Q2 01,2 0.0% 4a 23.5%
Not employed in Q2 01,2 0.0% 13a 76.5%
Nevada Employed in Q2 11,2 100.0% 6a 37.5%
Not employed in Q2 01,2 0.0% 10a 62.5%
New Hampshire Employed in Q2 01,2 0.0% 6a 30.0%
Not employed in Q2 11,2 100.0% 14a 70.0%
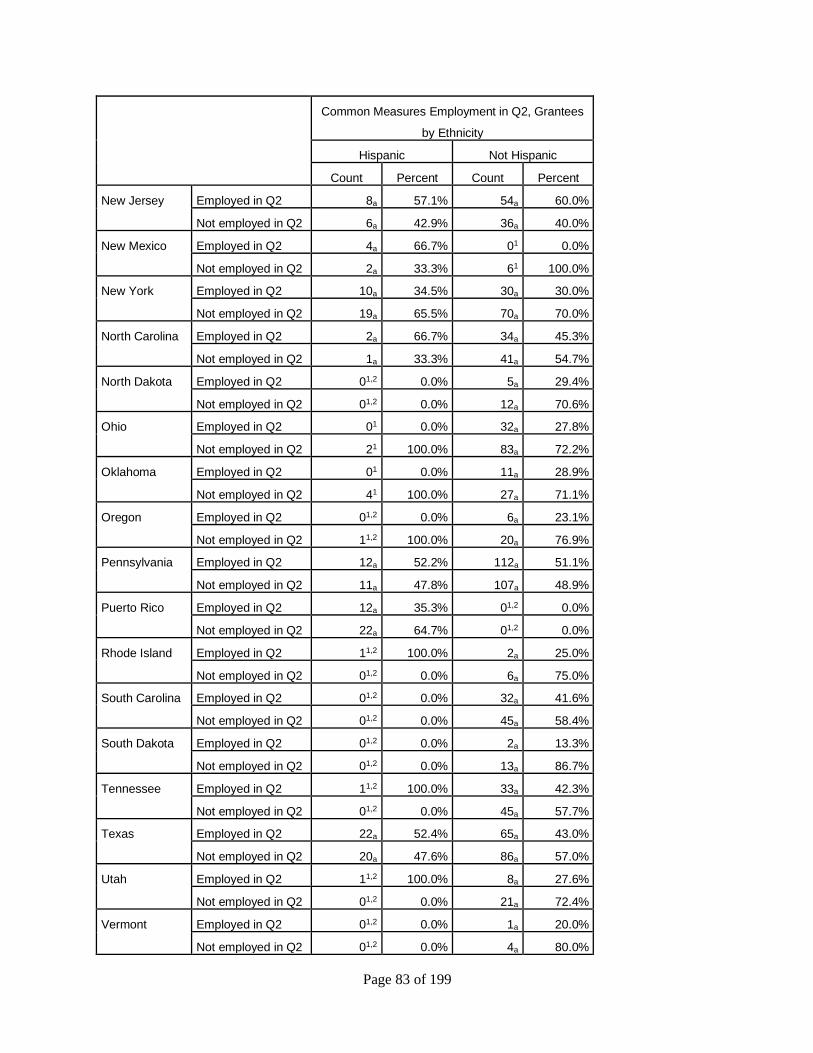
Page 83 of 199
Common Measures Employment in Q2, Grantees
by Ethnicity
Hispanic Not Hispanic
Count Percent Count Percent
New Jersey Employed in Q2 8a 57.1% 54a 60.0%
Not employed in Q2 6a 42.9% 36a 40.0%
New Mexico Employed in Q2 4a 66.7% 01 0.0%
Not employed in Q2 2a 33.3% 61 100.0%
New York Employed in Q2 10a 34.5% 30a 30.0%
Not employed in Q2 19a 65.5% 70a 70.0%
North Carolina Employed in Q2 2a 66.7% 34a 45.3%
Not employed in Q2 1a 33.3% 41a 54.7%
North Dakota Employed in Q2 01,2 0.0% 5a 29.4%
Not employed in Q2 01,2 0.0% 12a 70.6%
Ohio Employed in Q2 01 0.0% 32a 27.8%
Not employed in Q2 21 100.0% 83a 72.2%
Oklahoma Employed in Q2 01 0.0% 11a 28.9%
Not employed in Q2 41 100.0% 27a 71.1%
Oregon Employed in Q2 01,2 0.0% 6a 23.1%
Not employed in Q2 11,2 100.0% 20a 76.9%
Pennsylvania Employed in Q2 12a 52.2% 112a 51.1%
Not employed in Q2 11a 47.8% 107a 48.9%
Puerto Rico Employed in Q2 12a 35.3% 01,2 0.0%
Not employed in Q2 22a 64.7% 01,2 0.0%
Rhode Island Employed in Q2 11,2 100.0% 2a 25.0%
Not employed in Q2 01,2 0.0% 6a 75.0%
South Carolina Employed in Q2 01,2 0.0% 32a 41.6%
Not employed in Q2 01,2 0.0% 45a 58.4%
South Dakota Employed in Q2 01,2 0.0% 2a 13.3%
Not employed in Q2 01,2 0.0% 13a 86.7%
Tennessee Employed in Q2 11,2 100.0% 33a 42.3%
Not employed in Q2 01,2 0.0% 45a 57.7%
Texas Employed in Q2 22a 52.4% 65a 43.0%
Not employed in Q2 20a 47.6% 86a 57.0%
Utah Employed in Q2 11,2 100.0% 8a 27.6%
Not employed in Q2 01,2 0.0% 21a 72.4%
Vermont Employed in Q2 01,2 0.0% 1a 20.0%
Not employed in Q2 01,2 0.0% 4a 80.0%
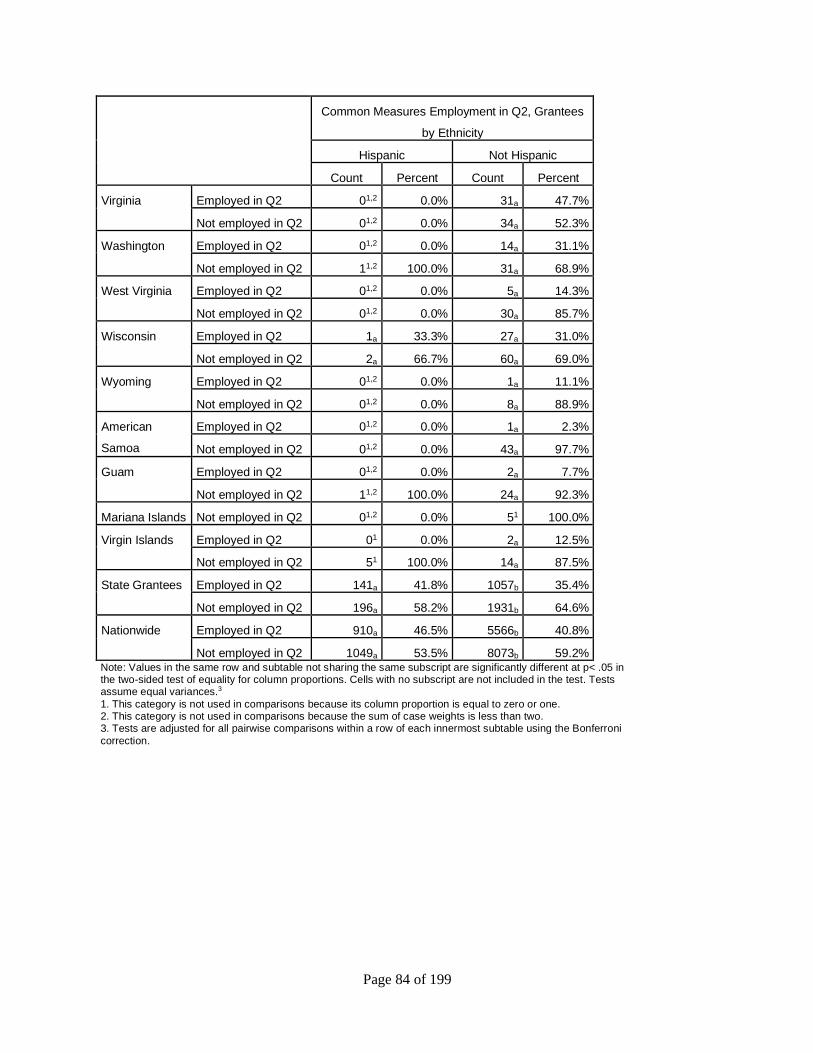
Page 84 of 199
Common Measures Employment in Q2, Grantees
by Ethnicity
Hispanic Not Hispanic
Count Percent Count Percent
Virginia Employed in Q2 01,2 0.0% 31a 47.7%
Not employed in Q2 01,2 0.0% 34a 52.3%
Washington Employed in Q2 01,2 0.0% 14a 31.1%
Not employed in Q2 11,2 100.0% 31a 68.9%
West Virginia Employed in Q2 01,2 0.0% 5a 14.3%
Not employed in Q2 01,2 0.0% 30a 85.7%
Wisconsin Employed in Q2 1a 33.3% 27a 31.0%
Not employed in Q2 2a 66.7% 60a 69.0%
Wyoming Employed in Q2 01,2 0.0% 1a 11.1%
Not employed in Q2 01,2 0.0% 8a 88.9%
American
Samoa
Employed in Q2 01,2 0.0% 1a 2.3%
Not employed in Q2 01,2 0.0% 43a 97.7%
Guam Employed in Q2 01,2 0.0% 2a 7.7%
Not employed in Q2 11,2 100.0% 24a 92.3%
Mariana Islands Not employed in Q2 01,2 0.0% 51 100.0%
Virgin Islands Employed in Q2 01 0.0% 2a 12.5%
Not employed in Q2 51 100.0% 14a 87.5%
State Grantees Employed in Q2 141a 41.8% 1057b 35.4%
Not employed in Q2 196a 58.2% 1931b 64.6%
Nationwide Employed in Q2 910a 46.5% 5566b 40.8%
Not employed in Q2 1049a 53.5% 8073b 59.2% Note: Values in the same row and subtable not sharing the same subscript are significantly different at p< .05 in the two-sided test of equality for column proportions. Cells with no subscript are not included in the test. Tests assume equal variances.3
1. This category is not used in comparisons because its column proportion is equal to zero or one. 2. This category is not used in comparisons because the sum of case weights is less than two. 3. Tests are adjusted for all pairwise comparisons within a row of each innermost subtable using the Bonferroni
correction.
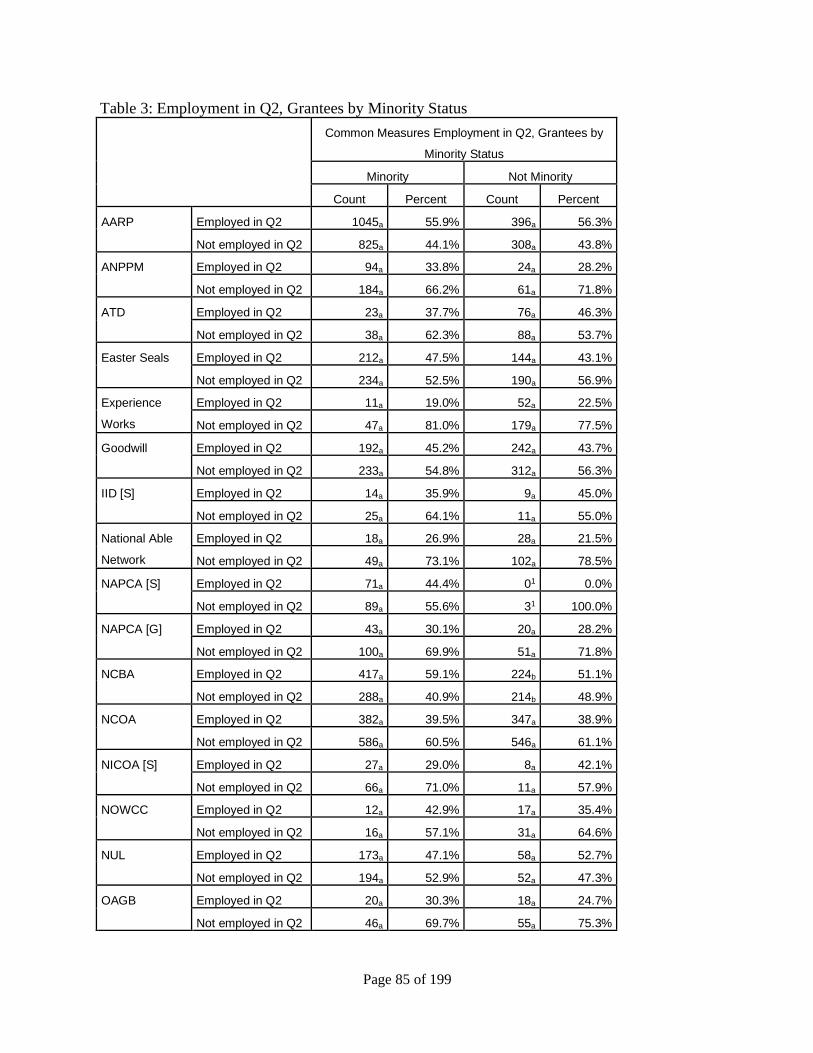
Page 85 of 199
Table 3: Employment in Q2, Grantees by Minority Status
Common Measures Employment in Q2, Grantees by
Minority Status
Minority Not Minority
Count Percent Count Percent
AARP Employed in Q2 1045a 55.9% 396a 56.3%
Not employed in Q2 825a 44.1% 308a 43.8%
ANPPM Employed in Q2 94a 33.8% 24a 28.2%
Not employed in Q2 184a 66.2% 61a 71.8%
ATD Employed in Q2 23a 37.7% 76a 46.3%
Not employed in Q2 38a 62.3% 88a 53.7%
Easter Seals Employed in Q2 212a 47.5% 144a 43.1%
Not employed in Q2 234a 52.5% 190a 56.9%
Experience
Works
Employed in Q2 11a 19.0% 52a 22.5%
Not employed in Q2 47a 81.0% 179a 77.5%
Goodwill Employed in Q2 192a 45.2% 242a 43.7%
Not employed in Q2 233a 54.8% 312a 56.3%
IID [S] Employed in Q2 14a 35.9% 9a 45.0%
Not employed in Q2 25a 64.1% 11a 55.0%
National Able
Network
Employed in Q2 18a 26.9% 28a 21.5%
Not employed in Q2 49a 73.1% 102a 78.5%
NAPCA [S] Employed in Q2 71a 44.4% 01 0.0%
Not employed in Q2 89a 55.6% 31 100.0%
NAPCA [G] Employed in Q2 43a 30.1% 20a 28.2%
Not employed in Q2 100a 69.9% 51a 71.8%
NCBA Employed in Q2 417a 59.1% 224b 51.1%
Not employed in Q2 288a 40.9% 214b 48.9%
NCOA Employed in Q2 382a 39.5% 347a 38.9%
Not employed in Q2 586a 60.5% 546a 61.1%
NICOA [S] Employed in Q2 27a 29.0% 8a 42.1%
Not employed in Q2 66a 71.0% 11a 57.9%
NOWCC Employed in Q2 12a 42.9% 17a 35.4%
Not employed in Q2 16a 57.1% 31a 64.6%
NUL Employed in Q2 173a 47.1% 58a 52.7%
Not employed in Q2 194a 52.9% 52a 47.3%
OAGB Employed in Q2 20a 30.3% 18a 24.7%
Not employed in Q2 46a 69.7% 55a 75.3%
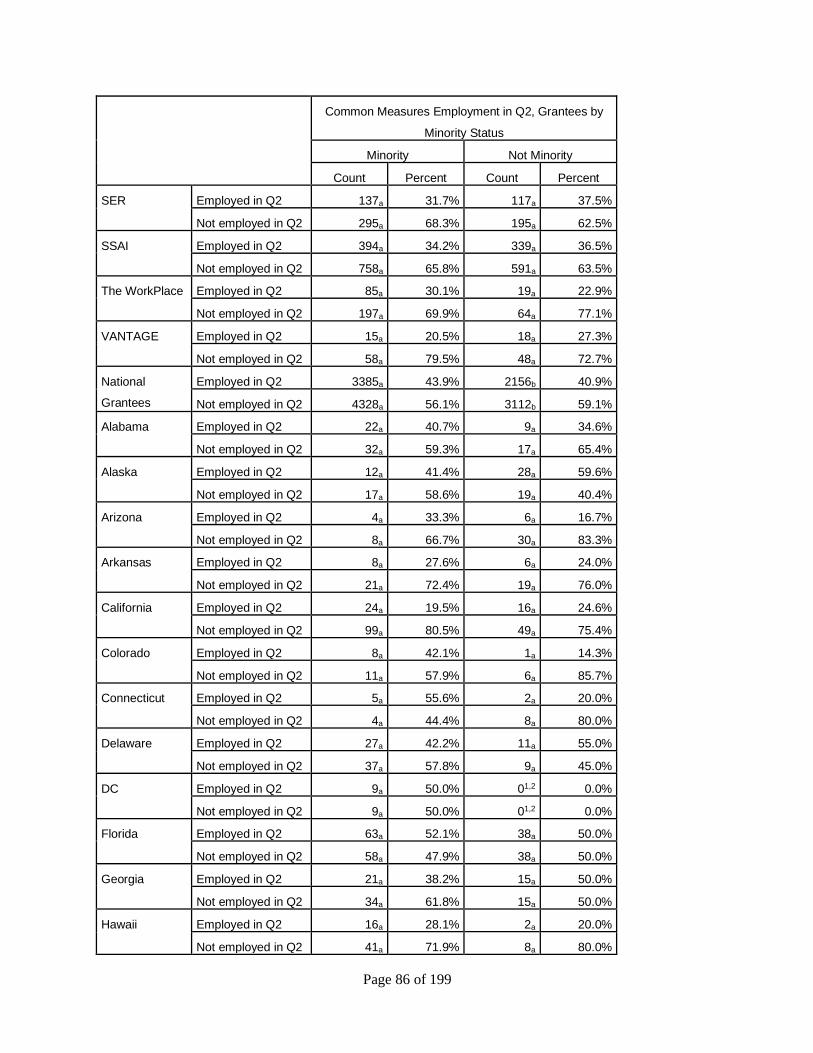
Page 86 of 199
Common Measures Employment in Q2, Grantees by
Minority Status
Minority Not Minority
Count Percent Count Percent
SER Employed in Q2 137a 31.7% 117a 37.5%
Not employed in Q2 295a 68.3% 195a 62.5%
SSAI Employed in Q2 394a 34.2% 339a 36.5%
Not employed in Q2 758a 65.8% 591a 63.5%
The WorkPlace Employed in Q2 85a 30.1% 19a 22.9%
Not employed in Q2 197a 69.9% 64a 77.1%
VANTAGE Employed in Q2 15a 20.5% 18a 27.3%
Not employed in Q2 58a 79.5% 48a 72.7%
National
Grantees
Employed in Q2 3385a 43.9% 2156b 40.9%
Not employed in Q2 4328a 56.1% 3112b 59.1%
Alabama Employed in Q2 22a 40.7% 9a 34.6%
Not employed in Q2 32a 59.3% 17a 65.4%
Alaska Employed in Q2 12a 41.4% 28a 59.6%
Not employed in Q2 17a 58.6% 19a 40.4%
Arizona Employed in Q2 4a 33.3% 6a 16.7%
Not employed in Q2 8a 66.7% 30a 83.3%
Arkansas Employed in Q2 8a 27.6% 6a 24.0%
Not employed in Q2 21a 72.4% 19a 76.0%
California Employed in Q2 24a 19.5% 16a 24.6%
Not employed in Q2 99a 80.5% 49a 75.4%
Colorado Employed in Q2 8a 42.1% 1a 14.3%
Not employed in Q2 11a 57.9% 6a 85.7%
Connecticut Employed in Q2 5a 55.6% 2a 20.0%
Not employed in Q2 4a 44.4% 8a 80.0%
Delaware Employed in Q2 27a 42.2% 11a 55.0%
Not employed in Q2 37a 57.8% 9a 45.0%
DC Employed in Q2 9a 50.0% 01,2 0.0%
Not employed in Q2 9a 50.0% 01,2 0.0%
Florida Employed in Q2 63a 52.1% 38a 50.0%
Not employed in Q2 58a 47.9% 38a 50.0%
Georgia Employed in Q2 21a 38.2% 15a 50.0%
Not employed in Q2 34a 61.8% 15a 50.0%
Hawaii Employed in Q2 16a 28.1% 2a 20.0%
Not employed in Q2 41a 71.9% 8a 80.0%
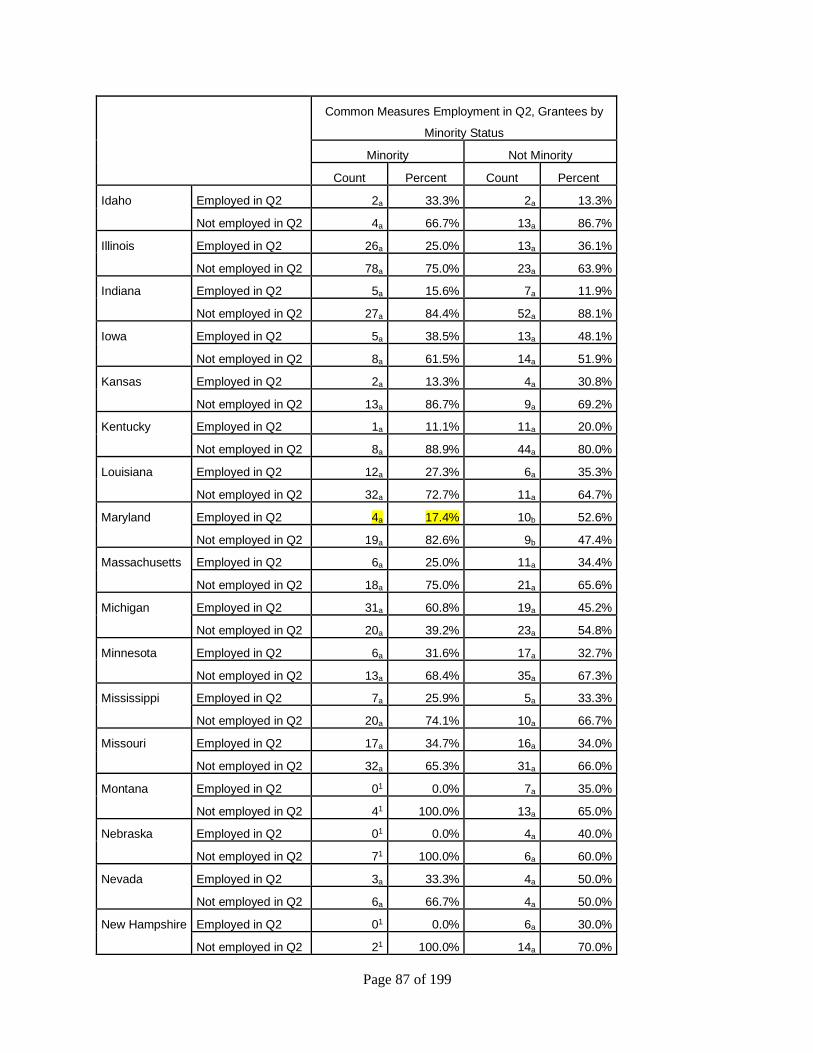
Page 87 of 199
Common Measures Employment in Q2, Grantees by
Minority Status
Minority Not Minority
Count Percent Count Percent
Idaho Employed in Q2 2a 33.3% 2a 13.3%
Not employed in Q2 4a 66.7% 13a 86.7%
Illinois Employed in Q2 26a 25.0% 13a 36.1%
Not employed in Q2 78a 75.0% 23a 63.9%
Indiana Employed in Q2 5a 15.6% 7a 11.9%
Not employed in Q2 27a 84.4% 52a 88.1%
Iowa Employed in Q2 5a 38.5% 13a 48.1%
Not employed in Q2 8a 61.5% 14a 51.9%
Kansas Employed in Q2 2a 13.3% 4a 30.8%
Not employed in Q2 13a 86.7% 9a 69.2%
Kentucky Employed in Q2 1a 11.1% 11a 20.0%
Not employed in Q2 8a 88.9% 44a 80.0%
Louisiana Employed in Q2 12a 27.3% 6a 35.3%
Not employed in Q2 32a 72.7% 11a 64.7%
Maryland Employed in Q2 4a 17.4% 10b 52.6%
Not employed in Q2 19a 82.6% 9b 47.4%
Massachusetts Employed in Q2 6a 25.0% 11a 34.4%
Not employed in Q2 18a 75.0% 21a 65.6%
Michigan Employed in Q2 31a 60.8% 19a 45.2%
Not employed in Q2 20a 39.2% 23a 54.8%
Minnesota Employed in Q2 6a 31.6% 17a 32.7%
Not employed in Q2 13a 68.4% 35a 67.3%
Mississippi Employed in Q2 7a 25.9% 5a 33.3%
Not employed in Q2 20a 74.1% 10a 66.7%
Missouri Employed in Q2 17a 34.7% 16a 34.0%
Not employed in Q2 32a 65.3% 31a 66.0%
Montana Employed in Q2 01 0.0% 7a 35.0%
Not employed in Q2 41 100.0% 13a 65.0%
Nebraska Employed in Q2 01 0.0% 4a 40.0%
Not employed in Q2 71 100.0% 6a 60.0%
Nevada Employed in Q2 3a 33.3% 4a 50.0%
Not employed in Q2 6a 66.7% 4a 50.0%
New Hampshire Employed in Q2 01 0.0% 6a 30.0%
Not employed in Q2 21 100.0% 14a 70.0%
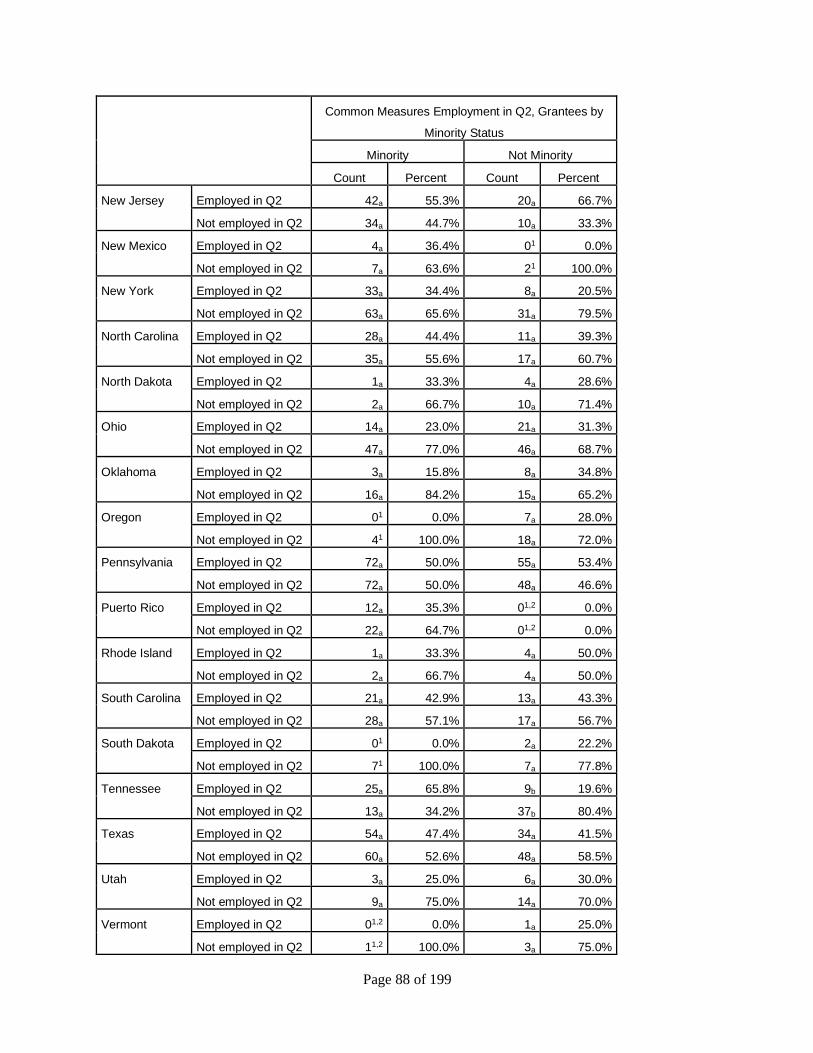
Page 88 of 199
Common Measures Employment in Q2, Grantees by
Minority Status
Minority Not Minority
Count Percent Count Percent
New Jersey Employed in Q2 42a 55.3% 20a 66.7%
Not employed in Q2 34a 44.7% 10a 33.3%
New Mexico Employed in Q2 4a 36.4% 01 0.0%
Not employed in Q2 7a 63.6% 21 100.0%
New York Employed in Q2 33a 34.4% 8a 20.5%
Not employed in Q2 63a 65.6% 31a 79.5%
North Carolina Employed in Q2 28a 44.4% 11a 39.3%
Not employed in Q2 35a 55.6% 17a 60.7%
North Dakota Employed in Q2 1a 33.3% 4a 28.6%
Not employed in Q2 2a 66.7% 10a 71.4%
Ohio Employed in Q2 14a 23.0% 21a 31.3%
Not employed in Q2 47a 77.0% 46a 68.7%
Oklahoma Employed in Q2 3a 15.8% 8a 34.8%
Not employed in Q2 16a 84.2% 15a 65.2%
Oregon Employed in Q2 01 0.0% 7a 28.0%
Not employed in Q2 41 100.0% 18a 72.0%
Pennsylvania Employed in Q2 72a 50.0% 55a 53.4%
Not employed in Q2 72a 50.0% 48a 46.6%
Puerto Rico Employed in Q2 12a 35.3% 01,2 0.0%
Not employed in Q2 22a 64.7% 01,2 0.0%
Rhode Island Employed in Q2 1a 33.3% 4a 50.0%
Not employed in Q2 2a 66.7% 4a 50.0%
South Carolina Employed in Q2 21a 42.9% 13a 43.3%
Not employed in Q2 28a 57.1% 17a 56.7%
South Dakota Employed in Q2 01 0.0% 2a 22.2%
Not employed in Q2 71 100.0% 7a 77.8%
Tennessee Employed in Q2 25a 65.8% 9b 19.6%
Not employed in Q2 13a 34.2% 37b 80.4%
Texas Employed in Q2 54a 47.4% 34a 41.5%
Not employed in Q2 60a 52.6% 48a 58.5%
Utah Employed in Q2 3a 25.0% 6a 30.0%
Not employed in Q2 9a 75.0% 14a 70.0%
Vermont Employed in Q2 01,2 0.0% 1a 25.0%
Not employed in Q2 11,2 100.0% 3a 75.0%
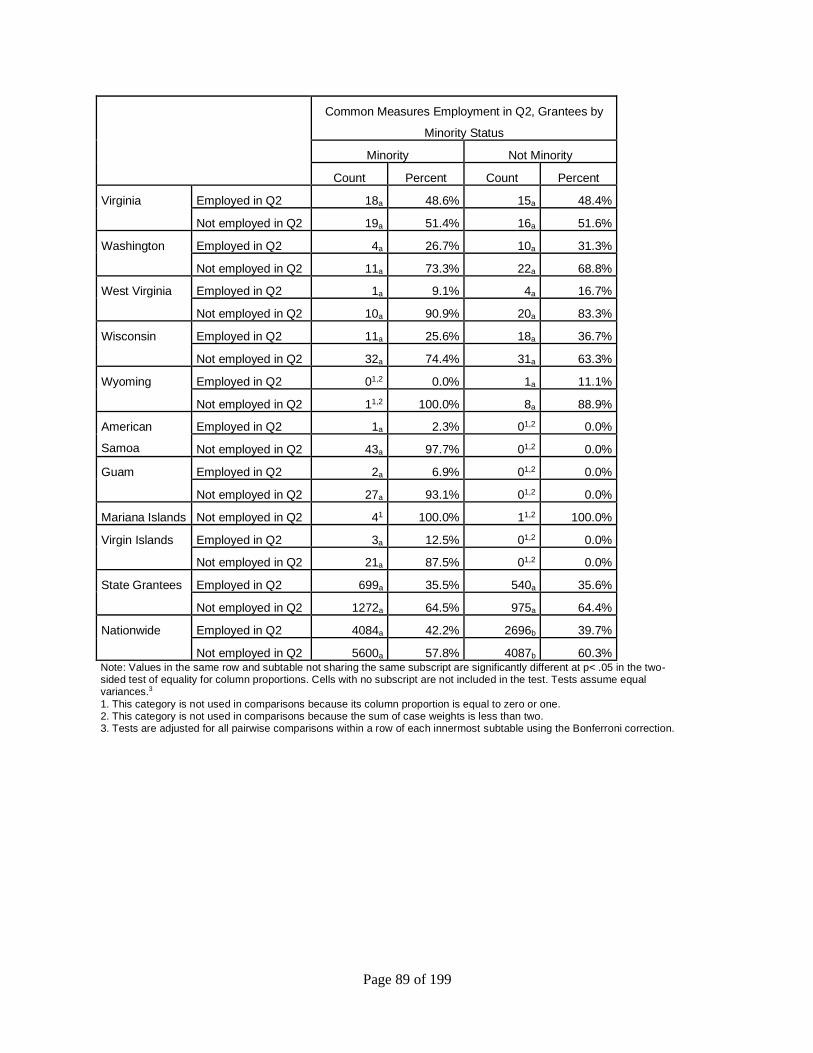
Page 89 of 199
Common Measures Employment in Q2, Grantees by
Minority Status
Minority Not Minority
Count Percent Count Percent
Virginia Employed in Q2 18a 48.6% 15a 48.4%
Not employed in Q2 19a 51.4% 16a 51.6%
Washington Employed in Q2 4a 26.7% 10a 31.3%
Not employed in Q2 11a 73.3% 22a 68.8%
West Virginia Employed in Q2 1a 9.1% 4a 16.7%
Not employed in Q2 10a 90.9% 20a 83.3%
Wisconsin Employed in Q2 11a 25.6% 18a 36.7%
Not employed in Q2 32a 74.4% 31a 63.3%
Wyoming Employed in Q2 01,2 0.0% 1a 11.1%
Not employed in Q2 11,2 100.0% 8a 88.9%
American
Samoa
Employed in Q2 1a 2.3% 01,2 0.0%
Not employed in Q2 43a 97.7% 01,2 0.0%
Guam Employed in Q2 2a 6.9% 01,2 0.0%
Not employed in Q2 27a 93.1% 01,2 0.0%
Mariana Islands Not employed in Q2 41 100.0% 11,2 100.0%
Virgin Islands Employed in Q2 3a 12.5% 01,2 0.0%
Not employed in Q2 21a 87.5% 01,2 0.0%
State Grantees Employed in Q2 699a 35.5% 540a 35.6%
Not employed in Q2 1272a 64.5% 975a 64.4%
Nationwide Employed in Q2 4084a 42.2% 2696b 39.7%
Not employed in Q2 5600a 57.8% 4087b 60.3% Note: Values in the same row and subtable not sharing the same subscript are significantly different at p< .05 in the two-sided test of equality for column proportions. Cells with no subscript are not included in the test. Tests assume equal variances.3
1. This category is not used in comparisons because its column proportion is equal to zero or one. 2. This category is not used in comparisons because the sum of case weights is less than two. 3. Tests are adjusted for all pairwise comparisons within a row of each innermost subtable using the Bonferroni correction.
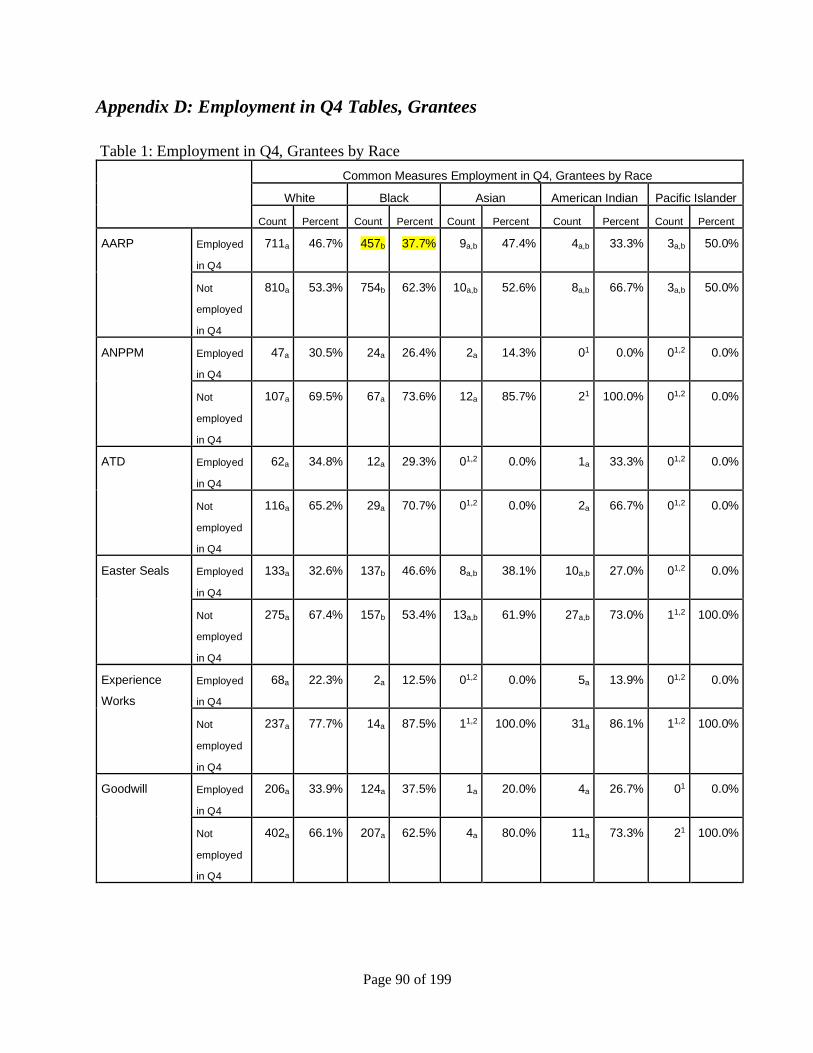
Page 90 of 199
Appendix D: Employment in Q4 Tables, Grantees
Table 1: Employment in Q4, Grantees by Race
Common Measures Employment in Q4, Grantees by Race
White Black Asian American Indian Pacific Islander
Count Percent Count Percent Count Percent Count Percent Count Percent
AARP Employed
in Q4
711a 46.7% 457b 37.7% 9a,b 47.4% 4a,b 33.3% 3a,b 50.0%
Not
employed
in Q4
810a 53.3% 754b 62.3% 10a,b 52.6% 8a,b 66.7% 3a,b 50.0%
ANPPM Employed
in Q4
47a 30.5% 24a 26.4% 2a 14.3% 01 0.0% 01,2 0.0%
Not
employed
in Q4
107a 69.5% 67a 73.6% 12a 85.7% 21 100.0% 01,2 0.0%
ATD Employed
in Q4
62a 34.8% 12a 29.3% 01,2 0.0% 1a 33.3% 01,2 0.0%
Not
employed
in Q4
116a 65.2% 29a 70.7% 01,2 0.0% 2a 66.7% 01,2 0.0%
Easter Seals Employed
in Q4
133a 32.6% 137b 46.6% 8a,b 38.1% 10a,b 27.0% 01,2 0.0%
Not
employed
in Q4
275a 67.4% 157b 53.4% 13a,b 61.9% 27a,b 73.0% 11,2 100.0%
Experience
Works
Employed
in Q4
68a 22.3% 2a 12.5% 01,2 0.0% 5a 13.9% 01,2 0.0%
Not
employed
in Q4
237a 77.7% 14a 87.5% 11,2 100.0% 31a 86.1% 11,2 100.0%
Goodwill Employed
in Q4
206a 33.9% 124a 37.5% 1a 20.0% 4a 26.7% 01 0.0%
Not
employed
in Q4
402a 66.1% 207a 62.5% 4a 80.0% 11a 73.3% 21 100.0%
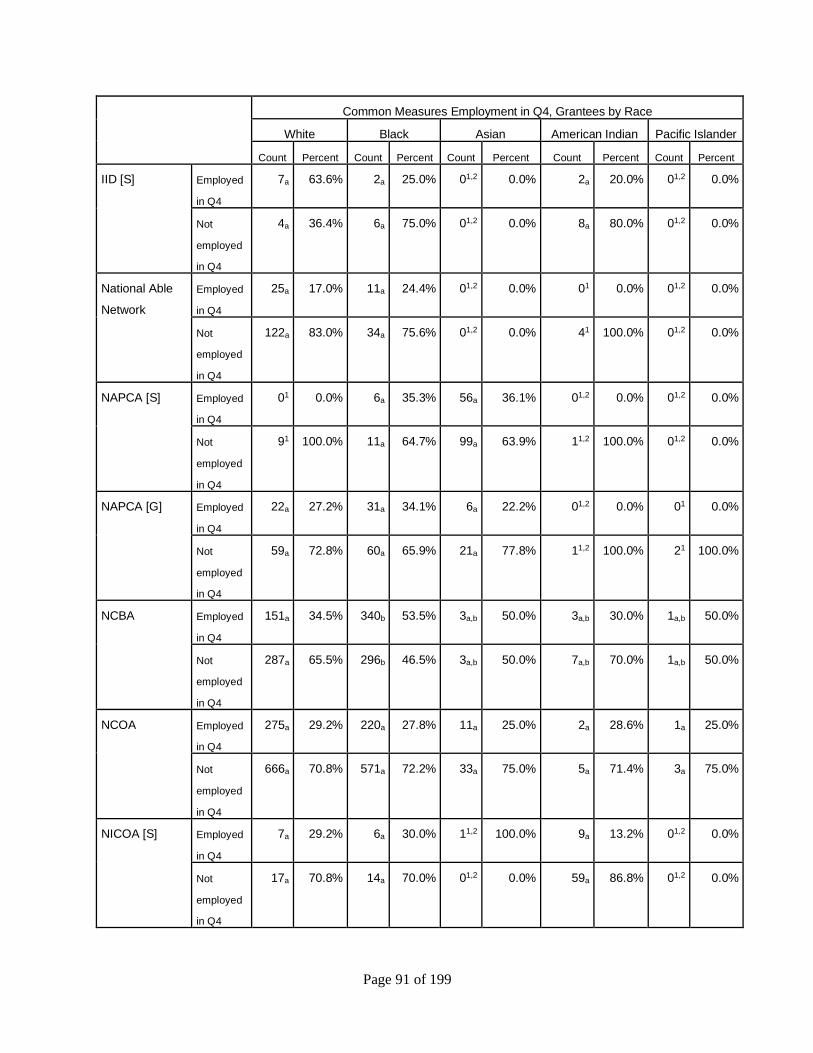
Page 91 of 199
Common Measures Employment in Q4, Grantees by Race
White Black Asian American Indian Pacific Islander
Count Percent Count Percent Count Percent Count Percent Count Percent
IID [S] Employed
in Q4
7a 63.6% 2a 25.0% 01,2 0.0% 2a 20.0% 01,2 0.0%
Not
employed
in Q4
4a 36.4% 6a 75.0% 01,2 0.0% 8a 80.0% 01,2 0.0%
National Able
Network
Employed
in Q4
25a 17.0% 11a 24.4% 01,2 0.0% 01 0.0% 01,2 0.0%
Not
employed
in Q4
122a 83.0% 34a 75.6% 01,2 0.0% 41 100.0% 01,2 0.0%
NAPCA [S] Employed
in Q4
01 0.0% 6a 35.3% 56a 36.1% 01,2 0.0% 01,2 0.0%
Not
employed
in Q4
91 100.0% 11a 64.7% 99a 63.9% 11,2 100.0% 01,2 0.0%
NAPCA [G] Employed
in Q4
22a 27.2% 31a 34.1% 6a 22.2% 01,2 0.0% 01 0.0%
Not
employed
in Q4
59a 72.8% 60a 65.9% 21a 77.8% 11,2 100.0% 21 100.0%
NCBA Employed
in Q4
151a 34.5% 340b 53.5% 3a,b 50.0% 3a,b 30.0% 1a,b 50.0%
Not
employed
in Q4
287a 65.5% 296b 46.5% 3a,b 50.0% 7a,b 70.0% 1a,b 50.0%
NCOA Employed
in Q4
275a 29.2% 220a 27.8% 11a 25.0% 2a 28.6% 1a 25.0%
Not
employed
in Q4
666a 70.8% 571a 72.2% 33a 75.0% 5a 71.4% 3a 75.0%
NICOA [S] Employed
in Q4
7a 29.2% 6a 30.0% 11,2 100.0% 9a 13.2% 01,2 0.0%
Not
employed
in Q4
17a 70.8% 14a 70.0% 01,2 0.0% 59a 86.8% 01,2 0.0%
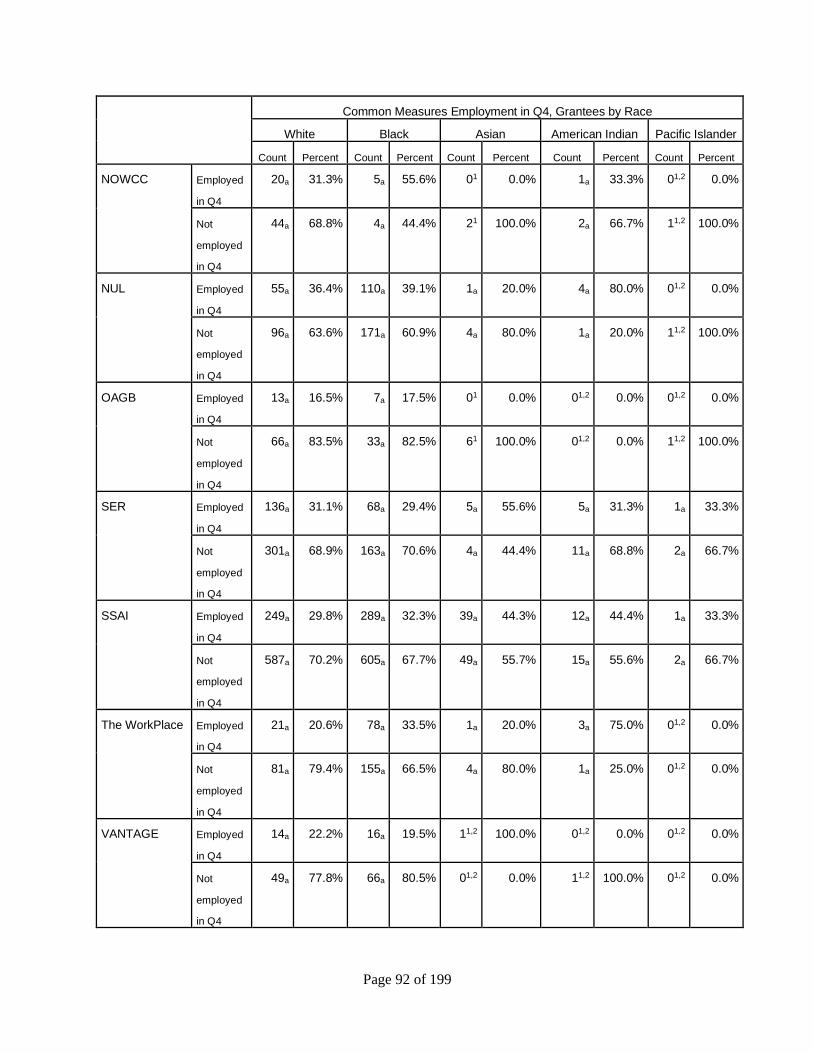
Page 92 of 199
Common Measures Employment in Q4, Grantees by Race
White Black Asian American Indian Pacific Islander
Count Percent Count Percent Count Percent Count Percent Count Percent
NOWCC Employed
in Q4
20a 31.3% 5a 55.6% 01 0.0% 1a 33.3% 01,2 0.0%
Not
employed
in Q4
44a 68.8% 4a 44.4% 21 100.0% 2a 66.7% 11,2 100.0%
NUL Employed
in Q4
55a 36.4% 110a 39.1% 1a 20.0% 4a 80.0% 01,2 0.0%
Not
employed
in Q4
96a 63.6% 171a 60.9% 4a 80.0% 1a 20.0% 11,2 100.0%
OAGB Employed
in Q4
13a 16.5% 7a 17.5% 01 0.0% 01,2 0.0% 01,2 0.0%
Not
employed
in Q4
66a 83.5% 33a 82.5% 61 100.0% 01,2 0.0% 11,2 100.0%
SER Employed
in Q4
136a 31.1% 68a 29.4% 5a 55.6% 5a 31.3% 1a 33.3%
Not
employed
in Q4
301a 68.9% 163a 70.6% 4a 44.4% 11a 68.8% 2a 66.7%
SSAI Employed
in Q4
249a 29.8% 289a 32.3% 39a 44.3% 12a 44.4% 1a 33.3%
Not
employed
in Q4
587a 70.2% 605a 67.7% 49a 55.7% 15a 55.6% 2a 66.7%
The WorkPlace Employed
in Q4
21a 20.6% 78a 33.5% 1a 20.0% 3a 75.0% 01,2 0.0%
Not
employed
in Q4
81a 79.4% 155a 66.5% 4a 80.0% 1a 25.0% 01,2 0.0%
VANTAGE Employed
in Q4
14a 22.2% 16a 19.5% 11,2 100.0% 01,2 0.0% 01,2 0.0%
Not
employed
in Q4
49a 77.8% 66a 80.5% 01,2 0.0% 11,2 100.0% 01,2 0.0%
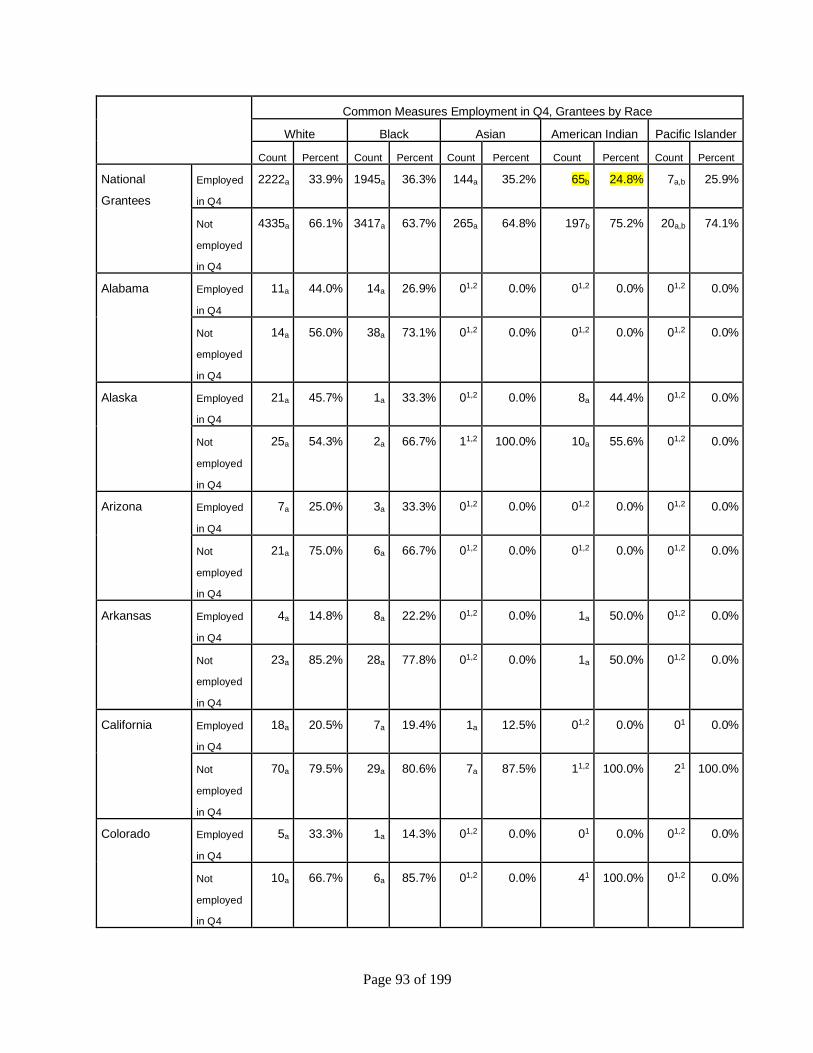
Page 93 of 199
Common Measures Employment in Q4, Grantees by Race
White Black Asian American Indian Pacific Islander
Count Percent Count Percent Count Percent Count Percent Count Percent
National
Grantees
Employed
in Q4
2222a 33.9% 1945a 36.3% 144a 35.2% 65b 24.8% 7a,b 25.9%
Not
employed
in Q4
4335a 66.1% 3417a 63.7% 265a 64.8% 197b 75.2% 20a,b 74.1%
Alabama Employed
in Q4
11a 44.0% 14a 26.9% 01,2 0.0% 01,2 0.0% 01,2 0.0%
Not
employed
in Q4
14a 56.0% 38a 73.1% 01,2 0.0% 01,2 0.0% 01,2 0.0%
Alaska Employed
in Q4
21a 45.7% 1a 33.3% 01,2 0.0% 8a 44.4% 01,2 0.0%
Not
employed
in Q4
25a 54.3% 2a 66.7% 11,2 100.0% 10a 55.6% 01,2 0.0%
Arizona Employed
in Q4
7a 25.0% 3a 33.3% 01,2 0.0% 01,2 0.0% 01,2 0.0%
Not
employed
in Q4
21a 75.0% 6a 66.7% 01,2 0.0% 01,2 0.0% 01,2 0.0%
Arkansas Employed
in Q4
4a 14.8% 8a 22.2% 01,2 0.0% 1a 50.0% 01,2 0.0%
Not
employed
in Q4
23a 85.2% 28a 77.8% 01,2 0.0% 1a 50.0% 01,2 0.0%
California Employed
in Q4
18a 20.5% 7a 19.4% 1a 12.5% 01,2 0.0% 01 0.0%
Not
employed
in Q4
70a 79.5% 29a 80.6% 7a 87.5% 11,2 100.0% 21 100.0%
Colorado Employed
in Q4
5a 33.3% 1a 14.3% 01,2 0.0% 01 0.0% 01,2 0.0%
Not
employed
in Q4
10a 66.7% 6a 85.7% 01,2 0.0% 41 100.0% 01,2 0.0%
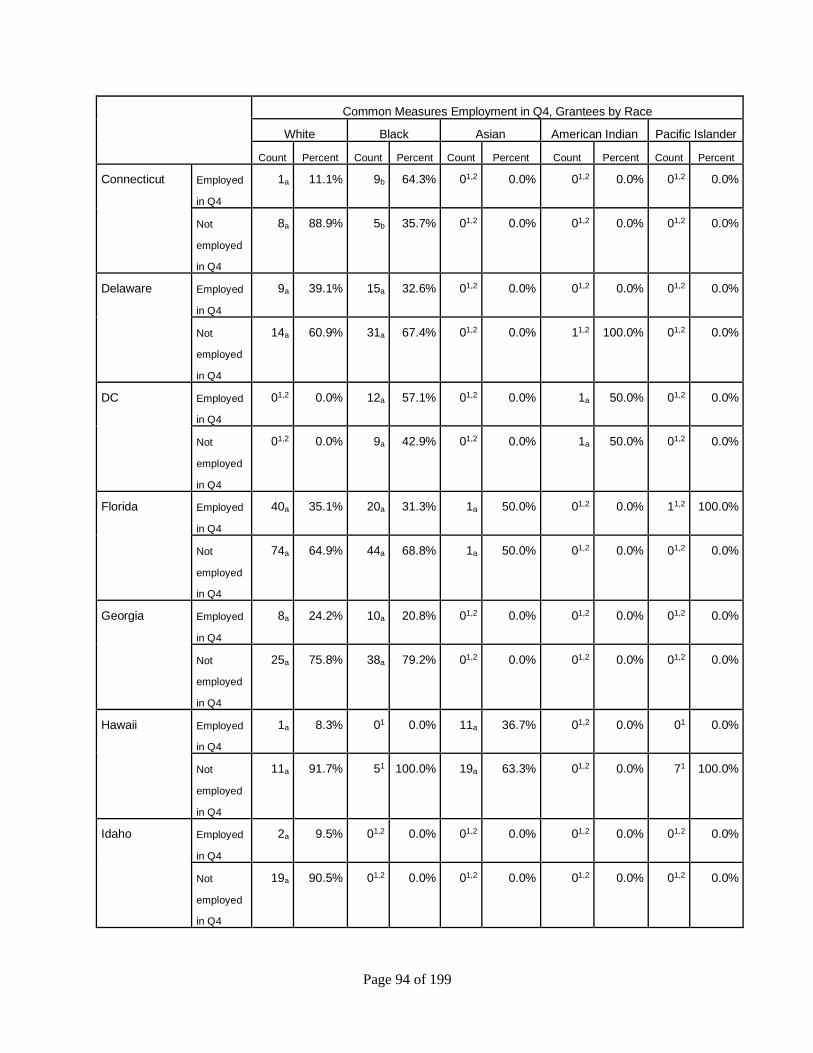
Page 94 of 199
Common Measures Employment in Q4, Grantees by Race
White Black Asian American Indian Pacific Islander
Count Percent Count Percent Count Percent Count Percent Count Percent
Connecticut Employed
in Q4
1a 11.1% 9b 64.3% 01,2 0.0% 01,2 0.0% 01,2 0.0%
Not
employed
in Q4
8a 88.9% 5b 35.7% 01,2 0.0% 01,2 0.0% 01,2 0.0%
Delaware Employed
in Q4
9a 39.1% 15a 32.6% 01,2 0.0% 01,2 0.0% 01,2 0.0%
Not
employed
in Q4
14a 60.9% 31a 67.4% 01,2 0.0% 11,2 100.0% 01,2 0.0%
DC Employed
in Q4
01,2 0.0% 12a 57.1% 01,2 0.0% 1a 50.0% 01,2 0.0%
Not
employed
in Q4
01,2 0.0% 9a 42.9% 01,2 0.0% 1a 50.0% 01,2 0.0%
Florida Employed
in Q4
40a 35.1% 20a 31.3% 1a 50.0% 01,2 0.0% 11,2 100.0%
Not
employed
in Q4
74a 64.9% 44a 68.8% 1a 50.0% 01,2 0.0% 01,2 0.0%
Georgia Employed
in Q4
8a 24.2% 10a 20.8% 01,2 0.0% 01,2 0.0% 01,2 0.0%
Not
employed
in Q4
25a 75.8% 38a 79.2% 01,2 0.0% 01,2 0.0% 01,2 0.0%
Hawaii Employed
in Q4
1a 8.3% 01 0.0% 11a 36.7% 01,2 0.0% 01 0.0%
Not
employed
in Q4
11a 91.7% 51 100.0% 19a 63.3% 01,2 0.0% 71 100.0%
Idaho Employed
in Q4
2a 9.5% 01,2 0.0% 01,2 0.0% 01,2 0.0% 01,2 0.0%
Not
employed
in Q4
19a 90.5% 01,2 0.0% 01,2 0.0% 01,2 0.0% 01,2 0.0%
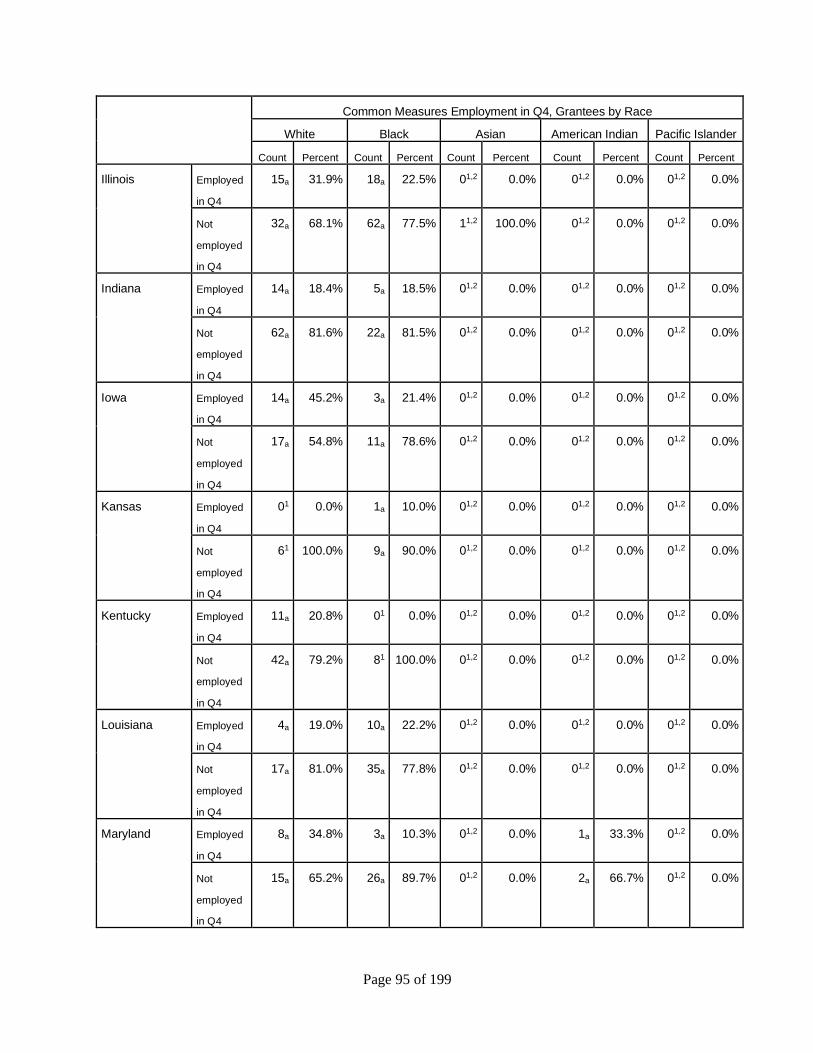
Page 95 of 199
Common Measures Employment in Q4, Grantees by Race
White Black Asian American Indian Pacific Islander
Count Percent Count Percent Count Percent Count Percent Count Percent
Illinois Employed
in Q4
15a 31.9% 18a 22.5% 01,2 0.0% 01,2 0.0% 01,2 0.0%
Not
employed
in Q4
32a 68.1% 62a 77.5% 11,2 100.0% 01,2 0.0% 01,2 0.0%
Indiana Employed
in Q4
14a 18.4% 5a 18.5% 01,2 0.0% 01,2 0.0% 01,2 0.0%
Not
employed
in Q4
62a 81.6% 22a 81.5% 01,2 0.0% 01,2 0.0% 01,2 0.0%
Iowa Employed
in Q4
14a 45.2% 3a 21.4% 01,2 0.0% 01,2 0.0% 01,2 0.0%
Not
employed
in Q4
17a 54.8% 11a 78.6% 01,2 0.0% 01,2 0.0% 01,2 0.0%
Kansas Employed
in Q4
01 0.0% 1a 10.0% 01,2 0.0% 01,2 0.0% 01,2 0.0%
Not
employed
in Q4
61 100.0% 9a 90.0% 01,2 0.0% 01,2 0.0% 01,2 0.0%
Kentucky Employed
in Q4
11a 20.8% 01 0.0% 01,2 0.0% 01,2 0.0% 01,2 0.0%
Not
employed
in Q4
42a 79.2% 81 100.0% 01,2 0.0% 01,2 0.0% 01,2 0.0%
Louisiana Employed
in Q4
4a 19.0% 10a 22.2% 01,2 0.0% 01,2 0.0% 01,2 0.0%
Not
employed
in Q4
17a 81.0% 35a 77.8% 01,2 0.0% 01,2 0.0% 01,2 0.0%
Maryland Employed
in Q4
8a 34.8% 3a 10.3% 01,2 0.0% 1a 33.3% 01,2 0.0%
Not
employed
in Q4
15a 65.2% 26a 89.7% 01,2 0.0% 2a 66.7% 01,2 0.0%
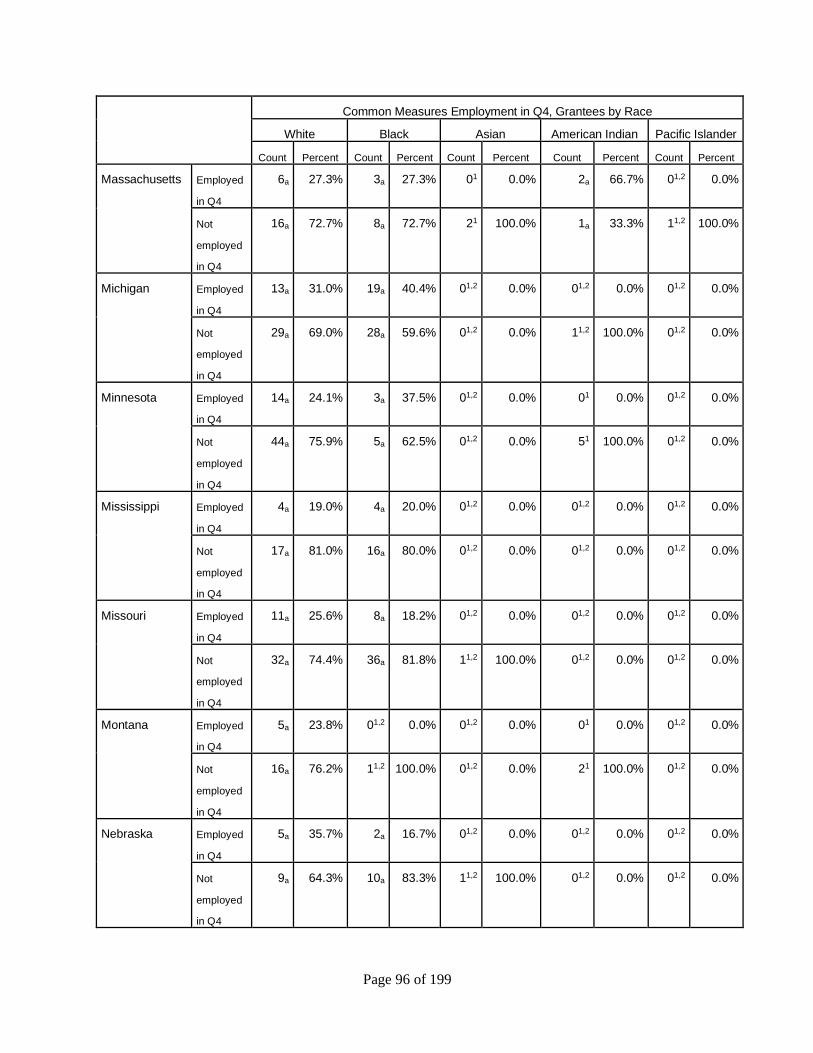
Page 96 of 199
Common Measures Employment in Q4, Grantees by Race
White Black Asian American Indian Pacific Islander
Count Percent Count Percent Count Percent Count Percent Count Percent
Massachusetts Employed
in Q4
6a 27.3% 3a 27.3% 01 0.0% 2a 66.7% 01,2 0.0%
Not
employed
in Q4
16a 72.7% 8a 72.7% 21 100.0% 1a 33.3% 11,2 100.0%
Michigan Employed
in Q4
13a 31.0% 19a 40.4% 01,2 0.0% 01,2 0.0% 01,2 0.0%
Not
employed
in Q4
29a 69.0% 28a 59.6% 01,2 0.0% 11,2 100.0% 01,2 0.0%
Minnesota Employed
in Q4
14a 24.1% 3a 37.5% 01,2 0.0% 01 0.0% 01,2 0.0%
Not
employed
in Q4
44a 75.9% 5a 62.5% 01,2 0.0% 51 100.0% 01,2 0.0%
Mississippi Employed
in Q4
4a 19.0% 4a 20.0% 01,2 0.0% 01,2 0.0% 01,2 0.0%
Not
employed
in Q4
17a 81.0% 16a 80.0% 01,2 0.0% 01,2 0.0% 01,2 0.0%
Missouri Employed
in Q4
11a 25.6% 8a 18.2% 01,2 0.0% 01,2 0.0% 01,2 0.0%
Not
employed
in Q4
32a 74.4% 36a 81.8% 11,2 100.0% 01,2 0.0% 01,2 0.0%
Montana Employed
in Q4
5a 23.8% 01,2 0.0% 01,2 0.0% 01 0.0% 01,2 0.0%
Not
employed
in Q4
16a 76.2% 11,2 100.0% 01,2 0.0% 21 100.0% 01,2 0.0%
Nebraska Employed
in Q4
5a 35.7% 2a 16.7% 01,2 0.0% 01,2 0.0% 01,2 0.0%
Not
employed
in Q4
9a 64.3% 10a 83.3% 11,2 100.0% 01,2 0.0% 01,2 0.0%
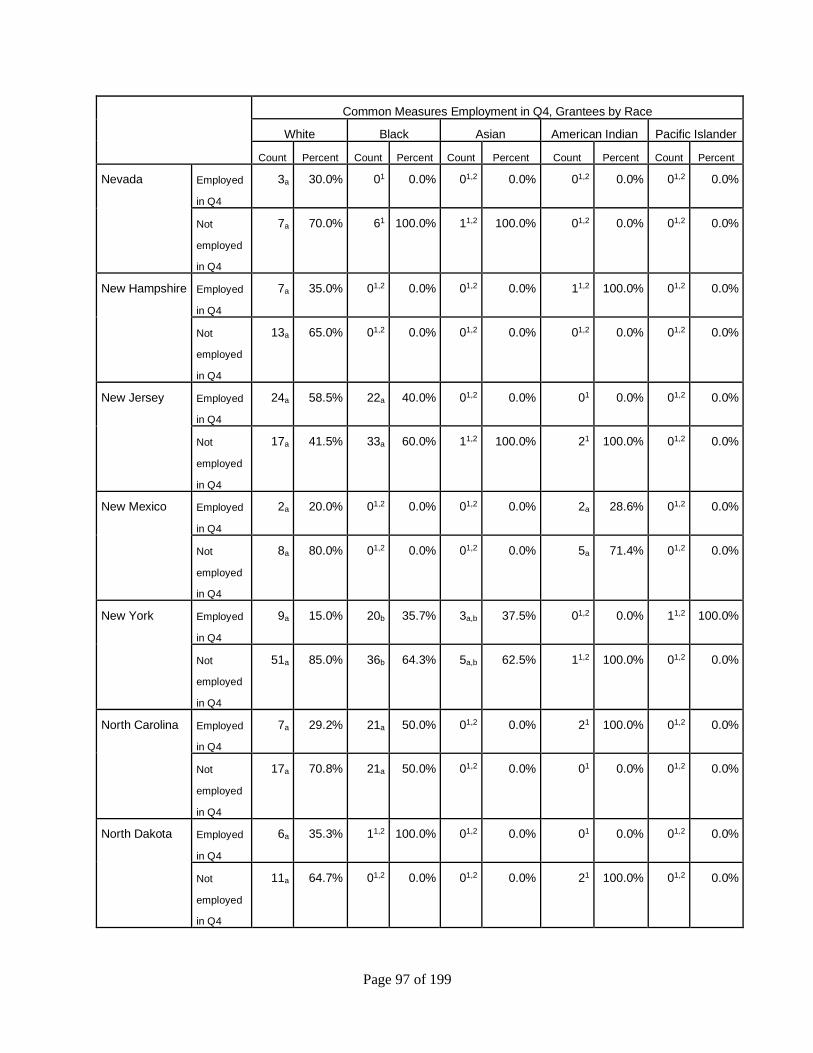
Page 97 of 199
Common Measures Employment in Q4, Grantees by Race
White Black Asian American Indian Pacific Islander
Count Percent Count Percent Count Percent Count Percent Count Percent
Nevada Employed
in Q4
3a 30.0% 01 0.0% 01,2 0.0% 01,2 0.0% 01,2 0.0%
Not
employed
in Q4
7a 70.0% 61 100.0% 11,2 100.0% 01,2 0.0% 01,2 0.0%
New Hampshire Employed
in Q4
7a 35.0% 01,2 0.0% 01,2 0.0% 11,2 100.0% 01,2 0.0%
Not
employed
in Q4
13a 65.0% 01,2 0.0% 01,2 0.0% 01,2 0.0% 01,2 0.0%
New Jersey Employed
in Q4
24a 58.5% 22a 40.0% 01,2 0.0% 01 0.0% 01,2 0.0%
Not
employed
in Q4
17a 41.5% 33a 60.0% 11,2 100.0% 21 100.0% 01,2 0.0%
New Mexico Employed
in Q4
2a 20.0% 01,2 0.0% 01,2 0.0% 2a 28.6% 01,2 0.0%
Not
employed
in Q4
8a 80.0% 01,2 0.0% 01,2 0.0% 5a 71.4% 01,2 0.0%
New York Employed
in Q4
9a 15.0% 20b 35.7% 3a,b 37.5% 01,2 0.0% 11,2 100.0%
Not
employed
in Q4
51a 85.0% 36b 64.3% 5a,b 62.5% 11,2 100.0% 01,2 0.0%
North Carolina Employed
in Q4
7a 29.2% 21a 50.0% 01,2 0.0% 21 100.0% 01,2 0.0%
Not
employed
in Q4
17a 70.8% 21a 50.0% 01,2 0.0% 01 0.0% 01,2 0.0%
North Dakota Employed
in Q4
6a 35.3% 11,2 100.0% 01,2 0.0% 01 0.0% 01,2 0.0%
Not
employed
in Q4
11a 64.7% 01,2 0.0% 01,2 0.0% 21 100.0% 01,2 0.0%
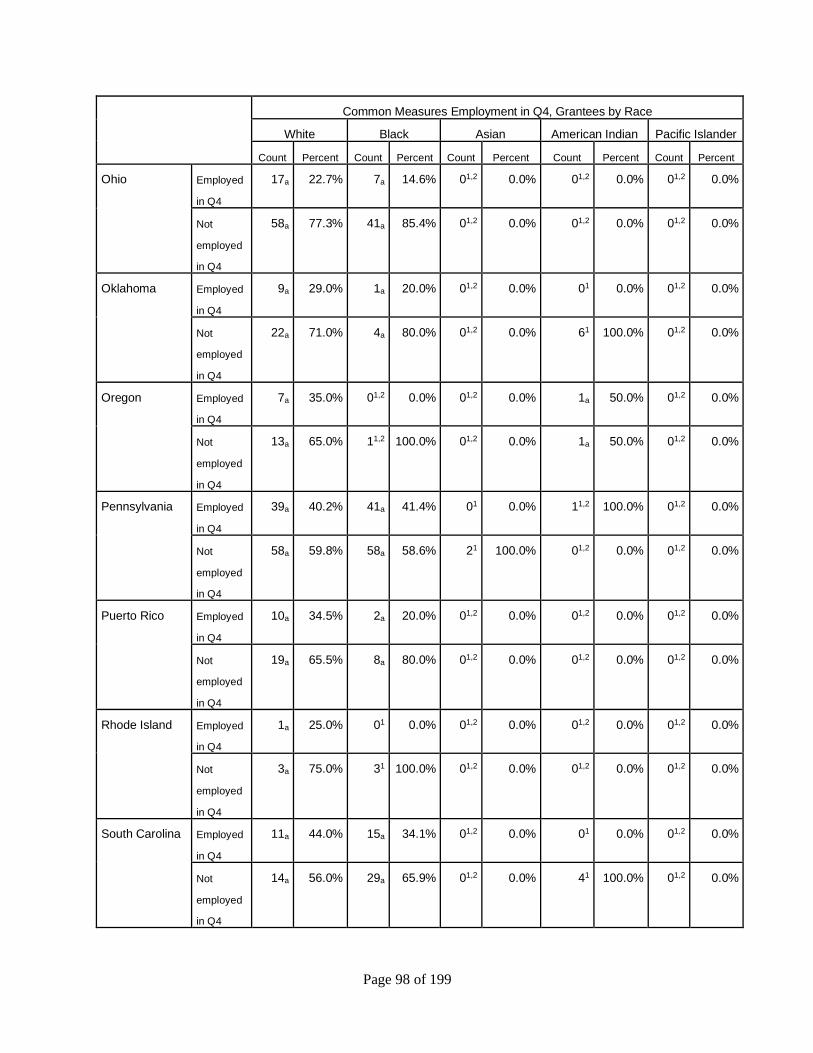
Page 98 of 199
Common Measures Employment in Q4, Grantees by Race
White Black Asian American Indian Pacific Islander
Count Percent Count Percent Count Percent Count Percent Count Percent
Ohio Employed
in Q4
17a 22.7% 7a 14.6% 01,2 0.0% 01,2 0.0% 01,2 0.0%
Not
employed
in Q4
58a 77.3% 41a 85.4% 01,2 0.0% 01,2 0.0% 01,2 0.0%
Oklahoma Employed
in Q4
9a 29.0% 1a 20.0% 01,2 0.0% 01 0.0% 01,2 0.0%
Not
employed
in Q4
22a 71.0% 4a 80.0% 01,2 0.0% 61 100.0% 01,2 0.0%
Oregon Employed
in Q4
7a 35.0% 01,2 0.0% 01,2 0.0% 1a 50.0% 01,2 0.0%
Not
employed
in Q4
13a 65.0% 11,2 100.0% 01,2 0.0% 1a 50.0% 01,2 0.0%
Pennsylvania Employed
in Q4
39a 40.2% 41a 41.4% 01 0.0% 11,2 100.0% 01,2 0.0%
Not
employed
in Q4
58a 59.8% 58a 58.6% 21 100.0% 01,2 0.0% 01,2 0.0%
Puerto Rico Employed
in Q4
10a 34.5% 2a 20.0% 01,2 0.0% 01,2 0.0% 01,2 0.0%
Not
employed
in Q4
19a 65.5% 8a 80.0% 01,2 0.0% 01,2 0.0% 01,2 0.0%
Rhode Island Employed
in Q4
1a 25.0% 01 0.0% 01,2 0.0% 01,2 0.0% 01,2 0.0%
Not
employed
in Q4
3a 75.0% 31 100.0% 01,2 0.0% 01,2 0.0% 01,2 0.0%
South Carolina Employed
in Q4
11a 44.0% 15a 34.1% 01,2 0.0% 01 0.0% 01,2 0.0%
Not
employed
in Q4
14a 56.0% 29a 65.9% 01,2 0.0% 41 100.0% 01,2 0.0%
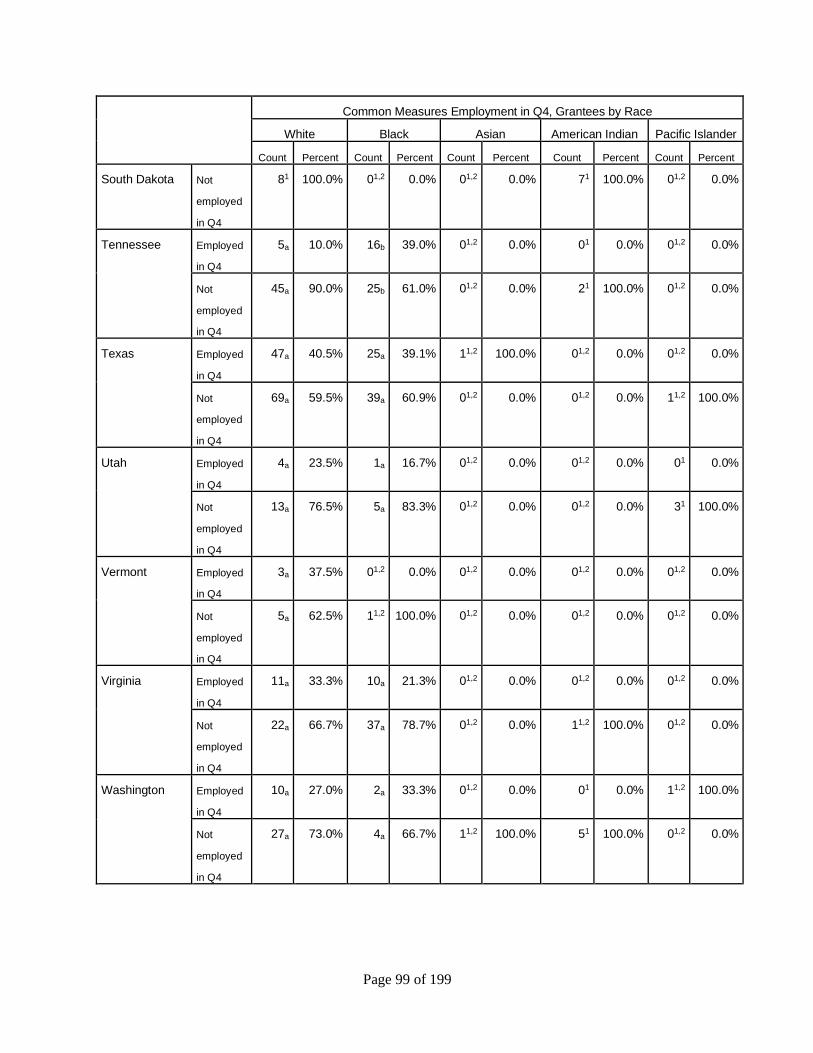
Page 99 of 199
Common Measures Employment in Q4, Grantees by Race
White Black Asian American Indian Pacific Islander
Count Percent Count Percent Count Percent Count Percent Count Percent
South Dakota Not
employed
in Q4
81 100.0% 01,2 0.0% 01,2 0.0% 71 100.0% 01,2 0.0%
Tennessee Employed
in Q4
5a 10.0% 16b 39.0% 01,2 0.0% 01 0.0% 01,2 0.0%
Not
employed
in Q4
45a 90.0% 25b 61.0% 01,2 0.0% 21 100.0% 01,2 0.0%
Texas Employed
in Q4
47a 40.5% 25a 39.1% 11,2 100.0% 01,2 0.0% 01,2 0.0%
Not
employed
in Q4
69a 59.5% 39a 60.9% 01,2 0.0% 01,2 0.0% 11,2 100.0%
Utah Employed
in Q4
4a 23.5% 1a 16.7% 01,2 0.0% 01,2 0.0% 01 0.0%
Not
employed
in Q4
13a 76.5% 5a 83.3% 01,2 0.0% 01,2 0.0% 31 100.0%
Vermont Employed
in Q4
3a 37.5% 01,2 0.0% 01,2 0.0% 01,2 0.0% 01,2 0.0%
Not
employed
in Q4
5a 62.5% 11,2 100.0% 01,2 0.0% 01,2 0.0% 01,2 0.0%
Virginia Employed
in Q4
11a 33.3% 10a 21.3% 01,2 0.0% 01,2 0.0% 01,2 0.0%
Not
employed
in Q4
22a 66.7% 37a 78.7% 01,2 0.0% 11,2 100.0% 01,2 0.0%
Washington Employed
in Q4
10a 27.0% 2a 33.3% 01,2 0.0% 01 0.0% 11,2 100.0%
Not
employed
in Q4
27a 73.0% 4a 66.7% 11,2 100.0% 51 100.0% 01,2 0.0%
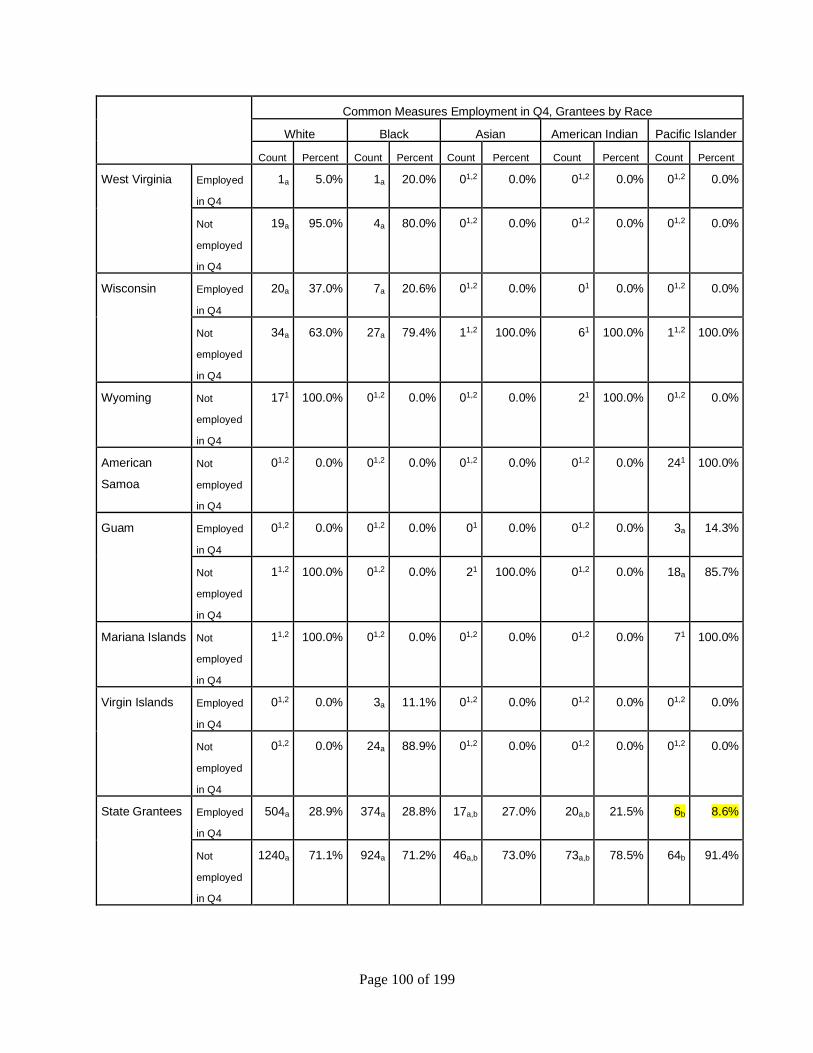
Page 100 of 199
Common Measures Employment in Q4, Grantees by Race
White Black Asian American Indian Pacific Islander
Count Percent Count Percent Count Percent Count Percent Count Percent
West Virginia Employed
in Q4
1a 5.0% 1a 20.0% 01,2 0.0% 01,2 0.0% 01,2 0.0%
Not
employed
in Q4
19a 95.0% 4a 80.0% 01,2 0.0% 01,2 0.0% 01,2 0.0%
Wisconsin Employed
in Q4
20a 37.0% 7a 20.6% 01,2 0.0% 01 0.0% 01,2 0.0%
Not
employed
in Q4
34a 63.0% 27a 79.4% 11,2 100.0% 61 100.0% 11,2 100.0%
Wyoming Not
employed
in Q4
171 100.0% 01,2 0.0% 01,2 0.0% 21 100.0% 01,2 0.0%
American
Samoa
Not
employed
in Q4
01,2 0.0% 01,2 0.0% 01,2 0.0% 01,2 0.0% 241 100.0%
Guam Employed
in Q4
01,2 0.0% 01,2 0.0% 01 0.0% 01,2 0.0% 3a 14.3%
Not
employed
in Q4
11,2 100.0% 01,2 0.0% 21 100.0% 01,2 0.0% 18a 85.7%
Mariana Islands Not
employed
in Q4
11,2 100.0% 01,2 0.0% 01,2 0.0% 01,2 0.0% 71 100.0%
Virgin Islands Employed
in Q4
01,2 0.0% 3a 11.1% 01,2 0.0% 01,2 0.0% 01,2 0.0%
Not
employed
in Q4
01,2 0.0% 24a 88.9% 01,2 0.0% 01,2 0.0% 01,2 0.0%
State Grantees Employed
in Q4
504a 28.9% 374a 28.8% 17a,b 27.0% 20a,b 21.5% 6b 8.6%
Not
employed
in Q4
1240a 71.1% 924a 71.2% 46a,b 73.0% 73a,b 78.5% 64b 91.4%
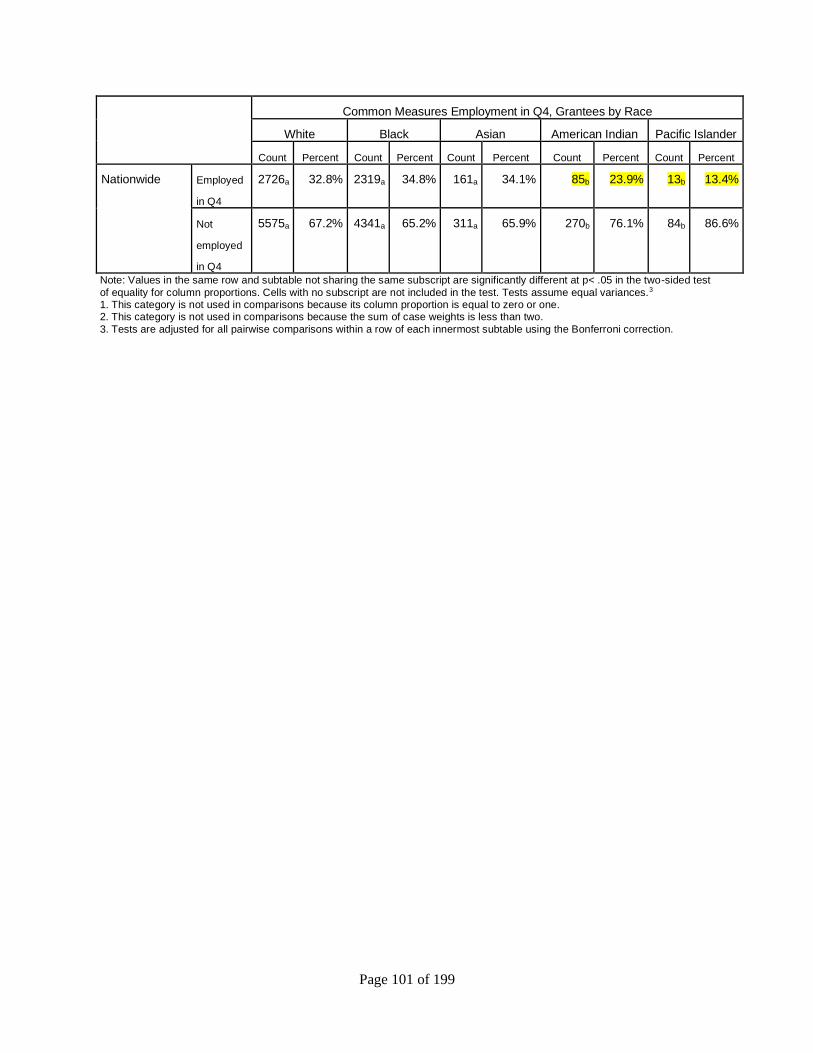
Page 101 of 199
Common Measures Employment in Q4, Grantees by Race
White Black Asian American Indian Pacific Islander
Count Percent Count Percent Count Percent Count Percent Count Percent
Nationwide Employed
in Q4
2726a 32.8% 2319a 34.8% 161a 34.1% 85b 23.9% 13b 13.4%
Not
employed
in Q4
5575a 67.2% 4341a 65.2% 311a 65.9% 270b 76.1% 84b 86.6%
Note: Values in the same row and subtable not sharing the same subscript are significantly different at p< .05 in the two-sided test
of equality for column proportions. Cells with no subscript are not included in the test. Tests assume equal variances.3 1. This category is not used in comparisons because its column proportion is equal to zero or one. 2. This category is not used in comparisons because the sum of case weights is less than two.
3. Tests are adjusted for all pairwise comparisons within a row of each innermost subtable using the Bonferroni correction.
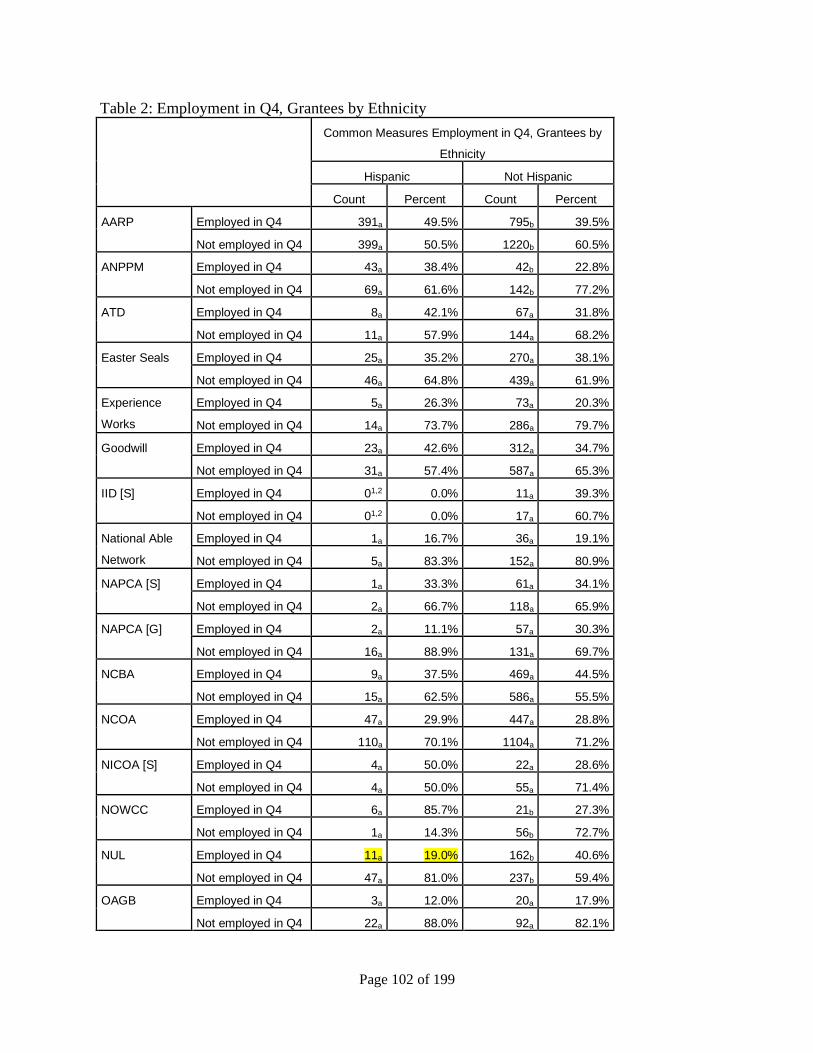
Page 102 of 199
Table 2: Employment in Q4, Grantees by Ethnicity
Common Measures Employment in Q4, Grantees by
Ethnicity
Hispanic Not Hispanic
Count Percent Count Percent
AARP Employed in Q4 391a 49.5% 795b 39.5%
Not employed in Q4 399a 50.5% 1220b 60.5%
ANPPM Employed in Q4 43a 38.4% 42b 22.8%
Not employed in Q4 69a 61.6% 142b 77.2%
ATD Employed in Q4 8a 42.1% 67a 31.8%
Not employed in Q4 11a 57.9% 144a 68.2%
Easter Seals Employed in Q4 25a 35.2% 270a 38.1%
Not employed in Q4 46a 64.8% 439a 61.9%
Experience
Works
Employed in Q4 5a 26.3% 73a 20.3%
Not employed in Q4 14a 73.7% 286a 79.7%
Goodwill Employed in Q4 23a 42.6% 312a 34.7%
Not employed in Q4 31a 57.4% 587a 65.3%
IID [S] Employed in Q4 01,2 0.0% 11a 39.3%
Not employed in Q4 01,2 0.0% 17a 60.7%
National Able
Network
Employed in Q4 1a 16.7% 36a 19.1%
Not employed in Q4 5a 83.3% 152a 80.9%
NAPCA [S] Employed in Q4 1a 33.3% 61a 34.1%
Not employed in Q4 2a 66.7% 118a 65.9%
NAPCA [G] Employed in Q4 2a 11.1% 57a 30.3%
Not employed in Q4 16a 88.9% 131a 69.7%
NCBA Employed in Q4 9a 37.5% 469a 44.5%
Not employed in Q4 15a 62.5% 586a 55.5%
NCOA Employed in Q4 47a 29.9% 447a 28.8%
Not employed in Q4 110a 70.1% 1104a 71.2%
NICOA [S] Employed in Q4 4a 50.0% 22a 28.6%
Not employed in Q4 4a 50.0% 55a 71.4%
NOWCC Employed in Q4 6a 85.7% 21b 27.3%
Not employed in Q4 1a 14.3% 56b 72.7%
NUL Employed in Q4 11a 19.0% 162b 40.6%
Not employed in Q4 47a 81.0% 237b 59.4%
OAGB Employed in Q4 3a 12.0% 20a 17.9%
Not employed in Q4 22a 88.0% 92a 82.1%
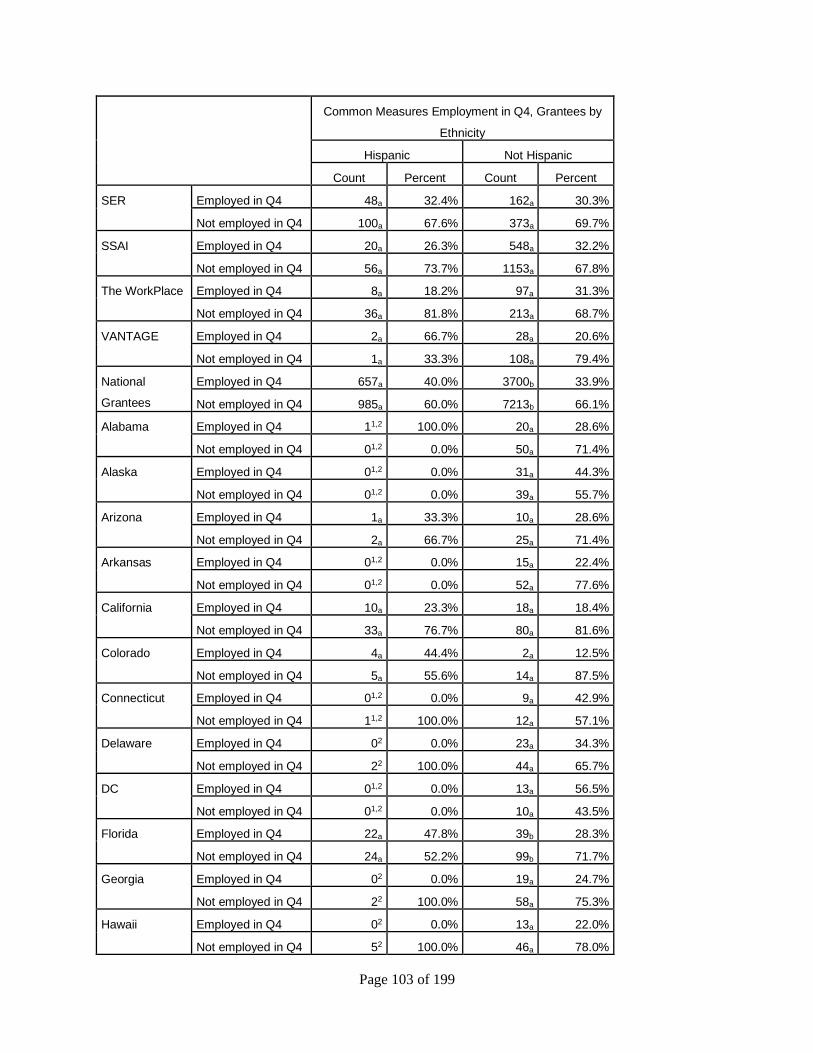
Page 103 of 199
Common Measures Employment in Q4, Grantees by
Ethnicity
Hispanic Not Hispanic
Count Percent Count Percent
SER Employed in Q4 48a 32.4% 162a 30.3%
Not employed in Q4 100a 67.6% 373a 69.7%
SSAI Employed in Q4 20a 26.3% 548a 32.2%
Not employed in Q4 56a 73.7% 1153a 67.8%
The WorkPlace Employed in Q4 8a 18.2% 97a 31.3%
Not employed in Q4 36a 81.8% 213a 68.7%
VANTAGE Employed in Q4 2a 66.7% 28a 20.6%
Not employed in Q4 1a 33.3% 108a 79.4%
National
Grantees
Employed in Q4 657a 40.0% 3700b 33.9%
Not employed in Q4 985a 60.0% 7213b 66.1%
Alabama Employed in Q4 11,2 100.0% 20a 28.6%
Not employed in Q4 01,2 0.0% 50a 71.4%
Alaska Employed in Q4 01,2 0.0% 31a 44.3%
Not employed in Q4 01,2 0.0% 39a 55.7%
Arizona Employed in Q4 1a 33.3% 10a 28.6%
Not employed in Q4 2a 66.7% 25a 71.4%
Arkansas Employed in Q4 01,2 0.0% 15a 22.4%
Not employed in Q4 01,2 0.0% 52a 77.6%
California Employed in Q4 10a 23.3% 18a 18.4%
Not employed in Q4 33a 76.7% 80a 81.6%
Colorado Employed in Q4 4a 44.4% 2a 12.5%
Not employed in Q4 5a 55.6% 14a 87.5%
Connecticut Employed in Q4 01,2 0.0% 9a 42.9%
Not employed in Q4 11,2 100.0% 12a 57.1%
Delaware Employed in Q4 02 0.0% 23a 34.3%
Not employed in Q4 22 100.0% 44a 65.7%
DC Employed in Q4 01,2 0.0% 13a 56.5%
Not employed in Q4 01,2 0.0% 10a 43.5%
Florida Employed in Q4 22a 47.8% 39b 28.3%
Not employed in Q4 24a 52.2% 99b 71.7%
Georgia Employed in Q4 02 0.0% 19a 24.7%
Not employed in Q4 22 100.0% 58a 75.3%
Hawaii Employed in Q4 02 0.0% 13a 22.0%
Not employed in Q4 52 100.0% 46a 78.0%
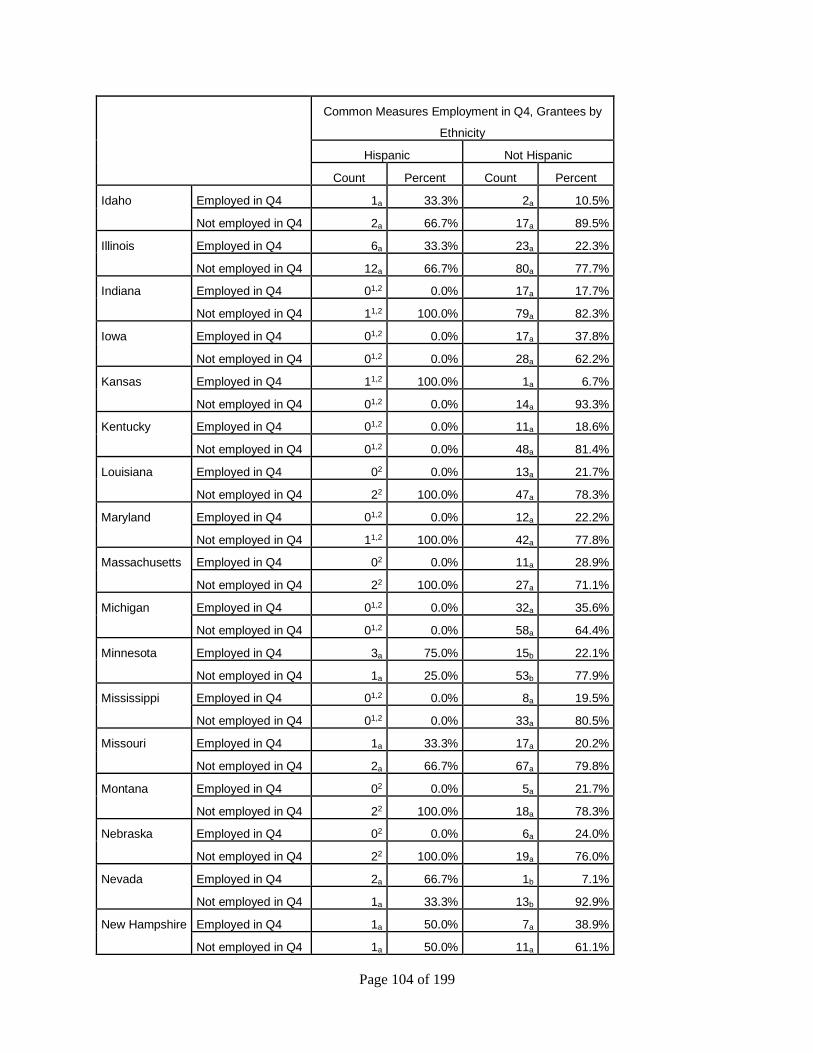
Page 104 of 199
Common Measures Employment in Q4, Grantees by
Ethnicity
Hispanic Not Hispanic
Count Percent Count Percent
Idaho Employed in Q4 1a 33.3% 2a 10.5%
Not employed in Q4 2a 66.7% 17a 89.5%
Illinois Employed in Q4 6a 33.3% 23a 22.3%
Not employed in Q4 12a 66.7% 80a 77.7%
Indiana Employed in Q4 01,2 0.0% 17a 17.7%
Not employed in Q4 11,2 100.0% 79a 82.3%
Iowa Employed in Q4 01,2 0.0% 17a 37.8%
Not employed in Q4 01,2 0.0% 28a 62.2%
Kansas Employed in Q4 11,2 100.0% 1a 6.7%
Not employed in Q4 01,2 0.0% 14a 93.3%
Kentucky Employed in Q4 01,2 0.0% 11a 18.6%
Not employed in Q4 01,2 0.0% 48a 81.4%
Louisiana Employed in Q4 02 0.0% 13a 21.7%
Not employed in Q4 22 100.0% 47a 78.3%
Maryland Employed in Q4 01,2 0.0% 12a 22.2%
Not employed in Q4 11,2 100.0% 42a 77.8%
Massachusetts Employed in Q4 02 0.0% 11a 28.9%
Not employed in Q4 22 100.0% 27a 71.1%
Michigan Employed in Q4 01,2 0.0% 32a 35.6%
Not employed in Q4 01,2 0.0% 58a 64.4%
Minnesota Employed in Q4 3a 75.0% 15b 22.1%
Not employed in Q4 1a 25.0% 53b 77.9%
Mississippi Employed in Q4 01,2 0.0% 8a 19.5%
Not employed in Q4 01,2 0.0% 33a 80.5%
Missouri Employed in Q4 1a 33.3% 17a 20.2%
Not employed in Q4 2a 66.7% 67a 79.8%
Montana Employed in Q4 02 0.0% 5a 21.7%
Not employed in Q4 22 100.0% 18a 78.3%
Nebraska Employed in Q4 02 0.0% 6a 24.0%
Not employed in Q4 22 100.0% 19a 76.0%
Nevada Employed in Q4 2a 66.7% 1b 7.1%
Not employed in Q4 1a 33.3% 13b 92.9%
New Hampshire Employed in Q4 1a 50.0% 7a 38.9%
Not employed in Q4 1a 50.0% 11a 61.1%
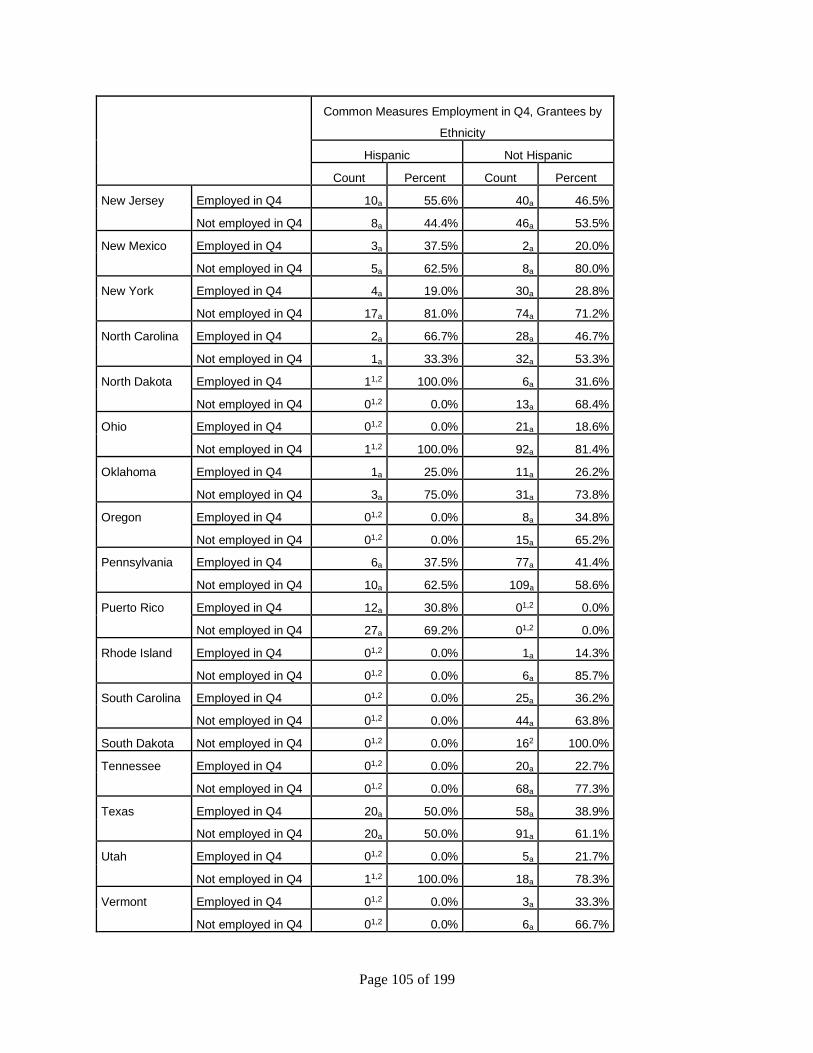
Page 105 of 199
Common Measures Employment in Q4, Grantees by
Ethnicity
Hispanic Not Hispanic
Count Percent Count Percent
New Jersey Employed in Q4 10a 55.6% 40a 46.5%
Not employed in Q4 8a 44.4% 46a 53.5%
New Mexico Employed in Q4 3a 37.5% 2a 20.0%
Not employed in Q4 5a 62.5% 8a 80.0%
New York Employed in Q4 4a 19.0% 30a 28.8%
Not employed in Q4 17a 81.0% 74a 71.2%
North Carolina Employed in Q4 2a 66.7% 28a 46.7%
Not employed in Q4 1a 33.3% 32a 53.3%
North Dakota Employed in Q4 11,2 100.0% 6a 31.6%
Not employed in Q4 01,2 0.0% 13a 68.4%
Ohio Employed in Q4 01,2 0.0% 21a 18.6%
Not employed in Q4 11,2 100.0% 92a 81.4%
Oklahoma Employed in Q4 1a 25.0% 11a 26.2%
Not employed in Q4 3a 75.0% 31a 73.8%
Oregon Employed in Q4 01,2 0.0% 8a 34.8%
Not employed in Q4 01,2 0.0% 15a 65.2%
Pennsylvania Employed in Q4 6a 37.5% 77a 41.4%
Not employed in Q4 10a 62.5% 109a 58.6%
Puerto Rico Employed in Q4 12a 30.8% 01,2 0.0%
Not employed in Q4 27a 69.2% 01,2 0.0%
Rhode Island Employed in Q4 01,2 0.0% 1a 14.3%
Not employed in Q4 01,2 0.0% 6a 85.7%
South Carolina Employed in Q4 01,2 0.0% 25a 36.2%
Not employed in Q4 01,2 0.0% 44a 63.8%
South Dakota Not employed in Q4 01,2 0.0% 162 100.0%
Tennessee Employed in Q4 01,2 0.0% 20a 22.7%
Not employed in Q4 01,2 0.0% 68a 77.3%
Texas Employed in Q4 20a 50.0% 58a 38.9%
Not employed in Q4 20a 50.0% 91a 61.1%
Utah Employed in Q4 01,2 0.0% 5a 21.7%
Not employed in Q4 11,2 100.0% 18a 78.3%
Vermont Employed in Q4 01,2 0.0% 3a 33.3%
Not employed in Q4 01,2 0.0% 6a 66.7%
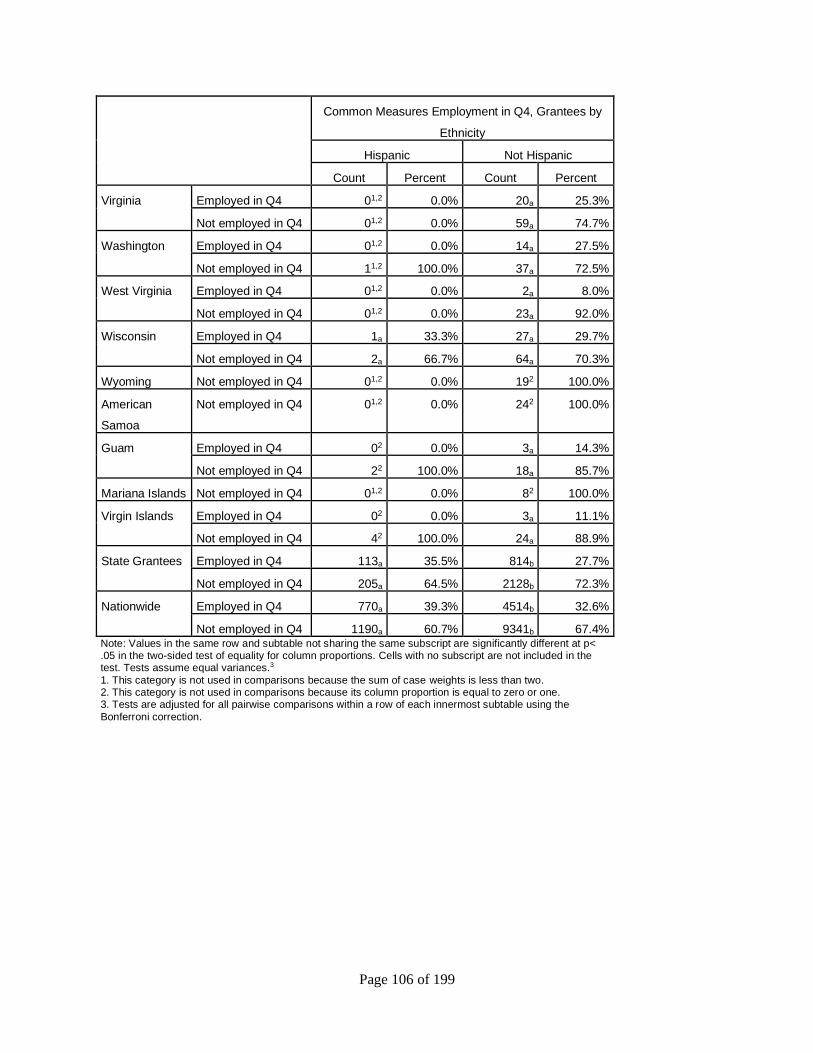
Page 106 of 199
Common Measures Employment in Q4, Grantees by
Ethnicity
Hispanic Not Hispanic
Count Percent Count Percent
Virginia Employed in Q4 01,2 0.0% 20a 25.3%
Not employed in Q4 01,2 0.0% 59a 74.7%
Washington Employed in Q4 01,2 0.0% 14a 27.5%
Not employed in Q4 11,2 100.0% 37a 72.5%
West Virginia Employed in Q4 01,2 0.0% 2a 8.0%
Not employed in Q4 01,2 0.0% 23a 92.0%
Wisconsin Employed in Q4 1a 33.3% 27a 29.7%
Not employed in Q4 2a 66.7% 64a 70.3%
Wyoming Not employed in Q4 01,2 0.0% 192 100.0%
American
Samoa
Not employed in Q4 01,2 0.0% 242 100.0%
Guam Employed in Q4 02 0.0% 3a 14.3%
Not employed in Q4 22 100.0% 18a 85.7%
Mariana Islands Not employed in Q4 01,2 0.0% 82 100.0%
Virgin Islands Employed in Q4 02 0.0% 3a 11.1%
Not employed in Q4 42 100.0% 24a 88.9%
State Grantees Employed in Q4 113a 35.5% 814b 27.7%
Not employed in Q4 205a 64.5% 2128b 72.3%
Nationwide Employed in Q4 770a 39.3% 4514b 32.6%
Not employed in Q4 1190a 60.7% 9341b 67.4% Note: Values in the same row and subtable not sharing the same subscript are significantly different at p< .05 in the two-sided test of equality for column proportions. Cells with no subscript are not included in the test. Tests assume equal variances.3
1. This category is not used in comparisons because the sum of case weights is less than two. 2. This category is not used in comparisons because its column proportion is equal to zero or one. 3. Tests are adjusted for all pairwise comparisons within a row of each innermost subtable using the
Bonferroni correction.
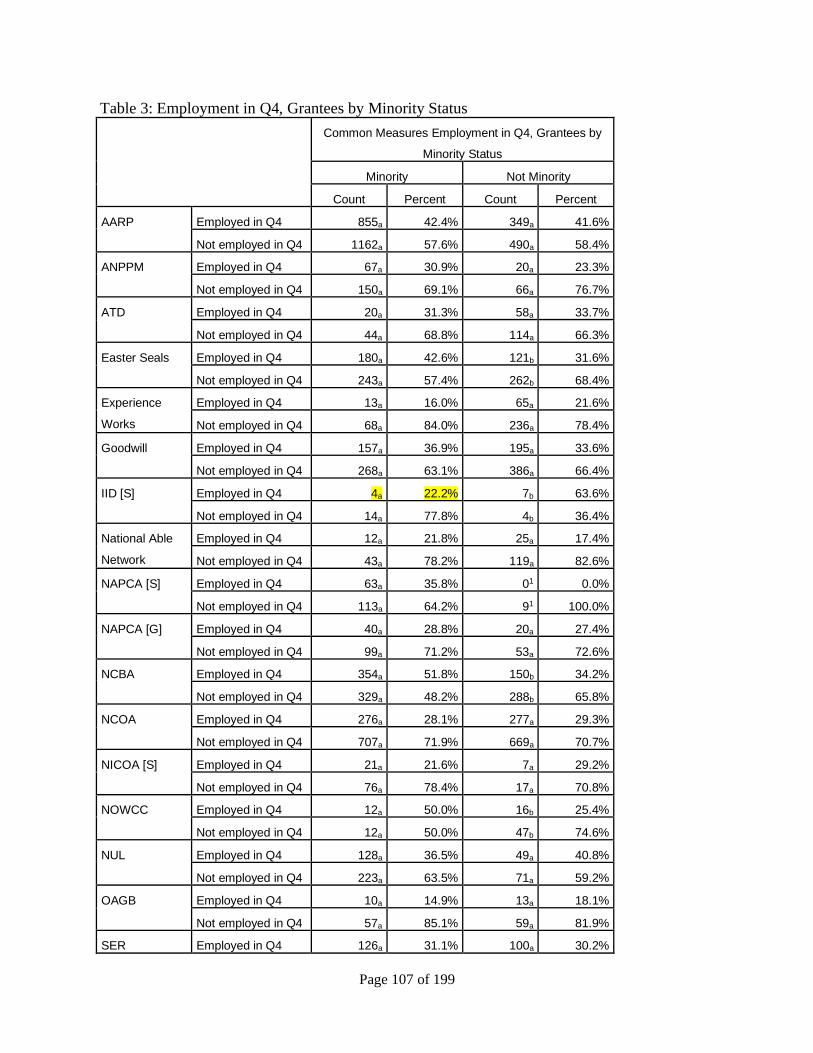
Page 107 of 199
Table 3: Employment in Q4, Grantees by Minority Status
Common Measures Employment in Q4, Grantees by
Minority Status
Minority Not Minority
Count Percent Count Percent
AARP Employed in Q4 855a 42.4% 349a 41.6%
Not employed in Q4 1162a 57.6% 490a 58.4%
ANPPM Employed in Q4 67a 30.9% 20a 23.3%
Not employed in Q4 150a 69.1% 66a 76.7%
ATD Employed in Q4 20a 31.3% 58a 33.7%
Not employed in Q4 44a 68.8% 114a 66.3%
Easter Seals Employed in Q4 180a 42.6% 121b 31.6%
Not employed in Q4 243a 57.4% 262b 68.4%
Experience
Works
Employed in Q4 13a 16.0% 65a 21.6%
Not employed in Q4 68a 84.0% 236a 78.4%
Goodwill Employed in Q4 157a 36.9% 195a 33.6%
Not employed in Q4 268a 63.1% 386a 66.4%
IID [S] Employed in Q4 4a 22.2% 7b 63.6%
Not employed in Q4 14a 77.8% 4b 36.4%
National Able
Network
Employed in Q4 12a 21.8% 25a 17.4%
Not employed in Q4 43a 78.2% 119a 82.6%
NAPCA [S] Employed in Q4 63a 35.8% 01 0.0%
Not employed in Q4 113a 64.2% 91 100.0%
NAPCA [G] Employed in Q4 40a 28.8% 20a 27.4%
Not employed in Q4 99a 71.2% 53a 72.6%
NCBA Employed in Q4 354a 51.8% 150b 34.2%
Not employed in Q4 329a 48.2% 288b 65.8%
NCOA Employed in Q4 276a 28.1% 277a 29.3%
Not employed in Q4 707a 71.9% 669a 70.7%
NICOA [S] Employed in Q4 21a 21.6% 7a 29.2%
Not employed in Q4 76a 78.4% 17a 70.8%
NOWCC Employed in Q4 12a 50.0% 16b 25.4%
Not employed in Q4 12a 50.0% 47b 74.6%
NUL Employed in Q4 128a 36.5% 49a 40.8%
Not employed in Q4 223a 63.5% 71a 59.2%
OAGB Employed in Q4 10a 14.9% 13a 18.1%
Not employed in Q4 57a 85.1% 59a 81.9%
SER Employed in Q4 126a 31.1% 100a 30.2%
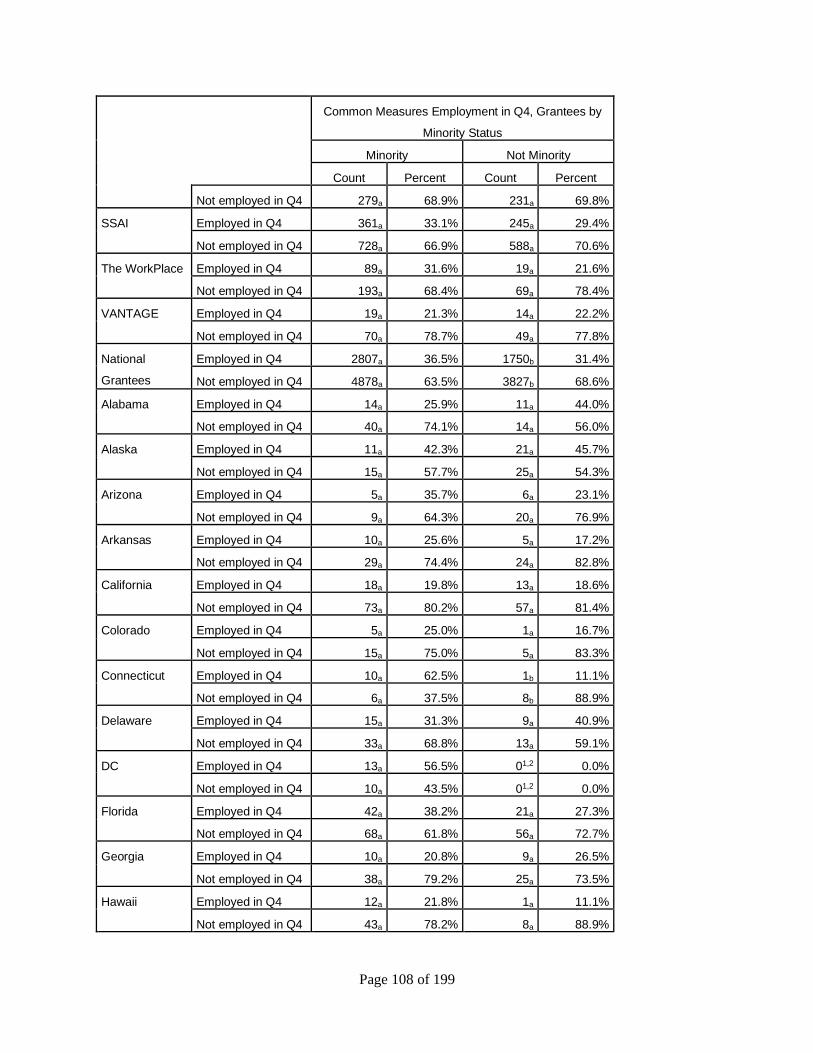
Page 108 of 199
Common Measures Employment in Q4, Grantees by
Minority Status
Minority Not Minority
Count Percent Count Percent
Not employed in Q4 279a 68.9% 231a 69.8%
SSAI Employed in Q4 361a 33.1% 245a 29.4%
Not employed in Q4 728a 66.9% 588a 70.6%
The WorkPlace Employed in Q4 89a 31.6% 19a 21.6%
Not employed in Q4 193a 68.4% 69a 78.4%
VANTAGE Employed in Q4 19a 21.3% 14a 22.2%
Not employed in Q4 70a 78.7% 49a 77.8%
National
Grantees
Employed in Q4 2807a 36.5% 1750b 31.4%
Not employed in Q4 4878a 63.5% 3827b 68.6%
Alabama Employed in Q4 14a 25.9% 11a 44.0%
Not employed in Q4 40a 74.1% 14a 56.0%
Alaska Employed in Q4 11a 42.3% 21a 45.7%
Not employed in Q4 15a 57.7% 25a 54.3%
Arizona Employed in Q4 5a 35.7% 6a 23.1%
Not employed in Q4 9a 64.3% 20a 76.9%
Arkansas Employed in Q4 10a 25.6% 5a 17.2%
Not employed in Q4 29a 74.4% 24a 82.8%
California Employed in Q4 18a 19.8% 13a 18.6%
Not employed in Q4 73a 80.2% 57a 81.4%
Colorado Employed in Q4 5a 25.0% 1a 16.7%
Not employed in Q4 15a 75.0% 5a 83.3%
Connecticut Employed in Q4 10a 62.5% 1b 11.1%
Not employed in Q4 6a 37.5% 8b 88.9%
Delaware Employed in Q4 15a 31.3% 9a 40.9%
Not employed in Q4 33a 68.8% 13a 59.1%
DC Employed in Q4 13a 56.5% 01,2 0.0%
Not employed in Q4 10a 43.5% 01,2 0.0%
Florida Employed in Q4 42a 38.2% 21a 27.3%
Not employed in Q4 68a 61.8% 56a 72.7%
Georgia Employed in Q4 10a 20.8% 9a 26.5%
Not employed in Q4 38a 79.2% 25a 73.5%
Hawaii Employed in Q4 12a 21.8% 1a 11.1%
Not employed in Q4 43a 78.2% 8a 88.9%
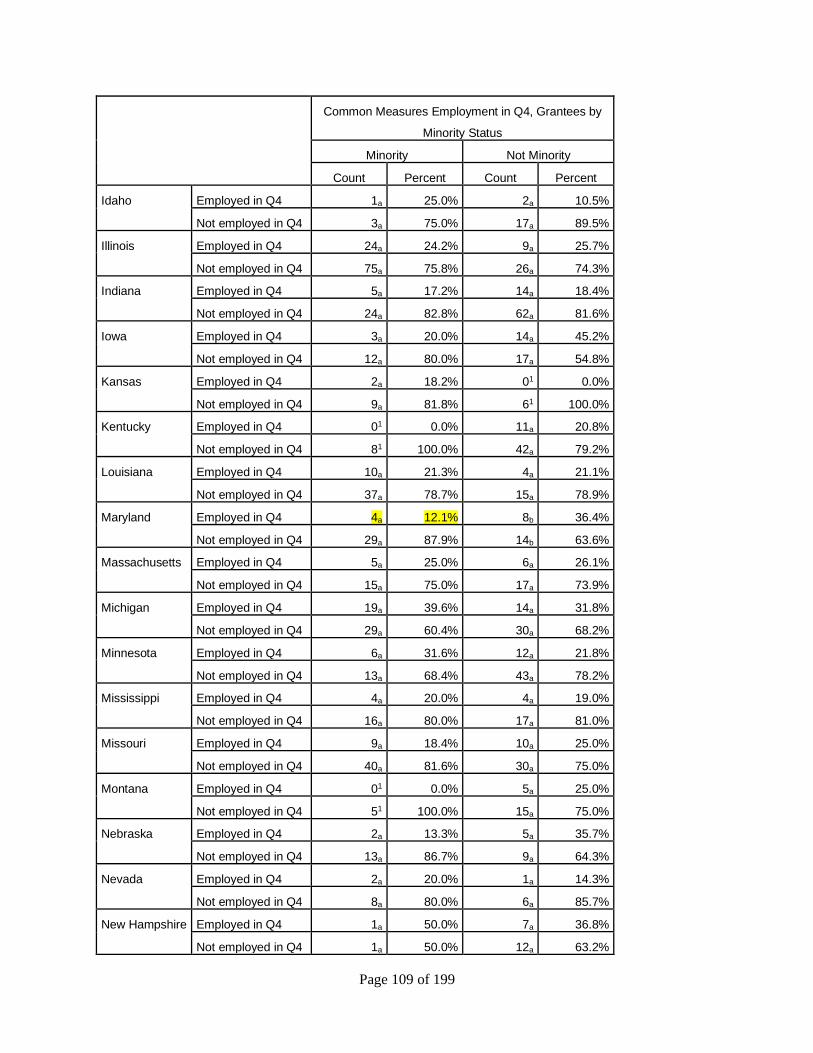
Page 109 of 199
Common Measures Employment in Q4, Grantees by
Minority Status
Minority Not Minority
Count Percent Count Percent
Idaho Employed in Q4 1a 25.0% 2a 10.5%
Not employed in Q4 3a 75.0% 17a 89.5%
Illinois Employed in Q4 24a 24.2% 9a 25.7%
Not employed in Q4 75a 75.8% 26a 74.3%
Indiana Employed in Q4 5a 17.2% 14a 18.4%
Not employed in Q4 24a 82.8% 62a 81.6%
Iowa Employed in Q4 3a 20.0% 14a 45.2%
Not employed in Q4 12a 80.0% 17a 54.8%
Kansas Employed in Q4 2a 18.2% 01 0.0%
Not employed in Q4 9a 81.8% 61 100.0%
Kentucky Employed in Q4 01 0.0% 11a 20.8%
Not employed in Q4 81 100.0% 42a 79.2%
Louisiana Employed in Q4 10a 21.3% 4a 21.1%
Not employed in Q4 37a 78.7% 15a 78.9%
Maryland Employed in Q4 4a 12.1% 8b 36.4%
Not employed in Q4 29a 87.9% 14b 63.6%
Massachusetts Employed in Q4 5a 25.0% 6a 26.1%
Not employed in Q4 15a 75.0% 17a 73.9%
Michigan Employed in Q4 19a 39.6% 14a 31.8%
Not employed in Q4 29a 60.4% 30a 68.2%
Minnesota Employed in Q4 6a 31.6% 12a 21.8%
Not employed in Q4 13a 68.4% 43a 78.2%
Mississippi Employed in Q4 4a 20.0% 4a 19.0%
Not employed in Q4 16a 80.0% 17a 81.0%
Missouri Employed in Q4 9a 18.4% 10a 25.0%
Not employed in Q4 40a 81.6% 30a 75.0%
Montana Employed in Q4 01 0.0% 5a 25.0%
Not employed in Q4 51 100.0% 15a 75.0%
Nebraska Employed in Q4 2a 13.3% 5a 35.7%
Not employed in Q4 13a 86.7% 9a 64.3%
Nevada Employed in Q4 2a 20.0% 1a 14.3%
Not employed in Q4 8a 80.0% 6a 85.7%
New Hampshire Employed in Q4 1a 50.0% 7a 36.8%
Not employed in Q4 1a 50.0% 12a 63.2%
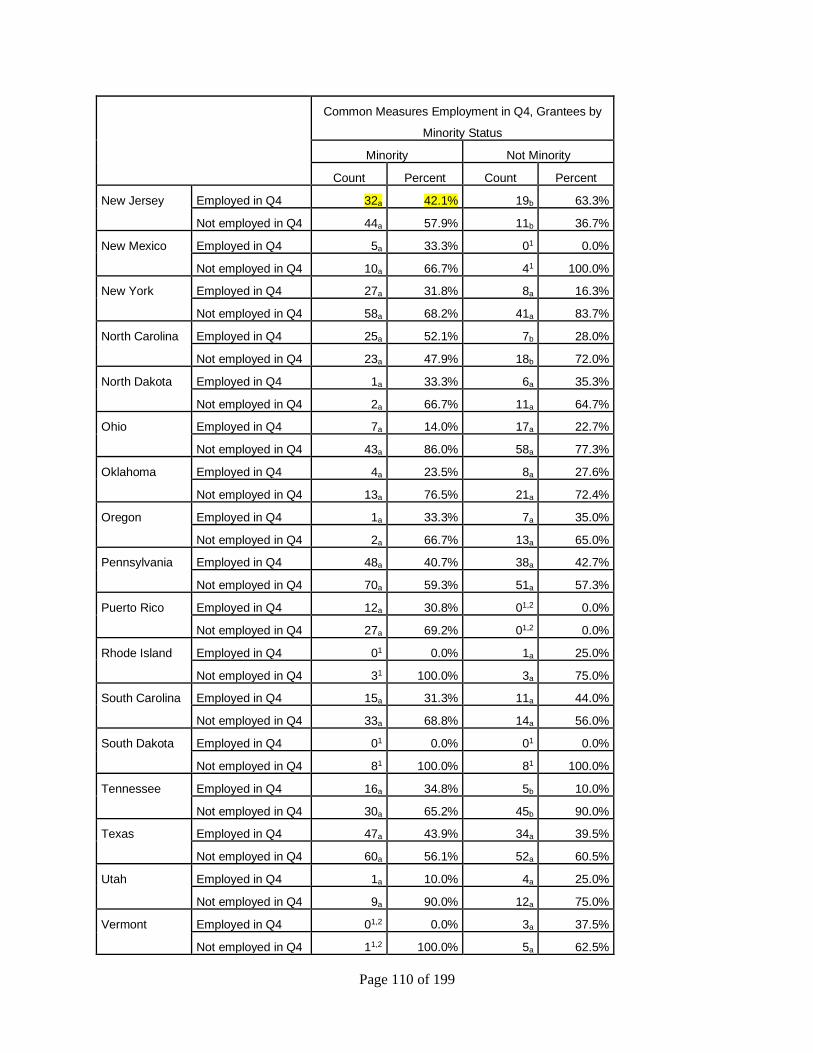
Page 110 of 199
Common Measures Employment in Q4, Grantees by
Minority Status
Minority Not Minority
Count Percent Count Percent
New Jersey Employed in Q4 32a 42.1% 19b 63.3%
Not employed in Q4 44a 57.9% 11b 36.7%
New Mexico Employed in Q4 5a 33.3% 01 0.0%
Not employed in Q4 10a 66.7% 41 100.0%
New York Employed in Q4 27a 31.8% 8a 16.3%
Not employed in Q4 58a 68.2% 41a 83.7%
North Carolina Employed in Q4 25a 52.1% 7b 28.0%
Not employed in Q4 23a 47.9% 18b 72.0%
North Dakota Employed in Q4 1a 33.3% 6a 35.3%
Not employed in Q4 2a 66.7% 11a 64.7%
Ohio Employed in Q4 7a 14.0% 17a 22.7%
Not employed in Q4 43a 86.0% 58a 77.3%
Oklahoma Employed in Q4 4a 23.5% 8a 27.6%
Not employed in Q4 13a 76.5% 21a 72.4%
Oregon Employed in Q4 1a 33.3% 7a 35.0%
Not employed in Q4 2a 66.7% 13a 65.0%
Pennsylvania Employed in Q4 48a 40.7% 38a 42.7%
Not employed in Q4 70a 59.3% 51a 57.3%
Puerto Rico Employed in Q4 12a 30.8% 01,2 0.0%
Not employed in Q4 27a 69.2% 01,2 0.0%
Rhode Island Employed in Q4 01 0.0% 1a 25.0%
Not employed in Q4 31 100.0% 3a 75.0%
South Carolina Employed in Q4 15a 31.3% 11a 44.0%
Not employed in Q4 33a 68.8% 14a 56.0%
South Dakota Employed in Q4 01 0.0% 01 0.0%
Not employed in Q4 81 100.0% 81 100.0%
Tennessee Employed in Q4 16a 34.8% 5b 10.0%
Not employed in Q4 30a 65.2% 45b 90.0%
Texas Employed in Q4 47a 43.9% 34a 39.5%
Not employed in Q4 60a 56.1% 52a 60.5%
Utah Employed in Q4 1a 10.0% 4a 25.0%
Not employed in Q4 9a 90.0% 12a 75.0%
Vermont Employed in Q4 01,2 0.0% 3a 37.5%
Not employed in Q4 11,2 100.0% 5a 62.5%
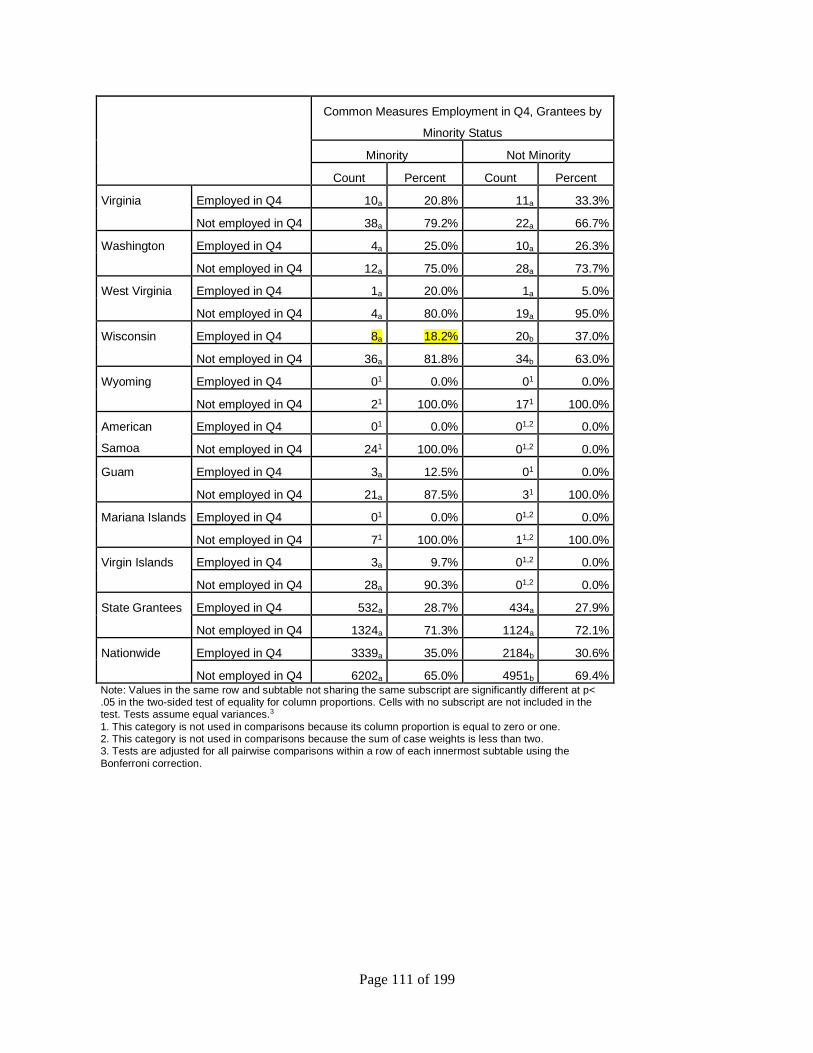
Page 111 of 199
Common Measures Employment in Q4, Grantees by
Minority Status
Minority Not Minority
Count Percent Count Percent
Virginia Employed in Q4 10a 20.8% 11a 33.3%
Not employed in Q4 38a 79.2% 22a 66.7%
Washington Employed in Q4 4a 25.0% 10a 26.3%
Not employed in Q4 12a 75.0% 28a 73.7%
West Virginia Employed in Q4 1a 20.0% 1a 5.0%
Not employed in Q4 4a 80.0% 19a 95.0%
Wisconsin Employed in Q4 8a 18.2% 20b 37.0%
Not employed in Q4 36a 81.8% 34b 63.0%
Wyoming Employed in Q4 01 0.0% 01 0.0%
Not employed in Q4 21 100.0% 171 100.0%
American
Samoa
Employed in Q4 01 0.0% 01,2 0.0%
Not employed in Q4 241 100.0% 01,2 0.0%
Guam Employed in Q4 3a 12.5% 01 0.0%
Not employed in Q4 21a 87.5% 31 100.0%
Mariana Islands Employed in Q4 01 0.0% 01,2 0.0%
Not employed in Q4 71 100.0% 11,2 100.0%
Virgin Islands Employed in Q4 3a 9.7% 01,2 0.0%
Not employed in Q4 28a 90.3% 01,2 0.0%
State Grantees Employed in Q4 532a 28.7% 434a 27.9%
Not employed in Q4 1324a 71.3% 1124a 72.1%
Nationwide Employed in Q4 3339a 35.0% 2184b 30.6%
Not employed in Q4 6202a 65.0% 4951b 69.4% Note: Values in the same row and subtable not sharing the same subscript are significantly different at p< .05 in the two-sided test of equality for column proportions. Cells with no subscript are not included in the test. Tests assume equal variances.3
1. This category is not used in comparisons because its column proportion is equal to zero or one. 2. This category is not used in comparisons because the sum of case weights is less than two. 3. Tests are adjusted for all pairwise comparisons within a row of each innermost subtable using the
Bonferroni correction.
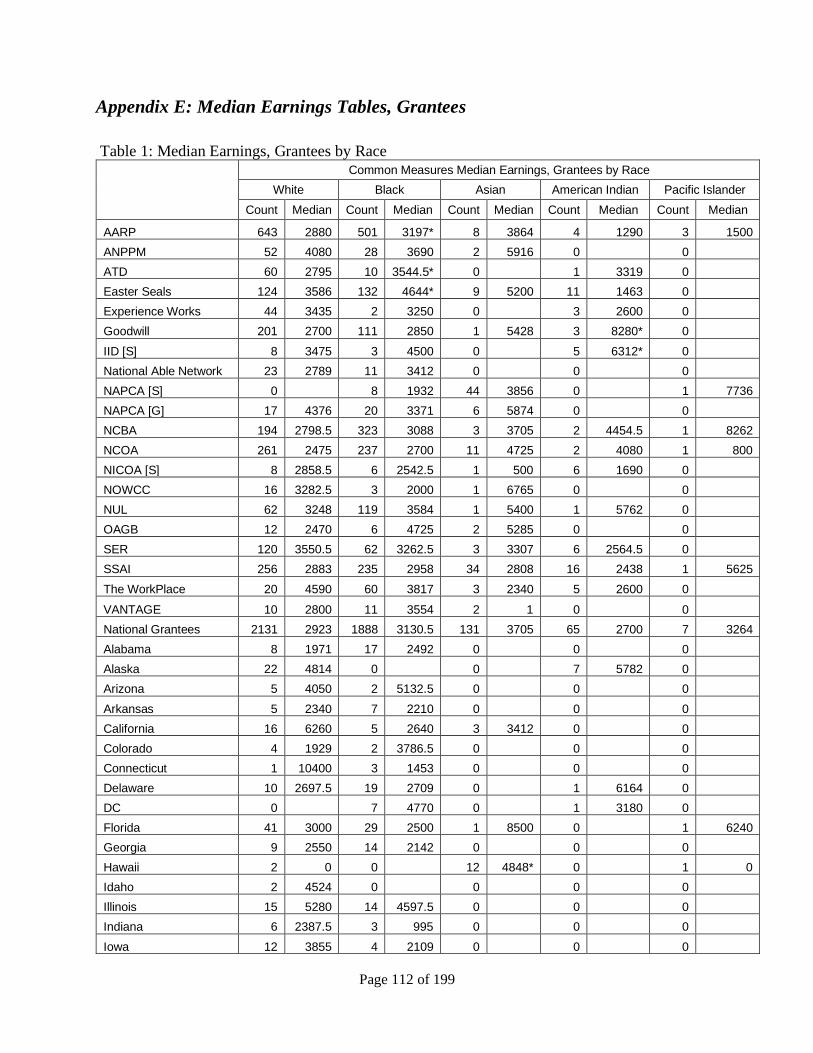
Page 112 of 199
Appendix E: Median Earnings Tables, Grantees
Table 1: Median Earnings, Grantees by Race
Common Measures Median Earnings, Grantees by Race
White Black Asian American Indian Pacific Islander
Count Median Count Median Count Median Count Median Count Median
AARP 643 2880 501 3197* 8 3864 4 1290 3 1500
ANPPM 52 4080 28 3690 2 5916 0 0
ATD 60 2795 10 3544.5* 0 1 3319 0
Easter Seals 124 3586 132 4644* 9 5200 11 1463 0
Experience Works 44 3435 2 3250 0 3 2600 0
Goodwill 201 2700 111 2850 1 5428 3 8280* 0
IID [S] 8 3475 3 4500 0 5 6312* 0
National Able Network 23 2789 11 3412 0 0 0
NAPCA [S] 0 8 1932 44 3856 0 1 7736
NAPCA [G] 17 4376 20 3371 6 5874 0 0
NCBA 194 2798.5 323 3088 3 3705 2 4454.5 1 8262
NCOA 261 2475 237 2700 11 4725 2 4080 1 800
NICOA [S] 8 2858.5 6 2542.5 1 500 6 1690 0
NOWCC 16 3282.5 3 2000 1 6765 0 0
NUL 62 3248 119 3584 1 5400 1 5762 0
OAGB 12 2470 6 4725 2 5285 0 0
SER 120 3550.5 62 3262.5 3 3307 6 2564.5 0
SSAI 256 2883 235 2958 34 2808 16 2438 1 5625
The WorkPlace 20 4590 60 3817 3 2340 5 2600 0
VANTAGE 10 2800 11 3554 2 1 0 0
National Grantees 2131 2923 1888 3130.5 131 3705 65 2700 7 3264
Alabama 8 1971 17 2492 0 0 0
Alaska 22 4814 0 0 7 5782 0
Arizona 5 4050 2 5132.5 0 0 0
Arkansas 5 2340 7 2210 0 0 0
California 16 6260 5 2640 3 3412 0 0
Colorado 4 1929 2 3786.5 0 0 0
Connecticut 1 10400 3 1453 0 0 0
Delaware 10 2697.5 19 2709 0 1 6164 0
DC 0 7 4770 0 1 3180 0
Florida 41 3000 29 2500 1 8500 0 1 6240
Georgia 9 2550 14 2142 0 0 0
Hawaii 2 0 0 12 4848* 0 1 0
Idaho 2 4524 0 0 0 0
Illinois 15 5280 14 4597.5 0 0 0
Indiana 6 2387.5 3 995 0 0 0
Iowa 12 3855 4 2109 0 0 0
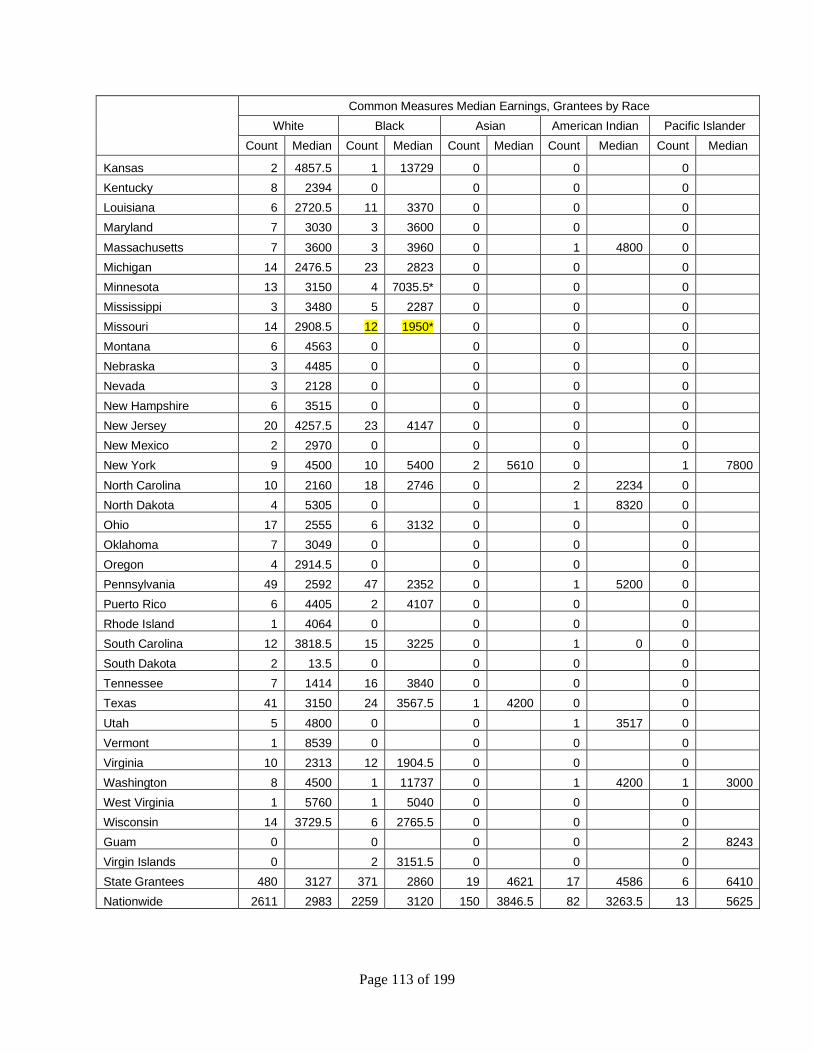
Page 113 of 199
Common Measures Median Earnings, Grantees by Race
White Black Asian American Indian Pacific Islander
Count Median Count Median Count Median Count Median Count Median
Kansas 2 4857.5 1 13729 0 0 0
Kentucky 8 2394 0 0 0 0
Louisiana 6 2720.5 11 3370 0 0 0
Maryland 7 3030 3 3600 0 0 0
Massachusetts 7 3600 3 3960 0 1 4800 0
Michigan 14 2476.5 23 2823 0 0 0
Minnesota 13 3150 4 7035.5* 0 0 0
Mississippi 3 3480 5 2287 0 0 0
Missouri 14 2908.5 12 1950* 0 0 0
Montana 6 4563 0 0 0 0
Nebraska 3 4485 0 0 0 0
Nevada 3 2128 0 0 0 0
New Hampshire 6 3515 0 0 0 0
New Jersey 20 4257.5 23 4147 0 0 0
New Mexico 2 2970 0 0 0 0
New York 9 4500 10 5400 2 5610 0 1 7800
North Carolina 10 2160 18 2746 0 2 2234 0
North Dakota 4 5305 0 0 1 8320 0
Ohio 17 2555 6 3132 0 0 0
Oklahoma 7 3049 0 0 0 0
Oregon 4 2914.5 0 0 0 0
Pennsylvania 49 2592 47 2352 0 1 5200 0
Puerto Rico 6 4405 2 4107 0 0 0
Rhode Island 1 4064 0 0 0 0
South Carolina 12 3818.5 15 3225 0 1 0 0
South Dakota 2 13.5 0 0 0 0
Tennessee 7 1414 16 3840 0 0 0
Texas 41 3150 24 3567.5 1 4200 0 0
Utah 5 4800 0 0 1 3517 0
Vermont 1 8539 0 0 0 0
Virginia 10 2313 12 1904.5 0 0 0
Washington 8 4500 1 11737 0 1 4200 1 3000
West Virginia 1 5760 1 5040 0 0 0
Wisconsin 14 3729.5 6 2765.5 0 0 0
Guam 0 0 0 0 2 8243
Virgin Islands 0 2 3151.5 0 0 0
State Grantees 480 3127 371 2860 19 4621 17 4586 6 6410
Nationwide 2611 2983 2259 3120 150 3846.5 82 3263.5 13 5625
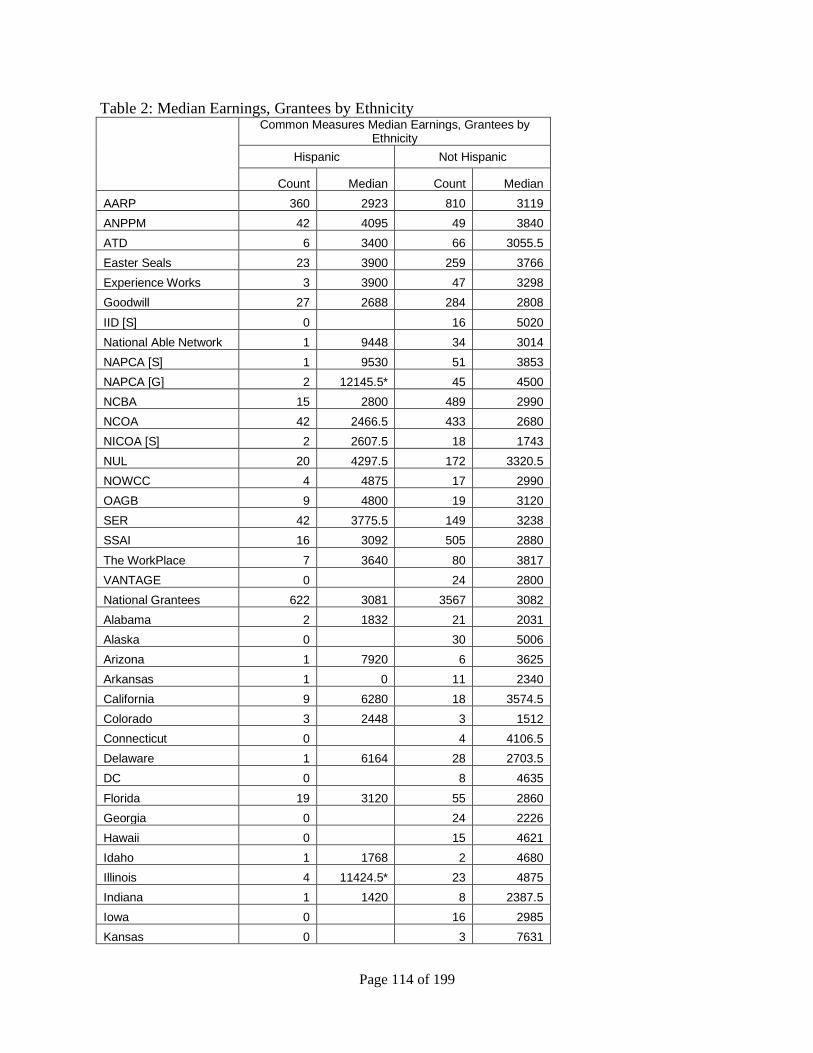
Page 114 of 199
Table 2: Median Earnings, Grantees by Ethnicity
Common Measures Median Earnings, Grantees by Ethnicity
Hispanic Not Hispanic
Count Median Count Median
AARP 360 2923 810 3119
ANPPM 42 4095 49 3840
ATD 6 3400 66 3055.5
Easter Seals 23 3900 259 3766
Experience Works 3 3900 47 3298
Goodwill 27 2688 284 2808
IID [S] 0 16 5020
National Able Network 1 9448 34 3014
NAPCA [S] 1 9530 51 3853
NAPCA [G] 2 12145.5* 45 4500
NCBA 15 2800 489 2990
NCOA 42 2466.5 433 2680
NICOA [S] 2 2607.5 18 1743
NUL 20 4297.5 172 3320.5
NOWCC 4 4875 17 2990
OAGB 9 4800 19 3120
SER 42 3775.5 149 3238
SSAI 16 3092 505 2880
The WorkPlace 7 3640 80 3817
VANTAGE 0 24 2800
National Grantees 622 3081 3567 3082
Alabama 2 1832 21 2031
Alaska 0 30 5006
Arizona 1 7920 6 3625
Arkansas 1 0 11 2340
California 9 6280 18 3574.5
Colorado 3 2448 3 1512
Connecticut 0 4 4106.5
Delaware 1 6164 28 2703.5
DC 0 8 4635
Florida 19 3120 55 2860
Georgia 0 24 2226
Hawaii 0 15 4621
Idaho 1 1768 2 4680
Illinois 4 11424.5* 23 4875
Indiana 1 1420 8 2387.5
Iowa 0 16 2985
Kansas 0 3 7631
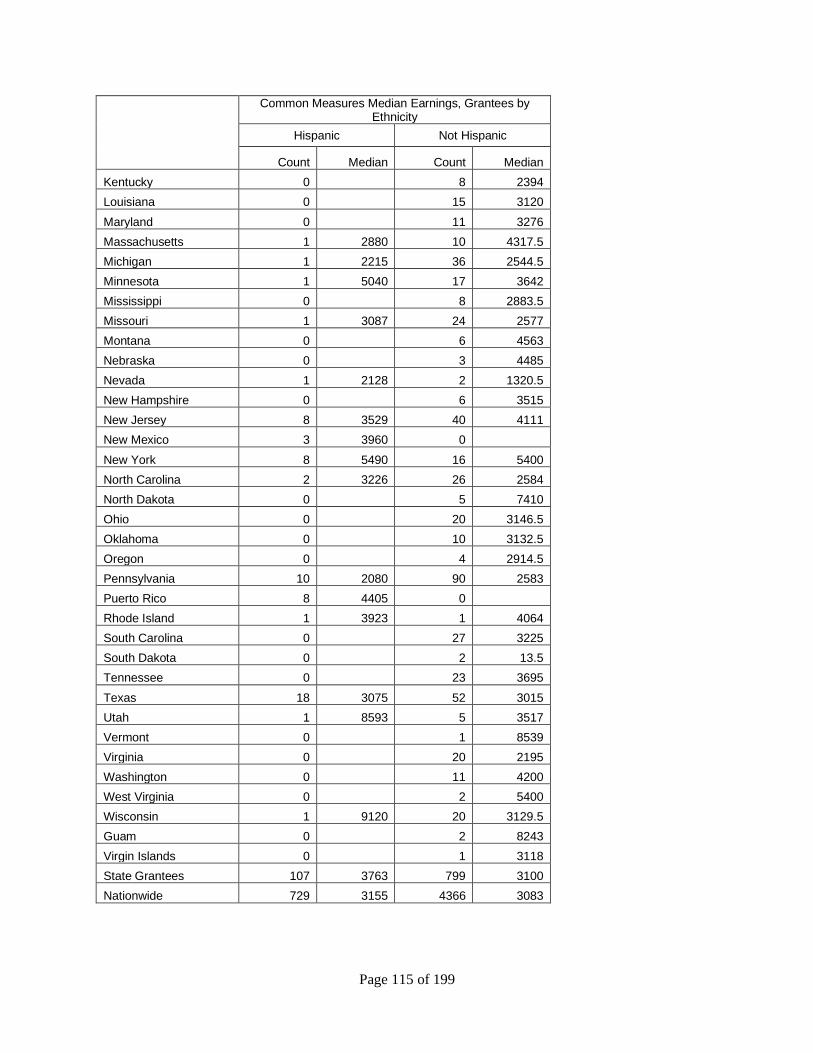
Page 115 of 199
Common Measures Median Earnings, Grantees by Ethnicity
Hispanic Not Hispanic
Count Median Count Median
Kentucky 0 8 2394
Louisiana 0 15 3120
Maryland 0 11 3276
Massachusetts 1 2880 10 4317.5
Michigan 1 2215 36 2544.5
Minnesota 1 5040 17 3642
Mississippi 0 8 2883.5
Missouri 1 3087 24 2577
Montana 0 6 4563
Nebraska 0 3 4485
Nevada 1 2128 2 1320.5
New Hampshire 0 6 3515
New Jersey 8 3529 40 4111
New Mexico 3 3960 0
New York 8 5490 16 5400
North Carolina 2 3226 26 2584
North Dakota 0 5 7410
Ohio 0 20 3146.5
Oklahoma 0 10 3132.5
Oregon 0 4 2914.5
Pennsylvania 10 2080 90 2583
Puerto Rico 8 4405 0
Rhode Island 1 3923 1 4064
South Carolina 0 27 3225
South Dakota 0 2 13.5
Tennessee 0 23 3695
Texas 18 3075 52 3015
Utah 1 8593 5 3517
Vermont 0 1 8539
Virginia 0 20 2195
Washington 0 11 4200
West Virginia 0 2 5400
Wisconsin 1 9120 20 3129.5
Guam 0 2 8243
Virgin Islands 0 1 3118
State Grantees 107 3763 799 3100
Nationwide 729 3155 4366 3083
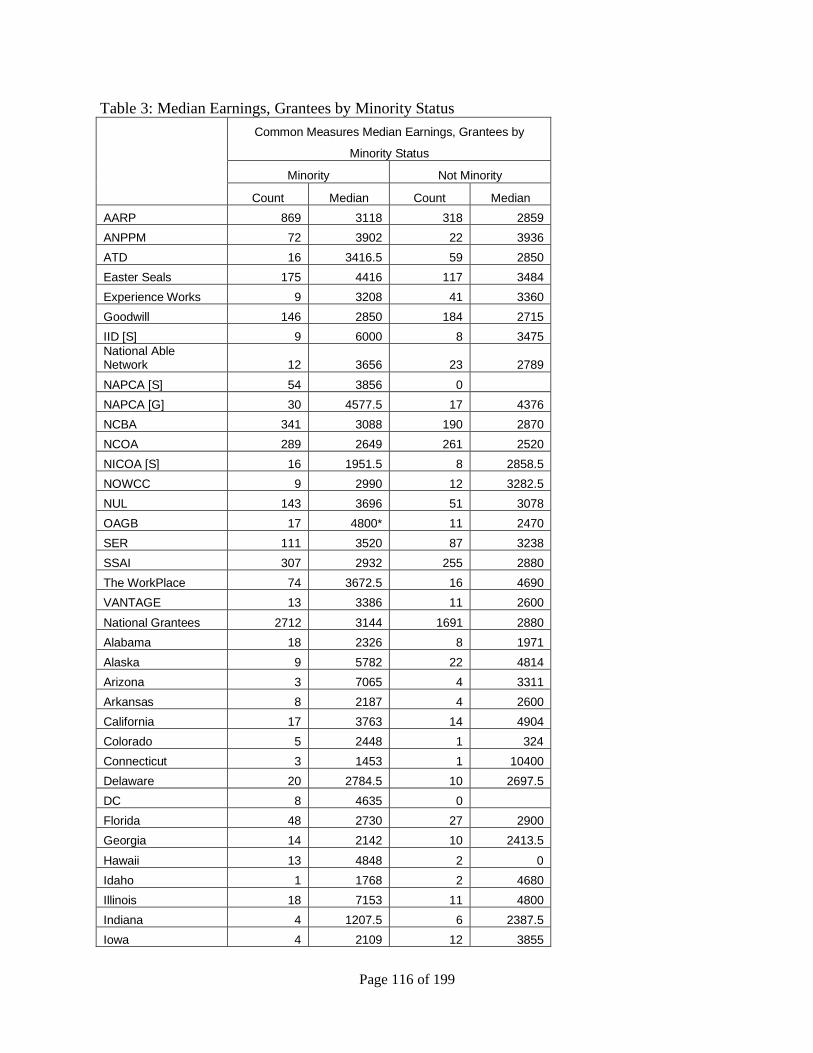
Page 116 of 199
Table 3: Median Earnings, Grantees by Minority Status
Common Measures Median Earnings, Grantees by
Minority Status
Minority Not Minority
Count Median Count Median
AARP 869 3118 318 2859
ANPPM 72 3902 22 3936
ATD 16 3416.5 59 2850
Easter Seals 175 4416 117 3484
Experience Works 9 3208 41 3360
Goodwill 146 2850 184 2715
IID [S] 9 6000 8 3475
National Able Network 12 3656 23 2789
NAPCA [S] 54 3856 0
NAPCA [G] 30 4577.5 17 4376
NCBA 341 3088 190 2870
NCOA 289 2649 261 2520
NICOA [S] 16 1951.5 8 2858.5
NOWCC 9 2990 12 3282.5
NUL 143 3696 51 3078
OAGB 17 4800* 11 2470
SER 111 3520 87 3238
SSAI 307 2932 255 2880
The WorkPlace 74 3672.5 16 4690
VANTAGE 13 3386 11 2600
National Grantees 2712 3144 1691 2880
Alabama 18 2326 8 1971
Alaska 9 5782 22 4814
Arizona 3 7065 4 3311
Arkansas 8 2187 4 2600
California 17 3763 14 4904
Colorado 5 2448 1 324
Connecticut 3 1453 1 10400
Delaware 20 2784.5 10 2697.5
DC 8 4635 0
Florida 48 2730 27 2900
Georgia 14 2142 10 2413.5
Hawaii 13 4848 2 0
Idaho 1 1768 2 4680
Illinois 18 7153 11 4800
Indiana 4 1207.5 6 2387.5
Iowa 4 2109 12 3855
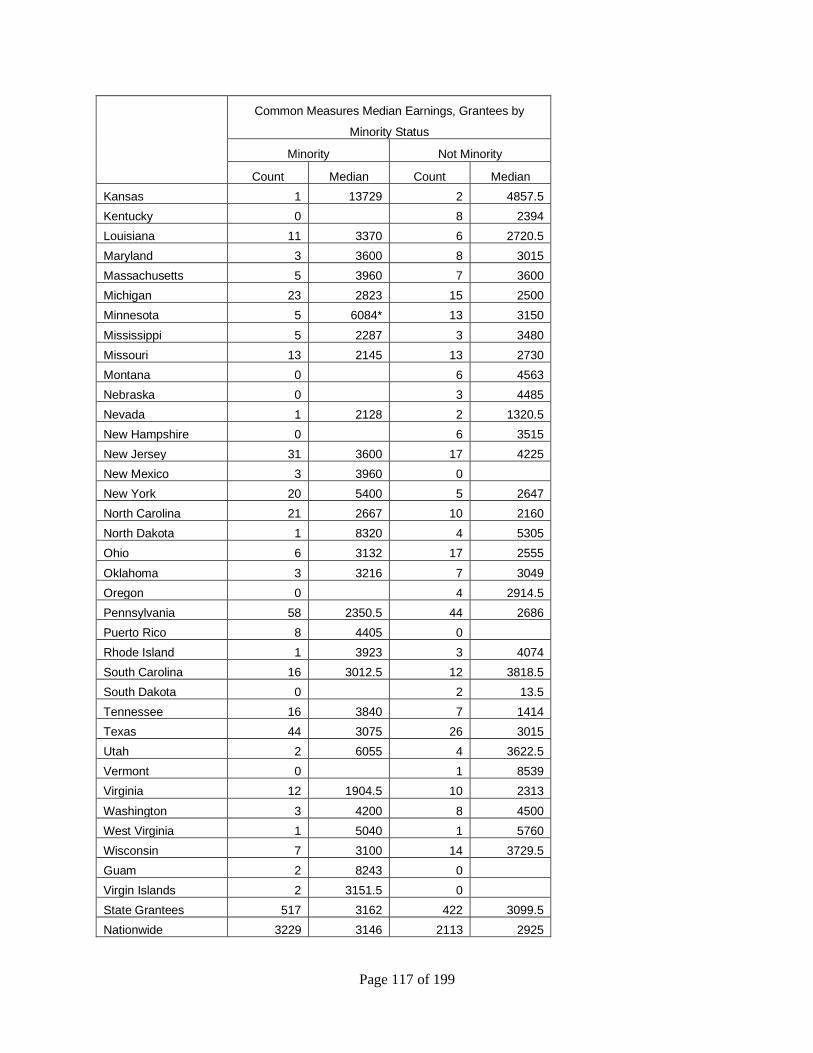
Page 117 of 199
Common Measures Median Earnings, Grantees by
Minority Status
Minority Not Minority
Count Median Count Median
Kansas 1 13729 2 4857.5
Kentucky 0 8 2394
Louisiana 11 3370 6 2720.5
Maryland 3 3600 8 3015
Massachusetts 5 3960 7 3600
Michigan 23 2823 15 2500
Minnesota 5 6084* 13 3150
Mississippi 5 2287 3 3480
Missouri 13 2145 13 2730
Montana 0 6 4563
Nebraska 0 3 4485
Nevada 1 2128 2 1320.5
New Hampshire 0 6 3515
New Jersey 31 3600 17 4225
New Mexico 3 3960 0
New York 20 5400 5 2647
North Carolina 21 2667 10 2160
North Dakota 1 8320 4 5305
Ohio 6 3132 17 2555
Oklahoma 3 3216 7 3049
Oregon 0 4 2914.5
Pennsylvania 58 2350.5 44 2686
Puerto Rico 8 4405 0
Rhode Island 1 3923 3 4074
South Carolina 16 3012.5 12 3818.5
South Dakota 0 2 13.5
Tennessee 16 3840 7 1414
Texas 44 3075 26 3015
Utah 2 6055 4 3622.5
Vermont 0 1 8539
Virginia 12 1904.5 10 2313
Washington 3 4200 8 4500
West Virginia 1 5040 1 5760
Wisconsin 7 3100 14 3729.5
Guam 2 8243 0
Virgin Islands 2 3151.5 0
State Grantees 517 3162 422 3099.5
Nationwide 3229 3146 2113 2925
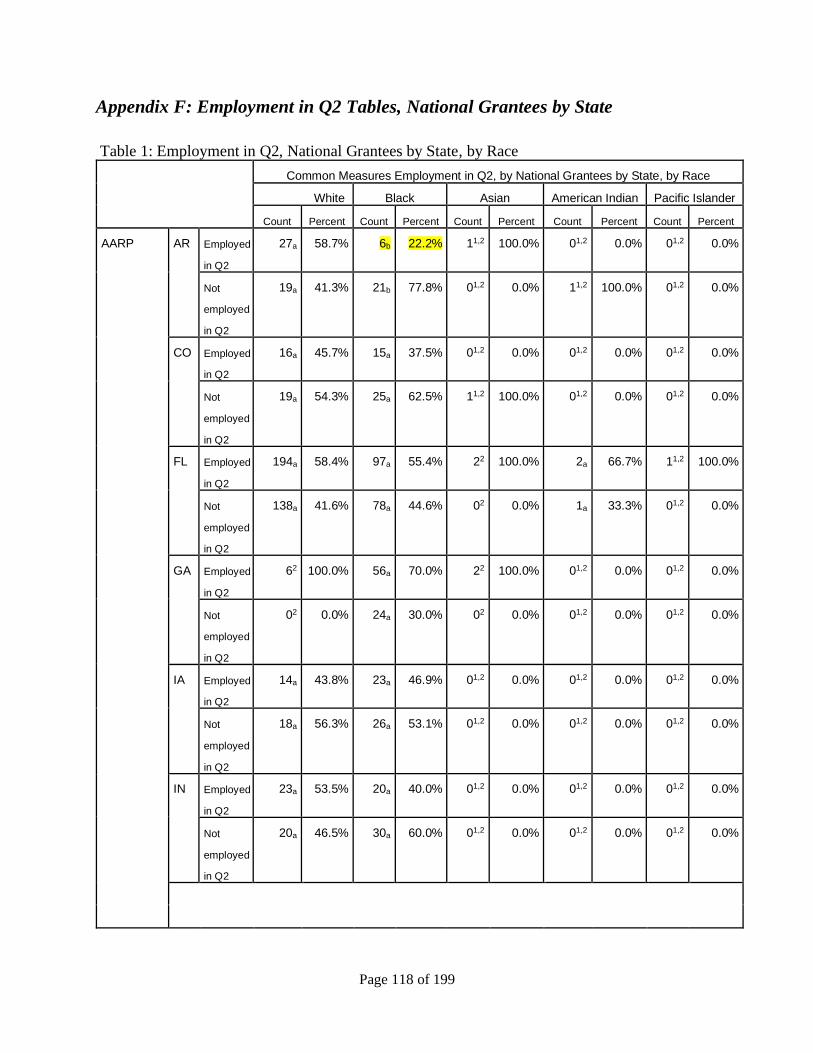
Page 118 of 199
Appendix F: Employment in Q2 Tables, National Grantees by State
Table 1: Employment in Q2, National Grantees by State, by Race
Common Measures Employment in Q2, by National Grantees by State, by Race
White Black Asian American Indian Pacific Islander
Count Percent Count Percent Count Percent Count Percent Count Percent
AARP AR Employed
in Q2
27a 58.7% 6b 22.2% 11,2 100.0% 01,2 0.0% 01,2 0.0%
Not
employed
in Q2
19a 41.3% 21b 77.8% 01,2 0.0% 11,2 100.0% 01,2 0.0%
CO Employed
in Q2
16a 45.7% 15a 37.5% 01,2 0.0% 01,2 0.0% 01,2 0.0%
Not
employed
in Q2
19a 54.3% 25a 62.5% 11,2 100.0% 01,2 0.0% 01,2 0.0%
FL Employed
in Q2
194a 58.4% 97a 55.4% 22 100.0% 2a 66.7% 11,2 100.0%
Not
employed
in Q2
138a 41.6% 78a 44.6% 02 0.0% 1a 33.3% 01,2 0.0%
GA Employed
in Q2
62 100.0% 56a 70.0% 22 100.0% 01,2 0.0% 01,2 0.0%
Not
employed
in Q2
02 0.0% 24a 30.0% 02 0.0% 01,2 0.0% 01,2 0.0%
IA Employed
in Q2
14a 43.8% 23a 46.9% 01,2 0.0% 01,2 0.0% 01,2 0.0%
Not
employed
in Q2
18a 56.3% 26a 53.1% 01,2 0.0% 01,2 0.0% 01,2 0.0%
IN Employed
in Q2
23a 53.5% 20a 40.0% 01,2 0.0% 01,2 0.0% 01,2 0.0%
Not
employed
in Q2
20a 46.5% 30a 60.0% 01,2 0.0% 01,2 0.0% 01,2 0.0%
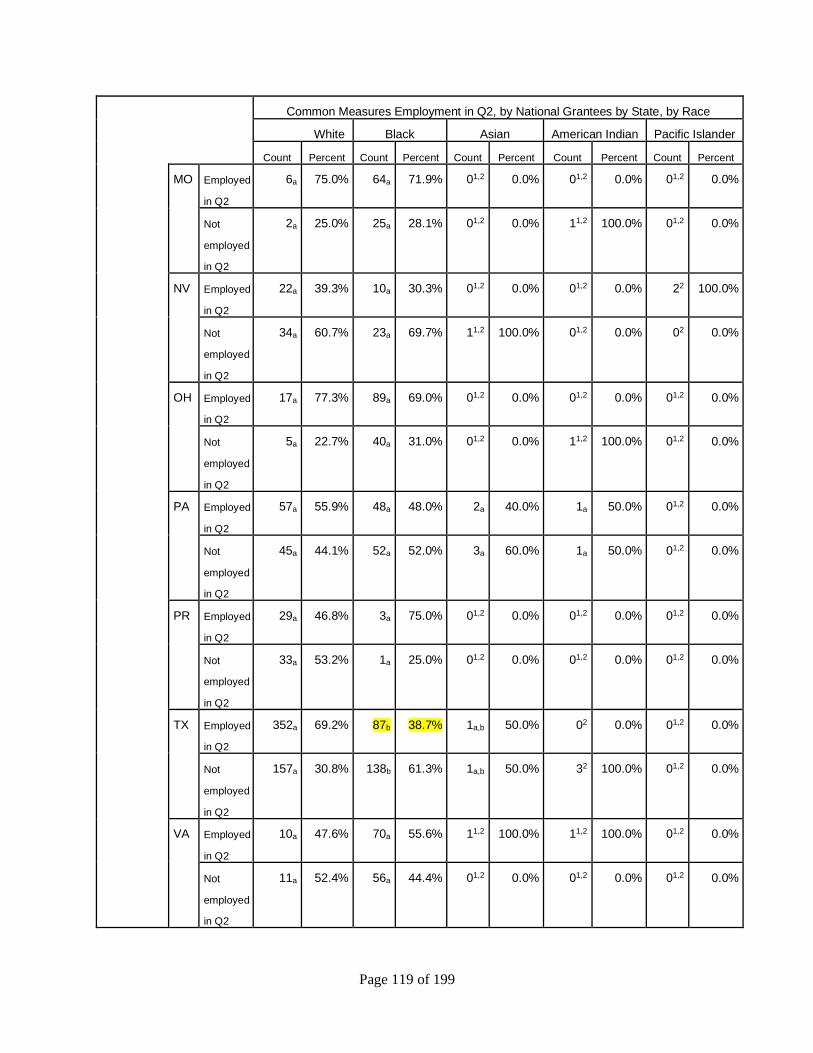
Page 119 of 199
Common Measures Employment in Q2, by National Grantees by State, by Race
White Black Asian American Indian Pacific Islander
Count Percent Count Percent Count Percent Count Percent Count Percent
MO Employed
in Q2
6a 75.0% 64a 71.9% 01,2 0.0% 01,2 0.0% 01,2 0.0%
Not
employed
in Q2
2a 25.0% 25a 28.1% 01,2 0.0% 11,2 100.0% 01,2 0.0%
NV Employed
in Q2
22a 39.3% 10a 30.3% 01,2 0.0% 01,2 0.0% 22 100.0%
Not
employed
in Q2
34a 60.7% 23a 69.7% 11,2 100.0% 01,2 0.0% 02 0.0%
OH Employed
in Q2
17a 77.3% 89a 69.0% 01,2 0.0% 01,2 0.0% 01,2 0.0%
Not
employed
in Q2
5a 22.7% 40a 31.0% 01,2 0.0% 11,2 100.0% 01,2 0.0%
PA Employed
in Q2
57a 55.9% 48a 48.0% 2a 40.0% 1a 50.0% 01,2 0.0%
Not
employed
in Q2
45a 44.1% 52a 52.0% 3a 60.0% 1a 50.0% 01,2 0.0%
PR Employed
in Q2
29a 46.8% 3a 75.0% 01,2 0.0% 01,2 0.0% 01,2 0.0%
Not
employed
in Q2
33a 53.2% 1a 25.0% 01,2 0.0% 01,2 0.0% 01,2 0.0%
TX Employed
in Q2
352a 69.2% 87b 38.7% 1a,b 50.0% 02 0.0% 01,2 0.0%
Not
employed
in Q2
157a 30.8% 138b 61.3% 1a,b 50.0% 32 100.0% 01,2 0.0%
VA Employed
in Q2
10a 47.6% 70a 55.6% 11,2 100.0% 11,2 100.0% 01,2 0.0%
Not
employed
in Q2
11a 52.4% 56a 44.4% 01,2 0.0% 01,2 0.0% 01,2 0.0%
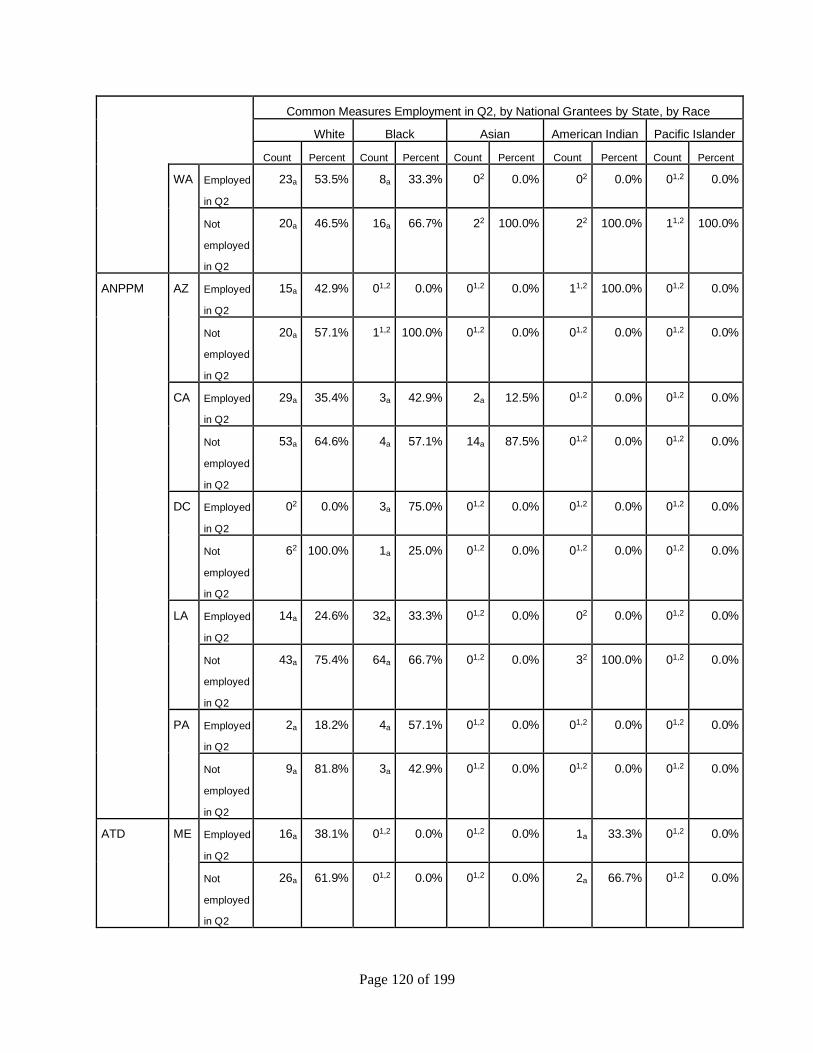
Page 120 of 199
Common Measures Employment in Q2, by National Grantees by State, by Race
White Black Asian American Indian Pacific Islander
Count Percent Count Percent Count Percent Count Percent Count Percent
WA Employed
in Q2
23a 53.5% 8a 33.3% 02 0.0% 02 0.0% 01,2 0.0%
Not
employed
in Q2
20a 46.5% 16a 66.7% 22 100.0% 22 100.0% 11,2 100.0%
ANPPM AZ Employed
in Q2
15a 42.9% 01,2 0.0% 01,2 0.0% 11,2 100.0% 01,2 0.0%
Not
employed
in Q2
20a 57.1% 11,2 100.0% 01,2 0.0% 01,2 0.0% 01,2 0.0%
CA Employed
in Q2
29a 35.4% 3a 42.9% 2a 12.5% 01,2 0.0% 01,2 0.0%
Not
employed
in Q2
53a 64.6% 4a 57.1% 14a 87.5% 01,2 0.0% 01,2 0.0%
DC Employed
in Q2
02 0.0% 3a 75.0% 01,2 0.0% 01,2 0.0% 01,2 0.0%
Not
employed
in Q2
62 100.0% 1a 25.0% 01,2 0.0% 01,2 0.0% 01,2 0.0%
LA Employed
in Q2
14a 24.6% 32a 33.3% 01,2 0.0% 02 0.0% 01,2 0.0%
Not
employed
in Q2
43a 75.4% 64a 66.7% 01,2 0.0% 32 100.0% 01,2 0.0%
PA Employed
in Q2
2a 18.2% 4a 57.1% 01,2 0.0% 01,2 0.0% 01,2 0.0%
Not
employed
in Q2
9a 81.8% 3a 42.9% 01,2 0.0% 01,2 0.0% 01,2 0.0%
ATD ME Employed
in Q2
16a 38.1% 01,2 0.0% 01,2 0.0% 1a 33.3% 01,2 0.0%
Not
employed
in Q2
26a 61.9% 01,2 0.0% 01,2 0.0% 2a 66.7% 01,2 0.0%
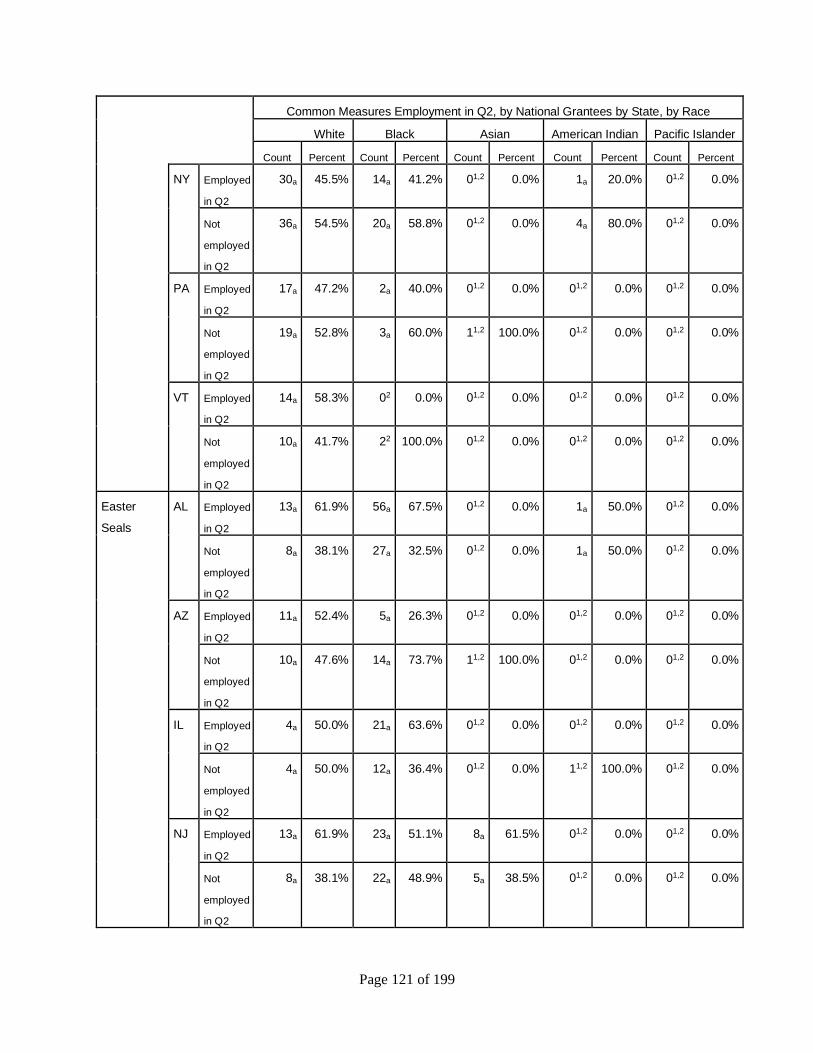
Page 121 of 199
Common Measures Employment in Q2, by National Grantees by State, by Race
White Black Asian American Indian Pacific Islander
Count Percent Count Percent Count Percent Count Percent Count Percent
NY Employed
in Q2
30a 45.5% 14a 41.2% 01,2 0.0% 1a 20.0% 01,2 0.0%
Not
employed
in Q2
36a 54.5% 20a 58.8% 01,2 0.0% 4a 80.0% 01,2 0.0%
PA Employed
in Q2
17a 47.2% 2a 40.0% 01,2 0.0% 01,2 0.0% 01,2 0.0%
Not
employed
in Q2
19a 52.8% 3a 60.0% 11,2 100.0% 01,2 0.0% 01,2 0.0%
VT Employed
in Q2
14a 58.3% 02 0.0% 01,2 0.0% 01,2 0.0% 01,2 0.0%
Not
employed
in Q2
10a 41.7% 22 100.0% 01,2 0.0% 01,2 0.0% 01,2 0.0%
Easter
Seals
AL Employed
in Q2
13a 61.9% 56a 67.5% 01,2 0.0% 1a 50.0% 01,2 0.0%
Not
employed
in Q2
8a 38.1% 27a 32.5% 01,2 0.0% 1a 50.0% 01,2 0.0%
AZ Employed
in Q2
11a 52.4% 5a 26.3% 01,2 0.0% 01,2 0.0% 01,2 0.0%
Not
employed
in Q2
10a 47.6% 14a 73.7% 11,2 100.0% 01,2 0.0% 01,2 0.0%
IL Employed
in Q2
4a 50.0% 21a 63.6% 01,2 0.0% 01,2 0.0% 01,2 0.0%
Not
employed
in Q2
4a 50.0% 12a 36.4% 01,2 0.0% 11,2 100.0% 01,2 0.0%
NJ Employed
in Q2
13a 61.9% 23a 51.1% 8a 61.5% 01,2 0.0% 01,2 0.0%
Not
employed
in Q2
8a 38.1% 22a 48.9% 5a 38.5% 01,2 0.0% 01,2 0.0%
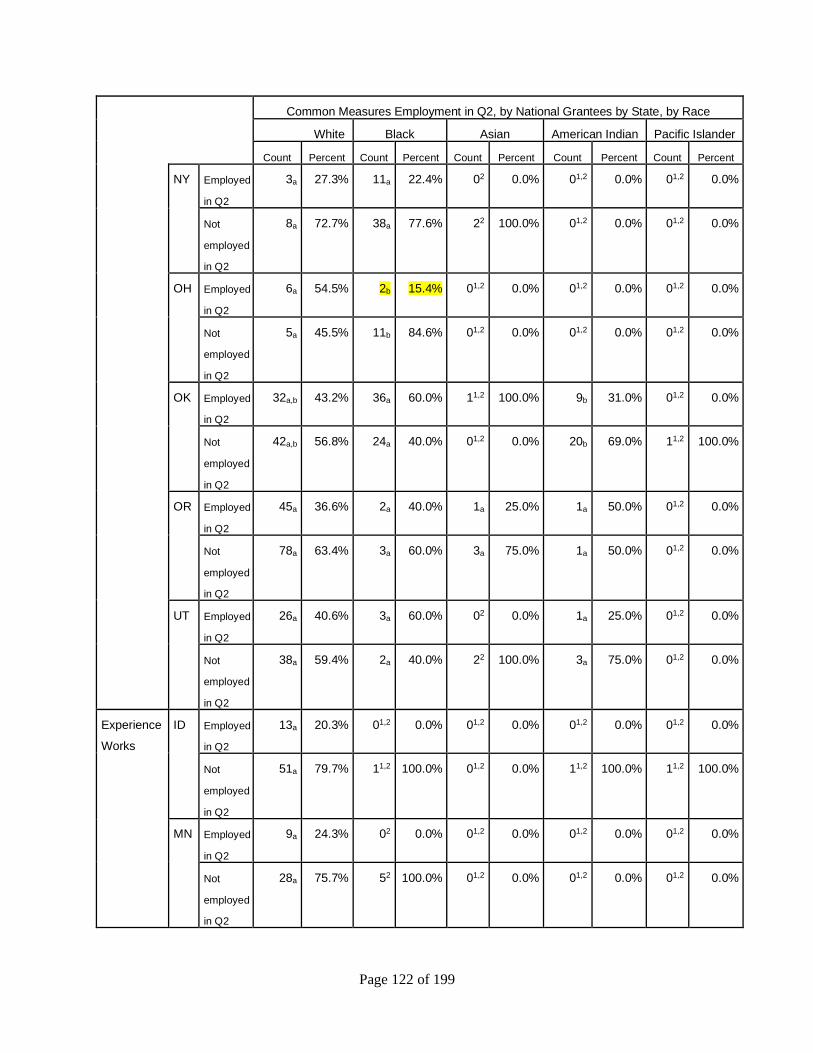
Page 122 of 199
Common Measures Employment in Q2, by National Grantees by State, by Race
White Black Asian American Indian Pacific Islander
Count Percent Count Percent Count Percent Count Percent Count Percent
NY Employed
in Q2
3a 27.3% 11a 22.4% 02 0.0% 01,2 0.0% 01,2 0.0%
Not
employed
in Q2
8a 72.7% 38a 77.6% 22 100.0% 01,2 0.0% 01,2 0.0%
OH Employed
in Q2
6a 54.5% 2b 15.4% 01,2 0.0% 01,2 0.0% 01,2 0.0%
Not
employed
in Q2
5a 45.5% 11b 84.6% 01,2 0.0% 01,2 0.0% 01,2 0.0%
OK Employed
in Q2
32a,b 43.2% 36a 60.0% 11,2 100.0% 9b 31.0% 01,2 0.0%
Not
employed
in Q2
42a,b 56.8% 24a 40.0% 01,2 0.0% 20b 69.0% 11,2 100.0%
OR Employed
in Q2
45a 36.6% 2a 40.0% 1a 25.0% 1a 50.0% 01,2 0.0%
Not
employed
in Q2
78a 63.4% 3a 60.0% 3a 75.0% 1a 50.0% 01,2 0.0%
UT Employed
in Q2
26a 40.6% 3a 60.0% 02 0.0% 1a 25.0% 01,2 0.0%
Not
employed
in Q2
38a 59.4% 2a 40.0% 22 100.0% 3a 75.0% 01,2 0.0%
Experience
Works
ID Employed
in Q2
13a 20.3% 01,2 0.0% 01,2 0.0% 01,2 0.0% 01,2 0.0%
Not
employed
in Q2
51a 79.7% 11,2 100.0% 01,2 0.0% 11,2 100.0% 11,2 100.0%
MN Employed
in Q2
9a 24.3% 02 0.0% 01,2 0.0% 01,2 0.0% 01,2 0.0%
Not
employed
in Q2
28a 75.7% 52 100.0% 01,2 0.0% 01,2 0.0% 01,2 0.0%
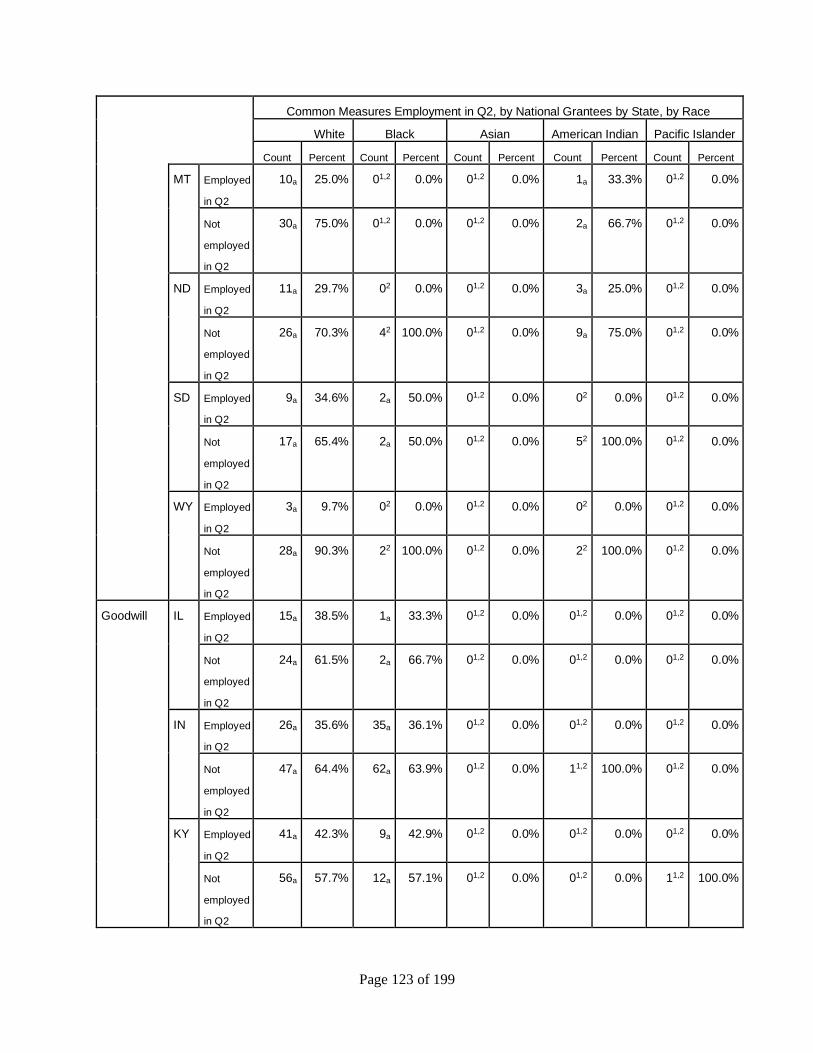
Page 123 of 199
Common Measures Employment in Q2, by National Grantees by State, by Race
White Black Asian American Indian Pacific Islander
Count Percent Count Percent Count Percent Count Percent Count Percent
MT Employed
in Q2
10a 25.0% 01,2 0.0% 01,2 0.0% 1a 33.3% 01,2 0.0%
Not
employed
in Q2
30a 75.0% 01,2 0.0% 01,2 0.0% 2a 66.7% 01,2 0.0%
ND Employed
in Q2
11a 29.7% 02 0.0% 01,2 0.0% 3a 25.0% 01,2 0.0%
Not
employed
in Q2
26a 70.3% 42 100.0% 01,2 0.0% 9a 75.0% 01,2 0.0%
SD Employed
in Q2
9a 34.6% 2a 50.0% 01,2 0.0% 02 0.0% 01,2 0.0%
Not
employed
in Q2
17a 65.4% 2a 50.0% 01,2 0.0% 52 100.0% 01,2 0.0%
WY Employed
in Q2
3a 9.7% 02 0.0% 01,2 0.0% 02 0.0% 01,2 0.0%
Not
employed
in Q2
28a 90.3% 22 100.0% 01,2 0.0% 22 100.0% 01,2 0.0%
Goodwill IL Employed
in Q2
15a 38.5% 1a 33.3% 01,2 0.0% 01,2 0.0% 01,2 0.0%
Not
employed
in Q2
24a 61.5% 2a 66.7% 01,2 0.0% 01,2 0.0% 01,2 0.0%
IN Employed
in Q2
26a 35.6% 35a 36.1% 01,2 0.0% 01,2 0.0% 01,2 0.0%
Not
employed
in Q2
47a 64.4% 62a 63.9% 01,2 0.0% 11,2 100.0% 01,2 0.0%
KY Employed
in Q2
41a 42.3% 9a 42.9% 01,2 0.0% 01,2 0.0% 01,2 0.0%
Not
employed
in Q2
56a 57.7% 12a 57.1% 01,2 0.0% 01,2 0.0% 11,2 100.0%
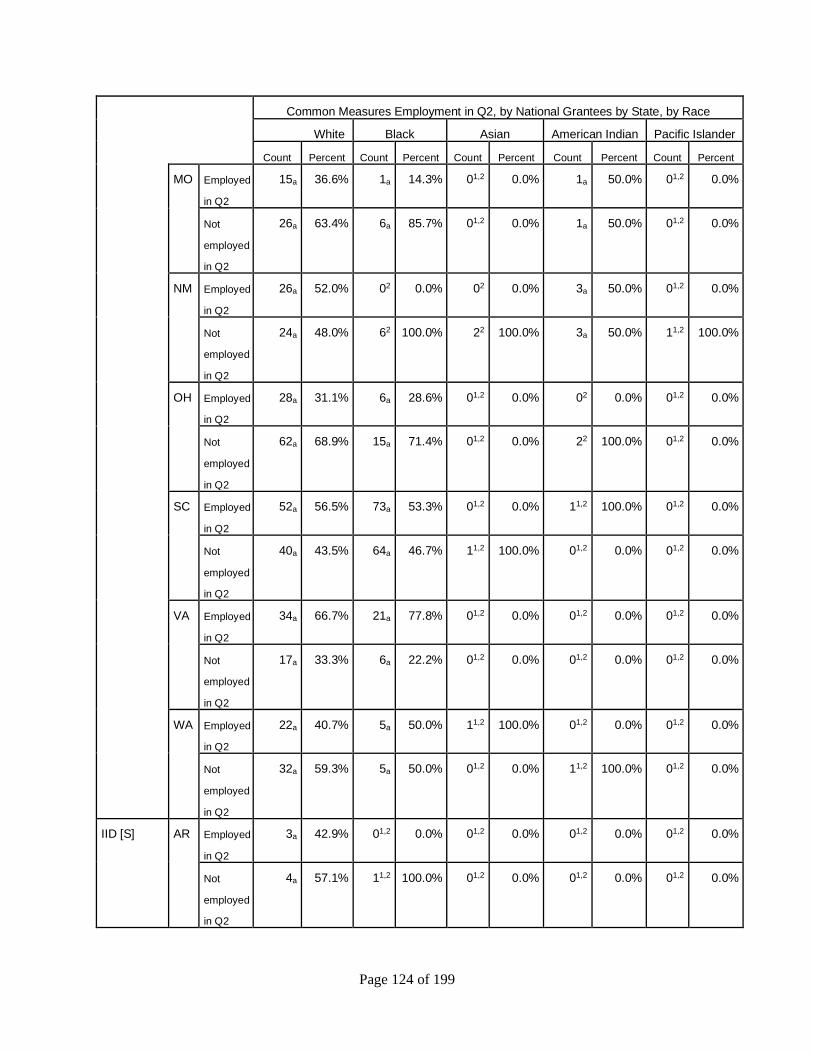
Page 124 of 199
Common Measures Employment in Q2, by National Grantees by State, by Race
White Black Asian American Indian Pacific Islander
Count Percent Count Percent Count Percent Count Percent Count Percent
MO Employed
in Q2
15a 36.6% 1a 14.3% 01,2 0.0% 1a 50.0% 01,2 0.0%
Not
employed
in Q2
26a 63.4% 6a 85.7% 01,2 0.0% 1a 50.0% 01,2 0.0%
NM Employed
in Q2
26a 52.0% 02 0.0% 02 0.0% 3a 50.0% 01,2 0.0%
Not
employed
in Q2
24a 48.0% 62 100.0% 22 100.0% 3a 50.0% 11,2 100.0%
OH Employed
in Q2
28a 31.1% 6a 28.6% 01,2 0.0% 02 0.0% 01,2 0.0%
Not
employed
in Q2
62a 68.9% 15a 71.4% 01,2 0.0% 22 100.0% 01,2 0.0%
SC Employed
in Q2
52a 56.5% 73a 53.3% 01,2 0.0% 11,2 100.0% 01,2 0.0%
Not
employed
in Q2
40a 43.5% 64a 46.7% 11,2 100.0% 01,2 0.0% 01,2 0.0%
VA Employed
in Q2
34a 66.7% 21a 77.8% 01,2 0.0% 01,2 0.0% 01,2 0.0%
Not
employed
in Q2
17a 33.3% 6a 22.2% 01,2 0.0% 01,2 0.0% 01,2 0.0%
WA Employed
in Q2
22a 40.7% 5a 50.0% 11,2 100.0% 01,2 0.0% 01,2 0.0%
Not
employed
in Q2
32a 59.3% 5a 50.0% 01,2 0.0% 11,2 100.0% 01,2 0.0%
IID [S] AR Employed
in Q2
3a 42.9% 01,2 0.0% 01,2 0.0% 01,2 0.0% 01,2 0.0%
Not
employed
in Q2
4a 57.1% 11,2 100.0% 01,2 0.0% 01,2 0.0% 01,2 0.0%

Page 125 of 199
Common Measures Employment in Q2, by National Grantees by State, by Race
White Black Asian American Indian Pacific Islander
Count Percent Count Percent Count Percent Count Percent Count Percent
LA Employed
in Q2
6a 42.9% 2a 16.7% 01,2 0.0% 3a 60.0% 01,2 0.0%
Not
employed
in Q2
8a 57.1% 10a 83.3% 01,2 0.0% 2a 40.0% 01,2 0.0%
MS Employed
in Q2
01,2 0.0% 01,2 0.0% 01,2 0.0% 1a 16.7% 01,2 0.0%
Not
employed
in Q2
01,2 0.0% 01,2 0.0% 01,2 0.0% 5a 83.3% 01,2 0.0%
TX Employed
in Q2
01,2 0.0% 3a 75.0% 01,2 0.0% 4a 57.1% 01,2 0.0%
Not
employed
in Q2
11,2 100.0% 1a 25.0% 01,2 0.0% 3a 42.9% 01,2 0.0%
National
Able
Network
IA Employed
in Q2
11a 17.5% 1a 10.0% 01,2 0.0% 02 0.0% 01,2 0.0%
Not
employed
in Q2
52a 82.5% 9a 90.0% 01,2 0.0% 22 100.0% 11,2 100.0%
IL Employed
in Q2
4a 28.6% 6a 37.5% 01,2 0.0% 01,2 0.0% 01,2 0.0%
Not
employed
in Q2
10a 71.4% 10a 62.5% 01,2 0.0% 01,2 0.0% 01,2 0.0%
IN Employed
in Q2
4a 18.2% 02 0.0% 01,2 0.0% 01,2 0.0% 01,2 0.0%
Not
employed
in Q2
18a 81.8% 22 100.0% 01,2 0.0% 01,2 0.0% 01,2 0.0%
NE Employed
in Q2
9a 27.3% 9a 32.1% 01,2 0.0% 02 0.0% 01,2 0.0%
Not
employed
in Q2
24a 72.7% 19a 67.9% 01,2 0.0% 22 100.0% 01,2 0.0%
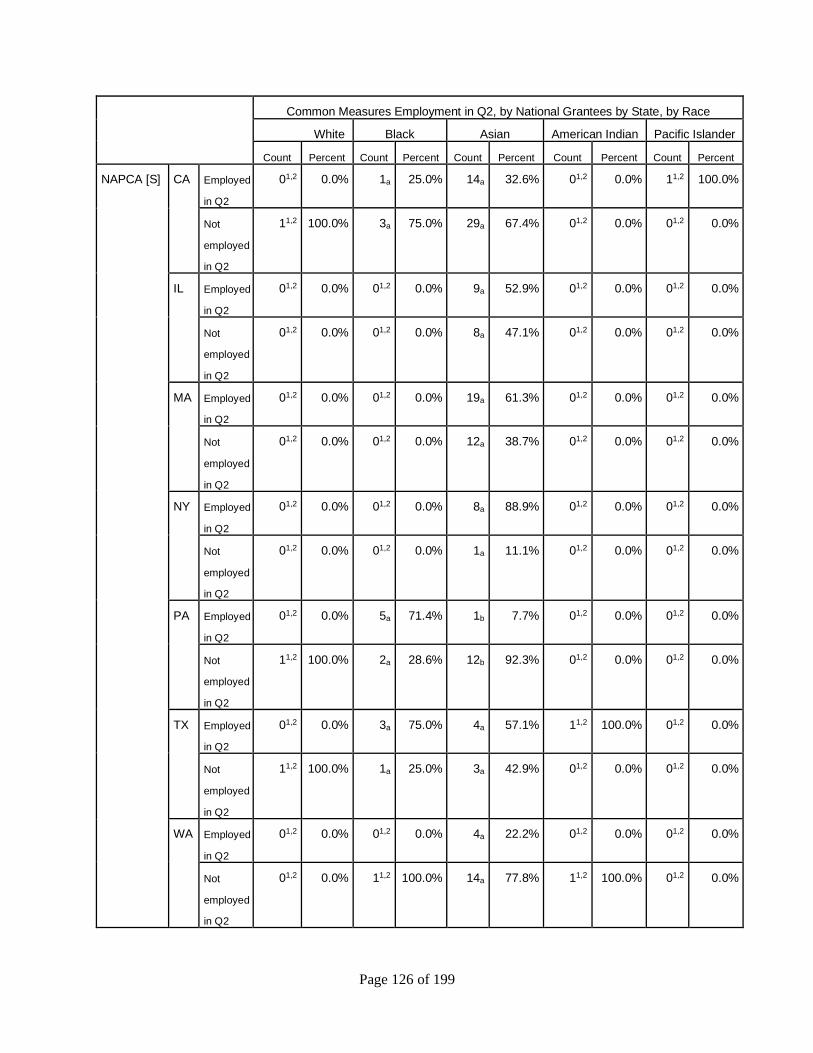
Page 126 of 199
Common Measures Employment in Q2, by National Grantees by State, by Race
White Black Asian American Indian Pacific Islander
Count Percent Count Percent Count Percent Count Percent Count Percent
NAPCA [S] CA Employed
in Q2
01,2 0.0% 1a 25.0% 14a 32.6% 01,2 0.0% 11,2 100.0%
Not
employed
in Q2
11,2 100.0% 3a 75.0% 29a 67.4% 01,2 0.0% 01,2 0.0%
IL Employed
in Q2
01,2 0.0% 01,2 0.0% 9a 52.9% 01,2 0.0% 01,2 0.0%
Not
employed
in Q2
01,2 0.0% 01,2 0.0% 8a 47.1% 01,2 0.0% 01,2 0.0%
MA Employed
in Q2
01,2 0.0% 01,2 0.0% 19a 61.3% 01,2 0.0% 01,2 0.0%
Not
employed
in Q2
01,2 0.0% 01,2 0.0% 12a 38.7% 01,2 0.0% 01,2 0.0%
NY Employed
in Q2
01,2 0.0% 01,2 0.0% 8a 88.9% 01,2 0.0% 01,2 0.0%
Not
employed
in Q2
01,2 0.0% 01,2 0.0% 1a 11.1% 01,2 0.0% 01,2 0.0%
PA Employed
in Q2
01,2 0.0% 5a 71.4% 1b 7.7% 01,2 0.0% 01,2 0.0%
Not
employed
in Q2
11,2 100.0% 2a 28.6% 12b 92.3% 01,2 0.0% 01,2 0.0%
TX Employed
in Q2
01,2 0.0% 3a 75.0% 4a 57.1% 11,2 100.0% 01,2 0.0%
Not
employed
in Q2
11,2 100.0% 1a 25.0% 3a 42.9% 01,2 0.0% 01,2 0.0%
WA Employed
in Q2
01,2 0.0% 01,2 0.0% 4a 22.2% 01,2 0.0% 01,2 0.0%
Not
employed
in Q2
01,2 0.0% 11,2 100.0% 14a 77.8% 11,2 100.0% 01,2 0.0%
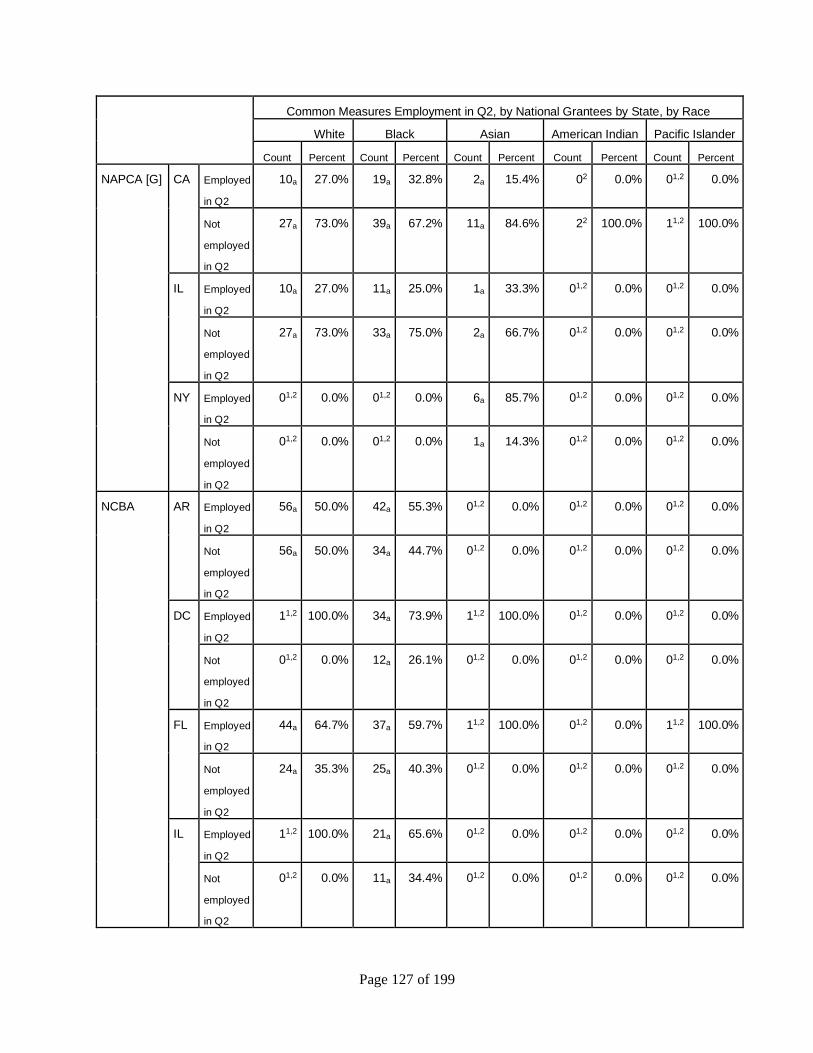
Page 127 of 199
Common Measures Employment in Q2, by National Grantees by State, by Race
White Black Asian American Indian Pacific Islander
Count Percent Count Percent Count Percent Count Percent Count Percent
NAPCA [G] CA Employed
in Q2
10a 27.0% 19a 32.8% 2a 15.4% 02 0.0% 01,2 0.0%
Not
employed
in Q2
27a 73.0% 39a 67.2% 11a 84.6% 22 100.0% 11,2 100.0%
IL Employed
in Q2
10a 27.0% 11a 25.0% 1a 33.3% 01,2 0.0% 01,2 0.0%
Not
employed
in Q2
27a 73.0% 33a 75.0% 2a 66.7% 01,2 0.0% 01,2 0.0%
NY Employed
in Q2
01,2 0.0% 01,2 0.0% 6a 85.7% 01,2 0.0% 01,2 0.0%
Not
employed
in Q2
01,2 0.0% 01,2 0.0% 1a 14.3% 01,2 0.0% 01,2 0.0%
NCBA AR Employed
in Q2
56a 50.0% 42a 55.3% 01,2 0.0% 01,2 0.0% 01,2 0.0%
Not
employed
in Q2
56a 50.0% 34a 44.7% 01,2 0.0% 01,2 0.0% 01,2 0.0%
DC Employed
in Q2
11,2 100.0% 34a 73.9% 11,2 100.0% 01,2 0.0% 01,2 0.0%
Not
employed
in Q2
01,2 0.0% 12a 26.1% 01,2 0.0% 01,2 0.0% 01,2 0.0%
FL Employed
in Q2
44a 64.7% 37a 59.7% 11,2 100.0% 01,2 0.0% 11,2 100.0%
Not
employed
in Q2
24a 35.3% 25a 40.3% 01,2 0.0% 01,2 0.0% 01,2 0.0%
IL Employed
in Q2
11,2 100.0% 21a 65.6% 01,2 0.0% 01,2 0.0% 01,2 0.0%
Not
employed
in Q2
01,2 0.0% 11a 34.4% 01,2 0.0% 01,2 0.0% 01,2 0.0%
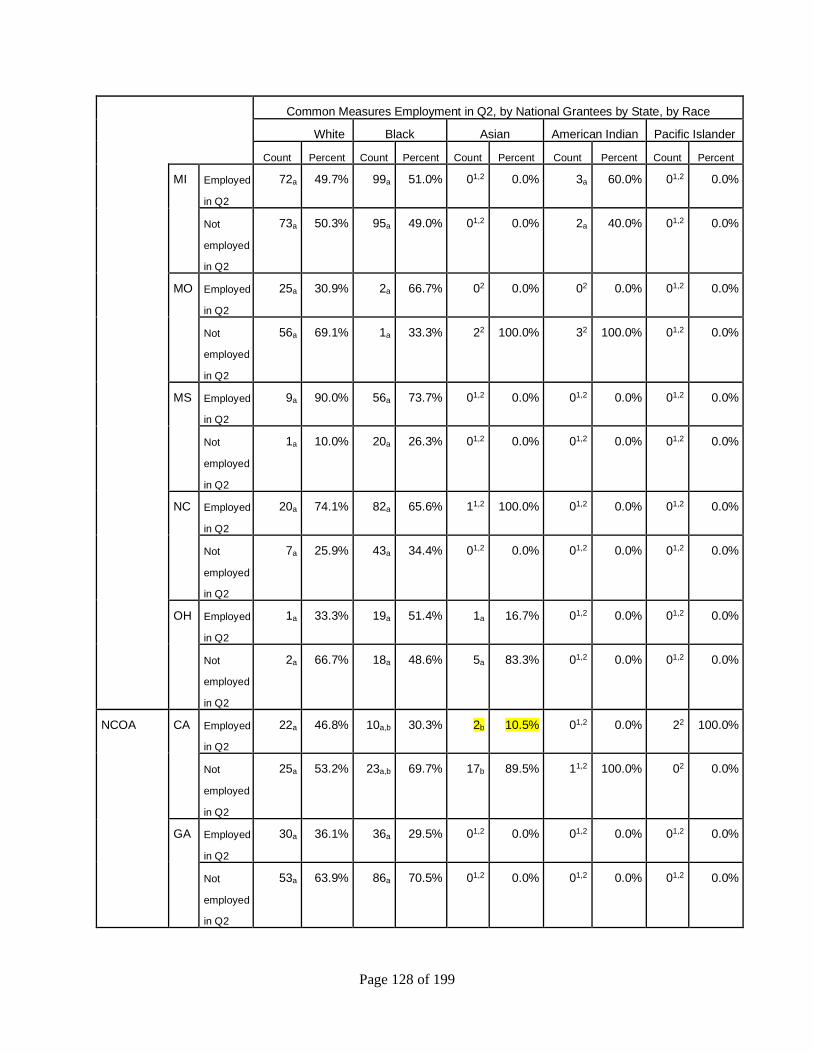
Page 128 of 199
Common Measures Employment in Q2, by National Grantees by State, by Race
White Black Asian American Indian Pacific Islander
Count Percent Count Percent Count Percent Count Percent Count Percent
MI Employed
in Q2
72a 49.7% 99a 51.0% 01,2 0.0% 3a 60.0% 01,2 0.0%
Not
employed
in Q2
73a 50.3% 95a 49.0% 01,2 0.0% 2a 40.0% 01,2 0.0%
MO Employed
in Q2
25a 30.9% 2a 66.7% 02 0.0% 02 0.0% 01,2 0.0%
Not
employed
in Q2
56a 69.1% 1a 33.3% 22 100.0% 32 100.0% 01,2 0.0%
MS Employed
in Q2
9a 90.0% 56a 73.7% 01,2 0.0% 01,2 0.0% 01,2 0.0%
Not
employed
in Q2
1a 10.0% 20a 26.3% 01,2 0.0% 01,2 0.0% 01,2 0.0%
NC Employed
in Q2
20a 74.1% 82a 65.6% 11,2 100.0% 01,2 0.0% 01,2 0.0%
Not
employed
in Q2
7a 25.9% 43a 34.4% 01,2 0.0% 01,2 0.0% 01,2 0.0%
OH Employed
in Q2
1a 33.3% 19a 51.4% 1a 16.7% 01,2 0.0% 01,2 0.0%
Not
employed
in Q2
2a 66.7% 18a 48.6% 5a 83.3% 01,2 0.0% 01,2 0.0%
NCOA CA Employed
in Q2
22a 46.8% 10a,b 30.3% 2b 10.5% 01,2 0.0% 22 100.0%
Not
employed
in Q2
25a 53.2% 23a,b 69.7% 17b 89.5% 11,2 100.0% 02 0.0%
GA Employed
in Q2
30a 36.1% 36a 29.5% 01,2 0.0% 01,2 0.0% 01,2 0.0%
Not
employed
in Q2
53a 63.9% 86a 70.5% 01,2 0.0% 01,2 0.0% 01,2 0.0%
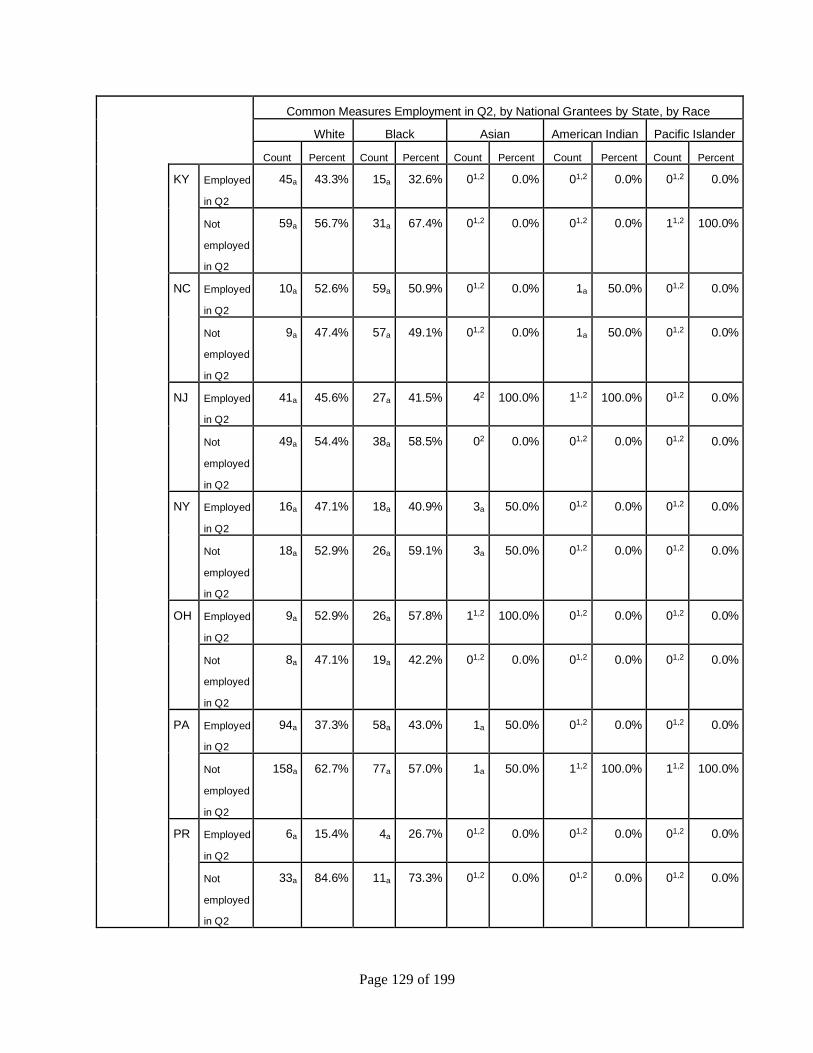
Page 129 of 199
Common Measures Employment in Q2, by National Grantees by State, by Race
White Black Asian American Indian Pacific Islander
Count Percent Count Percent Count Percent Count Percent Count Percent
KY Employed
in Q2
45a 43.3% 15a 32.6% 01,2 0.0% 01,2 0.0% 01,2 0.0%
Not
employed
in Q2
59a 56.7% 31a 67.4% 01,2 0.0% 01,2 0.0% 11,2 100.0%
NC Employed
in Q2
10a 52.6% 59a 50.9% 01,2 0.0% 1a 50.0% 01,2 0.0%
Not
employed
in Q2
9a 47.4% 57a 49.1% 01,2 0.0% 1a 50.0% 01,2 0.0%
NJ Employed
in Q2
41a 45.6% 27a 41.5% 42 100.0% 11,2 100.0% 01,2 0.0%
Not
employed
in Q2
49a 54.4% 38a 58.5% 02 0.0% 01,2 0.0% 01,2 0.0%
NY Employed
in Q2
16a 47.1% 18a 40.9% 3a 50.0% 01,2 0.0% 01,2 0.0%
Not
employed
in Q2
18a 52.9% 26a 59.1% 3a 50.0% 01,2 0.0% 01,2 0.0%
OH Employed
in Q2
9a 52.9% 26a 57.8% 11,2 100.0% 01,2 0.0% 01,2 0.0%
Not
employed
in Q2
8a 47.1% 19a 42.2% 01,2 0.0% 01,2 0.0% 01,2 0.0%
PA Employed
in Q2
94a 37.3% 58a 43.0% 1a 50.0% 01,2 0.0% 01,2 0.0%
Not
employed
in Q2
158a 62.7% 77a 57.0% 1a 50.0% 11,2 100.0% 11,2 100.0%
PR Employed
in Q2
6a 15.4% 4a 26.7% 01,2 0.0% 01,2 0.0% 01,2 0.0%
Not
employed
in Q2
33a 84.6% 11a 73.3% 01,2 0.0% 01,2 0.0% 01,2 0.0%
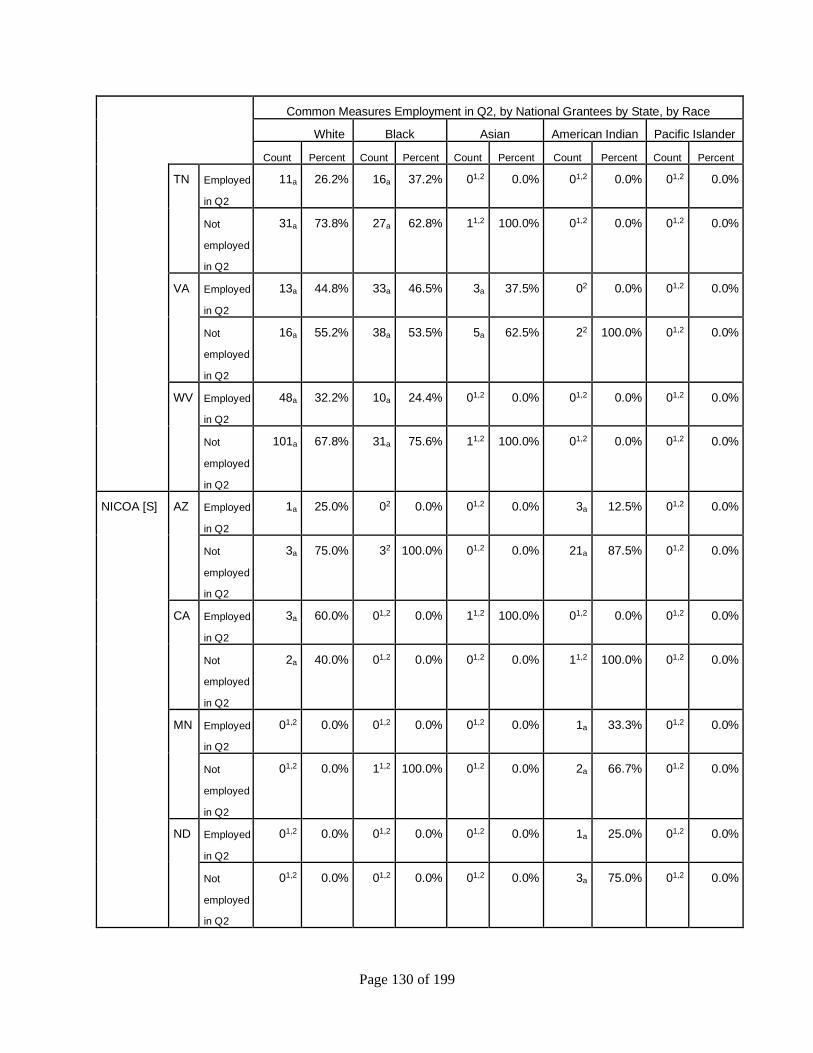
Page 130 of 199
Common Measures Employment in Q2, by National Grantees by State, by Race
White Black Asian American Indian Pacific Islander
Count Percent Count Percent Count Percent Count Percent Count Percent
TN Employed
in Q2
11a 26.2% 16a 37.2% 01,2 0.0% 01,2 0.0% 01,2 0.0%
Not
employed
in Q2
31a 73.8% 27a 62.8% 11,2 100.0% 01,2 0.0% 01,2 0.0%
VA Employed
in Q2
13a 44.8% 33a 46.5% 3a 37.5% 02 0.0% 01,2 0.0%
Not
employed
in Q2
16a 55.2% 38a 53.5% 5a 62.5% 22 100.0% 01,2 0.0%
WV Employed
in Q2
48a 32.2% 10a 24.4% 01,2 0.0% 01,2 0.0% 01,2 0.0%
Not
employed
in Q2
101a 67.8% 31a 75.6% 11,2 100.0% 01,2 0.0% 01,2 0.0%
NICOA [S] AZ Employed
in Q2
1a 25.0% 02 0.0% 01,2 0.0% 3a 12.5% 01,2 0.0%
Not
employed
in Q2
3a 75.0% 32 100.0% 01,2 0.0% 21a 87.5% 01,2 0.0%
CA Employed
in Q2
3a 60.0% 01,2 0.0% 11,2 100.0% 01,2 0.0% 01,2 0.0%
Not
employed
in Q2
2a 40.0% 01,2 0.0% 01,2 0.0% 11,2 100.0% 01,2 0.0%
MN Employed
in Q2
01,2 0.0% 01,2 0.0% 01,2 0.0% 1a 33.3% 01,2 0.0%
Not
employed
in Q2
01,2 0.0% 11,2 100.0% 01,2 0.0% 2a 66.7% 01,2 0.0%
ND Employed
in Q2
01,2 0.0% 01,2 0.0% 01,2 0.0% 1a 25.0% 01,2 0.0%
Not
employed
in Q2
01,2 0.0% 01,2 0.0% 01,2 0.0% 3a 75.0% 01,2 0.0%

Page 131 of 199
Common Measures Employment in Q2, by National Grantees by State, by Race
White Black Asian American Indian Pacific Islander
Count Percent Count Percent Count Percent Count Percent Count Percent
NM Employed
in Q2
1a 50.0% 22 100.0% 01,2 0.0% 2a 28.6% 01,2 0.0%
Not
employed
in Q2
1a 50.0% 02 0.0% 11,2 100.0% 5a 71.4% 01,2 0.0%
OK Employed
in Q2
3a 37.5% 7a 43.8% 01,2 0.0% 3a 37.5% 01,2 0.0%
Not
employed
in Q2
5a 62.5% 9a 56.3% 01,2 0.0% 5a 62.5% 11,2 100.0%
SD Employed
in Q2
01,2 0.0% 01,2 0.0% 01,2 0.0% 1a 16.7% 01,2 0.0%
Not
employed
in Q2
01,2 0.0% 01,2 0.0% 01,2 0.0% 5a 83.3% 01,2 0.0%
WI Employed
in Q2
01,2 0.0% 01,2 0.0% 01,2 0.0% 1a 16.7% 01,2 0.0%
Not
employed
in Q2
01,2 0.0% 11,2 100.0% 01,2 0.0% 5a 83.3% 01,2 0.0%
NOWCC CA Employed
in Q2
21a 42.0% 3a 42.9% 1a 25.0% 2a 28.6% 01,2 0.0%
Not
employed
in Q2
29a 58.0% 4a 57.1% 3a 75.0% 5a 71.4% 11,2 100.0%
NUL FL Employed
in Q2
46a 45.1% 17a 37.0% 01,2 0.0% 01,2 0.0% 01,2 0.0%
Not
employed
in Q2
56a 54.9% 29a 63.0% 01,2 0.0% 01,2 0.0% 01,2 0.0%
KY Employed
in Q2
11,2 100.0% 18a 40.9% 01,2 0.0% 01,2 0.0% 01,2 0.0%
Not
employed
in Q2
01,2 0.0% 26a 59.1% 01,2 0.0% 01,2 0.0% 01,2 0.0%

Page 132 of 199
Common Measures Employment in Q2, by National Grantees by State, by Race
White Black Asian American Indian Pacific Islander
Count Percent Count Percent Count Percent Count Percent Count Percent
MI Employed
in Q2
1a 25.0% 25a 47.2% 01,2 0.0% 11,2 100.0% 01,2 0.0%
Not
employed
in Q2
3a 75.0% 28a 52.8% 01,2 0.0% 01,2 0.0% 01,2 0.0%
NJ Employed
in Q2
5a 55.6% 18a 34.0% 01,2 0.0% 01,2 0.0% 01,2 0.0%
Not
employed
in Q2
4a 44.4% 35a 66.0% 01,2 0.0% 01,2 0.0% 01,2 0.0%
NY Employed
in Q2
13a 76.5% 23a 74.2% 1a 25.0% 01,2 0.0% 01,2 0.0%
Not
employed
in Q2
4a 23.5% 8a 25.8% 3a 75.0% 01,2 0.0% 01,2 0.0%
PA Employed
in Q2
7a 43.8% 42a 60.0% 01,2 0.0% 01,2 0.0% 01,2 0.0%
Not
employed
in Q2
9a 56.3% 28a 40.0% 01,2 0.0% 01,2 0.0% 01,2 0.0%
OAGB MA Employed
in Q2
4a 12.1% 7a 22.6% 1a 20.0% 01,2 0.0% 01,2 0.0%
Not
employed
in Q2
29a 87.9% 24a 77.4% 4a 80.0% 01,2 0.0% 01,2 0.0%
NH Employed
in Q2
15a 31.3% 1a 33.3% 11,2 100.0% 01,2 0.0% 01,2 0.0%
Not
employed
in Q2
33a 68.8% 2a 66.7% 01,2 0.0% 01,2 0.0% 01,2 0.0%
SER CA Employed
in Q2
52a 39.1% 30a 45.5% 3a 37.5% 11,2 100.0% 02 0.0%
Not
employed
in Q2
81a 60.9% 36a 54.5% 5a 62.5% 01,2 0.0% 22 100.0%
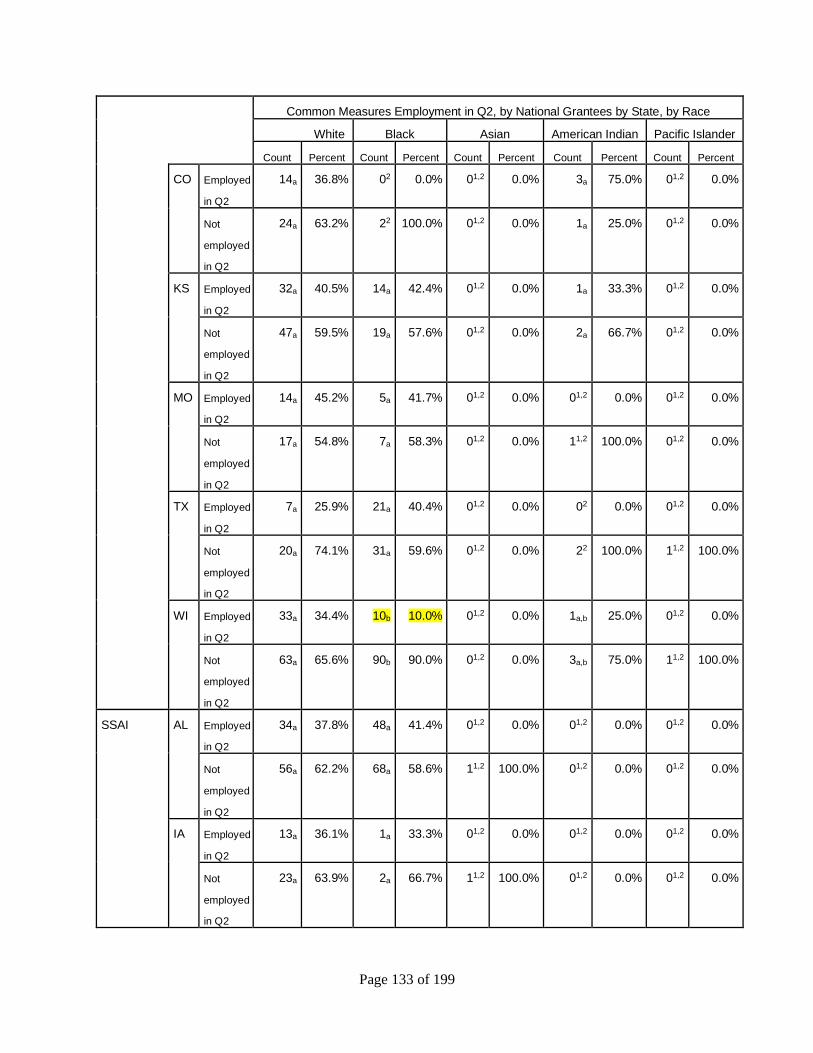
Page 133 of 199
Common Measures Employment in Q2, by National Grantees by State, by Race
White Black Asian American Indian Pacific Islander
Count Percent Count Percent Count Percent Count Percent Count Percent
CO Employed
in Q2
14a 36.8% 02 0.0% 01,2 0.0% 3a 75.0% 01,2 0.0%
Not
employed
in Q2
24a 63.2% 22 100.0% 01,2 0.0% 1a 25.0% 01,2 0.0%
KS Employed
in Q2
32a 40.5% 14a 42.4% 01,2 0.0% 1a 33.3% 01,2 0.0%
Not
employed
in Q2
47a 59.5% 19a 57.6% 01,2 0.0% 2a 66.7% 01,2 0.0%
MO Employed
in Q2
14a 45.2% 5a 41.7% 01,2 0.0% 01,2 0.0% 01,2 0.0%
Not
employed
in Q2
17a 54.8% 7a 58.3% 01,2 0.0% 11,2 100.0% 01,2 0.0%
TX Employed
in Q2
7a 25.9% 21a 40.4% 01,2 0.0% 02 0.0% 01,2 0.0%
Not
employed
in Q2
20a 74.1% 31a 59.6% 01,2 0.0% 22 100.0% 11,2 100.0%
WI Employed
in Q2
33a 34.4% 10b 10.0% 01,2 0.0% 1a,b 25.0% 01,2 0.0%
Not
employed
in Q2
63a 65.6% 90b 90.0% 01,2 0.0% 3a,b 75.0% 11,2 100.0%
SSAI AL Employed
in Q2
34a 37.8% 48a 41.4% 01,2 0.0% 01,2 0.0% 01,2 0.0%
Not
employed
in Q2
56a 62.2% 68a 58.6% 11,2 100.0% 01,2 0.0% 01,2 0.0%
IA Employed
in Q2
13a 36.1% 1a 33.3% 01,2 0.0% 01,2 0.0% 01,2 0.0%
Not
employed
in Q2
23a 63.9% 2a 66.7% 11,2 100.0% 01,2 0.0% 01,2 0.0%
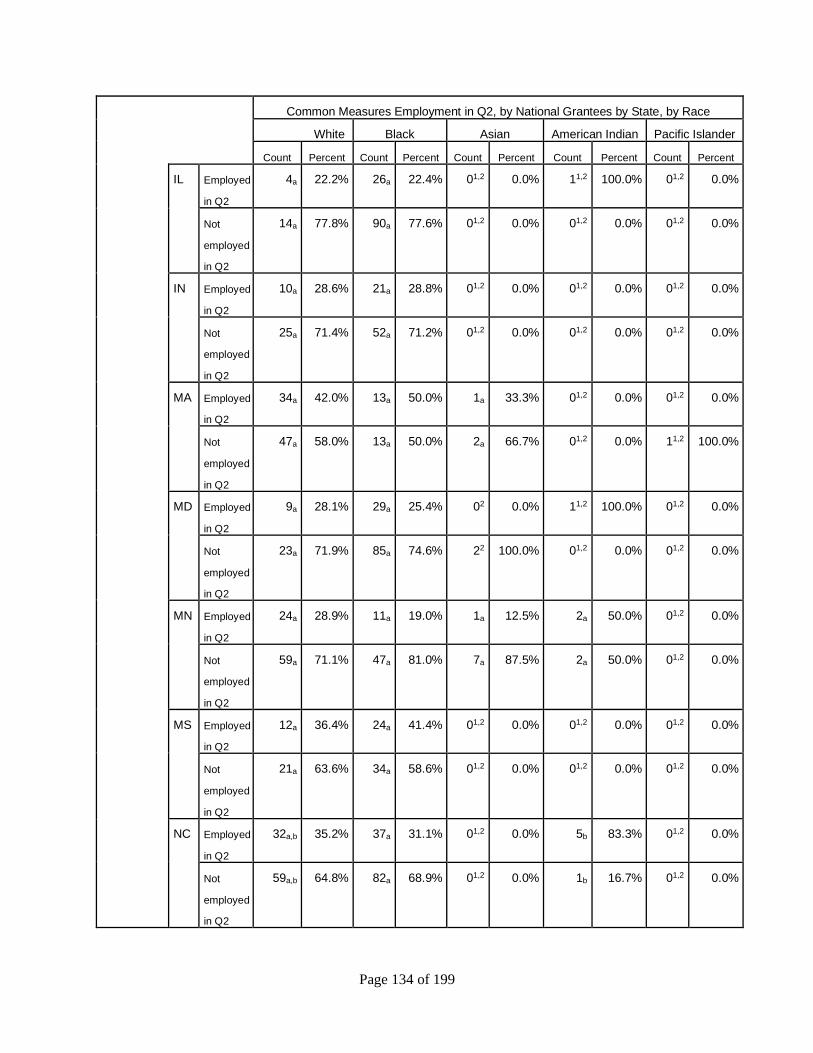
Page 134 of 199
Common Measures Employment in Q2, by National Grantees by State, by Race
White Black Asian American Indian Pacific Islander
Count Percent Count Percent Count Percent Count Percent Count Percent
IL Employed
in Q2
4a 22.2% 26a 22.4% 01,2 0.0% 11,2 100.0% 01,2 0.0%
Not
employed
in Q2
14a 77.8% 90a 77.6% 01,2 0.0% 01,2 0.0% 01,2 0.0%
IN Employed
in Q2
10a 28.6% 21a 28.8% 01,2 0.0% 01,2 0.0% 01,2 0.0%
Not
employed
in Q2
25a 71.4% 52a 71.2% 01,2 0.0% 01,2 0.0% 01,2 0.0%
MA Employed
in Q2
34a 42.0% 13a 50.0% 1a 33.3% 01,2 0.0% 01,2 0.0%
Not
employed
in Q2
47a 58.0% 13a 50.0% 2a 66.7% 01,2 0.0% 11,2 100.0%
MD Employed
in Q2
9a 28.1% 29a 25.4% 02 0.0% 11,2 100.0% 01,2 0.0%
Not
employed
in Q2
23a 71.9% 85a 74.6% 22 100.0% 01,2 0.0% 01,2 0.0%
MN Employed
in Q2
24a 28.9% 11a 19.0% 1a 12.5% 2a 50.0% 01,2 0.0%
Not
employed
in Q2
59a 71.1% 47a 81.0% 7a 87.5% 2a 50.0% 01,2 0.0%
MS Employed
in Q2
12a 36.4% 24a 41.4% 01,2 0.0% 01,2 0.0% 01,2 0.0%
Not
employed
in Q2
21a 63.6% 34a 58.6% 01,2 0.0% 01,2 0.0% 01,2 0.0%
NC Employed
in Q2
32a,b 35.2% 37a 31.1% 01,2 0.0% 5b 83.3% 01,2 0.0%
Not
employed
in Q2
59a,b 64.8% 82a 68.9% 01,2 0.0% 1b 16.7% 01,2 0.0%
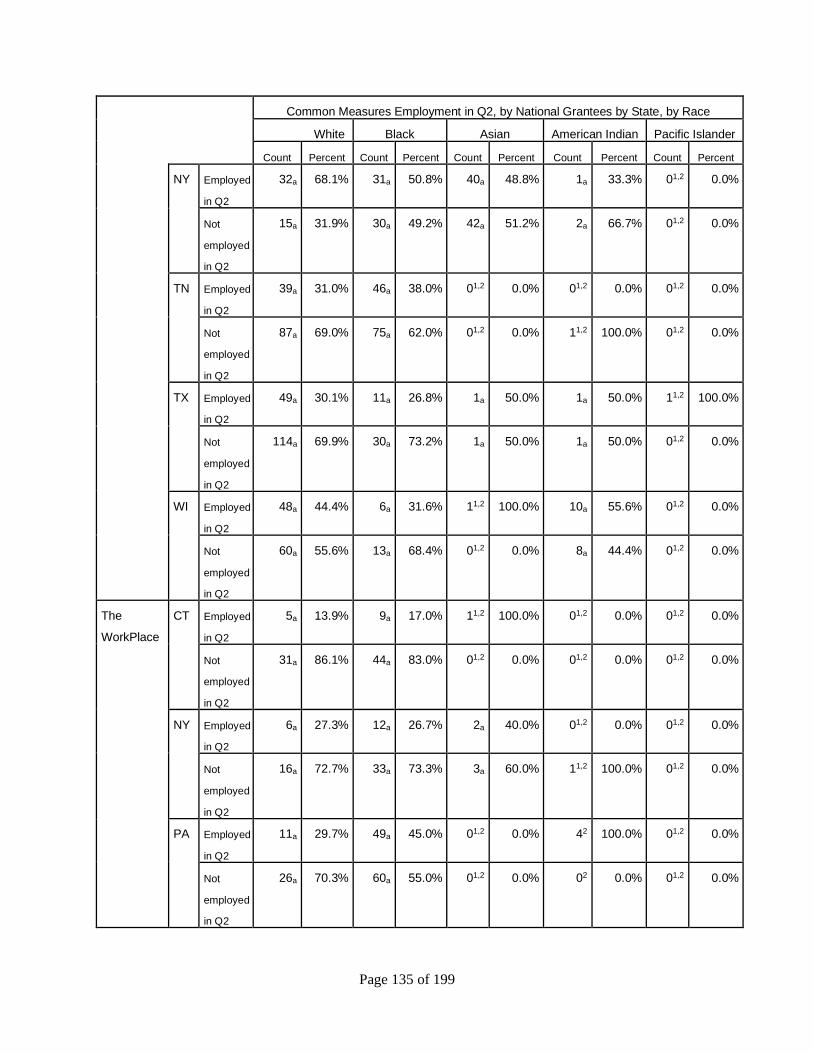
Page 135 of 199
Common Measures Employment in Q2, by National Grantees by State, by Race
White Black Asian American Indian Pacific Islander
Count Percent Count Percent Count Percent Count Percent Count Percent
NY Employed
in Q2
32a 68.1% 31a 50.8% 40a 48.8% 1a 33.3% 01,2 0.0%
Not
employed
in Q2
15a 31.9% 30a 49.2% 42a 51.2% 2a 66.7% 01,2 0.0%
TN Employed
in Q2
39a 31.0% 46a 38.0% 01,2 0.0% 01,2 0.0% 01,2 0.0%
Not
employed
in Q2
87a 69.0% 75a 62.0% 01,2 0.0% 11,2 100.0% 01,2 0.0%
TX Employed
in Q2
49a 30.1% 11a 26.8% 1a 50.0% 1a 50.0% 11,2 100.0%
Not
employed
in Q2
114a 69.9% 30a 73.2% 1a 50.0% 1a 50.0% 01,2 0.0%
WI Employed
in Q2
48a 44.4% 6a 31.6% 11,2 100.0% 10a 55.6% 01,2 0.0%
Not
employed
in Q2
60a 55.6% 13a 68.4% 01,2 0.0% 8a 44.4% 01,2 0.0%
The
WorkPlace
CT Employed
in Q2
5a 13.9% 9a 17.0% 11,2 100.0% 01,2 0.0% 01,2 0.0%
Not
employed
in Q2
31a 86.1% 44a 83.0% 01,2 0.0% 01,2 0.0% 01,2 0.0%
NY Employed
in Q2
6a 27.3% 12a 26.7% 2a 40.0% 01,2 0.0% 01,2 0.0%
Not
employed
in Q2
16a 72.7% 33a 73.3% 3a 60.0% 11,2 100.0% 01,2 0.0%
PA Employed
in Q2
11a 29.7% 49a 45.0% 01,2 0.0% 42 100.0% 01,2 0.0%
Not
employed
in Q2
26a 70.3% 60a 55.0% 01,2 0.0% 02 0.0% 01,2 0.0%
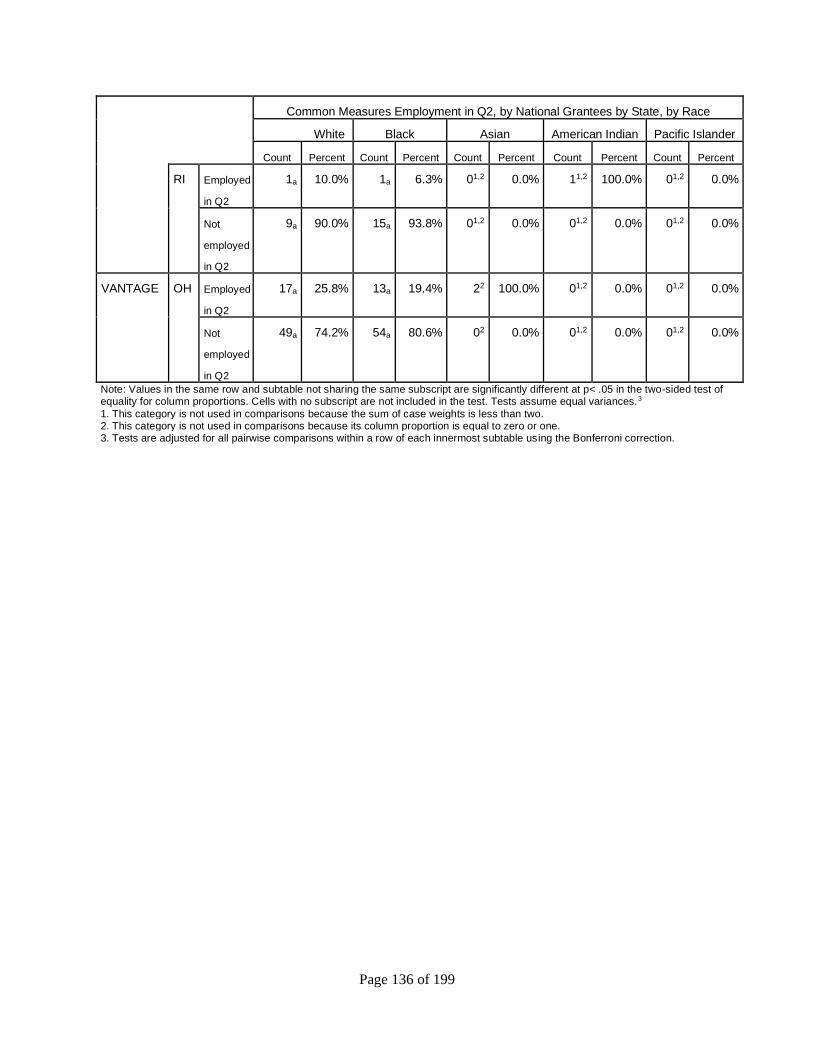
Page 136 of 199
Common Measures Employment in Q2, by National Grantees by State, by Race
White Black Asian American Indian Pacific Islander
Count Percent Count Percent Count Percent Count Percent Count Percent
RI Employed
in Q2
1a 10.0% 1a 6.3% 01,2 0.0% 11,2 100.0% 01,2 0.0%
Not
employed
in Q2
9a 90.0% 15a 93.8% 01,2 0.0% 01,2 0.0% 01,2 0.0%
VANTAGE OH Employed
in Q2
17a 25.8% 13a 19.4% 22 100.0% 01,2 0.0% 01,2 0.0%
Not
employed
in Q2
49a 74.2% 54a 80.6% 02 0.0% 01,2 0.0% 01,2 0.0%
Note: Values in the same row and subtable not sharing the same subscript are significantly different at p< .05 in the two-sided test of equality for column proportions. Cells with no subscript are not included in the test. Tests assume equal variances.3
1. This category is not used in comparisons because the sum of case weights is less than two. 2. This category is not used in comparisons because its column proportion is equal to zero or one. 3. Tests are adjusted for all pairwise comparisons within a row of each innermost subtable using the Bonferroni correction.
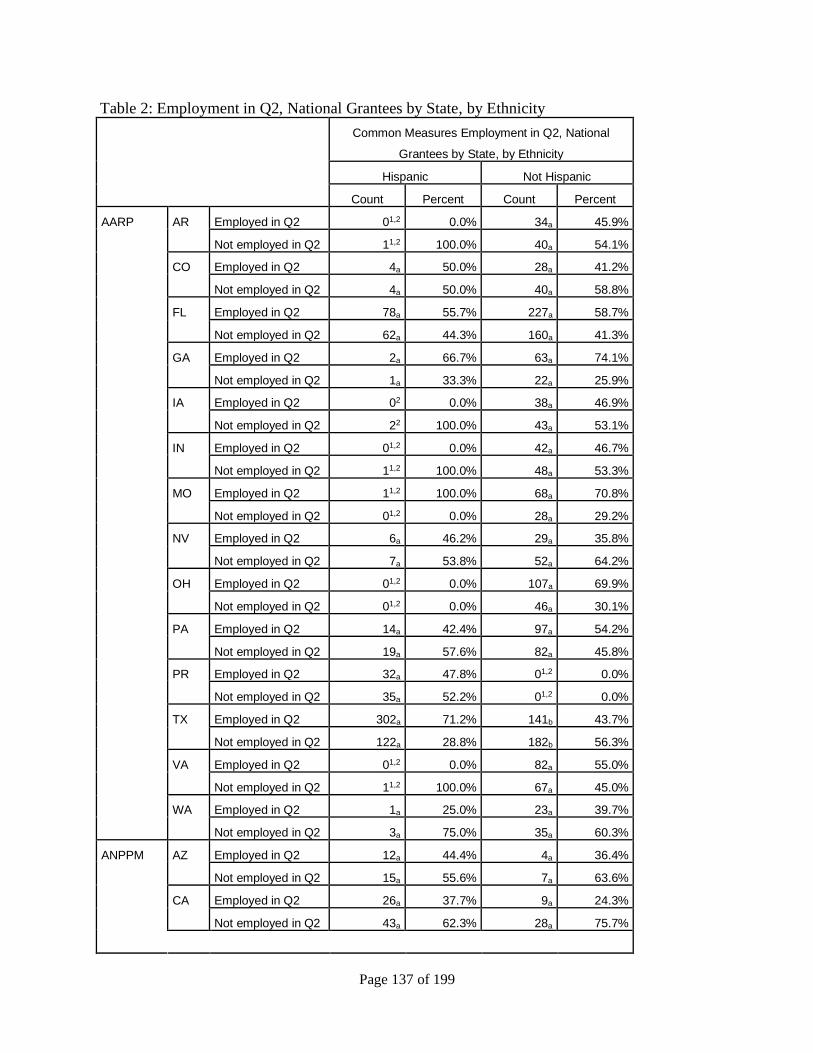
Page 137 of 199
Table 2: Employment in Q2, National Grantees by State, by Ethnicity
Common Measures Employment in Q2, National
Grantees by State, by Ethnicity
Hispanic Not Hispanic
Count Percent Count Percent
AARP AR Employed in Q2 01,2 0.0% 34a 45.9%
Not employed in Q2 11,2 100.0% 40a 54.1%
CO Employed in Q2 4a 50.0% 28a 41.2%
Not employed in Q2 4a 50.0% 40a 58.8%
FL Employed in Q2 78a 55.7% 227a 58.7%
Not employed in Q2 62a 44.3% 160a 41.3%
GA Employed in Q2 2a 66.7% 63a 74.1%
Not employed in Q2 1a 33.3% 22a 25.9%
IA Employed in Q2 02 0.0% 38a 46.9%
Not employed in Q2 22 100.0% 43a 53.1%
IN Employed in Q2 01,2 0.0% 42a 46.7%
Not employed in Q2 11,2 100.0% 48a 53.3%
MO Employed in Q2 11,2 100.0% 68a 70.8%
Not employed in Q2 01,2 0.0% 28a 29.2%
NV Employed in Q2 6a 46.2% 29a 35.8%
Not employed in Q2 7a 53.8% 52a 64.2%
OH Employed in Q2 01,2 0.0% 107a 69.9%
Not employed in Q2 01,2 0.0% 46a 30.1%
PA Employed in Q2 14a 42.4% 97a 54.2%
Not employed in Q2 19a 57.6% 82a 45.8%
PR Employed in Q2 32a 47.8% 01,2 0.0%
Not employed in Q2 35a 52.2% 01,2 0.0%
TX Employed in Q2 302a 71.2% 141b 43.7%
Not employed in Q2 122a 28.8% 182b 56.3%
VA Employed in Q2 01,2 0.0% 82a 55.0%
Not employed in Q2 11,2 100.0% 67a 45.0%
WA Employed in Q2 1a 25.0% 23a 39.7%
Not employed in Q2 3a 75.0% 35a 60.3%
ANPPM AZ Employed in Q2 12a 44.4% 4a 36.4%
Not employed in Q2 15a 55.6% 7a 63.6%
CA Employed in Q2 26a 37.7% 9a 24.3%
Not employed in Q2 43a 62.3% 28a 75.7%
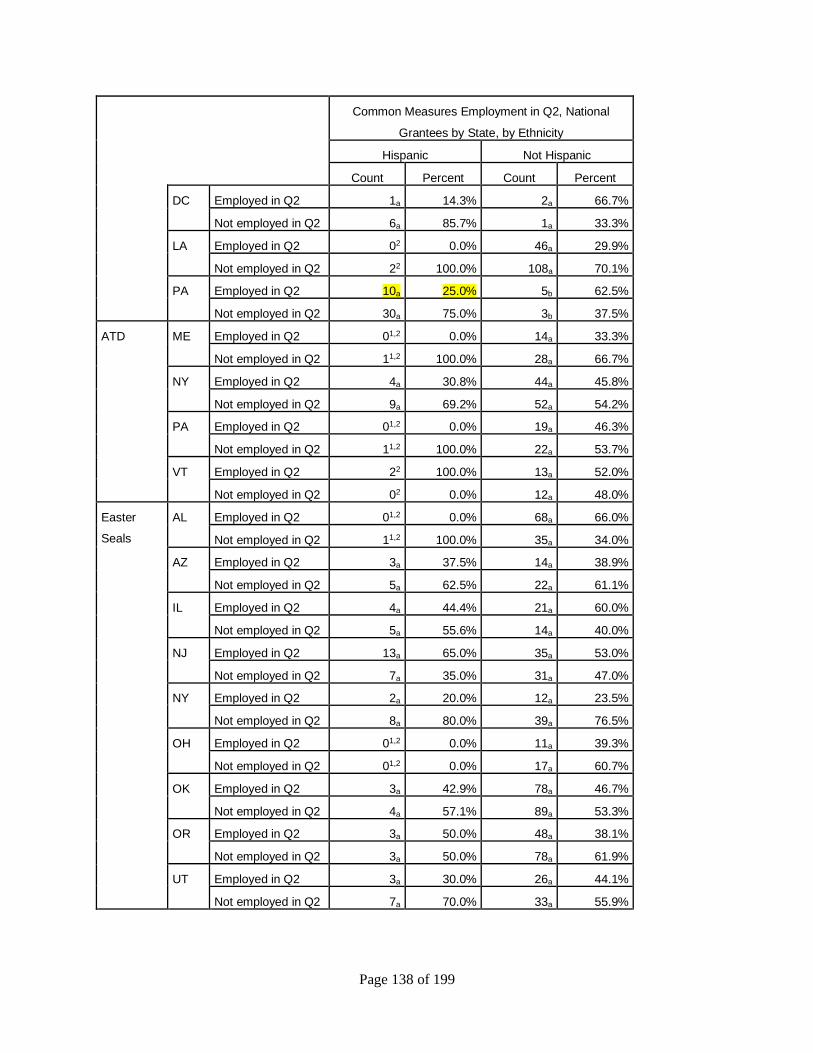
Page 138 of 199
Common Measures Employment in Q2, National
Grantees by State, by Ethnicity
Hispanic Not Hispanic
Count Percent Count Percent
DC Employed in Q2 1a 14.3% 2a 66.7%
Not employed in Q2 6a 85.7% 1a 33.3%
LA Employed in Q2 02 0.0% 46a 29.9%
Not employed in Q2 22 100.0% 108a 70.1%
PA Employed in Q2 10a 25.0% 5b 62.5%
Not employed in Q2 30a 75.0% 3b 37.5%
ATD ME Employed in Q2 01,2 0.0% 14a 33.3%
Not employed in Q2 11,2 100.0% 28a 66.7%
NY Employed in Q2 4a 30.8% 44a 45.8%
Not employed in Q2 9a 69.2% 52a 54.2%
PA Employed in Q2 01,2 0.0% 19a 46.3%
Not employed in Q2 11,2 100.0% 22a 53.7%
VT Employed in Q2 22 100.0% 13a 52.0%
Not employed in Q2 02 0.0% 12a 48.0%
Easter
Seals
AL Employed in Q2 01,2 0.0% 68a 66.0%
Not employed in Q2 11,2 100.0% 35a 34.0%
AZ Employed in Q2 3a 37.5% 14a 38.9%
Not employed in Q2 5a 62.5% 22a 61.1%
IL Employed in Q2 4a 44.4% 21a 60.0%
Not employed in Q2 5a 55.6% 14a 40.0%
NJ Employed in Q2 13a 65.0% 35a 53.0%
Not employed in Q2 7a 35.0% 31a 47.0%
NY Employed in Q2 2a 20.0% 12a 23.5%
Not employed in Q2 8a 80.0% 39a 76.5%
OH Employed in Q2 01,2 0.0% 11a 39.3%
Not employed in Q2 01,2 0.0% 17a 60.7%
OK Employed in Q2 3a 42.9% 78a 46.7%
Not employed in Q2 4a 57.1% 89a 53.3%
OR Employed in Q2 3a 50.0% 48a 38.1%
Not employed in Q2 3a 50.0% 78a 61.9%
UT Employed in Q2 3a 30.0% 26a 44.1%
Not employed in Q2 7a 70.0% 33a 55.9%
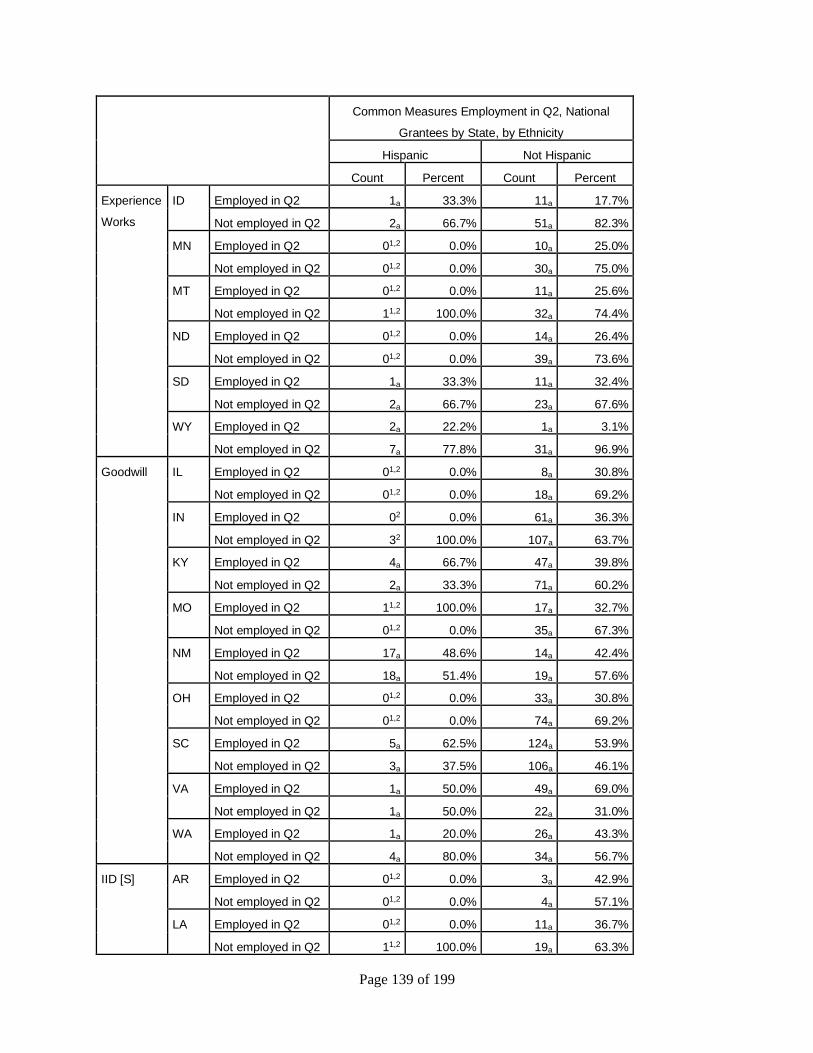
Page 139 of 199
Common Measures Employment in Q2, National
Grantees by State, by Ethnicity
Hispanic Not Hispanic
Count Percent Count Percent
Experience
Works
ID Employed in Q2 1a 33.3% 11a 17.7%
Not employed in Q2 2a 66.7% 51a 82.3%
MN Employed in Q2 01,2 0.0% 10a 25.0%
Not employed in Q2 01,2 0.0% 30a 75.0%
MT Employed in Q2 01,2 0.0% 11a 25.6%
Not employed in Q2 11,2 100.0% 32a 74.4%
ND Employed in Q2 01,2 0.0% 14a 26.4%
Not employed in Q2 01,2 0.0% 39a 73.6%
SD Employed in Q2 1a 33.3% 11a 32.4%
Not employed in Q2 2a 66.7% 23a 67.6%
WY Employed in Q2 2a 22.2% 1a 3.1%
Not employed in Q2 7a 77.8% 31a 96.9%
Goodwill IL Employed in Q2 01,2 0.0% 8a 30.8%
Not employed in Q2 01,2 0.0% 18a 69.2%
IN Employed in Q2 02 0.0% 61a 36.3%
Not employed in Q2 32 100.0% 107a 63.7%
KY Employed in Q2 4a 66.7% 47a 39.8%
Not employed in Q2 2a 33.3% 71a 60.2%
MO Employed in Q2 11,2 100.0% 17a 32.7%
Not employed in Q2 01,2 0.0% 35a 67.3%
NM Employed in Q2 17a 48.6% 14a 42.4%
Not employed in Q2 18a 51.4% 19a 57.6%
OH Employed in Q2 01,2 0.0% 33a 30.8%
Not employed in Q2 01,2 0.0% 74a 69.2%
SC Employed in Q2 5a 62.5% 124a 53.9%
Not employed in Q2 3a 37.5% 106a 46.1%
VA Employed in Q2 1a 50.0% 49a 69.0%
Not employed in Q2 1a 50.0% 22a 31.0%
WA Employed in Q2 1a 20.0% 26a 43.3%
Not employed in Q2 4a 80.0% 34a 56.7%
IID [S] AR Employed in Q2 01,2 0.0% 3a 42.9%
Not employed in Q2 01,2 0.0% 4a 57.1%
LA Employed in Q2 01,2 0.0% 11a 36.7%
Not employed in Q2 11,2 100.0% 19a 63.3%

Page 140 of 199
Common Measures Employment in Q2, National
Grantees by State, by Ethnicity
Hispanic Not Hispanic
Count Percent Count Percent
MS Employed in Q2 01,2 0.0% 1a 16.7%
Not employed in Q2 01,2 0.0% 5a 83.3%
TX Employed in Q2 01,2 0.0% 7a 58.3%
Not employed in Q2 11,2 100.0% 5a 41.7%
National
Able
Network
IA Employed in Q2 1a 50.0% 12a 16.0%
Not employed in Q2 1a 50.0% 63a 84.0%
IL Employed in Q2 01,2 0.0% 10a 34.5%
Not employed in Q2 11,2 100.0% 19a 65.5%
IN Employed in Q2 01,2 0.0% 3a 13.6%
Not employed in Q2 01,2 0.0% 19a 86.4%
NE Employed in Q2 1a 33.3% 18a 29.0%
Not employed in Q2 2a 66.7% 44a 71.0%
NAPCA [S] CA Employed in Q2 1a 50.0% 16a 32.7%
Not employed in Q2 1a 50.0% 33a 67.3%
IL Employed in Q2 01,2 0.0% 8a 50.0%
Not employed in Q2 11,2 100.0% 8a 50.0%
MA Employed in Q2 01,2 0.0% 19a 61.3%
Not employed in Q2 01,2 0.0% 12a 38.7%
NY Employed in Q2 01,2 0.0% 8a 88.9%
Not employed in Q2 01,2 0.0% 1a 11.1%
PA Employed in Q2 01,2 0.0% 6a 30.0%
Not employed in Q2 11,2 100.0% 14a 70.0%
TX Employed in Q2 01,2 0.0% 8a 61.5%
Not employed in Q2 01,2 0.0% 5a 38.5%
WA Employed in Q2 01,2 0.0% 3a 15.8%
Not employed in Q2 01,2 0.0% 16a 84.2%
NAPCA [G] CA Employed in Q2 2a 12.5% 33a 32.4%
Not employed in Q2 14a 87.5% 69a 67.6%
IL Employed in Q2 01,2 0.0% 22a 26.8%
Not employed in Q2 11,2 100.0% 60a 73.2%
NY Employed in Q2 01,2 0.0% 6a 85.7%
Not employed in Q2 01,2 0.0% 1a 14.3%
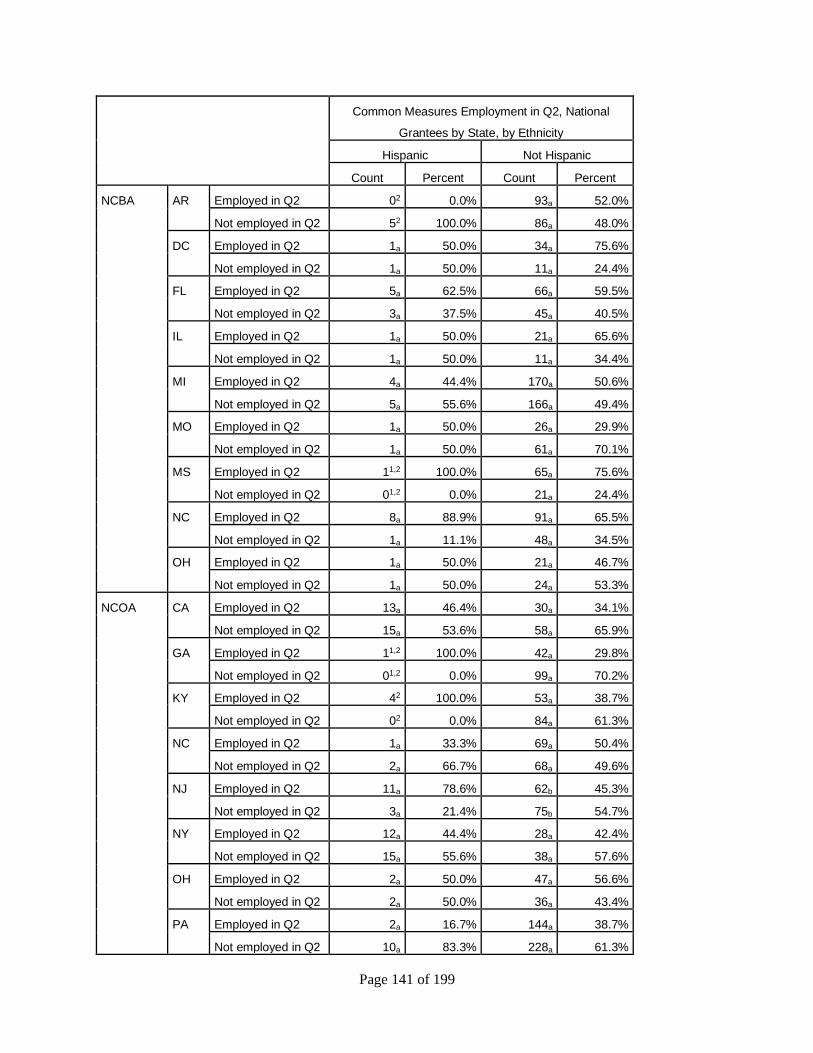
Page 141 of 199
Common Measures Employment in Q2, National
Grantees by State, by Ethnicity
Hispanic Not Hispanic
Count Percent Count Percent
NCBA AR Employed in Q2 02 0.0% 93a 52.0%
Not employed in Q2 52 100.0% 86a 48.0%
DC Employed in Q2 1a 50.0% 34a 75.6%
Not employed in Q2 1a 50.0% 11a 24.4%
FL Employed in Q2 5a 62.5% 66a 59.5%
Not employed in Q2 3a 37.5% 45a 40.5%
IL Employed in Q2 1a 50.0% 21a 65.6%
Not employed in Q2 1a 50.0% 11a 34.4%
MI Employed in Q2 4a 44.4% 170a 50.6%
Not employed in Q2 5a 55.6% 166a 49.4%
MO Employed in Q2 1a 50.0% 26a 29.9%
Not employed in Q2 1a 50.0% 61a 70.1%
MS Employed in Q2 11,2 100.0% 65a 75.6%
Not employed in Q2 01,2 0.0% 21a 24.4%
NC Employed in Q2 8a 88.9% 91a 65.5%
Not employed in Q2 1a 11.1% 48a 34.5%
OH Employed in Q2 1a 50.0% 21a 46.7%
Not employed in Q2 1a 50.0% 24a 53.3%
NCOA CA Employed in Q2 13a 46.4% 30a 34.1%
Not employed in Q2 15a 53.6% 58a 65.9%
GA Employed in Q2 11,2 100.0% 42a 29.8%
Not employed in Q2 01,2 0.0% 99a 70.2%
KY Employed in Q2 42 100.0% 53a 38.7%
Not employed in Q2 02 0.0% 84a 61.3%
NC Employed in Q2 1a 33.3% 69a 50.4%
Not employed in Q2 2a 66.7% 68a 49.6%
NJ Employed in Q2 11a 78.6% 62b 45.3%
Not employed in Q2 3a 21.4% 75b 54.7%
NY Employed in Q2 12a 44.4% 28a 42.4%
Not employed in Q2 15a 55.6% 38a 57.6%
OH Employed in Q2 2a 50.0% 47a 56.6%
Not employed in Q2 2a 50.0% 36a 43.4%
PA Employed in Q2 2a 16.7% 144a 38.7%
Not employed in Q2 10a 83.3% 228a 61.3%
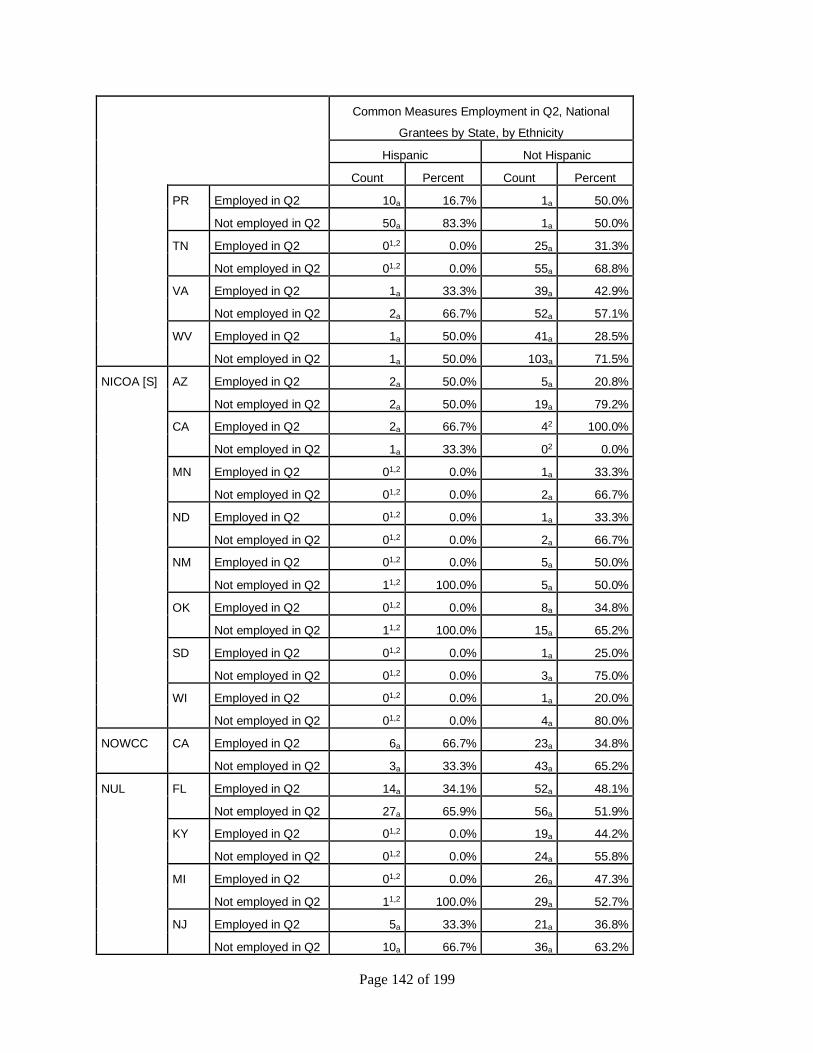
Page 142 of 199
Common Measures Employment in Q2, National
Grantees by State, by Ethnicity
Hispanic Not Hispanic
Count Percent Count Percent
PR Employed in Q2 10a 16.7% 1a 50.0%
Not employed in Q2 50a 83.3% 1a 50.0%
TN Employed in Q2 01,2 0.0% 25a 31.3%
Not employed in Q2 01,2 0.0% 55a 68.8%
VA Employed in Q2 1a 33.3% 39a 42.9%
Not employed in Q2 2a 66.7% 52a 57.1%
WV Employed in Q2 1a 50.0% 41a 28.5%
Not employed in Q2 1a 50.0% 103a 71.5%
NICOA [S] AZ Employed in Q2 2a 50.0% 5a 20.8%
Not employed in Q2 2a 50.0% 19a 79.2%
CA Employed in Q2 2a 66.7% 42 100.0%
Not employed in Q2 1a 33.3% 02 0.0%
MN Employed in Q2 01,2 0.0% 1a 33.3%
Not employed in Q2 01,2 0.0% 2a 66.7%
ND Employed in Q2 01,2 0.0% 1a 33.3%
Not employed in Q2 01,2 0.0% 2a 66.7%
NM Employed in Q2 01,2 0.0% 5a 50.0%
Not employed in Q2 11,2 100.0% 5a 50.0%
OK Employed in Q2 01,2 0.0% 8a 34.8%
Not employed in Q2 11,2 100.0% 15a 65.2%
SD Employed in Q2 01,2 0.0% 1a 25.0%
Not employed in Q2 01,2 0.0% 3a 75.0%
WI Employed in Q2 01,2 0.0% 1a 20.0%
Not employed in Q2 01,2 0.0% 4a 80.0%
NOWCC CA Employed in Q2 6a 66.7% 23a 34.8%
Not employed in Q2 3a 33.3% 43a 65.2%
NUL FL Employed in Q2 14a 34.1% 52a 48.1%
Not employed in Q2 27a 65.9% 56a 51.9%
KY Employed in Q2 01,2 0.0% 19a 44.2%
Not employed in Q2 01,2 0.0% 24a 55.8%
MI Employed in Q2 01,2 0.0% 26a 47.3%
Not employed in Q2 11,2 100.0% 29a 52.7%
NJ Employed in Q2 5a 33.3% 21a 36.8%
Not employed in Q2 10a 66.7% 36a 63.2%
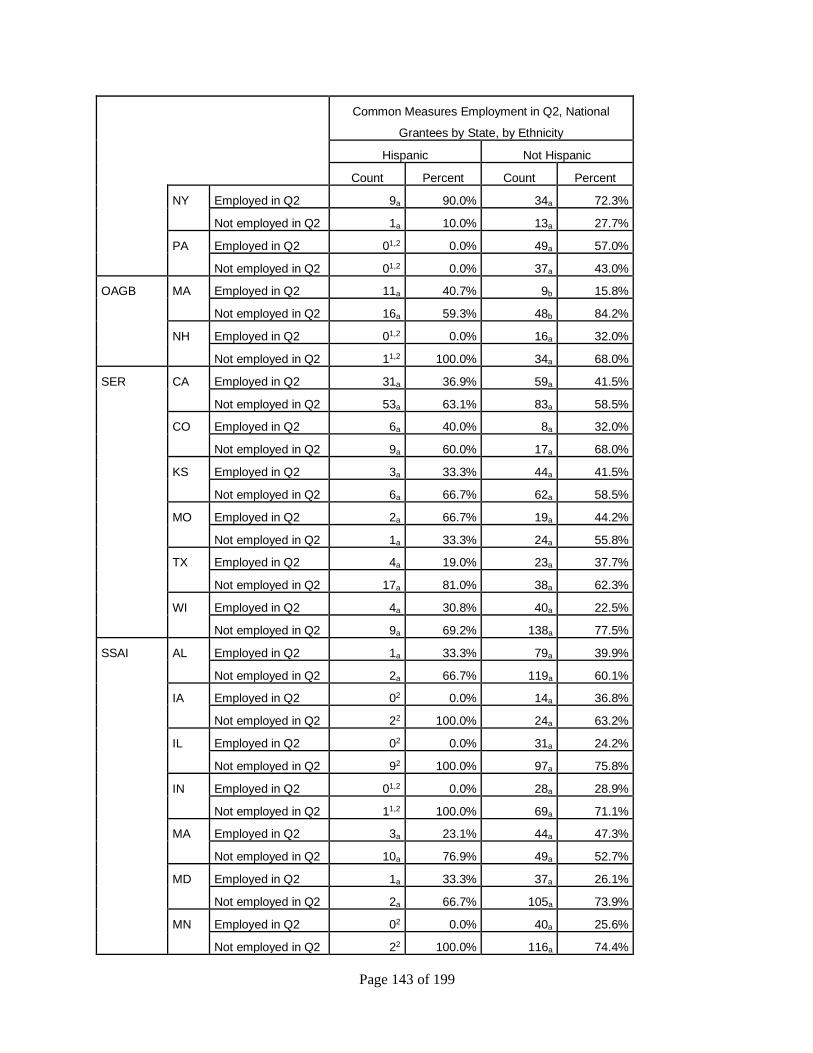
Page 143 of 199
Common Measures Employment in Q2, National
Grantees by State, by Ethnicity
Hispanic Not Hispanic
Count Percent Count Percent
NY Employed in Q2 9a 90.0% 34a 72.3%
Not employed in Q2 1a 10.0% 13a 27.7%
PA Employed in Q2 01,2 0.0% 49a 57.0%
Not employed in Q2 01,2 0.0% 37a 43.0%
OAGB MA Employed in Q2 11a 40.7% 9b 15.8%
Not employed in Q2 16a 59.3% 48b 84.2%
NH Employed in Q2 01,2 0.0% 16a 32.0%
Not employed in Q2 11,2 100.0% 34a 68.0%
SER CA Employed in Q2 31a 36.9% 59a 41.5%
Not employed in Q2 53a 63.1% 83a 58.5%
CO Employed in Q2 6a 40.0% 8a 32.0%
Not employed in Q2 9a 60.0% 17a 68.0%
KS Employed in Q2 3a 33.3% 44a 41.5%
Not employed in Q2 6a 66.7% 62a 58.5%
MO Employed in Q2 2a 66.7% 19a 44.2%
Not employed in Q2 1a 33.3% 24a 55.8%
TX Employed in Q2 4a 19.0% 23a 37.7%
Not employed in Q2 17a 81.0% 38a 62.3%
WI Employed in Q2 4a 30.8% 40a 22.5%
Not employed in Q2 9a 69.2% 138a 77.5%
SSAI AL Employed in Q2 1a 33.3% 79a 39.9%
Not employed in Q2 2a 66.7% 119a 60.1%
IA Employed in Q2 02 0.0% 14a 36.8%
Not employed in Q2 22 100.0% 24a 63.2%
IL Employed in Q2 02 0.0% 31a 24.2%
Not employed in Q2 92 100.0% 97a 75.8%
IN Employed in Q2 01,2 0.0% 28a 28.9%
Not employed in Q2 11,2 100.0% 69a 71.1%
MA Employed in Q2 3a 23.1% 44a 47.3%
Not employed in Q2 10a 76.9% 49a 52.7%
MD Employed in Q2 1a 33.3% 37a 26.1%
Not employed in Q2 2a 66.7% 105a 73.9%
MN Employed in Q2 02 0.0% 40a 25.6%
Not employed in Q2 22 100.0% 116a 74.4%
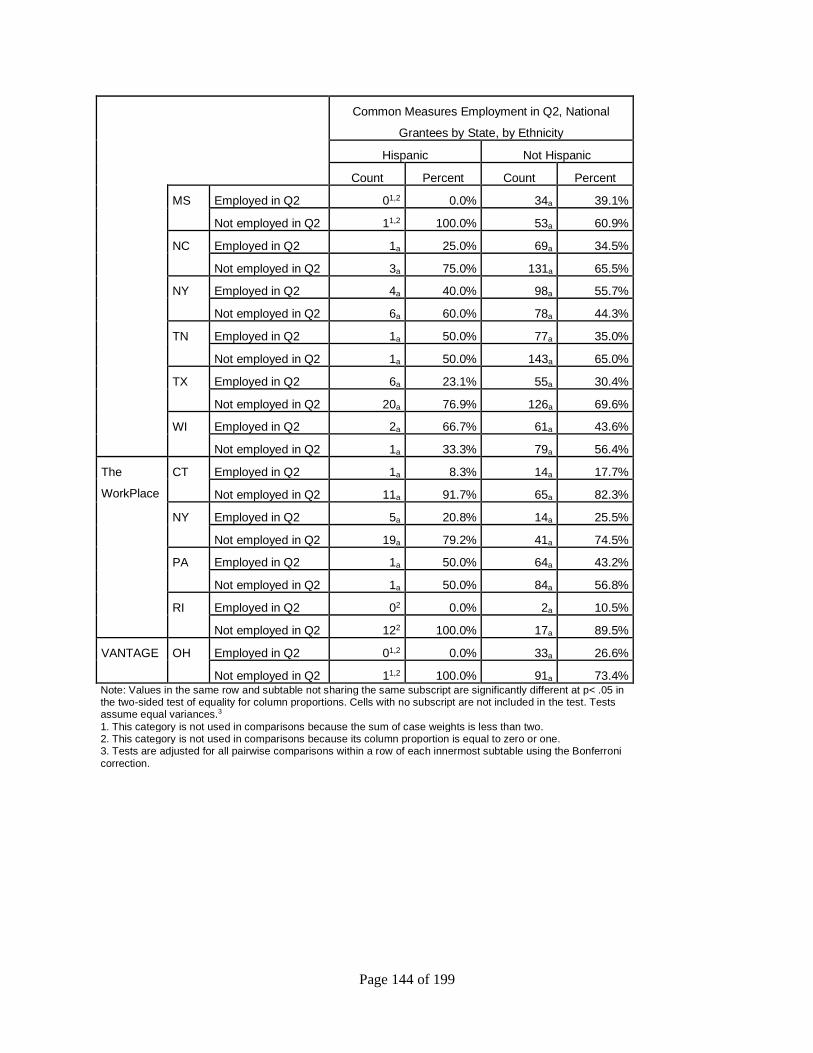
Page 144 of 199
Common Measures Employment in Q2, National
Grantees by State, by Ethnicity
Hispanic Not Hispanic
Count Percent Count Percent
MS Employed in Q2 01,2 0.0% 34a 39.1%
Not employed in Q2 11,2 100.0% 53a 60.9%
NC Employed in Q2 1a 25.0% 69a 34.5%
Not employed in Q2 3a 75.0% 131a 65.5%
NY Employed in Q2 4a 40.0% 98a 55.7%
Not employed in Q2 6a 60.0% 78a 44.3%
TN Employed in Q2 1a 50.0% 77a 35.0%
Not employed in Q2 1a 50.0% 143a 65.0%
TX Employed in Q2 6a 23.1% 55a 30.4%
Not employed in Q2 20a 76.9% 126a 69.6%
WI Employed in Q2 2a 66.7% 61a 43.6%
Not employed in Q2 1a 33.3% 79a 56.4%
The
WorkPlace
CT Employed in Q2 1a 8.3% 14a 17.7%
Not employed in Q2 11a 91.7% 65a 82.3%
NY Employed in Q2 5a 20.8% 14a 25.5%
Not employed in Q2 19a 79.2% 41a 74.5%
PA Employed in Q2 1a 50.0% 64a 43.2%
Not employed in Q2 1a 50.0% 84a 56.8%
RI Employed in Q2 02 0.0% 2a 10.5%
Not employed in Q2 122 100.0% 17a 89.5%
VANTAGE OH Employed in Q2 01,2 0.0% 33a 26.6%
Not employed in Q2 11,2 100.0% 91a 73.4% Note: Values in the same row and subtable not sharing the same subscript are significantly different at p< .05 in the two-sided test of equality for column proportions. Cells with no subscript are not included in the test. Tests assume equal variances.3
1. This category is not used in comparisons because the sum of case weights is less than two. 2. This category is not used in comparisons because its column proportion is equal to zero or one. 3. Tests are adjusted for all pairwise comparisons within a row of each innermost subtable using the Bonferroni
correction.
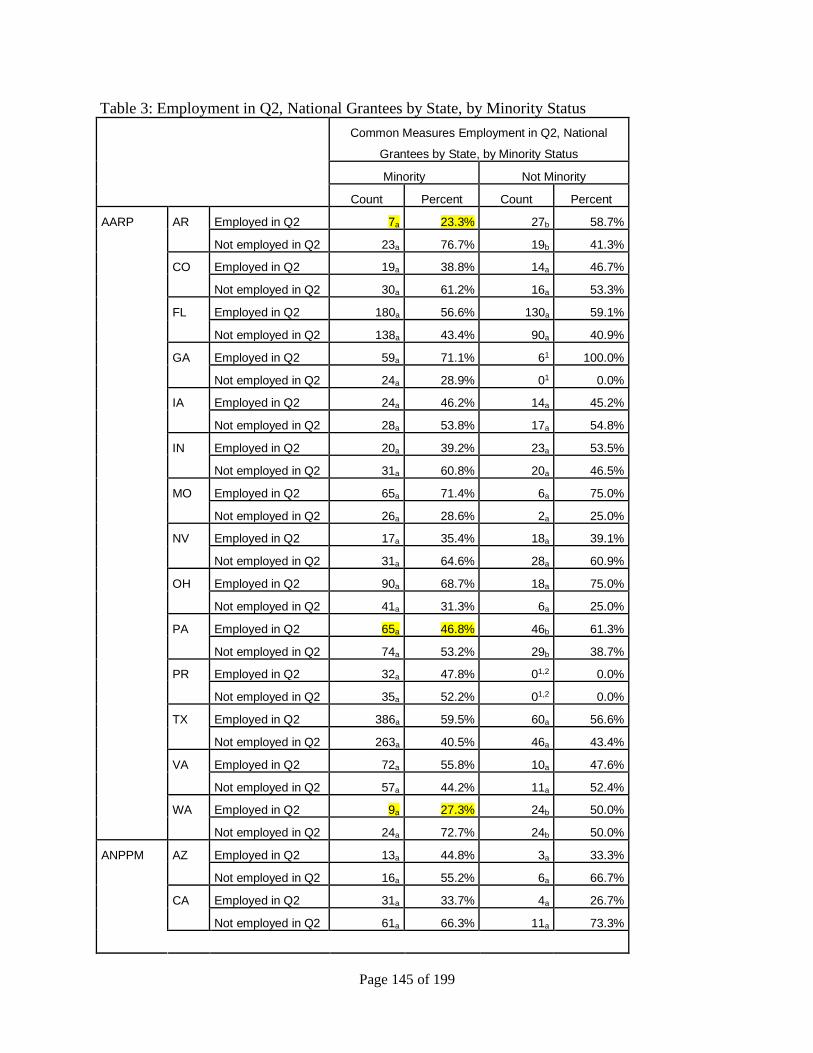
Page 145 of 199
Table 3: Employment in Q2, National Grantees by State, by Minority Status
Common Measures Employment in Q2, National
Grantees by State, by Minority Status
Minority Not Minority
Count Percent Count Percent
AARP AR Employed in Q2 7a 23.3% 27b 58.7%
Not employed in Q2 23a 76.7% 19b 41.3%
CO Employed in Q2 19a 38.8% 14a 46.7%
Not employed in Q2 30a 61.2% 16a 53.3%
FL Employed in Q2 180a 56.6% 130a 59.1%
Not employed in Q2 138a 43.4% 90a 40.9%
GA Employed in Q2 59a 71.1% 61 100.0%
Not employed in Q2 24a 28.9% 01 0.0%
IA Employed in Q2 24a 46.2% 14a 45.2%
Not employed in Q2 28a 53.8% 17a 54.8%
IN Employed in Q2 20a 39.2% 23a 53.5%
Not employed in Q2 31a 60.8% 20a 46.5%
MO Employed in Q2 65a 71.4% 6a 75.0%
Not employed in Q2 26a 28.6% 2a 25.0%
NV Employed in Q2 17a 35.4% 18a 39.1%
Not employed in Q2 31a 64.6% 28a 60.9%
OH Employed in Q2 90a 68.7% 18a 75.0%
Not employed in Q2 41a 31.3% 6a 25.0%
PA Employed in Q2 65a 46.8% 46b 61.3%
Not employed in Q2 74a 53.2% 29b 38.7%
PR Employed in Q2 32a 47.8% 01,2 0.0%
Not employed in Q2 35a 52.2% 01,2 0.0%
TX Employed in Q2 386a 59.5% 60a 56.6%
Not employed in Q2 263a 40.5% 46a 43.4%
VA Employed in Q2 72a 55.8% 10a 47.6%
Not employed in Q2 57a 44.2% 11a 52.4%
WA Employed in Q2 9a 27.3% 24b 50.0%
Not employed in Q2 24a 72.7% 24b 50.0%
ANPPM AZ Employed in Q2 13a 44.8% 3a 33.3%
Not employed in Q2 16a 55.2% 6a 66.7%
CA Employed in Q2 31a 33.7% 4a 26.7%
Not employed in Q2 61a 66.3% 11a 73.3%
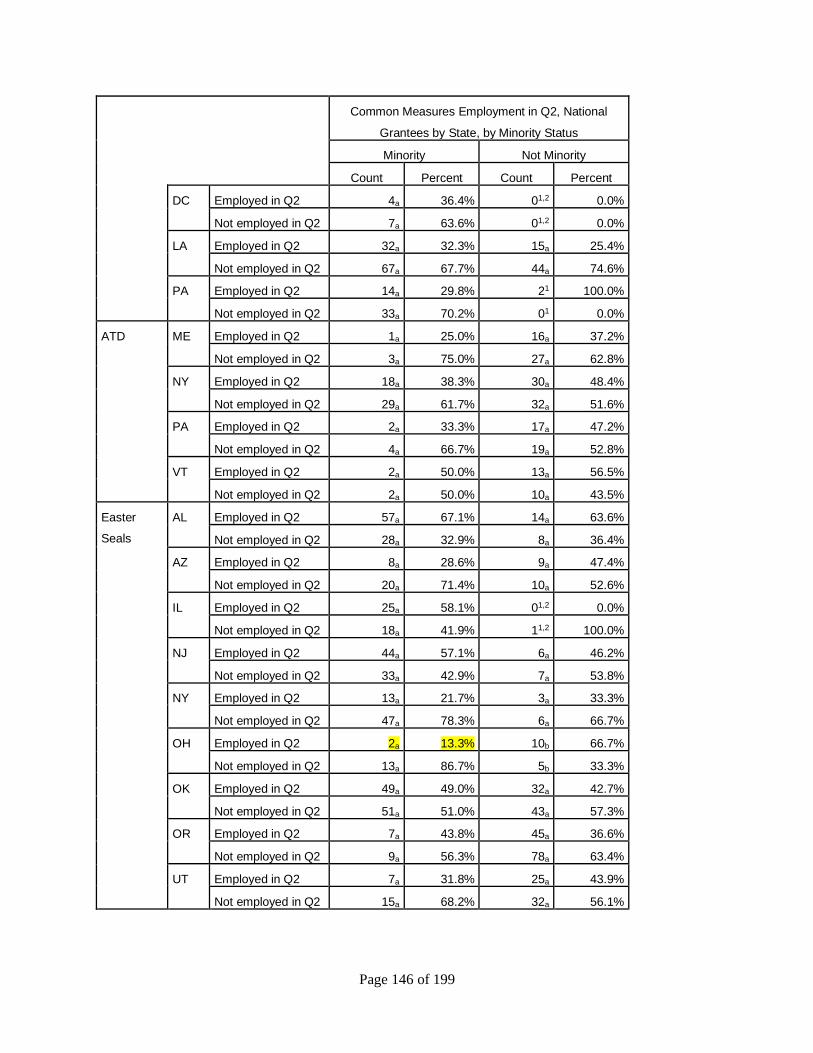
Page 146 of 199
Common Measures Employment in Q2, National
Grantees by State, by Minority Status
Minority Not Minority
Count Percent Count Percent
DC Employed in Q2 4a 36.4% 01,2 0.0%
Not employed in Q2 7a 63.6% 01,2 0.0%
LA Employed in Q2 32a 32.3% 15a 25.4%
Not employed in Q2 67a 67.7% 44a 74.6%
PA Employed in Q2 14a 29.8% 21 100.0%
Not employed in Q2 33a 70.2% 01 0.0%
ATD ME Employed in Q2 1a 25.0% 16a 37.2%
Not employed in Q2 3a 75.0% 27a 62.8%
NY Employed in Q2 18a 38.3% 30a 48.4%
Not employed in Q2 29a 61.7% 32a 51.6%
PA Employed in Q2 2a 33.3% 17a 47.2%
Not employed in Q2 4a 66.7% 19a 52.8%
VT Employed in Q2 2a 50.0% 13a 56.5%
Not employed in Q2 2a 50.0% 10a 43.5%
Easter
Seals
AL Employed in Q2 57a 67.1% 14a 63.6%
Not employed in Q2 28a 32.9% 8a 36.4%
AZ Employed in Q2 8a 28.6% 9a 47.4%
Not employed in Q2 20a 71.4% 10a 52.6%
IL Employed in Q2 25a 58.1% 01,2 0.0%
Not employed in Q2 18a 41.9% 11,2 100.0%
NJ Employed in Q2 44a 57.1% 6a 46.2%
Not employed in Q2 33a 42.9% 7a 53.8%
NY Employed in Q2 13a 21.7% 3a 33.3%
Not employed in Q2 47a 78.3% 6a 66.7%
OH Employed in Q2 2a 13.3% 10b 66.7%
Not employed in Q2 13a 86.7% 5b 33.3%
OK Employed in Q2 49a 49.0% 32a 42.7%
Not employed in Q2 51a 51.0% 43a 57.3%
OR Employed in Q2 7a 43.8% 45a 36.6%
Not employed in Q2 9a 56.3% 78a 63.4%
UT Employed in Q2 7a 31.8% 25a 43.9%
Not employed in Q2 15a 68.2% 32a 56.1%
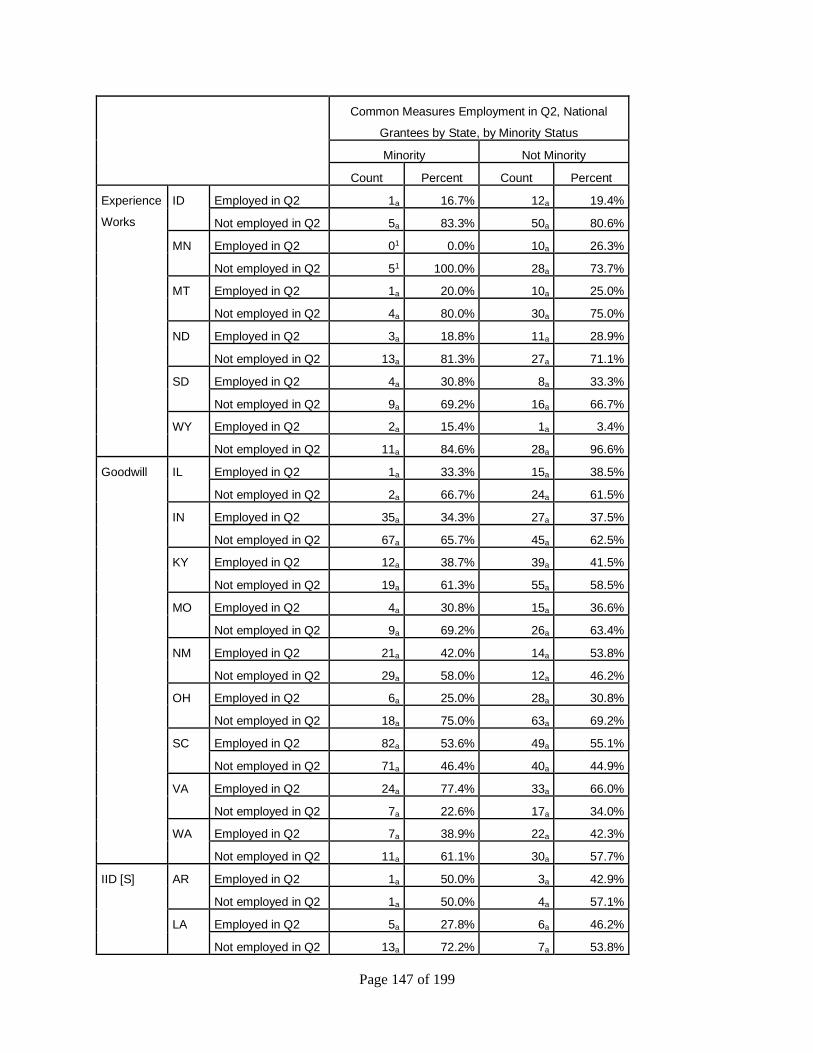
Page 147 of 199
Common Measures Employment in Q2, National
Grantees by State, by Minority Status
Minority Not Minority
Count Percent Count Percent
Experience
Works
ID Employed in Q2 1a 16.7% 12a 19.4%
Not employed in Q2 5a 83.3% 50a 80.6%
MN Employed in Q2 01 0.0% 10a 26.3%
Not employed in Q2 51 100.0% 28a 73.7%
MT Employed in Q2 1a 20.0% 10a 25.0%
Not employed in Q2 4a 80.0% 30a 75.0%
ND Employed in Q2 3a 18.8% 11a 28.9%
Not employed in Q2 13a 81.3% 27a 71.1%
SD Employed in Q2 4a 30.8% 8a 33.3%
Not employed in Q2 9a 69.2% 16a 66.7%
WY Employed in Q2 2a 15.4% 1a 3.4%
Not employed in Q2 11a 84.6% 28a 96.6%
Goodwill IL Employed in Q2 1a 33.3% 15a 38.5%
Not employed in Q2 2a 66.7% 24a 61.5%
IN Employed in Q2 35a 34.3% 27a 37.5%
Not employed in Q2 67a 65.7% 45a 62.5%
KY Employed in Q2 12a 38.7% 39a 41.5%
Not employed in Q2 19a 61.3% 55a 58.5%
MO Employed in Q2 4a 30.8% 15a 36.6%
Not employed in Q2 9a 69.2% 26a 63.4%
NM Employed in Q2 21a 42.0% 14a 53.8%
Not employed in Q2 29a 58.0% 12a 46.2%
OH Employed in Q2 6a 25.0% 28a 30.8%
Not employed in Q2 18a 75.0% 63a 69.2%
SC Employed in Q2 82a 53.6% 49a 55.1%
Not employed in Q2 71a 46.4% 40a 44.9%
VA Employed in Q2 24a 77.4% 33a 66.0%
Not employed in Q2 7a 22.6% 17a 34.0%
WA Employed in Q2 7a 38.9% 22a 42.3%
Not employed in Q2 11a 61.1% 30a 57.7%
IID [S] AR Employed in Q2 1a 50.0% 3a 42.9%
Not employed in Q2 1a 50.0% 4a 57.1%
LA Employed in Q2 5a 27.8% 6a 46.2%
Not employed in Q2 13a 72.2% 7a 53.8%
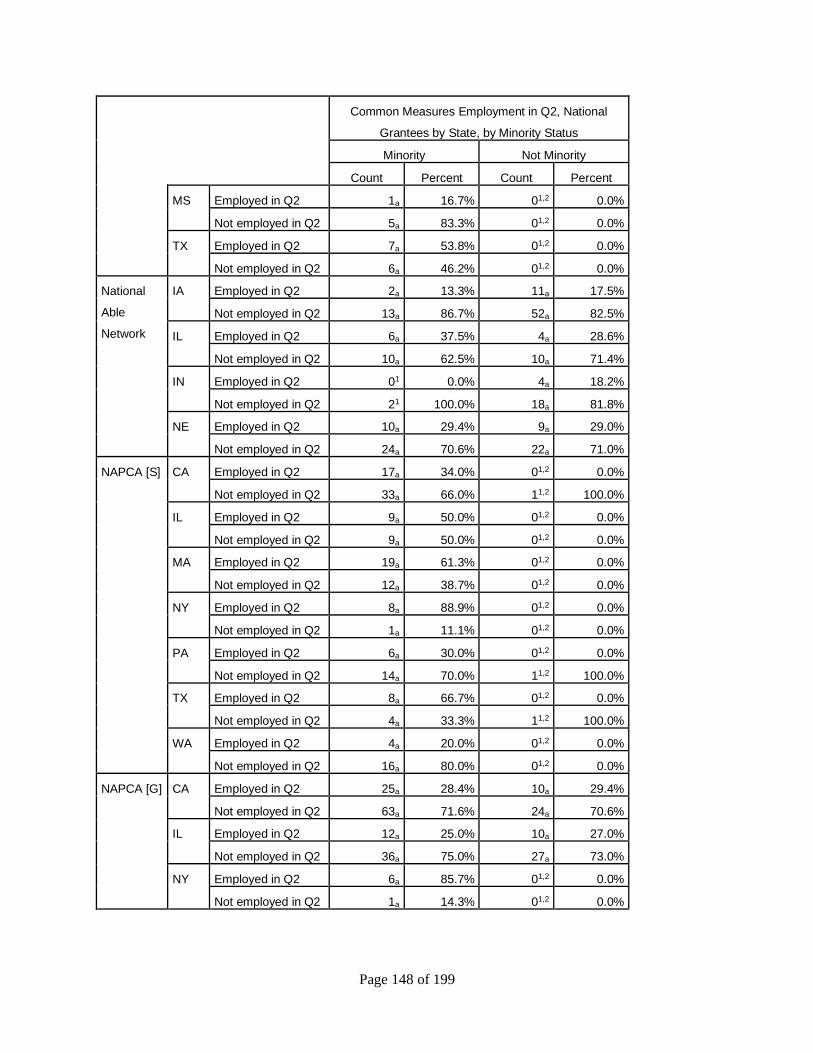
Page 148 of 199
Common Measures Employment in Q2, National
Grantees by State, by Minority Status
Minority Not Minority
Count Percent Count Percent
MS Employed in Q2 1a 16.7% 01,2 0.0%
Not employed in Q2 5a 83.3% 01,2 0.0%
TX Employed in Q2 7a 53.8% 01,2 0.0%
Not employed in Q2 6a 46.2% 01,2 0.0%
National
Able
Network
IA Employed in Q2 2a 13.3% 11a 17.5%
Not employed in Q2 13a 86.7% 52a 82.5%
IL Employed in Q2 6a 37.5% 4a 28.6%
Not employed in Q2 10a 62.5% 10a 71.4%
IN Employed in Q2 01 0.0% 4a 18.2%
Not employed in Q2 21 100.0% 18a 81.8%
NE Employed in Q2 10a 29.4% 9a 29.0%
Not employed in Q2 24a 70.6% 22a 71.0%
NAPCA [S] CA Employed in Q2 17a 34.0% 01,2 0.0%
Not employed in Q2 33a 66.0% 11,2 100.0%
IL Employed in Q2 9a 50.0% 01,2 0.0%
Not employed in Q2 9a 50.0% 01,2 0.0%
MA Employed in Q2 19a 61.3% 01,2 0.0%
Not employed in Q2 12a 38.7% 01,2 0.0%
NY Employed in Q2 8a 88.9% 01,2 0.0%
Not employed in Q2 1a 11.1% 01,2 0.0%
PA Employed in Q2 6a 30.0% 01,2 0.0%
Not employed in Q2 14a 70.0% 11,2 100.0%
TX Employed in Q2 8a 66.7% 01,2 0.0%
Not employed in Q2 4a 33.3% 11,2 100.0%
WA Employed in Q2 4a 20.0% 01,2 0.0%
Not employed in Q2 16a 80.0% 01,2 0.0%
NAPCA [G] CA Employed in Q2 25a 28.4% 10a 29.4%
Not employed in Q2 63a 71.6% 24a 70.6%
IL Employed in Q2 12a 25.0% 10a 27.0%
Not employed in Q2 36a 75.0% 27a 73.0%
NY Employed in Q2 6a 85.7% 01,2 0.0%
Not employed in Q2 1a 14.3% 01,2 0.0%
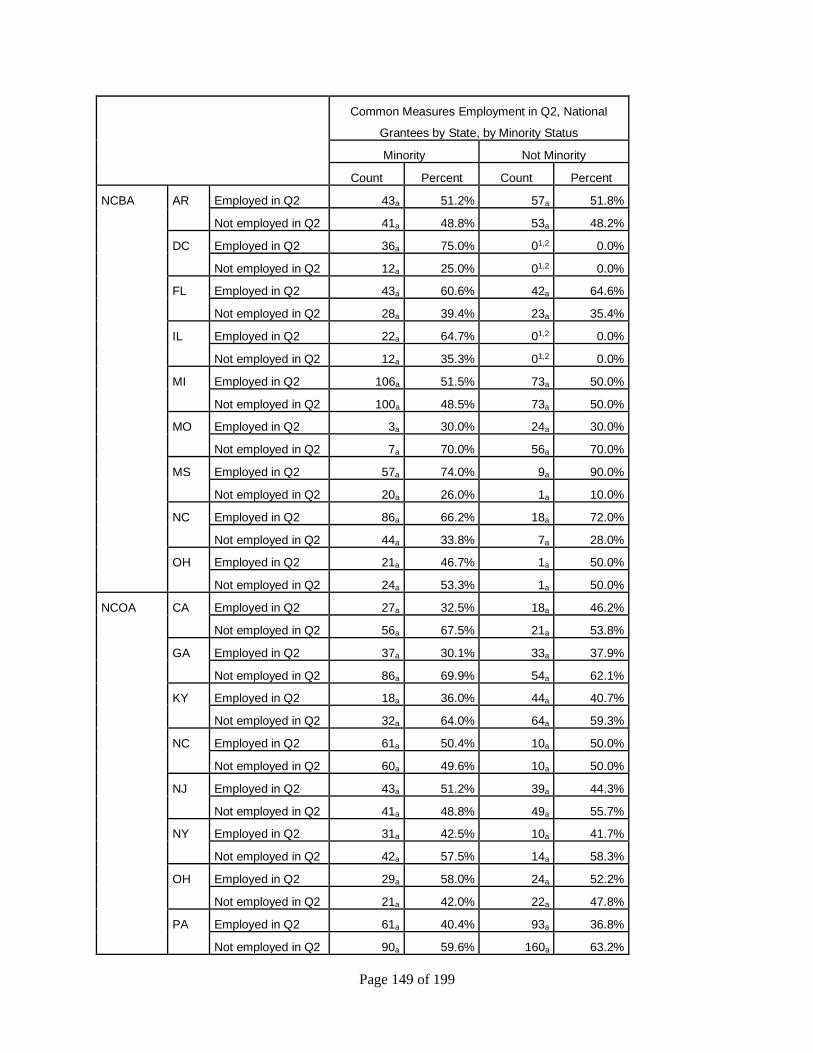
Page 149 of 199
Common Measures Employment in Q2, National
Grantees by State, by Minority Status
Minority Not Minority
Count Percent Count Percent
NCBA AR Employed in Q2 43a 51.2% 57a 51.8%
Not employed in Q2 41a 48.8% 53a 48.2%
DC Employed in Q2 36a 75.0% 01,2 0.0%
Not employed in Q2 12a 25.0% 01,2 0.0%
FL Employed in Q2 43a 60.6% 42a 64.6%
Not employed in Q2 28a 39.4% 23a 35.4%
IL Employed in Q2 22a 64.7% 01,2 0.0%
Not employed in Q2 12a 35.3% 01,2 0.0%
MI Employed in Q2 106a 51.5% 73a 50.0%
Not employed in Q2 100a 48.5% 73a 50.0%
MO Employed in Q2 3a 30.0% 24a 30.0%
Not employed in Q2 7a 70.0% 56a 70.0%
MS Employed in Q2 57a 74.0% 9a 90.0%
Not employed in Q2 20a 26.0% 1a 10.0%
NC Employed in Q2 86a 66.2% 18a 72.0%
Not employed in Q2 44a 33.8% 7a 28.0%
OH Employed in Q2 21a 46.7% 1a 50.0%
Not employed in Q2 24a 53.3% 1a 50.0%
NCOA CA Employed in Q2 27a 32.5% 18a 46.2%
Not employed in Q2 56a 67.5% 21a 53.8%
GA Employed in Q2 37a 30.1% 33a 37.9%
Not employed in Q2 86a 69.9% 54a 62.1%
KY Employed in Q2 18a 36.0% 44a 40.7%
Not employed in Q2 32a 64.0% 64a 59.3%
NC Employed in Q2 61a 50.4% 10a 50.0%
Not employed in Q2 60a 49.6% 10a 50.0%
NJ Employed in Q2 43a 51.2% 39a 44.3%
Not employed in Q2 41a 48.8% 49a 55.7%
NY Employed in Q2 31a 42.5% 10a 41.7%
Not employed in Q2 42a 57.5% 14a 58.3%
OH Employed in Q2 29a 58.0% 24a 52.2%
Not employed in Q2 21a 42.0% 22a 47.8%
PA Employed in Q2 61a 40.4% 93a 36.8%
Not employed in Q2 90a 59.6% 160a 63.2%
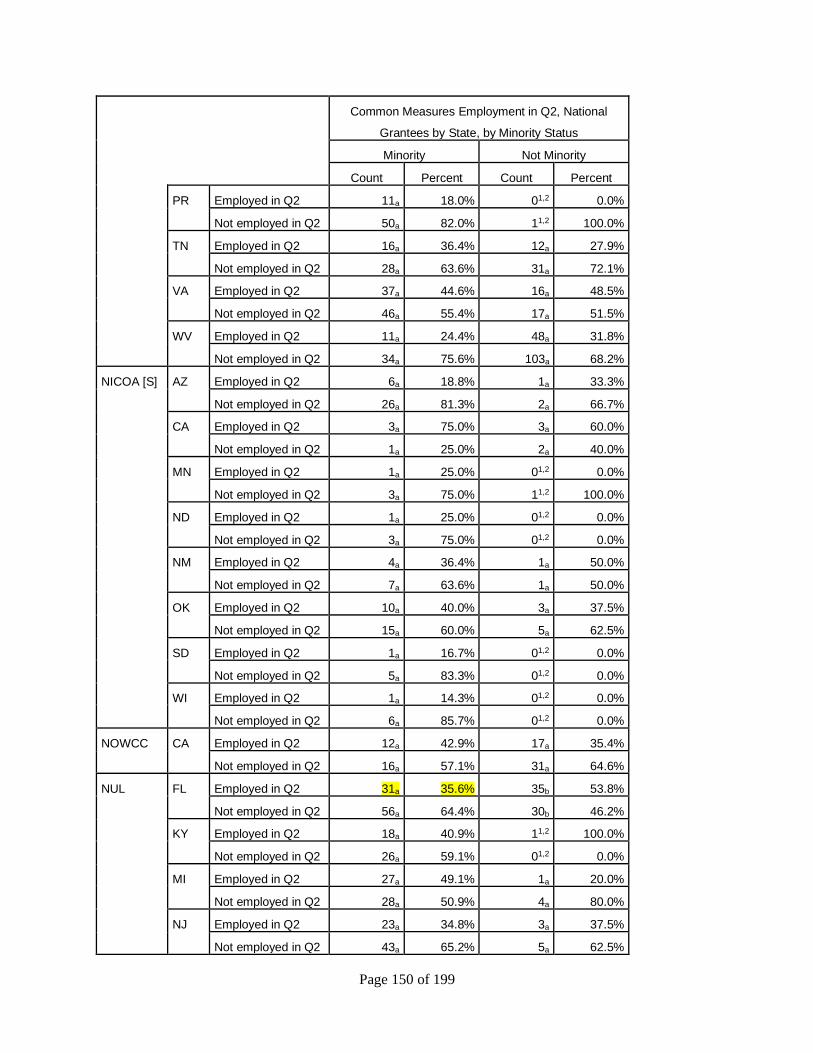
Page 150 of 199
Common Measures Employment in Q2, National
Grantees by State, by Minority Status
Minority Not Minority
Count Percent Count Percent
PR Employed in Q2 11a 18.0% 01,2 0.0%
Not employed in Q2 50a 82.0% 11,2 100.0%
TN Employed in Q2 16a 36.4% 12a 27.9%
Not employed in Q2 28a 63.6% 31a 72.1%
VA Employed in Q2 37a 44.6% 16a 48.5%
Not employed in Q2 46a 55.4% 17a 51.5%
WV Employed in Q2 11a 24.4% 48a 31.8%
Not employed in Q2 34a 75.6% 103a 68.2%
NICOA [S] AZ Employed in Q2 6a 18.8% 1a 33.3%
Not employed in Q2 26a 81.3% 2a 66.7%
CA Employed in Q2 3a 75.0% 3a 60.0%
Not employed in Q2 1a 25.0% 2a 40.0%
MN Employed in Q2 1a 25.0% 01,2 0.0%
Not employed in Q2 3a 75.0% 11,2 100.0%
ND Employed in Q2 1a 25.0% 01,2 0.0%
Not employed in Q2 3a 75.0% 01,2 0.0%
NM Employed in Q2 4a 36.4% 1a 50.0%
Not employed in Q2 7a 63.6% 1a 50.0%
OK Employed in Q2 10a 40.0% 3a 37.5%
Not employed in Q2 15a 60.0% 5a 62.5%
SD Employed in Q2 1a 16.7% 01,2 0.0%
Not employed in Q2 5a 83.3% 01,2 0.0%
WI Employed in Q2 1a 14.3% 01,2 0.0%
Not employed in Q2 6a 85.7% 01,2 0.0%
NOWCC CA Employed in Q2 12a 42.9% 17a 35.4%
Not employed in Q2 16a 57.1% 31a 64.6%
NUL FL Employed in Q2 31a 35.6% 35b 53.8%
Not employed in Q2 56a 64.4% 30b 46.2%
KY Employed in Q2 18a 40.9% 11,2 100.0%
Not employed in Q2 26a 59.1% 01,2 0.0%
MI Employed in Q2 27a 49.1% 1a 20.0%
Not employed in Q2 28a 50.9% 4a 80.0%
NJ Employed in Q2 23a 34.8% 3a 37.5%
Not employed in Q2 43a 65.2% 5a 62.5%
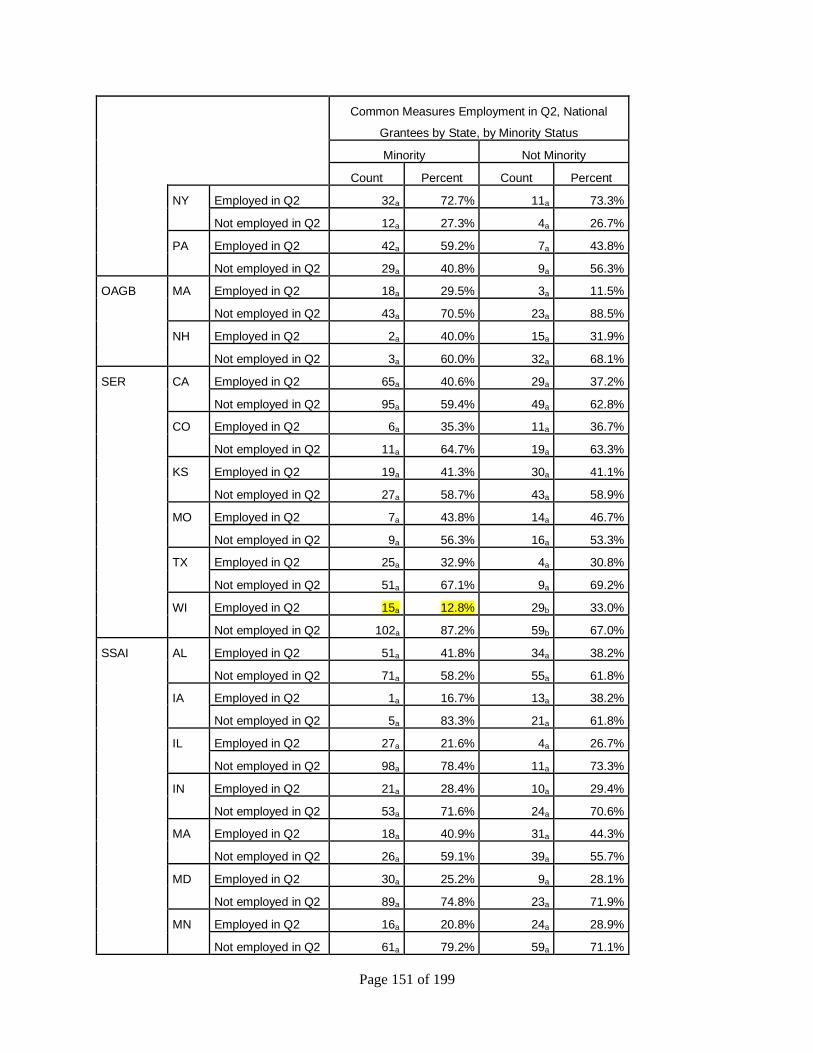
Page 151 of 199
Common Measures Employment in Q2, National
Grantees by State, by Minority Status
Minority Not Minority
Count Percent Count Percent
NY Employed in Q2 32a 72.7% 11a 73.3%
Not employed in Q2 12a 27.3% 4a 26.7%
PA Employed in Q2 42a 59.2% 7a 43.8%
Not employed in Q2 29a 40.8% 9a 56.3%
OAGB MA Employed in Q2 18a 29.5% 3a 11.5%
Not employed in Q2 43a 70.5% 23a 88.5%
NH Employed in Q2 2a 40.0% 15a 31.9%
Not employed in Q2 3a 60.0% 32a 68.1%
SER CA Employed in Q2 65a 40.6% 29a 37.2%
Not employed in Q2 95a 59.4% 49a 62.8%
CO Employed in Q2 6a 35.3% 11a 36.7%
Not employed in Q2 11a 64.7% 19a 63.3%
KS Employed in Q2 19a 41.3% 30a 41.1%
Not employed in Q2 27a 58.7% 43a 58.9%
MO Employed in Q2 7a 43.8% 14a 46.7%
Not employed in Q2 9a 56.3% 16a 53.3%
TX Employed in Q2 25a 32.9% 4a 30.8%
Not employed in Q2 51a 67.1% 9a 69.2%
WI Employed in Q2 15a 12.8% 29b 33.0%
Not employed in Q2 102a 87.2% 59b 67.0%
SSAI AL Employed in Q2 51a 41.8% 34a 38.2%
Not employed in Q2 71a 58.2% 55a 61.8%
IA Employed in Q2 1a 16.7% 13a 38.2%
Not employed in Q2 5a 83.3% 21a 61.8%
IL Employed in Q2 27a 21.6% 4a 26.7%
Not employed in Q2 98a 78.4% 11a 73.3%
IN Employed in Q2 21a 28.4% 10a 29.4%
Not employed in Q2 53a 71.6% 24a 70.6%
MA Employed in Q2 18a 40.9% 31a 44.3%
Not employed in Q2 26a 59.1% 39a 55.7%
MD Employed in Q2 30a 25.2% 9a 28.1%
Not employed in Q2 89a 74.8% 23a 71.9%
MN Employed in Q2 16a 20.8% 24a 28.9%
Not employed in Q2 61a 79.2% 59a 71.1%
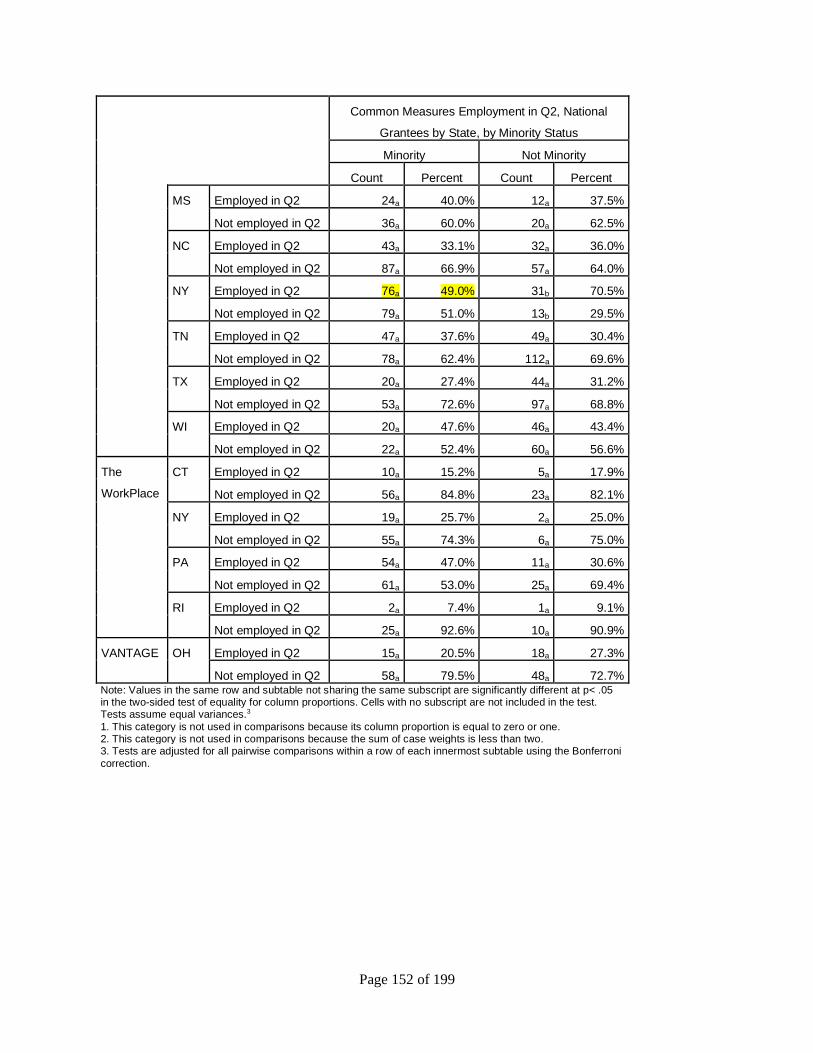
Page 152 of 199
Common Measures Employment in Q2, National
Grantees by State, by Minority Status
Minority Not Minority
Count Percent Count Percent
MS Employed in Q2 24a 40.0% 12a 37.5%
Not employed in Q2 36a 60.0% 20a 62.5%
NC Employed in Q2 43a 33.1% 32a 36.0%
Not employed in Q2 87a 66.9% 57a 64.0%
NY Employed in Q2 76a 49.0% 31b 70.5%
Not employed in Q2 79a 51.0% 13b 29.5%
TN Employed in Q2 47a 37.6% 49a 30.4%
Not employed in Q2 78a 62.4% 112a 69.6%
TX Employed in Q2 20a 27.4% 44a 31.2%
Not employed in Q2 53a 72.6% 97a 68.8%
WI Employed in Q2 20a 47.6% 46a 43.4%
Not employed in Q2 22a 52.4% 60a 56.6%
The
WorkPlace
CT Employed in Q2 10a 15.2% 5a 17.9%
Not employed in Q2 56a 84.8% 23a 82.1%
NY Employed in Q2 19a 25.7% 2a 25.0%
Not employed in Q2 55a 74.3% 6a 75.0%
PA Employed in Q2 54a 47.0% 11a 30.6%
Not employed in Q2 61a 53.0% 25a 69.4%
RI Employed in Q2 2a 7.4% 1a 9.1%
Not employed in Q2 25a 92.6% 10a 90.9%
VANTAGE OH Employed in Q2 15a 20.5% 18a 27.3%
Not employed in Q2 58a 79.5% 48a 72.7% Note: Values in the same row and subtable not sharing the same subscript are significantly different at p< .05 in the two-sided test of equality for column proportions. Cells with no subscript are not included in the test. Tests assume equal variances.3
1. This category is not used in comparisons because its column proportion is equal to zero or one. 2. This category is not used in comparisons because the sum of case weights is less than two. 3. Tests are adjusted for all pairwise comparisons within a row of each innermost subtable using the Bonferroni
correction.
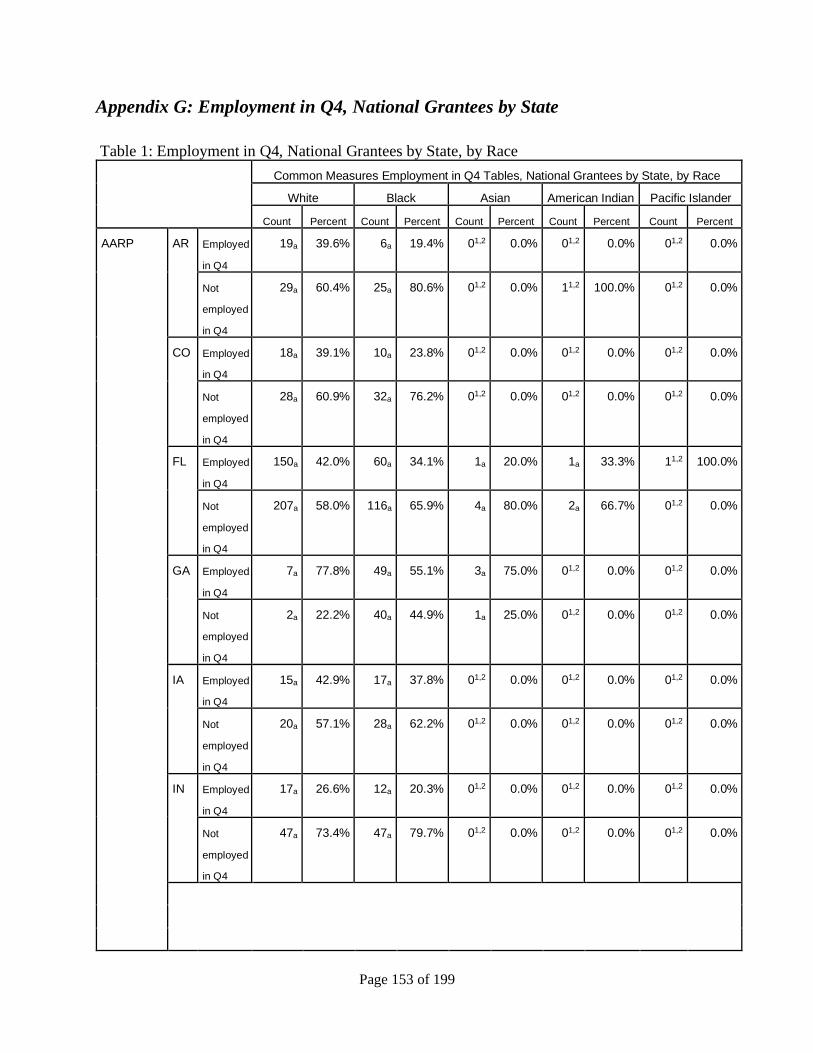
Page 153 of 199
Appendix G: Employment in Q4, National Grantees by State
Table 1: Employment in Q4, National Grantees by State, by Race
Common Measures Employment in Q4 Tables, National Grantees by State, by Race
White Black Asian American Indian Pacific Islander
Count Percent Count Percent Count Percent Count Percent Count Percent
AARP AR Employed
in Q4
19a 39.6% 6a 19.4% 01,2 0.0% 01,2 0.0% 01,2 0.0%
Not
employed
in Q4
29a 60.4% 25a 80.6% 01,2 0.0% 11,2 100.0% 01,2 0.0%
CO Employed
in Q4
18a 39.1% 10a 23.8% 01,2 0.0% 01,2 0.0% 01,2 0.0%
Not
employed
in Q4
28a 60.9% 32a 76.2% 01,2 0.0% 01,2 0.0% 01,2 0.0%
FL Employed
in Q4
150a 42.0% 60a 34.1% 1a 20.0% 1a 33.3% 11,2 100.0%
Not
employed
in Q4
207a 58.0% 116a 65.9% 4a 80.0% 2a 66.7% 01,2 0.0%
GA Employed
in Q4
7a 77.8% 49a 55.1% 3a 75.0% 01,2 0.0% 01,2 0.0%
Not
employed
in Q4
2a 22.2% 40a 44.9% 1a 25.0% 01,2 0.0% 01,2 0.0%
IA Employed
in Q4
15a 42.9% 17a 37.8% 01,2 0.0% 01,2 0.0% 01,2 0.0%
Not
employed
in Q4
20a 57.1% 28a 62.2% 01,2 0.0% 01,2 0.0% 01,2 0.0%
IN Employed
in Q4
17a 26.6% 12a 20.3% 01,2 0.0% 01,2 0.0% 01,2 0.0%
Not
employed
in Q4
47a 73.4% 47a 79.7% 01,2 0.0% 01,2 0.0% 01,2 0.0%
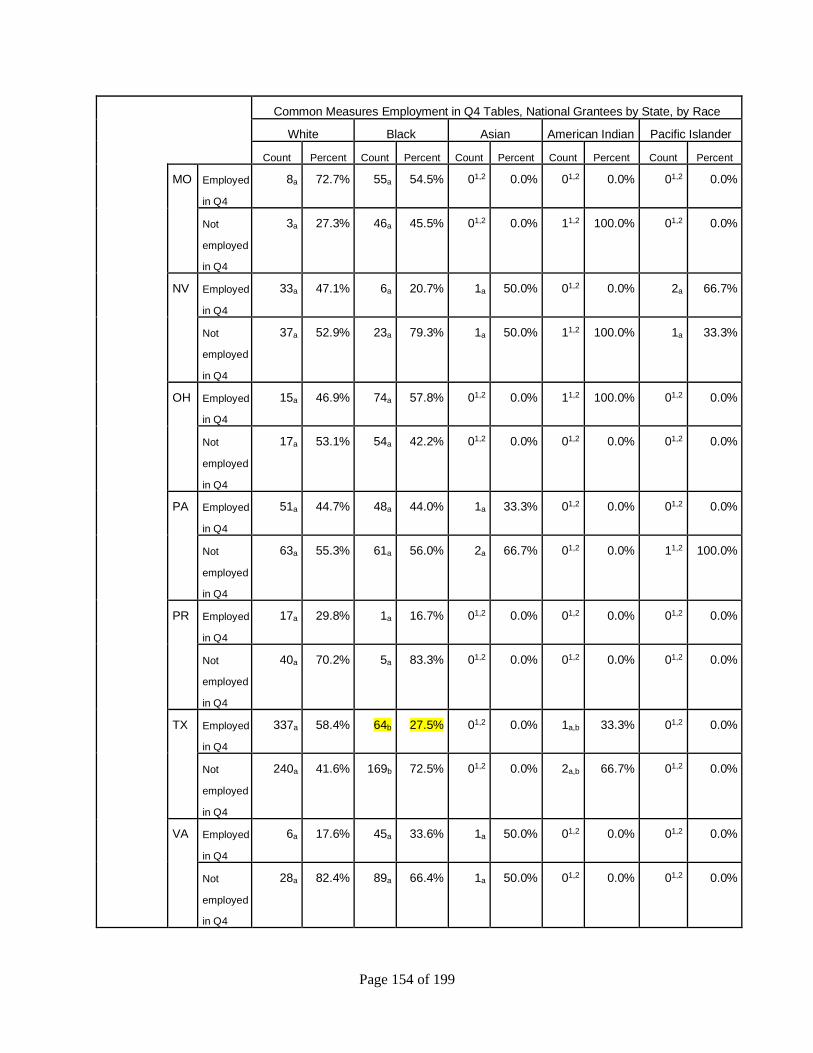
Page 154 of 199
Common Measures Employment in Q4 Tables, National Grantees by State, by Race
White Black Asian American Indian Pacific Islander
Count Percent Count Percent Count Percent Count Percent Count Percent
MO Employed
in Q4
8a 72.7% 55a 54.5% 01,2 0.0% 01,2 0.0% 01,2 0.0%
Not
employed
in Q4
3a 27.3% 46a 45.5% 01,2 0.0% 11,2 100.0% 01,2 0.0%
NV Employed
in Q4
33a 47.1% 6a 20.7% 1a 50.0% 01,2 0.0% 2a 66.7%
Not
employed
in Q4
37a 52.9% 23a 79.3% 1a 50.0% 11,2 100.0% 1a 33.3%
OH Employed
in Q4
15a 46.9% 74a 57.8% 01,2 0.0% 11,2 100.0% 01,2 0.0%
Not
employed
in Q4
17a 53.1% 54a 42.2% 01,2 0.0% 01,2 0.0% 01,2 0.0%
PA Employed
in Q4
51a 44.7% 48a 44.0% 1a 33.3% 01,2 0.0% 01,2 0.0%
Not
employed
in Q4
63a 55.3% 61a 56.0% 2a 66.7% 01,2 0.0% 11,2 100.0%
PR Employed
in Q4
17a 29.8% 1a 16.7% 01,2 0.0% 01,2 0.0% 01,2 0.0%
Not
employed
in Q4
40a 70.2% 5a 83.3% 01,2 0.0% 01,2 0.0% 01,2 0.0%
TX Employed
in Q4
337a 58.4% 64b 27.5% 01,2 0.0% 1a,b 33.3% 01,2 0.0%
Not
employed
in Q4
240a 41.6% 169b 72.5% 01,2 0.0% 2a,b 66.7% 01,2 0.0%
VA Employed
in Q4
6a 17.6% 45a 33.6% 1a 50.0% 01,2 0.0% 01,2 0.0%
Not
employed
in Q4
28a 82.4% 89a 66.4% 1a 50.0% 01,2 0.0% 01,2 0.0%
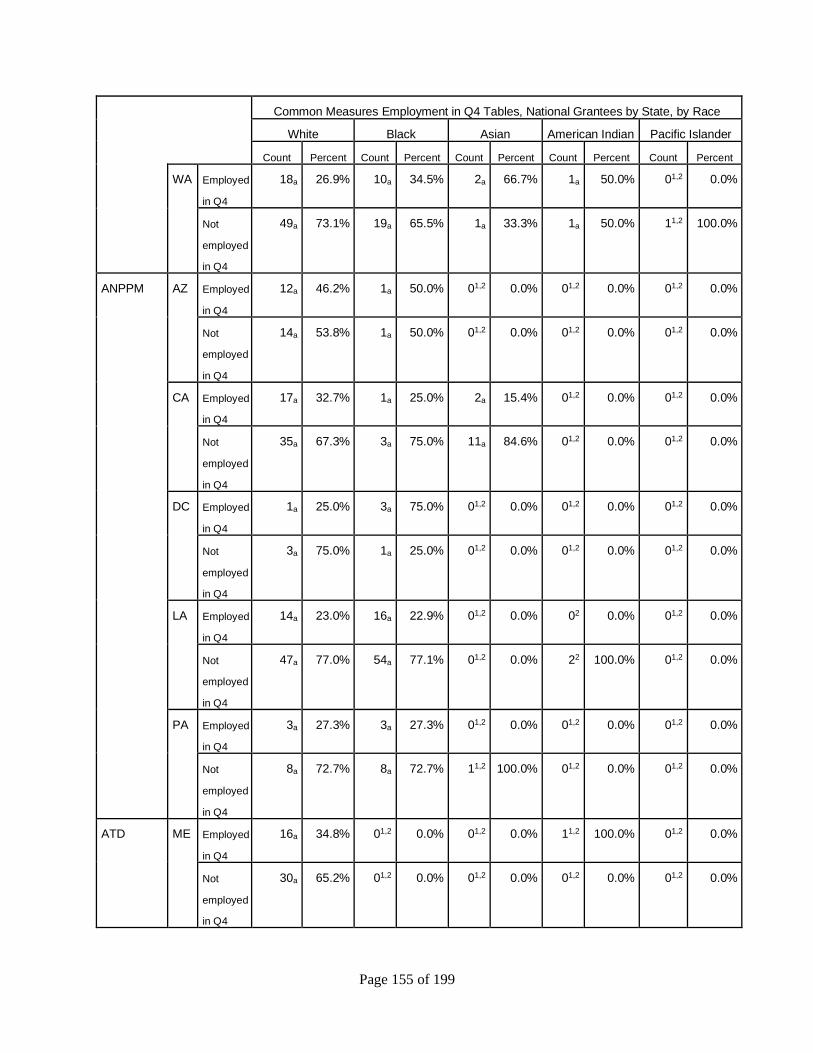
Page 155 of 199
Common Measures Employment in Q4 Tables, National Grantees by State, by Race
White Black Asian American Indian Pacific Islander
Count Percent Count Percent Count Percent Count Percent Count Percent
WA Employed
in Q4
18a 26.9% 10a 34.5% 2a 66.7% 1a 50.0% 01,2 0.0%
Not
employed
in Q4
49a 73.1% 19a 65.5% 1a 33.3% 1a 50.0% 11,2 100.0%
ANPPM AZ Employed
in Q4
12a 46.2% 1a 50.0% 01,2 0.0% 01,2 0.0% 01,2 0.0%
Not
employed
in Q4
14a 53.8% 1a 50.0% 01,2 0.0% 01,2 0.0% 01,2 0.0%
CA Employed
in Q4
17a 32.7% 1a 25.0% 2a 15.4% 01,2 0.0% 01,2 0.0%
Not
employed
in Q4
35a 67.3% 3a 75.0% 11a 84.6% 01,2 0.0% 01,2 0.0%
DC Employed
in Q4
1a 25.0% 3a 75.0% 01,2 0.0% 01,2 0.0% 01,2 0.0%
Not
employed
in Q4
3a 75.0% 1a 25.0% 01,2 0.0% 01,2 0.0% 01,2 0.0%
LA Employed
in Q4
14a 23.0% 16a 22.9% 01,2 0.0% 02 0.0% 01,2 0.0%
Not
employed
in Q4
47a 77.0% 54a 77.1% 01,2 0.0% 22 100.0% 01,2 0.0%
PA Employed
in Q4
3a 27.3% 3a 27.3% 01,2 0.0% 01,2 0.0% 01,2 0.0%
Not
employed
in Q4
8a 72.7% 8a 72.7% 11,2 100.0% 01,2 0.0% 01,2 0.0%
ATD ME Employed
in Q4
16a 34.8% 01,2 0.0% 01,2 0.0% 11,2 100.0% 01,2 0.0%
Not
employed
in Q4
30a 65.2% 01,2 0.0% 01,2 0.0% 01,2 0.0% 01,2 0.0%
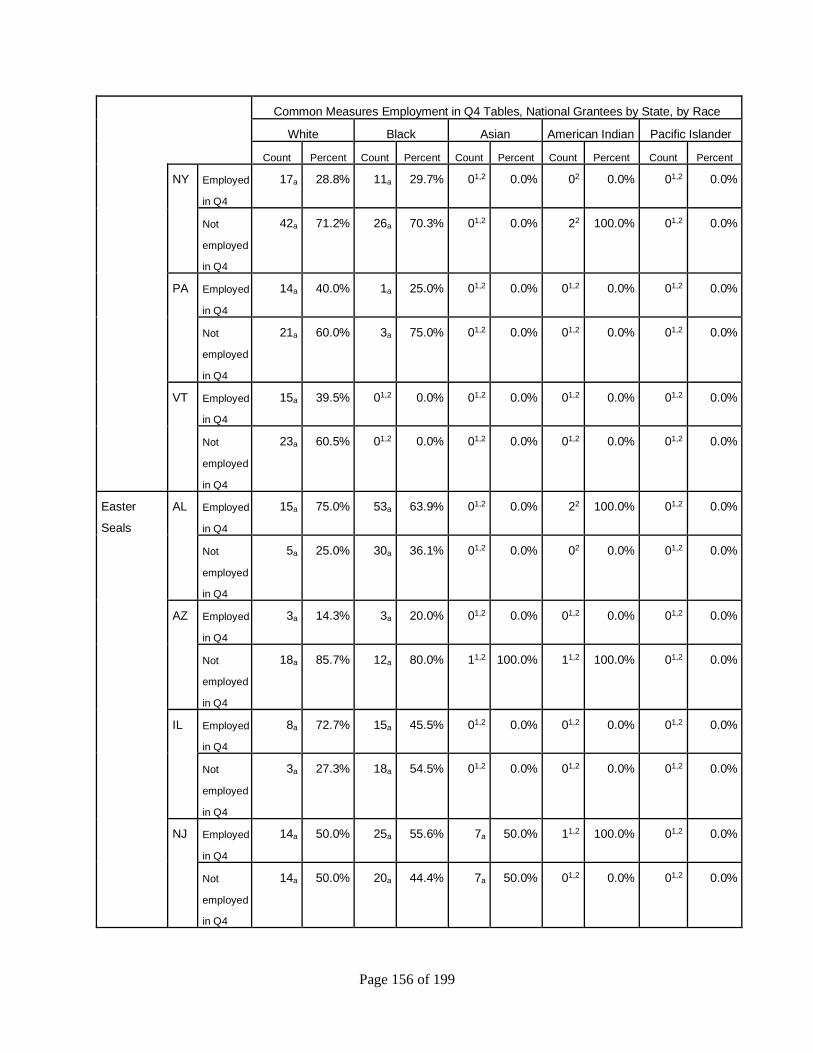
Page 156 of 199
Common Measures Employment in Q4 Tables, National Grantees by State, by Race
White Black Asian American Indian Pacific Islander
Count Percent Count Percent Count Percent Count Percent Count Percent
NY Employed
in Q4
17a 28.8% 11a 29.7% 01,2 0.0% 02 0.0% 01,2 0.0%
Not
employed
in Q4
42a 71.2% 26a 70.3% 01,2 0.0% 22 100.0% 01,2 0.0%
PA Employed
in Q4
14a 40.0% 1a 25.0% 01,2 0.0% 01,2 0.0% 01,2 0.0%
Not
employed
in Q4
21a 60.0% 3a 75.0% 01,2 0.0% 01,2 0.0% 01,2 0.0%
VT Employed
in Q4
15a 39.5% 01,2 0.0% 01,2 0.0% 01,2 0.0% 01,2 0.0%
Not
employed
in Q4
23a 60.5% 01,2 0.0% 01,2 0.0% 01,2 0.0% 01,2 0.0%
Easter
Seals
AL Employed
in Q4
15a 75.0% 53a 63.9% 01,2 0.0% 22 100.0% 01,2 0.0%
Not
employed
in Q4
5a 25.0% 30a 36.1% 01,2 0.0% 02 0.0% 01,2 0.0%
AZ Employed
in Q4
3a 14.3% 3a 20.0% 01,2 0.0% 01,2 0.0% 01,2 0.0%
Not
employed
in Q4
18a 85.7% 12a 80.0% 11,2 100.0% 11,2 100.0% 01,2 0.0%
IL Employed
in Q4
8a 72.7% 15a 45.5% 01,2 0.0% 01,2 0.0% 01,2 0.0%
Not
employed
in Q4
3a 27.3% 18a 54.5% 01,2 0.0% 01,2 0.0% 01,2 0.0%
NJ Employed
in Q4
14a 50.0% 25a 55.6% 7a 50.0% 11,2 100.0% 01,2 0.0%
Not
employed
in Q4
14a 50.0% 20a 44.4% 7a 50.0% 01,2 0.0% 01,2 0.0%

Page 157 of 199
Common Measures Employment in Q4 Tables, National Grantees by State, by Race
White Black Asian American Indian Pacific Islander
Count Percent Count Percent Count Percent Count Percent Count Percent
NY Employed
in Q4
2a 20.0% 14a 27.5% 02 0.0% 01,2 0.0% 01,2 0.0%
Not
employed
in Q4
8a 80.0% 37a 72.5% 22 100.0% 01,2 0.0% 01,2 0.0%
OH Employed
in Q4
4a 50.0% 2a 20.0% 01,2 0.0% 01,2 0.0% 01,2 0.0%
Not
employed
in Q4
4a 50.0% 8a 80.0% 01,2 0.0% 01,2 0.0% 01,2 0.0%
OK Employed
in Q4
23a 28.0% 20a 43.5% 01,2 0.0% 5a 18.5% 01,2 0.0%
Not
employed
in Q4
59a 72.0% 26a 56.5% 11,2 100.0% 22a 81.5% 01,2 0.0%
OR Employed
in Q4
44a 28.2% 2a 40.0% 1a 50.0% 02 0.0% 01,2 0.0%
Not
employed
in Q4
112a 71.8% 3a 60.0% 1a 50.0% 22 100.0% 11,2 100.0%
UT Employed
in Q4
20a 27.8% 3a 50.0% 01,2 0.0% 2a 50.0% 01,2 0.0%
Not
employed
in Q4
52a 72.2% 3a 50.0% 11,2 100.0% 2a 50.0% 01,2 0.0%
Experience
Works
ID Employed
in Q4
13a 17.1% 01,2 0.0% 01,2 0.0% 01,2 0.0% 01,2 0.0%
Not
employed
in Q4
63a 82.9% 11,2 100.0% 11,2 100.0% 01,2 0.0% 11,2 100.0%
MN Employed
in Q4
12a 26.1% 02 0.0% 01,2 0.0% 02 0.0% 01,2 0.0%
Not
employed
in Q4
34a 73.9% 52 100.0% 01,2 0.0% 22 100.0% 01,2 0.0%
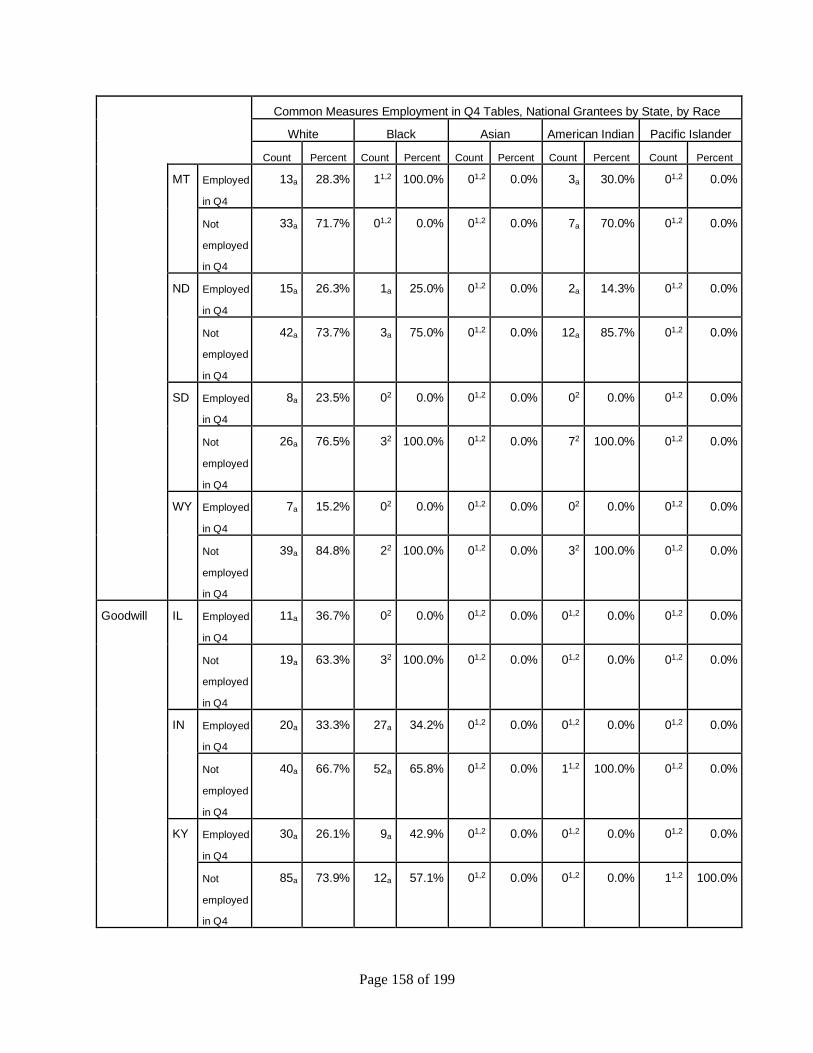
Page 158 of 199
Common Measures Employment in Q4 Tables, National Grantees by State, by Race
White Black Asian American Indian Pacific Islander
Count Percent Count Percent Count Percent Count Percent Count Percent
MT Employed
in Q4
13a 28.3% 11,2 100.0% 01,2 0.0% 3a 30.0% 01,2 0.0%
Not
employed
in Q4
33a 71.7% 01,2 0.0% 01,2 0.0% 7a 70.0% 01,2 0.0%
ND Employed
in Q4
15a 26.3% 1a 25.0% 01,2 0.0% 2a 14.3% 01,2 0.0%
Not
employed
in Q4
42a 73.7% 3a 75.0% 01,2 0.0% 12a 85.7% 01,2 0.0%
SD Employed
in Q4
8a 23.5% 02 0.0% 01,2 0.0% 02 0.0% 01,2 0.0%
Not
employed
in Q4
26a 76.5% 32 100.0% 01,2 0.0% 72 100.0% 01,2 0.0%
WY Employed
in Q4
7a 15.2% 02 0.0% 01,2 0.0% 02 0.0% 01,2 0.0%
Not
employed
in Q4
39a 84.8% 22 100.0% 01,2 0.0% 32 100.0% 01,2 0.0%
Goodwill IL Employed
in Q4
11a 36.7% 02 0.0% 01,2 0.0% 01,2 0.0% 01,2 0.0%
Not
employed
in Q4
19a 63.3% 32 100.0% 01,2 0.0% 01,2 0.0% 01,2 0.0%
IN Employed
in Q4
20a 33.3% 27a 34.2% 01,2 0.0% 01,2 0.0% 01,2 0.0%
Not
employed
in Q4
40a 66.7% 52a 65.8% 01,2 0.0% 11,2 100.0% 01,2 0.0%
KY Employed
in Q4
30a 26.1% 9a 42.9% 01,2 0.0% 01,2 0.0% 01,2 0.0%
Not
employed
in Q4
85a 73.9% 12a 57.1% 01,2 0.0% 01,2 0.0% 11,2 100.0%
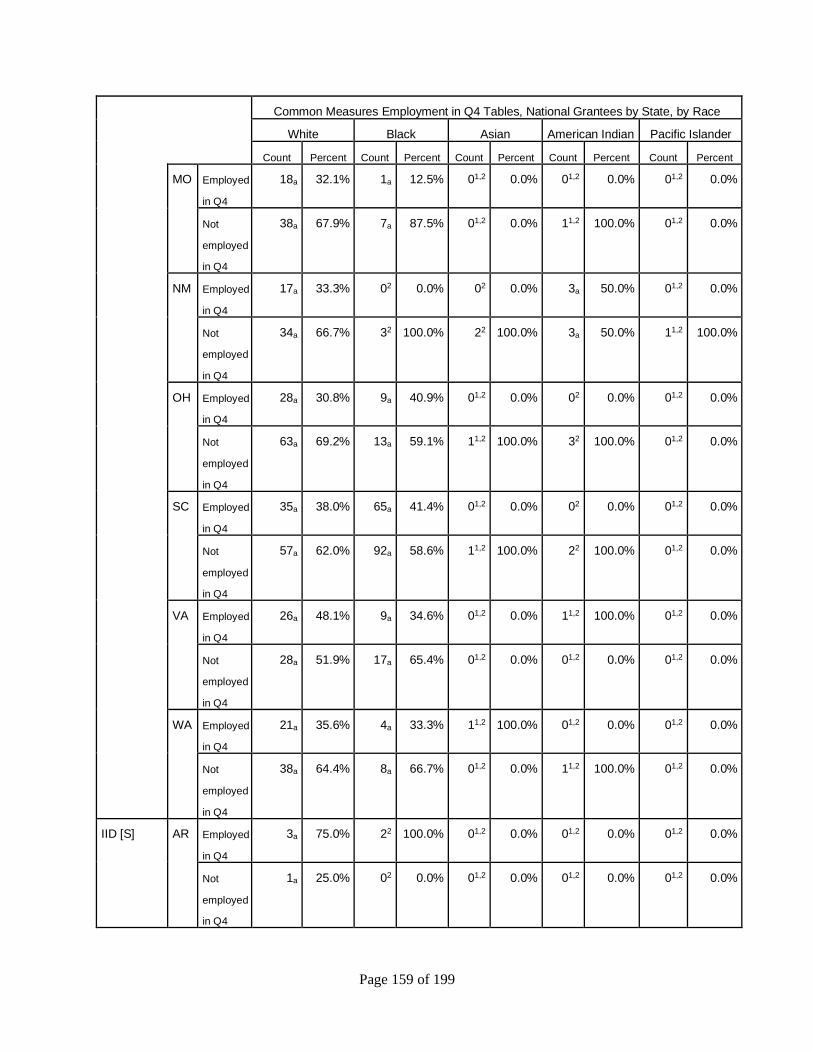
Page 159 of 199
Common Measures Employment in Q4 Tables, National Grantees by State, by Race
White Black Asian American Indian Pacific Islander
Count Percent Count Percent Count Percent Count Percent Count Percent
MO Employed
in Q4
18a 32.1% 1a 12.5% 01,2 0.0% 01,2 0.0% 01,2 0.0%
Not
employed
in Q4
38a 67.9% 7a 87.5% 01,2 0.0% 11,2 100.0% 01,2 0.0%
NM Employed
in Q4
17a 33.3% 02 0.0% 02 0.0% 3a 50.0% 01,2 0.0%
Not
employed
in Q4
34a 66.7% 32 100.0% 22 100.0% 3a 50.0% 11,2 100.0%
OH Employed
in Q4
28a 30.8% 9a 40.9% 01,2 0.0% 02 0.0% 01,2 0.0%
Not
employed
in Q4
63a 69.2% 13a 59.1% 11,2 100.0% 32 100.0% 01,2 0.0%
SC Employed
in Q4
35a 38.0% 65a 41.4% 01,2 0.0% 02 0.0% 01,2 0.0%
Not
employed
in Q4
57a 62.0% 92a 58.6% 11,2 100.0% 22 100.0% 01,2 0.0%
VA Employed
in Q4
26a 48.1% 9a 34.6% 01,2 0.0% 11,2 100.0% 01,2 0.0%
Not
employed
in Q4
28a 51.9% 17a 65.4% 01,2 0.0% 01,2 0.0% 01,2 0.0%
WA Employed
in Q4
21a 35.6% 4a 33.3% 11,2 100.0% 01,2 0.0% 01,2 0.0%
Not
employed
in Q4
38a 64.4% 8a 66.7% 01,2 0.0% 11,2 100.0% 01,2 0.0%
IID [S] AR Employed
in Q4
3a 75.0% 22 100.0% 01,2 0.0% 01,2 0.0% 01,2 0.0%
Not
employed
in Q4
1a 25.0% 02 0.0% 01,2 0.0% 01,2 0.0% 01,2 0.0%
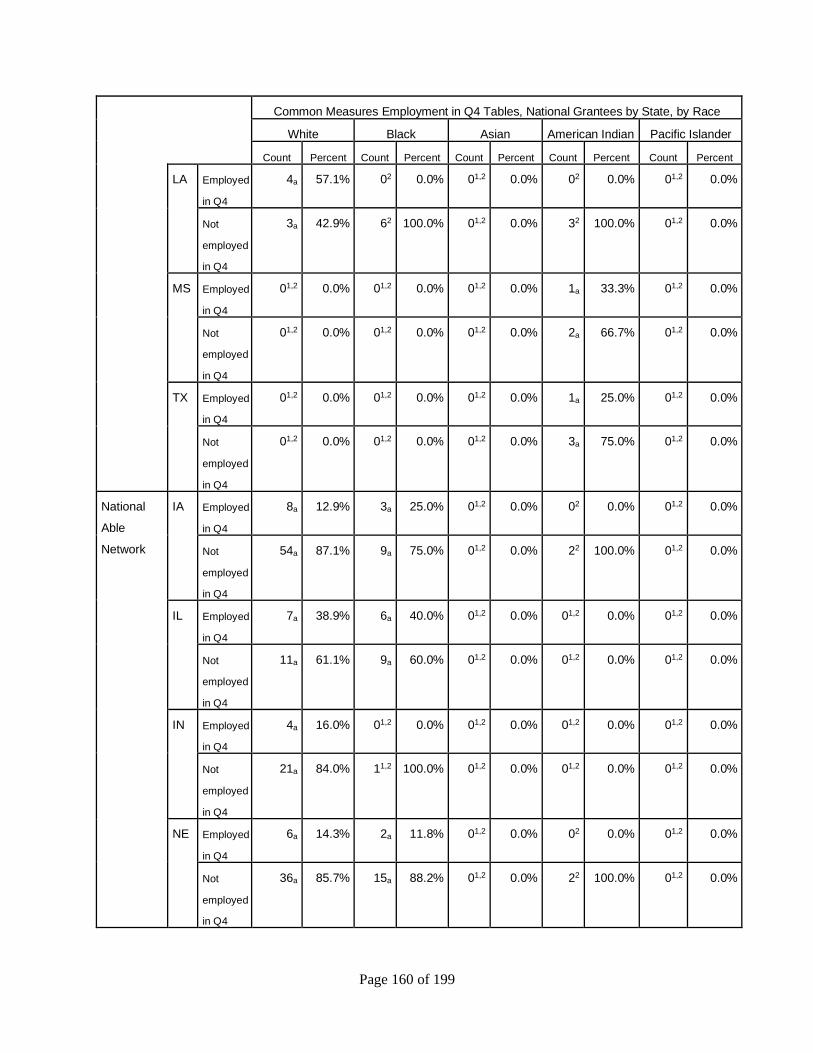
Page 160 of 199
Common Measures Employment in Q4 Tables, National Grantees by State, by Race
White Black Asian American Indian Pacific Islander
Count Percent Count Percent Count Percent Count Percent Count Percent
LA Employed
in Q4
4a 57.1% 02 0.0% 01,2 0.0% 02 0.0% 01,2 0.0%
Not
employed
in Q4
3a 42.9% 62 100.0% 01,2 0.0% 32 100.0% 01,2 0.0%
MS Employed
in Q4
01,2 0.0% 01,2 0.0% 01,2 0.0% 1a 33.3% 01,2 0.0%
Not
employed
in Q4
01,2 0.0% 01,2 0.0% 01,2 0.0% 2a 66.7% 01,2 0.0%
TX Employed
in Q4
01,2 0.0% 01,2 0.0% 01,2 0.0% 1a 25.0% 01,2 0.0%
Not
employed
in Q4
01,2 0.0% 01,2 0.0% 01,2 0.0% 3a 75.0% 01,2 0.0%
National
Able
Network
IA Employed
in Q4
8a 12.9% 3a 25.0% 01,2 0.0% 02 0.0% 01,2 0.0%
Not
employed
in Q4
54a 87.1% 9a 75.0% 01,2 0.0% 22 100.0% 01,2 0.0%
IL Employed
in Q4
7a 38.9% 6a 40.0% 01,2 0.0% 01,2 0.0% 01,2 0.0%
Not
employed
in Q4
11a 61.1% 9a 60.0% 01,2 0.0% 01,2 0.0% 01,2 0.0%
IN Employed
in Q4
4a 16.0% 01,2 0.0% 01,2 0.0% 01,2 0.0% 01,2 0.0%
Not
employed
in Q4
21a 84.0% 11,2 100.0% 01,2 0.0% 01,2 0.0% 01,2 0.0%
NE Employed
in Q4
6a 14.3% 2a 11.8% 01,2 0.0% 02 0.0% 01,2 0.0%
Not
employed
in Q4
36a 85.7% 15a 88.2% 01,2 0.0% 22 100.0% 01,2 0.0%

Page 161 of 199
Common Measures Employment in Q4 Tables, National Grantees by State, by Race
White Black Asian American Indian Pacific Islander
Count Percent Count Percent Count Percent Count Percent Count Percent
NAPCA [S] CA Employed
in Q4
02 0.0% 2a 40.0% 14a 30.4% 01,2 0.0% 01,2 0.0%
Not
employed
in Q4
22 100.0% 3a 60.0% 32a 69.6% 01,2 0.0% 01,2 0.0%
IL Employed
in Q4
01,2 0.0% 01,2 0.0% 12a 50.0% 01,2 0.0% 01,2 0.0%
Not
employed
in Q4
01,2 0.0% 01,2 0.0% 12a 50.0% 01,2 0.0% 01,2 0.0%
MA Employed
in Q4
02 0.0% 01,2 0.0% 19a 57.6% 01,2 0.0% 01,2 0.0%
Not
employed
in Q4
22 100.0% 01,2 0.0% 14a 42.4% 01,2 0.0% 01,2 0.0%
NY Employed
in Q4
01,2 0.0% 01,2 0.0% 5a 55.6% 01,2 0.0% 01,2 0.0%
Not
employed
in Q4
01,2 0.0% 01,2 0.0% 4a 44.4% 01,2 0.0% 01,2 0.0%
PA Employed
in Q4
02 0.0% 4a 40.0% 02 0.0% 01,2 0.0% 01,2 0.0%
Not
employed
in Q4
22 100.0% 6a 60.0% 102 100.0% 01,2 0.0% 01,2 0.0%
TX Employed
in Q4
02 0.0% 01,2 0.0% 5a 35.7% 01,2 0.0% 01,2 0.0%
Not
employed
in Q4
22 100.0% 11,2 100.0% 9a 64.3% 01,2 0.0% 01,2 0.0%
WA Employed
in Q4
01,2 0.0% 01,2 0.0% 1a 5.3% 01,2 0.0% 01,2 0.0%
Not
employed
in Q4
11,2 100.0% 11,2 100.0% 18a 94.7% 11,2 100.0% 01,2 0.0%
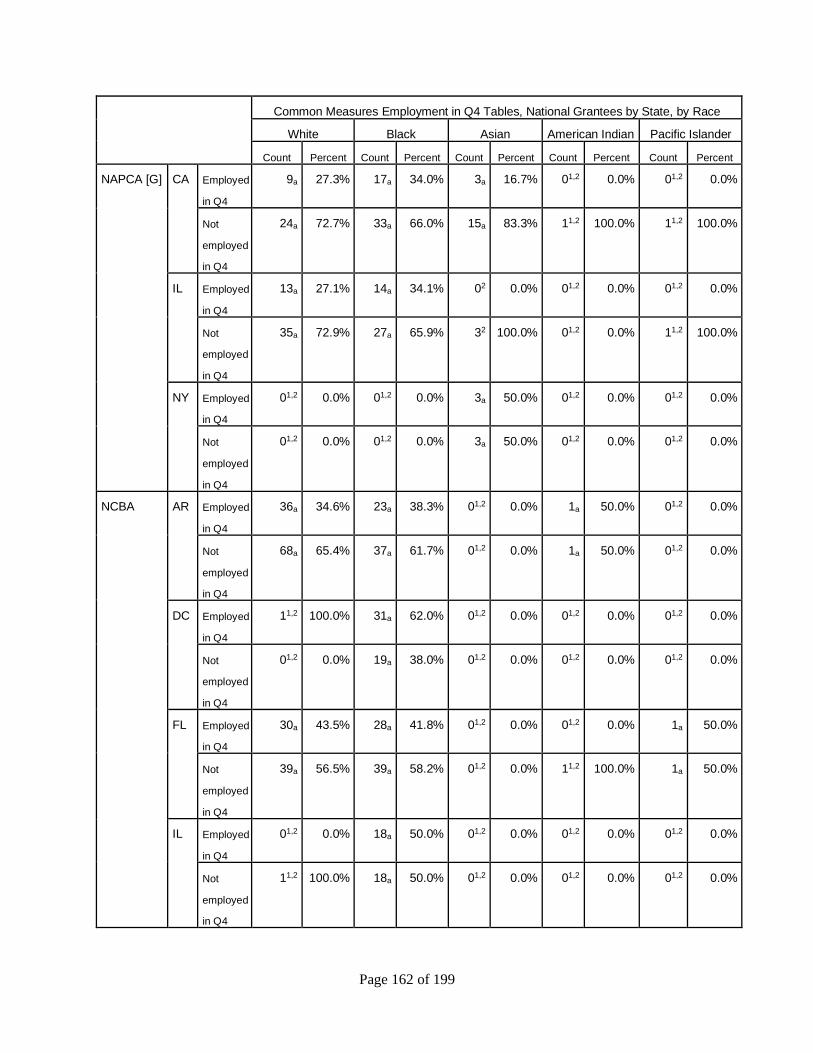
Page 162 of 199
Common Measures Employment in Q4 Tables, National Grantees by State, by Race
White Black Asian American Indian Pacific Islander
Count Percent Count Percent Count Percent Count Percent Count Percent
NAPCA [G] CA Employed
in Q4
9a 27.3% 17a 34.0% 3a 16.7% 01,2 0.0% 01,2 0.0%
Not
employed
in Q4
24a 72.7% 33a 66.0% 15a 83.3% 11,2 100.0% 11,2 100.0%
IL Employed
in Q4
13a 27.1% 14a 34.1% 02 0.0% 01,2 0.0% 01,2 0.0%
Not
employed
in Q4
35a 72.9% 27a 65.9% 32 100.0% 01,2 0.0% 11,2 100.0%
NY Employed
in Q4
01,2 0.0% 01,2 0.0% 3a 50.0% 01,2 0.0% 01,2 0.0%
Not
employed
in Q4
01,2 0.0% 01,2 0.0% 3a 50.0% 01,2 0.0% 01,2 0.0%
NCBA AR Employed
in Q4
36a 34.6% 23a 38.3% 01,2 0.0% 1a 50.0% 01,2 0.0%
Not
employed
in Q4
68a 65.4% 37a 61.7% 01,2 0.0% 1a 50.0% 01,2 0.0%
DC Employed
in Q4
11,2 100.0% 31a 62.0% 01,2 0.0% 01,2 0.0% 01,2 0.0%
Not
employed
in Q4
01,2 0.0% 19a 38.0% 01,2 0.0% 01,2 0.0% 01,2 0.0%
FL Employed
in Q4
30a 43.5% 28a 41.8% 01,2 0.0% 01,2 0.0% 1a 50.0%
Not
employed
in Q4
39a 56.5% 39a 58.2% 01,2 0.0% 11,2 100.0% 1a 50.0%
IL Employed
in Q4
01,2 0.0% 18a 50.0% 01,2 0.0% 01,2 0.0% 01,2 0.0%
Not
employed
in Q4
11,2 100.0% 18a 50.0% 01,2 0.0% 01,2 0.0% 01,2 0.0%
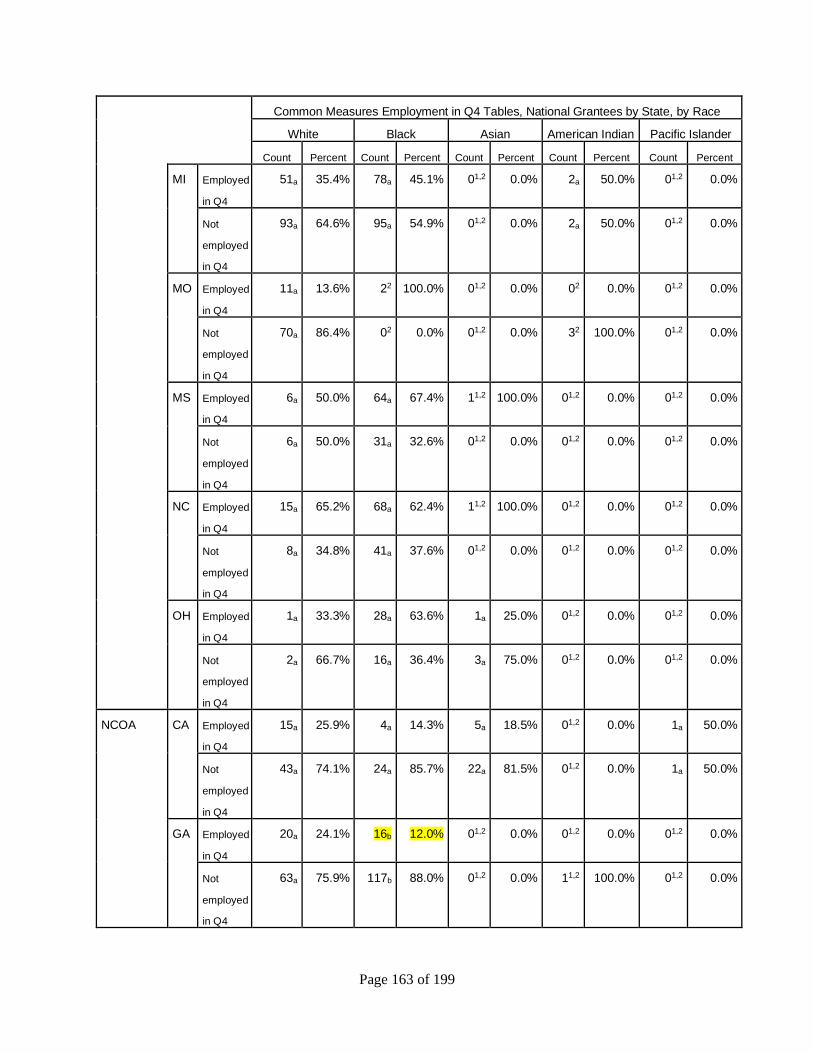
Page 163 of 199
Common Measures Employment in Q4 Tables, National Grantees by State, by Race
White Black Asian American Indian Pacific Islander
Count Percent Count Percent Count Percent Count Percent Count Percent
MI Employed
in Q4
51a 35.4% 78a 45.1% 01,2 0.0% 2a 50.0% 01,2 0.0%
Not
employed
in Q4
93a 64.6% 95a 54.9% 01,2 0.0% 2a 50.0% 01,2 0.0%
MO Employed
in Q4
11a 13.6% 22 100.0% 01,2 0.0% 02 0.0% 01,2 0.0%
Not
employed
in Q4
70a 86.4% 02 0.0% 01,2 0.0% 32 100.0% 01,2 0.0%
MS Employed
in Q4
6a 50.0% 64a 67.4% 11,2 100.0% 01,2 0.0% 01,2 0.0%
Not
employed
in Q4
6a 50.0% 31a 32.6% 01,2 0.0% 01,2 0.0% 01,2 0.0%
NC Employed
in Q4
15a 65.2% 68a 62.4% 11,2 100.0% 01,2 0.0% 01,2 0.0%
Not
employed
in Q4
8a 34.8% 41a 37.6% 01,2 0.0% 01,2 0.0% 01,2 0.0%
OH Employed
in Q4
1a 33.3% 28a 63.6% 1a 25.0% 01,2 0.0% 01,2 0.0%
Not
employed
in Q4
2a 66.7% 16a 36.4% 3a 75.0% 01,2 0.0% 01,2 0.0%
NCOA CA Employed
in Q4
15a 25.9% 4a 14.3% 5a 18.5% 01,2 0.0% 1a 50.0%
Not
employed
in Q4
43a 74.1% 24a 85.7% 22a 81.5% 01,2 0.0% 1a 50.0%
GA Employed
in Q4
20a 24.1% 16b 12.0% 01,2 0.0% 01,2 0.0% 01,2 0.0%
Not
employed
in Q4
63a 75.9% 117b 88.0% 01,2 0.0% 11,2 100.0% 01,2 0.0%

Page 164 of 199
Common Measures Employment in Q4 Tables, National Grantees by State, by Race
White Black Asian American Indian Pacific Islander
Count Percent Count Percent Count Percent Count Percent Count Percent
KY Employed
in Q4
25a 25.8% 12a 26.1% 01,2 0.0% 01,2 0.0% 01,2 0.0%
Not
employed
in Q4
72a 74.2% 34a 73.9% 01,2 0.0% 01,2 0.0% 11,2 100.0%
NC Employed
in Q4
4a 23.5% 50a 42.7% 01,2 0.0% 01,2 0.0% 01,2 0.0%
Not
employed
in Q4
13a 76.5% 67a 57.3% 01,2 0.0% 11,2 100.0% 01,2 0.0%
NJ Employed
in Q4
41a 44.6% 29a 36.3% 2a 66.7% 01,2 0.0% 01,2 0.0%
Not
employed
in Q4
51a 55.4% 51a 63.8% 1a 33.3% 11,2 100.0% 01,2 0.0%
NY Employed
in Q4
22a 55.0% 29a 52.7% 2a 40.0% 01,2 0.0% 01,2 0.0%
Not
employed
in Q4
18a 45.0% 26a 47.3% 3a 60.0% 01,2 0.0% 01,2 0.0%
OH Employed
in Q4
7a 25.9% 19a 41.3% 01,2 0.0% 01,2 0.0% 01,2 0.0%
Not
employed
in Q4
20a 74.1% 27a 58.7% 01,2 0.0% 01,2 0.0% 01,2 0.0%
PA Employed
in Q4
74a 28.2% 32a 26.2% 1a 50.0% 1a 50.0% 01,2 0.0%
Not
employed
in Q4
188a 71.8% 90a 73.8% 1a 50.0% 1a 50.0% 11,2 100.0%
PR Employed
in Q4
5a 14.7% 2a 11.1% 01,2 0.0% 01,2 0.0% 01,2 0.0%
Not
employed
in Q4
29a 85.3% 16a 88.9% 01,2 0.0% 01,2 0.0% 01,2 0.0%
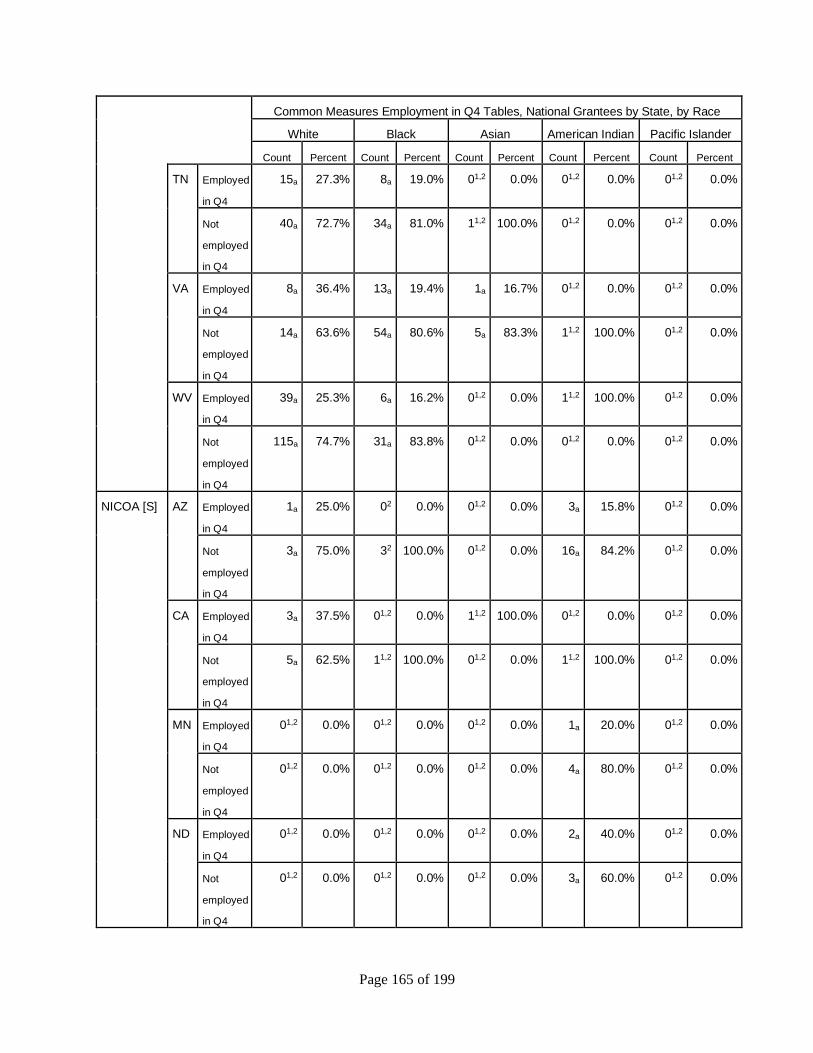
Page 165 of 199
Common Measures Employment in Q4 Tables, National Grantees by State, by Race
White Black Asian American Indian Pacific Islander
Count Percent Count Percent Count Percent Count Percent Count Percent
TN Employed
in Q4
15a 27.3% 8a 19.0% 01,2 0.0% 01,2 0.0% 01,2 0.0%
Not
employed
in Q4
40a 72.7% 34a 81.0% 11,2 100.0% 01,2 0.0% 01,2 0.0%
VA Employed
in Q4
8a 36.4% 13a 19.4% 1a 16.7% 01,2 0.0% 01,2 0.0%
Not
employed
in Q4
14a 63.6% 54a 80.6% 5a 83.3% 11,2 100.0% 01,2 0.0%
WV Employed
in Q4
39a 25.3% 6a 16.2% 01,2 0.0% 11,2 100.0% 01,2 0.0%
Not
employed
in Q4
115a 74.7% 31a 83.8% 01,2 0.0% 01,2 0.0% 01,2 0.0%
NICOA [S] AZ Employed
in Q4
1a 25.0% 02 0.0% 01,2 0.0% 3a 15.8% 01,2 0.0%
Not
employed
in Q4
3a 75.0% 32 100.0% 01,2 0.0% 16a 84.2% 01,2 0.0%
CA Employed
in Q4
3a 37.5% 01,2 0.0% 11,2 100.0% 01,2 0.0% 01,2 0.0%
Not
employed
in Q4
5a 62.5% 11,2 100.0% 01,2 0.0% 11,2 100.0% 01,2 0.0%
MN Employed
in Q4
01,2 0.0% 01,2 0.0% 01,2 0.0% 1a 20.0% 01,2 0.0%
Not
employed
in Q4
01,2 0.0% 01,2 0.0% 01,2 0.0% 4a 80.0% 01,2 0.0%
ND Employed
in Q4
01,2 0.0% 01,2 0.0% 01,2 0.0% 2a 40.0% 01,2 0.0%
Not
employed
in Q4
01,2 0.0% 01,2 0.0% 01,2 0.0% 3a 60.0% 01,2 0.0%
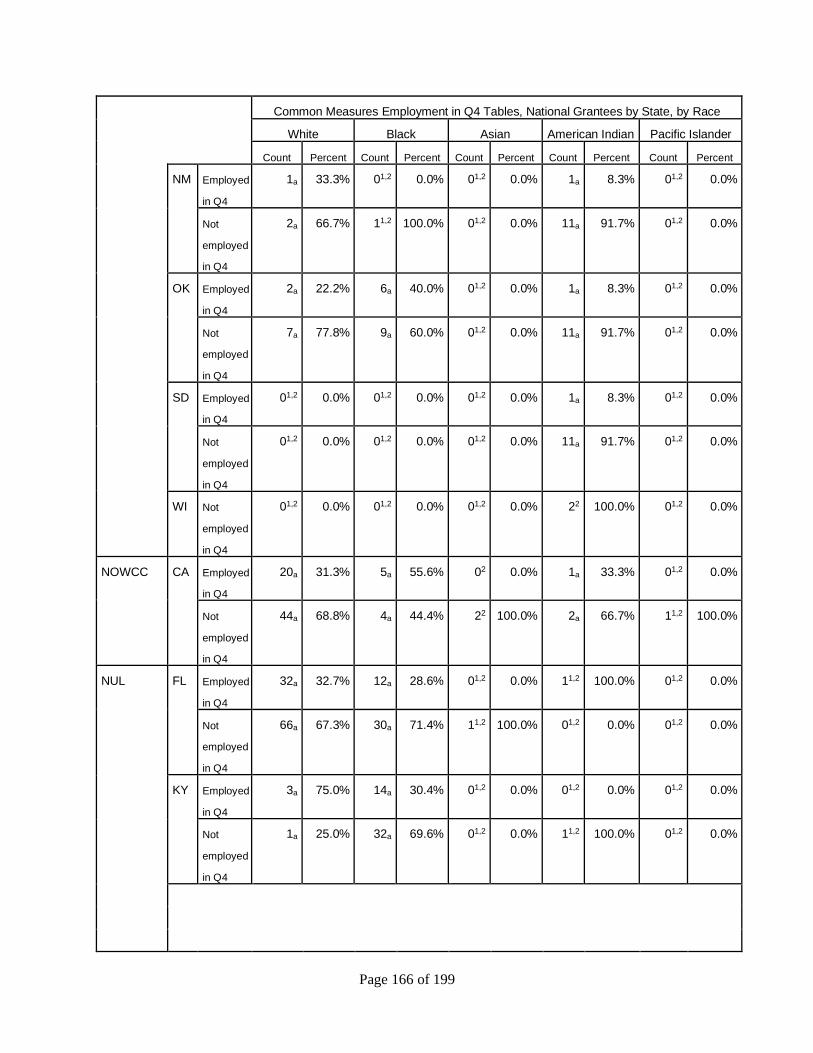
Page 166 of 199
Common Measures Employment in Q4 Tables, National Grantees by State, by Race
White Black Asian American Indian Pacific Islander
Count Percent Count Percent Count Percent Count Percent Count Percent
NM Employed
in Q4
1a 33.3% 01,2 0.0% 01,2 0.0% 1a 8.3% 01,2 0.0%
Not
employed
in Q4
2a 66.7% 11,2 100.0% 01,2 0.0% 11a 91.7% 01,2 0.0%
OK Employed
in Q4
2a 22.2% 6a 40.0% 01,2 0.0% 1a 8.3% 01,2 0.0%
Not
employed
in Q4
7a 77.8% 9a 60.0% 01,2 0.0% 11a 91.7% 01,2 0.0%
SD Employed
in Q4
01,2 0.0% 01,2 0.0% 01,2 0.0% 1a 8.3% 01,2 0.0%
Not
employed
in Q4
01,2 0.0% 01,2 0.0% 01,2 0.0% 11a 91.7% 01,2 0.0%
WI Not
employed
in Q4
01,2 0.0% 01,2 0.0% 01,2 0.0% 22 100.0% 01,2 0.0%
NOWCC CA Employed
in Q4
20a 31.3% 5a 55.6% 02 0.0% 1a 33.3% 01,2 0.0%
Not
employed
in Q4
44a 68.8% 4a 44.4% 22 100.0% 2a 66.7% 11,2 100.0%
NUL FL Employed
in Q4
32a 32.7% 12a 28.6% 01,2 0.0% 11,2 100.0% 01,2 0.0%
Not
employed
in Q4
66a 67.3% 30a 71.4% 11,2 100.0% 01,2 0.0% 01,2 0.0%
KY Employed
in Q4
3a 75.0% 14a 30.4% 01,2 0.0% 01,2 0.0% 01,2 0.0%
Not
employed
in Q4
1a 25.0% 32a 69.6% 01,2 0.0% 11,2 100.0% 01,2 0.0%
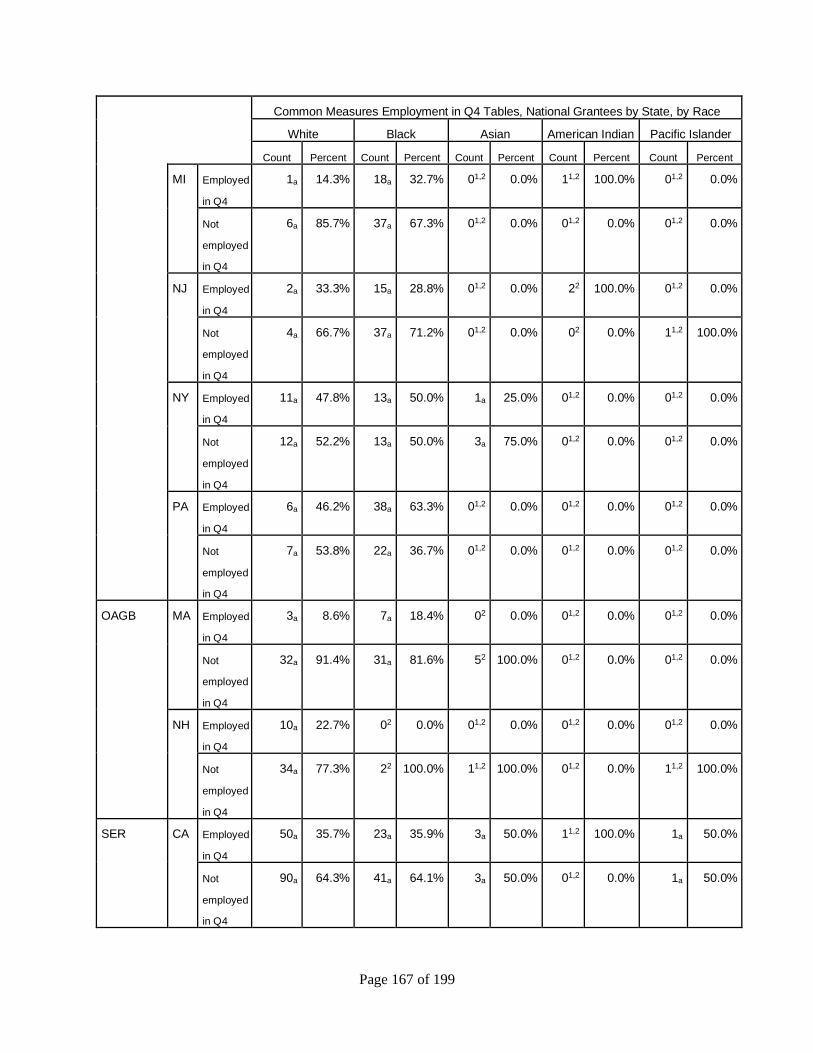
Page 167 of 199
Common Measures Employment in Q4 Tables, National Grantees by State, by Race
White Black Asian American Indian Pacific Islander
Count Percent Count Percent Count Percent Count Percent Count Percent
MI Employed
in Q4
1a 14.3% 18a 32.7% 01,2 0.0% 11,2 100.0% 01,2 0.0%
Not
employed
in Q4
6a 85.7% 37a 67.3% 01,2 0.0% 01,2 0.0% 01,2 0.0%
NJ Employed
in Q4
2a 33.3% 15a 28.8% 01,2 0.0% 22 100.0% 01,2 0.0%
Not
employed
in Q4
4a 66.7% 37a 71.2% 01,2 0.0% 02 0.0% 11,2 100.0%
NY Employed
in Q4
11a 47.8% 13a 50.0% 1a 25.0% 01,2 0.0% 01,2 0.0%
Not
employed
in Q4
12a 52.2% 13a 50.0% 3a 75.0% 01,2 0.0% 01,2 0.0%
PA Employed
in Q4
6a 46.2% 38a 63.3% 01,2 0.0% 01,2 0.0% 01,2 0.0%
Not
employed
in Q4
7a 53.8% 22a 36.7% 01,2 0.0% 01,2 0.0% 01,2 0.0%
OAGB MA Employed
in Q4
3a 8.6% 7a 18.4% 02 0.0% 01,2 0.0% 01,2 0.0%
Not
employed
in Q4
32a 91.4% 31a 81.6% 52 100.0% 01,2 0.0% 01,2 0.0%
NH Employed
in Q4
10a 22.7% 02 0.0% 01,2 0.0% 01,2 0.0% 01,2 0.0%
Not
employed
in Q4
34a 77.3% 22 100.0% 11,2 100.0% 01,2 0.0% 11,2 100.0%
SER CA Employed
in Q4
50a 35.7% 23a 35.9% 3a 50.0% 11,2 100.0% 1a 50.0%
Not
employed
in Q4
90a 64.3% 41a 64.1% 3a 50.0% 01,2 0.0% 1a 50.0%
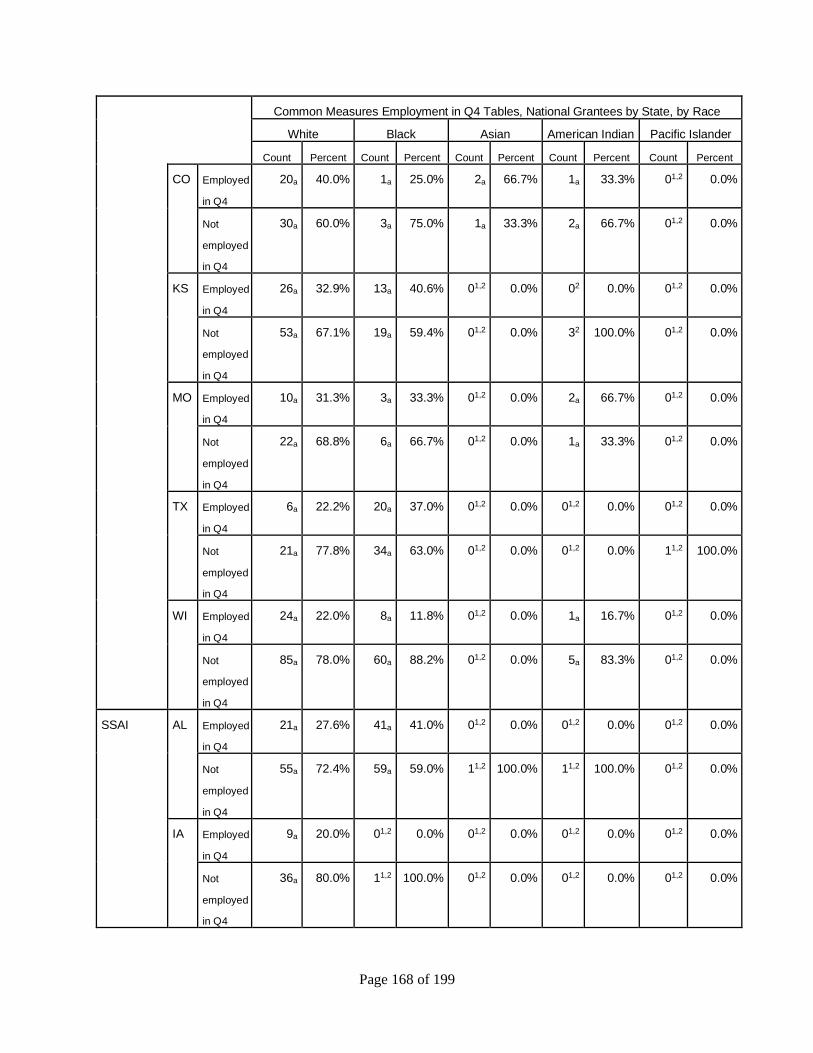
Page 168 of 199
Common Measures Employment in Q4 Tables, National Grantees by State, by Race
White Black Asian American Indian Pacific Islander
Count Percent Count Percent Count Percent Count Percent Count Percent
CO Employed
in Q4
20a 40.0% 1a 25.0% 2a 66.7% 1a 33.3% 01,2 0.0%
Not
employed
in Q4
30a 60.0% 3a 75.0% 1a 33.3% 2a 66.7% 01,2 0.0%
KS Employed
in Q4
26a 32.9% 13a 40.6% 01,2 0.0% 02 0.0% 01,2 0.0%
Not
employed
in Q4
53a 67.1% 19a 59.4% 01,2 0.0% 32 100.0% 01,2 0.0%
MO Employed
in Q4
10a 31.3% 3a 33.3% 01,2 0.0% 2a 66.7% 01,2 0.0%
Not
employed
in Q4
22a 68.8% 6a 66.7% 01,2 0.0% 1a 33.3% 01,2 0.0%
TX Employed
in Q4
6a 22.2% 20a 37.0% 01,2 0.0% 01,2 0.0% 01,2 0.0%
Not
employed
in Q4
21a 77.8% 34a 63.0% 01,2 0.0% 01,2 0.0% 11,2 100.0%
WI Employed
in Q4
24a 22.0% 8a 11.8% 01,2 0.0% 1a 16.7% 01,2 0.0%
Not
employed
in Q4
85a 78.0% 60a 88.2% 01,2 0.0% 5a 83.3% 01,2 0.0%
SSAI AL Employed
in Q4
21a 27.6% 41a 41.0% 01,2 0.0% 01,2 0.0% 01,2 0.0%
Not
employed
in Q4
55a 72.4% 59a 59.0% 11,2 100.0% 11,2 100.0% 01,2 0.0%
IA Employed
in Q4
9a 20.0% 01,2 0.0% 01,2 0.0% 01,2 0.0% 01,2 0.0%
Not
employed
in Q4
36a 80.0% 11,2 100.0% 01,2 0.0% 01,2 0.0% 01,2 0.0%
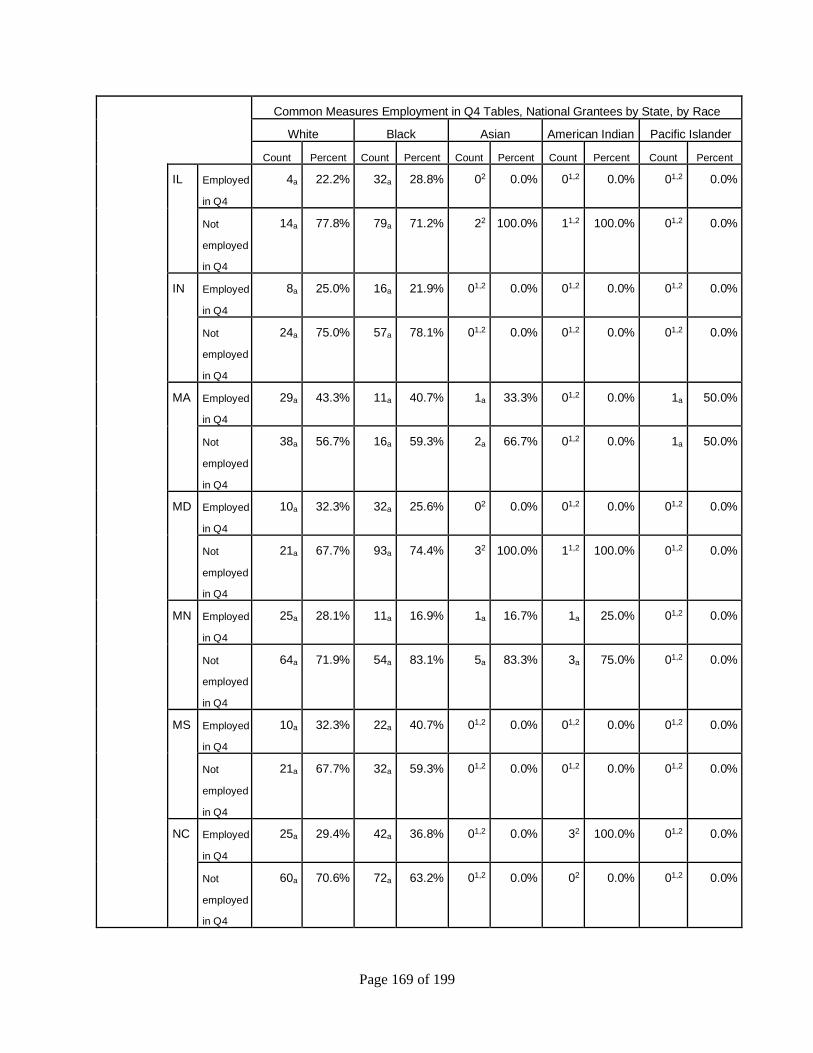
Page 169 of 199
Common Measures Employment in Q4 Tables, National Grantees by State, by Race
White Black Asian American Indian Pacific Islander
Count Percent Count Percent Count Percent Count Percent Count Percent
IL Employed
in Q4
4a 22.2% 32a 28.8% 02 0.0% 01,2 0.0% 01,2 0.0%
Not
employed
in Q4
14a 77.8% 79a 71.2% 22 100.0% 11,2 100.0% 01,2 0.0%
IN Employed
in Q4
8a 25.0% 16a 21.9% 01,2 0.0% 01,2 0.0% 01,2 0.0%
Not
employed
in Q4
24a 75.0% 57a 78.1% 01,2 0.0% 01,2 0.0% 01,2 0.0%
MA Employed
in Q4
29a 43.3% 11a 40.7% 1a 33.3% 01,2 0.0% 1a 50.0%
Not
employed
in Q4
38a 56.7% 16a 59.3% 2a 66.7% 01,2 0.0% 1a 50.0%
MD Employed
in Q4
10a 32.3% 32a 25.6% 02 0.0% 01,2 0.0% 01,2 0.0%
Not
employed
in Q4
21a 67.7% 93a 74.4% 32 100.0% 11,2 100.0% 01,2 0.0%
MN Employed
in Q4
25a 28.1% 11a 16.9% 1a 16.7% 1a 25.0% 01,2 0.0%
Not
employed
in Q4
64a 71.9% 54a 83.1% 5a 83.3% 3a 75.0% 01,2 0.0%
MS Employed
in Q4
10a 32.3% 22a 40.7% 01,2 0.0% 01,2 0.0% 01,2 0.0%
Not
employed
in Q4
21a 67.7% 32a 59.3% 01,2 0.0% 01,2 0.0% 01,2 0.0%
NC Employed
in Q4
25a 29.4% 42a 36.8% 01,2 0.0% 32 100.0% 01,2 0.0%
Not
employed
in Q4
60a 70.6% 72a 63.2% 01,2 0.0% 02 0.0% 01,2 0.0%

Page 170 of 199
Common Measures Employment in Q4 Tables, National Grantees by State, by Race
White Black Asian American Indian Pacific Islander
Count Percent Count Percent Count Percent Count Percent Count Percent
NY Employed
in Q4
16a 48.5% 39a 59.1% 36a 50.7% 11,2 100.0% 01,2 0.0%
Not
employed
in Q4
17a 51.5% 27a 40.9% 35a 49.3% 01,2 0.0% 01,2 0.0%
TN Employed
in Q4
19a 20.0% 32a 29.9% 11,2 100.0% 22 100.0% 01,2 0.0%
Not
employed
in Q4
76a 80.0% 75a 70.1% 01,2 0.0% 02 0.0% 01,2 0.0%
TX Employed
in Q4
36a 26.7% 8a 21.6% 01,2 0.0% 01,2 0.0% 01,2 0.0%
Not
employed
in Q4
99a 73.3% 29a 78.4% 11,2 100.0% 11,2 100.0% 11,2 100.0%
WI Employed
in Q4
37a 37.4% 3a 21.4% 01,2 0.0% 5a 38.5% 01,2 0.0%
Not
employed
in Q4
62a 62.6% 11a 78.6% 01,2 0.0% 8a 61.5% 01,2 0.0%
The
WorkPlace
CT Employed
in Q4
6a 16.2% 9a 20.5% 02 0.0% 01,2 0.0% 01,2 0.0%
Not
employed
in Q4
31a 83.8% 35a 79.5% 22 100.0% 01,2 0.0% 01,2 0.0%
NY Employed
in Q4
4a 19.0% 15a 29.4% 1a 33.3% 01,2 0.0% 01,2 0.0%
Not
employed
in Q4
17a 81.0% 36a 70.6% 2a 66.7% 01,2 0.0% 01,2 0.0%
PA Employed
in Q4
10a 31.3% 54a 42.9% 01,2 0.0% 32 100.0% 01,2 0.0%
Not
employed
in Q4
22a 68.8% 72a 57.1% 01,2 0.0% 02 0.0% 01,2 0.0%
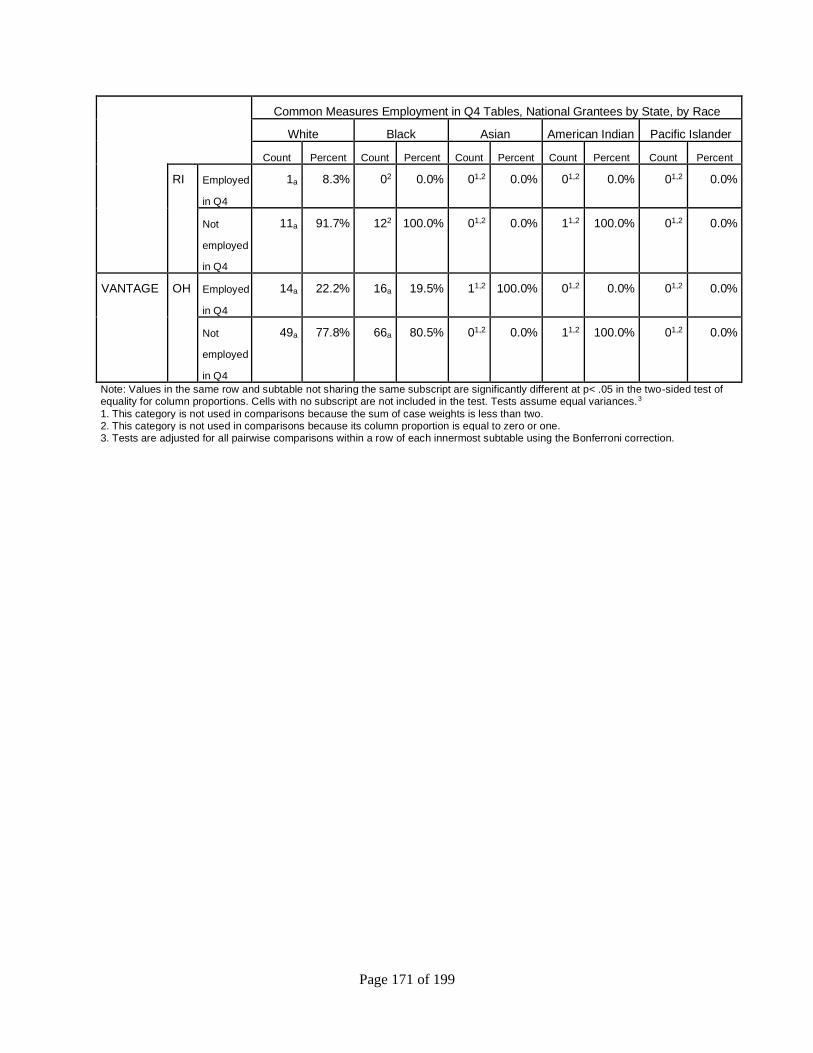
Page 171 of 199
Common Measures Employment in Q4 Tables, National Grantees by State, by Race
White Black Asian American Indian Pacific Islander
Count Percent Count Percent Count Percent Count Percent Count Percent
RI Employed
in Q4
1a 8.3% 02 0.0% 01,2 0.0% 01,2 0.0% 01,2 0.0%
Not
employed
in Q4
11a 91.7% 122 100.0% 01,2 0.0% 11,2 100.0% 01,2 0.0%
VANTAGE OH Employed
in Q4
14a 22.2% 16a 19.5% 11,2 100.0% 01,2 0.0% 01,2 0.0%
Not
employed
in Q4
49a 77.8% 66a 80.5% 01,2 0.0% 11,2 100.0% 01,2 0.0%
Note: Values in the same row and subtable not sharing the same subscript are significantly different at p< .05 in the two-sided test of equality for column proportions. Cells with no subscript are not included in the test. Tests assume equal variances.3
1. This category is not used in comparisons because the sum of case weights is less than two. 2. This category is not used in comparisons because its column proportion is equal to zero or one. 3. Tests are adjusted for all pairwise comparisons within a row of each innermost subtable using the Bonferroni correction.
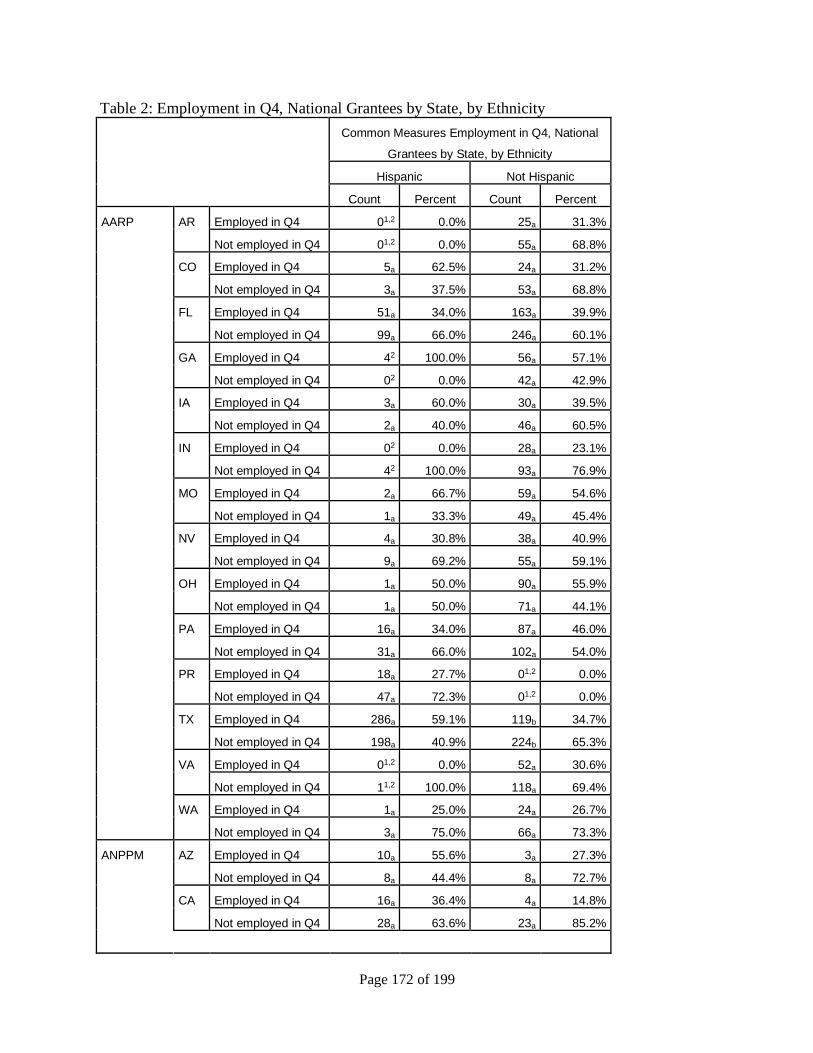
Page 172 of 199
Table 2: Employment in Q4, National Grantees by State, by Ethnicity
Common Measures Employment in Q4, National
Grantees by State, by Ethnicity
Hispanic Not Hispanic
Count Percent Count Percent
AARP AR Employed in Q4 01,2 0.0% 25a 31.3%
Not employed in Q4 01,2 0.0% 55a 68.8%
CO Employed in Q4 5a 62.5% 24a 31.2%
Not employed in Q4 3a 37.5% 53a 68.8%
FL Employed in Q4 51a 34.0% 163a 39.9%
Not employed in Q4 99a 66.0% 246a 60.1%
GA Employed in Q4 42 100.0% 56a 57.1%
Not employed in Q4 02 0.0% 42a 42.9%
IA Employed in Q4 3a 60.0% 30a 39.5%
Not employed in Q4 2a 40.0% 46a 60.5%
IN Employed in Q4 02 0.0% 28a 23.1%
Not employed in Q4 42 100.0% 93a 76.9%
MO Employed in Q4 2a 66.7% 59a 54.6%
Not employed in Q4 1a 33.3% 49a 45.4%
NV Employed in Q4 4a 30.8% 38a 40.9%
Not employed in Q4 9a 69.2% 55a 59.1%
OH Employed in Q4 1a 50.0% 90a 55.9%
Not employed in Q4 1a 50.0% 71a 44.1%
PA Employed in Q4 16a 34.0% 87a 46.0%
Not employed in Q4 31a 66.0% 102a 54.0%
PR Employed in Q4 18a 27.7% 01,2 0.0%
Not employed in Q4 47a 72.3% 01,2 0.0%
TX Employed in Q4 286a 59.1% 119b 34.7%
Not employed in Q4 198a 40.9% 224b 65.3%
VA Employed in Q4 01,2 0.0% 52a 30.6%
Not employed in Q4 11,2 100.0% 118a 69.4%
WA Employed in Q4 1a 25.0% 24a 26.7%
Not employed in Q4 3a 75.0% 66a 73.3%
ANPPM AZ Employed in Q4 10a 55.6% 3a 27.3%
Not employed in Q4 8a 44.4% 8a 72.7%
CA Employed in Q4 16a 36.4% 4a 14.8%
Not employed in Q4 28a 63.6% 23a 85.2%
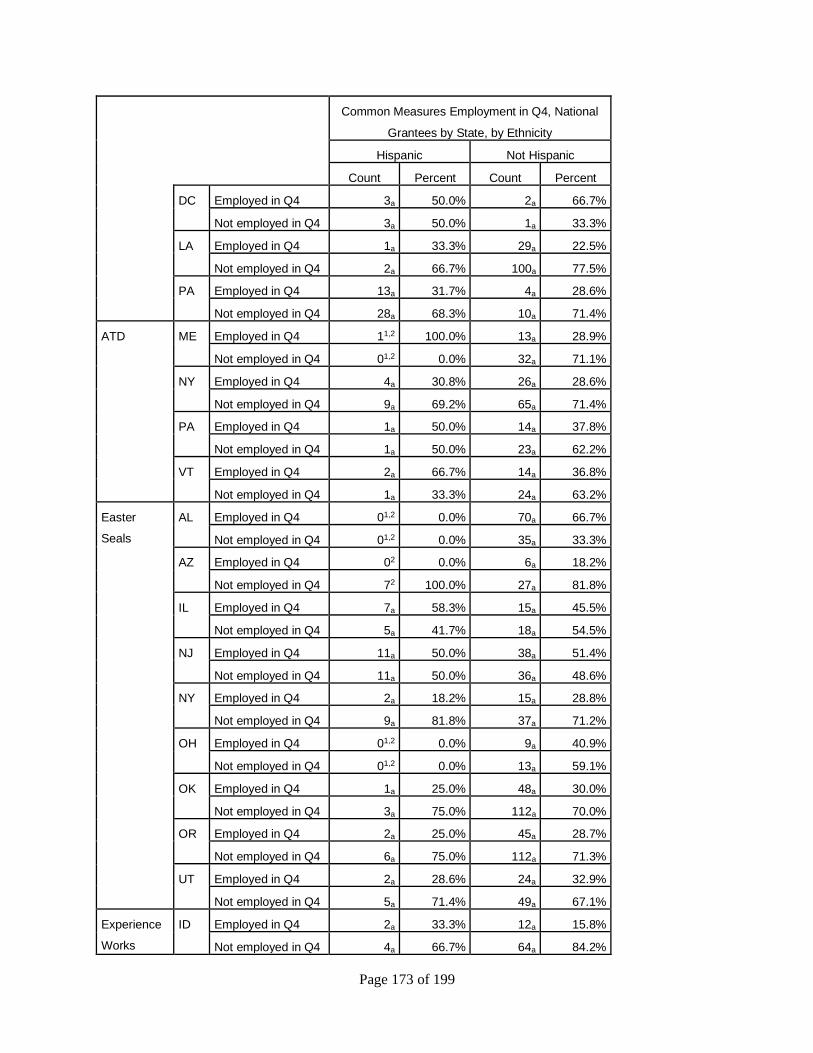
Page 173 of 199
Common Measures Employment in Q4, National
Grantees by State, by Ethnicity
Hispanic Not Hispanic
Count Percent Count Percent
DC Employed in Q4 3a 50.0% 2a 66.7%
Not employed in Q4 3a 50.0% 1a 33.3%
LA Employed in Q4 1a 33.3% 29a 22.5%
Not employed in Q4 2a 66.7% 100a 77.5%
PA Employed in Q4 13a 31.7% 4a 28.6%
Not employed in Q4 28a 68.3% 10a 71.4%
ATD ME Employed in Q4 11,2 100.0% 13a 28.9%
Not employed in Q4 01,2 0.0% 32a 71.1%
NY Employed in Q4 4a 30.8% 26a 28.6%
Not employed in Q4 9a 69.2% 65a 71.4%
PA Employed in Q4 1a 50.0% 14a 37.8%
Not employed in Q4 1a 50.0% 23a 62.2%
VT Employed in Q4 2a 66.7% 14a 36.8%
Not employed in Q4 1a 33.3% 24a 63.2%
Easter
Seals
AL Employed in Q4 01,2 0.0% 70a 66.7%
Not employed in Q4 01,2 0.0% 35a 33.3%
AZ Employed in Q4 02 0.0% 6a 18.2%
Not employed in Q4 72 100.0% 27a 81.8%
IL Employed in Q4 7a 58.3% 15a 45.5%
Not employed in Q4 5a 41.7% 18a 54.5%
NJ Employed in Q4 11a 50.0% 38a 51.4%
Not employed in Q4 11a 50.0% 36a 48.6%
NY Employed in Q4 2a 18.2% 15a 28.8%
Not employed in Q4 9a 81.8% 37a 71.2%
OH Employed in Q4 01,2 0.0% 9a 40.9%
Not employed in Q4 01,2 0.0% 13a 59.1%
OK Employed in Q4 1a 25.0% 48a 30.0%
Not employed in Q4 3a 75.0% 112a 70.0%
OR Employed in Q4 2a 25.0% 45a 28.7%
Not employed in Q4 6a 75.0% 112a 71.3%
UT Employed in Q4 2a 28.6% 24a 32.9%
Not employed in Q4 5a 71.4% 49a 67.1%
Experience
Works
ID Employed in Q4 2a 33.3% 12a 15.8%
Not employed in Q4 4a 66.7% 64a 84.2%
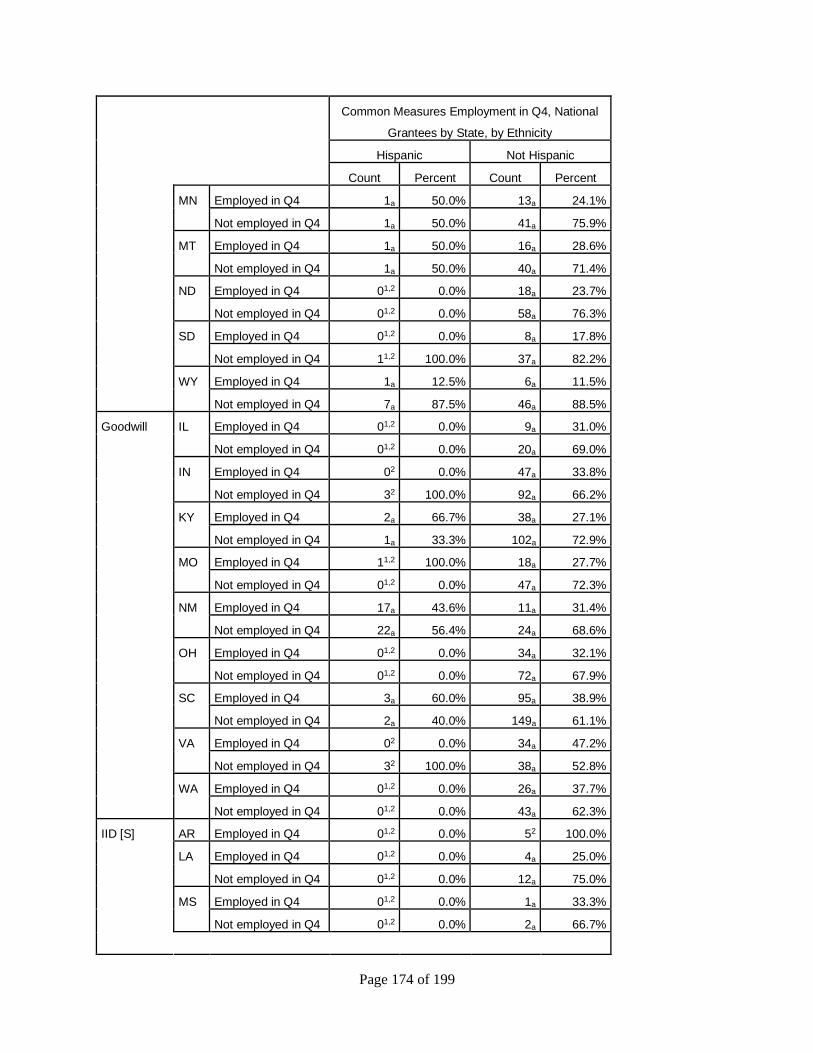
Page 174 of 199
Common Measures Employment in Q4, National
Grantees by State, by Ethnicity
Hispanic Not Hispanic
Count Percent Count Percent
MN Employed in Q4 1a 50.0% 13a 24.1%
Not employed in Q4 1a 50.0% 41a 75.9%
MT Employed in Q4 1a 50.0% 16a 28.6%
Not employed in Q4 1a 50.0% 40a 71.4%
ND Employed in Q4 01,2 0.0% 18a 23.7%
Not employed in Q4 01,2 0.0% 58a 76.3%
SD Employed in Q4 01,2 0.0% 8a 17.8%
Not employed in Q4 11,2 100.0% 37a 82.2%
WY Employed in Q4 1a 12.5% 6a 11.5%
Not employed in Q4 7a 87.5% 46a 88.5%
Goodwill IL Employed in Q4 01,2 0.0% 9a 31.0%
Not employed in Q4 01,2 0.0% 20a 69.0%
IN Employed in Q4 02 0.0% 47a 33.8%
Not employed in Q4 32 100.0% 92a 66.2%
KY Employed in Q4 2a 66.7% 38a 27.1%
Not employed in Q4 1a 33.3% 102a 72.9%
MO Employed in Q4 11,2 100.0% 18a 27.7%
Not employed in Q4 01,2 0.0% 47a 72.3%
NM Employed in Q4 17a 43.6% 11a 31.4%
Not employed in Q4 22a 56.4% 24a 68.6%
OH Employed in Q4 01,2 0.0% 34a 32.1%
Not employed in Q4 01,2 0.0% 72a 67.9%
SC Employed in Q4 3a 60.0% 95a 38.9%
Not employed in Q4 2a 40.0% 149a 61.1%
VA Employed in Q4 02 0.0% 34a 47.2%
Not employed in Q4 32 100.0% 38a 52.8%
WA Employed in Q4 01,2 0.0% 26a 37.7%
Not employed in Q4 01,2 0.0% 43a 62.3%
IID [S] AR Employed in Q4 01,2 0.0% 52 100.0%
LA Employed in Q4 01,2 0.0% 4a 25.0%
Not employed in Q4 01,2 0.0% 12a 75.0%
MS Employed in Q4 01,2 0.0% 1a 33.3%
Not employed in Q4 01,2 0.0% 2a 66.7%
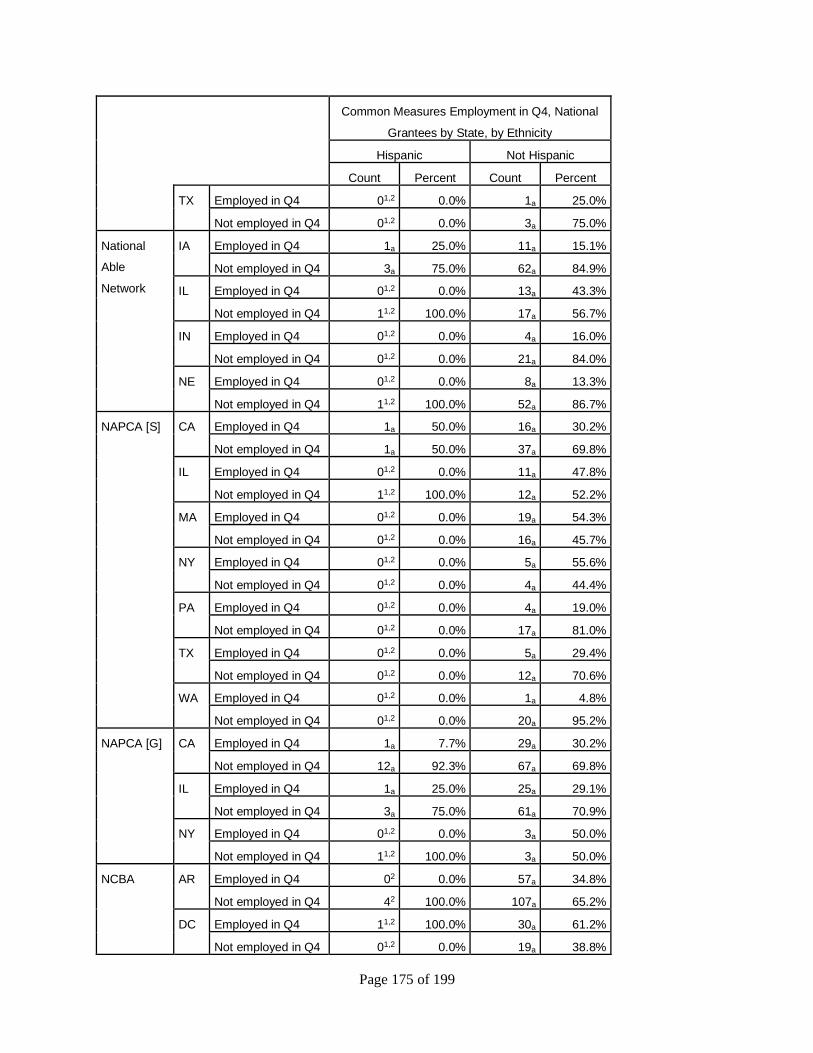
Page 175 of 199
Common Measures Employment in Q4, National
Grantees by State, by Ethnicity
Hispanic Not Hispanic
Count Percent Count Percent
TX Employed in Q4 01,2 0.0% 1a 25.0%
Not employed in Q4 01,2 0.0% 3a 75.0%
National
Able
Network
IA Employed in Q4 1a 25.0% 11a 15.1%
Not employed in Q4 3a 75.0% 62a 84.9%
IL Employed in Q4 01,2 0.0% 13a 43.3%
Not employed in Q4 11,2 100.0% 17a 56.7%
IN Employed in Q4 01,2 0.0% 4a 16.0%
Not employed in Q4 01,2 0.0% 21a 84.0%
NE Employed in Q4 01,2 0.0% 8a 13.3%
Not employed in Q4 11,2 100.0% 52a 86.7%
NAPCA [S] CA Employed in Q4 1a 50.0% 16a 30.2%
Not employed in Q4 1a 50.0% 37a 69.8%
IL Employed in Q4 01,2 0.0% 11a 47.8%
Not employed in Q4 11,2 100.0% 12a 52.2%
MA Employed in Q4 01,2 0.0% 19a 54.3%
Not employed in Q4 01,2 0.0% 16a 45.7%
NY Employed in Q4 01,2 0.0% 5a 55.6%
Not employed in Q4 01,2 0.0% 4a 44.4%
PA Employed in Q4 01,2 0.0% 4a 19.0%
Not employed in Q4 01,2 0.0% 17a 81.0%
TX Employed in Q4 01,2 0.0% 5a 29.4%
Not employed in Q4 01,2 0.0% 12a 70.6%
WA Employed in Q4 01,2 0.0% 1a 4.8%
Not employed in Q4 01,2 0.0% 20a 95.2%
NAPCA [G] CA Employed in Q4 1a 7.7% 29a 30.2%
Not employed in Q4 12a 92.3% 67a 69.8%
IL Employed in Q4 1a 25.0% 25a 29.1%
Not employed in Q4 3a 75.0% 61a 70.9%
NY Employed in Q4 01,2 0.0% 3a 50.0%
Not employed in Q4 11,2 100.0% 3a 50.0%
NCBA AR Employed in Q4 02 0.0% 57a 34.8%
Not employed in Q4 42 100.0% 107a 65.2%
DC Employed in Q4 11,2 100.0% 30a 61.2%
Not employed in Q4 01,2 0.0% 19a 38.8%

Page 176 of 199
Common Measures Employment in Q4, National
Grantees by State, by Ethnicity
Hispanic Not Hispanic
Count Percent Count Percent
FL Employed in Q4 1a 33.3% 48a 38.4%
Not employed in Q4 2a 66.7% 77a 61.6%
IL Employed in Q4 02 0.0% 18a 52.9%
Not employed in Q4 22 100.0% 16a 47.1%
MI Employed in Q4 3a 33.3% 126a 39.6%
Not employed in Q4 6a 66.7% 192a 60.4%
MO Employed in Q4 01,2 0.0% 13a 15.5%
Not employed in Q4 01,2 0.0% 71a 84.5%
MS Employed in Q4 01,2 0.0% 70a 65.4%
Not employed in Q4 01,2 0.0% 37a 34.6%
NC Employed in Q4 32 100.0% 79a 62.7%
Not employed in Q4 02 0.0% 47a 37.3%
OH Employed in Q4 1a 50.0% 28a 58.3%
Not employed in Q4 1a 50.0% 20a 41.7%
NCOA CA Employed in Q4 5a 20.0% 22a 21.2%
Not employed in Q4 20a 80.0% 82a 78.8%
GA Employed in Q4 01,2 0.0% 23a 14.0%
Not employed in Q4 11,2 100.0% 141a 86.0%
KY Employed in Q4 1a 50.0% 32a 24.2%
Not employed in Q4 1a 50.0% 100a 75.8%
NC Employed in Q4 1a 33.3% 54a 39.7%
Not employed in Q4 2a 66.7% 82a 60.3%
NJ Employed in Q4 8a 61.5% 68a 42.8%
Not employed in Q4 5a 38.5% 91a 57.2%
NY Employed in Q4 16a 55.2% 39a 48.1%
Not employed in Q4 13a 44.8% 42a 51.9%
OH Employed in Q4 2a 50.0% 35a 36.5%
Not employed in Q4 2a 50.0% 61a 63.5%
PA Employed in Q4 3a 16.7% 100a 27.9%
Not employed in Q4 15a 83.3% 259a 72.1%
PR Employed in Q4 8a 14.5% 01,2 0.0%
Not employed in Q4 47a 85.5% 11,2 100.0%
TN Employed in Q4 01,2 0.0% 21a 24.1%
Not employed in Q4 01,2 0.0% 66a 75.9%
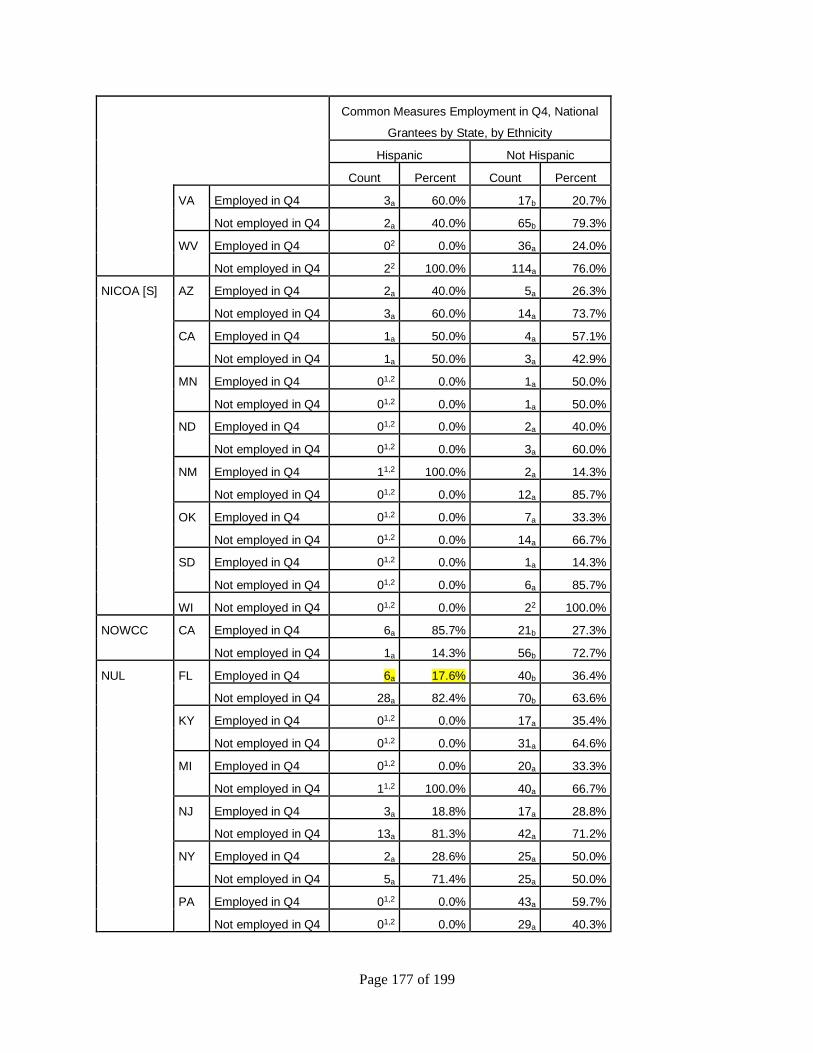
Page 177 of 199
Common Measures Employment in Q4, National
Grantees by State, by Ethnicity
Hispanic Not Hispanic
Count Percent Count Percent
VA Employed in Q4 3a 60.0% 17b 20.7%
Not employed in Q4 2a 40.0% 65b 79.3%
WV Employed in Q4 02 0.0% 36a 24.0%
Not employed in Q4 22 100.0% 114a 76.0%
NICOA [S] AZ Employed in Q4 2a 40.0% 5a 26.3%
Not employed in Q4 3a 60.0% 14a 73.7%
CA Employed in Q4 1a 50.0% 4a 57.1%
Not employed in Q4 1a 50.0% 3a 42.9%
MN Employed in Q4 01,2 0.0% 1a 50.0%
Not employed in Q4 01,2 0.0% 1a 50.0%
ND Employed in Q4 01,2 0.0% 2a 40.0%
Not employed in Q4 01,2 0.0% 3a 60.0%
NM Employed in Q4 11,2 100.0% 2a 14.3%
Not employed in Q4 01,2 0.0% 12a 85.7%
OK Employed in Q4 01,2 0.0% 7a 33.3%
Not employed in Q4 01,2 0.0% 14a 66.7%
SD Employed in Q4 01,2 0.0% 1a 14.3%
Not employed in Q4 01,2 0.0% 6a 85.7%
WI Not employed in Q4 01,2 0.0% 22 100.0%
NOWCC CA Employed in Q4 6a 85.7% 21b 27.3%
Not employed in Q4 1a 14.3% 56b 72.7%
NUL FL Employed in Q4 6a 17.6% 40b 36.4%
Not employed in Q4 28a 82.4% 70b 63.6%
KY Employed in Q4 01,2 0.0% 17a 35.4%
Not employed in Q4 01,2 0.0% 31a 64.6%
MI Employed in Q4 01,2 0.0% 20a 33.3%
Not employed in Q4 11,2 100.0% 40a 66.7%
NJ Employed in Q4 3a 18.8% 17a 28.8%
Not employed in Q4 13a 81.3% 42a 71.2%
NY Employed in Q4 2a 28.6% 25a 50.0%
Not employed in Q4 5a 71.4% 25a 50.0%
PA Employed in Q4 01,2 0.0% 43a 59.7%
Not employed in Q4 01,2 0.0% 29a 40.3%
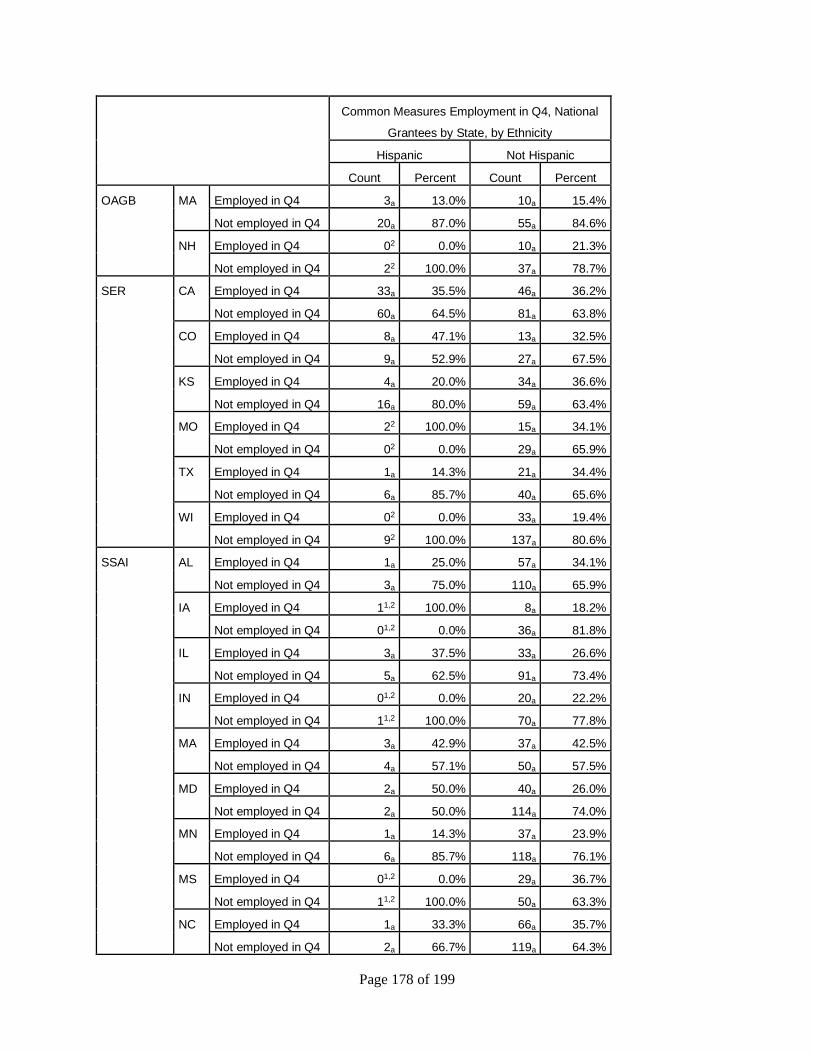
Page 178 of 199
Common Measures Employment in Q4, National
Grantees by State, by Ethnicity
Hispanic Not Hispanic
Count Percent Count Percent
OAGB MA Employed in Q4 3a 13.0% 10a 15.4%
Not employed in Q4 20a 87.0% 55a 84.6%
NH Employed in Q4 02 0.0% 10a 21.3%
Not employed in Q4 22 100.0% 37a 78.7%
SER CA Employed in Q4 33a 35.5% 46a 36.2%
Not employed in Q4 60a 64.5% 81a 63.8%
CO Employed in Q4 8a 47.1% 13a 32.5%
Not employed in Q4 9a 52.9% 27a 67.5%
KS Employed in Q4 4a 20.0% 34a 36.6%
Not employed in Q4 16a 80.0% 59a 63.4%
MO Employed in Q4 22 100.0% 15a 34.1%
Not employed in Q4 02 0.0% 29a 65.9%
TX Employed in Q4 1a 14.3% 21a 34.4%
Not employed in Q4 6a 85.7% 40a 65.6%
WI Employed in Q4 02 0.0% 33a 19.4%
Not employed in Q4 92 100.0% 137a 80.6%
SSAI AL Employed in Q4 1a 25.0% 57a 34.1%
Not employed in Q4 3a 75.0% 110a 65.9%
IA Employed in Q4 11,2 100.0% 8a 18.2%
Not employed in Q4 01,2 0.0% 36a 81.8%
IL Employed in Q4 3a 37.5% 33a 26.6%
Not employed in Q4 5a 62.5% 91a 73.4%
IN Employed in Q4 01,2 0.0% 20a 22.2%
Not employed in Q4 11,2 100.0% 70a 77.8%
MA Employed in Q4 3a 42.9% 37a 42.5%
Not employed in Q4 4a 57.1% 50a 57.5%
MD Employed in Q4 2a 50.0% 40a 26.0%
Not employed in Q4 2a 50.0% 114a 74.0%
MN Employed in Q4 1a 14.3% 37a 23.9%
Not employed in Q4 6a 85.7% 118a 76.1%
MS Employed in Q4 01,2 0.0% 29a 36.7%
Not employed in Q4 11,2 100.0% 50a 63.3%
NC Employed in Q4 1a 33.3% 66a 35.7%
Not employed in Q4 2a 66.7% 119a 64.3%
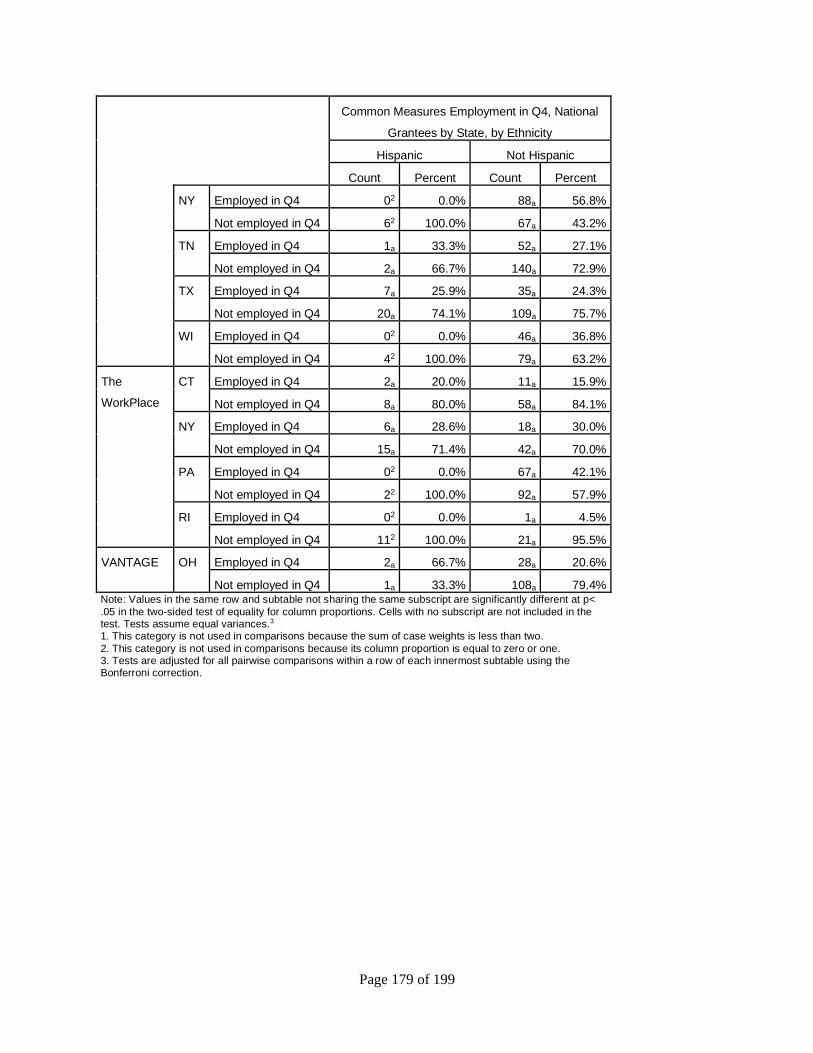
Page 179 of 199
Common Measures Employment in Q4, National
Grantees by State, by Ethnicity
Hispanic Not Hispanic
Count Percent Count Percent
NY Employed in Q4 02 0.0% 88a 56.8%
Not employed in Q4 62 100.0% 67a 43.2%
TN Employed in Q4 1a 33.3% 52a 27.1%
Not employed in Q4 2a 66.7% 140a 72.9%
TX Employed in Q4 7a 25.9% 35a 24.3%
Not employed in Q4 20a 74.1% 109a 75.7%
WI Employed in Q4 02 0.0% 46a 36.8%
Not employed in Q4 42 100.0% 79a 63.2%
The
WorkPlace
CT Employed in Q4 2a 20.0% 11a 15.9%
Not employed in Q4 8a 80.0% 58a 84.1%
NY Employed in Q4 6a 28.6% 18a 30.0%
Not employed in Q4 15a 71.4% 42a 70.0%
PA Employed in Q4 02 0.0% 67a 42.1%
Not employed in Q4 22 100.0% 92a 57.9%
RI Employed in Q4 02 0.0% 1a 4.5%
Not employed in Q4 112 100.0% 21a 95.5%
VANTAGE OH Employed in Q4 2a 66.7% 28a 20.6%
Not employed in Q4 1a 33.3% 108a 79.4% Note: Values in the same row and subtable not sharing the same subscript are significantly different at p<
.05 in the two-sided test of equality for column proportions. Cells with no subscript are not included in the test. Tests assume equal variances.3 1. This category is not used in comparisons because the sum of case weights is less than two.
2. This category is not used in comparisons because its column proportion is equal to zero or one. 3. Tests are adjusted for all pairwise comparisons within a row of each innermost subtable using the Bonferroni correction.
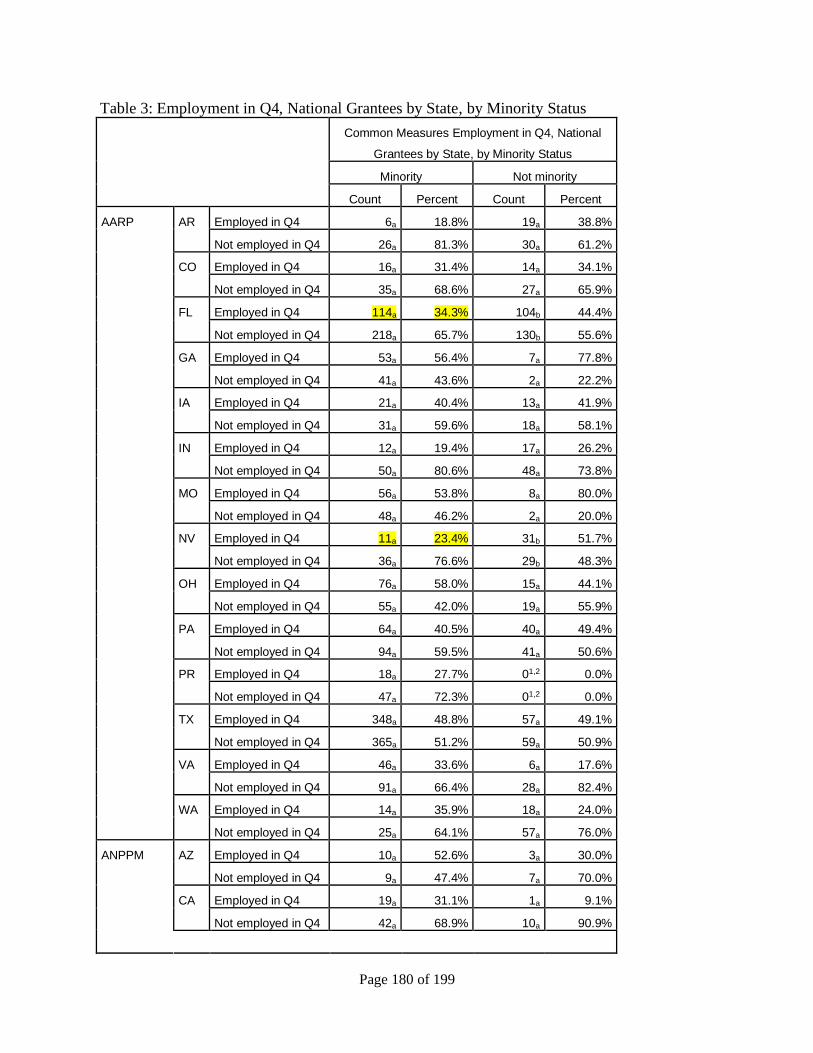
Page 180 of 199
Table 3: Employment in Q4, National Grantees by State, by Minority Status
Common Measures Employment in Q4, National
Grantees by State, by Minority Status
Minority Not minority
Count Percent Count Percent
AARP AR Employed in Q4 6a 18.8% 19a 38.8%
Not employed in Q4 26a 81.3% 30a 61.2%
CO Employed in Q4 16a 31.4% 14a 34.1%
Not employed in Q4 35a 68.6% 27a 65.9%
FL Employed in Q4 114a 34.3% 104b 44.4%
Not employed in Q4 218a 65.7% 130b 55.6%
GA Employed in Q4 53a 56.4% 7a 77.8%
Not employed in Q4 41a 43.6% 2a 22.2%
IA Employed in Q4 21a 40.4% 13a 41.9%
Not employed in Q4 31a 59.6% 18a 58.1%
IN Employed in Q4 12a 19.4% 17a 26.2%
Not employed in Q4 50a 80.6% 48a 73.8%
MO Employed in Q4 56a 53.8% 8a 80.0%
Not employed in Q4 48a 46.2% 2a 20.0%
NV Employed in Q4 11a 23.4% 31b 51.7%
Not employed in Q4 36a 76.6% 29b 48.3%
OH Employed in Q4 76a 58.0% 15a 44.1%
Not employed in Q4 55a 42.0% 19a 55.9%
PA Employed in Q4 64a 40.5% 40a 49.4%
Not employed in Q4 94a 59.5% 41a 50.6%
PR Employed in Q4 18a 27.7% 01,2 0.0%
Not employed in Q4 47a 72.3% 01,2 0.0%
TX Employed in Q4 348a 48.8% 57a 49.1%
Not employed in Q4 365a 51.2% 59a 50.9%
VA Employed in Q4 46a 33.6% 6a 17.6%
Not employed in Q4 91a 66.4% 28a 82.4%
WA Employed in Q4 14a 35.9% 18a 24.0%
Not employed in Q4 25a 64.1% 57a 76.0%
ANPPM AZ Employed in Q4 10a 52.6% 3a 30.0%
Not employed in Q4 9a 47.4% 7a 70.0%
CA Employed in Q4 19a 31.1% 1a 9.1%
Not employed in Q4 42a 68.9% 10a 90.9%
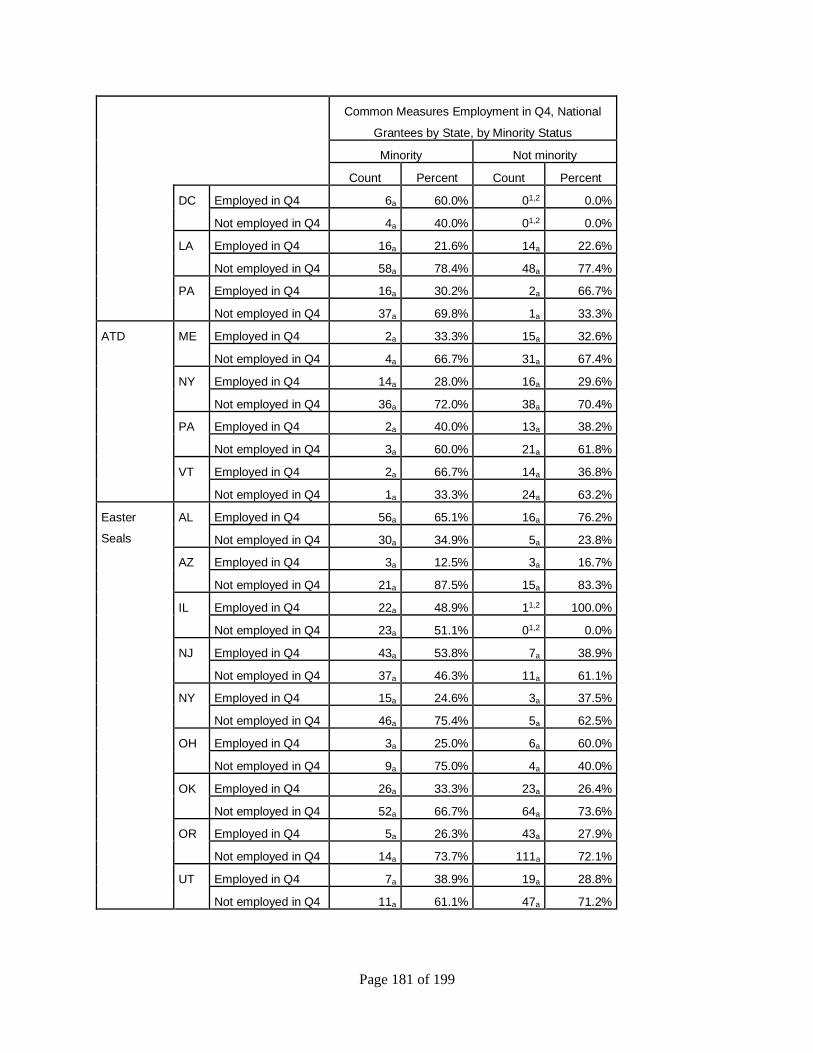
Page 181 of 199
Common Measures Employment in Q4, National
Grantees by State, by Minority Status
Minority Not minority
Count Percent Count Percent
DC Employed in Q4 6a 60.0% 01,2 0.0%
Not employed in Q4 4a 40.0% 01,2 0.0%
LA Employed in Q4 16a 21.6% 14a 22.6%
Not employed in Q4 58a 78.4% 48a 77.4%
PA Employed in Q4 16a 30.2% 2a 66.7%
Not employed in Q4 37a 69.8% 1a 33.3%
ATD ME Employed in Q4 2a 33.3% 15a 32.6%
Not employed in Q4 4a 66.7% 31a 67.4%
NY Employed in Q4 14a 28.0% 16a 29.6%
Not employed in Q4 36a 72.0% 38a 70.4%
PA Employed in Q4 2a 40.0% 13a 38.2%
Not employed in Q4 3a 60.0% 21a 61.8%
VT Employed in Q4 2a 66.7% 14a 36.8%
Not employed in Q4 1a 33.3% 24a 63.2%
Easter
Seals
AL Employed in Q4 56a 65.1% 16a 76.2%
Not employed in Q4 30a 34.9% 5a 23.8%
AZ Employed in Q4 3a 12.5% 3a 16.7%
Not employed in Q4 21a 87.5% 15a 83.3%
IL Employed in Q4 22a 48.9% 11,2 100.0%
Not employed in Q4 23a 51.1% 01,2 0.0%
NJ Employed in Q4 43a 53.8% 7a 38.9%
Not employed in Q4 37a 46.3% 11a 61.1%
NY Employed in Q4 15a 24.6% 3a 37.5%
Not employed in Q4 46a 75.4% 5a 62.5%
OH Employed in Q4 3a 25.0% 6a 60.0%
Not employed in Q4 9a 75.0% 4a 40.0%
OK Employed in Q4 26a 33.3% 23a 26.4%
Not employed in Q4 52a 66.7% 64a 73.6%
OR Employed in Q4 5a 26.3% 43a 27.9%
Not employed in Q4 14a 73.7% 111a 72.1%
UT Employed in Q4 7a 38.9% 19a 28.8%
Not employed in Q4 11a 61.1% 47a 71.2%
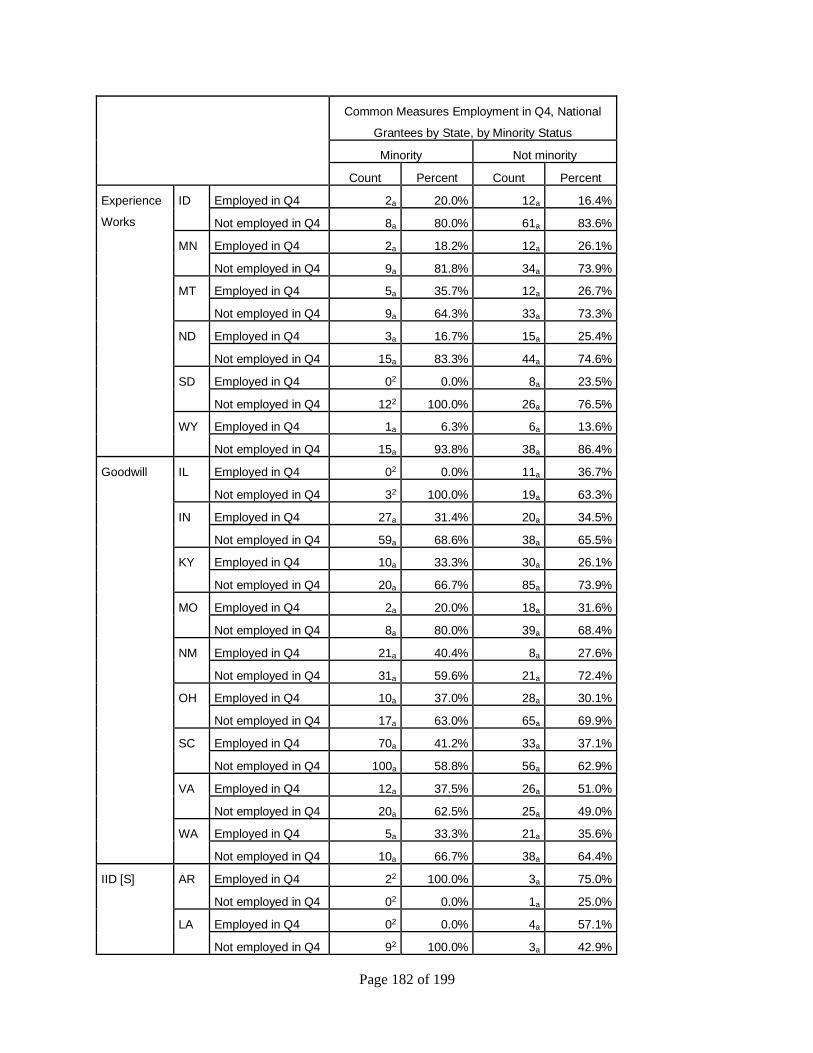
Page 182 of 199
Common Measures Employment in Q4, National
Grantees by State, by Minority Status
Minority Not minority
Count Percent Count Percent
Experience
Works
ID Employed in Q4 2a 20.0% 12a 16.4%
Not employed in Q4 8a 80.0% 61a 83.6%
MN Employed in Q4 2a 18.2% 12a 26.1%
Not employed in Q4 9a 81.8% 34a 73.9%
MT Employed in Q4 5a 35.7% 12a 26.7%
Not employed in Q4 9a 64.3% 33a 73.3%
ND Employed in Q4 3a 16.7% 15a 25.4%
Not employed in Q4 15a 83.3% 44a 74.6%
SD Employed in Q4 02 0.0% 8a 23.5%
Not employed in Q4 122 100.0% 26a 76.5%
WY Employed in Q4 1a 6.3% 6a 13.6%
Not employed in Q4 15a 93.8% 38a 86.4%
Goodwill IL Employed in Q4 02 0.0% 11a 36.7%
Not employed in Q4 32 100.0% 19a 63.3%
IN Employed in Q4 27a 31.4% 20a 34.5%
Not employed in Q4 59a 68.6% 38a 65.5%
KY Employed in Q4 10a 33.3% 30a 26.1%
Not employed in Q4 20a 66.7% 85a 73.9%
MO Employed in Q4 2a 20.0% 18a 31.6%
Not employed in Q4 8a 80.0% 39a 68.4%
NM Employed in Q4 21a 40.4% 8a 27.6%
Not employed in Q4 31a 59.6% 21a 72.4%
OH Employed in Q4 10a 37.0% 28a 30.1%
Not employed in Q4 17a 63.0% 65a 69.9%
SC Employed in Q4 70a 41.2% 33a 37.1%
Not employed in Q4 100a 58.8% 56a 62.9%
VA Employed in Q4 12a 37.5% 26a 51.0%
Not employed in Q4 20a 62.5% 25a 49.0%
WA Employed in Q4 5a 33.3% 21a 35.6%
Not employed in Q4 10a 66.7% 38a 64.4%
IID [S] AR Employed in Q4 22 100.0% 3a 75.0%
Not employed in Q4 02 0.0% 1a 25.0%
LA Employed in Q4 02 0.0% 4a 57.1%
Not employed in Q4 92 100.0% 3a 42.9%
Page 183 of 199
Common Measures Employment in Q4, National
Grantees by State, by Minority Status
Minority Not minority
Count Percent Count Percent
MS Employed in Q4 1a 33.3% 01,2 0.0%
Not employed in Q4 2a 66.7% 01,2 0.0%
TX Employed in Q4 1a 25.0% 01,2 0.0%
Not employed in Q4 3a 75.0% 01,2 0.0%
National
Able
Network
IA Employed in Q4 4a 22.2% 8a 13.3%
Not employed in Q4 14a 77.8% 52a 86.7%
IL Employed in Q4 6a 40.0% 7a 38.9%
Not employed in Q4 9a 60.0% 11a 61.1%
IN Employed in Q4 01,2 0.0% 4a 16.0%
Not employed in Q4 11,2 100.0% 21a 84.0%
NE Employed in Q4 2a 9.5% 6a 14.6%
Not employed in Q4 19a 90.5% 35a 85.4%
NAPCA [S] CA Employed in Q4 17a 32.1% 02 0.0%
Not employed in Q4 36a 67.9% 22 100.0%
IL Employed in Q4 12a 48.0% 01,2 0.0%
Not employed in Q4 13a 52.0% 01,2 0.0%
MA Employed in Q4 19a 57.6% 02 0.0%
Not employed in Q4 14a 42.4% 22 100.0%
NY Employed in Q4 5a 55.6% 01,2 0.0%
Not employed in Q4 4a 44.4% 01,2 0.0%
PA Employed in Q4 4a 20.0% 02 0.0%
Not employed in Q4 16a 80.0% 22 100.0%
TX Employed in Q4 5a 33.3% 02 0.0%
Not employed in Q4 10a 66.7% 22 100.0%
WA Employed in Q4 1a 4.8% 01,2 0.0%
Not employed in Q4 20a 95.2% 11,2 100.0%
NAPCA [G] CA Employed in Q4 22a 26.2% 8a 29.6%
Not employed in Q4 62a 73.8% 19a 70.4%
IL Employed in Q4 15a 31.3% 12a 26.1%
Not employed in Q4 33a 68.8% 34a 73.9%
NY Employed in Q4 3a 42.9% 01,2 0.0%
Not employed in Q4 4a 57.1% 01,2 0.0%
Page 184 of 199
Common Measures Employment in Q4, National
Grantees by State, by Minority Status
Minority Not minority
Count Percent Count Percent
NCBA AR Employed in Q4 24a 34.3% 38a 35.5%
Not employed in Q4 46a 65.7% 69a 64.5%
DC Employed in Q4 32a 62.7% 01,2 0.0%
Not employed in Q4 19a 37.3% 01,2 0.0%
FL Employed in Q4 30a 41.1% 30a 42.9%
Not employed in Q4 43a 58.9% 40a 57.1%
IL Employed in Q4 18a 47.4% 01,2 0.0%
Not employed in Q4 20a 52.6% 01,2 0.0%
MI Employed in Q4 82a 44.1% 49a 34.3%
Not employed in Q4 104a 55.9% 94a 65.7%
MO Employed in Q4 2a 28.6% 11a 13.6%
Not employed in Q4 5a 71.4% 70a 86.4%
MS Employed in Q4 65a 67.7% 6a 50.0%
Not employed in Q4 31a 32.3% 6a 50.0%
NC Employed in Q4 71a 63.4% 15a 65.2%
Not employed in Q4 41a 36.6% 8a 34.8%
OH Employed in Q4 30a 60.0% 1a 50.0%
Not employed in Q4 20a 40.0% 1a 50.0%
NCOA CA Employed in Q4 15a 18.5% 13a 23.6%
Not employed in Q4 66a 81.5% 42a 76.4%
GA Employed in Q4 16a 11.8% 23b 26.1%
Not employed in Q4 120a 88.2% 65b 73.9%
KY Employed in Q4 12a 25.0% 25a 25.5%
Not employed in Q4 36a 75.0% 73a 74.5%
NC Employed in Q4 51a 42.1% 4a 21.1%
Not employed in Q4 70a 57.9% 15a 78.9%
NJ Employed in Q4 39a 39.8% 43a 45.3%
Not employed in Q4 59a 60.2% 52a 54.7%
NY Employed in Q4 45a 52.9% 12a 41.4%
Not employed in Q4 40a 47.1% 17a 58.6%
OH Employed in Q4 21a 42.0% 18a 30.0%
Not employed in Q4 29a 58.0% 42a 70.0%
PA Employed in Q4 37a 25.7% 75a 28.7%
Not employed in Q4 107a 74.3% 186a 71.3%
Page 185 of 199
Common Measures Employment in Q4, National
Grantees by State, by Minority Status
Minority Not minority
Count Percent Count Percent
PR Employed in Q4 8a 14.3% 01,2 0.0%
Not employed in Q4 48a 85.7% 11,2 100.0%
TN Employed in Q4 8a 18.6% 16a 28.1%
Not employed in Q4 35a 81.4% 41a 71.9%
VA Employed in Q4 17a 21.5% 9a 36.0%
Not employed in Q4 62a 78.5% 16a 64.0%
WV Employed in Q4 7a 16.7% 39a 24.7%
Not employed in Q4 35a 83.3% 119a 75.3%
NICOA [S] AZ Employed in Q4 6a 21.4% 1a 25.0%
Not employed in Q4 22a 78.6% 3a 75.0%
CA Employed in Q4 2a 50.0% 3a 37.5%
Not employed in Q4 2a 50.0% 5a 62.5%
MN Employed in Q4 1a 20.0% 01,2 0.0%
Not employed in Q4 4a 80.0% 01,2 0.0%
ND Employed in Q4 2a 40.0% 01,2 0.0%
Not employed in Q4 3a 60.0% 01,2 0.0%
NM Employed in Q4 2a 14.3% 1a 33.3%
Not employed in Q4 12a 85.7% 2a 66.7%
OK Employed in Q4 7a 25.9% 2a 22.2%
Not employed in Q4 20a 74.1% 7a 77.8%
SD Employed in Q4 1a 8.3% 01,2 0.0%
Not employed in Q4 11a 91.7% 01,2 0.0%
WI Employed in Q4 02 0.0% 01,2 0.0%
Not employed in Q4 22 100.0% 01,2 0.0%
NOWCC CA Employed in Q4 12a 50.0% 16b 25.4%
Not employed in Q4 12a 50.0% 47b 74.6%
NUL FL Employed in Q4 19a 24.4% 28b 40.6%
Not employed in Q4 59a 75.6% 41b 59.4%
KY Employed in Q4 14a 29.8% 3a 75.0%
Not employed in Q4 33a 70.2% 1a 25.0%
MI Employed in Q4 20a 35.1% 1a 14.3%
Not employed in Q4 37a 64.9% 6a 85.7%
NJ Employed in Q4 20a 28.2% 1a 16.7%
Not employed in Q4 51a 71.8% 5a 83.3%
Page 186 of 199
Common Measures Employment in Q4, National
Grantees by State, by Minority Status
Minority Not minority
Count Percent Count Percent
NY Employed in Q4 17a 44.7% 10a 47.6%
Not employed in Q4 21a 55.3% 11a 52.4%
PA Employed in Q4 38a 63.3% 6a 46.2%
Not employed in Q4 22a 36.7% 7a 53.8%
OAGB MA Employed in Q4 10a 16.4% 3a 10.3%
Not employed in Q4 51a 83.6% 26a 89.7%
NH Employed in Q4 02 0.0% 10a 23.3%
Not employed in Q4 62 100.0% 33a 76.7%
SER CA Employed in Q4 61a 36.7% 25a 36.2%
Not employed in Q4 105a 63.3% 44a 63.8%
CO Employed in Q4 11a 42.3% 13a 32.5%
Not employed in Q4 15a 57.7% 27a 67.5%
KS Employed in Q4 17a 30.9% 23a 35.9%
Not employed in Q4 38a 69.1% 41a 64.1%
MO Employed in Q4 7a 50.0% 10a 31.3%
Not employed in Q4 7a 50.0% 22a 68.8%
TX Employed in Q4 21a 33.9% 5a 23.8%
Not employed in Q4 41a 66.1% 16a 76.2%
WI Employed in Q4 9a 11.0% 24b 22.9%
Not employed in Q4 73a 89.0% 81b 77.1%
SSAI AL Employed in Q4 42a 39.6% 20a 26.3%
Not employed in Q4 64a 60.4% 56a 73.7%
IA Employed in Q4 1a 50.0% 8a 18.2%
Not employed in Q4 1a 50.0% 36a 81.8%
IL Employed in Q4 35a 28.9% 2a 12.5%
Not employed in Q4 86a 71.1% 14a 87.5%
IN Employed in Q4 16a 21.6% 8a 25.8%
Not employed in Q4 58a 78.4% 23a 74.2%
MA Employed in Q4 16a 41.0% 27a 43.5%
Not employed in Q4 23a 59.0% 35a 56.5%
MD Employed in Q4 34a 25.4% 9a 30.0%
Not employed in Q4 100a 74.6% 21a 70.0%
MN Employed in Q4 14a 17.3% 24a 28.6%
Not employed in Q4 67a 82.7% 60a 71.4%

Page 187 of 199
Common Measures Employment in Q4, National
Grantees by State, by Minority Status
Minority Not minority
Count Percent Count Percent
MS Employed in Q4 22a 39.3% 10a 32.3%
Not employed in Q4 34a 60.7% 21a 67.7%
NC Employed in Q4 46a 38.0% 25a 29.8%
Not employed in Q4 75a 62.0% 59a 70.2%
NY Employed in Q4 76a 52.8% 16a 51.6%
Not employed in Q4 68a 47.2% 15a 48.4%
TN Employed in Q4 35a 31.3% 29a 21.6%
Not employed in Q4 77a 68.8% 105a 78.4%
TX Employed in Q4 15a 22.4% 30a 27.0%
Not employed in Q4 52a 77.6% 81a 73.0%
WI Employed in Q4 9a 28.1% 37a 37.4%
Not employed in Q4 23a 71.9% 62a 62.6%
The
WorkPlace
CT Employed in Q4 10a 18.5% 5a 15.6%
Not employed in Q4 44a 81.5% 27a 84.4%
NY Employed in Q4 22a 30.1% 3a 30.0%
Not employed in Q4 51a 69.9% 7a 70.0%
PA Employed in Q4 57a 43.8% 10a 32.3%
Not employed in Q4 73a 56.2% 21a 67.7%
RI Employed in Q4 02 0.0% 1a 6.7%
Not employed in Q4 252 100.0% 14a 93.3%
VANTAGE OH Employed in Q4 19a 21.3% 14a 22.2%
Not employed in Q4 70a 78.7% 49a 77.8% Note: Values in the same row and subtable not sharing the same subscript are significantly different at p< .05 in the two-sided test of equality for column proportions. Cells with no subscript are not included in the test. Tests assume equal variances.3
1. This category is not used in comparisons because the sum of case weights is less than two. 2. This category is not used in comparisons because its column proportion is equal to zero or one. 3. Tests are adjusted for all pairwise comparisons within a row of each innermost subtable using the
Bonferroni correction.
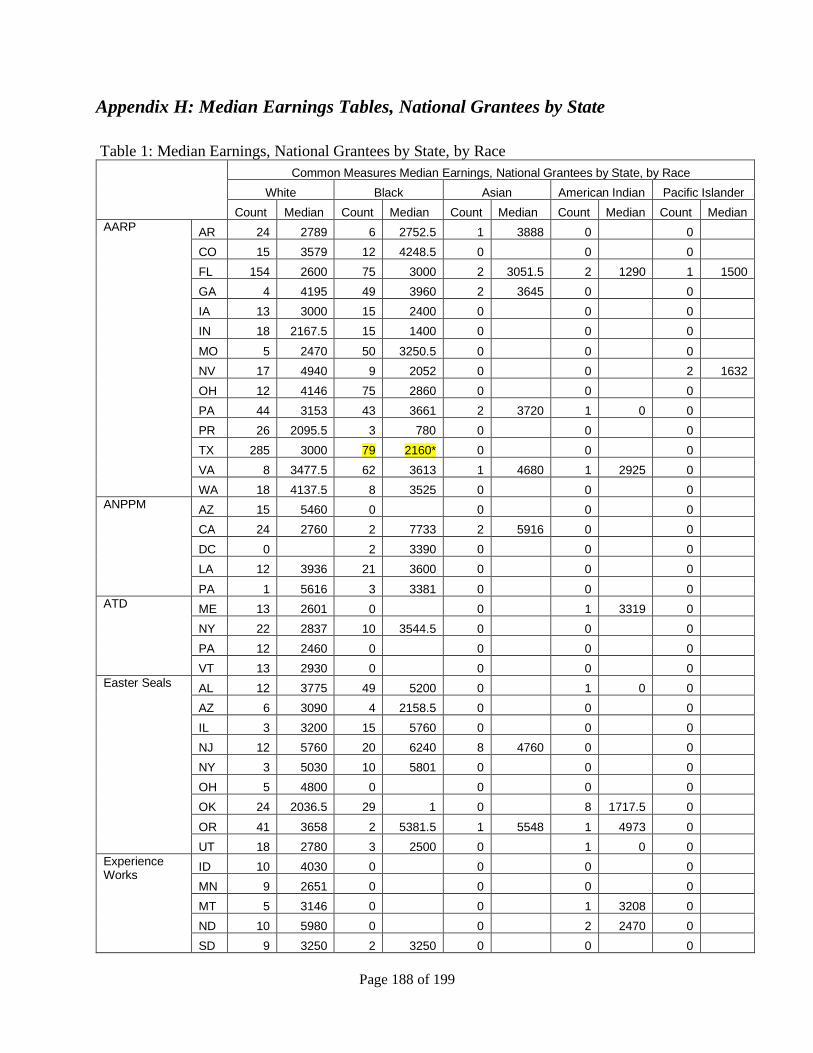
Page 188 of 199
Appendix H: Median Earnings Tables, National Grantees by State
Table 1: Median Earnings, National Grantees by State, by Race
Common Measures Median Earnings, National Grantees by State, by Race
White Black Asian American Indian Pacific Islander
Count Median Count Median Count Median Count Median Count Median
AARP AR 24 2789 6 2752.5 1 3888 0 0
CO 15 3579 12 4248.5 0 0 0
FL 154 2600 75 3000 2 3051.5 2 1290 1 1500
GA 4 4195 49 3960 2 3645 0 0
IA 13 3000 15 2400 0 0 0
IN 18 2167.5 15 1400 0 0 0
MO 5 2470 50 3250.5 0 0 0
NV 17 4940 9 2052 0 0 2 1632
OH 12 4146 75 2860 0 0 0
PA 44 3153 43 3661 2 3720 1 0 0
PR 26 2095.5 3 780 0 0 0
TX 285 3000 79 2160* 0 0 0
VA 8 3477.5 62 3613 1 4680 1 2925 0
WA 18 4137.5 8 3525 0 0 0
ANPPM AZ 15 5460 0 0 0 0
CA 24 2760 2 7733 2 5916 0 0
DC 0 2 3390 0 0 0
LA 12 3936 21 3600 0 0 0
PA 1 5616 3 3381 0 0 0
ATD ME 13 2601 0 0 1 3319 0
NY 22 2837 10 3544.5 0 0 0
PA 12 2460 0 0 0 0
VT 13 2930 0 0 0 0
Easter Seals AL 12 3775 49 5200 0 1 0 0
AZ 6 3090 4 2158.5 0 0 0
IL 3 3200 15 5760 0 0 0
NJ 12 5760 20 6240 8 4760 0 0
NY 3 5030 10 5801 0 0 0
OH 5 4800 0 0 0 0
OK 24 2036.5 29 1 0 8 1717.5 0
OR 41 3658 2 5381.5 1 5548 1 4973 0
UT 18 2780 3 2500 0 1 0 0
Experience Works
ID 10 4030 0 0 0 0
MN 9 2651 0 0 0 0
MT 5 3146 0 0 1 3208 0
ND 10 5980 0 0 2 2470 0
SD 9 3250 2 3250 0 0 0
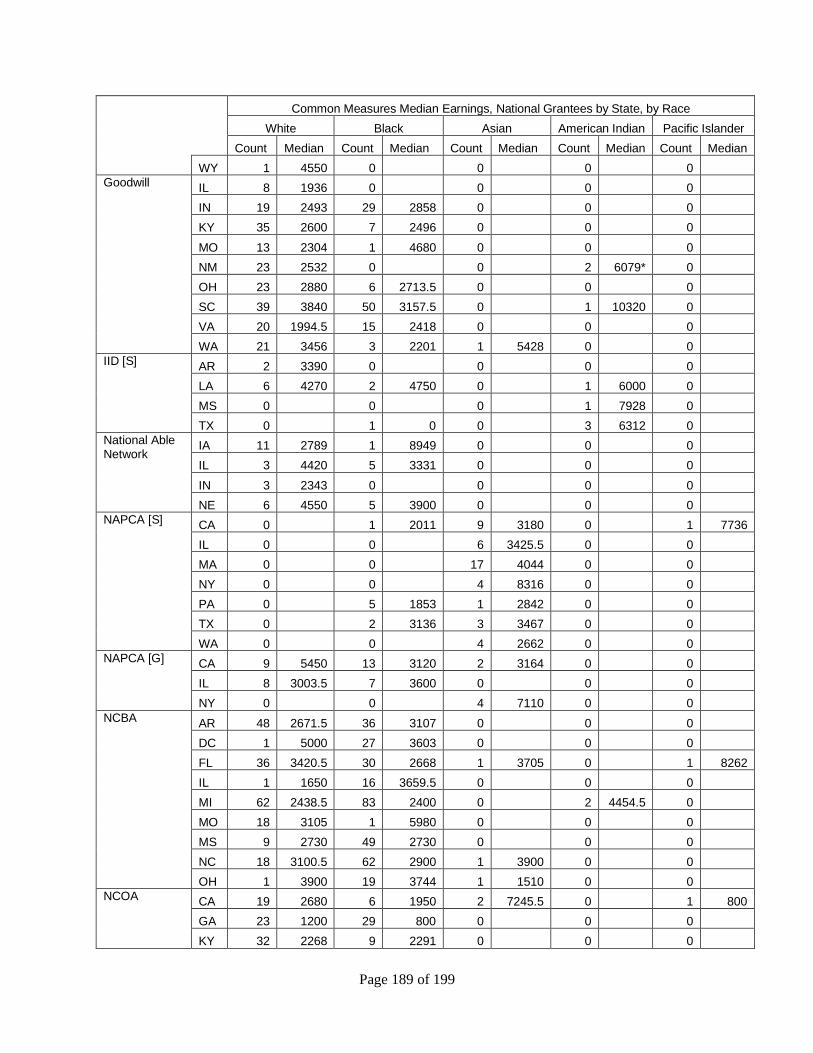
Page 189 of 199
Common Measures Median Earnings, National Grantees by State, by Race
White Black Asian American Indian Pacific Islander
Count Median Count Median Count Median Count Median Count Median
WY 1 4550 0 0 0 0
Goodwill IL 8 1936 0 0 0 0
IN 19 2493 29 2858 0 0 0
KY 35 2600 7 2496 0 0 0
MO 13 2304 1 4680 0 0 0
NM 23 2532 0 0 2 6079* 0
OH 23 2880 6 2713.5 0 0 0
SC 39 3840 50 3157.5 0 1 10320 0
VA 20 1994.5 15 2418 0 0 0
WA 21 3456 3 2201 1 5428 0 0
IID [S] AR 2 3390 0 0 0 0
LA 6 4270 2 4750 0 1 6000 0
MS 0 0 0 1 7928 0
TX 0 1 0 0 3 6312 0
National Able Network
IA 11 2789 1 8949 0 0 0
IL 3 4420 5 3331 0 0 0
IN 3 2343 0 0 0 0
NE 6 4550 5 3900 0 0 0
NAPCA [S] CA 0 1 2011 9 3180 0 1 7736
IL 0 0 6 3425.5 0 0
MA 0 0 17 4044 0 0
NY 0 0 4 8316 0 0
PA 0 5 1853 1 2842 0 0
TX 0 2 3136 3 3467 0 0
WA 0 0 4 2662 0 0
NAPCA [G] CA 9 5450 13 3120 2 3164 0 0
IL 8 3003.5 7 3600 0 0 0
NY 0 0 4 7110 0 0
NCBA AR 48 2671.5 36 3107 0 0 0
DC 1 5000 27 3603 0 0 0
FL 36 3420.5 30 2668 1 3705 0 1 8262
IL 1 1650 16 3659.5 0 0 0
MI 62 2438.5 83 2400 0 2 4454.5 0
MO 18 3105 1 5980 0 0 0
MS 9 2730 49 2730 0 0 0
NC 18 3100.5 62 2900 1 3900 0 0
OH 1 3900 19 3744 1 1510 0 0
NCOA CA 19 2680 6 1950 2 7245.5 0 1 800
GA 23 1200 29 800 0 0 0
KY 32 2268 9 2291 0 0 0
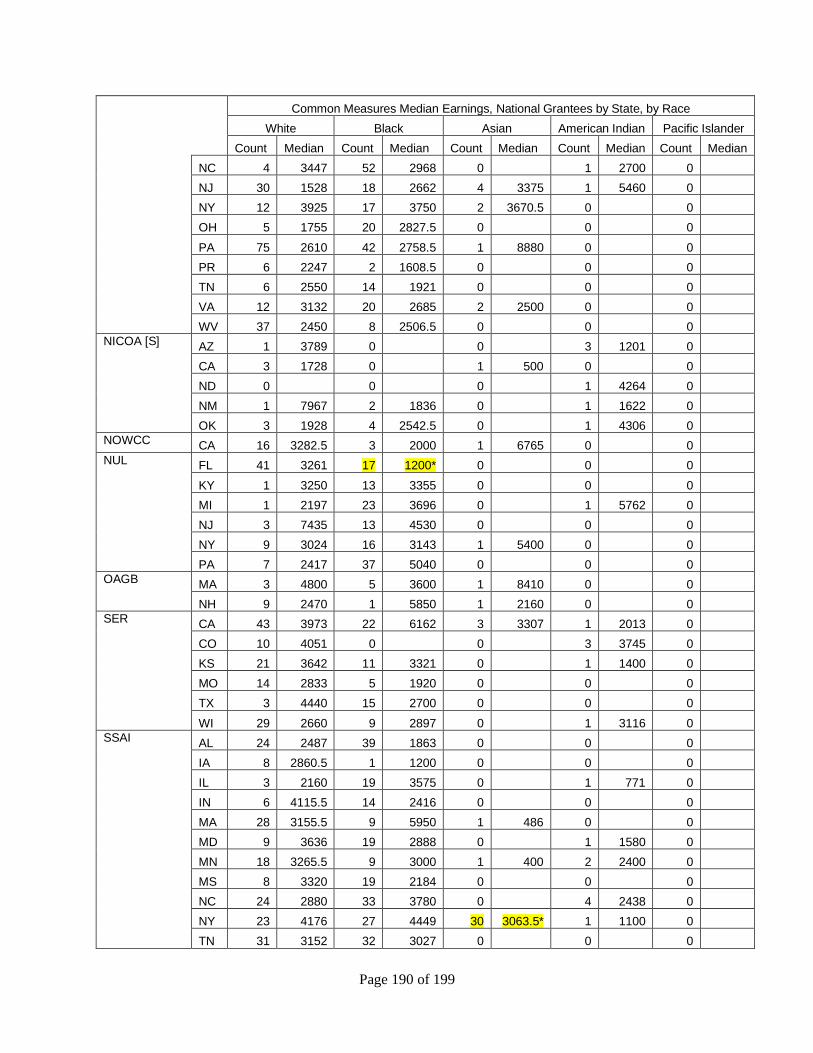
Page 190 of 199
Common Measures Median Earnings, National Grantees by State, by Race
White Black Asian American Indian Pacific Islander
Count Median Count Median Count Median Count Median Count Median
NC 4 3447 52 2968 0 1 2700 0
NJ 30 1528 18 2662 4 3375 1 5460 0
NY 12 3925 17 3750 2 3670.5 0 0
OH 5 1755 20 2827.5 0 0 0
PA 75 2610 42 2758.5 1 8880 0 0
PR 6 2247 2 1608.5 0 0 0
TN 6 2550 14 1921 0 0 0
VA 12 3132 20 2685 2 2500 0 0
WV 37 2450 8 2506.5 0 0 0
NICOA [S] AZ 1 3789 0 0 3 1201 0
CA 3 1728 0 1 500 0 0
ND 0 0 0 1 4264 0
NM 1 7967 2 1836 0 1 1622 0
OK 3 1928 4 2542.5 0 1 4306 0
NOWCC CA 16 3282.5 3 2000 1 6765 0 0
NUL FL 41 3261 17 1200* 0 0 0
KY 1 3250 13 3355 0 0 0
MI 1 2197 23 3696 0 1 5762 0
NJ 3 7435 13 4530 0 0 0
NY 9 3024 16 3143 1 5400 0 0
PA 7 2417 37 5040 0 0 0
OAGB MA 3 4800 5 3600 1 8410 0 0
NH 9 2470 1 5850 1 2160 0 0
SER CA 43 3973 22 6162 3 3307 1 2013 0
CO 10 4051 0 0 3 3745 0
KS 21 3642 11 3321 0 1 1400 0
MO 14 2833 5 1920 0 0 0
TX 3 4440 15 2700 0 0 0
WI 29 2660 9 2897 0 1 3116 0
SSAI AL 24 2487 39 1863 0 0 0
IA 8 2860.5 1 1200 0 0 0
IL 3 2160 19 3575 0 1 771 0
IN 6 4115.5 14 2416 0 0 0
MA 28 3155.5 9 5950 1 486 0 0
MD 9 3636 19 2888 0 1 1580 0
MN 18 3265.5 9 3000 1 400 2 2400 0
MS 8 3320 19 2184 0 0 0
NC 24 2880 33 3780 0 4 2438 0
NY 23 4176 27 4449 30 3063.5* 1 1100 0
TN 31 3152 32 3027 0 0 0
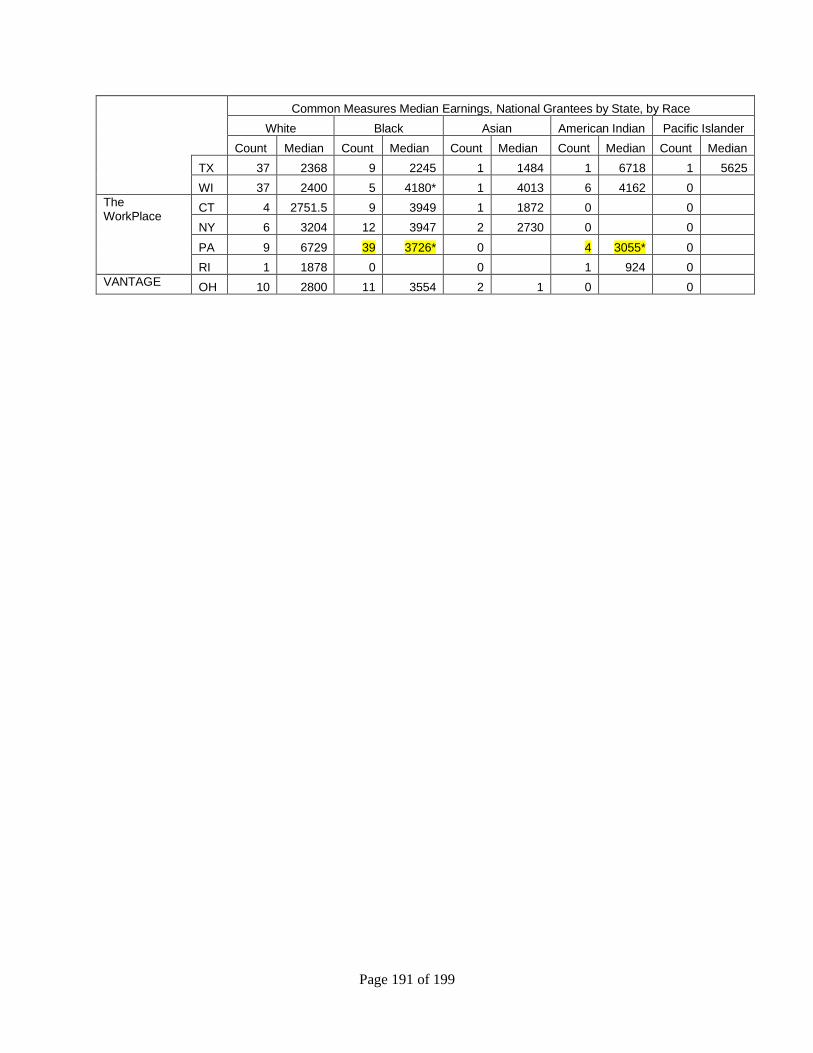
Page 191 of 199
Common Measures Median Earnings, National Grantees by State, by Race
White Black Asian American Indian Pacific Islander
Count Median Count Median Count Median Count Median Count Median
TX 37 2368 9 2245 1 1484 1 6718 1 5625
WI 37 2400 5 4180* 1 4013 6 4162 0
The WorkPlace
CT 4 2751.5 9 3949 1 1872 0 0
NY 6 3204 12 3947 2 2730 0 0
PA 9 6729 39 3726* 0 4 3055* 0
RI 1 1878 0 0 1 924 0
VANTAGE OH 10 2800 11 3554 2 1 0 0
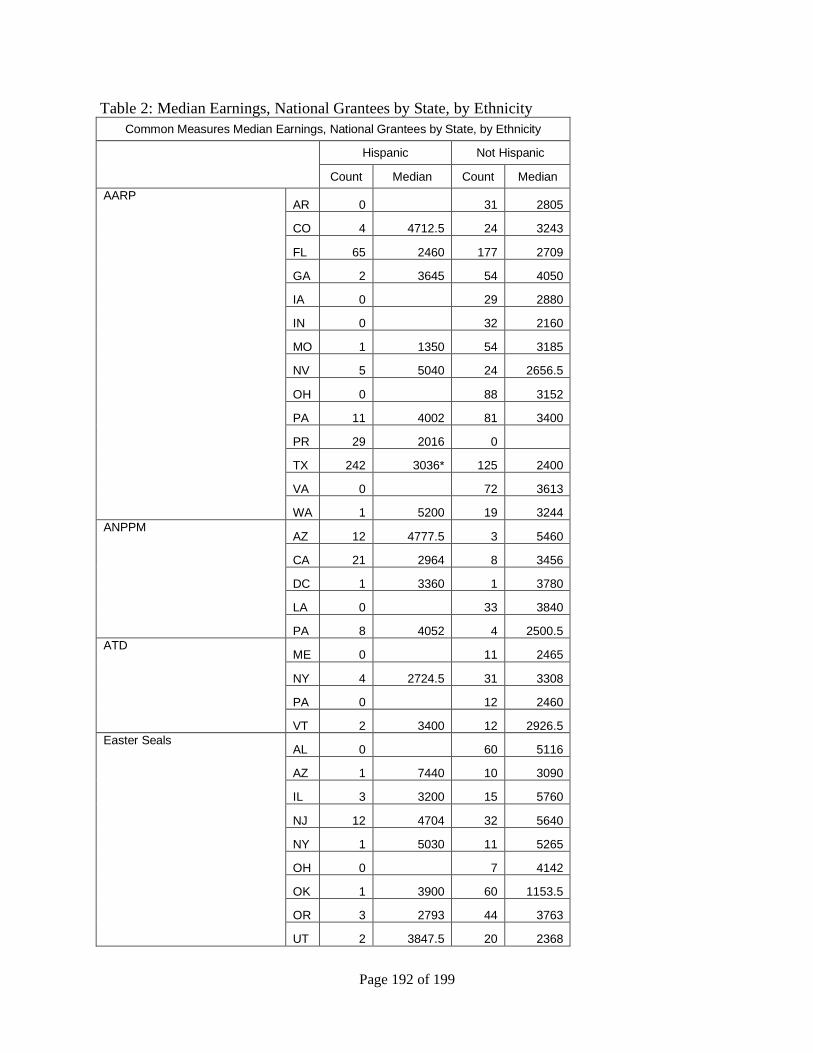
Page 192 of 199
Table 2: Median Earnings, National Grantees by State, by Ethnicity
Common Measures Median Earnings, National Grantees by State, by Ethnicity
Hispanic Not Hispanic
Count Median Count Median
AARP AR 0 31 2805
CO 4 4712.5 24 3243
FL 65 2460 177 2709
GA 2 3645 54 4050
IA 0 29 2880
IN 0 32 2160
MO 1 1350 54 3185
NV 5 5040 24 2656.5
OH 0 88 3152
PA 11 4002 81 3400
PR 29 2016 0
TX 242 3036* 125 2400
VA 0 72 3613
WA 1 5200 19 3244
ANPPM AZ 12 4777.5 3 5460
CA 21 2964 8 3456
DC 1 3360 1 3780
LA 0 33 3840
PA 8 4052 4 2500.5
ATD ME 0 11 2465
NY 4 2724.5 31 3308
PA 0 12 2460
VT 2 3400 12 2926.5
Easter Seals AL 0 60 5116
AZ 1 7440 10 3090
IL 3 3200 15 5760
NJ 12 4704 32 5640
NY 1 5030 11 5265
OH 0 7 4142
OK 1 3900 60 1153.5
OR 3 2793 44 3763
UT 2 3847.5 20 2368
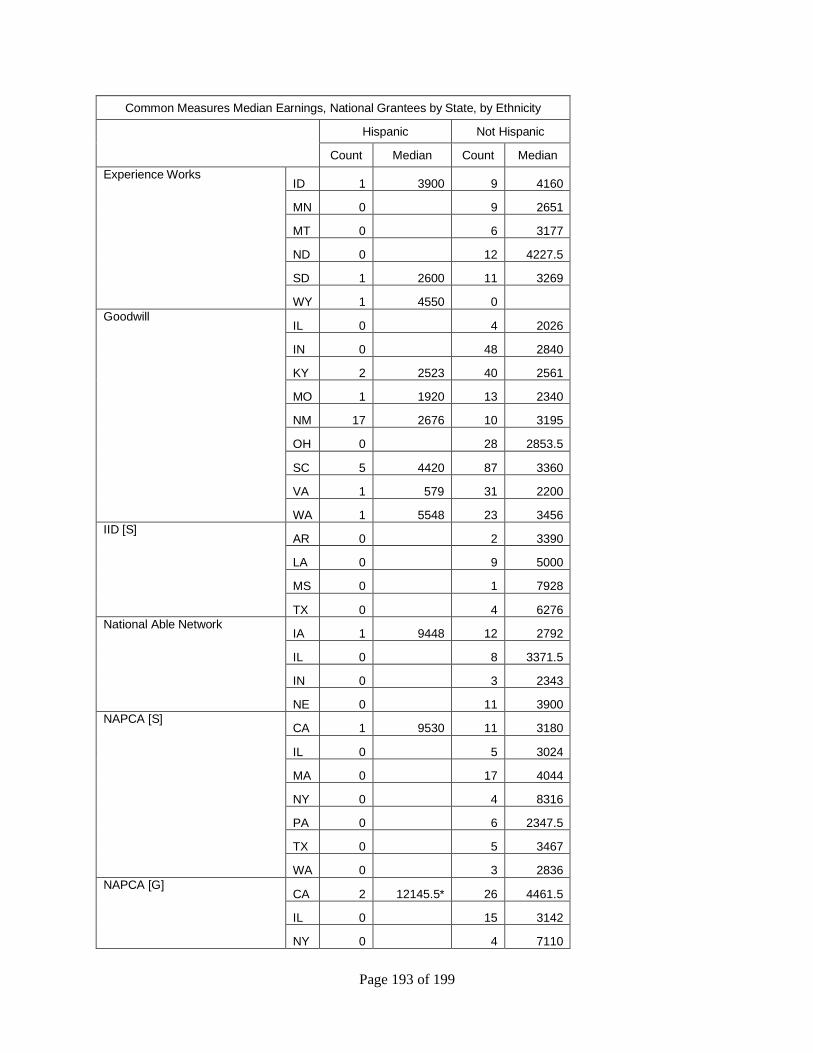
Page 193 of 199
Common Measures Median Earnings, National Grantees by State, by Ethnicity
Hispanic Not Hispanic
Count Median Count Median
Experience Works ID 1 3900 9 4160
MN 0 9 2651
MT 0 6 3177
ND 0 12 4227.5
SD 1 2600 11 3269
WY 1 4550 0 Goodwill
IL 0 4 2026
IN 0 48 2840
KY 2 2523 40 2561
MO 1 1920 13 2340
NM 17 2676 10 3195
OH 0 28 2853.5
SC 5 4420 87 3360
VA 1 579 31 2200
WA 1 5548 23 3456
IID [S] AR 0 2 3390
LA 0 9 5000
MS 0 1 7928
TX 0 4 6276
National Able Network IA 1 9448 12 2792
IL 0 8 3371.5
IN 0 3 2343
NE 0 11 3900
NAPCA [S] CA 1 9530 11 3180
IL 0 5 3024
MA 0 17 4044
NY 0 4 8316
PA 0 6 2347.5
TX 0 5 3467
WA 0 3 2836
NAPCA [G] CA 2 12145.5* 26 4461.5
IL 0 15 3142
NY 0 4 7110
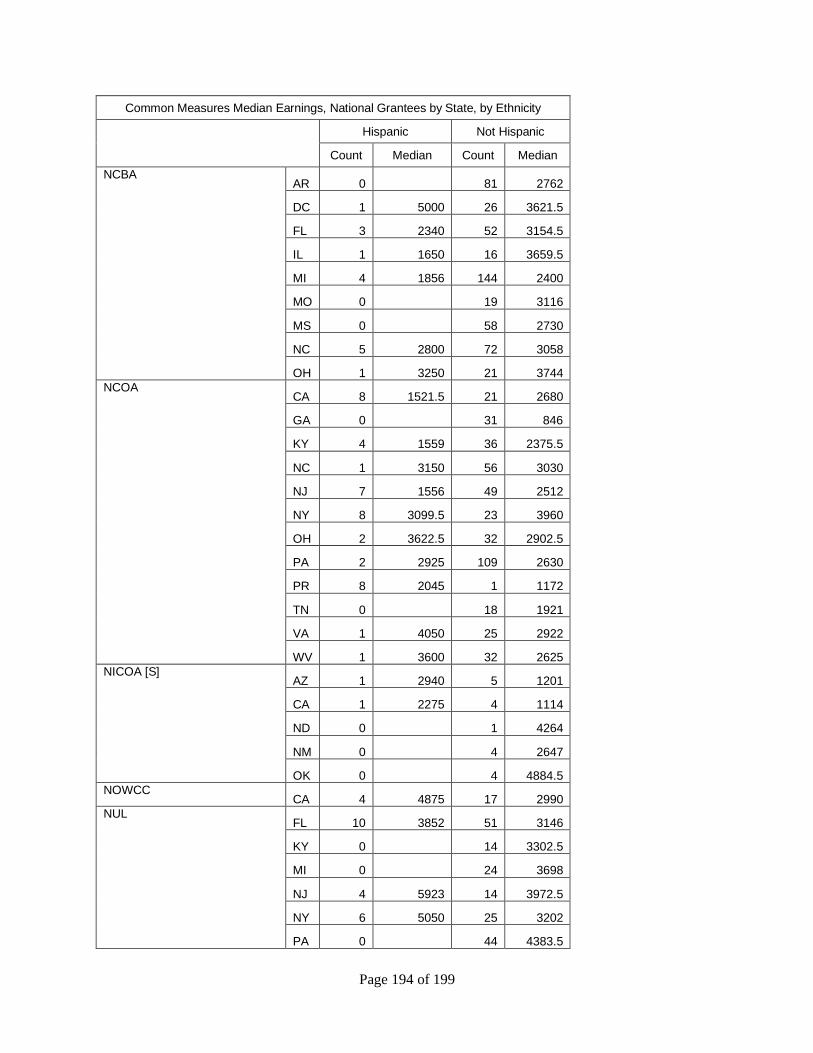
Page 194 of 199
Common Measures Median Earnings, National Grantees by State, by Ethnicity
Hispanic Not Hispanic
Count Median Count Median
NCBA AR 0 81 2762
DC 1 5000 26 3621.5
FL 3 2340 52 3154.5
IL 1 1650 16 3659.5
MI 4 1856 144 2400
MO 0 19 3116
MS 0 58 2730
NC 5 2800 72 3058
OH 1 3250 21 3744
NCOA CA 8 1521.5 21 2680
GA 0 31 846
KY 4 1559 36 2375.5
NC 1 3150 56 3030
NJ 7 1556 49 2512
NY 8 3099.5 23 3960
OH 2 3622.5 32 2902.5
PA 2 2925 109 2630
PR 8 2045 1 1172
TN 0 18 1921
VA 1 4050 25 2922
WV 1 3600 32 2625
NICOA [S] AZ 1 2940 5 1201
CA 1 2275 4 1114
ND 0 1 4264
NM 0 4 2647
OK 0 4 4884.5
NOWCC CA 4 4875 17 2990
NUL FL 10 3852 51 3146
KY 0 14 3302.5
MI 0 24 3698
NJ 4 5923 14 3972.5
NY 6 5050 25 3202
PA 0 44 4383.5
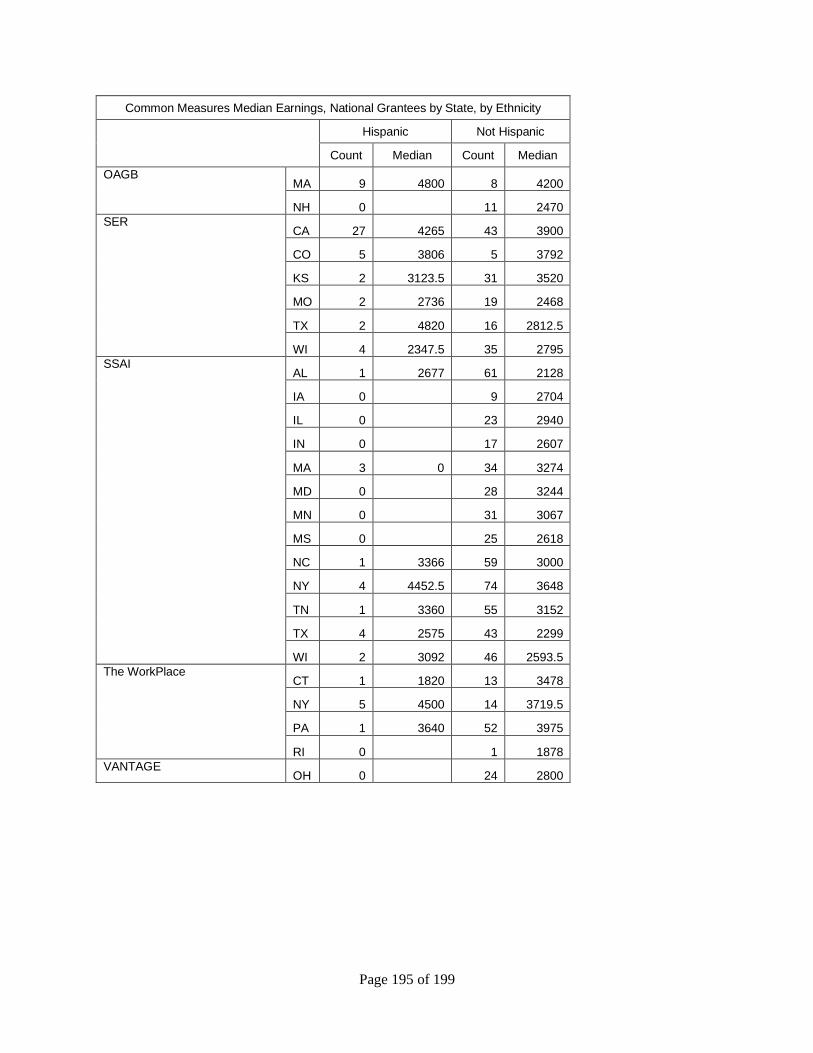
Page 195 of 199
Common Measures Median Earnings, National Grantees by State, by Ethnicity
Hispanic Not Hispanic
Count Median Count Median
OAGB MA 9 4800 8 4200
NH 0 11 2470
SER CA 27 4265 43 3900
CO 5 3806 5 3792
KS 2 3123.5 31 3520
MO 2 2736 19 2468
TX 2 4820 16 2812.5
WI 4 2347.5 35 2795
SSAI AL 1 2677 61 2128
IA 0 9 2704
IL 0 23 2940
IN 0 17 2607
MA 3 0 34 3274
MD 0 28 3244
MN 0 31 3067
MS 0 25 2618
NC 1 3366 59 3000
NY 4 4452.5 74 3648
TN 1 3360 55 3152
TX 4 2575 43 2299
WI 2 3092 46 2593.5
The WorkPlace CT 1 1820 13 3478
NY 5 4500 14 3719.5
PA 1 3640 52 3975
RI 0 1 1878
VANTAGE OH 0 24 2800
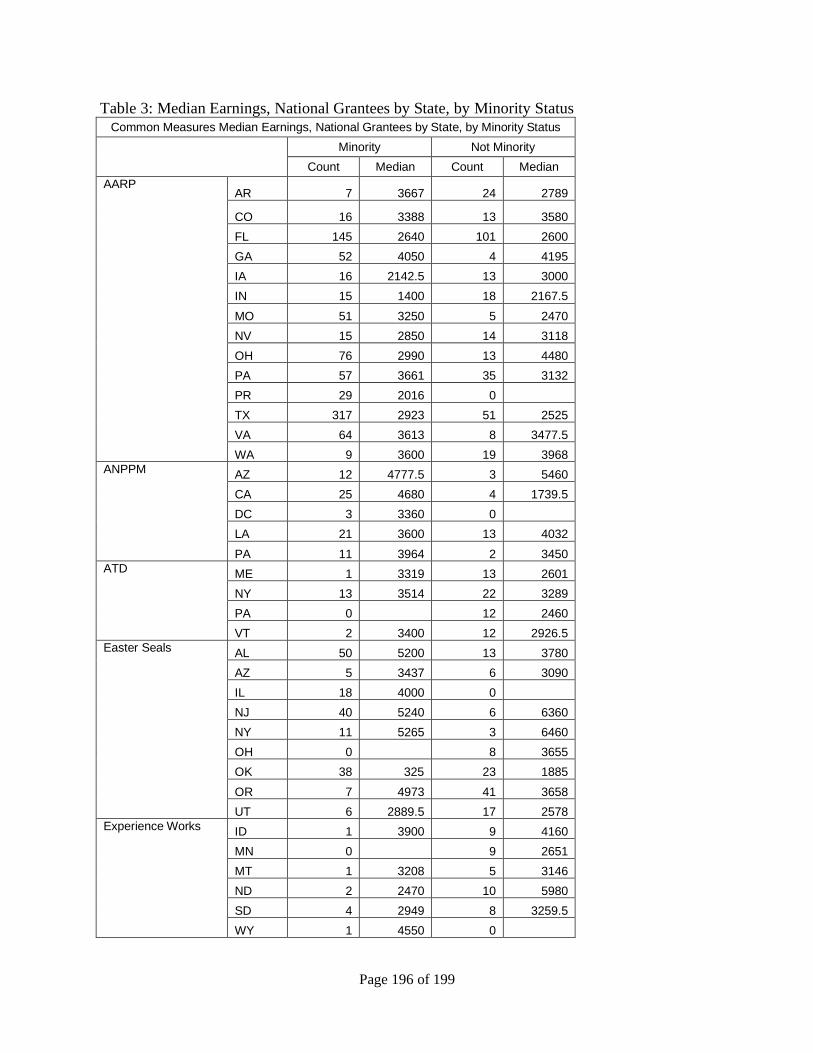
Page 196 of 199
Table 3: Median Earnings, National Grantees by State, by Minority Status Common Measures Median Earnings, National Grantees by State, by Minority Status
Minority Not Minority
Count Median Count Median
AARP AR 7 3667 24 2789
CO 16 3388 13 3580
FL 145 2640 101 2600
GA 52 4050 4 4195
IA 16 2142.5 13 3000
IN 15 1400 18 2167.5
MO 51 3250 5 2470
NV 15 2850 14 3118
OH 76 2990 13 4480
PA 57 3661 35 3132
PR 29 2016 0
TX 317 2923 51 2525
VA 64 3613 8 3477.5
WA 9 3600 19 3968
ANPPM AZ 12 4777.5 3 5460
CA 25 4680 4 1739.5
DC 3 3360 0
LA 21 3600 13 4032
PA 11 3964 2 3450
ATD ME 1 3319 13 2601
NY 13 3514 22 3289
PA 0 12 2460
VT 2 3400 12 2926.5
Easter Seals AL 50 5200 13 3780
AZ 5 3437 6 3090
IL 18 4000 0
NJ 40 5240 6 6360
NY 11 5265 3 6460
OH 0 8 3655
OK 38 325 23 1885
OR 7 4973 41 3658
UT 6 2889.5 17 2578
Experience Works ID 1 3900 9 4160
MN 0 9 2651
MT 1 3208 5 3146
ND 2 2470 10 5980
SD 4 2949 8 3259.5
WY 1 4550 0
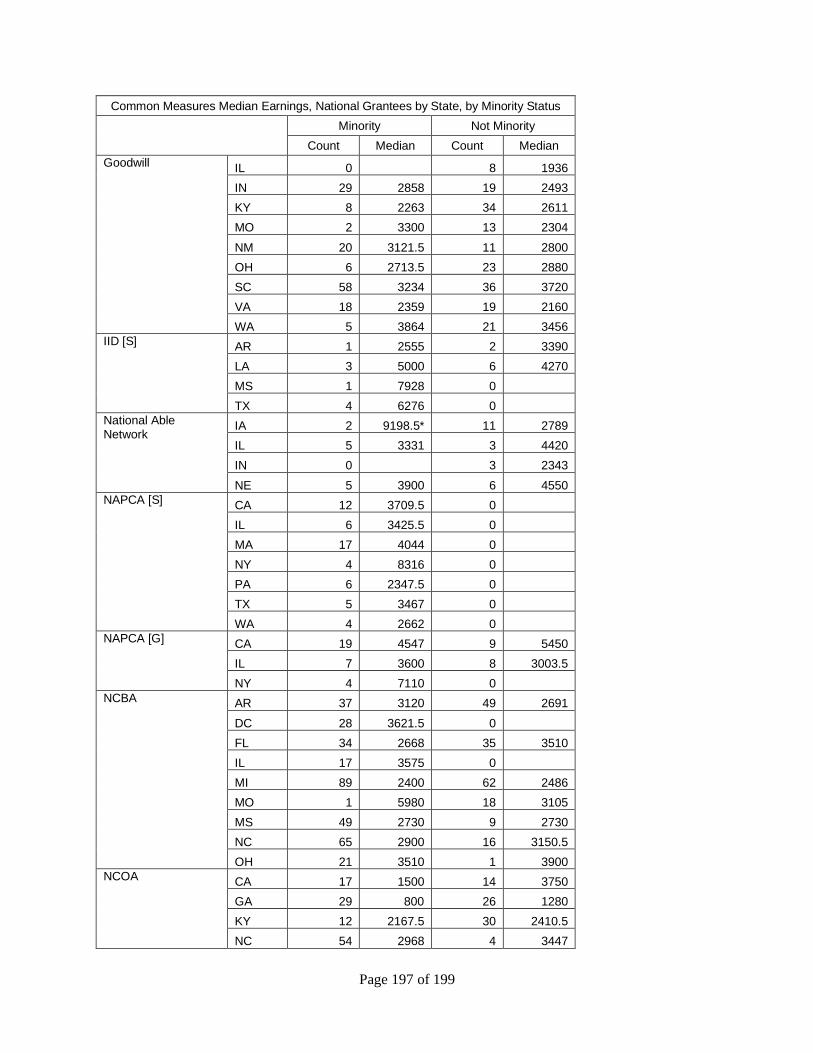
Page 197 of 199
Common Measures Median Earnings, National Grantees by State, by Minority Status
Minority Not Minority
Count Median Count Median
Goodwill IL 0 8 1936
IN 29 2858 19 2493
KY 8 2263 34 2611
MO 2 3300 13 2304
NM 20 3121.5 11 2800
OH 6 2713.5 23 2880
SC 58 3234 36 3720
VA 18 2359 19 2160
WA 5 3864 21 3456
IID [S] AR 1 2555 2 3390
LA 3 5000 6 4270
MS 1 7928 0
TX 4 6276 0 National Able Network
IA 2 9198.5* 11 2789
IL 5 3331 3 4420
IN 0 3 2343
NE 5 3900 6 4550
NAPCA [S] CA 12 3709.5 0
IL 6 3425.5 0
MA 17 4044 0
NY 4 8316 0
PA 6 2347.5 0
TX 5 3467 0
WA 4 2662 0 NAPCA [G] CA 19 4547 9 5450
IL 7 3600 8 3003.5
NY 4 7110 0 NCBA AR 37 3120 49 2691
DC 28 3621.5 0
FL 34 2668 35 3510
IL 17 3575 0
MI 89 2400 62 2486
MO 1 5980 18 3105
MS 49 2730 9 2730
NC 65 2900 16 3150.5
OH 21 3510 1 3900
NCOA CA 17 1500 14 3750
GA 29 800 26 1280
KY 12 2167.5 30 2410.5
NC 54 2968 4 3447
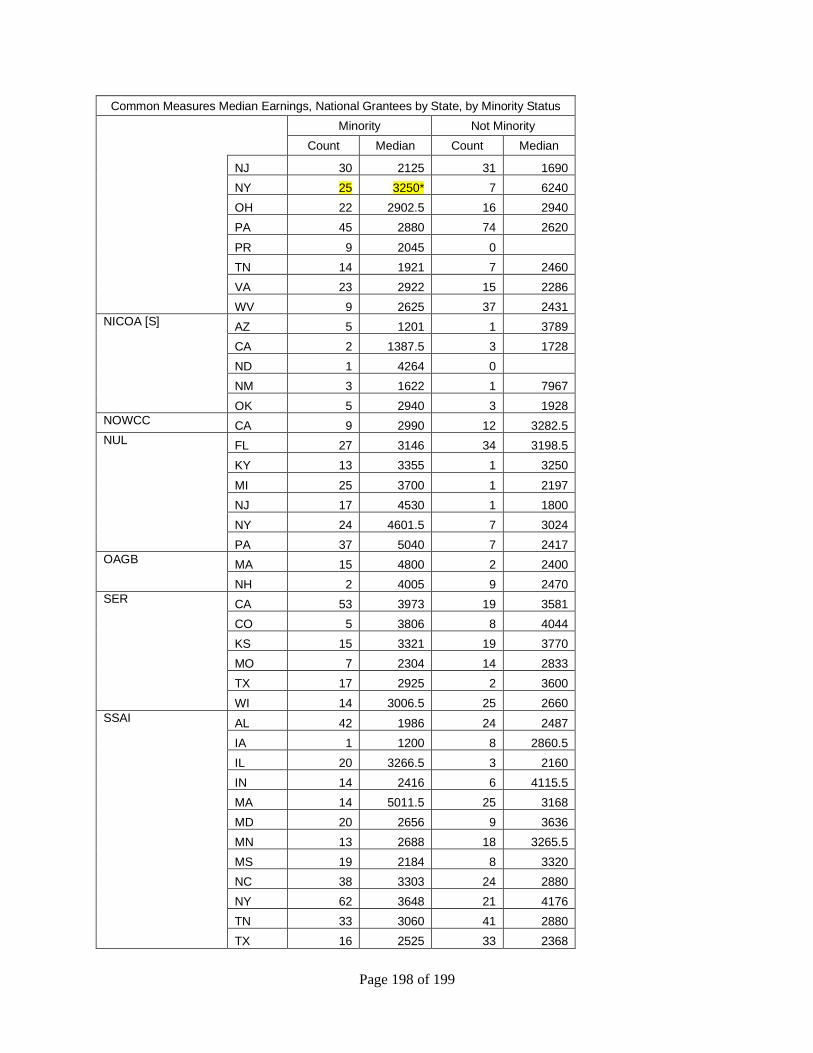
Page 198 of 199
Common Measures Median Earnings, National Grantees by State, by Minority Status
Minority Not Minority
Count Median Count Median
NJ 30 2125 31 1690
NY 25 3250* 7 6240
OH 22 2902.5 16 2940
PA 45 2880 74 2620
PR 9 2045 0
TN 14 1921 7 2460
VA 23 2922 15 2286
WV 9 2625 37 2431
NICOA [S] AZ 5 1201 1 3789
CA 2 1387.5 3 1728
ND 1 4264 0
NM 3 1622 1 7967
OK 5 2940 3 1928
NOWCC CA 9 2990 12 3282.5
NUL FL 27 3146 34 3198.5
KY 13 3355 1 3250
MI 25 3700 1 2197
NJ 17 4530 1 1800
NY 24 4601.5 7 3024
PA 37 5040 7 2417
OAGB MA 15 4800 2 2400
NH 2 4005 9 2470
SER CA 53 3973 19 3581
CO 5 3806 8 4044
KS 15 3321 19 3770
MO 7 2304 14 2833
TX 17 2925 2 3600
WI 14 3006.5 25 2660
SSAI AL 42 1986 24 2487
IA 1 1200 8 2860.5
IL 20 3266.5 3 2160
IN 14 2416 6 4115.5
MA 14 5011.5 25 3168
MD 20 2656 9 3636
MN 13 2688 18 3265.5
MS 19 2184 8 3320
NC 38 3303 24 2880
NY 62 3648 21 4176
TN 33 3060 41 2880
TX 16 2525 33 2368
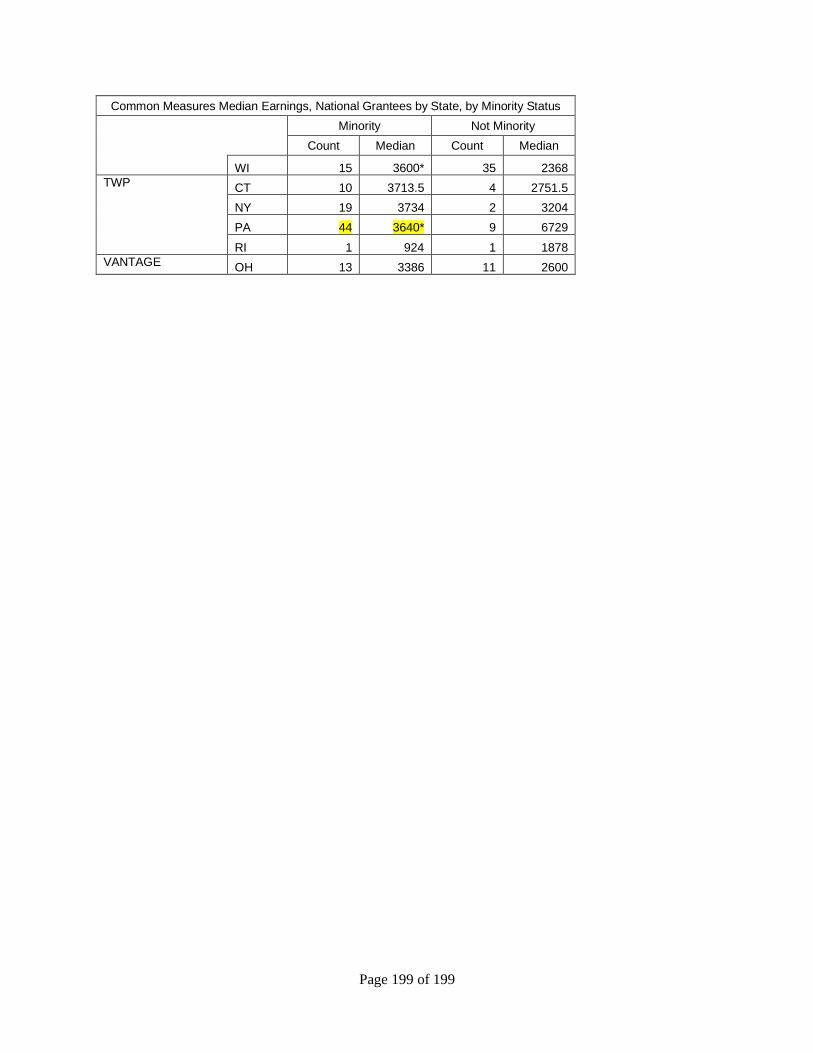
Page 199 of 199
Common Measures Median Earnings, National Grantees by State, by Minority Status
Minority Not Minority
Count Median Count Median
WI 15 3600* 35 2368
TWP CT 10 3713.5 4 2751.5
NY 19 3734 2 3204
PA 44 3640* 9 6729
RI 1 924 1 1878
VANTAGE OH 13 3386 11 2600