Embed Size (px)
Citation preview

The Detection and Monitoring of Droughts: Approximations from Climatological and Hydrological parameters
Nicolas A. Mari
IG - 27 / 12 / 2012
Seminario
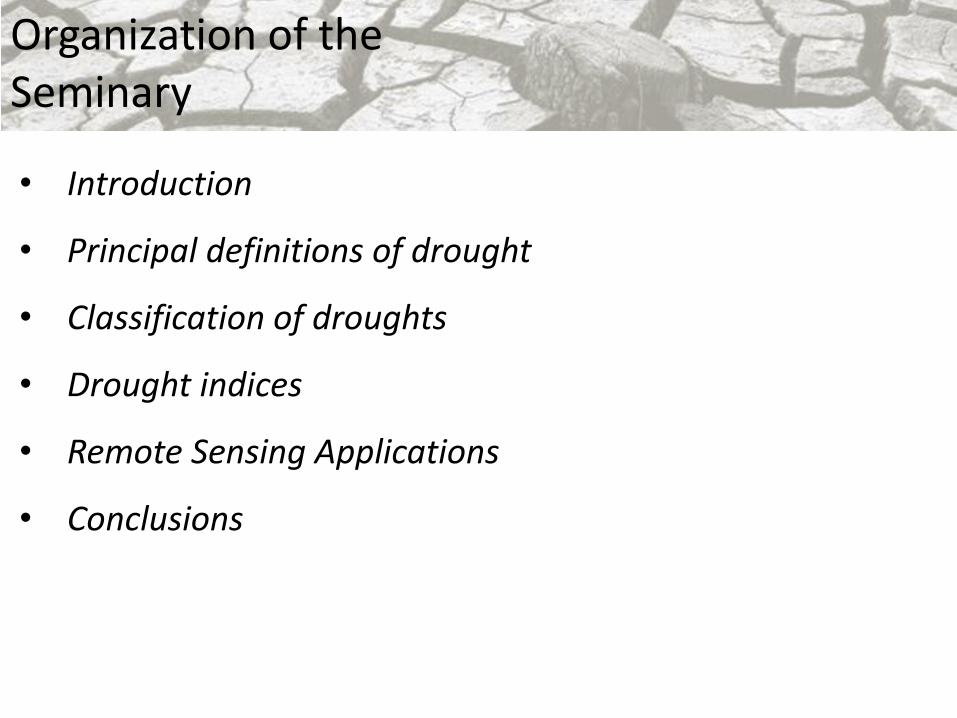
• Introduction
• Principal definitions of drought
• Classification of droughts
• Drought indices
• Remote Sensing Applications
• Conclusions
Organization of the Seminary
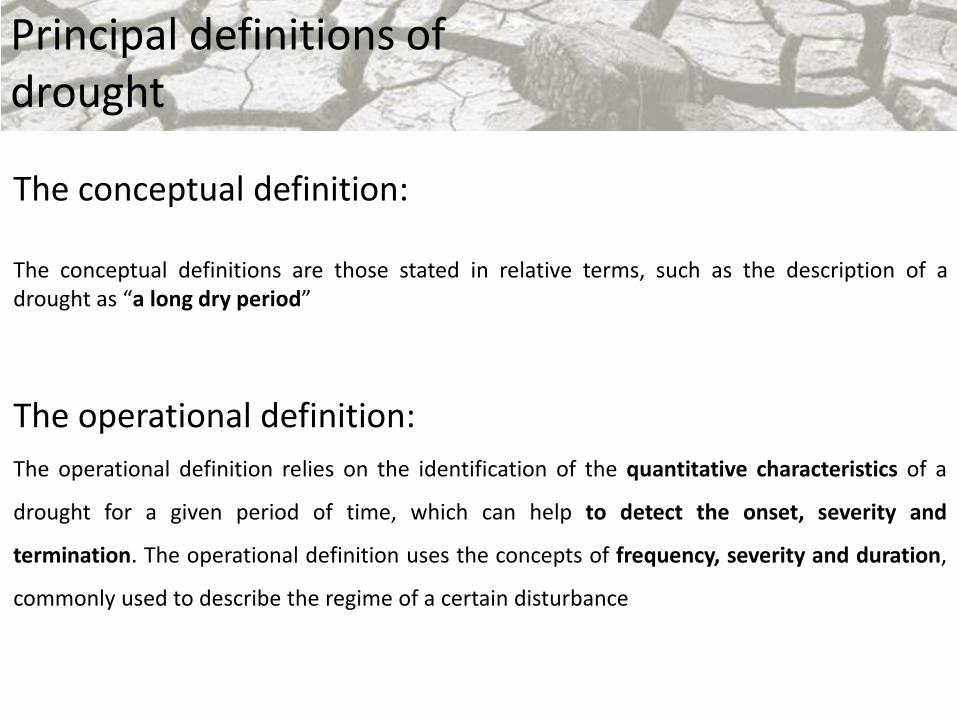
The conceptual definition: The conceptual definitions are those stated in relative terms, such as the description of a drought as “a long dry period”
The operational definition:
The operational definition relies on the identification of the quantitative characteristics of a
drought for a given period of time, which can help to detect the onset, severity and
termination. The operational definition uses the concepts of frequency, severity and duration,
commonly used to describe the regime of a certain disturbance
Principal definitions of drought
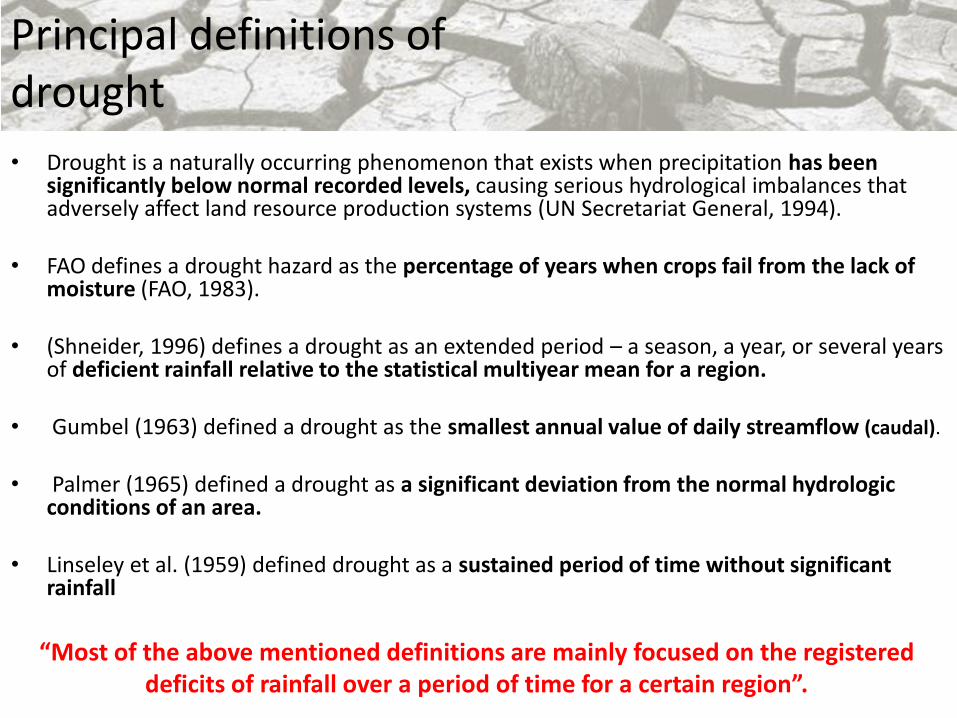
• Drought is a naturally occurring phenomenon that exists when precipitation has been significantly below normal recorded levels, causing serious hydrological imbalances that adversely affect land resource production systems (UN Secretariat General, 1994).
• FAO defines a drought hazard as the percentage of years when crops fail from the lack of moisture (FAO, 1983).
• (Shneider, 1996) defines a drought as an extended period – a season, a year, or several years of deficient rainfall relative to the statistical multiyear mean for a region.
• Gumbel (1963) defined a drought as the smallest annual value of daily streamflow (caudal).
• Palmer (1965) defined a drought as a significant deviation from the normal hydrologic
conditions of an area.
• Linseley et al. (1959) defined drought as a sustained period of time without significant rainfall
Principal definitions of drought
“Most of the above mentioned definitions are mainly focused on the registered deficits of rainfall over a period of time for a certain region”.
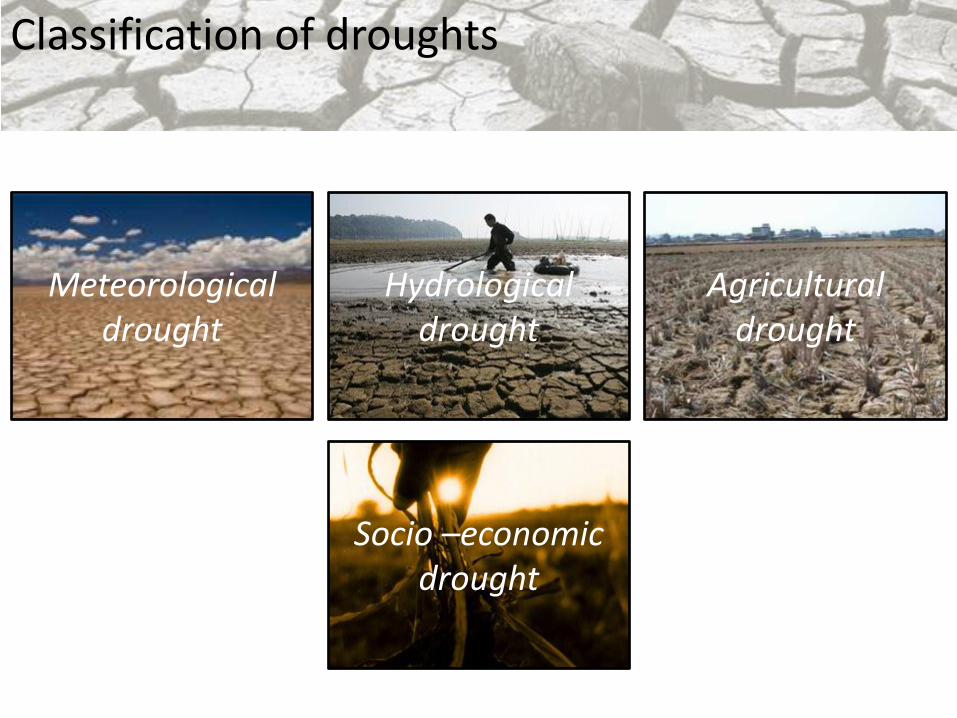
Classification of droughts
Meteorological drought
Hydrological drought
Agricultural drought
Socio –economic drought
Classification of droughts
Meteorological drought is related to the amount of lacking rainfall for
a period of time. Precipitation is the main variable used for
meteorological drought analysis. Monthly precipitation data is usually
compared with average values (Gibs, 1975). Other analyses are focused
on determining drought duration and intensity in relation to
cumulative precipitation shortages (Chang and Kleopa, 1991; Estrela et
al., 2000).
Meteorological drought
Classification of droughts
Hydrological drought is defined when a given water resources
management system is affected by a period of insufficient surface and
subsurface water supply. Streamflow drought is proven to be related to
the catchment properties, being geology an important factor in
hydrological droughts.
Hydrological drought
Classification of droughts
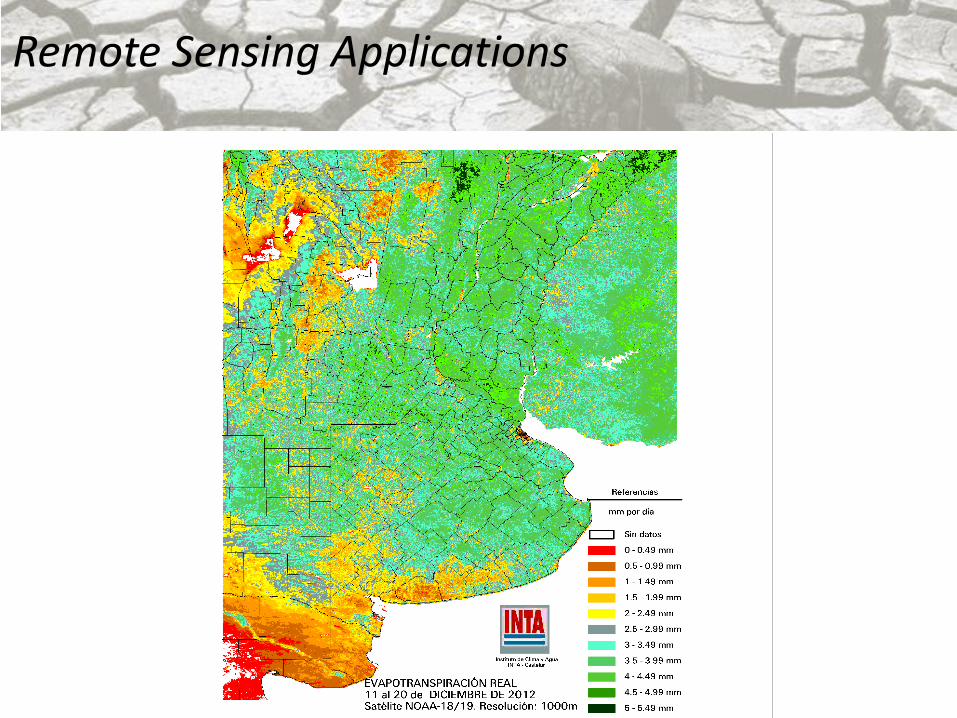
Agricultural drought is specifically related to the insufficiency of soil
moisture for a period of time, independent of the availability of surface
water resources, which affects crops. Actual and potential
evapotranspiration plays a key role on the decline of soil moisture,
which is related to the plant water demand, prevailing weather
conditions, the physiological characteristics of the plants and the
physical and biological properties of the soil itself. The combination of
meteorological variables with soil moisture has been useful to produce
several drought indices related to study agricultural droughts.
Agricultural drought
Classification of droughts
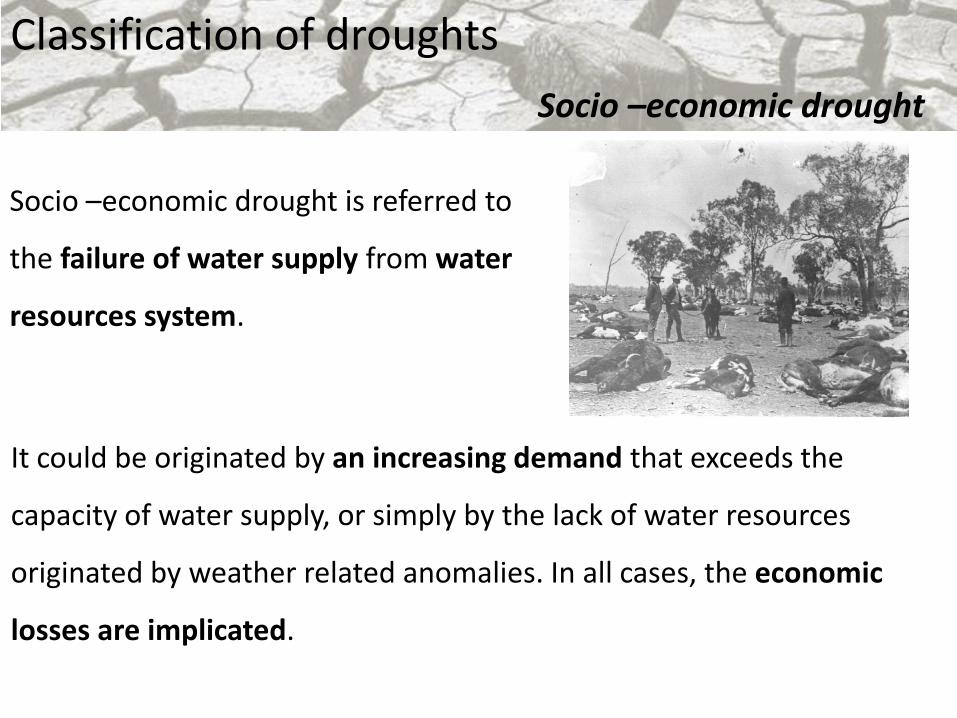
Socio –economic drought
It could be originated by an increasing demand that exceeds the
capacity of water supply, or simply by the lack of water resources
originated by weather related anomalies. In all cases, the economic
losses are implicated.
Socio –economic drought is referred to
the failure of water supply from water
resources system.
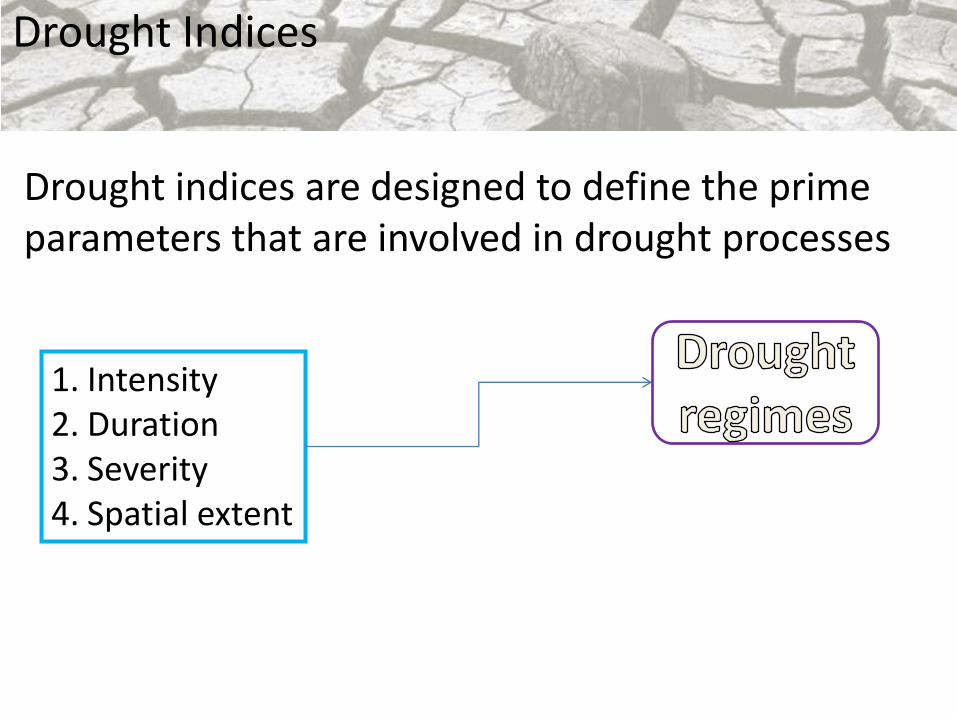
Drought Indices
1. Intensity 2. Duration 3. Severity 4. Spatial extent
Drought indices are designed to define the prime parameters that are involved in drought processes
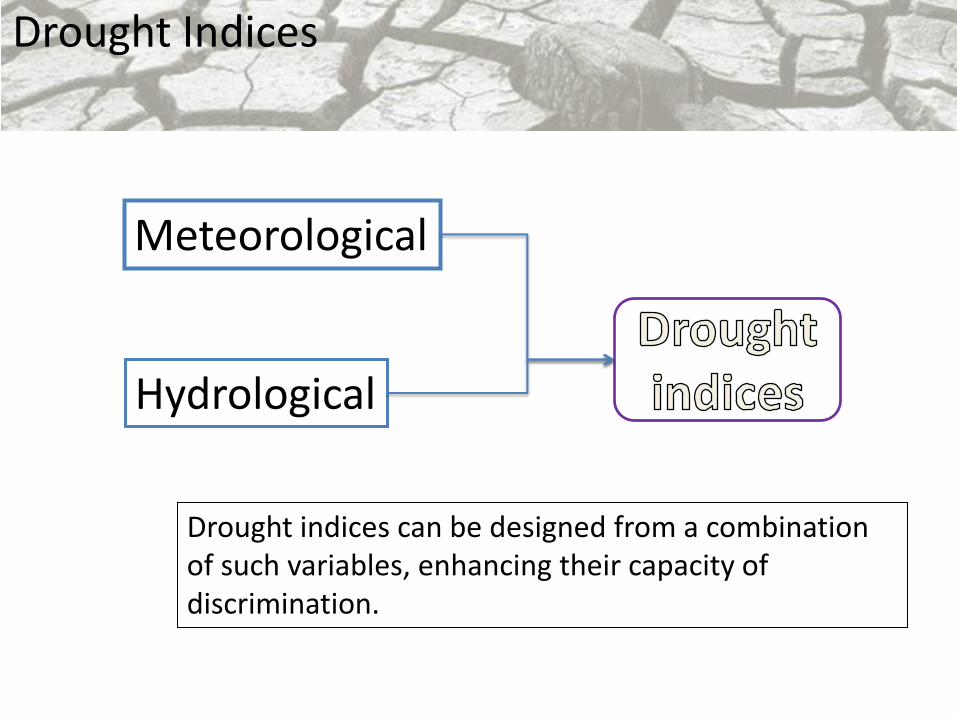
Drought Indices
Meteorological
Hydrological
Drought indices can be designed from a combination of such variables, enhancing their capacity of discrimination.
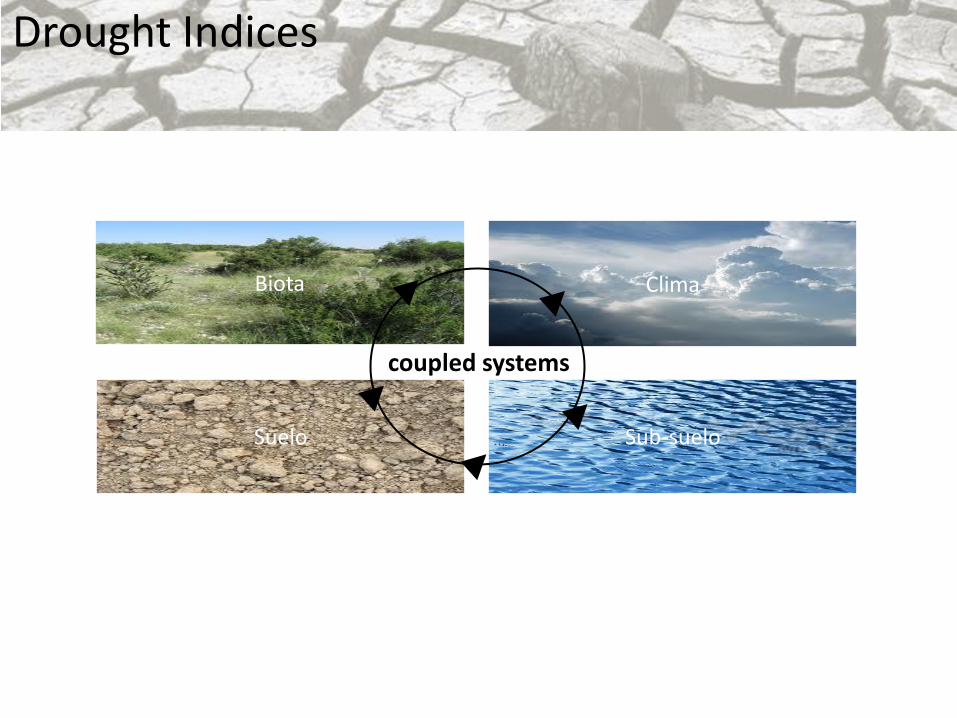
Drought Indices
Suelo Sub-suelo
Biota Clima
coupled systems
Drought Indices
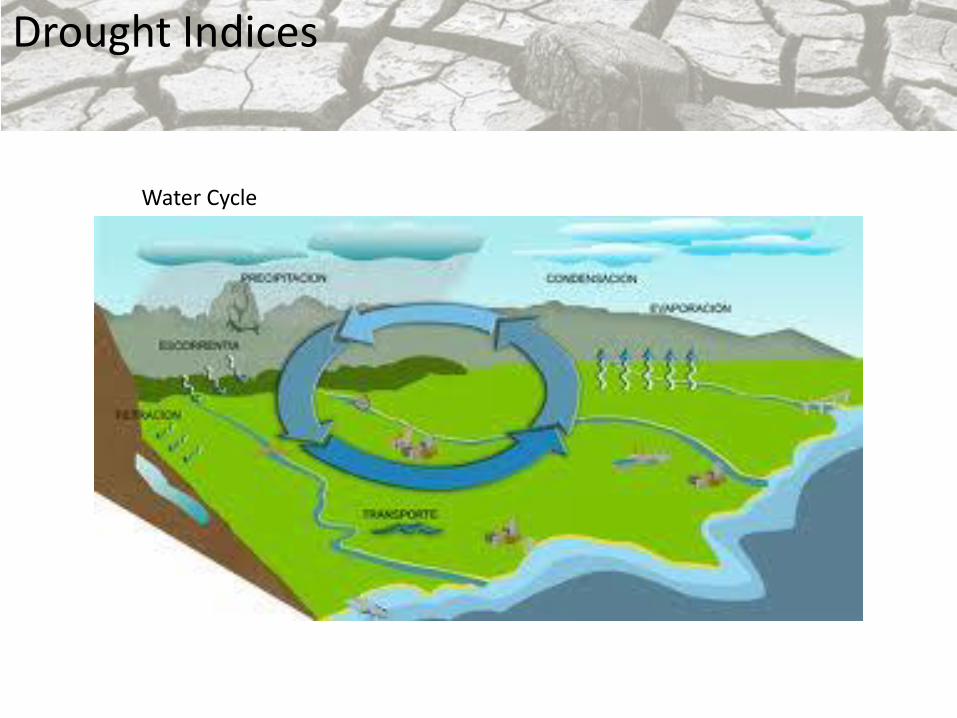
Water Cycle

Drought Indices
Long time series of data are essential to evaluate the effect of drought at different time scales.
Pp
,
T
and the monthly time scale of data is useful for monitoring drought in agricultural practices, water supply and groundwater data analysis
One year of data is useful to abstract information on the regional behavior of droughts
Drought Indices
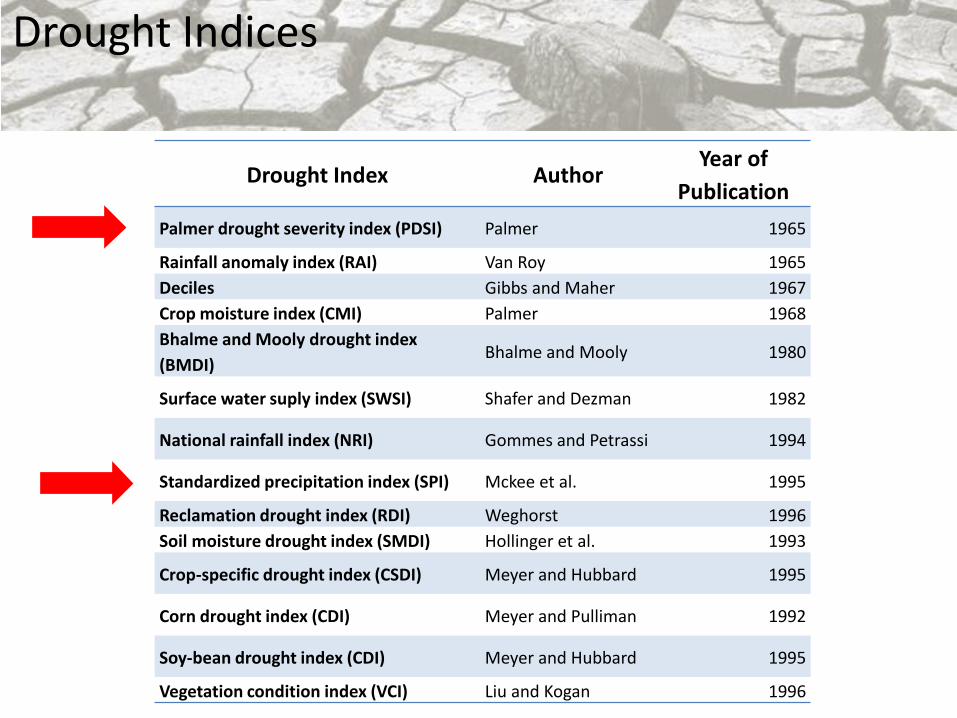
Drought Index Author Year of
Publication
Palmer drought severity index (PDSI) Palmer 1965
Rainfall anomaly index (RAI) Van Roy 1965
Deciles Gibbs and Maher 1967
Crop moisture index (CMI) Palmer 1968
Bhalme and Mooly drought index
(BMDI) Bhalme and Mooly 1980
Surface water suply index (SWSI) Shafer and Dezman 1982
National rainfall index (NRI) Gommes and Petrassi 1994
Standardized precipitation index (SPI) Mckee et al. 1995
Reclamation drought index (RDI) Weghorst 1996
Soil moisture drought index (SMDI) Hollinger et al. 1993
Crop-specific drought index (CSDI) Meyer and Hubbard 1995
Corn drought index (CDI) Meyer and Pulliman 1992
Soy-bean drought index (CDI) Meyer and Hubbard 1995
Vegetation condition index (VCI) Liu and Kogan 1996
4.1 Standardized precipitation index (SPI)
Drought Indices
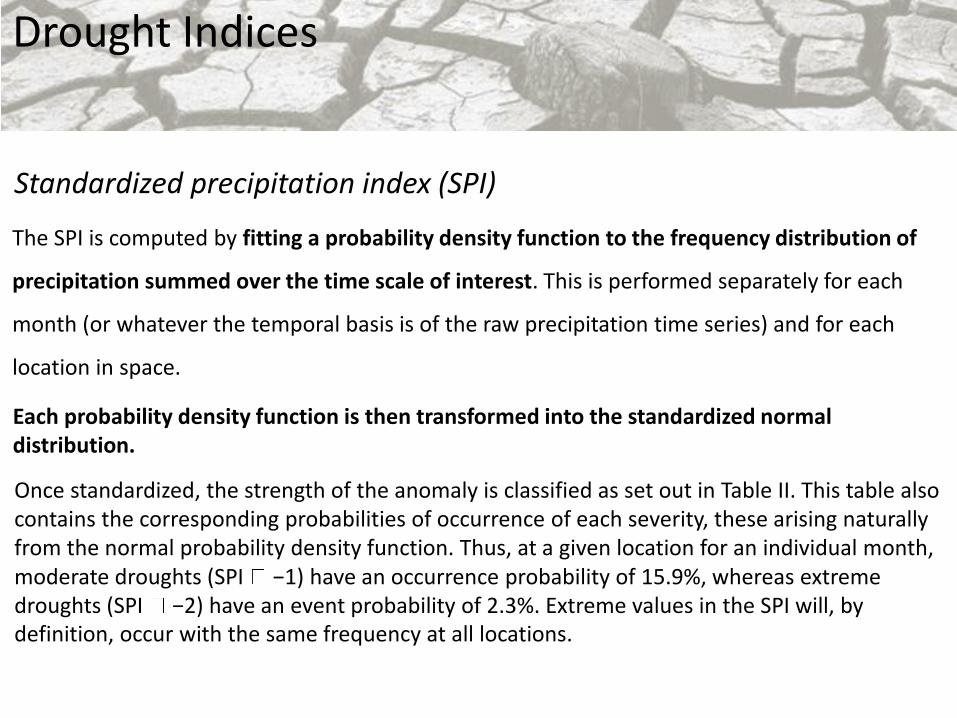
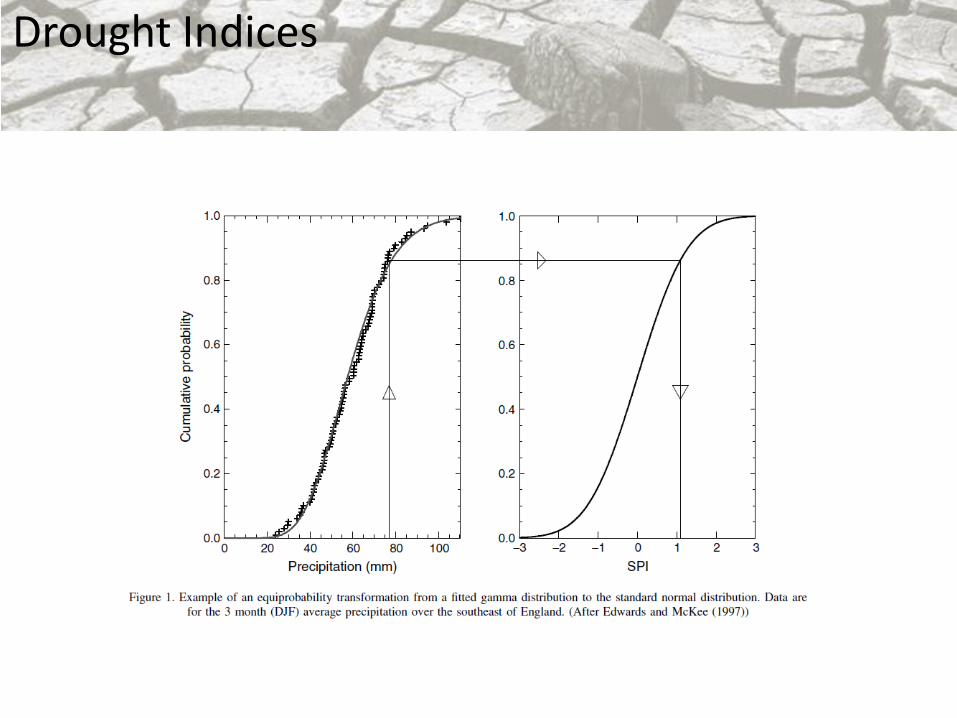
Standardized precipitation index (SPI)
The SPI is computed by fitting a probability density function to the frequency distribution of
precipitation summed over the time scale of interest. This is performed separately for each
month (or whatever the temporal basis is of the raw precipitation time series) and for each
location in space.
Each probability density function is then transformed into the standardized normal distribution.
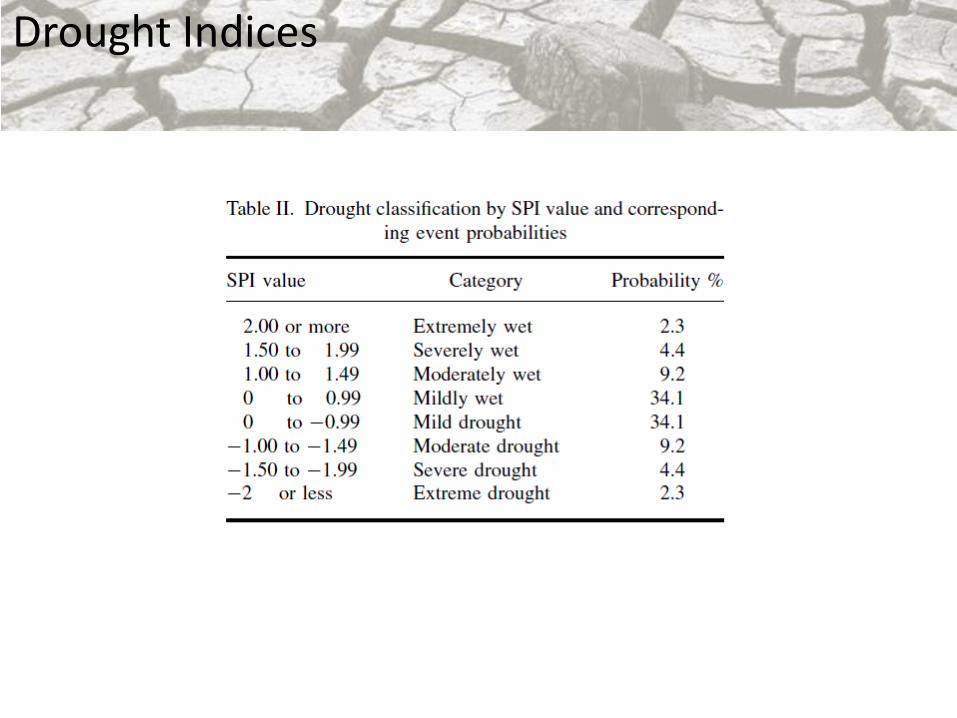
Once standardized, the strength of the anomaly is classified as set out in Table II. This table also contains the corresponding probabilities of occurrence of each severity, these arising naturally from the normal probability density function. Thus, at a given location for an individual month, moderate droughts (SPI −1) have an occurrence probability of 15.9%, whereas extreme droughts (SPI −2) have an event probability of 2.3%. Extreme values in the SPI will, by definition, occur with the same frequency at all locations.
Drought Indices Drought Indices
Drought Indices Drought Indices
Drought Indices Drought Indices
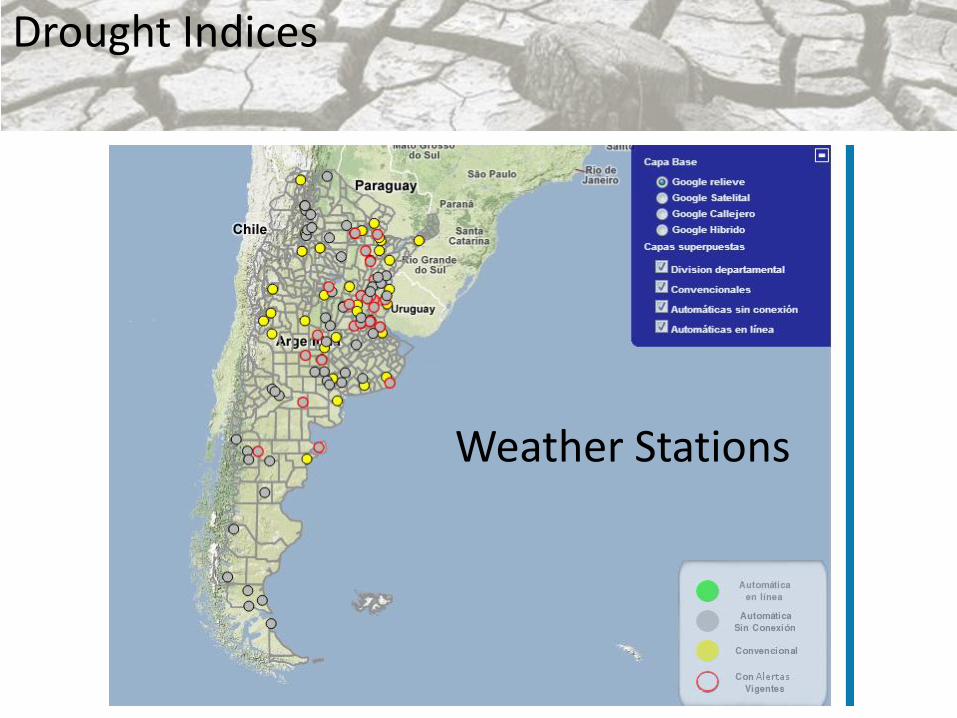
Weather Stations
Drought Indices Drought Indices
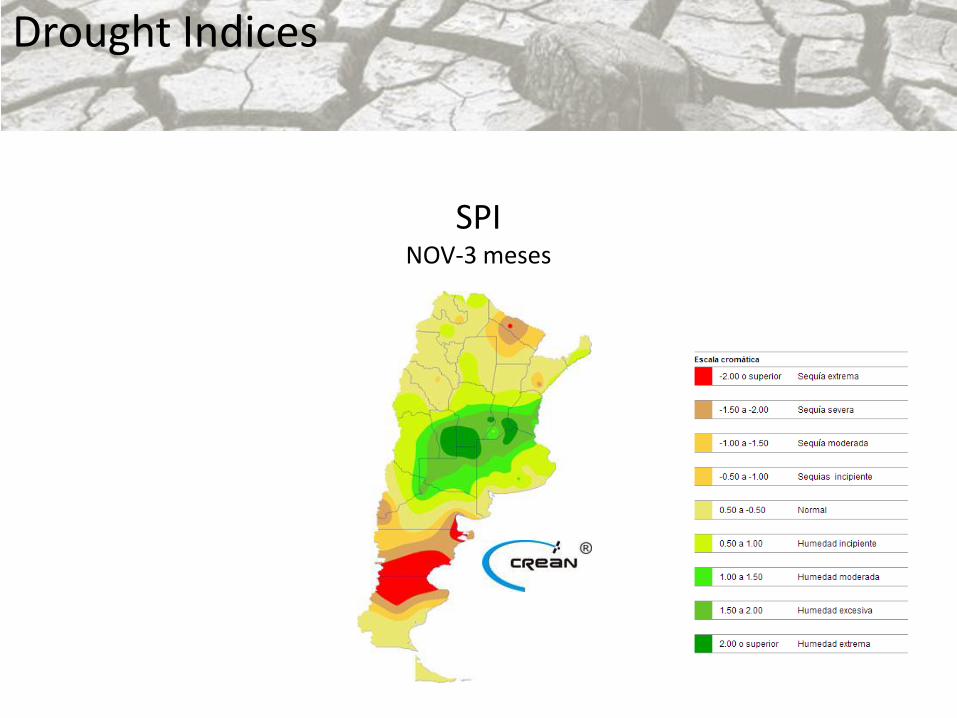
SPI NOV-3 meses
Drought Indices Drought Indices
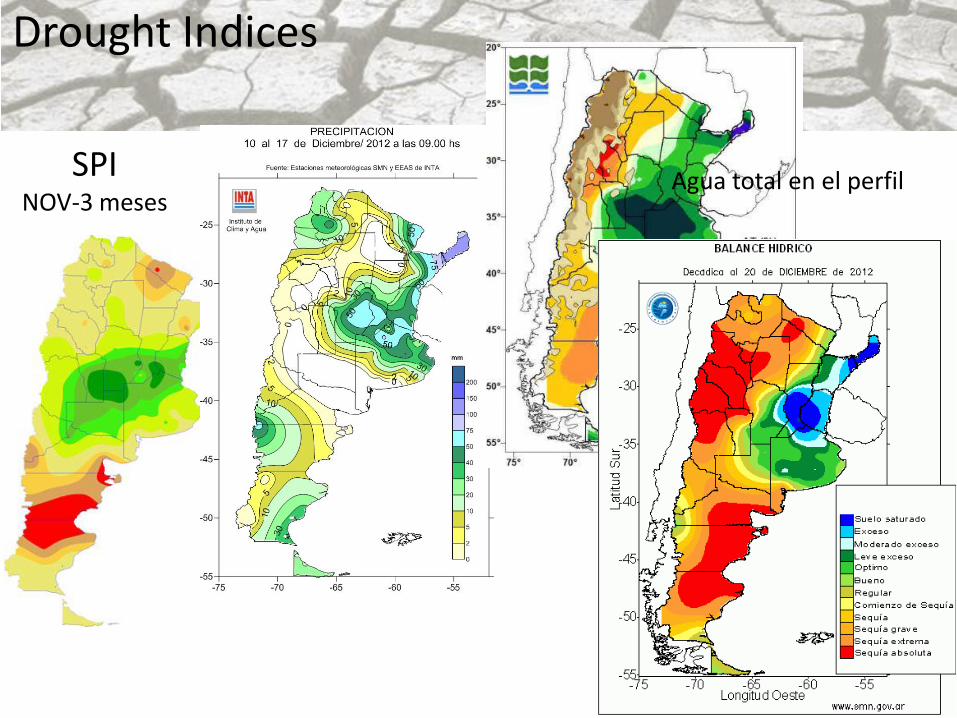
SPI NOV-3 meses
Agua total en el perfil

Drought Indices Drought Indices
SPI NOV-3 meses
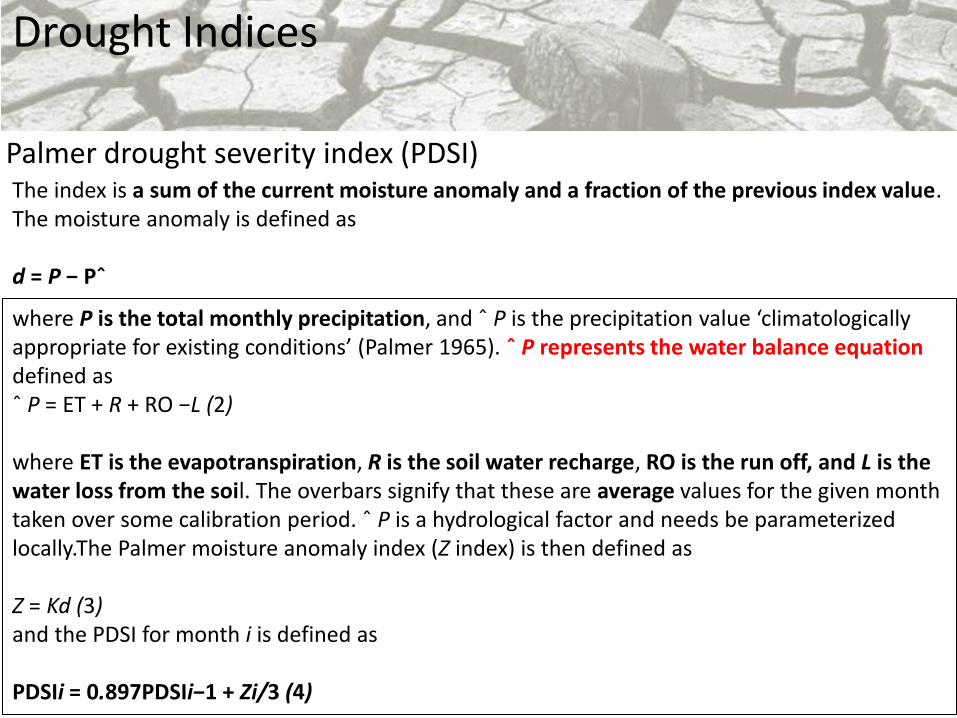
Palmer drought severity index (PDSI)
Drought Indices Drought Indices
The index is a sum of the current moisture anomaly and a fraction of the previous index value. The moisture anomaly is defined as d = P − Pˆ
where P is the total monthly precipitation, and ˆ P is the precipitation value ‘climatologically appropriate for existing conditions’ (Palmer 1965). ˆ P represents the water balance equation defined as ˆ P = ET + R + RO −L (2) where ET is the evapotranspiration, R is the soil water recharge, RO is the run off, and L is the water loss from the soil. The overbars signify that these are average values for the given month taken over some calibration period. ˆ P is a hydrological factor and needs be parameterized locally.The Palmer moisture anomaly index (Z index) is then defined as Z = Kd (3) and the PDSI for month i is defined as PDSIi = 0.897PDSIi−1 + Zi/3 (4)
Drought Indices Drought Indices
Drought Indices Drought Indices

Drought Indices Drought Indices
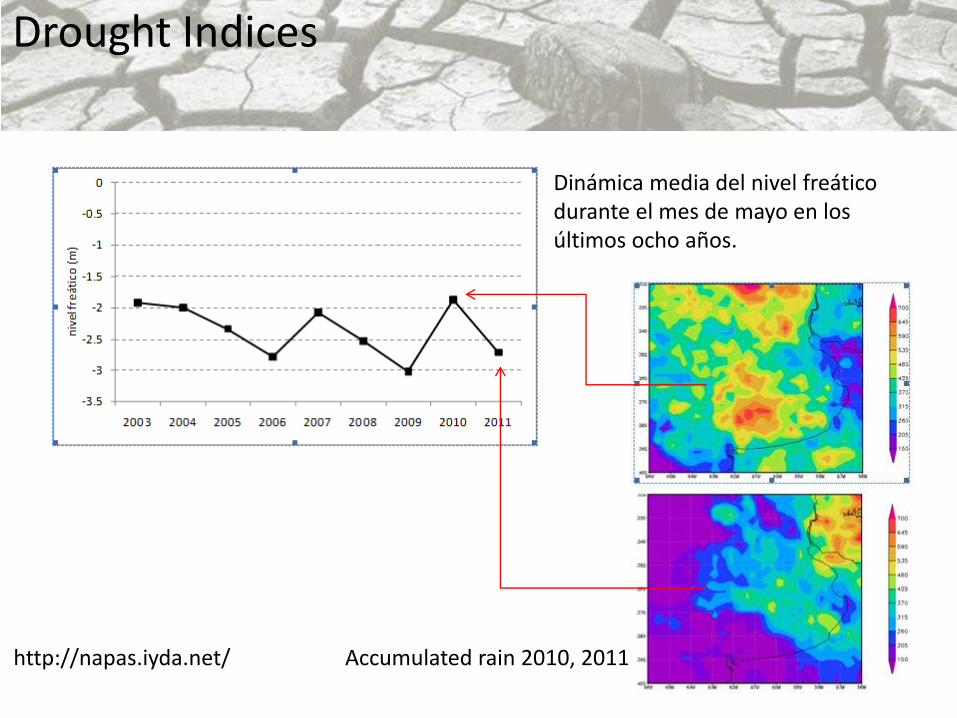
And the hydrological parameters?
Drought Indices Drought Indices
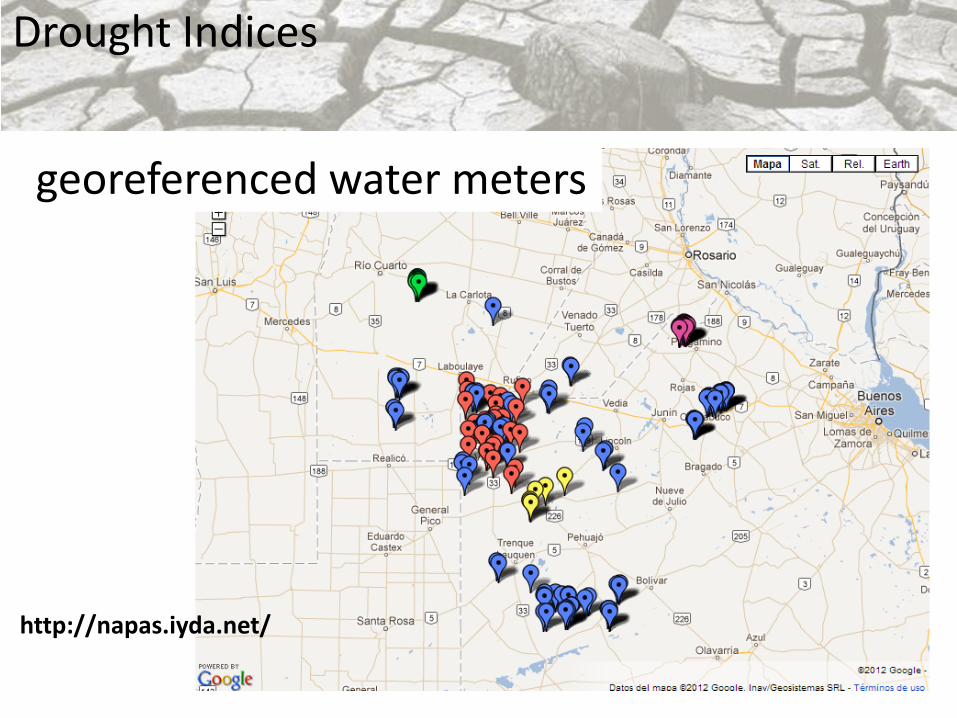
georeferenced water meters
http://napas.iyda.net/
http://napas.iyda.net/
Drought Indices Drought Indices Drought Indices
Dinámica media del nivel freático durante el mes de mayo en los últimos ocho años.
Accumulated rain 2010, 2011
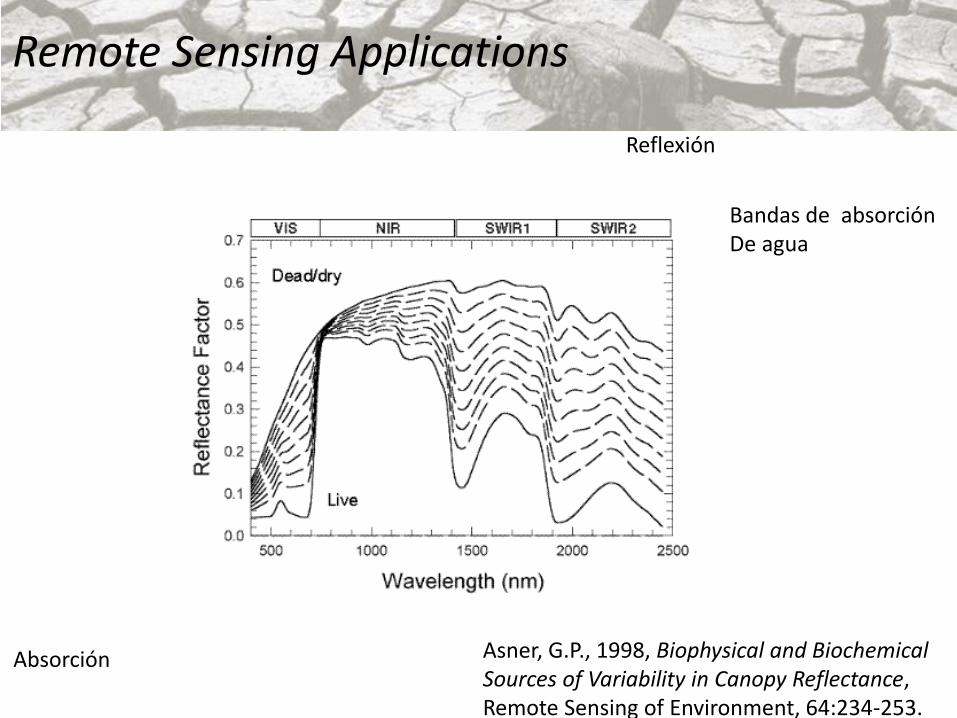
Asner, G.P., 1998, Biophysical and Biochemical Sources of Variability in Canopy Reflectance, Remote Sensing of Environment, 64:234-253.
Absorción
Reflexión
Bandas de absorción De agua
Drought Indices Remote Sensing Applications
Drought Indices Remote Sensing Applications
Drought Indices Remote Sensing Applications
Remote Sensing Applications Drought Indices Remote Sensing Applications
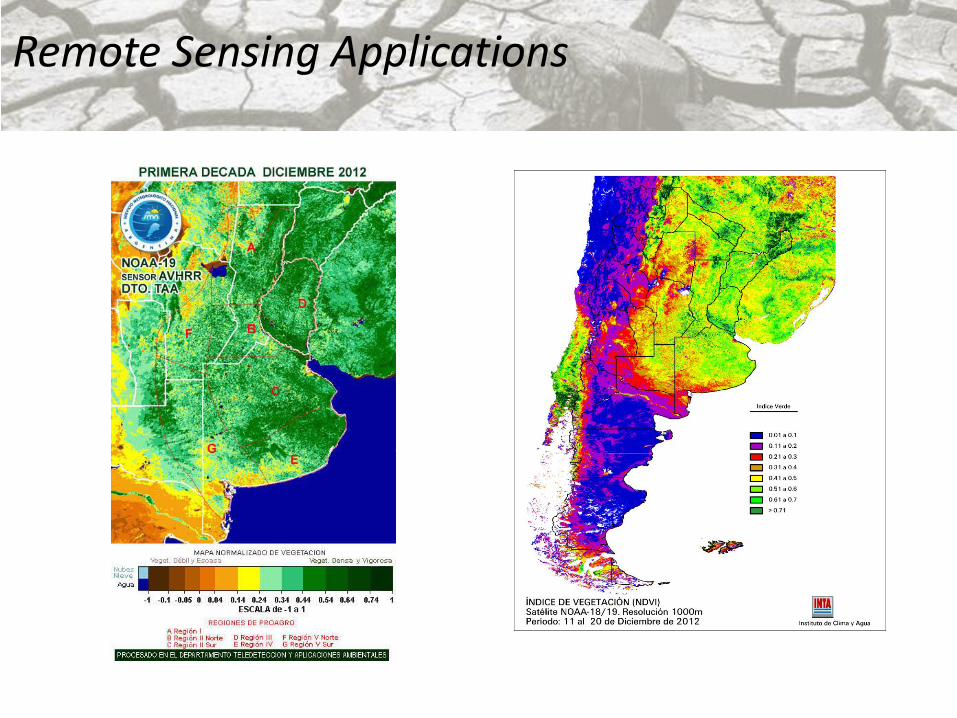
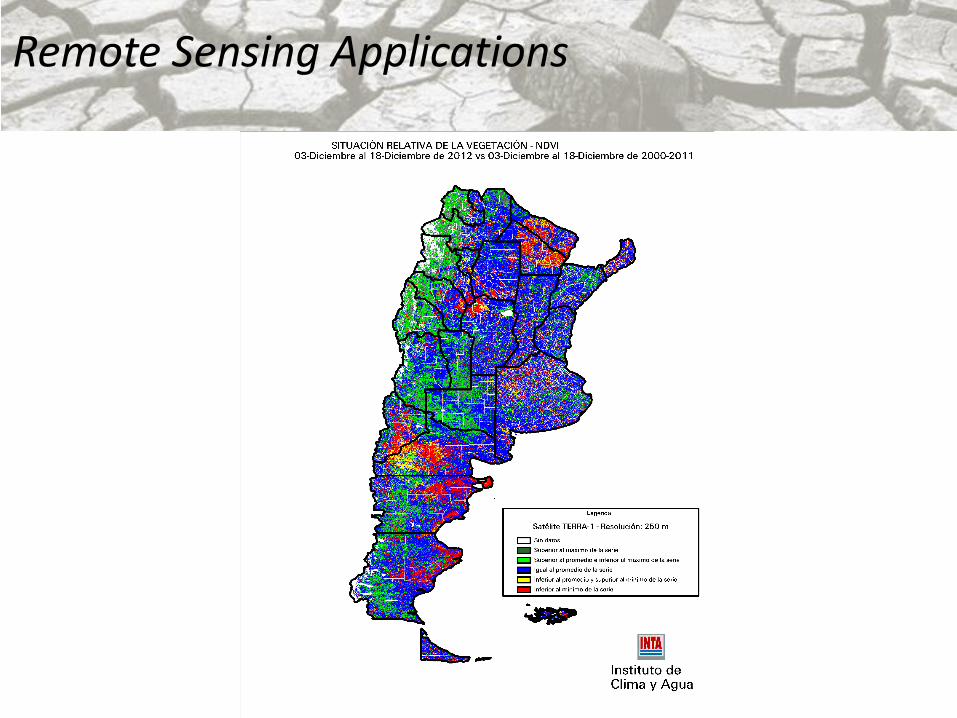
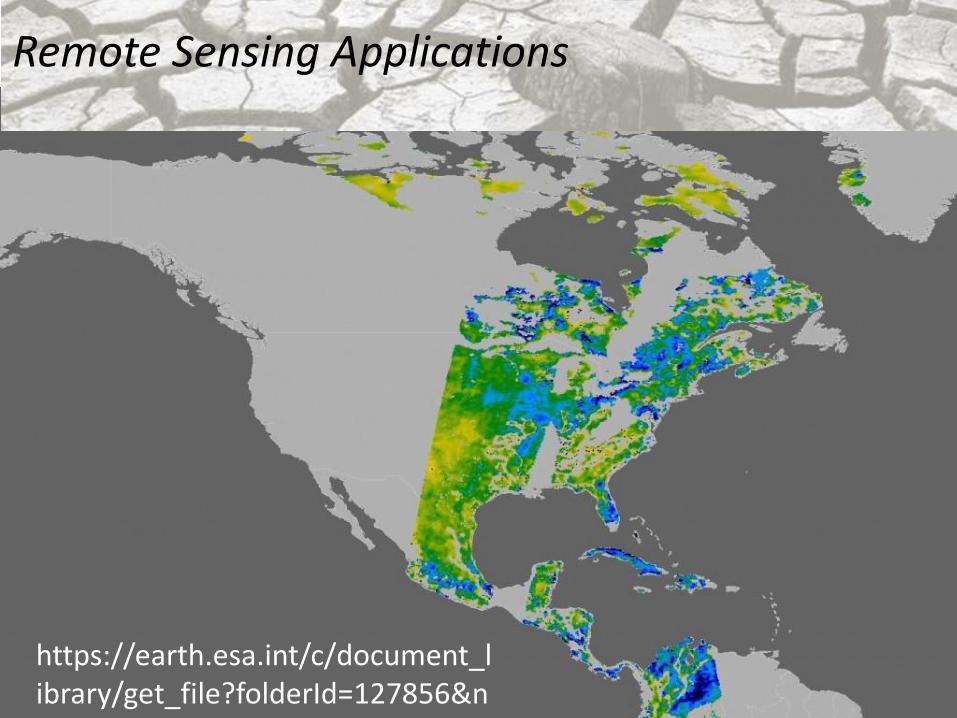
Remote Sensing Applications
Drought Indices Remote Sensing Applications
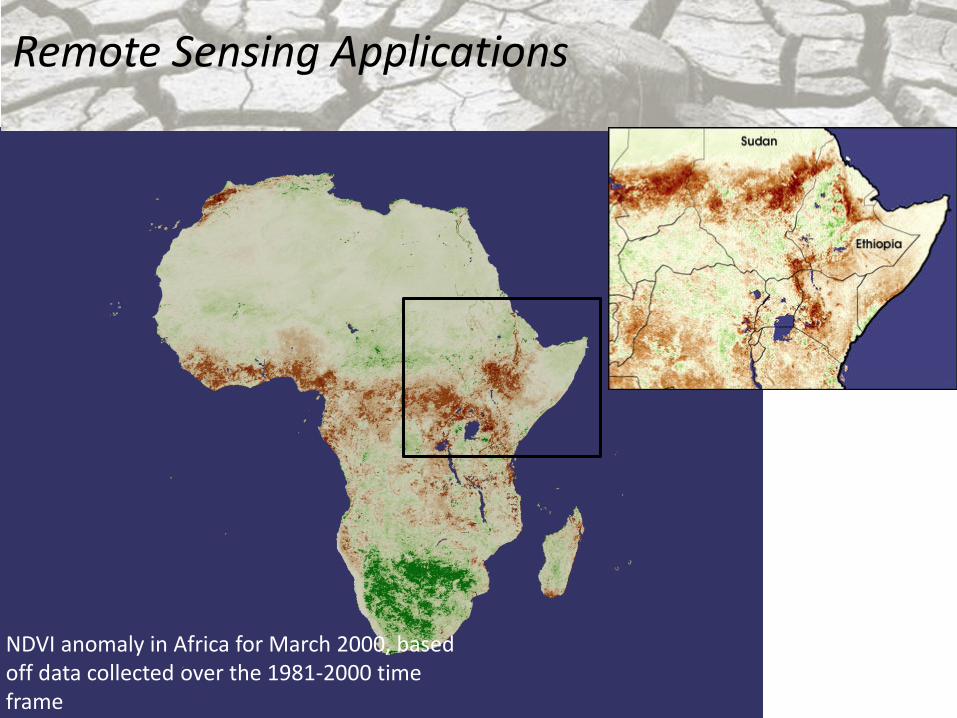
NDVI anomaly in Africa for March 2000, based off data collected over the 1981-2000 time frame
Remote Sensing Applications
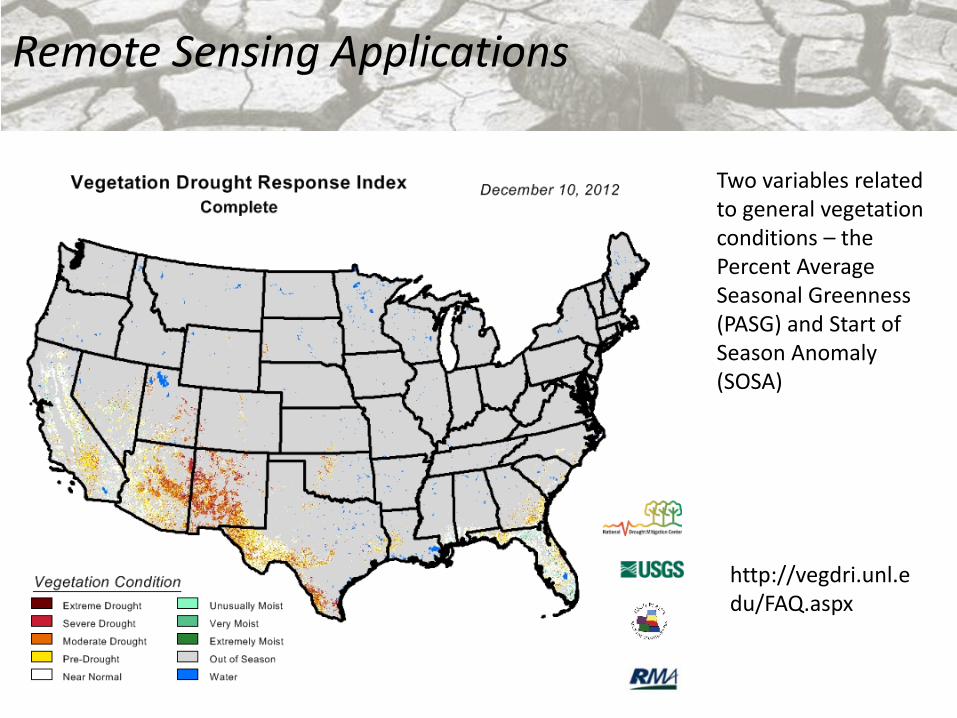
Two variables related to general vegetation conditions – the Percent Average Seasonal Greenness (PASG) and Start of Season Anomaly (SOSA)
http://vegdri.unl.edu/FAQ.aspx
Remote Sensing Applications
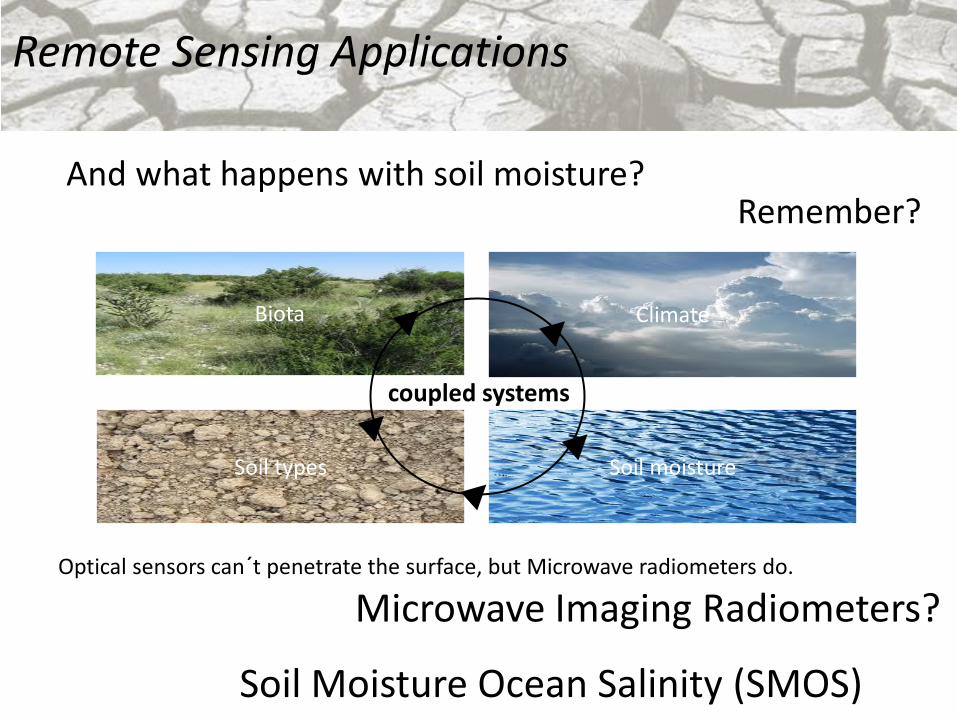
Microwave Imaging Radiometers?
Soil Moisture Ocean Salinity (SMOS)
And what happens with soil moisture?
Optical sensors can´t penetrate the surface, but Microwave radiometers do.
Soil types Soil moisture
Biota Climate
coupled systems
Remember?
Remote Sensing Applications
For optimum results, SMOS will measure microwave radiation emitted
from Earth's surface within the L-band (1.4 GHz) using an
interferometric radiometer.
SMOSS Mission Overview
Measurement principles
Moisture and salinity decrease the emissivity of soil and seawater
respectively, and thereby affect microwave radiation emitted from the
surface of the Earth. Interferometry measures the phase difference
between electromagnetic waves at two or more receivers, which are a
known distance apart – the baseline.
Remote Sensing Applications
A two-dimensional 'measurement image' is taken every 1.2 seconds. As
the satellite moves along its orbital path each observed area is seen
under various viewing angles.
Remote Sensing Applications
Remote Sensing Applications
https://earth.esa.int/c/document_library/get_file?folderId=127856&name=DLFE-2302.pdf

Conclusions

Conclusions
• Meteorological approximations are usefull to derive the occurence of
dry and wet periods for regional scale applications (eg. SPI).
• The quality of these estimations will depend on the density of
weather stations and the long data record.
• For agricultural purposes, it is recommended to use the accumulated
rainfall over the past 3 months.
• The PDSI is usefull to estimate the total moisture status of a region
in combination with SPI.
Conclusions
• The applications developed for optical sensors are usefull for
vegetation monitoring, while is not cappable to retrieve soil
characteristics.
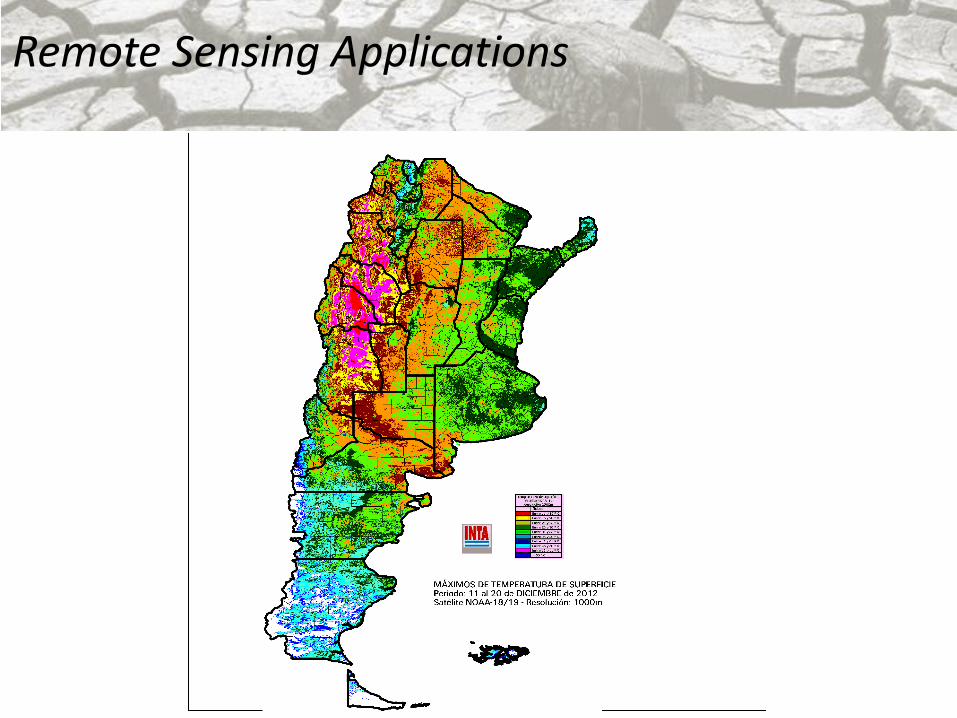
• Temperature estimations in combination with vegetations indices are
good indicators of vegetation stress.
• The new era of microwave radiometers is the future of soil moisture
estimations
Muchas Gracias por su atención!


![[Estrela Do Texas Country Club 02] - ROSA DOS TEXAS - Marie Ferrarella - Destino 50](https://img.pdfslide.us/doc/110x75/577cdf8f1a28ab9e78b18548/estrela-do-texas-country-club-02-rosa-dos-texas-marie-ferrarella-destino.jpg)