Embed Size (px)
Citation preview
KENNETH FLAMM Brookings Institution
Semiconductor Dependency and Strategic Trade Policy
IN JULY OF 1991, the U.S. government formally concluded negotiation of a new Semiconductor Trade Arrangement (STA) with Japan and set out a framework for trade and investment in microelectronics between the two nations for the next five years. That agreement, which replaced a pathbreaking 1986 pact, continued a controversial experiment in trade policy.
The 1986 trade arrangement was not the first time governments have intervened to reshape international trade flows in semiconductors. The very first trade dispute in semiconductors was in 1959. American tran- sistor producers sought protection from Japanese exports of low-priced transistors on national security grounds. They filed a petition with the U.S. government, and the government was asked to intervene to protect the domestic semiconductor industry. In response, the Japanese gov- ernment pushed Japanese transistor producers to form an export cartel and thus jointly raise prices on export sales. This earliest episode of semiconductor trade friction had two key elements: appeals to govern-
This paper was presented at the December 1992 Microeconomics Panel Meeting for the Brookings Papers on Economic Activity. The views expressed are the author's and do not represent those of other staff, officers, or trustees of the Brookings Institution. Without implicating them in my errors, I am grateful to William Finan, F. M. Scherer, and Philip Webre for helpful comments, and to Dan Hutcheson for many useful conversations about empirical modeling issues in the semiconductor industry. I also thank Yuko lida Frost, for helpful research assistance, and Ann Ziegler, for wrestling mathematical appendixes into Wordperfect's equation format. This paper draws extensively from material in Mismanaged Trade: Strategic Policy and the Semiconductor Industry (Brookings Institution, forth- coming).
249

250 Brookings Papers: Microeconomics 1993
ment for protection based on assertions of the strategic nature of the semiconductor industry and formation of an export cartel in reaction to the political response. Remarkably, these same elements reappeared a quarter of a century later at the epicenter of controversy over the U.S. - Japan Semiconductor Trade Arrangement of 1986.
In the early 1960s the U.S. semiconductor industry had developed the integrated circuit (IC), which constructed, on a single chip, entire electronic circuits made up of circuit elements like transistors and diodes. Previously, these elements had been packaged as discrete electronic components. Soon Japanese transistors, no matter how inexpensively priced, became quite obsolete. The semiconductor threat from Japan receded.
Faced with a barrage of innovative American products, the Japanese chip industry retreated behind an array of formal and informal barriers. In the 1960s and early 1970s, foreign pressure mounted, and the Jap- anese government eventually committed itself to a timetable for lib- eralization of formal restrictions on semiconductor trade and investment. By the end of the 1970s, most formal trade barriers had disappeared.1 Perceiving a new foreign technological challenge to its embattled chip makers, at a time when trade barriers shielding domestic producers were being phased out, the Japanese government organized a large- scale R&D effort in IC technology in the mid-1970s.
Integrated circuits began to be exported in significant quantities in the late 1970s, and once again American producers began to raise alarms about their Japanese competitors. The market for memory chips-spe- cifically, dynamic random access memory chips (DRAMs), the highest volume semiconductor product, and erasable programmable read-only memory chips (EPROMs)-was the reentry point for Japanese pro- ducers into global semiconductor competition. Trade frictions between the U. S. and Japanese semiconductor industries focused on these chips. And, once more, strategic issues were placed at the center of debate.
Today many view government intervention in semiconductor trade as a strategic economic issue for the United States. This paper examines
1. Complaints by foreign chip makers, however, continued. They complained about restrictive practices in procurement by Nippon Telephone and Telegraph, the state-owned telecommunications monopoly, about standards, certification, and quality requirements, and membership in R&D associations.

Kenneth Flamm 251
the question of whether dependency on foreign suppliers of semicon- ductors is likely to be an empirically persuasive motivation for public policy. By focusing on monopoly power as the motive for strategic policies, I ignore the other possible reason for thinking semiconductors a strategic sector: technological externalities.2 My analysis focuses on two assertions at the core of arguments for strategic policy interventions by the U.S. government. The first assertion is that the predatory be- havior by Japanese chip producers to secure monopoly power in key semiconductor markets was implicit in the "dumping" of Japanese chips in the U.S. market in the early 1980s. Second is the claim that collusive behavior to exploit that monopoly power, once secured, could create significant costs for the U.S. economy. Do these costs justify the investment of resources in defensive countermeasures?
There are two basic parts to my analysis. The first part reviews the U.S. semiconductor industry's changing analysis of its Japanese rivals' behavior. Through 1980 the story told was what now might be described as the conventional account of strategic trade policy: barriers protecting Japan's domestic semiconductor market against American imports pro- moted the development of the Japanese industry and its global market share to the detriment of the sales and profits of U.S. producers.3 After 1980, however, it became clear that prices in the American and Japanese markets were essentially identical. U.S. allegations that Japanese pro- ducers were pricing exports below cost (dumping) necessarily and ex- plicitly began to include an element of predatory behavior on the part of these companies and an element of collusion. A more unconventional story of strategic behavior surfaced: below-cost pricing, it was asserted, was calculated to induce exit by American producers, after which Jap- anese producers would jointly raise prices and extract monopoly rents that would provide a return on their investment in predation.
The history of this discussion, and the American trade policy re-
2. There is little compelling empirical evidence on this issue, particularly on aspects critical to the design of policy. For example, do spillovers cross industry boundaries as well as firm boundaries? Are they inherently confined to a local geographic region? Can alternative means (such as revised norms for intellectual property rights, or design and technical standards) internalize what otherwise might be externalities for an individual firm? See Flamm (Brookings, forthcoming).
3. This is the "import protection as export promotion" policy described by Krugman (1984).

252 Brookings Papers: Microeconomics 1993
sponse it provoked, could be interpreted skeptically as a self-fulfilling prophecy. In response to increasing trade frictions with the United States in the early 1 980s, the Japanese government pressured its semiconductor industry to reduce exports, in essence sanctioning an export cartel. The U.S. industry interpreted this same behavior as the normal second stage of a successful predatory campaign-rent extraction. In its view this behavior validated the original assertions about Japanese intentions.
Is the creation of export cartel-like market structures the handmaiden of a misguided trade policy? Or is it the fruit of successful predation? This is the key issue. The Semiconductor Trade Arrangement of 1986 drove this debate to new extremes. I briefly describe the complex evo- lution of the administrative mechanisms created under the auspices of this agreement. The most interesting element of recent trade friction is that Japanese semiconductor producers, for perhaps the first time in their history, have been able since 1988 to maintain significant coop- eration (or, less charitably, collusion) in a key product market absent overt regulatory pressures from the Japanese political system. The long- feared predatory threat might finally have surfaced, albeit with consid- erable support from policies that were put into place from 1986 to 1988.
The second part of this paper assesses the empirical significance of the threat of collusive behavior. Putting aside the issue of whether collusive behavior was the cause or the effect of American trade policy, I ask these questions: Just how large an economic threat, in the worst case, might collusion represent? How much might the United States reasonably be willing to spend on "anticartel insurance"?
To examine these issues, I develop a model of pricing and production over the life cycle of a high-technology industry (like semiconductors) in which learning economies and scale economies, as well as capacity constraints, are important. I apply this model using empirical parameters relevant to the production of 1-megabit dynamic random access mem- ories (lM DRAMs). Both claims-of predatory behavior and of col- lusive organization of foreign production to increase monopoly rent extraction-have been interpreted as relevant to this product.
The resulting simulations produce more realistic outcomes than have earlier attempts to model semiconductor production. Precise specifi- cation of how learning economies operate is a crucial issue. In IM DRAMs (and in other industries with significant learning and scale economies, capacity constraints, and short product life cycles), prices

Kenneth Flamm 253
over some time interval will fall below common measures of average cost and marginal cost, even with no strategic behavior (like predation) assumed on the part of producers. Therefore, antidumping trade laws that forbid pricing below some measure of average cost will snare "normal" competitive behavior in the net they cast. Moreover, con- sumer welfare losses from successful cartelization of a market like that for DRAMs can greatly exceed the monopoly rents collected by pro- ducers. There may be sound reasons for governments to invest re- sources-economic and political-to ensure that this does not occur.
Strategic Rhetoric in Semiconductors, 1959-84
Industry appeals to the U.S. government for measures to assist its domestic semiconductor industry have generally been phrased in terms of a defensive policy against some foreign threat. Over the years, how- ever, the description of the nature of the threat, and the behavior to be neutralized or counteracted by policy interventions, have changed. Trade policy has been as much the cause, as the effect, of the competitive conduct of foreign semiconductor producers.
1959: A Threat to the National Security
As previously remarked, the initial challenge occurred in 1959, when a surge of low-priced Japanese transistor imports first hit American markets. (In 1958 Japan shipped 1,000 units worth $7,000 to the United States; in 1959 it shipped 1.8 million units worth $1.1 million.4) Citing national security concerns, a U.S. industry group, the Electronics In- dustry Association, petitioned the Office of Civil and Defense Mobi- lization (OCDM) to impose quotas on Japanese transistor imports.5
In 1960, however, there was a relatively clear dividing line between the types of transistors used in consumer electronics and those used in
4. See "Business Week Reports on: Semiconductors," Business Week, March 26, 1960, pp. 92-96.
5. The OCDM, an executive branch agency, was the predecessor of the Office of Emergency Preparedness. See "Import Study Nears Showdown," Electronics, November 6, 1959, pp. 32-33; "Electronics in Japan," Electronics, May 27, 1960, pp. 99-100; and "Washington Rejects Transistor Import Quota," Electronics, June 8, 1962, p. 7.
254 Brookings Papers: Microeconomics 1993
defense (industrial and computer applications). At that time the Defense Department was pouring substantial resources into the development of advanced semiconductor technology for use in military applications, and it was even directly subsidizing the industry's investment in new capacity. Defense' s Electronics Production Resource Agency submitted a study to OCDM concluding that adequate capacity existed for present and future military transistor demand.6 Narrowly interpreted, defense needs did not provide a particularly compelling rationale for action.
In response to the campaign for protection in Washington, Japan blazed some trails that would become well trod over time. A Japanese delegation traveled to Washington in 1959. It stressed that activities in consumer electronics created no threat to U . S. defense and that Japanese companies had "no immediate plans to go after the markets for highly specialized transistors. "7 The delegation also made clear its willingness to impose voluntary quotas or other negotiated arrangements.
In response to continuing frictions, Japan's Ministry of International Trade and Industry (MITI) went ahead in the late spring of 1960 and imposed quotas and floor prices on transistor radios exported to the United States. The system was continued in later years.8 The issue of third-country exports (quota-evading stratagems to export to third coun- tries that were then used as a base for reexport to the United States) arose early on and was dealt with administratively by MITI. In May of 1962, MITI suspended transistor exports to Hong Kong. This was in response to complaints that Chinese manufacturers were undercutting Japanese export prices for transistor radios-built using Japanese tran- sistors-shipped to the United States. A system of quantitative limits on transistor exports to Hong Kong was set up a few months later.9
6. "Import Study Nears Showdown," p. 32. 7. Ibid., p. 33. 8. Quotas for 1960 were set by MITI to equal a 20 percent increase over actual exports
in 1958 and 1959. Penalties, including cancellation of the quota, were set for firms that violated the floor prices or evaded controls by exporting to the United States and Canada through third countries. See "Japanese Put Off Freeing Electronics Imports," Electronics, July 8, 1960, p. 11. On later years see "Japan Extends Transistor Radio Quota," Elec- tronics, January 6, 1961, p. 9; "Japan Eases License Rules," "Japan May Cut Transistor Prices," Electronics, May 26, 1961, p. 9. By 1971 Japan had voluntary export controls on transistor radio shipments to twenty-nine different countries. See also USTC (1974, p. 255).
9. MITI suspended transistor exports to Hong Kong and Okinawa because transistor radios were being exported to the United States at a price $6 lower than that for equivalent

Kenneth Flamm 255
After a good two and a half years of discussion, the U.S. producers' petition to restrict Japanese transistor imports was rejected in 1963 on narrow national security grounds. The American semiconductor indus- try, after an alarming slowdown in 1960-61, was growing rapidly again, fueled by technical innovation in the form of the integrated circuit. American producers were getting the vast bulk of the defense business, and capacity seemed adequate to meet any future surges in demand.10 Some U.S. producers continued to complain to the U.S. government that the closed Japanese market was being used as the base for an export push into the American market. But the U.S. government's attitude was perceived by the Japanese to be that Japan's concentration on the consumer market permitted U. S. firms to concentrate their resources on defense needs and therefore contributed to national security. As one Japanese observer put it, the Japanese were pleased that the United States, as a technologically advanced nation, could afford such a fair decision. I l
1979: Two-Tier Pricing
Although the immediate competitive threat to the American chip industry was dissipated by its breakneck technical advance, American firms remained unhappy about being shut out of the Japanese market. As Japanese electronic exports making use of integrated circuits began to enter the U.S. market in the late 1960s, Texas Instruments jimmied open the Japanese market a notch by threatening to petition to exclude from the U.S. market Japanese exports of electronic equipment using infringing semiconductors.12 Barred from establishing a presence in Japan, Texas Instruments had refused to license its patents to Japanese companies. Texas Instruments was finally permitted to establish a joint
Japanese exports. This episode almost set off a trade war between Hong Kong and Japan. The British government threatened to suspend Japanese cotton cloth exports to the Crown Colony unless the Japanese lifted their export restrictions on transistors. See "Japanese Transistors Sought by Hong Kong," Electronics, June 8, 1962, p. 8; and David Rose, "Hong Kong's Transistor Radio Exports," Electronics, September 28, 1962, p. 24.
10. "Washington Rejects Transistor Import Quota," p. 7. 1 1. Nakagawa (1985, pp. 125-27). 12. For the standard account of this episode, see Tilton (1971). Granted access to the
TI archives, Mason (1992) provides the most detailed account from the American per- spective.

256 Brookings Papers: Microeconomics 1993
venture in Japan, subject to output restrictions. In 1971 this venture was converted into a wholly owned subsidiary. The early presence of Texas Instruments was the exception that proved the rule of barriers to entering the Japanese market, however.
Under continuing foreign pressure, quantitative import restrictions were gradually phased out by 1976. Foreign investment was liberalized in 1974, and all residual legal restrictions were removed in 1980. As the market began to open in the early 1970s, Japanese chip producers began to face serious competition. Frequently, they were forced to rely on direct intervention by MITI with their customers to fend off American imports of integrated circuits. As the inevitability of liberalization of the Japanese market became clear, government subsidies to semicon- ductor R&D were greatly increased in order to help Japanese producers adjust to the oncoming new realities. Highly successful cooperative industrial research programs were launched in 1975 and 1976 by Nippon Telephone and Telegraph (NTT, the quasi-public telecommunications monopoly) and MITI. The programs were focused on technologies to improve mass production of high-volume chips used in the computer industry, particularly DRAMs.
By 1977 it was becoming clear in the United States that Japan's ongoing technology push was achieving important results and was being accompanied by increased investments in capacity. Imported Japanese DRAMs had begun to trickle into the U.S. market. A surge in exports to the U.S. market of Japanese chips (similar to the surge already seen in consumer electronics and autos) seemed likely. Determined to main- tain a more effective voice in Washington, American chip producers formed the Semiconductor Industry Association (SIA) as their lobbying arm. 13
In October 1978 Robert Noyce, the chairman of DRAM-producer Intel, launched the first public salvo across the Japanese bow. He charged that Japan's protection of its home market, together with government subsidies, made it possible for Japanese producers to engage in two- tier pricing. Citing the example of the television market, Noyce argued
13. After a transcoastal pilgrimage to Washington to inform Robert Strauss, the U.S. trade representative, that "the Japanese are coming," semiconductor executives were re- portedly dismayed to get a "so?" reaction from Strauss. Interview with industry executives and former government officials, September 1992.

Kenneth Flamm 257
Table 1. Prices of Various Integrated Circuits by Regiona
Western United Type of integrated circuit Europe States Japan
Calculator, large-scale integration (LSI) 2.75 2.45 1.86
Metal-oxide semiconductor (MOS) 3.20 3.00 3.20 Bipolar digital 0.85 0.75 1.36 Bipolar linear 1.10 1.00 0.70 Microprocessor (including
memory and support circuits) 150.00 95.00 150.00
Calculator and watch displays (4 millimeter) Light-emitting diode (LED) 1.80 1.70 1.50 Liquid crystal display (LCD) 5.00 4.50 4.50
Clock displays (15 millimeter) Light-emitting diode (LED) 5.50 5.00 5.25 Liquid crystal display (LCD) 8.50 8.00 8.00
Source: Mackintosh Consultants, Market Survey of Semnicontdtuctors, vol. 4: Applicationis and Markets, December 1976, pp. 125-27. This study was conducted on behalf of the Ministry of Research and Technology of the Federal Republic of Germany.
a. Factory price of finished device in 1976 U.S. dollars. Quoted average costs reflect differences in product specifications and volume requirements.
that firms were free to charge high prices in the sheltered Japanese
market, then price exports "as low as they want, since they need only to cover incremental variable costs." 14 Without actually claiming that
this was occurring in semiconductors, Noyce noted that "if this pattern is repeated in the semiconductor market, the U.S. market would be flooded with underpriced Japanese integrated circuits and LSI prod- ucts," and U.S. producers would "have no choice but to cut production or go bankrupt."915
Noyce's fears were not without factual support. There is some evi- dence, largely anecdotal, that chip prices for leading-edge digital ICs tended to be higher in Japan than in the United States throughout the 1970s. Table 1, though it does not control for volume and product mix, shows that unit costs for advanced ICs tended to be significantly higher in Japan in the mid-1970s, while products typically used in consumer electronics (linear ICs, display chips) tended to be priced below U.S. levels.
14. See Peter Moylan, "Noyce Rips Government as Peril to U.S. Semiconductor Industry," Electronic News, October 9, 1978, p. 52.
15. Ibid.
258 Brookings Papers: Microeconomics 1993
The SIA activity prodded a Senate subcommittee to ask the U.S. International Trade Commission (ITC) to launch an informational in- vestigation into the competitive position of the U.S. semiconductor industry in December 1978. By the time the resulting report was de- livered, at the end of 1979, the threat had materialized. Three major Japanese producers-Hitachi, Fujitsu, and Nippon Electric Corporation (NEC)-had collectively jumped to a 40 percent share of the U.S. market for 16-kilobit DRAMs. 16
During a nine-month ITC investigation, the SIA's evolving theory of Japanese industrial practices was elaborated. At a hearing in San Francisco in May 1979, the SIA suggested for the first time that the two-tier pricing scenario was occurring, notably in sales of 16K DRAMs.17 Apparently for the first time, it also suggested that Japanese policies contained an explicitly predatory element. At the hearing Noyce artic- ulated a strategic conception of the dangers of dependency on foreign suppliers:
Now one might argue that U.S. consumers benefit from these bargain prices. But we must realistically ask how long such bargain prices last. Middle Eastern oil was a bargain until we became dependent upon it. Similarly, sooner or later the Japanese losses on high density memories will be recouped and I submit that it is foolish to assume any long run benefit to consumers. 18
From statements made at the hearing, it is unclear whether strategic calculations were being made by the Japanese state, with Japanese companies passively responding to changes in state policy, or whether the companies were active parties to the strategic plan. One might, for example, conceive of "state predation," where state subsidies induce
16. See Richard Wightman, "ITC Launches Probe of U.S. Semiconductor Position in Japan, Europe," Electronic News, December 18, 1978, p. 44. See also Lloyd Schwartz, "Mostek Chief: Japan Threatens Industry," Electronic News, October 15, 1979, p. 72; and Henry Scott Stokes, "Japan Goal: Lead in Computers," New York Times, December 11, 1979, p. DI.
17. Jim Leeke, "Practices Abroad Unfair, SIA Says at ITC Hearing," Electronic News, June 4, 1979, p. 106.
18. "Statement of Dr. Robert N. Noyce, Vice Chairman of the Board, Intel Corporation, on Behalf of the Semiconductor Industry Association" before the U.S. International Trade Commission, San Francisco, May 30, 1979, pp. 21-22.

Kenneth Flamm 259
firms to cut prices in order to stimulate exit by foreign rivals. 19 At the time, however, the prevailing conception was of "Japan, Inc." -firms and state joined together in a collective strategic plan. In the colorful words of one top American executive, it was the "33 companies in the SIA taking on the sovereign nation of Japan."20
1982: Below-Cost Dumping
The era of two-tier pricing was relatively short lived. The evidence submitted in 1979 was quite scanty. The head of DRAM-producer Mostek claimed that there was a 20 percent to 30 percent differential between U.S. and Japanese 16K DRAM prices in 1978, and he presented first- quarter 1979 data on five selected sales contracts by a U.S. company to Japanese customers. The data showed prices significantly above the prevailing prices for the equivalent Japanese product sold in the United States.21 In any event, an attempt to investigate the issue in greater depth would have soon run into difficulties. Price-to-price comparisons between the two markets are rather tricky because of the complexities of market structure and distribution patterns for semiconductors in the United States and Japan.
Roughly 70 percent to 80 percent of sales to U.S.-based semicon- ductor customers are transacted directly with chip manufacturers through long-term contracts. Deals are struck months ahead of delivery. The balance of the chips sold go through distributors to smaller customers and as "spot" sales funneled through an active secondary "gray" market of brokers, distributors, and other arbitrageurs. Spot prices usu-
19. Willig (1992, pp. 7-8) draws a distinction between "strategic dumping," which relies on national policies to protect exporting companies' home market (in order to gain cost advantages and create monopoly power for the exporters in importing markets) and "predatory-pricing dumping," which is a company strategy to obtain monopoly power in an importing country's market.
20. The quote is by W.J. Sanders, president of Advanced Micro Devices at the time. See Leeke, "Practices Abroad Unfair."
21. These data, contained in a confidential submission to the USITC dated August 17, 1979, appear to have been presented at a hearing of the Joint Economic Committee in October 1979. See USITC (1979, pp. 70-71); U.S. Congress, Joint Economic Committee, U.S.-Japanese Trade Relations, Hearing, October 10, 1979, pp. 21, 26. DRAMs are sold on long-term contracts and on an immediate delivery, spot basis. These prices can diverge substantially. It is unclear whether an appropriate spot-to-spot, or contract-to-contract, comparison between the two markets was made.

260 Brookings Papers: Microeconomics 1993
ally rise above contract prices in tight markets, and they fall below contract prices when demand is slack.22 Thus, to avoid comparing ap- ples with oranges when searching for price differentials, contract prices should be compared with other contract prices, not to spot prices, and vice versa. Dumping complaints have not always drawn these distinc- tions.
In Japan the semiconductor market has a rather different structure than in the United States. For the most part, large chip manufacturers sell directly only to sister electronic equipment divisions of their parent corporation. Most external sales to large Japanese customers go through authorized sales agents; smaller customers are served through secondary sales agents who order the product from the main sales agents. Even smaller quantities are sold on a spot basis through retailers clustered in selected urban areas, like Tokyo's Akihabara district.23 Prices quoted in Japanese trade sources typically refer to large-user prices through main sales agents or to spot prices in Akihabara. Large-user prices in Japan are roughly comparable with U.S. contract prices, while U.S. spot prices are most similar to Akihabara prices.
The complexities of direct comparisons of U.S. and Japanese prices never became a major issue, however. This was because the charges of two-tier pricing had a relatively short life. In the months after the San Francisco hearing, demand for 16K DRAMs surged. As prices soared, complaints about low-priced imports faded away. Beginning in mid-1979, charges that U.S. prices for Japanese chip imports were
22. For detailed evidence on the structure of the U.S. semiconductor market, see Flamm (NBER and Chicago, forthcoming).
23. See U.S. Department of Commerce, International Trade Administration, "Japan- Semiconductors/Nonvolatile Memory in Japan-ISA9106," derived from Fuji Keizai Co., "The Semiconductors-Nonvolatile Memory Market in Japan," Tokyo, June 1991; "Ja- pan-Semiconductors/Analog Devices in Japan-ISA9 106, " derived from Fuji Keizai Co., "The Semiconductors-Analog Devices Market in Japan," Tokyo, June 1991; "Japan- Semiconductors/Logic Devices in Japan-ISA9106," derived from Fuji Keizai Co., "The Semiconductors-Logic Devices Market in Japan," Tokyo, June 1991. Reportedly NEC and Mitsubishi sell 100 percent of their Japanese sales through sales agents; Hitachi, Fujitsu, and Toshiba sell wholesale 80 to 90 percent of their external sales through sales agents. Smaller manufacturers, such as Sharp, reportedly sell 20 to 30 percent of their shipments directly to users and the remainder through sales agents. Primary sales agents are associated with a particular Japanese manufacturer and rarely handle competitive foreign products. Since most Japanese producers offer broad product lines, it is unusual for a primary sales agent to even sell imported semiconductors.
Kenneth Flamm 261
below Japanese levels ceased to be an important irritant to trade rela- tions. Instead, complaints that the Japanese were selling below the cost of production in both markets began to emerge.24
Texas Instruments, the only American producer manufacturing in Japan at the time, had attacked the position of the Semiconductor In- dustry Association in early 1980. Texas Instruments asserted that prices received by Japanese producers in their home market were actually lower than American prices for the same Japanese chips; the SIA argued that the Japanese were voluntarily restraining their exports in response to American industry complaints and deliberately creating a soft market at home.25 Press reports imply, however, that prices in a weakening U.S. market still felt pressure from falling prices in the Japanese market. By mid-1980, Japanese DRAM producers were reported to be starting a campaign of surveillance on shipments to their sales agents. The purpose of the campaign was to discourage resale of shipments at very low prices to customers in the U.S. market by gray-market traders (further irritating American producers). By the spring of 1981, NEC (which exported 60 percent of its output to the United States) and Fujitsu had suspended sales into the U.S. spot market to lessen the threat of an American antidumping action. In a complementary bid to reduce trade frictions, four of the main Japanese producers of integrated circuits (NEC, Hitachi, Toshiba, and Fujitsu) announced plans to manufacture DRAMs at U.S. plants.26
24. Testifying before a Senate committee, Intel's Robert Noyce saw a political intent in this development. "Intel buys the 16K RAMs from Japan because we have found that cheaper than to make them ourselves. Now, there is some artificial pricing in that market. That's what I'm suggesting. . . . Up until the San Francisco hearings, we could buy 16K RAMs in the United States, from Japanese companies at lower prices than we were selling the same product in Japan."
Senator Stevenson: "Is that artificial pricing or are they just more productive and efficient?"
Dr. Noyce: "We were meeting the market price in Japan. After the ITC hearings in the United States, U.S. prices went up and Japanese prices went down. I think the prices had been artificial there, but that is a very difficult thing to determine."
Senate Committee on Banking, Housing, and Urban Affairs, Subcommittee on Inter- national Finance, Trade and Technology, Hearings, January 15, 1980, p. 176.
25. "U.S. Semiconductor Firms Disagree on Import Strategy," Denver Post, March 23, 1980, p. 40.
26. See "Exports of Japanese Semiconductors to US at Low Prices Conspicuous; Half Price, Too, through Trading Firms; Manufacturers Strengthen Checking of Destinations," Nihon Keizai Shimbun, May 24, 1980, p. 6; "NEC Suspends Shipments of RAM Chips

262 Brookings Papers: Microeconomics 1993
In 1981 the next generation of the dynamic random access memory chip, the 64K part, was introduced, and conflict between U.S. and Japanese industries worsened. Japanese producers had rushed into early introduction of the 64K DRAM in mid-1981, and they gained a lead over most of their American competitors. Aggressive Japanese pricing in 64K DRAMs, and rapidly falling prices, stimulated a new round of industry complaints in the United States.27 By the spring of 1982, the Japanese share of the U.S. market in 64K DRAMs stood at about 70 percent. American producers, led by Motorola, pressed the Commerce Department to investigate charges that the Japanese were selling 64K DRAMs below "fair value" (average cost).28 Just as this investigation was beginning in March, however, 64K DRAM prices suddenly dou- bled, Japanese suppliers began rationing U.S. customers, and Japanese companies reportedly cut back U.S. exports to blunt moves toward trade restrictions on DRAM imports.29 The Japanese semiconductor industry openly acknowledged that these reductions in exports were spurred by MITI guidance. In early April 1982, Japanese DRAM pro- ducers actually confirmed to reporters in Tokyo that they were reducing U.S. exports to alleviate trade friction.30
to U.S. Market," Japan Economic Journal, March 3, 1981; "Japanese Electronics Firms Delay Plans to Mass-Produce 64-K Chips," Asian Wall Street Journal Weekly, April 6, 1981, p. 14; "Japan Firms Plan U.S. Production of Advanced Circuits," Asian Wall Street Journal Weekly, May 18, 1981, p. 17; Thomas J. Lueck, "NEC Plans $100 Million U.S. Plant, " New York Times, June 27, 1981, p. D 1; and "Top Four Japanese IC Makers Expand U.S. Operations," Asian Wall Street Journal Weekly, July 13, 1981, p. 15.
27. See Sabin Russell, "U.S. Suppliers Outnumbered in 64K RAM Competition-for Now," Electronic News, August 24, 1981; and "Prices of 64K RAM Drop to One-Tenth of Year Ago," Japan Economic Journal, September 15, 1981.
28. Clyde H. Farnsworth, "Japanese Chip Sales Studied," New York Times, March 4, 1982, p. DI; John Eckhouse, "Are Japanese Chip-makers 'Dumping'?" San Francisco Examiner, March 5, 1982; and Bruce Entin, "Motorola Asks Inquiry into Japanese Pric- ing," San Jose News, March 10, 1982. Motorola reportedly wanted the government to take the lead in order to avoid placing itself in an antagonistic position with Hitachi, the top Japanese producer of 256K DRAMs, with which it had close ties. Richard Wightman, "SIA Split on 64K RAM 'Dump' Action; Expect Members to Petition," Electronic News, March 22, 1982.
29. Alan Alper, "See 64K Levels in Line with Demand," Electronic News, March 15, 1982; "Justice Department Investigating Japanese 64K RAM Marketing; Seek Price, Shipment Data," Electronic News, August 2, 1982, pp. 1, 4.
30. The Japanese trade publication VLSI Report, in its chronology of U.S.-Japan semi- conductor trade frictions, sets February 1982 as the date "MITI instructions on dumping began." The Electronic Industry Association of Japan's official industry handbook, IC

Kenneth Flamm 263
Malcolm Baldridge, the secretary of the Commerce Department, immediately informed the U.S. press of his initial "favorable" reaction to the Japanese voluntary export restraints, though he warned:
"They were building much more capacity than they could stand, and we thought there was possibly some evidence of predatory pricing to take over the market."
He added that he thought there was a danger that the nation's security could be threatened if the American computer and telecommunications industries were to become dependent on Japan for supply of the chips, which have been characterized as the crude oil of the 1980s.
"This is something we would not like to see," Mr. Baldridge said, noting that the aim of the Commerce Department investigation was to determine whether the Japanese were building volume in the 64K RAM market as a result of subsidies to their industry or because of policies or practices that insulate it from competition from American industries.31
The very next day MITI and various Japanese company representatives officially denied reports of export restraints. But U.S. prices were to continue well above Japanese price levels through early 1983.32
Two-Tier Pricing Revisited
The semiconductor saga took an even more bizarre turn three months later in July 1982. The Justice Department informed MITI that Japanese producers were being investigated to determine whether a cartel had been formed to set volume and price levels in the U.S. market. (Prices in the United States had continued to hover at almost double Japanese levels.) An NEC spokesman (apparently unfamiliar with U.S. antitrust concepts) was quoted as responding that "Japanese interests have set
Gaido Bukku, has a time line dating February 1982 as "MITI to Japanese industry, no exports that might cause blame for dumping." VLSI Report, "Japan-U.S. IC Frictions," (Tokyo: Press Journal, circa 1988), p. 62. Electronic Industry Association of Japan, IC Gaido Bukku, 1987, p. 62. See also A.E. Cullison, "Japan Alters Memory Chip Export Policy," Journal of Commerce, April 7, 1982; and "64K RAM Exports Are Being Held Down by Makers," Japan Economic Journal, April 13, 1982.
31. Clyde H. Farnsworth, "Japan to Cut Export of Chips to U.S.," New York Times, April 8, 1982, pp. Dl, D 11.
32. Steve Lohr, "Japanese Deny Any Cut in Chip Exports to U.S.," New York Times, April 9, 1982, p. Dl; Associated Press, "Computer Chip Reports 'Premature'," Japan Times, April 10, 1982; and Jack Robertson, "Japanese RAM Power," Electronic News, February 28, 1983.

264 Brookings Papers: Microeconomics 1993
relatively high prices for 64-kilobit RAM chips in the U.S. so as not to raise suspicions of dumping."33 Needless to say, the whole sequence of events left the Japanese somewhat confused. In March, amid loud industry and Commerce Department complaints about excessively low prices, import prices of Japanese DRAMs suddenly jumped. A short time later the Justice Department announced an investigation of exces- sively high prices.34
A lawyer speaking for the SIA explained the apparent contradiction as a real-life example of precisely the predatory scenario first raised by Noyce back in 1979: "They may have committed violations of the dumping laws early on, to buy market share, and now they're getting the payoff by limiting supplies and raising prices."35 Noyce himself addressed the issue in early 1983: "It is probably correct that the Jap- anese are selling RAMs in the United States at higher prices. It is a classic case of competitors using predatory low pricing to take the lion's share of a market, and then increasing prices once they dominate that market. " 36
By mid-1983, however, the market for DRAMs had picked up, and the industry faced looming shortages. Prices in Japan rose sharply, pushed up to U.S. levels.37 Justice's antitrust investigation simply faded away after the department took depositions from Silicon Valley rep-
33. "U.S. Will Probe Japanese Makers of Semiconductors," Japan Times, July 27, 1982. See also Steve Lohr, "6 Japan Concerns Focus of Inquiry," New York Times, July 27, 1982, p. A4; "U.S. Probes Sales of Computer Chips by Six Japan Firms," Wall Street Journal, July 27, 1982, p. 4; and "U.S. Won't Indict Japan Semiconductor Makers," Japan Times, July 30, 1982.
34. " 'In the second half of 1981, the U.S. Commerce Department was told by one of our competitors that we were dumping 64K RAMs on the U.S. Market,' one semicon- ductor company spokesman said in Tokyo last week. 'Now, the U.S. Justice department is asking if we are fixing prices and holding back supplies. Well, cartel or dumping, which is it?' " J.D. Kidd, "Japanese 64K Makers Puzzled by U.S. Probe," Electronic News, August 22, 1982. See also Andrew Pollack, "Inquiry Puzzles Chip Makers," New York Times, July 28, 1982, p. D9.
35. Thomas A. Skornia, speaking for the Semiconductor Industry Association. See "A New Front in the War over Japanese Chips," Business Week, August 9, 1982, pp. 22-23.
36. Robertson, "Japanese RAM Power." 37. Sabin Russell and Stuart Zipper, "Motorola Rivals See 64K Woes Pressuring
Deliveries, Prices," Electronic News, March 28, 1983; "Quotations of LSIs Stop Falling, Start Rebounding," Japan Economic Journal, May 31, 1983; and Sabin Russell, "64K RAM Revival Ends 3-Mo. Lull," Electronic News, June 23, 1983.

Kenneth Flamm 265
resentatives of the Japanese chip makers in the spring of 1983.38 As the industry entered one of its cyclical boom periods, trade frictions receded as an urgent matter requiring attention in Washington.
What was most notable in the 1980-84 period of friction was a subtle shift in the argument about predatory behavior in semiconductors. By 1980 a large and highly visible Japanese R&D subsidy in semicon- ductors, directly focused on DRAMs and related manufacturing tech- nology, had ended.39 Formal quotas had also ended, and tariffs were low and dropping rapidly.40 Though complaints about access to the Japanese market persisted, intensifying in early 1983, it could no longer be claimed that higher prices in the home market enabled Japanese producers to persistently price below average cost in foreign markets.41 If Japanese producers were losing money in the United States on sales of dumped memory chips, they had to be losing money at home as well.
Thus, the story told about Japanese predation in 1982 necessarily had to change. At first the Japanese government's policies of R&D subsidy and home-market protection might have encouraged firms to price exports low. The government did not require explicitly predatory company behavior (since home market profits could offset foreign losses). Later, to sustain massive losses around the world, it was necessary to argue that Japanese firms had adopted an explicitly predatory strategy, with the expectation that in the long run, with the exit of foreign com- petitors, rents could be collected to offset the initial costs of predation. The appearance of significantly higher U.S. prices for a period begin-
38. Mark Blackburn, "Execs Testify in Computer Chip Probe," Oakland Tribune, March 18, 1983; and "64K RAM Makers Face Possible Antitrust Charges," Japan Times, March 20, 1983. Apparently none of the Japanese management based in Japan was deposed.
39. Substantial (but less visible) support from NTT, and a privately funded cooperative followup to MITI's VLSI project, continued. See Flamm (Brookings, forthcoming). U.S. firms continued to be concerned, well into the 1980s, about access to technology created in MITI's VLSI project.
40. In mid-1981 Japan and the United States agreed to a five-year acceleration in Tokyo Round tariff cuts on semiconductors (to a rate of 4.2 percent in both countries by January 1982 from 10.1 percent in Japan and 5.6 percent in the United States). Clyde H. Farnsworth, "U.S. and Japan Plan Cuts in Semiconductor Tariffs," New York Times, May 12, 1981, p. Dl. In February 1985 Japan and the United States agreed to end all tariffs on semicon- ductors effective the next month. "Japan and US Agree to Abolish Semiconductor Tariff Next Month," Nihon Keizai Shimbun, February 9, 1985, p. 3.
41. In February 1983 the SIA published a major report criticizing Japanese industrial targeting practices.

266 Brookings Papers: Microeconomics 1993
ning in March 1982, and the charge that the fruits of predation were finally being collected, added an element to the mix: collusion. Amer- ican producers argued that having achieved a dominant position in the market for DRAMs, Japanese companies were cooperating to cut back supply on foreign markets in order to collect monopoly rents, either on their own or with administrative support from their government.
Since 1982 the U.S. industry has analyzed Japanese production and pricing practices as a mix of (1) strategic industrial and trade policy by the government with (2) collusive behavior by private firms. This same combination of strategic government policy with strategic and collusive private firm behavior has consistently been presented as the U.S. in- dustry analysis of Japanese production and pricing practices, and it has reappeared in the aftermath of the landmark Semiconductor Trade Ar- rangement of 1986 between the United States and Japan.
Evolution of the Semiconductor Trade Arrangement
The year 1984 marked a cyclical peak in the semiconductor business. By the late fall of that year, however, semiconductor demand in the United States had weakened rapidly, a downturn mirrored in the Jap- anese market. A series of rapid declines in price for the then-predom- inant memory chip of the day, the 64K DRAM, were triggered in October 1984 when Micron Technology, a small American memory chip manufacturer, announced a sharp cut in its sales price. Other manufacturers, Japanese and American, quickly followed suit, and DRAM prices plunged further into a sustained decline by early 1985.
As the U.S. chip market weakened and domestic sales faltered, U.S. semiconductor companies began to press complaints in Washington about limited access to the Japanese chip market, where their sales had fallen off even more sharply. Through the spring of 1985, the Japanese market remained relatively robust. American firms began to worry that their Japanese competitors would continue the trend of record invest- ments in new capacity logged in fiscal 1984, when Japanese investments in semiconductor facilities had more than doubled over fiscal 1983 levels. In May of 1985, U.S. trade negotiators reportedly asked MITI to persuade Japanese companies to restrain their investments in new capacity. The request was turned down.

Kenneth Flamm 267
In June of 1985, the Semiconductor Industry Association filed with the U.S. trade representative a Section 301 complaint, alleging that barriers to Japanese market access constituted an unfair trade practice and asking for retaliatory sanctions. Later that month Micron Tech- nology filed with the Commerce Department a dumping complaint against seven Japanese producers of 64K DRAMs.
Meanwhile, in another key type of memory chip-erasable pro- grammable read-only memories-conflicts over import competition had been mounting through most of the spring. A cause celebre was stirred up when Hitachi America's "10 percent memo" was unearthed and publicized. The memo urged Hitachi distributors to undercut all rival EPROM price quotes by 10 percent, at a guaranteed 25 percent profit margin. An often unmentioned but important fact is that this memo specifically urged Hitachi distributors to target Japanese rival Fujitsu, as well as American makers Intel and Advanced Micro Devices (AMD).
The Japanese political establishment reacted to the Commerce dump- ing investigation at a meeting on July 17 between business organization leaders and politicians from Japan's ruling Liberal Democratic Party (LDP). A top LDP politician reportedly urged Japanese semiconductor (and auto) companies to restrict their exports "on a voluntary basis, instead of doing things in a clumsy manner like the Government's taking the initiative."42 Within a week Hitachi, the largest producer of 64K DRAMs and the author of the infamous 10 percent memo, announced voluntary restrictions on semiconductor exports for fiscal 1985. Hita- chi's plan to cut exports by 30 percent from 1984 levels was quickly followed by two announcements: NEC said it planned "to reduce ex- ports to the U.S., while increasing its production in the U.S.," and Toshiba announced that it too planned to cut its U.S. chip exports by 20 percent in fiscal 1985.43 Despite these measures, Chairman Fujio of the LDP Policy Board publicly stepped up the pressure at the end of July, declaring it necessary to consider the "possibility of restricting
42. "LDP Even Likely to Request Export Self-Restraint; Clarification Toward Business World; Automobiles and Semiconductors as Pillars: Intertwined with Opening of Market for U.S.," Asahi Shimbun, July 18, 1985, p. 9.
43. See "Hitachi to Reduce Semiconductor Exports to U.S. for This Fiscal Year by 30%," Nihon Keizai Shimbun, July 23, 1985, p. 1; "Toshiba to Cut Semiconductor Exports to U.S.," Kyodo News Wire story, July 24, 1985; "Chip Makers to Cut Exports to U.S.," Japan Economic Journal, July 30, 1985.

268 Brookings Papers: Microeconomics 1993
exports of automobiles and semiconductors and imposing an export surcharge. " 44
The chip market remained mired in recession: by October Intel, Mostek, and National Semiconductor had announced their intention to close down facilities and phase out their production of DRAMs. Three Japanese companies with U. S. manufacturing facilities-Fujitsu, Hi- tachi, and Toshiba-announced postponements in plans to expand their U.S. manufacturing operations, while NEC announced a complete halt in its fabrication of new 64K DRAMs.45
It was in this atmosphere of crisis that U.S . and Japanese negotiators held successive frustrating rounds of talks on semiconductor trade prob- lems in August, September, and October of 1985. By November it was known in Tokyo that the U.S. government was considering initiating an antidumping investigation against Japanese producers of the latest generation of DRAMs, the 256K. For the first time ever Washington would be launching the suit rather than waiting for the industry to come forward. Aware of the rumblings in Washington, Japanese manufac- turers reportedly increased their U.S. export prices for 256K DRAMs that November.46
By the end of 1985, the "production coordination" launched by major Japanese producers that summer had proved increasingly effective in pushing up 64K DRAM prices.47 But the successful efforts by Jap-
44. "Also Restriction on Exports of Automobiles and Semiconductors; Policy Board Chairman Fujio," Yomiuri Shimbun, July 27, 1985, p. 2.
45. "Construction of Very Large-Scale Integrated Circuit Plant in U.S.; Toshiba Post- pones Plan by Half a Year or One Year Due to Semiconductor Depression," Nihon Keizai Shimbun, October 23, 1985, p. 9; "NEC to Adjust Production of 64K DRAMs; Suspends Pre-process Operations to Digest Semiconductor Products in Stock, " Nihon Keizai Shimbun, October 31, 1985, p. 9.
46. "Semiconductor Maker, Full Power for 256K Price Hike, MPU for Price Cut," Nihon Keizai Shimbun, January 14, 1986, p. 18.
47. The round of export and production cuts and price increases was described in the Japanese press as "production coordination. " See "Semiconductor Industry Showing Signs of Recovery from Depression; Nippon Electric and Mitsubishi Electric Heading Toward Expansion of 64 Kilobit DRAM Production; Inventory Adjustment Makes Progress Due to Coordination of Production; Situation Remains Severe for 256 Kilobit DRAM," Sankei Shimbun, December 5, 1985, p. 6; see also "Following 'Leather,' Also 'Semiconductors' Have Hard Sailing; Japan-US Consultations; MITI Officials in Charge Impatient Without Good Idea," Tokyo Shimbun, December 6, 1985, p. 3; "Semiconductor Companies Remain Calm Toward Preliminary Ruling of 'Guilty' on 64K DRAM; Upper-Grade Item Now

Kenneth Flamm 269
anese manufacturers to collectively stabilize prices for 64K DRAMs were too late to halt the administrative machinery now set into motion by Micron's dumping petition. In early December the Commerce De- partment announced a preliminary finding of dumping in 64K DRAMs.
Higher 64K DRAM prices, coupled with a continuing increase in supply and falling prices for 256K DRAMs, accelerated chip users' switch to 256K DRAMs in their electronic systems production. Con- sumers, Japanese and American producers, and the American govern- ment now shifted their attention toward this product. By mid-December the Commerce Department had initiated an antidumping investigation of DRAMs with densities of 256K or greater.48 As tensions continued to mount, NEC and Hitachi "self-reflected upon their excessive com- petition for mass production which led to the decline of [256K DRAM] prices. " In late December 1985 they began to cut back on 256K DRAM production.49 As in the case of 64K DRAMs, however, the dumping machinery, once set in motion, was not to be stopped by anything less than a formal government agreement.
In a continuing attempt to reduce trade friction, Japanese producers announced 256K DRAM price increases for their domestic customers in early 1986.50 (U.S. export prices had been raised the previous No- vember.) By late January, delivery prices for 256K DRAMs had risen in Tokyo in both the spot and large-user markets.5" Japanese users
Attached with Major Importance; Consultations Between Japanese and US Governments Are Watched," Nihon Keizai Shimbun, December 6, 1985, p. 8.
48. This was the first antidumping case initiated by the U.S. government rather than an industry petitioning the government. It covered 256K and higher density DRAMs, including new products not yet on the market.
49. "Nippon Electric and Hitachi Begin to Curb 256K DRAM Production; Watching U.S. Dumping Investigations," Nihon Keizai Shimbun, December 18, 1985, p. 9; "NEC, Hitachi Hold Down 256K DRAM Production to Avoid U.S. Dumping Charge," Japan Economic Journal, December 28, 1985, p. 18.
50. See "Super LSI Domestic Shipment Price Hike a Little Over 10%, Consideration of Friction with U.S.," Nihon Keizai Shimbun, January 11, 1986, p. 1; "Semiconductor Maker Full Power for 256K Price Hike, MPU for Price Cut," Nihon Keizai Shimbun, January 14, 1986, p. 18; "Semiconductor Demand to Recover This Year; From Demand- Price Survey, Price Crash Period Ends; Bottom Spreads Support Price," Nihon Keizai Shimbun, January 14, 1986, p. 18.
51. "Negotiation for Determining Price, Next Month to Be the Peak; Makers Forceful for 256K Price Hike; Users Demand Price Reduction Due to Yen Appreciation," Nihon Keizai Shimbun, January 29, 1986, p. 20; "Semiconductor: Due to Japan-U.S. Trade
270 Brookings Papers: Microeconomics 1993
complained loudly about the unnatural and artificial price increases induced by gaiatsu (foreign pressure).52 But the administrative gears set in motion by the dumping cases continued to turn: by March of 1986, the Commerce Department had added preliminary dumping de- terminations in both the EPROM and 256K DRAM cases to a December finding on 64K DRAMs. Following the March EPROM ruling, Intel reportedly raised its EPROM prices by an average of 25 percent. Jap- anese producers, concerned about trade frictions, followed Intel's lead by raising domestic sales prices, exercising "self-restraint" on low- priced sales of EPROMs.53
By the end of July 1986, antidumping cases were in play for three different types of memory chips (as well as a Section 301 unfair trade practices complaint and a private antitrust suit against Japanese chip producers). At that point, after almost a year of negotiations, agreement was finally reached on the first bilateral U.S.-Japan Semiconductor Trade Arrangement. Dumping cases in 256K (and higher) DRAMs and EPROMs, and the 301 case, were suspended after these talks were successfully concluded in late July. The STA was officially signed on September 1, 1986.
Operation of the Semiconductor Trade Arrangement
A detailed analysis of the operation of the Semiconductor Trade Arrangement is beyond the scope of this paper, but some account of developments after 1986 is necessary. Essentially, there were two main points. First, in a "secret" side letter, the Japanese government agreed
Friction, Unprecedented Price Rise; U.S.-Made Import Doubtful; Maker Confident in Profit Maintenance," Nihon Keizai Shimbun, January 30, 1986, p. 20.
52. "This price increase by Japanese makers, aimed at calming bilateral trade friction, has its roots in political judgements beyond simple market principles." See "Semicon- ductors: Abnormal Price Increase Caused as a Result of the U.S.-Japan Trade Friction," Nihon Keizai Shimbun, January 30, 1986, p. 20. The article concludes: "One maker pointed out that the year 1986 marks the first time all the makers share a sense of cooperation in the history of the semiconductor industry, unlike in the past when they were competing with each other for higher production and lower prices. They expect that less price com- petition will bring them larger profits in FY1986."
53. "EPROM Prices in Steady Tone-Semiconductors; Japanese Manufacturers Ex- ercise Self-Restraint on Low-Priced Sales," Nihon Keizai Shimbun, April 2, 1986, p. 18.

Kenneth Flamm 271
that a 20 percent market share should be attainable by foreign companies selling into Japan. (I have little to say about this part of the STA in this paper.) Second, dumping cases in 256K and higher density DRAMs, and in EPROMs, were suspended in exchange for Japanese companies' agreement to respect price floors set by the U. S. Commerce Department, and MITI's agreement to " monitor" the pricing of an even wider variety of chip exports in U. S. markets and other foreign export markets.
Disagreement over the interpretation of the second point was virtually immediate. Though the Japanese government established monitoring and control mechanisms in the fall of 1986, considerable dispute existed over the extent to which price floors-foreign market values (FMVs)- set by the Commerce Department were to be applied to sales in so- called third-country markets. This issue brought into the conflict the European Community and the General Agreement on Tariffs and Trade (GATT). The Europeans submitted to GATT a complaint, arguing that such restraints were illegal.
In addition to setting or monitoring prices, the STA called upon the Japanese government to compile semiconductor demand and supply forecasts for Japan, establish direct quantitative controls over certain exports, and use Japan's export control ordinances to enforce third- country antidumping measures. (Foreign reaction to these measures led the Japanese government in 1987 to make a public disavowal of pro- duction controls. In 1989 the government disavowed ex ante review of export pricing for non-American markets and dissolved Japan's supply- demand forecast committee. MITI continued to collect highly detailed information on production, exports, and pricing of memory chips by Japanese producers, however, and to release some of these data in periodic public reports.)
In response to mounting political pressures from the United States over third-country dumping, the Japanese government "guided" Jap- anese producers to significantly reduce DRAM output in the first half of 1987. Export control mechanisms also were used to pressure com- panies to meet minimum export-price guidelines. Evasion appears to have initially been widespread, and the U.S. government responded in late March 1987 by imposing sanctions on imports of selected Japanese products.
To boost prices by restricting supply, the Japanese government kept pressure on firms to hold production down. Guidance also was given

272 Brookings Papers: Microeconomics 1993
covering investment in new capacity by Japanese firms. The success of these measures in bringing third-country prices up to U. S. levels prompted the U.S. government in November 1987 to partially lift the sanctions. (Some sanctions were maintained to express dissatisfaction with the pace at which Japanese companies had increased their pur- chases of foreign semiconductors.)
By late 1987 demand for chips was tightening with a recovery in the computer industry, the main market for these products. Production controls-formally forsworn by the Japanese government in Novem- ber-were to become irrelevant as the industry approached full-capacity utilization. Guidance of investment reportedly continued into 1988, however, and a system of regional allocation guidelines for exports was reported by Japanese producers to be in place by late 1987. Adminis- trative measures were taken that made it more difficult to export chips without the approval of manufacturers and the government. This hin- dered the export of chips into the "gray market" by brokers and other arbitrageurs.
A full-fledged shortage of DRAMs was widely felt in the United States and Europe by early 1988. As prices soared, substantial differ- entials between Japanese large-user prices and foreign contract prices appeared. (On the gray market, inherently much more difficult to con- trol, available data suggest that U.S. and Japanese spot prices were roughly equalized.) These differentials persisted throughout 1988 and into 1989. To reduce supplies filtering into the Japanese gray market, Japanese manufacturers increased their surveillance of chip transactions by their sales agents.
Figure 1 shows just how extraordinary the changes in Fisher Ideal price indexes for DRAMs and EPROMs over this period look when compared with earlier years. 54 These indexes refer to average worldwide sales prices; U.S. contract prices soared by a considerably greater mar- gin, and spot prices jumped even higher, roughly quadrupling in the first months of 1988. As American users howled in pain over unpre- cedented price increases, criticism of the Semiconductor Trade Ar- rangement mounted.
American chip producers argued that reductions in supply, and price
54. The construction of this chained index of year-to-year Fisher Ideal price comparisons is described in Flamm (Brookings, forthcoming).

Kenneth Flamm 273
Figure 1. Fisher-Ideal Price Indexes, 1972-89
Percent 30
10' n/\ X X I
-7 0 I- - - - - - - - - - -. - - - - - - - -
30
Cl - -
-m 0 O N C m - -
00 O- r- r- r- r- r- r- r- r- 00 00 00 oo 00 00 00 00 00 00
dynamic random access erasable programmable memory chips read-only memory chips
Source: See text.
increases, were the consequence of predation rather than an outcome created or facilitated by the STA. David Yoffie, a professor at the Harvard Business School (and shortly to become a member of Intel's Board of Directors), explained the problem in this way:
Any economist will tell you that we shouldn't complain about for- eigners dumping, because consumers benefit. The one exception is if foreign firms can put domestic firms out of business, and then raise prices. If it is costly to re-enter the business (like it is to restart DRAM pro- duction), foreign firms can gain monopoly profits at the consumers' expense.
Rather than signaling a bankrupt trade policy, today's shortages in DRAMs should remind us that dumped products in an industry like semiconductors usually lead to higher prices and limited availability if domestic suppliers are allowed to be destroyed.55
Claims of predatory Japanese behavior were further developed when it
55. David B. Yoffie, "Chip Shortage: Don't Blame the Pact," Wall Street Journal, June 21, 1988, p. 52. Yoffie joined Intel's Board of Directors in 1989.

274 Brookings Papers: Microeconomics 1993
became evident that market prices had stayed well above the Commerce Department's floor prices in 1988 and 1989.
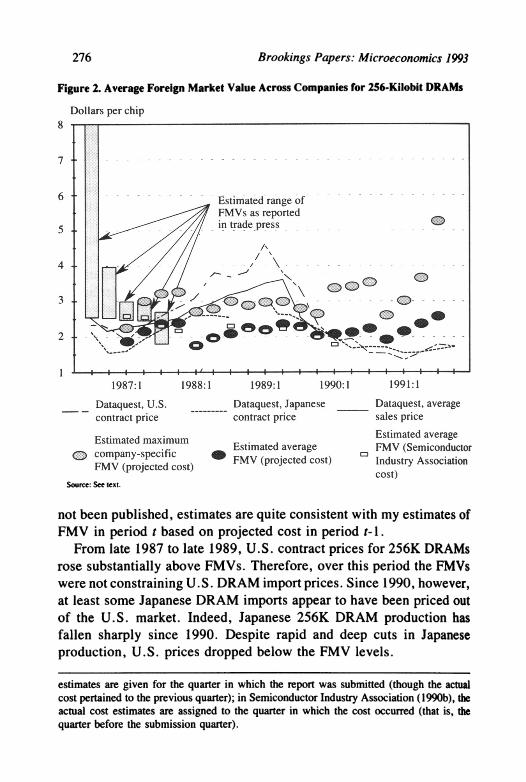
The FMV System
From late 1986 through mid-1991, the Department of Commerce administered a system of company-specific price floors (foreign market values, FMVs) for U.S. imports of Japanese DRAMs and EPROMs. With the announcement of sanctions against third-country dumping applied to Japan in March 1987, pressure was placed on the Japanese government to ensure that the prices of Japanese products sold in other foreign countries met or exceeded the minimum U. S. price. What effect did the FMVs have on the market price of affected products?
Although the FMVs set for each Japanese company by the Commerce Department were never revealed, one can deduce a range within which these levels varied. Japanese companies were required to file public reports every quarter with the Commerce Department that contained "ranged" estimates of various cost concepts (the true value plus or minus an up to 20 percent error added to preserve a degree of confi- dentiality). These cost estimates were the basis for the procedures by which the Commerce Department set FMVs. The foreign market value for a given quarter (call this quarter t) was essentially set by the Com- merce Department to the projected cost for the previous quarter (t-1). The methodology used to project cost in quarter t-1, in turn, based it on actual cost of production in period t-2. Projected cost in quarter t- 1 and actual cost in period t-2 were contained in a report filed with the Commerce Department in quarter t_ 1.56
Let us consider for some type of chip the "average FMV," defined as the simple average across companies of the unobserved company- specific FMVs set for Japanese imports. Treat the "error" added on to confidential true-cost estimates to produce public ranged-cost estimates as a mean zero random error (averaging public ranged-cost estimates across minor variants of a specific type of product within a company
56. For what appears to be the only published description of this methodology, see Semiconductor Industry Association (1990a).

Kenneth Flamm 275
and across companies). This will produce an unbiased estimate of av- erage FMV. Similarly, adding 20 percent to the maximum public ranged estimate among the population of ranged average costs for all companies will produce a number that must be greater than or equal to the greatest "true" FMV among all Japanese companies, and therefore bounds true FMV from above. Using these calculations we can construct an upper bound on the maximum company-specific FMV and an estimate of the average FMV across all companies.
Particularly in the initial quarters of the operation of the FMV system, the Commerce Department, before issuing FMVs, changed the cost estimates submitted by the companies in their quarterly reports. After the system had operated for a while, and the Commerce Department and the companies had developed procedures that produced estimates acceptable to Commerce, FMVs generally were set quite close to the constructed cost projections submitted by Japanese companies.57 By mid- to late 1987, FMVs had settled down around companies' projected cost submissions. Figure 2 shows estimates I have constructed of "av- erage FMV" across companies for 256K DRAMs (as well as a bound on maximum company-specific FMV) based on public cost submissions to the Commerce Department (of projected cost in period t-1).58 Also shown are ranges for actual FMVs for this product reported in the Japanese trade press in 1986-87. After initial large discrepancies be- tween company and Commerce calculations of cost, the midpoint of the reported range for actual FMV settles around the third quarter of 1987 at the approximate neighborhood of my average FMV.
Also shown in figure 2 is the midpoint of upper and lower bounds on constructed actual cost reported in these quarterly submissions, as compiled by the Semiconductor Industry Association. Actual cost in quarter t-2 may be considered an alternative estimate of FMV in period t.59 Though the SIA's methodology in producing these estimates has
57. Interview with law firm staff responsible for Japanese company submission to Commerce, January 1990.
58. Because the type and extent of data reported for every company were different and often varied over time, it is not easy to tell how these estimates were constructed. For a fuller discussion see Flamm (Brookings, forthcoming, chap. 6).
59. Note that the SIA is not always consistent in how it associates these estimates of actual cost with a time period. In Semiconductor Industry Association (1990a) actual cost
276 Brookings Papers: Microeconomics 1993
Figure 2. Average Foreign Market Value Across Companies for 256-Kilobit DRAMs
Dollars per chip S
7 - - - ~ - - - - - - ---- -- -------,
6 - - - - - - - - - - r d f- - - - - - - - - - - - - - - -- - -stiniat&(rangje of
FMVs as reported cnr -in trade_pres s? ice
4~~~~~~~~~~~~~~~~~
2 A5T%
1987:1 1988:1 1989:1 1990:1 1991:1.
Dataquest, U.S. Dataquest, Japanese __ Dataquest, average contract price contract price sales price
Estimated mimum Estimated average
Et company-specific Estimated average 3 FMV (Semicondcto FMV (projacid cost) *FMV (projected cost) Industry Association FMV (projected cost)
~~~~~cost) Source: See text.
not been published, estimates are quite consistent with my estimates of FMV in period t based on projected cost in period t-1.
From late 1987 to late 1989, U.S. contract prices for 256K DRAMs rose substantially above FMVs. Therefore, over this period the FMVs were not constraining U.S. DRAM import prices. Since 1990, however, at least some Japanese DRAM imports appear to have been priced out of the U.S. market. Indeed, Japanese 256K DRAM production has fallen sharply since 1990. Despite rapid and deep cuts in Japanese production, U.S. prices dropped below the FMV levels.
estimates are given for the quarter in which the report was submitted (though the actual cost pertained to the previous quarter); in Semiconductor Industry Association (1990b), the actual cost estimates are assigned to the quarter in which the cost occurred (that is, the quarter before the submission quarter).
Kenneth Flamm 277
Figure 3. Average Foreign Market Value Across Companies for I-Megabit DRAMs
Dollars per chip 30
15 elo
15
1987:1 1988:1 1989:1 1990:1 1991:1
Dataquest, U.S. Dataquest, Japanese Dataquest, average contract price contract price sales price
Estimated maximum Estimated average Estimated average company-specific 0 FMV (projected cost) o FMV (Semiconductor FMV (projected cost) Industry Association
cost) Source: See text.
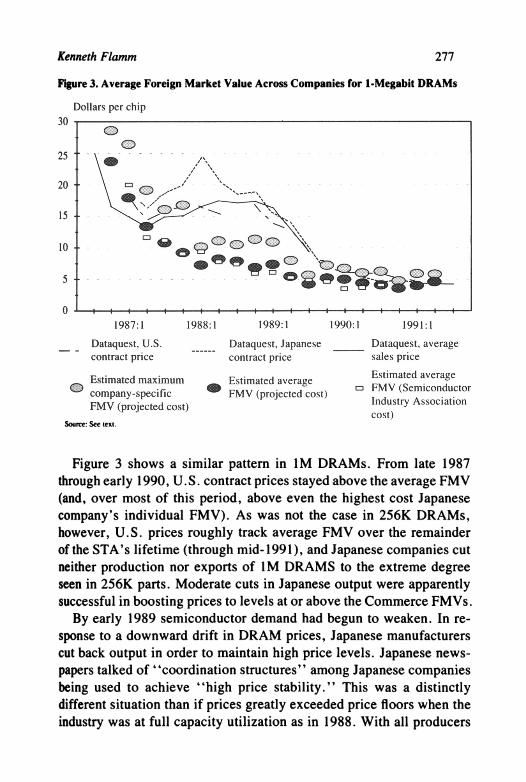
Figure 3 shows a similar pattern in IM DRAMs. From late 1987 through early 1990, U.S. contract prices stayed above the average FMV (and, over most of this period, above even the highest cost Japanese company's individual FMV). As was not the case in 256K DRAMs, however, U.S. prices roughly track average FMV over the remainder of the STA's lifetime (through mid- 1991), and Japanese companies cut neither production nor exports of 1 M DRAMS to the extreme degree seen in 256K parts. Moderate cuts in Japanese output were apparently successful in boosting prices to levels at or above the Commerce FMVs.
By early 1989 semiconductor demand had begun to weaken. In re- sponse to a downward drift in DRAM prices, Japanese manufacturers cut back output in order to maintain high price levels. Japanese news- papers talked of "coordination structures" among Japanese companies being used to achieve "high price stability." This was a distinctly different situation than if prices greatly exceeded price floors when the industry was at full capacity utilization as in 1988. With all producers

278 Brookings Papers: Microeconomics 1993
operating close to capacity, it was more difficult to argue that industry's own restraint-rather than politically mandated restraints on capacity expansion and production-was causing high prices. With idle capac- ity, it became more plausible to argue that collusive behavior by firms was the principal cause of abnormally high prices that exceeded FMVs.60
Causes of the DRAM Crisis of 1988
A more neutral assessment would begin by noting three distinct explanations for the unprecedented run-up in chip prices in 1988. Log- ically, the 1988 crisis could be explained by any combination of these three arguments. First, a sustained shortfall in supply could be explained by producers' innocent miscalculation (on the demand side, underes- timation of the recovery in chip demand in 1988; on the supply side, unexpectedly slow growth in yield rates in semiconductor production in 1987 and 1988). Second, the shortfall in 1988 could be explained by the implementation of the Semiconductor Trade Arrangement in 1987, when Japanese producers were being "guided" by their govern- ment to reduce output and investment. In other words, we might imagine a purely exogenous "political" shock to Japanese suppliers' production and investment decisions. Third, a group of suppliers (accounting for most of global production) might have made a deliberate decision to collectively exploit its monopoly power and seek greater monopoly rents.
Two variants of this third argument exist. Variant 3(a) is that the organized rent collecting was largely opportunistic, facilitated by the STA and the subsequent creation of a joint information gathering and price monitoring framework for Japanese chip supply. Variant 3(b) is that the exploitation of monopoly power reflects the private decisions of a collusive group of predatory producers (perhaps aided or abetted by the state) but basically independent from the evolving resolution of semiconductor trade frictions.
Some version of variant 3(b) has been an element of the story of Japanese predation told by U.S. chip producers since 1982. The factual case for variant 3(b) was reasserted most recently by several analysts
60. See Semiconductor Industry Association (1990b, p. 65).

Kenneth Flamm 279
associated with the Semiconductor Industry Association and given wide circulation by others citing their work.61 The starting point for the argument is the "production coordination" by Japanese suppliers in late 1985 and early 1986, which attracted little immediate public com- ment outside Japan (unlike the case in 1982, when the Justice Depart- ment became involved). The SIA analysis argues that moves to reduce DRAM exports and production predated the Semiconductor Trade Ar- rangement and therefore must be independent of government policy. They attribute "production coordination" instead to Japanese chip mak- ers passing over some threshold of monopoly power as American pro- ducers withdrew:
The move toward production regulation by the Japanese producers' group began in 1985, well before the Semiconductor Arrangement had even been conceptualized, much less actually put in place. . . . Thus, by the third and fourth quarters of 1985, Japanese DRAM producers had few competitors left except each other. It was at this precise moment- in late 1985-that reports began to appear of joint actions by the Japanese DRAM producers to stabilize price competition by coordinated curtail- ments in output.62
In fact, the historical record refutes the specifics of these claims. Cuts in exports by the big Japanese producers occurred after political pressure had been brought to bear on the industry by top politicians in July of 1985. Furthermore, most U.S. firms dropped out of DRAMs after the initial cuts in semiconductor exports by Hitachi, NEC, and Toshiba in the summer of 1985. The strategy embodied in the STA was not "conceptualized" for the first time in 1985. In response to political pressure and government "guidance," Japanese chip exporters had cut semiconductor exports back in 1982, 1981, possibly in 1979, and def- initely in 1959, when Japan's market share was much smaller than in 1985.
In one known episode several Japanese producers have been de- scribed as having attempted to coordinate production of semiconductors in the absence of a political initiative to deal with trade friction. This
61. The SIA analysis is repeated uncritically in U.S. Congress, Office of Technology Assessment (1991, pp. 1 1-12) and in Laura D'Andrea Tyson and David B. Yoffie, "Manag- ing Trade and Competition in the Semiconductor Industry," in Tyson (1992, pp. 117-18).
62. Howell, Bartlett, and Davis (1992, p. 117).

280 Brookings Papers: Microeconomics 1993
attempt apparently failed. In September of 1981, as prices for the newly introduced 64K DRAM plummeted, NEC, Hitachi, and Fujitsu each announced a freeze on increased production. Late that year producers Oki and Mitsubishi broke ranks and announced output increases. As Yui Kimura has noted, "This, together with the rapidly rising demand [for 64K DRAMs], broke down the tacit agreement among NEC, Hi- tachi, and Fujitsu to hold back production."63
As 64K prices continued to fall in late 1981, trade frictions inten- sified. MITI intervened in February 1982, counseling restraint in " guid- ance" to Japanese producers. (In fact, Japanese market share in 64K DRAMs peaked in the last quarter of 1981 and then went into sustained decline.) Restraints on exports seemed to "stick" only after bureau- cratic intervention to resolve a deepening external political crisis.
Thus, before the Semiconductor Trade Arrangement of 1986, epi- sodes of successfully coordinated restraint on exports or output by Japanese producers seem to have occurred only after bureaucrats and politicians responded to trade friction. After the STA was signed, ad- ministrative mechanisms for coordination and control became much more explicit and formal. Then, as foreign pressure led the Japanese government to explicitly forswear production controls after 1987, and to back off from price controls on exports to markets other than the United States after 1989, the government's overt intervention in DRAMs faded.
Even after 1989, the government fostered an environment in which it was much easier for firms to cooperate and coordinate. After 1989 the government continued to encourage Japanese producers to exercise ''restraint,' and it continued to collect very detailed and accurate data on DRAM production and exports. Nonetheless, the more visible in- struments of direct Japanese government control had been removed. It is after 1989 that it is most useful to examine whether DRAM producers were showing any disposition to collude on their own.
Anecdotal Evidence on Private Collusion
The period from early 1989 through early 1990 is the most interesting part of the five-year history of the STA from the standpoint of allegations
63. Kimura (1988, p. 66).

Kenneth Flamm 281
of collusive behavior by Japanese companies. This is because market DRAM prices in the United States and Japan remained considerably above U.S. foreign market values at a time of weakening demand, while companies were reducing their output levels well below capacity. By this time the Japanese government was under considerable foreign pressure to not intervene and order domestic chip producers to reduce output. Understandably, the manner in which Japanese DRAM producers were reducing their output prompted intense foreign interest.
It would be helpful to use actual data on pricing and costs to examine the credibility of allegations of collusive behavior empirically, but un- fortunately no data on price-cost margins for DRAMs are available. Some noisy information on average cost is available in public company submissions to the Commerce Department filed as part of its FMV- setting process, but statistical procedures and assumptions, as well as supplemental estimates of company output levels, are required to make any inferences about marginal cost. The only direct evidence on the question, then, is necessarily anecdotal.
Reportedly, the three largest producers of DRAMs in Japan cut output sharply the day after an attempt by U.S. chip consumers and producers to organize a DRAM manufacturing venture (U.S. Memories) finally failed. The U.S. press fueled assertions that the Japanese were "acting much like a cartel."64 Some close to the U.S. industry even charged
64. See David E. Sanger, "Contrasts on Chips," New York Times, January 18, 1990, p. DI. Sanger writes: "On the day last week when American electronics companies decided to abandon their cooperative venture to make computer chips, their competitors in Tokyo had already moved in lockstep. One by one, within hours, Japan's biggest chip makers announced plans to cut their production of one-megabit memory chips. . . . There was far too much supply, each company explained in great detail, and unless production was cut, prices would continue to fall drastically. The Japanese companies, despite repeated con- tentions that they are now each other's fiercest competitors, were acting much like a cartel." Sanger's account incorrectly claims that the Japanese cutback plans were revealed after U.S. Memories failed. The cutbacks were reported in the Japanese press on Sunday, January 7, and in the U.S. press on Tuesday, January 9. See "Drastic Drop of IM DRAM Price: Semiconductor Makers Reinforce Production Cut (10-15% Starting This Month)," Nihon Keizai Shimbun, January 7, 1990, p. 5; and G. Pascal Zachary, "Japan's Biggest Memory- Chip Makers Are Cutting Output in Bid to Ease Glut," Wall Street Journal, January 9, 1990, p. B4. The critical meeting at which the U.S. Memories proposal failed was on Wednesday, January 10, and its failure was publicly announced on Monday, January 15. See Stephen Kreider Yoder, "U.S. Memories to Abandon Bid for Chip Venture," Wall Street Journal, January 15, 1990, p. B4; "Lessons Linger as U.S. Memories Fails," Wall

282 Brookings Papers: Microeconomics 1993
that Japanese companies had flooded the market and forced prices down in a deliberate effort to torpedo U.S. Memories.65
Actually, major Japanese companies had cut shipments and reduced production long before U.S. Memories failed. After increasing pro- duction of IM DRAMs during the first quarter of 1989, domestic pro- ducers began to cut back production in the late spring, sliced shipments even more, and increased their stocks of parts held in inventories. In the early fall of 1989, large production cuts were announced by most major producers of Japanese chips. At the end of July, NEC announced that it had scaled back its plans for increasing production of IM DRAMs. In September Toshiba, Hitachi, and Mitsubishi each reported that they were cutting back their production levels by about 10 percent. In late October NEC announced that it, too, would cut current production levels in the first quarter of 1990.66
The press in Japan asserted that Japanese chip makers were collec- tively cutting back production to achieve "high price stabilization." Mention of a "coordination structure" also reappeared in the trade press. It was feared that a round of vicious price cutting, like that last seen in 1985, was about to break out.67
In interviews with the author in November and December of 1989, semiconductor executives at several Japanese companies were quite up-
Street Journal, January 16, 1990, p. B 1; and Andrew Pollack, "Memory Chip Cooperative Is Officially Declared Dead," New York Times, January 16, 1990, p. DI.
65. Borrus (1990) wrote, "The Japanese press reported that Japanese firms were creating a glut in the market to lower prices and thus discourage the initiative [U.S. Memories]." When contacted by the author, however, Borrus was unable to provide any citations to Japanese press reports. The erroneous belief that Japanese makers engineered a shortage to kill U.S. Memories was possibly fueled by the story in the New York Times, January 18, 1990, p. D-20: "No one has suggested that Japan's production cuts and the abandonment of U.S. Memories are directly related. But both were spurred by a growing glut of chips, after two years of huge demand."
66. This basic chronology of events in 1989 was reviewed by Hitachi's H. Nakagawa in "Semiconductor and EDP Market," slides from a presentation, circa late 1989 (given to author in December 1989). See Nikkan Kogyo, July 29, 1989, p. 1; Nihon Kogyo, July 29, 1989, p. 1; "Major Semiconductor Manufacturers to Reduce IM-DRAM Production by 10% from September," Nihon Keizai Shimbun, September 14, 1989, p. 10; Dempa Shumbun, October 31, 1989, p. 1; Nikkan Kogyo, October 31, 1989, p. 1; and Nihon Kogyo, October 31, 1989, p. 5.
67. See "Spot Price Plunges: Dark Cloud Lingers over the Semiconductor Market," Nihon Keizai Shimbun, August 13, 1989.

Kenneth Flamm 283
front about their intention to continue to reduce DRAM production in order to stabilize prices. Asked why, given current prices that were certainly far above his company's production costs, he did not cut prices in order to stimulate sales, one top executive motioned toward a sky- scraper visible through the window. This was the headquarters of a rival electronics giant. The man remarked that if he cut prices, his neighbor would as well, setting off a round of continual price cutting. Asked how he could know how much to cut production to stabilize prices, without knowing the plans of other companies, his colleague responded that the matter was complicated, with "many aspects." He declined to elaborate.68
The subject of coordination among companies is obviously a delicate one. It is very difficult to find someone with firsthand information who is willing to discuss it, even on an unattributed basis. Nonetheless, I did manage to interview someone who was present at meetings in Japan where information on the production and capacity of individual com- panies was discussed by participants. According to his account, these informal and unofficial meetings were attended by managers from the semiconductor divisions of major Japanese companies. Each company had available to it computer printouts of other companies' output and capacity by product, and all companies had the same data in their printouts. No government officials were present at these meetings.69
After 1989, observers writing in the Japanese trade press noted the trend toward increasingly tight oligopoly control of Japanese DRAM production. As one chip executive remarked to an American government official in early 1990, Japanese DRAM manufacturers since the STA "have moved from competing for market share to market sharing."
The trade arrangement at the very least played a catalytic role in this move toward market sharing by Japanese producers. Whether cause or effect of the STA, apparent coordinated action among Japanese pro- ducers was probably the most persuasive evidence for the claim that the absence of U.S. manufacturing capability in semiconductors poses strategic issues for the larger U.S. economy. I next want to consider
68. Author's interview in Tokyo, December 1989. 69. The last meeting attended by my source, as of the date of my interview, was in
1990.

284 Brookings Papers: Microeconomics 1993
what the cost to U.S. chip consumers might be if they faced a foreign DRAM cartel and what they might be willing to spend to ensure that a cartel could not be formed.
First, I develop a simple model of the product life cycle for semi- conductors that assumes nonstrategic, noncooperative behavior by pro- ducers. I then show how strategic but noncooperative behavior might change producers' decisions. Finally, I sketch a particular scenario for cartel formation and simulate its effect on American chip consumers.
Modeling the Product Life Cycle for Semiconductors
My modeling efforts focus on the 1-megabit DRAM for two reasons. First, it was the most recent generation of DRAM chip for which rel- atively reliable data were available at the time the research was begun. Second, its product life cycle largely corresponded to the period of the Semiconductor Trade Arrangement. This second consideration was par- ticularly important, since I wished to approximate the potential impact of collusive behavior over a period when it was alleged to have occurred.
The argument that collusive behavior could have significant effects in DRAMs is not inherently unreasonable. The industrial organization of the supplier industry for DRAMs is depicted in table 2, which cal- culates the Hirschman-Herfindahl index of concentration and the share of global supply coming from firms headquartered in different countries over time. The Hirschman-Herfindahl index (HHI) calculated here will range in value from 1 (most concentrated, with all output produced by a single firm) to 0 (approached with perfect competition).
In DRAMs, levels of concentration (generally at or above the 0. 1 level) were considerably greater than that measured in the semicon- ductor market as a whole. In 1987, for example, the HHI for the fifty largest U.S. semiconductor-producing companies was 0.0539, down from 0.0597 in 1982.70 What this probably indicates is that semicon- ductor firms tend to specialize in particular types of products. It is also evident that HHIs vary enormously over the product life cycle, with values of 1 when the first firm introduces a new generation chip, drop-
70. See Bureau of the Census, 1987 Census of Manufactures: Concentration Ratios in Manufacturing, Department of Commerce, 1991, pp. 6-38.

Kenneth Flamm 285
Table 2. Global Production of Dynamic Random Access Memory Chips
Percentage of global production
Hirschman- Top five Other Herfindahl Japanese Japanese U.S. European Korean
Year index producers producers producers producers producers
64K DRAM 1979 0.525 67 33 1980 0.264 59 41 1981 0.178 67 6 28 1982 0.129 60 6 33 1983 0.108 53 7 38 2 1984 0.092 48 10 38 4 1985 0.091 54 7 31 4 4 1986 0.099 56 11 19 5 10 1987 0.106 44 13 20 6 17 1988 0.170 19 22 21 1 37 1989 0.273 4 17 34 45
256K DRAM 1979 1980 1981 1982 1.000 100 1983 0.265 92 1 7 1984 0.213 89 3 9 1985 0.165 82 3 15 1986 0.135 77 5 15 1 2 1987 0.102 55 11 24 2 9 1988 0.091 46 18 28 2 7 1989 0.078 43 19 25 3 10
IM DRAM 1979 1980 1981 1982 1983 1984 0.964 99 1 1985 0.369 87 13 1986 0.347 93 6 1 1987 0.173 78 10 6 3 2 1988 0.135 54 16 14 5 11 1989 0.110 45 15 21 5 15
Source: Author's calculations based on unpublished Dataquest Inc. data.

286 Brookings Papers: Microeconomics 1993
ping over time as others enter the business, then rising again at the end of the life cycle as firms phase out their production of the older product and shift to newer items.
Thus, consideration of whether excessive monopoly power exists, or whether the industry is "more concentrated" than the historical norm, cannot be independent of the product's position in the product cycle. One convenient measure of how advanced in the product cycle a generation of product might be is cumulative output over time (see figure 6). Historically, HHJs in this product have tended toward 0. 1 as mass production peaked. During the early years of production of IM and 256K DRAMs, the industry was somewhat more concentrated than the historical norm. By 1989, however, concentration in both these products looked similar to earlier historical levels.
While variation in producer concentration may not be much of a potential factor in analyzing DRAM market conditions over the 1986- 89 period, geographic concentration offers greater promise. In 1986, when the Semiconductor Trade Arrangement was signed, Japanese mar- ket share was 67 percent for 64K DRAMs, 82 percent for 256K DRAMs, and 99 percent for IM DRAMs. Thus, reductions by Japanese producers in production or exports could have greatly affected aggregate world- wide supply of DRAMs.
Memory chips have a reputation as the "commodity" product par excellence within the semiconductor industry. They are a high-volume, standardized good, and almost perfect substitution among different manufacturers' offerings is the norm. The largest single segment in the U.S. semiconductor market, memory chips accounted for 28 percent of sales and 34 percent of integrated circuit consumption in 1989.71 The dominant product (almost two-thirds of memory sales) was the dynamic random access memory. DRAMS alone accounted for 20 per- cent of American consumption of integrated circuits in 1989. The first widely used commercial DRAM, the 1K memory (K means 1,024 bits of information), was introduced in 1970 by American semiconductor companies.
71. Based on U.S. market estimates from Bernard C. Cole, "In Chips, the Demand Stays Strong, " Electronics, January 1990, p. 83. Only a small fraction of DRAMs consumed is manufactured within the United States; DRAMs account for a much smaller share of the value of U.S. production.

Kenneth Flamm 287
At center stage in the continuing saga of technological improvement in DRAMs sits constant advance in semiconductor manufacturing pro- cesses. Improvements in fabrication technology have steadily reduced the size of electronic circuit elements and shrunk chip size. Three or more "die shrinks" typically occur over the life cycle of a given- capacity DRAM within a single company. The smaller the chip size, the more chips that can be crammed onto the surface of the circular silicon wafers that are the essential raw material for integrated circuits. Together with the fine-tuning of production processes that produces more "good" nondefective chips in any batch of wafers, these "die shrinks" lead to a steadily rising number of good chips per wafer starting down the production line.
Processing costs are the largest component of manufacturing costs. Therefore, improving yields-the number of good chips that can be extracted from some area of the processed silicon wafers-is the key to being profitable in commodity-like market segments, like DRAMs, where proprietary design details count for little. Yield improvement comes from better control over the manufacturing process (learning- by-doing) as well as from die shrinks (cramming more parts onto a given surface area). Learning economies-declines in unit cost that come from experience-are critical. The conventional industry wisdom asserts that every doubling in cumulative output brings a 28 percent decline in unit costs.72
Four features of DRAM production (and, more generally, semicon- ductor production) need to be addressed by models of the industry. The first is the important role of learning economies, the manner in which the net output from a given semiconductor fabrication facility rises with accumulated production experience. This creates what amounts to dy- namic economies of scale.
The second feature is capacity constraints. There are long gestation lags between when facilities are started and when they are capable of mass production. It typically takes a year to a year and a half for a new facility to become operational. Debugging manufacturing processes on "pilot production" can take another six months to a year.73
72. Noyce (1977, p. 67). 73. A newly opened state-of-the-art fabrication facility in Taiwan recently reported that
it took four months to qualify production processes, followed by five months of further

288 Brookings Papers: Microeconomics 1993
Third, product life cycles are short because of accelerated techno- logical change. In DRAMs, a new, higher density memory chip is introduced about every three years. The older chips then become ob- solete. The new chips use manufacturing processes that are technolog- ically more advanced. Therefore, new production facilities are needed, or old facilities must be extensively retrofitted. Thus, capacity for a given generation of chip is essentially locked in at the beginning of the product life cycle. By the time the product is entering large-scale mass production, it is essentially too late to enter the market.
Finally, models should take into account large investments in re- search and development. In recent years chip producers have claimed that semiconductor R&D expenditures average 10 percent to 15 percent of sales. The sunk investment required for product and process R&D for a new generation of DRAM has been roughly equal to the cost of a high-volume manufacturing facility. This investment has been in- creasing rapidly. For the upcoming 256-megabit DRAM, for example, industry sources have estimated both the R&D and plant investment required to be about $1 billion each.74
In my stylized model of the industry, a DRAM producer produces a homogeneous commodity, perfectly substitutable for that of other producers. I assume that a DRAM producer faces a fixed period over which the DRAM is sold and that costs for developing and producing the product are relevant to that generation of DRAM alone. (Difficult issues concerning the timing of the switchover from one generation of DRAM to another and intergenerational externalities are ignored.) The product life cycle begins at time 0 and ends at time 1. Hence, the unit of time is the "product life cycle." Every producer faces revenue function R, giving total revenues at any moment t as a function of his own production y(t), and the aggregate output of all other producers, x(t). All revenues and costs are measured in constant dollars.
work to raise production from 1,000 to 10,000 wafers a month. This facility has a current production rate of 15,000 wafers per month. See Wiemer and Burnett (1992, pp. 96-98).
74. Comments by an IBM executive at the Workshop on Government Roles in Com- mercial Technology, Kennedy School of Government, Harvard University, September 14, 1992. "According to estimates from IBM, Siemens, and Toshiba, the cost of designing and qualifying a quarter-micron process is in excess of $1 billion." Adam Greenberg and J. Robert Lineback, "IBM, Toshiba, Siemens in 256M DRAM Alliance," Electronic News, July 20, 1992, p. 4.
Kenneth Flamm 289
Spence has shown that a rational firm, as it takes into account the cost-reducing effect of current production on future production costs, will equate marginal revenue to a value below its current short-run marginal cost of production.75 The Spence model is rather unsuitable for analyzing production decisions in an industry, like the semicon- ductor industry, where capacity constraints may be important. Never- theless, it shows that even with nonstrategic behavior-that is, with a firm taking production decisions by competitors as given, independent of its actions-economically rational firms will engage in "forward pricing. " In other words, they will choose output levels where marginal revenue lies below their current short-run marginal cost. Following Spence, for simplicity, I ignore discounting over time because product life cycles are short, and the additional complexity would be substantial.
In semiconductor production, plant capacity may be measured in terms of "wafer starts," the number of slices of silicon, on which integrated circuits are etched, that can be processed per unit of time. At any moment t, w(E(t)) functioning chips are yielded per wafer processsed, where w is an increasing function of E(t)- 'experience" through time. How one defines relevant "experience" is a subject I explore later. I parametrize the impact of output, y, on relevant ex- perience, E, as
dE y dt Kz'
where K is capacity, and y is a parameter taking on a value between 0 and 1. For notational simplicity, time will sometimes be suppressed as an argument of time-varying variables.
Some of the variable cost of producing a chip is incurred with every wafer processed, and some of the cost is incurred only with good, yielded chips (assembly and final test, for example). If a wafer-pro- cessing facility is utilized at rate u(t) (u between 0 and 1), total variable costs at any moment are dy + cuK, where d is assembly and final test cost per good, yielded chip, and c is processing cost per wafer start. Note that y(t,K) = w(E(t)) u(t) K.
Up-front, sunk costs independent of output levels (like R&D) are equal to F, and fixed capital investment costs required for a facility
75. Spence (1981).

290 Brookings Papers: Microeconomics 1993
processing K wafer starts are equal to r per wafer start. The producer's problem is to maximize
(1) maxu(t),K f [R(x(t), y(t)) - dy(t) - cu(t)K -rK] dt - F 0
with y(t) w(E(t)) u(t) K
s.t. E = KY w(E(t)) u(t) K>-.
Thus, there are two sources of "fixed" costs in my model. The first is F, the sunk cost of company entry into the DRAM business. The second is rK, the capital costs required to build wafer fabrication ca- pacity of size K (measured in millions of product-cycle wafer starts). If plants are of some standard size, then K is proportional to the number of plants.
Assume firms simultaneously choose initial capacity investments K and a time path for utilization rates, which gave rise to a path for output over time. My assumption that capacity investments in DRAMs are committed at the beginning of the product cycle is not terribly unreal- istic. As noted earlier, it usually takes a year or more to get a new fabrication facility up and running, and a new generation of DRAM is introduced roughly every three years.76
For the moment, take y to equal 0. In other words, absolute cu- mulative production is the relevant measure of experience. As in the Spence model, I assume a Cournot-Nash equilibrium in output paths. Given rivals' actual choices of capacity and a time profile for the uti- lization rate, (1) is maximized by every firm. For the moment the behavior of firms in this static game is nonstrategic, since they take their rivals' output choices as unaffected by their own.77
76. The world record for bringing a new fabrication facility on line seems to be held by NMB Semiconductor. It claims that it took only nine months to go from groundbreaking for a new factory to initial production of 256K DRAMs in 1985. See Larry Waller, "DRAM Users and Makers: Shotgun Marriages Kick In," Electronics, November 1988, pp. 29- 30.
77. The alternative is to set up a two-stage competition among rival firms. Capacity investment is the initial stage followed by a second stage in which firms choose output paths subject to capacity constraints. The solution of the static game presented here cor-

Kenneth Flamm 291
Spence's Model
If wafer-processing capacity K is not fixed over the life cycle but is continuously variable, as is implicit in Spence's formulation, then we have a special case of the above model in which r is 0 (capital costs are included in wafer-processing cost c and some arbitrary initial scale for capacity K is set), capital is a completely variable input, and a producer is free to choose any nonnegative u-that is, u is unbounded above, not bounded by 1 and produce any yielded chip output desired. Under these circumstances, formal maximization of objective function (1) yields the first-order condition
c (2) y w K-
Note that u is chosen so that marginal revenue is set equal to current marginal cost (d + clw) less a term proportional to nonnegative adjoint variable 8, which captures the future cost-reducing effects of current production. Adjoint variable 8, in turn, is determined by the transver- sality condition
(3) 8 (1) = 0
and equation of motion
C (4) = --uKWE.
w
By differentiating both sides of equation 2 with respect to time, we immediately see that marginal revenue, Ry, must be constant over time and therefore by equation 3 equal to current marginal cost at the end of the product cycle, d + clw(E(1)).
In short, with continuously variable capacity, profit-maximizing pro- ducers will choose their output so that marginal revenue equals their terminal (not current!) marginal cost. This is so-called forward pricing.
responds to the open-loop (nonstrategic) equilibrium of this two-stage game, in which a firm's first-period choice of capacity takes its rivals choices in both periods as given. The alternative equilibrium concept will assume second-period subgame perfectness (that firms take into account the effect of their first-period capacity choices on their rivals' second- period output paths). This creates strategic interactions among firms. See Dixit (1986, p. 114); and Shapiro (1989, pp. 383-86).

292 Brookings Papers: Microeconomics 1993
With a constant elasticity, and autonomous demand, a constant price proportional to terminal marginal cost will result.
Although this model provides an appealing explanation of the phe- nomenon of forward pricing, a notable empirical feature of business practice within the semiconductor industry, the actual trajectory of pricing suggested by this model (with a constant elasticity demand, price is fixed at some constant level over the entire product cycle) is quite inconsistent with observed behavior.78 Chip prices typically drop very quickly over the first part of the product cycle, drop less quickly as the product approaches maturity, and fall very slowly, if at all, at the end. A more realistic treatment of capacity constraints yields a more plausible trajectory for prices.
The Baldwin-Krugman Conundrum
The pioneering attempt to incorporate learning economies into a stylized empirical model of the semiconductor industry is that of Bald- win and Krugman.79 To simulate the impact of market closure policies, the B-K model focuses on regional segmentation of the U.S. and Jap- anese semiconductor markets. Its approach to producer behavior differs significantly from that of Spence. Baldwin and Krugman constrain firms to operate at full capacity over the entire product cycle; the choice variable for the firm is initial capacity, which (once set) determines output levels over the entire product life cycle. The first-order condition for an optimum is that the life-cycle revenue created from the addition of a marginal unit of wafer-processing capacity just equals the cost of building and operating that marginal unit of wafer-processing capacity. (Since all capacity is always fully utilized, the distinction I am drawing between investment costs and wafer-processing costs is immaterial.)
78. Dick (1991) invokes the Spence model to motivate his assumptions about the time path of semiconductor prices over the product life cycle, but he ignores the constant pricing prediction of the Spence model.
79. Baldwin and Krugman (1988). A somewhat different exposition of this model is given in Helpman and Krugman (1989, chap. 8). The later interpretation differs in some significant respects from B-K. For example, the learning curve in B-K has yields improving with cumulative wafers processed (faulty chips have the same yield-enhancing effects as good ones), while H-K presents a more conventional view of the learning curve, with yield rates rising with cumulative output of yielded (good) chips. The B-K assumption on yields, while not the accepted approach to modeling yield improvement within the industry, sim- plifies the mathematical structure of the model.
Kenneth Flamm 293
Firms in the Spence model are never capacity constrained; firms in the B-K model always operate at their capacity constraint. Firms in the Spence model are forward pricing-maintaining marginal revenue con- stant over the life cycle, equal to their terminal marginal cost. The B-K model has marginal revenue-and price-falling smoothly over the life cycle. Thus, while the striking forward-pricing behavior of the Spence model has disappeared (though not all forward pricing), a more empirically plausible path for prices has replaced it.80
Unfortunately, when Baldwin and Krugman actually calibrated their model to empirical data, their results indicated that in the intuitively appealing case of a Cournot-Nash equilibrium in output, only two firms would populate the industry in zero profit equilibrium, in part because of the steep declines in unit cost from learning economies assumed.81 This gross deviation from a realistic market structure led them (despite their theoretical reservations about the approach) to specify firm be- havior in terms of conjectural variations, and even this tactic yielded disturbingly high conjectural variations, fueling doubts about the un- derlying model.82 As I note below, Baldwin and Krugman actually underestimated learning economies as reported in the sources they cite, deepening the perplexity created by their results.
As Krishna notes, the algebraic tractability created by the simplicity of the B-K specification of firm behavior has been purchased by ex- cluding the possibility of some interesting forms of strategic compe- tition.83 (Because Baldwin and Krugman empirically calibrate conjectural variations, strategic interactions among firms exist.) Investments in capacity may be undertaken to convince rivals to reduce output, to exit, or to dissuade them from entering an industry, creating additional mo-
80. There is great confusion in the industry about "forward pricing." Does it mean learning economies are to be taken into account when forecasting marginal costs, and prices, for future deliveries in forward contracts with large customers? Or-as in the Spence model-does it mean producing quantities such that marginal revenue falls below marginal cost? Furthermore, the latter can hold even when output is capacity constrained (unlike the Spence model). In my model price is below both current marginal cost and average cost in the earliest portion of the product cycle (see table 4). Thus, capacity-constrained output and aggressive forward pricing a la Spence are not mutually inconsistent. You are producing as much as you can and reducing price to whatever level is needed to sell it all.
81. See Baldwin and Krugman (1988, p. 185). 82. Ibid., p. 195; and Helpman and Krugman (1989, p. 173). 83. Krishna (1988).
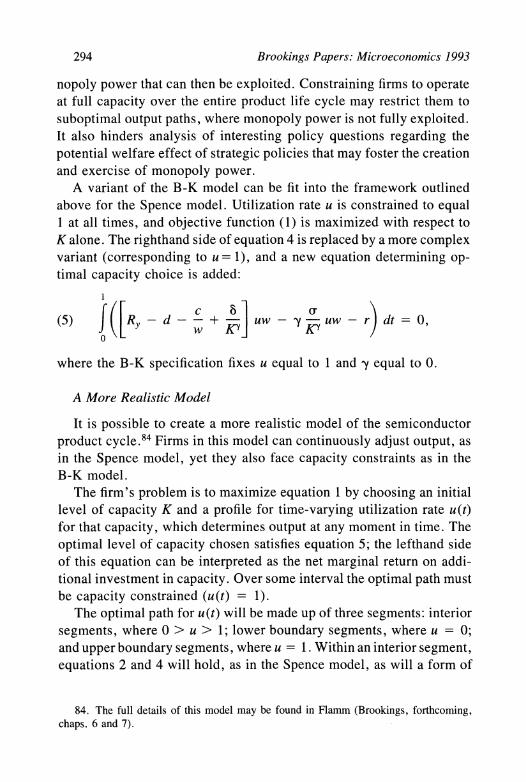
294 Brookings Papers: Microeconomics 1993
nopoly power that can then be exploited. Constraining firms to operate at full capacity over the entire product life cycle may restrict them to suboptimal output paths, where monopoly power is not fully exploited. It also hinders analysis of interesting policy questions regarding the potential welfare effect of strategic policies that may foster the creation and exercise of monopoly power.
A variant of the B-K model can be fit into the framework outlined above for the Spence model. Utilization rate u is constrained to equal 1 at all times, and objective function (1) is maximized with respect to K alone. The righthand side of equation 4 is replaced by a more complex variant (corresponding to u = 1), and a new equation determining op- timal capacity choice is added:
(5) R([ - d - - + - uw - y uw - r) dt = 0,
where the B-K specification fixes u equal to 1 and y equal to 0.
A More Realistic Model
It is possible to create a more realistic model of the semiconductor product cycle.84 Firms in this model can continuously adjust output, as in the Spence model, yet they also face capacity constraints as in the B-K model.
The firm's problem is to maximize equation 1 by choosing an initial level of capacity K and a profile for time-varying utilization rate u(t) for that capacity, which determines output at any moment in time. The optimal level of capacity chosen satisfies equation 5; the lefthand side of this equation can be interpreted as the net marginal return on addi- tional investment in capacity. Over some interval the optimal path must be capacity constrained (u(t) = 1).
The optimal path for u(t) will be made up of three segments: interior segments, where 0 > u > 1; lower boundary segments, where u = 0; and upper boundary segments, where u = 1. Within an interior segment, equations 2 and 4 will hold, as in the Spence model, as will a form of
84. The full details of this model may be found in Flamm (Brookings, forthcoming, chaps. 6 and 7).

Kenneth Flamm 295
forward pricing: marginal revenue will be held constant, set equal to current marginal cost less 6/KA-the marginal cost-reducing value (over the remainder of the product life cycle) of an additional unit of output- at the endpoint of this interval.
With additional assumptions, one can sharpen the characterization of the optimal behavior of a profit-maximizing firm. I assume a sym- metric industry equilibrium with N identical firms; an autonomous de- mand (that is, not an explicit function of time); and concavity of total industry revenues in industry output (as would be the case, for example, with a constant elasticity demand function and price elasticity exceeding unity). Though a Nash equilibrium in utilization rates is assumed for the moment, for expositional purposes I parametrize a firm's perceptions of other firms' reactions to changes in its output in terms of a constant, nonnegative conjectural variation. The two interesting cases that mo- tivate this parametrization are Cournot-Nash equilibrium (conjectural variation equal to 0) and a collusive, constant market share cartel (con- jectural variation equal to N - 1).85
Under these assumptions, optimal u must decline over an interior segment, and u must be continuous in time. Therefore, the optimal path of the utilization rate must look like an upper boundary segment, pos- sibly followed by an interior segment, possibly followed by a lower boundary segment. Along a lower boundary segment, where u = 0, 8 will be constant and therefore equal to its terminal value, 0. Thus, the Spence forward-pricing result of marginal revenue being set equal to terminal marginal cost will hold whenever we are producing but are not capacity constrained (that is, 0 < u < 1, along an interior segment).
Now assume that firm marginal revenue exceeds the initial value of current marginal cost as industry output approaches zero, so some pro- duction will always be profitable. This must be the case with a constant elasticity demand. We can then exclude the possibility of lower bound- ary segments occurring along the optimal path in a symmetric equilib-
85. The main behavioral assumption excluded by a nonnegative conjectural variation is Bertrand competition in prices. Because DRAMs are essentially a homogeneous com- modity sold in well-developed secondary spot markets, specifying that producers sell at a single market price and choose quantities sold is the natural assumption. Moreover, Kreps and Scheinkman (1983) have shown that in a two-stage game,where first-stage capacity investments are followed by a second-stage Bertrand game in prices and a particular ("ef- ficient") rationing rule, the outcome is a Cournot-Nash equilibrium in output.

296 Brookings Papers: Microeconomics 1993
rium. Note that nothing about the specific shape of the learning curve (function w)-beyond the fact that it is increasing in experience (WE >
0)-has been assumed in arriving at this characterization of optimal policy.
This model of the semiconductor product life cycle captures both the importance of capacity investments and the ability of firms to fully exploit what monopoly power they enjoy by varying utilization rates over time. It is simple enough to be empirically tractable. Firms will make some capacity investment, run at that capacity full blast for some period of time, then possibly switch to a constant output path (with constant marginal revenue, but decreasing utilization of capacity, as yields continue to rise) over the remainder of the product life cycle. I note parenthetically that a period of full-blast production during which yields rise very sharply is a pervasive feature of producer behavior in this industry and has been given its own special name: "ramp-up."
The model sketched out thus far takes the number of firms in the industry-which will affect profitability and pricing-as given. One natural way to close the model is to specify that firms enter the industry until rents earned by producers (the integrand in equation 1) just equal zero. The zero profit condition then determines N, the number of firms entering the industry. (I ignore the complications created if one insists that N be an integer.)
Further Assumptions
My next step is to take this simple control model and try and derive a particular firm's behavior over time. Let the time at which a firm switches from full-blast production to constant-output production be t, (with full-blast production over the entire product life cycle an important possibility). I approximate the learning curve by specifying that
(6) w(E) = fE%, with E(O) = Eo, 0 ' e ' 1.
Learning Economies
Equation 6 gives yielded chips per wafer, w, as a function of ex- perience, E. This functional form is best regarded as an approximation:

Kenneth Flamm 297
Figure 4. Empirical Approximation of the Learning Curve
Yielded chips per wafer
Empirical approximation
True learning curve
; ~~~~~~I I I I I
I Experience
Source: See text.
mass production typically starts at initially low yields; after a period, yields rise quickly, then flatten out in a pattern closer to a logistic curve.86 Analytical tractability is the grounds for selecting this approx- imation. Note that a "dummy" experience value Eo is used as an argument in the function to specify some initial nonzero yield. Without this constant, yields would stay at zero forever.87 The assumed ap- proximation to the "true" learning curve is depicted in figure 4. The approximation somewhat distorts yields, output, and pricing in the very earliest portion of the product cycle.
Defining "experience" raises additional issues. It is customary to use cumulative output as a proxy for experience in empirical studies,
86. For depictions of changes of wafer yields over time in DRAM production, see Integrated Circuit Engineering (1988, pp. 6-35); and Stapper and others (1982, p. 540).
87. Baldwin and Krugman use the same functional form but do not face the "stuck" yield problem because the argument in their learning curve is experience in processing gross wafers, not yielded good chips. Generally, industry practice in estimating learning curves is to use yielded good chips as the argument.

298 Brookings Papers: Microeconomics 1993
and most empirical studies of learning economies have taken this ap- proach. But using absolute, company-wide production experience as the determinant of any single facility's productivity implies that, say, ten facilities running in parallel produce the same yields at the end of a period as running a single facility to produce the same total output over a much longer period. In the semiconductor industry it is widely believed that improved manufacturing yields come from two main sources that are iterative and sequential: refinements of the operation of the production line (with each new refinement building on previous expe- rience) and die shrinks (reductions in the feature size for chip designs made possible by improved use of existing process equipment). That is, lessons learned from running a line over some period of time are then applied to refine the operation of that line over a subsequent period.
By this logic, if identical production lines are run in an identical fashion over the same period of time, then the same "lessons" are being learned, in parallel, on each line. Yields at the end of the period should be no higher than if only a single line were being run. Of course, if a new line-a line with less experience and lower yields-was put into operation after an older line had been running for some time, and if all the fruits of greater experience could be transferred across facil- ities, then the maximum experience on any one line would be the "experience" variable determining production yields. Because all in- vestment occurs at a single initial moment in my simple model, all lines will have identical production experience at any subsequent moment in time, and cumulative output per facility is the desired measure of ex- perience.
The lessons learned on different lines, however, may not be the same if completely different experiments in production refinement are being conducted at every production facility. If, once again, experience can be completely transferred across facilities, and there is no duplication in lessons learned in different facilities, then company-wide, absolute cumulative output, rather than cumulative output per facility, may be the relevant experience variable.88 Indeed, the transfer of experience across facilities is quite costly.89
88. Or perhaps even industry-wide cumulative output, if complete cross-company dif- fusion of the lessons of production experience occurs.
89. See Stapper and others (1982). "Thus, much of the accumulated knowhow with

Kenneth Flamm 299
A related issue is whether intercompany learning effects are signif- icant. Are yields influenced by not just one particular fab line or com- pany's experience, but by the experience of other companies? Such a specification would require substantial changes in the model developed here. However, empirical analysis of company data on IM DRAM production detailed elsewhere produced no evidence that such effects were significant.90
One way to parametrize these differences in the conceptualization of how learning economies work is to define experience as cumulative output divided by K7. Gamma takes on value 0 if absolute, company- wide cumulative output is the correct experience variable and value 1 if experience per facility (or unit capacity) is what is relevant.91 (With individual fab-line data-unfortunately unavailable-this hypothesis could actually be tested.) This means
= with some initial E(O) = Eo
defines E(t).92 My approach will be an agnostic one. I will solve the model using both 0 and 1 as possible values for y, and then I will ask
respect to semiconductor processing technology comes from a section where it cannot be documented. For this reason, when engineers are unable to travel, the transfer of technology becomes difficult." Ishihara and Wakabayashi (1991, p. 18).
90. Flamm (Brookings, forthcoming). 91. The relationship between this specification and the "per fab" and "per company"
specifications of learning effects may be sketched out as follows. Let Y be total company output; q, output per fab; K, company capacity; f, capacity per fab (plant size); m, number of fabs per company. The basic hypothesis is that E = q mW, with p an "appropriability" parameter taking on value 0 if only the plant's own experience is relevant to yields and value 1 if all company-owned plants' experience is relevant. Any intermediate degree of appropriability can be assumed by choosing the appropriate value for p. Since m =
K Y Y , and q = K then E = ( y) -, I - p. If capacity is measured in units such that
f approximately equals 1, then my assumed relationship holds as it stands. If not, rescale experience variable E as E' = YIK7 = E f-', and substitute for E in equation 6.
92. Note that an alternative specification might make cumulative output, or cumulative output per unit capacity, the state variable, subject to some initial value, and it might make this alternative state variable times K to some power the argument of w, the function giving yield per wafer. Such a specification, however, makes initial yield (with no experience) a function of the scale of capacity investment, which is undesirable. (In that case increasing or decreasing capacity simply to raise initial yield on every line will play an entirely artificial role in determining optimal capacity.)

300 Brookings Papers: Microeconomics 1993
which seems to predict more empirically plausible behavior. The "true" value almost certainly lies somewhere between these two extremes, but my judgment is that it should be substantially closer to 1. Parameter 'y plays a critical role in defining the nature of an industry equilibrium and resolves the B-K conundrum.93
Final Test and Assembly Yields
A tested, just-fabricated "good" die (one that has passed "probe" test) is not yet a finished integrated circuit (has not passed "final" test). The dice produced on the wafer fabrication line must then be assembled into a sealed package and subjected to a rigorous final testing process. While yields of good tested chips assembled from "good" dice may show some evidence of a "learning curve," the impact of learning in this stage of the IC production process is thought to be quite small relative to learning economies in the wafer fabrication phase of IC manufacturing. I will model assembly and final test yields by assuming a fixed yield of final good chips from "good" dice produced on the wafer fab line. Here v = (y, where v is "net" good, assembled, and tested ICs produced from quantity y of "gross" good dice yielded by wafer fabrication. 94
93. The empirical literature on learning curves gives us little help in deciding the correct specification. If data on cumulative output from a given facility, or aggregate data from a group of facilities with fixed capacities, are used to estimate the relationship y = w K using equation 6 (and Eo = 0 assumed), we get
Ln[y(t)] = a + E Ln[Q(t)].
The natural log of total output is a linear function of the natural log of cumulative output Q, even if cumulative output per unit capacity is the relevant experience variable. The effects of capacity size, K, have been absorbed into constant a. Data from different facilities of varying size within a single company, or from different companies, along with an additional variable controlling for capacity size, are required to identify and estimate 'y.
94. In other words, I will convert net, finished IC demand to a gross (defect-inclusive) demand for fabricated chips, then pose the optimization problem in terms of choosing a time path for wafer fab output y (as opposed to net output t y). I ignore the additional yield losses in the assembly and final test stages of production. (The critical assumption is that all "good" chips coming off the wafer fab line incur all the costs of assembly and final test before being culled again.) In interpreting the results, we divide all "gross" per unit cost and revenue measures (like price, marginal revenue, marginal cost) emerging from the optimization analysis by (, in order to get the "net" cost and revenue measures per good unit observed in the chip marketplace.

Kenneth Flamm 301
DRAM Demand
We must specify a demand function for DRAMs, and an industry structure, in order to calculate marginal revenue RyI I assume a constant elasticity demand function of the form
(7) z = otP,
where z is aggregate demand for DRAMs and P is DRAM price. With an industry made up of N identical firms, a firm's marginal revenue Ry is given by
(8) R + I
where parameter oa equals the conjectural variation plus one, divided by N, the number of firms. With Cournot-Nash competition, oa is 1/N, with a constant market share cartel, 1.
Plausible Parameter Values
The final step in my simulation of firm behavior was to decide on empirically plausible parameter values to be used in this model. A significant effort was devoted to constructing realistic and accurate parameter estimates.95 Table 3 shows the values used.
Note that my estimate of learning economies-an elasticity of about 0.5-is significantly larger than that used by Baldwin and Krugman. Multiple sources and empirical methods yielded a value in this neigh- borhood; indeed, B-K's own sources, when correctly interpreted, sug- gest a similar value.96 The estimate of IM DRAM own-price elasticity
95. For details, see Flamm (Brookings, forthcoming). 96. In DRAMs there are several published reports of an empirical 72 percent "learning
curve," meaning that current unit cost drops by 28 percent with every doubling of output, corresponding to E = 0.47. With a constant wafer-processing cost as the only cost element (the model which underlies these studies), we have
unit cost = E = (c)E - w
A learning elasticity E equal to 0.47 is solved from the 72 percent learning curve: 2 =
0.72. See Noyce (1977); U.S. Congress, Office of Technology Assessment (1983, p. 76). Engineers at IBM, on the basis of studies of production costs for IBM bipolar integrated circuits in the 1960s and 1970s, derived a virtually identical 71 percent learning curve. See

302 Brookings Papers: Microeconomics 1993
Table 3. Empirical Parameter Values
Symbol Parameter Assumed value
xoo "level" of life cycle demand for 190,000 million units assembled and tested units at $1 per chip
price elasticity of demand - 1.5
share of yielded good chips as fraction of 0.9 good dice after assembly and final test
(x level of demand for "gross" fabricated o(-(1+> dice (including units rejected at final test)
4) wafer fabrication yield, learning curve 31 "level" parameter
Eo initial "experience" at time 0 0.01
E experience elasticity of wafer fabrication 0.49 yield
ly (gamfna) parameter determining 0-1 experience variable
m overhead expense per dollar of direct 0.36 manufacturing cost
d package, assembly, and final test cost per $0.75 (1 + m) fabricated unit
c fabrication cost per processed wafer $390 (1 + m)
r capital cost per unit life cycle wafer- $240 (1 + m) processing capacity
Source: Author's calculations. See text.
13, again based on my own empirical research, was taken to be - 1.5, somewhat lower (in absolute value) than other estimates found in a sparse and rather inadequate published literature.97 A value of 190 billion was used as an estimate of product life cycle demand "level"
Harding (1981, p. 652). Webbink's 1977 survey of the integrated circuit industry notes that interviewed companies believed E to generally lie in the 0.32 to 0.52 range, depending on type of device. Webbink (1977, p. 52). Baldwin and Krugman appear to have erred in interpreting the number in the 1983 OTA study's report of a 72 percent learning curve. They assume that E = 0.28, when it actually corresponds to E = 0.47!
97. My empirical estimates of learning curve parameters are based on two types of data for the IM DRAM generation alone: engineering estimates of yielded chips over the five-year life of a "typical" IM DRAM fab and company-specific data on output over a five-quarter period when all facilities are believed to have been running at close to capacity.

Kenneth Flamm 303
ot.98 To transform this demand function to a demand for "gross" fab- ricated dice (prior to test and assembly losses), it was assumed that net output of tested and finished chips equals 0.9 times good dice produced in wafer fab.99 With the functional form assumed, a simple transfor- mation of a is merely substituted for its original value in order to derive the appropriate inverse demand function for "gross" chip output.100
Model Solution
Next, I briefly summarize the method used to solve numerically for an optimal policy. It is useful to categorize optimal policies in terms of two possibilities. One possibility is that full-blast production is fol- lowed by an "interior segment" where a firm is producing at less than full capacity. In this case an optimal policy boils down to picking both an optimal capacity K and some optimal time t, to switch from full- blast production to constant-output production. The second possibility is that the firm runs at full capacity throughout the product cycle. In this latter regime necessary conditions for the firm are used only to solve for an optimal capacity.
Optimal Output Decisions with Interior Segments
When the firm produces at less than full capacity, an optimal, profit- maximizing policy must set the difference between current marginal cost and marginal revenue equal to 6/K7, the value of an additional unit of current production in reducing future production costs over the re- mainder of the product cycle. As in the Spence model, marginal revenue along this interior segment will be constant, equal to terminal marginal
Both of these sets of data specific to the IM DRAM produce results that are quite close to other estimates in the literature, which sometimes rely on data pooled across generations.
98. This gives the demand that would be observed at a IM DRAM price of $1 over a twenty-quarter (five-year) product cycle, given real GNP and other price levels prevailing in 1989:4.
99. For estimated test and assembly yields in this general neighborhood, see VLSI Research (1990), addendum A; and Integrated Circuit Engineering (1988, pp. 7-16-7-17).
100. That is, P(tz)t = (tz/ot)"/t = (z/ot')", where ot' = (x -

304 Brookings Papers: Microeconomics 1993
cost. We can solve a differential equation giving experience at time ts, E(ts,K), after a period of full-blast production through optimal switch- point ts to an interior segment. Using this result, we can derive an equation giving ts as an implicit function of K, N, and other parameters of the control problem:
(9) [N tK 1 ( + 1
+ d. 4(E(ts,K) + 4K1`Y(1 - ts)E(ts,K)E)E
This is just the condition that marginal revenue at time ts (on the lefthand side) equal current marginal cost at terminal time 1 (on the righthand side). 101
A second equation giving optimal capacity may be derived from equation 5. After solving for 8 over interior and boundary segments, and substituting into equation 5, we have an expression implicitly giving K as a function of optimal ts and N. Together with equation 9, for given N, and various other parameters, we have two equations in two un- knowns. An optimal ts and K pair must solve these two equations.
Optimal Capacity with No Interior Segments
In many important cases the optimal path may not contain an interior segment. We therefore never switch from full-blast production, and u(t) will always equal 1. The transversality condition-equation 3-will still hold, however. Using this boundary value, we can solve an equation of motion for 8 and derive a version of equation 5, which implicitly determines K as a function of N and other parameters.
Since this expression gives us a necessary condition for optimal K assuming full-capacity utilization over the entire product cycle, we must ensure that such a path is, in fact, a Cournot-Nash equilibrium. In searching for Cournot-Nash equilibriums, I attempted to solve the two- equation system characterizing an optimal policy with interior seg- ments, for a ts and K pair, and the single equation giving optimal K
101. The expression within the outermost parentheses in the denominator on the right- hand side of equation 9 is experience at terminal time 1, after producing from ts to 1 at a constant output level.

Kenneth Flamm 305
assuming full capacity utilization throughout the product cycle. Solu- tions found were then checked as possible Cournot-Nash equilibriums by perturbing both firm capacity K and switching time ts by 0.01 in all feasible directions, while maintaining the hypothesized equilibrium out- put path for all other firms. The impact on firm profitability should be negative in a Cournot-Nash equilibrium. The procedure assures us that we have found a local maximum satisfying the first-order necessary conditions.
Simulations with different values of y are comparable. A specifi- cation has been chosen that starts at some given value for yield that is independent of capacity (and the assumed value for y). Note that with ,y equal to 0, the time derivative of E is greater than with y equal to 1, for given firm capacity. Also, for given company output, less ex- perience is realized with larger capacity (more plants) with 'y greater than 0. Both effects are precisely what one would expect. If learning operates at the firm level rather than at the plant level, yield-relevant experience should pile up faster for given output, and yields should rise more quickly. Similarly, if experience is not completely transfer- able across plants, dividing some given output up across more plants should reduce the yield-relevant experience derived from any given volume of company output.
Baseline Simulations
Table 4 gives the optimal values of ts and K derived from numerical solution of the optimal control problem described earlier. The roots of a system of two nonlinear equations in two unknowns described above, or one equation in one unknown (in the case where full-blast production over the product life cycle is the optimal policy), were sought. Table 4 also shows a "gross rent"-profits net of all costs, other than fixed entry cost F, received by each producer. The columns of table 4 cor- respond to different assumed numbers of firms in the industry, the rows to differing assumptions about parameter -y, which defines the experi- ence variable relevant to learning economies. Note that where gross rents are zero or negative, no producer will be earning a profit (exclusive of entry cost) in equilibrium, and the industry will be "overpopulated" with firms irrespective of the entry cost. (Strictly speaking, these entries
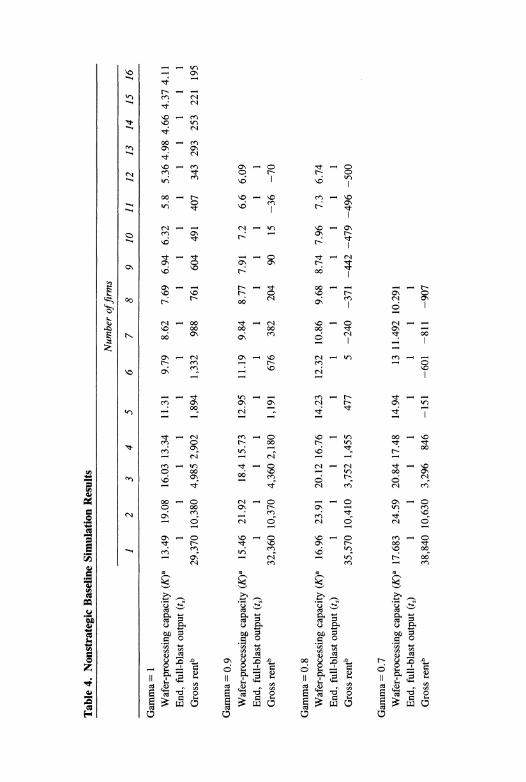
Table 4.
Nonstrategic
Baseline
Simulation
Results
Number of
firms
1
2
3
4
5
6
7
8
9
10
11
12
13
14
15
16
Gamma= 1
Wafer-processing
capacity
(K)a
13.49
19.08
16.03
13.34
11.31
9.79
8.62
7.69
6.94
6.32
5.8
5.36
4.98
4.66
4.37
4.11
End,
full-blast
output
(t)
1
1
1
1
1
1
1
1
1
1
1
1
I
I
I
I
Gross
rentb
29,370
10,380
4,985
2,902
1,894
1,332
988
761
604
491
407
343
293
253
221
195
Gamma =
0.9
Wafer-processing
capacity
(K)a
15.46
21.92
18.4
15.73
12.95
11.19
9.84
8.77
7.91
7.2
6.6
6.09
End,
full-blast
output
(t)
1
1
1
1
1
1
1
1
1
1
1
1
Gross
rentb
32,360
10,370
4,360
2,180
1,191
676
382
204
90
15
-36
-70
Gamma = 0 .8
Wafer-processing
capacity
(K)a
16.96
23.91
20.12
16.76
14.23
12.32
10.86
9.68
8.74
7.96
7.3
6.74
End,
full-blast
output
(t)
1
1
1
1
1
1
1
1
1
1
1
1
Gross
rentb
35,570
10,410
3,752
1,455
477
5
-240
-371
-442
-479
-496
-500
Gamma =
0.7
Wafer-processing
capacity
(K)a
17.683
24.59
20.84
17.48
14.94
13
11.492
10.291
End,
full-blast
output
(ti)
1
1
1
1
1
1
1
1
Gross
rentb
38,840
10,630
3,296
846
-151
-601
-811
-907

Gamma =
0.68
Wafer-processing
capacity
(K)a
17.73
24.56
20.86
17.53
15
13.07
End,
full-blast
output
(ti)
0.98
0.95
00.96
0.98
1
1
Gross
rentb
39,480
10,700
3,232
747
-258
-707
Gamma =
0.6
Wafer-processing
capacity
(K)'
17.77
24.4
20.81
17.57
15.11
13.22
End,
full-blast
output
(ti)
0.86
0.82
0.84
0.86
0.88
0.9
Gross
rentb
41,950
11,050
3,061
428
-619
-1,074
Gamma =
0.5
Wafer-processing
capacity
(K)a
17.57
23.82
20.45
17.39
15.04
13.23
End,
full-blast
output
(ti)
0.72
0.68
0.7
0.72
0.75
0.77
Gross
rentb
44,820
11,630
3,029
197
-924
-1,406
Gamma =
0.3
Wafer-processing
capacity
(K)a
16.69
22.06
19.18
16.53
14.46
12.86
End,
full-blast
output
(ti)
0.51
0.47
0.49
0.51
0.53
0.55
Gross
rentb
49,660
13,020
3,414
187
-1,120
-1,697
Gamma= 0
Wafer-processing
capacity
(K)a
14.88
19.02
16.82
14.76
13.12
11.83
End,
full-blast
output
(ti)
0.31
0.28
0.29
0.31
0.33
0.34
Gross
rentb
54,880
15,140
4,492
782
-796
-1,543
Source:
Author's
calculations.
See
text.
a.
Millions of
product-cycle
wafer
starts.
b.
Millions of
dollars.

308 Brookings Papers: Microeconomics 1993
should not be interpreted as Cournot equilibriums, since firms could do better by simply not producing at all.)
Since identical firms are assumed to make up the industry in equi- librium, one may close the model by assuming free entry, that firms enter the industry up to the point where gross rent per firm just covers the fixed cost of entry (F). Because I am restricted to an integer number of firms, I define the "equilibrium" as the number of firms where one more entrant reduces rent per firm below F. As a consequence of the integer number of firms, the symmetric equilibrium so defined will generally be characterized by some small positive rent (net of entry cost F).
I assume that the fixed entry cost (primarily total R&D costs) that must be invested before mass production of the 1M DRAM ran between $250 million and $500 million. Thus, for -y = 1, if entry costs F amounted to $250 million, we would expect to find fourteen identical firms in the industry, each with facilities capable of producing 4.66 million wafer starts over a five-year product life cycle. With entry costs F of $500 million, we would expect nine producers, each with capacity to produce 6.94 million product-cycle wafer starts. In either case, the optimal policy would involve full-blast production over the entire life cycle. Thus, with -y = 1 (which I argued earlier is a heuristically appealing specification), small differences in fixed entry costs can make a large difference in the industrial structure of the industry (number of firms observed). The same cannot be said for -y much less than 1.
Table 5 summarizes characteristics of industry equilibriums derived from table 4 under differing assumptions about fixed entry costs F. I have taken F as either $500 million or $250 million; these values are best interpreted as bracketing a range of feasible values. Alongside the equilibrium number of firms, the Hirschman-Herfindahl index of con- centration is also shown.102 Initial and final yields per wafer (w) and
102. This index is defined as
HHI = S i= 1
where si is the market share of company i. The index ranges in value from 1, with monopoly, to 0, with a competitive industry composed of an infinite number of equally sized firms. In the special case of N identical firms, this index is just equal to 1/N.

Kenneth Flamm 309
output per firm (y) are shown to better illustrate how parameter y affects the results.
These results may shed light on the issue of whether "dumping" is observed. 103 I have calculated observed prices and various cost concepts at 100 equally spaced points over the product life cycle. One useful cost concept is short-run marginal cost (SRMC), which in my model happens to be constant at any moment in time, coincides with average variable cost, and is equal to d + clw. This is the incremental current cost saved when output is reduced by one unit. Another important cost concept is fully allocated, long-run average cost (LRAC). To define this concept, I have assumed straight-line depreciation in spreading capital and fixed entry costs over the product life cycle: an equal amount of these fixed costs is allocated to every moment in time. Capital and fixed entry cost per unit is then calculated by dividing fixed costs cor- responding to time t by the number of units y(t) produced at that mo- ment. Adding average variable cost to average fixed cost, LRAC then equals d + clw + Fly + riuw. Multiplying LRAC by output at any instant, and summing these costs at every instant over the product cycle, gives the total cost of producing some time-varying path of output over the entire product cycle.
Assuming -y equals 1, price falls short of short-run marginal cost over the first 3 percent of the product life cycle, and it falls short of average cost over roughly the first third of the product cycle (see table 5). With -y equal to 0, price is less than marginal cost only at the beginning of the product cycle; price is less than average cost over two distinct periods: at the beginning and over roughly the second quarter of the product life cycle. Indeed, for all values of -y, given my as- sumptions about other parameter values, price falls short of marginal cost only at the beginning of the product cycle. Further perusal of this table makes clear, however, that the timing of periods of sales at less than average cost is quite sensitive to the specification of the experience variable. Depending on -y, such episodes can occur at the beginning of the product cycle, the middle, or the end, or in some combination of these sequences.104
103. See Flamm (1993) for a more complete discussion of this issue. 104. Alternatively, if one defines "dumping" as price below marginal cost, it is still

Table 5.
Symmetric
Industry
Equilibriumsa
Initial
Final
Segments of
product
cyclee
Hirschman-
Final
wafer
company
company
Price is
Price is
Number
Herfindahl
yieldb
output
ratec
output
rated
less
than
less
than
Gamma
of
firms
index
w(E(I))
y(O)
y(l)
SRMCf
LRAC9
F =
$500
miliionh
1.0
9
0.1111
442.4
22.5
3,070.1
0-0.03
0-0.32
0.9
6
0.1667
557.2
36.3
6,235.2
0-0.03
0-0.29
0.8
4
0.2500
758.5
54.4
12,712.6
0-0.02
0-0.19
0.7
4
0.2500
1,005.8
56.7
17,580.4
0-0.01
0-0.17 0.93-1.00
0.68
4
0.2500
1,063.2
56.9
18,283.4
0-0.01
0-0.16 0.87-1.00
0.6
3
0.3333
1,397.8
67.6
24,906.8
0-0.01
0-0.07
0.5
3
0.3333
1,796.8
66.4
27,263.7
0-0
0-0.05
0.3
3
0.3333
2,789.3
62.3
31,038.4
0-0
0-0.02 0.48-0.50
0
4
0.2500
4,321.3
47.9
28,019.6
0-0
0-0.01 0.24-0.63

F =
$250
million'
1.0
14
0.0714
442.4
15.1
2,061.5
0-0.03
0-0.35
0.9
7
0.1429
550.4
31.9
5,416.0
0-0.03
0-0.29
0.8
5
0.2000
735.1
46.2
10,460.6
0-0.02
0-0.24
0.7
4
0.2500
1,005.8
56.7
17,580.4
0-0.01
0-0.15 0.97-1.00
0.68
4
0.2500
1,063.2
56.9
18,283.4
0-0.01
0-0.15 0.91-1.00
0.6
4
0.2500
1,313.7
57.0
20,157.1
0-0.01
0-0.12 0.71-1.00
0.5
3
0.3333
1,796.8
66.4
27,263.7
0-0
0-0.05
0.3
3
0.3333
2,789.3
62.3
31,038.4
0-0
0-0.02 0.49-0.49
0
4
0.2500
4,321.3
47.9
28,019.6
0-0
0-0.01 0.25-0.58
Source:
Author's
calculations.
See
text.
a.
w(E(O)) is
yield of
good
chips
per
wafer
during
fabrication
process at
beginning of
product
cycle;
w(E(O)) is
3.25 in all
cases.
b.
Yield of
good
chips
per
wafer at
end of
product
cycle.
c.
Instantaneous
company
production
rate at
beginning of
product
cycle. In
millions of
chips
per
product
life
cycle.
d.
Instantaneous
company
production
rate at
end of
product
cycle. In
millions of
chips
per
product
life
cycle.
e.
Entire
product
cycle is
from
time 0 to
time 1.
f.
Short-run
marginal
cost.
g.
Long-run
average
cost.
h. F is
up-front
sunk
costs
independent of
output
levels.

312 Brookings Papers: Microeconomics 1993
Table 5 also shows that the value of y makes a big difference in the structure of a symmetric industry equilibrium. With cumulative output per facility (y = 1) determining relevant experience, a relatively large number of firms (nine to fourteen) populate the industry. With y much below 0.9, no more than three or four firms make up the industry.
Figure 5 shows the paths of price, marginal revenue, marginal cost, and average cost over time in the case where entry costs are $250 million. In figure 5-A, y equals 0; in figure 5-B, y equals 1.
Ironically, the specification of firm behavior in the B-K model- full-blast production over the entire product cycle-turns out to be optimal if parameter y is close to 1 (see table 4). The irony arises because the B-K model also specifies absolute cumulative output (y = 0) as the experience variable, and given realistic choices for other parameters, optimal behavior would then require cutting back produc- tion to levels below capacity after about the first third of the product cycle. Like Baldwin and Krugman, with Cournot and y = 0 assump- tions, my model predicts only a few firms will "fit" in the industry (though the number is larger than in B-K's simulations, in part because firms are not constrained to produce always at full capacity). With y equal to 1, though, the number of firms that "fits" roughly triples, giving a much more appealing prediction about industry structure. This suggests that the conundrum of Baldwin and Krugman is at least partly the result of their specification of learning economies.105
Reality Checks
How plausible are these simulations, and do they suggest anything about the realism of various assumptions about parameters? One straightforward way to evaluate the model is to compare the predicted industry structure with the observed industry structure. Figure 6 shows Hirschman-Herfindahl concentration indexes constructed from Data- quest estimates of annual producer shipments of various generations of DRAMs. 106 For virtually all generations of DRAMs, the concentration
possible for "dumping" to occur at the beginning or end of the product cycle. See Flamm (1993) for details on how to construct such an example.
105. Remember that Baldwin and Krugman looked at a different product (16K DRAMs), had a different cost model-only a single (fixed and variable) cost per wafer processed is considered-and used different parameter values.
106. Note that there were two distinct varieties of 16K DRAMs: one with a single-
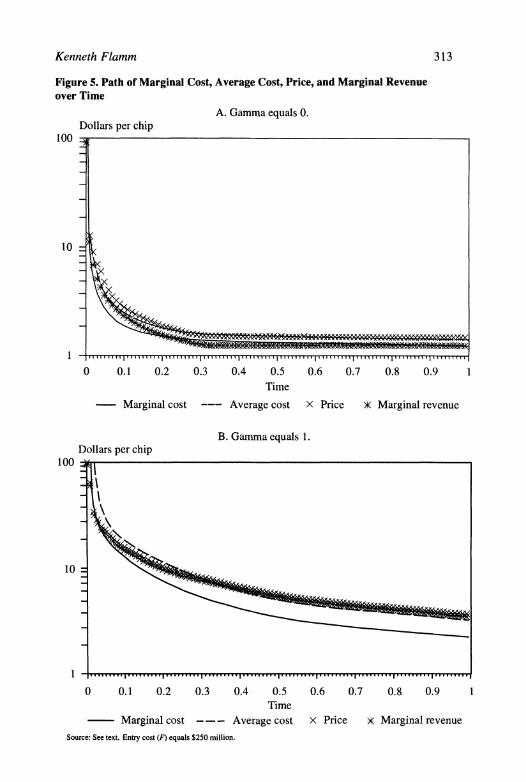
Kenneth Flamm 313
Figure 5. Path of Marginal Cost, Average Cost, Price, and Marginal Revenue over Time
A. Gamma equals 0. Dollars per chip
100 _
10
0 0.1 0.2 0.3 0.4 0.5 0.6 0.7 0.8 0.9 1 Time
Marginal cost --- Average cost X Price X Marginal revenue
B. Gamma equals 1. Dollars per chip
100 -
10
0 0.1 0.2 0.3 0.4 0.5 0.6 0.7 0.8 0.9 1 Time
Marginal cost --- Average cost X Price X Marginal revenue Source: See text. Entry cost (F) equals $250 million.

314 Brookings Papers: Microeconomics 1993
Figure 6. Hirschman-Herfindahl Indexes for Six Generations of DRAMs
Hirschman-Herfindahl indexes 0.5
0.45 1 - -
0.4 - ,
0.35
0.3 - - -
0.25 - - -,,,-- -
0.2
0 - I l l I II
0 500,000 1,000,000 1,50,000 2,000,000 2,500,000 3,000,000 3500,000 Cumulative industry output
(1,000 units)
z 4K DRAM + 16K two-voltage DRAM x 16K one-voltage DRAM o 64K DRAM A 256K DRAM - IM DRAM
Source: Dataquest, Inc. estimates of annual production by all merchant companies. Production by exclusively captive producers like IBM (with no sales on the open merchant market) is excluded.
index declines sharply from an initially very high level, as one producer after another comes on line with volume production. The index then levels off near 0.1 (corresponding to an industry made up of ten equally sized firms). It rises sharply at the end of the product cycle as producers one after another drop the product line. Although the early phases of
voltage power source, the other requiring dual voltages. Each is treated as a separate product in figure 6. In calculating concentration indexes for IM DRAMs, I have allocated Motorola- labeled product to Toshiba (since virtually all of Motorola's product over this period is believed to have been assembled from Toshiba-fabricated dice, or produced by a Toshiba- Motorola joint venture); IM DRAMs bearing the Intel label have been assigned to Samsung, since it is believed that virtually all of Intel's sales over this period were "private labeled" Samsung product. Neither of these adjustments has a particularly significant effect on the pattern of concentration.

Kenneth Flamm 315
Figure 7. Actual and Simulated Prices of 1-Megabit DRAMS
Dollars per chip 100
10
1- . . .,
1988:1 1989:1 1990:1 1991:1 1991:9 1993:1 Gamma = 1 X Japanese volume price + U.S. contract
-c- Nonstrategic, gamma= 0 x Strategic, gamma = 0 price
Source: See text.
the 256K and IM DRAMs may have been more concentrated than in the life cycle of earlier generations, they, too, seem destined to follow this pattern.
Now compare the Hirschman-Herfindahl indexes associated with my simulations with the pattern depicted in figure 6. Only the results as- sociated with the specification of cumulative output per facility (-y = 1) as the experience variable fit reasonably closely. Note that my as- sumption of symmetric firms means that the associated Hirschman- Herfindahl index of concentration must be constant over time. While conceding that my model is at best an approximation to reality, I con- clude that only a -y close to 1 yields predicted behavior that is reasonably accurate.
Another approach is to compare predicted and actual paths for DRAM prices over time. I assume that a five-year product cycle for the IM DRAM effectively began in 1988. (Although small quantities were produced late in 1985, quantity production did not really ramp up until 1988.) Figure 7 charts the actual behavior of one set of estimates of

316 Brookings Papers: Microeconomics 1993
large-volume contract prices for IM DRAMs in the U.S. and Japanese markets through September 1991, along with simulated IM DRAM price levels associated with an assumed -y equal to 1, and 0, respec- tively.107 Note that 1988 to the first quarter of 1989 was a period of extreme shortage in real-world DRAM markets, while the period after late 1989 was a period marked by lackluster demand. Given that the early portion of my empirical approximation to the learning curve is probably poorer than in later periods, and that my assumption of sym- metric firms is probably least appropriate in the early stages of the product cycle, I am not surprised to find the very earliest part of my predicted time path for prices seems least accurate. All things consid- ered, the simulation with -y equal to 1 seems to do a reasonable job of tracking real prices for IM DRAMs! The simulation with -y equal to 0 clearly does not. Thus, two pieces of evidence-observed and predicted concentration indexes, and the time path of DRAM prices-suggest that a value of -y close to 1 provides significantly more realistic pre- dictions than does a value close to 0.
Strategic Behavior
Next I allow for the possibility of noncooperative strategic behavior by producers. I think of competition as occurring in two periods. In the first period, firms make capacity investments. In the second period, firms select a time profile for capacity utilization rates. I assume that this two-stage game is characterized by subgame perfection. Given first- period capacities, the second-stage game in utilization rates results in a static Cournot-Nash equilibrium. When firms select first-period ca- pacities, however, they correctly anticipate the resulting second-stage equilibrium. But in the first period, rivals' capacity choices are per- ceived as unaffected by one's own capacity choice. Strategic interac- tions arise because first-period capacity choices correctly anticipate
107. These data are monthly averages of Dataquest estimates of average contract prices in these markets. See Flamm (NBER and Chicago, forthcoming).

Kenneth Flamm 317
effects on second-period utilization decisions by oneself and one's com- petitors. 108
The second-period subgame remains identical to that analyzed in the nonstrategic case. (I take capacities as given, and optimal utilization rates are exactly as analyzed earlier.) Thus, we need consider only how the determination of optimal capacity is changed. As before, I assume a symmetric equilibrium of identical firms. To do so, we must add an additional term to equation 5 that reflects the anticipated effects of increasing one's own capacity on second-stage outputs. Given the op- timal path for the utilization rate, u*(t), and the corresponding trajectory E*(t) for the experience variable, the necessary condition for optimal capacity choice is that
ax (10) R ( d + uw + Rx
-y uw - cu - r) dt = 0
must hold. This partial derivative is with respect to K alone, evaluated with u(t) set equal to optimal control u*(t). This differs from the expres- sion developed from equation 5 because in the nonstrategic case, initial capacity investments were not viewed by the firm as affecting rivals' second-period utilization decisions-that is, axIaK = 0 was assumed. With more than two firms in the industry and a symmetric equilibrium, concavity of the industry revenue function is sufficient to guarantee that rivals will reduce their output along an interior segment. The additional effect added on to equation 5 must be positive, which means that the marginal return on additional capacity will be positive at the level of investment corresponding to the nonstrategic equilibrium. With stra- tegic competition, additional capacity will seem attractive.
Along a boundary segment, however, the response by competitors to a marginal increase in one's own capacity will be 0. Intuitively, when a firm's marginal revenue already exceeds its true (corrected for
108. Another approach to strategic behavior would be to make capacity investments sequential, permitting "first-moving" firms to anticipate and preempt capacity investments by "follower" firms in a von Stackelberg-type model. A major component of such an approach would be to describe the economic basis for asymmetries among firms.

318 Brookings Papers. Microeconomics 1993
learning economies) marginal cost, so that it chooses to operate at maximum capacity, a small increase in a competitor's output-which reduces the firm's marginal revenue (with a concave industry revenue function)-will still leave the firm wishing to produce at maximum output. Thus, if the symmetric industry equilibrium is one in which firms are everywhere capacity constrained, producing full blast through- out the product cycle, the strategic equilibrium will coincide with a nonstrategic equilibrium. Strategic behavior will have no effect on the industry equilibrium.
Note that I am allowing only partially strategic behavior with this modeling strategy. There are two possible instruments of strategic be- havior: capacity choice and output (capacity utilization) choice. Output choice has potential strategic effects through learning economies, in- sofar as current output affects future cost structure. (Without learning economies, current output choice has no effect on future cost structure and therefore no strategic value.) A firm might choose capacity utili- zation, taking into account the impact of its own current output choice on rivals' future output choices, rather than taking rivals' future output path as given.
I do not allow strategic output choice, and output paths are chosen as an open loop (that is, firms precommit to an output path at the beginning of the second stage of the game).109 However, I do permit strategic competition in capacity. Firms do use capacity choice stra- tegically to affect rivals' choice of (open-loop) output path in the second stage of the game. Capacity choice in the first stage takes into account strategic effects in rivals' choice of open-loop output path in the second stage of the game. Thus, strategic competition is permitted in capacity choice but not in output choice.
Table 6 reworks table 4 to reflect strategic behavior. Equation 10 instead of equation 5 is used. If no solution for a system based on equations 9 and 10 was found, the alternative, corresponding to full- blast production throughout the product cycle, is identical to unmodified equation 5, since axIaK = 0 holds along a capacity-constrained seg-
109. Note that one possible (but only partial) empirical justification for this is that there are very long lags between capacity utilization decisions and output resulting from these decisions. The production process for a chip takes almost a full quarter, so any change in output rates is observable by one's rivals only after a substantial lag.

Kenneth Flamm 319
ment. In what I earlier tentatively concluded was the most realistic case (-y = 1), strategic behavior appears to have no effect on the symmetric industry equilibrium, and full-blast production throughout the product cycle still prevails. In the case of -y equals 0 (which had a substantial interior segment with nonstrategic behavior), capacity per firm increases by about 50 percent relative to the nonstrategic case, and the equilibrium number of firms drops from four to three, for the range of fixed R&D costs considered plausible. (The resulting path of DRAM price is also shown in figure 7.) Strategic behavior has no impact with the "per- fab-line" specification of learning but a large impact with "company- wide" learning.
For the same reasons outlined earlier, the -y = 1 case continues to appear most plausible. Having done my best to get realistic values for empirical parameters relevant to IM DRAM production, I conclude that strategic competition in capacity investments most likely play no sig- nificant role in shaping market outcomes in my simple model of the industry.
Collusion and Cartel
Now, finally, I can attempt to answer the question I posed at the beginning of the paper: what is the potential effect on U.S. consumers of the systematic exploitation of monopoly power by a foreign DRAM cartel? Suppose, for one reason or another, that country U firms believe their fixed sunk cost required to enter the industry (F) is higher than for country J firms. In other words, suppose that country U firms are less efficient producers than country J firms. In a competitive equilib- rium where entry ensures zero profits, only (more efficient) J firms will populate the industry. Country J firms alone then play the two-stage game I have described and select sunk capacity investments corre- sponding to the strategic (or nonstrategic) case.
After the first stage (capacity selection), but before the second stage (production), suppose an external force intervenes and changes the rules. The J firms are to be permitted-perhaps even encouraged-to form a cartel to reduce output and raise prices. How much will con- sumers of DRAMs lose? How much will producers of DRAMs gain?
Carry the argument a step further. Suppose J firms, if left to their

Table 6.
Strategic
Simulation
Results
Number of
firms
1
2
3
4
5
6
7
8
9
10
11
12
13
14
15
16
Gamma= 1
Wafer-processing
capacity
(K)a
13.49
19.08
16.03
13.34
11.31
9.79
8.62
7.69
6.94
6.32
5.8
5.36
4.98
4.66
4.37
4.11
End,
full-blast
output
(t)
1
1
1
1
1
1
1
1
1
1
1
1
I
I
I
I
Gross
rentb
29,370
10,380
4,985
2,902
1,894
1,332
988
761
604
491
407
343
293
253
221
195
Gamma =
0.9
Wafer-processing
capacity
(K)a
15.46
21.92
18.4
15.73
12.95
11.19
9.84
8.77
7.91
7.2
6.6
6.09
End,
full-blast
output
(t)
1
1
1
1
1
1
1
1
1
1
1
1
Gross
rentb
32,360
10,370
4,360
2,180
1,192
676
382
204
90
15
-36
-70
Gamma =
0.8
Wafer-processing
capacity
(K)a
16.96
23.91
20.12
16.76
14.23
12.32
10.86
9.68
8.74
7.96
7.3
6.74
End,
full-blast
output
(t)
1
1
1
1
1
1
1
1
1
1
1
1
Gross
rentb
35,570
10,410
3,752
1,455
477
5
-240
-371
-442
-479
-496
-500
Gamma =
0.7
Wafer-processing
capacity
(K)a
17.683
24.65
20.86
17.48
14.94
13
11.492
10.291
End,
full-blast
output
(ti)
1
0.98
0.99
1
1
1
1
1
Gross
rentb
38,840
10,590
3,277
846
-151
-601
-811
-907

Gamma =
0.68
Wafer-processing
capacity
(K)a
17.73
24.76
21.07
17.61
15
13.07
End,
full-blast
output
(ti)
0.98
0.94
0.95
0.98
0.997
1
Gross
rentb
39,480
10,580
3,056
676
-264
-707
Gamma =
0.6
Wafer-processing
capacity
(K)'
17.77
24.97
21.73
18.19
15.48
13.46
End,
full-blast
output
(t5)
0.86
0.79
0.79
0.82
0.85
0.88
Gross
rentb
41,950
10,630
2,289
-113
-963
-1,294
Gamma =
0.5
Wafer-processing
capacity
(K)a
17.57
24.9
22.29
18.69
15.89
13.8
End,
full-blast
output
(t)
0.72
0.64
0.62
0.65
0.69
0.72
Gross
rentb
44,820
10,880
1,614
-858
-1,643
-1,902
Gamma
0.3
Wafer-processing
capacity
(K)a
16.69
24.07
22.8
19.15
16.23
14.08
End,
full-blast
output
(t@)
0.51
0.4
0.36
0.4
0.44
0.47
Gross
rentb
49,660
11,840
1,108
-1,593
-2,399
-2,600
Gamma = 0
Wafer-processing
capacity
(K)a
14.88
22.11
22.65
19.03
16.04
13.87
End,
full-blast
output
(ti)
0.31
0.2
0.16
0.19
0.22
0.25
Gross
rentb
54,880
13,650
1,569
-1,508
-2,445
-2,746
Source:
Author's
calculations.
See
text.
a.
Millions of
product-cycle
wafer
starts.
b.
Millions of
dollars.

322 Brookings Papers: Microeconomics 1993
Table 7. Simulated Impact of Cartelization on DRAM Marketa
Strategic competition in capacity with
Competitive output Second-period
Unit choice cartel Change
Gamma = I b
tS, end full-blast output 1 0.237 P(1), final price dollars 3.77 9.37 Consumers' surplus billions of dollars 148.9 117.4 - 31.5 Industry net profits billions of dollars 0.045 4.564 4.5
Gamma = 0C tS, end full-blast output 0.16047 0.037 P(1), final price dollars 1.61 4.08 Consumers' surplus billions of dollars 287.9 186.4 - 101.5 Industry net profits billions of dollars 3.957 34.57 30.61
Source: Author's calculations. See text. a. Symmetric industry equilibrium assumed. b. F equals $250 million; N equals fourteen firms; and K equals 4.655 million product-cycle wafer starts. c. F equals $250 million; N equals three firms; and K equals 22.648 million product-cycle wafer starts.
own devices, are perfectly prepared to form a cartel on their own. This will require, however, that some "critical mass" of DRAM producers be type J firms. Then country U can prevent cartel formation by sub- sidizing entry by type U firms (that are assumed to be behaviorally, or legally, indisposed toward collusion). How much in subsidies should country U be willing to pay to insure against cartel formation?
Table 7 shows the loss to consumers and increased producer profits associated with a second-stage switch from a noncooperative Cournot- Nash equilibrium to cartel. Initial capacities are assumed to have been chosen as the first stage of the competitive game, with a competitive second stage anticipated. Now, however, conjectural variation param- eter a has been reset, in calculating the second-stage output path, from a competitive Cournot-Nash value of 0 to the collusive cartel value of 1.
The lost consumer surplus is very much larger than the profits gained by producers. 110 There are two reasons for this. First, fixed capital cost
110. In a constant elasticity demand curve, the total consumer surplus, CS, is given by ts
CS = -( [P(s)'+Os + (1 - ts)P(ts)1 +

Kenneth Flamm 323
per unit produced rises considerably when output is cut back sharply in the second stage relative to the "competitive" output levels for which capacity was initially chosen. Second, the existence of learning econ- omies means that when producers cut back output, they also raise their variable costs per unit over the remainder of the product cycle. Thus, much of what might have been additional monopoly profit, without scale and learning economies, is chewed up by higher unit costs incurred when output is reduced.
For example, in the case where Sy equals 1, a switch from competition to collusion in IM DRAM costs more than $30 billion in forgone consumer surplus over a five-year product cycle while producing mo- nopoly profits of only about $4.5 billion over the same period. (Note that at the height of the real-world shortage of IM DRAMs in 1988- 89, some estimated "excess" profits at $1 billion to $2 billion per year.11 1) Clearly, even if country U accounts for only 40 percent of final DRAM consumption, its consumers should be willing to pay $2 billion or so annually to prevent the formation of a cartel. Of course, there may be less costly ways to inhibit cartel formation by foreign producers. If governments can agree to enforce international antitrust standards, for example, and such norms are applied by foreign gov- ernments to their producers, the benefits of competition might be avail- able to U.S. consumers at no cost.
Conclusion
The model developed in this paper, despite its simplifications, does a tolerable job in tracking reality. My simulations of symmetric equi- libriums were extremely sensitive to the specification of the experience variable relevant to learning economies. This was to me quite unex- pected. Gratifyingly, my "per fab" specification of learning economies appears to solve the B-K puzzle: Cournot-Nash behavior, coupled to a reasonable empirical approximation to the costs of real-life DRAM
111. Flamm (1989, p. 21). These numbers cover 256K and IM DRAMs.

324 Brookings Papers: Microeconomics 1993
production, gives much more realistic predictions about industrial struc- ture.
The previous section on collusion and cartel raises some interesting questions. First, how realistic is my story? Is the cartel threat-and cartel insurance-or some lesser degree of collusion a serious possi- bility? Were the DRAM price and output manipulations of 1987-90 a transitory phenomenon, or has some threshold been crossed into a less competitive world of market sharing? Continued production cutbacks by Japanese producers since 1989 may suggest a break with pre-1986 patterns of firm behavior. In addition, efficiency differences between groups of firms could be tied to a story about intergenerational exter- nalities, where incumbents have lower costs because they are incum- bents.
Second, if the J firms can form a cartel, why not do so in the first stage and choose more profitable levels of capacity investments? My answer is that at this stage, entry by others will be stimulated if reduced capacity investments imply that positive rents will be earned. At the second stage new entry is no longer possible.
More importantly, there is the issue of whether cartel pricing would attract additional entrants in later plays of this game. This is a com- plicated matter, but one can construct at least the germ of an argument as to why entry by non-J firms might not occur. Let us imagine that nonincumbent U firms operate at a cost disadvantage (say in fixed entry cost) relative to incumbent J firms and that entry by a single nonin- cumbent is enough to completely disrupt the cartel. Imagine also that the capacity investment stage of this game is played as the first stage of a two-stage competitive game. (If it were apparent that the number of firms and levels of capacity set in the first stage were other than at competitive levels, such as to imply rents in the second stage, further entry by other firms presumably would be stimulated.) Then we have a terrible dilemma for the potential U entrant. If she doesn't enter, the J firms may form a cartel in the second stage, in which case she must sit and watch as others earn rents. If she does enter, however, she disrupts the cartel, guarantees competition in the second stage, and thus guarantees that she makes a loss in a zero-profit equilibrium (since she produces at a cost disadvantage relative to the rest of the population of firms).
Third, my consumer welfare calculation assumes that monopoly rents

Kenneth Flamm 325
are extracted by a cartel at arms length from a competitive user industry, which then passes on cost increases directly to final consumers. It is well known that if an input is not fixed in relation to output, a monopolist controlling the pricing of an input maximizes profit by integrating for- ward into the user industry that purchases that input, in order to avoid substitution away from the input."12 Since type J firms producing chips may also be systems producers, there would appear to be few barriers to this occurring in the long run. The welfare cost to final consumers would increase if this were to happen.
Fourth, what if an industry that consumes domestic chips is imper- fectly competitive and extracts rents from sales to foreign consumers? Would not this increase the welfare loss from a domestic standpoint, particularly if forward integration accompanies monopoly rent extrac- tion?
Fifth, the logic of anticartel insurance suggests that chip consumers as a group ought to be willing to subsidize entry by cartel-busting entrants. (The ill-fated U.S. Memories consortium, in which chip users proposed to fund entry into the DRAM business, comes to mind.) However, there will be a free-rider problem. All consumers gain from entry, whether or not they have paid for it. A government role might be needed to handle this "public good" aspect of entry.
Sixth, little attention has been paid to intergenerational externalities. Several firms, particularly NMB Semiconductor in Japan, entered the DRAM business in the mid-1980s with virtually no prior experience. This suggests that such externalities, if they exist, are not an insuperable barrier to entry.
All the details of the policy-related story I have told are extreme. The costs I have calculated probably should be regarded as an upper bound on the costs corresponding to a more realistic scenario. Is there a convenient way to parametrize less stark forms of behavior? In par- ticular, one might want to imagine most producers in a cartel, but with one or two "outsiders'" forming a competitive fringe and not cooper- ating with the cartel. With asymmetric firms, however, the character- ization of equilibrium paths becomes much more difficult.
1 2. Vernon and Graham (1971).

Comments and Discussion
Comment by Peter C. Reiss: During the past fifteen years, industrial organization economists have extensively used game-theoretic models to analyze monopoly practices. Although these models have influenced antitrust policy, they rarely provide practical policy advice. Consider, for example, predatory pricing. Economists still find it difficult to dis- tinguish between it and "tough" price competition. International trade economists also have used imperfect competition models to analyze strategic dumping. As with predatory pricing, economists find it difficult to distinguish between dumping and normal competition. We have not had much success defining either practice because it is difficult to quan- tify them and because we have few empirical studies describing these practices.
Ken Flamm's study of semiconductor trade policy advances our un- derstanding of the interplay between government policy and foreign and domestic competition. It contains two distinct contributions. First, it provides a historical analysis of the economic rationales underlying government trade policy. In particular, it describes the U.S. govern- ment's response to charges that the Japanese dumped early-generation DRAMs. Second, it develops game-theoretic models that assess how collusion by Japanese firms would affect domestic chip consumers.
The historical analysis uncovers several important lessons for poli- cymakers. One central message is that government intervention can both undermine and create strategic opportunities for foreign firms. A second is that domestic trade policies frequently encourage foreign firms to coordinate their activities, thereby increasing the likelihood of col- lusion. A third is that declining average costs and significant learning curves may encourage predation. A final lesson is that product inno-
326

Kenneth Flamm 327
vations may do more to redress trade imbalances than government price or output restrictions.
The historical discussion also reinforces the first paragraph's mes- sage. While there is circumstantial evidence that Japanese producers formed an export cartel, it is difficult to show that they engaged in predatory dumping. As Flamm notes, even noncooperative "normal" competitors may price below average cost when they have steep learning curves. Thus, low DRAM prices during the early eighties may simply have reflected the presence of substantial learning and scale economies. Unfortunately, his limited price data do not allow him to test this hypothesis against predatory hypotheses. Further, even if he could ac- cept a predatory hypothesis, it is not clear how one would use price and cost data to predict the likelihood of Japanese success absent U.S. government intervention. Although Flamm acknowledges these diffi- culties, he argues that indirect evidence favors the hypothesis that the Japanese tried to monopolize DRAM production.
In examining the evidence and U.S. policy, it is important to keep in mind the scope of the semiconductor industry. The industry has many firms and products. It also changed dramatically during the 1980s. Before 1980 most semiconductor makers were vertically integrated. They designed their chips, synthesized them, tested them, manufactured them, and consumed them. (Examples are IBM and NEC.) As the industry grew, chip technologies multiplied and firms became less in- tegrated. Much of Flamm's discussion focuses on DRAM manufactur- ing. Though DRAMs represent a significant fraction of all semiconductors, DRAM manufacturing historically has generated few rents. Thus, if the goal of U.S. policy was to preserve "the" semiconductor industry, an important first question is this: Is a manufacturing capability necessary for the United States to preserve its interests? One also must question whether monopolization was likely, given the presence of captive do- mestic manufacturers (for example, manufacturing within IBM).
The second half of the paper develops dynamic models to simulate what would happen to prices, output, and consumer welfare if Japanese firms had monopolized IM DRAMs. This is an interesting exercise primarily because it categorizes the economic and strategic factors that affect production decisions. I have some doubts, however, about the relation between these calculations and the earlier trade policy discus- sion. The open-loop model assumes that a cartel exists and is stable.

328 Brookings Papers: Microeconomics 1993
A more complete model would explain how a foreign cartel would arise and sustain itself, especially when foreign firms may not share knowl- edge. The model also does not explain how cost differences arose and how they would persist from one chip generation to the next. From a policy perspective, the presence of gray markets and competing pro- ducers in Korea and Taiwan also seems relevant. Finally, even if we believe the Japanese could sustain a manufacturing cartel, it is not clear that these calculations justify "anticartel insurance." Without knowing the form that government insurance would take, or how it might influ- ence firm behavior, we cannot guarantee that "insurance" would im- prove consumer welfare. To do this, we require separate calculations.
One striking finding that emerges from Flamm's calibration exercise is the sensitivity of losses to assumptions about experience. His results suggest that experience accrues relative to plant output and not total output. This conclusion has several interesting implications for policy. First, it implies that domestic firms may have incentives to centralize or specialize in production. Second, it suggests that government policy might better be directed toward improving process R&D spillovers among domestic firms. Such policies could increase domestic and for- eign competition, and consumer welfare. Ken Flamm's study no doubt will help us address these important questions.
General Discussion: Richard Gilbert noted the importance of product differentiation when developing policy affecting the semiconductor market. He said that most of the profits in the industry have been in proprietary technologies, such as the Intel iAPX and Motorola 68000 architectures. Nonproprietary technologies, such as DRAMs, have been very competitive. He said that many people are concerned that these commodity markets are state of the art and are important as "drivers" for the proprietary technologies, but it is still unclear whether this is actually the case.
Making analogies to U.S. policies designed to protect the auto in- dustry in the 1980s, Gilbert and Nancy Rose suggested that export restraints in the semiconductor case might be harmful or unnecessary. Rose said the experience with the auto industry had shown that voluntary export constraints might permanently alter the behavior of foreign firms. Japanese automakers adopted "voluntary" export restraints to avoid U.S. trade action. Their experience was so positive-that is, profita-

Kenneth Flamm 329
ble-that the restraints were extended after their initial expiration. The semiconductor case might be recast in the same light. After Japanese semiconductor firms aggressively cut their prices in the U.S. market, dumping cases brought against them led to reduced exports and higher prices. Eventually, according to Rose, Japanese firms began to expe- rience the benefits of less aggressive pricing. They developed, she said, a taste for high prices, which ultimately resulted in tacit collusion.
Gilbert argued that the U. S. auto industry was fighting for its survival when the voluntary export restraint program was instituted. In contrast, the U.S. semiconductor industry today is relatively healthy, investing more than the Japanese and possessing process technology as good as anywhere else in the world.
Gilbert also said there was no evidence of cartel behavior by Japanese or other foreign DRAM producers. He attributed the price rise in the late 1980s to the voluntary export restrictions brought about by the 1986 agreement in combination with a simultaneous explosion of growth in the personal computer market-in other words, a coincidental supply decrease and demand increase.
Frank Wolak argued that there are two ways to view the very slow gains in market share U. S. semiconductor manufacturers have achieved in the Japanese market. The first and most widely held view is that U.S. firms have been denied market access by Japanese trading practices and government policies. However, by looking at the rapidly growing volume of sales by U.S. firms in Japan, a second, more optimistic view emerges: the U.S. firms have obtained an increasing share of an ever- expanding Japanese domestic market.
Several participants suggested improvements in the author's model specifications. Linda Cohen noted that the history section of the paper discussed the unusually short product life cycles as well as the tre- mendous movements in international market shares. She said these market characteristics were critical and should be incorporated into the model. The short product cycle, she argued, seemed to mean that gov- ernment policy in the field might always be playing catch-up. She also noted that although the author's model presented a two-step game, there was a repetition of two-step games, where capacity could be invested in every other period.
Roger Noll asserted that the history section of the paper argued for a model with endogeneity of trade policy. Consider a two-period model,

330 Brookings Papers: Microeconomics 1993
where the behavior of firms in one period determines the likelihood that a policy would be enacted in the second period that would facilitate the formation of a cartel, Noll said. It might be rational for Japanese firms to engage in predatory behavior in the first period if the U.S. government would then encourage them to collude in the second. With this model, Noll claimed, if the U.S. adopted a technology policy during the first period that allowed American firms to coordinate their R&D decisions, then less R&D and less investment in fixed costs might be possible. This would heighten the probability that a policy encouraging collusion would be introduced in the second period.
Wolak suggested adding strategic use of capacity to Flamm's model. He said that a firm's timing of plant construction relative to that of its competitors is crucial to the market success of the semiconductors it produces. He gave the example of the one megabit DRAM market, where the speed and volume at which Japanese firms constructed and began producing from their plants precluded all but a small amount of U.S. production in this DRAM generation. He also suggested that the model should account for product heterogeneity, noting that the re- surgence of the U.S. semiconductor producers could, in large part, be attributed to U.S . firms specializing in high value-added products, such as microprocessors, while the Japanese focused largely on commodity semiconductor markets.
Wolak also said that one argument omitted from the historical section of the paper was the necessity for U.S. firms to remain in the semi- conductor market in order to maintain U . S. leadership in semiconductor manufacturing equipment. Finally, he noted that some agreements be- tween foreign and domestic firms were exempted from U.S. antitrust laws under the Noerr-Pennington doctrine. Because those exemptions appeared to make coordination of pricing decisions between foreign and domestic producers easier, he felt that policy in this area should be redesigned.

Kenneth Flamm 331
References
Baldwin, Richard E., and Paul R. Krugman. 1988. "Market Access and In- ternational Competition: A Simulation Study of 16K Random Access Mem- ories." In Robert C. Feenstra, ed., Empirical Methods for International Trade, pp. 171-97. Cambridge: MIT Press.
Borrus, Michael. 1990. "Chips of State." Issues in Science and Technology 7 (Fall): 44.
Dick, Andrew R. 1991. "Learning by Doing and Dumping in the Semicon- ductor Industry." Journal of Law and Economics 34 (April): 133-59.
Dixit, Avinash. 1986. "Comparative Statics for Oligopoly." International Economic Review 27 (February): 107-22.
Finan, William F., and Chris B. Amundsen. 1986a. "An Analysis of the Effects of Targeting on the Competitiveness of the U.S. Semiconductor Industry." Paper prepared for the Office of the U.S. Special Trade Representative, Department of Commerce and Department of Labor. Washington: Quick Finan and Associates.
. 1986b. "Modelling U.S.-Japan Competition in Semiconductors." Journal of Policy Modeling 8 (Fall): 305-26.
Flamm, Kenneth. 1985. "Internationalization in the Semiconductor Industry." In Joseph Grunwald and Kenneth Flamm, The Global Factory: Foreign Assembly in International Trade, pp. 38-136. Washington: The Brookings Institution.
. 1989. "Policy and Politics in the International Semiconductor Indus- try." In Semiconductor Materials and Equipment Institute, SEMI ISS Sem- inar. January 16. Newport Beach, Calif.: SEMI.
. 1990. "Semiconductors." In Gary Clyde Hufbauer, ed., Europe 1992: An American Perspective, pp. 225-92. Washington: The Brookings Insti- tution.
. 1993. "Forward Pricing Versus Fair Value: An Analytical Assessment of 'Dumping' in DRAMs." In Takatoshi Ito and Anne 0. Krueger, eds., Trade and Protectionism. Chicago: National Bureau of Economic Research and University of Chicago Press.
. Forthcoming. "Measurement of DRAM Prices: Technology and Mar- ket Structure." In Murray F. Foss, Marilyn Manser, and Allan Young, eds., Price Measurements and Their Uses. Chicago: National Bureau of Economic Research and University of Chicago Press.
. Forthcoming. Mismanaged Trade: Strategic Policy and the Semicon- ductor Industry. Washington: The Brookings Institution.
Fudenberg, Drew, and Jean Tirole. 1983. "Learning by Doing and Market Performance." Bell Journal of Economics 14 (Autumn): 522-30.
Harding, William E. 1981. "Semiconductor Manufacturing in IBM, 1957 to

332 Brookings Papers: Microeconomics 1993
the Present: A Perspective." IBM Journal of Research and Development 25 (September): 647-58.
Helpman, Elhanan, and Paul R. Krugman. 1989. Trade Policy and Market Structure. Cambridge: MIT Press.
Howell, Thomas R., Brent L. Bartlett, and Warren Davis. 1992. Creating Advantage: Semiconductors and Government Industrial Policy in the 1990s. San Jose: Semiconductor Industry Association and Dewey Ballantine.
Integrated Circuit Engineering. 1988. Mid-Term 1988. Scottsdale, Ariz.: ICE.
1989. Mid-Term 1989. Scottsdale, Ariz.: ICE.
Ishihara, Noboru, and Hideki Wakabayashi, with Makoto Sumita. 1991. "The Semiconductor Industry in the 1990s." Tokyo: Nomura Research Institute. July 26.
Kimura, Yui. 1988. The Japanese Semiconductor Industry: Structure, Com- petitive Strategies, and Performance. Greenwich, Conn.: JAI Press.
Kreps, D. M., and J. A. Scheinkman. 1983. "Quantity Precommitment and Bertrand Competition Yield Cournot Outcomes." Bell Journal of Economics 14 (Autumn): 326-37.
Krishna, Kala. 1988. "Comment on 'Market Access and International Com- petition'." In Robert C. Feenstra, ed., Empirical Methods for International Trade. Cambridge: MIT Press.
Krugman, Paul R. 1984. "Import Protection as Export Promotion: International Competition in the Presence of Oligopoly and Economies of Scale." In Henryk Kierzkowski, ed., Monopolistic Competition and International Trade, pp. 180-93. Oxford: Clarendon Press.
Mason, Mark. 1992. American Multinationals and Japan: The Political Econ- omy of Japanese Capital Controls, 1899-1980. Cambridge: Harvard Uni- versity Press.
Nakagawa, Yasuzo. 1985. Semiconductor Developments. Tokyo: Diamond Publishing.
Noyce, Robert N. 1977. "Microelectronics." Scientific American, 237 (Sep- tember): 62-69.
Semiconductor Industry Association. 1983. The Effect of Government Target- ing on World Semiconductor Competition: A Case History of Japanese In- dustrial Strategy and Its Costs for America. Cupertino, Calif.
. 1990a. Antidumping Law Reform and the Semiconductor Industry: A Discussion of the Issues. Cupertino, Calif., February.
. 1990b. Four Years of Experience Under the U.S.-Japan Semicon- ductor Agreement: "A Deal Is a Deal." San Jose, November.
Shapiro, Carl. 1989. "Theories of Oligopoly Behavior." In Richard Schma- lensee and Robert D. Willig, eds., Handbook of Industrial Organization, vol. 1, pp. 330-414. New York: North-Holland.

Kenneth Flamm 333
Spence, A. Michael. 1981. "The Learning Curve and Competition." Bell Journal of Economics 12 (Spring): 49-70.
Stapper, C. H., and others. 1982. "Evolution and Accomplishments of VLSI Yield Management at IBM." IBM Journal of Research and Development 26 (September): 532-44.
Tilton, John E. 1971. International Diffusion of Technology: The Case of Semiconductors. Washington: The Brookings Institution.
Tirole, Jean. 1988. The Theory of Industrial Organization. Cambridge: MIT Press.
Tyson, Laura D'Andrea. 1992. Who's Bashing Whom? Washington, D.C.: Institute for International Economics.
Vernon, John M., and Daniel A. Graham. 1971. "Profitability of Monopoli- zation by Vertical Integration." Journal of Political Economy 79 (July- August): 924-25.
U.S. Congress. Office of Technology Assessment. 1983. International Com- petitiveness in Electronics. GPO.
. 1991. Competing Economies. GPO.
U.S. International Trade Commission (USITC). 1979. Competitive Factors Influencing World Trade in Integrated Circuits, publication no. 1013. No- vember.
U.S. Tariff Commission (USTC). 1974. Trade Barriers, pt. 2. Nontariff Bar- riers, vol. 5 of 11.
VLSI Research. 1990. Depreciation Schedules: Their Impact on the Interna- tional Competitiveness of Semiconductor Manufacturers. San Jose, Calif.: VLSI Research.
Webbink, Douglas W. 1977. Staff Report on the Semiconductor Industry. Washington: Bureau of Economics, Federal Trade Commission.
Wiemer, K. C., and J. R. Burnett. 1992. "The Fab of the Future: Concept and Reality." Semiconductor International (July): 96-98.
Willig, Robert D. 1992. "The Economic Effects of Antidumping Policy." Paris: OECD. Unpublished.
Wilson, Robert W., Peter K. Ashton, and Thomas P. Egan. 1980. Innovation, Competition, and Government Policy in the Semiconductor Industry. Lex- ington, Mass.: Lexington Books.