Embed Size (px)
Citation preview
Semiannual Financial Report
The 39th Fiscal Period
(From December 1, 2020 to May 31, 2021)
HEIWA REAL ESTATE REIT, Inc.
9-1, Nihonbashi-kabutocho, Chuo-ku, Tokyo

Message from the Executive Director
On behalf of HEIWA REAL ESTATE REIT, Inc., I would like to express our sincere appreciation for your continued
patronage and support.
Let me start by extending our sympathy to all those who have contracted COVID-19 and offer our heartfelt prayers
for their speedy recovery.
COVID-19 cases have continued to spread since 2020 and a state of emergency was declared twice during the fiscal
period under review that ended May 31, 2021, creating a challenging external environment. Meanwhile, the portfolio
of the Investment Corporation has achieved steady growth, even in these conditions.
The average occupancy rate of office properties during the period was 98.8%, and the rent revision rate of existing
tenants rose 5.15%. COVID-19 had some impact, including the postponement of rent negotiations while a state of
emergency was in effect. However, having a small number of tenants in the restaurant business, a limited impact from
the increase in telecommuting, and a new JR Yamanote Line station, Takanawa Gateway Station, established in the
area of properties held by the Investment Corporation contributed to a high occupancy rate throughout the fiscal
period.
Demand for residential assets clearly recovered, particularly among companies. While rents for some properties are
adjusted in areas in which the recovery in demand remains weak, a steady recovery is observed in Japan overall. The
average occupancy rate during the fiscal period was 96.7%, and the rent revision rate of existing tenants rose 1.12%.
In addition, activities such as the acquisition of new properties, posting of a gain on sale of assets, and reduction of
financial costs contributed to an increase in distribution per unit of ¥120 from the previous period to ¥2,800.
At the beginning of the 40th fiscal period ending November 30, 2021, that follows the period under review, we made
a follow-on offering for the first time in approximately five and a half years. Our efforts to raise investor value,
including the follow-on offering, were recognized and we were able to receive strong demand of approximately 29
times the number of new investment units issued. The Investment Corporation was included in the FTSE EPRA
Nareit Global Real Estate Index Series widely adopted by foreign investors as their benchmark, and its rating outlook
was raised from “A+ stable outlook” to “A+ positive outlook.” We will aim for an even higher rating and strive to
further increase our market capitalization and liquidity and improve our appeal to a wide range of investors, including
foreign investors and regional financial institutions.
Recently, public interest in ESG has been growing rapidly. The Asset Management Company established a
sustainability committee as an organization that will accelerate the ESG activities of the Investment Corporation and
examine how such activities contribute to the environment, local communities, and investors’ profit. To begin with,
we will aim to replace electric power used at all of our properties with renewable energy by November 2021.
We would appreciate it if you could pay attention to the future growth and efforts of the Investment Corporation.
2

1. Overview of asset management
(1) Summary of asset management during the 39th fiscal period
The REIT is striving based on its Basic Philosophy of “Steady Growth of Assets Under Management” and “Stable
Medium- to Long-Term Profits,” as well as “cooperation with and use of the Heiwa Real Estate Group” (below,
collectively referring to Heiwa Real Estate Co., Ltd. [below, “Heiwa Real Estate”] and the subsidiaries of Heiwa Real
Estate; the same hereinafter) to manage its assets with the purpose of maximizing investor’s value. Following is a
summary of our asset management during the 39th fiscal period.
(i) Brief background of the REIT
Investment units in the REIT have been listed on the Real Estate Investment Trust Section (J-REIT Section) of the
Tokyo Stock Exchange (below, TSE) since March 8, 2005 (Securities Code: 8966). Between then and the start of the
fiscal period under review, the REIT executed a capital increase through public offering and underwriting of new
investment units issued through private placement on several occasions, an investment unit split and investment unit
issuance through a merger with Japan Single-residence REIT Inc. on October 1, 2010 (below, this event is referred
to as the merger) and a cancellation of treasury investment units on September 29, 2020. As a result, total investment
units outstanding were 999,933 and unitholders' capital was 81,370 million yen as of the end of the 39th fiscal period
(May 2021).
(ii) Operating environment
Under the effects of COVID-19’s spread, moves that restrained economic activities continued in Japan in the fiscal
period under review, including the declaration of a state of emergency in areas centered on large cities on two
occasions and subsequent extensions. Infections with more contagious variants are also spreading. The situation
remains unpredictable. Overseas trends also appear to require attention, given lingering uncertainty about overseas
economies due to the prolonged stagnation of economic activities connected with U.S.-China trade friction and
COVID-19’s spread.
In this environment, the TSE REIT index remained in a situation in which was difficult for the index to rise due to
the COVID-19 pandemic. However, REITs that were slow to recover were bought in reaction to reduced upward
pressure on interest rates that resulted from the Bank of Japan’s announcement of its policy to keep interest rates low.
As a result, the TSE REIT index returned to 2,000 points, the pre-pandemic level on March 6, 2020, for the first time
in 12 months. The TSE REIT index continued to surpass 2,000 points, rising from 1,687.98 points at the end of the
previous fiscal period (November 30, 2020) to 2,073.55 points at the end of the fiscal period under review (May 31,
2021).
(a) Office building leasing market
According to the latest office building market data from Miki Shoji Co., Ltd., the average office building vacancy
rate in the five central wards of Tokyo (Chiyoda, Chuo, Minato, Shinjuku and Shibuya) rose for 15 consecutive
months from March 2020, reflecting sustained conditions that made it difficult to proceed with contract conclusion,
in addition to the impact of tenant contract cancellations chiefly due to an increasingly rapid shift to working from
home, and office downscaling and consolidation based on corporate concerns about the business outlook under the
pandemic. As a result, the average office building vacancy rate in the area rose from 4.33% at the end of the previous
fiscal period to 5.90% at the end of the fiscal period under review, topping the 5% mark for the first time since June
2015. Meanwhile, the average rent fell for 10 consecutive months from August 2020, plunging from 22,223 yen/tsubo
at the end of the previous fiscal period, to 21,249 yen/tsubo at the end of the fiscal period under review.
COVID-19’s impact on office building market conditions is becoming increasingly visible. Concerns over the
deterioration in market conditions are growing, with tenants showing signs of downscaling their operations or
canceling their contracts nationwide. COVID-19’s spread affected occupancy rates for office building assets in the
REIT’s portfolio. However, the pandemic’s effects were limited. The occupancy rates remained at high levels. Both
new and continued rents were revised upward. A moderate uptrend continued for the average unit rent in spite of the
pandemic.
3

(b) Residential leasing market
According to At Home Co., Ltd., the average condominium contract rent in major cities across Japan (nine areas
including the metropolis of Tokyo, three surrounding prefectures, Sendai City, Nagoya City, Osaka City and Fukuoka
City) declined conspicuously in the area zone of 30m2 or less in May 2021. The average contract rent fell year on
year in seven areas excluding Kanagawa Prefecture and Chiba Prefecture. However, the average contract rent kept
rising in the area zone in excess of 70m2. The rent reached the highest level since January 2015 in the metropolis of
Tokyo, Kanagawa Prefecture, Nagoya City and Fukuoka City. According to the Survey Report on the Statistics of
Construction Starts published in May 2021, the number of new housing starts (rental housing) decreased for 30
consecutive months until February 2021. However, the number of new housing starts took an upward turn in March
2021 and increased for three consecutive months from that point. With supply stabilizing as in the previous fiscal
period, demand and supply remained stable. However, the number of move-ins decreased with the spread of COVID-
19. Rental housing demand appears somewhat weaker. The occupancy rate for residential assets in the REIT’s
portfolio remained stable in the fiscal period under review attributable to various measures taken. The impact of
deteriorating economic conditions was limited. Their effects on short-term operations are assumed to be insignificant.
(c) Real estate
According to publicly assessed land values as of January 1, 2021, which were published in March 2021, the average
prices for all types of land, prices for land in residential areas, and prices for land in commercial areas in Japan’s
three major metropolitan areas dropped for the first time in eight years, since 2013. Prices for land in industrial areas
rose for the seventh consecutive year, but the rate of increase was lower. Likewise, the average prices for all types of
land, prices for land in residential areas and prices for land in commercial areas took a downward turn in regional
areas. Prices of land in industrial areas rose, but the rate of climb fell. In government ordinance-designated regional
cities, which the REIT considers as its investment targets, prices of land in both residential and commercial areas
rose at lower rates or took a downward turn. Market conditions for land prices in those cities appear weaker.
Demand appears to have weakened with uncertainty about the future under COVID-19’s effects, causing prices in
general to increase at reduced rates or begin to fall. This situation has become prolonged. Real estate market
conditions appear to require continued monitoring.
(iii) Management performance
(a) External growth
The REIT acquired one office building (Of-46 TORYO BUILDING [real estate, acquisition price: 2,501 million yen])
on December 17, 2020, and two residences (Re-93 HF HAKATA-HIGASHI RESIDENCE II [real estate, acquisition
price: 1,198 million yen] and Re-94 HF FUKUOKA RESIDENCE EAST [real estate, acquisition price: 1,180 million
yen]) on March 24, 2021, and sold one residence (Re-37 HF TAKANAWA RESIDENCE [trust beneficiary rights,
acquisition price: 749 million yen]) on January 22, 2021, aiming to improve the profitability and quality of its
portfolio. In addition, the REIT acquired one office building (Of-38 ACROSS SHINKAWA BUILDING [trust
beneficiary rights, acquisition price: 500 million yen]) on March 19, 2021 to raise its building ownership ratio to
34.51%, and another office building (Of-45 KABUTO-CHO UNI-SQUARE [trust beneficiary rights, acquisition
price: 1,480 million yen]) on March 23, 2021 to own the building completely.
As a result, portfolio assets as of the end of the period were 109 properties (total acquisition price: 184,136 million
yen), including 33 office buildings (total acquisition price of 82,902 million yen) and 76 residential buildings (total
acquisition price of 101,234 million yen).
(b) Internal growth
The REIT has consistently endeavored to increase profitability by improving and maintaining its occupancy rates.
During the 39th fiscal period, the REIT continued to be engaged in tenant leasing activities, working to shorten
vacancy duration as well as systematic efforts to increase its investment value based on tenant needs and the
characteristics of each individual property. Supported by these and other initiatives for maintaining and improving
the competitiveness of its assets, the occupancy rate for all properties held by the REIT came to 97.4% at the end of
the fiscal period under review. The REIT was able to stabilize the occupancy rate, which had reached 97.9% at the
end of the previous fiscal period, at a high level throughout the fiscal period under review. The average month-end
occupancy rate for the period under review stood high at 97.5%.
4

(iv) Procurement of funds
The REIT issued the Sixth Series of Unsecured Investment Corporation Bonds (total issue value: 1,500 million yen)
on November 25, 2020 for the purpose of establishing a stronger financial base by extending the term for interest-
bearing liabilities, dispersing repayment dates and diversifying financing methods. Using funds raised in that way,
the REIT prepaid Term Loan 45 (loan amount: 1,100 million yen) on December 11, 2020.
The REIT took out Term Loan 49 (loan amount: 1,000 million yen) on December 17, 2020, and Term Loan 50 (1)
(loan amount: 1,000 million yen) and Term Loan 50 (2) (loan amount: 1,000 million yen) on March 24, 2021 to use
the money for property acquisition and the like. In addition, the REIT took out Term Loan 51 Tranche A (loan amount:
225 billion yen), Tranche B (loan amount: 3,559 million yen) and Tranche C (loan amount: 1,000 million yen) on
May 31, 2021 to repay Term Loan 22 Tranche B (loan balance: 1,000 million yen) and Term Loan 23 Tranche A (loan
balance: 3,784 million yen), the principal repayment of which was due on the same date.
An overview of the loans is provided below. These loans enabled the REIT to reduce the concentration of redemption
dates (average borrowing period as of May 31: 7.1 years; average remaining period: 4.0 years) while at the same time
achieving the borrowing cost at a low level (average borrowing interest rate as of May 31: 0.75%).
Taking a further step, the REIT established a commitment line with a maximum loan amount of 7,000 million yen
with Sumitomo Mitsui Banking Corporation, MUFG Bank, Ltd., Mizuho Bank, Ltd. and Resona Bank, Ltd. to secure
financial creditworthiness by increasing the means of flexible and stable financing and liquidity on hand. (The
original contract period was June 1, 2020 to May 31, 2021. The period was revised to June 1, 2021 to May 31, 2022
on May 26, 2021).
As a result, the total interest-bearing liabilities amount (Note) at period end was 88,067 million yen (period end LTV
(Note): 46.11%).
(Note) Interest-bearing liabilities = Short-term loans + Long-term loans due within one year + Investment corporation bonds + Long-term loans Closing ratio of interest-bearing liabilities to total assets = Closing amount of interest-bearing liabilities / Closing amount of total assets × 100
(v) Performance and distributions
The management described above led to 39th fiscal period results of 6,730 million yen in operating revenues, 3,309
million yen in operating income, after deducting interest expenses on loans, 2,916 million yen in ordinary income,
and 2,916 million yen in net income. With respect to the distribution of monies (“distributions”) stipulated in Article
137 of the Act on Investment Trusts and Investment Corporations (Act No. 198 of 1951 and subsequent amendments),
distributions shall be not more than the amount of unappropriated retained earnings at the end of the fiscal period
under review and are defined as anything in excess of 90% of the “amount of distributable income” stipulated in
Article 67-15 of the Act on Special Measures Concerning Taxation (Act No. 26 of 1957 and subsequent amendments;
the “Special Taxation Measures Act”) in accordance with the stipulations of Article 32, paragraph 1 of its Articles of
Incorporation (“bylaws”). Based on this policy, the REIT made a decision to pay out 2,799,812,400 yen as
distributions from earnings by appropriating the reversal of reserve for adjustment of temporary differences of
39,997,320 yen (40 yen per unit) to the balance excluding the internal reserve of 156,410,159 yen, from the net
income of 2,916,225,239 yen for the fiscal period under review. As a result, distributions per unit have come to 2,800
yen.
(2) Overview of capital increase
The table below shows changes in total number of investment units issued and outstanding and unitholders' capital
over the past five years.
Date Summary
Total number of investment units
issued and outstanding
Unitholders' capital
(million yen) Remarks
Change Remaining units Change Remaining units
September 29, 2020 Cancellation -14,914 999,933 - 81,370 (Note 1)
(Note 1) From July 16, 2020 to September 15, 2020, the REIT bought back investment units (market purchase based on discretionary transactions with a
securities company). On September 29, 2020, the REIT cancelled all of the investment units that it had bought back following a resolution at the Board of Directors meeting held on September 16, 2020. The funds for buying back the investment units were deducted from unitholders' capital
surplus, and unitholders' capital remained unchanged.
5

[Changes in the market price of investment securities]
The table below shows high and low prices (closing prices) of the investment securities of the REIT in recent fiscal
periods on the Tokyo Stock Exchange Real Estate Investment Trust Securities Market, on which the investment
securities are listed.
(Unit: yen)
Fiscal period 35th FP 36th FP 37th FP 38th FP 39th FP
Closing date May 31, 2019 November 30, 2019 May 31, 2020 November 30, 2020 May 31, 2021
High 129,100 146,500 150,000 121,000 168,400
Low 116,100 121,300 66,100 96,700 115,900
6

(3) Distributions
Under the REIT's bylaws, distributions shall be not more than the amount of unappropriated retained earnings at the
end of the fiscal period under review and are defined as anything in excess of 90% of the "amount of distributable
income" stipulated in a special provision in taxation for investment corporations (Article 67-15 of the Act on Special
Measures Concerning Taxation).
Based on this policy, the REIT made a decision to pay out 2,799,812,400 yen as distributions from earnings by
appropriating the reversal of reserve for adjustment of temporary differences of 39,997,320 yen (40 yen per unit) to
the balance excluding the internal reserve of 156,410,159 yen, from the net income of 2,916,225,239 yen for the
fiscal period under review.
As a result, distributions per unit have come to 2,680 yen.
Fiscal period
35th FP 36th FP 37th FP 38th FP 39th FP
May 31,
2019
November 30,
2019
May 31,
2020
November 30,
2020
May 31,
2021
Unappropriated retained
earnings
thousand
yen 4,827,310 4,913,382 5,205,178 5,933,582 5,871,290
Reserve for temporary
difference adjustment
thousand
yen - - - 338,693 -
Reversal of reserve for
adjustment of temporary
differences
thousand
yen 40,593 40,593 40,593 39,997 39,997
Retained earnings thousand
yen 2,406,900 2,416,858 2,657,912 2,955,065 3,111,475
Total distributions thousand
yen 2,461,003 2,537,117 2,587,859 2,679,820 2,799,812
Distributions per unit
(excluding distributions
in excess of earnings)
yen (2,425) (2,500) (2,550) (2,680) (2,800)
Distributions of profit thousand
yen 2,461,003 2,537,117 2,587,859 2,679,820 2,799,812
(Distributions of profit
per unit) yen (2,425) (2,500) (2,550) (2,680) (2,800)
Contribution refunds thousand
yen - - - - -
(Contribution refunds per
unit) yen (-) (-) (-) (-) (-)
Of contribution refunds,
distributions from reserve
for temporary difference
adjustment
thousand
yen - - - - -
(Of contribution refunds
per unit, distributions
from reserve for
temporary difference
adjustment per unit)
yen (-) (-) (-) (-) (-)
Of contribution refunds,
distributions
accompanying decrease
in capital, etc. under tax
law
thousand
yen - - - - -
(Of contribution refunds
per unit, distributions
accompanying decrease
in capital, etc. under tax
law)
yen (-) (-) (-) (-) (-)
7
(4) Management policy and future issues
The REIT has developed and managed a high quality portfolio, primarily consisting of office and residence properties
located in Tokyo 23 Wards, with the aim of maximizing investor value through our Basic Philosophy of “Steady
Growth of Assets under Management” and “Stable Medium- to Long-Term Profits” as well as through “cooperation
with and use of the Heiwa Real Estate Group.” In subsequent periods, we will continue to adhere to the above
philosophy, aiming to further maximize investor value through the stable management of our portfolio and pursuing
a strategy of steady growth.
(a) External growth
The REIT sought to expand its portfolio, enhance the portfolio’s quality and increase its revenues by selling two
properties and acquiring six new properties of good quality (including two additional acquisitions) in the period from
the previous fiscal period to the fiscal period under review. While the REIT will continue to seek expansion in the
scale of its assets in the future, it will also consider the replacement of assets, strive to enhance its medium- to long-
term portfolio quality and aim to maximize investor value. Although the situation with regard to the financing
environment and expectations for higher property prices on the back of the economic recovery may change due to
the COVID-19 pandemic, companies' appetite for the acquisition of properties is unlikely to weaken dramatically
and the acquisition environment is likely to remain extremely challenging. We will endeavor to promptly obtain
information on excellent properties by using our pipeline with Heiwa Real Estate and building up our unique
information routes as an asset management company. As a basic strategy, we aim to increase opportunities for
primarily acquiring properties owned and developed by Heiwa Real Estate, and additionally for acquiring properties
owned and developed by other developers to expand our portfolio, contributing to stable profitability over the
medium to long term.
(b) Internal growth
The REIT believes that by using the database and information network developed by the Heiwa Real Estate Group
and its property management company, it can quickly detect leasing market trends and conduct precise property
management, enabling it to maintain and increase occupancy rates and rent levels in assets under management. The
REIT expects that the COVID-19 pandemic will have a limited impact on the office building leasing market in the
next fiscal period. It will, however, be necessary to monitor changes in office demand stemming from more
widespread teleworking in addition to changing economic, business and other trends in Japan and overseas.
Meanwhile, in the residential leasing market, demand for small city-center units may decline judging from the signs
of changes in property demand associated with the normalization of teleworking and a tendency to move to the
suburbs to avoid high-density areas, but the REIT intends to exercise management carefully tailored to the
characteristics of individual properties based on a close observation of market conditions.
In dealing with tenants, the REIT will continue to focus on maintaining and raising rent levels and reducing the
number of departures. The REIT will also perform leasing management, including the reduction of time needed to
restore properties to their original state, in a bid to shorten the period from tenant departures to the acquisition of new
tenants. To make our properties more competitive, we continuously and actively make value-building investments in
repairs and improvements of assets under management to maintain and enhance their medium- to long-term value,
taking into account each property’s asset age, facility level and other aspects.
(c) Financial strategy
The REIT is actively implementing measures in an effort to stabilize its financial foundations and achieve sustainable
growth. Concerning borrowings, the REIT will continue to strive to extend its borrowing periods and diversify
maturities by maintaining an appropriate loan-to-value ratio, while promoting measures to reduce risks from higher
interest rates in the future and cut financial costs. It will also endeavor to further strengthen its bank formation by
strengthening its relationships with financial institutions. The REIT will also issue investment corporation bonds,
while keeping a close watch on the effect of reducing financial costs and trends in the financial market. As part of its
unitholder returns policy, the REIT will also consider the acquisition and cancellation of treasury investment units
based on comprehensive consideration of factors such as the level of the investment unit price, the situation of cash
reserves, financial conditions and the market environment. By implementing these measures and initiatives on a
continuous basis, the REIT will strive to build sound financial systems that are resilient to changes in the funding
environment.
8

(d) Promotion of more timely disclosure
We practice information disclosure that is accurate, fair and timely, complying with the TSE’s Securities Listing
Regulations and other regulations, laws, etc. relating to timely disclosure. The REIT discloses information on its
decisions on the acquisition of new properties, etc. as a rule at the time of the decision by a REIT organization such
as the Board of Directors, while events such as damage to assets under management resulting from incidental
occurrences are disclosed at the time they are discovered. As a rule, the REIT uses the TSE’s TDnet and its official
website as its methods for disclosing information.
(5) Significant subsequent events
A. Issuance of New Investment Units
The Board of Directors of the REIT resolved to issue new investment units in the manner described below at its
meetings held on May 17, 2021 and May 25, 2021. The REIT completed payments for new investment units issued
by means of public offering and by means of private placement on June 1, 2021 and June 29, 2021, respectively. As
a result, unitholders’ capital amounted to 90,063 million yen and the number of investment units issued totaled
1,055,733 as of the date of this document.
1. Issuance of new investment units by means of primary offering (public offering)
(1) Number of new investment units issued: 53,100
(2) Issue price (offer price): 161,070 yen
(3) Total issue price (offer price): 8,552,817,000 yen
(4) Amount to be paid in (issue value): 155,783 yen
(5) Total amount to be paid in (total issue value): 8,272,077,300 yen
(6) Payment date: June 1, 2021
2. Issuance of new investment units by means of private placement
(1) Number of new investment units issued: 2,700
(2) Amount to be paid in (issue value): 155,783 yen
(3) Total amount to be paid in (total issue value): 420,614,100 yen
(4) Allottee: SMBC Nikko Securities Inc.
(5) Payment date: June 29, 2021
B. Asset Acquisitions
The REIT acquired trust beneficial interest in one property (acquisition price: 5,160 million yen) and purchased three
properties (total acquisition price: 3,610 million yen) on June 4, 2021 in accordance with the basic policy and the
like set out in its bylaws.
Property no.: Of-47; Property name: OSAKI CN BUILDING
Type of asset acquired Trust beneficial interest
Contract date May 17, 2021
Acquisition date June 4, 2021
Acquisition price (Note 1) 5,160 million yen
Location (residential address) 5-10-10 Osaki, Shinagawa-ku, Tokyo
Use Office and a parking lot
Completed October 2, 1992
Structure Reinforced concrete flat-roofed 8-story structure with a 1-story basement
Total floor area (Note 2) 4,779.40 m2
Total rentable area 3,237.77 m2
(Note 1) The acquisition price is the sales price (excluding amounts corresponding to the consumption taxes, etc.) stated in the Agreement
on the Sale and Purchase of Trust Beneficial Interest. The price does not include the costs of acquisition, the fixed property tax,
the city planning tax, etc.
(Note 2) The building in trust is a co-owned property. The area stated is a figure calculated by multiplying the total floor area in the entire
building by 78.16, which is the ratio of co-ownership.
9

Property no.: Re-95; property name: HF SHOKOJI AKABANE RESIDENCE II
Type of asset acquired (Note 1) Real estate
Contract date May 17, 2021
Acquisition date June 4, 2021
Acquisition price (Note 2) 1,690 million yen
Location (residential address) 24-16 Iwabuchi-machi, Kita-ku, Tokyo
Use Co-housing
Completed January 31, 2020
Structure Reinforced concrete flat-roofed 14-story structure
Total floor area 2,764.49 m2
Total rentable area 2,438.42 m2
(Note 1) The asset acquired consists of a building and leasehold rights. The leasehold rights are ordinary leasehold rights.
(Note 2) The acquisition price is the sales price (excluding amounts equal to consumption taxes, etc.) stated in the Agreement on the
Sale and Purchase of Real Estate and does not include the costs of acquisition, fixed property tax, city planning tax, etc.
Property no.: Re-96; property name: HF YAHIRO RESIDENCE
Type of asset acquired (Note 1) Real estate
Contract date May 17, 2021
Acquisition date June 4, 2021
Acquisition price (Note 2) 1,220 million yen
Location (residential address) 4-50-1 Yahiro, Sumida-ku, Tokyo
Use Co-housing
Completed November 27, 2020
Structure Reinforced concrete flat-roofed 9-story structure
Total floor area 2,151.30 m2
Total rentable area 1,919.50 m2
(Note 1) The asset acquired consists of a building and leasehold rights. The leasehold rights are ordinary leasehold rights.
(Note 2) The acquisition price is the sales price (excluding amounts equal to consumption taxes, etc.) stated in the Agreement on the
Sale and Purchase of Real Estate and does not include the costs of acquisition, fixed property tax, city planning tax, etc.
Property no.: Re-97; property name: HF SETAGAYAKAMIMACHI RESIDENCE
Type of asset acquired (Note 1) Real estate
Contract date May 17, 2021
Acquisition date June 4, 2021
Acquisition price (Note 2) 700 million yen
Location (residential address) 1-45-9 Setagaya, Setagaya-ku, Tokyo
Use Co-housing
Completed November 30, 2020
Structure Reinforced concrete flat-roofed 7-story structure
Total floor area 1,070.10 m2
Total rentable area 759.24 m2
(Note 1) The asset acquired consists of a building and leasehold rights. The leasehold rights are ordinary leasehold rights.
(Note 2) The acquisition price is the sales price (excluding amounts equal to consumption taxes, etc.) stated in the Agreement on the
Sale and Purchase of Real Estate and does not include the costs of acquisition, fixed property tax, city planning tax, etc.
10

C. Borrowing of Loans
The REIT took out loans (total loan amount: 1,000 million yen) on December 17, 2020, to partially fund the
acquisition of one office property (see “A. Asset Acquisitions” above) acquired on the same date.
[Term Loan 52]
Lender Loan amount Principal repayment
date
Principal repayment
method Purpose Summary
Sumitomo Mitsui Banking
Corporation
The Chiba Bank, Ltd. 400 million yen
October 31, 2024
(Note)
Lump sum
repayment on the
principal repayment
date
Property acquisition
funding, etc.
Unsecured
Non-
guaranteed
(Note) Or the previous business day if the date shown is not a business day.
2. Overview of the Investment Corporation
(1) Overview of investments
Fiscal period
35th FP 36th FP 37th FP 38th FP 39th FP
May 31, 2019 November30,
2019 May 31, 2020
November30,
2020 May 31, 2021
Total number of authorized
investment units 8,000,000 8,000,000 8,000,000 8,000,000 8,000,000
Total number of investment
units issued and outstanding 1,014,847 1,014,847 1,014,847 999,933 999,933
Unitholders' capital million
yen 81,370 81,370 81,370 81,370 81,370
Number of unitholders 12,204 11,566 11,797 11,699 10,906
(2) Matters concerning investment units
The following represents major unitholders as of May 31, 2021
Name Units Owned
(units)
Ownership Ratio
(Note 1) (%)
Custody Bank of Japan, Ltd. (trust account) (Note 2) 255,140 25.51
The Master Trust Bank of Japan ,Ltd. (trust account) 175,647 17.56
Heiwa Real Estate Co., Ltd. 135,845 13.58
The Nomura Trust and Banking Co., Ltd. (trust account) 33,629 3.36
Custody Bank of Japan, Ltd. (securities investment trust account) 25,475 2.54
STATE STREET BANK WEST CLIENT -TREATY 505234 11,970 1.19
SCBHK AC LIECHTENSTEINISCHE LANDESBANK AG 11,945 1.19
NOMURA BANK (LUXEMBOURG) S.A. 11,868 1.18
Aozora Bank, Ltd. 11,011 1.10
Shikoku Railway Company 10,249 1.02
Total 682,779 68.28
(Note 1) The ratio of number of investment units owned to number of investment units outstanding is rounded down to the second decimal place.
11

(3) Matters relating to officers
The Executive Director, Supervisory Directors and accounting auditor in the 39th fiscal period are shown below.
Role Name Major concurrent posts
Total remuneration for
each role in the period
(thousand yen)
Executive Director
(Note 1) Aya Motomura Attorney at law, Inaba & Partners 2,583
Supervisory Director
(Note 1) Noriyuki Katayama Attorney at law, City-Yuwa Partners
3,709 Supervisory Director
(Note 1) Toshio Suzuki
Certified Public Accountant, Suzuki Toshio
Certified Public Accountant Office
Independent Auditor
(Note 2) KPMG AZSA LLC - 11,660
(Note 3)
(Note 1) No Executive Director or Supervisory Directors have any investment units of the Investment Corporation under their own name or anyone else's
name. The Supervisory Directors may be officers at companies other than the companies stated above, but those companies, including the ones stated
above, do not have a stake in the Investment Corporation.
(Note 2) The Investment Corporation may dismiss or may not reappoint the accounting auditor if necessary in consideration of various circumstances. (Note 3) The amount includes compensation for an audit of English-language financial statements for the 38th fiscal period financial statements.
(4) Asset Management Company, Asset Custodian and General Administrators
The asset management company, asset custody company and administrative service contractors at the end of 39th
fiscal period are shown below.
Contract classification Name
Asset Management Company HEIWA REAL ESTATE Asset Management CO., LTD.
Asset Custodian Mizuho Trust & Banking Co., Ltd.
General Services related to Accounting Ernst & Young Tax Co.
Investors' Registry Administrator Mizuho Trust & Banking Co., Ltd.
Special Account Administrator Mizuho Trust & Banking Co., Ltd.
General Services related to Institutional Management Mitsubishi UFJ Trust and Banking Corporation
General Services related to Investment Corporation Bonds Resona Bank, Limited
12

3. Status on investment properties
(1) Composition of assets of real estate investment company
Asset type Use Area
38th Fiscal Period
(As of November 30, 2020)
39th Fiscal Period
(As of May 31, 2021)
Value of holding
(Million yen) (Note 1)
Ratio to total
assets (%)
Value of holding
(Million yen) (Note 1)
Ratio to total
assets (%)
Real estate (Note 2)
Office
Tokyo 23 Wards 7,622 4.0 7,598 4.0
Metropolitan Area (Note 3) 3,472 1.8 3,466 1.8
Other (Note 4) - - 2,628 1.4
Residence
Tokyo 23 Wards 23,468 12.4 23,363 12.2
Metropolitan Area (Note 3) 4,994 2.6 5,023 2.6
Other (Note 4) 5,237 2.8 7,809 4.1
Subtotal 44,794 23.7 49,890 26.1
Real estate
in trust (Note 2)
Office
Tokyo 23 Wards 50,445 26.7 52,382 27.4
Metropolitan Area (Note 3) 4,844 2.6 4,837 2.5
Other (Note 4) 11,119 5.9 11,039 5.8
Residence
Tokyo 23 Wards 39,816 21.1 38,949 20.4
Metropolitan Area (Note 3) 2,897 1.5 2,887 1.5
Other (Note 4) 16,734 8.9 16,634 8.7
Subtotal 125,858 66.6 126,730 66.4
Real estate, etc., subtotal 170,652 90.3 176,621 92.5
Deposits and other assets 18,263 9.7 14,365 7.5
Total assets 188,916 100.0 190,986 100.0
(Note 1) “Value of holding” is based on the balance sheet amount (carrying amount after depreciation and impairment accounting in the case of real estate
and real estate in trust) as of the end of the period.
(Note 2) The land leasehold right, etc. owned in conjunction with a building, etc. is stated in the sections of “real estate” and “real estate in trust” by aggregating it with the building, etc. "Real estate" does not include construction in progress.
(Note 3) “Metropolitan Area” refers to Tokyo (other than Tokyo 23 Wards) and Kanagawa, Saitama and Chiba prefectures.
(Note 4) “Other” refers to investment areas other than Tokyo 23 Wards and Metropolitan Area.
13

(2) Major owned assets
The table below shows data about major assets owned by the Investment Corporation at the end of the 38th fiscal
period (top ten properties in terms of book value at the end of the fiscal period).
Property name
Book
value (million
yen)
Rentable area (Note 1)
(m2)
Rental area (Note 2)
(m2)
Occupancy
rate (Note 3)
(%)
Ratio of
total rent
revenue-
real estate (Note 4)
(%)
Main use
Re-43 HF KOMAZAWA-KOEN
RESIDENCE TOWER 6,341 8,141.02 7,949.72 97.7 3.3 Residence
Re-25 HF GINZA RESIDENCE EAST 5,450 5,459.49 5,179.07 94.9 2.1 Residence
Of-25 KAYABACHO HEIWA
BUILDING 4,726 4,156.53 4,156.53 100.0 3.3 Office
Of-30 HF SAKURADORI BUILDING 4,447 9,934.77 9,934.77 100.0 5.2 Office
Of-38 ACROSS SHINKAWA
BUILDING 3,888 3,828.92 3,828.92 100.0 1.9
Office,
Residence
Of-45 KABUTO-CHO UNI-SQUARE 3,628 2,737.77 2,737.77 100.0 1.3 Office
Re-20 HF SHIROKANETAKANAWA
RESIDENCE 3,588 4,457.76 4,324.85 97.0 1.9 Residence
Of-20 FUNABASHI FACE BUILDING 3,466 2,520.22 2,520.22 100.0 1.9 Office
Of-33 HF UENO BUILDING 3,460 4,168.79 4,168.79 100.0 2.2 Office
Of-18 M2 HARAJUKU 3,404 1,178.57 1,008.99 85.6 1.5 Retail
Total 42,400 46,583.84 45,809.63 98.3 24.4
(Note 1) Rentable area is the area of the space that can be rented for office, retail or residential use (excluding common use space).
(Note 2) Rental area is based on the rental agreement.
(Note 3) Occupancy rate is the ratio of rental area to rentable area at the end of the period. (Note 4) Ratio of total rent revenue-real estate is the ratio of rental revenue from each property to rental revenue from the entire portfolio.
14

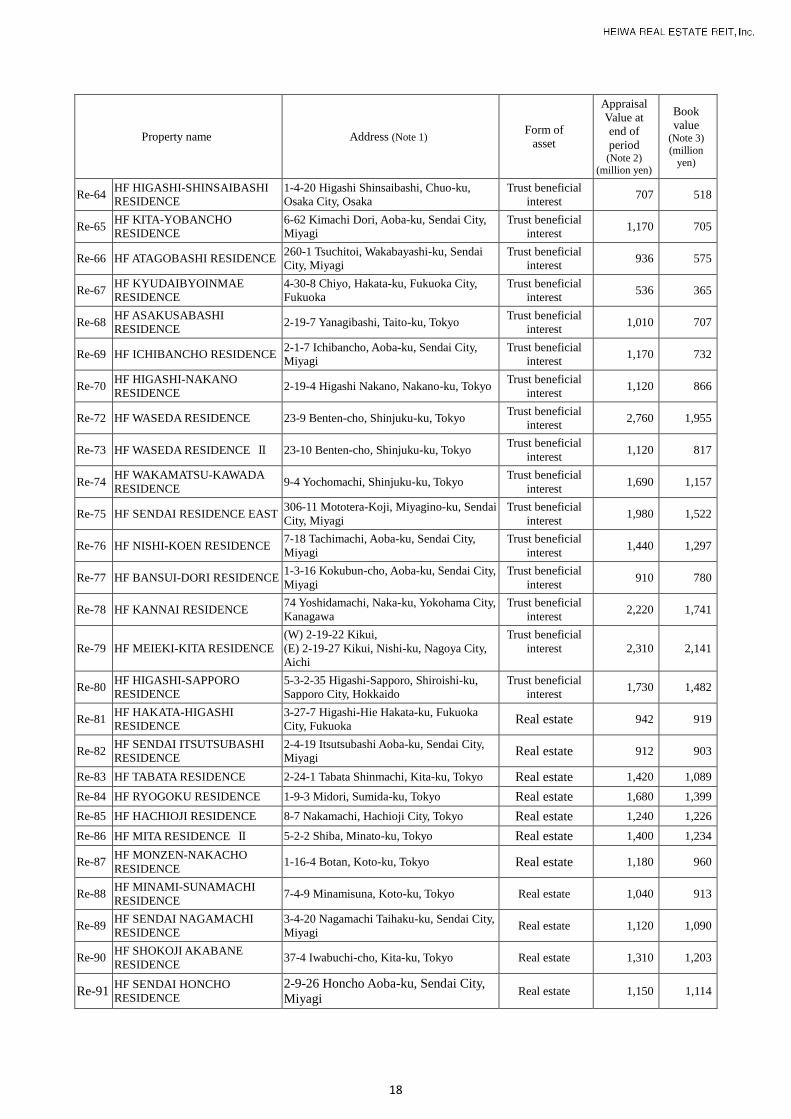
(3) Summary of portfolio properties
The table below is a statement of real estate owned by the Investment Corporation at the end of the 39th fiscal period.
Property name Address (Note 1) Form of
asset
Appraisal
Value at
end of
period (Note 2)
(million yen)
Book
value (Note 3) (million
yen)
Of-05 SUITENGU HEIWA BUILDING 1-16-8 Nihonbashi Kakigara-cho, Chuo-ku,
Tokyo
Trust beneficial
interest 1,712 1,375
Of-06 HF MONZENNAKACHO
BUILDING 2-1-9 Tomioka, Koto-ku, Tokyo
Trust beneficial
interest 2,860 2,232
Of-07 HF HAMAMATSUCHO
BUILDING 2-12-9 Shiba Daimon, Minato-ku, Tokyo
Trust beneficial
interest 1,890 1,510
Of-08 HF TAMEIKE BUILDING 2-12-10 Akasaka, Minato-ku, Tokyo Trust beneficial
interest 3,120 2,746
Of-09 GRACE BUILDING
SENGAKUJIMAE 2-15-8 Takanawa, Minato-ku, Tokyo
Trust beneficial
interest 1,680 1,111
Of-11 HF NIHONBASHI
ODENMACHO BUILDING
2-7 Nihonbashi Odenma-cho, Chuo-ku,
Tokyo
Trust beneficial
interest 2,270 2,148
Of-12 HF HATCHOBORI BUILDING 3-12-8 Hatchobori, Chuo-ku, Tokyo Real estate 2,760 3,029
Of-17 HATCHOBORI MF BUILDING 1-2-9 Irifune, Chuo-ku, Tokyo Real estate 1,060 1,091
Of-18 M2 HARAJUKU 6-27-8 Jingumae, Shibuya-ku, Tokyo Trust beneficial
interest 5,079 3,404
Of-20 FUNABASHI FACE BUILDING 1-3-1 Hon-cho, Funabashi City, Chiba Real estate 3,430 3,466
Of-21 ADESSO NISHIAZABU 1-7-2 Nishi Azabu, Minato-ku, Tokyo Real estate 500 597
Of-23 HF IKEBUKURO BUILDING 2-29-12 Minami Ikebukuro, Toshima-ku,
Tokyo
Real estate 1,500 1,283
Of-24 HF YUSHIMA BUILDING 3-37-4 Yushima, Bunkyo-ku, Tokyo Real estate 1,710 1,596
Of-25 KAYABACHO HEIWA
BUILDING
3-1-2 Nihonbashi Kayaba-cho, Chuo-ku,
Tokyo
Trust beneficial
interest 6,860 4,726
Of-27 KOBE KYUKYORYUCHI
HEIWA BUILDING
49 Harima-cho ,Chuo-ku, Kobe City,
Hyogo
Trust beneficial
interest 3,420 2,564
Of-29 SAKAE MINAMI HEIWA
BUILDING 3-19-8 Sakae ,Naka-ku, Nagoya City, Aichi
Trust beneficial
interest 2,300 1,485
Of-30 HF SAKURADORI BUILDING 3-23-20 Marunouchi,Naka-ku, Nagoya City,
Aichi
Trust beneficial
interest 6,590 4,447
Of-31 HF NIHONBASHI HAMACHO
BUILDING
1-2-1 Nihonbashi Hamacho, Chuo-ku,
Tokyo
Trust beneficial
interest 2,630 1,947
Of-32 HF SENDAI HONCHO
BUILDING
1-11-1 Honcho,Aoba-ku, Sendai-shi,
Miyagi
Trust beneficial
interest 3,640 2,542
Of-33 HF UENO BUILDING 5-6-10 Ueno,Taito-ku, Tokyo Trust beneficial
interest 4,240 3,460
Of-34 KOJIMACHI HF BUILDING 3-2-4 Kojimachi,Chiyoda-ku, Tokyo Trust beneficial
interest 2,160 1,360
Of-35 HF KUDAN MINAMI
BUILDING 3-9-14 Kudan-Minami,Chiyoda-ku, Tokyo
Trust beneficial
interest 3,310 2,751
Of-36 HF KANDA OGAWAMACHI
BUILDING
3-3-5 Kanda ogawamachiChiyoda-ku,
Tokyo
Trust beneficial
interest 4,240 3,219
Of-37 NISSO 5 BUILDING 2-10-39 Kita-SaiwaiNishi-ku, Yokohama
City, Kanagawa
Trust beneficial
interest 3,840 3,195
Of-38 ACROSS SHINKAWA
BUILDING 1-8-8, 1-8-15 Shinkawa, Chuo-ku, Tokyo
Trust beneficial
interest 4,370 3,888
Of-39 SENJU MILDIX Ⅱ 3-98 Senju,Adachi-ku, Tokyo Trust beneficial
interest 1,950 1,602
Of-40 ARK Mori Building 1-12-32 Akasaka,Minato-ku, Tokyo Trust beneficial
interest 3,570 3,131
15

Property name Address (Note 1) Form of
asset
Appraisal
Value at
end of
period (Note 2)
(million yen)
Book
value (Note 3) (million
yen)
Of-41 Nihonbashi Horidomecho First 1-2-10 Nihonbashi Horidomecho, Chuo-ku,
Tokyo
Trust beneficial
interest 2,330 2,158
Of-42 SOUTHERN SKY TOWER
HACHIOJI 4-7-1 Koyasumachi,Hachioji City, Tokyo
Trust beneficial
interest 1,890 1,641
Of-43 HAMACHO HEIWA BUILDING 2-17-8 Nihonbashi-hamacho, Chuo-ku,
Tokyo
Trust beneficial
interest 3,310 3,124
Of-44 KINSHICHO SQUARE
BUILDING 3-10-8 Koutoubashi, Sumida-ku, Tokyo
Trust beneficial
interest 2,930 2,854
Of-45 KABUTO-CHO UNI-SQUARE 21-7 Nihonbashi Kayaba-cho, Chuo-ku,
Tokyo
Trust beneficial
interest 3,990 3,628
Of-46 TORYO BUILDING 1-8-1 Ichibancho, Aoba-ku, Sendai City,
Miyagi Real estate 2,670 2,628
Office subtotal 99,811 81,953
Re-03 HF ICHIKAWA RESIDENCE 4-8-13 Ainokawa, Ichikawa City, Chiba Trust beneficial
interest 573 371
Re-05 HF MEGURO RESIDENCE 2-15-10 Shimomeguro, Meguro-ku, Tokyo Trust beneficial
interest 773 610
Re-09 HF KASAI RESIDENCE 7-10-6 Higashi Kasai, Edogawa-ku, Tokyo Trust beneficial
interest 940 574
Re-11 HF WAKABAYASHI-KOEN
RESIDENCE 4-33-14 Wakabayashi, Setagaya-ku, Tokyo
Trust beneficial
interest 4,771 3,114
Re-12 HF HIMONYA RESIDENCE 5-5-15 Himonya, Meguro-ku, Tokyo Trust beneficial
interest 1,872 1,396
Re-14 HF MINAMIAZABU
RESIDENCE 2-13-20 Minami Azabu, Minato-ku, Tokyo
Trust beneficial
interest 1,555 1,289
Re-16 HF GAKUGEIDAIGAKU
RESIDENCE 6-18-27 Shimomeguro, Meguro-ku, Tokyo
Trust beneficial
interest 1,050 883
Re-17 HF HIGASHIKANDA
RESIDENCE 3-1-9 Higashi Kanda, Chiyoda-ku, Tokyo
Trust beneficial
interest 1,480 846
Re-18 HF HIGASHINIHONBASHI
RESIDENCE 3-6-8 Nihonbashi, Chuo-ku, Tokyo
Trust beneficial
interest 1,730 947
Re-19 HF NERIMA RESIDENCE 3-1-12 Nerima, Nerima-ku, Tokyo Trust beneficial
interest 890 537
Re-20 HF SHIROKANETAKANAWA
RESIDENCE 1-2-6 Takanawa, Minato-ku, Tokyo Real estate 5,320 3,588
Re-21 HF MEIDAIMAE RESIDENCE 1-27-7 Hanegi, Setagaya-ku, Tokyo Real estate 1,060 962
Re-22 HF NIHONBASHI RESIDENCE 9-5 Nihonbashi Koami-cho, Chuo-ku,
Tokyo
Trust beneficial
interest 1,230 1,071
Re-23 HF KAMISHAKUJII
RESIDENCE
3-34-12 Kamishakujii, Nerima-
ku, Tokyo Real estate 1,070 833
Re-24 HF KINSHICHO RESIDENCE 2-10-2 Kotobashi, Sumida-ku, Tokyo Real estate 1,260 1,068
Re-25 HF GINZA RESIDENCE EAST 7-7-8 Tsukiji, Chuo-Ku, Tokyo Real estate 5,500 5,450
Re-26 HF SHIN-YOKOHAMA
RESIDENCE
2-7-6 Shin-Yokohama, Kohoku-ku,
Yokohama City, Kanagawa Real estate 2,920 2,914
Re-29 HF HAKUSAN RESIDENCE 1-7-12 Mukogaoka, Bunkyo-ku, Tokyo Real estate 2,110 2,213
Re-30 HF MAGOME RESIDENCE 1-38-8 Higashi Magome, Ota-ku, Tokyo Real estate 1,480 1,463
Re-31 HF GAKUGEIDAIGAKU
RESIDENCE Ⅱ 1-40-7 Naka-cho, Meguro-ku, Tokyo
Trust beneficial
interest 1,350 1,531
Re-33 HF KAMEIDO RESIDENCE 2-36-13 Kameido, Koto-ku, Tokyo Real estate 1,250 982
Re-34 HF TANASHI RESIDENCE 6-5-23 Tanashi, Nishitokyo City, Tokyo Real estate 774 882
16

Property name Address (Note 1) Form of
asset
Appraisal
Value at
end of
period (Note 2)
(million yen)
Book
value (Note 3) (million
yen)
Re-35 HF SHIBA-KOEN RESIDENCE 3-14-15 Shiba, Minato-ku, Tokyo Trust beneficial
interest 906 788
Re-36 HF MITA RESIDENCE 3-3-6 Mita, Minato-ku, Tokyo Trust beneficial
interest 1,300 1,009
Re-37 HF TAKANAWA RESIDENCE 4-17-22 Mita, Minato-ku, Tokyo Trust beneficial
interest 963 697
Re-38 La Residence de Shirokanedai 5-18-8 Shirokanedai, Minato-ku, Tokyo Trust beneficial
interest 1,870 1,344
Re-39 HF GINZA RESIDENCE EAST
Ⅱ 1-6-10 Shintomi, Chuo-ku, Tokyo
Trust beneficial
interest 2,370 1,721
Re-40 HF HATCHOBORI RESIDENCE
Ⅱ 2-7-11 Shinkawa, Chuo-ku, Tokyo
Trust beneficial
interest 1,250 982
Re-41 HF HATCHOBORI RESIDENCE
Ⅲ 2-17-8 Shinkawa, Chuo-ku, Tokyo
Trust beneficial
interest 1,080 694
Re-42 HF GINZA RESIDENCE 1-20-6 Ginza, Chuo-ku, Tokyo Trust beneficial
interest 1,310 810
Re-43 HF KOMAZAWA-KOEN
RESIDENCE TOWER 2-7-1 Komazawa, Setagaya-ku, Tokyo
Trust beneficial
interest 7,660 6,341
Re-45 HF NAKANOSHIMA
RESIDENCE
3-5-19 Nakanoshima, Kita-ku, Osaka City,
Osaka
Trust beneficial
interest 533 414
Re-46 HF AWAZA RESIDENCE 4-6-12 Itachibori, Nishi-ku, Osaka City,
Osaka
Trust beneficial
interest 727 484
Re-47 HF MARUNOUCHI
RESIDENCE
2-11-21 Habashita, Nishi-ku, Nagoya City,
Aichi
Trust beneficial
interest 751 498
Re-48 HF HIRAO RESIDENCE 2-4-32 Nanokawa, Minami-ku, Fukuoka
City, Fukuoka
Trust beneficial
interest 2,260 1,535
Re-49 HF KAWARAMACHI NIJO
RESIDENCE
84 Enoki-cho, Teramachi Dori, Nijo Sagaru,
Nakagyo-ku, Kyoto City, Kyoto
Trust beneficial
interest 608 476
Re-53 HF SHIJO KAWARAMACHI
RESIDENCE
560 (3 lots) Nakano-cho, Teramachi Dori
Ayanokoji Sagaru, Shimogyo-ku, Kyoto
City, Kyoto
Trust beneficial
interest 2,380 1,618
Re-54 La Residence de Sendagi 2-23-3 Sendagi, Bunkyo-ku, Tokyo Trust beneficial
interest 1,020 757
Re-55 HF SENDAGI RESIDENCE 2-6-6 Sendagi, Bunkyo-ku, Tokyo Trust beneficial
interest 1,080 797
Re-56 HF KOMAZAWA-KOEN
RESIDENCE 4-11-2 Komazawa, Setagaya-ku, Tokyo
Trust beneficial
interest 728 584
Re-57 HF MUSASHIKOYAMA
RESIDENCE 4-8-6 Koyama, Shinagawa-ku, Tokyo
Trust beneficial
interest 1,160 779
Re-58 HF KOKUBUNJI RESIDENCE 3-18-7 Minami-cho, Kokubunji City, Tokyo Trust beneficial
interest 1,060 774
Re-59 HF HISAYAODORI
RESIDENCE
1-12-1 Izumi, Higashi-ku, Nagoya City,
Aichi
Trust beneficial
interest 1,300 973
Re-60 HF KARASUMA
KURAMAGUCHI RESIDENCE
411-1 Kami Goryomae-cho, Kami
Goryomae Dori, Karasuma Higashi Iru,
Kamigyo-ku, Kyoto City, Kyoto
Trust beneficial
interest 702 511
Re-61 HF NISHI-SHINJUKU
RESIDENCE WEST 8-8-20 Nishi Shinjuku, Shinjuku-ku, Tokyo
Trust beneficial
interest 2,730 1,930
Re-62 HF NISHI-SHINJUKU
RESIDENCE EAST 8-7-11 Nishi Shinjuku, Shinjuku-ku, Tokyo
Trust beneficial
interest 1,600 1,132
Re-63 HF HIGASHI-SHINJUKU
RESIDENCE 2-2-8 Okubo, Shinjuku-ku, Tokyo
Trust beneficial
interest 1,680 1,248
17
Property name Address (Note 1) Form of
asset
Appraisal
Value at
end of
period (Note 2)
(million yen)
Book
value (Note 3) (million
yen)
Re-64 HF HIGASHI-SHINSAIBASHI
RESIDENCE
1-4-20 Higashi Shinsaibashi, Chuo-ku,
Osaka City, Osaka
Trust beneficial
interest 707 518
Re-65 HF KITA-YOBANCHO
RESIDENCE
6-62 Kimachi Dori, Aoba-ku, Sendai City,
Miyagi
Trust beneficial
interest 1,170 705
Re-66 HF ATAGOBASHI RESIDENCE 260-1 Tsuchitoi, Wakabayashi-ku, Sendai
City, Miyagi
Trust beneficial
interest 936 575
Re-67 HF KYUDAIBYOINMAE
RESIDENCE
4-30-8 Chiyo, Hakata-ku, Fukuoka City,
Fukuoka
Trust beneficial
interest 536 365
Re-68 HF ASAKUSABASHI
RESIDENCE 2-19-7 Yanagibashi, Taito-ku, Tokyo
Trust beneficial
interest 1,010 707
Re-69 HF ICHIBANCHO RESIDENCE 2-1-7 Ichibancho, Aoba-ku, Sendai City,
Miyagi
Trust beneficial
interest 1,170 732
Re-70 HF HIGASHI-NAKANO
RESIDENCE 2-19-4 Higashi Nakano, Nakano-ku, Tokyo
Trust beneficial
interest 1,120 866
Re-72 HF WASEDA RESIDENCE 23-9 Benten-cho, Shinjuku-ku, Tokyo Trust beneficial
interest 2,760 1,955
Re-73 HF WASEDA RESIDENCE Ⅱ 23-10 Benten-cho, Shinjuku-ku, Tokyo Trust beneficial
interest 1,120 817
Re-74 HF WAKAMATSU-KAWADA
RESIDENCE 9-4 Yochomachi, Shinjuku-ku, Tokyo
Trust beneficial
interest 1,690 1,157
Re-75 HF SENDAI RESIDENCE EAST 306-11 Mototera-Koji, Miyagino-ku, Sendai
City, Miyagi
Trust beneficial
interest 1,980 1,522
Re-76 HF NISHI-KOEN RESIDENCE 7-18 Tachimachi, Aoba-ku, Sendai City,
Miyagi
Trust beneficial
interest 1,440 1,297
Re-77 HF BANSUI-DORI RESIDENCE 1-3-16 Kokubun-cho, Aoba-ku, Sendai City,
Miyagi
Trust beneficial
interest 910 780
Re-78 HF KANNAI RESIDENCE 74 Yoshidamachi, Naka-ku, Yokohama City,
Kanagawa
Trust beneficial
interest 2,220 1,741
Re-79 HF MEIEKI-KITA RESIDENCE
(W) 2-19-22 Kikui,
(E) 2-19-27 Kikui, Nishi-ku, Nagoya City,
Aichi
Trust beneficial
interest 2,310 2,141
Re-80 HF HIGASHI-SAPPORO
RESIDENCE
5-3-2-35 Higashi-Sapporo, Shiroishi-ku,
Sapporo City, Hokkaido
Trust beneficial
interest 1,730 1,482
Re-81 HF HAKATA-HIGASHI
RESIDENCE
3-27-7 Higashi-Hie Hakata-ku, Fukuoka
City, Fukuoka Real estate 942 919
Re-82 HF SENDAI ITSUTSUBASHI
RESIDENCE
2-4-19 Itsutsubashi Aoba-ku, Sendai City,
Miyagi Real estate 912 903
Re-83 HF TABATA RESIDENCE 2-24-1 Tabata Shinmachi, Kita-ku, Tokyo Real estate 1,420 1,089
Re-84 HF RYOGOKU RESIDENCE 1-9-3 Midori, Sumida-ku, Tokyo Real estate 1,680 1,399
Re-85 HF HACHIOJI RESIDENCE 8-7 Nakamachi, Hachioji City, Tokyo Real estate 1,240 1,226
Re-86 HF MITA RESIDENCE Ⅱ 5-2-2 Shiba, Minato-ku, Tokyo Real estate 1,400 1,234
Re-87 HF MONZEN-NAKACHO
RESIDENCE 1-16-4 Botan, Koto-ku, Tokyo Real estate 1,180 960
Re-88 HF MINAMI-SUNAMACHI
RESIDENCE 7-4-9 Minamisuna, Koto-ku, Tokyo Real estate 1,040 913
Re-89 HF SENDAI NAGAMACHI
RESIDENCE
3-4-20 Nagamachi Taihaku-ku, Sendai City,
Miyagi Real estate 1,120 1,090
Re-90 HF SHOKOJI AKABANE
RESIDENCE 37-4 Iwabuchi-cho, Kita-ku, Tokyo Real estate 1,310 1,203
Re-91 HF SENDAI HONCHO
RESIDENCE
2-9-26 Honcho Aoba-ku, Sendai City,
Miyagi Real estate 1,150 1,114
18

Property name Address (Note 1) Form of
asset
Appraisal
Value at
end of
period (Note 2)
(million yen)
Book
value (Note 3) (million
yen)
Re-92 HF OHORI RESIDENCE
BAYSIDE
3-17-10 Nagahama Chuo-ku, Fukuoka
City,Fukuoka Real estate 1,280 1,201
Re-93 HF HAKATA-HIGASHI
RESIDENCEⅡ
1-9-27 Yutaka, Hakata-ku, Fukuoka
City, Fukuoka Real estate 1,410 1,290
Re-94 HF FUKUOKA RESIDENCE
EAST
14-22 Futamataseshinmachi, Higashi-
ku, Fukuoka City, Fukuoka Real estate 1,480 1,289
Residence subtotal 119,109 94,667
Total 218,920 176,621
(Note 1) Address is based on residence indication or an address stated in the registry.
(Note 2) Valuation at end of period is an appraisal value determined by a real estate appraiser based on the asset valuation method and standard set out in
the bylaws and under the rules of The Investment Trusts Association, Japan.
(Note 3) Book value is the acquisition price (including expenses for acquisition and subsequent capital expenditures) as of May 31, 2021, after deducting
the accumulated depreciation.
19
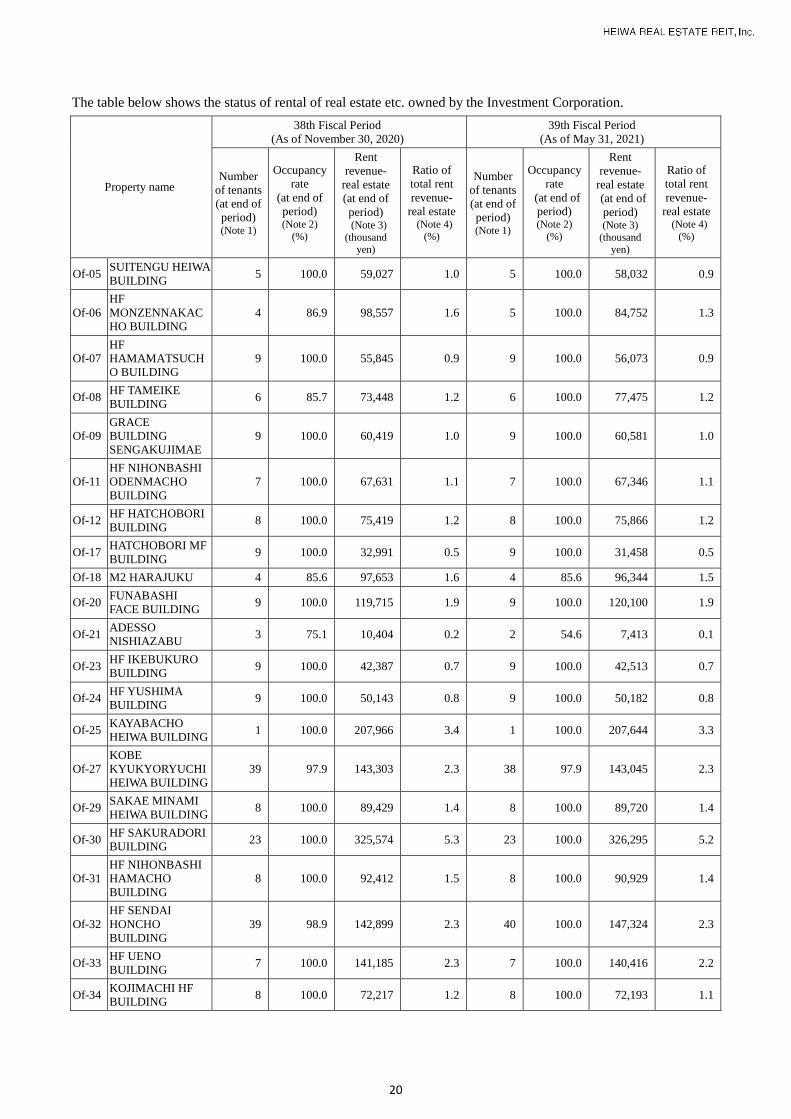
The table below shows the status of rental of real estate etc. owned by the Investment Corporation.
Property name
38th Fiscal Period
(As of November 30, 2020)
39th Fiscal Period
(As of May 31, 2021)
Number
of tenants
(at end of
period) (Note 1)
Occupancy
rate
(at end of
period) (Note 2)
(%)
Rent
revenue-
real estate
(at end of
period) (Note 3) (thousand
yen)
Ratio of
total rent
revenue-
real estate (Note 4)
(%)
Number
of tenants
(at end of
period) (Note 1)
Occupancy
rate
(at end of
period) (Note 2)
(%)
Rent
revenue-
real estate
(at end of
period) (Note 3)
(thousand yen)
Ratio of
total rent
revenue-
real estate (Note 4)
(%)
Of-05 SUITENGU HEIWA
BUILDING 5 100.0 59,027 1.0 5 100.0 58,032 0.9
Of-06
HF
MONZENNAKAC
HO BUILDING
4 86.9 98,557 1.6 5 100.0 84,752 1.3
Of-07
HF
HAMAMATSUCH
O BUILDING
9 100.0 55,845 0.9 9 100.0 56,073 0.9
Of-08 HF TAMEIKE
BUILDING 6 85.7 73,448 1.2 6 100.0 77,475 1.2
Of-09
GRACE
BUILDING
SENGAKUJIMAE
9 100.0 60,419 1.0 9 100.0 60,581 1.0
Of-11
HF NIHONBASHI
ODENMACHO
BUILDING
7 100.0 67,631 1.1 7 100.0 67,346 1.1
Of-12 HF HATCHOBORI
BUILDING 8 100.0 75,419 1.2 8 100.0 75,866 1.2
Of-17 HATCHOBORI MF
BUILDING 9 100.0 32,991 0.5 9 100.0 31,458 0.5
Of-18 M2 HARAJUKU 4 85.6 97,653 1.6 4 85.6 96,344 1.5
Of-20 FUNABASHI
FACE BUILDING 9 100.0 119,715 1.9 9 100.0 120,100 1.9
Of-21 ADESSO
NISHIAZABU 3 75.1 10,404 0.2 2 54.6 7,413 0.1
Of-23 HF IKEBUKURO
BUILDING 9 100.0 42,387 0.7 9 100.0 42,513 0.7
Of-24 HF YUSHIMA
BUILDING 9 100.0 50,143 0.8 9 100.0 50,182 0.8
Of-25 KAYABACHO
HEIWA BUILDING 1 100.0 207,966 3.4 1 100.0 207,644 3.3
Of-27
KOBE
KYUKYORYUCHI
HEIWA BUILDING
39 97.9 143,303 2.3 38 97.9 143,045 2.3
Of-29 SAKAE MINAMI
HEIWA BUILDING 8 100.0 89,429 1.4 8 100.0 89,720 1.4
Of-30 HF SAKURADORI
BUILDING 23 100.0 325,574 5.3 23 100.0 326,295 5.2
Of-31
HF NIHONBASHI
HAMACHO
BUILDING
8 100.0 92,412 1.5 8 100.0 90,929 1.4
Of-32
HF SENDAI
HONCHO
BUILDING
39 98.9 142,899 2.3 40 100.0 147,324 2.3
Of-33 HF UENO
BUILDING 7 100.0 141,185 2.3 7 100.0 140,416 2.2
Of-34 KOJIMACHI HF
BUILDING 8 100.0 72,217 1.2 8 100.0 72,193 1.1
20

Property name
38th Fiscal Period
(As of November 30, 2020)
39th Fiscal Period
(As of May 31, 2021)
Number
of tenants
(at end of
period) (Note 1)
Occupancy
rate
(at end of
period) (Note 2)
(%)
Rent
revenue-
real estate
(at end of
period) (Note 3) (thousand
yen)
Ratio of
total rent
revenue-
real estate (Note 4)
(%)
Number
of tenants
(at end of
period) (Note 1)
Occupancy
rate
(at end of
period) (Note 2)
(%)
Rent
revenue-
real estate
(at end of
period) (Note 3)
(thousand yen)
Ratio of
total rent
revenue-
real estate (Note 4)
(%)
Of-35
HF KUDAN
MINAMI
BUILDING
2 86.5 90,802 1.5 3 100.0 96,866 1.5
Of-36
HF KANDA
OGAWAMACHI
BUILDING
8 100.0 111,725 1.8 8 100.0 110,420 1.7
Of-37 NISSO 5
BUILDING 1 100.0 87,218 1.4 1 100.0 87,218 1.4
Of-38
ACROSS
SHINKAWA
BUILDING
(Note 6)
12 100.0 110,805 1.8 14 100.0 117,892 1.9
Of-39 SENJU MILDIX Ⅱ 7 100.0 68,204 1.1 6 100.0 71,553 1.1
Of-40 ARK Mori Building 1 100.0 Undisclosed
(Note 7)
Undisclosed
(Note 7) 1 100.0
Undisclosed
(Note 7)
Undisclosed
(Note 7)
Of-41 Nihonbashi
Horidomecho First 3 100.0 62,615 1.0 3 100.0 62,211 1.0
Of-42 SOUTHERN SKY
TOWER HACHIOJI 3 100.0 69,277 1.1 3 100.0 68,835 1.1
Of-43 HAMACHO
HEIWA BUILDING 10 100.0 93,560 1.5 9 94.8 92,170 1.5
Of-44
KINSHICHO
SQUARE
BUILDING
10 100.0 77,401 1.3 10 100.0 76,734 1.2
Of-45
KABUTO-CHO
UNI-SQUARE
(Note 6)
5 100.0 63,786 1.0 8 100.0 80,304 1.3
Of-46
TORYO
BUILDING
(Note 6) - - - - 12 95.6 75,257 1.2
Office subtotal 286 98.3 2,975,510 48.1 302 99.3 3,066,656 48.5
Re-03 HF ICHIKAWA
RESIDENCE 36 100.0 17,280 0.3 36 100.0 17,286 0.3
Re-05 HF MEGURO
RESIDENCE 21 100.0 21,146 0.3 20 95.1 20,145 0.3
Re-09 HF KASAI
RESIDENCE 47 97.9 26,390 0.4 46 95.8 25,773 0.4
Re-11
HF
WAKABAYASHI-
KOEN
RESIDENCE
97 100.0 120,797 2.0 93 96.1 119,414 1.9
Re-12 HF HIMONYA
RESIDENCE 51 95.7 46,360 0.7 50 95.1 43,174 0.7
Re-14
HF
MINAMIAZABU
RESIDENCE
59 98.3 34,588 0.6 57 95.0 35,008 0.6
Re-16
HF
GAKUGEIDAIGA
KU RESIDENCE
26 95.8 25,595 0.4 27 100.0 27,144 0.4
21

Property name
38th Fiscal Period
(As of November 30, 2020)
39th Fiscal Period
(As of May 31, 2021)
Number
of tenants
(at end of
period) (Note 1)
Occupancy
rate
(at end of
period) (Note 2)
(%)
Rent
revenue-
real estate
(at end of
period) (Note 3) (thousand
yen)
Ratio of
total rent
revenue-
real estate (Note 4)
(%)
Number
of tenants
(at end of
period) (Note 1)
Occupancy
rate
(at end of
period) (Note 2)
(%)
Rent
revenue-
real estate
(at end of
period) (Note 3)
(thousand yen)
Ratio of
total rent
revenue-
real estate (Note 4)
(%)
Re-17
HF
HIGASHIKANDA
RESIDENCE
63 97.9 37,296 0.6 64 100.0 37,162 0.6
Re-18
HF
HIGASHINIHONB
ASHI RESIDENCE
64 96.2 42,994 0.7 65 98.8 41,102 0.6
Re-19 HF NERIMA
RESIDENCE 51 100.0 23,426 0.4 50 98.1 25,630 0.4
Re-20
HF
SHIROKANETAK
ANAWA
RESIDENCE
64 97.2 123,995 2.0 64 97.0 114,258 1.8
Re-21 HF MEIDAIMAE
RESIDENCE 52 98.2 27,465 0.4 53 100.0 29,092 0.5
Re-22 HF NIHONBASHI
RESIDENCE 47 98.4 34,326 0.6 46 96.6 34,139 0.5
Re-23
HF
KAMISHAKUJII
RESIDENCE
64 100.0 31,601 0.5 64 100.0 32,129 0.5
Re-24 HF KINSHICHO
RESIDENCE 56 100.0 33,447 0.5 56 100.0 32,483 0.5
Re-25 HF GINZA
RESIDENCE EAST 102 97.0 131,187 2.1 100 94.9 132,729 2.1
Re-26
HF SHIN-
YOKOHAMA
RESIDENCE
110 97.3 84,981 1.4 105 93.7 86,781 1.4
Re-29 HF HAKUSAN
RESIDENCE 50 98.1 58,065 0.9 49 96.0 59,816 0.9
Re-30 HF MAGOME
RESIDENCE 30 100.0 43,609 0.7 29 97.0 43,404 0.7
Re-31
HF
GAKUGEIDAIGA
KU RESIDENCE
Ⅱ
21 95.6 33,679 0.5 22 100.0 36,901 0.6
Re-33 HF KAMEIDO
RESIDENCE 59 96.7 32,991 0.5 61 100.0 31,523 0.5
Re-34 HF TANASHI
RESIDENCE 34 97.1 30,902 0.5 33 94.5 30,991 0.5
Re-35 HF SHIBA-KOEN
RESIDENCE 27 90.1 24,079 0.4 28 93.0 23,372 0.4
Re-36 HF MITA
RESIDENCE 46 97.8 34,795 0.6 44 93.9 32,518 0.5
Re-37 HF TAKANAWA
RESIDENCE 29 100.0 26,319 0.4 - - 7,646 0.1
Re-38 La Residence de
Shirokanedai 28 100.0 23,047 0.4 27 96.5 24,056 0.4
Re-39
HF GINZA
RESIDENCE EAST
Ⅱ
73 98.7 50,821 0.8 74 100.0 51,002 0.8
22

Property name
38th Fiscal Period
(As of November 30, 2020)
39th Fiscal Period
(As of May 31, 2021)
Number
of tenants
(at end of
period) (Note 1)
Occupancy
rate
(at end of
period) (Note 2)
(%)
Rent
revenue-
real estate
(at end of
period) (Note 3) (thousand
yen)
Ratio of
total rent
revenue-
real estate (Note 4)
(%)
Number
of tenants
(at end of
period) (Note 1)
Occupancy
rate
(at end of
period) (Note 2)
(%)
Rent
revenue-
real estate
(at end of
period) (Note 3)
(thousand yen)
Ratio of
total rent
revenue-
real estate (Note 4)
(%)
Re-40 HF HATCHOBORI
RESIDENCE Ⅱ 84 100.0 56,778 0.9 81 96.4 58,796 0.9
Re-41 HF HATCHOBORI
RESIDENCE Ⅲ 35 94.7 29,090 0.5 36 96.9 29,502 0.5
Re-42 HF GINZA
RESIDENCE 44 97.8 33,450 0.5 45 100.0 30,867 0.5
Re-43
HF KOMAZAWA-
KOEN
RESIDENCE
TOWER
282 98.5 205,561 3.3 280 97.7 208,412 3.3
Re-44
HF
UMEDA
RESIDENCE
TOWER (Note 5)
- - 27,419 0.4 - - - -
Re-45
HF
NAKANOSHIMA
RESIDENCE
37 96.9 19,173 0.3 34 89.3 18,792 0.3
Re-46 HF AWAZA
RESIDENCE 61 97.0 23,735 0.4 60 95.3 23,251 0.4
Re-47 HF MARUNOUCHI
RESIDENCE 70 97.2 26,633 0.4 68 94.4 27,123 0.4
Re-48 HF HIRAO
RESIDENCE 193 96.5 81,697 1.3 191 95.3 80,409 1.3
Re-49
HF
KAWARAMACHI
NIJO RESIDENCE
48 95.9 18,380 0.3 49 97.8 18,378 0.3
Re-53
HF SHIJO
KAWARAMACHI
RESIDENCE
131 100.0 75,362 1.2 129 96.7 73,458 1.2
Re-54 La Residence de
Sendagi 49 98.2 28,093 0.5 49 98.2 28,731 0.5
Re-55 HF SENDAGI
RESIDENCE 49 100.0 31,115 0.5 47 94.1 32,216 0.5
Re-56
HF KOMAZAWA-
KOEN
RESIDENCE
36 100.0 20,155 0.3 35 97.2 20,922 0.3
Re-57
HF
MUSASHIKOYAM
A RESIDENCE
52 100.0 33,217 0.5 51 98.2 33,079 0.5
Re-58 HF KOKUBUNJI
RESIDENCE 46 98.0 31,634 0.5 45 96.4 30,140 0.5
Re-59 HF HISAYAODORI
RESIDENCE 98 100.0 40,969 0.7 94 96.1 42,115 0.7
Re-60
HF KARASUMA
KURAMAGUCHI
RESIDENCE
41 100.0 21,344 0.3 39 95.7 22,653 0.4
Re-61
HF NISHI-
SHINJUKU
RESIDENCE
WEST
76 98.4 67,834 1.1 73 95.0 68,928 1.1
23

Property name
38th Fiscal Period
(As of November 30, 2020)
39th Fiscal Period
(As of May 31, 2021)
Number
of tenants
(at end of
period) (Note 1)
Occupancy
rate
(at end of
period) (Note 2)
(%)
Rent
revenue-
real estate
(at end of
period) (Note 3) (thousand
yen)
Ratio of
total rent
revenue-
real estate (Note 4)
(%)
Number
of tenants
(at end of
period) (Note 1)
Occupancy
rate
(at end of
period) (Note 2)
(%)
Rent
revenue-
real estate
(at end of
period) (Note 3)
(thousand yen)
Ratio of
total rent
revenue-
real estate (Note 4)
(%)
Re-62
HF NISHI-
SHINJUKU
RESIDENCE EAST
46 95.2 41,077 0.7 46 95.6 41,761 0.7
Re-63
HF HIGASHI-
SHINJUKU
RESIDENCE
68 100.0 48,379 0.8 64 94.4 47,446 0.8
Re-64
HF HIGASHI-
SHINSAIBASHI
RESIDENCE
38 100.0 21,406 0.3 38 100.0 21,283 0.3
Re-65
HF KITA-
YOBANCHO
RESIDENCE
90 100.0 36,137 0.6 87 96.7 38,153 0.6
Re-66 HF ATAGOBASHI
RESIDENCE 78 98.7 31,269 0.5 76 96.3 32,647 0.5
Re-67
HF
KYUDAIBYOINM
AE RESIDENCE
47 100.0 19,136 0.3 45 95.0 19,013 0.3
Re-68
HF
ASAKUSABASHI
RESIDENCE
38 97.4 26,802 0.4 39 100.0 26,394 0.4
Re-69 HF ICHIBANCHO
RESIDENCE 77 98.8 38,669 0.6 73 94.1 40,622 0.6
Re-70
HF HIGASHI-
NAKANO
RESIDENCE
49 100.0 30,199 0.5 47 96.7 31,742 0.5
Re-72 HF WASEDA
RESIDENCE 117 96.7 76,007 1.2 116 96.3 76,294 1.2
Re-73 HF WASEDA
RESIDENCE Ⅱ 51 100.0 31,959 0.5 48 94.2 31,656 0.5
Re-74
HF WAKAMATSU-
KAWADA
RESIDENCE
32 96.3 39,750 0.6 32 97.8 39,763 0.6
Re-75 HF SENDAI
RESIDENCE EAST 146 97.6 66,533 1.1 146 97.6 67,442 1.1
Re-76 HF NISHI-KOEN
RESIDENCE 100 98.1 43,098 0.7 99 97.0 43,858 0.7
Re-77 HF BANSUI-DORI
RESIDENCE 66 100.0 25,098 0.4 65 98.5 27,236 0.4
Re-78 HF KANNAI
RESIDENCE 116 99.1 63,233 1.0 117 100.0 63,710 1.0
Re-79 HF MEIEKI-KITA
RESIDENCE 113 100.0 58,591 0.9 110 97.5 62,608 1.0
Re-80
HF HIGASHI-
SAPPORO
RESIDENCE
149 98.5 56,710 0.9 143 93.0 57,526 0.9
Re-81
HF HAKATA-
HIGASHI
RESIDENCE
74 94.9 29,065 0.5 77 98.7 29,416 0.5
24

Property name
38th Fiscal Period
(As of November 30, 2020)
39th Fiscal Period
(As of May 31, 2021)
Number
of tenants
(at end of
period) (Note 1)
Occupancy
rate
(at end of
period) (Note 2)
(%)
Rent
revenue-
real estate
(at end of
period) (Note 3) (thousand
yen)
Ratio of
total rent
revenue-
real estate (Note 4)
(%)
Number
of tenants
(at end of
period) (Note 1)
Occupancy
rate
(at end of
period) (Note 2)
(%)
Rent
revenue-
real estate
(at end of
period) (Note 3)
(thousand yen)
Ratio of
total rent
revenue-
real estate (Note 4)
(%)
Re-82
HF SENDAI
ITSUTSUBASHI
RESIDENCE
54 98.2 24,936 0.4 47 85.4 26,260 0.4
Re-83 HF TABATA
RESIDENCE 55 98.6 42,139 0.7 55 98.6 41,534 0.7
Re-84 HF RYOGOKU
RESIDENCE 66 100.0 49,585 0.8 65 98.8 52,928 0.8
Re-85 HF HACHIOJI
RESIDENCE 49 96.9 32,833 0.5 48 94.9 34,327 0.5
Re-86 HF MITA
RESIDENCE Ⅱ 38 95.1 31,005 0.5 37 92.5 30,364 0.5
Re-87
HF MONZEN-
NAKACHO
RESIDENCE
44 100.0 28,376 0.5 42 95.5 28,961 0.5
Re-88
HF MINAMI-
SUNAMACHI
RESIDENCE
48 100.0 27,487 0.4 46 95.8 27,131 0.4
Re-89
HF SENDAI
NAGAMACHI
RESIDENCE
(Note 5)
69 100.0 33,380 0.5 67 96.8 33,804 0.5
Re-90
HF SHOKOJI
AKABANE
RESIDENCE
(Note 5)
49 100.0 36,865 0.6 48 98.5 40,910 0.6
Re-91
HF SENDAI
HONCHO
RESIDENCE
39 56.6 12,298 0.2 67 97.1 27,920 0.4
Re-92
HF OHORI
RESIDENCE
BAYSIDE
(Note 5)
63 94.4 11,039 0.2 67 100.0 34,954 0.6
Re-93
HF HAKATA-
HIGASHI
RESIDENCEⅡ
(Note 6)
- - - - 105 96.1 18,341 0.3
Re-94
HF FUKUOKA
RESIDENCE
EAST(Note 6) - - - - 113 94.5 20,800 0.3
Residence subtotal 4,908 97.8 3,205,919 51.9 5,044 96.4 3,259,290 51.5
Total 5,194 97.9 6,181,430 100.0 5,346 97.4 6,325,946 100.0
(Note 1) Number of tenants is the number of end tenants whose lessors are the Investment Corporation, trusteed and master lease companies (number of
rental units for residential properties).
The number of tenants for the fixed-rent office property is 1. (Note 2) Occupancy rate is the ratio of rental area to rentable area.
(Note 3) Rent revenue-real estate is leasing business revenue from each property in the fiscal period.
(Note 4) Ratio of total rent revenue-real estate is the ratio of rental revenue from each property to rental revenue from the entire portfolio. (Note 5) Re-92 HF OHORI RESIDENCE BAYSIDE was acquired on September 30, 2020. Re-44 HF UMEDA RESIDENCE TOWER was transferred
on August 5, 2020.
(Note 6) Of-46 TORYO BUILDING was acquired on December 17, 2020. Re-93 HF HAKATA-HIGASHI RESIDENCEⅡand HF FUKUOKA
RESIDENCE EAST were acquired on March 24, 2021. Of-38 ACROSS SHINKAWA BUILDING was acquired on March 19, 2021 to raise its
building ownership ratio. Of-45 KABUTO-CHO UNI-SQUARE was acquired on March 23, 2021 to own the building completely. In addition, Re-37 HF TAKANAWA RESIDENCE was transferred on January 22, 2021.
25

(Note 7) These figures are not disclosed because no consent of the master lease company and the property management company has been obtained.
(4) Schedule of securities incorporated into assets
Not applicable
(5) Schedule of renewable energy power generation facilities
Not applicable
(6) Schedule of public facilities management rights
Not applicable
26

(7) Status of other assets
Real estate owned by the Investment Corporation and trust beneficial interests in real estate owned by the Investment
Corporation are stated in 3. Status of Investment properties (3) Summary of portfolio properties.
The major other specified assets that the Investment Corporation makes major invests in are stated below.
Table of contract amounts and market prices of specified transactions
(Unit: thousand yen)
Classification Type
Contract amount (Note 1)
Market price (Note 2)
Contract period of
over a year
Transactions other than
market transactions
Interest rate swaps Pay
fixed, receive floating 63,313,000 51,244,000 -247,139
Total 63,313,000 51,244,000 -247,139
(Note 1) The contract amounts of interest rate swaps are based on notional amounts.
(Note 2) The market prices are based on quotes from financial institutions
(Note 3) Of transactions reflected in the Market price, transactions to which special treatment for interest rate swaps are applied under the Accounting
Standard for Financial instruments (ASBJ Statement No. 10, March 10, 2008) are not evaluated on a mark-to-market basis in the balance sheet.
(8) Asset holdings by country and region
No asset holdings in countries or regions outside Japan
4. Capital expenditures for properties held
(1) Planned capital expenditure
Major capital expenditures for repair work at properties owned by the REIT planned as of the date of the creation of
this report are shown below.
The estimate in the table may include expenses in accounting.
The REIT will continue to work to prepare an efficient repair plan for each property to maintain and improve the
competitiveness of assets under management from a medium- to long-term perspective and will repair properties and
make capital expenditures.
Property name Address Purpose Scheduled period
Estimated construction costs (thousand yen)
Total
amount
Payment in
the period
Amount
already paid
Of-06
HF
MONZENNAKACH
O BUILDING
Koto-ku,
Tokyo
Air conditioning
equipment
replacement
From June 2021
To November 2021 13,000 - -
Of-11
HF NIHONBASHI
ODENMACHO
BUILDING
Chuo-ku,
Tokyo
Repair of
mechanical parking
facilities
From June 2021
To November 2021 25,600 - -
Transforming
equipment
replacement
From June 2021
To November 2021 12,500 - -
Of-31
HF NIHONBASHI
HAMACHO
BUILDING
Chuo-ku,
Tokyo
Air conditioning
equipment
replacement
From June 2021
To November 2021 15,000 - -
Of-37 NISSO 5 BUILDING
Yokohama
City,
Kanagawa
Air conditioning
equipment
replacement
From June 2021
To November 2021 10,250 - -
Of-38
ACROSS
SHINKAWA
BUILDING
Chuo-ku,
Tokyo
Air conditioning
equipment
replacement
From June 2021
To November 2021 24,000 - -
27

Of-44
KINSHICHO
SQUARE
BUILDING
Sumida-ku,
Tokyo
Transforming
equipment
replacement
From June 2021
To November 2021 25,000 - -
Of-45 KABUTO-CHO
UNI-SQUARE
Chuo-ku,
Tokyo
Repair of
mechanical parking
facilities
From June 2021
To November 2021 10,000 - -
Re-19 HF NERIMA
RESIDENCE
Nerima-ku,
Tokyo
Comprehensive
repair of outer walls
From June 2021
To November 2021 42,000 - -
Re-31
HF
GAKUGEIDAIGAK
U RESIDENCE Ⅱ
Meguro-ku,
Tokyo
Comprehensive
repair of outer walls
From June 2021
To November 2021 37,000 - -
Re-58 HF KOKUBUNJI
RESIDENCE
Kokubunji
City,
Tokyo
Comprehensive
repair of outer walls
From June 2021
To November 2021 24,000 - -
Re-93
HF HAKATA-
HIGASHI
RESIDENCEⅡ
Fukuoka City,
Fukuoka
Renovation of
common-area
corridors
From June 2021
To November 2021 10,000 - -
Re-94 HF FUKUOKA
RESIDENCE EAST
Fukuoka City,
Fukuoka
Renovation of
common-area
corridors
From June 2021
To November 2021 12,000 - -
28

(2) Capital expenditures in the fiscal period
Below is a list of major work at properties owned by the REIT for which capital expenditures were made in the 39th
fiscal period.
Capital expenditures in the fiscal period stood at 368,849 thousand yen. Expenses for repairs, etc. were 603,881
thousand yen, including repair expenses of 235,032 thousand yen.
These projects were undertaken to increase the satisfaction of existing tenants and ensure a competitive edge
attracting new tenants.
Property name Address Purpose Scheduled period Estimated
construction costs (thousand yen)
Of-06
HF
MONZENNAKACHO
BUILDING
Koto-ku,
Tokyo OA floor replacement
From April 2021
To April 2021 6,290
Of-29 SAKAE MINAMI
HEIWA BUILDING
Nagoya City,
Aichi
Repair of mechanical parking
facilities
From March 2021
To March2021 6,100
Of-31 HF NIHONBASHI
HAMACHO BUILDING Chuo-ku, Tokyo
Air conditioning equipment
replacement
From December
2020
To May 2020
12,150
Of-36
HF KANDA
OGAWAMACHI
BUILDING
Chiyoda-ku,
Tokyo
Switchover to LED lamps
In common-area
From April 2021
To April 2021 6,340
Of-37 NISSO 5 BUILDING Yokohama City,
Kanagawa
Air conditioning equipment
replacement
From May 2021
To May 2021 6,400
Of-38 ACROSS SHINKAWA
BUILDING Chuo-ku, Tokyo
Smoke control equipment
replacement
From November
2020
To January 2021
13,658
Of-41 Nihonbashi Horidomecho
First Chuo-ku, Tokyo
Renovation of common-area
lavatories
From November
2020
To December 2020
5,115
Of-43 HAMACHO HEIWA
BUILDING Chuo-ku, Tokyo
Repair of mechanical parking
facilities
From May 2021
To May 2021 5,800
Of-46 TORYO BUILDING Sendai City,
Miyagi
Fire extinguishment equipment
replacement
From February 2021
To February 2021 7,300
Re-72 HF WASEDA
RESIDENCE
Shinjuku-ku,
Tokyo
Renovation of common-area
corridors
From March 2021
To May 2021 10,026
Re-73 HF WASEDA
RESIDENCE Ⅱ
Shinjuku-ku,
Tokyo
Renovation of common-area
corridors
From March 2021
To May 2021 6,600
Re-85 HF HACHIOJI
RESIDENCE
Hachioji City,
Tokyo
Comprehensive repair of outer
walls
From June 2020
To December 2020 58,697
Others
From December
2020
To May 2021
224,371
Total 368,849
29

(3) Reserve funds for long-term repair plans
The REIT has the repair reserves shown below. It appropriates a part of cash flows for major medium- to long-term
repairs according to the long-term repair plan for each property.
(Unit: thousand yen)
Fiscal period
35th FP
May 31,
2019
36th FP
November 30,
2019
37th FP
May 31,
2020
38th FP
November 30,
2020
39th FP
May 31,
2021
Reserves at beginning of
fiscal period - - - - -
Provision for reserves in
the fiscal period - - - - -
Reversal of reserves in the
fiscal period - - - - -
Reserves brought forward - - - - -
(Note 1) In addition to the reserves above, the REIT has repair reserves of 379,056 thousand yen at the end of the 39th period under the management
bylaws primarily for the buildings of which the REIT is a unit owner. (Note 2) From the 20th fiscal period, the REIT does not provide funds to the repair reserves if the REIT is able to cover expenditures for repairs in each
fiscal period using the cash flows for that fiscal period.
5. Expenses and liabilities
(1) Expense items related to asset management
(Unit: thousand yen)
Item 38th Fiscal Period
(As of November 30, 2020)
39th Fiscal Period
(As of May 31, 2021)
(a) Asset management fee (Note) 586,845 600,615
(b) Asset custody fee 11,473 11,626
(c) Administrative service fee 39,215 27,705
(d) Directors' compensation 6,293 6,293
(e) Audit fee 11,660 11,660
(f) Other operating expenses 148,308 146,593
Total 803,794 804,495
(Note) In addition to the asset management fee above, management fees related to property acquisitions of 11,500 thousand yen (38th period) and 68,595 thousand yen (39th period) were recorded. Management fees related to property transfers of 26,200 thousand yen (38th period) and
11,300 thousand yen (39th period) were also recorded.
30

(2) Status of borrowings
Below is the status of borrowings from each financial institution at the end of the fiscal period.
(Unit: thousand yen)
Classification Borrowing
date
Balance at
the
beginning
of the
period
Balance at
the end of
the period
Average
interest
rate (%)
(Note 1)
Maturity Repayment
method Purpose Summary
Lender
Long-term
loans
payable
Due
within
One Year
Development
Bank of Japan
Inc.
December
20, 2013 1,000,000 - 1.46168
May 31,
2021
Lump-sum
repayment
(Note 3)
Unsecured
and
Unguaranteed
Sumitomo
Mitsui Banking
Corporation
May 30,
2014
631,700 -
1.00736 May 31,
2021
Lump-sum
repayment
Aozora Bank,
Ltd. 450,000 -
MUFG Bank,
Ltd. 225,000 -
Mizuho Trust &
Banking Co.,
Ltd.
1,786,700 -
Sumitomo
Mitsui Trust
Bank, Limited.
690,800 -
MUFG Bank,
Ltd.
May 30,
2014 800,000 800,000 1.04451
October
31, 2021
Lump-sum
repayment
ORIX Bank
Corporation
May 29,
2015 480,000 480,000 0.66700
October
31, 2021
Lump-sum
repayment
Aozora Bank,
Ltd.
October 30,
2015 940,000 940,000 0.61700
October
31, 2021
Lump-sum
repayment
Sumitomo
Mitsui Banking
Corporation
December
18, 2015
300,000 300,000
0.61700 October
31, 2021
Lump-sum
repayment
Aozora Bank,
Ltd. 100,000 100,000
MUFG Bank,
Ltd. 200,000 200,000
Sumitomo
Mitsui Trust
Bank, Limited.
300,000 300,000
Mizuho Bank,
Ltd. 200,000 200,000
The Nomura
Trust and
Banking Co.,
Ltd.
200,000 200,000
Shinsei Bank,
Limited 100,000 100,000
Aozora Bank,
Ltd.
October 31,
2017
- 1,250,000
0.47700 May 31,
2022
Lump-sum
repayment
Resona Bank,
Limited. - 950,000
Sumitomo
Mitsui Banking
Corporation - 500,000
31

MUFG Bank,
Ltd. - 180,000
Sumitomo
Mitsui Banking
October 31,
2018
1,390,000 1,390,000
0.34800 October
31, 2021
Lump-sum
repayment
Resona Bank,
Limited. 330,000 330,000
MUFG Bank,
Ltd. 480,000 480,000
Sumitomo
Mitsui Trust
Bank, Limited.
200,000 200,000
Sumitomo
Mitsui Banking
Corporation
May 31,
2019
- 300,000
0.26700 May 31,
2022
Lump-sum
repayment
MUFG Bank,
Ltd. - 215,000
The Bank of
Fukuoka, Ltd. - 200,000
ORIX Bank
Corporation - 200,000
The Nomura
Trust and
Banking Co.,
Ltd.
- 985,000
The
Norinchukin
Bank - 600,000
Sompo Japan
Insurance Inc. - 469,000
Sumitomo
Mitsui Trust
Bank, Limited.
March 19,
2020 1,100,000 - 0.25818
May 31,
2021 (note 2)
Lump-sum
repayment
Subtotal 11,904,200 11,869,000
Aozora Bank,
Ltd.
October 31,
2014
420,000 420,000
0.99951 October
31, 2022
Lump-sum
repayment
Mizuho Trust &
Banking Co.,
Ltd.
1,000,000 1,000,000
The Bank of
Fukuoka, Ltd. 500,000 500,000
Development
Bank of Japan
Inc.
December
4, 2014 900,000 900,000 1.24348
October
31, 2022
Lump-sum
repayment
Long-term
loans
payable
Resona Bank,
Limited.
May 29,
2015
480,000 480,000
1.02201 May 31,
2023
Lump-sum
repayment
(Note 3)
Unsecured
and
Unguaranteed
MUFG Bank,
Ltd. 1,400,000 1,400,000
Shinsei Bank,
Limited 200,000 200,000
Mizuho Bank,
Ltd. 800,000 800,000
Sumitomo
Mitsui Banking
Corporation October 29,
2015
1,100,000 1,100,000
1.08018 October
31, 2023
Lump-sum
repayment
Aozora Bank,
Ltd. 200,000 200,000
32

Resona Bank,
Limited. 500,000 500,000
MUFG Bank,
Ltd. 1,000,000 1,000,000
Mizuho Trust &
Banking Co.,
Ltd.
500,000 500,000
Sumitomo
Mitsui Trust
Bank, Limited.
900,000 900,000
Mizuho Bank,
Ltd. 200,000 200,000
Sumitomo
Mitsui Banking
Corporation October 30,
2015
2,440,000 2,440,000
1.20800 May 31,
2024
Lump-sum
repayment
Resona Bank,
Limited. 940,000 940,000
MUFG Bank,
Ltd. 1,500,000 1,500,000
Aozora Bank,
Ltd.
May 31,
2016 1,000,000 1,000,000 0.65900
October
31, 2022
Lump-sum
repayment
Sumitomo
Mitsui Banking
Corporation
May 31,
2016
1,050,000 1,050,000
0.91770 October
31, 2024
Lump-sum
repayment
Long-term
loans
payable
Resona Bank,
Limited. 1,600,000 1,600,000 (Note 3)
Unsecured
and
Unguaranteed
MUFG Bank,
Ltd. 500,000 500,000
Sumitomo
Mitsui Trust
Bank, Limited.
700,000 700,000
Sumitomo
Mitsui Banking
Corporation
October 31,
2016
1,585,000 1,585,000
0.93670 May 31,
2025
Lump-sum
repayment
Aozora Bank,
Ltd. 1,250,000 1,250,000
Resona Bank,
Limited. 452,000 452,000
MUFG Bank,
Ltd. 320,000 320,000
ORIX Bank
Corporation 250,000 250,000
Sumitomo
Mitsui Banking
Corporation
May 31,
2017
895,000 895,000
0.90850 November
28, 2025
Lump-sum
repayment
Resona Bank,
Limited. 915,000 915,000
Shinsei Bank,
Limited 485,000 485,000
MUFG Bank,
Ltd. 470,000 470,000
Aozora Bank,
Ltd. October 31,
2017
1,250,000 1,250,000
0.47700 May 31,
2022
Lump-sum
repayment
Resona Bank,
Limited. 950,000 950,000
33

Sumitomo
Mitsui Banking
Corporation
500,000 500,000
MUFG Bank,
Ltd. 180,000 180,000
Aozora Bank,
Ltd.
October 31,
2017
1,820,000 1,820,000
0.97750 May 31,
2026
Lump-sum
repayment
Long-term
loans
payable
Resona Bank,
Limited. 1,000,000 1,000,000
(Note 3)
Unsecured
and
Unguaranteed
Sumitomo
Mitsui Banking
Corporation
550,000 550,000
Mizuho Bank,
Ltd. 330,000 330,000
Mizuho Bank,
Ltd.
December
15, 2017 800,000 800,000 0.68740
October
31, 2024
Lump-sum
repayment
Sumitomo
Mitsui Banking
Corporation
March 28,
2018 900,000 900,000 0.78630
May 31,
2025
Lump-sum
repayment
Sumitomo
Mitsui Banking
Corporation
May 31,
2018
1,100,000 1,100,000
0.74700 November
30, 2026
Lump-sum
repayment
Sumitomo
Mitsui Trust
Bank, Limited.
900,000 900,000
Resona Bank,
Limited. 700,000 700,000
Aozora Bank,
Ltd. 700,000 700,000
MUFG Bank,
Ltd. 200,000 200,000
The Bank of
Fukuoka, Ltd. 200,000 200,000
The 77 Bank,
Ltd. 200,000 200,000
Sumitomo
Mitsui Banking
Corporation
October 31,
2018
600,000 600,000
0.76850 November
30, 2025
Lump-sum
repayment
Resona Bank,
Limited. 150,000 150,000
Aozora Bank,
Ltd. 100,000 100,000
MUFG Bank,
Ltd. 200,000 200,000
Mizuho Trust &
Banking Co.,
Ltd.
100,000 100,000
Sumitomo
Mitsui Trust
Bank, Limited.
100,000 100,000
Mizuho Bank,
Ltd. 100,000 100,000
The Bank of
Fukuoka, Ltd. 200,000 200,000
The 77 Bank,
Ltd. 200,000 200,000
34

Long-term
loans
payable
Mizuho Bank,
Ltd.
December
14, 2018 1,000,000 1,000,000 0.63850
November
30, 2025
Lump-sum
repayment
(Note 3) Unsecured
and
Unguaranteed
The Bank of
Fukuoka, Ltd.
December
14, 2018 700,000 700,000 0.63850
November
30, 2025
Lump-sum
repayment
Sumitomo
Mitsui Banking
Corporation
May 31,
2019
300,000 -
0.26700 May 31,
2022
Lump-sum
repayment
MUFG Bank,
Ltd. 215,000 -
The Bank of
Fukuoka, Ltd. 200,000 -
ORIX Bank
Corporation 200,000 -
The Nomura
Trust and
Banking Co.,
Ltd.
985,000 -
The
Norinchukin
Bank
600,000 -
Sompo Japan
Insurance Inc. 469,000 -
Sumitomo
Mitsui Banking
Corporation
May 31,
2019
300,000 300,000
0.60000 May 31,
2026
Lump-sum
repayment
Aozora Bank,
Ltd. 200,000 200,000
MUFG Bank,
Ltd. 300,000 300,000
The Bank of
Fukuoka, Ltd. 285,000 285,000
ORIX Bank
Corporation 600,000 600,000
The
Norinchukin
Bank
877,000 877,000
Sumitomo
Mitsui Banking
Corporation
October 31,
2019
1,000,000 1,000,000
0.32500 May 31,
2023
Lump-sum
repayment
Resona Bank,
Limited. 700,000 700,000
Sumitomo
Mitsui Trust
Bank, Limited.
500,000 500,000
The Nomura
Trust and
Banking Co.,
Ltd.
300,000 300,000
Shinsei Bank,
Limited 200,000 200,000
Sumitomo
Mitsui Banking
Corporation October 31,
2019
500,000 500,000
0.50500 May 31,
2025
Lump-sum
repayment Aozora Bank,
Ltd. 700,000 700,000
35
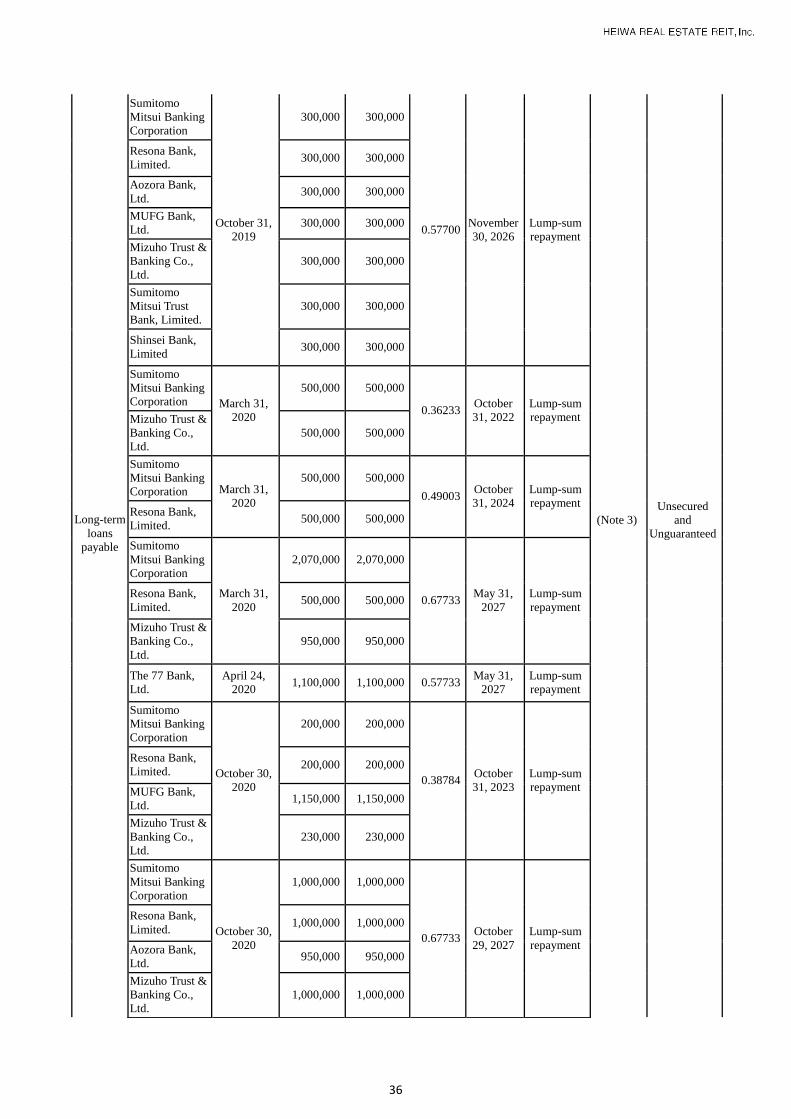
Long-term
loans
payable
Sumitomo
Mitsui Banking
Corporation
October 31,
2019
300,000 300,000
0.57700 November
30, 2026
Lump-sum
repayment
(Note 3)
Resona Bank,
Limited. 300,000 300,000
Unsecured
and
Unguaranteed
Aozora Bank,
Ltd. 300,000 300,000
MUFG Bank,
Ltd. 300,000 300,000
Mizuho Trust &
Banking Co.,
Ltd.
300,000 300,000
Sumitomo
Mitsui Trust
Bank, Limited.
300,000 300,000
Shinsei Bank,
Limited 300,000 300,000
Sumitomo
Mitsui Banking
Corporation March 31,
2020
500,000 500,000
0.36233 October
31, 2022
Lump-sum
repayment Mizuho Trust &
Banking Co.,
Ltd.
500,000 500,000
Sumitomo
Mitsui Banking
Corporation March 31,
2020
500,000 500,000
0.49003 October
31, 2024
Lump-sum
repayment Resona Bank,
Limited. 500,000 500,000
Sumitomo
Mitsui Banking
Corporation
March 31,
2020
2,070,000 2,070,000
0.67733 May 31,
2027
Lump-sum
repayment
Resona Bank,
Limited. 500,000 500,000
Mizuho Trust &
Banking Co.,
Ltd.
950,000 950,000
The 77 Bank,
Ltd.
April 24,
2020 1,100,000 1,100,000 0.57733
May 31,
2027
Lump-sum
repayment
Sumitomo
Mitsui Banking
Corporation
October 30,
2020
200,000 200,000
0.38784 October
31, 2023
Lump-sum
repayment
Resona Bank,
Limited. 200,000 200,000
MUFG Bank,
Ltd. 1,150,000 1,150,000
Mizuho Trust &
Banking Co.,
Ltd.
230,000 230,000
Sumitomo
Mitsui Banking
Corporation
October 30,
2020
1,000,000 1,000,000
0.67733 October
29, 2027
Lump-sum
repayment
Resona Bank,
Limited. 1,000,000 1,000,000
Aozora Bank,
Ltd. 950,000 950,000
Mizuho Trust &
Banking Co.,
Ltd.
1,000,000 1,000,000
36

(Note 1) Average interest rate is a weighted average during the fiscal period. For the borrowings for which interest rate swaps are used to avoid interest
rate risk, the estimated effect of the interest rate swaps is reflected on the average interest rate.
(Note 2) The full amount was repaid before its maturity on December 11, 2020.
(Note 3) The funds are used for the acquisition of real estate, etc. or the refinancing of interest-bearing debt.
Long-term
loans
payable
Sumitomo
Mitsui Trust
Bank, Limited.
300,000 300,000
(note 3)
Unsecured
and
Unguaranteed
The 77 Bank,
Ltd.
December
17, 2020 - 1,000,000 0.68122
November
30, 2028
Lump-sum
repayment
The Bank of
Fukuoka, Ltd.
March 24,
2021 - 1,000,000 0.66032
November
30, 2028
Lump-sum
repayment
Shinsei Bank,
Limited
March 24,
2021 - 1,000,000 0.68032
May 31,
2029
Lump-sum
repayment
MUFG Bank,
Ltd.
May 31,
2021 - 225,000 0.38754
May 31,
2024
Lump-sum
repayment
Sumitomo
Mitsui Banking
Corporation
May 31,
2021
- 631,700
0.67754 May 31,
2028
Lump-sum
repayment
Aozora Bank,
Ltd. - 450,000
Mizuho Trust &
Banking Co.,
Ltd. - 1,786,700
Sumitomo
Mitsui Trust
Bank, Limited. - 690,800
Development
Bank of Japan
Inc.
May 31,
2021 - 1,000,000 0.64125
May 31,
2028
Lump-sum
repayment
Subtotal 66,363,000 68,298,200
Total 78,267,200 80,167,200
37

(3) Investment corporation bonds
Below is the status of investment corporation bonds issued at the end of the fiscal period.
(Unit: thousand yen)
Name of bond Issued
date
Balance at
beginning of
period
Balance at
end of
period
Interest
rate (%)
Repayment
date
Repayment
method Use Remarks
Unsecured Investment
Corporation Bond #1
June 30,
2017 1,000,000 1,000,000 0.300%
June 30,
2022
Lump-sum
repayment or
Repurchase /
Cancellation
Repayment
of Loans
Unsecured Investment
Corporation Bond #2
June 30,
2017 1,800,000 1,800,000 0.650%
June 30,
2027
Lump-sum
repayment or
Repurchase /
Cancellation
Repayment
of Loans
Unsecured Investment
Corporation Bond #3
May 7,
2018 1,000,000 1,000,000 0.700%
May 2,
2028
Lump-sum
repayment or
Repurchase /
Cancellation
Repayment
of Loans
Unsecured Investment
Corporation Bond #4
June 4,
2019 1,000,000 1,000,000 0.410%
May 31,
2024
Lump-sum
repayment or
Repurchase /
Cancellation
Repayment
of Loans
Unsecured Investment
Corporation Bond #5
June 4,
2019 1,600,000 1,600,000 0.820%
May 31,
2029
Lump-sum
repayment or
Repurchase /
Cancellation
Repayment
of Loans
Unsecured Investment
Corporation Bond #6
November
25, 2020 1,500,000 1,500,000 0.750%
November
25, 2030
Lump-sum
repayment or
Repurchase /
Cancellation
Repayment
of Loans
Total 7,900,000 7,900,000
(4) Short-term investment corporation bonds
Not applicable
(5) Investment unit subscription rights
Not applicable
38

6. Status of purchases and sales in the fiscal period
(1) Real estate and asset-backed securities, etc. and infrastructure-related assets, etc.
Property name
Acquisition Transfer
Date of
acquisition
Acquisition
price (Note 1) (million yen)
Date of
transfer
Transfer
price (Note 1)
(million yen)
Book value (million yen)
Profit/loss on
sale (Note 2)
(million yen)
Of-38
ACROSS SHINKAWA
BUILDING
(Additional acquisition)
March 19,
2021 500 - - - -
Of-45
KABUTO-CHO
UNI-SQUARE
(Additional acquisition)
March 23,
2021 1,480 - - - -
Of-46 TORYO BUILDING December 17,
2020 2,501 - - - -
Re-93
HF HAKATA-
HIGASHI
RESIDENCEⅡ
March 24,
2021 1,198 - - - -
Re-94 HF FUKUOKA
RESIDENCE EAST
March 24,
2021 1,180 - - - -
Re-37 HF TAKANAWA
RESIDENCE - -
January 22,
2021 1,130 702 404
Total - 6,859 - 1,130 702 404
(Note 1) Acquisition price and Transfer price do not include expenses necessary for the acquisition or transfer of the real estate, etc. (intermediary fees,
taxes and public dues, etc.) (transfer amount stated in the sales agreement, etc.).
(Note 2) Profit/loss on sale is the transfer price less the book value less sale costs.
(2) Status of purchases and sales of other assets
Major assets other than the real estate and asset-backed securities, etc. above are bank deposits and bank deposits in
trust property.
(3) Appraisal or price, etc. of specified assets
(i) Real estate, etc.
Acquisition
or transfer Asset type Name of real estate
Date of
acquisition
or
transfer
Acquisition
price or
transfer price (million yen)
(Note)
Real estate
appraisal value (million yen)
Real estate
appraisal
organization
Valuation
date
Acquisition
Trust
beneficial
interest
Of-38
ACROSS
SHINKAWA
BUILDING
(Additional
acquisition)
March 19,
2021 500 750
Daiwa Real Estate
Appraisal Co., Ltd
January 31,
2021
Acquisition
Trust
beneficial
interest
Of-45
KABUTO-
CHO
UNI-
SQUARE
(Additional
acquisition)
March 23,
2021 1,480 1,600
Daiwa Real Estate
Appraisal Co., Ltd
February
28, 2020
Acquisition Real estate Of-46 TORYO
BUILDING
December
17, 2020 2,501 2,670
Daiwa Real Estate
Appraisal Co., Ltd
September
30, 2020
Acquisition Real estate Re-93
HF HAKATA-
HIGASHI
RESIDENCE
Ⅱ
March 24,
2021 1,198 1,370
Daiwa Real Estate
Appraisal Co., Ltd
January 31,
2021
39

Acquisition Real estate Re-94
HF
FUKUOKA
RESIDENCE
EAST
March 24,
2021 1,180 1,440
Daiwa Real Estate
Appraisal Co., Ltd
January 31,
2021
Transfer
Trust
beneficial
interest
Re-37
HF
TAKANAWA
RESIDENCE
January
22, 2021 1,130 965
Daiwa Real Estate
Appraisal Co., Ltd
November
30, 2020
(Note) Acquisition price and Transfer price do not include expenses necessary for the acquisition or transfer of the real estate, etc.
(intermediary fees, taxes and public dues, etc.) (transfer amount stated in the sales agreement, etc.).
(ii) Other
For transactions other than those stated in "① Real estate, etc." above among the transactions conducted by the
Investment Corporation that require an investigation into the value of specified assets pursuant to Article 201 of the
Act on Investment Trusts and Investment Corporations, the investigation has been entrusted to KPMG AZSA LLC.
Relevant transactions during the period covered (December 1, 2020 to May 31, 2021) were two interest rate swap
transactions, and the investigation report on these transactions was received from KPMG AZSA LLC. For the
investigation into interest rate swap transactions, the Investment Corporation entrusted the investigation into the
names of counterparties, contract values, transaction periods, and other matters related to the content of OTC
derivatives.
40

(4) Transactions with interested parties
(i) Status of transactions
(Unit: thousand yen)
Classification Trading value, etc. (Note 2)
Purchase amount, etc. Sales amount, etc.
Total 6,859,500 1,130,000
Breakdown of transactions with interested parties, etc. (Note 1)
Heiwa Real Estate Co., Ltd. - (-%) - (-%)
Total - (-%) - (-%)
(ii) Payment fees
(Unit: thousand yen)
Classification Total payment fees
(A)
Breakdown of transactions with interested parties, etc. (Note 1)
(B) / (A)
Payee Payment amount (B)
Management commissions: 672,432
Heiwa Real Estate Co., Ltd. (Note 5) 213,374 31.7%
Heiwa Real Estate Property
Management Co., Ltd. (Note 4) 4,897 0.7%
Non-life insurance premiums 8,055 Heiwa Real Estate Property
Management Co., Ltd. (Note 4) 7,993 99.2%
(Note 1) Interested parties, etc. are the interested parties, etc. of the asset management company that have concluded an asset management agreement
with the REIT that are set out in Article 201, Paragraph 1 of the Act on Investment Trusts and Investment Corporations, Article 123 of the Order for Enforcement of the Act on Investment Trusts and Investment Corporations (Cabinet Order No. 480 of 2000, including subsequent revisions)
and Article 26, Item 27 of the Investment Trusts Association, Japan's Rules on Management Reports, etc. of Investment Trusts and Investment
Corporations. (Note 2) Trading value, etc. is selling prices stated in agreements on sales of real estate and real estate trust beneficial interests.
(Note 3) Figures in parentheses are a percentage of the total amount.
(Note 4)Heiwa Service Co., Ltd. Has changed its company name to Heiwa Real Estate Property Management Co., Ltd. As of March 1, 2021. (Note 5) Of the amount above, amounts paid as building management fees by Heiwa Real Estate are as stated below.
Heiwa Real Estate Property Management Co., Ltd. 103,113 thousand yen
Third parties other than Heiwa Real Estate Property Management Co., Ltd. 37,559 thousand yen
(Note 6) Amounts paid to interested parties, etc., including the cost of repairs, other than the transactions above in the 39th fiscal period are as stated
below.
Heiwa Real Estate Property Management Co., Ltd. 43,306 thousand yen
(5) Transactions between the asset management company and its subsidiary businesses
HEIWA REAL ESTATE Asset Management CO., LTD., the asset management company of the REIT, does not have
any side businesses (Type I Financial Instruments Business, Type II Financial Instrument Business, building lots and
buildings transaction business, or real estate specified joint enterprise) and this item is not applicable.
7. Financial situation
(1) Situation of assets, liabilities, principal and profit and loss
Please refer to the balance sheet, profit and loss statement, statements of changes in net assets, Notes and statements
of cash dividend distributions.
(2) Change in method of calculating depreciation
Not applicable
(3) Change in valuation method for infrastructure assets including real estate
Not applicable
41

(4) Disclosure of investment trust beneficial securities issued by the REIT
(i) Status of acquisition
Not applicable
(ii) Status of holding
Below is data on investment units of the REIT held by the asset management company.
Number of investment units at
end of period
Value of investment units held
at end of period (Note)
(million yen)
Ratio to investment units issued
and outstanding (%)
30th FP November 30, 2016 3,334 337 0.3
31st FP May 31, 2017 3,334 337 0.3
32nd FP November 30, 2017 3,334 337 0.3
33rd FP May 31, 2018 3,334 337 0.3
34th FP November 30, 2018 3,334 337 0.3
35th FP May 31, 2019 3,334 337 0.3
36th FP November 30, 2019 3,334 337 0.3
37th FP May 31, 2020 3,334 337 0.3
38th FP November 30, 2020 3,334 337 0.3
39th FP May 31, 2021 3,334 337 0.3
(Note) Value of investment units held at end of period is an acquisition price.
8. Other
(1) Notice
The REIT held Board of Directors meetings in the 39th fiscal year. Summaries of the major agenda items resolved
by the Board of Directors are as follows.
Date of approval Item Summary
May 17, 2021 Conclusion of underwriting
agreement
In association with the issuance of new investment units, administrative services
related to the public offering of investment units were entrusted to SMBC Nikko
Securities Inc., Daiwa Securities Co., Ltd., Nomura Securities Co., Ltd., Mizuho
Securities Co., Ltd., Mitsubishi UFJ Morgan Stanley Securities Co., Ltd.,
IwaiCosmo Securities Co., Ltd., Okasan Securities Co., Ltd., Tokai Tokyo
Securities Co., Ltd., Toyo Securities Co., Ltd., Mito Securities Co., Ltd., Aizawa
Securities Co., Ltd., and Ichiyoshi Securities Co., Ltd.
(2) Disclosure related to overseas real estate held by the investment corporation
Not applicable.
(3) Disclosure related to real estate owned by the investment corporation holding overseas real estate
Not applicable.
(4) Rounding of amounts and percentages
In this report, unless otherwise stated, fractions are rounded down and percentages are rounded off.
42

Materiality Basic Policy Applicable SDGs
EnvironmentEnvironmentally friendly business operations
■ Environmentally friendly business operations■ Climate change mitigation (improvement of building performance and equipment
capacity for energy conservation)■ Adapting to climate change (flood control measures)■ Confirming the results of sustainability activities by obtaining external certification
Social
Providing tenants with security and peace of mind
Contributing to local communities
Creating a rewarding work environment
■ Tenants: Improving tenant satisfaction and increasing the value of properties under ownership by providing safety and security through barrier-free and disaster preparedness measures
■ Local community: Managing properties that help solve problems faced by local communities and that create livable urban developments, by attracting childcare, healthcare, and government facilities
■ J-REIT industry: Fostering the future investor base and contributing to the development of the J-REIT industry through J-REIT industry educational activities
■ PM, BM: Promoting sustainability in cooperation with PM companies and operators that manage working assets
■ Executives: Creating strong business results through employees’ healthy minds and bodies and enhanced expertise, by managing health, improving the workplace environment, enhancing work-life balance, and providing support to undergo training and obtain qualifications
GovernanceStrengthening corporate governance
■ Promoting initiatives to ensure corporate ethics across the board■ Establishing a governance system that ensures the impartiality and diversity of
investment corporation directors■ Promoting investment management with an emphasis on unitholder returns■ Ensuring transparency
The Heiwa Real Estate Group, as a company pursuing the realization of an affluent urban environment by providing comfortable offices and living spaces, is aware of the weight of its social responsibilities and strictly complies with any and all laws, regulations and rules. Moreover, the Group aims to be a company that perpetually earns the trust of society by observing the highest ethical standards. In accordance with this basic policy established as the Group's Code of Conduct, the Investment Corporation will strive to conduct business operations while taking into consideration the environment, society, and governance (ESG), and contributing to the development of a sustainable society as well as increasing medium- to long-term shareholder value.
ESG ESG Policy
1. Realizing sustainable urban development with safety and security
The Investment Corporation will promote disaster preparedness and support for people with disabilities to provide safety and security, and through these actions seek to increase the value of its properties. The Investment Corporation will also consider the risks and opportunities related to climate change and promote the reduction of energy consumption and the introduction of renewable energy to contribute to the realization of a low carbon society, and will advance the adaption of our portfolio to climate change.
2. Contributing to local communities
The Investment Corporation will place importance on coexistence with local communities as a good corporate citizen, and will endeavor to resolve problems faced by local communities by attracting tenants and through other methods, and will build trust by strengthening relations with the local area as well as increase the competitiveness of the Investment Corporation’s properties by boosting local-area value through operating properties that contribute to the development of areas to provide a comfortable life.
3. Creating a rewarding work environment
In cooperation with the Asset Management Company, the Investment Corporation will promote efforts to create a healthy, rewarding work environment, and will secure mental and physical comfort as well as a sense of affluence. The Investment Corporation will also endeavor to respect each individual employee, eliminate any and all discrimination and harassment, proactively work to enhance the professional expertise
of the officers and employees through human resource development including training and support for the acquisition of qualifications, and increase business growth, stability, and operational capacity by securing excellent human resources.
4. Strengthening corporate governance
The Investment Corporation will promote the establishment of an effective governance system that ensures the objectivity and diversity of its directors as well as reduce operational risks by strictly complying with laws and regulations pertaining to the Investment Corporation's operations, social norms and corporate ethics.
5. Sustainability-related education and awareness building
The Investment Corporation will conduct sustainability-related education and awareness building activities for the officers and employees of the Asset Management Company, the properties managers of the Investment Corporation, other suppliers, tenants, and all others concerned to enhance the level of motivation to achieve sustainability.
6. Facilitating communications
The Investment Corporation will endeavor to ensure transparency and communicate extensively with society through the acquisition of external certifications and the timely and accurate disclosure of information, and it will proactively disclose its ESG policies, activities, and other necessary information to unitholders, tenants, local communities, and business partners while seeking to build stakeholder trust and obtain appropriate ratings.
Materiality
43

For certain transactions with interested parties as set forth in the regulations of the Investment Corporation, it is necessary for the board of directors to make a resolution followed by a discussion and a final decision by the director’s meeting of the Investment Corporation. However, in the case of transactions with interested parties that are larger than a certain scale, it is necessary to obtain the prior agreement of the director’s meeting of the Investment Corporation before a resolution is passed by the board of directors.
■ Use of outside experts in internal audits (Asset Management Company)The Asset Management Company conducts its internal audits jointly with outside experts. It ensures objectivity in audits and responds to new or complex risks.
Corporate Governance
S Social
With the prolonged spread of COVID-19, the deterioration of the restaurant industry in particular has become increasingly serious. In this environment, the Heiwa Real Estate Group supports restaurants in the Nihonbashi-kabutocho area, where Heiwa Real Estate is based. The Group pays half of the prices of lunches and take-out meals on business days for officers and employees, thereby encouraging them to use local restaurants, with the aim of contributing to maintaining local business performance.
■ Support for the local restaurant industry
DBJ Green Building Certification Program
★★★★ ★★★ ★★
1 property 1 property 3 properties
CASBEE
★★★★★ ★★★★
4 properties 2 properties
■ Acquisition of external assessment and external rating
EnvironmentE
G Governance
BELS (Building Energy-efficiency Labeling System)
★★
2 properties
■ Process for making decisions regarding acquisition or sale of assetsFor certain transactions with interested parties as set forth in the regulations of the Investment Corporation, it is necessary for the board of directors to make a resolution followed by a discussion and a final decision by the director’s meeting of the Investment Corporation. However, in the case of transactions with interested parties that are larger than a certain scale, it is necessary to obtain the prior agreement of the director’s meeting of the Investment Corporation before a resolution is passed by the board of directors.
Asset Management Company Investment Corporation
Director's MeetingReport
In case of non sponsor related transaction
Board of Directors: D
ecision-Making
Com
pliance Com
mittee: Approve
Investment C
omm
ittee: Approve
Prepare an agenda item: Proposal
In case of sponsor related transaction
Director's MeetingDecision-Making
44

45

46

47
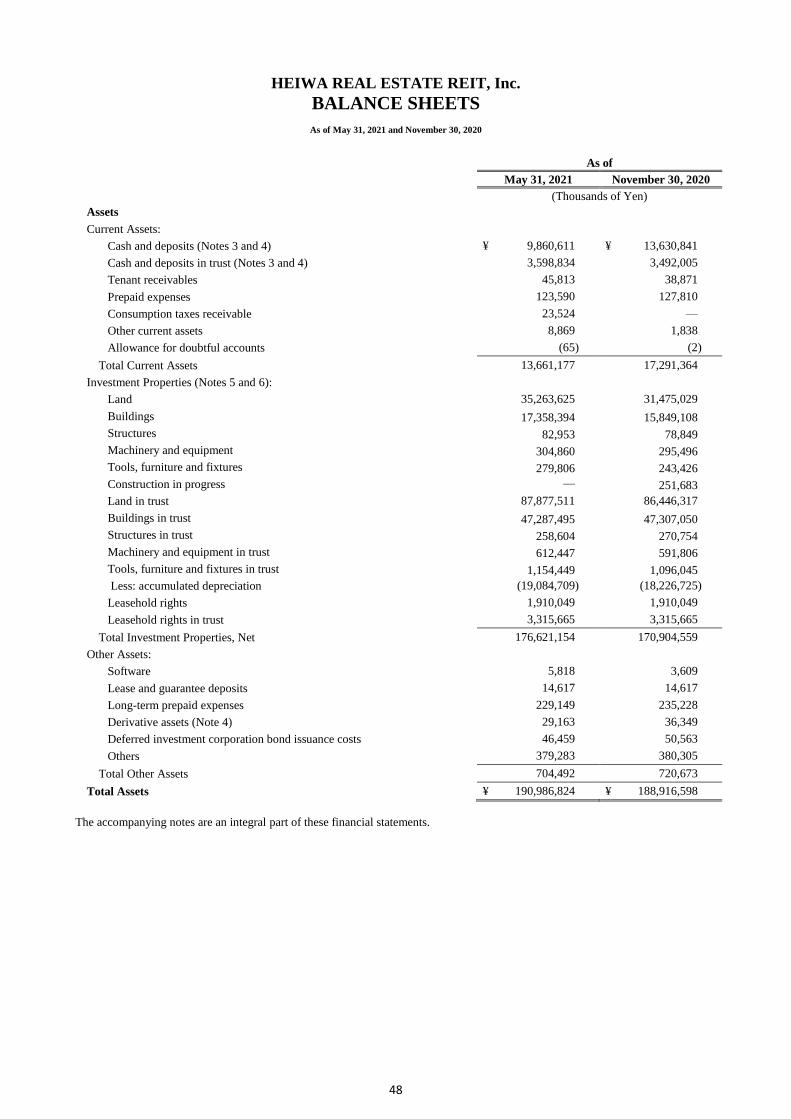
HEIWA REAL ESTATE REIT, Inc.
BALANCE SHEETS
As of May 31, 2021 and November 30, 2020
As of
May 31, 2021 November 30, 2020
(Thousands of Yen)
Assets
Current Assets:
Cash and deposits (Notes 3 and 4) ¥ 9,860,611 ¥ 13,630,841
Cash and deposits in trust (Notes 3 and 4) 3,598,834 3,492,005
Tenant receivables 45,813 38,871
Prepaid expenses 123,590 127,810
Consumption taxes receivable 23,524 —
Other current assets 8,869 1,838
Allowance for doubtful accounts (65) (2)
Total Current Assets 13,661,177 17,291,364
Investment Properties (Notes 5 and 6):
Land 35,263,625 31,475,029
Buildings 17,358,394 15,849,108
Structures 82,953 78,849
Machinery and equipment 304,860 295,496
Tools, furniture and fixtures 279,806 243,426
Construction in progress ― 251,683
Land in trust 87,877,511 86,446,317
Buildings in trust 47,287,495 47,307,050
Structures in trust 258,604 270,754
Machinery and equipment in trust 612,447 591,806
Tools, furniture and fixtures in trust 1,154,449 1,096,045
Less: accumulated depreciation (19,084,709) (18,226,725)
Leasehold rights 1,910,049 1,910,049
Leasehold rights in trust 3,315,665 3,315,665
Total Investment Properties, Net 176,621,154 170,904,559
Other Assets:
Software 5,818 3,609
Lease and guarantee deposits 14,617 14,617
Long-term prepaid expenses 229,149 235,228
Derivative assets (Note 4) 29,163 36,349
Deferred investment corporation bond issuance costs 46,459 50,563
Others 379,283 380,305
Total Other Assets 704,492 720,673
Total Assets ¥ 190,986,824 ¥ 188,916,598
The accompanying notes are an integral part of these financial statements.
48

HEIWA REAL ESTATE REIT, Inc.
BALANCE SHEETS, CONTINUED
As of May 31, 2021 and November 30, 2020
As of
May 31, 2021 November 30, 2020
(Thousands of Yen)
Liabilities
Current Liabilities:
Operating accounts payable ¥ 352,179 ¥ 507,184
Long-term debt due within one year (Notes 4 and 7) 11,869,000 11,904,200
Accrued expenses 715,622 732,134
Income taxes payable 595 271
Accrued consumption taxes ― 160,415
Advances received 1,104,773 1,071,742
Other current liabilities 14,020 25,029
Total Current Liabilities 14,056,190 14,400,978
Long-Term Liabilities:
Investment corporation bonds (Notes 4 and 8) 7,900,000 7,900,000
Long-term debt (Notes 4 and 7) 68,298,200 66,363,000
Tenant security deposits (Note 4) 823,499 720,120
Tenant security deposits in trust (Note 4) 4,514,754 4,381,685
Derivative liabilities (Note 4) 210,744 240,601
Total Long-Term Liabilities 81,747,198 79,605,408
Total Liabilities 95,803,389 94,006,386
Net Assets (Notes 9)
Unitholders’ Equity:
Unitholders’ capital 81,370,715 81,370,715
Units authorized: 8,000,000 units
Units issued and outstanding: 999,933 units
Capital surplus 7,406,652 7,406,652
Deduction from capital surplus (1,699,990) (1,699,990)
Reserve for reduction entry 415,683 415,683
Reserve for temporary difference adjustment (Note 10) 2,002,699 1,704,003
Retained earnings 5,871,290 5,933,582
Total Unitholders’ Equity 95,367,050 95,130,645
Valuation and translation adjustments:
Deferred gains or losses on hedges (183,615) (220,434)
Total valuation and translation adjustments (183,615) (220,434)
Total Net Assets 95,183,434 94,910,211
Total Liabilities and Net Assets ¥ 190,986,824 ¥ 188,916,598
The accompanying notes are an integral part of these financial statements.
49

HEIWA REAL ESTATE REIT, Inc.
STATEMENTS OF INCOME AND RETAINED EARNINGS
For the six months ended May 31, 2021 and November 30, 2020
For the six months ended
May 31, 2021 November 30, 2020
(Thousands of Yen)
Operating Revenues:
Rental revenues (Note 11) ¥ 5,831,007 ¥ 5,715,947
Other revenues related to property leasing (Note 11) 494,939 465,482
Gain on sales of investment properties (Note 12) 404,961 890,700
Total Operating Revenues 6,730,908 7,072,131
Operating Expenses (Note 18):
Property-related expenses (Note 11) 2,617,359 2,590,863
Asset management fees 600,615 586,845
Asset custody fees 11,626 11,473
Administrative service fees 27,705 39,215
Directors’ compensation 6,293 6,293
Independent auditors’ fees 11,660 11,660
Other operating expenses 146,594 148,308
Total Operating Expenses 3,421,854 3,394,658
Operating Income 3,309,053 3,677,472
Non-Operating Revenues:
Interest income 1,110 1,118
Reversal of distributions payable 457 465
Insurance income 4,612 4,970
Other non-operating revenues 628 375
Total Non-Operating Revenues 6,809 6,930
Non-Operating Expenses:
Interest expenses 317,120 327,047
Borrowing related expenses 50,599 53,496
Interest expenses on investment corporation bonds 25,085 19,647
Amortization of deferred investment corporation bond issuance costs 4,104 3,546
Other non-operating expenses 2,122 4,390
Total Non-Operating Expenses 399,032 408,128
Ordinary Income 2,916,830 3,276,274
Income Before Income Taxes 2,916,830 3,276,274
Income taxes – current 605 605
Income Taxes (Note 14) 605 605
Net Income 2,916,225 3,275,669
Retained Earnings Brought Forward 2,955,065 2,657,912
Retained Earnings at End of Period ¥ 5,871,290 ¥ 5,933,582
The accompanying notes are an integral part of these financial statements.
50

HEIWA REAL ESTATE REIT, Inc.
STATEMENTS OF CHANGES IN NET ASSETS
For the six months ended May 31, 2021 and November 30, 2020
Unitholders’ Equity
Number
of
Units
Unitholders’
Capital
Capital
Surplus
Deduction
from Capital
Surplus
Reserve for
Reduction
Entry
Reserve for
Temporary
Difference
Adjustment
Retained
Earnings
(Units) (Thousands of Yen)
Balance as of May 31, 2020 1,014,847 ¥ 81,370,715 ¥ 7,406,652 ¥ - ¥ 415,683 ¥ 1,744,597 ¥ 5,205,178
Cash distributions declared - - - - - - (2,587,859)
Net income - - - - - - 3,275,669
Reversal of reserve for temporary
difference adjustment - - - - - (40,593) 40,593
Acquisition of treasury investment units - - - - - - -
Cancellation of treasury investment units (14,914) - - (1,699,990) - - -
Net changes of items other than
unitholders’ equity - - - - - - -
Balance as of November 30, 2020 999,933 ¥ 81,370,715 ¥ 7,406,652 ¥ (1,699,990) ¥ 415,683 ¥ 1,704,003 ¥ 5,933,582
Cash distributions declared - - - - - - (2,679,820)
Net income - - - - - - 2,916,225
Provision of reserve for temporary
difference adjustment - - - - - 338,693 (338,693)
Reversal of reserve for temporary
difference adjustment - - - - - (39,997) 39,997
Net changes of items other than
unitholders’ equity - - - - - - -
Balance as of May 31, 2021 999,933 ¥ 81,370,715 ¥ 7,406,652 ¥ (1,699,990) ¥ 415,683 ¥ 2,002,699 ¥ 5,871,290
Unitholders’ Equity Valuation and Translation
Adjustments
Treasury
Investment
Units
Total
Unitholders’
Equity
Deferred
Gains or
Losses on
Hedges
Total
Valuation
and
Translation
Adjustments
Total Net
Assets
(Thousands of Yen)
Balance as of May 31, 2020 ¥ - ¥ 96,142,826 ¥ (168,168) ¥ (168,168) ¥ 95,974,657
Cash distributions declared - (2,587,859) - -
(2,587,859)
Net income - 3,275,669 - -
3,275,669
Reversal of reserve for temporary
difference adjustment - - - - -
Acquisition of treasury investment units (1,699,990) (1,699,990) - -
(1,699,990)
Cancellation of treasury investment units 1,699,990 - - - -
Net changes of items other than
unitholders’ equity - - (52,265) (52,265)
(52,265)
Balance as of November 30, 2020 ¥ - ¥ 95,130,645 ¥ (220,434) ¥ (220,434) ¥ 94,910,211
Cash distributions declared - (2,679,820) - - (2,679,820)
Net income - 2,916,225 - - 2,916,225
Provision of reserve for temporary
difference adjustment - - - - -
Reversal of reserve for temporary
difference adjustment - - - - -
Net changes of items other than
unitholders’ equity - - 36,818 36,818 36,818
Balance as of May 31, 2021 ¥ - ¥ 95,367,050 ¥ (183,615) ¥ (183,615) ¥ 95,183,434
The accompanying notes are an integral part of these financial statements.
51

HEIWA REAL ESTATE REIT, Inc.
STATEMENTS OF CASH FLOWS
For the six months ended May 31, 2021 and November 30, 2020
For the six months ended
May 31, 2021 November 30, 2020
(Thousands of Yen)
Cash Flows from Operating Activities:
Income before income taxes ¥ 2,916,830 ¥ 3,276,274
Depreciation and amortization 955,925 951,615
Increase (decrease) in allowance for doubtful accounts 63 (96)
Amortization of deferred investment corporation bond issuance costs 4,104 3,546
Interest income (1,110) (1,118)
Interest expenses 342,205 346,695
(Increase) decrease in tenant receivables (5,592) 20,601
Increase in consumption taxes receivable (23,524) ―
(Decrease) increase in accrued consumption taxes (160,415) 105,471
Decrease in long-term prepaid expenses 6,078 19,340
(Decrease) increase in operating accounts payable (174,485) 148,877
(Decrease) increase in accrued expenses (11,449) 2,964
Increase in advances received 33,031 21,493
(Decrease) increase in deposits received (54) 11
Decrease due to sale of investment properties in trust 702,521 1,685,113
Other, net 2,645 (55,265)
Interest income received 63 2,175
Interest expenses paid (347,268) (351,457)
Income taxes paid (281) (927)
Net Cash Provided by Operating Activities 4,239,285 6,175,314
Cash Flows from Investing Activities:
Proceeds from withdrawals of time deposits — 3,000,000
Payment for deposits of time deposits — (3,000,000)
Payment for purchases of investment properties other than intangible assets (5,116,394) (1,521,296)
Payment for purchases of investment properties in trust (2,252,335) (494,557)
Payment for purchases of intangible assets (3,206) —
Proceeds from tenant security deposits 144,672 28,573
Refunds of tenant security deposits (41,292) (20,663)
Proceeds from tenant security deposits in trust 276,126 206,764
Refunds of tenant security deposits in trust (131,507) (205,389)
Proceeds from payment of trust deposits corresponding to tenant security
deposits in trust 525 16,473
Deposit of trust deposits corresponding to tenant security deposits in trust (92,227) —
Net Cash Used in Investing Activities (7,215,640) (1,990,095)
Cash Flows from Financing Activities:
Proceeds from long-term debt 7,784,200 6,030,000
Repayments of long-term debt (5,884,200) (6,030,000)
Proceeds from issuance of investment corporation bonds — 1,489,730
Payment for acquisition of treasury investment units — (1,699,990)
Distributions paid (2,678,748) (2,588,499)
Net Cash Used in Financing Activities (778,748) (2,798,759)
Net Change in Cash and Cash Equivalents (3,755,103) 1,386,459
Cash and Cash Equivalents at Beginning of Period 13,712,643 12,326,184
Cash and Cash Equivalents at End of Period (Note 3) ¥ 9,957,540 ¥ 13,712,643 The accompanying notes are an integral part of these financial statements.
52
HEIWA REAL ESTATE REIT, Inc.
Notes to Financial Statements
For the six months ended May 31, 2021 and November 30, 2020
Note 1 – Organization and Basis of Presentation
(a) Organization
HEIWA REAL ESTATE REIT, Inc. (“HEIWA REAL ESTATE REIT”) was established on January 31, 2002 as
an investment corporation under the Act on Investment Trusts and Investment Corporations (Act No. 198 of 1951,
including subsequent revisions, hereinafter referred to as the “Investment Trust Act”) by the founder (the former
Canal Investment Trust Co., Ltd.; now, HEIWA REAL ESTATE REIT Asset Management, Inc., the Asset
Management Company).
HEIWA REAL ESTATE REIT is an externally managed real estate fund, established as an investment
corporation. HEIWA REAL ESTATE REIT Asset Management, Inc., as HEIWA REAL ESTATE REIT’s asset
management company, is engaged in acquiring, managing, leasing, and renovating office properties, residential
properties and commercial properties. HEIWA REAL ESTATE CO., LTD. (“HEIWA REAL ESTATE”) currently
own 100% of HEIWA REAL ESTATE REIT Asset Management, Inc.
Investment units in HEIWA REAL ESTATE REIT have been listed on the Real Estate Investment Trust Section
(J-REIT Section) of the Tokyo Stock Exchange since March 8, 2005. Subsequently, HEIWA REAL ESTATE REIT
issued new investment units through public offerings and third-party allotments on several occasions, and executed
an investment unit split and investment unit issuance due to a merger with Japan Single-residence REIT Inc. on
October 1, 2010.
As of May 31, 2021, HEIWA REAL ESTATE REIT has ownership or trust beneficiary interests in 109 properties
with approximately 263,123.23 square meters of rentable space and has leased space to 5,346 tenants. The
occupancy rate for the properties is approximately 97.45%.
(b) Basis of Presentation
The accompanying financial statements have been prepared in accordance with the provisions set forth in the
Investment Trust Act, the Financial Instruments and Exchange Act and their related accounting regulations and in
conformity with Generally Accepted Accounting Principles of Japan (“Japanese GAAP”), which are different in
certain respects as to application and disclosure requirements from both International Financial Reporting Standards
(“IFRS”) and U.S. Generally Accepted Accounting Principles.
The accompanying financial statements have been reformatted and translated into English from the financial
statements of HEIWA REAL ESTATE REIT prepared in accordance with Japanese GAAP and filed with the
appropriate Local Finance Bureau of the Ministry of Finance as required by the Financial Instruments and Exchange
Act. In preparing the accompanying financial statements, relevant notes have been expanded and certain
reclassifications have been made from the Japanese GAAP financial statements. Certain supplementary information
included in the statutory Japanese GAAP financial statements, but not required for fair presentation, is not presented
in the accompanying financial statements. Certain reclassifications have been made to the prior period’s financial
statements to conform to the presentation for the current period.
As permitted by Japanese GAAP, amounts of less than one thousand yen have been omitted. Consequently, the
totals shown in the accompanying financial statements do not necessarily agree with sums of the individual amounts.
53

(c) Significant Accounting Estimates
Impairment loss on investment properties
(1) Carrying amount on the accompanying financial statements
As of
May 31, 2021
(Thousands of Yen)
Investment properties ¥ 176,621,154
(2) Information on the nature of significant accounting estimates for identified items
HEIWA REAL ESTATE REIT has adopted the accounting treatment to reduce the book value of investment
properties to its recoverable amount when the invested amount is deemed to be unrecoverable due to decrease in
profitability in conformity with the Accounting Standard for Impairment of Fixed Assets.
Investment properties are grouped on an individual real property basis. HEIWA REAL ESTATE REIT reviews
each of the investment properties for impairment when factors such as consecutive operating losses, significant
decline in the market price and others related to investment properties indicate the carrying amount of a property
may not be recoverable. Whether an impairment loss is recognized is determined based on the future cash flows
expected from the property. In the case that the impairment loss is recognized, the book value of the property is
reduced to the respective recoverable amount determined primarily based on appraisal values by external real estate
appraisers, and the difference between the book value and recoverable amount is recorded as an impairment loss.
Future cash flows are measured by comprehensive judgement on estimates of rents, occupancy rates, rental
expenses and other factors based on market trends, transaction information of similar properties, historical data and
others. Operating results and market price of each investment property may be affected by trends in property leasing
market and property trading market. It is possible to recognize impairment losses in the next fiscal period if
assumptions used in estimates change.
(d) Changes in method of presentation
HEIWA REAL ESTATE REIT adopted “Accounting Standard for Disclosure of Accounting Estimates”
(Accounting Standards Board of Japan (“ASBJ”) Statement No. 31, March 31, 2020) from the six months ended
May 31, 2021 and disclosed a note on Significant Accounting Estimates. However, in accordance with the
transitional treatment as stipulated in the proviso of Paragraph 11 of the Accounting Standard, there is no
information to be disclosed for the six months ended November 30, 2020.
54

Note 2 – Summary of Significant Accounting Policies
(a) Cash and Cash Equivalents
Cash and cash equivalents consist of cash on hand and cash in trust, demand deposits and deposits in trust and
short-term investments which are highly liquid and readily convertible to cash and which have insignificant risk of
market value fluctuation and maturities of three months or less from the date of acquisition.
(b) Allowance for Doubtful Accounts
Allowance for doubtful accounts is provided at the amount considered sufficient to cover probable losses on
collection. The amount is determined by estimating an uncollectible amount based on the analysis of certain
individual accounts that may not be collectable.
(c) Investment Properties
Investment properties that include investment properties in trust are recorded at cost, which includes the allocated
purchase price, related costs and expenses for acquisition of the trust beneficiary interests in real estate. Investment
property balances are depreciated using the straight-line method over the estimated useful lives as follows:
(Years)
Buildings 2-65
Structures 4-62
Machinery and equipment 3-15
Tools, furniture and fixtures 2-18
(d) Software
Software for internal use is amortized using the straight-line method over its useful lives (5 years).
(e) Long-Term Prepaid Expenses
Long-term prepaid expenses are amortized using the straight-line method.
(f) Deferred Investment Corporation Bond Issuance Costs
Deferred investment corporation bond issuance costs are amortized on a straight-line basis over the respective
terms of the bonds.
(g) Income Taxes
Deferred tax assets and liabilities are computed based on the difference between the financial statements and
income tax bases of assets and liabilities using the statutory rate.
55
(h) Real Estate Taxes
Investment properties are subject to various taxes such as property taxes and city planning taxes. Owners of the
properties are registered by records maintained in each jurisdiction by the local government. The taxes are imposed
on the registered record owner as of January 1 of each year based on an assessment made by the local government.
When a property is purchased within the calendar year, the taxes for the corresponding calendar year are imposed
on the seller. HEIWA REAL ESTATE REIT pays the seller the corresponding amount of the taxes for the period
from the property acquisition date to December 31 of the calendar year and capitalizes these amounts as acquisition
costs of the property rather than expensing them. In subsequent calendar years, such taxes on investment properties
are charged as operating expenses in each fiscal period.
The following is a summary of capitalized real estate taxes.
For the six-month periods ended
May 31, 2021 November 30, 2020
(Thousands of Yen)
Capitalized real estate taxes ¥ 16,605 ¥ 1,274
(i) Consumption Taxes
Consumption taxes are excluded from transaction amounts. Non-deductible consumption taxes related to the
acquisition of properties are treated as the cost of the applicable properties.
(j) Hedge Accounting
HEIWA REAL ESTATE REIT enters into derivative transactions for the purpose of hedging risks defined in the
Articles of Incorporation of HEIWA REAL ESTATE REIT in accordance with its financial policy. HEIWA REAL
ESTATE REIT uses interest rate swaps as hedging instruments in order to hedge the risk of interest rate fluctuations
related to borrowings. In principle, the deferral method is applied for hedge transactions. For interest rate swaps
which qualify for hedge accounting and meet specific criteria, the special treatment is applied. Under the special
treatment, the related differentials paid or received under such swap contracts can be recognized and included in
interest expense or income of the hedged assets or liabilities, and the interest rate swaps are not required to be
measured at fair value separately. HEIWA REAL ESTATE REIT evaluates hedge effectiveness by comparing the
cumulative changes in cash flows of hedging instruments and the hedged items and assessing the ratio between the
changes. However, the assessment of hedge effectiveness for interest rate swaps which meet the special criteria is
omitted.
(k) Revenue Recognition
Revenues from property leasing consist of rental revenues including base rents, common area charges and other
revenues related to property leasing such as parking space rental revenues and others. Rental revenues are generally
recognized when earned and considered realizable over the life of each lease.
(l) Accounting Treatment of Trust Beneficiary Interests in Real Estate
For trust beneficiary interests in real estate owned by HEIWA REAL ESTATE REIT, all accounts of assets and
liabilities within the assets in trust and all accounts of revenue generated and expenses incurred from the assets in
trust are recognized in the relevant accounts of the balance sheets and statements of income and retained earnings.
The following assets in trust are recognized and presented separately on the balance sheets.
(i) Cash and deposits in trust
(ii) Land in trust, buildings in trust, structures in trust, machinery and equipment in trust, tools, furniture and
fixtures in trust and leasehold rights in trust
(iii) Tenant security deposits in trust
56

(m) New accounting standards not yet adopted
- “Accounting Standard for Revenue Recognition” (Accounting Standards Board of Japan (“ASBJ”) Statement
No. 29, March 31, 2020,)
- “Implementation Guidance on Accounting Standard for Revenue Recognition” (ASBJ Guidance No. 30,
March 31, 2020)
- “Implementation Guidance on Disclosures about Fair Value of Financial Instruments” (ASBJ Guideline No.
19, March 31, 2020)
(1) Overview
The International Accounting Standards Board (“IASB”) and the Financial Accounting Standards Board
(“FASB”) jointly developed a comprehensive accounting standard for revenue recognition and issued “Revenue
from Contracts with Customers” (IFRS 15 by IASB and Topic 606 by FASB) in May 2014. IFRS No. 15 is effective
from the fiscal year beginning on or after January 1, 2018 and Topic 606 is effective from the fiscal year beginning
after December 15, 2017. In accordance with the IASB and FASB standard, the ASBJ developed its own
comprehensive accounting standard for revenue recognition and issued it with the implementation guidances.
The ASBJ’s basic policy in developing the accounting standard for revenue recognition was to establish
accounting standards with the incorporation of the basic principles of IFRS No. 15 as a starting point from a
viewpoint of comparability between financial statements, which is one of benefits of maintaining consistency with
IFRS No. 15, and to add alternative treatments to the extent necessary to address practices conducted in Japan, but
not to the extent that would impair comparability.
(2) Effective date
HEIWA REAL ESTATE REIT will adopt the new standard and related guidances from the beginning of the six-
month period ending November 30, 2021.
(3) Effect of application
HEIWA REAL ESTATE REIT is currently assessing the effect of applying the new standard and related
guidances on the financial statements.
- “Accounting Standard for Fair Value Measurement” (ASBJ Statement No. 30, July 4, 2019)
- “Accounting Standard for Financial Instruments” (ASBJ Statement No. 10, July 4, 2019)
- “Implementation Guidance on Accounting Standard for Fair Value Measurement” (ASBJ Guidance No. 31,
July 4, 2019)
- “Implementation Guidance on Disclosures about Fair Value of Financial Instruments” (ASBJ Guidance No.
19, March 31, 2020)
(1) Overview
The ASBJ promoted an initiative to ensure consistency of the requirements between the Japanese accounting
standards and international accounting standards, primarily in the areas of guidance on the fair values of financial
instruments and their disclosures, and issued “Accounting Standard for Fair Value Measurement,” etc., considering
the circumstance where the IASB and the FASB have prescribed almost the similar detailed guidance (IFRS No. 13
“Fair Value Measurement” issued by IASB and Accounting Standard Codification Topic 820 “Fair Value
Measurement” issued by FASB).
The ASBJ’s fundamental policies adopted for developing the “Accounting Standard for Fair Value Measurement,”
etc. are, in principle, to implement all the requirements of IFRS No. 13 from the viewpoint of enhancing the
comparability of the financial statements of domestic and overseas companies by prescribing unified measurement
methods, and also to prescribe exceptional treatments for individual matters so that comparability would not be
impaired while the accounting practices that have conventionally been adopted in Japan are taken into account.
(2) Effective date
HEIWA REAL ESTATE REIT will adopt the new standards and related guidances from the beginning of the six-
month period ending November 30, 2021.
(3) Effect of application
HEIWA REAL ESTATE REIT is currently assessing the effect of applying the new standards and related
guidances on the financial statements.
57

Note 3 – Cash and Cash Equivalents
Reconciliation between cash and deposits and cash and deposits in trust in the balance sheets and cash and cash
equivalents in the statements of cash flows is as follows:
As of
May 31, 2021 November 30, 2020
(Thousands of Yen)
Cash and deposits ¥ 9,860,611 ¥ 13,630,841
Cash and deposits in trust 3,598,834 3,492,005
Trust deposits retained for repayment of tenant security deposits (501,905) (410,203)
Time deposits with maturities exceeding three months (3,000,000) (3,000,000)
Cash and cash equivalents ¥ 9,957,540 ¥ 13,712,643
Note 4 – Financial Instruments
(a) Qualitative Information for Financial Instruments
Policy for Financial Instrument Transactions
HEIWA REAL ESTATE REIT raises funds through borrowings, issuance of investment corporation bonds and
issuance of investment units for acquisition of investment properties. HEIWA REAL ESTATE REIT enters into
derivative transactions only for the purpose of hedging interest rate risks arising from borrowings and does not
engage in speculative transactions. Surplus funds can be invested into securities and other monetary assets. However,
HEIWA REAL ESTATE REIT currently does not actively make such investments.
Nature and Extent of Risks Arising from Financial Instruments and Risk Management
Proceeds from borrowings and investment corporation bonds are mainly used to acquire investment properties
and repay outstanding borrowings. These are exposed to liquidity risk on their repayments and redemptions. Such
risk is managed in ways such as preparing cash flow analyses by the Asset Management Company, securing funds
on hand, diversifying maturities and lenders, executing commitment type term loan contracts, and other measures.
Floating-rate borrowings are exposed to the risk of rising interest rates. HEIWA REAL ESTATE REIT uses
derivatives (interest rate swaps) to manage such risk. Derivatives are executed and administered in accordance with
the risk management rules and based on advices from the Asset Management Company. HEIWA REAL ESTATE
REIT enters into derivatives only with financial institutions with high ratings in order to mitigate credit risk.
Tenant security deposits are exposed to liquidity risk arising from the vacating of properties by tenants. Such risk
is managed by reserving sufficient funds to make repayments in principle.
Supplemental Explanation Regarding Fair Value of Financial Instruments
The fair value of financial instruments is based on quoted market prices. When there is no observable market
price available, fair value is based on a price that may be reasonably estimated. Since certain assumptions and factors
are reflected in estimating the fair value, different assumptions and factors could result in a different value. Also,
the contractual amounts of derivatives do not represent the market risk involved in these derivatives.
58

(b) Estimated Fair Value of Financial Instruments
Book values, fair values and differences between them are as follows:
As of May 31, 2021 As of November 30, 2020
(Thousands of Yen) (Thousands of Yen)
Assets Book value Fair value Difference
Book value Fair value Difference
Cash and deposits ¥ 9,860,611 ¥ 9,860,611 ¥ —
¥ 13,630,841 ¥ 13,630,841 ¥ —
Cash and deposits in trust 3,598,834 3,598,834 —
3,492,005 3,492,005 —
Total ¥ 13,459,445 ¥ 13,459,445 ¥ —
¥ 17,122,846 ¥ 17,122,846 ¥ —
Liabilities
Long-term debt due within one
year ¥ 11,869,000 ¥ 11,869,000 ¥ —
¥ 11,904,200 ¥ 11,915,280 ¥ 11,080
Investment corporation bonds 7,900,000 7,829,260 (70,740)
7,900,000 7,830,130 (69,870)
Long-term debt 68,298,200 68,307,006 8,806
66,363,000 66,381,643 18,643
Total ¥ 88,067,200 ¥ 88,005,266 ¥ (61,933)
¥ 86,167,200 ¥ 86,127,053 ¥ (40,146)
Derivatives (*) ¥ (183,615) ¥ (247,139) ¥ (63,524)
¥ (220,434) ¥ (288,759) ¥ (68,325)
(*) The value of assets and liabilities arising from derivatives is shown at net value and with the amount in parenthesis
indicating the net liability position.
The financial instruments whose fair values are deemed extremely difficult to determine are excluded from the
above table.
Notes:
1. Methods used to estimate the fair value of financial instruments and derivatives
Assets and Liabilities:
(1) Cash and deposits and cash and deposits in trust
Due to the short maturities, the book value of these assets is deemed a reasonable approximation of the fair
value; therefore, the book value is used as the fair value equivalent.
(2) Long-term debt due within one year, investment corporation bonds and long-term debt
The fair value of investment corporation bonds is based on their indicative market price obtained from Japan
Securities Dealers Association. For long-term debt with floating interest rates that reflects market interest rates
within a short period of time, the book value is deemed a reasonable approximation of the fair value; therefore, the
book value is used as the fair value equivalent. For long-term debts with fixed interest rates, the fair value is
calculated based on the total amount of principle and interest discounted at the current interest rate applicable to
similar borrowings.
59

Derivatives:
There are no derivatives to which hedge accounting is not applied as of May 31, 2021 and November 30, 2020.
Derivatives to which hedge accounting is applied are as follows:
Hedge
accounting
method Type Hedged item
As of May 31, 2021
Contractual amount Fair value (*)
Total Due after one year
(Thousands of Yen)
Deferral hedge
accounting
method
Interest rate swaps
Receive floating/
Pay fixed
Long-term debt ¥ 58,433,000 ¥ 46,364,000 ¥ (183,615)
Special treatment
for interest rate
swaps
Interest rate swaps
Receive floating/
Pay fixed
Long-term debt 4,880,000 4,880,000 (63,524)
¥ 63,313,000 ¥ 51,244,000 ¥ (247,139)
Hedge
accounting
method Type Hedged item
As of November 30, 2020
Contractual amount Fair value (*)
Total Due after one year
(Thousands of Yen)
Deferral hedge
accounting
method
Interest rate swaps
Receive floating/
Pay fixed
Long-term debt ¥ 60,361,700 ¥ 49,433,000 ¥ (220,434)
Special treatment
for interest rate
swaps
Interest rate swaps
Receive floating/
Pay fixed
Long-term debt 4,880,000 4,880,000 (68,325)
¥ 65,241,700 ¥ 54,313,000 ¥ (288,759)
(*) The fair value is determined at the quoted price provided by financial institutions.
2. Financial instruments whose fair value are deemed extremely difficult to determine
As of
May 31, 2021 November 30, 2020
(Thousands of Yen)
Tenant security deposits ¥ 823,499 ¥ 720,120
Tenant security deposits in trust 4,514,754 4,381,685
¥ 5,338,253 ¥ 5,101,806
The fair value of tenant security deposits and tenant security deposits in trust are not disclosed because these
deposits do not have a readily available market price, and it is difficult to estimate a period as to when these deposits
will be returned, which in turn makes it difficult to reasonably estimate the future cash flows.
60

3. Redemption schedule for monetary claims
As of May 31, 2021
Due within
one year
Due after one
year to two
years
Due after two
years to three
years
Due after three
years to four
years
Due after four
years to five
years
Due after
five years
(Thousands of Yen)
Cash and deposits ¥ 9,860,611 ¥ — ¥ — ¥ — ¥ — ¥ —
Cash and deposits in trust 3,598,834 — — — — —
Total ¥ 13,459,445 ¥ — ¥ — ¥ — ¥ — ¥ —
As of November 30, 2020
Due within
one year
Due after one
year to two
years
Due after two
years to three
years
Due after three
years to four
years
Due after four
years to five
years
Due after
five years
(Thousands of Yen)
Cash and deposits ¥ 13,630,841 ¥ — ¥ — ¥ — ¥ — ¥ —
Cash and deposits in trust 3,492,005 — — — — —
Total ¥ 17,122,846 ¥ — ¥ — ¥ — ¥ — ¥ —
4. Redemption schedule for short-term debt, investment corporation bonds and long-term debt
As of May 31, 2021
Due within
one year
Due after one
year to two
years
Due after two
years to three
years
Due after three
years to four
years
Due after four
years to five
years
Due after
five years
(Thousands of Yen)
Long-term debt due within
one year ¥ 11,869,000 ¥ — ¥ — ¥ — ¥ — ¥ —
Investment corporation bonds — 1,000,000 1,000,000 — — 5,900,000
Long-term debt — 10,400,000 11,285,000 11,607,000 12,477,000 22,529,200
Total ¥ 11,869,000 ¥ 11,400,000 ¥ 12,285,000 ¥ 11,607,000 ¥ 12,477,000 ¥ 28,429,200
As of November 30, 2020
Due within
one year
Due after one
year to two
years
Due after two
years to three
years
Due after three
years to four
years
Due after four
years to five
years
Due after
five years
(Thousands of Yen)
Long-term debt due within
one year ¥ 11,904,200 ¥ — ¥ — ¥ — ¥ — ¥ —
Investment corporation bonds — 1,000,000 — 1,000,000 — 5,900,000
Long-term debt — 10,669,000 11,760,000 10,530,000 12,172,000 21,232,000
Total ¥ 11,904,200 ¥ 11,669,000 ¥ 11,760,000 ¥ 11,530,000 ¥ 12,172,000 ¥ 27,132,000
61

Note 5 – Investment Properties
Investment properties consist of the following:
As of May 31, 2021 As of November 30, 2020
(Thousands of Yen) (Thousands of Yen)
Acquisition
cost
Accumulated
depreciation Book value
Acquisition
cost
Accumulated
depreciation Book value
Land ¥ 35,263,625 ¥ — ¥ 35,263,625
¥ 31,475,029 ¥ — ¥ 31,475,029
Buildings 17,358,394 (4,876,000) 12,482,393
15,849,108 (4,647,199) 11,201,909
Structures 82,953 (45,546) 37,407
78,849 (43,237) 35,611
Machinery and equipment 304,860 (223,986) 80,874
295,496 (215,093) 80,403
Tools, furniture and fixtures 279,806 (163,576) 116,230
243,426 (151,897) 91,529
Construction in progress — — —
251,683 — 251,683
Land in trust 87,877,511 — 87,877,511
86,446,317 — 86,446,317
Buildings in trust 47,287,495 (12,600,139) 34,687,355
47,307,050 (12,050,916) 35,256,133
Structures in trust 258,604 (100,926) 157,677
270,754 (99,918) 170,835
Machinery and equipment
in trust 612,447 (305,245) 307,202
591,806 (288,451) 303,354
Tools, furniture and fixtures
in trust 1,154,449 (769,288) 385,161
1,096,045 (730,009) 366,035
Leasehold rights 1,910,049 — 1,910,049
1,910,049 — 1,910,049
Leasehold rights in trust 3,315,665 — 3,315,665
3,315,665 — 3,315,665
Total ¥ 195,705,864 ¥ (19,084,709) ¥ 176,621,154
¥ 189,131,284 ¥ (18,226,725) ¥ 170,904,559
62

Note 6 – Fair Value of Investment and Rental Properties
HEIWA REAL ESTATE REIT owns rental properties for office and residential use in Tokyo and other regions
throughout Japan. The book value, net changes in the book value and the fair value of the investment and rental
properties are as follows:
As of
May 31, 2021 November 30, 2020
(Thousands of Yen)
Book value:
Balance at beginning of period ¥ 170,652,876 ¥ 171,654,221
Change during the period 5,968,277 (1,001,344)
Balance at end of period ¥ 176,621,154 ¥ 170,652,876
Fair value ¥ 218,920,000 ¥ 210,006,000
Notes:
1. Book value represents acquisition costs after deducting accumulated depreciation.
2. For the six months ended May 31, 2021, the increases are primarily due to acquisition of TORYO BUILDING
and four other properties (¥7,249,230 thousand, at total), and the decreases are primarily due to disposal of HF
TAKANAWA RESIDENCE (¥702,521 thousand) and depreciation (¥955,925 thousand). For the six months
ended November 30, 2020, the increases are primarily due to acquisition of HF OHORI RESIDENCE
BAYSIDE (¥1,192,413 thousand), and the decreases are primarily due to disposal of HF UMEDA RESIDENCE
TOWER (¥1,685,113 thousand) and depreciation (¥951,615 thousand).
The information on Operating Revenues and Expenses is disclosed in Note 11.
63

Note 7 – Short-Term Debt and Long-Term Debt
Short-term debt and long-term debt consist of the following:
As of
May 31, 2021 November 30, 2020
(Thousands of Yen)
Long-term debt
0.35% - 1.04% unsecured loans due 2021 (Notes 1 and 2) ¥ 6,020,000 ¥ 11,904,200
0.27% - 1.24% unsecured loans due 2022 (Notes 1 and 2) 10,669,000 10,669,000
0.39% - 1.08% unsecured loans due 2023 (Notes 1 and 2) 9,060,000 11,760,000
0.39% - 1.21% unsecured loans due 2024 (Notes 1 and 2) 10,755,000 10,530,000
0.33% - 0.94% unsecured loans due 2025 (Notes 1 and 2) 14,872,000 12,172,000
0.58% - 0.98% unsecured loans due 2026 (Notes 1 and 2) 12,362,000 12,362,000
0.58% - 0.68% unsecured loans due 2027 (Notes 1 and 2) 8,870,000 8,870,000
0.64% - 0.68% unsecured loans due 2028 (Notes 1 and 2) 6,559,200 —
0.68% unsecured loans due 2029 (Notes 1 and 2) 1,000000 —
Less: amount due within one year (11,869,000) (11,904,200)
Total long-term debt due after one year ¥ 68,298,200 ¥ 66,363,000
Notes:
1. Interest rates presented are average interest rates applicable to individual loans during the period ended May 31, 2021. The
average interest rates are stated after reflecting the effect of the interest rate swaps as to the loans with interest rate swaps for
the purpose of hedging the risk of interest rate fluctuations.
2. Funds are used for the acquisition of real estate, and refinancing of borrowings.
HEIWA REAL ESTATE REIT maintains commitment line contracts with four financial institutions. The
amounts of unused commitments on loans as of May 31, 2021 and November 30, 2020 and are as follows:
As of
May 31, 2021 November 30, 2020
(Thousands of Yen)
Total amounts of borrowing commitment lines ¥ 7,000,000 ¥ 7,000,000
Borrowing execution balances — —
Net unused balance ¥ 7,000,000 ¥ 7,000,000
64

Note 8 – Investment Corporation Bonds
Investment corporation bonds consist of the following:
As of
May 31, 2021 November 30, 2020
Issued date Maturity date Interest rate (Thousands of Yen)
1st unsecured bonds June 30, 2017 June 30, 2022 0.30% ¥ 1,000,000 ¥ 1,000,000
2nd unsecured bonds June 30, 2017 June 30, 2027 0.65% 1,800,000 1,800,000
3rd unsecured bonds May 7, 2018 May 2, 2028 0.70% 1,000,000 1,000,000
4th unsecured bonds June 4, 2019 May 31, 2024 0.41% 1,000,000 1,000,000
5th unsecured bonds June 4, 2019 May 31, 2029 0.82% 1,600,000 1,600,000
6th unsecured bonds November 25,
2020
November 25,
2030 0.75% 1,500,000 1,500,000
Total ¥ 7,900,000 ¥ 7,900,000
Note 9 – Net Assets
HEIWA REAL ESTATE REIT issues non-par value units in accordance with the Investment Trust Act. HEIWA
REAL ESTATE REIT maintains a minimum of ¥50,000 thousand of net assets as required by the Investment Trust
Act.
The following table shows the cumulative number and amount of treasury investment units cancelled as of May
31, 2021 and November 30, 2020, respectively.
As of
May 31, 2021 November 30, 2020
Cumulative number of treasury investment units cancelled 14,914 14,914
(Thousands of Yen)
Cumulative amount of treasury investment units cancelled ¥ 1,699,990 ¥ 1,699,990
65

Note 10 – Reserve for Temporary Difference Adjustment
The following table shows the amount of provision and reversal of reserve for temporary difference adjustment
and the reason for provision or reversal.
For the six months
ended May 31, 2021
Original
amount
Balance as of
December 1,
2020
Provision
during the
period
Reversal
during the
period
Balance as of
May 31, 2021
Reason for provision
or reversal
(Thousands of Yen)
Gain on bargain
purchase (Note 1) ¥ 2,497,604 ¥ 1,704,003 ¥ — ¥ (39,997) ¥ 1,664,005
Allocation for
distributions
Part of differences
between tax and
accounting due to
gain on sale of
investment
properties (Note 2)
¥ 338,693 ¥ — ¥ 338,693 ¥ — ¥ 338,693
Provision of a part of
differences between tax
and accounting due to
gain on sale of
investment properties
Notes:
1. The amount represents gain on bargain purchase provided in past periods and is scheduled to be reversed every period
by an amount equal to or more than the initial amount divided by 50 years from the following period of its provision.
2. The amount represents a part of differences between tax and accounting due to gain on sales of investment properties
and is scheduled to be reversed every period by an amount equal to or more than the initial amount divided by 50 years
from the following period of its provision.
For the six months
ended November 30,
2020
Original
amount
Balance as of
June 1, 2020
Provision
during the
period
Reversal
during the
period
Balance as of
November 30,
2020
Reason for provision
or reversal
(Thousands of Yen)
Gain on bargain
purchase (Note 1) ¥ 2,497,604 ¥ 1,744,597 ¥ — ¥ (40,593) ¥ 1,704,003
Allocation for
distributions
Note: The amount represents gain on bargain purchase provided in past periods and is scheduled to be reversed every period
by an amount equal to or more than the initial amount divided by 50 years from the following period of its provision.
66

Note 11 – Operating Revenues and Expenses
Details of rental revenues and expenses are as follows:
For the six months ended
May 31, 2021 November 30, 2020
(Thousands of Yen)
Revenues from property leasing:
Rental revenues:
Base rents ¥ 5,182,402 ¥ 5,090,113
Common area charges 648,605 625,833
Total rental revenues 5,831,007 5,715,947
Other revenues related to property leasing:
Parking space rental revenues 149,489 137,417
Incidental income 314,332 299,967
Cancellation penalty income 3,654 9,933
Others 27,462 18,164
Total other revenues related to property leasing 494,939 465,482
Total revenues from property leasing 6,325,946 6,181,430
Property-related expenses:
Rental expenses:
Property management expenses 672,432 668,692
Taxes and dues 401,283 397,640
Utilities expenses 180,577 184,752
Repair expenses 235,032 222,842
Insurance expenses 8,055 8,313
Trust fees 32,851 32,439
Depreciation 955,925 951,615
Others 131,199 124,567
Total property-related expenses 2,617,359 2,590,863
Operating income from property leasing ¥ 3,708,587 ¥ 3,590,566
67

Note 12 – Gain on Sales of Investment Properties
Details of gain on sales of investment properties are as follows:
For the six months ended May 31, 2021
(Thousands of Yen)
HF TAKANAWA RESIDENCE:
Proceeds from sales of investment properties ¥ 1,130,000
Cost of sales of investment properties 702,521
Other expenses related to sales 22,517
Gain on sales of investment properties ¥ 404,961
For the six months ended November 30, 2020
(Thousands of Yen)
HF UMEDA RESIDENCE TOWER:
Proceeds from sales of investment properties ¥ 2,620,000
Cost of sales of investment properties 1,685,113
Other expenses related to sales 44,185
Gain on sales of investment properties ¥ 890,700
Note 13 – Leases
Future minimum rental revenues under existing non-cancelable operating leases are as follows:
As of
May 31, 2021 November 30, 2020
(Thousands of Yen)
Due within one year ¥ 174,436 ¥ 174,436
Due after one year 203,508 290,726
Total ¥ 377,944 ¥ 465,162
68

Note 14 – Income Taxes
The following table summarizes the significant differences between the statutory tax rate and HEIWA REAL
ESTATE REIT’s effective tax rate.
For the six months ended
May 31, 2021 November 30, 2020
Statutory tax rate 31.46% 31.46%
Deductible cash distributions (29.94) (25.27)
Changes in valuation allowance (1.52) (6.19)
Others 0.02 0.02
Effective tax rate 0.02% 0.02%
The significant components of deferred tax assets and liabilities are as follows:
As of
May 31, 2021 November 30, 2020
(Thousands of Yen)
Deferred tax assets:
Allowance for doubtful accounts ¥ 20 ¥ 0
Deferred gains or losses on hedges 57,765 69,348
Valuation differences due to merger 2,067,807 2,112,097
Total deferred tax assets 2,125,593 2,181,446
Valuation allowance (2,125,593) (2,181,446)
Net deferred tax assets ¥ — ¥ —
69

Note 15 – Distribution Information
Cash distributions are declared by the Board of Directors of HEIWA REAL ESTATE REIT after the end of each
period. Such distributions are payable to unitholders of record at the end of each period. Information on retained
earnings brought forward after the cash distributions and cash distributions per unit is as follows:
For the six months ended
May 31, 2021 November 30, 2020
(Yen)
Unappropriated retained earnings ¥ 5,871,290,874 ¥ 5,933,582,253
Reversal of reserve for temporary difference adjustment (Note) 39,997,320 39,997,320
Cash distributions declared 2,799,812,400 2,679,820,440
(Cash distributions per unit) (2,800) (2,680)
Provision of reserve for temporary difference adjustment ― 338,693,498
Retained earnings carried forward ¥ 3,111,475,794 ¥ 2,955,065,635
Note: In accordance with transitional measures of the Supplementary Provisions paragraph No. 3 of the Ordinance on Accounting of
Investment Corporations (Cabinet Office Order No. 27 of 2015), HEIWA REAL ESTATE REIT provided reserve for temporary
difference adjustment of ¥2,497,604,770, which was the outstanding amount allocated to gain on bargain purchase recognized
in past periods from unappropriated retained earnings in the statement of distributions for the six months ended November 30,
2015. The provided amount has been reversed every period by an amount equal to or more than the initial amount divided by
50 years from the six months ended May 31, 2016. HEIWA REAL ESTATE REIT reversed ¥36,610,385 and ¥39,997,320 for
the six months ended May 31, 2021 and November 30, 2020, respectively.
In addition, HEIWA REAL ESTATE REIT provided reserve for temporary difference adjustment of ¥338,693,498, which was
a part of differences between tax and accounting due to gain on sales of investment properties for the six months ended
November 30, 2020. The provided amount is reversed every period by an amount equal to or more than the initial amount
divided by 50 years from the six months ended May 31, 2021. HEIWA REAL ESTATE REIT reversed ¥3,386,935 for the six
months ended May 31, 2021.
Pursuant to the terms of the distribution policy set forth in Article 32(1) of HEIWA REAL ESTATE REIT’s
Articles of Incorporation, the amount of distributions is defined to be in excess of an amount equivalent to 90% of
HEIWA REAL ESTATE REIT’s distributable profit as defined in Article 67-15 of the Special Taxation Measure
Act of Japan, but not in excess of the amount of retained earnings at the end of period.
Based on the policy, HEIWA REAL ESTATE REIT declared total distributions of ¥2,799,812,400 and
¥2,679,820,440 for the six months ended May 31, 2021 and November 30, 2020, respectively, which are calculated
by deducting ¥156,410,159 and ¥635,846,324 (including provision of reserve for temporary difference adjustment
of ¥338,693,498) from the amount obtained by adding reversal of reserve for temporary difference adjustment of
¥39,997,320 (¥40 per unit) and ¥39,997,320 (¥40 per unit) to net income of ¥2,916,225,239 and ¥3,275,669,444 for
the six months ended May 31, 2021 and November 30, 2020, respectively. Furthermore, HEIWA REAL ESTATE
REIT does not make cash distributions in excess of profit as set forth in Article 32(2) of HEIWA REAL ESTATE
REIT’s Articles of Incorporation.
70

Note 16 – Per Unit Information
Information about earnings per unit and net assets per unit is as follows:
For the six months ended
May 31, 2021 November 30, 2020
Earnings per unit: (Yen)
Net income per unit ¥ 2,916 ¥ 3,254
Weighted average number of units outstanding (units) 999,933 1,006,388
As of
May 31, 2021 November 30, 2020
(Yen)
Net assets per unit ¥ 95,189 ¥ 94,916
The net income per unit is calculated by dividing the net income by the weighted average number of units
outstanding during the period. The net assets per unit is computed based on the number of units outstanding at each
period end. Diluted earnings per unit and related information are not disclosed as no dilutive units are outstanding.
71
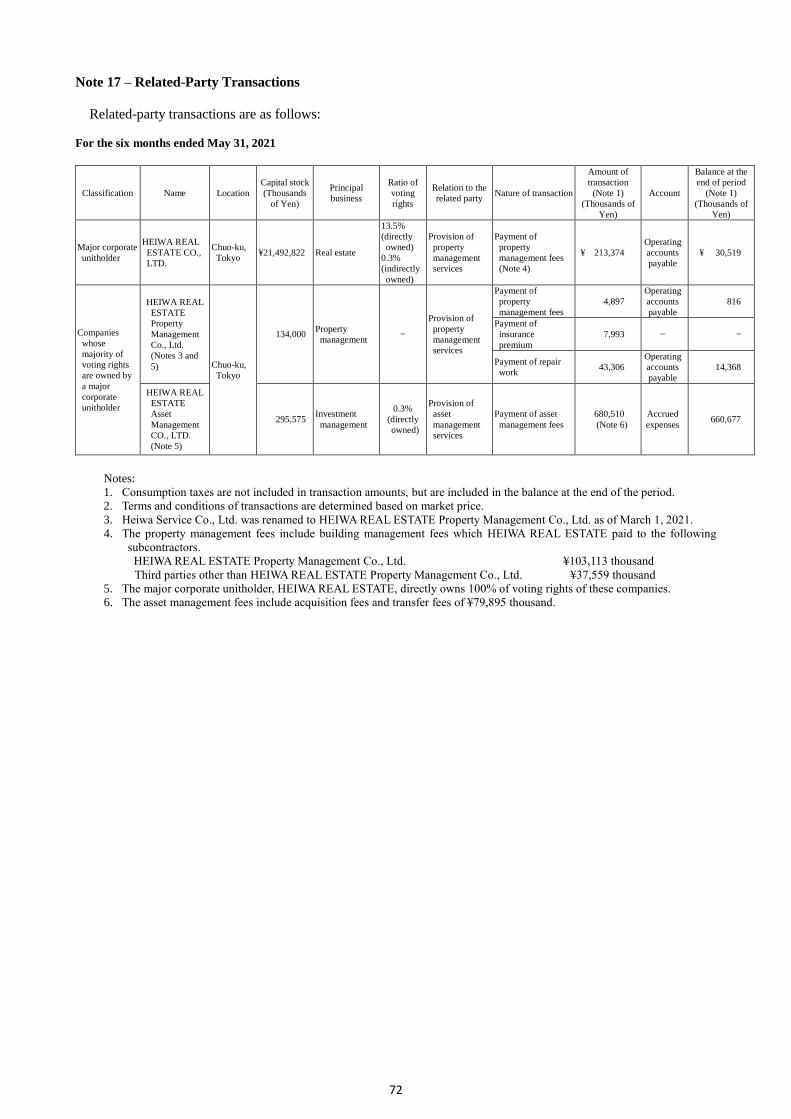
Note 17 – Related-Party Transactions
Related-party transactions are as follows:
For the six months ended May 31, 2021
Classification Name Location
Capital stock
(Thousands
of Yen)
Principal
business
Ratio of
voting
rights
Relation to the
related party Nature of transaction
Amount of
transaction
(Note 1)
(Thousands of
Yen)
Account
Balance at the
end of period
(Note 1)
(Thousands of
Yen)
Major corporate
unitholder
HEIWA REAL
ESTATE CO.,
LTD.
Chuo-ku,
Tokyo ¥21,492,822 Real estate
13.5%
(directly
owned)
0.3%
(indirectly
owned)
Provision of
property
management
services
Payment of
property
management fees
(Note 4)
¥ 213,374
Operating
accounts
payable
¥ 30,519
Companies
whose
majority of
voting rights
are owned by
a major
corporate
unitholder
HEIWA REAL
ESTATE
Property
Management
Co., Ltd.
(Notes 3 and
5) Chuo-ku,
Tokyo
134,000 Property
management —
Provision of
property
management
services
Payment of
property
management fees
4,897
Operating
accounts
payable
816
Payment of
insurance
premium
7,993 — —
Payment of repair
work 43,306
Operating
accounts
payable
14,368
HEIWA REAL
ESTATE
Asset
Management
CO., LTD.
(Note 5)
295,575 Investment
management
0.3%
(directly
owned)
Provision of
asset
management
services
Payment of asset
management fees
680,510
(Note 6)
Accrued
expenses 660,677
Notes:
1. Consumption taxes are not included in transaction amounts, but are included in the balance at the end of the period.
2. Terms and conditions of transactions are determined based on market price.
3. Heiwa Service Co., Ltd. was renamed to HEIWA REAL ESTATE Property Management Co., Ltd. as of March 1, 2021.
4. The property management fees include building management fees which HEIWA REAL ESTATE paid to the following
subcontractors.
HEIWA REAL ESTATE Property Management Co., Ltd. ¥103,113 thousand
Third parties other than HEIWA REAL ESTATE Property Management Co., Ltd. ¥37,559 thousand
5. The major corporate unitholder, HEIWA REAL ESTATE, directly owns 100% of voting rights of these companies.
6. The asset management fees include acquisition fees and transfer fees of ¥79,895 thousand.
72

For the six months ended November 30, 2020
Classification Name Location
Capital stock
(Thousands
of Yen)
Principal
business
Ratio of
voting
rights
Relation to the
related party Nature of transaction
Amount of
transaction
(Note 1)
(Thousands of
Yen)
Account
Balance at the
end of period
(Note 1)
(Thousands of
Yen)
Major corporate
unitholder
HEIWA REAL
ESTATE CO.,
LTD.
Chuo-ku,
Tokyo ¥21,492,822 Real estate
13.5%
(directly
owned)
0.3%
(indirectly
owned)
Provision of
property
management
services
Payment of
property
management fees
(Note 3)
¥ 210,718
Operating
accounts
payable
¥ 35,072
Companies
whose
majority of
voting rights
are owned by
a major
corporate
unitholder
Heiwa Service
Co., Ltd.
(Note 4)
Chuo-ku,
Tokyo
134,000 Property
management —
Provision of
property
management
services
Payment of
property
management fees
4,897
Operating
accounts
payable
816
Payment of
insurance
premium
7,860 — —
Payment of repair
work 30,483
Operating
accounts
payable
20,986
HEIWA REAL
ESTATE
Asset
Management
CO., LTD.
(Note 4)
295,575 Investment
management
0.3%
(directly
owned)
Provision of
asset
management
services
Payment of asset
management fees
624,545
(Note 5)
Accrued
expenses 645,529
Notes:
1. Consumption taxes are not included in transaction amounts, but are included in the balance at the end of the period.
2. Terms and conditions of transactions are determined based on market price.
3. The property management fees include building management fees which HEIWA REAL ESTATE paid to the following
subcontractors.
Heiwa Service Co., Ltd. ¥103,145 thousand
Third parties other than Heiwa Service Co., Ltd. ¥33,171 thousand
4. The major corporate unitholder, HEIWA REAL ESTATE, directly owns 100% of voting rights of these companies.
5. The asset management fees include acquisition fees and transfer fees of ¥37,700 thousand.
Note 18 – Transactions with Major Unitholders
Amounts of transactions with major unitholders are as follows:
For the six months ended
May 31, 2021 November 30, 2020
(Thousands of Yen)
Operating expenses ¥ 213,374 ¥ 210,718
73

Note 19 – Segment Information
Segment Information
Segment information is omitted as HEIWA REAL ESTATE REIT has only one segment, which is the property
leasing business.
Related Information
Information about Products and Services
Disclosure of this information is omitted as operating revenues to external customers for a single product/service
category accounts for more than 90% of the operating revenues on the statements of income and retained earnings.
Information by Geographic Areas
(1) Operating revenues
Disclosure of this information is omitted as domestic operating revenues account for more than 90% of total
operating revenues.
(2) Investment properties
Disclosure of this information is omitted as domestic investment properties account for more than 90% of the
book value of the total investment properties.
Information on Major Tenants
Disclosure of this information is omitted as there is no tenant that accounts for 10% or more of the operating
revenues recorded in the statements of income and retained earnings.
Note 20 – Subsequent Events
A. Issuance of new investment units
At the Board of Directors Meeting held on May 17, 2021 and May 25, 2021, HEIWA REAL ESTATE REIT
resolved to issue new investment units as described below and the payment for issuance of new investment units
through public offering and third-party allotment has been completed on June 1, 2021, and June 29, 2021,
respectively. As a result, the amount of unitholders’ capital is ¥90,063 thousand and the number of investment units
issued is 1,055,733 as of August 26, 2021.
1. Issuance of new investment units through public offering
(1) Number of investment units issued 53,100 units
(2) Issue price (offer price) ¥161,070 per unit
(3) Total amount of the issue ¥8,552,817,000
(4) Paid amount (issue price) ¥155,783 per unit
(5) Total paid amount (issue price) ¥8,272,077,300
(6) Payment date June 1, 2021
2. Issuance of new investment units through third-party allotment
(1) Number of investment units issued 2,700 units
(2) Paid amount (issue price) ¥155,783
(3) Total paid amount (issue price) ¥420,614,100
(4) Allottee SMBC Nikko Securities Inc.
(5) Payment date June 29, 2021
74

B. Acquisition of Assets
HEIWA REAL ESTATE REIT acquired one real estate trust beneficiary right and three real estates described
below on June 4, 2021.
Of-47 OSAKI CN BUILDING
Type of specified asset Real estate trust beneficiary right
Agreement date May 17, 2021
Acquisition date June 4, 2021
Acquisition price (Note 1) ¥5,160,000 thousand
Location (lot number) 5-10-10 Osaki, Shinagawa-ku, Tokyo
Purpose of use Office, Parking
Construction date October 2, 1992
Structure Steel-framed reinforced concrete with flat roof, 1 floor below
ground and 8 floors above ground
Total floor space (Note2) 4,779.40m2
Total rentable space 3,237.77m2
Notes:
1. “Acquisition price” is the price described in the real estate trust beneficiary right purchase agreement
(consumption tax excluded), and does not include the amounts of settlement for fixed property tax, city planning
tax, etc.
2. The trust building is a co-owned building and the total floor space is calculated by multiplying the total floor
space of the building by the co-ownership share of 78.16%.
Re-95 HF SHOKOJI AKABANE RESIDENCE Ⅱ
Type of specified asset (Note1) Real estate
Agreement date May 17, 2021
Acquisition date June 4, 2021
Acquisition price (Note2) ¥1,690,000 thousand
Location (lot number) 24-16 Iwabuchi-cho, Kita-ku, Tokyo
Purpose of use Residential complex
Construction date January 31, 2020
Structure Reinforced concrete with flat roof, 14 floors above ground
Total floor space 2,764.49m2
Total rentable space 2,438.42m2
Notes:
1. The acquired asset is a building with leasehold land. The leasehold is not the fixed term land lease right provided
in section 4, chapter 2 of the Act on Land and Building Leases.
2. “Acquisition price” is the price described in the real estate purchase agreement (consumption tax excluded),
and does not include the amounts of settlement for fixed property tax, city planning tax, etc.
Re-96 HF YAHIRO RESIDENCE
Type of specified asset (Note1) Real estate
Agreement date May 17, 2021
Acquisition date June 4, 2021
Acquisition price (Note2) ¥1,220,000 thousand
Location (lot number) 4-50-1 Yahiro, Sumida-ku, Tokyo
Purpose of use Residential complex
Construction date November 27, 2020
Structure Reinforced concrete with flat roof, 9 floors above ground
Total floor space 2,151.30m2
Total rentable space 1,919.50m2
Notes:
1. The acquired asset is a building with leasehold land. The leasehold is not the fixed term land lease right
provided in section 4, chapter 2 of the Act on Land and Building Leases.
2. “Acquisition price” is the price described in the real estate purchase agreement (consumption tax excluded),
and does not include the amounts of settlement for fixed property tax, city planning tax, etc.
75

Re-97 HF SETAGAYA KAMIMACHI RESIDENCE
Type of specified asset (Note1) Real estate
Agreement date May 17, 2021
Acquisition date June 4, 2021
Acquisition price (Note2) ¥700,000 thousand
Location (lot number) 1-45-9 Setagaya, Setagaya-ku, Tokyo
Purpose of use Residential complex
Construction date November 30, 2020
Structure Reinforced concrete with flat roof, 7 floors above ground
Total floor space 1,070.10m2
Total rentable space 759.24m2
Notes:
1. The acquired asset is a building with leasehold land. The leasehold is not the fixed term land lease right provided
in section 4, chapter 2 of the Act on Land and Building Leases.
2. “Acquisition price” is the price described in the real estate purchase agreement (consumption tax excluded),
and does not include the amounts of settlement for fixed property tax, city planning tax, etc.
C. Borrowing of Funds
HEIWA REAL ESTATE REIT borrowed funds as described below on June 4, 2021 (total borrowing amount of
¥400,000 thousand) to partly fund for acquisition of one real estate trust beneficiary right and three real estates on
the same date (as described in B. Acquisition of Assets above.)
Term loan-52
Lender
Borrowing
Amount
(Thousands
of Yen)
Maturity Date Repayment
Method Usage of Fund
Collateral and
Guarantee
Sumitomo Mitsui
Banking Corporation,
The Chiba Bank, Ltd.
¥400,000 October 31,
2024 (Note)
Lump-sum
repayment
To fund for acquisition
of properties and
others
Unsecured/
non-guaranteed
Note: In the event that the maturity date is not a business day, the repayment shall be made on the business day
immediately preceding it.
76