Embed Size (px)
Citation preview
SEMI QUALITATIVE EVALUATION OF ACCESS & COVERAGE
GARBATULLA DISTRICT; ISIOLO COUNTY
SEMI QUALITATIVE EVALUATION OF ACCESS & COVERAGE(SQUEAC)
REPORT
GARBATULLA DISTRICT; ISIOLO COUNTY KENYA
Funded by
MARCH 2012
SEMI QUALITATIVE EVALUATION OF ACCESS & COVERAGE
Funded by
ACF-USA / GARBATULLA DISTRICT ; MARCH 2012 2
TABLE OF CONTENTS 1 BACKGROUND .......................................................................................................................... 3 2 INVESTIGATION PROCESS ......................................................................................................... 3
2.1 STAGE ONE: ........................................................................................................................... 3 Identification of areas of high and low coverage and reasons for coverage failure using available program data ...................................................................................................................................... 3 2.1.1 PROGRAM ADMISSIONS .................................................................................................... 4 2.1.2 ADMISSION BY FACILITY UNIT ........................................................................................... 5 2.1.3 OVERALL REVIEW OF DEFAULTER RECORDS ..................................................................... 5 2.1.4 REVIEW OF MUAC ADMISSIONS ....................................................................................... 7 2.1.5 DISEASE INCIDENCE AND ADMISSION TRENDS ................................................................. 9 2.1.6 REVIEW OF PERFORMANCE INDICATORS ....................................................................... 10 2.2 STAGE 2: Testing of hypothesis ........................................................................................... 10 2.3 STAGE 3 ............................................................................................................................... 11 2.3.1 Developing a prior: .......................................................................................................... 11 2.3.2 Sampling methodology ................................................................................................... 12 2.3.3 Spatial representation ..................................................................................................... 13 2.3.4 WIDE AREA SURVEY RESULTS .......................................................................................... 13
3 APPENDIX ............................................................................................................................... 15 LIST OF TABLES Table 1: Results of hypothesis testing in Sericho and Garbatulla......................................................... 10 Table 2: Minimum number of villages .................................................................................................. 12 Table 3: Wide Area survey findings ...................................................................................................... 13 Table 4: Reasons for non attendance ................................................................................................... 13 Table 5: SEASONAL CALENDER and critical events (Adopted from ALRMP: Drought Monitoring Bulletin for Isiolo, Garbatulla and Merti Districts. April 2011.) ............................................................. 16 LIST OF FIGURES Figure 1: Program admission trends over time ...................................................................................... 1 Figure 2: Admissions by health unit over time ....................................................................................... 5 Figure 3: Admissions and defaulter in 2011 by health unit .................................................................... 6 Figure 4: Defaulter numbers by visit ...................................................................................................... 7 Figure 5: MUAC admissions by category ................................................................................................ 1 Figure 6: MUAC Admissions by health unit ............................................................................................ 8 Figure 7: Malaria and Diarrhea incidence trends VS admissions in Garbatulla district 2011 ................. 9 Figure 8: Performance indicators in 2011............................................................................................. 10
1 BACKGROUND ACF has been operational in Garbatulla District since February 2010. Since then, the agency has been undertaking an integrated program that encompasses nutrition, food security and livelihoods, water, sanitation and hygiene. The nutrition program mainly focuses on high Impact Nutrition Indicators (HINI) for sustainable impact. These indicator core activities surrounding integrated management of acute malnutrition, infant and young child feeding/nutrition., micron nutrient supplementation just to mention but a few. The main approach employed by the program is capacity building. As such, the agency closely works with and along the ministry of health and ministry of public health and sanitation in the implementation of all its nutrition programs. Five rounds of surveillance and 2 SMART surveys have been undertaken in Garbatulla district since 2010. However, the indirect coverage of feeding program unveiled by the surveys has just been used as adue to the limitations of the methodology. ACF thus deemed it necessary to undertake a coverage assessment using the approved methodology for Kenya; SQUEAC in March 20 To provide a clear baseline of it’s programmes using an approved methodology To develop feasible recommendations based on assessment findings The SQUEAC investigation was carried out by ACF Kenya with the support of ACFEvaluations, Learning & Accountability Unit. A three stage methodology was employed during this exercise.
2 INVESTIGATION PROCESS
2.1 STAGE ONE:
Identification of areas of high and low coverage and reasons for coverage failure using available program data
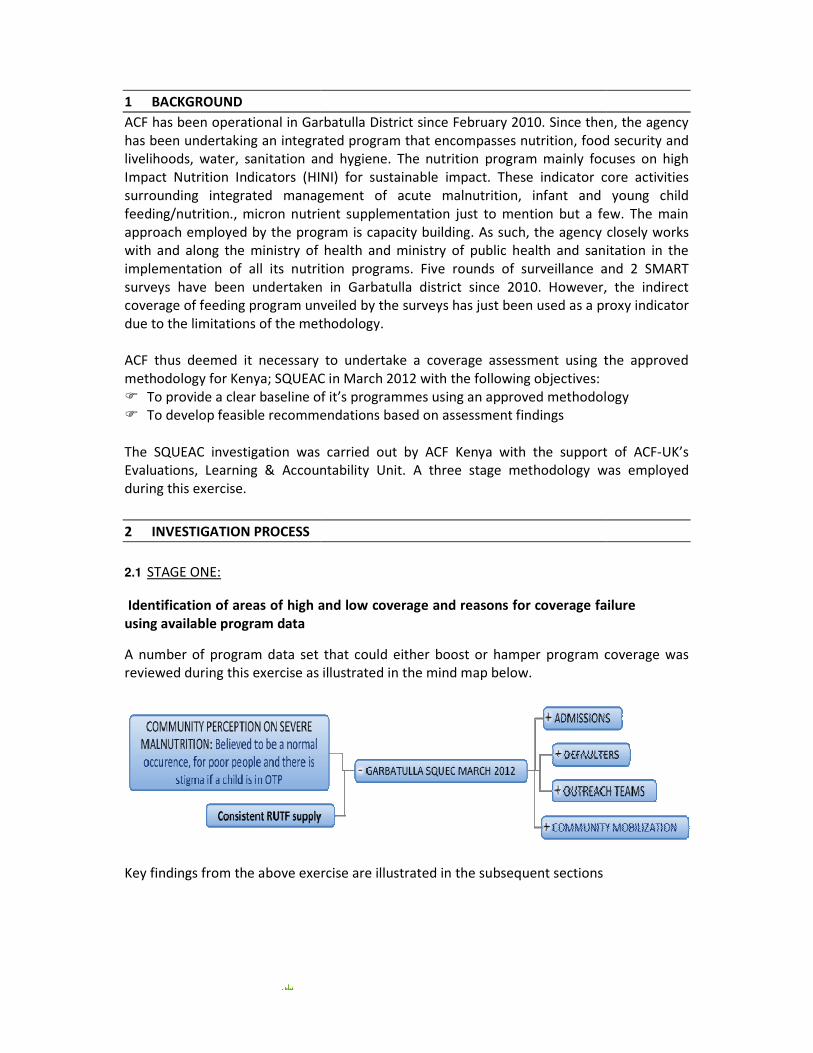
A number of program data set that could either boost or hamper program coverage was reviewed during this exercise as illustrated in the mind map below.
Key findings from the above exercise are illustrated in the subsequent sections
ACF has been operational in Garbatulla District since February 2010. Since then, the agency ntegrated program that encompasses nutrition, food security and
livelihoods, water, sanitation and hygiene. The nutrition program mainly focuses on high Impact Nutrition Indicators (HINI) for sustainable impact. These indicator core activities
integrated management of acute malnutrition, infant and young child feeding/nutrition., micron nutrient supplementation just to mention but a few. The main approach employed by the program is capacity building. As such, the agency closely works
ong the ministry of health and ministry of public health and sanitation in the implementation of all its nutrition programs. Five rounds of surveillance and 2 SMART surveys have been undertaken in Garbatulla district since 2010. However, the indirect
age of feeding program unveiled by the surveys has just been used as a proxy due to the limitations of the methodology.
ACF thus deemed it necessary to undertake a coverage assessment using the approved methodology for Kenya; SQUEAC in March 2012 with the following objectives:
To provide a clear baseline of it’s programmes using an approved methodologyTo develop feasible recommendations based on assessment findings
The SQUEAC investigation was carried out by ACF Kenya with the support of ACFEvaluations, Learning & Accountability Unit. A three stage methodology was employed
Identification of areas of high and low coverage and reasons for coverage failure
A number of program data set that could either boost or hamper program coverage was reviewed during this exercise as illustrated in the mind map below.
Key findings from the above exercise are illustrated in the subsequent sections
ACF has been operational in Garbatulla District since February 2010. Since then, the agency ntegrated program that encompasses nutrition, food security and
livelihoods, water, sanitation and hygiene. The nutrition program mainly focuses on high Impact Nutrition Indicators (HINI) for sustainable impact. These indicator core activities
integrated management of acute malnutrition, infant and young child feeding/nutrition., micron nutrient supplementation just to mention but a few. The main approach employed by the program is capacity building. As such, the agency closely works
ong the ministry of health and ministry of public health and sanitation in the implementation of all its nutrition programs. Five rounds of surveillance and 2 SMART surveys have been undertaken in Garbatulla district since 2010. However, the indirect
proxy indicator
ACF thus deemed it necessary to undertake a coverage assessment using the approved
To provide a clear baseline of it’s programmes using an approved methodology
The SQUEAC investigation was carried out by ACF Kenya with the support of ACF-UK’s Evaluations, Learning & Accountability Unit. A three stage methodology was employed
Identification of areas of high and low coverage and reasons for coverage failure
A number of program data set that could either boost or hamper program coverage was
Key findings from the above exercise are illustrated in the subsequent sections
ACF-USA / GARBATULLA DISTRICT ; MARCH 2012 4
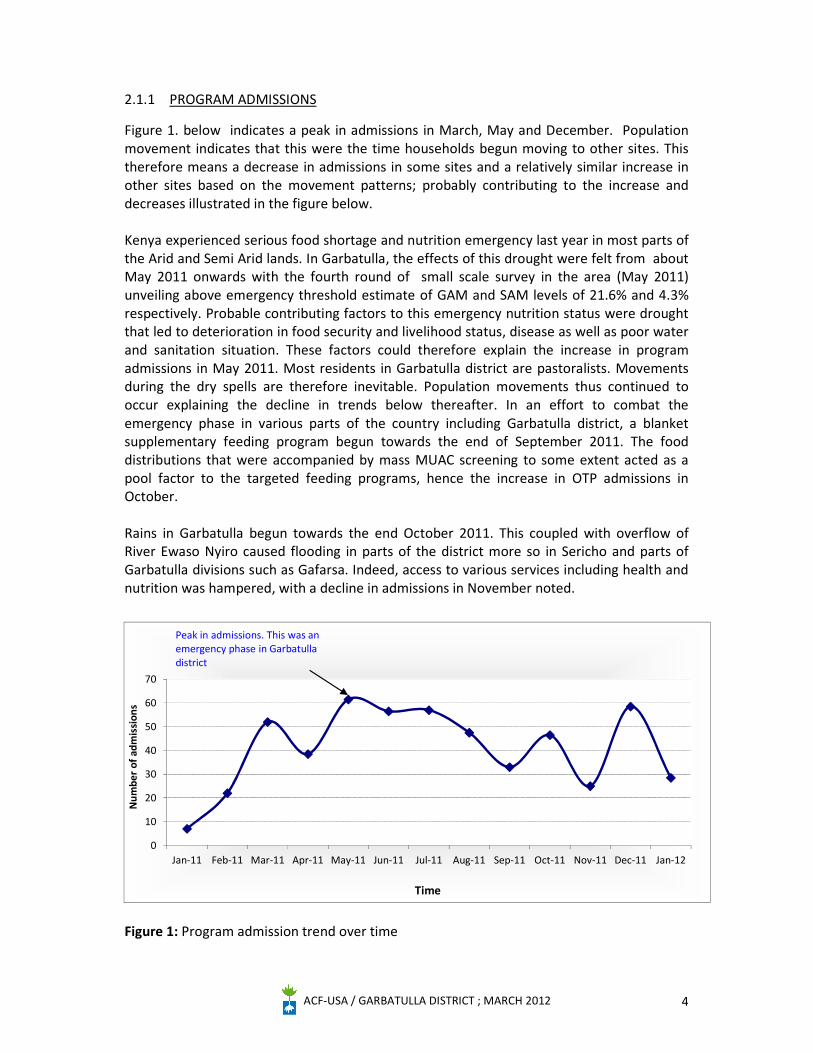
2.1.1 PROGRAM ADMISSIONS
Figure 1. below indicates a peak in admissions in March, May and December. Population movement indicates that this were the time households begun moving to other sites. This therefore means a decrease in admissions in some sites and a relatively similar increase in other sites based on the movement patterns; probably contributing to the increase and decreases illustrated in the figure below. Kenya experienced serious food shortage and nutrition emergency last year in most parts of the Arid and Semi Arid lands. In Garbatulla, the effects of this drought were felt from about May 2011 onwards with the fourth round of small scale survey in the area (May 2011) unveiling above emergency threshold estimate of GAM and SAM levels of 21.6% and 4.3% respectively. Probable contributing factors to this emergency nutrition status were drought that led to deterioration in food security and livelihood status, disease as well as poor water and sanitation situation. These factors could therefore explain the increase in program admissions in May 2011. Most residents in Garbatulla district are pastoralists. Movements during the dry spells are therefore inevitable. Population movements thus continued to occur explaining the decline in trends below thereafter. In an effort to combat the emergency phase in various parts of the country including Garbatulla district, a blanket supplementary feeding program begun towards the end of September 2011. The food distributions that were accompanied by mass MUAC screening to some extent acted as a pool factor to the targeted feeding programs, hence the increase in OTP admissions in October. Rains in Garbatulla begun towards the end October 2011. This coupled with overflow of River Ewaso Nyiro caused flooding in parts of the district more so in Sericho and parts of Garbatulla divisions such as Gafarsa. Indeed, access to various services including health and nutrition was hampered, with a decline in admissions in November noted.
Figure 1: Program admission trend over time
0
10
20
30
40
50
60
70
Jan-11 Feb-11 Mar-11 Apr-11 May-11 Jun-11 Jul-11 Aug-11 Sep-11 Oct-11 Nov-11 Dec-11 Jan-12
Num
ber
of a
dmis
sion
s
Time
Peak in admissions. This was an emergency phase in Garbatulla district
ACF-USA / GARBATULLA DISTRICT ; MARCH 2012 5
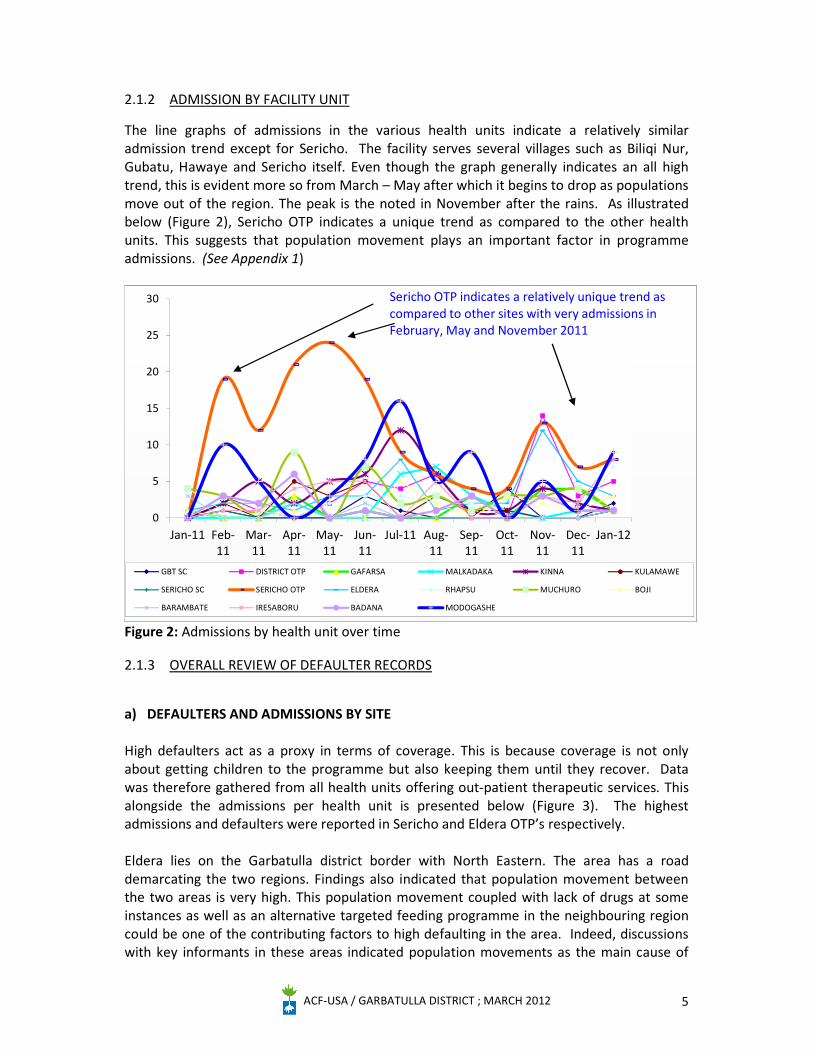
2.1.2 ADMISSION BY FACILITY UNIT
The line graphs of admissions in the various health units indicate a relatively similar admission trend except for Sericho. The facility serves several villages such as Biliqi Nur, Gubatu, Hawaye and Sericho itself. Even though the graph generally indicates an all high trend, this is evident more so from March – May after which it begins to drop as populations move out of the region. The peak is the noted in November after the rains. As illustrated below (Figure 2), Sericho OTP indicates a unique trend as compared to the other health units. This suggests that population movement plays an important factor in programme admissions. (See Appendix 1)
Figure 2: Admissions by health unit over time
2.1.3 OVERALL REVIEW OF DEFAULTER RECORDS
a) DEFAULTERS AND ADMISSIONS BY SITE
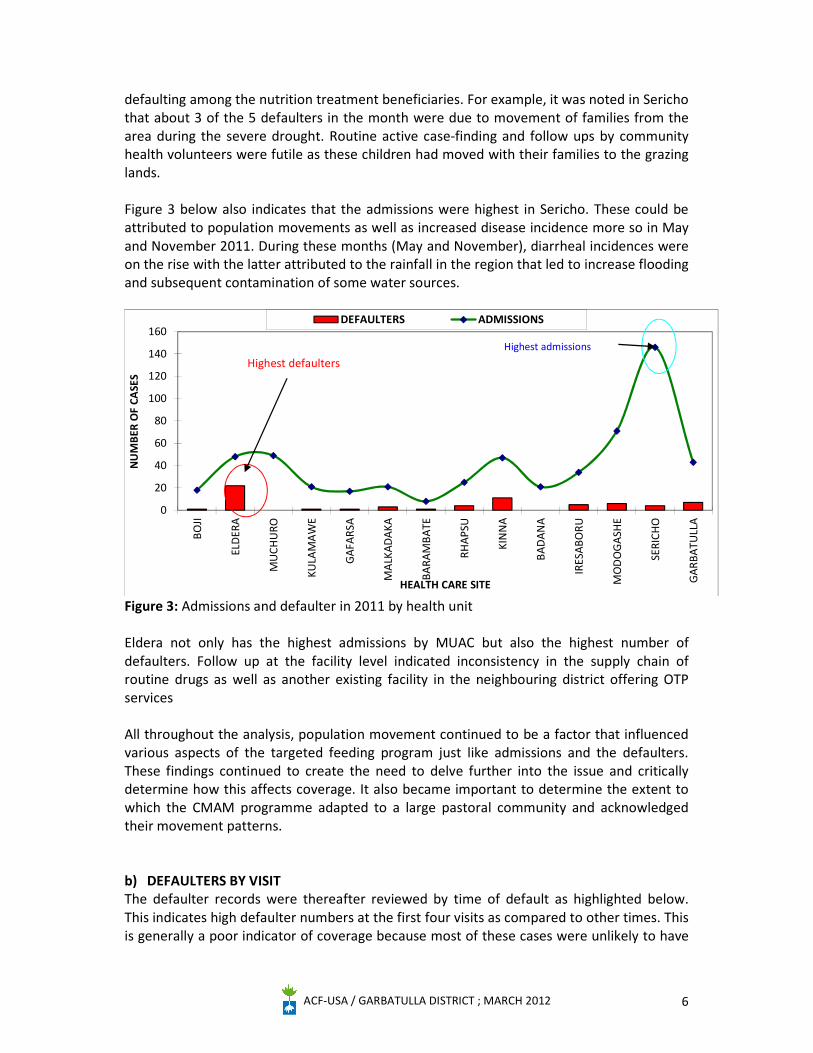
High defaulters act as a proxy in terms of coverage. This is because coverage is not only about getting children to the programme but also keeping them until they recover. Data was therefore gathered from all health units offering out-patient therapeutic services. This alongside the admissions per health unit is presented below (Figure 3). The highest admissions and defaulters were reported in Sericho and Eldera OTP’s respectively. Eldera lies on the Garbatulla district border with North Eastern. The area has a road demarcating the two regions. Findings also indicated that population movement between the two areas is very high. This population movement coupled with lack of drugs at some instances as well as an alternative targeted feeding programme in the neighbouring region could be one of the contributing factors to high defaulting in the area. Indeed, discussions with key informants in these areas indicated population movements as the main cause of
0
5
10
15
20
25
30
Jan-11 Feb-11
Mar-11
Apr-11
May-11
Jun-11
Jul-11 Aug-11
Sep-11
Oct-11
Nov-11
Dec-11
Jan-12
GBT SC DISTRICT OTP GAFARSA MALKADAKA KINNA KULAMAWE
SERICHO SC SERICHO OTP ELDERA RHAPSU MUCHURO BOJI
BARAMBATE IRESABORU BADANA MODOGASHE
Sericho OTP indicates a relatively unique trend as compared to other sites with very admissions in February, May and November 2011
ACF-USA / GARBATULLA DISTRICT ; MARCH 2012 6
defaulting among the nutrition treatment beneficiaries. For example, it was noted in Sericho that about 3 of the 5 defaulters in the month were due to movement of families from the area during the severe drought. Routine active case-finding and follow ups by community health volunteers were futile as these children had moved with their families to the grazing lands. Figure 3 below also indicates that the admissions were highest in Sericho. These could be attributed to population movements as well as increased disease incidence more so in May and November 2011. During these months (May and November), diarrheal incidences were on the rise with the latter attributed to the rainfall in the region that led to increase flooding and subsequent contamination of some water sources.
Figure 3: Admissions and defaulter in 2011 by health unit Eldera not only has the highest admissions by MUAC but also the highest number of defaulters. Follow up at the facility level indicated inconsistency in the supply chain of routine drugs as well as another existing facility in the neighbouring district offering OTP services All throughout the analysis, population movement continued to be a factor that influenced various aspects of the targeted feeding program just like admissions and the defaulters. These findings continued to create the need to delve further into the issue and critically determine how this affects coverage. It also became important to determine the extent to which the CMAM programme adapted to a large pastoral community and acknowledged their movement patterns. b) DEFAULTERS BY VISIT The defaulter records were thereafter reviewed by time of default as highlighted below. This indicates high defaulter numbers at the first four visits as compared to other times. This is generally a poor indicator of coverage because most of these cases were unlikely to have
0
20
40
60
80
100
120
140
160
BOJI
ELD
ERA
MU
CHU
RO
KULA
MA
WE
GAF
ARSA
MA
LKAD
AKA
BARA
MBA
TE
RHAP
SU
KIN
NA
BAD
ANA
IRES
ABO
RU
MO
DO
GA
SHE
SERI
CHO
GAR
BATU
LLA
NU
MBE
R O
F CA
SES
HEALTH CARE SITE
DEFAULTERS ADMISSIONS
Highest defaultersHighest admissions
ACF-USA / GARBATULLA DISTRICT ; MARCH 2012 7
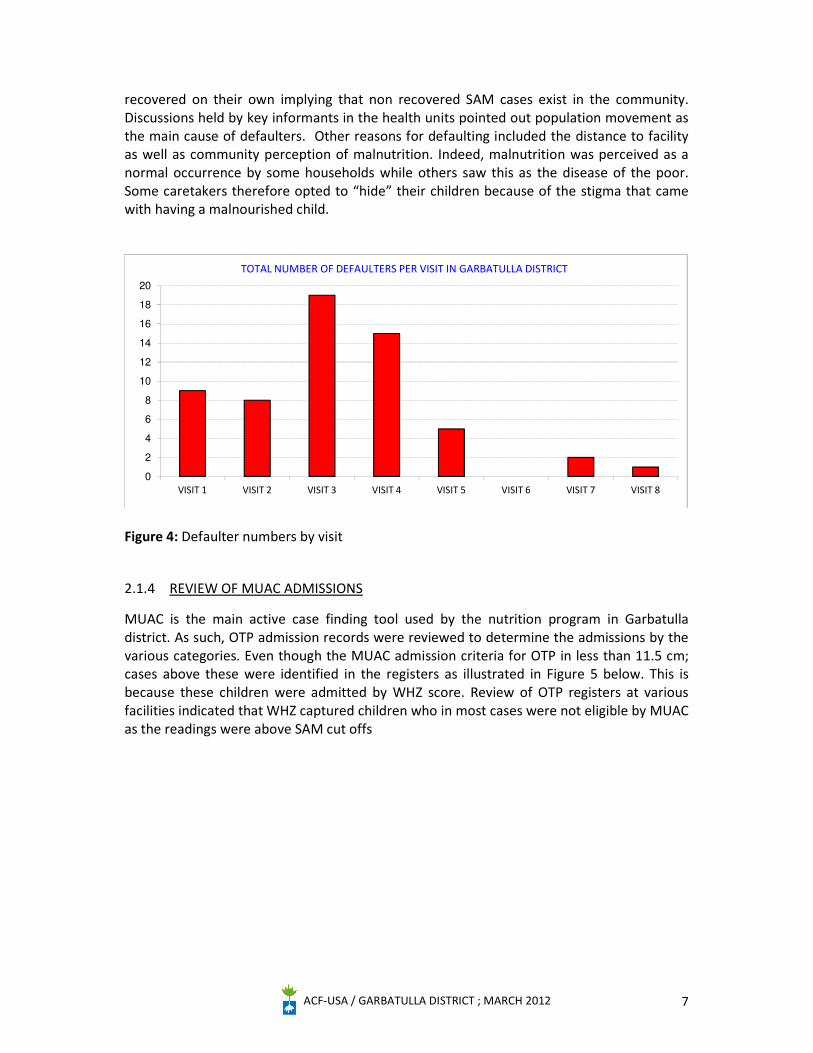
recovered on their own implying that non recovered SAM cases exist in the community. Discussions held by key informants in the health units pointed out population movement as the main cause of defaulters. Other reasons for defaulting included the distance to facility as well as community perception of malnutrition. Indeed, malnutrition was perceived as a normal occurrence by some households while others saw this as the disease of the poor. Some caretakers therefore opted to “hide” their children because of the stigma that came with having a malnourished child.
Figure 4: Defaulter numbers by visit
2.1.4 REVIEW OF MUAC ADMISSIONS
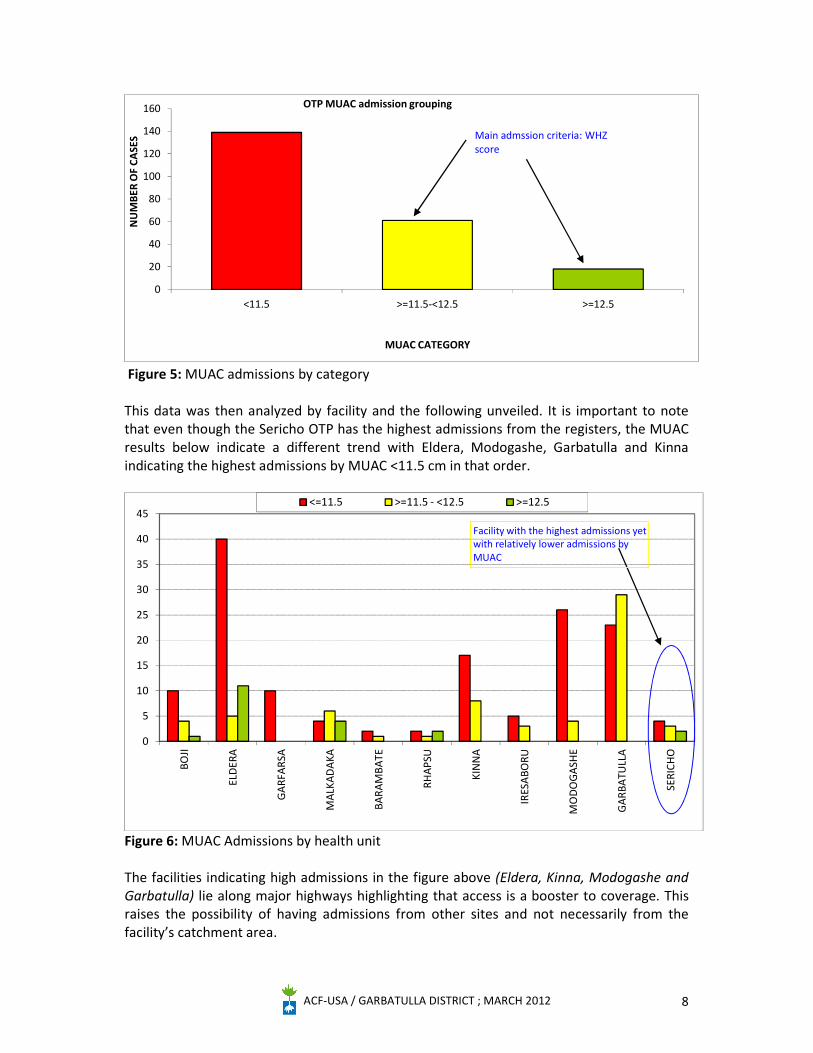
MUAC is the main active case finding tool used by the nutrition program in Garbatulla district. As such, OTP admission records were reviewed to determine the admissions by the various categories. Even though the MUAC admission criteria for OTP in less than 11.5 cm; cases above these were identified in the registers as illustrated in Figure 5 below. This is because these children were admitted by WHZ score. Review of OTP registers at various facilities indicated that WHZ captured children who in most cases were not eligible by MUAC as the readings were above SAM cut offs
0
2
4
6
8
10
12
14
16
18
20
VISIT 1 VISIT 2 VISIT 3 VISIT 4 VISIT 5 VISIT 6 VISIT 7 VISIT 8
TOTAL NUMBER OF DEFAULTERS PER VISIT IN GARBATULLA DISTRICT
ACF-USA / GARBATULLA DISTRICT ; MARCH 2012 8
Figure 5: MUAC admissions by category This data was then analyzed by facility and the following unveiled. It is important to note that even though the Sericho OTP has the highest admissions from the registers, the MUAC results below indicate a different trend with Eldera, Modogashe, Garbatulla and Kinna indicating the highest admissions by MUAC <11.5 cm in that order.
Figure 6: MUAC Admissions by health unit The facilities indicating high admissions in the figure above (Eldera, Kinna, Modogashe and Garbatulla) lie along major highways highlighting that access is a booster to coverage. This raises the possibility of having admissions from other sites and not necessarily from the facility’s catchment area.
0
5
10
15
20
25
30
35
40
45
BOJI
ELD
ERA
GA
RFA
RSA
MA
LKA
DA
KA
BARA
MBA
TE
RHA
PSU
KIN
NA
IRES
ABO
RU
MO
DO
GA
SHE
GA
RBA
TULL
A
SERI
CHO
<=11.5 >=11.5 - <12.5 >=12.5
Facility with the highest admissions yet with relatively lower admissions by MUAC
0
20
40
60
80
100
120
140
160
<11.5 >=11.5-<12.5 >=12.5
NU
MBE
R O
F CA
SES
MUAC CATEGORY
OTP MUAC admission grouping
Main admssion criteria: WHZ score
ACF-USA / GARBATULLA DISTRICT ; MARCH 2012 9
2.1.5 DISEASE INCIDENCE AND ADMISSION TRENDS
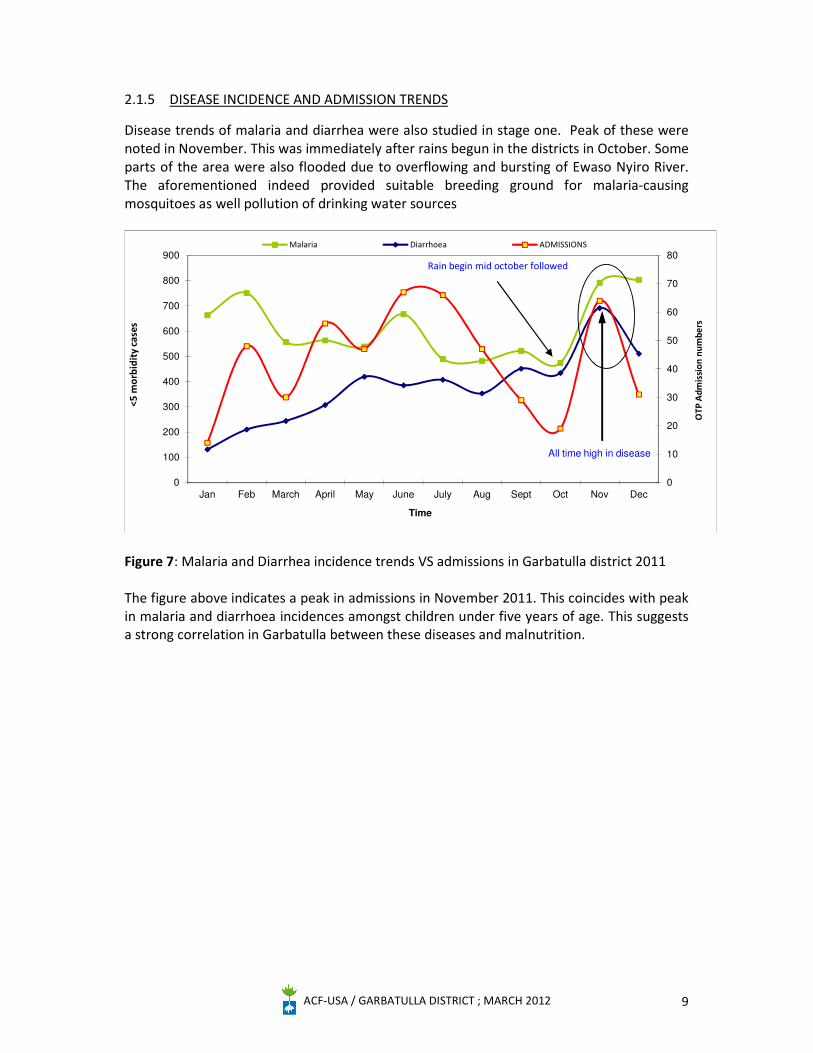
Disease trends of malaria and diarrhea were also studied in stage one. Peak of these were noted in November. This was immediately after rains begun in the districts in October. Some parts of the area were also flooded due to overflowing and bursting of Ewaso Nyiro River. The aforementioned indeed provided suitable breeding ground for malaria-causing mosquitoes as well pollution of drinking water sources
Figure 7: Malaria and Diarrhea incidence trends VS admissions in Garbatulla district 2011 The figure above indicates a peak in admissions in November 2011. This coincides with peak in malaria and diarrhoea incidences amongst children under five years of age. This suggests a strong correlation in Garbatulla between these diseases and malnutrition.
0
10
20
30
40
50
60
70
80
0
100
200
300
400
500
600
700
800
900
Jan Feb March April May June July Aug Sept Oct Nov Dec
OTP
Adm
issi
on n
umbe
rs
<5 m
orbi
dity
cas
es
Time
Malaria Diarrhoea ADMISSIONS
Rain begin mid october followed
All time high in disease
ACF-USA / GARBATULLA DISTRICT ; MARCH 2012 10
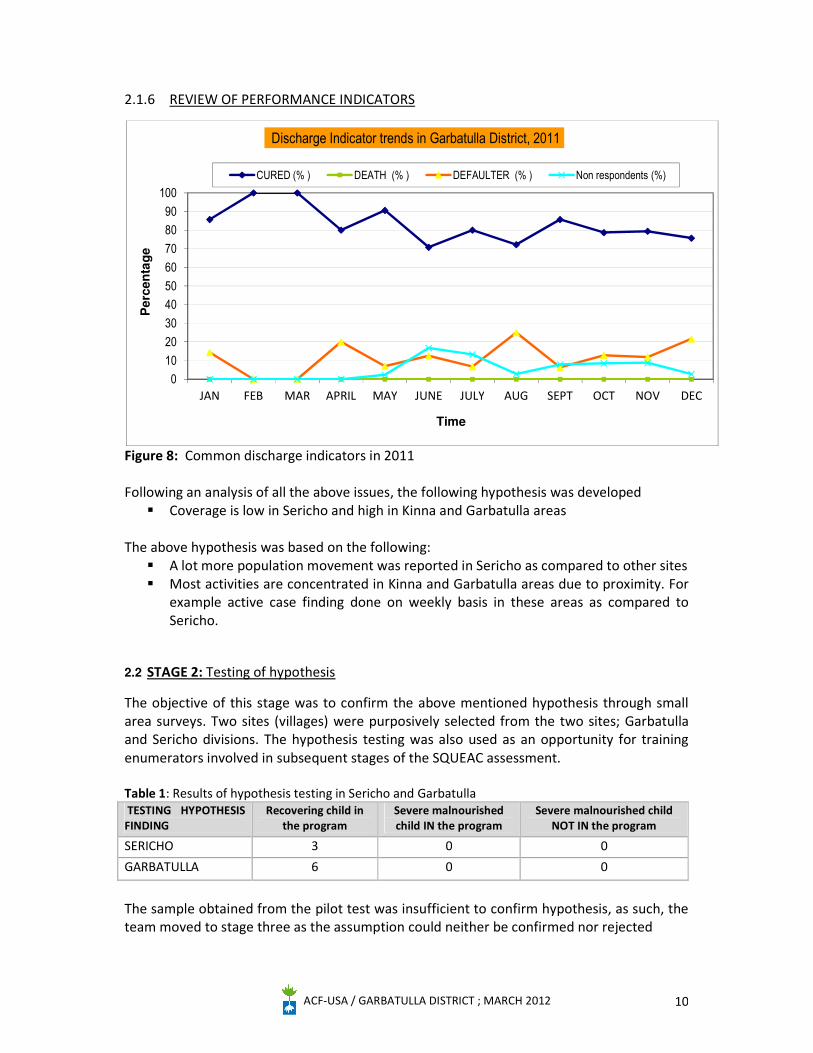
2.1.6 REVIEW OF PERFORMANCE INDICATORS
Figure 8: Common discharge indicators in 2011 Following an analysis of all the above issues, the following hypothesis was developed
Coverage is low in Sericho and high in Kinna and Garbatulla areas The above hypothesis was based on the following:
A lot more population movement was reported in Sericho as compared to other sites Most activities are concentrated in Kinna and Garbatulla areas due to proximity. For
example active case finding done on weekly basis in these areas as compared to Sericho.
2.2 STAGE 2: Testing of hypothesis
The objective of this stage was to confirm the above mentioned hypothesis through small area surveys. Two sites (villages) were purposively selected from the two sites; Garbatulla and Sericho divisions. The hypothesis testing was also used as an opportunity for training enumerators involved in subsequent stages of the SQUEAC assessment. Table 1: Results of hypothesis testing in Sericho and Garbatulla TESTING HYPOTHESIS FINDING
Recovering child in the program
Severe malnourished child IN the program
Severe malnourished child NOT IN the program
SERICHO 3 0 0 GARBATULLA 6 0 0
The sample obtained from the pilot test was insufficient to confirm hypothesis, as such, the team moved to stage three as the assumption could neither be confirmed nor rejected
0102030405060708090
100
JAN FEB MAR APRIL MAY JUNE JULY AUG SEPT OCT NOV DEC
Pe
rce
nta
ge
Time
Discharge Indicator trends in Garbatulla District, 2011
CURED (% ) DEATH (% ) DEFAULTER (% ) Non respondents (%)
ACF-USA / GARBATULLA DISTRICT ; MARCH 2012 11
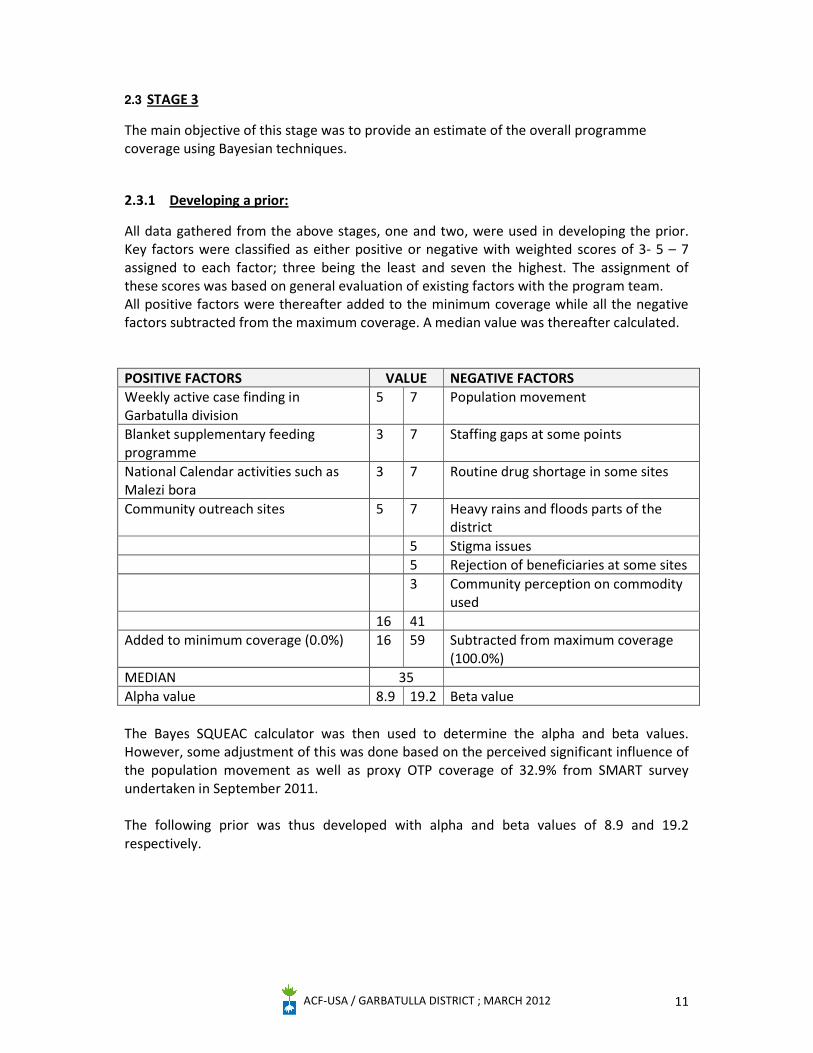
2.3 STAGE 3
The main objective of this stage was to provide an estimate of the overall programme coverage using Bayesian techniques.
2.3.1 Developing a prior:
All data gathered from the above stages, one and two, were used in developing the prior. Key factors were classified as either positive or negative with weighted scores of 3- 5 – 7 assigned to each factor; three being the least and seven the highest. The assignment of these scores was based on general evaluation of existing factors with the program team. All positive factors were thereafter added to the minimum coverage while all the negative factors subtracted from the maximum coverage. A median value was thereafter calculated. POSITIVE FACTORS VALUE NEGATIVE FACTORS Weekly active case finding in Garbatulla division
5 7 Population movement
Blanket supplementary feeding programme
3 7 Staffing gaps at some points
National Calendar activities such as Malezi bora
3 7 Routine drug shortage in some sites
Community outreach sites 5 7 Heavy rains and floods parts of the district
5 Stigma issues 5 Rejection of beneficiaries at some sites 3 Community perception on commodity
used 16 41 Added to minimum coverage (0.0%) 16 59 Subtracted from maximum coverage
(100.0%) MEDIAN 35 Alpha value 8.9 19.2 Beta value The Bayes SQUEAC calculator was then used to determine the alpha and beta values. However, some adjustment of this was done based on the perceived significant influence of the population movement as well as proxy OTP coverage of 32.9% from SMART survey undertaken in September 2011. The following prior was thus developed with alpha and beta values of 8.9 and 19.2 respectively.
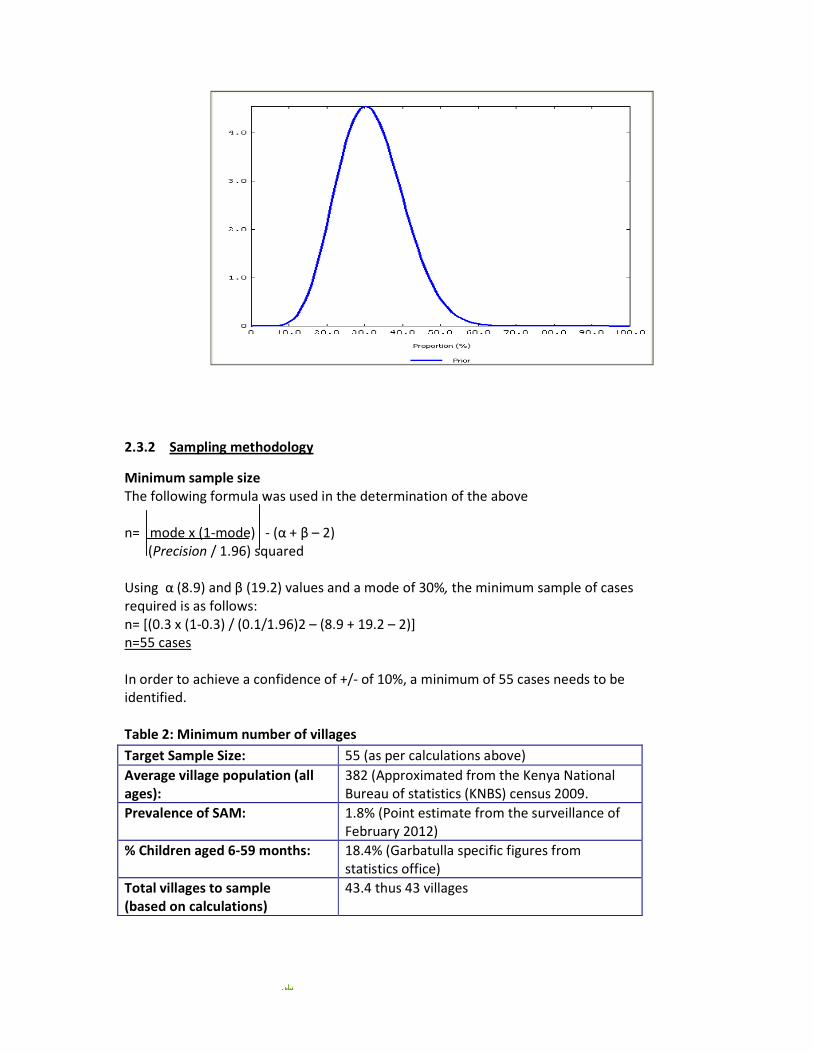
2.3.2 Sampling methodology
Minimum sample size The following formula was used in the determination of the above n= mode x (1-mode) - (α + β – 2) (Precision / 1.96) squared Using α (8.9) and β (19.2) values and a mode of 30%, the minimum sample of cases required is as follows: n= [(0.3 x (1-0.3) / (0.1/1.96)2 – (8.9 + 19.2 – 2)] n=55 cases In order to achieve a confidence of +/- of 10%, a minimum of 55 cases needs to be identified. Table 2: Minimum number of villages
Target Sample Size: 55 (as per calculations above) Average village population (all ages):
382 (Approximated from the Kenya National Bureau of statistics (KNBS) census 2009.
Prevalence of SAM: 1.8% (Point estimate from the surveillance of February 2012)
% Children aged 6-59 months: 18.4% (Garbatulla specific figures from statistics office)
Total villages to sample (based on calculations)
43.4 thus 43 villages
ACF-USA / GARBATULLA DISTRICT ; MARCH 2012 13
2.3.3 Spatial representation
One of the difficulties experienced during this exercise was getting an up to date map that is to scale and contains all the villages. As such, an updated list of villages in the area was used. The list contained 80 villages with the wide area survey requiring 43 villages as explained in the table above. A sampling interval of 1.86 was then obtained (80/43). ENA for SMART software was then used to select a random number between 1 and 2; random number 1 selected. Sampling villages were then selected through systematic sampling applied on the sampling frame as illustrated in Annex 4.
2.3.4 WIDE AREA SURVEY RESULTS
Table 3: Wide Area survey findings Number of cases Number of current SAM cases 23 Number of SAM cases in the program 16 Number of SAM cases not in the program 7 Number of recovering cases attending the program 78 All caretakers of the 7 malnourished children not in the program knew that they were malnourished. However, only 5 knew of a programme that could treat their children. Main reasons for not attending the program amongst the cases identified were (Table 4): Table 4: Reasons for non attendance
Number of cases Lack of awareness about the programme 2 Carer not able to attend the program 3 Carer ashamed 3 Child rejected by the programme 2 Others 3 As illustrated in Table 2, the findings from the wide area survey are less than the minimum number of cases (55) initially required. The findings indicate a conflict between the prior and the likelihood curves. There is limited overlap between the two to make the resulting curve (posterior) and its mode reliable. This is due to a number of possible factors with the main one being pegged on population movement. The prior was developed based on both sedentary and pastoral movement; however, the actual study focused on available population in Garbatulla at that point in time (mostly sedentary). In effect, this meant that the original prior estimation of coverage was based on expected low coverage amongst all sectors of the community (sedentary and pastoralist), whereas the wide-area survey was based on only part of the population (sedentary). This reflects the sampling challenges faced by coverage assessments assessing pastoralist populations. Whilst this discrepancy prevented this assessment from estimating overall coverage, the assessment does suggest that coverage in the district is likely to be >30%.
ACF-USA / GARBATULLA DISTRICT ; MARCH 2012 14
CONCLUSION AND RECOMMENDATIONS This was the first SQUEAC assessment undertaken by ACF Kenya in its operational area. This was generally an informative process to the programme enabling it to deeply understand the dynamics influencing its programs as well as how to further tackle future assessments.
It has become clearer to the program now that pastoral movement is a factor that
needs to be closely followed up and understood in depth. For example, defaulters from one site could actually be admissions in another site during the seasonal pastoral movements. Exploring operational alternatives to better cater for these movements should be explored.
Access to services in the district is generally adequate and in areas where no facilities
exist, outreach services have been offered either on weekly or monthly basis based on needs. There is however a need to clearly understand population movements in this area and look at the feasibility of ensuring services reach these populations irrespective of where they are.
There is need to deeply look at the various health facility records and how this
translates into accurate information. However much the capacity building is taking root in the area, some gaps were noted in terms of data management. For example, some finer details were missing from registers such as date of discharge. Revisiting reporting standards in light of the needs of assessments and other M&E initiatives should be considered.
Ensure that drug supply is consistent at the facility level. Indeed, OTP programs are
not only affected by lack of ready to use therapeutic feeds but also other routine drugs as has been cited in Eldera dispensary. These compounding factors need to considered in details as they are bound to affect program coverage
Management of stigma and community perception on malnutrition is necessary for
proper uptake. As such, the need for sensitization on malnutrition, its causes and management should be prioritised.
ACF-USA / GARBATULLA DISTRICT ; MARCH 2012 15
3 APPENDIX
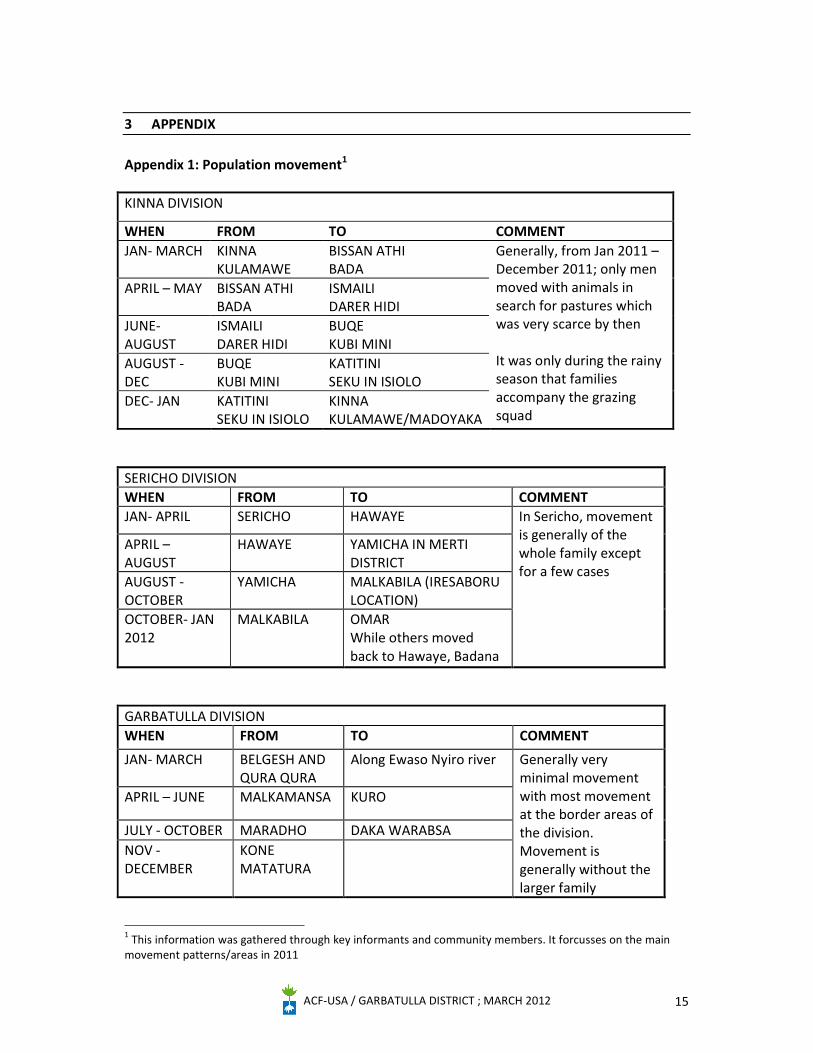
Appendix 1: Population movement1 KINNA DIVISION
WHEN FROM TO COMMENT JAN- MARCH KINNA
KULAMAWE BISSAN ATHI BADA
Generally, from Jan 2011 – December 2011; only men moved with animals in search for pastures which was very scarce by then It was only during the rainy season that families accompany the grazing squad
APRIL – MAY BISSAN ATHI BADA
ISMAILI DARER HIDI
JUNE- AUGUST
ISMAILI DARER HIDI
BUQE KUBI MINI
AUGUST - DEC
BUQE KUBI MINI
KATITINI SEKU IN ISIOLO
DEC- JAN KATITINI SEKU IN ISIOLO
KINNA KULAMAWE/MADOYAKA
SERICHO DIVISION WHEN FROM TO COMMENT JAN- APRIL SERICHO HAWAYE In Sericho, movement
is generally of the whole family except for a few cases
APRIL – AUGUST
HAWAYE YAMICHA IN MERTI DISTRICT
AUGUST - OCTOBER
YAMICHA MALKABILA (IRESABORU LOCATION)
OCTOBER- JAN 2012
MALKABILA OMAR While others moved back to Hawaye, Badana
GARBATULLA DIVISION WHEN FROM TO COMMENT
JAN- MARCH BELGESH AND QURA QURA
Along Ewaso Nyiro river Generally very minimal movement with most movement at the border areas of the division. Movement is generally without the larger family
APRIL – JUNE MALKAMANSA KURO
JULY - OCTOBER MARADHO DAKA WARABSA NOV - DECEMBER
KONE MATATURA
1 This information was gathered through key informants and community members. It forcusses on the main movement patterns/areas in 2011
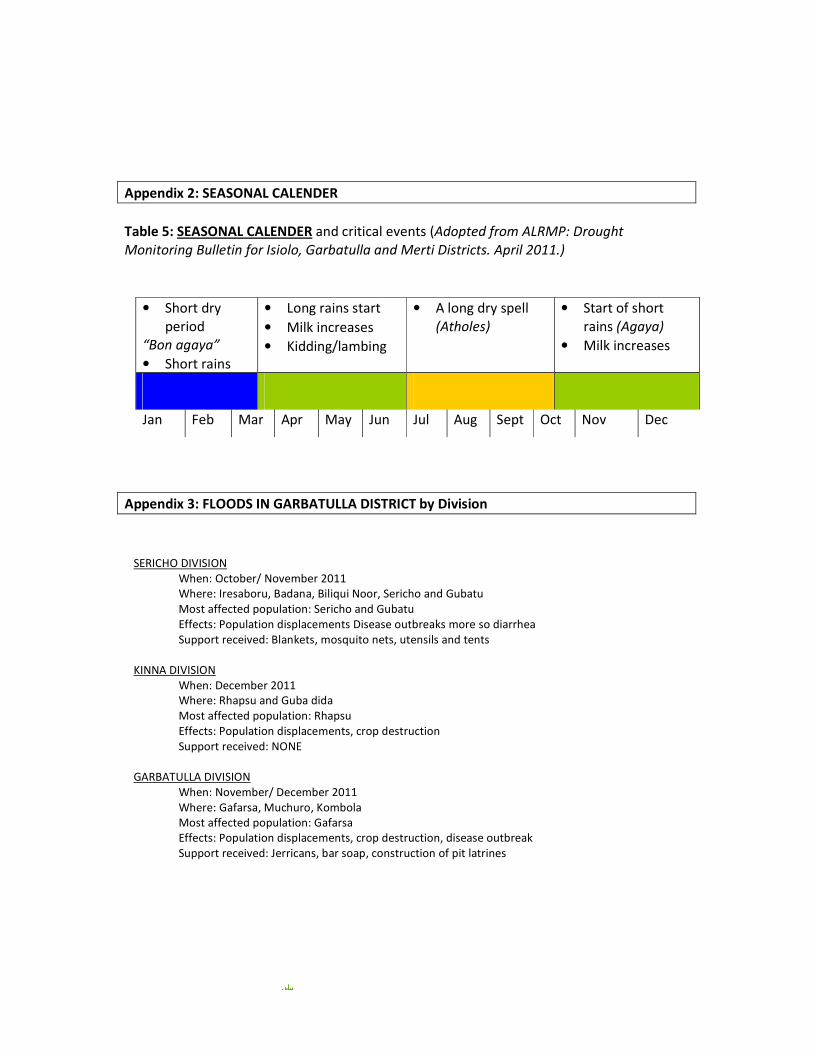
Appendix 2: SEASONAL CALENDER Table 5: SEASONAL CALENDER and critical events (Adopted from ALRMP: Drought Monitoring Bulletin for Isiolo, Garbatulla and Merti Districts. April 2011.)
Appendix 3: FLOODS IN GARBATULLA DISTRICT by Division
• Short dry period
“Bon agaya” • Short rains
• Long rains start • Milk increases • Kidding/lambing
• A long dry spell (Atholes)
• Start of short rains (Agaya)
• Milk increases
Jan Feb Mar Apr May Jun Jul Aug Sept Oct Nov Dec
SERICHO DIVISION When: October/ November 2011 Where: Iresaboru, Badana, Biliqui Noor, Sericho and Gubatu Most affected population: Sericho and Gubatu Effects: Population displacements Disease outbreaks more so diarrhea Support received: Blankets, mosquito nets, utensils and tents
KINNA DIVISION
When: December 2011 Where: Rhapsu and Guba dida Most affected population: Rhapsu Effects: Population displacements, crop destruction Support received: NONE
GARBATULLA DIVISION
When: November/ December 2011 Where: Gafarsa, Muchuro, Kombola Most affected population: Gafarsa Effects: Population displacements, crop destruction, disease outbreak Support received: Jerricans, bar soap, construction of pit latrines
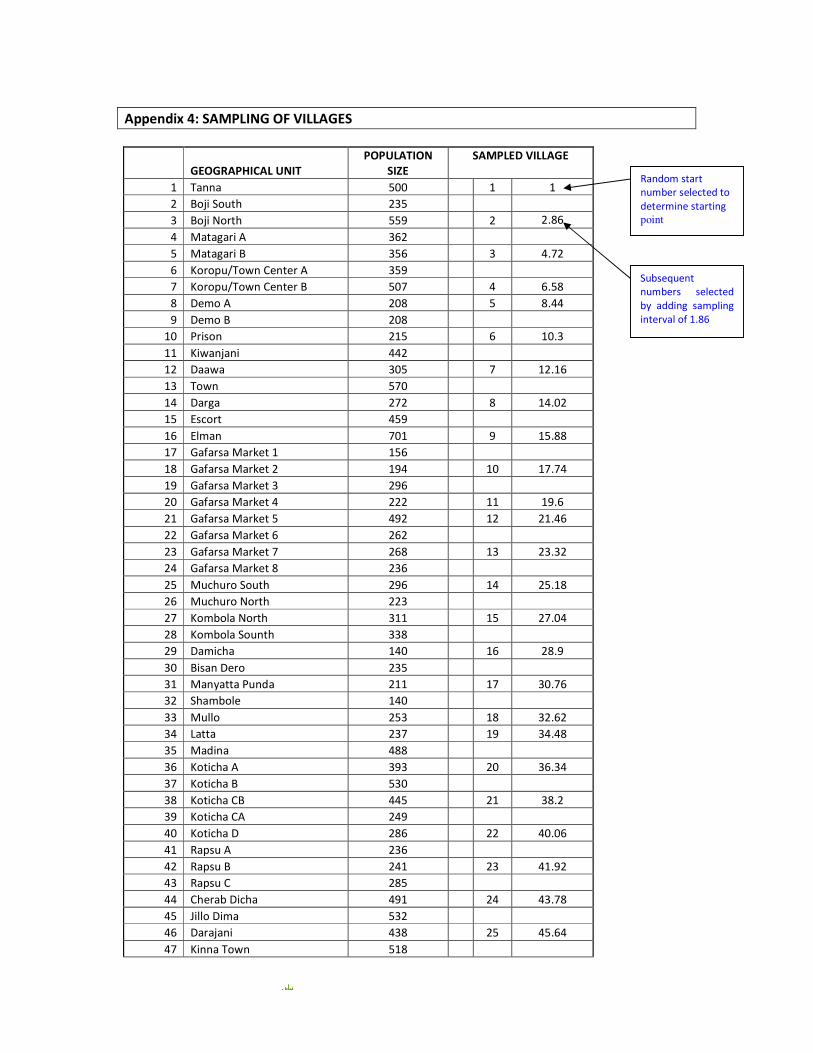
Appendix 4: SAMPLING OF VILLAGES
GEOGRAPHICAL UNIT POPULATION
SIZE SAMPLED VILLAGE
1 Tanna 500 1 1 2 Boji South 235 3 Boji North 559 2 2.86 4 Matagari A 362 5 Matagari B 356 3 4.72 6 Koropu/Town Center A 359 7 Koropu/Town Center B 507 4 6.58 8 Demo A 208 5 8.44 9 Demo B 208
10 Prison 215 6 10.3 11 Kiwanjani 442 12 Daawa 305 7 12.16 13 Town 570 14 Darga 272 8 14.02 15 Escort 459 16 Elman 701 9 15.88 17 Gafarsa Market 1 156 18 Gafarsa Market 2 194 10 17.74 19 Gafarsa Market 3 296 20 Gafarsa Market 4 222 11 19.6 21 Gafarsa Market 5 492 12 21.46 22 Gafarsa Market 6 262 23 Gafarsa Market 7 268 13 23.32 24 Gafarsa Market 8 236 25 Muchuro South 296 14 25.18 26 Muchuro North 223 27 Kombola North 311 15 27.04 28 Kombola Sounth 338 29 Damicha 140 16 28.9 30 Bisan Dero 235 31 Manyatta Punda 211 17 30.76 32 Shambole 140 33 Mullo 253 18 32.62 34 Latta 237 19 34.48 35 Madina 488 36 Koticha A 393 20 36.34 37 Koticha B 530 38 Koticha CB 445 21 38.2 39 Koticha CA 249 40 Koticha D 286 22 40.06 41 Rapsu A 236 42 Rapsu B 241 23 41.92 43 Rapsu C 285 44 Cherab Dicha 491 24 43.78 45 Jillo Dima 532 46 Darajani 438 25 45.64 47 Kinna Town 518
Random start number selected to determine starting point
Subsequent numbers selected by adding sampling interval of 1.86
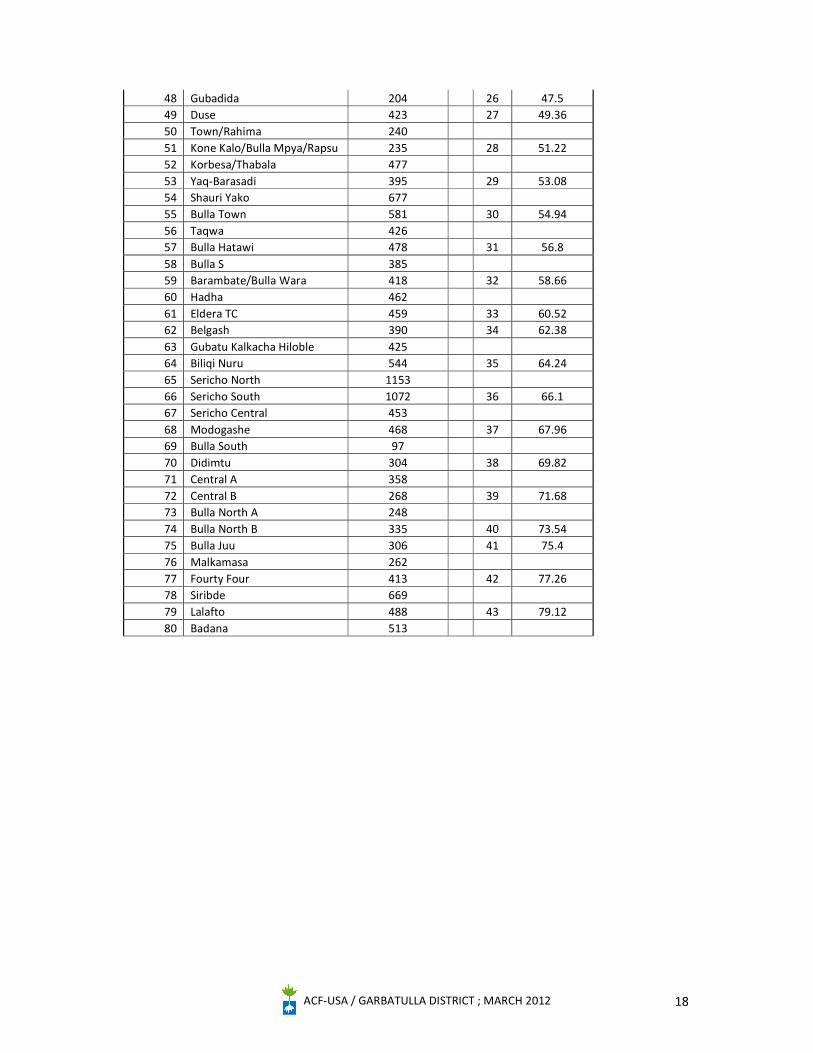
ACF-USA / GARBATULLA DISTRICT ; MARCH 2012 18
48 Gubadida 204 26 47.5 49 Duse 423 27 49.36 50 Town/Rahima 240 51 Kone Kalo/Bulla Mpya/Rapsu 235 28 51.22 52 Korbesa/Thabala 477 53 Yaq-Barasadi 395 29 53.08 54 Shauri Yako 677 55 Bulla Town 581 30 54.94 56 Taqwa 426 57 Bulla Hatawi 478 31 56.8 58 Bulla S 385 59 Barambate/Bulla Wara 418 32 58.66 60 Hadha 462 61 Eldera TC 459 33 60.52 62 Belgash 390 34 62.38 63 Gubatu Kalkacha Hiloble 425 64 Biliqi Nuru 544 35 64.24 65 Sericho North 1153 66 Sericho South 1072 36 66.1 67 Sericho Central 453 68 Modogashe 468 37 67.96 69 Bulla South 97 70 Didimtu 304 38 69.82 71 Central A 358 72 Central B 268 39 71.68 73 Bulla North A 248 74 Bulla North B 335 40 73.54 75 Bulla Juu 306 41 75.4 76 Malkamasa 262 77 Fourty Four 413 42 77.26 78 Siribde 669 79 Lalafto 488 43 79.12 80 Badana 513