Embed Size (px)
Citation preview
Semi-Automatic Classification of Power Lines by Using Airborne Lidar
Dragana POPOVIC, Vladimir PAJIC, Dusan JOVANOVIC, Filip SABO, Jovana RADOVIC,
Serbia
Key words: LIDAR, Power Lines, Cadastre, Classification
SUMMARY
Light Detection and Ranging (LIDAR) can be used for collecting spatial data of power
(transmission) lines providing more accurate geometric information of the power lines and
vegetation/object near power electric network. However problem with this kind of data is extraction
and classification of raw point cloud data. There is no perfect automatic classification of points, so
it is necessary to process data with semi-automatic classification.
This paper describes the method of applying automatic and semi-automatic classification to point
cloud data in order to extract valid 2D/3D cadastre data. Also, this paper analyses the combination
of orthophoto and oblique images with LIDAR 3D data for the area of interest. By using the
combination of the two datasets, it is possible to detect more details. After 2D/3D vectorization and
point classification, derived data is used to create Digital Terrain Model (DTM), longitudinal
profiles, cadastral maps. Obtained data can be used in cadastre, Electrical Control and Energy
Management System.
Semi-Automatic Classification of Power Lines by Using Airborne Lidar (8862)
Dragana Popović, Vladimir Pajić, Dušan Jovanović, Filip Sabo and Jovana Radović (Serbia)
FIG Working Week 2017
Surveying the world of tomorrow - From digitalisation to augmented reality
Helsinki, Finland, May 29–June 2, 2017
Semi-Automatic Classification of Power Lines by Using Airborne Lidar
Dragana POPOVIC, Vladimir PAJIC, Dusan JOVANOVIC, Filip SABO, Jovana RADOVIC,
Serbia
1. INTRODUCTION
Electricity distribution infrastructure represents important part of a country infrastructure. The
main purpose of electrical power distribution network is to provide power to consumers. Power line
networks are often in areas which are not easily accessible and therefore, the power lines network
may be difficult to survey. It is necessary to find an adequate method of collecting data that will
enable fast, effective and accurate output data for power lines infrastructure.
More recently, the LIDAR system is introduced as a cheap and effective method for data collection
that is capable to quickly capture 3D scenes. Another benefit of this automation in data collection
and map generation is that it allows a previously unattainable level of detail. Both surveying and
photogrammetric mapping required extensive human labor, making it costly to map at a high level
of detail. Lidar mapping, being highly automated, can shoot many laser pulses a second (Krogstad
& Schiess, 2004).
Also LIDAR data can produce highly detailed topographic maps with high accuracy. This data can
be used in many cases, but mainly for the purpose of cadastral information system and management
of electricity distribution infrastructure. The crucial elements which had to be extracted in this
work are poles, wires, power lines, substations and nearby objects. It is necessary to process
recorded data with certain operations that enable right amount of information. This technology
provides accurate position (spatial) information of wires, structures, vegetation and the ground along the
power line corridor.
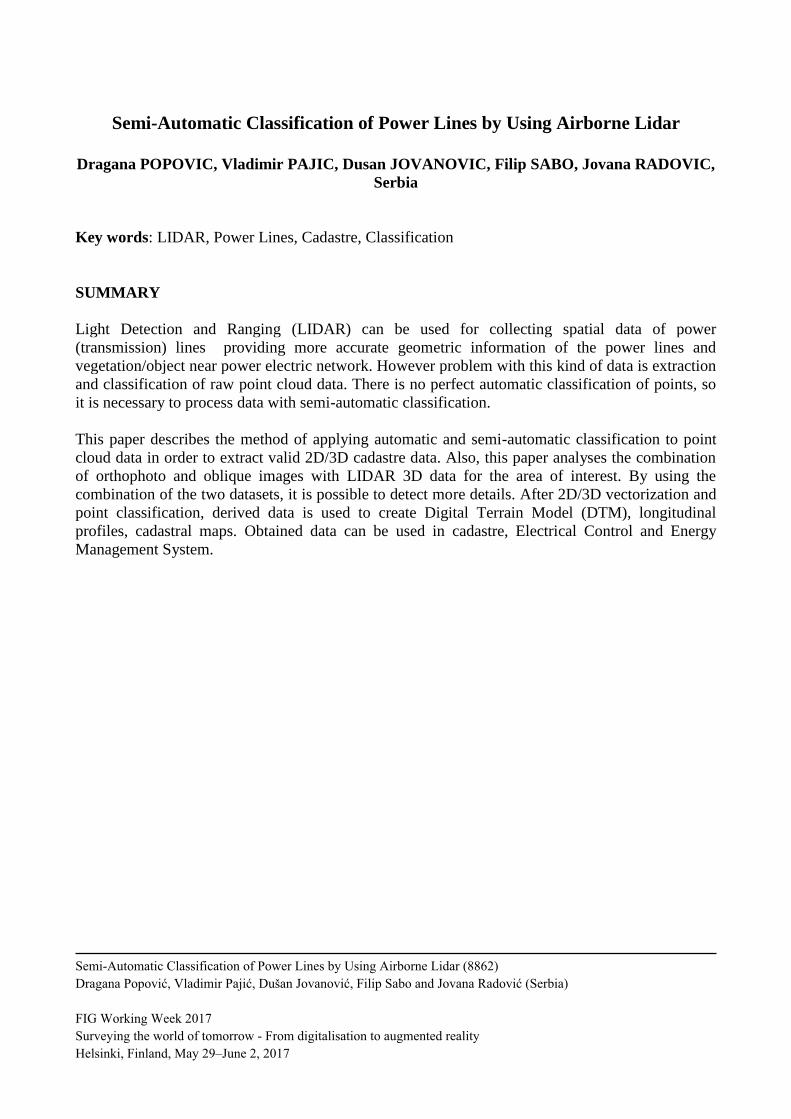
This paper presents a solution for mapping of power lines using LIDAR data, with it's advantages
and disadvantages. Workflow of this work is given in Figure 1 below.
Figure 1 Study workflow
Semi-Automatic Classification of Power Lines by Using Airborne Lidar (8862)
Dragana Popović, Vladimir Pajić, Dušan Jovanović, Filip Sabo and Jovana Radović (Serbia)
FIG Working Week 2017
Surveying the world of tomorrow - From digitalisation to augmented reality
Helsinki, Finland, May 29–June 2, 2017
The problem of identifying and monitoring of power lines can be solved by using different
solutions. For example, the problem of automatic identification of power lines can be solved by
forming an algorithm called Voxel-based Piece-wise Line Detector (VPLD) (Jwa, Sohn, Kim, H. B. 2009). The algorithm proposed by Sohn is based on the segmentation (linear and planar segment)
using Markov Random Field (MRF) classifier that identifies the power lines of linear segments, as
well as objects from planar segment (Sohn, Jwa, Kim 2012). Application of extraction lines in
forests in Finland is represented by a method which consists of statistical analysis and image-
based processing (Zhu, Hyyppä, 2014). The first phase provides selection of candidates for the
power line, while the second phase comprises of converting the candidates in a binary image, after
by the image-based processing. The results showed that 93.26% of power lines were appropriately
classified. Cheng et al. (Cheng, Tong, Wang, Li 2014) and other similar works performed extractions
of power lines using a voxel-based hierarchical model in which the geometric elements are
calculated for each voxel. Then, from below upwards by filtration belonging to the power line. The
process is iteratively performed to identify each power line. Bo Guo describes a robust algorithm
for reconstruction of power lines based on automatic classification (RANSAC) of five target class
before reconstruction. RANSAC algorithm is used for reconstruction of the power lines. The
experiment showed that the proposed method is most effective for the extraction of power
lines(Guo, Li, Huang, Wang, 2016).
2. DATA AND STUDY AREA
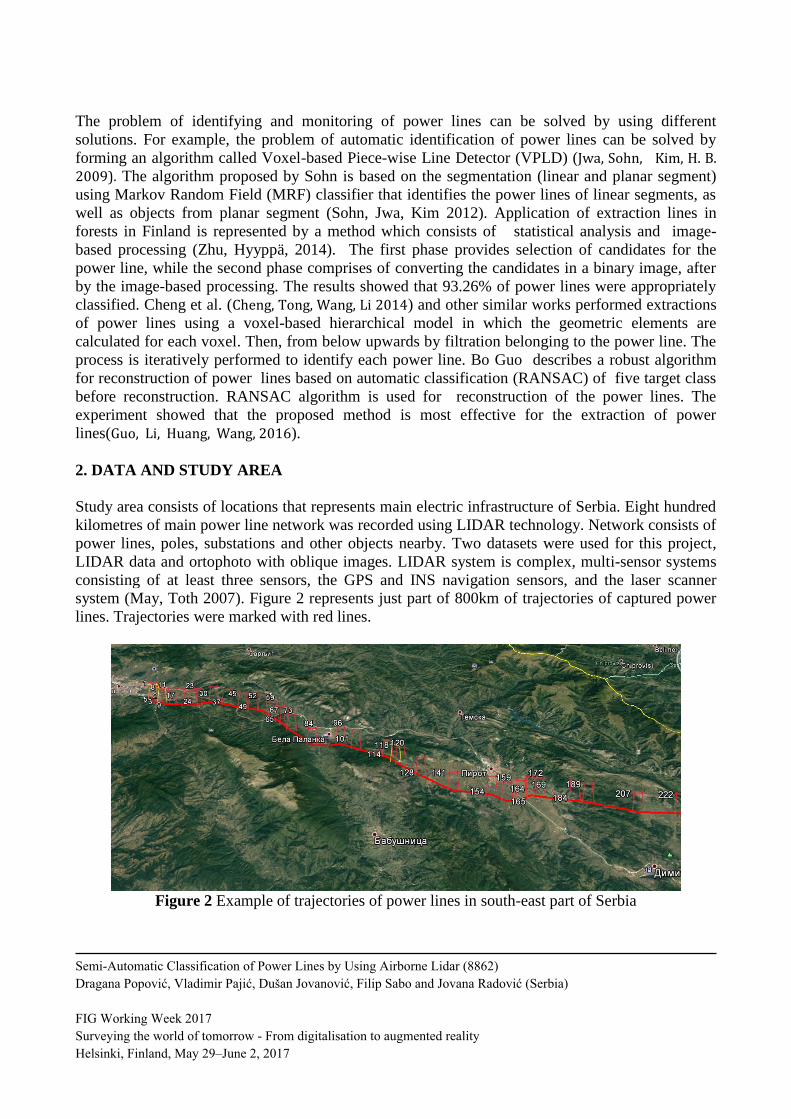
Study area consists of locations that represents main electric infrastructure of Serbia. Eight hundred
kilometres of main power line network was recorded using LIDAR technology. Network consists of
power lines, poles, substations and other objects nearby. Two datasets were used for this project,
LIDAR data and ortophoto with oblique images. LIDAR system is complex, multi-sensor systems
consisting of at least three sensors, the GPS and INS navigation sensors, and the laser scanner
system (May, Toth 2007). Figure 2 represents just part of 800km of trajectories of captured power
lines. Trajectories were marked with red lines.
Figure 2 Example of trajectories of power lines in south-east part of Serbia
Semi-Automatic Classification of Power Lines by Using Airborne Lidar (8862)
Dragana Popović, Vladimir Pajić, Dušan Jovanović, Filip Sabo and Jovana Radović (Serbia)
FIG Working Week 2017
Surveying the world of tomorrow - From digitalisation to augmented reality
Helsinki, Finland, May 29–June 2, 2017
Datasets used for this project were raw LIDAR data and ortophoto. Ortophoto and oblique images
were captured with Riegl MS-q680 camera that was integrated with LIDAR system. The long-
range RIEGL LMS-Q680i airborne laser scanner makes use of a powerful laser source, multiple
time around (MTA) processing, and digital full waveform analysis. This combination allows the
operation at varying flight altitudes and is therefore ideally suited for aerial survey of complex
terrain. His best features are high laser pulse repetition rates up to 400 kHz, multiple-time-around
(MTA), processing up to 266 000 measurements/sec on the ground, high ranging accuracy up to
20 mm, wide scan field of view up to 60°, interface for smooth integration of GPS, high scan speed
up to 200 lines/s (Riegl).
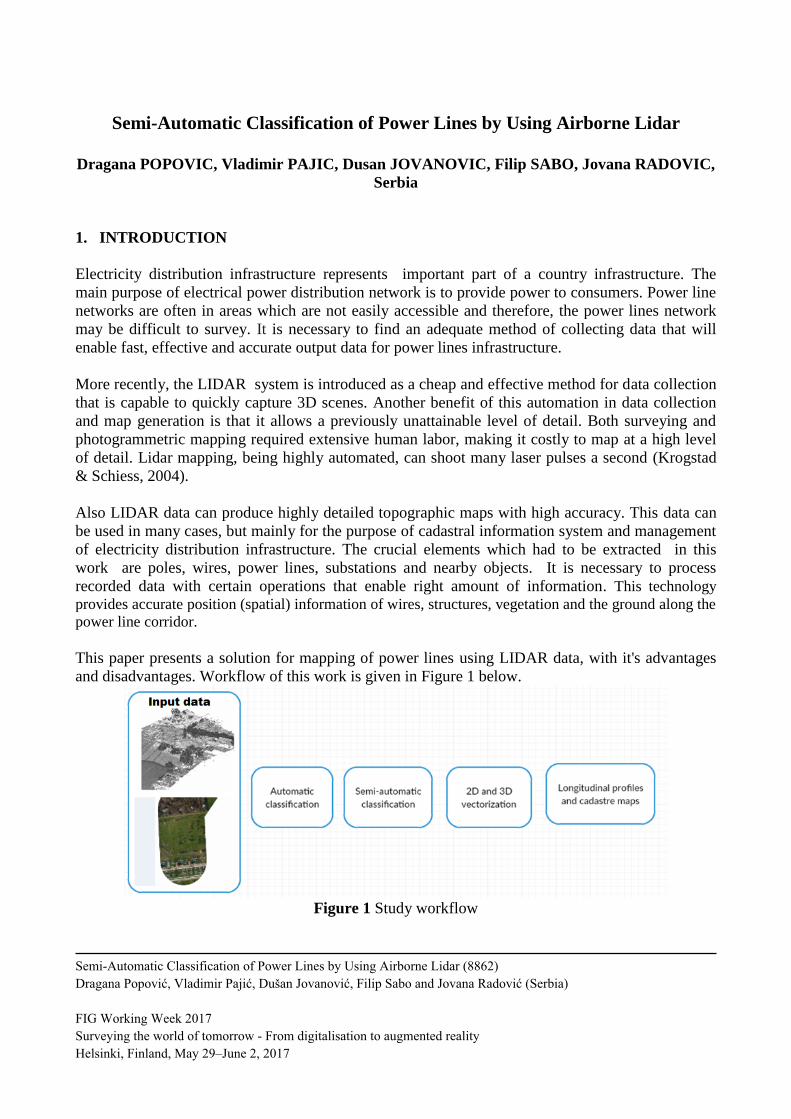
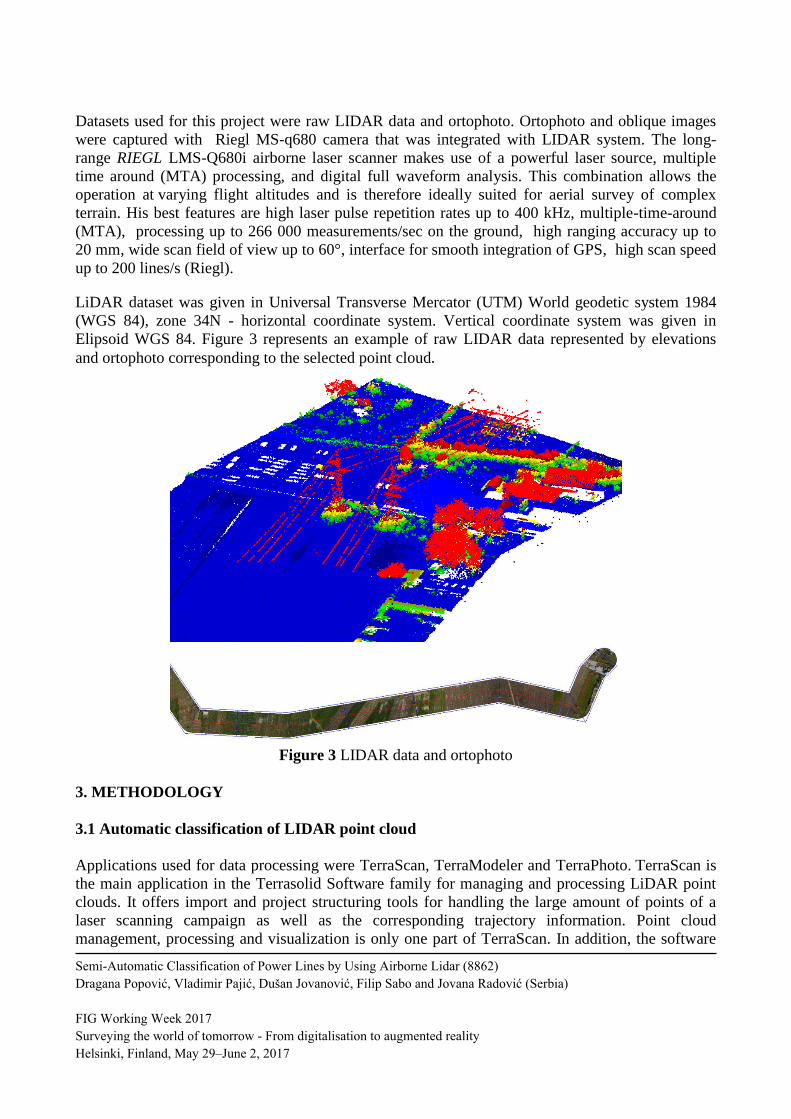
LiDAR dataset was given in Universal Transverse Mercator (UTM) World geodetic system 1984
(WGS 84), zone 34N - horizontal coordinate system. Vertical coordinate system was given in
Elipsoid WGS 84. Figure 3 represents an example of raw LIDAR data represented by elevations
and ortophoto corresponding to the selected point cloud.
Figure 3 LIDAR data and ortophoto
3. METHODOLOGY
3.1 Automatic classification of LIDAR point cloud
Applications used for data processing were TerraScan, TerraModeler and TerraPhoto. TerraScan is
the main application in the Terrasolid Software family for managing and processing LiDAR point
clouds. It offers import and project structuring tools for handling the large amount of points of a
laser scanning campaign as well as the corresponding trajectory information. Point cloud
management, processing and visualization is only one part of TerraScan. In addition, the software
Semi-Automatic Classification of Power Lines by Using Airborne Lidar (8862)
Dragana Popović, Vladimir Pajić, Dušan Jovanović, Filip Sabo and Jovana Radović (Serbia)
FIG Working Week 2017
Surveying the world of tomorrow - From digitalisation to augmented reality
Helsinki, Finland, May 29–June 2, 2017
provides tools for creating 3D vector data based on the laser points. TerraModeler creates surface
models (TINs) from various sources, such as LiDAR points stored in binary files or loaded in
TerraScan, XYZ ascii files and graphical design elements. TerraPhoto is specifically developed for
processing images captured together with laser data during a survey mission. The software enables
the production of rectified images and ortho mosaics based on ground model that has been extracted
from the laser data (TerraSolid).
Due to large amount of data collected and due to the fact that point cloud processing is highly
memory demanding , blocks 500m x 100m with imported points were created. After the data pre-
processing, automatic classification was applied with thirty two classes and appropriate attributes.
For the purposes of automatic classification macro files were created with parameters which define
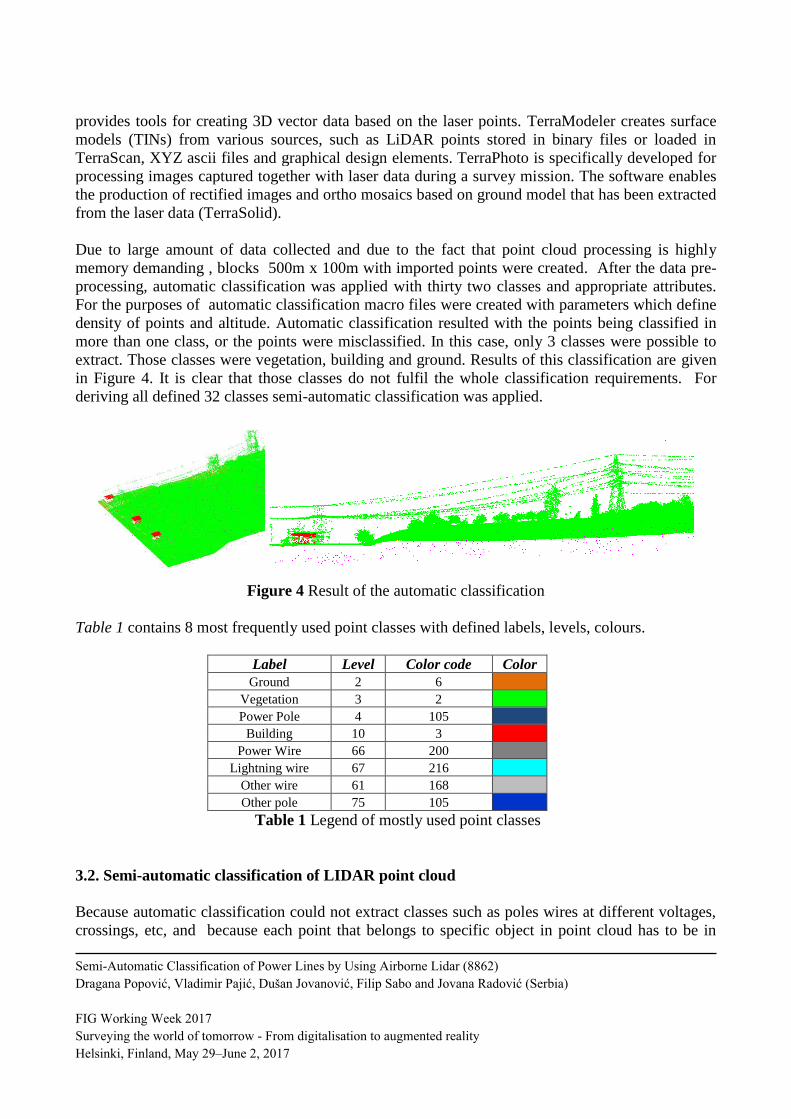
density of points and altitude. Automatic classification resulted with the points being classified in
more than one class, or the points were misclassified. In this case, only 3 classes were possible to
extract. Those classes were vegetation, building and ground. Results of this classification are given
in Figure 4. It is clear that those classes do not fulfil the whole classification requirements. For
deriving all defined 32 classes semi-automatic classification was applied.
Figure 4 Result of the automatic classification
Table 1 contains 8 most frequently used point classes with defined labels, levels, colours.
Label Level Color code Color
Ground 2 6
Vegetation 3 2
Power Pole 4 105
Building 10 3
Power Wire 66 200
Lightning wire 67 216
Other wire 61 168
Other pole 75 105
Table 1 Legend of mostly used point classes
3.2. Semi-automatic classification of LIDAR point cloud
Because automatic classification could not extract classes such as poles wires at different voltages,
crossings, etc, and because each point that belongs to specific object in point cloud has to be in
Semi-Automatic Classification of Power Lines by Using Airborne Lidar (8862)
Dragana Popović, Vladimir Pajić, Dušan Jovanović, Filip Sabo and Jovana Radović (Serbia)
FIG Working Week 2017
Surveying the world of tomorrow - From digitalisation to augmented reality
Helsinki, Finland, May 29–June 2, 2017
appropriate point class (32 classes are defined), semi-automatic classification was used. Using
specific tools, points from class vegetation were transferred to class wires at different voltages,
poles, substations etc. In this part of the classification, it was necessary to manually defined area of
interest and change classified point value from one to another class. Figure 5 represents the
classification of vegetation points into class pole. Pole is represented with blue points.
Figure 5 Reclassification of misclassified points of pole
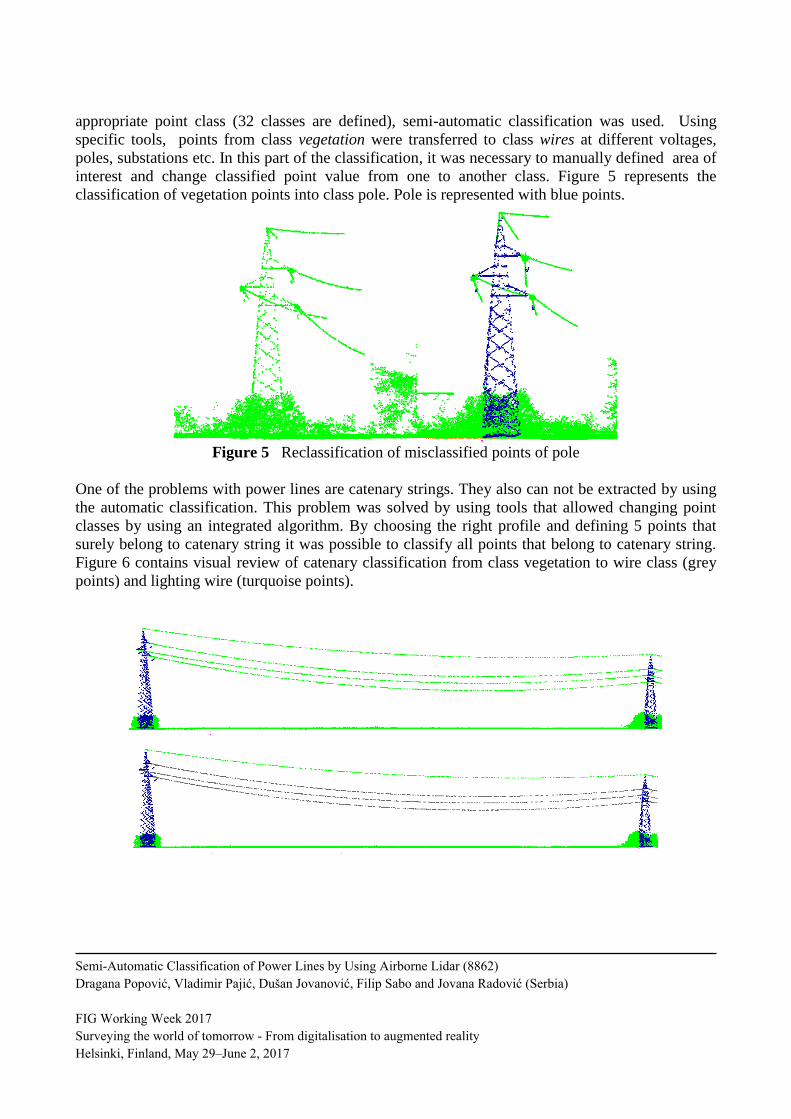
One of the problems with power lines are catenary strings. They also can not be extracted by using
the automatic classification. This problem was solved by using tools that allowed changing point
classes by using an integrated algorithm. By choosing the right profile and defining 5 points that
surely belong to catenary string it was possible to classify all points that belong to catenary string.
Figure 6 contains visual review of catenary classification from class vegetation to wire class (grey
points) and lighting wire (turquoise points).
Semi-Automatic Classification of Power Lines by Using Airborne Lidar (8862)
Dragana Popović, Vladimir Pajić, Dušan Jovanović, Filip Sabo and Jovana Radović (Serbia)
FIG Working Week 2017
Surveying the world of tomorrow - From digitalisation to augmented reality
Helsinki, Finland, May 29–June 2, 2017
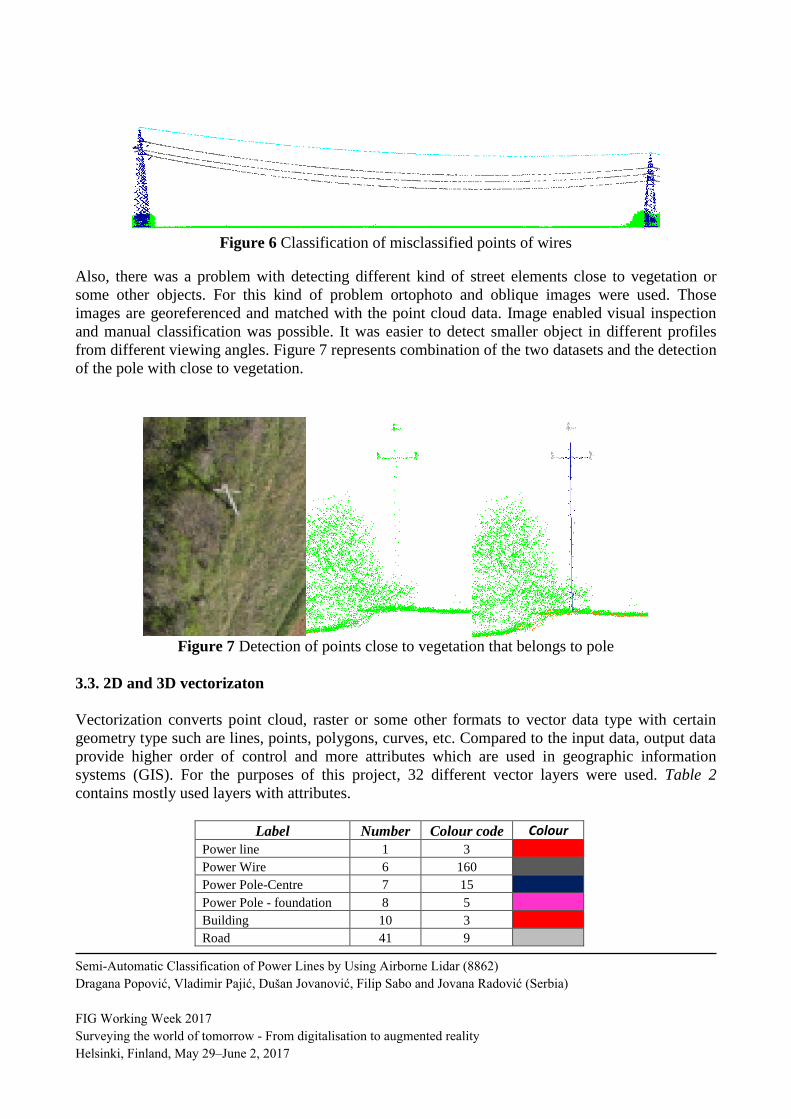
Figure 6 Classification of misclassified points of wires
Also, there was a problem with detecting different kind of street elements close to vegetation or
some other objects. For this kind of problem ortophoto and oblique images were used. Those
images are georeferenced and matched with the point cloud data. Image enabled visual inspection
and manual classification was possible. It was easier to detect smaller object in different profiles
from different viewing angles. Figure 7 represents combination of the two datasets and the detection
of the pole with close to vegetation.
Figure 7 Detection of points close to vegetation that belongs to pole
3.3. 2D and 3D vectorizaton
Vectorization converts point cloud, raster or some other formats to vector data type with certain
geometry type such are lines, points, polygons, curves, etc. Compared to the input data, output data
provide higher order of control and more attributes which are used in geographic information
systems (GIS). For the purposes of this project, 32 different vector layers were used. Table 2
contains mostly used layers with attributes.
Label Number Colour code Colour
Power line 1 3
Power Wire 6 160
Power Pole-Centre 7 15
Power Pole - foundation 8 5
Building 10 3
Road 41 9
Semi-Automatic Classification of Power Lines by Using Airborne Lidar (8862)
Dragana Popović, Vladimir Pajić, Dušan Jovanović, Filip Sabo and Jovana Radović (Serbia)
FIG Working Week 2017
Surveying the world of tomorrow - From digitalisation to augmented reality
Helsinki, Finland, May 29–June 2, 2017
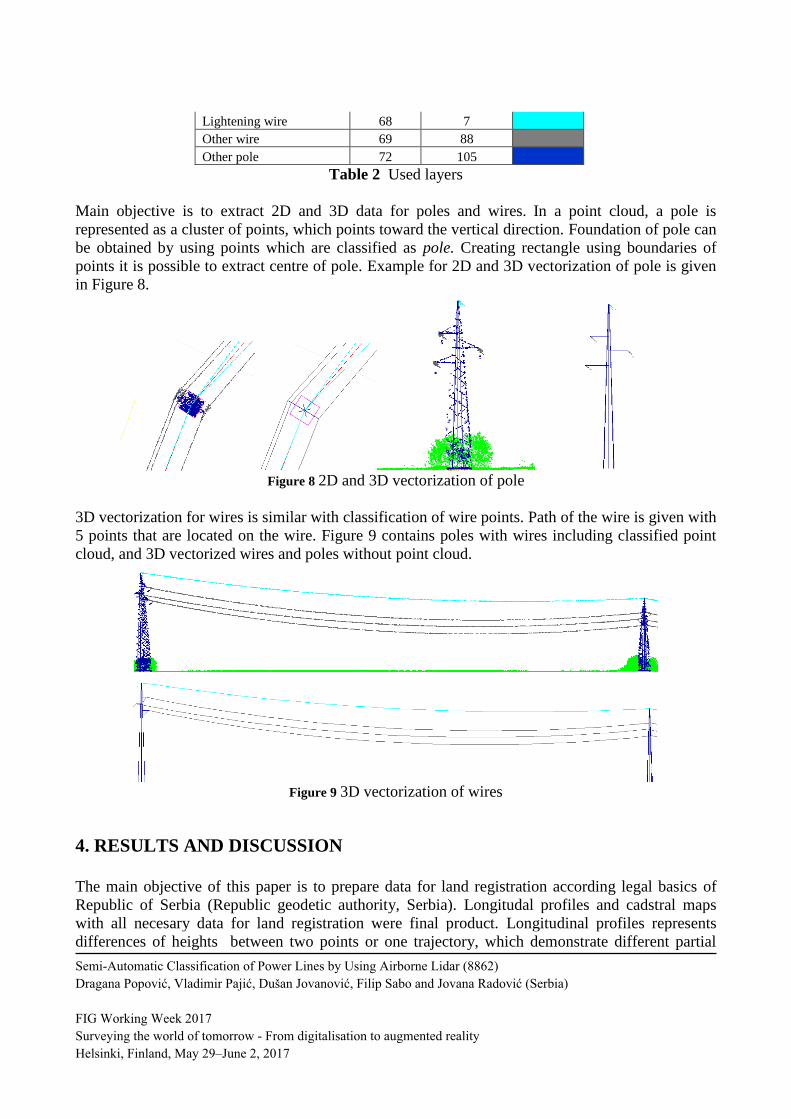
Lightening wire 68 7
Other wire 69 88
Other pole 72 105
Table 2 Used layers
Main objective is to extract 2D and 3D data for poles and wires. In a point cloud, a pole is
represented as a cluster of points, which points toward the vertical direction. Foundation of pole can
be obtained by using points which are classified as pole. Creating rectangle using boundaries of
points it is possible to extract centre of pole. Example for 2D and 3D vectorization of pole is given
in Figure 8.
Figure 8 2D and 3D vectorization of pole
3D vectorization for wires is similar with classification of wire points. Path of the wire is given with
5 points that are located on the wire. Figure 9 contains poles with wires including classified point
cloud, and 3D vectorized wires and poles without point cloud.
Figure 9 3D vectorization of wires
4. RESULTS AND DISCUSSION
The main objective of this paper is to prepare data for land registration according legal basics of
Republic of Serbia (Republic geodetic authority, Serbia). Longitudal profiles and cadstral maps
with all necesary data for land registration were final product. Longitudinal profiles represents
differences of heights between two points or one trajectory, which demonstrate different partial
Semi-Automatic Classification of Power Lines by Using Airborne Lidar (8862)
Dragana Popović, Vladimir Pajić, Dušan Jovanović, Filip Sabo and Jovana Radović (Serbia)
FIG Working Week 2017
Surveying the world of tomorrow - From digitalisation to augmented reality
Helsinki, Finland, May 29–June 2, 2017
slopes and distances and at the origin of the track (trajectory). Database of the cadastre lines as a
subsystem of geodetic and cadastral information system of the Republic Geodetic Authority
contains geospatial data, data on property rights and data of holders rights (Republic geodetic
authority, Serbia).
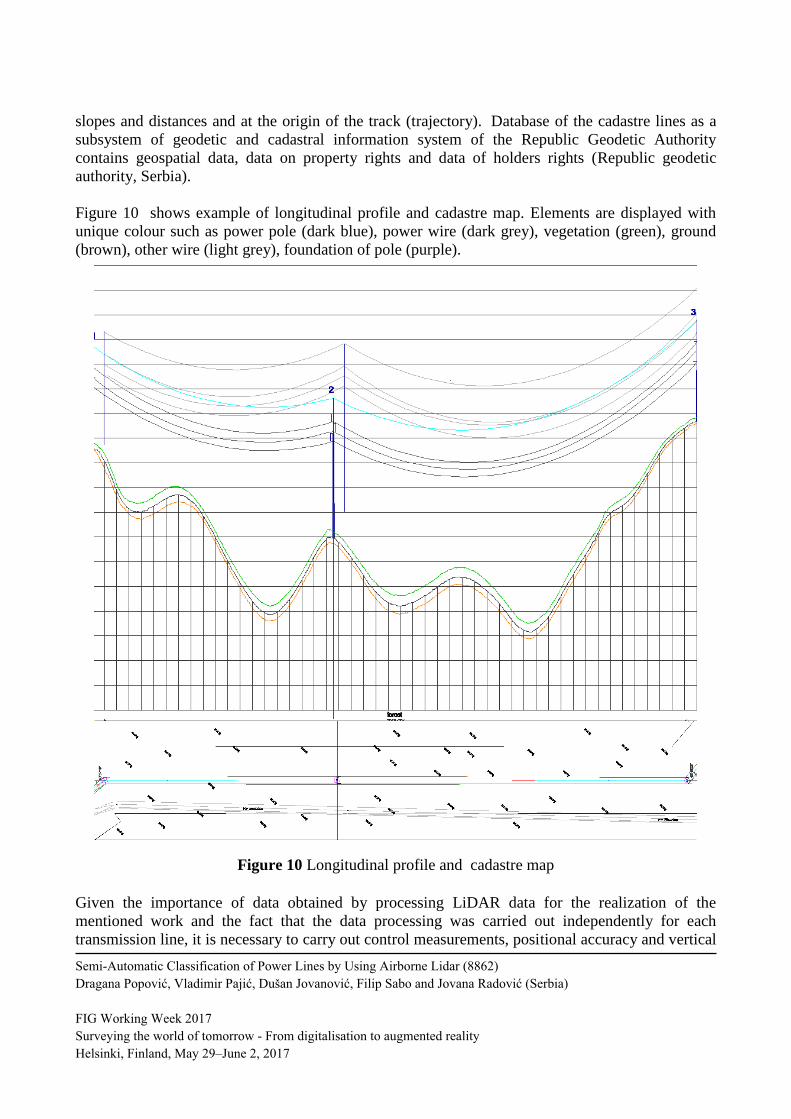
Figure 10 shows example of longitudinal profile and cadastre map. Elements are displayed with
unique colour such as power pole (dark blue), power wire (dark grey), vegetation (green), ground
(brown), other wire (light grey), foundation of pole (purple).
Figure 10 Longitudinal profile and cadastre map
Given the importance of data obtained by processing LiDAR data for the realization of the
mentioned work and the fact that the data processing was carried out independently for each
transmission line, it is necessary to carry out control measurements, positional accuracy and vertical
Semi-Automatic Classification of Power Lines by Using Airborne Lidar (8862)
Dragana Popović, Vladimir Pajić, Dušan Jovanović, Filip Sabo and Jovana Radović (Serbia)
FIG Working Week 2017
Surveying the world of tomorrow - From digitalisation to augmented reality
Helsinki, Finland, May 29–June 2, 2017
accuracy for each power line. It consists of two datasets, first dataset is data produced by LIDAR
and second is data that was obtained with standards surveying methods such as GPS using Real-
Time Kinematic method. According to the legal basis of the topographic surveys in Serbia accuracy
is permitted up to 15 cm. Analyzing the table 3 and table 4, it can be conclude that data satisfies the
required accuracy.
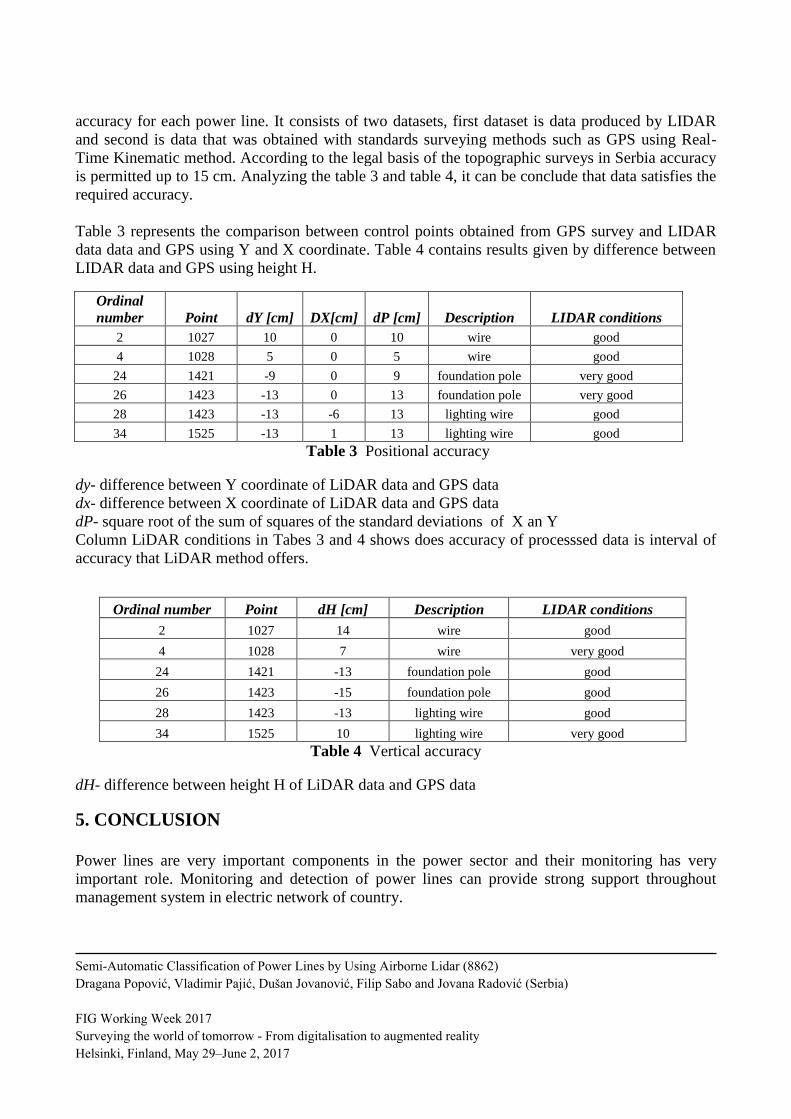
Table 3 represents the comparison between control points obtained from GPS survey and LIDAR
data data and GPS using Y and X coordinate. Table 4 contains results given by difference between
LIDAR data and GPS using height H.
Ordinal
number Point dY [cm] DX[cm] dP [cm] Description LIDAR conditions
2 1027 10 0 10 wire good
4 1028 5 0 5 wire good
24 1421 -9 0 9 foundation pole very good
26 1423 -13 0 13 foundation pole very good
28 1423 -13 -6 13 lighting wire good
34 1525 -13 1 13 lighting wire good
Table 3 Positional accuracy
dy- difference between Y coordinate of LiDAR data and GPS data
dx- difference between X coordinate of LiDAR data and GPS data
dP- square root of the sum of squares of the standard deviations of X an Y
Column LiDAR conditions in Tabes 3 and 4 shows does accuracy of processsed data is interval of
accuracy that LiDAR method offers.
Ordinal number Point dH [cm] Description LIDAR conditions
2 1027 14 wire good
4 1028 7 wire very good
24 1421 -13 foundation pole good
26 1423 -15 foundation pole good
28 1423 -13 lighting wire good
34 1525 10 lighting wire very good
Table 4 Vertical accuracy
dH- difference between height H of LiDAR data and GPS data
5. CONCLUSION
Power lines are very important components in the power sector and their monitoring has very
important role. Monitoring and detection of power lines can provide strong support throughout
management system in electric network of country.
Semi-Automatic Classification of Power Lines by Using Airborne Lidar (8862)
Dragana Popović, Vladimir Pajić, Dušan Jovanović, Filip Sabo and Jovana Radović (Serbia)
FIG Working Week 2017
Surveying the world of tomorrow - From digitalisation to augmented reality
Helsinki, Finland, May 29–June 2, 2017
Monitoring of power lines with application some of the classical methods of survey does not give
good results. The term good results does not apply only on the accuracy of the data but on the
availability of data in a short period of time.
Semi-automatic classification gave good results and completed goals such as fast data processing,
required accuracy and appropriate classified point cloud. This method can be applied on surveying
of different parts of country infrastructure.
The new LIDAR technology is a quick and efficient method for collecting data on lines, with high
precision and is therefore widely accepted technology for tracking power lines. It allows obtaining
the desired product in a very short time. The advantage of using LIDAR data over other standard
surveying methods is in speed, reduced human resources, large amount of data that can be used for
another purpose than cadastre, data processing is relatively quick. LiDAR method is more suitable
method than standard surveying methods when it comes to collect data of the power lines on
inaccessible areas, which was in this case. Also, reference is made to the financial side of this whole
idea of monitoring the transmission line. Overall, LIDAR system is more expensive, but provides
effective results.
Future work will be focused on finding the ideal solution for semi-automatic classification and
vectorization. Solution should be basic automatic classification that would classify much more point
classes that automatic classification could not classify.
REFERENCES
Cheng, L., Tong, L., Wang, Y., & Li, M. (2014). Extraction of urban power lines from vehicle-borne LiDAR
data. Remote Sensing, 6(4), 3302-3320.
Guo, B., Li, Q., Huang, X., & Wang, C. (2016). An improved method for power-line reconstruction from
point cloud data. Remote Sensing, 8(1), 36
Jwa, Y., Sohn, G., & Kim, H. B. (2009). Automatic 3d powerline reconstruction using airborne lidar
data. Int. Arch. Photogramm. Remote Sens, 38(Part 3), W8.
Krogstad, F., & Schiess, P. (2004, June). The allure and pitfalls of using LiDAR topography in harvest and
road design. In Joint Conference of IUFRO (Vol. 3).
May, N. C., & Toth, C. K. (2007). Point positioning accuracy of airborne LiDAR systems: A rigorous
analysis.
Republic geodetic authority, Serbia http://www.rgz.gov.rs
Riegl http://www.riegl.com/products/airborne-scanning/produktdetail/product/scanner/23/
Sohn, G., Jwa, Y., & Kim, H. B. (2012). Automatic powerline scene classification and reconstruction using
airborne lidar data. ISPRS Ann. Photogramm. Remote Sens. Spat. Inf. Sci, 13(167172), 28.
TerraSolid https://www.terrasolid.com/home.php
Semi-Automatic Classification of Power Lines by Using Airborne Lidar (8862)
Dragana Popović, Vladimir Pajić, Dušan Jovanović, Filip Sabo and Jovana Radović (Serbia)
FIG Working Week 2017
Surveying the world of tomorrow - From digitalisation to augmented reality
Helsinki, Finland, May 29–June 2, 2017
Zhu, L., & Hyyppä, J. (2014). Fully-automated power line extraction from airborne laser scanning point
clouds in forest areas. Remote Sensing, 6(11), 11267-11282.
BIOGRAPHICAL NOTES
Dragana Popovic is PhD student and works on Faculty of Technical Sciences in Novi Sad as
Teaching Assistant in the fields of Geospatial database. She graduated from the same institution in
2013 and in 2014 obtained Master's degree. Her bachelor thesis referred to the application of
LiDAR data in surveying of railroad infrastructure.
CONTACTS
Dragana Popovic
Faculty of Technical Sciences, Novi Sad
Trg Dositeja Obradovica 6 21000
Novi Sad
Serbia
Tel. +381 69 16 32 640
Email: [email protected]
Semi-Automatic Classification of Power Lines by Using Airborne Lidar (8862)
Dragana Popović, Vladimir Pajić, Dušan Jovanović, Filip Sabo and Jovana Radović (Serbia)
FIG Working Week 2017
Surveying the world of tomorrow - From digitalisation to augmented reality
Helsinki, Finland, May 29–June 2, 2017