Embed Size (px)
Citation preview
Semantic Message Passing forGenerating Linked Data from Tables?
Varish Mulwad, Tim Finin and Anupam Joshi
University of Maryland, Baltimore CountyBaltimore, MD 21250 USA
{varish1,finin,joshi}@cs.umbc.edu
Abstract. We describe work on automatically inferring the intended mean-ing of tables and representing it as RDF linked data, making it available forimproving search, interoperability and integration. We present implementa-tion details of a joint inference module that uses knowledge from the linkedopen data (LOD) cloud to jointly infer the semantics of column headers,table cell values (e.g., strings and numbers) and relations between columns.The framework generates linked data by mapping column headers to classes,cell values to LOD entities (existing or new) and by identifying relationsbetween columns.e also implement a novel Semantic Message Passing al-gorithm which uses LOD knowledge to improve existing message passingschemes. We evaluate our implemented techniques on tables from the Weband Wikipedia.
Keywords: Tables, Semantic Web, Linked Data, Graphical Models
1 Introduction
Tables are an integral part of documents, reports and Web pages, compactlyencoding important information that can be difficult to express in text. Table-like structures outside documents, such as spreadsheets, CSV files, log files anddatabases, are widely used to represent and share information. Tables are im-portant to a number of domains including the Web, healthcare, e-science andpublic policy. Google study [2] found more than 150 million high quality rela-tional tables on the Web. Many governments share public data useful to citizensand businesses as tables. The U.S. government’s data sharing website, for exam-ple, had nearly 400,000 such datasets as of September 2012. Medical researcherscan asses treatment efficacy via a meta-analysis of previously published clinicaltrials, often using systems like MEDLINE1 to find relevant articles and extractkey data, which is typically summarized in tables, like the one in Figure 1.
Integrating and searching over this information benefits from a better un-derstanding of its intended meaning, a task with several unique challenges. The
? This is an extended version of a paper with the same title that appears in theProceedings of the 2013 International Semantic Web Conference.
1 http://nlm.nih.gov/bsd/pmresources.html
This is an extended version of the paper: Varish Mulwad, Tim Finin and Anupam Joshi, Semantic Message Passing for Generating Linked Data from Tables, 12th Int. Semantic Web Conf., Sydney, Oct. 2013.
2 V. Mulwad, T. Finin and A. Joshi
very structure of tables which adds value and makes it easier for human under-standing also makes it harder for machine understanding. Web search engines,for example, perform well when searching over narrative text on the Web, butpoorly when searching for information embedded in tables in HTML documents.
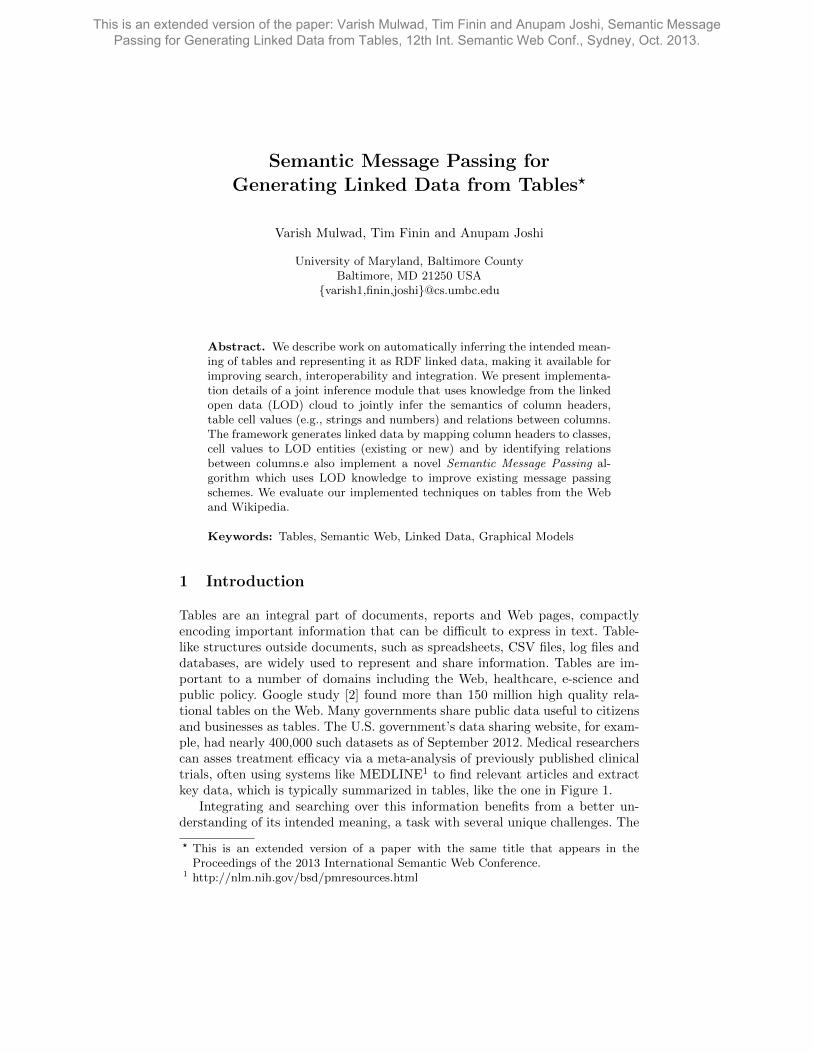
We might interpret tables using proven
Fig. 1: Tables in clinical trials reports [22]often have both row and column headers,contain numerical data and have captionswith critical metadata.
NLP techniques; after all, tables also containtext. We understand the meaning of a sen-tence by understanding the meaning of theindividual words, which in turn are under-stood using grammatical knowledge and thecontext provided by the surrounding text.Contrast that with a table like Figure 1,where uncovering its meaning requires in-terpreting the row and column headers, therelation between them and mapping cell val-ues to appropriate measurements.
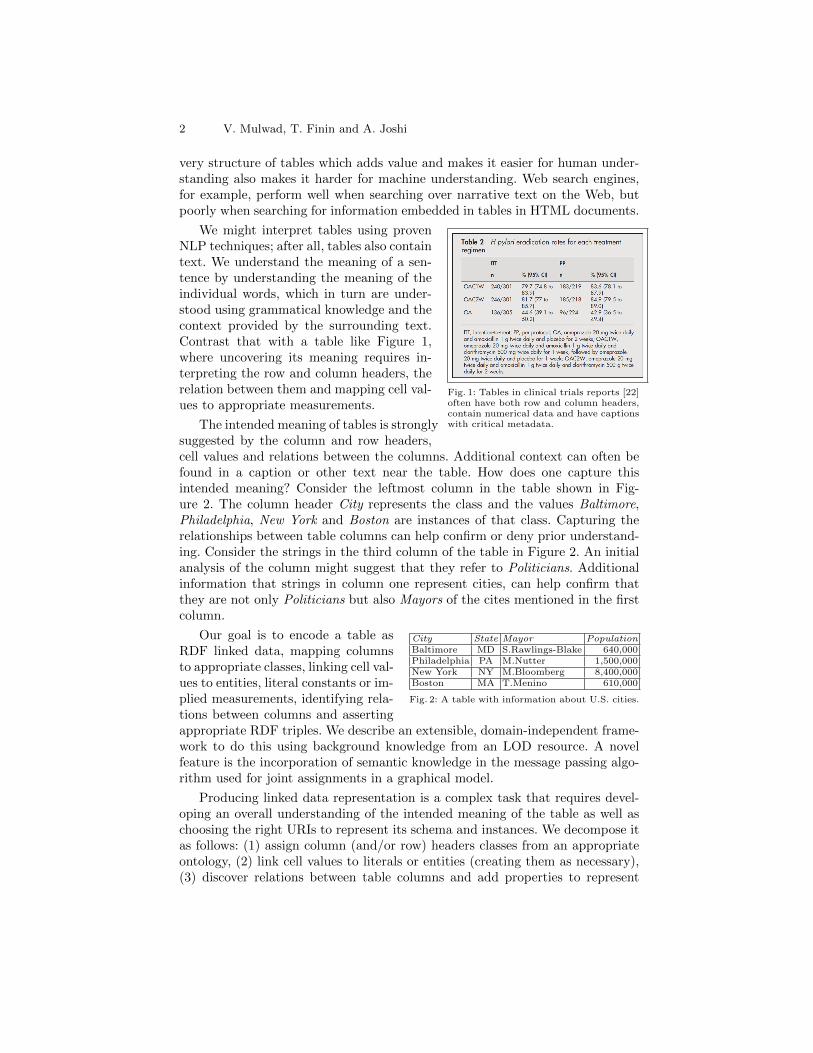
The intended meaning of tables is stronglysuggested by the column and row headers,cell values and relations between the columns. Additional context can often befound in a caption or other text near the table. How does one capture thisintended meaning? Consider the leftmost column in the table shown in Fig-ure 2. The column header City represents the class and the values Baltimore,Philadelphia, New York and Boston are instances of that class. Capturing therelationships between table columns can help confirm or deny prior understand-ing. Consider the strings in the third column of the table in Figure 2. An initialanalysis of the column might suggest that they refer to Politicians. Additionalinformation that strings in column one represent cities, can help confirm thatthey are not only Politicians but also Mayors of the cites mentioned in the firstcolumn.
Our goal is to encode a table as City State Mayor PopulationBaltimore MD S.Rawlings-Blake 640,000Philadelphia PA M.Nutter 1,500,000New York NY M.Bloomberg 8,400,000Boston MA T.Menino 610,000
Fig. 2: A table with information about U.S. cities.
RDF linked data, mapping columnsto appropriate classes, linking cell val-ues to entities, literal constants or im-plied measurements, identifying rela-tions between columns and assertingappropriate RDF triples. We describe an extensible, domain-independent frame-work to do this using background knowledge from an LOD resource. A novelfeature is the incorporation of semantic knowledge in the message passing algo-rithm used for joint assignments in a graphical model.
Producing linked data representation is a complex task that requires devel-oping an overall understanding of the intended meaning of the table as well aschoosing the right URIs to represent its schema and instances. We decompose itas follows: (1) assign column (and/or row) headers classes from an appropriateontology, (2) link cell values to literals or entities (creating them as necessary),(3) discover relations between table columns and add properties to represent
Generating Linked Data from Tables 3
them, and (4) generate a linked data representation. We describe our approachto these tasks and an evaluation of the results in the remainder of the paper.
2 Approach
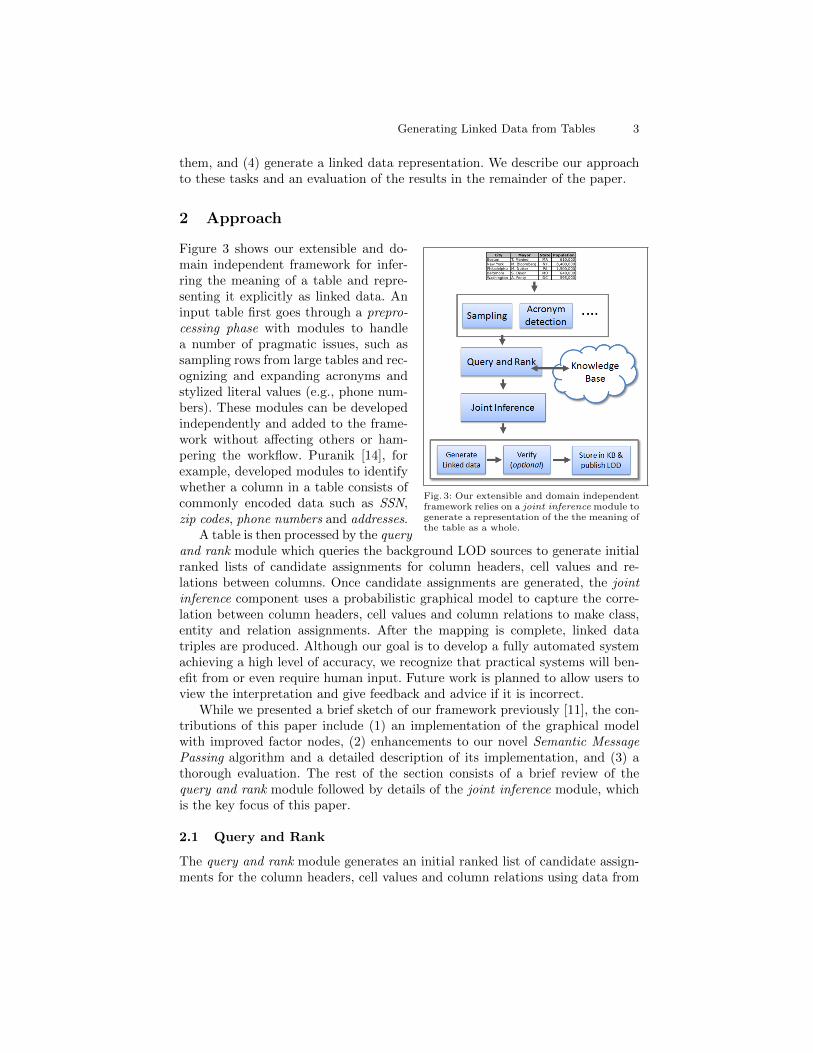
Figure 3 shows our extensible and do-
Fig. 3: Our extensible and domain independentframework relies on a joint inference module togenerate a representation of the the meaning ofthe table as a whole.
main independent framework for infer-ring the meaning of a table and repre-senting it explicitly as linked data. Aninput table first goes through a prepro-cessing phase with modules to handlea number of pragmatic issues, such assampling rows from large tables and rec-ognizing and expanding acronyms andstylized literal values (e.g., phone num-bers). These modules can be developedindependently and added to the frame-work without affecting others or ham-pering the workflow. Puranik [14], forexample, developed modules to identifywhether a column in a table consists ofcommonly encoded data such as SSN,zip codes, phone numbers and addresses.
A table is then processed by the queryand rank module which queries the background LOD sources to generate initialranked lists of candidate assignments for column headers, cell values and re-lations between columns. Once candidate assignments are generated, the jointinference component uses a probabilistic graphical model to capture the corre-lation between column headers, cell values and column relations to make class,entity and relation assignments. After the mapping is complete, linked datatriples are produced. Although our goal is to develop a fully automated systemachieving a high level of accuracy, we recognize that practical systems will ben-efit from or even require human input. Future work is planned to allow users toview the interpretation and give feedback and advice if it is incorrect.
While we presented a brief sketch of our framework previously [11], the con-tributions of this paper include (1) an implementation of the graphical modelwith improved factor nodes, (2) enhancements to our novel Semantic MessagePassing algorithm and a detailed description of its implementation, and (3) athorough evaluation. The rest of the section consists of a brief review of thequery and rank module followed by details of the joint inference module, whichis the key focus of this paper.
2.1 Query and Rank
The query and rank module generates an initial ranked list of candidate assign-ments for the column headers, cell values and column relations using data from
4 V. Mulwad, T. Finin and A. Joshi
DBpedia [1], Yago [17] and Wikitology [18]. For most of the general tables, es-pecially ones found on the Web, these knowledge sources provide good coverage.Additional LOD data sources can be selected and incorporated, automaticallyor manually, based on the table’s domain.
Generating and ranking candidates for cell values. We generate an initialset of candidate entities for each cell value using Wikitology, a hybrid knowl-edge base combining unstructured and structured information from Wikipedia,DBpedia and Yago. The contents of the column header and other row valuesare used as context when querying Wikitology. The query for Baltimore, for ex-ample, consists of the query string Baltimore and the context data City, MD,S.C.Rawlings-Blake, and 640,000 [12]. Wikitology returns ranked lists of entitiesand classes, which for Baltimore, include the entities Baltimore, John Baltimoreand Baltimore Ravens along with DBpedia classes City, PopulatedPlace andPlace and Yago types CitiesInMaryland and GeoclassPopulatedPlace. An en-tity ranker then re-ranks a cell’s candidates entities using an approach adaptedfrom [4] and features from [12] to return a measure of how likely the given en-tity (e.g., John Baltimore) is the correct assignment for the string mention (e.g.,Baltimore).
Generating candidates for columns. Initial candidate classes for a columnare generated from its cell values, each of which has a set of candidate entities,which in turn have sets of DBpedia and Yago classes. The column’s potentialclasses is just the union of the classes from the its cells. We generate two separateset of candidate classes – one for DBpedia classes and another for Yago classes.
Generating candidate relations between columns. Identifying relationsbetween table columns is an important part of table understanding and is mod-eled by finding appropriate predicates from the reference LOD’s ontologies (e.g.,DBpedia). We generate candidate relations for every pair of columns in the table,based on the cell value pairs in the respective columns. Each cell value has a setof candidate entities, which in turn may be linked to other entities in the refer-ence LOD resources. For example, the DBpedia entities Baltimore and Marylandare linked via the predicates isPartOf and subdivisionName.
We use the links between pairs of entities to generate candidate relations.For a pair of cell values in the same row between the two columns, the candidateentity sets for both cells are obtained. For each possible pairing between theentities in both the candidate sets, we query Yago and DBpedia, to obtain rela-tion in either direction i.e. entityrow1 someproperty1 entityrow2 and entityrow2someproperty2 entityrow1. This gives us a candidate set between pair of row cellvalues. The candidate relation set for the entire column pair is generated bytaking a union of the set of candidate relations between individual pairs of rowcell values. Thus for example, the candidate relations between column City andcolumn State might include isPartOf, capitalCity, bornIn etc. Again, we generatetwo sets of candidate relations, one from DBpedia and the other from Yago.
Literal Constants. We use a regular expression to distinguish string men-tions, which probably refer to entities, and literal constants such as numbersand measurements, which probably do not. If the cell value is a literal constant,
Generating Linked Data from Tables 5
candidate entities are not generated and the cell is mapped to no-annotation.If all the cells in a column are literals, we update the column header annotationto no-annotation.
2.2 Joint Inference
Once the initial sets of candidate assignments are generated, the joint inferencemodule assigns values to columns and row cell values and identifies relationsbetween the table columns. The result is a representation of the meaning of thetable as a whole. Probabilistic graphical models [8] provide a powerful and con-venient framework for expressing a joint probability over a set of variables andperforming inference or joint assignment of values to the variables. Probabilisticgraphical models use graph based representations to encode probability distri-bution over a set of variables for a given system. The nodes in such a graphrepresent the variables of the system and the edges represent the probabilisticinteraction between the variables.
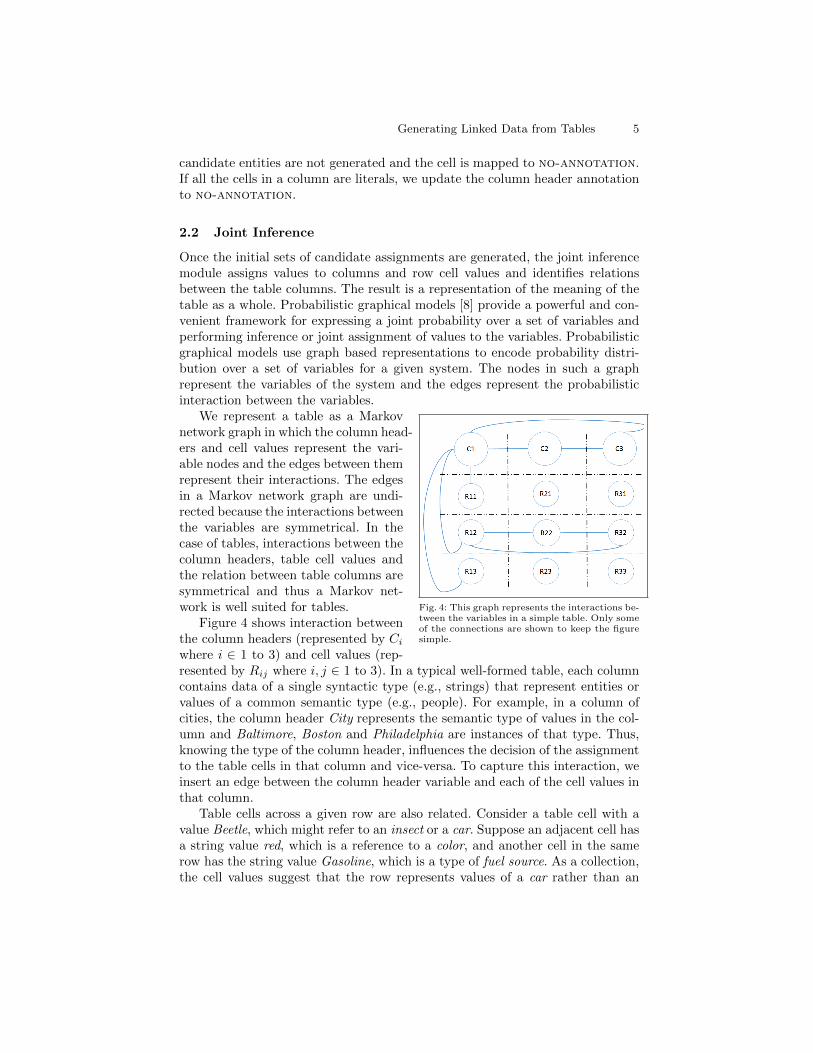
We represent a table as a Markov
Fig. 4: This graph represents the interactions be-tween the variables in a simple table. Only someof the connections are shown to keep the figuresimple.
network graph in which the column head-ers and cell values represent the vari-able nodes and the edges between themrepresent their interactions. The edgesin a Markov network graph are undi-rected because the interactions betweenthe variables are symmetrical. In thecase of tables, interactions between thecolumn headers, table cell values andthe relation between table columns aresymmetrical and thus a Markov net-work is well suited for tables.
Figure 4 shows interaction betweenthe column headers (represented by Ci
where i ∈ 1 to 3) and cell values (rep-resented by Rij where i, j ∈ 1 to 3). In a typical well-formed table, each columncontains data of a single syntactic type (e.g., strings) that represent entities orvalues of a common semantic type (e.g., people). For example, in a column ofcities, the column header City represents the semantic type of values in the col-umn and Baltimore, Boston and Philadelphia are instances of that type. Thus,knowing the type of the column header, influences the decision of the assignmentto the table cells in that column and vice-versa. To capture this interaction, weinsert an edge between the column header variable and each of the cell values inthat column.
Table cells across a given row are also related. Consider a table cell with avalue Beetle, which might refer to an insect or a car. Suppose an adjacent cell hasa string value red, which is a reference to a color, and another cell in the samerow has the string value Gasoline, which is a type of fuel source. As a collection,the cell values suggest that the row represents values of a car rather than an
6 V. Mulwad, T. Finin and A. Joshi
insect. Thus, the interpretation of each cell is influenced by the interpretationof the others in its row. This co-relation when considered between pairs of tablecell values between two columns can also be used to identify relations betweentable columns. To capture this context, we insert edges between all the tablecells in a given row.
Similar interactions exist between the column headers. By itself, the columnheader City suggests that column’s cells might refer to city instances. However,if the other columns appear to refer to basketball players, coaches and basketballdivisions, we can infer that the cities column refers to a team itself. This is anexample of metonymy, in which an entity (i.e., the team) is referenced by oneof its significant properties (i.e., the location of its base). This interaction iscaptured by inserting edges between column header variables.
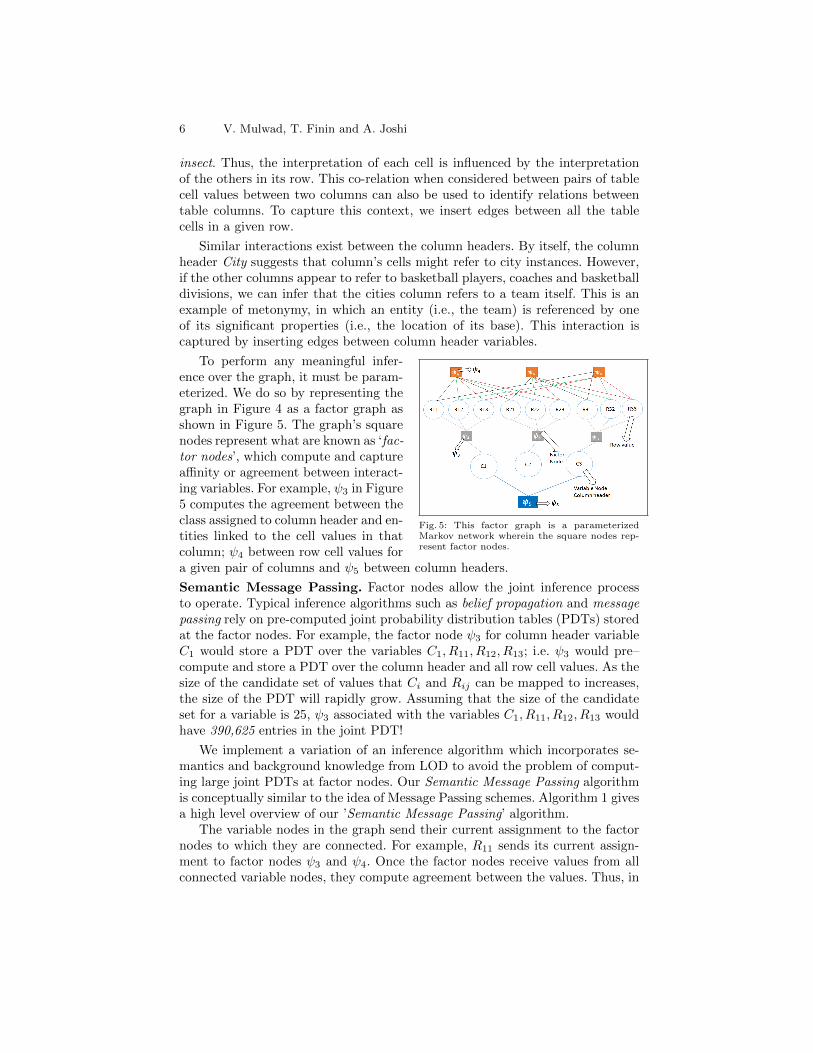
To perform any meaningful infer-
Fig. 5: This factor graph is a parameterizedMarkov network wherein the square nodes rep-resent factor nodes.
ence over the graph, it must be param-eterized. We do so by representing thegraph in Figure 4 as a factor graph asshown in Figure 5. The graph’s squarenodes represent what are known as ‘fac-tor nodes’, which compute and captureaffinity or agreement between interact-ing variables. For example, ψ3 in Figure5 computes the agreement between theclass assigned to column header and en-tities linked to the cell values in thatcolumn; ψ4 between row cell values fora given pair of columns and ψ5 between column headers.
Semantic Message Passing. Factor nodes allow the joint inference processto operate. Typical inference algorithms such as belief propagation and messagepassing rely on pre-computed joint probability distribution tables (PDTs) storedat the factor nodes. For example, the factor node ψ3 for column header variableC1 would store a PDT over the variables C1, R11, R12, R13; i.e. ψ3 would pre–compute and store a PDT over the column header and all row cell values. As thesize of the candidate set of values that Ci and Rij can be mapped to increases,the size of the PDT will rapidly grow. Assuming that the size of the candidateset for a variable is 25, ψ3 associated with the variables C1, R11, R12, R13 wouldhave 390,625 entries in the joint PDT!
We implement a variation of an inference algorithm which incorporates se-mantics and background knowledge from LOD to avoid the problem of comput-ing large joint PDTs at factor nodes. Our Semantic Message Passing algorithmis conceptually similar to the idea of Message Passing schemes. Algorithm 1 givesa high level overview of our ’Semantic Message Passing’ algorithm.
The variable nodes in the graph send their current assignment to the factornodes to which they are connected. For example, R11 sends its current assign-ment to factor nodes ψ3 and ψ4. Once the factor nodes receive values from allconnected variable nodes, they compute agreement between the values. Thus, in
Generating Linked Data from Tables 7
Algorithm 1 Semantic Message Passing
1: Let V ars be the set of variable nodes and Factors be the set of factor nodes inthe graph.
2: for all v in V ars do3: Let F ′ be the set of factor nodes v is connected to.4: for all f ′ in F ′ do5: v sends its current assignment (value) to f ′.6: end for7: end for8: for all f in Factors do9: Compute agreement between the received assignments.
10: Identify variable nodes that may have sent an incorrect assignment.11: Send a no-change message to all nodes that are in agreement, as determined
by f .12: Send change message and characteristic of expected assignment to all the nodes
that have an incorrect assignment, as determined by f .13: end for14: for all v in V ars do15: Let Messages be the set of messages received by v.16: If all m ∈ Messages are no-change, do nothing.17: If few or all m ∈ Messages are change, update the current assignment by
choosing a new one from the candidate set which satisfies the characteristicssent by the factor nodes.
18: end for19: Repeat till convergence.
one of the iterations, ψ3 might receive values City, Baltimore Ravens, Philadel-phia, New York and Boston. The goal of ψ3 is to determine if all the assignmentsagree and, if not, identify the outliers.
In this case ψ3 identifies Baltimore Ravens as an outlier and sends a changemessage to R11, together with its semantic preferences for a new, alternate valuethat R11 might produce. In our example, ψ3 informs R11 of its preference forupdate to an entity of type City. To the rest of the variable nodes, ψ3 sendsa no-change message. This process is performed by all factor nodes. Once avariable node receives messages from all of its connected factor nodes, it decideswhether to update its value or not.
If it receives a message of no-change from all factor nodes, its currentassignment is in agreement with the others and it need not update its assignment.If it receives a change message from some or all factor nodes, it updates itscurrent assignment, taking into consideration the semantic preferences providedby the factor nodes. The entire process repeats until convergence, i.e., agreementover the entire graph is achieved. A hard convergence metric could be to repeatthe process until no variable node receives a change message.
Our Semantic Message Passing algorithm thus circumvents the problem ofcomputing joint PDTs at factor nodes by computing agreement over currentassigned values. Furthermore, our scheme not only detects individual variable
8 V. Mulwad, T. Finin and A. Joshi
nodes that have incorrect assignments, but provides the nodes with guidance onthe characteristics or semantics associated with the value that a variable nodeshould update to. This capability requires defining semantically-aware factornodes that can perform such functions. In this paper, we describe our imple-mentation of factor nodes ψ3 and ψ4 and the process by which a variable nodeupdates its values based on the messages received and our metric for graphconvergence.
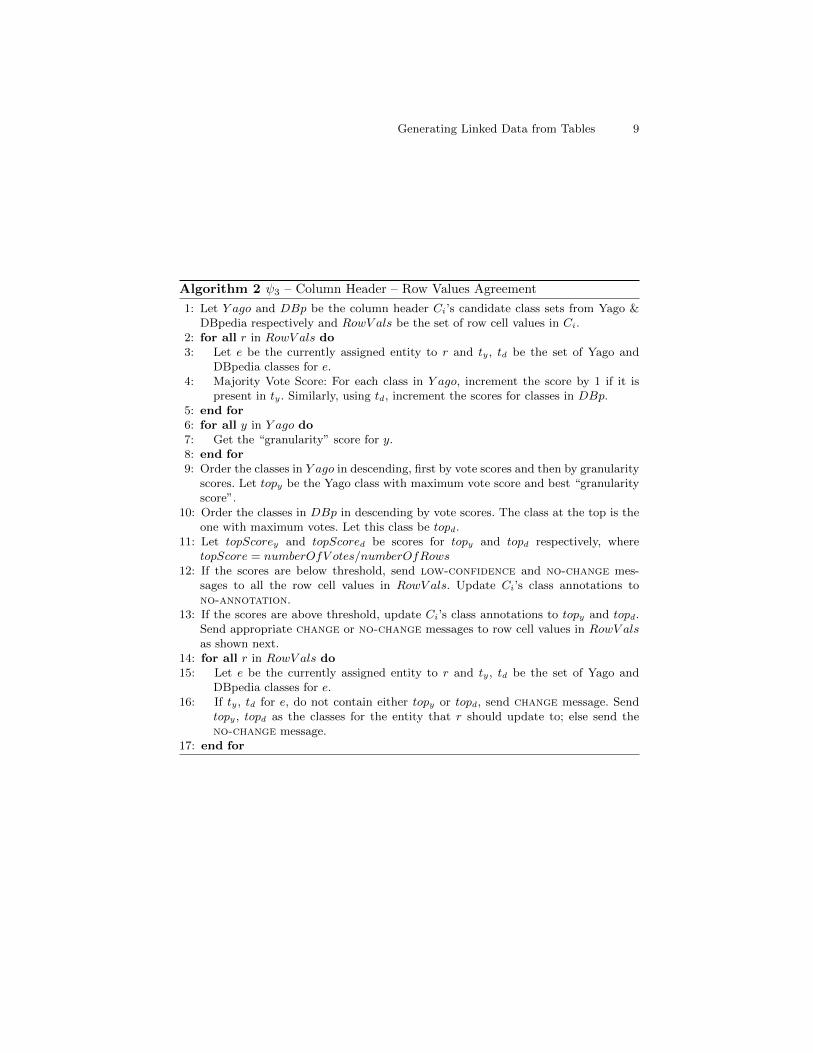
ψ3 – Column header and row cell value agreement function. Algorithm2 gives an overview of the column header and row cell value agreement function.The ψ3 factor node computes agreement between the class assigned to the columnand the entities assigned to its cell values. For example, agreement between thecolumn assigned type City and candidate cell assignments Baltimore Ravens,Philadelphia, New York and Boston. Recall that at the end of the query and rankphase, every row cell value has an initial entity assignment and every columnheader has a set of candidate classes. In our current implementation every columnheader Ci maintains two separate sets of candidate classes – one from Yago’sclasses and the other from DBpedia’s. Each cell value in a column is mapped toan initial entity e which in itself has its own set of Yago and DBpedia classes.The initial entities assigned to a column’s cell values perform a majority votingover the Yago and DBpedia class set to pick the top Yago and DBpedia class.Each entity votes and increments the score of a class from the candidate set by1 if the class is present in the class set associated with e.
The Yago and DBpedia candidate class sets are ordered by votes. ψ3 com-putes the top score for each of the top classes. The top score is simply equalto the number of votes for the top class divided by the number of rows in thecolumn. Ideally, we want to pick more specific classes (e.g., City) over generalclasses (e.g., Place) when making an assignment to the column headers. Thus,if multiple Yago classes get voted as top class, we use a ‘granularity’ score astie-breaker. The ‘granularity’ score is computed by simply dividing the numberof instances that belong to the class by the total number of instances and sub-tracting the result from one. This assigns a higher score to specific classes anda lower score to general classes.
Once the top class(es) are identified and their scores computed, ψ3 deter-mines if they can be used in the process of identifying cell values with incorrectassignments. It checks whether the top scores for the classes are below a certainthreshold. If so, it implies lower confidence and agreement between row cell val-ues and that the top classes cannot be relied upon. In such scenarios, ψ3 sendsa message of low-confidence and no-change to the variable nodes and alsomaps the column header class to no-annotation.
If scores for both the top Yago and DBpedia classes are above the threshold,ψ3 assigns both the classes to the column header and uses them in the processof identifying its cell values with incorrect assignments. However if either class isbelow threshold, it checks if the classes are aligned. We define the two classes asaligned if either the DBpedia class is a subclass of the Yago class or vice-versa.
Generating Linked Data from Tables 9
Algorithm 2 ψ3 – Column Header – Row Values Agreement
1: Let Y ago and DBp be the column header Ci’s candidate class sets from Yago &DBpedia respectively and RowV als be the set of row cell values in Ci.
2: for all r in RowV als do3: Let e be the currently assigned entity to r and ty, td be the set of Yago and
DBpedia classes for e.4: Majority Vote Score: For each class in Y ago, increment the score by 1 if it is
present in ty. Similarly, using td, increment the scores for classes in DBp.5: end for6: for all y in Y ago do7: Get the “granularity” score for y.8: end for9: Order the classes in Y ago in descending, first by vote scores and then by granularity
scores. Let topy be the Yago class with maximum vote score and best “granularityscore”.
10: Order the classes in DBp in descending by vote scores. The class at the top is theone with maximum votes. Let this class be topd.
11: Let topScorey and topScored be scores for topy and topd respectively, wheretopScore = numberOfV otes/numberOfRows
12: If the scores are below threshold, send low-confidence and no-change mes-sages to all the row cell values in RowV als. Update Ci’s class annotations tono-annotation.
13: If the scores are above threshold, update Ci’s class annotations to topy and topd.Send appropriate change or no-change messages to row cell values in RowV alsas shown next.
14: for all r in RowV als do15: Let e be the currently assigned entity to r and ty, td be the set of Yago and
DBpedia classes for e.16: If ty, td for e, do not contain either topy or topd, send change message. Send
topy, topd as the classes for the entity that r should update to; else send theno-change message.
17: end for
10 V. Mulwad, T. Finin and A. Joshi
The subclass relation between the DBpedia and Yago classes is obtained via thePARIS project [16].
If the alignment exists, then ignoring the lower score to either Yago or DB-pedia, ψ3 picks both the classes as the Yago and DBpedia assignments for thecolumn header respectively. Otherwise, the class with the lower score is ignored,and the other one is selected as the column class. Once the column header ismapped to a class assignment, ψ3 revisits each entity assignment in the column.All cell values (variable nodes) whose currently assigned entity e include the topclass(es) in their class set are sent a message of no-change. Ones whose entitydo not contain the top class in their class set are sent a change message. Thesevariable nodes are also provided with the top class(es) as semantic preferencesthat their next entity assignment should try to fulfill. ψ3 also sends the top scoreas a confidence score associated with the message.
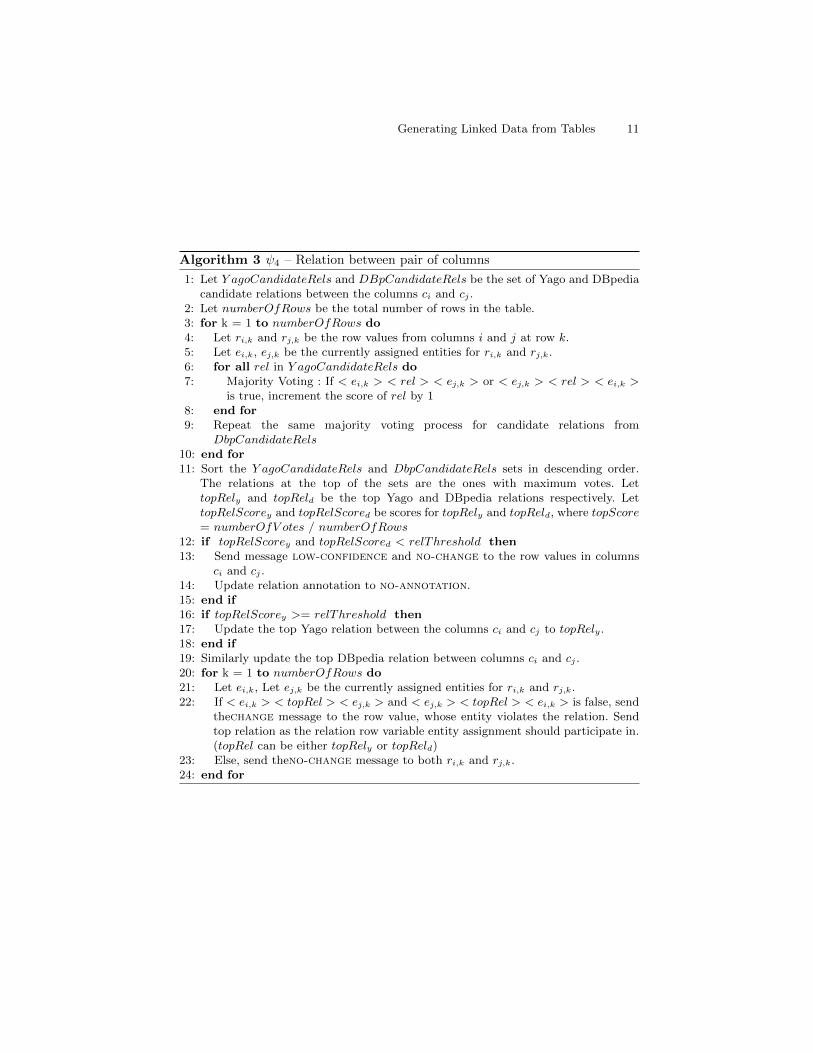
ψ4 – Relations between pair of columns. Algorithm 3 gives an overview offunction that identifies relation between pair of columns in a table. The goal offactor node ψ4 is to discover if a relation exists between a pair of columns, sayCity and State, and, if so, to use it as evidence to uncover any incorrect entityassignments in the columns’ cells. At the end of query and rank phase, every rowcell value has an initial entity assignment, e. The pair of column headers is alsoassociated with a set of candidate relations. The initial assigned pair of entities inthe two columns perform majority voting to select the best possible relation fromthe candidate relation set. Each pair of entities in every row between the twocolumns votes for a relation rel. It increments its score by 1 if < ei,k > < rel >< ej,k > or < ej,k > < rel > < ei,k > is true (here i, j refer to two columns andk refers to entities from the k th row between the two columns). Factor node ψ4
queries Yago and DBpedia separately to check if the relations exists. The currentψ4 implementation also maintains two separate sets of candidate relations (onefor Yago and the other for DBpedia) ordered by votes.
Factor node ψ4 also computes a value for topScore for both top Yago andDBpedia relations as the the number of votes divided by the number of cells inthe column. If a score is below the current threshold, the relations are discardedand ψ4 sends low-confidence and no-change messages to all of the rowcell values in both columns and updates the relation between the columns tono-annotation. If the scores are above threshold, the top Yago and DBpediarelations between the two columns are updated. ψ4 then revisits the pair ofentities from the columns to discover possible incorrect assignments. For everycurrently assigned entity e in the two columns, ψ4 checks if e appears as a subjector object of the top relations (depending upon the relation direction; either Yagoor DBpedia). If e satisfies this constraint, a no-change message is sent to therow cell and a change message is sent otherwise. The ψ4 factor node also sendsthe relation information as characteristics the row cell should use for pickingthe next entity assignment and topScore as confidence score associated with themessage.
Updating entity annotations for row cell value variables. Every row cellr in the table receives messages from two types of factor nodes – column header
Generating Linked Data from Tables 11
Algorithm 3 ψ4 – Relation between pair of columns
1: Let Y agoCandidateRels and DBpCandidateRels be the set of Yago and DBpediacandidate relations between the columns ci and cj .
2: Let numberOfRows be the total number of rows in the table.3: for k = 1 to numberOfRows do4: Let ri,k and rj,k be the row values from columns i and j at row k.5: Let ei,k, ej,k be the currently assigned entities for ri,k and rj,k.6: for all rel in Y agoCandidateRels do7: Majority Voting : If < ei,k > < rel > < ej,k > or < ej,k > < rel > < ei,k >
is true, increment the score of rel by 18: end for9: Repeat the same majority voting process for candidate relations from
DbpCandidateRels10: end for11: Sort the Y agoCandidateRels and DbpCandidateRels sets in descending order.
The relations at the top of the sets are the ones with maximum votes. LettopRely and topReld be the top Yago and DBpedia relations respectively. LettopRelScorey and topRelScored be scores for topRely and topReld, where topScore= numberOfV otes / numberOfRows
12: if topRelScorey and topRelScored < relThreshold then13: Send message low-confidence and no-change to the row values in columns
ci and cj .14: Update relation annotation to no-annotation.15: end if16: if topRelScorey >= relThreshold then17: Update the top Yago relation between the columns ci and cj to topRely.18: end if19: Similarly update the top DBpedia relation between columns ci and cj .20: for k = 1 to numberOfRows do21: Let ei,k, Let ej,k be the currently assigned entities for ri,k and rj,k.22: If < ei,k > < topRel > < ej,k > and < ej,k > < topRel > < ei,k > is false, send
thechange message to the row value, whose entity violates the relation. Sendtop relation as the relation row variable entity assignment should participate in.(topRel can be either topRely or topReld)
23: Else, send theno-change message to both ri,k and rj,k.24: end for
12 V. Mulwad, T. Finin and A. Joshi
factor node (ψ3) and relation factor node (ψ4). While r will receive only onemessage from the column header (since r belongs to only one column), it mightreceive multiple messages from relation factor nodes if its column is related toseveral columns in the table. For example, the column City is associated withcolumns State, Mayor and Population. The result is that r can receive conflictingmessages – some factor nodes might send a change message, while others a no-change message.
If all of the messages received by r are no-change, r does not update. Ifall messages received by r are change, it decides to update its assignment. Inthe case of conflicting messages, r uses the confidence score sent by each factornode along with the message to compute the average score associated with thechange messages and compares it against the average score associated with theno-change messages. If the average change message score is higher, r updatesits current assignment, otherwise it does not.
When r chooses to update its current assignment, it picks a new assignmentbased on the semantic preferences sent by the factor nodes. For example, a rowcell value in the first column of the table in Figure 2 might receive messages toupdate to an entity which will have a rdf:type City and is the subject of rela-tions isPartOf and hasMayor. The row cell value r iterates through its rankedlist of candidate entity set and picks the next best entity satisfying all the se-mantic preferences specified in the message. In cases where r cannot find anentity that satisfies them all, it orders them based on the confidence scores asso-ciated with the respective messages and attempts to pick an entity assignmentthat satisfies the highest rank combination. For example, if there were threepreferences, ranked 1, 2 and 3, r will first attempt to find an entity that satis-fies[1,2,3] followed by [1,2] ; [1,3]; [2,3]; [1]; [2] and so on. If r is unable to findan entity that satisfies any preferences, then it updates its current assignmentto no-annotation.
An exception to this process occurs when the candidate entities for the cellall have low confidence (i.e., below the threshold (index threshold)). This istypically the case if the entity is absent from the knowledge base. In such cases,the algorithm maps the row cell value to no-annotation rather than linkingto any candidate. If the column header is mapped to no-annotation, the rowcell values retain the top ranked entity assignment as suggested by the entityranker.
Halting condition. Once the row cell values have updated, they send theirnew assignments to the factor nodes and the entire process repeats. Ideally, theprocess should be repeated until best possible assignments are achieved; i.e., re-peat until no variable node receives a change message or none of the variablenodes select a new assignment. Practically, this a hard convergence metric andit is often not achieved. In our current implementation, the Semantic MessagePassing algorithm lets this cycle repeat for five iterations. After five iterations,the algorithm checks the number of variables that have received a change mes-sage. If the number of variables is lower than the threshold required to updatethe column header or relation annotation, the process is stopped, else the pro-
Generating Linked Data from Tables 13
cess continues until convergence or the tenth iteration has been completed. Theassignments at the end of the final iteration are chosen as final values.
3 Evaluation
We begin by describing the experimental setup and follow by presenting ourevaluation and analysis for column header, cell value and relation annotations,and performance of the graphical model in terms of convergence and runningtimes.
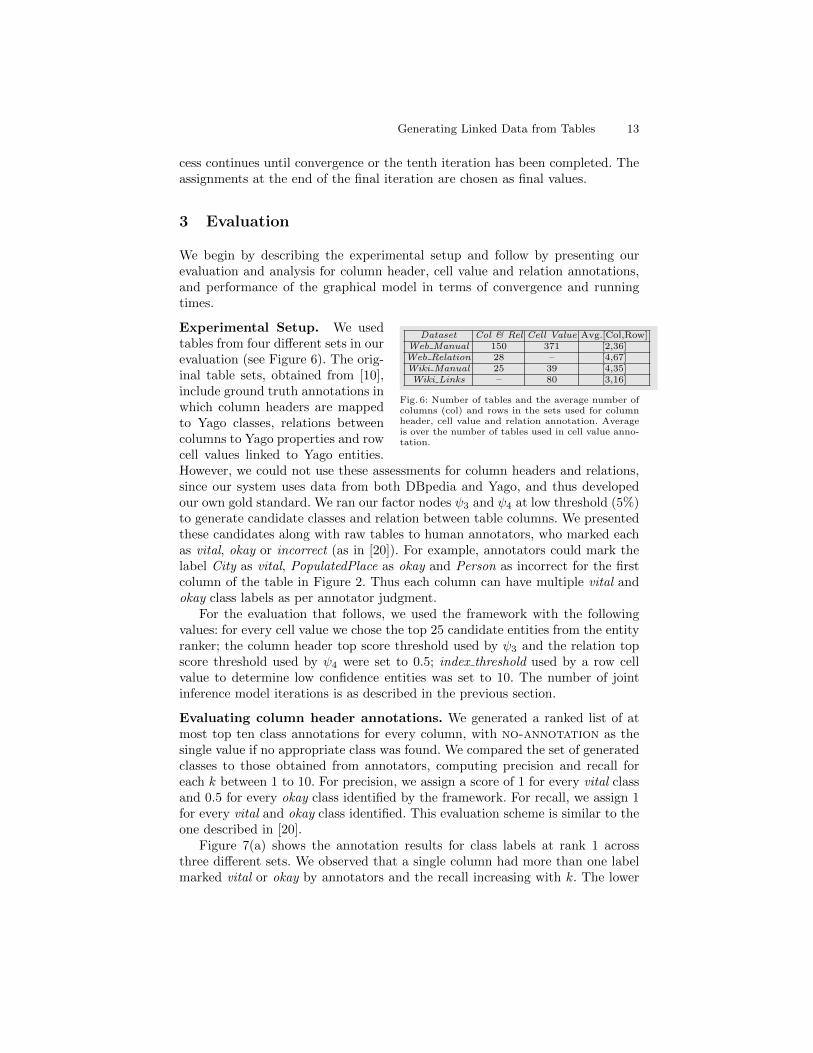
Experimental Setup. We usedDataset Col & Rel Cell Value Avg.[Col,Row]
Web Manual 150 371 [2,36]Web Relation 28 – [4,67]Wiki Manual 25 39 [4,35]Wiki Links – 80 [3,16]
Fig. 6: Number of tables and the average number ofcolumns (col) and rows in the sets used for columnheader, cell value and relation annotation. Averageis over the number of tables used in cell value anno-tation.
tables from four different sets in ourevaluation (see Figure 6). The orig-inal table sets, obtained from [10],include ground truth annotations inwhich column headers are mappedto Yago classes, relations betweencolumns to Yago properties and rowcell values linked to Yago entities.However, we could not use these assessments for column headers and relations,since our system uses data from both DBpedia and Yago, and thus developedour own gold standard. We ran our factor nodes ψ3 and ψ4 at low threshold (5%)to generate candidate classes and relation between table columns. We presentedthese candidates along with raw tables to human annotators, who marked eachas vital, okay or incorrect (as in [20]). For example, annotators could mark thelabel City as vital, PopulatedPlace as okay and Person as incorrect for the firstcolumn of the table in Figure 2. Thus each column can have multiple vital andokay class labels as per annotator judgment.
For the evaluation that follows, we used the framework with the followingvalues: for every cell value we chose the top 25 candidate entities from the entityranker; the column header top score threshold used by ψ3 and the relation topscore threshold used by ψ4 were set to 0.5; index threshold used by a row cellvalue to determine low confidence entities was set to 10. The number of jointinference model iterations is as described in the previous section.
Evaluating column header annotations. We generated a ranked list of atmost top ten class annotations for every column, with no-annotation as thesingle value if no appropriate class was found. We compared the set of generatedclasses to those obtained from annotators, computing precision and recall foreach k between 1 to 10. For precision, we assign a score of 1 for every vital classand 0.5 for every okay class identified by the framework. For recall, we assign 1for every vital and okay class identified. This evaluation scheme is similar to theone described in [20].
Figure 7(a) shows the annotation results for class labels at rank 1 acrossthree different sets. We observed that a single column had more than one labelmarked vital or okay by annotators and the recall increasing with k. The lower
14 V. Mulwad, T. Finin and A. Joshi
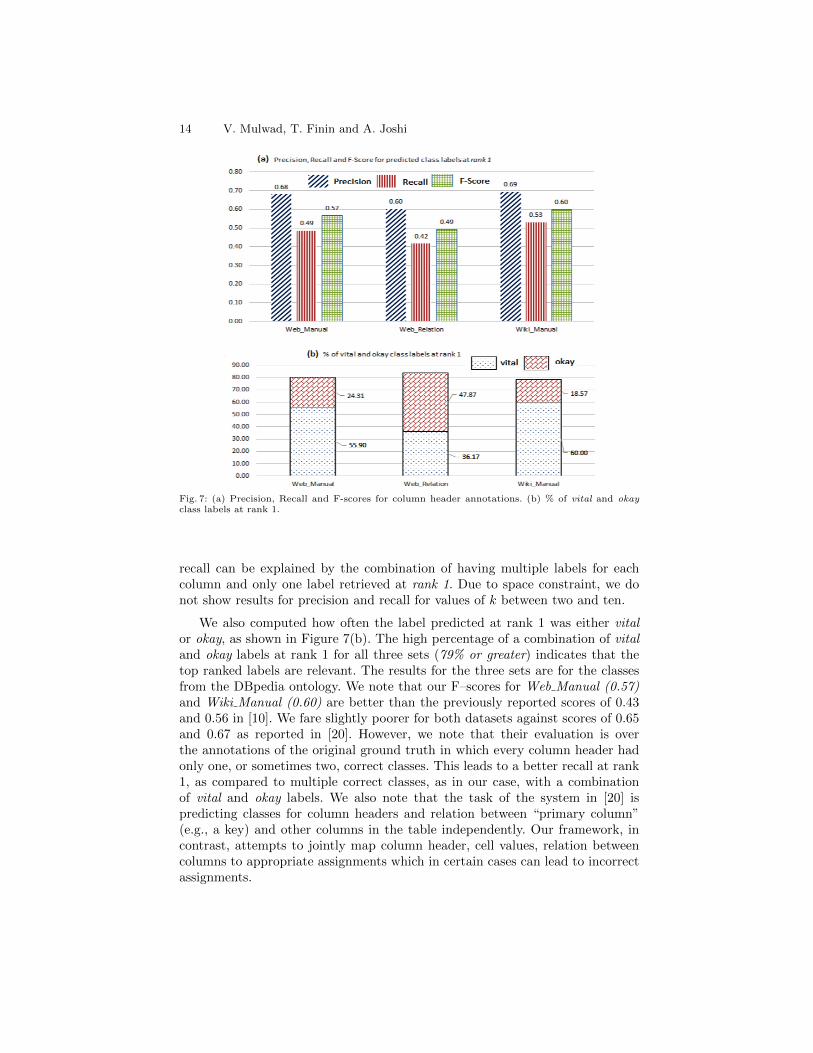
Fig. 7: (a) Precision, Recall and F-scores for column header annotations. (b) % of vital and okayclass labels at rank 1.
recall can be explained by the combination of having multiple labels for eachcolumn and only one label retrieved at rank 1. Due to space constraint, we donot show results for precision and recall for values of k between two and ten.
We also computed how often the label predicted at rank 1 was either vitalor okay, as shown in Figure 7(b). The high percentage of a combination of vitaland okay labels at rank 1 for all three sets (79% or greater) indicates that thetop ranked labels are relevant. The results for the three sets are for the classesfrom the DBpedia ontology. We note that our F–scores for Web Manual (0.57)and Wiki Manual (0.60) are better than the previously reported scores of 0.43and 0.56 in [10]. We fare slightly poorer for both datasets against scores of 0.65and 0.67 as reported in [20]. However, we note that their evaluation is overthe annotations of the original ground truth in which every column header hadonly one, or sometimes two, correct classes. This leads to a better recall at rank1, as compared to multiple correct classes, as in our case, with a combinationof vital and okay labels. We also note that the task of the system in [20] ispredicting classes for column headers and relation between “primary column”(e.g., a key) and other columns in the table independently. Our framework, incontrast, attempts to jointly map column header, cell values, relation betweencolumns to appropriate assignments which in certain cases can lead to incorrectassignments.
Generating Linked Data from Tables 15
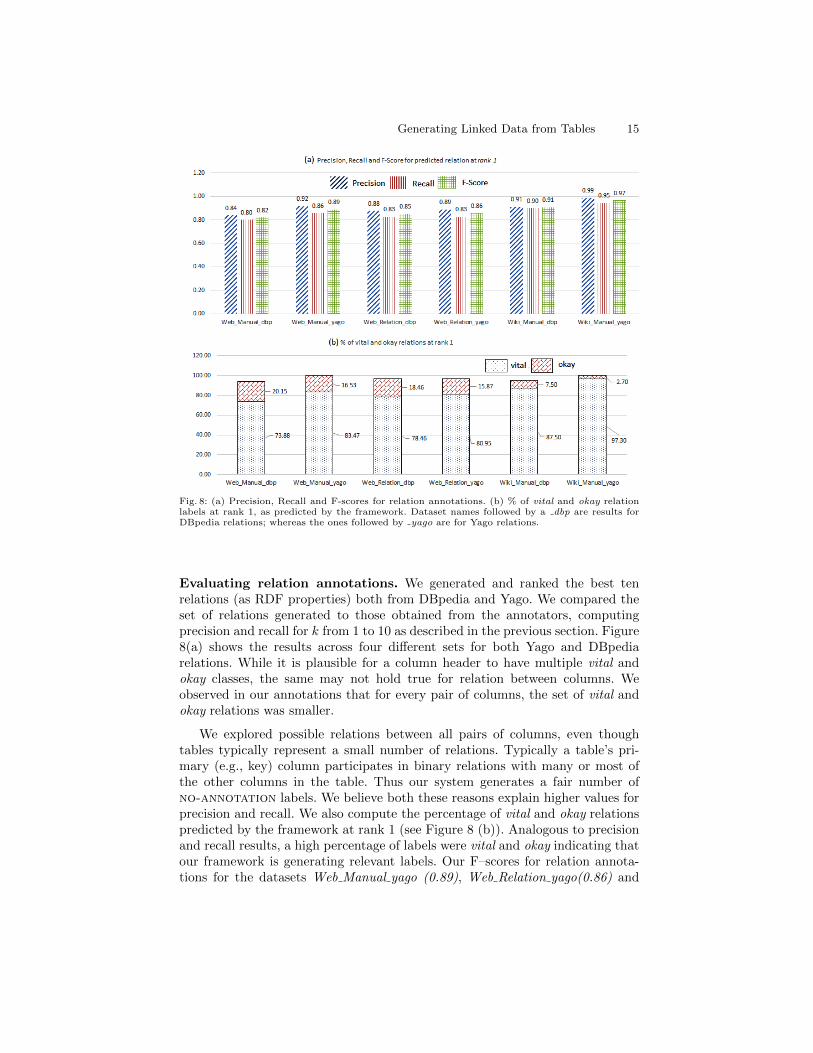
Fig. 8: (a) Precision, Recall and F-scores for relation annotations. (b) % of vital and okay relationlabels at rank 1, as predicted by the framework. Dataset names followed by a dbp are results forDBpedia relations; whereas the ones followed by yago are for Yago relations.
Evaluating relation annotations. We generated and ranked the best tenrelations (as RDF properties) both from DBpedia and Yago. We compared theset of relations generated to those obtained from the annotators, computingprecision and recall for k from 1 to 10 as described in the previous section. Figure8(a) shows the results across four different sets for both Yago and DBpediarelations. While it is plausible for a column header to have multiple vital andokay classes, the same may not hold true for relation between columns. Weobserved in our annotations that for every pair of columns, the set of vital andokay relations was smaller.
We explored possible relations between all pairs of columns, even thoughtables typically represent a small number of relations. Typically a table’s pri-mary (e.g., key) column participates in binary relations with many or most ofthe other columns in the table. Thus our system generates a fair number ofno-annotation labels. We believe both these reasons explain higher values forprecision and recall. We also compute the percentage of vital and okay relationspredicted by the framework at rank 1 (see Figure 8 (b)). Analogous to precisionand recall results, a high percentage of labels were vital and okay indicating thatour framework is generating relevant labels. Our F–scores for relation annota-tions for the datasets Web Manual yago (0.89), Web Relation yago(0.86) and
16 V. Mulwad, T. Finin and A. Joshi
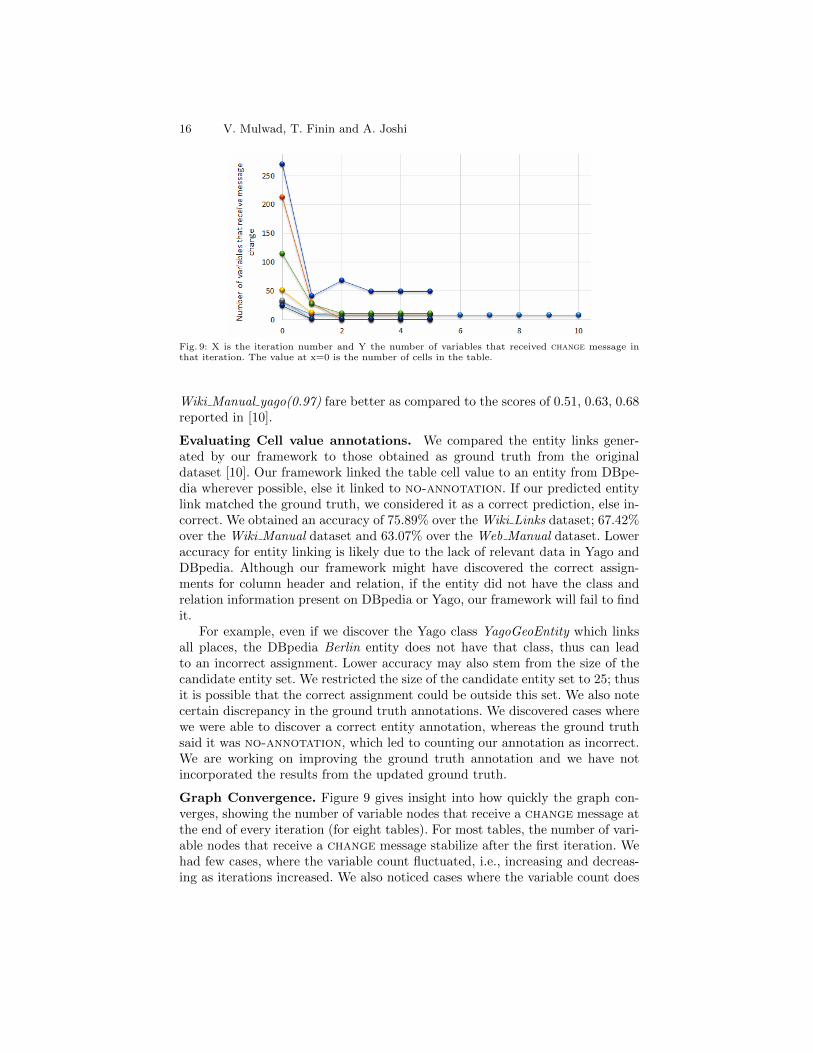
Fig. 9: X is the iteration number and Y the number of variables that received change message inthat iteration. The value at x=0 is the number of cells in the table.
Wiki Manual yago(0.97) fare better as compared to the scores of 0.51, 0.63, 0.68reported in [10].
Evaluating Cell value annotations. We compared the entity links gener-ated by our framework to those obtained as ground truth from the originaldataset [10]. Our framework linked the table cell value to an entity from DBpe-dia wherever possible, else it linked to no-annotation. If our predicted entitylink matched the ground truth, we considered it as a correct prediction, else in-correct. We obtained an accuracy of 75.89% over the Wiki Links dataset; 67.42%over the Wiki Manual dataset and 63.07% over the Web Manual dataset. Loweraccuracy for entity linking is likely due to the lack of relevant data in Yago andDBpedia. Although our framework might have discovered the correct assign-ments for column header and relation, if the entity did not have the class andrelation information present on DBpedia or Yago, our framework will fail to findit.
For example, even if we discover the Yago class YagoGeoEntity which linksall places, the DBpedia Berlin entity does not have that class, thus can leadto an incorrect assignment. Lower accuracy may also stem from the size of thecandidate entity set. We restricted the size of the candidate entity set to 25; thusit is possible that the correct assignment could be outside this set. We also notecertain discrepancy in the ground truth annotations. We discovered cases wherewe were able to discover a correct entity annotation, whereas the ground truthsaid it was no-annotation, which led to counting our annotation as incorrect.We are working on improving the ground truth annotation and we have notincorporated the results from the updated ground truth.
Graph Convergence. Figure 9 gives insight into how quickly the graph con-verges, showing the number of variable nodes that receive a change message atthe end of every iteration (for eight tables). For most tables, the number of vari-able nodes that receive a change message stabilize after the first iteration. Wehad few cases, where the variable count fluctuated, i.e., increasing and decreas-ing as iterations increased. We also noticed cases where the variable count does
Generating Linked Data from Tables 17
not go to zero. Some number of “stubborn” variables keep receiving a changemessage at the end of every iteration, but cannot find a new value. However, wenoticed that the number of stubborn variables are less as compared to the origi-nal number of variables in the table. We present results for eight tables for visualpurposes; the results are representative of rest of the tables in the dataset. Theaverage time required for the inference model across all tables was 3.4 seconds.
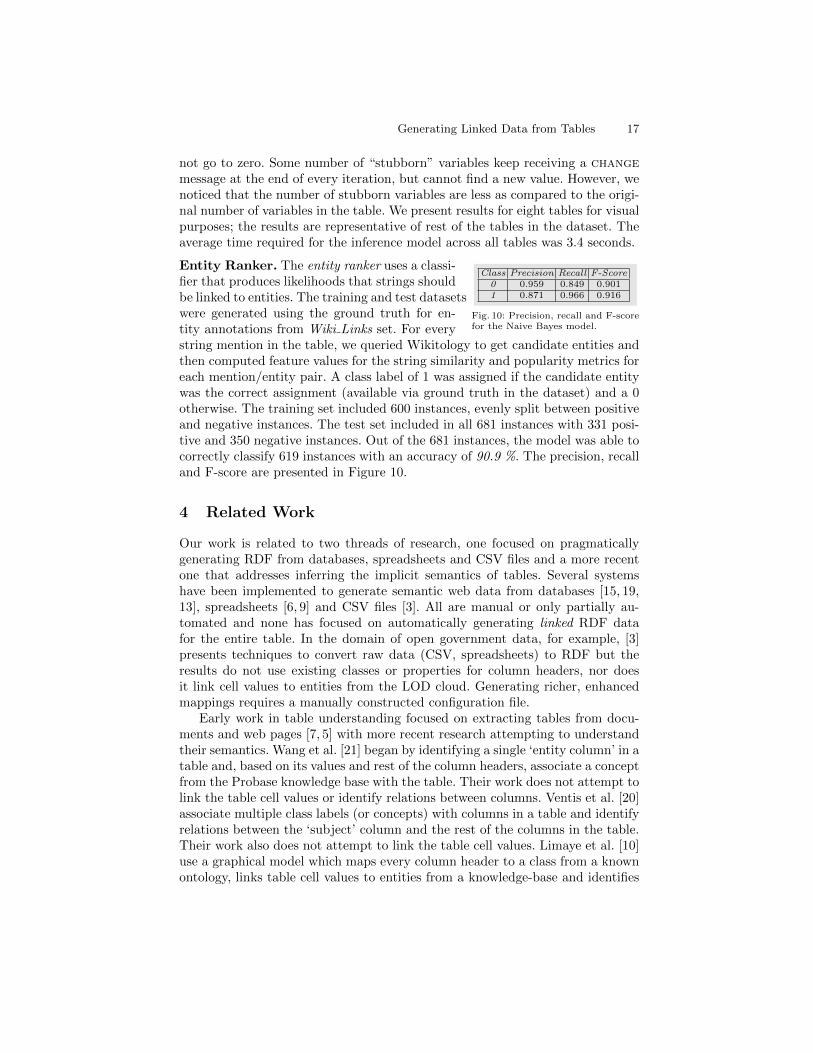
Entity Ranker. The entity ranker uses a classi-Class Precision Recall F-Score
0 0.959 0.849 0.9011 0.871 0.966 0.916
Fig. 10: Precision, recall and F-scorefor the Naive Bayes model.
fier that produces likelihoods that strings shouldbe linked to entities. The training and test datasetswere generated using the ground truth for en-tity annotations from Wiki Links set. For everystring mention in the table, we queried Wikitology to get candidate entities andthen computed feature values for the string similarity and popularity metrics foreach mention/entity pair. A class label of 1 was assigned if the candidate entitywas the correct assignment (available via ground truth in the dataset) and a 0otherwise. The training set included 600 instances, evenly split between positiveand negative instances. The test set included in all 681 instances with 331 posi-tive and 350 negative instances. Out of the 681 instances, the model was able tocorrectly classify 619 instances with an accuracy of 90.9 %. The precision, recalland F-score are presented in Figure 10.
4 Related Work
Our work is related to two threads of research, one focused on pragmaticallygenerating RDF from databases, spreadsheets and CSV files and a more recentone that addresses inferring the implicit semantics of tables. Several systemshave been implemented to generate semantic web data from databases [15, 19,13], spreadsheets [6, 9] and CSV files [3]. All are manual or only partially au-tomated and none has focused on automatically generating linked RDF datafor the entire table. In the domain of open government data, for example, [3]presents techniques to convert raw data (CSV, spreadsheets) to RDF but theresults do not use existing classes or properties for column headers, nor doesit link cell values to entities from the LOD cloud. Generating richer, enhancedmappings requires a manually constructed configuration file.
Early work in table understanding focused on extracting tables from docu-ments and web pages [7, 5] with more recent research attempting to understandtheir semantics. Wang et al. [21] began by identifying a single ‘entity column’ in atable and, based on its values and rest of the column headers, associate a conceptfrom the Probase knowledge base with the table. Their work does not attempt tolink the table cell values or identify relations between columns. Ventis et al. [20]associate multiple class labels (or concepts) with columns in a table and identifyrelations between the ‘subject’ column and the rest of the columns in the table.Their work also does not attempt to link the table cell values. Limaye et al. [10]use a graphical model which maps every column header to a class from a knownontology, links table cell values to entities from a knowledge-base and identifies
18 V. Mulwad, T. Finin and A. Joshi
relations between columns. They rely on Yago for background knowledge. Thecore of our framework is a probabilistic graphical model that captures more se-mantics, including relations between column headers and between row entities.Current table interpretation systems rely on semantically poor and possibly noisyknowledge-bases and do not attempt to produce a complete interpretation of atable. None generate high quality linked data from the inferred meaning or caninterpret columns with numeric values and use the results as evidence in tableinterpretation, a task essential for many domains.
5 Conclusions
Generating an explicit representation of the meaning implicit in tabular datawill support automatic integration and more accurate search. In this paper, wepresented an implementation of our graphical model which infers a table’s mean-ing relative to a knowledge base of general and domain-specific knowledge. Wedescribed a novel Semantic Message Passing algorithm which avoids computingpotentially huge joint-probability distribution tables normally required in suchgraphical models.
A thorough evaluation showed promising results, but leaves room for im-provement. We believe our extensible and domain independent framework canaddress the existing challenges in converting tabular data to RDF or high qualitylinked data. In the future, we will work on designing a cooperative environmentin which a person-in-the-loop identifies bad system choices for column classesand relations, cell value entities and optionally suggests better ones from thealternate candidates.
Acknowledgement. This work was supported by AFOSR award FA9550-08-1-0265 NSF awards 0326460 and 0910838 and a gift from Microsoft Research.
References
1. Bizer, C., Lehmann, J., Kobilarov, G., Auer, S., Becker, C., Cyganiak, R., Hell-mann, S.: Dbpedia - a crystallization point for the web of data. Journal of WebSemantics 7(3), 154–165 (2009)
2. Cafarella, M.J., Halevy, A.Y., Wang, Z.D., Wu, E., Zhang, Y.: Webtables: exploringthe power of tables on the web. PVLDB 1(1), 538–549 (2008)
3. Ding, L., DiFranzo, D., Graves, A., Michaelis, J.R., Li, X., McGuinness, D.L.,Hendler, J.A.: TWC data-gov corpus: incrementally generating linked governmentdata from data.gov. In: Proc 19th WWW. pp. 1383–1386. ACM (2010)
4. Dredze, M., McNamee, P., Rao, D., Gerber, A., Finin, T.: Entity disambiguationfor knowledge base population. In: COLING. pp. 277–285 (2010)
5. Embley, D.W., Lopresti, D.P., Nagy, G.: Notes on contemporary table recognition.In: Document Analysis Systems. pp. 164–175 (2006)
6. Han, L., Finin, T., Parr, C., Sachs, J., Joshi, A.: RDF123: from Spreadsheets toRDF. In: Proc. 7th Int. Semantic Web Conf. Springer (October 2008)
Generating Linked Data from Tables 19
7. Hurst, M.: Towards a theory of tables. IJDAR 8(2-3), 123–131 (2006)8. Koller, D., Friedman, N.: Probabilistic Graphical Models: Principles and Tech-
niques. MIT Press (2009)9. Langegger, A., Wob, W.: Xlwrap - querying and integrating arbitrary spreadsheets
with SPARQL. In: Proc. 8th Int. Semantic Web Conf. (October 2009)10. Limaye, G., Sarawagi, S., Chakrabarti, S.: Annotating and searching web tables
using entities, types and relationships. In: Proc. 36th VLDB (2010)11. Mulwad, V., Finin, T., Joshi, A.: A Domain Independent Framework for Extract-
ing Linked Semantic Data from Tables. In: Search Computing - Broadening WebSearch, pp. 16–33. Springer (July 2012), lNCS volume 7538
12. Mulwad, V., Finin, T., Syed, Z., Joshi, A.: Using linked data to interpret tables.In: Proc. 1st Int. Workshop on Consuming Linked Data. Shanghai (2010)
13. Polfliet, S., Ichise, R.: Automated mapping generation for converting databasesinto linked data. In: Proc. 9th Int. Semantic Web Conf. (Nov 2010)
14. Puranik, N.: A Specialist Approach for Classification of Column Data. Master’sthesis, University of Maryland, Baltimore County (August 2012)
15. Sahoo, S.S., Halb, W., Hellmann, S., Idehen, K., Thibodeau Jr, T., Auer, S., Se-queda, J., Ezzat, A.: A survey of current approaches for mapping of relationaldatabases to rdf. Tech. rep., W3C (2009)
16. Suchanek, F.M., Abiteboul, S., Senellart, P.: PARIS: Probabilistic Alignment ofRelations, Instances, and Schema. PVLDB 5(3), 157–168 (2011)
17. Suchanek, F.M., Kasneci, G., Weikum, G.: Yago: A Core of Semantic Knowledge.In: 16th Int. World Wide Web Conf. ACM Press, New York (2007)
18. Syed, Z., Finin, T.: Creating and Exploiting a Hybrid Knowledge Base for LinkedData. Springer (April 2011)
19. Vavliakis, K.N., Grollios, T.K., Mitkas, P.A.: RDOTE- transforming relationaldatabases into semantic web data. In: 9th Int. Semantic Web Conf. (2010)
20. Venetis, P., Halevy, A., Madhavan, J., Pasca, M., Shen, W., Wu, F., Miao, G., Wu,C.: Recovering semantics of tables on the web. In: Proc. 37th VLDB (2011)
21. Wang, J., Shao, B., Wang, H., Zhu, K.Q.: Understanding tables on the web. Tech.rep., Microsoft Research Asia (2011)
22. Zagari, R., Bianchi-Porro, G., Fiocca, R., Gasbarrini, G., Roda, E., Bazzoli, F.:Comparison of 1 and 2 weeks of omeprazole, amoxicillin and clarithromycin treat-ment for helicobacter pylori eradication: the hyper study. Gut 56(4), 475 (2007)


![2 3 arXiv:1805.10483v1 [cs.CV] 26 May 2018 · facial boundaries through message passing [11, 63] to in-crease its robustness to occlusion. After generating facial boundary heatmaps,](https://img.pdfslide.us/doc/110x75/5dd0f18bd6be591ccb6374dc/2-3-arxiv180510483v1-cscv-26-may-2018-facial-boundaries-through-message-passing.jpg)