Embed Size (px)
DESCRIPTION
http://cmimarseille.org/_src/SELM2_wk3/SELM2_wk3_Millot.pdf
Citation preview

“Are countries investing sufficiently at the tertiary education level?”
Benoît Millot
Marseille, 24/01/11
2/1/2011 1

Outline
I. Introduction
II. Approach
III. Investing in tertiary education
IV. Spending and access
V. Spending and quality
VI. Conclusion
2/1/2011 2

I. Introduction
“Are countries investing sufficiently
at the tertiary education level” ?2/1/2011 3

II. Approach (1)
Two directions:
(1) Spending and
Quantities/Access/Coverage
(2) Spending and
Quality
2/1/2011 4

Is the supply of birds sufficient for the cat’s appetite
Is the supply of birds sufficient for the cat?

Approach (2)
• Looks like a “Simple” question
• Use simple methodology: regressions (over-simplistic?)
• Robust results
• But correlation is not causality
2/1/2011 6

Slippery road
2/1/2011 7

III. Investment in Tertiary Ed
Measure: Public Exp on Ter Ed per student, as a % of GDP p.c.
Historical perspective: (from 1999 to 2007)
2/1/2011 8

Public total edu. expenditure per student(% of GDP p.c.), tertiary
0
50
100
150
200
250
300
350
1999 2000 2001 2002 2003 2004 2005 2006
Average
Mini/Max
2/1/2011 9

Investment in Tertiary Ed and Economic level (1)
Do countries tend to spend more public monies
on Tertiary education as they get richer ?
NO
(Almost the other way around)
2/1/2011 10

Investment in Tertiary Ed and Economic level (2)
Tunisia
Lebanon0.000
2.000
4.000
6.000
8.000
10.000
12.000
14.000
16.000
18.000
Tajik
ista
n
Kyrg
yz R
epu
blic
Mo
ldo
va
Gu
yan
a
Para
guay
Iran
, Isl
amic
Rep
.
Bu
lgar
ia
Tun
isia
Leb
ano
n
Ch
ile
Mex
ico
Esto
nia
Mal
ta
Ko
rea,
Rep
.
Ital
y
Au
stra
lia
Net
her
lan
ds
Mac
ao S
AR
, Ch
ina
Den
mar
k
Un
ited
Sta
tes
No
rway
Public Exp per student as % of GDP p.c.
GDP p.c. (log)
2/1/2011 11

Investment in Tertiary Ed and Economic level (3)
Story of two tails
2/1/2011 12
1 Korea, Rep. 8 1 Azerbaijan 8
2 Lebanon 14 2 Kazakhstan 8
3 Japan 15 3 Korea, Rep. 9
4 Argentina 18 4 Philippines 10
5 Azerbaijan 19 5 Liechtenstein 10
55 Swaziland 351 64 Madagascar 137
56 Burundi 1051 65 Togo 155
57 Lesotho 1387 66 Burkina Faso 307
58 Mozambique 1412 67 Niger 553
59 Malawi 2613 68 Ethiopia 643
MAX
Public Exp per student as % of GDP p.c YR1999 YR2007
Min

MENA Countries: Public Exp per student as % of GDP p.c
2/1/2011 13
0
10
20
30
40
50
60
70
80
90
100
YR2002 YR2003 YR2004 YR2005 YR2006
Iran, Islamic Rep.
Morocco
Tunisia
Sample Ave

IV. Spending & Access
Measure : Straightforward:
Gross Enrollment Rate in Tertiary Education:
GER (Ter)
2/1/2011 14

Access: Main features (1)
• The obvious (almost trivial):
• GER (Ter) strongly related to economic level (GDP p.c.) observed in 2007
• Strong and stable positive correlation over the years (2000 to 2008)
GDP p.c. ∆ = + 45%
GER (Ter) ∆ = + 57%
2/1/2011 15

Access: Main features(2)
2/1/2011 16
Burundi
Congo
SaudiArabia
Lebanon
Russia
Ukraine
Finland
Korea
-20.0
0.0
20.0
40.0
60.0
80.0
100.0
120.0
0.000 1.000 2.000 3.000 4.000 5.000 6.000
GER (Ter) & Log GDP p.c (2007 & 2007).

Remark Correlation goes both ways:
wealth more access
more participation more growth
2/1/2011 17

Spending & Access (1)
Less intuitive: A stable, moderately strong,
negative correlation:
Higher level investments are linked to lowerlevels of coverage
2/1/2011 18

Spending & Access (2)
Tunisia
Lebanon0.0
20.040.060.080.0
100.0120.0140.0160.0180.0
Mad
agas
car
Cam
ero
on
Aze
rbai
jan
Tajik
ista
n
Para
guay
Liec
hte
nst
ein
Mal
ta
Mo
ldo
va
Cro
atia
Bu
lgar
ia
Kaz
akh
stan
Fran
ce
Ro
man
ia
Isra
el
Esto
nia
Hu
nga
ry
Spai
n
Swed
en
No
rway
Den
mar
k
Fin
lan
d
GER (Ter)
Public Exp per student as % of GDP p.c
2/1/2011 19

Spending & Access (3)
Is there any lag time effect ?
(investment takes some years to concretize) ?
NO: correlation does not change when lag is introduced
2/1/2011 20

Spending & Access (4)
Alternative measure of spending:
relative share of total public education expenditure on Tertiary Education
Is it a better predictor of performances in terms
of access ?
Response: next slide
2/1/2011 21

Spending & Access (5)
2/1/2011 22
Burundi
Cuba
Ecuador
FinlandGreece
Lebanon
MalaysiaTunisia
0
20
40
60
80
100
120
0 5 10 15 20 25 30 35 40
Share of tertiary education in total education expenditure and GER (Ter)

Spending & Access (6)
Alternative perspective on investment:
Is private provision linked to wider coverage?
Response: next slide
2/1/2011 23

Spending & Access (7):
Private Provision
Morocco
WB-G
0.0
20.0
40.0
60.0
80.0
100.0
120.0
Den
mar
k
Au
stra
lia
Mo
rocc
o
Cze
ch R
epu
blic
New
Zea
lan
d
Mad
agas
car
Icel
and
Bu
lgar
ia
Spai
n
Hu
nga
ry
Fran
ce
Swit
zerl
and
Lao
PD
R
Pola
nd
Mex
ico
Port
uga
l
Mac
ao S
AR
, …
Jord
an
Geo
rgia
Wes
t B
ank …
Co
lom
bia
El S
alva
do
r
Jap
an
Isra
el
Ber
mu
da
Private enrollment share (%), tertiary
School enrollment, tertiary (% gross)
2/1/2011 24

Spending & Access (8)
Summary
• As countries get richer, access to Ter Ed increases, but public investment in Ter Ed tends to decrease
• Participation in Ter Ed decreases as Public Investment rises, but mildly increase when the Ter Ed share of ed expenditures increases
• Access is insensitive to the density of private penetration
2/1/2011 25

V. Spending & Quality
Measure: Very tricky:
no common metric for international comparisons;
no good, universally accepted proxy
Solution: use major leagues
ARWU and THES
2/1/2011 26

Quality: Measure (1)
From:
# of top 500 universities in a given country
To:
Tertiary Population = ½ Number of youths (15-24) per university in the top 500 in a given country
(or potential clientele of the top universities)
2/1/2011 27

Quality: Measure (2a)
2/1/2011 28
1 Finland 54685 1 Ireland 37443
2 Sweden 55893 2 Finland 46873
3 New Zealand 62292 3 New Zealand 51910
4 Switzerland 68140 4 Switzerland 59622
5 Austria 72041 5 Australia 60715
6 Norway 78231 6 Denmark 67044
7 Israel 80240 7 Hong Kong SAR, China 73851
8 Netherlands 83213 8 Sweden 76853
9 Denmark 83805 9 Norway 78231
10 Australia 85715 10 United Kingdom 78778
11 Belgium 90235 11 Netherlands 83213
12 Canada 97765 12 Belgium 90235
13 Ireland 99849 13 Austria 100857
14 United Kingdom 105728 14 Germany 111770
15 Slovenia 115185 15 Canada 112430
16 Germany 120367 16 Greece 118548
17 Italy 132060 17 Israel 140420
18 United States 146549 18 Singapore 163901
19 Singapore 163901 19 France 181797
20 France 173534 20 Italy 193687
21 Spain 230390 21 Portugal 198833
22 Japan 252743 22 United States 208968
23 Greece 296370 23 Spain 230390
24 Portugal 298249 24 Japan 252743
25 Hungary 310488 25 South Korea 254602
ARWU THES

Quality: Measure (2b)
2/1/2011 29
ARWU
26 South Korea 330983 26 Uruguay 257980
27 Czech 628931 27 Hungary 310488
28 Chile 737664.75 28 Czech Republic 314466
29 Saudi Arabia 1237368.5 29 United Arab Emirates 341773
30 Poland 1330153.8 30 Lebanon 372556
31 South Africa 1631978.2 31 Malaysia 519938
32 Brazil 2811416.2 32 Chile 737665
33 China 3233238.5 33 Saudi Arabia 824912
34 Argentina 3414160.5 34 Thailand 1208413.3
35 Russia 5049081.8 35 Poland 1330153.8
36 Turkey 6825539.5 36 Turkey 1365107.9
37 Iran 8374274.5 37 Kazakhstan 1457104.5
38 Mexico 9938534 38 South Africa 1631978.2
39 India 58764202 39 Argentina 1707080.3
40 Russian Federation 2019632.7
41 Philippines 3048134.7
42 Mexico 4969267
43 Indonesia 5273054.9
44 Brazil 5622832.3
45 Egypt, Arab Rep. 7712652.5
46 Iran, Islamic Rep. 8374274.5
47 China 10948700
48 India 14691050
49 Pakistan 19436096
THES

Quality: Measure (2c)
2/1/2011 30
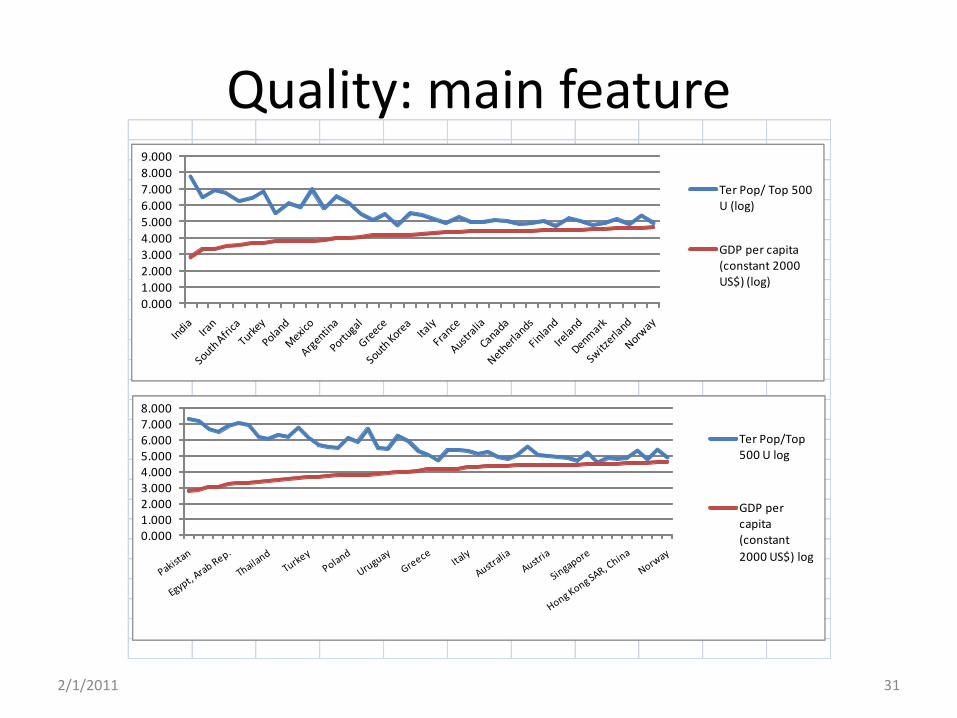
Quality: main feature
2/1/2011 31
0.000
1.000
2.000
3.000
4.000
5.000
6.000
7.000
8.000
9.000
Ter Pop/ Top 500 U (log)
GDP per capita (constant 2000 US$) (log)
0.0001.0002.0003.0004.0005.0006.0007.0008.000
Ter Pop/Top 500 U log
GDP per capita (constant
2000 US$) log

Spending and Quality (1): Summary
2/1/2011 32
ARWU THES
Publ Exp per st. as % of GDP p.c. (2001) &
Ter Pop /Top 500 U (log)-0.11 -0.16
Publ Exp per st. as % of GDP p.c. (2007) &
Ter Pop /Top 500 U (log)-0.1 -0.30
Share of Ter in total Ed Expenditures
(2007) & . (2001) & Ter Pop /Top 500 U
(log)
-0.36 -0.44
Private enrollment share (2007) & Ter
Pop/Top 500 U (log)0.12 0.21

Spending and Quality (2)
Summary
• While quality of Ter Ed is and positively linked with economic level of countries, it is only moderately increasing with rising levels of public investment
• Quality of Ter Ed is negatively –albeit slightly --influenced by the presence of the private sector
2/1/2011 33

VI. Conclusion (1)
2/1/2011 34

VI. Conclusion (2): No extraordinary claims
Just paradoxes and inconclusiveness
• Paradox #1: As countries get richer, both quantity and quality of Ter Ed increase, but at the same time, public investment in Ter Ed tends to decrease
• Paradox #2: Higher levels of public spending have a (strong) negative impact on access but a (weak) positive impact on quality of Ter Ed
• Observation #1: The share Ter Ed in total Education Expenditures has a (slight) positive impact on both access and quality
• Observation #2: Neither quality nor quantity of Ter Ed is affected by the penetration of the private sector
2/1/2011 35

Conclusion (3):
• Back to the initial question: “Are countries investing sufficiently at the tertiary education level?”:
• The answer is that it is not possible to say “yes” or “no”
• The real questions are:
what exactly is invested ? and
Is the investment efficient and equitable ?
2/1/2011 36
Conclusion (4): Lessons
Acknowledgment: Simplistic statistical treatment
Still, results robust enough to suggest:– Money is not everything
– Multiple factors are at play
– Governance as important
– No single development path
– No benchmark
– Country context most important
2/1/2011 37

No reason to give up
No fatality
There is a multiplicity of models
Each country has its own path
2/1/2011 38
Last word

Thank YOU(still pondering?)
2/1/2011 39
Credits
1st cat: Qatar
2nd cat: France


