Embed Size (px)
Citation preview
FACULTAD DE CIENCIAS SOCIALES, JURÍDICAS Y
DE LA EMPRESA
DEPARTAMENTO DE CIENCIAS SOCIALES, JURÍDICAS Y DE LA EMPRESA
“SELLING SERVICES BY CREATING TRUST AN EMPIRICAL STUDY IN THE GERMAN TRADE
FAIR MARKET”
Author: Maike Ursula Busch
Directores:
Prof. Dr.Dr. Peter Kürble Dra. Mª Pilar Flores Asenjo
Düsseldorf, February 2016


AUTHORIZATION OF THE DIRECTOR OF THE THESIS
FOR SUBMISSION
Prof. Dr. Dr. Peter Kürble and Dra. M.a Pilar Flores Asenjo as Directors(1) of the
Doctoral Thesis “Selling services by creating trust - An empirical study in the German trade
fair market” by Ms. Maike Ursula Busch in the Departamento de Ciencias Sociales, Jurídicas y
de la Empresa, authorizes for submission since it has the conditions necessary for her
defense.
Sign, to comply with the Royal Decrees 99/2011, 1393/2007, 56/2005 y 778/98, in Murcia
Prof.Dr.Dr. Peter Kürble Dra. Mª Pilar Flores Asenjo
(1) If the thesis is directed by more than one Director must noted and sign both.
Tercer Ciclo. Vicerrectorado de Investigación Campus de Los Jerónimos. 30107 Guadalupe (Murcia)
Tel. (+34) 968 27 88 22 • Fax (+34) 968 27 85 78 - C. e.: [email protected]


ACKNOWLEDGEMENTS
The doctoral thesis at hand represents the work of several years of study. It is set
in the Germany trade fair industry and focuses on how trade fair organizing
companies can sell their provided services more effectively to the exhibitors on
their fairgrounds.
This project would not have been possible without the support of many people
and institutions. To start with, I would like to thank most of all my doctoral
advisers Prof. Dr. Dr. Peter Kürble and Dra. Mª Pilar Flores Asenjo for their
support in finding and narrowing down the topic and for their constant support
throughout the project. It was more than helpful and encouraging to have the
constructive talks and help. Same applies to Prof. Dr. Dr. habil. Clemens Jäger.
His constant encouragements and support truly helped me to get this far.
Additionally, I would like to thank Jens Steinbach who help me get in touch with
the Messe Düsseldorf GmbH. It was a great benefit to have Wolfgang Prager,
Dagmar Prinz and Meike Schürgers as well as Barbara Biedermann of Wissler &
Partner at my side.
I also would like to thank some of my colleagues and friends for their support.
Dr. Frank Brimmen, thank you so much for all the constructive and encouraging
talks about the project. Lars Kleinikel, thank you for your effort in reading and
discussing especially the statistical evaluations of this paper at length with me.
Stefan Breuer, thank you for all the times, we encouraged each other to move on.
Thank you Laura Treske for the information exchange about trust research. Thank
you Kathrin, Bettina, Celeste, Nina, Miriam, Steffie, Anne, Kerstin and Christiane
for your endless encouragements. Although you might not believe this, you being
there for me, pulled me through this. And thank you as well for “letting me
borrow” your kids, whenever I needed to get my mind off this project.
Finally, I thank my family. Thanks to my American family for their courage to
read this paper and to give me advice. Thanks to my parents Ursula and Theo
Busch as well as my sister Tanja, her husband Damian and their kids Florian and
Luisa whose tireless support led me through the whole project. I have truly been
blessed to have so many people giving me confidence and supporting me.


“By perserverance the snail reached the ark.”
~ Charles Haddon Spurgeon ~


INDEX
AUTHORIZATION OF THE DIRECTOR OF THE THESIS ................................... 3
ACKNOWLEDGEMENTS ............................................................................................. 5
INDEX ................................................................................................................................ 9
INDEX OF FIGURES ..................................................................................................... 13
INDEX OF TABLES ....................................................................................................... 17
ACRONYMS AND ABBREVIATIONS ..................................................................... 19
1 INTRODUCTION .................................................................................................. 21
1.1 PROBLEM DEFINITION ............................................................................. 21
1.2 DEFINITION OF OBJECTIVES .................................................................... 23
1.3 RESEARCH APPROACH ............................................................................ 24
2 LITERATURE REVIEW ........................................................................................ 27
2.1 SERVICE MARKETING ............................................................................... 27
2.1.1 Defining services ....................................................................................... 27
2.1.2 Performance-models of services ............................................................... 34
2.1.3 Significant aspects of service marketing ................................................ 40
2.1.4 Market services internationally .............................................................. 44
2.2 BUSINESS-TO-BUSINESS MARKETING .................................................... 47
2.2.1 Defining business markets and business-to-business marketing ....... 47
2.2.2 Buying behavior in business markets ..................................................... 50
2.2.2.1 The buying center ..................................................................................... 50
2.2.2.2 Buying techniques in business markets ................................................ 56
2.2.2.3 The B2B buying process........................................................................... 58
2.2.3 Pertinent aspects of marketing communication in business markets 59
2.2.4 Marketing goods in business markets internationally ......................... 67
2.3 NEW INSTITUTIONAL ECONOMICS ....................................................... 69
2.3.1 Origin and development of the New Institutional Economics ........... 69
10
2.3.2 Institutions ................................................................................................. 70
2.3.3 Approaches of the New Institutional Economics .................................. 71
2.3.3.1 Property-rights approach ........................................................................ 71
2.3.3.2 Transaction-costs approach .................................................................... 73
2.3.3.3 Principal-agent approach ........................................................................ 74
2.3.3.4 Information economics ............................................................................ 76
2.3.4 Problems and difficulties in principal-agent relationships.................. 78
2.3.4.1 Problems based on asymmetric information in an agency relation-
ship ............................................................................................................. 78
2.3.4.2 Additional problems in an agency relationship ................................... 81
2.3.4.3 Possibilities to reduce agency problems ............................................... 83
2.3.4.3.1 Reducing information asymmetry .......................................................... 85
2.3.4.3.2 Alignment of interest ................................................................................ 87
2.3.4.3.3 Creation of trust ......................................................................................... 88
2.4 TRUST .......................................................................................................... 90
2.4.1 Trust research in etymology .................................................................... 90
2.4.2 Trust research in philosophy ................................................................... 91
2.4.3 Trust research in psychology ................................................................... 91
2.4.4 Trust research in social psychology ........................................................ 93
2.4.5 Trust research in sociology ...................................................................... 96
2.4.6 Trust research in economics .................................................................... 96
2.4.6.1 Trust between individuals and/or organizations ............................... 100
2.4.6.2 Determinants of trust in economic research ....................................... 101
2.4.6.3 Trust and communication ..................................................................... 105
2.5 INTERIM CONCLUSION CHAPTER 2 ..................................................... 108
3 THE GERMAN TRADE FAIR MARKET ........................................................ 111
3.1 HISTORICAL DEVELOPMENT & SITUATION TODAY ......................... 111
3.2 CORPORATIVE ACTORS ON THE GERMAN TRADE FAIR MARKET .. 118
3.2.1 Primary actors ......................................................................................... 119
3.2.2 Secondary actors ...................................................................................... 123
3.3 SERVICE OFFERS OF GERMAN TRADE FAIR ORGANIZERS ............... 127
3.3.1 Additional services and their relevance for the core business ........... 127
3.3.2 Constitution of service clusters ............................................................. 128
11
3.3.3 Competitive situation on the service market for German trade fair
companies ................................................................................................. 130
3.4 INTERIM CONCLUSION CHAPTER 3 ..................................................... 131
4 DERIVATION OF HYPOTHESES FOR THE EMPIRICAL RESEARCH . 133
5 EMPIRICAL ANALYSIS IN THE GERMAN TRADE FAIR MARKET .... 137
5.1 SPECIFICATIONS FOR PRIMARY RESEARCH ........................................ 137
5.1.1 Definition of the research sample .......................................................... 140
5.1.2 Illustration of the survey’s implementation in practice ..................... 145
5.1.3 Development and description of final questionnaire .......................... 145
5.1.4 Description of statistical methods for analyzing the survey results 152
5.2 DATA ANALYSIS...................................................................................... 155
5.2.1 Verification of the sample ....................................................................... 155
5.2.2 General results of the survey (focus on the complete sample) .......... 163
5.2.3 Testing of hypotheses .............................................................................. 170
5.2.3.1 Testing of hypothesis 1 .......................................................................... 170
5.2.3.2 Testing of hypothesis 2 .......................................................................... 172
5.2.3.3 Testing of hypothesis 3 .......................................................................... 199
5.2.4 Buying center analysis for the medical industry ................................ 232
5.2.4.1 Analyzing the members of the buying center .................................... 233
5.2.4.2 Determining buying center clusters for communication
approaches .............................................................................................. 239
5.2.5 Transferability of survey results to other industries .......................... 246
5.2.5.1 Testing of hypotheses ............................................................................ 251
5.2.5.2 Buying center analysis ........................................................................... 265
6 CONCLUSION ..................................................................................................... 267
6.1 RECAPITULATION OF RESEARCH QUESTION, OBJECTIVES AND
RESEARCH APPROACH .......................................................................... 267
6.2 EMPIRICAL FINDINGS AND RESULTS FOR THE GERMAN TRADE
FAIR INDUSTRY ....................................................................................... 269
6.2.1 Trust as success factor ............................................................................ 269
6.2.2 Implications to build and maintain trust with exhibitors ................. 270
6.2.2.1 Determinants of trust relevant for the medical industry .................. 270
12
6.2.2.2 Trust-building communication aspects relevant for the medical
industry.................................................................................................... 271
6.2.2.3 Buying center analysis (medical industry) to support a success-
ful business relationship ........................................................................ 278
6.2.2.4 Generalization of results........................................................................ 279
6.3 IMPLICATIONS OF THIS STUDY ............................................................. 281
6.4 LIMITATIONS OF THE STUDY AND RECOMMENDATIONS FOR
FUTURE RESEARCH ................................................................................. 283
PUBLICATION BIBLIOGRAPHY ............................................................................ 285
APPENDIX .................................................................................................................... 318
13
INDEX OF FIGURES
Figure 1: Research approach .......................................................................................... 25
Figure 2: The transition from material goods to services .......................................... 29
Figure 3: Dividing services by phases .......................................................................... 33
Figure 4: Information economics triangle .................................................................... 35
Figure 5: Evaluation of goods and services ................................................................. 36
Figure 6: Typology of service performances by Engelhardt et al. ............................ 37
Figure 7: Typology of service performances by Meffert ............................................ 39
Figure 8: Demarcation of endconsumer marketing, B2B marketing & service
marketing ..................................................................................................... 49
Figure 9: Members of a buying center .......................................................................... 52
Figure 10: Environmental influences on buying behavior ........................................ 54
Figure 11: The stages of the B2B buying process ....................................................... 58
Figure 12: Problems based on asymmetric information in a principal-agent
relationship .................................................................................................. 80
Figure 13: Possible strategies to solve agency problems ........................................... 84
Figure 14: The stages of trust development ................................................................. 95
Figure 15: Trade fairs in Germany 2011 (in comparison to the respective
previous events) ........................................................................................ 113
Figure 16: Origins of foreign exhibitors at trade fairs in Germany 2014 ............... 115
Figure 17: Corporate actors on the German trade fair market ................................ 119
Figure 18: Quantitative survey – from sample to report ......................................... 138
Figure 19: Importance of trust for a sustainable service provider and buyer
relationship (n = 580) ................................................................................ 171
Figure 20: Valuation of trust determinants (by exhibitor status) ........................... 176
Figure 21: Valuation of trust determinants (by stand size) ..................................... 178
14
Figure 22: Valuation of trust determinants (by origin) ............................................ 183
Figure 23: Ratings ‘Benevolence’ divided by exhibitors’ origin ............................. 188
Figure 24: Ratings ‘Supplier reputation (in relation to the company)’ divided
by exhibitors’ origin ................................................................................. 189
Figure 25: Ratings ‘Similarity of the service provider and the customer’
divided by exhibitors’ origin ................................................................... 190
Figure 26: Ratings ‘Honesty’ divided by exhibitors’ origin .................................... 191
Figure 27: Ratings ‘Reliability‘ divided by exhibitors’ origin ................................. 192
Figure 28: Ratings ‘Technical assistance in addition to the ordered services’
divided by exhibitors’ origin ................................................................... 193
Figure 29: Ratings ‘Level of experience of supplying firm’ divided by
exhibitors’ origin ....................................................................................... 194
Figure 30: Ratings ‘Cultural background of supplier’s contact person’ divided
by exhibitors’ origin ................................................................................. 195
Figure 31: Ratings ‘Cultural background of supplying firm’ divided by
exhibitors’ origin ....................................................................................... 195
Figure 32: Valuation of trust building communication aspects by exhibitor
status ........................................................................................................... 202
Figure 33: Valuation of trust building communication aspects by stand size ...... 205
Figure 34: Ratings ‘Recommendations of other customers are available
regarding the service provider’ divided by stand size ........................ 209
Figure 35: Ratings ‘Information about supplier can be obtained through
independent media’ divided by stand size ........................................... 210
Figure 36: Ratings ‘The service provider is able to present independent
certification’ divided by stand size ........................................................ 211
Figure 37: Ratings ‘The service provider offers a serious complaint
management’ divided by stand size ...................................................... 212
15
Figure 38: Ratings ‘The service provider shows stability in his communication
and doing’ divided by stand size ........................................................... 213
Figure 39: Valuation of trust building communication aspects by exhibitors’
origin .......................................................................................................... 215
Figure 40: Ratings ‘The service provider has a positive reputation in the
market’ divided by exhibitors’ origin .................................................... 217
Figure 41: Ratings ‘Recommendations of other customers are available
regarding the service provider’ divided by exhibitors’ origin ........... 218
Figure 42: Ratings ‘The service provider ensures a regular direct contact
between customer and supplier’ divided by exhibitors’ origin ......... 219
Figure 43: Ratings ‘Information about supplier can be obtained through
independent media’ divided by exhibitors’ origin .............................. 221
Figure 44: Ratings ‘The service provider is able to present independent
certification’ divided by exhibitors’ origin ............................................ 222
Figure 45: Ratings ‘The service provider offers a serious complaint
management’ divided by exhibitors’ origin ......................................... 223
Figure 46: Ratings ‘The service provider accommodates and shows readiness
to act if necessary’ divided by exhibitors’ origin ................................. 224
Figure 47: Ratings ‘The service provider offers ways to preview the goods
and services he sells’ divided by exhibitors’ origin ............................. 225
Figure 48: Ratings ‘The service provider offers correct information & possibly
ways to double-check this information’ divided by exhibitors’
origin .......................................................................................................... 226
Figure 49: Ratings ‘The service provider shows public interest, supports char-
ity and shows social responsibility’ divided by exhibitors’ origin .... 227
Figure 50: Who makes the decision to participate in a trade fair? ......................... 233
Figure 51: Decision making about trade fair participations in companies ........... 234
Figure 52: Deciders on services when decisions are made centralized ................. 235
16
Figure 53: Answering of question 17: “Are you responsible within your com-
pany for the commissioning of service providers for your partici-
pation at the trade fair?” divided by position in the company .......... 236
Figure 54: Cluster distribution based on the cluster analysis calculation ............. 243
Figure 55: Importance of trust for a sustainable service provider and buyer
relationship (n=107) .................................................................................. 252
Figure 56: Ratings ‘Technical assistance in addition to ordered services’
divided by exhibitors’ origin ................................................................... 256
Figure 57: Ratings ’Cultural background of supplier’s contact person’ divided
by exhibitors’ origin ................................................................................. 256
Figure 58: Ratings ‘Cultural background of the supplying firm’ divided by
exhibitors’ origin ....................................................................................... 257
Figure 59: Ratings ‘Personal level of experience of contact person at supply-
ing firm’ divided by exhibitors’ origin .................................................. 258
Figure 60: Ratings ‘The service provider offers correct information & possibly
ways to double-check this information’ divided by exhibitor
status ........................................................................................................... 260
Figure 61: Ratings ‘The service provider accommodates and shows readiness
to act if necessary’ divided by exhibitior’ origin .................................. 262
Figure 62: Ratings ‘The service provider offers openness and transparency.’
divided by exhibitors’ origin ................................................................... 262
Figure 63: Ratings ‘Experienced sales personnel’ divided by exhibitors’ origin . 263
Figure 64: Ratings ‘Ensuring of regular contact’ divided by exhibitors’origin .... 264
Figure 65: Ratings ‘Independent certification’ divided by exhibitors’ origin ....... 264
Figure 66: Ratings ‘Possibility to preview goods’ divided by exhibitors’ origin . 265
Figure 67: Results of primary research on the worldwide medical industry
with focus on the booked stand sizes .................................................... 276
Figure 68: Results of primary research on the worldwide medical industry
with focus on the exhibitors’ origin ....................................................... 277
17
INDEX OF TABLES
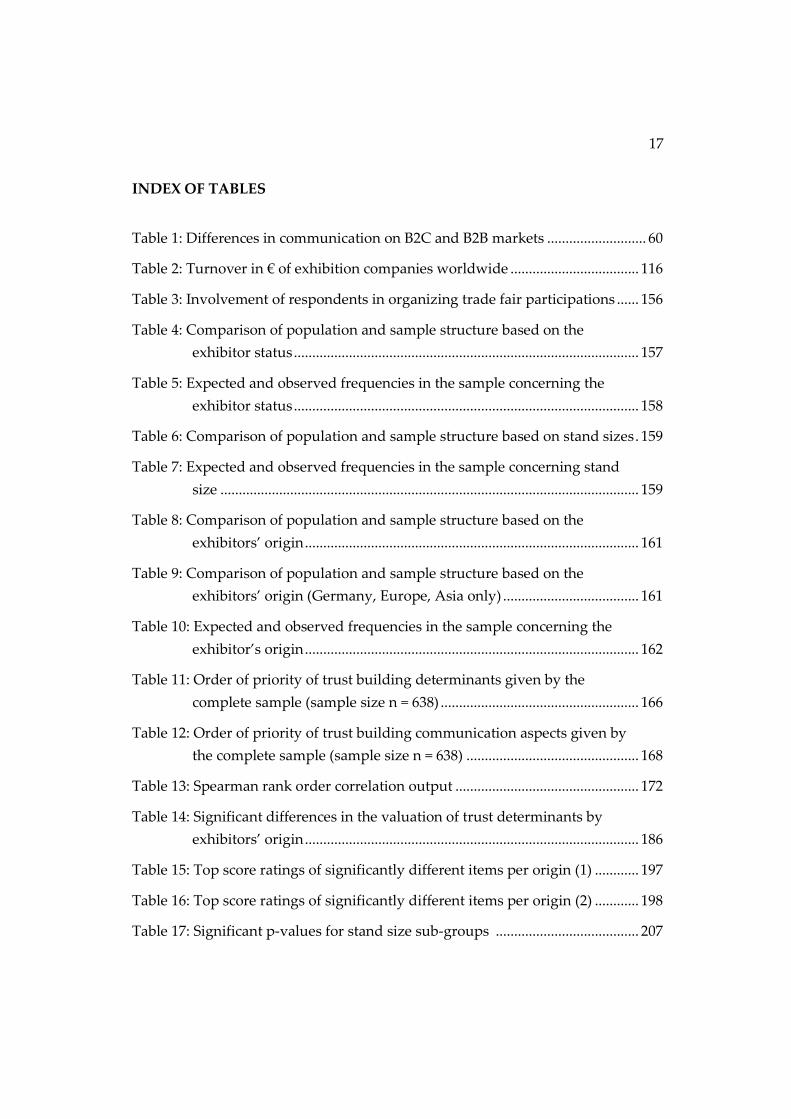
Table 1: Differences in communication on B2C and B2B markets ........................... 60
Table 2: Turnover in € of exhibition companies worldwide ................................... 116
Table 3: Involvement of respondents in organizing trade fair participations ...... 156
Table 4: Comparison of population and sample structure based on the
exhibitor status .............................................................................................. 157
Table 5: Expected and observed frequencies in the sample concerning the
exhibitor status .............................................................................................. 158
Table 6: Comparison of population and sample structure based on stand sizes . 159
Table 7: Expected and observed frequencies in the sample concerning stand
size .................................................................................................................. 159
Table 8: Comparison of population and sample structure based on the
exhibitors’ origin ........................................................................................... 161
Table 9: Comparison of population and sample structure based on the
exhibitors’ origin (Germany, Europe, Asia only) ..................................... 161
Table 10: Expected and observed frequencies in the sample concerning the
exhibitor’s origin ........................................................................................... 162
Table 11: Order of priority of trust building determinants given by the
complete sample (sample size n = 638) ...................................................... 166
Table 12: Order of priority of trust building communication aspects given by
the complete sample (sample size n = 638) ............................................... 168
Table 13: Spearman rank order correlation output .................................................. 172
Table 14: Significant differences in the valuation of trust determinants by
exhibitors’ origin ........................................................................................... 186
Table 15: Top score ratings of significantly different items per origin (1) ............ 197
Table 16: Top score ratings of significantly different items per origin (2) ............ 198
Table 17: Significant p-values for stand size sub-groups ....................................... 207
18
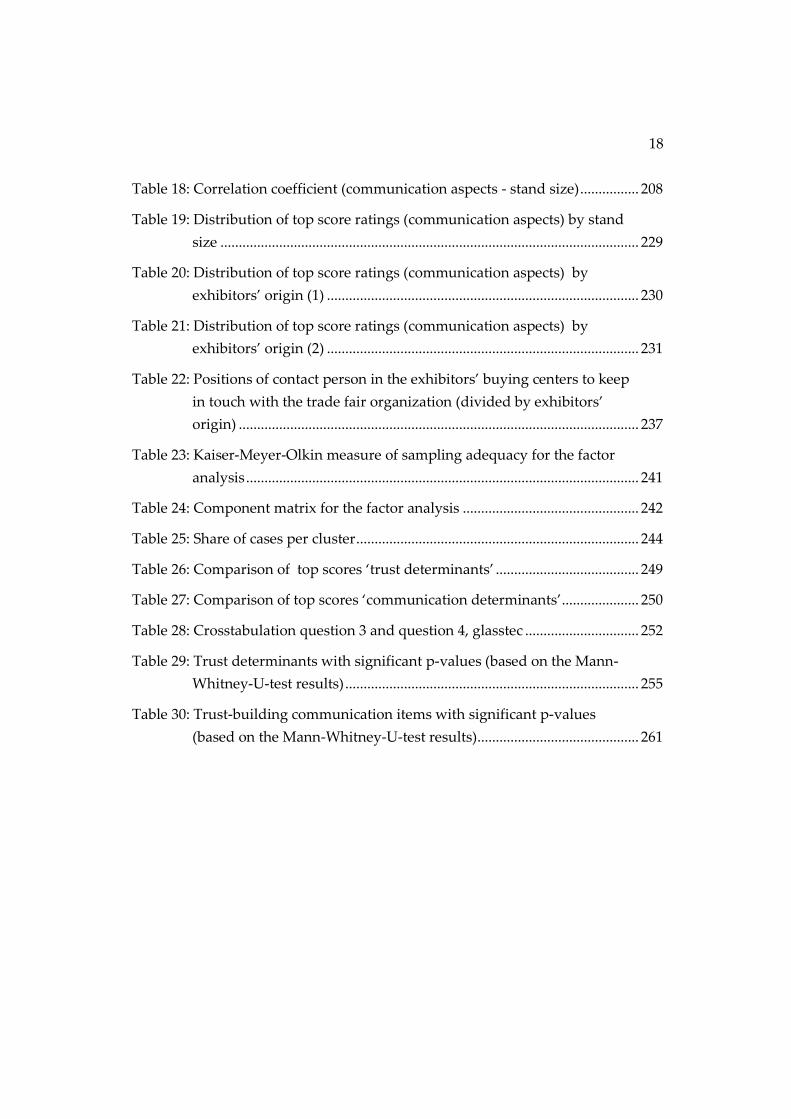
Table 18: Correlation coefficient (communication aspects - stand size) ................ 208
Table 19: Distribution of top score ratings (communication aspects) by stand
size .................................................................................................................. 229
Table 20: Distribution of top score ratings (communication aspects) by
exhibitors’ origin (1) ..................................................................................... 230
Table 21: Distribution of top score ratings (communication aspects) by
exhibitors’ origin (2) ..................................................................................... 231
Table 22: Positions of contact person in the exhibitors’ buying centers to keep
in touch with the trade fair organization (divided by exhibitors’
origin) ............................................................................................................. 237
Table 23: Kaiser-Meyer-Olkin measure of sampling adequacy for the factor
analysis ........................................................................................................... 241
Table 24: Component matrix for the factor analysis ................................................ 242
Table 25: Share of cases per cluster ............................................................................. 244
Table 26: Comparison of top scores ‘trust determinants’ ....................................... 249
Table 27: Comparison of top scores ‘communication determinants’ ..................... 250
Table 28: Crosstabulation question 3 and question 4, glasstec ............................... 252
Table 29: Trust determinants with significant p-values (based on the Mann-
Whitney-U-test results) ................................................................................ 255
Table 30: Trust-building communication items with significant p-values
(based on the Mann-Whitney-U-test results) ............................................ 261

19
ACRONYMS AND ABBREVIATIONS
AUMA Ausstellungs- und Messe-Ausschuss der Deutschen Wirtschaft
e.V. / Association of the German Trade Fair Industry
B2B business-to-business
B2C business-to-consumer
CRM customer relationship management
e.g. exempli gratia
et al. et alii
FAMAB e.V Verband Direkte Wirtschaftskommunikation e.V. / Association for
Direct Business Communication
ISO International Organization for Standardization
NIE New Institutional Economics
p. pages
pp. pages
UFI The Global Association of the Exhibition Industry

MAIKE U. BUSCH 20
21
1 INTRODUCTION
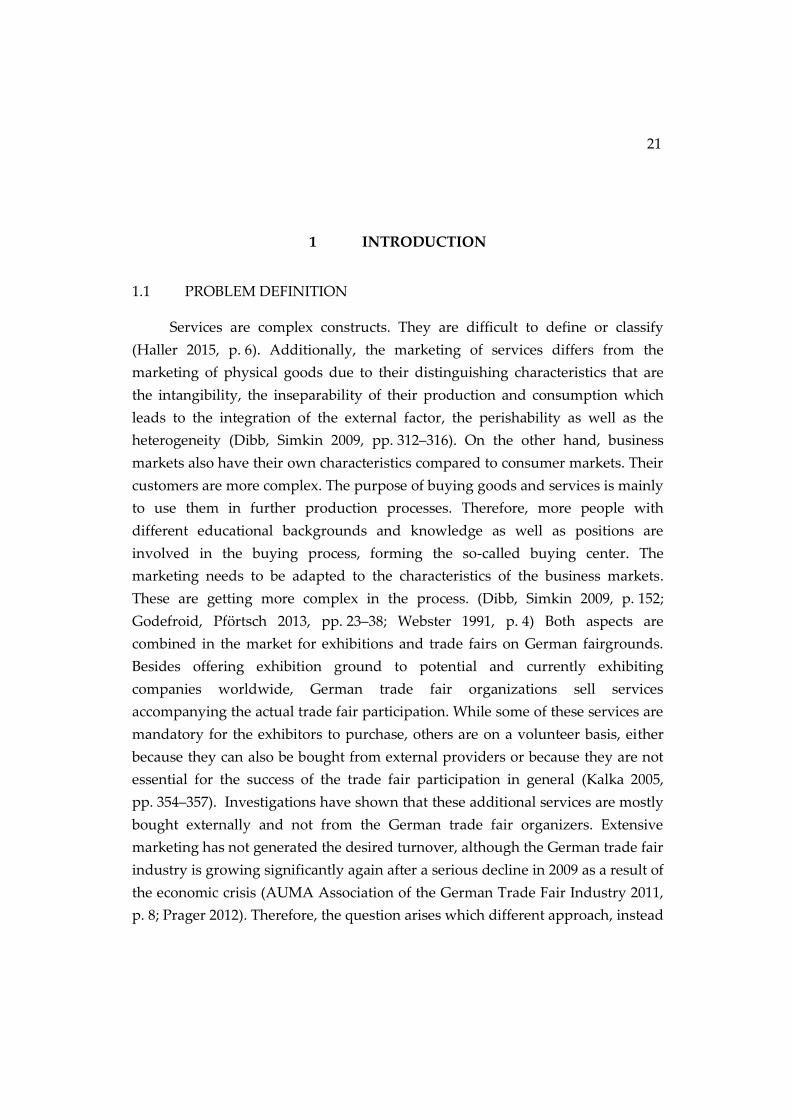
1.1 PROBLEM DEFINITION
Services are complex constructs. They are difficult to define or classify
(Haller 2015, p. 6). Additionally, the marketing of services differs from the
marketing of physical goods due to their distinguishing characteristics that are
the intangibility, the inseparability of their production and consumption which
leads to the integration of the external factor, the perishability as well as the
heterogeneity (Dibb, Simkin 2009, pp. 312–316). On the other hand, business
markets also have their own characteristics compared to consumer markets. Their
customers are more complex. The purpose of buying goods and services is mainly
to use them in further production processes. Therefore, more people with
different educational backgrounds and knowledge as well as positions are
involved in the buying process, forming the so-called buying center. The
marketing needs to be adapted to the characteristics of the business markets.
These are getting more complex in the process. (Dibb, Simkin 2009, p. 152;
Godefroid, Pförtsch 2013, pp. 23–38; Webster 1991, p. 4) Both aspects are
combined in the market for exhibitions and trade fairs on German fairgrounds.
Besides offering exhibition ground to potential and currently exhibiting
companies worldwide, German trade fair organizations sell services
accompanying the actual trade fair participation. While some of these services are
mandatory for the exhibitors to purchase, others are on a volunteer basis, either
because they can also be bought from external providers or because they are not
essential for the success of the trade fair participation in general (Kalka 2005,
pp. 354–357). Investigations have shown that these additional services are mostly
bought externally and not from the German trade fair organizers. Extensive
marketing has not generated the desired turnover, although the German trade fair
industry is growing significantly again after a serious decline in 2009 as a result of
the economic crisis (AUMA Association of the German Trade Fair Industry 2011,
p. 8; Prager 2012). Therefore, the question arises which different approach, instead
MAIKE U. BUSCH 22
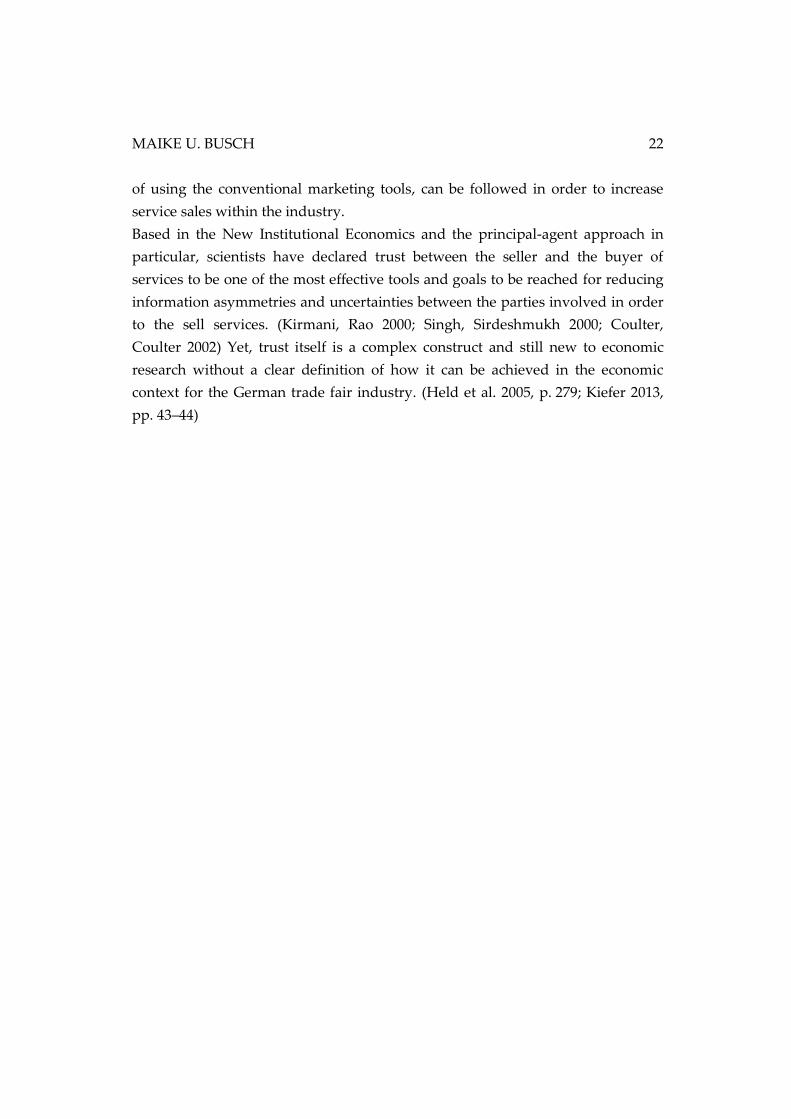
of using the conventional marketing tools, can be followed in order to increase
service sales within the industry.
Based in the New Institutional Economics and the principal-agent approach in
particular, scientists have declared trust between the seller and the buyer of
services to be one of the most effective tools and goals to be reached for reducing
information asymmetries and uncertainties between the parties involved in order
to the sell services. (Kirmani, Rao 2000; Singh, Sirdeshmukh 2000; Coulter,
Coulter 2002) Yet, trust itself is a complex construct and still new to economic
research without a clear definition of how it can be achieved in the economic
context for the German trade fair industry. (Held et al. 2005, p. 279; Kiefer 2013,
pp. 43–44)
INTRODUCTION
23
1.2 DEFINITION OF OBJECTIVES
The main research questions to the survey which are closely connected to each
other can be formulated as:
‘Can German trade fair organizing companies sell services more
effectively by creating trust?’
‘And if so how, can trust be established between the service
provider and his (potential) customer?’
As previous research has found out, the determinants of creating and maintaining
trust can be named, but their degree of importance to reach these goals varies
according to the industry and its customers in focus. (e.g. Ganesan 1994; Doney,
Cannon 1997; Moorman et al. 1992; Kenning, Blut 2006; Sakoa, Helper 1998;
Nienaber, Schewe 2011)
This leads to the following sub-objectives:
• Which trust-building determinants are of high importance for the exhibitors
on German fairgrounds in order to establish trust with the service provider?
• How can these determinants be addressed to ensure a trust-developing
communication between the service provider and his (potential) customer?
MAIKE U. BUSCH 24
1.3 RESEARCH APPROACH
After the problem definition and the illustration of the practical relevance of the
topic, the main research question and sub questions to be answered have been
defined.
The next step to be taken is an extensive literature review. The different facets
linked to the research problem have to be examined and relevant aspects have to
be extracted. Since the setting of the problem is complex, the literature review
focuses on several areas: Service management and marketing, business-to-
business marketing, the theory of the New Institutional Economics with focus on
the principal-agent approach and trust research in the scientific world. The
current state of research is to be determined in these fields. Additionally, the
German trade fair industry with its service offers is to be covered and briefly
portrayed.
The information retrieved from the literature review is then to be funneled and
hypotheses for the proceeding empirical research are to be deduced. Following
the formulation of the hypotheses, their testing needs to be carried out. Therefore,
a primary research is to be conducted among the target group. As a large variety
of different industries meet on German fairgrounds, the target group for this
study at hand has to be narrowed down. Only this way significant results can be
expected. Due to reasons, which will be explained later in this paper, the medical
industry has been chosen to be exemplarily in focus. The glass working sector is
to be examined additionally for comparison. To begin with, the framework
requirements have to be considered and defined, the research method has to be
decided on and developed, followed by the execution of the survey among the
target groups. Based on the survey results, the hypotheses are to be examined
regarding rejection or acceptation. Implementation for theory and the practice
will be given in the end leading to answering of the research question as well as
the sub-questions. Figure 1 illustrates the structure of the research approach.
INTRODUCTION
25
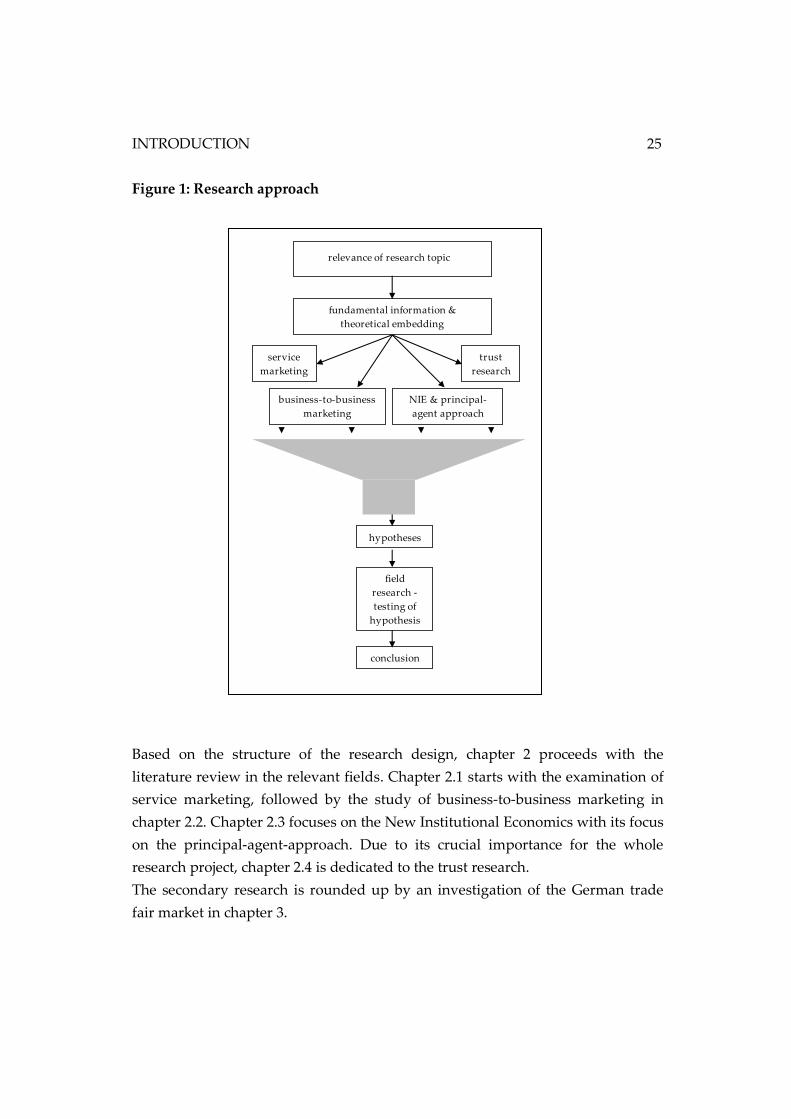
Figure 1: Research approach
Based on the structure of the research design, chapter 2 proceeds with the
literature review in the relevant fields. Chapter 2.1 starts with the examination of
service marketing, followed by the study of business-to-business marketing in
chapter 2.2. Chapter 2.3 focuses on the New Institutional Economics with its focus
on the principal-agent-approach. Due to its crucial importance for the whole
research project, chapter 2.4 is dedicated to the trust research.
The secondary research is rounded up by an investigation of the German trade
fair market in chapter 3.
relevance of research topic
fundamental information &
theoretical embedding
service
marketing
business-to-business
marketing
NIE & principal-
agent approach
trust
research
hypotheses
field
research -
testing of
hypothesis
conclusion
MAIKE U. BUSCH 26
In chapter 4 the previous findings are compiled and the hypotheses for the
proceeding primary research are formed.
Chapter 5 then focuses on the primary research, meaning the data collection. It
explains the research design in detail and also displays the data analysis.
A conclusion of the results and an answer to the research questions are given in
chapter 6. Moreover, the implications for theory are given in consideration of the
limitations of the study. The study ends with the resulting outlook for future
research options.
27
2 LITERATURE REVIEW
2.1 SERVICE MARKETING
Based on the three-sector-theory by Colin Clark (1940), pure economics structures
the production in the markets in three areas: In the primary sector, products or
raw materials are extracted, specifically named are agriculture, forestry and
fishery. The secondary sector deals with the manufacturing of products, as found
in the craft trade sector, including mining and construction. The tertiary sector
focuses on services, such as trade, repairs, communication, social and health care.
Jean Fourastié (1949) used this classification to state his three-sector-hypothesis.
He states that societies develop their economic activities from the first to the
secondary sector leading to a service economy. The tertiary sector then dominates
the economy. (Geißler 2014, p. 185; Bruhn, Meffert 2012, pp. 7–8) Nowadays,
almost 70% of the working population in the EU in employed in the tertiary
sector. (Statistisches Bundesamt (Destatis) 2013, p. 4) This shows its importance in
today’s economy and its need to consider the marketing activities in this area
more closely.
2.1.1 Defining services
Until today, there is no single universally valid definition of the term “service” in
the scientific world. Services are difficult to classify, there is a diverse range of
services available. In addition, it is often difficult to do the separation between the
category of a service and the category of a physical good. (Haller 2015, pp. 6–7)
According to Corsten and Gössinger (2007, p. 21) there are three sorts of
definition approaches: The enumerative definition, the negative definition and the
constitutive definition.
The first, the enumerative definition, specifies the term by listing examples of
services. (Meffert, Bruhn 2009, p. 16) The problem with this kind of definition lies
in the fact that no clear definition is given of what would not be a service.
(Corsten, Gössinger 2007, p. 21) Plus, the list of services would never be complete
MAIKE U. BUSCH 28
due to the heterogeneity of the services, as mentioned above, and in addition new
services are invented steadily. (Decker 1975 as cited in: Haller 2015, p. 6)
The second approach calls for a negative definition by comparing services to
physical goods and stating what is not part of a service. Corsten and Gössinger
(2007, p. 21) call this a “scientific solution of disconcertedness”.
This leaves the third approach, the constitutive definition. The goal of this
definition is to define the characteristics which all services have in common and
then deduct a definition out of it. (Corsten, Gössinger 2007, p. 21) This is still not
the perfect solution since no absolutely clear differentiation to physical goods
could be found, however this seems to be the most useful way up until today.
(Meyer 1994 as cited in: Haller 2015, p. 6) Moreover, this seems to be the only
approach that can later be transferred and used for marketing purposes. (Meffert,
Bruhn 2009, p. 16)
As Haller (2015, pp. 6–9) identifies, although there are different nuances to the
various definitions of the scientists, all definitions include two constitutive
characteristics:
The immateriality (or intangibility)
The integration of an external factor.
These are now taken as a starting point for further research.
Services are immaterial. Some scientists even go as far as calling services
intangible, meaning that the goods can neither be seen, touched, heard, smelled
or tasted nor are they easily defined or understood. (Corsten, Gössinger 2007,
p. 28) Hentschel (1992, p. 26) states that services are products which are mostly
intangible before, during and after the contact of the supplier and the customer.
The fact that consumers cannot see the good makes it most difficult for them.
They cannot evaluate the product before the purchase and therefore have to put
trust in the supplier. (Bruhn, Meffert 2012, pp. 110–111)
However, differentiations can be made in how intangible a service is to the
consumers. True services are services like a consulting service or the service
offered by a language school. (Haller 2015, pp. 8–9) Many services are a
combination of tangible and intangible good to the consumer. Some services only
make sense when they are linked to material goods as also some physical goods
only have an additional value to the customer when connected to a service: A
LITERATURE REVIEW
29
restaurant that offers meals only satisfies the customer when the cook not only
produces a meal virtually, but with real ingredients and food. A plane on the
other hand is not worth its original purpose without including the service of the
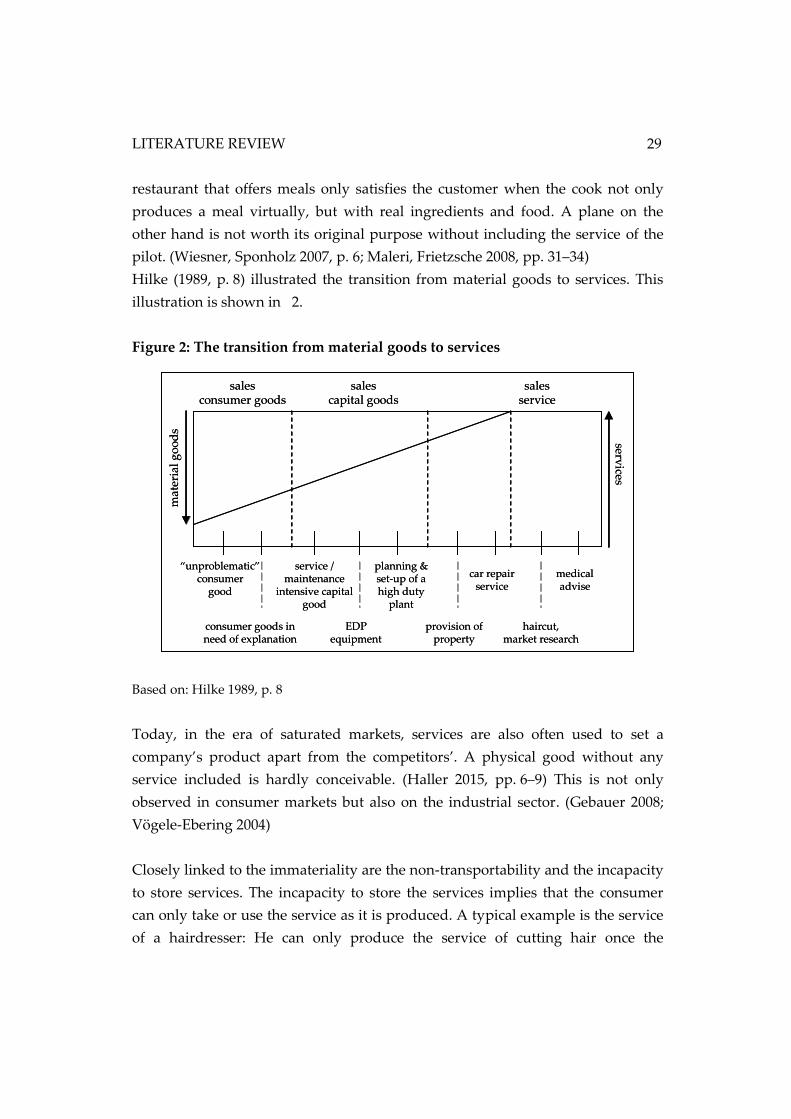
pilot. (Wiesner, Sponholz 2007, p. 6; Maleri, Frietzsche 2008, pp. 31–34)
Hilke (1989, p. 8) illustrated the transition from material goods to services. This
illustration is shown in 2.
Figure 2: The transition from material goods to services
Based on: Hilke 1989, p. 8
Today, in the era of saturated markets, services are also often used to set a
company’s product apart from the competitors’. A physical good without any
service included is hardly conceivable. (Haller 2015, pp. 6–9) This is not only
observed in consumer markets but also on the industrial sector. (Gebauer 2008;
Vögele-Ebering 2004)
Closely linked to the immateriality are the non-transportability and the incapacity
to store services. The incapacity to store the services implies that the consumer
can only take or use the service as it is produced. A typical example is the service
of a hairdresser: He can only produce the service of cutting hair once the
mat
eria
l g
oo
ds
sales consumer goods
sales capital goods
sales service
services
“unproblematic”consumer
good
consumer goods in need of explanation
service / maintenance
intensive capital good
EDP equipment
planning & set-up of a high duty
plant
provision of property
car repair service
haircut, market research
medical advise
MAIKE U. BUSCH 30
customer is present. A preproduction of the service is not possible. The non-
transportability states that the providers of a service and the demand for the
service have to come together. (Meffert, Bruhn 2009, p. 44)
This leads to the second overall characteristic of a service: The integration of the
external factor. The production (as well as the sale) of the service can only take
place if a demander and/or an item that belongs to him are involved in the
production process. (Engelhardt 1990, pp. 280–281) A service is provided directly
towards a demander of it, like schooling or a haircut. Alternatively, there are also
services that are asked for by a person yet the service is provided on an object that
belongs to the customer. Examples could be a treatment of the customer’s dog,
executed by the veterinarian, or a repair service of the customer’s car. The objects
stay in the ownership of the customer before, during and after the process of the
service. This fact is a criterion for delimiting services from physical goods. When
physical goods are produced some kinds of raw materials are usually integrated
in the produced item. These raw materials are in the belonging of the producer
and are owned by the customer only after the production is done and paid for.
(Haller 2015, pp. 7–8)
Maleri and Frietzsche (2008, pp. 169–170) expound in their work that the degree
of involvement of the external factor is dependent on the sort of service. A
mailman can deliver the customer’s mail highly independently. All he needs are
the person who handed the letter over to the mail and a receiving address. A
florist needs someone to call or enter the shop to order the bouquet and to state
his wishes for the composition. When offering a language course, however, the
customer must get deeply involved himself in order to get a satisfying result in
the end.
Therefore, not only the provider of the service is responsible for the success of a
service. The customer is always involved to some extent. This makes a
standardization of service-categories very difficult. Moreover, especially due to
the integration of the customer into the process, the levels of quality are uneasily
defined. (Haller 2015, p. 8)
Going further into detail, the so-called uno-actu-principle falls into focus. It
affirms that the services are consumed at the same time as they are produced.
LITERATURE REVIEW
31
Different scientists have different opinions on how this principle evolves or what
it includes in detail. Corsten and Gössinger (2007, p. 139) define it as a result of
the need to integrate the external factor Bruhn and Meffert (2012, pp. 58–59) call it
an obvious development of the immateriality. Haller states that service-
performance is fugacious, since it is not storable. However, Haller (2015, pp. 8–9)
as well as Meffert and Bruhn (2009, p. 44) call for Frietzsches definition
(Frietzsche 2001, S. 131ff): The production of the service can only be carried out if
the provider as well as the consumer, meaning the internal as well as the external
factor, get together. The selling or the consumption can also be earlier or later:
Before starting a vacation, flights and hotel accommodation have been booked
and paid for in advance. The flight or the accommodation is used later. The
medical treatment, like a vaccination, provides a benefit for the customer even
after the injection. (Frietzsche, Scheuch 2001, pp. 107–149)
And there are exceptions to the rule: If the concert can be saved on a digital
advice, for example, it can be carried to another place and listened to at a different
time. However, it is then seen as a physical good, as a CD. The performance itself
still does not belong to the customer. (Haller 2005, p. 9)
As a result of these characteristics, problems or challenges develop. Due to the
missing suitability for storage, there has to be a just-in-time-production.
Therefore, a very well organized coordination of production capacities and
demand has to be established. Capacities have to be flexible and sudden demands
have to be handled. In the aviation business, for example, there can be times
when flights are half empty; however, during summer vacation, there are
sometimes not enough seats. Solutions have to be found to keep the costs
reasonable and to keep the customers satisfied. (Meffert, Bruhn 2009, pp. 44–45)
Since services are not transportable, the provider has to find a way to the
customer. Often this is done by establishing subsidiaries. These, however, are not
always easily controlled and, therefore, do not show the same quality standards
as the original provider. (Haller 2015, p. 20) So, the provider has to be present in
order to stay competitive. (Meffert, Bruhn 2009, p. 45)
As mentioned above, the immateriality makes it also difficult to evaluate the good
before using it. The consumer cannot evaluate his haircut before he gets it;
therefore, the service provider has to get it right the first time. And while
MAIKE U. BUSCH 32
providing the service he should convince the customer of his abilities in order to
create trust by the customer. (Haller 2015, pp. 20–22)
The integration of the external factor can lead to difficulties, but also to positive
aspects. The involvement of the demander provides a “volunteer-co-worker”.
Depending on the degree of involvement, he can take over bigger tasks (like
getting his own food in self service) or smaller tasks (providing first ideas of how
to design the new kitchen). (Haller 2015, pp. 19–20)
This leads to additional issues: As every customer has own ideas, the services one
company offers are very difficult to standardize. Moreover, the consumer often
does not express all his wishes or cannot articulate his ideas well; or the provider
does not clearly display his abilities. These aspects lead to asymmetric
distribution of information between both parties involved. (Lehmann 1998,
pp. 63ff; Meffert, Bruhn 2009, p. 43) A risk of dissatisfying one side is high.
(Meffert, Bruhn 2009, pp. 42–43; Haller 2015, pp. 17–22)
Progressing from the constitutive approach of a service-definition, services can
furthermore be divided into three phases that all have their own characteristics
(Corsten, Gössinger 2007, pp. 22–25):
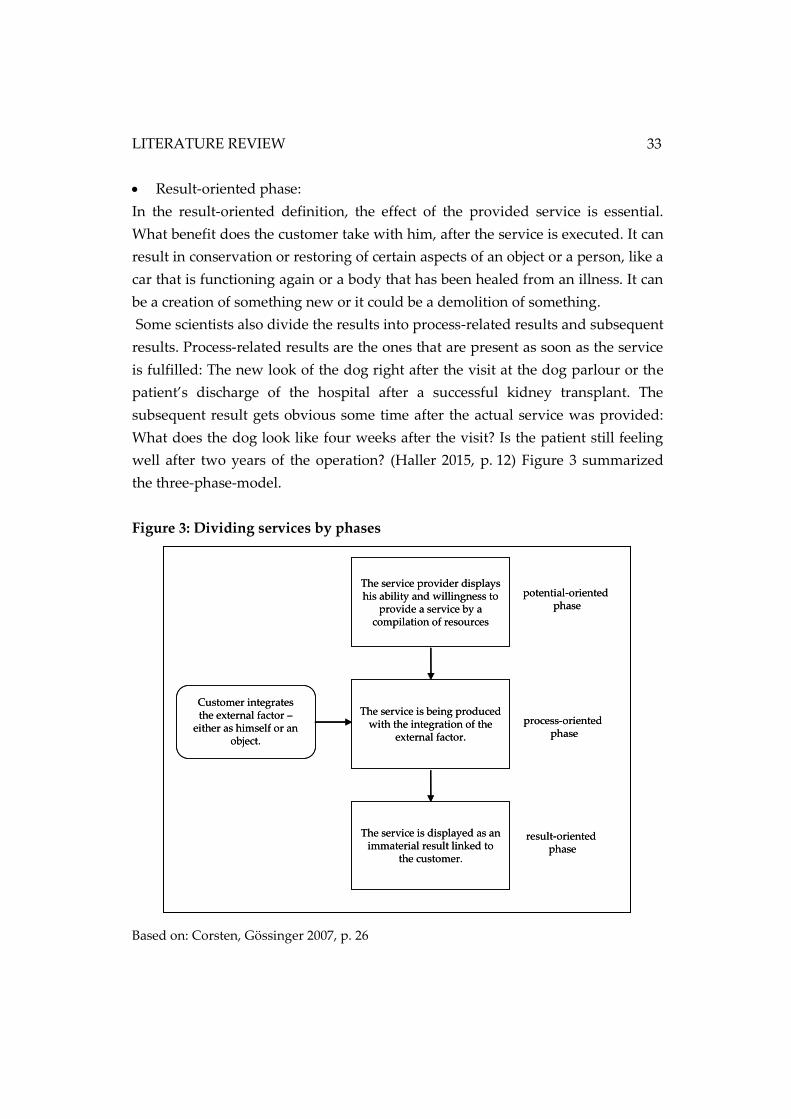
Potential-oriented phase:
In this phase or definition, the provider of a service displays his ability and
willingness to provide a certain service. He has the mental power and knowledge.
However, the provider is not only capable of operating the service but also has
the tools needed. For example, the hairdresser has a shop, scissors, a chair to sit
on and so on. The provider of hotel accommodation has a house with different
rooms and beds. Thus, in this phase the internal factor is most important.
Process-oriented phase:
When it comes to the process-oriented phase, the external factor comes into
action. Someone is demanding a service. According to Berekoven (1983, p. 23) this
is the phase where the actual service is produced. The external factor asks for a
service and offers its information so that the provider can start the service
production and fulfill it. As an example: The customer enters a hairdresser’s shop,
the hairdresser and the customer talk about the way, the customer would like his
hair to be done, and the hairdresser will carry out his task accordingly.
LITERATURE REVIEW
33
Result-oriented phase:
In the result-oriented definition, the effect of the provided service is essential.
What benefit does the customer take with him, after the service is executed. It can
result in conservation or restoring of certain aspects of an object or a person, like a
car that is functioning again or a body that has been healed from an illness. It can
be a creation of something new or it could be a demolition of something.
Some scientists also divide the results into process-related results and subsequent
results. Process-related results are the ones that are present as soon as the service
is fulfilled: The new look of the dog right after the visit at the dog parlour or the
patient’s discharge of the hospital after a successful kidney transplant. The
subsequent result gets obvious some time after the actual service was provided:
What does the dog look like four weeks after the visit? Is the patient still feeling
well after two years of the operation? (Haller 2015, p. 12) Figure 3 summarized
the three-phase-model.
Figure 3: Dividing services by phases
Based on: Corsten, Gössinger 2007, p. 26
The service provider displays his ability and willingness to
provide a service by a compilation of resources
The service is being produced with the integration of the
external factor.
The service is displayed as an immaterial result linked to
the customer.
Customer integrates the external factor –
either as himself or an object.
process-oriented phase
result-oriented phase
potential-oriented phase
MAIKE U. BUSCH 34
Recapitulating the previous findings, the impossibility of one precise definition of
the term ‘service’ becomes obvious. The terms differ in the degree of involvement
of the external factor, they are difficult to set apart from physical goods, and their
results can be (partly) material or immaterial.
However, all attempts that scientists made to explain it combine the following
aspects:
Services show a great heterogeneity.
All services contain certain characteristics, such as the integration of the
external factor or the immateriality to a certain degree.
Services have constitutive phases.
2.1.2 Performance-models of services
Since services are so difficult to define clearly, a large number of models to cluster
services into groups have been developed. Many of them use the factor of
performance as basis for the clustering. Some of the most cited models are
displayed in this subchapter.
Nelson (1970) defines that there are two ways customers can inherit information
about a product in order to evaluate it and its performance: The customer can
either search for information prior to the purchase or he can evaluate it after the
purchase based on the experiences he made with the good. Which kind of
information search he uses depends on the costs (also measured by the time) that
arise for the search. If the costs for getting enough information in order to
evaluate are too high, the customer will judge on the experience after the use.
Darby and Karni (1973) expand Nelson’s model by a third characteristic: Some
goods can neither be clearly evaluated by searched information nor by
experiences. Some goods can only be trusted in their level of performance. These
goods have then a high level of credence qualities, also called trust qualities.1
Then Weiber and Adler (1995) developed the information economics triangle. In
this scheme search, experience and credence qualities are combined in a three-
1 See also: Essig, Amann 2013, pp. 424–425.
LITERATURE REVIEW
35
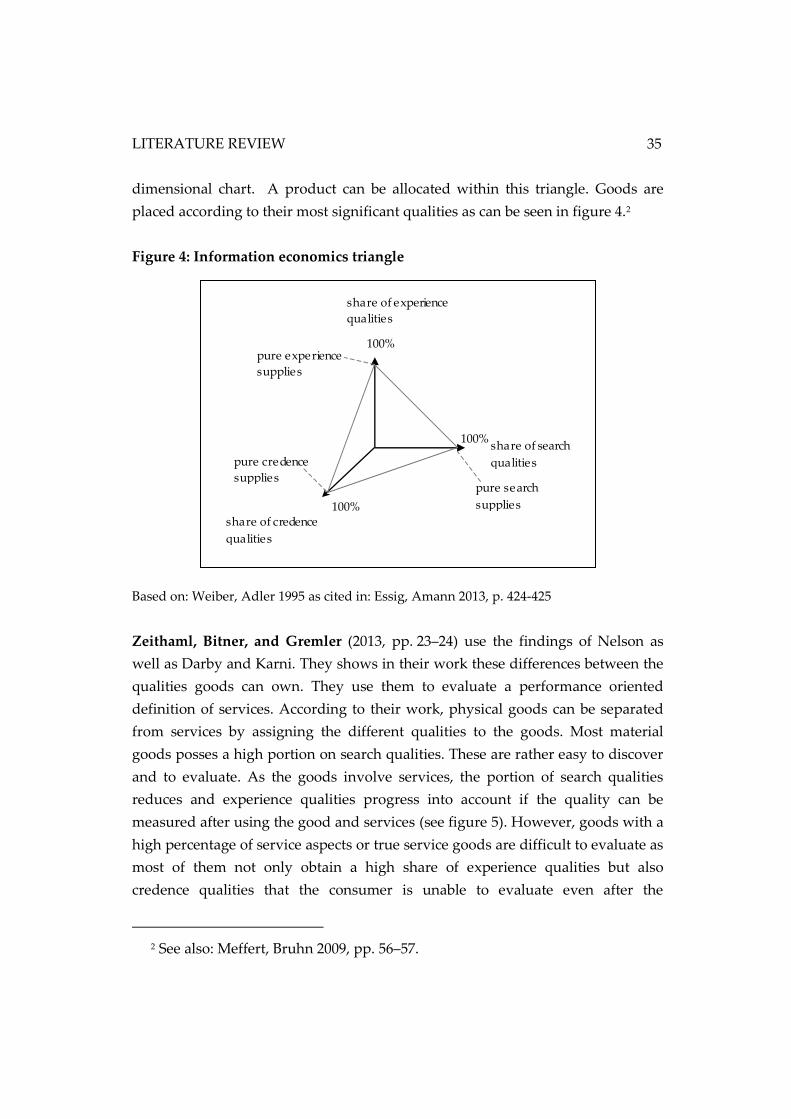
dimensional chart. A product can be allocated within this triangle. Goods are
placed according to their most significant qualities as can be seen in figure 4.2
Figure 4: Information economics triangle
Based on: Weiber, Adler 1995 as cited in: Essig, Amann 2013, p. 424-425
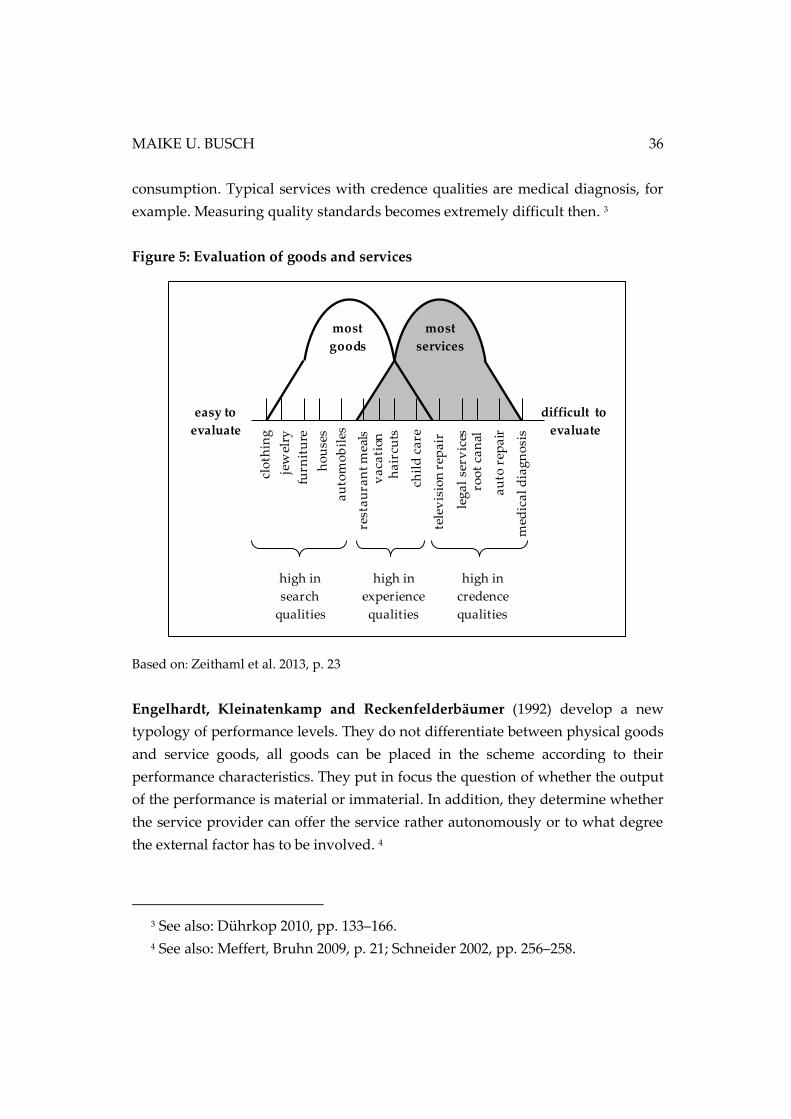
Zeithaml, Bitner, and Gremler (2013, pp. 23–24) use the findings of Nelson as
well as Darby and Karni. They shows in their work these differences between the
qualities goods can own. They use them to evaluate a performance oriented
definition of services. According to their work, physical goods can be separated
from services by assigning the different qualities to the goods. Most material
goods posses a high portion on search qualities. These are rather easy to discover
and to evaluate. As the goods involve services, the portion of search qualities
reduces and experience qualities progress into account if the quality can be
measured after using the good and services (see figure 5). However, goods with a
high percentage of service aspects or true service goods are difficult to evaluate as
most of them not only obtain a high share of experience qualities but also
credence qualities that the consumer is unable to evaluate even after the
2 See also: Meffert, Bruhn 2009, pp. 56–57.
share of experience qualities
share of search qualities
share of credence qualities
pure experience supplies
pure search supplies
pure credence supplies
100%
100%
100%
MAIKE U. BUSCH 36
consumption. Typical services with credence qualities are medical diagnosis, for
example. Measuring quality standards becomes extremely difficult then. 3
Figure 5: Evaluation of goods and services
Based on: Zeithaml et al. 2013, p. 23
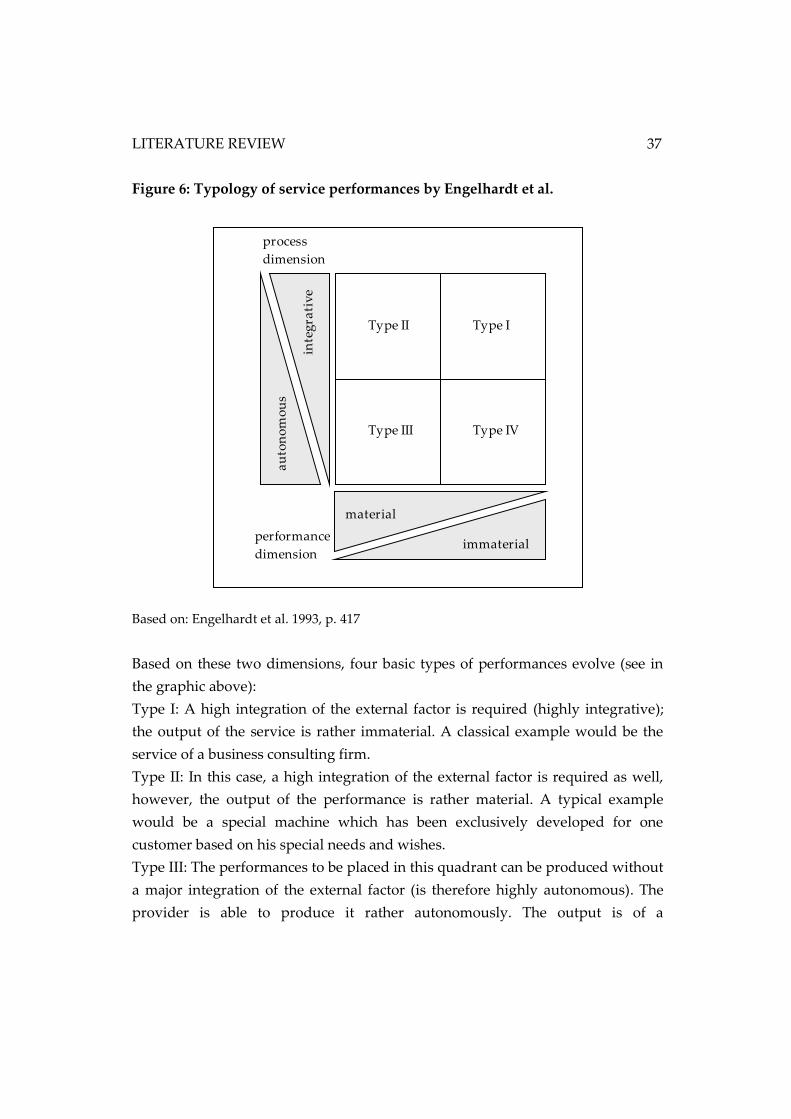
Engelhardt, Kleinatenkamp and Reckenfelderbäumer (1992) develop a new
typology of performance levels. They do not differentiate between physical goods
and service goods, all goods can be placed in the scheme according to their
performance characteristics. They put in focus the question of whether the output
of the performance is material or immaterial. In addition, they determine whether
the service provider can offer the service rather autonomously or to what degree
the external factor has to be involved. 4
3 See also: Dührkop 2010, pp. 133–166.
4 See also: Meffert, Bruhn 2009, p. 21; Schneider 2002, pp. 256–258.
most goods
most services
easy to evaluate
difficult to evaluate
clo
thin
g
jew
elry
fu
rnit
ure
ho
use
s
au
tom
ob
iles
rest
au
ran
t m
eals
v
aca
tion
h
air
cuts
chil
d c
are
tele
vis
ion
rep
air
leg
al
serv
ices
ro
ot
can
al
au
to r
epa
ir
med
ica
l d
iag
no
sis
high in search
qualities
high in experience qualities
high in credence qualities
LITERATURE REVIEW
37
Figure 6: Typology of service performances by Engelhardt et al.
Based on: Engelhardt et al. 1993, p. 417
Based on these two dimensions, four basic types of performances evolve (see in
the graphic above):
Type I: A high integration of the external factor is required (highly integrative);
the output of the service is rather immaterial. A classical example would be the
service of a business consulting firm.
Type II: In this case, a high integration of the external factor is required as well,
however, the output of the performance is rather material. A typical example
would be a special machine which has been exclusively developed for one
customer based on his special needs and wishes.
Type III: The performances to be placed in this quadrant can be produced without
a major integration of the external factor (is therefore highly autonomous). The
provider is able to produce it rather autonomously. The output is of a
process
dimension
Type II
Type III Type IV
Type I
au
ton
om
ou
s
performance dimension
inte
gra
tiv
e
material
immaterial
MAIKE U. BUSCH 38
materialistic nature. Products of mass production or reproduction of certain
goods could be placed here.
Type IV: The performance can be carried out autonomously by the provider, the
result is rather immaterial. Data bank service can be named as an example.
(Engelhardt et al. 1993)5
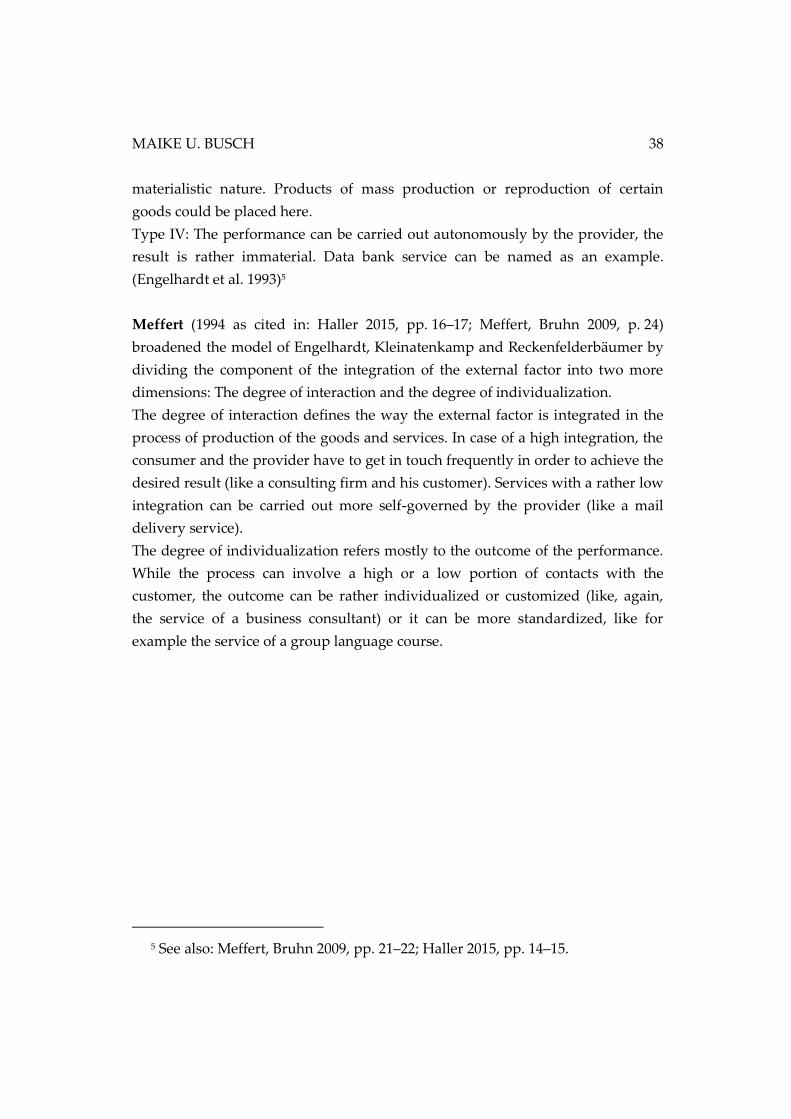
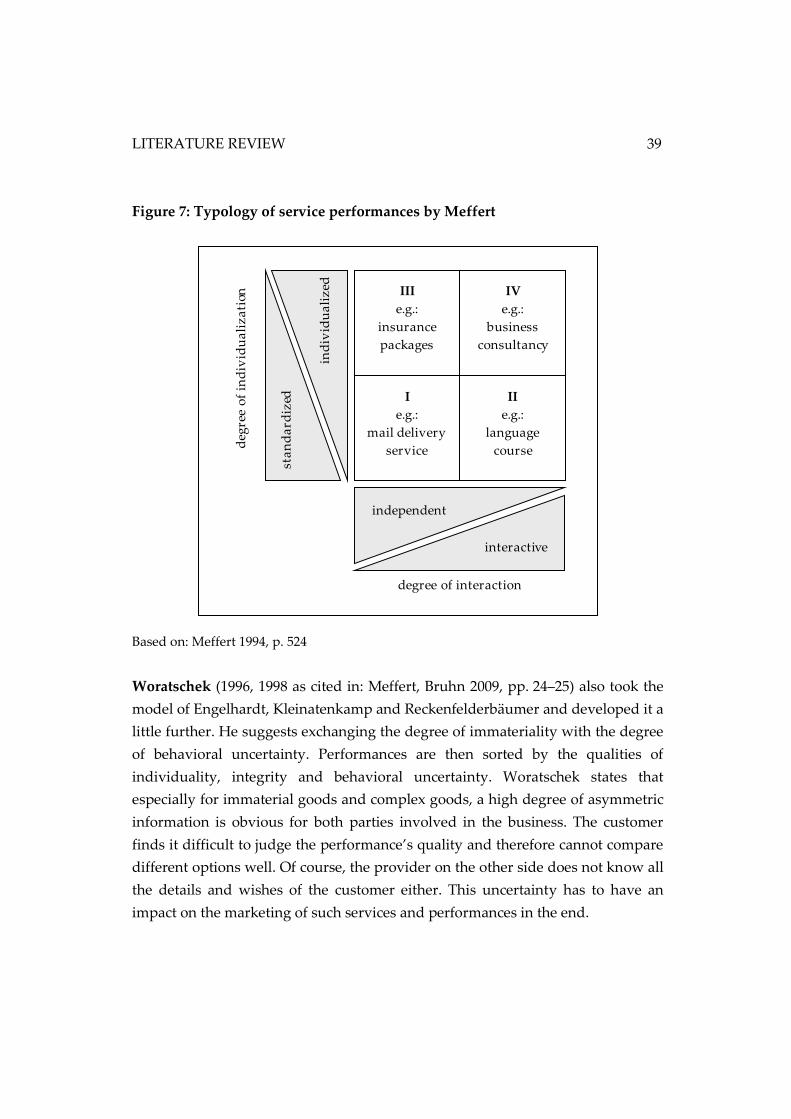
Meffert (1994 as cited in: Haller 2015, pp. 16–17; Meffert, Bruhn 2009, p. 24)
broadened the model of Engelhardt, Kleinatenkamp and Reckenfelderbäumer by
dividing the component of the integration of the external factor into two more
dimensions: The degree of interaction and the degree of individualization.
The degree of interaction defines the way the external factor is integrated in the
process of production of the goods and services. In case of a high integration, the
consumer and the provider have to get in touch frequently in order to achieve the
desired result (like a consulting firm and his customer). Services with a rather low
integration can be carried out more self-governed by the provider (like a mail
delivery service).
The degree of individualization refers mostly to the outcome of the performance.
While the process can involve a high or a low portion of contacts with the
customer, the outcome can be rather individualized or customized (like, again,
the service of a business consultant) or it can be more standardized, like for
example the service of a group language course.
5 See also: Meffert, Bruhn 2009, pp. 21–22; Haller 2015, pp. 14–15.
LITERATURE REVIEW
39
Figure 7: Typology of service performances by Meffert
Based on: Meffert 1994, p. 524
Woratschek (1996, 1998 as cited in: Meffert, Bruhn 2009, pp. 24–25) also took the
model of Engelhardt, Kleinatenkamp and Reckenfelderbäumer and developed it a
little further. He suggests exchanging the degree of immateriality with the degree
of behavioral uncertainty. Performances are then sorted by the qualities of
individuality, integrity and behavioral uncertainty. Woratschek states that
especially for immaterial goods and complex goods, a high degree of asymmetric
information is obvious for both parties involved in the business. The customer
finds it difficult to judge the performance’s quality and therefore cannot compare
different options well. Of course, the provider on the other side does not know all
the details and wishes of the customer either. This uncertainty has to have an
impact on the marketing of such services and performances in the end.
deg
ree
of
ind
ivid
ua
liz
ati
on
degree of interaction
sta
nd
ard
ized
ind
ivid
ua
liz
ed
independent
interactive
III e.g.:
insurance
packages
IV e.g.:
business
consultancy
I e.g.:
mail delivery
service
II e.g.:
language
course
MAIKE U. BUSCH 40
All attempts stated above try to define services more clearly. However, it becomes
obvious, that although there are distinct differences between material goods and
services, there is no approach which distinguishes and separates services totally
from physical products. Most goods offered on markets today are bundles of
services interconnected with other goods. (Burr, Stephan 2006, p. 23)
So based on these facts, consequences regarding marketing activities for service
offers can be determined.
2.1.3 Significant aspects of service marketing
Based on the service characteristics as well as the findings regarding the
performance level approaches, service marketing calls for special considerations.
Modifications to the traditional marketing mix by McCarthy (1960, pp. 208–668)
consisting of product (e.g. physical good, packaging, branding), place (e.g.
distribution channels, storage, transportation), promotion (e.g. advertising, sales
promotion), and price (e.g. price levels, discounts) need to be made. (Groucutt et
al. 2004, p. 17) Due to the characteristics of services in general, the marketing mix
needs to be extended by the aspects of people, physical evidence and process.
(Zeithaml et al. 2013, pp. 24–27)
All three factors take their share of including the external factor and facing the
credence qualities of the goods offered. They all consider the intangibility, the
heterogeneity, the perishability and the simultaneous production and
consumption (Zeithaml et al. 2013, pp. 26–27):
• The factor “people” includes not only the people inside the service providing
company, but also the customers. Both sides bring in their level of experience,
their motivation as well as their willingness to cooperate, for example.
• The factor “physical evidence” is built on the intangibility. A physical
surrounding has to be established to be linked to the service itself and to make
it more concrete for the customer. This might be the facility design or reports
offered by the service provider.
LITERATURE REVIEW
41
• The factor “process” considers the level of standardization, the involvement
of the customer and the work flow while producing and consuming the
services at the same time.
However, the most crucial aspect in marketing services is to reduce the risk a
customer takes when purchasing a service as a result of uncertainties. (Fliess 2009,
pp. 158–165) Recalling the information economics tringle grounded on the
findings by Nelson, Darbi and Karny, Weiber and Adler6 the issue can be
approached by the information economics perspective. Buying but also selling
service goods contains a high degree of credence qualities. As a result, an
information asymmetry between seller and buyer regarding wants and needs but
also the seller’s possibilities and offers is generally present.7 Therefore, the main
goal ought to be the reduction of the uncertainties in the selling and buying
process. Often cited actions are signaling, screening as well as establishing a
strong buyer-seller relationship. (Fliess 2009, pp. 165–173)
When signaling one party involved actively offers information to the other party.
Generally, this originates from the seller signaling information about his work, his
services or his performances to the potential buyer in order to reduce the
uncertainties on the purchaser’s side. For signaling, the seller can use various
communication tools through which he hopes to reach his clients. Which tools
and channels are most effective depends on the target customer and his routines
when searching for information. (Kotler, Armstrong 2014, pp. 176–177; Blackwell
et al. 2006, pp. 75–76) Based on the previous assumption of the information
economics triangle, a service might contain each of the three qualities. Therefore,
the seller should discover ways to directly address these. Addressing the search
qualities, the seller needs to establish a communication that reaches the potential
client. He can place advertisements in magazines the potential customer reads. He
can also provide flyers or folders showing previous results of his work or the
company in order to produce physical evidence, for example. (Fliess 2009,
pp. 170–171) However, as Hopf (1983) points out, such activities include new
6 See chapter 2.1.2. 7The issue of information economics as part of the New Institutional
Economics is broached in chapter 2.3.3.4 in detail.
MAIKE U. BUSCH 42
experience and trust qualities which need to be verified by the customer himself
again.
Regarding experience qualities, Fliess (2009, pp. 172–173) advises sellers to use
references from other customers. Existing customers can be asked to share their
positive experiences with the service provider as testimonials. Moreover, they can
be asked to attract new customers through offering incentives, for example.
However, the credibility of the testimonial or reference customer is essential and
needs to be ensured beforehand. In addition, sellers can offer ways to let potential
customers gain experiences themselves, e.g. through workshops or open days.
The third category refers to the credence qualities of services. Here, testing by
independent agencies offer risk-reducing sources of information to potential
buyers. Same goes for the aspect of reputation a service provider has in the
industry or among other customers. Offering guaranties can reduce the perceived
risk, as the purchaser can share the risk with the provider. Moreover, establishing
a solid brand name and certifications can support the buyers positive attitude
towards a provider. (Fliess 2009, p. 173; Rao 2007, pp. 142–145; Bruhn 2006, p. 385)
So, based on the information economics approach, the seller has many ways to
reduce the perceived risk and the uncertainties for the potential seller.
Nevertheless, the seller always has to balance the cost for the signaling against the
usefulness for the intended purpose. (Fliess 2009, pp. 167–168)
Screening on the other hand involves the active search of information of one
party in the buyer-seller relationship. Again, both sides can screen the other. A
seller might screen the information the buyer, as external factor, offers regarding
his wishes and needs. On the other hand, the client can search the market to find
the right provider. If the potential buyer is screening the market, he searches for
information provided as stated in the paragraph above. He looks for trustworthy
sources to gain more information and to reduce his information asymmetry
concerning the providers of services he needs. (Fliess 2009, pp. 168–169)8
8 More details on signaling and screening are also be provided in chapter
2.3.4.3.
LITERATURE REVIEW
43
A third approach can be the focusing on building and establishing a strong
business relationship between seller and buyer. The transition from focusing
mainly on transactions to a relationship-oriented business world has been
established in the industrial world. Companies submit themselves to long-term
commitments and efforts in order to build and maintain strong and sustainable
business relationships. As earnings they get rewarded with partners as customers.
(Webster 1992)
While the primary goal of relationship marketing is “to build and maintain a base of
committed customers who are profitable for the organization” (Zeithaml et al. 2013,
p. 152), Zeithaml, Bitner and Gremler (2013) state several benefits for both
customers and service providers when strengthening the relationships between
each other:
For customers it is much easier to have confidence in a service provider they have
a functioning business relationship with. This fact links back to the credence
qualities of services and the importance of building trust. The authors name this
aspect the most important benefit for customers, relying on scientific studies.
Additionally, social benefits should not be neglected which develop when the
customer and his contact at the supplying firm become acquainted with each
other. Especially in business-to-business relationships this can be an advantage.
However, in case the employee leaves the company, this can easily turn into a
disadvantage as well. The third benefit for customers mentioned are possible
deals and discounts as well as a privileged treatment. (Zeithaml et al. 2013,
pp. 153–154)
The service provider on the other hand also profits from a strong relationship.
Increased purchases and a willingness to pay higher prices are referred to as
economic benefits. Plus, maintaining existing customers is regarded less
expensive than attracting new ones while existing customers might also tend to
spread the word-of-mouth messages, saving advertising costs for the company.
Due to the integration of the external factor, a loyal customer can furthermore be
regarded as an “additional” employee who shows involvement and simplifies the
cooperation between customer and supplier. Moreover, customers with a solid
business relationship to their service provider tend to have a more realistic view
on the possibilities the provider has in performing his service, saving time and
effort concerning discussions for the employee of the providing company. As a
MAIKE U. BUSCH 44
result, employee retention is likewise supported due to a higher degree of
satisfaction. (Zeithaml et al. 2013, pp. 154–156; Bruhn 2009, pp. 22–31)
2.1.4 Market services internationally
Since the 1980s there is an increasing international business competition in the
markets. Markets are changing and the requirements of the markets are changing
as well. Companies need to consider joining the globalization and the
international competition to keep a strong position in the markets. Globalization
in the markets started out mainly with material goods – but by now, also services
are sold and marketed internationally. (Meffert, Bruhn 2009, p. 443; Zentes et al.
2013, p. 1; Keegan, Green 2013, p. 60)
When marketing services internationally, the basic characteristics of services
themselves stay valid. However, certain aspects of the characteristics might have
to be considered in more detail. (Meffert, Bruhn 2009, pp. 449–452; Keegan, Green
2013, pp. 32–39; Usunier, Lee 2009, p. 85)
Considering the immateriality of services and their non-transportability as well as
their incapacity of being stored9, a way has to be found to distribute the goods
and services to the customer and out into the international market. (Meffert,
Bruhn 2009, p. 452) This can either be done by the company itself or through the
distribution channels of local partners. (Meffert, Bruhn 2009, pp. 441–447; Keegan,
Green 2013, pp. 248–304) Nevertheless, the quality aspect has to be put in focus.
While it should be the overall goal to offer the same quality everywhere, there
might be different expectations according to different regions. Plus there might be
different price levels which all might lead to a variation in price-performance-
expectations among the customers. (Meffert, Bruhn 2009, p. 451; Usunier, Lee
2009, pp. 220–233)
Although the scientific knowledge of the so called country of origin-effect is still
rather limited, it should be mentioned in this context. The county of origin-effect
tries to define the influence that the good’s or service’s origin has on a customer’s
perception and attitude towards it. Images of countries are often defined by
9 See chapter 2.1.1.
LITERATURE REVIEW
45
stereotypes such as the assumption that cars manufactured by a German brand
are reliable, consumer electronics manufactured in Japan are innovative or goods
produced in China are often of cheap quality. The images of a country are
therefore often transmitted to the products and services manufactured in the
corresponding country. But not only the image, the potential customer has of the
producer’s origin, matters. The people selling the product, the product itself and
also the selling situation might have an impact on the country of origin-effect.
(Mai, 2011) Yet, although the knowledge about the impact is limited, several
authors indicate the possibility to effectively integrate the country image in the
communication policy or in the pricing policy of internationally acting
companies. (Onkvisit, Shaw 2004, p. 477; Stauss 1995, p. 464)
Equally important is the integration of the external factor. The customer as
external factor stays in touch with the employee of the supplying firm. This
employee should be qualified and well-informed about the customer’s origin and
the cultural differences or similarities between the supplier’s and the customer’s
country (Berry, Parasuraman 2000). Rizal, Jeng and Chang (2015) even go a step
further in their research and state that not only their country origin is important.
In some regions, even the ethical background has to be considered. Furthermore,
Sichtman and von Selasinsky (2009) point out the even greater importance to
build trust in international business relationships than in regional ones.
So concluding the aspect of international service marketing, the service provider
has to be aware of his own origin as well as the potential customer’s. This way, he
can better promote and market his services internationally and can take an active
role in building and maintaining a strong customer-seller relationship.10
Recapitulating the findings on service marketing, it is first of all essential to
realize that there is no distinct definition for services. The embodiment of services
can vary significantly. However, to some extent at least, all services are
immaterial and call for the integration of an external factor during the production.
Furthermore, services are difficult to standardize in most cases, which, of course,
10 Further details on specific cultural differences per region are neglected here
as they have limited additional value to the investigation at this point. The issue is
picked up again within the primary research.

MAIKE U. BUSCH 46
is also partly due to the integration of the external factor. Therefore, marketing
services requires some attention to certain characteristics, one of them surely the
relationship between the service provider and his (potential) customer.
LITERATURE REVIEW
47
2.2 BUSINESS-TO-BUSINESS MARKETING
2.2.1 Defining business markets and business-to-business marketing
Industrial goods are goods that are produced for and sold to industrial and
institutional customers. These are for example manufacturing firms, wholesalers,
retailers, governments, hospitals or educational institutions. They use the
purchased goods for their own production in contrast to end consumers who
purchase goods for their own consumption or use. (Webster 1991, p. 4) This
definition, however, neglects some areas like for example services which are
offered from one organization to another. Therefore, in today’s scientific
literature, the term ‘business-to-business marketing’ (B2B marketing) is more and
more used on this matter. B2B marketing focuses then on all areas of marketing
which do not address the end consumer directly. It includes all industries,
reselling businesses, service providers as well as governmental and institutional
organizations that do business with other companies and organizations. (Eckardt
2010, p. 1; Zimmerman, Blythe 2013, pp. 23–27; Godefroid, Pförtsch 2013, p. 23)
Compared to consumer goods, industrial goods or B2B-transactions also call for
different kinds of management and marketing approaches due to the
characteristics of the customers on these markets and the markets themselves.
Pfötsch and Godefroid define several areas in which business-to-business markets
differ from consumer markets (Godefroid, Pförtsch 2013, pp. 23–26) 11 12:
Structure of the markets: Business markets are mainly deeper segmented than
consumer markets. There are fewer sellers but also fewer customers in each
segment as they are often very specialized in their demand and offers.
11 For this section also see: Zimmerman, Blythe 2013, pp. 7–9; Shepherd 2012,
pp. 58–59; Doyle 2011, pp. 58–69; Eckardt 2010, pp. 3–8. 12 Some of these aspects are taken a closer look at in the progress of this
chapter.
MAIKE U. BUSCH 48
Products: While some products offered in consumer markets can be similar or
even the same as the ones on B2C markets, many products and services are very
specialized. Often, there is a close exchange between the supplier and the
customer. Custom-made products are developed and manufactured to meet the
customer’s specific needs. Furthermore, in B2B markets product-service-packages
are standard. This means, the supplier usually does not only provide the
hardware but also the installation and maintenance if required.
Buying behavior: The buying behavior in B2B markets is very different from the
buying behavior on business-to-consumer markets (B2C markets). Of course, also
on B2C markets more than one person can be involved in the buying process.
However, on the B2B markets where organizations buy it is a standard procedure.
Companies usually have a buying structure which involves several persons and
departments. The buying behavior is more complex therefore, impulsive buying
is highly unusual. Buying within organizations is usually a rational and well
planned procedure.
Demand: Demand in B2B markets is regulated by the demand of the customers of
the buying organizations. Suppliers in B2B markets can hardly influence the
demand of their customers as they are facing a derived demand.
Distribution channels: The distribution in B2B markets is usually a direct
distribution between the supplier and the manufacturing operations or the
retailer.
Pricing strategies: As goods to be sold are specialized and markets are not
transparent, the customers have great power to get involved in the negotiation of
prices.
Communication: Effectiveness of communication tools differentiates a lot
between the B2B markets and the B2C markets. On B2C markets mass-
communication is often and effectively used. A big variety of tools is used. In B2B
markets, personal sales have an outstanding position in marketing practice. The
buyers are usually experts in their fields and therefore also demand experts on
the selling side. The purchasing process in B2B markets is less emotional and
more analytical. Therefore, communication is mainly based on providing
information and facts as well as establishing credibility instead of stirring
emotions.
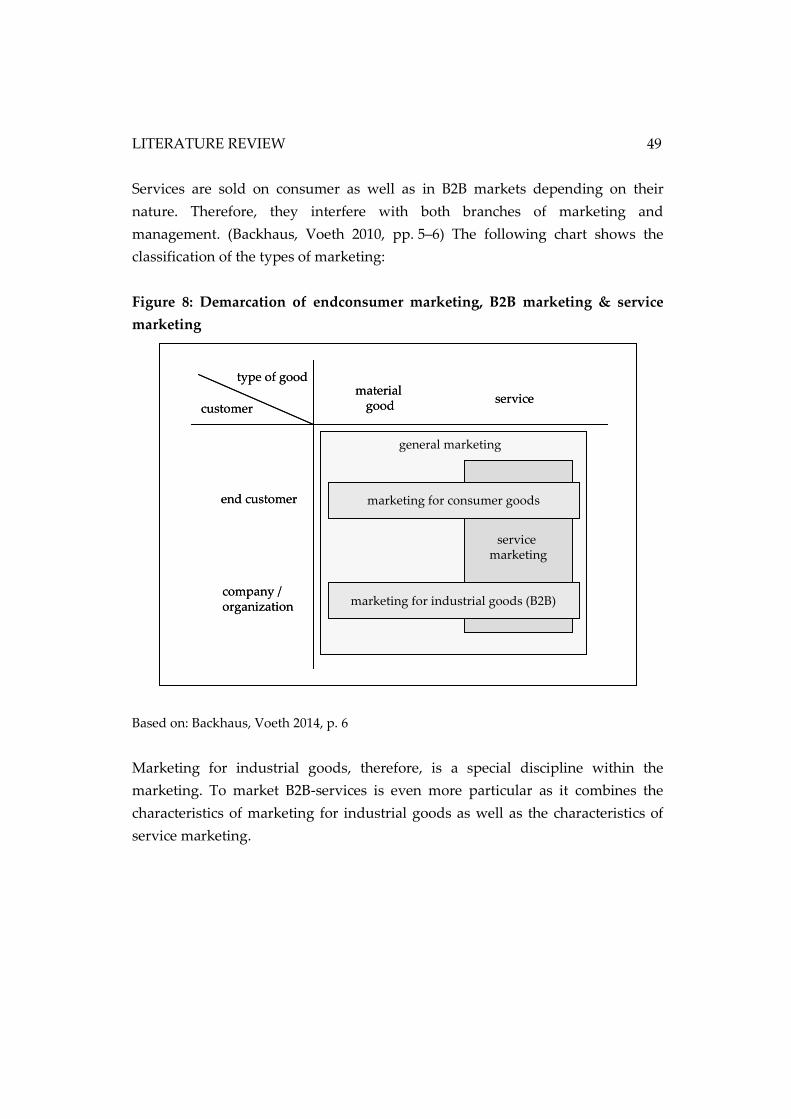
LITERATURE REVIEW
49
Services are sold on consumer as well as in B2B markets depending on their
nature. Therefore, they interfere with both branches of marketing and
management. (Backhaus, Voeth 2010, pp. 5–6) The following chart shows the
classification of the types of marketing:
Figure 8: Demarcation of endconsumer marketing, B2B marketing & service
marketing
Based on: Backhaus, Voeth 2014, p. 6
Marketing for industrial goods, therefore, is a special discipline within the
marketing. To market B2B-services is even more particular as it combines the
characteristics of marketing for industrial goods as well as the characteristics of
service marketing.
service marketing
customer
type of good
company / organization
end customer
servicematerial
good
general marketing
marketing for consumer goods
marketing for industrial goods (B2B)
service marketing
customer
type of good
company / organization
end customer
servicematerial
good
general marketing
marketing for consumer goods
marketing for industrial goods (B2B)
MAIKE U. BUSCH 50
2.2.2 Buying behavior in business markets
Compared to the typical end consumer, the customer in B2B markets shows some
major differences. In order to understand and analyze the buying behavior in B2B
markets, it makes sense to take a closer look first of all at the customer himself,
then at the buying techniques, the influencing factors, and finally also at the
different stages in the B2B buying process. (Eckardt 2010, p. 22)
2.2.2.1 The buying center
With only few exceptions, the buying processes in organizations are usually
carried out by a number of different people, often situated in different
departments as well. Such group of people in a company is called a buying center
or a decision-making unit. (Zimmerman, Blythe 2013, p. 18; Godefroid, Pförtsch
2013, pp. 53–56)
As Webster and Wind put it in short:
“Industrial buying takes place in the context of a formal organization influenced by
a budget, cost and profit considerations. Furthermore, organizational (i.e.,
industrial and institutional) buying usually involves many people in the decision
process with complex interactions among people and among individual and
organizational goals.” (Webster, Wind 1972, p. 12)
A buying center consists of several persons involved in the actual purchasing
process. The different people are involved in the process according to their roles
and functions within the organization. However, while a buying center is an
institution, it is not only formed by different roles and functions within the
organization but also of individuals with own minds and own thinking. It should
not be forgotten, that it is still the human being who takes the decisions in the
end. (Zimmerman, Blythe 2013, p. 17) As a seller of goods and services, it is, thus,
important to know the different parties involved in order to provide the relevant
information and to behave according to the different people. (Schneider 2002,
p. 225)
LITERATURE REVIEW
51
Categories of members in the buying center
In literature, role concepts are valued as a useful instrument to investigate and
understand the purchase decisions within the buying center. These roles are
independently seen without a close linkage to certain persons. These role models
are always general models without being linked to specific buying situations
either. This fact is a weakness for the application of these models in the actual
working environment. However, they have been proven helpful for
understanding buying situations that involve multiple individuals. (Backhaus,
Voeth 2010, pp. 50–51)
One very famous and often cited model is the “General Model for Understanding
Organizational Buying Behavior” by Webster and Wind (1972). In their model,
Webster and Wind classify the members of a buying center into five groups13:
Gatekeepers are the ones that supervise and control the flow of information that
enters the buying center. In addition they also monitor the flow of information
within the buying center. They also support the deciders.
The Deciders are the ones with great authority. They actually have the power to
take the final decision of which alternative should be taken. They often possess a
higher rank within the organization and have access to the budgets needed for the
transaction.
Influencers influence the decision process. They can do this either directly or
indirectly. Influencers provide information that are relevant for evaluating the
alternatives and taking a decision in the end.
Buyers are the members of the organization that actually are in contact with the
suppliers. They have the authority for contracting and sign the purchase
contracts.
The Users after all are the ones who use the purchased products or services.
Bonoma (2006) claims one more party to be involved in a buying center in
addition to the model of Webster and Wind (1972). He adds the Initiator who
starts the buying process by suggesting that a company’s problem can be solved
by acquiring a certain product or service.
13 For this section see also: Zimmerman, Blythe 2013, p. 17; Kotler, Armstrong
2014, p. 194; Backhaus, Voeth 2014, pp. 52–54.
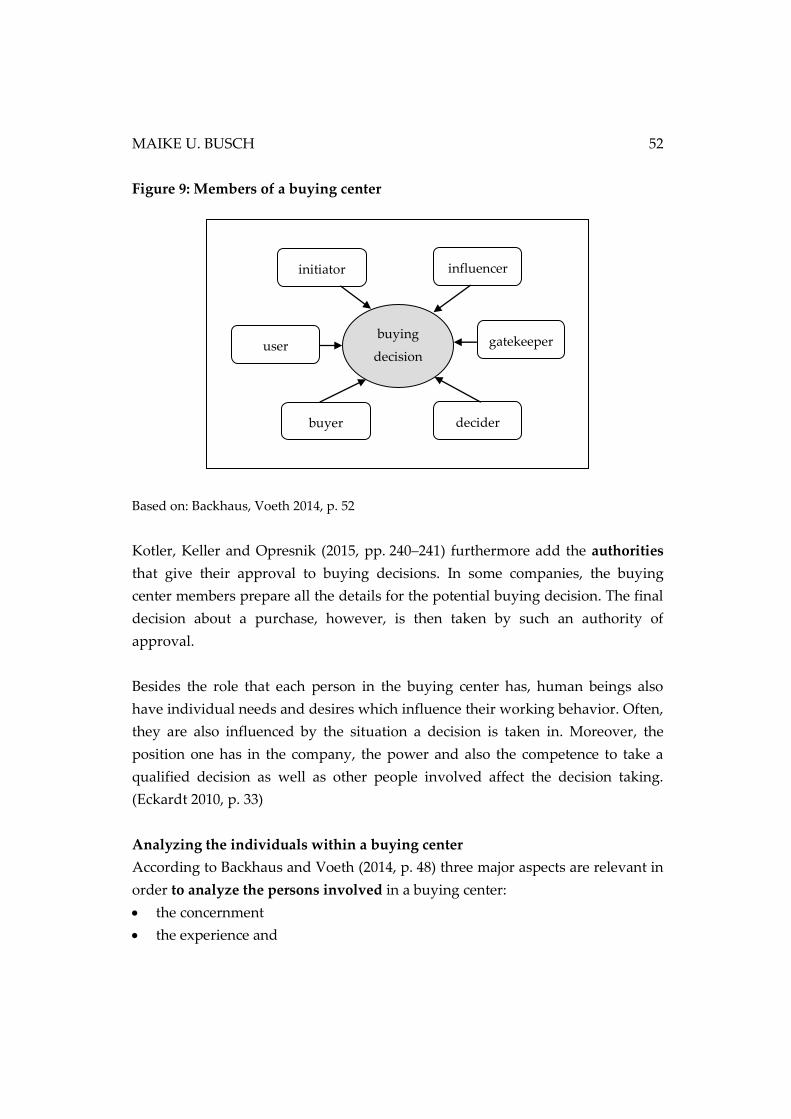
MAIKE U. BUSCH 52
Figure 9: Members of a buying center
Based on: Backhaus, Voeth 2014, p. 52
Kotler, Keller and Opresnik (2015, pp. 240–241) furthermore add the authorities
that give their approval to buying decisions. In some companies, the buying
center members prepare all the details for the potential buying decision. The final
decision about a purchase, however, is then taken by such an authority of
approval.
Besides the role that each person in the buying center has, human beings also
have individual needs and desires which influence their working behavior. Often,
they are also influenced by the situation a decision is taken in. Moreover, the
position one has in the company, the power and also the competence to take a
qualified decision as well as other people involved affect the decision taking.
(Eckardt 2010, p. 33)
Analyzing the individuals within a buying center
According to Backhaus and Voeth (2014, p. 48) three major aspects are relevant in
order to analyze the persons involved in a buying center:
the concernment
the experience and
buying
decision
initiator
user gatekeeper
buyer decider
influencer
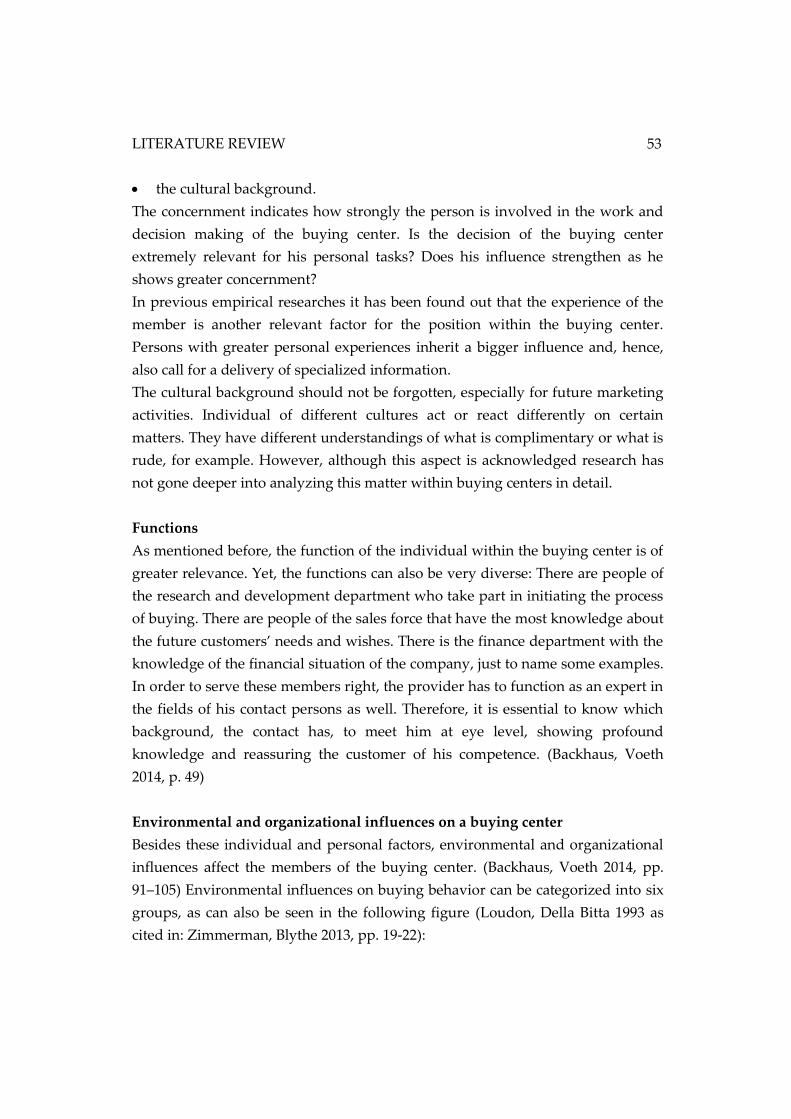
LITERATURE REVIEW
53
the cultural background.
The concernment indicates how strongly the person is involved in the work and
decision making of the buying center. Is the decision of the buying center
extremely relevant for his personal tasks? Does his influence strengthen as he
shows greater concernment?
In previous empirical researches it has been found out that the experience of the
member is another relevant factor for the position within the buying center.
Persons with greater personal experiences inherit a bigger influence and, hence,
also call for a delivery of specialized information.
The cultural background should not be forgotten, especially for future marketing
activities. Individual of different cultures act or react differently on certain
matters. They have different understandings of what is complimentary or what is
rude, for example. However, although this aspect is acknowledged research has
not gone deeper into analyzing this matter within buying centers in detail.
Functions
As mentioned before, the function of the individual within the buying center is of
greater relevance. Yet, the functions can also be very diverse: There are people of
the research and development department who take part in initiating the process
of buying. There are people of the sales force that have the most knowledge about
the future customers’ needs and wishes. There is the finance department with the
knowledge of the financial situation of the company, just to name some examples.
In order to serve these members right, the provider has to function as an expert in
the fields of his contact persons as well. Therefore, it is essential to know which
background, the contact has, to meet him at eye level, showing profound
knowledge and reassuring the customer of his competence. (Backhaus, Voeth
2014, p. 49)
Environmental and organizational influences on a buying center
Besides these individual and personal factors, environmental and organizational
influences affect the members of the buying center. (Backhaus, Voeth 2014, pp.
91–105) Environmental influences on buying behavior can be categorized into six
groups, as can also be seen in the following figure (Loudon, Della Bitta 1993 as
cited in: Zimmerman, Blythe 2013, pp. 19-22):
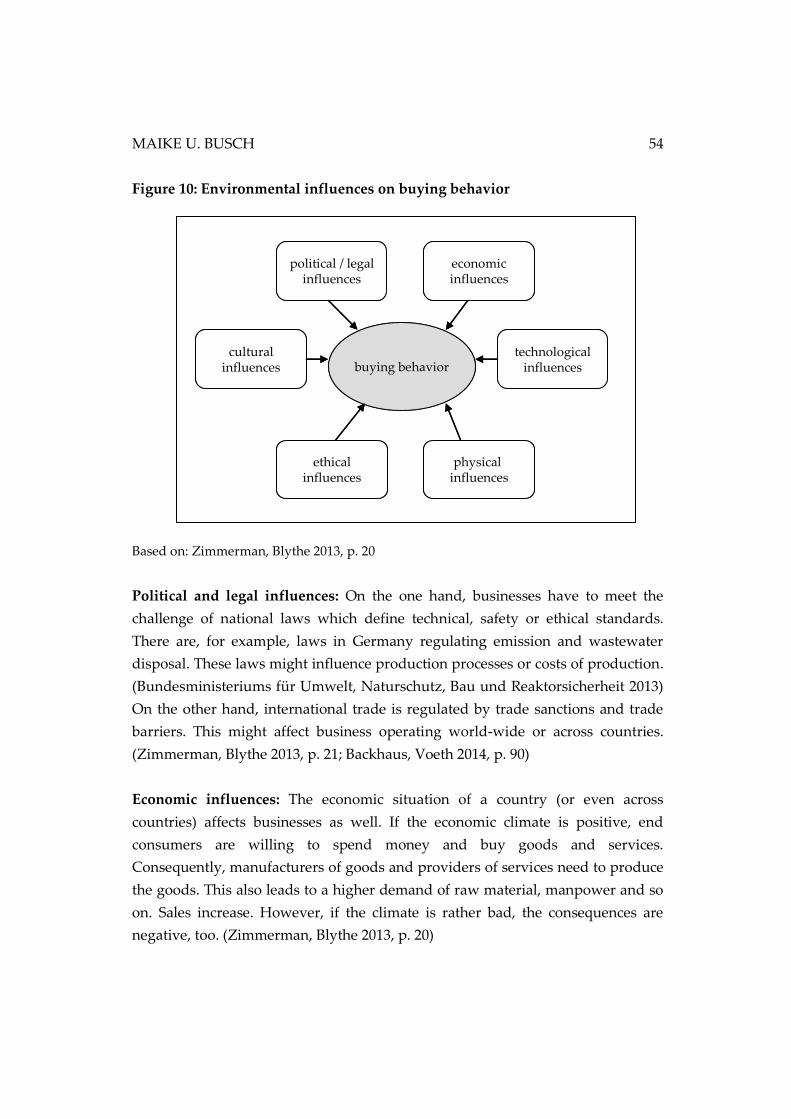
MAIKE U. BUSCH 54
Figure 10: Environmental influences on buying behavior
Based on: Zimmerman, Blythe 2013, p. 20
Political and legal influences: On the one hand, businesses have to meet the
challenge of national laws which define technical, safety or ethical standards.
There are, for example, laws in Germany regulating emission and wastewater
disposal. These laws might influence production processes or costs of production.
(Bundesministeriums für Umwelt, Naturschutz, Bau und Reaktorsicherheit 2013)
On the other hand, international trade is regulated by trade sanctions and trade
barriers. This might affect business operating world-wide or across countries.
(Zimmerman, Blythe 2013, p. 21; Backhaus, Voeth 2014, p. 90)
Economic influences: The economic situation of a country (or even across
countries) affects businesses as well. If the economic climate is positive, end
consumers are willing to spend money and buy goods and services.
Consequently, manufacturers of goods and providers of services need to produce
the goods. This also leads to a higher demand of raw material, manpower and so
on. Sales increase. However, if the climate is rather bad, the consequences are
negative, too. (Zimmerman, Blythe 2013, p. 20)
buying behavior
physical influences
technologicalinfluences
economicinfluences
political / legalinfluences
ethicalinfluences
culturalinfluences buying behavior
physical influences
technologicalinfluences
economicinfluences
political / legalinfluences
ethicalinfluences
culturalinfluences
LITERATURE REVIEW
55
Technological influences: Especially for internationally operating companies,
technical influences need to be considered. Technical standards might vary from
country to country. This results in a need to check the local conditions. Different
power plugs in European countries is just one example. (Zimmerman, Blythe
2013, p. 20; Backhaus, Voeth 2014, pp. 90–91)
Physical influences: The location of the producing and the supplying company
might matter. Many companies tend to prefer local suppliers to support the local
companies or to work together with people of the same cultural background. Also
delivery times might matter. On the contrary, cost and quality matters also need
to be considered. (Zimmerman, Blythe 2013, p. 20)
Ethical influences: Although business-to-business partnerships are focusing on
the companies’ relationships, there are still people doing the actual work. Thus,
also ethical issues matter. Bribery, for example, is still in common practice in some
countries, however, from the ethical point of view, one has to debate whether a
bribing business partner is seriously trustworthy. What about working conditions
in countries with low salaries like in the garment factories in Bangladesh? Is
everything allowed in order to being able to offer low prices to the end consumer?
Such questions and open discussions influence the industrial businesses.
(Zimmerman, Blythe 2013, p. 21)
Cultural influences: Especially when analyzing business relationships, cultural
influences should not be neglected. Considering the partner’s cultural
background might make contract negotiations and collaboration much easier.
(Zimmerman, Blythe 2013, p. 21; Backhaus, Voeth 2014, p. 91)14
14 For the whole section see also: Loudon, Della Bitta 1993 as cited in:
Zimmerman, Blythe 2013, pp. 19–22, see also Kotler, Armstrong 2014, pp. 194–
197.
MAIKE U. BUSCH 56
2.2.2.2 Buying techniques in business markets
Depending of the kind of purchase the buyer is about to make, the buying
situation and consequently the buying behavior varies for the buying center
involved. Depending on the perspective taken, types of buying situations can be
categorized. The purchasing behavior might, therefore, depend on the value, the
purchased items has, for example. The product technology involved can also
increase the complexity of a purchase. (Backhaus, Voeth 2010, p. 74; Eckardt 2010,
pp. 23–24) An often cited model is the buyclass framework by Robinson, Faris
and Wind (1967). It “has also been called one of the most useful concepts in
organizational buying behavior” (Anderson et al. 1987, p. 71) and is still in used also
in empirical research (Moon, Tikoo 2002; Moschuris 2007) The concept
categorizes the types of purchase according to their degree of innovation for the
company. Generally, three different kinds of purchases have been determined:
The straight re-buy, the modified re-buy as well as the new task. (Zimmerman,
Blythe 2013, pp. 27–28; Eckardt 2010, pp. 22–25)
New task: In such a buying situation, the task to be carried out is new to the
buyer, or it is at least perceived this way. This means, the buyer has no previous
experiences or already acquired knowledge about the task. In order to take a
proper decision, the buyer has to take the challenge of facing a complex decision
making process. The buyer first needs to determine the needs, his company has.
Then, he needs to understand the complex details of the offered goods and
services in the market in order to evaluate the alternatives. After finding these, he
must undergo the negotiations with the potential suppliers to finally take the best
decision. Yet, as stated in the previous subchapter, in business-to-business
management, it is not only one person deciding on issues. Therefore, this new
task can become a very complex one, if many departments and people are
involved in the decision making process. The complexity of a new task is related
to the risk, linked to the new task. (Kotler et al. 2006, p. 25; Hutt, Speh 2013,
pp. 38–39; Backhaus, Voeth 2010, p. 76)
Straight re-buy: The contrary of a new task is the straight re-buy. In this buying
situation the buyer purchases the same product in basically the same quantity
and from the same supplier again. The buyer already gained experiences during
LITERATURE REVIEW
57
previous buying situations; he knows the supplier and can easily fulfill the task.
Usually, a straight re-buy is no complex buying situation and most of the time,
few people of the buying center are involved in the task. (Kotler et al. 2006, p. 25;
Hutt, Speh 2013, pp. 39–41; Backhaus, Voeth 2010, pp. 76–77; Zimmerman, Blythe
2013, pp. 27–28)
Modified re-buy: The modified re-buy is a construct between the new task and
the straight re-buy. Sometimes, a buyer reevaluates his already habitual buying
process and makes some adjustments to the existing purchasing process. The
buyer might have gained new information of various origins. There might be a
need to order a smaller quantity, or the company might have decided to order
more exhibition space at the next trade show. Maybe a competitor of the current
supplier is offering better deals. So during a modified re-buy only one or a few
components are changed compared to a straight re-buy. The basic task is still
similar to the previous buying situation. (Kotler et al. 2006, p. 25; Hutt, Speh 2013,
p. 41; Backhaus, Voeth 2010, p. 76)
Mending existing and well functioning business relationships with straight re-
buy customers takes less effort from the supplier than the other two situations. In
straight re-buy situations, both parties tend to show more commitment and trust
as well as communication and, therefore, satisfaction within the buying process.
In the new task situations, potential customers face greater perceived risks, have
less commitment and keep a greater distance. The supplier has to put much more
effort in such a relationship – which, on the other side, can lead to new customers
and profits. The modified re-buy is in between. Although the situation is not as
extreme as for a new task, the customer has much power. His willingness to
change things in the relationship has high potential for conflicts and the supplier
needs to fear the customer’s willingness to change suppliers. However, also the
supplier has knowledge about the buyer from previous experiences and can
consequently use these to please the customer. Nowadays, companies try to keep
and maintain existing business relationships, despite all the efforts it takes to gain
long-term profits. (Leonidou 2004, p. 739)
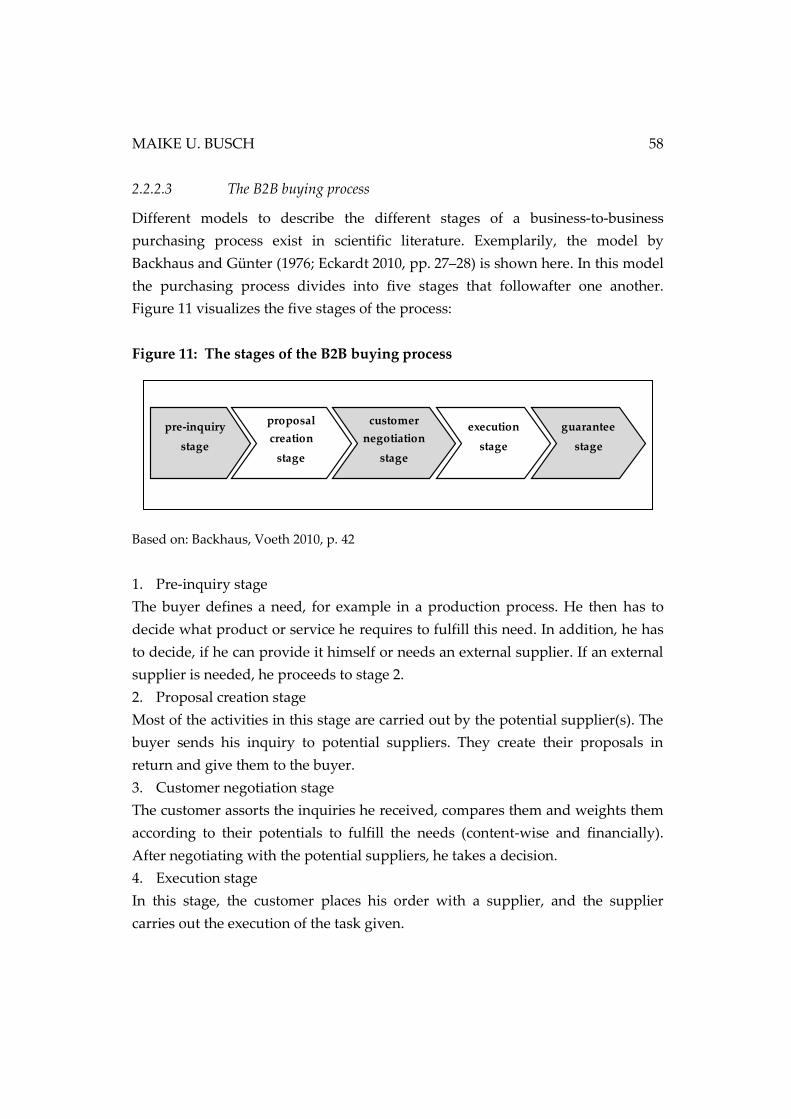
MAIKE U. BUSCH 58
2.2.2.3 The B2B buying process
Different models to describe the different stages of a business-to-business
purchasing process exist in scientific literature. Exemplarily, the model by
Backhaus and Günter (1976; Eckardt 2010, pp. 27–28) is shown here. In this model
the purchasing process divides into five stages that followafter one another.
Figure 11 visualizes the five stages of the process:
Figure 11: The stages of the B2B buying process
Based on: Backhaus, Voeth 2010, p. 42
1. Pre-inquiry stage
The buyer defines a need, for example in a production process. He then has to
decide what product or service he requires to fulfill this need. In addition, he has
to decide, if he can provide it himself or needs an external supplier. If an external
supplier is needed, he proceeds to stage 2.
2. Proposal creation stage
Most of the activities in this stage are carried out by the potential supplier(s). The
buyer sends his inquiry to potential suppliers. They create their proposals in
return and give them to the buyer.
3. Customer negotiation stage
The customer assorts the inquiries he received, compares them and weights them
according to their potentials to fulfill the needs (content-wise and financially).
After negotiating with the potential suppliers, he takes a decision.
4. Execution stage
In this stage, the customer places his order with a supplier, and the supplier
carries out the execution of the task given.
pre-inquiry
stage
proposal
creation
stage
customer
negotiation
stage
execution
stage
guarantee
stage
LITERATURE REVIEW
59
5. Guarantee stage
After the product or service is delivered, the supplier makes sure, everything has
been carried out pleasing the customer. He analyzes his performance in order to
improve for future orders. Furthermore, he offers additional services, if required.
In daily practice, however, the reflection stage is often not carried out properly.15
2.2.3 Pertinent aspects of marketing communication in business markets
The main goal in marketing communication is to deliver information to a
receiving audience with the purpose to create an effect of some kind, meaning to
influence the focused target group. The marketing communication of a company
includes not only the planning of the strategy but also the implementation as well
as the controlling and adaption of the chosen strategy if necessary. (Meffert et al.
2014, p. 570)
According to Bruhn (2014, pp. 202–204) the process of planning the marketing
strategy for a company can be divided into six main stages. After analyzing the
company’s situation, internally and in the market, a target group needs to be
fixed. While considering the chosen target group as well as the company’s
previously defined marketing goals, specific communication goals need to be
developed. These goals can be divided into economical objectives, such as sold
items, as well as psychological objectives, like a certain image, for example. In the
next step, a strategy needs to be developed which will make it possible to reach
the objectives. Decisions of the budget and the tonality have to be taken before a
detailed communication mix with the detailed use of the communication
instruments can be considered and the, in the progress, be implemented. A
critical review of the taken steps finalizes the communication process of a
company.
In principle, the process of planning and executing a marketing communication
strategy is comparable in both business-to-consumer and business-to-business
markets. However, the use and the importance of the different marketing
15 As mentioned before this section is based on: Eckardt 2010, pp. 27–28.
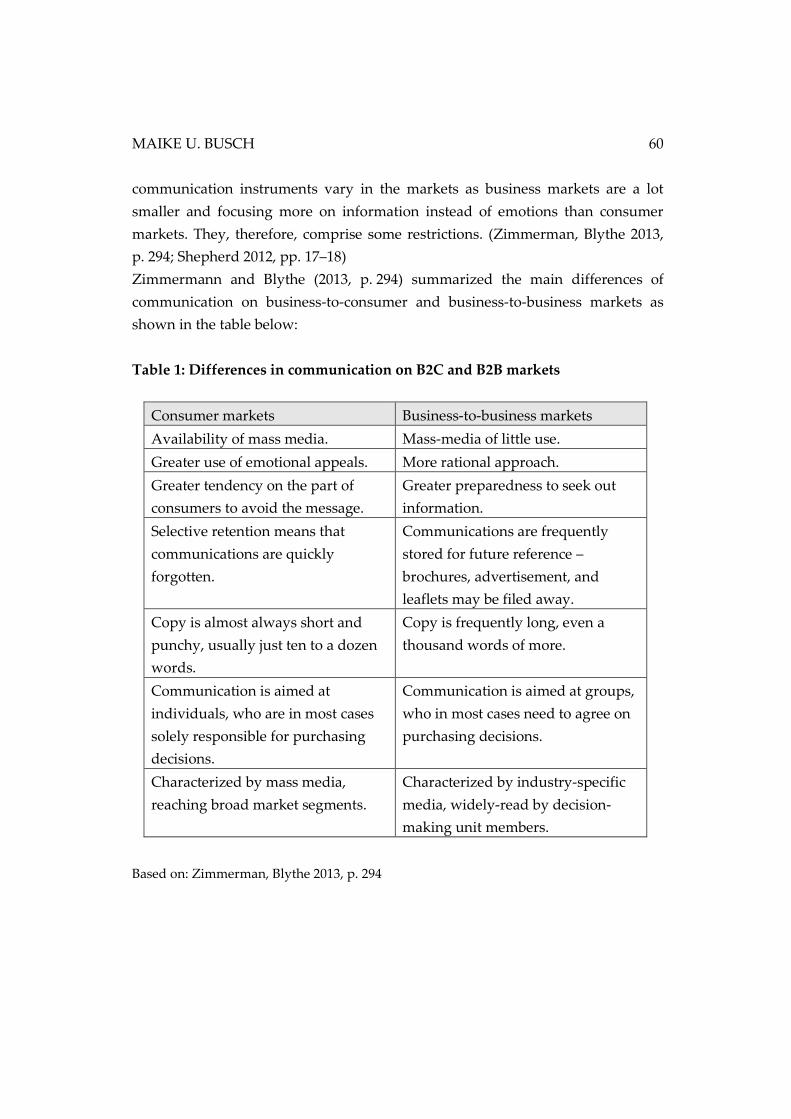
MAIKE U. BUSCH 60
communication instruments vary in the markets as business markets are a lot
smaller and focusing more on information instead of emotions than consumer
markets. They, therefore, comprise some restrictions. (Zimmerman, Blythe 2013,
p. 294; Shepherd 2012, pp. 17–18)
Zimmermann and Blythe (2013, p. 294) summarized the main differences of
communication on business-to-consumer and business-to-business markets as
shown in the table below:
Table 1: Differences in communication on B2C and B2B markets
Consumer markets Business-to-business markets
Availability of mass media. Mass-media of little use.
Greater use of emotional appeals. More rational approach.
Greater tendency on the part of
consumers to avoid the message.
Greater preparedness to seek out
information.
Selective retention means that
communications are quickly
forgotten.
Communications are frequently
stored for future reference –
brochures, advertisement, and
leaflets may be filed away.
Copy is almost always short and
punchy, usually just ten to a dozen
words.
Copy is frequently long, even a
thousand words of more.
Communication is aimed at
individuals, who are in most cases
solely responsible for purchasing
decisions.
Communication is aimed at groups,
who in most cases need to agree on
purchasing decisions.
Characterized by mass media,
reaching broad market segments.
Characterized by industry-specific
media, widely-read by decision-
making unit members.
Based on: Zimmerman, Blythe 2013, p. 294
LITERATURE REVIEW
61
Communication instruments in B2B markets
In the following, the most effective communication instruments in B2B markets,
according to literature, are presented. It is not intended to show all possible
communication instruments.
Personal selling
The most important type of distribution (distribution channel) used in B2B
marketing management still is the personal selling. Depending on the structure of
a company’s sales organization, the sales department usually consists of the sales
force which is working in the field and the sales personnel working in the office.
Some companies also provide a support service for the sales force, for example
with a deeper technical know-how of the products if those are very complex. The
personal relationship between a field sales person, supported by the office sales
person, and the most important or most influential employees of the customer are
essential to the supplier in order to succeed. This is a result of the already
mentioned complexity of B2B markets as well as the possibilities arising from
fewer customers on a market compared to consumer markets. Personal selling
includes all kinds of contacts between the sales force and the (potential) customer.
It can be carried out during visits to the customer, by personal talks at trade fairs
or via the telephone. Due to these personal talks, often face-to-face and in an
atmosphere without time-pressure, customers can gain the information for their
specified needs. In addition, such meetings also lead to new creative projects
between supplier and customer. In the daily business practice, the personal
selling is supported by the seller’s customer relationship management (CRM)16.
16 Customer relationship management (CRM) in the business-to-business
markets is the “strategic process of strengthening the relationship with business
customers”. (Kumar, Reinartz 2012, p. 261) Or as George S. Day (2000, p. 4) puts it,
CRM is process in which a seller tries to keep close to the customer by frequent
dialogue through all channels, e.g. sales force or call centers, in order to ensure
the customer retention and to make the marketing activities more effective. In
order to create a source of knowledge to build this strong relationship, software
systems are frequently used in companies to produce an information pool. This
information pool can then be used by all members of the selling center that get in
MAIKE U. BUSCH 62
Depending on the kind of system, the seller established, different sorts and
amounts of information about the (potential) customer as well as his buying
behavior are stored in a computer program. A well kept CRM system helps the
sales force to follow up the sales approaches carried out towards the customer
and to plan the future personal selling strategy more easily. (Godefroid, Pförtsch
2013, pp. 273–333) 17
However, one basic problem, the sales force is facing, is to address the right
members of the buying center and then to also address them in the most efficient
and correct way, according to their knowledge and functions. Therefore, the
personal selling should be backed by other communication instruments.
(Godefroid, Pförtsch 2013, p. 341)
Public relations
According to the Merriam-Webster dictionary (Merriam-Webster 2014) public
relation is
(1) “the activity or job of providing information about a particular person or
organization to the public so that people will regard that person or organization in
a favorable way”
and
(2) “the relationship between an organization and the public”.
So in public relations activities, a company provides information about itself, its
way of working and its goals to the public. Yet, it also tries to gain information
about the public in return. Compared to consumer markets, public relations own
touch with the customer and his wishes and needs (e.g. the sales force, research
and development, products designers). CRM systems are not a marketing
strategy themselves; however, they can be used as the foundation to develop
marketing or customer strategies. (Hutt, Speh 2013, pp. 76–77).
17 As customer relationship management as own topic combined with CRM
systems themselves are side issues to this report, explanations are kept short on
these topics. More detailed information can be acquired though various sources,
for example: Hippner et al. 2011; Kleinaltenkamp et al. 2015; Kumar, Reinartz
2012. The relationship between seller and customer will be also further analyzed
in chapter 2.3.3.3 with the principal-agent approach.
LITERATURE REVIEW
63
a higher priority on business-to business markets. In consumer markets,
companies mostly offer certain brands which the consumer is often unable to link
to a company name. In business-to-business markets on the other hand, product
and company names are often not only linked but also the same. Therefore, public
relation activities about the company are more effectively link also to the offered
products in the public. Public relation, however, is not only addressing
customers. The public is defined in a much broader sense. Employees,
shareholders and many other stakeholders are part of the public and can be
reached by public relations. (Godefroid, Pförtsch 2013, pp. 341–344)
Advertising
Advertising aims at motivating customers to show a certain behavior. In the
marketing sense, the advertiser is following commercial goals, of course. Style
and methods used in advertising can vary, though. (Justitz 2013, p. 26; Nieschlag
et al. 2002, p. 989) Although advertising is an important marketing tool in
business-to-business marketing, it is not as important on these markets as in
consumer markets. In consumer markets, mass media reaches a much bigger
group of single customers while the business-to-business markets have the
tendency to consist of fewer potential customers, as mentioned above. Plus, the
style of business-to-business advertising also varies from the end consumer
advertising: Business -to-business advertising focuses much more on transferring
information to business customers and neglects most of the emotional factors.
(Godefroid, Pförtsch 2013, pp. 345–353)
Weis (2012, p. 511) defines four major areas of objectives companies pursue by
advertising:
• Presentation of and creation of awareness for a service or a product by
creating, maintaining or increasing the brand awareness.
• Distribution of information about the product or service by presenting the
goods features, usage as well as its cost-befit-ratio.
• Strengthening of the trust level consumers have into the product or service by
building a positive image and by building a close relationship with the
customer.
• Support of sales activities by creating a unique selling proposition and
differentiating one’s good from the competitors’ goods, by offering sales
MAIKE U. BUSCH 64
arguments and by that supporting the sales force, and finally by completing
the cross-channel marketing activities.
Advertising in business-to-business markets also differs from the advertising in
consumer markets regarding the publications and advertising locations. As only a
specialized group of people forms the target group, advertising is done where
these specialists can be met. Advertising in specialized press publications, trade
publications, such as technical newspapers and catalogues, in technical school, or
at trade fairs for the branch of industry are common used options. Yet,
advertising in these B2B markets does not only mean advertising in the classical
sense, but also making use of editorial articles in trade magazines. These can
transfer more information, and tend to be more convincing to the target group
due to their rather neutral appearance. (Godefroid, Pförtsch 2013, pp. 348–351)
Trade fairs and exhibitions
“Exhibitions and trade fairs are among the most widely-used business-to-business
marketing tools, and yet at the same time they are the at least well-researched.”
(Zimmerman, Blythe 2013, p. 351)
Especially in international business, trade fairs are used a lot. For many
companies, this is the only way to personally meet with customers abroad.
(Zimmerman, Blythe 2013, p. 352) Besides the networking and selling activities,
trade shows are also used to introduce new products, to strengthen the
company’s image and identify new potential customers. Another aim, which
should not be neglected, is the chance to also collect information about the
competitors and the overall situation in the market. (Zimmerman, Blythe 2013,
p. 354; Godefroid, Pförtsch 2013, pp. 354–357) Although some trade fairs are open
to the interested public, the larger part of trade shows aims at business customers.
Trade fairs, thus, have a deeper impact in business-to-business markets than in
consumer markets. (Godefroid, Pförtsch 2013, p. 354) A survey among German
companies revealed that for many years about 40% of a company’s
communication budget was spend on trade show or exhibition participations.
Since 2013 this percentage has increased by five percentage points and has been
steady on a share of 45% of the whole communication budget since. (AUMA,
Ausstellungs- und Messe-Ausschuss der Deutschen Wirtschaft e.V. 2015a, p. 14)
LITERATURE REVIEW
65
Of course, not all trade fairs are internationally organized and the meeting point
for the whole branch of industry. There are also many smaller national or even
local trade fairs and exhibitions which mainly attract smaller business as
exhibitors as well as as visitors. (Godefroid, Pförtsch 2013, pp. 355–356)
Sales promotion
Sales promotion aims at providing an inducement to buy to customers. Usually,
this is done by offering added values or incentives of some kind. Sales promotion
activities show a great variety, such as short term discounts, ad-ons to existing
products, special packaging sizes, contest and games, loyalty programs and so on.
These activities are generally embedded in a larger strategic marketing
framework. Typically categorized as push strategies, sales promotions are custom
to increase the customers’ sales. (Doyle 2011, p. 337; Zimmerman, Blythe 2013,
pp. 364–365) Besides increasing the sales, another often followed goal of sales
promotion is to influence the introduction and establishment of new products in
the market. (Eckardt 2010, p. 166)
Over the past years, sales promotion activities have been taking growing shares of
companies’ marketing budgets. In Germany, for example, sales promotion has
gained a higher relevance especially in the investment goods industries.
(Godefroid, Pförtsch 2013, p. 358)
Use of the Internet
Many business-to-business companies have increased their use of the internet as
communication tool. Not only consumers in B2C markets are using the internet to
search for information or do online shopping. In many buying centers, the
internet is used by the members to receive concrete information about a product
or service and to get an overall picture of the (potential) provider of a needed
good. On the other hand, sellers provide also online purchasing tools to business
contacts. Productions are increasingly automated and can often be connected to
online purchasing systems which simplify the placing of orders in many respects.
Moreover, using the internet as communication tool is less costly for companies,
even regarding the exchange with customers (compared to a telephone hotline,
for example). It is easier to keep the information up-to-date and to react to daily
happenings, too. (Godefroid, Pförtsch 2013, pp. 368–371) Although B2B
MAIKE U. BUSCH 66
businesses are getting slowly involved into the usage of digital and social media
for their marketing uses, the intensity is increasing as more and more research is
carried out in this field and more insight is given on best practice, reducing the
risk of failure for companies. (Järvinen et al. 2012; Siamagka et al. 2015)
Direct mail
This instrument is frequently used in business-to-business marketing, too. As
already mentioned in subchapter 2.2.1, business markets are smaller than
consumer markets; the number of customers is mostly a manageable amount.
However, sending out direct mails requires an updated and valid address file.
Only direct mails that reach the correct person in a buying center can be effective.
(Godefroid, Pförtsch 2013, p. 360; Zimmerman, Blythe 2013, pp. 306–311) This
links direct mails to the tool of personal selling and the customer relationship
management.
Catalogues / brochures
Other widely-used communication instruments on the B2B markets are
catalogues and brochures. As communications is less emotional but more
informational in these fields, customers who indicate a first interest should be
supplied with informative brochures as well as catalogues, designed for people in
the buying centers with the specialized knowledge. In contrast to consumers
markets, in B2B markets, customers tend to file such information for later instead
of throwing them away after reading. Therefore, they are an important
communication tool. (Godefroid, Pförtsch 2013, pp. 359–360, p. 294) Nowadays,
since the use of the internet is increasing in the buying centers, catalogues and
brochures can (or should) also be provided online. (Lilien, Grewal 2012, pp. 546–
550)
Seminars / trainings
Products and services sold in business-to-business markets can be very
specialized and complex. Therefore, just reading all the information in a catalogue
or seeing a movie of its functionality might not be enough to convince the
potential buyer. Many companies offer trainings and seminars then, to get a
LITERATURE REVIEW
67
feeling for the good as well as to learn the handling of it. (Godefroid, Pförtsch
2013, p. 362)
So basically speaking, business-to-business marketing uses the same marketing
tools as marketing in consumer markets does. Only the emphasis on certain
techniques and instrument shifts.
2.2.4 Marketing goods in business markets internationally
When marketing products internationally, B2B companies have similar options
than companies acting in consumer markets. Although a standardized marketing
communication is favored sometimes due to a possible cost and work reduction,
adaption is usually necessary when operating on international markets. Not only
language might be an issue, but also layout as well as the media selection might
differ largely according to the origin of the companies addressed. Laws and
regulations might also lead to adapted products or communication strategies.
(Zimmerman, Blythe 2013, pp. 311–312; Keegan, Green 2013, p. 326)
When planning the strategic alternatives, companies have basically four options
to market their products internationally (Keegan, Green 2013, pp. 328–332):
First, they can offer the same product in every country they operate, using the
same communication likewise. This strategy is more frequently used when goods
are sold in business-to-business markets instead of to end consumers. The major
reason is the goods are usually not sold with such a high emotional impact and
therefore are also “less deeply rooted in culture”. (Keegan, Green 2013, p. 329)
The second option calls for adapted communication, although the product is still
the same. This approach can be based on the fact that the product is used in a
different way in another country or this might be due to different values and
opinions in the target market. (Keegan, Green 2013, p. 330)
A company could, however, also modify the product according to the local needs
or possibilities (like resources or regulations) while communicating in the same
way in all countries they are operating in. (Keegan, Green 2013, p. 331)
MAIKE U. BUSCH 68
In the fourth approach, a company could alter both elements, the product and the
communication. This is usually done when both the market regulations as well as
the target group call for a diversification. (Keegan, Green 2013, pp. 331–332)
So, companies operating internationally and seeking success need to analyze the
target market’s conditions regarding regulations, laws and preferences of product
usage. Plus, in addition they need to thoroughly study the target group and the
cultural differences amongst the different origins. (Keegan, Green 2013, p. 333)
Summarizing the findings on business-to-business marketing, it needs to be taken
into account that the markets for business good or industrial goods and services
vary from end consumer markets. Not only the structure of the markets is
different, but also the buying behavior,and demand as well as the embodiment of
the marketing mix consisting of product, prices structures, distribution and the
communication. Especially the buying center with its variety of members, their
functions and the buying techniques should be considered. Environmental and
organizational influences might affect the behavior. Consequently, an adapted
marketing communication strategy is essential in B2B markets to reach the
customers efficiently. Selling services in B2B markets requires a combination of
the characteristics of service marketing as well as B2B markting.
LITERATURE REVIEW
69
2.3 NEW INSTITUTIONAL ECONOMICS
2.3.1 Origin and development of the New Institutional Economics
Based on Ronald H. Coase’s paper “The nature of the firm”, which he published
in 1937 (Coase 1937), the theory of the New Institutional Economics (NIE) has
developed within the economic theory. (Goebel 2002, p. 49) However, it got its
name in the 1970s, when Oliver E. Williamson wanted to show the differences to
the older institutional studies. (Opper 2001, p. 602) Especially since the 1970s this
field of research has picked up importance in economic science, and it is
established worldwide today. (Springer Gabler Verlag 2015b) The NIE developed
as an advancement of the neoclassical economics. Early scientists did not see it as
a replacement of the old theory but as a critical revision. (Opper 2001, pp. 601–
602)
The neoclassic economics are based on the assumption of perfect markets. In this
approach it is hypothesized that transactions do not generate any costs. As
markets are perfect, all relevant information are accessible for everyone; contracts
are not needed as no one is trying to cheat on someone else or acting in an
opportunistic way; nor do any time lags occur on markets during transactions, as
supply and demand even out. The NIE on the other hand dissociates itself from
the perfect market. It does not follow the assumption that supply and demand
even out in today’s markets. Consumers are not willing to buy only the cheapest
goods and services that are offered to them. They search for a variety of options
and evaluate them in order to find the choice that fits best to their needs. Neither
does the NIE believe in perfect information in the market. In order to find the best
solutions, consumers have to search for information. In the NIE approach,
scientists claim that in a real world, not all information is accessible for everyone.
Therefore, this search for information can turn out to be extensive and costly. So
transaction costs can arise, showing the imperfection of the market once more.
(Kaas 1995c; Kleinaltenkamp, Jacob 2002a; Furubotn, Richter 2005, pp. 51–57;
Opper 2001, p. 602)
MAIKE U. BUSCH 70
According to Coarse, the subjects in the markets form regulating systems to face
their problems of imperfection. (Coase 1937) This leads to the fact that within the
institutional economics not the individual in the market is in focus of research
anymore but institutions which regulate, structure and influence the acting of
these individuals in the markets. (Opper 2001, pp. 601–602)
2.3.2 Institutions
The theory of New Institutional Economics focuses on institutions. But what are
institutions? The term is difficult to define. (Hodgson 2006, 2006, p. 1) In daily
linguistic usage institutions are usually understood as public establishments with
a certain scope of duties, such as religious or governmental establishments.
(Strzysch, Weiß 1998, pp. 432–433) Still, it can be much more complex.
North (1991, p. 97; 1992, p. 6) defines formal and informal institutions. Formal
institutions are constitutions, a jurisdiction or property rights, for example. As
informal institutions on the other hand, he sees morals, traditions or behavioral
codes. Combined together, these institutions form a system which creates an
order and which helps human beings to reduce the uncertainties they have to face
in life everyday. They are like the rules of the game of life. (Holl 2004, p. 12)
Richter and Furubotn (2005, p. 7) back the idea that institutions create a system
that helps the individuals to reduce uncertainties and therefore make it easier for
them to take decisions. In the long run, this then also leads to a reduction of
transaction costs. The same applies for Ostrom (1990, p. 51) as she defines
institutions to be understood as a group of rules that determine within a certain
framework who is in charge of taking decisions, which codes of conduct have to
be followed, and which actions and orders have to be carried out.18
Such institutions can either develop from a habitual way of acting, so that after a
passing of time, people adopt certain rules, traditions or habits that are valid in
specific situations for a specific group of people. Or institutions are purposely
18 See also: Holl 2004, pp. 12–13; Maier 1997, pp. 29–32.

LITERATURE REVIEW
71
created, either by one person assigning or establishing a rule or as a contract
between two or more people. (Goebel 2002, pp. 8–10; Windsperger 1996, pp. 7–8)
North (1991, p. 97) transferred his findings also to economic life and defines:
“Institutions provide the incentive structure of an economy.”
In this regard, institutions form then the basis for the future development of an
economy.
2.3.3 Approaches of the New Institutional Economics
As the NIE has not been developed as one single approach but evolved out of
several directions over a period of time, it combines an assortment of studies all
developed as enhancements of the neoclassical theories. The NIE cannot be seen
as a homogeneous construct. Today, it can be viewed as a sort of generic term for
a collection of related theories. (Opper 2001, p. 602; Goebel 2002, pp. 48–49) Most
researchers focus on the three major approaches of the NIE: The property-rights
approach, the transaction-costs approach as well as the principal-agent approach.
The last one is often combined with the studies on the approach of information
economics as this focuses also on the relationship between the principal and the
agent and the situation of asymmetric situations between both parties. (Richter,
Furubotn 2010, pp. 51, 226; Jost 2001, pp. 23–31; Kleinaltenkamp, Jacob 2002b;
Beye 2013, pp. 19–20)
2.3.3.1 Property-rights approach
The property-rights theory focuses not only on basic the right of ownership of a
material or immaterial good but also on the rights of disposal that are linked to it.
The theory states that not the ownership itself has an economic value. In order to
measure the value of a good, the rights someone has to actually do something
with or to the good have to be considered. (Picot 1981, pp. 156–157)
According to Furubotn and Richter (Richter, Furubotn 2010, p. 143) property
rights can be divided into absolute property rights and relative property rights.
Rights, like the right of private ownership, which need to be respeced by every
other human, are absolute property rights. Relative property rights, on the other
MAIKE U. BUSCH 72
hand, are those that are only valid between a limited number of participants, as
for example the right of the landlord to collect the rent. He can only demand the
money from the tenant that he signed a contract with.19
In the broadest sense property rights can also be transferred to personal
relationships between people. Those relationships can be seen as an asset to an
individual. If one has close personal relationships, he has a sort of right to expect
help if needed, to expect loyalty or faithfulness, for example. (Richter, Furubotn
2010, p. 103) This social capital can also play an important role in business
relationships: As business partners feel the loyalty and fairness of the opponent,
they can expect a trustful cooperation. A trustful relationship facilitates
transactions while costs for scaling down the information asymmetry can be
reduced. (Ripperger 2003, pp. 165–167)
In detail the rights an individual can own of a resource can be divided into four to
five groups according to the property-rights approach (Goebel 2002, p. 66; Picot
1981, p. 157):
• the right to use an object (usus)
• the right to use the profit gained by the object (usus fructus)
• the right to change the object (abusus)
• the right to assign some or all rights of the object to other individuals
• the right to exclude other individuals form the usage of the object,
while the last two points could also be combined as the right to consign. (Erlei et
al. 2007, p. 297; Opper 2001, p. 604)
The actor who owns all these five rights on a resource owns the most extensive
property rights. He has the full power of the resource and can influence all the
results of his action. (Riedel 2009, p. 23) Nevertheless, these rights can also be
segmented among several individuals, so that the rights on one resource are
owned by several individuals. (Fritsch 2014, pp. 8–9)
As individuals decide and act rationally as much as they can, it can be assumed
that the owner of any right will try to maximize his advantage of it. This
assumption leads to the predictability of the individual’s behavior. (Richter,
Furubotn 2010, p. 143) However, the acquired property rights can also be limited
19 See also: Goebel 2002, p. 67.
LITERATURE REVIEW
73
in the institutional context in some cases. Governmental laws, for example, can
limit the right of an individual. (Fritsch 2014, p. 9)
As a recapitulatory definition of property rights, Göbel states that all kinds of
permissions to command a material or immaterial resource can be defined as
property rights. It does not matter, whether the right has been assigned according
to law, has been acquired by a contract or has developed out of social
responsibilities. (Goebel 2002, p. 67)
Costs are also a relevant factor of this theory. While acquiring property rights or
while using them, costs can develop. Those costs are called transaction costs.
Practical examples could be the costs for a person checking entrance tickets to a
theatre performance, costs that arise, when deciding on a contract for buying a
house, or costs for a fence which is set up to ward unauthorized persons to enter a
construction site. (Kieser 2006, pp. 247–257)
2.3.3.2 Transaction-costs approach
Ronald Coase is often mentioned as the discoverer of the transaction-costs
approach. (Goebel 2002, p. 63; Richter, Furubotn 2010, p. 53; Cortekar, Groth 2010)
In his famous article “The nature of the firm“ Coase (1937) points out that the
neoclassical approach of an unproblematic use of the market which is free of any
costs is not acceptable. Every use of the market is linked to costs. Due to these
‘findings’ Coarse also often gets called the founder of the New Institutional
Economics. (Goebel 2002, p. 132) Since the publication of Coase’s article in 1937,
many economists have searched the nature of transactions and transaction costs.
Today, there are several existing definitions which show the diverse nature of
transactions costs. (Furubotn, Richter 2005, pp. 51–58)
According to Commons (1934, p. 58 as cited in: Goebel 2002, p. 129), for example,
transaction costs can be closely linked to any conclusion of a contract of purchase.
They are the costs for the instantiation of the contract, for signing the contract and
for possible problems of executing the contract. Commons further explained that
every transfer of property rights causes transaction costs, not only contracts of
purchase but also rental agreements, loan agreements and so on. Williamson
MAIKE U. BUSCH 74
(1985) then argued that not only the transfer of property right but also the
(physical) transfer of a good or service across any kind of interface – which leads
to a transfer of property rights – is responsible for transaction costs. So also the
costs for sharing the work can also be considered as transaction costs. (Furubotn,
Richter 2005, pp. 180–183) This leads to the overall assumption that not only using
the market creates costs but also forming a hierarchy and establishing a
bureaucracy does. Even broader definitions have been created; however, the one
from Williamson is probably the most cited one. (Goebel 2002, p. 132)
Transaction costs can be estimated through models, yet only to a certain extent.
The problem of asymmetric information, bounded rationality, opportunistic
behavior, uncertainty and the structure of the market with its unpredictable
occurrences need to be kept in mind by the estimation. (Richter, Furubotn 2010,
p. 86) As Arrow (1969) puts it, transaction costs are “the costs of running the
economic system” which sums up the importance and relevance of investigating
transaction costs within business operations.
2.3.3.3 Principal-agent approach
Principal-agent relationships exist in almost every social structure as soon as two
or more parties are involved in solving a problem, in working on a case or are
influencing the others acting. (Shy 1996, p. 396) The focus of this theory is set on
the relationship between a client (‘principal’) and a kind of contractor (‘agent’). In
order to realize his own interests the principal transfers certain tasks and
decisions to his selected agent. This agent gets a compensation for his efforts in
return. In today’s business world this usually results in a pay for the work done.
(Baßeler et al. 1995, p. 64; Richter, Furubotn 2010, p. 602) In general this
compensation has been fixed in a contract in advance. (Kieser 2006, p. 258; Jost
2001, pp. 12–23) Therefore, typical principal-agent relationships are the following
ones, for example:
A landlord and his tenants
A salesman and his customer
A manager/employer and his employee
A doctor and his patient
…
LITERATURE REVIEW
75
Pratt and Zeckhauser (1991, p. 2) define these relationships as follows:
“Whenever one individual depends on the action of another, an agency
relationship arises. The individual taking the action is called the agent. The affected
party is the principal.”
Jensen and Meckling (1976, p. 308) state:
“We define an agency relationship as a contract under which one or more persons
(the principal(s)) engage another person (the agent) to perform some service on
their behalf which involves delegating some decision making authority to the
agent. “
Also Ross (1973) backs these definitions. Especially Jensen and Meckling’s
definition makes it easy to draw a link to principal-agent relationships in the
business world. Due to a high degree of division of work and due to
specifications in the field of working, the principal-agent construct has taken a
strong position in order to define, describe and analyze business relationships.
Companies today are often not able to fulfill all the specialized tasks themselves.
They need partners who help them out in order to grow and to maximize their
success. (Goebel 2002, pp. 98–99)
Contracts in principal-agent relationships
As mentioned above, a contract is usually the basis for such a relationship. It
forms and controls the ties between the parties involved. The contract is supposed
to be a guideline for all possible situations that can occur during the existence of
the relationship. It states the rights, the powers and the responsibilities of each
party, makes them measurable and offers the opportunity to have a third party
judge a critical situation. In addition, also the compensation, the agent gets for his
efforts is defined in this document. (Jost 2001, pp. 12–15) The fact that a contract is
signed and therefore also needed, however, proves the existence of opportunistic
behavior: The principal and the agent do not necessarily share the same interest
nor do they trust each other thoroughly. If that was the case a contract would not
be needed. The actions of the principal as well as the agent are based on their
individual goals and interest. Each party tries to maximize its benefit. As a result
of this possible opportunistic behavior, conflicting interests can arise and the
parties try to minimize the risks by establishing contracts. (Schumann et al. 2007,
pp. 450-452, 488; Erlei 2007, p. 130) The other reason that makes contracts between
MAIKE U. BUSCH 76
agents and principals a necessity is the fact that each side has to expect an
asymmetric distribution of information between the parties. (Jost 2001, p. 21) The
principal has an information advantage regarding his own ambitions, meaning
his interests, wishes or needs. The agent on the other hand has more detailed
information about his production process, the costs of production or the expertise
in a certain field, for example. (Kleinaltenkamp, Jacob 2002a).20
Jost claims another basic issue which complicates the contracts in the principal-
agent relationships: Agents tend to have a risk aversion. So when contracts are
compiled, agents make an effort to keep their possible risks as small as possible
and have the principals take over all the risk. (Jost 2001, pp. 22–23)
Arrow (1984 as cited in: Pratt, Zeckhauser 1985, pp. 37–51) agrees with the
previously stated points but also adds that the results of these relationships are
not only dependent on the agents’ work but can furthermore be influenced by
external threats like coincidences which cannot be controlled by contracts.
So basically, principal-agent relationships can be summarized as corporations
between two or more individuals or companies. These partnerships are
established to follow a common goal while both partners have to face risks and
uncertainties. The character of this relationship can vary depending on the
integration of the sides involved. It can vary from a delegation, when a principal
assigns all the work as well as the decisions to be taken to his agent, to something
like a team effort, when all parties are involved strongly. (Kaas 1995b, p. 32; Laux
1988, pp. 185–186)
2.3.3.4 Information economics
Closely linked to the principal-agent approach is the topic of information
economics. It focuses on the effects that result from the information asymmetry in
the market and between its actors and searches for solutions (mechanisms and
institutions) to reduce the resulting problems. (Kleinaltenkamp, Jacob 2002b,
p. 152) Since this information asymmetry usually evolves between a principal and
20 The aspect of asymmetric information and the resulting problems are further
explained in the following chapter 2.3.3.4.
LITERATURE REVIEW
77
an agent, it is often included in the principal-agent approach in scientific research.
(Richter, Furubotn 2010, p. 51; Jost 2001, pp. 23–32; Fritsch 2014, p. 246)
As stated in the previous chapters, economists today presume that most markets
are imperfect. Decisions have to be taken under the situation of uncertainty. Not
all information is accessible or present to the actors in the market. (Berg et al.
2007, pp. 248–254; Erlei 2007, p. 124) The provider of a good or service lacks
information about the needs, expectations, situation and the restrictions of the
consumer, while the consumer has no absolute knowledge about the available
products, production possibilities, qualities and prices in the market. (Kaas 1995a,
p. 4) As a result, the NIE assumes that all actors in the markets act and make
decisions under bound rationality. If an actor does not have access to perfect
information, he has to make decisions based on his knowledge and
understanding. In general, the actor searches for available information to take the
best decision for his cause. Yet, once he believes he has enough information
gathered, he discontinues the search. Therefore, his decisions cannot be absolutely
rational. (Fritsch 2014, p. 316; Furubotn, Richter 2005, pp. 555–556)
The shortfall of information can be divided into two categories: The first one is the
‘uncertainty’. Although the actor in the market is willing to search for information
he has to realize that some uncertainties will have to be accepted. Either it is
plainly impossible for the person to find out or the costs for finding out are in no
relation to the benefit of getting them. The other category of a deficit in
information consists of the information that could realistically be acquired in
order to reduce the information asymmetry without disproportional effort. This
group can be summarized as ‘ignorance’. (Fritsch 2014, pp. 245–246) However
generally speaking, the information search, no matter how small the findings,
help to reduce the asymmetry. Therefore, it can be assumed that as long as either
the agent or the principal rate the benefit of investing any kind of resources into
the information search are beneficial, one will invest in them. On the other hand,
it does not imply that all parties involved search for the same amount of
information. The decision regarding the essential level of information is rather
subjective to each actor. A very important aspect in this regard is also the
individual’s willingness to carry a risk. (Blankart 2011, pp. 12–13)
MAIKE U. BUSCH 78
The outcome of this can be encapsulated as: Each information search reduces the
lack of knowledge for either participant, yet does not necessarily solve the
information asymmetry problem between the actors. This leads to particular
problems.
2.3.4 Problems and difficulties in principal-agent relationships
Based on the previous findings, in becomes obvious that problems and difficulties
in business relationships can occur. These problems and difficulties are the subject
of this subchapter.
2.3.4.1 Problems based on asymmetric information in an agency relationship
As seen before (chapter 2.3.3.4) one should not act on the assumption that
principal and agent always have the same quantum of information. In addition, it
has to be assumed that each side of the relationship has a different perspective of
what is beneficial in the course of action, while each side also tries to maximize its
benefits. Starting from this perspective, problems within the principal-agent
relationships might arise. In specialized literature on this topic, four main
problems are defined (Goebel 2002, p. 100; Fritsch 2014, pp. 252–260):
• the problem of hidden characteristics,
• the problem of hidden action,
• the problem of hidden information, and
• the problem of hidden intention.
For one there is the possibility of hidden characteristics. Before signing a contract
with an agent, the principal wishes to know the characteristics of the agent. While
the principal is able to observe the potential agent’s behavior, he is not able to
judge the characteristics which are private information to the agent. The agent
might want to look better than he is and hides his bad or less beneficial
characteristics in order to get the deal. An employer, for example, might hire a
person without knowing for sure if this person is seriously capable of working
with a certain computer program all by himself. An insurance agent might on the
LITERATURE REVIEW
79
other hand accept a new customer, although the new customer hides a certain
medical record from the agent that would - if known before - not recommend
them as a good client. As these examples show, the difficulty of hidden
characteristics can arise on both sides, the one of the agent or the principal. It is a
difficulty which is present already before a contract is signed between principal
and agent. (Goebel 2002, p. 101; Jost 2001, pp. 27–28; Fritsch 2014, p. 259)
Due to this asymmetrical information, a result could be an adverse selection. The
principal might decide on an agent as a partner for fulfilling a task, who is less
perfect than another would be. Or also an agent might choose a principal who
reveals disadvantageous characteristics once a contract has been signed and the
task-fulfillment has begun. (Jost 2001, p. 28; Kirmani, Rao 2000, pp. 67–68)
The problems of hidden information or hidden action evolve after the contract is
signed. (Jost 2001, pp. 25–27) Hidden action occurs when the principal cannot
observe all the actions the agent is taking in order to fulfill his task. Another case
could be that the prices for observing all the details in the agent’s work are too
high. If the principal cannot judge the efforts of the agent when seeing the result
either, the agent can take advantage of the principal. An agent could work slower
than he has to or could take more breaks, for example (also known as ‘shirking’),
or he could have the principal pay for resources that he uses then for other tasks,
not related to the contract with the principal, as well. (Goebel 2002, p. 102; Snyder,
Nicholson 2012, p. 583) The problem for the principal arises also in the fact that
not only endogenous reasons can be responsible for the action and result of the
agent’s work. Sometimes exogenous reasons, which the agent is not responsible
for, interfere with the planned way of working or limit the progress of the agent.
Therefore, the agent could also explain possible bad results with those exogenous
matters to the principal. (Jost 2001, p. 26; Fritsch 2014, pp. 256–257)
Hidden information problems develop when the principal can monitor the
actions and activities of the agent, yet he cannot rate them properly. He does not
know if the way of working is the most practical solution or if a stated limitation
to a process is actually true. A patient, for example, might see and actively take
part in a treatment. However, he does not necessarily know if this special
treatment was the best solution to reduce his pains. A person bringing his car to
the garage might be able to watch the mechanic change the ignition plug yet is
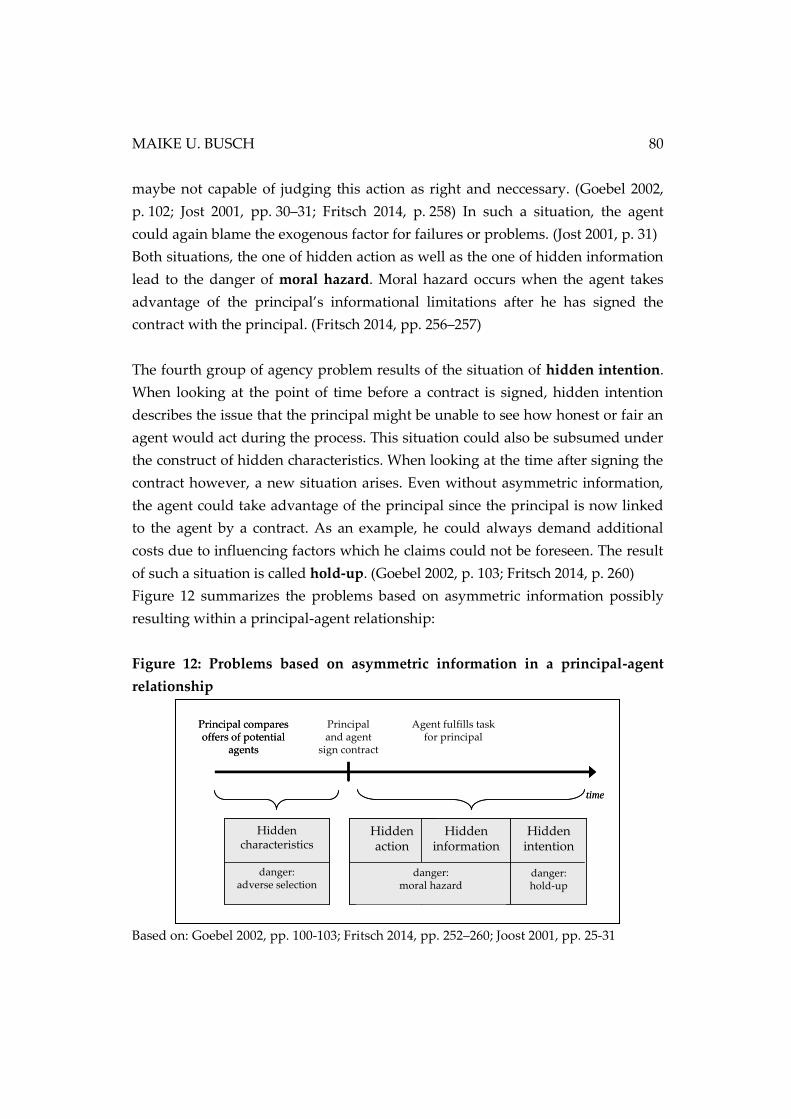
MAIKE U. BUSCH 80
maybe not capable of judging this action as right and neccessary. (Goebel 2002,
p. 102; Jost 2001, pp. 30–31; Fritsch 2014, p. 258) In such a situation, the agent
could again blame the exogenous factor for failures or problems. (Jost 2001, p. 31)
Both situations, the one of hidden action as well as the one of hidden information
lead to the danger of moral hazard. Moral hazard occurs when the agent takes
advantage of the principal’s informational limitations after he has signed the
contract with the principal. (Fritsch 2014, pp. 256–257)
The fourth group of agency problem results of the situation of hidden intention.
When looking at the point of time before a contract is signed, hidden intention
describes the issue that the principal might be unable to see how honest or fair an
agent would act during the process. This situation could also be subsumed under
the construct of hidden characteristics. When looking at the time after signing the
contract however, a new situation arises. Even without asymmetric information,
the agent could take advantage of the principal since the principal is now linked
to the agent by a contract. As an example, he could always demand additional
costs due to influencing factors which he claims could not be foreseen. The result
of such a situation is called hold-up. (Goebel 2002, p. 103; Fritsch 2014, p. 260)
Figure 12 summarizes the problems based on asymmetric information possibly
resulting within a principal-agent relationship:
Figure 12: Problems based on asymmetric information in a principal-agent
relationship
Based on: Goebel 2002, pp. 100-103; Fritsch 2014, pp. 252–260; Joost 2001, pp. 25-31
Principal and agent
sign contract
Hidden characteristics
danger:adverse selection
time
Principal compares offers of potential
agents
Agent fulfills task for principal
Hidden action
Hidden information
Hidden intention
danger:hold-up
danger:moral hazard
Principal and agent
sign contract
Hidden characteristics
danger:adverse selection
time
Principal compares offers of potential
agents
Agent fulfills task for principal
Hidden action
Hidden information
Hidden intention
danger:hold-up
danger:moral hazard
LITERATURE REVIEW
81
2.3.4.2 Additional problems in an agency relationship
While the normative branch of the agency-theory works with many premises and
reduces the agency problems basically to finding the right contract, another
branch also takes a closer look at the rather complex business situations that can
develop between principals and agents in reality. Out of this perspective, a
broader variety of problems can occur. Goebel (2002, pp. 105–109) compiled the
following situations which can lead to further principal-agent-problems:
• Several agents: Often, a principal does not only face one agent, but several. A
typical example would be an employer who has several employees (agents)
working for the success of his business. Another one could also be an
exhibitor for example, planning his participation at a trade fair. He needs a
booth which has to be planned, constructed, the carpenter needs to put the
carpet on the floor, and the florist brings in the plants, the caterer brings the
food and so on. In order to implement the whole project, the exhibitor needs
support of several different service providers meaning several agents. The
problems for the principal are to coordinate the work of the agents and to
have each single agent to give his best effort. If the agents depend on each
other’s work, it might get difficult to judge each performance and define
reasons and responsible agents especially in cases of difficulties or wrong
production. Each agent might withhold some effort as he sees his chance to
reduce his work within the team without being held responsible. On the other
hand, the agents might also make special arrangements among each other to
benefit themselves while harming the principal’s success (such as price
agreements or reduced performance levels). 21
• Multilevel relationships: Especially in companies with diverse hierarchy
levels, there are multilevel relationships. The worker at the machine is the
agent to his foreman; the foreman on the other hand is the agent to the head of
the division while this person is the agent to the top management. If coalitions
are formed the principal agent relationships can be harmed. Yet, in cases that
21 See also: Arrow 1985.
MAIKE U. BUSCH 82
trust between the individuals involved developed, it can also be beneficial for
the company.
• Several principals: While a principal sometimes has to work with several
agents, it can also be the other way around, having one agent to several
principals. A typical example could be an artisan or a service provider that
offers his work and service to several customers. He is expected to be fair to
all customers, fulfilling the tasks on time for every customer despite the
different interests of the different principals.22
• Several tasks: An agent often faces the challenge to not only have one task to
do but a wide range. Hardly any employee carries out one task all day long,
all the time. Therefore, not only having several principals can develop to a
problem but also a variety of tasks, which need to be taken care of. An
employee in the service department does probably not only have to make
sure, the customer gets his service as ordered, he also has to make sure, the
right suppliers are available with the needed material.
• Several periods lasting relationships: The challenge for the agent in business
relationships that last several periods is to keep up the quality and service
offered and to draw up a smart contract. On the other hand, these
relationships can develop to big advantages as well. Working together for a
longer time reduces the information asymmetry between the parties involved.
Furthermore, a reputation can be reached which can make the renewal of
existing contracts as well as the signing of new contracts much easier.
In addition Göbel (2002, p. 109) picks up the topic of the bound rationality and
broadens the issue. The bound rationality is not only based on the fact that
principal and agent cannot access all relevant information. Although a lot of
information is available, each side has also a limited capacity of taking in and
22 See also: Arrow 1985.
LITERATURE REVIEW
83
processing information. In case a human takes in too much information, it might
even lead to an increasing inefficiency in taking decisions.23
So, summing up the preceding findings, principal-agent relationships can lead to
several problems. Information asymmetry, bound rationality, external factors as
well as the constellation of the relationships might result in difficulties for one or
even all parties involved. This leads to the question of how such problems can be
solved. Some areas of scientific research have focused on this issue. Results are to
be presented in the following subchapter.
2.3.4.3 Possibilities to reduce agency problems
As seen before agency problems can result from the asymmetric information
between the principal and the agent. They can furthermore result from the
conflicting goals one has in the transaction as well as from the fact that each party
tends to live his own opportunism. Nonetheless, there are also external factors.
Once a business relationship is established, there are some additional practical
issues that one has to keep in mind when analyzing principal-agent-problems in
detail in reality.
Especially the four main problems in principal-agent relationships are often
considered in economic science. They can make it impossible to establish or tend
to disturb well functioning business relationships. Therefore, scientists have also
focused on the questions of how these problems can be avoided or solved.
Starting out from the foundations of the agency problems, three main categories
of solutions can be divided (Goebel 2002, pp. 110–125; Fritsch 2014, pp. 260–261):
• Both parties involved could try to minimize the information asymmetry.
• Both parties try to align their interests and goals.
• Both parties create and build trust towards one another and strengthen it with
the passing of time.
Furthermore, it has to be considered whether the problem occurs before the
contract between principal and agent is signed or after. (Goebel 2002, pp. 110–125)
23 See also: Kroeber-Riel et al. 2009, pp. 421–422; Jacoby 1977, p. 569.
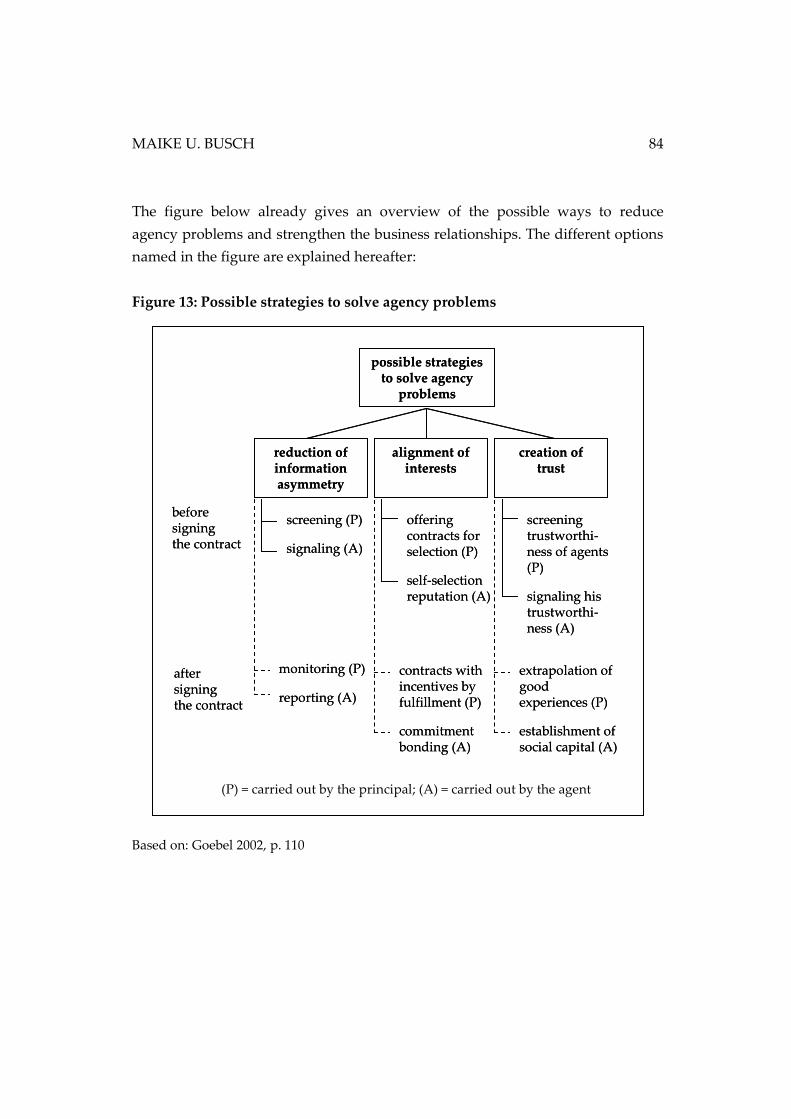
MAIKE U. BUSCH 84
The figure below already gives an overview of the possible ways to reduce
agency problems and strengthen the business relationships. The different options
named in the figure are explained hereafter:
Figure 13: Possible strategies to solve agency problems
Based on: Goebel 2002, p. 110
(P) = carried out by the principal; (A) = carried out by the agent
possible strategies to solve agency
problems
creation of trust
alignment of interests
reduction of information asymmetry
before signing the contract
after signing the contract
screening (P)
signaling (A)
monitoring (P)
reporting (A)
offering contracts for selection (P)
self-selectionreputation (A)
contracts with incentives by fulfillment (P)
commitmentbonding (A)
screening trustworthi-ness of agents (P)
signaling his trustworthi-ness (A)
extrapolation of good experiences (P)
establishment of social capital (A)
LITERATURE REVIEW
85
2.3.4.3.1 Reducing information asymmetry
The situation of asymmetric information can be present before and after the
contract between a principal and an agent is been signed. According to the timing
and the one taking the initiative, four procedures are possible.
Screening
Screening is an action the principal can do before he has signed the contract with
an agent. In order to reduce the information asymmetry and to protect himself
from an adverse selection, the principal tries to find out as much information as
possible on the possible agents. Then, in the end, he can compare alternatives and
has a better knowledge to decide on the best fitting agent for his tasks. In order to
gain information, the principal can execute a variety of actions and test. He can,
for example, do a research on available press releases or articles on the possible
agent. He can get in touch with previous customers. Depending on the good the
agents are offering, the principal can request samples. He can also try to visit the
agent and get first hand information on the production process of the good. On
the other hand, the principal could also hire an independent expert to gather
information about potential clients for him, if he can find one, that is truly
nonpartisan to either side. This list could be extended. (Fritsch 2014, pp. 261–262;
Picot et al. 2002, pp. 99–100; Stiglitz, Joseph E. 1975)
Nevertheless, the principal faces the difficulty to identify the characteristic
features which actually are the ones to base the best decisions on. In addition,
finding out the details in the necessary depth might result in high costs. As a
consequence, the principal always has to consider the cost-benefit-analysis.
(Alparslan 2006, p. 29; Fritsch 2014, p. 261)
Signaling
Signaling is also done before a contract is signed. It is a tool to reduce asymmetric
information, too. However, this time, the potential agent is taking action. He
voluntarily provides information about himself to the principal. He does that at
his own costs. In order to convince the principal of the correctness of the given
information, the agent can use proofs from nonpartisan sources, such as
consumer associations or the International Organization for Standardization

MAIKE U. BUSCH 86
(ISO); or he uses information by previous customers. Certificates and diplomas, as
well as independent survey results reveal an objective perspective on the agent
towards the principal. Acquiring such proofs is often linked to additional costs for
the agent. On the other hand, it might also lead to more successful and profitable
contracts. (Goebel 2002, p. 111; Jost 2001, pp. 29–30; Picot et al. 2002, pp. 98–99)
Monitoring
After a contract has been signed, the principal might still like to be informed
about the progress of the assigned tasks or about resources used, for example. The
principal could monitor the actions of the agent and by doing so keep track of the
progress. This approach might involve difficulties, though. First of all, monitoring
the agent and his work might be very time consuming and costly. Secondly,
besides the time and cost issues, the principal might not have the knowledge to
judge the progress correctly. He could hire an independent and capable observer.
Yet, this way could also lead to problems, as the observer is then another agent
involved. The observer himself could also hide important information like the fact
that he is in favor of the other agent he is observing or that he is not fully capable
of fulfilling the task in the first place. (Goebel 2002, pp. 112–113; Arrow 1985)
Reporting
The opposite of the principal observing the agent and his work during the process
could be called reporting. Reporting would then mean that the agent reports to
the principal about the progress of the project, after a contract has been signed
and the project has been started. He then keeps him up to date with actual
information. As mentioned above, the external factor might also harm a positive
outcome of a project. The agent could use reporting to distinguish clearly the
impact the external factor might have on a project’s outcome. (Goebel 2002,
p. 113)
LITERATURE REVIEW
87
2.3.4.3.2 Alignment of interest
As mentioned previously, problems between a principal and his agent can occur
due to unequal objectives. Therefore, it might be worth trying to align the
interests of both parties. This, can be difficult if it is assumed that both want to
maximize their benefits. (Jost 2001, p. 15)
From the principal’s perspective, contracts can be a solution. In order to prevent
the agent from showing opportunistic behavior the principal can install contracts.
These contracts can include different perspectives. On the one hand, these
contracts can be used to clarify the responsibilities of the agent. In addition to that
they then also state the consequences if requirements and agreements are not met
by the agent. This way the agent knows and by signing such a contract also agrees
on possible fines. On the other hand, such contracts can also be used to present
incentives to the agent. Only if an agent sees enough benefits also on his side, he
is willing to sign the agreement. The contract then defines the incentives that will
be offered to the agents in case of a positive evaluation of the fulfillment of the
assigned task. For a service agent the incentive could be defined in terms of a fee.
The employee, for example, might find his salary as well as some bonus
agreements in his contract. Both contents of a contract, the incentives by
fulfillment as well as the possible punishments in case of non-fulfillment, might
prevent the agent from opportunistic behavior and taking advantage of the
principal. (Jost 2001, p. 17; Goebel 2002, pp. 113–115; Fritsch 2014, pp. 265–266)
However, when assuming that the agent might try to minimize his own risk, the
drafting of a contract can turn out to be a challenge. While the agent knows his
own competences and resources, he surely wants to assure himself that in case of
external threats (as mentioned before), he is not taking all the risk himself. (Jost
2001, p. 23) Asymmetric information might lead to difficulties in setting up the
contract as well. Here, the principal needs to make sure, that the agent is not able
to take an advantage of a different level of knowledge. (Jost 2001, p. 21)
The agent on the other hand can also do his part to align the interests. First of all,
the agent can ask the principal for all the necessary details of his tasks before
agreeing on a partnership. This way, he can select himself, if the objectives are
going into the same direction or not. So, possible fundamental problems can
already be avoided in the first step, before showing any commitment.
MAIKE U. BUSCH 88
Alternatively, the agent could also present the reputation he gained in the market.
This way, the principal can also evaluate if a successful partnership could be
possible. (Goebel 2002, pp. 110–113)
After a contract has been signed and the agent takes over his assignments from
the principal, the agent has further ways to show the principal his willingness to
work by the same interests. Two possible ways are the commitment and the
bonding. When showing commitment, the agent signals the principal, that he
does not have the plan to take advantage of the principal. He can do that by
making an investment himself to enhance the results of the business he is doing
for the principal, for example. When using the bonding, the agent is willing to
make advanced payments (prepayments) in his course of action. The principal
can then transfer his payment to the agent later. This way the agent shows the
principal that he is aiming for the same goals. The principal on the other hand
gets a sort of insurance that the agent is working according to his wishes.
Otherwise, the principal could disagree to even out the prepayment made by the
agent. Although bonding is seen as an action provided by the agent, it has been
observed that sometimes principals also request such prepayment as a sort of
deposit. (Goebel 2002, pp. 116–117)
2.3.4.3.3 Creation of trust
When two parties work together as principal and agent, there is hardly ever a
chance of a 100% control or 100% guarantee that all matters are handled as stated
in the contract or that all information asymmetries are removed. Therefore, trust
between the principal and his agent can strengthen the relationship and reduce
the experienced uncertainties on both sides. Nevertheless, trust research has
rather recently found its way into economic science. It is a rather new field in
economic research. (Singh, Sirdeshmukh 2000; Goebel 2002, pp. 118–120)
While the principal can try to screen the potential agent before signing the
contract with him thoroughly with regard to his trustworthiness, the agent on the
other hand can do likewise and signal his intentions. In the end, the goal should
be to create a basis of positive experiences with each other and to let social capital
develop between the parties involved. (Goebel 2002, pp. 119–123)

LITERATURE REVIEW
89
Kirmani and Rao (2000) affirm, though, that signaling itself does not succeed in
selling services with mainly credence qualities, such as services. They indicate
trust to be essential for those transactions. Singh and Sirdeshmukh (2000) support
this statement and even go a step further, calling trust essential for sustainable
principal-agent relationships in general.
Now, if trust is so essential for a functioning principal-agent relationship and
seems to be most effective for reducing the agency problems, a closer look should
be taken at the issue. However, as many scientists have claimed, trust is a
multidimensional construct difficult to define. (Yousafzai et al. 2009; Singh,
Sirdeshmukh 2000) Therefore, the following chapter will delve into this subject.
MAIKE U. BUSCH 90
2.4 TRUST
As literature shows, the roots of the research on trust lie in several different areas
of academic research. Trust research has its origins in the fields of philosophy,
psychology, social psychology and sociology. Over the passing of time, it also
situated significance for economic research. (Enke, Greschuchna 2005, p. 4;
Cornelius 2008, p. 4)
A lot of research has been done on the phenomenon of trust in all various
disciplines on science. However, until today, there is no overall-valid definition
for the term ‘trust’. Trust is an intangible construct. (Gilbert 2007, p. 62)24 Yet, trust
defines the modern society, as human beings trust not only in other people but
also in organizations, in science, in technological and economic progress.
(Cornelius 2008, p. 3; Frambach 2003, p. 241) Trust is the basis for all social
relationships as well as all economic transactions. A world with perfect
information does not exist. There are usually uncertainties to some extent and
humans close these gaps by using trust. (Hippe 1997, p. 255; Möllering, Sydow
2005, pp. 64–76)
2.4.1 Trust research in etymology
When taking the definition of the word ‘trust’ from a dictionary, trust can be
defined as:
(1) “the belief or willingness to believe that one can rely on the goodness, strength,
ability etc. of sb/sth”
or
(2) “responsibility, care” (Hornby, Crowther 1995, p. 1281)
The word ‘trust’ developed from the Middle English and its origin is probably
Scandinavian from the Old Norse words ‘traust’, ‘traustr’ meaning ‘strong’. It is
also closely relates to the Old English word ‘treowe’ meaning ‘faithful’. (Oxford
University Press 2015; Merriam-Webster 2015)
24 See also: Mayeret al. (1995); Bittl (1997); McEvily et al. (2003) as cited in:
Gilbert 2007.
LITERATURE REVIEW
91
2.4.2 Trust research in philosophy
Trust research in philosophy dates back as far as Aristole, Thomas Aquinas, and
Thomas Hobbes. (Cornelius 2008, p. 4) One of the most cited representatives of
trust research in philosophy, however, is Rudolf Schottlaender.
According to Schottlaender, trust is the necessary ingredient to have a functioning
relationship between two persons and within a community. (Schottlaender 1955,
p. 348)
He defines trust as a sort of frame of mind, that one sees the good that lies within
the other people around. (Schweer 2008, p. 13) It is therefore similar to faith as
trust is directed towards the future which is always linked to uncertainties.
(Schottlaender 1957, p. 10)
On the other hand, Schottlaender claims that trust is based on previously made
experiences. A person gains knowledge from making experiences and uses this
knowledge to predict future behaviors of others, for example. Thus, trust is also
linked to knowledge. (Schottlaender 1957, p. 10)
Furthermore, Schottlaender differentiates between ‘familiarity’ and ‘trust’. Before
trust can develop, the person or the item that should be trusted has to be familiar.
One needs to get used to the person or item before trusting him/it. Still, while
familiarity is necessary for trust to arise, it does not always lead to trust. Other
factors might influence the developments otherwise. (Schottlaender 1957, p. 12)
Trusting always leads to a condition of being at ease and feeling safe. (Wesemeier
2002, p. 62)
Jackson et al.'s (2011, p. 209) conception of trust is comparable to Schottlaender’s
conclusions. They claim that trust is the belief that one day, the opponent will do
the same for oneself as one has done for him.
2.4.3 Trust research in psychology
Psychology is the scientific research on the behavior of individuals and their
mental processes that go along with this behavior. (Zimbardo et al. 2008, p. 2)
Erikson advanced the model of the psychosexual development by Freud and
added the eight psychosocial stages of ego development model. This model
claims, that each individual passes through eight different stages through his
MAIKE U. BUSCH 92
span of life. In each stage, the individual has to face a psychosocial crisis. This
crisis is always determined by a certain social relationship, for example between
an individual and its mother, between an individual and both of his parents, or
between an individual and partners in friendship and sex. Each stages takes its
time and has a favorable outcome such as trust and optimism, competence in
intellectual, social and physical skills, or concern for family, society and future
generations. (Weiten 2008, p. 341; Erikson 1963, pp. 222–250) Already the first
stage is the cornerstone for building trust and/or mistrust when a baby is
interacting with his mother or the person who takes over the motherly care.
(Erikson 1995, pp. 222–226) As a conclusion, the creation of basic trust is therefore
a concomitant of a close relationship between a newborn child and the person
who provides nourishment, love, and a positive feeling of physical closeness
towards the baby. (Zimbardo et al. 2008, pp. 388–389) Erikson (1953, p. 11)
defines trust as a feeling that one may rely on another person. However, he also
states that negative behavior such as punishments or threatening, harm the
creation of trust. 25
Rotter (1967, p. 651) on the other hand contradicts with Erikson’s opinion that
negative behavior leads to mistrust.26 According to him, trust can be defined as
the expectation an individual or a group has regarding the reliability of the
promises another individual makes. For that matter it is not important if the
promise is good or bad, if the promise was transferred in a verbal or a written
form. Only the fact that one can rely on this promise is important for building
trust. (Rotter 1971, pp. 443–452) Besides the specific trust in a certain person or
situation, Rotter states that generalized expectations also develop with the
passing of time when an individual transfers his expectations made with one
social agent to another:
“The development of such a generalized attitude may be learned directly from the
behavior of parents, teachers, peers, etc., and also from verbal statements regarding
others made by significant people or trusted sources of communication such as
newspapers and television. It is ironic that we can learn to distrust large groups of
25 See also: Petermann 2013, pp. 12–13.
26 See also: Petermann 2013, p. 13.
LITERATURE REVIEW
93
people without personal experience validating such distrust, because people who
are themselves trusted teach distrust.” (Rotter 1967, p. 653)
Consequently, interpersonal trust is based on the learning experiences of an
individual. Over some time, they form patterns of expectations and attitudes
and evolve into personality traits. (Petermann 2013, p. 13) Rotter found out
that people who are able to trust others are more reliable, are less unhappy,
have more friends and experience less trouble. (Petermann 2013, p. 82)
A more detailed definition yet also in the same direction as Rotter’s, is the
definition by the social psychologist Morton Deutsch. He focuses on trustful
acting which can be observed. According to Deutsch, one person trusts another
without being forced to do so. (Petermann 2013, p. 13) Therefore, in order to be
able to trust someone else, one also needs to have confidence in his own decisions
(Wesemeier 2002, p. 66) as “trust is subjective and dependent on the views of the
individual.” (Vu et al. 2010, p. 184) His famous definition reads as follows:
“A trusting behavior occurs when an individual is confronted with an ambiguous
path, a path that can lead to an event perceived to be beneficial or an event
perceived to be harmful. In this person’s perception, the occurrence of these events
is contingent on the behavior of another person and the strength on a harmful event
to be greater than the strength of a beneficial event. If this person takes the
ambiguous path he makes a trusting choice to another person. He trusts that the
other person can so the actions leading to a good result. Otherwise, he makes a
distrustful choice.” (Deutsch 1962 as cited in: Vu et al. 2010, p. 184)
This leads to the studies of social psychology.
2.4.4 Trust research in social psychology
According to Thomas trust research has gained much interest in the social
psychology studies since the late 1990s. (Thomas 2005, pp. 19–20) As social
psychology investigates how people interact with one another, focuses on
thoughts, feelings and behaviors of individuals as they interact with other human
beings (Hogg, Vaughan 2008, p. 4), it seems rather surprising that the strong
research interest began so late.
MAIKE U. BUSCH 94
Social psychologists define trust as the foundation of all social order and as basis
for solid social institutions and markets. (Arrow 1974, Zucker 1986 as cited in:
Frey, Bierhoff 2011, p. 123) It can be seen as an expectation of an individual that a
situation or transaction will lead to a positive outcome without having the duty to
supervise the opponent party that is involved. In addition, trust also reduced the
complexity of life’s reality. (Oswald, Fuchs 1998) Mayer, Davis and Schoorman
(1995) agree with this definition.
Oswald (2010) also defines that trust cannot only develop between persons but
also into organizations and institutions. Moreover, trust can not only develop into
a belief that another person’s motives are right but also in a person’s competences
to perform according to his motives. Frey and Bierhoff (2011, p. 124) cite an
example by Yamagishi and Yamagishi (1994, pp. 131–133) in this respect: A
passenger on a plane can trust an inexperienced pilot to have to right motives to
fly the plane safely to its destination. However, the passenger might not trust in
the competences of the pilot to actually act according to his motives.
Lewicki and Benedict Bunker (1996) developed a model that trust development
runs through three stages which they have also transferred to the business world.
In the first stage, a person calculated the economic value of the relationship and of
the trusting. Therefore, the stage is called calculus-based trust. He compares the
costs of maintaining the relationship to the possible outcome of it. Trust builds up
slowly with each step taken within the relationship. It can easily be broken again
if one party involved is harmed in the process of the relationship. In the second
stage, the trust is a knowledge-based trust. The partner in the relationship is
known well enough to be able to predict his positive attitude and acting. The
partners rely on information about each other. As a metaphor for this sort of trust,
Lewicki and Benedict Bunker use ‘gardening’. From experience a person has
some knowledge about a topic. In this stage, trust is not as easily broken as in the
stage before. If one party is disappointed by a wrong doing of the other, he will
first await an explanation for the behavior and will give the opponent the chance
to make an excuse before eliminating all trust. The last stage is the so called
identification-based trust. In this stage, one person is able to rely on another or the
whole group. The individuals that share identification-based trust also share the
same values, they understand each others’ needs and they approve the others’
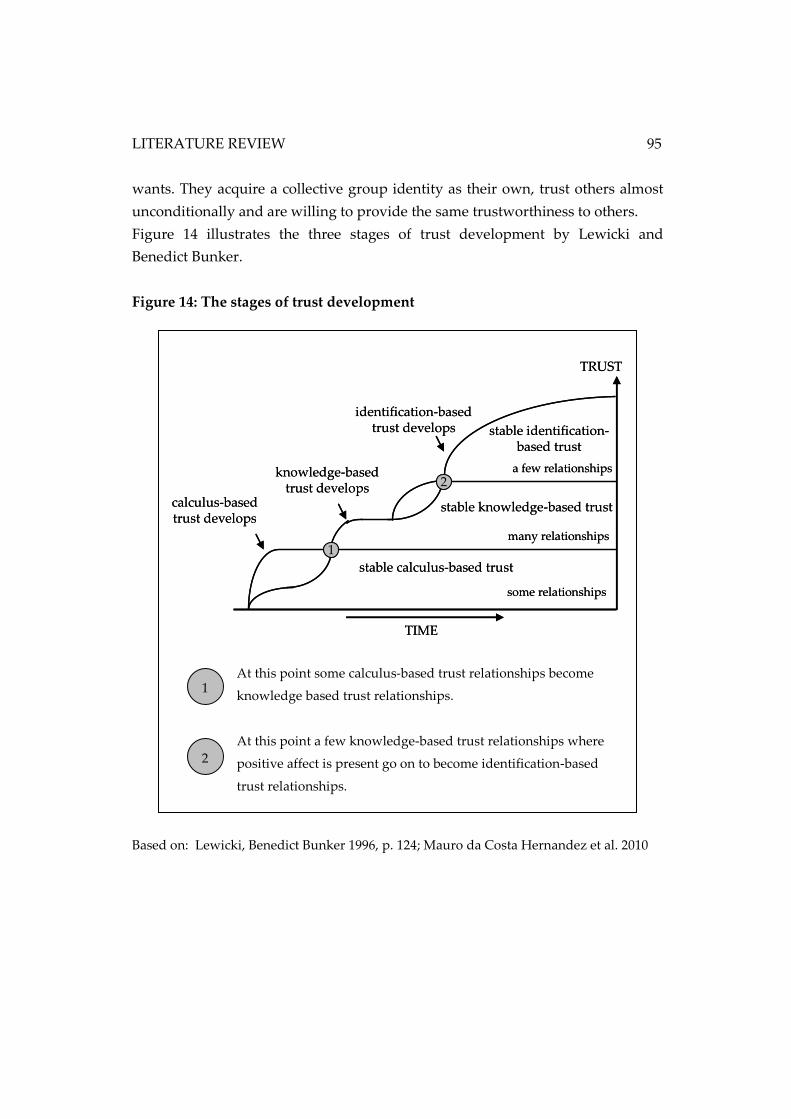
LITERATURE REVIEW
95
wants. They acquire a collective group identity as their own, trust others almost
unconditionally and are willing to provide the same trustworthiness to others.
Figure 14 illustrates the three stages of trust development by Lewicki and
Benedict Bunker.
Figure 14: The stages of trust development
Based on: Lewicki, Benedict Bunker 1996, p. 124; Mauro da Costa Hernandez et al. 2010
some relationships
many relationships
a few relationships
stable calculus-based trust
stable knowledge-based trust
stable identification-based trust
calculus-based trust develops
knowledge-based trust develops
identification-based trust develops
TIME
1
2
TRUST
some relationships
many relationships
a few relationships
stable calculus-based trust
stable knowledge-based trust
stable identification-based trust
calculus-based trust develops
knowledge-based trust develops
identification-based trust develops
TIME
1
2
TRUST
At this point some calculus-based trust relationships become
knowledge based trust relationships.
At this point a few knowledge-based trust relationships where
positive affect is present go on to become identification-based
trust relationships.
1
2
MAIKE U. BUSCH 96
2.4.5 Trust research in sociology
Sociology analyzes the behavior of groups and institutions, meaning the behavior
of the people within such a group. (Zimbardo et al. 2008, p. 2) While the micro
sociology takes a look at families and groups of friends, the macro sociology
explores group behavior in bigger groups such as political parties or companies.
(Kroeber-Riel et al. 2009, p. 11) Therefore, it has a different focus than the
psychology which focuses on the individual itself or the social psychology which
focuses on the individual behavior inside a group, in a social context. (Secord,
Backman 1997, p. 1)
Also, in the field of sociology, trust is researched. Here it has been a topic for a
long time already. (Reckwitz 1999, pp. 311–312) As sociology examines the
relationships between people in a society, trust research is a central topic.
(Preisendörfer 1995) One prominent sociologist is Niklas Luhmann. (Endreß
2013, p. 155) Luhmann claims that trust reduces the complexity of human
behavior. When experiencing trust, humans have a higher potential to experience
and to act. In addition, trust gives them a greater feeling of security, especially in
risky situations. (Krause 1999, p. 211) Luhmann says, this, however, is a risky
advance payment, as trust only suggests security in such situations. (Luhmann
2000, p. 23)
Giddens (1991, p. 244) also states that trust – as a “leap into faith” – enables
humans to have confidence in other people and abstract systems. Trust is then the
bridge between the knowing and the hoping/assuming. According to Giddens,
trust is not based on a good mother-child relationship nor is a person naturally
provided with it. Trust is something that has to be trained and learned as a belief
that one can calculate social relationships and behaviors. (Reckwitz 1999, p. 329)
Trust can be seen as a central component in order to build and strengthen social
relationships and to ensure social order in society. In addition, he also calls trust a
tool to reduce the complexity of life and to provide a framework for social
interactions. (Endress 2001, p. 11)
2.4.6 Trust research in economics
Trust research is also a topic in economic research; in fact trust research gained an
increasingly interested in this field over the past years. For a long time, scientific
LITERATURE REVIEW
97
trust research had been rather neglected in economics compared to the research
done in social sciences. (Held et al. 2005, p. 279) However, especially after the
financial crises in 2008, trust gained much importance for economics. Since then
many studies have been conducted with focus on this field. (Kiefer 2013, pp. 44–
45) There are several directions of trust research in economics: Some researchers
focus on trust within one organization meaning how employees among each
other or in relation with the manager can work on a trustful basis and what good
that can do. Other scientists focus on trust in business relationships between a
company and its customers. Furthermore, research has been done on trust
between people and on trust in an organization. This list can be continued.
(Gilbert 2007; Möllering, Sydow 2005)
Trust can also be approached from a micro and a macro economical perspective.
From the macro economical view it was found out that a society that trusts in its
economy is more efficient and productive in carrying out transactions than those
societies that need costly contracts. National economics which have trust in their
economical actors are much more qualified to grow than others who have no
trust. (Held et al. 2005, pp. 276–277) From the micro economical point of view,
trust is an important aspect to reduce transaction cost in business transactions
between two parties. (Neuberger 2006, p. 13) If the world was a perfect market,
trust in transaction partners would not be necessary. (Hippe 1997, p. 255)
However, the markets are not perfect. (Hayek 1952a) And the individual only has
a limited capacity to process information as well. (Hippe 1997, p. 255) Based on
this aspect, trust research can also be approached from the perspective of the New
Institutional Economics. While in neoclassical economics trust research was not
an issue, the theory of NIE turned its attention to this area. In neoclassical theory
markets are regarded perfect. All players in the markets have perfect information
and act as ‘homo oeconomicus’27. Therefore, there is no need to build in business
27 The ‘homo oeconomicus’ is seen as a purely rational thinking and acting
individual. He takes all his decisions in order to maximize his benefits and
profits. He can do that because he has access to complete information and knows
all about the markets as well as consequences based on his actions. Nevertheless,
especially in recent times, this construct of the homo oeconomicus has been
MAIKE U. BUSCH 98
partnerships, as everything is known concerning the other party, about the others
needs, ambitions and plans. (Watzenberg 2014, p. 113) The representatives of the
NIE on the other hand argue that there is no such person as the ‘homo
oeconomicus’, markets are not perfect, and information asymmetries between
business partners exist. (Hayek 1952b; Kaas 1995c; Kleinaltenkamp, Jacob 2002b;
Richter, Furubotn 2010, pp. 53ff; Opper 2001, p. 602)28 As a result, Arrow said:
„Virtually every commercial transaction has within itself an element of trust.”
(Arrow 1972, p. 357)
Ripperger (2003, pp. 63–82) as one famous representative of researchers, who
have raised the question of trust in economics from the NIE perspective, stresses
the importance of trust in principal-agent relationships. From the NIE
perspective, human beings do not always act and think rationally. This fact leads
to risks for the different parties involved in a business relationship. Opportunistic
behavior of one party might harm the other. The impact in the markets becomes
very complex. Although trust cannot eliminate the risk of opportunistic behavior,
it can reduce the complexity and make business easier to operate. In addition to
the motivation of the actors, Gilbert (2007, p. 69) claims that trust in such a
principal-agent relationship also needs to evolve into the competencies of the
business partners, as only a motivation to fulfill the other’s needs might not be
enough to satisfy. This view corresponds to the findings as Yamagishi and
Yamagishi (1994) stated earlier.
Lately, a socio-economic perspective of trust research in economics has
developed. Resulted from the NIE approach, this perspective tries to combine the
findings of sociology and economic research. (Gilbert 2007, p. 70) Researchers
add, for example, Luhmann’s and Giddens’ perspectives of trust reducing
complexity and the positive expectations of the future when analyzing business
relationships. Trust does not eliminate the risks of these relationships, but it gives
the parties involved a feeling of security. (Gilbert 2007, pp. 74–76)
criticized due to the realization that individuals on markets hardly ever have
access to complete information. (Springer Gabler Verlag 2015a).
28 See also chapter 2.3.1.
LITERATURE REVIEW
99
According to Zucker (1986), trust in a business relationship can have its source
out of three springs29:
Trust can be based on characteristics of the people within a business
relationship. If they are alike or at least similar in their characteristics, trust is
formed easily among them (characteristic-based trust).
Trust can also be based on the experiences the business partners have made
with each other during previous work processes. Or, if no previous projects
haven been conducted, trust can also be based on the reputation one partner
has in the eyes of the other. If earlier experiences have been good and
sufficient for one party, or if the reputation was outstanding, one will easily
be willing to sustain the relationship. If the previous experiences have been
bad or if other business partners have spread negative words about the
potential partner, trust is difficult to achieve (process-based trust).
In a third approach, trust can also develop out of institutions, such as quality
certificates or memberships in certain associations (institutional-based trust).
Since the 1980s marketing research in particular has put a focus on trust research.
(Morgan, Hunt 1994; Dwyer et al. 1987, p. 11) Back then, relationship marketing
was developing. It was an advancement of the marketing which only focussed on
transactions. (Sheth, Parvatiyar 1995) Measuring the degree of relationship
quality between business partners became important. Trust was then determined
a psychological indicator for this quality. (Meffert, Bruhn 2009, pp. 49–54;
Hadwich 2003, pp. 22–23) However, in already 1962, Nerlove and Arrow
researched the construct of trust, or goodwill as they called it, in marketing. They
focussed on the effect advertising efforts have on the customers and how these
effects can also fade away again after a passing of time. (Nerlove, Arrow 1962,
p. 130; Helm 2007, p. 82; Gilbert 2007, p. 66) Nerlove and Arrow are seen as the
ones who introduced the aspect of goodwill into marketing practice. (Helm 2007,
p. 82) While Kaas studied the connection between the NIE and marketing, he also
stressed trust research in marketing. He took a special look at the markets of
contract goods. (Kaas 1992) Contract goods are first of all promises of the
provider to supply the ordered goods. All features of the goods are summarized
29 See also: Cook, Schilke 2010.
MAIKE U. BUSCH 100
in a contract before the actual good is provided. The integration of the customer
in the production process is a requirement. Services are typical contract goods.
(Gilbert 2007, p. 67) Kaas claimed that the importance of trust cannot be overrated
when selling contract goods. (Kaas 1992)
2.4.6.1 Trust between individuals and/or organizations
When explaining trust, it is also important to mention, that trust can develop on
different levels. A person can trust another person. He can also trust several
persons or a group of people. Both conditions are forms of interpersonal trust.
Additionally, a person can also have trust in an organization or an institution
(meaning organizational or institutional trust). And on the highest level one
organization can be trusting another organization, meaning interorganizational
trust. (Münscher 2011, p. 11) For the examination of trust in business
relationships, not only interpersonal trust, but also trust in or between
organizations or institutions plays an important part. In economic theory,
research over the past years has confirmed the opinion that trust not only is a
basic factor for successful interpersonal relationships in business, trust also plays
a key role in cooperation within one or of more than one company. (Gilbert 2007,
p. 76)
However, although lots of research has been done regarding trust within the
marketing (or business) science, researchers have not agreed on a generally
accepted definition of trust. Many different determinants have been explored,
combined, separated and determined as relevant aspects of building and
maintaining trust in business relationships. (Castaldo et al. 2010; Cook, Schilke
2010; Ebert 2009, p. 68) They range from the amount of information provided
(Morgan, Hunt 1994; Sakoa, Helper 1998), flexibility of the partners (Aulakh P.
1996), and similarity of the partners (Doney, Cannon 1997; Morgan, Hunt 1994) to
trustworthiness (Doney, Cannon 1997; Ganesan 1994), reliability (Morgan, Hunt
1994; Ganesan 1994; Johnson, Grayson 2005), or professional competence (Doney,
Cannon 1997; Johnson, Grayson 2005) just to name a few. It seems that different
branches of industry, different cultures or differently organized companies call
LITERATURE REVIEW
101
for different aspects. (Praxmarer 2009; Cook, Schilke 2010; Enke, Greschuchna
2005)
Therefore, different determinants of trust extracted from literature are to be
looked at more closely in the following subchapter.
2.4.6.2 Determinants of trust in economic research
As seen before, there is no single definition of trust. This subchapter tries to
provide an overview of the most cited and researched determinants of trust.
Special focus is laid on trust research from an economic respectively marketing
perspective. These determinants are then lead to the aspect and importance of
communication in building and maintaining trust. Nonetheless, it needs to be
noted, that this listing of determinants makes no claim to be complete. As much
research is being done in this field, only a carefully selected number of
determinants can be taken into account. Moreover, it should be kept in mind that
trust can evolve between individuals and organizations as well, as stated before.
Expertise: Gansean (1994) as well as Donney and Cannon (1997, p. 44) found out
that the ability/competences of the supplier to realize the customers’ particular
wishes is essential for building trust. The ability in this respect is not only the
willingness of the seller, but also his competence in fulfilling the task. (Ganesan
1994) Crosby, Evans, and Cowles (1990), Moormann, Desphande, and Zaltmann
(1992), Johnson and Grayson (2005) as well as Sichtmann (2007) and Rossmann
(2010, p. 81) support these findings with their research results.
Level of experience of supplying firm: The level of experience of a supplying
firm involves on the knowledge a company can provide. The level of experience
differs from the expertise. While expertise focuses on concrete wishes of a
particular customer, the level of experience has a more general perspective. It
refers to the history of a company, to its development and professionalization of
skills, projects done and the education of the employees. (Mayer et al. 1995)
Benevolence: Gansean (1994) studied the relationship between retailers and
vendors. He claims that: “Benevolence focuses on the motives and intentions of the
MAIKE U. BUSCH 102
exchange partner.” (Ganesan 1994) A retailer has to be able to believe that the
vendor acts according to the retailer’s wishes and their agreements; only then,
trust can grow between the two parties. (Lindskold 1978) If the seller is only
concerned with his own welfare, the buyer will distance himself from this
relationship. (Ganesan 1994; Castaldo et al. 2010)
Reputation: Especially if the customer has not gained any previous experiences
with the possible supplier before, reputation is a tool that can be used to create
trust in the suppliers work. (Kenning, Blut 2006, p. 11) The business partners can
influence their reputation by providing public information about themselves and
their company towards the potential customers. (Neumann 2007, p. 31) They have
to work out a communication through different channels in order to spread the
information about their work. They can use tools like public relations,
advertising, the communication of certifications or also opinion leaders in the
private surrounding of a potential business partner, e.g. family or friends.
(Sander, Weywara 2006, p. 254)
Satisfaction with previous interactions: According to Johnson and Grayson
(2005) previous interactions between the business partners as well as previous
product performances influence the development of trust. Positive outcomes are
more likely to result in a trustful relationship. Also other researchers underline
this statement. (Ganesan 1994) Ebert (2009, p. 76) even claims in her research, that
performance is the most mentioned key variable found in trust literature.
Similarity: Similarity between the seller (service provider) and the buyer can
lead to trust. Similarity in this respect refers to the similarity in both parties’
values and interests. If the buyer discovers these common values and interests in
the provider, he is more easily willing to cooperate and oblige towards the
supplier. (Johnson, Grayson 2005; Nienaber, Schewe 2011, p. 16; Crosby et al.
1990, pp. 71–72)
Integrity / honesty / credibility: Honesty, integrity and credibility are factors that
are essential for trust. If these characteristics are not established for the one,
giving the trust, the other party has to expect a great loss of trust in the
LITERATURE REVIEW
103
relationship. (Nienaber, Schewe 2011, p. 16) As uncertainties and perceived risks
are part of every business transaction, honesty can fill this gap by creating trust.
While the uncertainty is still there to a certain degree, the customer does not feel
this way. (Einwiller 2003, pp. 57–59; Ganesan 1994)
Reliability: Reliability describes the situation when a customer is able to count on
the provider to act according to agreements. It can also be considered a basic
characteristic for trust development. (Ganesan 1994; Morgan, Hunt 1994; Dwyer
et al. 1987; Nienaber, Schewe 2011, p. 16)
Information exchange: Information exchange plays a key role in order to develop
and to strengthen trust. (Ebert 2009, p. 76; Sakoa, Helper 1998, p. 406) Particularly,
information exchange including confidential information, strengthens the tie
between both parties. The parties put each other on an equal level, showing
respect and commitment towards their relationship. (Sakoa, Helper 1998, p. 406)
Communication between customer and supplier: Closely connected to the
exchange of information is the factor of communication between the customer
and the supplier. In scientific research, communication is also rated an important
factor both in the creation as well as in the maintenance of trust. Some even say it
is the basis from which trust can emerge. (Morgan, Hunt 1994; Ebert 2009, p. 76;
Sakoa, Helper 1998, p. 406; Mohr, Nevin 1990; Denize, Young 2007; Nienaber,
Schewe 2011, p. 5) Donney and Cannon (1997) found out that the frequency of
contact between the buyer and the seller has an influence on the trust
relationship, too. The more frequent the contact, the stronger the trust in the
salesperson. (Doney, Cannon 1997, p. 44)
Technical assistance: The customer buys the goods and services of the provider.
If then, the provider volunteers to also help out with additional technical
assistance (free of charge) this can lead to a positive feeling from the customer
towards the supplier. He might see that as an indication of the supplier’s
commitment. Furthermore, the technical assistance can underline the competence
of the supplier and his work. Therefore, it leads to significant effects on trust in a
business relationship. (Sakoa, Helper 1998)
MAIKE U. BUSCH 104
Personality of contact person: As human beings are working together, the
personalities of the actors in these business relationships cannot be neglected. Not
only the company itself but also the contact person in the partner firm creates the
basis for trust. The liking as well as the honesty of this person are considered
important in order to deepen the trust and the relationship. (Friman et al. 2002,
p. 407)
Personal level of experience of contact person at supplying firm: Not only the
personality of the contact person plays an important role for business
relationships to develop, the level of experience of the contact person is essential,
too. Even, if a company is known to have a high level of experience, the customer
has to interact with his contact person. This person needs to prove to be
competent of fulfilling the task given in order to gain the customer’s trust. If one
feels in good hands, perceived risks are reduced and trust can develop. (Crosby et
al. 1990, pp. 71–72; Busch, Wilson 1976)
Cultural differences: According to Praxmarer (2009) as well as Münscher (2011,
p. 4) many researchers have mentioned the influence of culture and cultural
differences on trust; however, few researchers have actually conducted scientific
studies on the issue. Although trusting always means taking risks, the different
mechanisms that lead to trust can have different meanings or impacts of the
development of trust due to the cultural differences. (Praxmarer 2009, pp. 626–
627; Münscher 2011, p. 34)
Different value systems, like the importance of being on time for appointments,
can lead to difficulties when establishing trust. (Sitkin, Roth 1993, p. 371) These
different values can lead to misunderstandings. These misunderstandings then
might result in a less efficient communication that is not able to reduce fears and
worries regarding the risks to be taken with this business relationship. (Voldnes
et al. 2012)
Similar to the aspects of experience, the company as a whole can be seen as one
unit or the single contact person can be the crucial factor. This divides the cultural
determinant to create trust into two single points: The cultural background of the
supplying firm and the cultural background of the supplier’s contact person.
(Münscher 2011, p. 11)
LITERATURE REVIEW
105
2.4.6.3 Trust and communication
The development of trust is dependent on communication. (Herger 2006, p. 41)
First of all, in order to get in touch with a potential business partner, a customer
usually checks the market for relevant information about this potential partner.
This is often done by contacting befriended companies or companies in the
market that have gained experiences already. Therefore, the potential partner
company should have a positive reputation in the market. However, the
reputation is not only essential in the phase of the initiating a business contact. A
positive reputation has to be kept alive. Consequently, companies need to work
on keeping their reputation on the same level, if not improving their reputation
constantly. (Buß 2007)
Hubig and Siemoneit (2007) researched the connection and dependency between
communication and trust. They state communication is basically the basis for
trust to develop as communication leads to getting to know one another. Trust is
a construct that needs time to establish between business partners. It cannot be
inherited right away. Therefore, it is necessary to focus on communication and to
keep up and deepen the communication over the passing of time. However, trust
not only depends on communication. Also communication needs trust between
the two parties to get deeper and more detailed. It is like a circular flow in which
one of the partners has to start offering trust towards the other to get the
circulation moving. In their paper, they present a list of communication aspects
they have researched that can lead to build and strengthen trust in a business
relationship (Hubig, Siemoneit 2007, pp. 171–188):
• Both sides should communicate directly with each other. They should
communicate in a way that each sides feels understood and treated well.30
Especially in business-to-business relationships, the direct communication
earns an important status due to the characteristics of these relationships.31
This subject has already been broached in chapter 2.2.3 when business-to-
business communication methods were discussed.
30 See also: Rossmann 2010, p. 80.
31 See also: Kirchgeorg, Springer 2010, p. 541.
MAIKE U. BUSCH 106
• An organization or company that shows stability and calculability in its acting
and communication is more likely to be trusted than a company which
changes its doing according to the ways that are most beneficial for it in an
opportunistic way.
• Business partners should practice openness and transparency. If difficulties or
problems occur, a partner should not try to whitewash delicate issues nor
should he wait too long to inform the other party. He should communicate
openly and offer ways out of the situation. Waiting for public pressure to
force transmission of such information usually causes distrust.
• Information given to the partner should show consistency and correctness,
especially if different departments of one company are involved. It is even
better to provide ways to prove the correctness of data given.
• If one company tries to sell his goods or services to another, it is usually
helpful to provide samples or the opportunity to collect first experiences with
the items to the potential customer. This can be done through exhibitions,
open days, conferences, customer events and so on.
• Furthermore, offering complaint hotlines and answers to consumers’
questions underline one’s willingness to care.
• A company’s reputation is also essential for the creation of trust. This
reputation should not only be based on the opinion of other customers but
also be corroborated by independent sources. These could be independent
media but also certifications.
• Last but not least, Hubig and Siemoneit broach the issue of showing public
interest as well as social responsibility. This could be by supporting charity or
by actively showing environmental awareness during the production process,
for example.
Other authors also indicate the importance of not only a consistency in
communication but also communication on a regular basis. (Herger 2006, p. 41)
One overall essential factor is also the sales personnel. All caring and talking is
rather a waste of time if the sales personnel is incompetent in advising and
discussing project related issues with the (potential) customer. (Doney, Cannon
1997, pp. 39–40; Eckardt 2010, pp. 53–57)
LITERATURE REVIEW
107
To sum up this chapter on trust, it becomes obvious that trust itself is a very
complex construct due to its origins in different areas of science as well as its
individuality. However, several determinants of trust that support establishing
and nourishing trust can be identified by researching the relevant literature.
As trust is also a very personal construct, communication plays a key role in trust
research and development. Again, several aspects of how communication can
contribute towards trust can be extracted from the literature.
Nevertheless, it becomes obvious that trust cannot be defined by some overall
valid determinantes and ways of communication which can be used universally
in all industries and cultures. Therefore, the necessity of a detailed research
within the industry of focus, crystallizes out of the previous research.
The following quote gets to the heart of trust in relationships between two or
more parties and recapitulates the findings precisely:
“Trust is the willingness of a party to be vulnerable to the actions of another party
based on the expectation that the other will perform a particular action important to
the trustor, irrespective of the ability to monitor or control that other party.” (Mayer
et al. 1995, p. 711)
MAIKE U. BUSCH 108
2.5 INTERIM CONCLUSION CHAPTER 2
Chapter 2 concentrates on the different scientific areas involved when trying to
solve the current problem of the German trade fair organizations to sell services.
Services itself are first of all complex constructs. They are difficult to define. The
immateriality as well as the integration of the external factor are two major
characteristics. These characteristics lead to additional traits, making service
marketing a diverse challenge for marketers. The degree of immateriality, the
type of integration of the external factor plus the level of standardization have to
be considered. Furthermore, the high amount of credence and experience
qualities of services call for a more multifaceted marketing approach. Not only
the standard channels of marketing but also the relationships and people
involved should be considered. (Chapter 2.1)
When services are sold in business markets, the facets of those markets need to be
taken into account also. Business markets display a different structure than
consumer markets with fewer actors in the markets and often a higher degree of
specialization. These aspects might lead to a different buying behavior, demand
and marketing approach. Of high importance is the analysis of the buying center
of potential customers leading to specialized sales approaches. (Chapter 2.2)
In both areas of marketing, service marketing and business-to-business
marketing, the scientific world claims the relevance of the seller-buyer
relationships. This aspect then leads to the perspective of the principal-agent
approach as part of the New Institutional Economics. Especially when tying to
sell goods with a high level of credence qualities to an organization as customer,
information asymmetries on both sides are involved. The seller might have more
insight on production processes and resources while the buyer has a clearer
picture on his wishes and needs. Problems, like the dangers of adverse selection,
moral hazard or hold-ups might occur. They might avert potential business
relationships, damage existing relationships or hamper future business affairs.
Different strategies might be options to reduce the feeling of uncertainties. Both
sides can work on a reduction of the information asymmetry, for example.
However, since service are contract goods with a high level of credence qualities,

LITERATURE REVIEW
109
the most promising option to establish and ensure a sustainable service-provider-
buyer relationship is the creation of trust between the parties involved, as the
literature review reveals. (Chapter 2.3)
In the next step, the aspect of trust has been considered, leading to a complex
construct. Trust has been a topic in many scientific areas. In economics trust
research is still a rather young field of interest. Yet, findings have shown that due
to its complexity and linkage to credence aspects, no overall valid results could be
retrieved so far which determinants of trust lead to an establishment of trust in
business markets. The review of the current state of research has provided a
number of possible aspects responsible for creating trust. Yet, research has also
shown, that conditions vary in the different industries. (Chapter 2.4)
Drawing an interim conclusion, the previously conducted research reveals the
necessity of additional research right on the German trade fair market in order to
answer the research questions.
First of all, an overview of the German trade fair market is to be provided in the
proceeding chapter, also directing a detailed view on the trade fair services in
focus of this project.
Afterwards, a primary research is conducted to expose the trust determinants
leading to a sustainable seller-buyer relationship in this sector of industry.

MAIKE U. BUSCH 110

111
3 THE GERMAN TRADE FAIR MARKET
3.1 HISTORICAL DEVELOPMENT & SITUATION TODAY
Historical development
In 1329 the German term ‘Messe’ (meaning trade fair/trade show/exhibition) was
mentioned in German literature for the first time. (Jarnut 1991, p. 2) Back then,
however, the meaning of this term was divers: On the one hand, it could be used
for a market, where goods were sold. On the other hand, it was also used for
pleasurable festivals, like a carnival where attractions were offered to marvel at
for the visitors. Not before the middle of the 16th century the term was commonly
used as a synonym for a centralized market place for long-distance trading with
regulated monetary transactions. (Rodekamp 2003, p. 7; Maurer 1970, p. 5)32 This
particular trade fair model of long-distance trading was based on the early trade
fair model that had developed in the Champagne, France, in the 12th century.
(Neven 2005, p. 73)
Nowadays, it is impossible to state exactly, when and where the first trade fair of
this kind took place in Europe. Nevertheless, historians consider the trade fairs,
which were held in the Champagne in the 11th and 12th century to be the first ones
of their kind. Back then, merchants from Flanders, France, Italy and Central
Europe met to exchange goods and carry them to their home markets afterwards.
It was the time when fairgrounds, like the well respected fabric markets in Bruges
or Antwerp, developed across Europe. (Rodekamp 2003, p. 9)
In the 14th century, the east-west-axis became more interesting for many
merchants. German fairgrounds developed in Frankfurt/Main as well as in
Leipzig with connections to Eastern and Southern Europe down towards Greece.
In the beginning Frankfurt/Main used to be the stronger trade market, that shifted
later on making Leipzig the number one fairground in Germany. (Rodekamp
2003, pp. 9–10) During that time, such trade fairs were mostly held in periodic
cycles linked to religious celebrations. (Rodekamp 2003, p. 8)
32 See also: Schoop 2003, p. 18.

MAIKE U. BUSCH 112
In the 19th century, due to the industrialization, the character of trade fairs
changed again. While in former times, these fairs were established to exchange
goods, they transformed into sample exhibitions. (Ludwig 1999, pp. 353–361;
Kaufhold 1996, p. 266) The aim of these sample exhibitions was to display and
present the state of the art in the technical development of that time. The actual
physical exchange of goods was not the prior intention anymore. The trade fair in
Leipzig, Germany, was a pioneer in this transition – and the transition went well.
It assured the superior position of the fairground in Leipzig. (Kaufhold 1996,
p. 266) Despite the two World Wars and their aftermath, the constitution of
sample exhibitions survived and is stated as basis for the international trade fair
industry until today. (Rodekamp 1997, pp. 353–357)
In Germany, the industry grew dissatisfied with the trade fair sector’s
development in the beginning of the 20th century. Small exhibitions and fairs
sprouted everywhere. There were break-downs and scandals all around these
shows. Any trust in the fairs and their organizations was lost. Therefore, the
industry urged a creation of a committee that was in charge of reorganizing the
trade fair sector with regards to the wishes of the exhibiting industries. A
precursor of today’s AUMA (Ausstellung- und Messeausschuss der Deutschen
Wirtschaft e.V. / Association of German Trade Fair Industry) was established in
1907. It was established as an association to represent the concerns of industrial
exhibitors. Due to the reorganization of the trade fair market and industry in
Germany, the fair ground in Leipzig lost its monopoly position along the way. A
decentralization of the German trade fair sector began. (Döring 1956, pp. 22ff;
Neven 2005, p. 81; AUMA, Ausstellungs- und Messe-Ausschuss der Deutschen
Wirtschaft e.V. 2007) After World War Two and the time of reconstruction, the
AUMA became an even bigger and more powerful institution. The trade fair
organizing companies joined the AUMA. By 1956 the institution represented not
only the exhibitors anymore, but also the visitors as well as the organizing
companies. In that time the whole sector re-established again after the war, and
Hannover, Cologne and Frankfurt/Main resumed their businesses, further
locations followed in the western part of Germany. (Fried, Boockmann 1990;
Tandetzki, Kock 1999; Tasch 1997; Neven 2005, p. 83; AUMA, Ausstellungs- und
Messe-Ausschuss der Deutschen Wirtschaft e.V. 2007) The trade fair in Leipzig
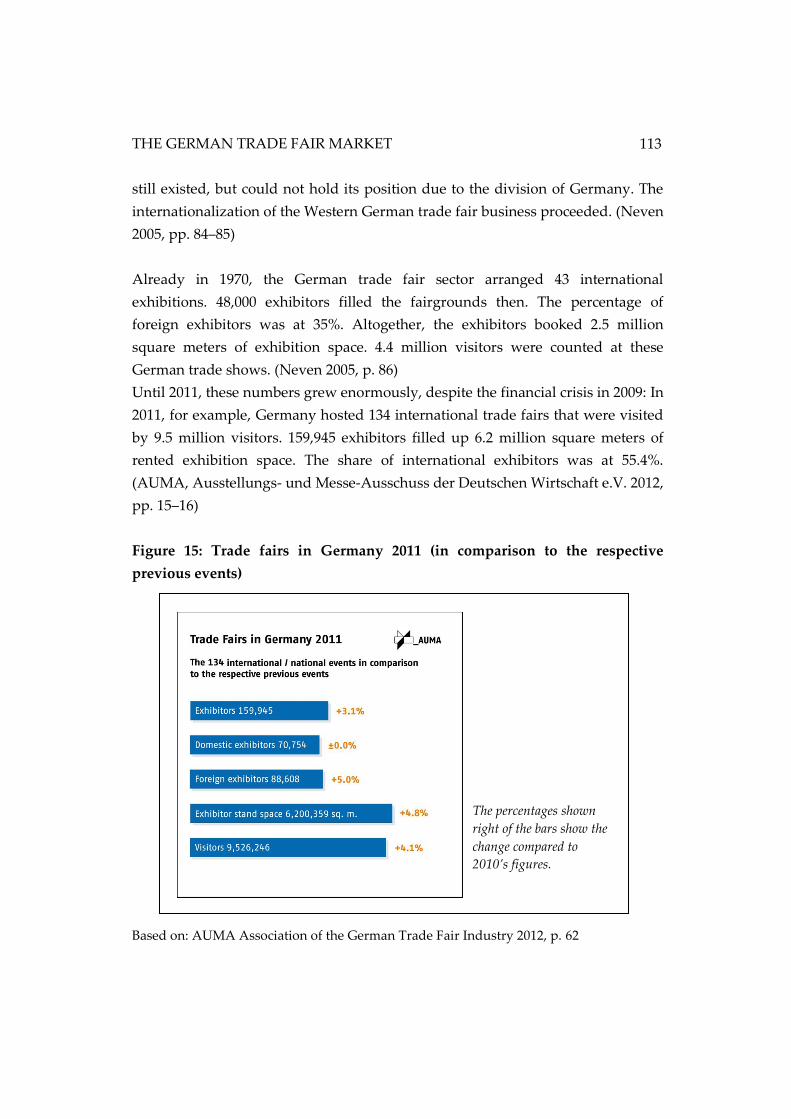
THE GERMAN TRADE FAIR MARKET
113
still existed, but could not hold its position due to the division of Germany. The
internationalization of the Western German trade fair business proceeded. (Neven
2005, pp. 84–85)
Already in 1970, the German trade fair sector arranged 43 international
exhibitions. 48,000 exhibitors filled the fairgrounds then. The percentage of
foreign exhibitors was at 35%. Altogether, the exhibitors booked 2.5 million
square meters of exhibition space. 4.4 million visitors were counted at these
German trade shows. (Neven 2005, p. 86)
Until 2011, these numbers grew enormously, despite the financial crisis in 2009: In
2011, for example, Germany hosted 134 international trade fairs that were visited
by 9.5 million visitors. 159,945 exhibitors filled up 6.2 million square meters of
rented exhibition space. The share of international exhibitors was at 55.4%.
(AUMA, Ausstellungs- und Messe-Ausschuss der Deutschen Wirtschaft e.V. 2012,
pp. 15–16)
Figure 15: Trade fairs in Germany 2011 (in comparison to the respective
previous events)
Based on: AUMA Association of the German Trade Fair Industry 2012, p. 62
The percentages shown
right of the bars show the
change compared to
2010’s figures.
MAIKE U. BUSCH 114
Situation today
According to Pepels (2014, p. 401) Germany is the most important exhibition place
due to its geographical location and its economic significance especially regarding
the foreign trade.
In May 2015, the AUMA released the actual economic figures of 2014. In 2014,
besides 154 regional fairs33, 176 international trade fairs took place in Germany.
Compared to the previous exhibitions, organizers talk about slightly positive
results.34 At these international fairs, 179,645 exhibitors presented their companies
and goods to 9.72 million visitors. 6.82 million square meters exhibition space
were used. The number of foreign exhibitors on German fair grounds has grown.
More than 57% of the exhibitors were of foreign origin, mainly from Europe or
Asia. (AUMA, Ausstellungs- und Messe-Ausschuss der Deutschen Wirtschaft e.V.
2015b, pp. 15-16, 20) The graph below illustrates these results:
33 The 154 regional trade fairs cumulated 52,602 exhibitors and 5,887,966
visitors on 1,5 million m² exhibition space. (AUMA, Ausstellungs- und Messe-
Ausschuss der Deutschen Wirtschaft e.V. 2015b, p. 16)
34 Note of the author: As some trade fairs do not have a yearly cycle,
comparisons cannot accurately be made by just comparing the figures of the
previous years.
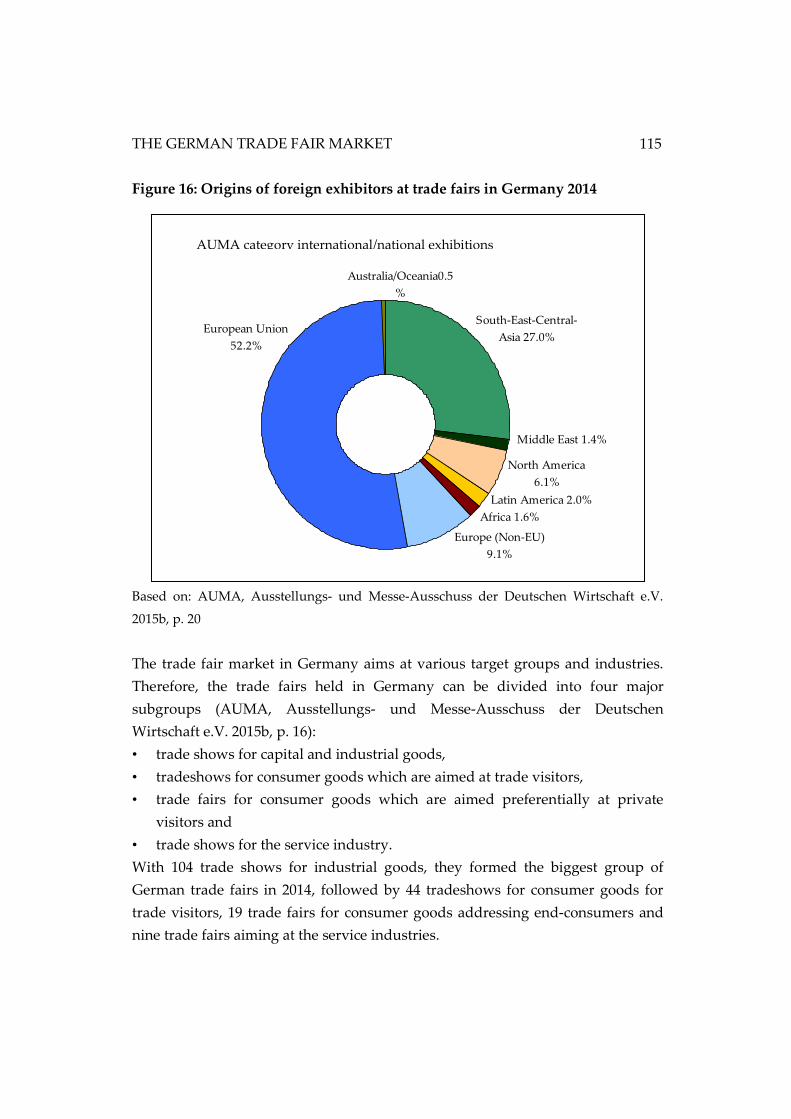
THE GERMAN TRADE FAIR MARKET
115
Figure 16: Origins of foreign exhibitors at trade fairs in Germany 2014
Based on: AUMA, Ausstellungs- und Messe-Ausschuss der Deutschen Wirtschaft e.V.
2015b, p. 20
The trade fair market in Germany aims at various target groups and industries.
Therefore, the trade fairs held in Germany can be divided into four major
subgroups (AUMA, Ausstellungs- und Messe-Ausschuss der Deutschen
Wirtschaft e.V. 2015b, p. 16):
• trade shows for capital and industrial goods,
• tradeshows for consumer goods which are aimed at trade visitors,
• trade fairs for consumer goods which are aimed preferentially at private
visitors and
• trade shows for the service industry.
With 104 trade shows for industrial goods, they formed the biggest group of
German trade fairs in 2014, followed by 44 tradeshows for consumer goods for
trade visitors, 19 trade fairs for consumer goods addressing end-consumers and
nine trade fairs aiming at the service industries.
Europe (Non-EU)
9.1%
Latin America 2.0%
Africa 1.6%
North America
6.1%
Middle East 1.4%
European Union
52.2%
Australia/Oceania0.5
%
South-East-Central-
Asia 27.0%
AUMA category international/national exhibitions
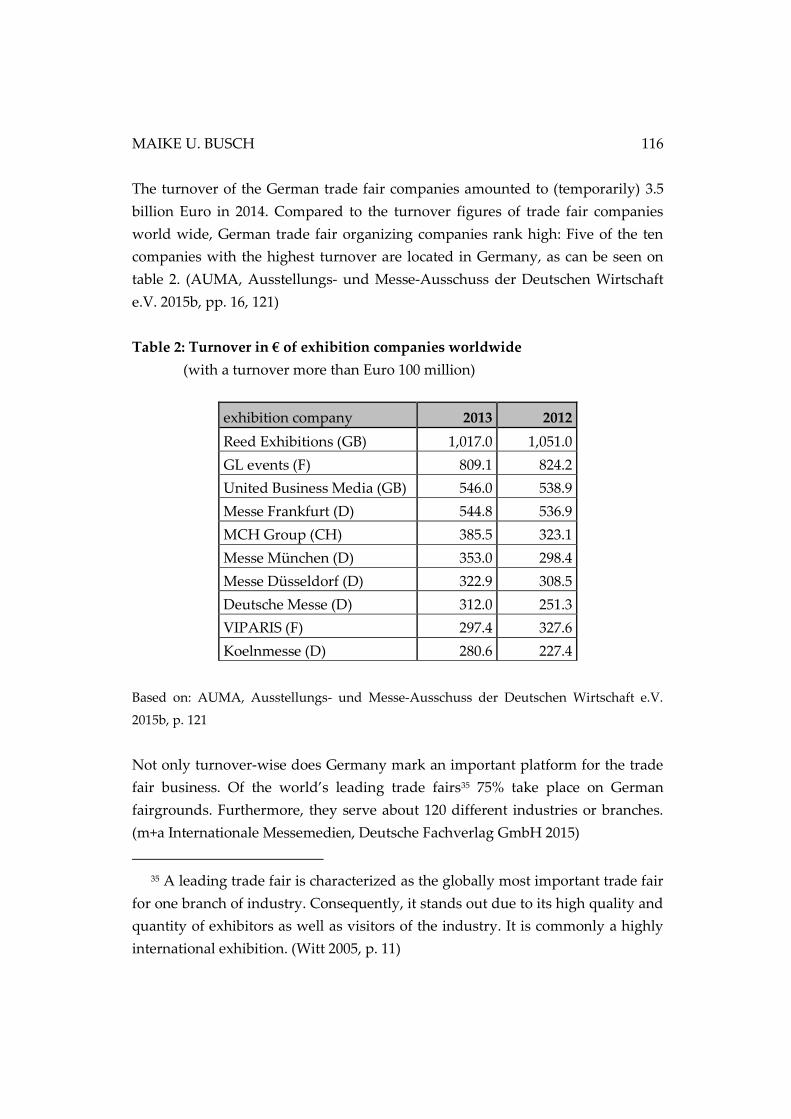
MAIKE U. BUSCH 116
The turnover of the German trade fair companies amounted to (temporarily) 3.5
billion Euro in 2014. Compared to the turnover figures of trade fair companies
world wide, German trade fair organizing companies rank high: Five of the ten
companies with the highest turnover are located in Germany, as can be seen on
table 2. (AUMA, Ausstellungs- und Messe-Ausschuss der Deutschen Wirtschaft
e.V. 2015b, pp. 16, 121)
Table 2: Turnover in € of exhibition companies worldwide
(with a turnover more than Euro 100 million)
exhibition company 2013 2012
Reed Exhibitions (GB) 1,017.0 1,051.0
GL events (F) 809.1 824.2
United Business Media (GB) 546.0 538.9
Messe Frankfurt (D) 544.8 536.9
MCH Group (CH) 385.5 323.1
Messe München (D) 353.0 298.4
Messe Düsseldorf (D) 322.9 308.5
Deutsche Messe (D) 312.0 251.3
VIPARIS (F) 297.4 327.6
Koelnmesse (D) 280.6 227.4
Based on: AUMA, Ausstellungs- und Messe-Ausschuss der Deutschen Wirtschaft e.V.
2015b, p. 121
Not only turnover-wise does Germany mark an important platform for the trade
fair business. Of the world’s leading trade fairs35 75% take place on German
fairgrounds. Furthermore, they serve about 120 different industries or branches.
(m+a Internationale Messemedien, Deutsche Fachverlag GmbH 2015)
35 A leading trade fair is characterized as the globally most important trade fair
for one branch of industry. Consequently, it stands out due to its high quality and
quantity of exhibitors as well as visitors of the industry. It is commonly a highly
international exhibition. (Witt 2005, p. 11)
THE GERMAN TRADE FAIR MARKET
117
The AUMA grew together with the market. Over the years, many tasks and
scopes of duties accrued. Not only does the association represent the interests of
the groups involved within Germany today. The AUMA also maintains contacts
with trade fair organizations worldwide and is a member of UFI, the global
association of the exhibition industry. The AUMA collects trade fair data from all
over the world and provides this to its members and the potential exhibitors at
German trade fairs. In addition, the AUMA inter alia supports the Federal
Ministry of Economics regarding participations in international fairs and
conducts scientific research as well as educational programs on the trade fair
industry. (Kötter 2013, pp. 23–24)
The seven German trade fair organizing companies with the highest turnover and
the most exhibition space per fairground formed an additional institution to the
AUMA. (AUMA, Ausstellungs- und Messe-Ausschuss der Deutschen Wirtschaft
e.V. 2015b, pp. 121, 124) The trade fair companies of Frankfurt/Main, Munich,
Düsseldorf, Hannover, Cologne, Nurnberg and Berlin have united and formed
the “Gemeinschaft Deutscher Großmessen” registered association in order to
represent the shared values and interest as well as concerns of the overall German
trade fair market with the public. (Gemeinschaft Deutscher Großmessen e.V.
2014)
Most of the international (or supraregional) trade fair companies in Germany are
organized in a similar way: They are not privately owned but have public
shareholders, like the town council or the federal state they are located in.
Another characteristic of these companies is the ownership of an own fairground,
equipped with exhibition halls. Therefore, these trade fair companies aim not only
at the highest turnover but also have to consider reaching economic goals for the
local businesses. Examples would be spendings of the visitors and exhibitors on
restaurant visits, hotel accommodation, cab rides and so on. (Witt 2005, pp. 6–8)
MAIKE U. BUSCH 118
3.2 CORPORATIVE ACTORS ON THE GERMAN TRADE FAIR MARKET
The primary target groups for trade fair organizers consist of the fair’s exhibitors
and the fair’s visitors as they both bring money to the fair organizing company. It
is a typical characteristic for trade fairs, that the exhibitors as well as the visitors
are not only customers, but also part of the product ‘trade fair’. Only a right
amount of each group and also the right quality of them make a trade fair
successful. (Witt 2005, pp. 9–10; Grimm 2004, pp. 68-70, 72-73) It is not only
important to get the biggest companies of the industries involved, but to get a
well mixed audience on both sides. (Zygojannis 2005, pp. 38–39)
However, not only the exhibitors and visitors are actors in the trade fair market.
According to Zygojannis (2005) the stakeholders can be divided into primary
stakeholders and secondary stakeholders: The trade fair organizer, the exhibitors
as well as the visitors are clearly the primary actors. Yet, on the secondary
ground, there are also the company owning the fairground (if another than the
one organizing it), trade associations, the town the fairground is located at, the
media, the local businesses and the trade fair service providers.36 Figure 17
illustrates the different groups of actors and states their main duties.
36 See also: Robertz 1999, pp. 34–41.
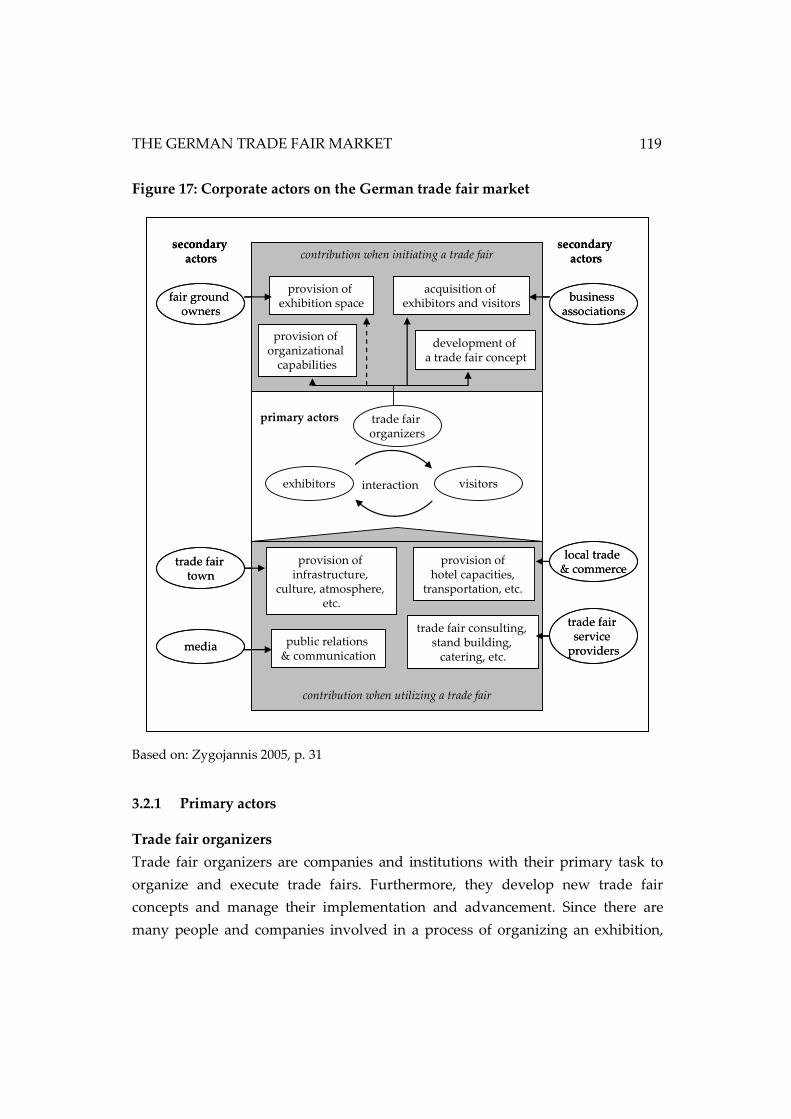
THE GERMAN TRADE FAIR MARKET
119
Figure 17: Corporate actors on the German trade fair market
Based on: Zygojannis 2005, p. 31
3.2.1 Primary actors
Trade fair organizers
Trade fair organizers are companies and institutions with their primary task to
organize and execute trade fairs. Furthermore, they develop new trade fair
concepts and manage their implementation and advancement. Since there are
many people and companies involved in a process of organizing an exhibition,
provision of organizational
capabilities
trade fair organizers
exhibitors visitorsinteraction
primary actors
provision of exhibition space
acquisition of exhibitors and visitors
development of a trade fair concept
public relations & communication
trade fair consulting, stand building,
catering, etc.
provision of hotel capacities,
transportation, etc.
provision of infrastructure,
culture, atmosphere, etc.
fair ground owners
trade fair town
media
business associations
local trade & commerce
trade fair service
providers
contribution when initiating a trade fair
contribution when utilizing a trade fair
secondaryactors
secondaryactors
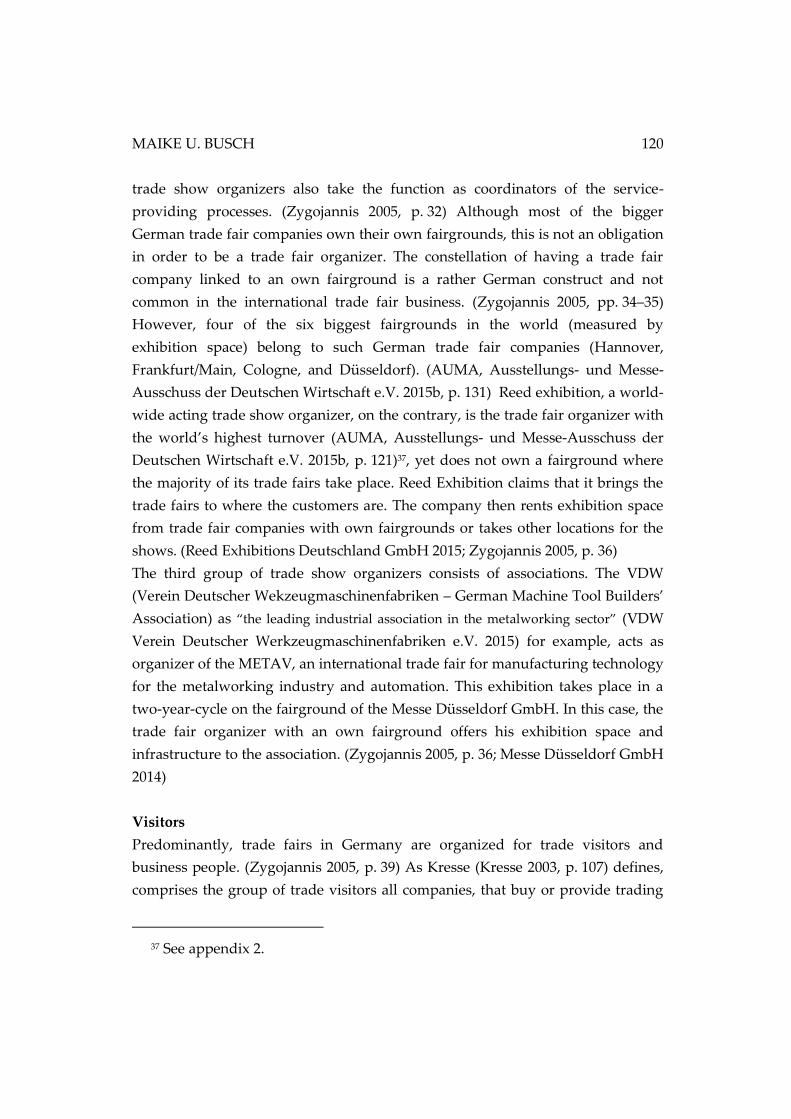
MAIKE U. BUSCH 120
trade show organizers also take the function as coordinators of the service-
providing processes. (Zygojannis 2005, p. 32) Although most of the bigger
German trade fair companies own their own fairgrounds, this is not an obligation
in order to be a trade fair organizer. The constellation of having a trade fair
company linked to an own fairground is a rather German construct and not
common in the international trade fair business. (Zygojannis 2005, pp. 34–35)
However, four of the six biggest fairgrounds in the world (measured by
exhibition space) belong to such German trade fair companies (Hannover,
Frankfurt/Main, Cologne, and Düsseldorf). (AUMA, Ausstellungs- und Messe-
Ausschuss der Deutschen Wirtschaft e.V. 2015b, p. 131) Reed exhibition, a world-
wide acting trade show organizer, on the contrary, is the trade fair organizer with
the world’s highest turnover (AUMA, Ausstellungs- und Messe-Ausschuss der
Deutschen Wirtschaft e.V. 2015b, p. 121)37, yet does not own a fairground where
the majority of its trade fairs take place. Reed Exhibition claims that it brings the
trade fairs to where the customers are. The company then rents exhibition space
from trade fair companies with own fairgrounds or takes other locations for the
shows. (Reed Exhibitions Deutschland GmbH 2015; Zygojannis 2005, p. 36)
The third group of trade show organizers consists of associations. The VDW
(Verein Deutscher Wekzeugmaschinenfabriken – German Machine Tool Builders’
Association) as “the leading industrial association in the metalworking sector” (VDW
Verein Deutscher Werkzeugmaschinenfabriken e.V. 2015) for example, acts as
organizer of the METAV, an international trade fair for manufacturing technology
for the metalworking industry and automation. This exhibition takes place in a
two-year-cycle on the fairground of the Messe Düsseldorf GmbH. In this case, the
trade fair organizer with an own fairground offers his exhibition space and
infrastructure to the association. (Zygojannis 2005, p. 36; Messe Düsseldorf GmbH
2014)
Visitors
Predominantly, trade fairs in Germany are organized for trade visitors and
business people. (Zygojannis 2005, p. 39) As Kresse (Kresse 2003, p. 107) defines,
comprises the group of trade visitors all companies, that buy or provide trading
37 See appendix 2.
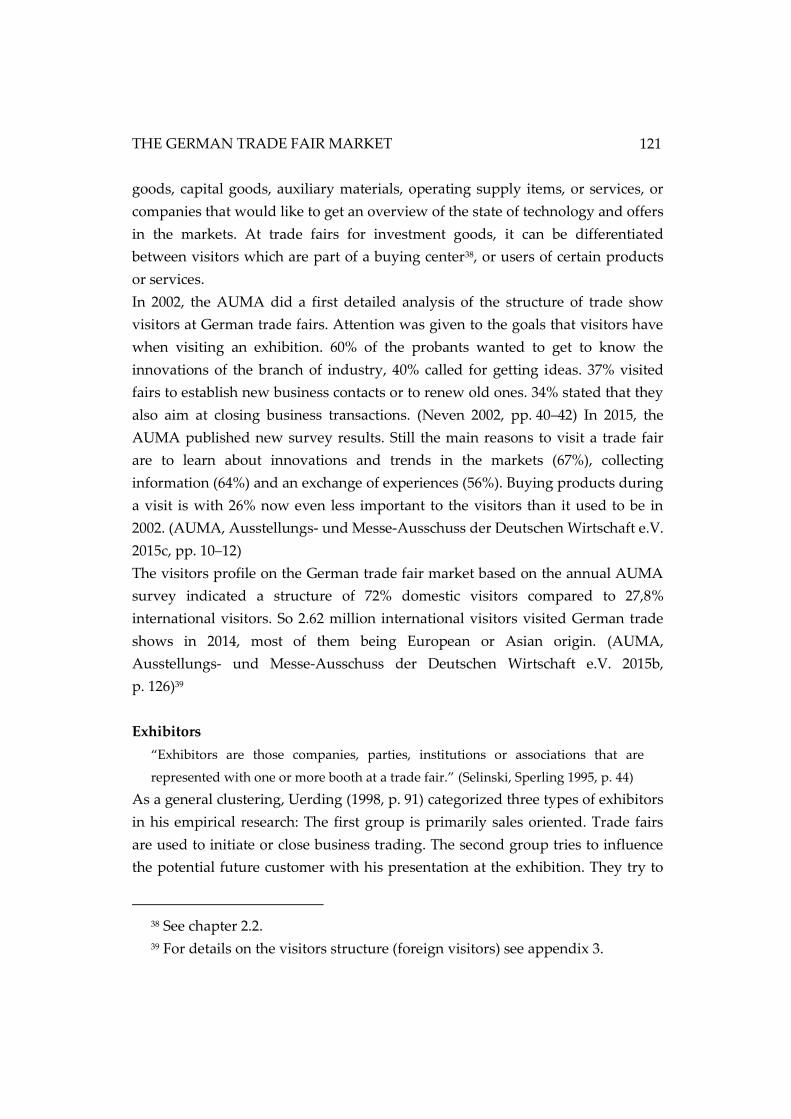
THE GERMAN TRADE FAIR MARKET
121
goods, capital goods, auxiliary materials, operating supply items, or services, or
companies that would like to get an overview of the state of technology and offers
in the markets. At trade fairs for investment goods, it can be differentiated
between visitors which are part of a buying center38, or users of certain products
or services.
In 2002, the AUMA did a first detailed analysis of the structure of trade show
visitors at German trade fairs. Attention was given to the goals that visitors have
when visiting an exhibition. 60% of the probants wanted to get to know the
innovations of the branch of industry, 40% called for getting ideas. 37% visited
fairs to establish new business contacts or to renew old ones. 34% stated that they
also aim at closing business transactions. (Neven 2002, pp. 40–42) In 2015, the
AUMA published new survey results. Still the main reasons to visit a trade fair
are to learn about innovations and trends in the markets (67%), collecting
information (64%) and an exchange of experiences (56%). Buying products during
a visit is with 26% now even less important to the visitors than it used to be in
2002. (AUMA, Ausstellungs- und Messe-Ausschuss der Deutschen Wirtschaft e.V.
2015c, pp. 10–12)
The visitors profile on the German trade fair market based on the annual AUMA
survey indicated a structure of 72% domestic visitors compared to 27,8%
international visitors. So 2.62 million international visitors visited German trade
shows in 2014, most of them being European or Asian origin. (AUMA,
Ausstellungs- und Messe-Ausschuss der Deutschen Wirtschaft e.V. 2015b,
p. 126)39
Exhibitors
“Exhibitors are those companies, parties, institutions or associations that are
represented with one or more booth at a trade fair.” (Selinski, Sperling 1995, p. 44)
As a general clustering, Uerding (1998, p. 91) categorized three types of exhibitors
in his empirical research: The first group is primarily sales oriented. Trade fairs
are used to initiate or close business trading. The second group tries to influence
the potential future customer with his presentation at the exhibition. They try to
38 See chapter 2.2.
39 For details on the visitors structure (foreign visitors) see appendix 3.
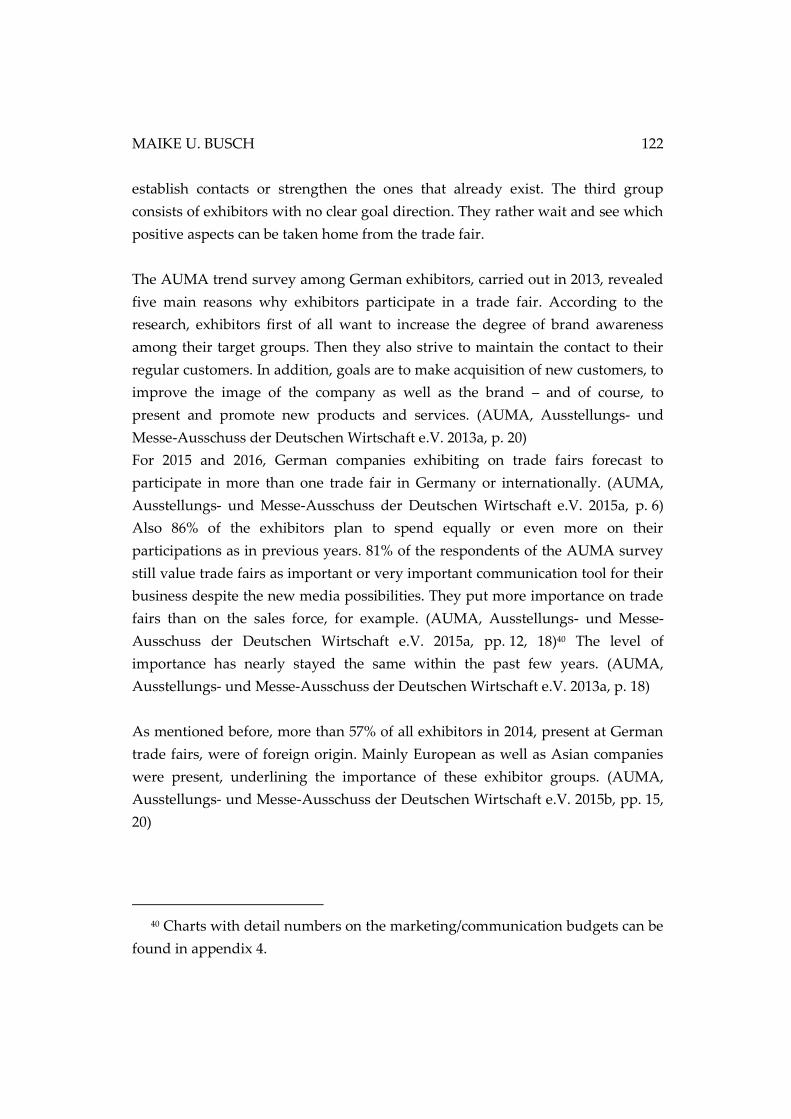
MAIKE U. BUSCH 122
establish contacts or strengthen the ones that already exist. The third group
consists of exhibitors with no clear goal direction. They rather wait and see which
positive aspects can be taken home from the trade fair.
The AUMA trend survey among German exhibitors, carried out in 2013, revealed
five main reasons why exhibitors participate in a trade fair. According to the
research, exhibitors first of all want to increase the degree of brand awareness
among their target groups. Then they also strive to maintain the contact to their
regular customers. In addition, goals are to make acquisition of new customers, to
improve the image of the company as well as the brand – and of course, to
present and promote new products and services. (AUMA, Ausstellungs- und
Messe-Ausschuss der Deutschen Wirtschaft e.V. 2013a, p. 20)
For 2015 and 2016, German companies exhibiting on trade fairs forecast to
participate in more than one trade fair in Germany or internationally. (AUMA,
Ausstellungs- und Messe-Ausschuss der Deutschen Wirtschaft e.V. 2015a, p. 6)
Also 86% of the exhibitors plan to spend equally or even more on their
participations as in previous years. 81% of the respondents of the AUMA survey
still value trade fairs as important or very important communication tool for their
business despite the new media possibilities. They put more importance on trade
fairs than on the sales force, for example. (AUMA, Ausstellungs- und Messe-
Ausschuss der Deutschen Wirtschaft e.V. 2015a, pp. 12, 18)40 The level of
importance has nearly stayed the same within the past few years. (AUMA,
Ausstellungs- und Messe-Ausschuss der Deutschen Wirtschaft e.V. 2013a, p. 18)
As mentioned before, more than 57% of all exhibitors in 2014, present at German
trade fairs, were of foreign origin. Mainly European as well as Asian companies
were present, underlining the importance of these exhibitor groups. (AUMA,
Ausstellungs- und Messe-Ausschuss der Deutschen Wirtschaft e.V. 2015b, pp. 15,
20)
40 Charts with detail numbers on the marketing/communication budgets can be
found in appendix 4.

THE GERMAN TRADE FAIR MARKET
123
3.2.2 Secondary actors
As seen in the illustration of the actors on German trade fair markets (figure 17),
there are more parties involved in the organization of a trade fair, than just those
three mentioned above. Closely linked to the main organizers of the trade fair, is
also the owner of the fairground (if not the same as the organizer). The business
associations as well as the trade fair service-providers have to be mentioned. In
addition, the local businesses, the township of the fairground and also the media
has a share in a successful trade show organization.
The fairground owner as well as the business associations both can be closely
involved in the planning of an exhibition. As mentioned before, in Germany, the
trade fair companies are often also the owner of the fairground. On the other
hand, business associations can act as a host of a trade show, as the following
paragraphs will show.
Fair ground owner
Basically, the owner of the fairground is in charge of offering the exhibition halls,
the exterior exhibition space as well as a well functioning infrastructure on the
fairground. Certain exhibitions have special requirements for the fairground.
Trade fairs like the EMO in Hannover, the leading international trade fair for the
machine tool industry, for example, call for carrying capacity of the halls’ floors
due to heavy machines that are presented. (Deutsche Messe AG 2014) In addition,
streets on the fairground are needed to carry these machines to a company’s
rented exhibition space. The BAUMA in Munich, the world's largest and probably
most important trade fair for the building industry (Messe München GmbH 2014)
requires a big area outside the halls to display the different machinery, like lifting
appliances and conveyors which would not fit into the exhibition halls. Therefore,
the structure of a fairground can play an important part in choosing the right
location for a new exhibition. (Zygojannis 2005, pp. 43–44) The biggest seven
German trade fair companies (untited in the Gemeinschaft deutscher
Großemessen e.V.) have an cumulated exhibition space of 2,825,208 square meter
available. (AUMA, Ausstellungs- und Messe-Ausschuss der Deutschen Wirtschaft
e.V. 2015b, p. 124)
MAIKE U. BUSCH 124
In order to stay compatible world-wide, German trade fair companies also invest
in building new fairgrounds in other countries. The 2001 opened Shanghai New
Exhibition Center (SNIEC) is a joint-venture of Deutsche Messe AG of Hannover,
Messe Düsseldorf GmbH and Messe München GmbH. (Shanghai New
International Expo Centre Co., Ltd. 2011)
Business associations
As stated before, business associations can act as trade fair organizers. However,
even if not in the role as organizer, business associations can influence the
appearance and the character of a trade fair. As a voice of the branch of industry
they represent, business associations are usually members of the industry’s trade
fair advisory board. In this function, they play an active role in the design of a
new exhibition or a development of an existing trade fair. Theoretically, it would
also be possible that a business association builds a fairground itself to act as a
trade fair company in its original meaning. (Zygojannis 2005, pp. 41–43)
Trade fair town
Trade fair towns are the towns with fairgrounds and where trade fairs take place
frequently. Usually, these towns are located in areas with a convenient
infrastructure, meaning a transport network with well established rail-road-air
connections and a good local business structure, so that all products and services
needed by the exhibitors and visitors are available. (Zygojannis 2005, pp. 44–45)
The local surroundings of the trade fair also have a big impact on the image of the
trade fair. If the people involved can get easily to and from the fairground, if they
can get hotel accommodation close by, if the restaurants and shops are as desired
and the public transportation is convenient, this makes visitors as well as
exhibitors more satisfied with the trade fair in general. Additional benefits are a
pleasant atmosphere in the downtown area, cultural offerings, leisure time
facilities and so on, to make the guests in town feel welcome and content. Thus, it
is also profitable for the town if the city marketing and the trade fair management
are working closely together in promoting the town and the exhibitions.
(Zygojannis 2005, pp. 45–46)
For the town itself, supporting the trade fair business can be very profitable for all
different kind of local businesses. If an exhibition grows to be a big international
THE GERMAN TRADE FAIR MARKET
125
show, many guests come to town – and spend money there. Moreover, a
flourishing local economy saves and establishes more places of employment.
However, the direct connection of these positive side aspects and the single trade
fairs is hardly measurable. (Zygojannis 2005, pp. 46–47)
Local trade and commerce
Like mentioned above, the local trade and commerce can also profit from the
trade fair business, as long as they also offer their share in supporting it. Hotels,
restaurants, taxi companies, local public transportation, florists, retail, handicraft
businesses etc. all can gain lucrative sales in return for their support. (Zygojannis
2005, p. 47; Arzt 2007, pp. 32–33 based on Robertz 1999)
Media
Trade fair companies use media before, during and after the actual exhibitions.
Before the exhibition starts, news coverage can enlarge the number of exhibitors
and visitors due to interesting insights. During the trade fair news coverage of the
show, the innovations and trends of the industry are a sign for how important a
trade fair is. Trade fairs are often even evaluated by the number of published
articles about it. After the exhibition, the coverage can be extended up to several
months after the actual event in order to shorten the time until the next edition of
the trade fair takes place and keep it alive in the customers’ minds. (Zygojannis
2005, p. 48; Roloff 1992, pp. 141–143)
For exhibitors, journalists create a very important target group. With intensive
and positive news coverage about a company, a positive image can be supported
plus, the companies’ innovations, presented at the fair for the first time, can gain a
high profile among potential customers. (Zygojannis 2005, p. 49; Andrich et al.
2008, p. 178)
Trade fair service providers
To make a trade fair or a company’s booth work, many different services are
needed. Therefore, the range of service providers is large. Trade fair service
providers are often specialized in offering services exclusively for trade fairs, then
mostly to support the exhibitors. Offered services can range from the stand
building and electricity to water supplies, can be the service of a florist, a caterer
MAIKE U. BUSCH 126
or the provider of hostesses, or the transportation of goods to the fairground as
well as trade fair consulting services, for example. (Zygojannis 2005, pp. 47–48;
Klante 2008, p. 281)
Trade fair companies usually have certain service providers as fixed partners to
guarantee a smooth procedure of each fair. In general, these providers in
partnership with the trade fair company have a representative office on the
fairground. (Delfmann, Arzt 2005b, p. 461) A very typical service provider on the
fairground is an official fairground-carrier. (Haeberle, Bühler 1992, p. 280) Some
of the services such a company provides are the transport of goods on the
fairground, the custom clearance, or the storage of packaging material during the
time of the exhibition. (Groß 2004, p. 19)
Beyond that, exhibitors can also choose external service providers to work with.
Those are not linked to the trade fair company directly but are a partner to the
exhibiting company. (Prager 2012)
THE GERMAN TRADE FAIR MARKET
127
3.3 SERVICE OFFERS OF GERMAN TRADE FAIR ORGANIZERS
This study’s topic is concerned with the selling of services for trade fairs.
Therefore, it is relevant to take a closer look at these services and how they can
possibly be categorized for future marketing activities. Thus, the following
subchapters broach these issues.
3.3.1 Additional services and their relevance for the core business
The core product of trade fair companies is the organization of fairs, meaning the
offering of exhibition space. The positioning of the product “trade fair” is rather
difficult due to the fact that a trade fair itself has service characteristics and can
also be seen as communication platform for the visitors and exhibitors alike.
Therefore, a trade fair is more complex in its commercialization respectively
branding. (Delfmann, Arzt 2005a, p. 108) As seen before in chapter 2.1, services
are characterized by its immateriality, the integration of the external factor and
the performance level. All these aspects are also valid for the good ‘trade fair’.
The additional service offers the trade fair companies provides besides the
exhibition space and communication platform, so called ‘non-space-products’, are
not rated as core products of a trade fair organizing company. (Witt 2003,
pp. 505–506) They show in a very distinguished way the service orientation of a
trade fair company, and, therefore, can be rated as a marketing-tool. (Kalka 2005,
p. 355)
Non-space-products can develop to become a key element for differentiation from
the competitor. (Witt 2003, p. 507) In order to reach this stage, the trade fair
company should establish a full-service-range to the actors on their market to
support them in reaching their goals. Full-service means offers for all actors. One
example could be the association that is looking for a trade fair company as a
partner for realizing their show. A trade fair company with a suitable fairground
and infrastructure plus a well equipped and functioning non-space-product-
catalogue can make the organization of the exhibition much easier for an
association. On the other hand, an exhibitor might feel in good hands on a
fairground that is so well organized that it can offer many good services in
MAIKE U. BUSCH 128
addition to the exhibition space. The degree of customer satisfaction can be
strengthened through these additional offers. Customers might feel the
motivation to develop a closer business relationship. Exhibitors might see the
advantages of cost and time savings and can exhaust trade fair potentials better
due to experienced service partners. Non-space-offers can also take an essential
part in establishing an overall positive image of a fairground and the company
behind it. Nevertheless, when developing a wide service-program, it is important
to integrate the external factor. This ensures the balance between what is offered
and what is needed or wished for by the customer. (Witt 2003, pp. 508–509)
Naturally, the employee on the service provider’s side takes an important part in
this kind of business relationship. As already discussed in chapter 2.1, selling
services depends a lot on the individual selling the goods. The employee selling
the service offers needs a service-orientation towards the customer, needs to be
friendly, competent and showing motivation to help. As services are credence
products, the effort of the sales representative is essential for the whole process.
(Delfmann, Arzt 2005c, p. 129; Kalka 2005, pp. 355–357)
3.3.2 Constitution of service clusters
According to Kalka (2005, pp. 355–357) services offered by trade fair companies
can be categorized considering different angles, some of them are listed here:
by the time: Some services are relevant before the exhibition in the planning
process, other are relevant during or after the exhibition.
by the place, the service is offered at: Some services are accessed at the place
the exhibitor’s company is located; services like the ones of travel agencies are
used during the journey to the fairground; in town, a visitor might use the
hotel reservation service; the provision of a telephone-connection might be
used in the booth.
by the equivalent, granted for the service in return: Does the user of the
service have to pay for it or is it free of charge?
by the target group, the service is aiming at: The service could be directed at
e.g. exhibitors, at visitors, at the media, at partners of the trade fair company.
THE GERMAN TRADE FAIR MARKET
129
by the expectations of the customer: Some services are naturally expected by
the customer, like restaurants inside the exhibition halls, electricity,
telecommunication services. Others should be there in the eyes of the
customers as they are also offered at other fairgrounds, such as VIP-member
clubs, hostesses, an internet portal. A third group would be the services that
the customer does not expect to find, yet are positively valued in case he finds
them as for example a sales tax refund service or a virtual stand planning.
by the duty of the customer While the customer can expect certain services,
he also has an obligation to use certain services. Kalka (2005, pp. 356–357)
divides such services into two groups: compulsory services and facultative
services. She puts her focus on services exhibitors use. The compulsory
services are those that customers have to order from the trade fair company
like electricity connections and water supplies. Voluntarily, they can book
further services like the stand building or the advertising service from the
trade fair organizer.
The heads of the service departments of some German trade fair companies
would even consider three different categories in this respect: First of all there
are services, which are essential/mandatory and can only be ordered from the
trade fair company, such as electricity, water and waste management for the
booth. The second group of services is classified by their characteristics which
make them mandatory, however, they can be ordered from trade fair
company or external providers. For example, it is essential to have a stand
build on the rented exhibition space. This stand can be build by a stand
builder, booked through the service offers provided by the trade fair
company, or the exhibitor can also contract an external stand builder who is
no partner of the trade fair company. The third group of services marks
services that are not mandatory for an exhibitor’s presentation at the
fairground. They can also be ordered by the trade fair company directly or
through an external provider. Typical services in this category would be the
mailing of invitations to the show to potential visitors branded by the
exhibitor, the work of florist or catering services on the stand. (Prager
201241)42
41 See memo in appendix 1.
MAIKE U. BUSCH 130
3.3.3 Competitive situation on the service market for German trade fair
companies
A trade fair can only be successful if numerous service providers are involved.
Stand builders, designers and specialized event organizers are most important,
yet, a trade fair cannot be successful without carriers, training offers for stand
personnel or the gastronomy and hotel industries. (AUMA, Ausstellungs- und
Messe-Ausschuss der Deutschen Wirtschaft e.V. 2013b, p. 8) As the FAMAB e.V
(Association for Direct Business Communication) concluded, service providers
engaged in the trade fair business should be regarded as one branch of industry.
Due to its diversity then, it is hardly possible to analyze the situation on this
market, though. In addition, the necessity to order services for trade fairs
correlates positively with the trade fair cycles and the numbers of trade fairs
executed in a defined period of time. (FAMAB e.V. - Verband Direkte
Wirtschaftskommunikation 2015) Nevertheless, as a small indication, the
FAMAB e.V. provides information about the stand builder industry in its 2014-15
report as one example for the trade fair service industry. On the basis of only the
stand builders that are members of the FAMAB e.V., the turnover in 2014
amounted to 2,2 billion Euros. The branch’s number of employees is moderately
growing as is the order situation. (FAMAB e.V. - Verband Direkte
Wirtschaftskommunikation 2015)
Based on the research conducted by Kirchgeorg et al. (2012), it can be expected
that the competitive situation regarding services accompanying trade fairs is
going to increase. Trade fair organizers as well as external service providers will
try to use their service offers to stand out from the competitors in the market.
(Kirchgeorg et al. 2012, p. 19)
42 As this categorization fits best to the problem to be analyzed in this project it
will be taken into consideration for the research later on.
THE GERMAN TRADE FAIR MARKET
131
3.4 INTERIM CONCLUSION CHAPTER 3
The German trade fair market is a steady market with still slightly growing
figures. Although the industry has suffered during the economic crises in 2009, it
is back to a solid strength. The German trade fair industry also has a strong
position in the international exhibition market.
The service offers in the market are fairly diverse. Some are mandatory to order
through the fair ground owner; others are optional and can also be demanded
from external suppliers, meaning not the trade fair organization or the fair
ground owner. These optional services are the services, the organizers want to
improve sales in. Based on the positive economic situation, the potential is
evident. However, common marketing strategies have not been of satisfactory use
in the past. As the competitive situation regarding service providers at trade fairs
is predicted to grow, the trade fair organizing companies in Germany should find
out, how to face this challenge in the nearer future. Establishing a strong business
relationship derived from the principal-agent approach and the creation of trust
as a success factor, might be the strategic advantage when reflecting the current
information of the market as well as the findings of chapter 2.

MAIKE U. BUSCH 132
133
4 DERIVATION OF HYPOTHESES FOR THE EMPIRICAL RESEARCH
Although the literature review gave a deep insight in the relevant areas, the
specific research question, how trade fair organizers can sustainably, meaning
over a long term, sell their provided services, cannot be answered to full
satisfaction. It became obvious through the secondary research, that much has
already been discovered in the various fields. However, no specific research on
this exact matter has been carried out so far. Based on previous findings, the
general results or survey findings from other industries cannot be simply
transferred to any other area of business. Different industries seem to react
differently to the matters of service and business-to-business marketing, business
relationships and trust.43 So, derived from the research question and aims from
this project, specific primary research within the trade fair industry has to be
carried out.
Deducted from the secondary research, hypotheses for the area of business in
focus can be formed. Hypotheses are propositions made concerning
characteristics of a relevant target group. Their usefulness and confirmation need
to be tested by empirical research. (Bortz, Schuster 2010, p. 97) Popper states,
though, that the development of hypotheses does not have to be linked to a
logical reconstruction. Often, hypotheses are found by scientists through intuition
instead of scientific rules. This is also completely acceptable in the scientific world
as not the hypothesis itself is crucial but its testing. (Schurz 2013, p. 27)
The main goal of sciences in general linguistic usage is characterized as the search
for truth. However, this would imply that something like truth exists in science.
(Merten 2007, p. 37) Popper on the other hand obliterates this implication. He
claims, that although we are striving for the certainty, fact is, that we can only
assume that we are getting closer to the truth. Though, we never can be certain.
(Popper 1996, p. 4)44 Therefore, the goal in science should be to find explanations
43 See chapter 2. 44 "Our aim as scientists is objective truth; more truth, more interesting truth,
more intelligible truth. We cannot reasonably aim at certainty. Once we realize
MAIKE U. BUSCH 134
for things that are worthy to study. (Popper 1973, p. 213) The hypotheses have the
function to connect the given findings and formulate a statement to close the gaps
of knowledge in order to use this statement for further research in reality.
(Vaihinger 2013, p. 148) Hypotheses can then be falsified in empirical research if
the findings do not correspond with the formulated hypothesis. Nevertheless,
hypotheses can only be temporarily confirmed but not verified, as future findings
might modify the previous research results. (Töpfer 2010, p. 55; Moulines 2008,
pp. 62–63)
As theories already exist in this field of research, inductive research has been
conducted. These findings are therefore taken to form hypotheses, which are
tested then for a special field. Consequently, this leads to a deductive research
approach. (Kuß 2012, p. 21; Töpfer 2010, pp. 62–69)
In the present case, three superordinated hypotheses can be formulated in order
to answer the research question more specifically than the literature review and
current state of research can. They are deducted from the information found
during the secondary research. Their aim is to measure correlations and/or the
differences and distributions within the subsets of the sample. (Töpfer 2010,
pp. 206–207)
Hypothesis 1 tests the correlation between the exhibitors’ wishes for sustainable
business relationships with their trade fair-service providers and their estimation
of relevance for trust to be an essential aspect for building such a relationship.
Missing information and the related risk of choosing the wrong provider or
service might prevent an exhibitor from committing himself to a lasting business
relationship with a service provider. Based on the literature findings, trust is an
essential aspect to fill the gap of information asymmetry which is particularly
present in the service business.45 The null hypothesis and the alternative
hypothesis are therefore formulated as follows:
that human knowledge is fallible, we realize also that we can never be completely
certain that we have not made a mistake." (Popper 1996, p. 4).
45 See chapter 2.3.
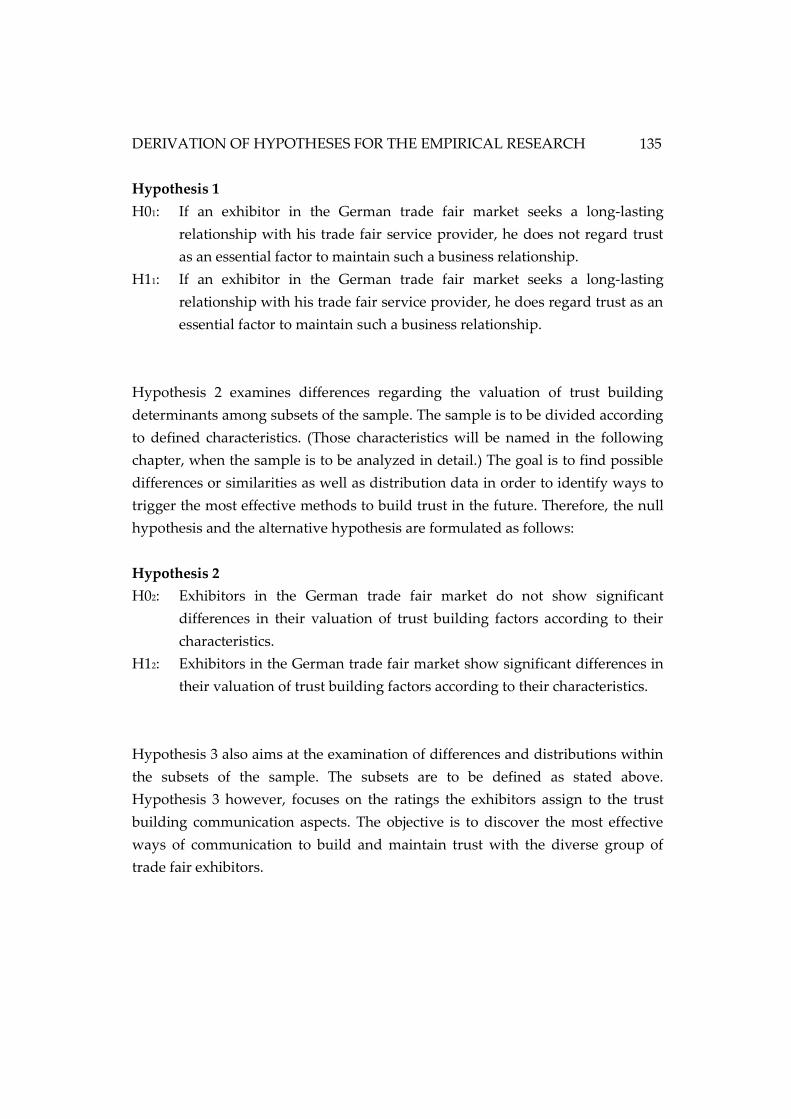
DERIVATION OF HYPOTHESES FOR THE EMPIRICAL RESEARCH
135
Hypothesis 1
H01: If an exhibitor in the German trade fair market seeks a long-lasting
relationship with his trade fair service provider, he does not regard trust
as an essential factor to maintain such a business relationship.
H11: If an exhibitor in the German trade fair market seeks a long-lasting
relationship with his trade fair service provider, he does regard trust as an
essential factor to maintain such a business relationship.
Hypothesis 2 examines differences regarding the valuation of trust building
determinants among subsets of the sample. The sample is to be divided according
to defined characteristics. (Those characteristics will be named in the following
chapter, when the sample is to be analyzed in detail.) The goal is to find possible
differences or similarities as well as distribution data in order to identify ways to
trigger the most effective methods to build trust in the future. Therefore, the null
hypothesis and the alternative hypothesis are formulated as follows:
Hypothesis 2
H02: Exhibitors in the German trade fair market do not show significant
differences in their valuation of trust building factors according to their
characteristics.
H12: Exhibitors in the German trade fair market show significant differences in
their valuation of trust building factors according to their characteristics.
Hypothesis 3 also aims at the examination of differences and distributions within
the subsets of the sample. The subsets are to be defined as stated above.
Hypothesis 3 however, focuses on the ratings the exhibitors assign to the trust
building communication aspects. The objective is to discover the most effective
ways of communication to build and maintain trust with the diverse group of
trade fair exhibitors.

MAIKE U. BUSCH 136
Hypothesis 3
H03: Exhibitors in the German trade fair market do not show significant
differences in their valuation of methods to establish a trust building
communication a service provider should direct towards his customers
according to their characteristics.
H13: Exhibitors in the German trade fair market show significant differences in
their valuation of methods to establish a trust building communication a
service provider should direct towards his customers according to their
characteristics.
To round off the primary research, the often recalled buying center will be in
focus with the purpose to identify possible clusters for future adaption.
137
5 EMPIRICAL ANALYSIS IN THE GERMAN TRADE FAIR MARKET
5.1 SPECIFICATIONS FOR PRIMARY RESEARCH
Generally, the market research process follows a certain pattern. After the
research problem has been clearly defined and could not be solved by secondary
research46, a primary research, also called field research, should be carried out. In
the following step, the researcher needs to decide on a research method like
performing an experiment, carrying out an observation, or conducting a
quantitative or qualitative survey. (Weis, Steinmetz 2008, pp. 30–40)
Among all the different methods of market research, quantitative research is
conducted to examine a defined part of reality by testing hypotheses. These
hypotheses are formed after an extended literature research and when the current
state of research cannot answer the research question focused on a certain field.
(Mayer 2009, p. 28) A standardized questionnaire helps to facilitate a quantitative
research. (Mayer 2009, p. 58) Seeing that this fits perfectly well to the distinct
research situation, quantitative research should be in focus in the following.
After the decision to conduct a quantitative research by means of structured
questionnaire, the subsequent process looks as illustrated in the chart below:
46 Secondary research is defined as “research using information that has already
been compiled and formatted. It is different from primary reseach, which is also known as
original research. Analysis is frequently done with research that has been provided by a
third party. […] In research, it is important to assess the secondary information that exists
before time and money is spent to conduct new research. […]” (Doyle 2011, p. 342)
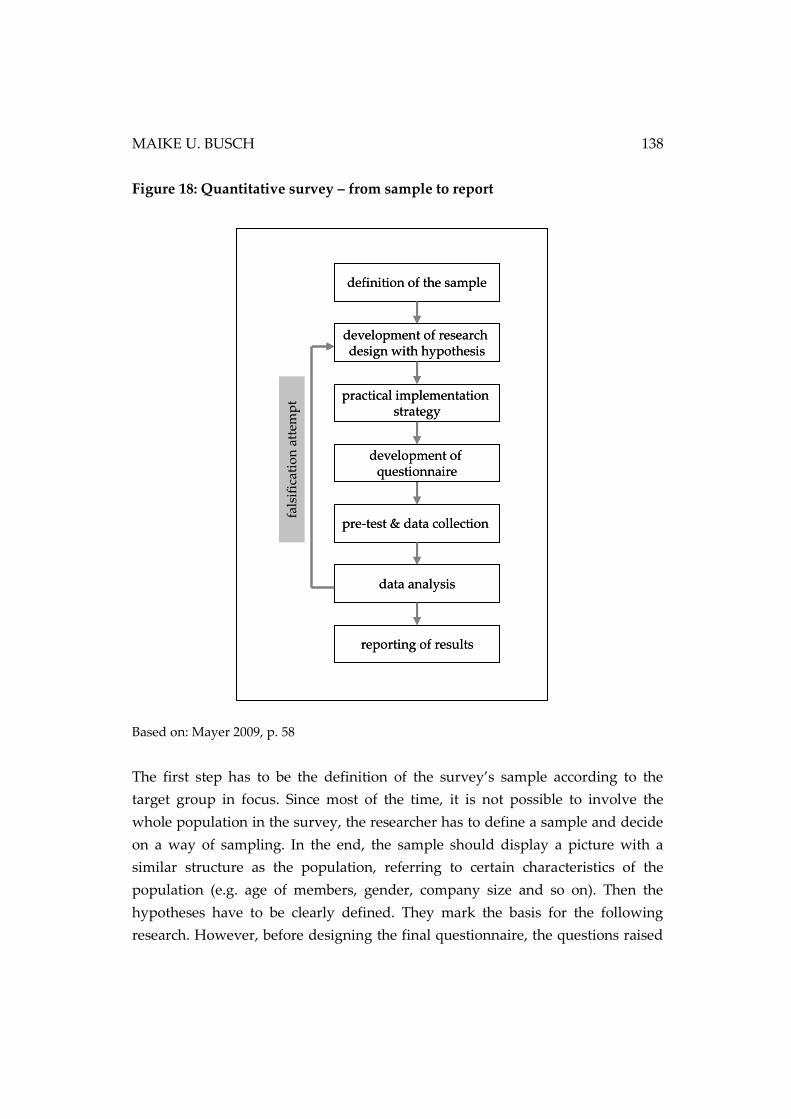
MAIKE U. BUSCH 138
Figure 18: Quantitative survey – from sample to report
Based on: Mayer 2009, p. 58
The first step has to be the definition of the survey’s sample according to the
target group in focus. Since most of the time, it is not possible to involve the
whole population in the survey, the researcher has to define a sample and decide
on a way of sampling. In the end, the sample should display a picture with a
similar structure as the population, referring to certain characteristics of the
population (e.g. age of members, gender, company size and so on). Then the
hypotheses have to be clearly defined. They mark the basis for the following
research. However, before designing the final questionnaire, the questions raised
definition of the sample
development of research design with hypothesis
reporting of results
data analysis
pre-test & data collection
development of questionnaire
practical implementation strategy
fals
ific
atio
n a
ttem
pt
definition of the sample
development of research design with hypothesis
reporting of results
data analysis
pre-test & data collection
development of questionnaire
practical implementation strategy
fals
ific
atio
n a
ttem
pt

EMPIRICAL ANALYSIS IN THE GERMAN TRADE FAIR MARKET
139
during the studies of the theory have to be transferred to the current research
problem. Decisions regarding the levels of measurement of scales need to be
taken. The set of questions resulting from this work now has to be phrased to fit
the purpose as well as the target group and has to be put into a systematical and
logical order. Before addressing the whole sample, it is wise to test the
questionnaire in a pre-test in order to eliminate weak points as unclear questions
being a source for misunderstanding. While creating the questionnaire, the
framework for the execution of the survey has to be distinguished as well. The
timing of sending out the questionnaire respectively the reminder(s) should be
decided on. The procedure of delivering and collecting the questionnaires among
the test persons needs a set-up. Once the revised questionnaire is ready for
mailing and the timing is correct, the actual data acquisition takes place, followed
by a statistical analyses and interpretation of the results. A comparison with the
hypothesis from the beginning of the process and its documentation closes the
market research process. (Burns, Bush 2000, pp. 302–381; Berekoven et al. 2009,
pp. 31–33; Weis, Steinmetz 2008, pp. 30–34; Mayer 2009, pp. 58–59)
With regard to the literature research as well as the consideration of the current
state of trust-research, several aspects of building trust between business
customers and sellers could be revealed. However, it became obvious that – based
on previous research – no overall valid answer to the trust-building factors can be
given. It was found out that several determinants can be responsible for building
and maintaining trust. Nevertheless, different industries show different focuses.
Moreover, the focus on certain trust determinants might also differ regarding the
services required. Communication as a tool to build and strengthen trust between
business partners also consists of different parameters which are valued
differently with different target groups.47 A more detailed research among the
particular target group has to follow. As mentioned above, a quantitative survey
with a structured questionnaire fits to the research situation in focus. Therefore,
this method is to be used.
47 See chapter 2.4.6.3.
MAIKE U. BUSCH 140
5.1.1 Definition of the research sample
The German trade fair industry consists of a very broad variety of customers in
the market. 2/3 of the global leading trade fairs of the various industries, e.g.
construction machinery, automobile, medical, leisure, or fashion, take place in
Germany. Each year, there are approximately 150 international trade fairs with up
to 180.000 exhibitors. (AUMA, Ausstellungs- und Messe-Ausschuss der
Deutschen Wirtschaft e.V. 2014) Considering previous research results, it is nearly
impossible to clarify the trust determinants for all trade fair exhibitors at once.
Therefore, in order to realize a controlled sampling which leads to convincing
results, a primary research is to be conducted in one industry exemplarily.48 A
second trade fair is to be analyzed for comparision.
After negotiations with the service department of the Messe Düsseldorf GmbH,
one of the leading German fair ground operators, the world’s largest medical
trade fair MEDICA has been chosen as sample exhibition for the further main
research. (Prager et al. 201249) The MEDICA has already existed as important
platform for the medical industry for over 40 years. (Messe Düsseldorf GmbH
2015a) This trade fair takes place in Düsseldorf, Germany, every year. In 2014, for
example, 4,831 exhibitors representing 67 countries used this platform on more
than 118,000m² of exhibition space for exchange with about 130,000 trade visitors
from 120 countries. It is an established product with recurrent and growing
clusters of actors. (Messe Düsseldorf GmbH 2015c, 2015d) Current studies of the
worldwide medical market also confirm further economic growth of the industry.
Expansions on the emerging markets, the implementation of new technologies,
new developments in treatments, biotechnology, gentechnology, and
nanotechnology are just a few directions and trends that move the medical
industry forward. (PricewaterhouseCoopers 2015; PwC 2012; Taylor et al. 2014)
48 The goal is to establish a research method which can be used and transferred
to investigate other industries as well later on.
49 See appendix 5.
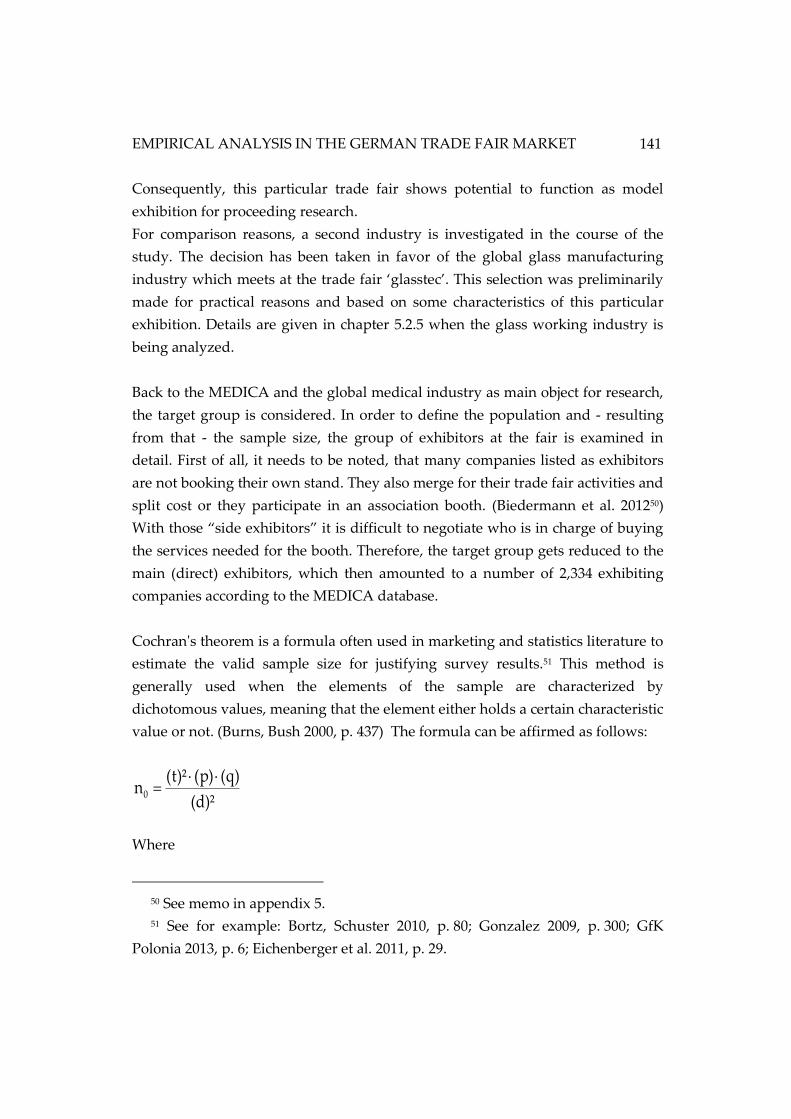
EMPIRICAL ANALYSIS IN THE GERMAN TRADE FAIR MARKET
141
Consequently, this particular trade fair shows potential to function as model
exhibition for proceeding research.
For comparison reasons, a second industry is investigated in the course of the
study. The decision has been taken in favor of the global glass manufacturing
industry which meets at the trade fair ‘glasstec’. This selection was preliminarily
made for practical reasons and based on some characteristics of this particular
exhibition. Details are given in chapter 5.2.5 when the glass working industry is
being analyzed.
Back to the MEDICA and the global medical industry as main object for research,
the target group is considered. In order to define the population and - resulting
from that - the sample size, the group of exhibitors at the fair is examined in
detail. First of all, it needs to be noted, that many companies listed as exhibitors
are not booking their own stand. They also merge for their trade fair activities and
split cost or they participate in an association booth. (Biedermann et al. 201250)
With those “side exhibitors” it is difficult to negotiate who is in charge of buying
the services needed for the booth. Therefore, the target group gets reduced to the
main (direct) exhibitors, which then amounted to a number of 2,334 exhibiting
companies according to the MEDICA database.
Cochran's theorem is a formula often used in marketing and statistics literature to
estimate the valid sample size for justifying survey results.51 This method is
generally used when the elements of the sample are characterized by
dichotomous values, meaning that the element either holds a certain characteristic
value or not. (Burns, Bush 2000, p. 437) The formula can be affirmed as follows:
Where
50 See memo in appendix 5. 51 See for example: Bortz, Schuster 2010, p. 80; Gonzalez 2009, p. 300; GfK
Polonia 2013, p. 6; Eichenberger et al. 2011, p. 29.
)²d(
)q()p()²t(n0
MAIKE U. BUSCH 142
• n is the sample size to be calculated.
• d signifies the margin of error, a researcher is willing to accept, meaning the
desired accuracy to the survey results. For categorical data, a margin of error
of 5% is commonplace and acceptable according to Barlett et al. (Barlett et al.
2001, pp. 47–48)
• t equals the value for the alpha level. This level shows the acceptable risk a
researcher is willing to agree to “that the true margin of error exceeds the
acceptable margin of error” (Barlett et al. 2001, pp. 44–45) in the survey.
According to literature and experts, the alpha level is generally set to 0.05,
sometimes to 0.01. However, 0.05 is proven acceptable for most research
problems. The t-value in the formula therefore results in 1.96. (Burns, Bush
2000, p. 437; Weis, Steinmetz 2008, p. 93)
• p stands for the estimated variability in the population while q = (100 –p). If
the variability in the target group is known, these values should be used.
However, this is often difficult. In that case, the proportion should be
assumed to be 50% to 50%. This maximizes the variance and leads inevitable
to the ‘worst case scenario’ and to a maximum of the sample size. (Anderson
et al. 2014, p. 214)
If then, the calculated sample size exceeds 5% of the population, Cochran (1977,
pp. 77–78) recommends using his correction formula in a second step:
Transferring the requirements of applying this formula to the population and
research question in focus, the overall important matter to define the sample size
could be the query whether the exhibitors asked consider trust as an important
aspect for a business relationship with a service provider or not. As the
distribution within the target group regarding this aspect is not known, the
assumption has to be made that 50% of the population value trust in their
business relationships while the other 50% do not. This maximized the required
sample size as mentioned above.
)Npopulation/n(1
nn
0
01
EMPIRICAL ANALYSIS IN THE GERMAN TRADE FAIR MARKET
143
Considering this aspect as main reference to determine the sample size, 331
exhibitors should be questioned in order to get a representative sample.
However, considering the usefulness of this research, it might be more effective to
put greater attention to the methods of stratified sampling. Stratified sampling is
used in market research when the heterogeneous population can be divided into
rather homogeneous sub-populations of which the samples are then taken
according to the structure of the population. The members of each sub-population
are still randomly chosen as every member of the population has the chance to
being asked. Dividing the population into strata minimizes the sampling error.
(Weis, Steinmetz 2008, pp. 97–99; Berekoven et al. 2009, pp. 47–48) In order to
prove the transferability of the sample results to the population the comparison of
the sample’s structure with the structure of the population is essential. Therefore,
the knowledge about the structure within the population is required. (Berekoven
et al. 2009, pp. 47–48)
Taking into account the diverse population of exhibitors of the MEDICA 2012,
different aspects can be contemplated when planning the sample’s strata. It was
discussed with the cooperating trade fair organization and a representative of
their advisory market research institute what characteristics could be useful for a
deeper analysis of the target group on an elevated level, meaning company level,
instead of the specific details on the members of the buying center. In previous
surveys with exhibitors, the exhibitor status, the booked stand size as well as the
origin of the exhibitor have been common aspects for diversification.
(Biedermann et al. 2012) Together with the findings on service marketing,
business-to-business marketing as well as the German trade fair market, these
33149,330334,2/16.3841
16.384n
:correction
38516.384²05.0
5.05.0²96.1n
1
0
MAIKE U. BUSCH 144
divisions seem reasonable also for this analysis.52 Moreover, this data can be
retrieved form the MEDICA customer database of the Messe Düsseldorf GmbH.
Cconsequently, the structure of the population can be shown for reconciliation
between the sample and the population. (Prager et al. 2012)
So, the exhibitor status claims whether the exhibiting company has taken part in
the MEDICA exhibition before, or if it is new to the trade fair and the
organization. This links to the experience level of the (potential) customer and the
buying techniques of the buying center.53 The stand size indicates the space a
company has booked on the fairground for the period of the exhibition. For the
trade fair business, the company size is less important and less in focus than the
square meters sold.54 The sold square meters lead to the turnover results for the
trade fair organizer. Therefore, this aspect should be considered as well. (Prager
et al. 2012) The third aspect to be considered is the origin of the exhibitor. As the
trade fair business on the big German fairgrounds is a very international business
(AUMA, Ausstellungs- und Messe-Ausschuss der Deutschen Wirtschaft e.V.
2015b, pp. 16,20-22), the origin and cultural background of the exhibiting
companies should not be neglected as a distinct characteristic regarding different
ways of thinking about trust-building and communication matters. This has also
been proven by the literature review on service marketing, business-to-business
marketing and the study on trust research in economics.55 Therefore, in the
following subchapters, these subgroups or strata are to be taken into account for
further analysis of the survey data.
52 See chapters 2 and 3.
53 See chapter 2.2.2.
54 Although, at least for the MEDICA structure, it correlates positively with the
company size. The calculation can be found in appendix 6.
55 See chapter 2.
EMPIRICAL ANALYSIS IN THE GERMAN TRADE FAIR MARKET
145
5.1.2 Illustration of the survey’s implementation in practice
The next step is to plan how this sample could be reached. In the view of the fact,
that the MEDICA 2012 took place end of November 2012, the questionnaires is
sent out in January 2013. Two major aspects lead to this timing: The review of the
trade fair activities usually takes the exhibitors quite some time and secondly,
Christmas holidays were coming up shortly after the trade fair. Therefore, mid-
January seems like an appropriate timing to start the survey. The survey is to be
filled in online. As exhibitors are spread all over the world after the term of the
trade fair, and since most of the communication in general between the trade fair
company and the exhibitor is carried out online, this way seems most suitable.
Additionally, MEDICA exhibitors have been part of online surveys of the Messe
Düsseldorf GmbH before with positive responses. (Prager et al. 2012) Depending
in the origin of the contact in the database, a link to either the German or the
English version of the questionnaire is to be sent out (foreign contacts receive the
English version.)
The link to the questionnaire is sent directly to the contact person whose details
are stored in the MEDICA database as responsible for ordering services. The
emails are personalized unless an info-address or another kind of collective
address is stored. After sending out the first invitation to fill in the questionnaire,
the potential respondent has two weeks time to take part. If necessary, due to a
lack of participants, a follow-up email is to be sent as a reminder to the ones who
have not responded yet after those two weeks.
5.1.3 Development and description of final questionnaire
According to Burns and Bush (2000, p. 344), a questionnaire has six different
functions:
(1) It translates the research objectives into specific questions that are asked of the
respondents.
(2) It standardizes those questions and the response categories so every participant
responds to identical stimuli.
(3) By its wording, question flow an appearance, it fosters cooperation and keeps
respondents motivated throughout the interview.
MAIKE U. BUSCH 146
(4) Questionnaires serve as permanent records of research.
(5) They speed up the process of data analysis. […]
(6) They contain information upon which reliability assessments such as test-retest
or equivalent form questions may be made, and they are used in follow-up
validation of respondents’ participation in the survey. “
Development of draft
With these functions kept in mind, a questionnaire regarding the current research
problem and directed to the defined target group is developed.
The development process starts with a random collection of questions necessary
in order to solve the research problem. After the collection of these questions is
finished, the questions are divided into clusters and brought into a logical order.
To prevent the respondents from quitting to answer the questionnaire, it is
important to keep it as short as possible, to design it in an easy to answer format
and to give it a clear structure. (Mayer 2009, pp. 79-80) Basically, the first draft of
the questionnaire contains four major parts. The determinants to build trust in
seller-buyer relationships make the beginning. Questions regarding the purchase
of services and the general importance of trust in business relationships follow.
The third topic is concerning the aspects of communication for developing and
strengthening trust. The statistical questions for classification purposes complete
the questionnaire. An introduction is renounced due to the fact that the
questionnaire is sent out by email which includes an introductory letter. The
questionnaire is translated into German and English.
Pre-test & revision of questionnaire
After a drafted has been developed, the draft is tested in two different ways: First,
the developed questionnaire is discussed with a member of the service
department of the Messe Düsseldorf GmbH and a representative of an external
market research agency. This agency has already carried out a number of research
projects for the company, therefore knows the exhibitors and has a certain insight
of do’s and don’ts as well as experience in the field. The representative of the
service department of the Messe Düsseldorf GmbH also knows the target group
but also has a clear insight on the seller’s sight.
EMPIRICAL ANALYSIS IN THE GERMAN TRADE FAIR MARKET
147
This working meeting results in several changes of the draft version of the
questionnaire. One major change made in the process is the adaptation of the
scales. The draft version used Likert scales56 with four response possibilities. The
idea was to make the respondent decide whether his answer tended towards the
positive or the negative side. However, the market research expert claims, that
although this sort of rating system is often used in marketing practice, it has
shown disadvantages especially when conducting international market research.
In some societies, like in Japan, the center is important. Due to the internationality
of the research, there should be a middle score to chose. Furthermore, by adding a
fifth gradation, the center becomes measurable. If a respondent is not 100% sure if
he is convinced or satisfied with the answer, he can choose the middle.57 In most
cases, choosing the middle does not necessarily mean, the respondent does not
agree. Plus, if a respondent is clearly negative towards an issue, experience has
shown, that he is then determined to show it. Therefore, on a scale from 1 (=
totally disagree) to 5 (= totally agree), a ‘neutral’ 3 can be judged as a slightly
positive attitude. Moreover, a sixth field is added. ‘No opinion’ gives the test
persons the possibility to skip a question. This way, the termination rate among
the respondents can be lowered, the expert says. (Prager et al. 2012) Therefore,
the final version of the questionnaire is adapted accordingly. Additionally, some
other changes regarding wording and relevance of statistical data are made. The
introductory letter to the potential respondents is also revised taking advantage
again of the experience provided by the market researcher. After the adaption of
the questionnaire according to the results of the interview, a second pre-test is
performed. This time, the wording stands in focus of the test. Both, the German as
well as the English version of the questionnaire are presented to a test group of
native and non-native speakers of both languages. They are supposed to answer
the questionnaire and mark unclear or illogical questions. Adjustments are made
afterwards, so that the questionnaire and the introductory email are finalized.
56 Likert scales are generally used to measure attitudes and opinions. (Mayer
2009, p. 87)
57 See also: Mayer 2009, pp. 83–85.
MAIKE U. BUSCH 148
Description of the final questionnaire
All recipients of the final questionnaire receive an email with a link to the online
questionnaire. It briefly explains the purpose of the survey and indicates the
importance of participation. A statement of confidentiality and the approximate
time needed for answering are added.58
The questionnaire59 starts with a warm-up question. Warm-ups are questions to
get the respondent started on the questionnaire and to get him interested in the
topic. They are simple questions and easy to answer. Usually, this kind of
questions has no intention to add any valuable information to the survey’s
analysis. (Burns, Bush 2000, pp. 361–362; Mayer 2009, p. 95) In this survey, the
question is not evaluated either. This question is asked as a dichotomous closed-
ended question with a yes/no-answer possibility. (Burns, Bush 2000, p. 305)
Since the questionnaire should be kept short to limit the termination rate, the
second question directly enters the trust topic. The various determinants found in
the literature search as well as the investigation of the current state of research
(see chapter 2.4) are clustered and combined. As a result, 16 aspects are included
in question number two:
“Although trust is a commonly known and used term, there is no
single definition for it. Which factors do you find necessary for trust to
develop and to strengthen it within a business relationship to a service
provider?”
The test person is asked to rate the importance of each determinant for building
trust according to his opinion. At the end of the question, the respondent can also
add one more issue he could not find in the list but which he thinks plays an
important role as well. So, question 2 is designed as a half-open-ended question.
As mentioned before, a Likert scale with 6 answer possibilities is used. They
range from 1 = very low meaning to 5 = very important. The sixth possibility is the
‘no opinion’ option. The answer possibilities for each trust determinant are
designed as labeled scaled-response questions. As this question asks for an
opinion or a feeling, it seems reasonable to work with an ordinal scale. This kind
58 Copies of the introductory emails can be found in appendix 7and 8.
59 See appendix 9 and 10.
EMPIRICAL ANALYSIS IN THE GERMAN TRADE FAIR MARKET
149
of data reveals the characteristics of nominal data; only a ranking to this data is
given by the respondent. (Freeman et al. 2014, p. 5; Berekoven et al. 2009, pp. 64–
65) While these questions are rather simple to administer and code after collecting
the filled-in questionnaires, they also allow the respondents to rate their opinion
and express their feelings in comparison to other characteristics of building trust
asked in the question. The labeled version is chosen to help the respondents
relating to the scale. (Burns, Bush 2000, p. 305)
Each aspect has to be rated in order to move on to the next question (function
installed in the online system). This way, the analysis and comparison of the data
are less complicated and valid due to same amount of responses.
The second topic of the questionnaire focuses on the buying of services for trade
fairs. Literature research revealed the importance of trust and long-term
relationships when buying services (from the buyer’s perspective).60 Questions 3
to 5 focus on that matter. While question 361 asks for a rating again with the
parametric value from 1 (= hardly necessary) to 5 (= very important), questions 4
and 5 are designed as simple yes-/no-questions62. Therefore, question 3 represents
an ordinal scale in a labeled scaled-response question and questions 4 und 5 are
dichotomous closed-ended questions. (Anderson et al. 2014, p. 5; Burns, Bush
2000, p. 305)
60 See chapter 2.1. 61 Question 3: “When buying services, it is often difficult to foresee the end result. On
a scale from 1 to 5 how important do you rate the existence of trust into
the sales partner for establishing a long-term, sustainable buyer and
service provider relationship?”
62 Question 4: “When buying services, are you looking for a long-term relationship
(for several trade fair cycles) with a service provider who implements your
wishes?”
Question 5: “When buying services for your exhibition at a trade show, are you looking
for one single partner who supports you in as many areas as possible, offering
service packages (e.g. constructing the stand, organizing the catering and
taking care of security)”
MAIKE U. BUSCH 150
The current state of trust research also exposes several communication aspects
which can be linked to the creation and strengthening of trust.63 Additionally, also
the area of service marketing searches for ways to sell goods with high credence
qualities which goes in line with a trust building communication.64 These findings
were analyzed and combined. Question 6 of the questionnaire addresses this
issue. 13 elements are taken from literature and put into the question. Again,
Likert scales with the answer possibilities from 1 (= very low meaning) to 5 (=
very important) plus ‘no opinion’ are offered to the respondents in a labelled
scaled-response question. This is done for the same reasons as in question 2.
(Burns, Bush 2000, p. 305) The question investigates opinions of the respondents.
Consequently, no metric scaling is used but ordinal scales. Likewise question 2,
the respondents have to indicate an opinion on each single communication item
before moving on to the next one.
Questions 7 to 18 are marked as statistical question for classification purposes.
This indicates to the respondent, that the end of the questionnaire is near.
However, although these questions include many statistical issues for clustering,
they also reveal information about several details. First of all, the buying center
problem, mentioned in chapter 2.2, is taken up. Questions 7, 8, 15, 16, and 17
relate to this topic. They indicate who is in charge of the trade fair organization,
particularly the buying of services within the target group. In addition, it is found
out whether the people in charge have been addressed by this questionnaire and
therefore validate the survey. From the statistical point of view, those questions
are a mix of dichotomous closed-ended questions as well as multiple category
closed-ended questions. Questions 8 and 16 leave just two options of answering
to the respondent.65 Questions 7, 15, and 17 offer several answer-options to the
test persons. Multiple category closed-ended questions are used, because they
63 See chapter 2.4.
64 See chapter 2.1.3. 65 Question 8: “When participating in a trade fair, who decides on the service
providers that actually work for you (e.g. stand builder, caterer, hostess
service, press service, etc)?”
Question 16: “Are you involved in organizing the trade fair participation at your
company?”
EMPIRICAL ANALYSIS IN THE GERMAN TRADE FAIR MARKET
151
permit an extensive variety of answering option and are easier to manage during
the analysis than open questions. On the other hand, as an opinion or rating is
asked for, this kind of question is also handier for the test-person to respond on.66
(Burns, Bush 2000, p. 305)
Other clustering information is disclosed through the remaining questions.
Details regarding the number of trade fair participation (question 9), the average
stand size (question 10), the company size (questions 13 and 14) as well as the
cultural background (question 12) are investigated. Here also metric scales are
used, when numeric values are being surveyed, like a number of square meters
for the stand size, the number of employees or the amount of turnover for the
company. When classifications instead of very distinct numbers seem sufficient,
classes are used to ensure clarity within the questionnaire (e.g. no of employees).
Moreover, questions 12 (origin) and 18 (working time for company) are designed
as open-ended questions. The questions are easy to answer and no aid should be
needed to do so. Offering all possible answers would unnecessarily expand the
questionnaire by volume and might rather be confusing to the respondents than
helpful.
Except for questions 13 and 14 all questions require an answer before moving on
with the questionnaire. Here, this was neglected to offer the respondents the
choice of stating the company size (either by no of employees or by turnover per
year).
The questionnaire closes with a thank you to the test persons.
66 Question 7 (questionnaire): “When planning a participation at a trade fair,
who takes the final decision about the
participation at your company? (Please mark only
one answer.)”
Question 15 (questionnaire): “What is your position in the company?”
Question 17 (questionnaire): “Are you responsible within your company for
the commissioning of service providers for your
participation at the trade fair”?
For details in the answering options, see appendix 9 and 10.
MAIKE U. BUSCH 152
5.1.4 Description of statistical methods for analyzing the survey results
As already mentioned in the introduction to this subchapter, the quantitative data
collected by a survey needs to be analyzed to draw conclusions for practical
implementations. Therefore, statistical methods of analysis and statistical tests are
carried out to verify the authentication of the sample and to evaluate the findings
of the survey. In this project non-parametric tests are used. They are used when a
normal distribution of the data cannot be assured. Moreover, they are
implemented when ordinal scales are used. (Bühl 2009, p. 347) Ordinal scales are
mainly of interest in this survey as could be seen in description of the
questionnaire. In the following the relevant test are briefly stated and described to
give the reader an overview and insight for the proceeding research:
Chi-square test
The Chi-square test can be used to measure the significance level of two or more
independent samples. The goal is to discover whether the alternative hypothesis
can be accepted or if the null hypothesis has to be taken. A level of significance
has to be defined. In general statistical practice, this level (also called p-value) is
set to 5% as significant results and 1% for highly significant results. If the results
of the test level 5% or less, the alternative hypothesis should be accepted. Since
the data only needs to be nominally scaled for the calculation, the test can be
broadly used with the different scales. (Janssen, Laatz 2003, pp. 228–229)
However, as the Chi-square test is carried out based on a cross table, one aspect
needs to be ensured: None of the fields in the cross tab is allowed to have a count
less than five. If the count is less than five, the Fisher’s exact test could be chosen
for the same purpose. (Bühl 2009, pp. 292–293; Cassens 1992, p. 66; Anderson et
al. 2014, p. 581)
Several versions of the chi-square test exist. The probably most commonly used
one is the Chi-square goodness-of-fit test by Pearson. (Voinov et al. 2013, p. xi)
The Chi-square goodness-of-fit test can be used with nominal data as well. It is
applied when a single sample is taken from a single population and when both,
sample and population can be divided into multiple categories. (Morien 2013,
p. 202) In this case, the Chi-square goodness-of-fit test can be used to determine,
how well the sample structure represents the actual structure of the population.
(Corder, Foreman 2009b, p. 156) It can be tested by using the formula:
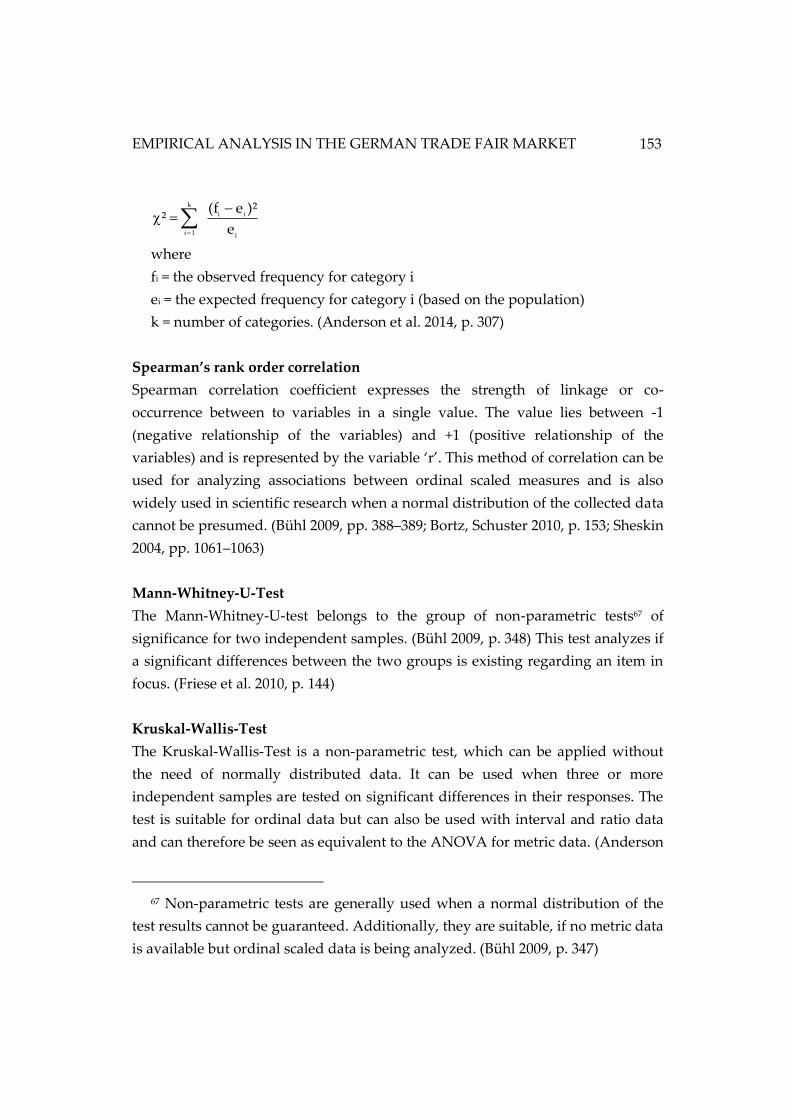
EMPIRICAL ANALYSIS IN THE GERMAN TRADE FAIR MARKET
153
i
ii
k
1i e
)²ef(²
where
fi = the observed frequency for category i
ei = the expected frequency for category i (based on the population)
k = number of categories. (Anderson et al. 2014, p. 307)
Spearman’s rank order correlation
Spearman correlation coefficient expresses the strength of linkage or co-
occurrence between to variables in a single value. The value lies between -1
(negative relationship of the variables) and +1 (positive relationship of the
variables) and is represented by the variable ‘r’. This method of correlation can be
used for analyzing associations between ordinal scaled measures and is also
widely used in scientific research when a normal distribution of the collected data
cannot be presumed. (Bühl 2009, pp. 388–389; Bortz, Schuster 2010, p. 153; Sheskin
2004, pp. 1061–1063)
Mann-Whitney-U-Test
The Mann-Whitney-U-test belongs to the group of non-parametric tests67 of
significance for two independent samples. (Bühl 2009, p. 348) This test analyzes if
a significant differences between the two groups is existing regarding an item in
focus. (Friese et al. 2010, p. 144)
Kruskal-Wallis-Test
The Kruskal-Wallis-Test is a non-parametric test, which can be applied without
the need of normally distributed data. It can be used when three or more
independent samples are tested on significant differences in their responses. The
test is suitable for ordinal data but can also be used with interval and ratio data
and can therefore be seen as equivalent to the ANOVA for metric data. (Anderson
67 Non-parametric tests are generally used when a normal distribution of the
test results cannot be guaranteed. Additionally, they are suitable, if no metric data
is available but ordinal scaled data is being analyzed. (Bühl 2009, p. 347)

MAIKE U. BUSCH 154
et al. 2014, pp. 580–582; Bender et al. 2007) If significant differences between the
three or more samples have been identified, it is necessary to perform a post-hoc
test. The post-hoc test then identifies in pairs between which of the samples the
significant differences can be measured. The Mann-Whitney U-test can be
regarded as a useful method then. (Plichta, Garzon 2009, p. 203; Corder, Foreman
2009a, p. 99; Bühl 2009, pp. 361–363)
EMPIRICAL ANALYSIS IN THE GERMAN TRADE FAIR MARKET
155
5.2 DATA ANALYSIS
According to the definition of the research sample in chapter 5.1.1, the sample is
first of all analyzed regarding its validity68 and representativeness69 in comparison
to the relevant population. Afterwards, the survey results based on the
questionnaire are being evaluated.
5.2.1 Verification of the sample
The data analysis starts with an overview of the sample structure. As defined in
chapter 5.1.1, the population for the survey consisted of 2,334 main exhibitors at
MEDICA 2012. It was aspired to reach a census. Therefore, all 2,334 exhibitors
were addressed to participate in the survey. It was not expected that every
exhibitor would respond, though, yet, the set-up still guaranteed that every
addressed person had the same and equal chance to participate in the survey. The
survey was conducted online. The respondents were invited to participate by an
email containing a link to the survey. As determined before, using the Cochran’s
theorem (see chapter 5.1.1) at least 385 correctly filled in questionnaires (331 with
correction) were needed in order to expect valid and reliable results from the
analysis. Altogether, 646 recipients contributed to the survey. Thus, the criteria
return rate according to the formula is fulfilled.70
Nevertheless, as mentioned in chapter 5.1.1 analyzing the sample structure might
be more useful to evaluate the transferability of the sample results to the complete
population.
68 Validity describes the transferability of sample results to the population.
Especially the test situation as well as the respondents are in focus. (Berekoven et
al. 2009, pp. 82–83)
69 Representativeness implies that the sample is comparable to the population
regarding certain structure characteristics, so that the results can be transferred
from the sample to the population. (Bamberger 1994, p. 44)
70 For reference, see chapter 5.1.1.
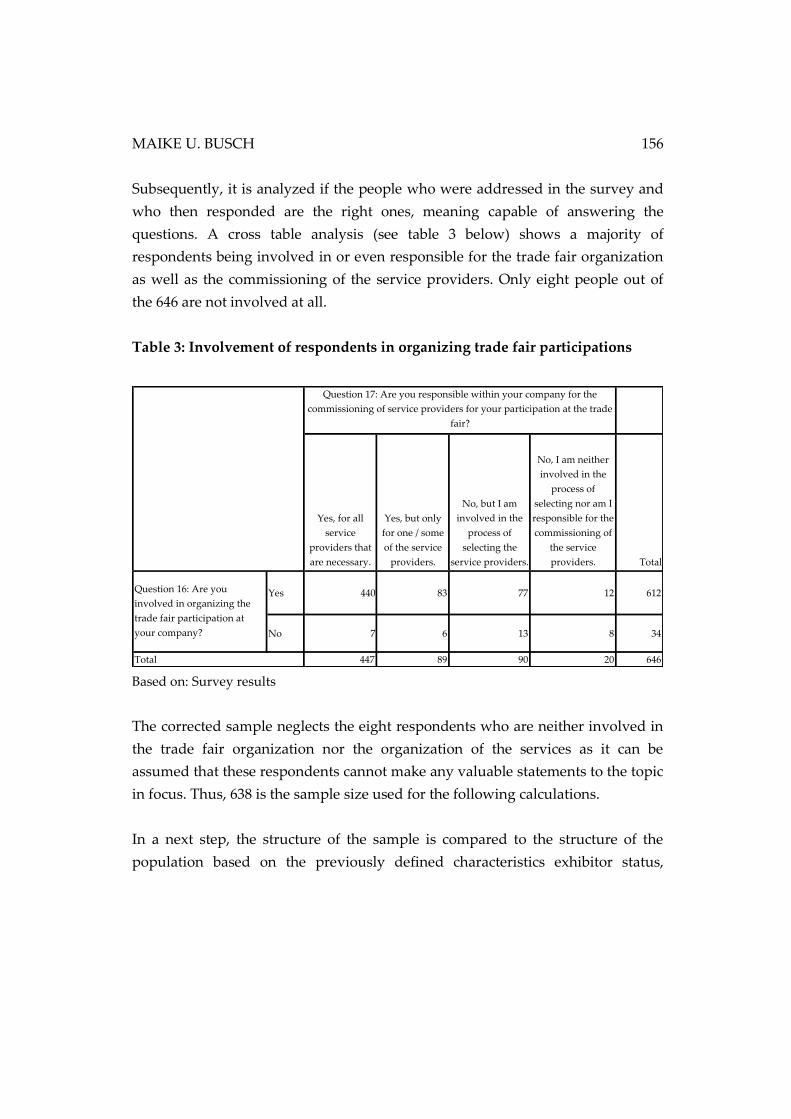
MAIKE U. BUSCH 156
Subsequently, it is analyzed if the people who were addressed in the survey and
who then responded are the right ones, meaning capable of answering the
questions. A cross table analysis (see table 3 below) shows a majority of
respondents being involved in or even responsible for the trade fair organization
as well as the commissioning of the service providers. Only eight people out of
the 646 are not involved at all.
Table 3: Involvement of respondents in organizing trade fair participations
Based on: Survey results
The corrected sample neglects the eight respondents who are neither involved in
the trade fair organization nor the organization of the services as it can be
assumed that these respondents cannot make any valuable statements to the topic
in focus. Thus, 638 is the sample size used for the following calculations.
In a next step, the structure of the sample is compared to the structure of the
population based on the previously defined characteristics exhibitor status,
Yes, for all
service
providers that
are necessary.
Yes, but only
for one / some
of the service
providers.
No, but I am
involved in the
process of
selecting the
service providers.
No, I am neither
involved in the
process of
selecting nor am I
responsible for the
commissioning of
the service
providers. Total
Yes 440 83 77 12 612
No 7 6 13 8 34
447 89 90 20 646
Question 16: Are you
involved in organizing the
trade fair participation at
your company?
Total
Question 17: Are you responsible within your company for the
commissioning of service providers for your participation at the trade
fair?
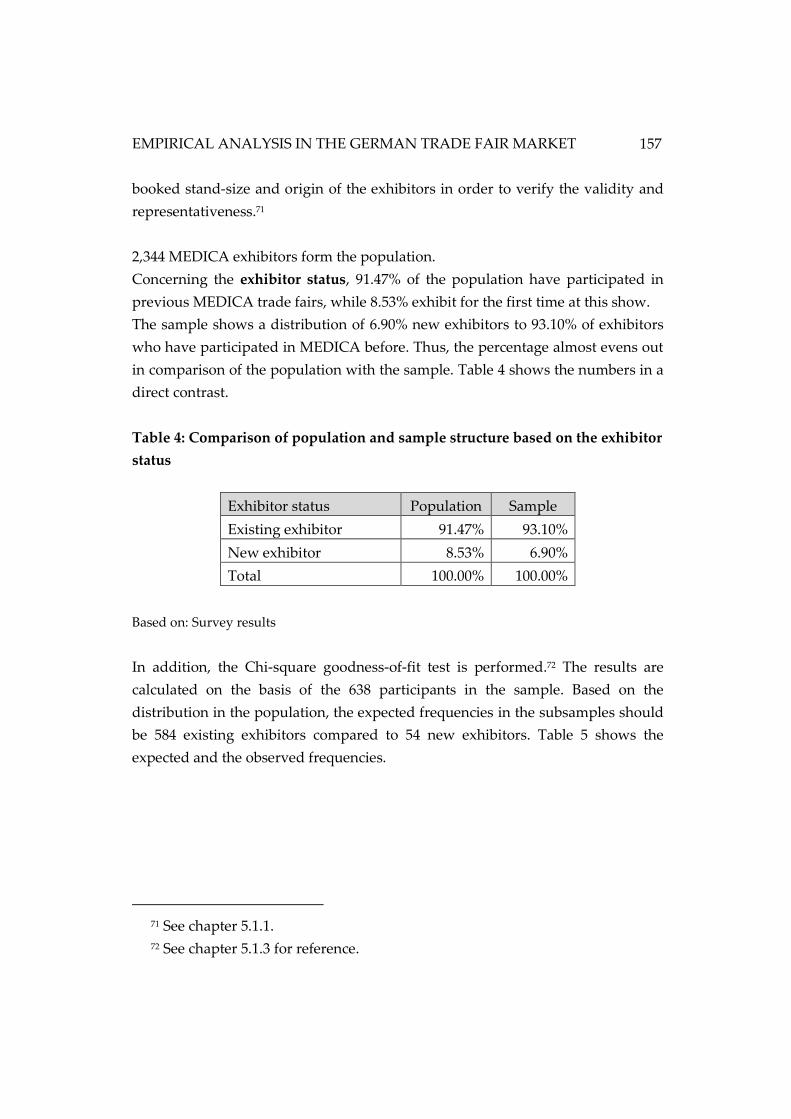
EMPIRICAL ANALYSIS IN THE GERMAN TRADE FAIR MARKET
157
booked stand-size and origin of the exhibitors in order to verify the validity and
representativeness.71
2,344 MEDICA exhibitors form the population.
Concerning the exhibitor status, 91.47% of the population have participated in
previous MEDICA trade fairs, while 8.53% exhibit for the first time at this show.
The sample shows a distribution of 6.90% new exhibitors to 93.10% of exhibitors
who have participated in MEDICA before. Thus, the percentage almost evens out
in comparison of the population with the sample. Table 4 shows the numbers in a
direct contrast.
Table 4: Comparison of population and sample structure based on the exhibitor
status
Exhibitor status Population Sample
Existing exhibitor 91.47% 93.10%
New exhibitor 8.53% 6.90%
Total 100.00% 100.00%
Based on: Survey results
In addition, the Chi-square goodness-of-fit test is performed.72 The results are
calculated on the basis of the 638 participants in the sample. Based on the
distribution in the population, the expected frequencies in the subsamples should
be 584 existing exhibitors compared to 54 new exhibitors. Table 5 shows the
expected and the observed frequencies.
71 See chapter 5.1.1.
72 See chapter 5.1.3 for reference.
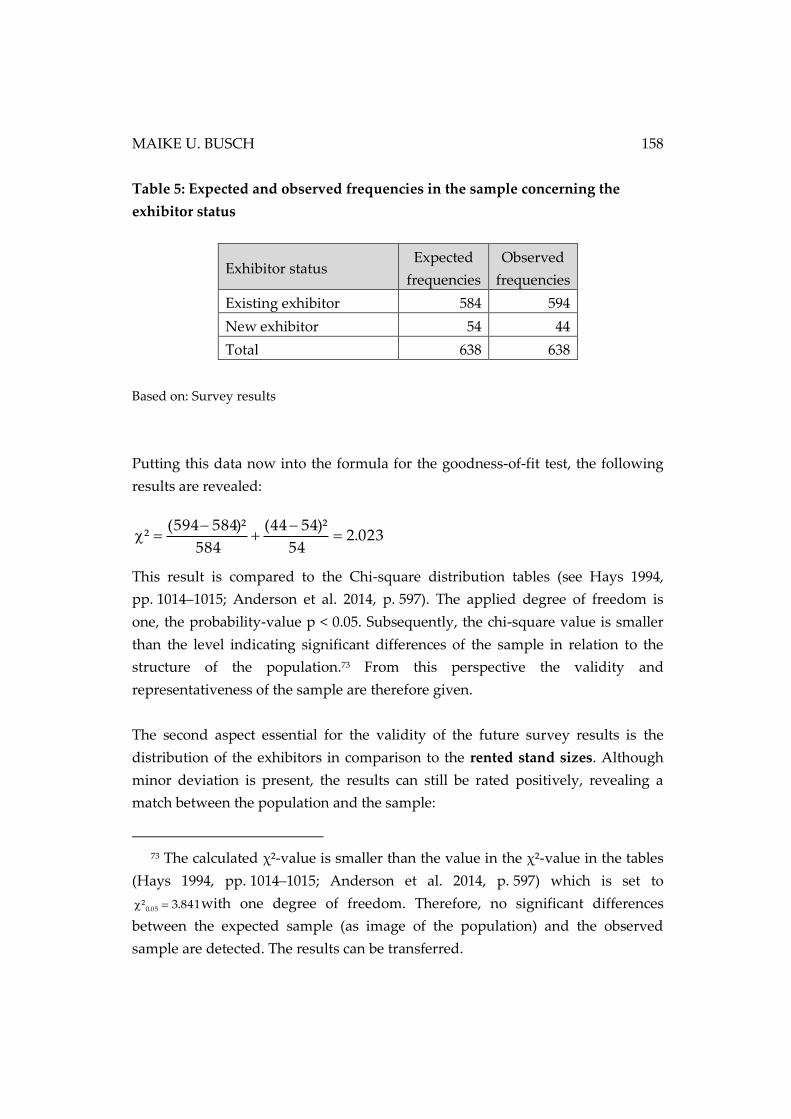
MAIKE U. BUSCH 158
Table 5: Expected and observed frequencies in the sample concerning the
exhibitor status
Exhibitor status Expected
frequencies
Observed
frequencies
Existing exhibitor 584 594
New exhibitor 54 44
Total 638 638
Based on: Survey results
Putting this data now into the formula for the goodness-of-fit test, the following
results are revealed:
This result is compared to the Chi-square distribution tables (see Hays 1994,
pp. 1014–1015; Anderson et al. 2014, p. 597). The applied degree of freedom is
one, the probability-value p < 0.05. Subsequently, the chi-square value is smaller
than the level indicating significant differences of the sample in relation to the
structure of the population.73 From this perspective the validity and
representativeness of the sample are therefore given.
The second aspect essential for the validity of the future survey results is the
distribution of the exhibitors in comparison to the rented stand sizes. Although
minor deviation is present, the results can still be rated positively, revealing a
match between the population and the sample:
73 The calculated χ²-value is smaller than the value in the χ²-value in the tables
(Hays 1994, pp. 1014–1015; Anderson et al. 2014, p. 597) which is set to
841.3² 05.0 with one degree of freedom. Therefore, no significant differences
between the expected sample (as image of the population) and the observed
sample are detected. The results can be transferred.
023.254
)²5444(
584
)²584594(²
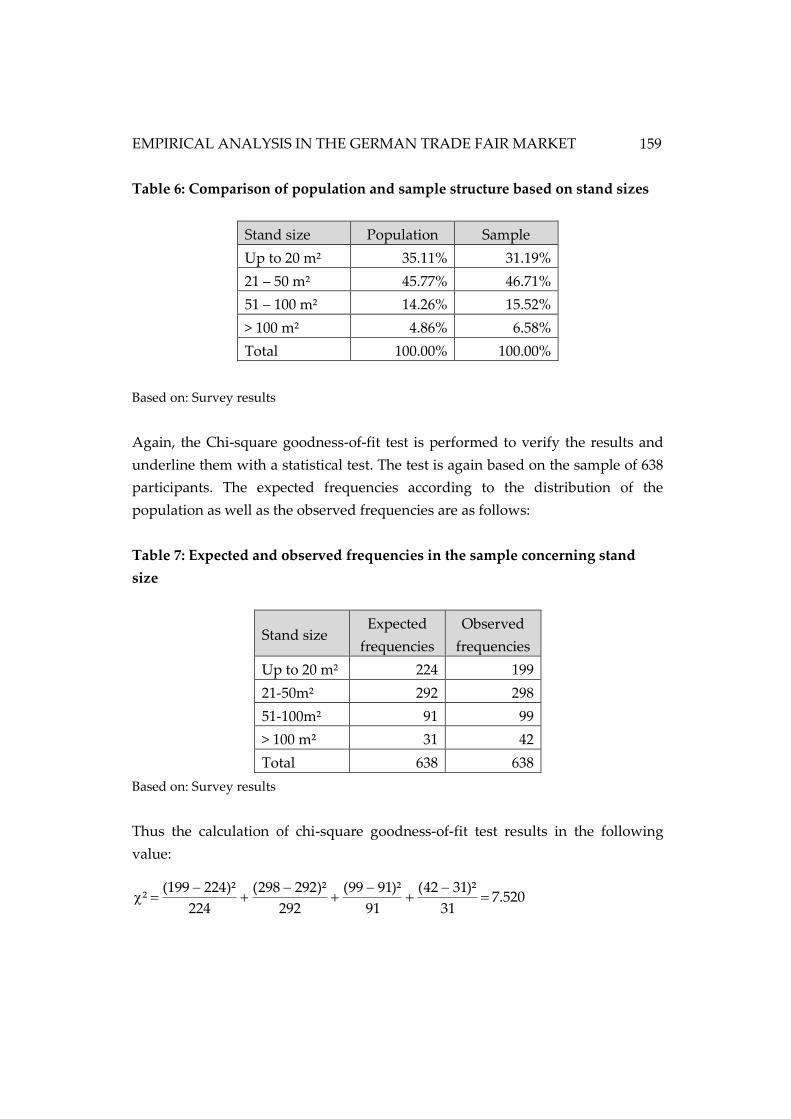
EMPIRICAL ANALYSIS IN THE GERMAN TRADE FAIR MARKET
159
Table 6: Comparison of population and sample structure based on stand sizes
Stand size Population Sample
Up to 20 m² 35.11% 31.19%
21 – 50 m² 45.77% 46.71%
51 – 100 m² 14.26% 15.52%
> 100 m² 4.86% 6.58%
Total 100.00% 100.00%
Based on: Survey results
Again, the Chi-square goodness-of-fit test is performed to verify the results and
underline them with a statistical test. The test is again based on the sample of 638
participants. The expected frequencies according to the distribution of the
population as well as the observed frequencies are as follows:
Table 7: Expected and observed frequencies in the sample concerning stand
size
Stand size Expected
frequencies
Observed
frequencies
Up to 20 m² 224 199
21-50m² 292 298
51-100m² 91 99
> 100 m² 31 42
Total 638 638
Based on: Survey results
Thus the calculation of chi-square goodness-of-fit test results in the following
value:
520.731
)²3142(
91
)²9199(
292
)²292298(
224
)²224199(²
MAIKE U. BUSCH 160
This result is compared to the Chi-square distribution tables (see Hays 1994,
pp. 1014–1015; Anderson et al. 2014, p. 597). The applied degree of freedom is
three, the probability-value p < 0.05. Subsequently, the chi-square value is smaller
than the level indicating significant differences of the sample in relation to the
structure of the population.74 Therefore, the sample can be verified as an image of
the population.
Last but not least, the origin of the exhibitors is compared. As mentioned before,
most exhibitors on the German trade fair market originate from Germany, Europe
(without Germany), and Asia.75 The same structure can be observed for the
MEDICA - Germany: 32.35%, Europe (without Germany): 41.09%, Asia: 19.19%,
all remaining parts of the world: 7.37%. Consequently, when differentiating
according to the origin, the focus is laid on these three categories as well.
Moreover, although the percentage distribution matches the parameter in the
population, only 25 people in total replied from all other parts of the world
(Africa, Americas, etc.). This small number of exhibitors would most likely not
lead to statistically useful results when running the statistical test. Thus, so that
survey results are not misinterpreted, this small group of exhibitors is neglected
when analyzing the sample with focus on the origin. Examining the survey
results in this respect, the sample distribution is fairly similar and comparable
with the structure of the population, see tables 8 and 9.
74 The calculated χ²-value is smaller than the value in the χ²-value in the tables
(see Hays 1994, pp. 1014–1015; Anderson et al. 2014, p. 597. which is set to
815.7² 05.0 with three degrees of freedom. Therefore, no significant differences
between the expected sample (as image of the population) and the observed
sample are detected. The results can be transferred.
75 See chapter 3.1.
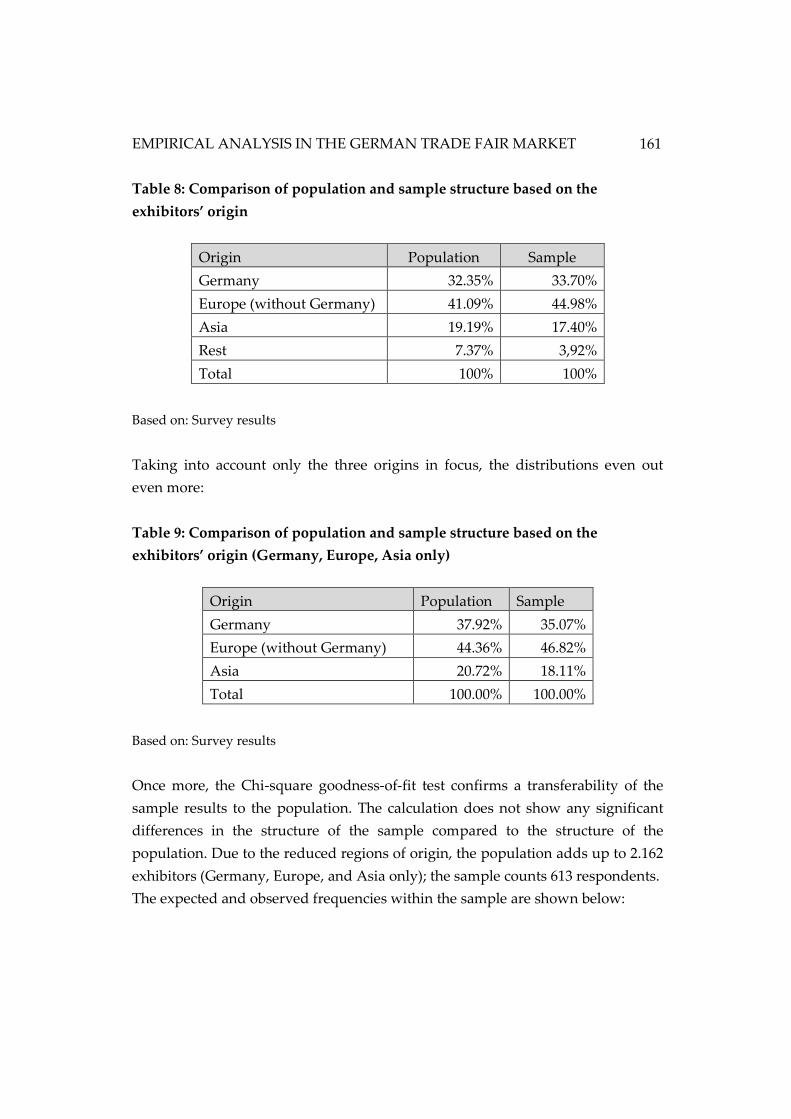
EMPIRICAL ANALYSIS IN THE GERMAN TRADE FAIR MARKET
161
Table 8: Comparison of population and sample structure based on the
exhibitors’ origin
Origin Population Sample
Germany 32.35% 33.70%
Europe (without Germany) 41.09% 44.98%
Asia 19.19% 17.40%
Rest 7.37% 3,92%
Total 100% 100%
Based on: Survey results
Taking into account only the three origins in focus, the distributions even out
even more:
Table 9: Comparison of population and sample structure based on the
exhibitors’ origin (Germany, Europe, Asia only)
Origin Population Sample
Germany 37.92% 35.07%
Europe (without Germany) 44.36% 46.82%
Asia 20.72% 18.11%
Total 100.00% 100.00%
Based on: Survey results
Once more, the Chi-square goodness-of-fit test confirms a transferability of the
sample results to the population. The calculation does not show any significant
differences in the structure of the sample compared to the structure of the
population. Due to the reduced regions of origin, the population adds up to 2.162
exhibitors (Germany, Europe, and Asia only); the sample counts 613 respondents.
The expected and observed frequencies within the sample are shown below:
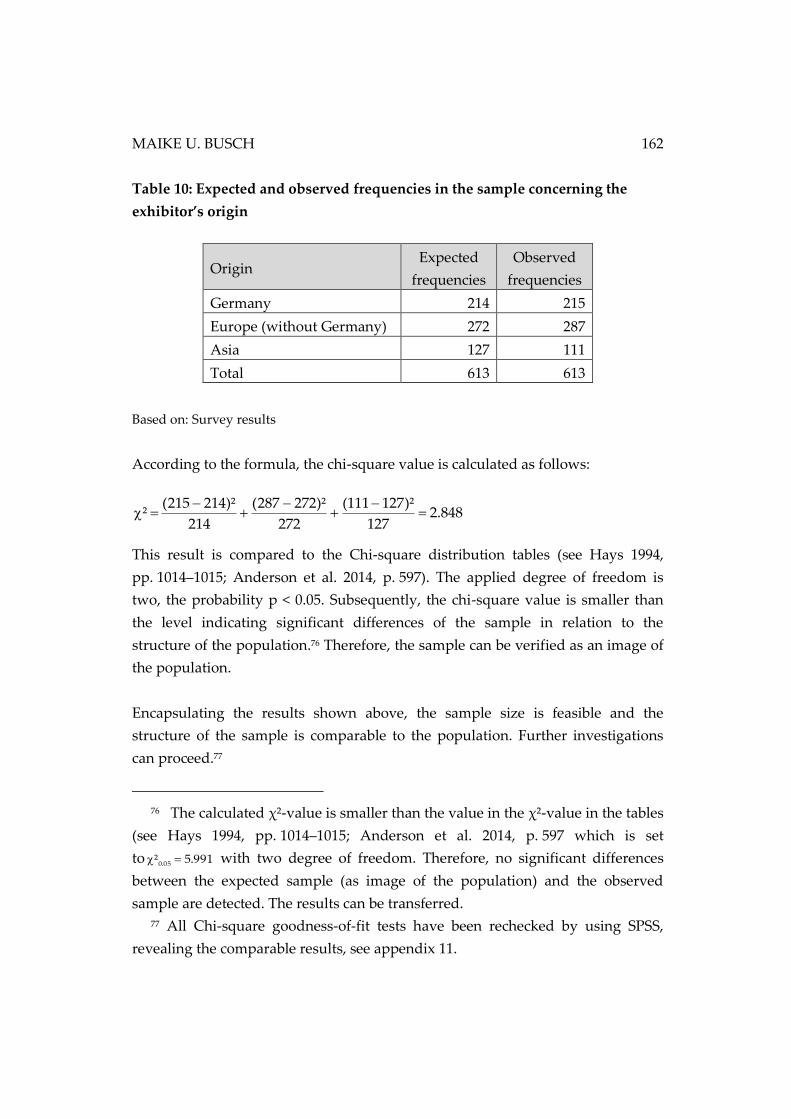
MAIKE U. BUSCH 162
Table 10: Expected and observed frequencies in the sample concerning the
exhibitor’s origin
Origin Expected
frequencies
Observed
frequencies
Germany 214 215
Europe (without Germany) 272 287
Asia 127 111
Total 613 613
Based on: Survey results
According to the formula, the chi-square value is calculated as follows:
This result is compared to the Chi-square distribution tables (see Hays 1994,
pp. 1014–1015; Anderson et al. 2014, p. 597). The applied degree of freedom is
two, the probability p < 0.05. Subsequently, the chi-square value is smaller than
the level indicating significant differences of the sample in relation to the
structure of the population.76 Therefore, the sample can be verified as an image of
the population.
Encapsulating the results shown above, the sample size is feasible and the
structure of the sample is comparable to the population. Further investigations
can proceed.77
76 The calculated χ²-value is smaller than the value in the χ²-value in the tables
(see Hays 1994, pp. 1014–1015; Anderson et al. 2014, p. 597 which is set
to 991.5² 05.0 with two degree of freedom. Therefore, no significant differences
between the expected sample (as image of the population) and the observed
sample are detected. The results can be transferred. 77 All Chi-square goodness-of-fit tests have been rechecked by using SPSS,
revealing the comparable results, see appendix 11.
848.2127
)²127111(
272
)²272287(
214
)²214215(²
EMPIRICAL ANALYSIS IN THE GERMAN TRADE FAIR MARKET
163
5.2.2 General results of the survey (focus on the complete sample)
To begin with, the general overview over the research results is given. Therefore,
the complete sample is analyzed as a one group. Thereby, the reader gets a first
impression on valuation of trust in general and specific characteristics linked to
the topic by the target group.
First, the importance MEDICA exhibitors attach to trust in business relationships
is investigated. Therefore, the answers to the questions 3 to 5 are taken into
account.78 Out of all respondents of the survey, almost 94% see an importance of
trust as a basis for a sustainable and long-term buyer-service-provider
relationship. Additionally, over 90% of all respondents seek long-term
relationships with service providers instead of continuously working with new
suppliers on different trade show participations. Although usually not all services
can be supplied by a single provider, the majority of exhibitors nevertheless
78 Question 3 (questionnaire): When buying services, it is often difficult to foresee
the end result. On a scale from 1 to 5 how important do
you rate the existence of trust into the sales partner for
establishing a long-term, sustainable buyer and service
provider relationship?
Question 4 (questionnaire): When buying services, are you looking for a long-term
relationship (for several trade fair cycles) with a service
provider who implements your wishes?
Question 5 (questionnaire): When buying services for your exhibition at a trade show,
are you looking for one single partner who supports you
in as many areas as possible, offering service packages
(e.g. constructing the stand, organizing the catering and
taking care of security)?
MAIKE U. BUSCH 164
wishes for a limited number of business partners to take care of all the services
necessary for a successful trade fair participation. 79 80
Derived from the secondary research outcomes, no general statements on relevant
and promising trust building determinants can be identified that are valid for all
business areas and industries. The factors leading to trust vary among the
branches of industry. The same goes for the facets of how the trust building
communication needs to be shaped.81 Consequently, the MEDICA exhibitors were
asked to state their opinions to these aspects. They were presented lists of trust
building factors and methods of communication in order to rate the single aspects
(in questions 2 and 6 of the questionnaire).
As mentioned already in chapter 5.1.3, it can be assumed that respondents
deciding on values of 3 up to 5 have a (rather) positive feeling about an aspect,
while respondents ticking the boxes 1 or 2 see no importance or attach no positive
feelings to the particular issue. In order to analyze the general findings of the
sample more precisely, the respondents ticking the boxes 4 and 5 are combined to
the top-box-group, while the respondents stating values of 1 and 2 are combined
in the low-box-group. The test persons choosing the value 3 are stated separately.
They might have a rather positive yet also somewhat indifferent attitude towards
the aspect. Therefore, only the top-box answers are taken into account for
displaying the magnitude of the singe aspects.
Before displaying the communication aspects, attention is previously drawn to
the ratings of the trust building factors.82 As can be seen in table 11 below, the
79 So exhibitors wish to reduce the problem of having several agents in one
project as stated in chapter 2.3.4.2 to minimize the need to coordinate and also to
reduce the information asymmetry. 80 See appendix 12 for more details on the survey results regarding questions 3
to 5.
81 See chapter 2.4 82 Based on question 2 (questionnaire): Although trust is a commonly known and
used term, there is no single definition for it. Which factors
EMPIRICAL ANALYSIS IN THE GERMAN TRADE FAIR MARKET
165
general importance attached to the determinants differs largely. While some
determinants mean a lot to the respondents and are considered essential when
building trust in business relationships, other determinants are only
contemplated as important by a smaller number of exhibitors.
The factors
• Communication between customer and supplier
• Honesty
• Reliability
• Ability of the supplier to realize the customers wishes (expertise)
• Satisfaction with previous interactions (= product performance)
seem essential for the purpose of building and maintaining trust. More than 90%
of all the respondents value each of these items as most important, rating them
with values of 4 and 5.
They are closely followed by the next items. Still more than 80% of the
respondents gave each item a score in the top boxes:
• Level of experience of supplying firm
• Personal level of experience of contact person at supplying firm
• Information exchange on an equal level
• Technical assistance in addition to ordered services
For the remaining factors the degree of overall importance declines steadily
among the complete sample.
Based on the survey results as displayed in table 11, 94.20% of all the respondents
involved in the MEDICA trade fair organization, ascribe a high importance to the
factor of communication between a supplier and a customer in order to build a
trustful and long-lasting business relationship. So for the target group this is the
overall and most crucial factor in building and maintaining trust in a business
relationship.83
do you find necessary for trust to develop and to strengthen
it within a business relationship to a service provider? 83 The detailed results with the all different measures can be viewed in
appendix 13.
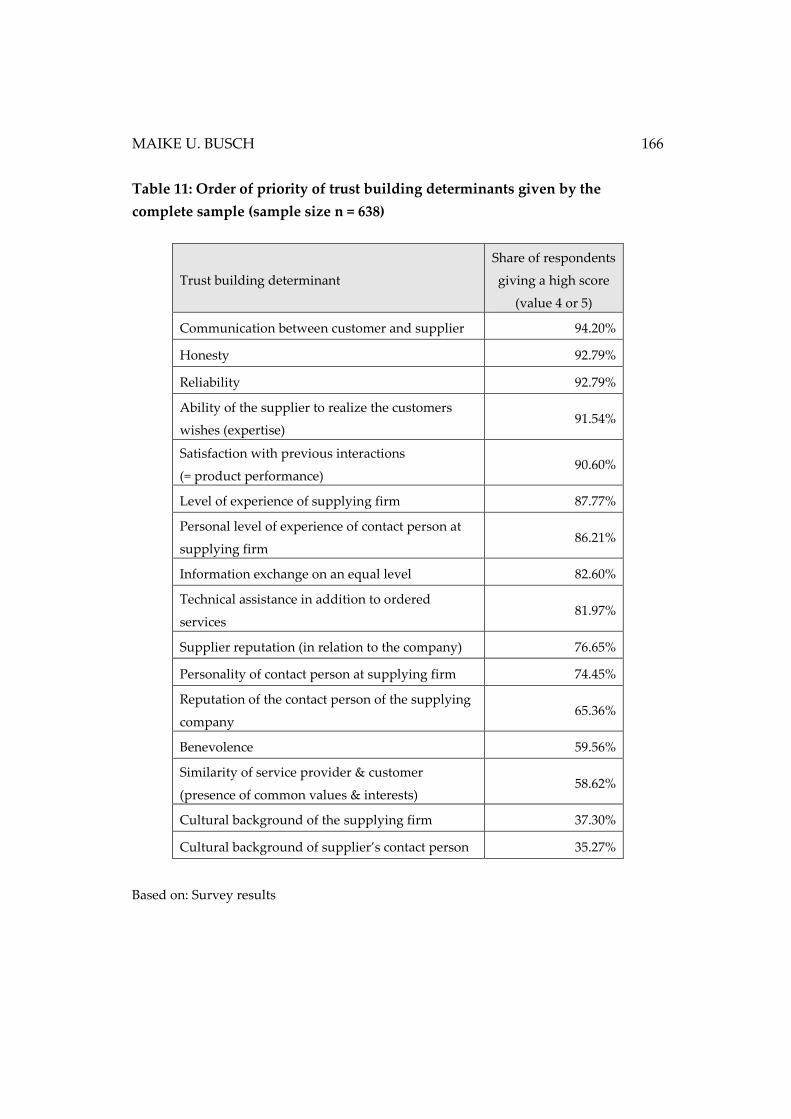
MAIKE U. BUSCH 166
Table 11: Order of priority of trust building determinants given by the
complete sample (sample size n = 638)
Trust building determinant
Share of respondents
giving a high score
(value 4 or 5)
Communication between customer and supplier 94.20%
Honesty 92.79%
Reliability 92.79%
Ability of the supplier to realize the customers
wishes (expertise) 91.54%
Satisfaction with previous interactions
(= product performance) 90.60%
Level of experience of supplying firm 87.77%
Personal level of experience of contact person at
supplying firm 86.21%
Information exchange on an equal level 82.60%
Technical assistance in addition to ordered
services 81.97%
Supplier reputation (in relation to the company) 76.65%
Personality of contact person at supplying firm 74.45%
Reputation of the contact person of the supplying
company 65.36%
Benevolence 59.56%
Similarity of service provider & customer
(presence of common values & interests) 58.62%
Cultural background of the supplying firm 37.30%
Cultural background of supplier’s contact person 35.27%
Based on: Survey results
EMPIRICAL ANALYSIS IN THE GERMAN TRADE FAIR MARKET
167
The respondents also had the chance to state missing aspects to develop trust.
However, they only confirmed the completeness of the list from their point of
view.
This leads directly to the next analysis – the analysis of the communication
aspects that the MEDICA exhibitors value most in order to establish a trust
building communication. As depicted earlier in the literature review, certain
aspects of communication have proven to be valuable when building and
strengthening trust in a relationship in the service industries.84 Question 6 of the
questionnaire broaches this particular issue.85 The respondents were asked to
review and assess 13 trust-building communication items. These items were
extracted from the literature research and clustered for the survey. Again, a
priority list is made of the survey results. The procedure of creating the list
follows the same pattern as the previous list in table 11.
In general, the analysis of question 6, asking for the relevance of the
communication aspects, shows less distinct results than the findings in question 2
asking for the trust determinants. The results regarding the promising
communication factors are more moderate.
According to this list based on the complete sample, the highest priority for the
respondents is the stability of the service provider in his communication and
doing (88.1%). However, just slightly less important are his willingness to care for
the customers’ needs (85.6%) as well as his offer of correct information at all times
even when difficulties arise (84.5%). Although half of the respondents feel
strongly about independent certifications, it is less relevant for the respondents in
general as the direct interaction with the business partners. The same applies also
for the news coverage about the service supplier in independent media and the
supplier’s social commitment. Nonetheless, it should be stressed that these
84 See chapters 2.1.2 and 2.1.3. 85 Question 6 (questionnaire): When getting in touch with a potential service
supplier, which aspects – besides prices and
discounts – are most important for you in order to
consider the supplier for further business?
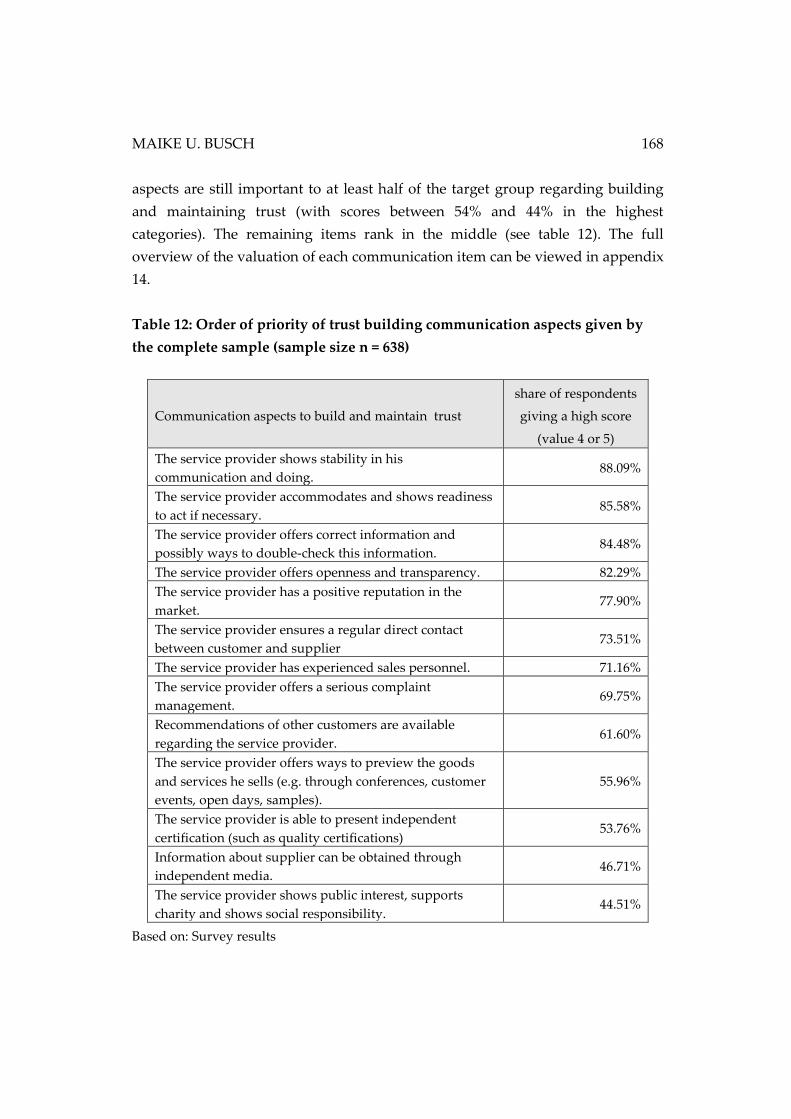
MAIKE U. BUSCH 168
aspects are still important to at least half of the target group regarding building
and maintaining trust (with scores between 54% and 44% in the highest
categories). The remaining items rank in the middle (see table 12). The full
overview of the valuation of each communication item can be viewed in appendix
14.
Table 12: Order of priority of trust building communication aspects given by
the complete sample (sample size n = 638)
Communication aspects to build and maintain trust
share of respondents
giving a high score
(value 4 or 5)
The service provider shows stability in his
communication and doing. 88.09%
The service provider accommodates and shows readiness
to act if necessary. 85.58%
The service provider offers correct information and
possibly ways to double-check this information. 84.48%
The service provider offers openness and transparency. 82.29%
The service provider has a positive reputation in the
market. 77.90%
The service provider ensures a regular direct contact
between customer and supplier 73.51%
The service provider has experienced sales personnel. 71.16%
The service provider offers a serious complaint
management. 69.75%
Recommendations of other customers are available
regarding the service provider. 61.60%
The service provider offers ways to preview the goods
and services he sells (e.g. through conferences, customer
events, open days, samples).
55.96%
The service provider is able to present independent
certification (such as quality certifications) 53.76%
Information about supplier can be obtained through
independent media. 46.71%
The service provider shows public interest, supports
charity and shows social responsibility. 44.51%
Based on: Survey results
EMPIRICAL ANALYSIS IN THE GERMAN TRADE FAIR MARKET
169
Another question arises from these two tables: Can the trust building variables be
matched with the communication factors which are relevant for establishing trust
according to literature and the survey results? For that reason, cross tables are
formed to determine the relation of every single trust item and the
communication aspects. Counted are those respondents who rated certain trust
item with a high score in connection with the various communication tools. The
aim is to reveal the most effective communication tools per trust determinant to
give clues for trust building communication strategies among the target group.
The analysis, however, reveals similar tendencies in the split results as in the
overall analysis. The single trust items do not seem to require any specific
addressing. Instead, those communication aspects, generally rated as important,
seem to have a positive effect on all the trust building factors while the less
favored communication items in relation to the trust items do also not deviate
much from the overall results. 86
Additionally, the Spearman’s rank order correlation is carried out per item. Both
the trust determinants as well as the communication aspects are rated on ordinal
scales; therefore, the Spearman’s rank correlation is a useful tool.87 All correlation
coefficients show a very low or low positive correlation. However, no
communication tool shows an extreme deviation from the others. Therefore, this
result backs the findings already mentioned above: There is a connection between
each trust item and each communication item, but no preeminent correlation
between two specific items could be discovered. 88
Thus, the analysis of the trust building and communication aspects in general
shows clear rankings of the importance the exhibitors attach to them. However,
no obvious tendencies of corresponding trust and communication features can be
discovered. The specific communication tools can be used to address the variety
of trust items. Hence, some trust-building factors as well as some communication
aspects are rated more valuable or necessary in order to achieve the goal of a
trustful business relationship than others.
86 The crosstables can be found in appendix 15. 87 See chapter 5.1.4.
88 See appendix 16.
MAIKE U. BUSCH 170
However, as seen before, the exhibitor target group for international trade fairs is
very diverse as mentioned in chapter 3.1. In this exemplary target group of the
MEDICA exhibitors, this can be observed as well. Therefore, further analyses are
carried out. The next step is the attempt to falsify the hypotheses generated in
chapter 4.
5.2.3 Testing of hypotheses
In the next step, the complete sample is to be tested on the hypotheses. Therefore,
the sample is partly divided into sub-samples based on the beforehand defined
characteristics. A brief description of the tests to be used has been given in
chapter 5.1.4. As already previously mentioned, in this project non-parametric
tests are used. They are used when a normal distribution of the data cannot be
assures. Moreover, they are implemented when ordinal scales are used. (Bühl
2009, p. 347) Ordinal scales are mainly of interest in this survey as could be seen
in description of the questionnaire.
5.2.3.1 Testing of hypothesis 1
Based on the findings on the topics of service marketing, the principal agent
theory as well as trust, the first hypothesis for testing has been formulated as
follows:
Hypothesis 1
H01: If an exhibitor seeks a long-lasting relationship with his trade fair
service provider, he does not regard trust as an essential factor to
maintain such a business relationship.
H11: If an exhibitor seeks a long-lasting relationship with his trade fair
service provider, he does regard trust as an essential factor to maintain
such a business relationship.
The relevance of both factors in general was already made obvious. However, it
can also be stated that those exhibitors seeking for a long-lasting business
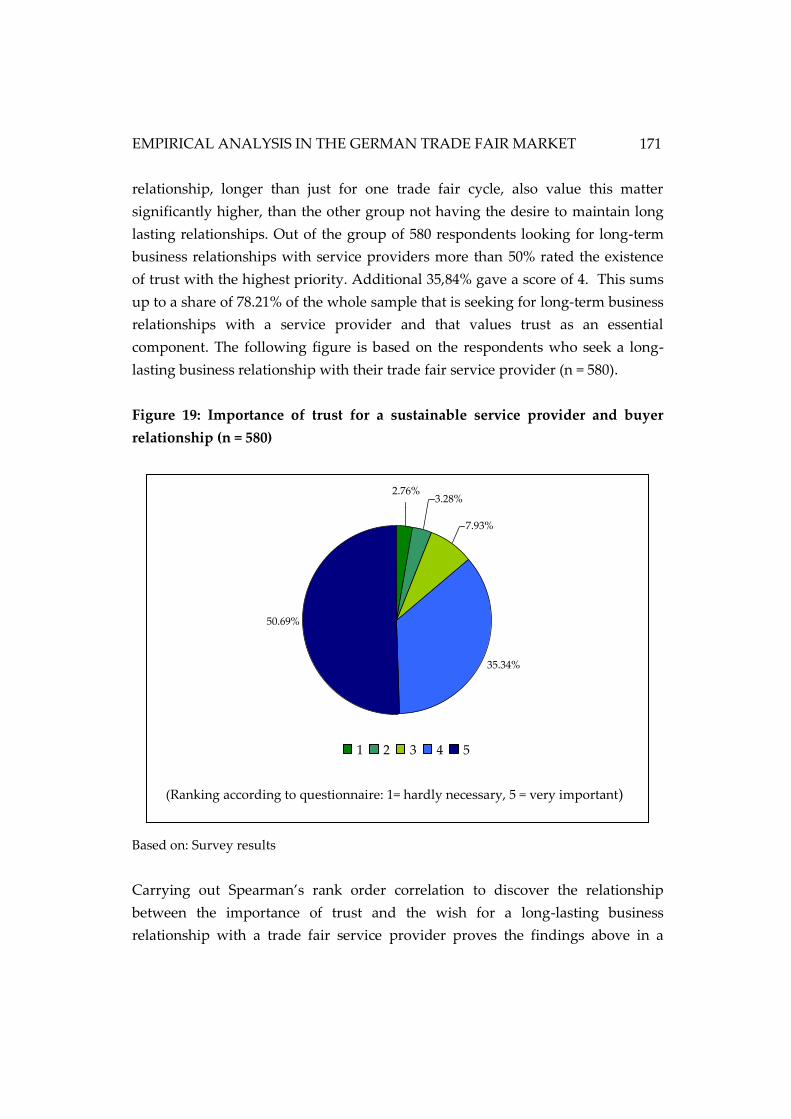
EMPIRICAL ANALYSIS IN THE GERMAN TRADE FAIR MARKET
171
relationship, longer than just for one trade fair cycle, also value this matter
significantly higher, than the other group not having the desire to maintain long
lasting relationships. Out of the group of 580 respondents looking for long-term
business relationships with service providers more than 50% rated the existence
of trust with the highest priority. Additional 35,84% gave a score of 4. This sums
up to a share of 78.21% of the whole sample that is seeking for long-term business
relationships with a service provider and that values trust as an essential
component. The following figure is based on the respondents who seek a long-
lasting business relationship with their trade fair service provider (n = 580).
Figure 19: Importance of trust for a sustainable service provider and buyer
relationship (n = 580)
Based on: Survey results
Carrying out Spearman’s rank order correlation to discover the relationship
between the importance of trust and the wish for a long-lasting business
relationship with a trade fair service provider proves the findings above in a
(Ranking according to questionnaire: 1= hardly necessary, 5 = very important)
4.55%
1.70%
9.09%
23.86%
60.80%
1 2 3 4 5
35.34%
50.69%
2.76%
7.93%
3.28%
1
2
3
4
5
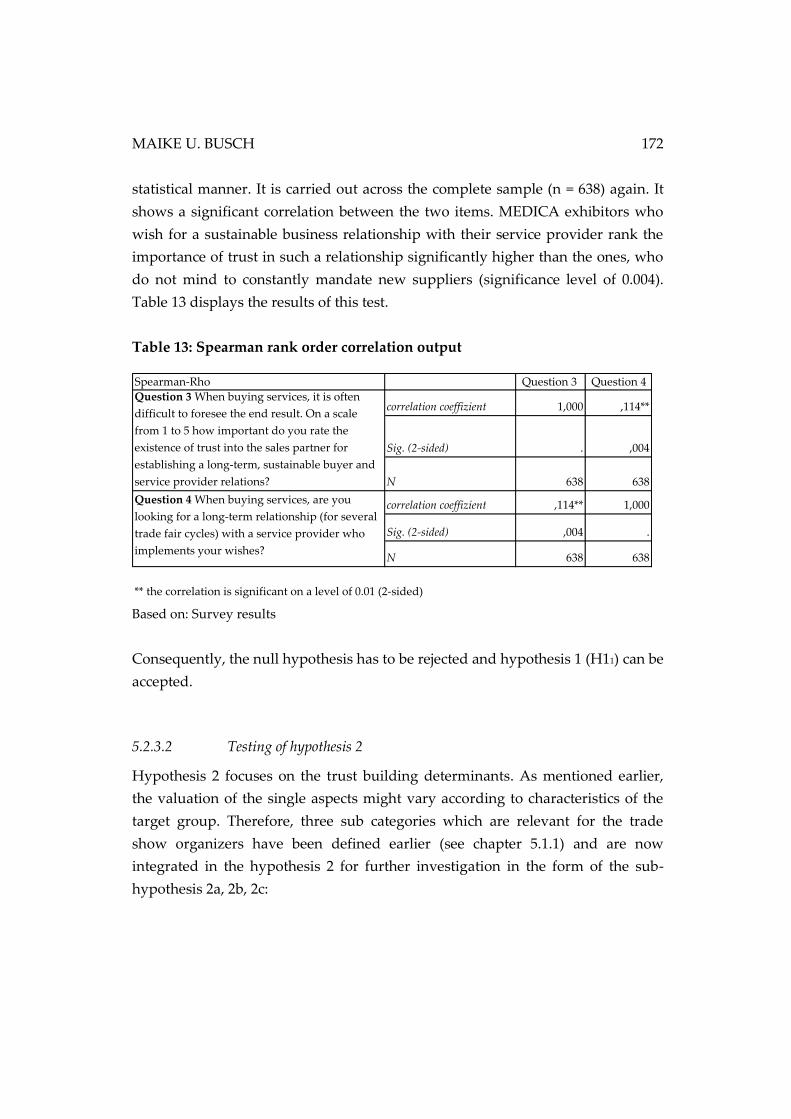
MAIKE U. BUSCH 172
statistical manner. It is carried out across the complete sample (n = 638) again. It
shows a significant correlation between the two items. MEDICA exhibitors who
wish for a sustainable business relationship with their service provider rank the
importance of trust in such a relationship significantly higher than the ones, who
do not mind to constantly mandate new suppliers (significance level of 0.004).
Table 13 displays the results of this test.
Table 13: Spearman rank order correlation output
Spearman-Rho Question 3 Question 4
correlation coeffizient 1,000 ,114**
Sig. (2-sided) . ,004
N 638 638
correlation coeffizient ,114** 1,000
Sig. (2-sided) ,004 .
N 638 638
** the correlation is significant on a level of 0.01 (2-sided)
Question 3 When buying services, it is often
difficult to foresee the end result. On a scale
from 1 to 5 how important do you rate the
existence of trust into the sales partner for
establishing a long-term, sustainable buyer and
service provider relations?
Question 4 When buying services, are you
looking for a long-term relationship (for several
trade fair cycles) with a service provider who
implements your wishes?
Based on: Survey results
Consequently, the null hypothesis has to be rejected and hypothesis 1 (H11) can be
accepted.
5.2.3.2 Testing of hypothesis 2
Hypothesis 2 focuses on the trust building determinants. As mentioned earlier,
the valuation of the single aspects might vary according to characteristics of the
target group. Therefore, three sub categories which are relevant for the trade
show organizers have been defined earlier (see chapter 5.1.1) and are now
integrated in the hypothesis 2 for further investigation in the form of the sub-
hypothesis 2a, 2b, 2c:
EMPIRICAL ANALYSIS IN THE GERMAN TRADE FAIR MARKET
173
Hypothesis 2
H02: Exhibitors do not show significant differences in their valuation of trust
building factors according to their characteristics.
H12: Exhibitors show significant differences in their valuation of trust
building factors according to their characteristics.
H12a: Exhibitors show significant differences in their valuation of trust
building factors according to their exhibitor status.
H12b: Exhibitors show significant differences in their valuation of trust
building factors according to their booked stand size.
H12c: Exhibitors show significant differences in their valuation of trust
building factors according to their origin.
The hypothesis is based on the answers to question 2 of the questionnaire.
Question 2 reads as follows:
“Although trust is a commonly known and used term, there is no single definition for it.
Which factors do you find necessary for trust to develop and to strengthen it within a
business relationship to a service provider?”
The respondents were asked to rate a number of 16 items according to the
importance they attach to each determinant. Different groups of variables have to
be compared to each other. Therefore, not only the summary of frequencies of
specific answers needs to be looked at. Important are measures that can show
relationships between these variables, such as measures of location. Although a
variety of mean comparison tests are possible, the author decides to use the
median as tool.89 The median has the advantage that is not affected by unusual
89 The median indicates the middle of the raw data. After the single answers
are arranged from smallest to largest value, the mean names the value of which
50% of all answers are bigger and 50% of all answers are smaller in value.
(Freeman et al. 2014, p. 50)
MAIKE U. BUSCH 174
small or unusual high values as the arithmetic mean could be. (Bortz, Schuster
2010, pp. 25–29; Freeman et al. 2014, p. 50) However, the results can only give an
indication of differences in the exhibitors’ judgment of the different attributes. In
order to discover statistically significant differences among the opinions per
subgroup, significance test according to the present data basis are carried out. For
the significance tests the two lower parameters (‘very low meaning’, value 1, and
‘low meaning’, value 2) are combined. The same applies to the two scores ‘very
important’ (value 5) and ‘important’ (value 4). The middle score as well as the ‘no
opinion’-option stay unpaired. As a result three categories for calculation develop
from “unimportant” to ‘indifferent’ to ‘important’. The answers ‘no opinion’ is to
be neglected per item, as the answers have no explanatory value. Possible
significant divergence between the subgroups can then be calculated by using the
statistical tests, explained in chapter 5.1.4. In combination with the median
results, deductions regarding the target groups can be drawn.
Exhibitor status
The first aspect to divide the sample by is the exhibitor status, corresponding to
hypothesis 2a:
H12a: Exhibitors show significant differences in their valuation of trust
building factors according to their exhibitor status.
When differentiating the sample according to the characteristic ‘exhibitor status’,
it can be divided into two groups: existing exhibitors and new exhibitors. As an
exhibitor can only belong into one of these groups, they can be defined as two
independent samples. (Bühl 2009, p. 145)
The median comparison between the two groups ‘existing exhibitors’ and ‘new
exhibitors’ shows only a slight differences in the weighting of the trust factors.
Only the aspect ‘cultural background of the supplying firm’ seems to have a
minimal deviation. According to these results, existing exhibitors seem to put a
little more emphasis on the origin of the service provider when choosing one than
new exhibitors do. It can be assumed exhibitors who have participated in this
trade show on this fair ground before have gained previous experiences and can
therefore easier negotiate between the available service providers. However, even
EMPIRICAL ANALYSIS IN THE GERMAN TRADE FAIR MARKET
175
this one diversification among the valuations is only small as new exhibitors rate
the aspect with a grouped median value90 of 3.18 while the existing exhibitors
average at 3.50. The following figure 20 provides an overview of the ratings for
each potentially trust building factor.91
90 The trust determinants cannot be rated and measure by metric scales. The
values expressed in numbers are therefore only numeric coding, representing a
range of values the respondents attach to the terms ‘very low meaning’, ‘low
meaning’, ‘important’ and ‘very important’. Thus, the grouped median is used for
comparison. (Brosius 2013, p. 472)
91 Detailed median values can be viewed in appendix 17.
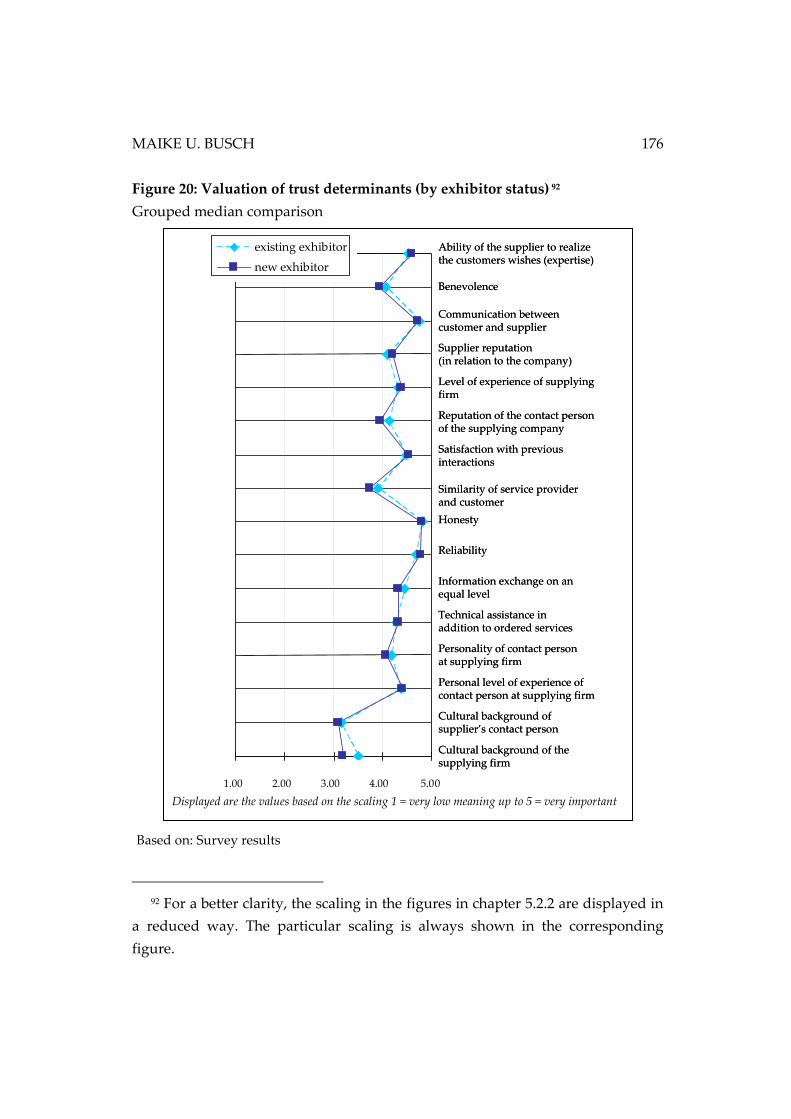
MAIKE U. BUSCH 176
Figure 20: Valuation of trust determinants (by exhibitor status) 92
Grouped median comparison
92 For a better clarity, the scaling in the figures in chapter 5.2.2 are displayed in
a reduced way. The particular scaling is always shown in the corresponding
figure.
Based on: Survey results
Displayed are the values based on the scaling 1 = very low meaning up to 5 = very important
Ability of the supplier to realize the
customers wishes (expertise)Benevolence
Communication between customer and
supplier
Supplier reputation (in relation to the
company)
Level of experience of supplying firm
Reputation of the contact person of the
supplying company
Satisfaction with previous interactions
Similarity of service provider &
customer
Honesty
Reliability
Information exchange on an equal level
Technical assistance in addition to
ordered servicesPersonality of contact person at
supplying firm
Personal level of experience of contact
person at supplying firmCultural background of supplier’s
contact person
Cultural background of the supplying
firm1.00 2.00 3.00 4.00 5.00
existing exhibitor
new exhibitor
Ability of the supplier to realize the customers wishes (expertise)Ability of the supplier to realize the customers wishes (expertise)
BenevolenceBenevolence
Communication between customer and supplierCommunication between customer and supplier
Supplier reputation(in relation to the company)Supplier reputation(in relation to the company)
Level of experience of supplying firmLevel of experience of supplying firm
Reputation of the contact person of the supplying companyReputation of the contact person of the supplying company
Satisfaction with previous interactions Satisfaction with previous interactions
Similarity of service provider and customerSimilarity of service provider and customer
Honesty Honesty
Reliability Reliability
Information exchange on an equal levelInformation exchange on an equal level
Technical assistance in addition to ordered servicesTechnical assistance in addition to ordered services
Personality of contact personat supplying firmPersonality of contact personat supplying firm
Personal level of experience of contact person at supplying firmPersonal level of experience of contact person at supplying firm
Cultural background of supplier’s contact personCultural background of supplier’s contact person
Cultural background of the supplying firmCultural background of the supplying firm
1.00 2.00 3.00 4.00 5.00
Ability of the supplier to realize the
customers wishes (expertise)Benevolence
Communication between customer and
supplier
Supplier reputation (in relation to the
company)
Level of experience of supplying firm
Reputation of the contact person of the
supplying company
Satisfaction with previous interactions
Similarity of service provider &
customer
Honesty
Reliability
Information exchange on an equal level
Technical assistance in addition to
ordered servicesPersonality of contact person at
supplying firm
Personal level of experience of contact
person at supplying firmCultural background of supplier’s
contact person
Cultural background of the supplying
firm1.00 2.00 3.00 4.00 5.00
existing exhibitor
new exhibitor
EMPIRICAL ANALYSIS IN THE GERMAN TRADE FAIR MARKET
177
In order to evaluate the answers of two independent samples, several statistical
operations are possible to use. However, the fact that the exhibitor status is a
nominal variable and the trust-building determinants are rated on an ordinal
scale limits the variety of reasonable tests. In order to compare two independent
samples with a non-parametric test of significance, the Mann-Whitney U-Test can
be calculated. 93
According to the test results, no significant differences exist between the two
groups in focus.94 Based on the test results, it can be concluded that the exhibitor
status has no significant influence on the rating of the determinants responsible
for building trust in business relationships with a service provider. Hypothesis 2a
(H12a) has to be rejected. The null-hypothesis should be retained.
Stand size
The next relevant characteristic, the sample can be divided into subgroups by, is
the stand size, meaning the number of square meters exhibitors have booked for
the last trade fair before the survey. The variable stand size has been divided into
four categories for the questionnaire (up to 20m², 21-50m², 51-100m², more than
100m²) and each exhibitor can belong to only one category at a time. Thus, in this
testing situation, four independent samples have to be compared.
The second segmentation of the sample therefore corresponds with hypothesis 2b
(H12b):
H12b: Exhibitors show significant differences in their valuation of trust
building factors according to their booked stand size.
Again, a median comparison is performed. The results are shown in the chart
below. Detailed figures of the median values can be found in appendix 19 .
93 See chapter 5.1.4.
94 See appendix 18.
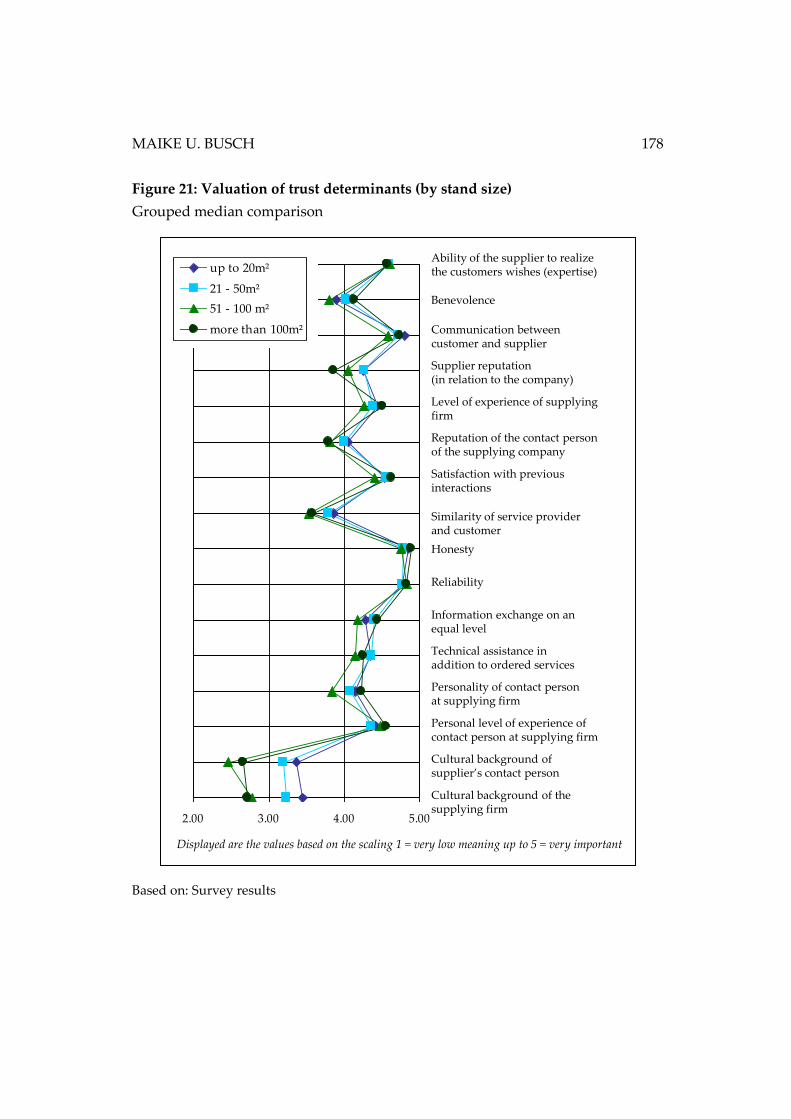
MAIKE U. BUSCH 178
Figure 21: Valuation of trust determinants (by stand size)
Grouped median comparison
Based on: Survey results
Ability of the supplier to realize the customers
wishes (expertise)Benevolence
Communication between customer and
supplier
Supplier reputation (in relation to the
company)
Level of experience of supplying firm
Reputation of the contact person of the
supplying company
Satisfaction with previous interactions
(= Product performance) Similarity of service provider & customer
(presence of common values & interests)
Honesty
Reliability
Information exchange on an equal level
Technical assistance in addition to ordered
services
Personality of contact person at supplying
firm
Personal level of experience of contact person
at supplying firm
Cultural background of supplier’s contact
person
Cultural background of the supplying firm
2.00 3.00 4.00 5.00
up to 20m²
21 - 50m²
51 - 100 m²
more than 100m²
Ability of the supplier to realize the customers wishes (expertise)
Benevolence
Communication between customer and supplier
Supplier reputation(in relation to the company)
Level of experience of supplying firm
Reputation of the contact person of the supplying company
Satisfaction with previous interactions
Similarity of service provider and customer
Honesty
Reliability
Information exchange on an equal level
Technical assistance in addition to ordered services
Personality of contact personat supplying firm
Personal level of experience of contact person at supplying firm
Cultural background of supplier’s contact person
Cultural background of the supplying firm
Ability of the supplier to realize the customers
wishes (expertise)Benevolence
Communication between customer and
supplier
Supplier reputation (in relation to the
company)
Level of experience of supplying firm
Reputation of the contact person of the
supplying company
Satisfaction with previous interactions
(= Product performance) Similarity of service provider & customer
(presence of common values & interests)
Honesty
Reliability
Information exchange on an equal level
Technical assistance in addition to ordered
services
Personality of contact person at supplying
firm
Personal level of experience of contact person
at supplying firm
Cultural background of supplier’s contact
person
Cultural background of the supplying firm
2.00 3.00 4.00 5.00
up to 20m²
21 - 50m²
51 - 100 m²
more than 100m²
Displayed are the values based on the scaling 1 = very low meaning up to 5 = very important
EMPIRICAL ANALYSIS IN THE GERMAN TRADE FAIR MARKET
179
The medians of the items, resulting from the weighting by the subgroups show
hardly any diversification. Only the last two aspects concentration on the cultural
backgrounds of the service provider’s contact person and the service supplying
firm seem to differ. From a stand size bigger than 51m², the cultural background
has a lower magnitude than for exhibitors with only smaller booths up to 50m².
Once more, a statistical test of significance succeeds the previous median
comparison. Taking the stand size and the ratings of question 2 into account, the
stand size is measured in square meters, so a metric scale but divided into ordinal
classes. Question 2 also divides its parametric values into ordinal classes.
However, since the sample does not show a normal distribution, the ANOVA
cannot be tested. It is therefore decided to use the Kruskal-Wallis-test to examine
the significance between the independent parametric values of the sample
regarding the stand size with respect to the ordinal dependent variable, meaning
the trust building determinants.95
The Kuskal-Wallis-test states that there are hardly any significant relations
between the stand size and the weighting of the trust building determinants. The
null-hypothesis should be retained in most cases, as different stand sizes value
the aspects in a comparable manner. There are only three exceptions for the
determinant relating to the satisfaction with previous interactions and the items
focusing on the cultural aspects, one of them already showing differences in the
median comparison per category.96
As the characteristic is measured in four different categories, in a second step a
comparison by pairs has to be carried out to see the significant differences in
detail. Therefore, the Mann-Whitney-U-test for the comparison of two
independent samples is performed as post-hoc test.97
Considering the aspect of satisfaction with previous interactions first, the Mann-
Whitney-U-test reveals a significant difference in the weighting of the factor
95 See chapter 5.1.4. 96 See appendix 20.
97 See chapter 5.1.4.
MAIKE U. BUSCH 180
between the smaller exhibitors (up to 20m² and 21-50m²) in relation with the
group of exhibitors booking 51-100m² booths (p-value = 0,023 and 0,019).
Additionally, this group (51-100m²) shows a significant difference compared to
the largest group with stand sizes exceeding 100m² (p-value = 0,037).98
Spearman’s rank order correlation is carried out in order to display any
correlations between the four different groups and their valuation of the aspect of
satisfaction with previous items. The test exposes a correlation value of r = -0.046,
however, this result is not significant (p-value = 0.250). 99 Consequently no
statement can be made that the bigger the stand, the less important is the
previous product performance. With almost 91% of the complete sample voting
for a higher importance of this aspect, as stated in chapter 5.2.2, it should
generally considered valuable for the target group.
Taking the stand size and the cultural background of the sales person into
account, it reveals a significant difference in the rating between the contacts with
the smaller stand sizes (up to 50m²) and the bigger ones, bigger than 50m². The
p-values for group 1 (up to 20m²) compared to group 3 (51-100m²) respectively
group 4 (more than 100m²) are calculated as p = 0.000 and 0.004, and are therefore
highly significant. The calculations between group 2 (21-50m²) and group 3
respectively group 4 lead to similar results with significant p-levels of p = 0.000
and p = 0.031. The Spearmen’s rank correlation test shows a slight negative
correlation r = -0.172. Furthermore, it is highly significant (p = 0,000). These
circumstances can be summarized as follows: With the growing of the stand size,
the importance of the cultural background of the contact person loses its
importance. 100
When taking the stand size and the cultural background of the service company
into account, the picture is similar. There is a no significant difference in the
valuing of this particular aspect between group 1 (up to 20m²) and group 2 (21-
50m²) and between the groups 3 (51-100m²) and 4 (more than 100m²) according to
the Mann-Whitney-U-test. Nevertheless, a significant difference can be seen
between the groups 1 and 2 as one unit compared with the groups 3 and 4 as
98 See appendix 21. 99 See chapter 5.3.1.
100 See appendix 22.

EMPIRICAL ANALYSIS IN THE GERMAN TRADE FAIR MARKET
181
another unit. All p-values are in the range of 0.000 up to 0.045101, so the tests show
that the exhibitors with smaller stands differ from the ones with bigger stands.
Here, the Spearman rank order correlation-test also shows a slight negative
correlation r 0 -0.138 and the result is highly significant (p = 0.001). This leads to
the conclusion: The bigger the stand size, the less important gets the cultural
background of the service-providing company.102
However, considering the overall scores of these cultural-related items across the
total sample, both aspects score rather low in the general valuation regarding
trust building determinants. With about 35% and 37% they rank last with an
obvious distance to all other aspects in the top score comparison of the trust-
building variables.103 Therefore, a further investigation of the causation has been
abandoned.
Concluding it can be presumed that the booked stand size has at its most only a
slight influence on how exhibitors rate the trust building determinants for a
business relationship with a service provider.
Origin
This leads to the third and last set of subgroups to be considered for significant
differences among them. They are divided by the origin as main characteristic.
This matches up with hypothesis 2c (H12c):
H12c: Exhibitors show significant differences in their valuation of trust
building factors according to their origin.
As explained in chapter 5.2.1, only three regions are analyzed: Germany, Europe
without Germany (future reference: Europe), and Asia.
Again, the analysis starts with an execution of a median comparison. From the
calculation of the median measures, the cultural aspects regarding the service
provider seem to be relevant once more. The European and Asian exhibitors rate
101 See appendix 22. 102 See appendix 22.
103 See table in chapter 5.2.2.
MAIKE U. BUSCH 182
these aspects of cultural backgrounds with a median value of approximately 3.5.
German exhibitors on the contrary value them distinctly less important (median
value of approximately 2.5). Although generally speaking, the overall low rating
of this aspect has to be kept in mind.
Additionally, the curves in the graph below show some differences also in the
aspects of ‘reputation of the contact person of the supplying company’, ‘similarity
of service provider and customer’, ‘reliability’, ‘technical assistance in addition to
ordered services’ and ‘the personal level of experience of the contact person at the
supplying firm’, for example. The exact numbers of the median values can be
found in appendix 23.
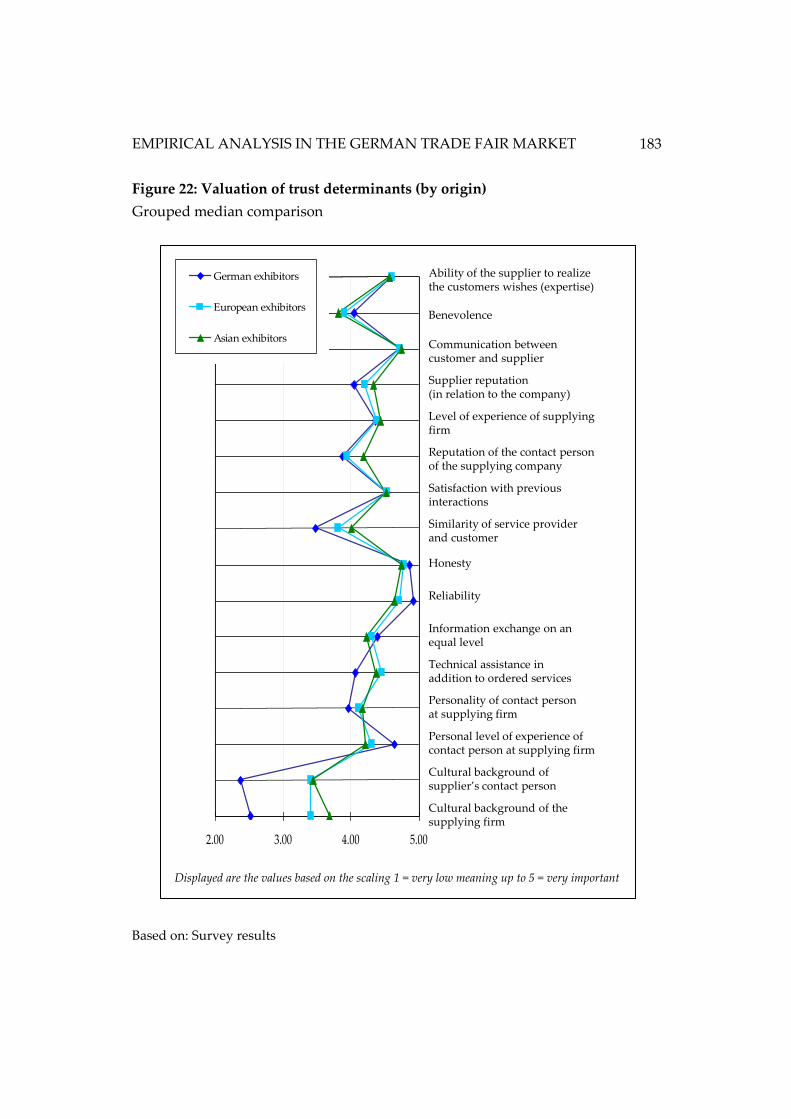
EMPIRICAL ANALYSIS IN THE GERMAN TRADE FAIR MARKET
183
Figure 22: Valuation of trust determinants (by origin)
Grouped median comparison
Based on: Survey results
Displayed are the values based on the scaling 1 = very low meaning up to 5 = very important
2.00 3.00 4.00 5.00
German exhibitors
European exhibitors
Asian exhibitors
Ability of the supplier to realize the customers wishes (expertise)
Benevolence
Communication between customer and supplier
Supplier reputation(in relation to the company)
Level of experience of supplying firm
Reputation of the contact person of the supplying company
Satisfaction with previous interactions
Similarity of service provider and customer
Honesty
Reliability
Information exchange on an equal level
Technical assistance in addition to ordered services
Personality of contact personat supplying firm
Personal level of experience of contact person at supplying firm
Cultural background of supplier’s contact person
Cultural background of the supplying firm
2.00 3.00 4.00 5.00
German exhibitors
European exhibitors
Asian exhibitors
MAIKE U. BUSCH 184
Thus, it is interesting to investigate more deeply the relevance of these
determinants by carrying out a statistical significance test once more.
The Kruskal-Wallis-Test has been introduced in chapter 5.1.4. It can be used when
more than two independent samples are tested on significant differences in their
responses. As previously when dividing the sample by ordered stand size, there
are more than two categories regarding the origin. Plus, the data in focus is
measured on an ordinal scale. Therefore, the non-parametric Kruskal-Wallis-test
is used again for analysing significant differences between the three origin groups
of the sample concerning their ratings of the trust determinants.
According to the test results, significant differences in the rating can be observed
for the following trust determinants104:
- Benevolence (p-value = 0,047)
- Supplier reputation (in relation to the company) (p-value = 0,032)
- Similarity between the service provider and the customer (presence of
common values and interests) (p-value = 0,000)
- Honesty (p-value =0,013)
- Reliability (p-value = 0,001)
- Technical assistance in addition to ordered services (p-value = 0,001)
- Personal level of experience of contact person at supplying firm
(p-value = 0,001)
- Cultural contact of supplier’s contact person (p-value = 0,000)
- Cultural contact of supplying firm (p-value = 0,000)
For these nine variables it needs to be found out which subgroups answered
significantly different to the others. Thus, the Mann-Whitney-U-test is performed
in pairs of two again for the relevant trust determinants105:
At first, a comparison of the results between the German and the European
exhibitors is carried out. The Mann-Whitney-U-test reveals a highly significant
differentiation on six of the previously expressed aspects (p-level smaller than
104 See appendix 24.
105 See appendix 25 for numbers and chapter 5.1.4 for theory on the test.
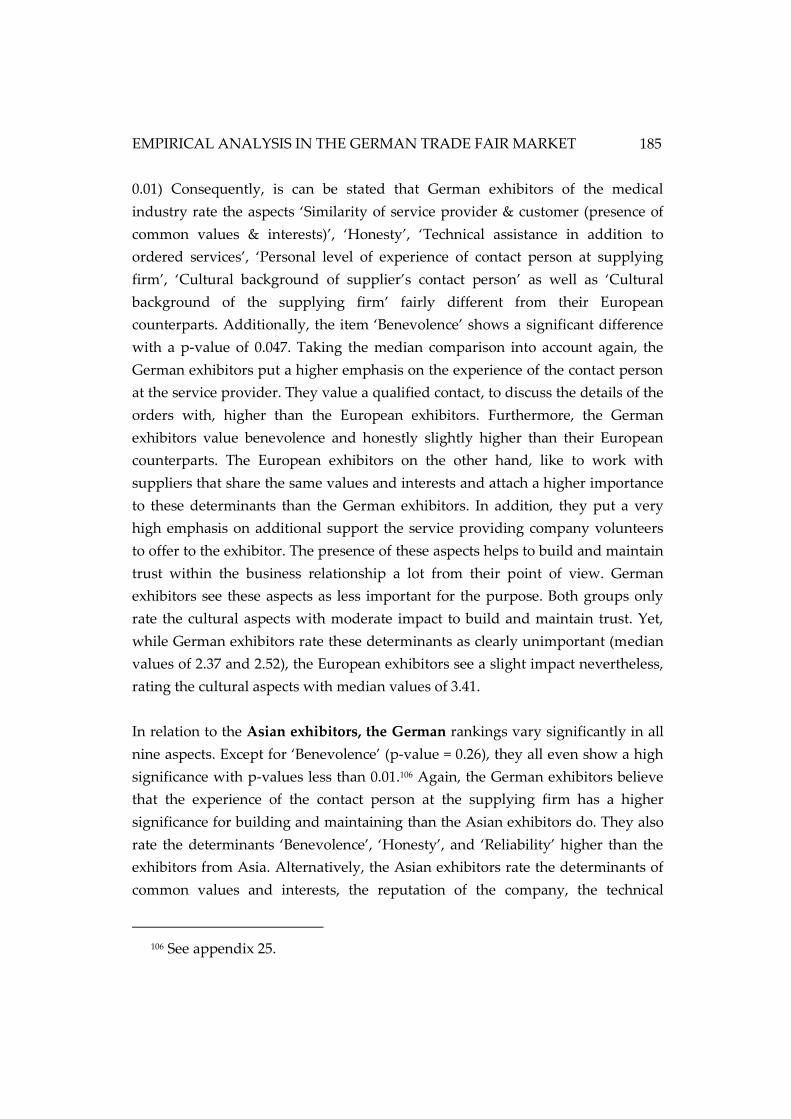
EMPIRICAL ANALYSIS IN THE GERMAN TRADE FAIR MARKET
185
0.01) Consequently, is can be stated that German exhibitors of the medical
industry rate the aspects ‘Similarity of service provider & customer (presence of
common values & interests)’, ‘Honesty’, ‘Technical assistance in addition to
ordered services’, ‘Personal level of experience of contact person at supplying
firm’, ‘Cultural background of supplier’s contact person’ as well as ‘Cultural
background of the supplying firm’ fairly different from their European
counterparts. Additionally, the item ‘Benevolence’ shows a significant difference
with a p-value of 0.047. Taking the median comparison into account again, the
German exhibitors put a higher emphasis on the experience of the contact person
at the service provider. They value a qualified contact, to discuss the details of the
orders with, higher than the European exhibitors. Furthermore, the German
exhibitors value benevolence and honestly slightly higher than their European
counterparts. The European exhibitors on the other hand, like to work with
suppliers that share the same values and interests and attach a higher importance
to these determinants than the German exhibitors. In addition, they put a very
high emphasis on additional support the service providing company volunteers
to offer to the exhibitor. The presence of these aspects helps to build and maintain
trust within the business relationship a lot from their point of view. German
exhibitors see these aspects as less important for the purpose. Both groups only
rate the cultural aspects with moderate impact to build and maintain trust. Yet,
while German exhibitors rate these determinants as clearly unimportant (median
values of 2.37 and 2.52), the European exhibitors see a slight impact nevertheless,
rating the cultural aspects with median values of 3.41.
In relation to the Asian exhibitors, the German rankings vary significantly in all
nine aspects. Except for ‘Benevolence’ (p-value = 0.26), they all even show a high
significance with p-values less than 0.01.106 Again, the German exhibitors believe
that the experience of the contact person at the supplying firm has a higher
significance for building and maintaining than the Asian exhibitors do. They also
rate the determinants ‘Benevolence’, ‘Honesty’, and ‘Reliability’ higher than the
exhibitors from Asia. Alternatively, the Asian exhibitors rate the determinants of
common values and interests, the reputation of the company, the technical
106 See appendix 25.
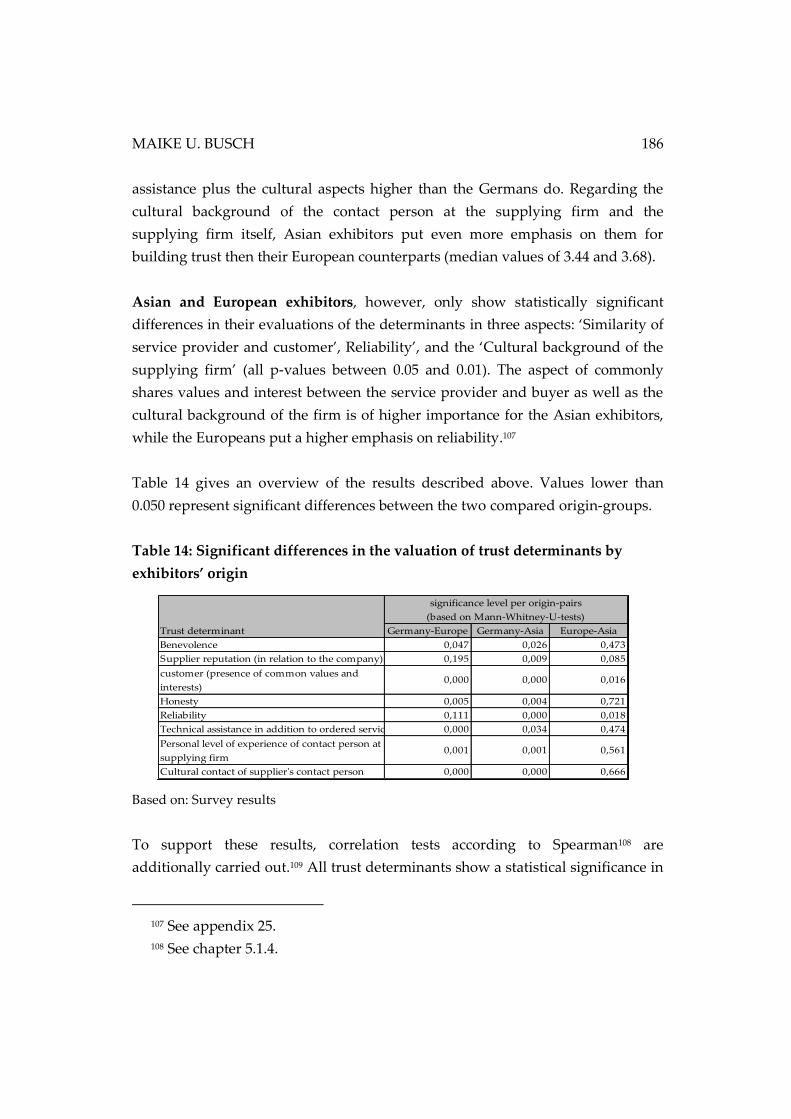
MAIKE U. BUSCH 186
assistance plus the cultural aspects higher than the Germans do. Regarding the
cultural background of the contact person at the supplying firm and the
supplying firm itself, Asian exhibitors put even more emphasis on them for
building trust then their European counterparts (median values of 3.44 and 3.68).
Asian and European exhibitors, however, only show statistically significant
differences in their evaluations of the determinants in three aspects: ‘Similarity of
service provider and customer’, Reliability’, and the ‘Cultural background of the
supplying firm’ (all p-values between 0.05 and 0.01). The aspect of commonly
shares values and interest between the service provider and buyer as well as the
cultural background of the firm is of higher importance for the Asian exhibitors,
while the Europeans put a higher emphasis on reliability.107
Table 14 gives an overview of the results described above. Values lower than
0.050 represent significant differences between the two compared origin-groups.
Table 14: Significant differences in the valuation of trust determinants by
exhibitors’ origin
Based on: Survey results
To support these results, correlation tests according to Spearman108 are
additionally carried out.109 All trust determinants show a statistical significance in
107 See appendix 25.
108 See chapter 5.1.4.
Germany-Europe Germany-Asia Europe-Asia
Benevolence 0,047 0,026 0,473
Supplier reputation (in relation to the company) 0,195 0,009 0,085Similarity between the service provider and the
customer (presence of common values and
interests) 0,000 0,000 0,016
Honesty 0,005 0,004 0,721
Reliability 0,111 0,000 0,018
Technical assistance in addition to ordered services 0,000 0,034 0,474
Personal level of experience of contact person at
supplying firm 0,001 0,001 0,561
Cultural contact of supplier's contact person 0,000 0,000 0,666
significance level per origin-pairs
(based on Mann-Whitney-U-tests)
Trust determinant

EMPIRICAL ANALYSIS IN THE GERMAN TRADE FAIR MARKET
187
the calculation of the correlation. The items more important to the exhibitors
originated closer to the fairground (with a negative correlation coefficient r) are:
‘Benevolence’ (r = -0.102), ‘Honesty’ (r = -0.115), ‘Reliability’ (r = -0.138), ‘Personal
level of experience of contact person at supplying firm’ (r = -0.142). With rather
low correlation coefficient values, the correlation is not very strong in either of
these items. The farther away the exhibitors come from, the more important are
the factors: ‘Supplier reputation (in relation to the company)’ (r = 0.104),
‘Similarity of service provider and customer’ (r = 0.216), ‘Technical assistance in
addition to ordered services’ (r = 0.142), ‘Cultural background of supplier’s
contact person’ (r = 0.328), and ‘Cultural background of the supplying firm’ (r =
0.327). Here the correlation is stronger in several aspects.110
In the following, each of these items is to be examined to show the distributions
compared to the relevant characteristics in detail.
Benevolence is with an overall rating of 59.56% in the top boxes across the whole
sample generally not one of the most important trust building determinants.
However, as can be seen in the figure below, for the German exhibitors it ranks
higher than for the other two groups.
109 Therefore, the nominally scaled variable is coded with numbers according to
their distance to the trade fair market Germany. Germany is coded with 1, Europe
gets 2 and Asia gets number 3.
110 See appendix 26.
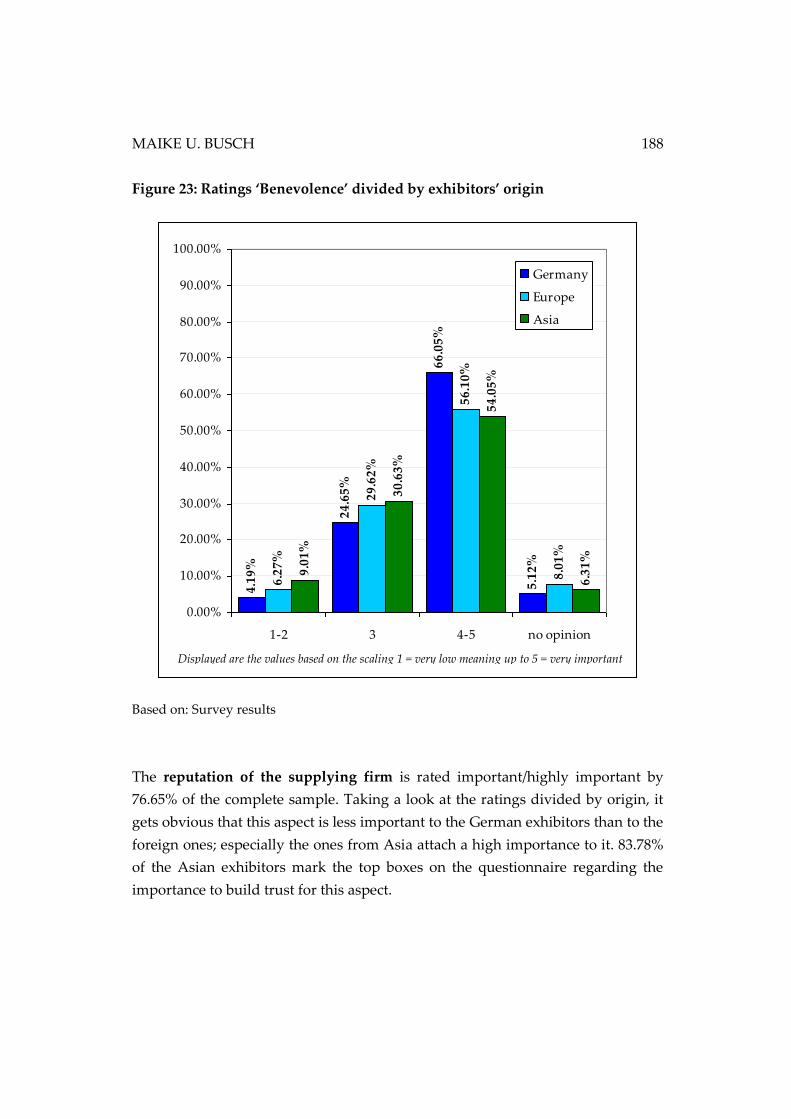
MAIKE U. BUSCH 188
Figure 23: Ratings ‘Benevolence’ divided by exhibitors’ origin
Based on: Survey results
The reputation of the supplying firm is rated important/highly important by
76.65% of the complete sample. Taking a look at the ratings divided by origin, it
gets obvious that this aspect is less important to the German exhibitors than to the
foreign ones; especially the ones from Asia attach a high importance to it. 83.78%
of the Asian exhibitors mark the top boxes on the questionnaire regarding the
importance to build trust for this aspect.
4.1
9%
24
.65
%
66
.05
%
5.1
2%
6.2
7%
29
.62
%
56
.10
%
8.0
1%
9.0
1%
30
.63
%
54
.05
%
6.3
1%
0.00%
10.00%
20.00%
30.00%
40.00%
50.00%
60.00%
70.00%
80.00%
90.00%
100.00%
1-2 3 4-5 no opinion
Germany
Europe
Asia
Displayed are the values based on the scaling 1 = very low meaning up to 5 = very important
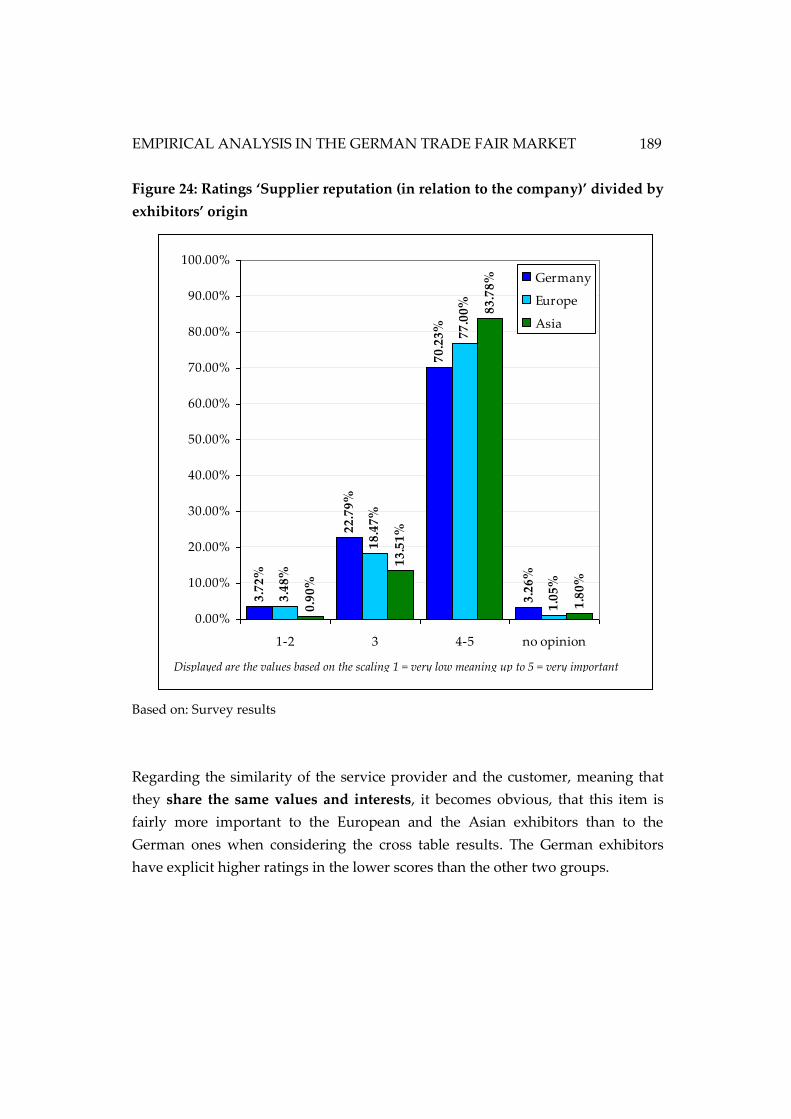
EMPIRICAL ANALYSIS IN THE GERMAN TRADE FAIR MARKET
189
Figure 24: Ratings ‘Supplier reputation (in relation to the company)’ divided by
exhibitors’ origin
Based on: Survey results
Regarding the similarity of the service provider and the customer, meaning that
they share the same values and interests, it becomes obvious, that this item is
fairly more important to the European and the Asian exhibitors than to the
German ones when considering the cross table results. The German exhibitors
have explicit higher ratings in the lower scores than the other two groups.
3.7
2%
22
.79
%
70
.23
%
3.2
6%
3.4
8%
18
.47
%
77
.00
%
1.0
5%
0.9
0%
13
.51
%
83
.78
%
1.8
0%
0.00%
10.00%
20.00%
30.00%
40.00%
50.00%
60.00%
70.00%
80.00%
90.00%
100.00%
1-2 3 4-5 no opinion
Germany
Europe
Asia
Displayed are the values based on the scaling 1 = very low meaning up to 5 = very important
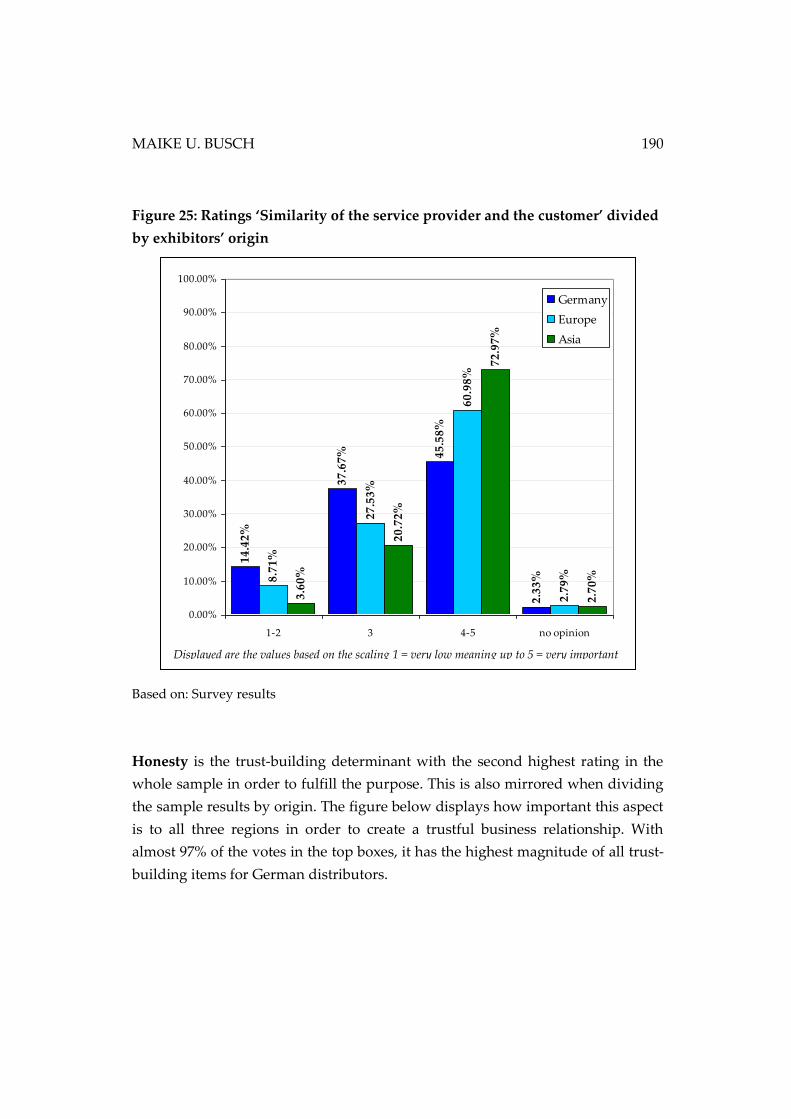
MAIKE U. BUSCH 190
Figure 25: Ratings ‘Similarity of the service provider and the customer’ divided
by exhibitors’ origin
Based on: Survey results
Honesty is the trust-building determinant with the second highest rating in the
whole sample in order to fulfill the purpose. This is also mirrored when dividing
the sample results by origin. The figure below displays how important this aspect
is to all three regions in order to create a trustful business relationship. With
almost 97% of the votes in the top boxes, it has the highest magnitude of all trust-
building items for German distributors.
14
.42
%
37
.67
% 45
.58
%
2.3
3%8.7
1%
27
.53
%
60
.98
%
2.7
9%
3.6
0%
20
.72
%
72
.97
%
2.7
0%
0.00%
10.00%
20.00%
30.00%
40.00%
50.00%
60.00%
70.00%
80.00%
90.00%
100.00%
1-2 3 4-5 no opinion
Germany
Europe
Asia
Displayed are the values based on the scaling 1 = very low meaning up to 5 = very important
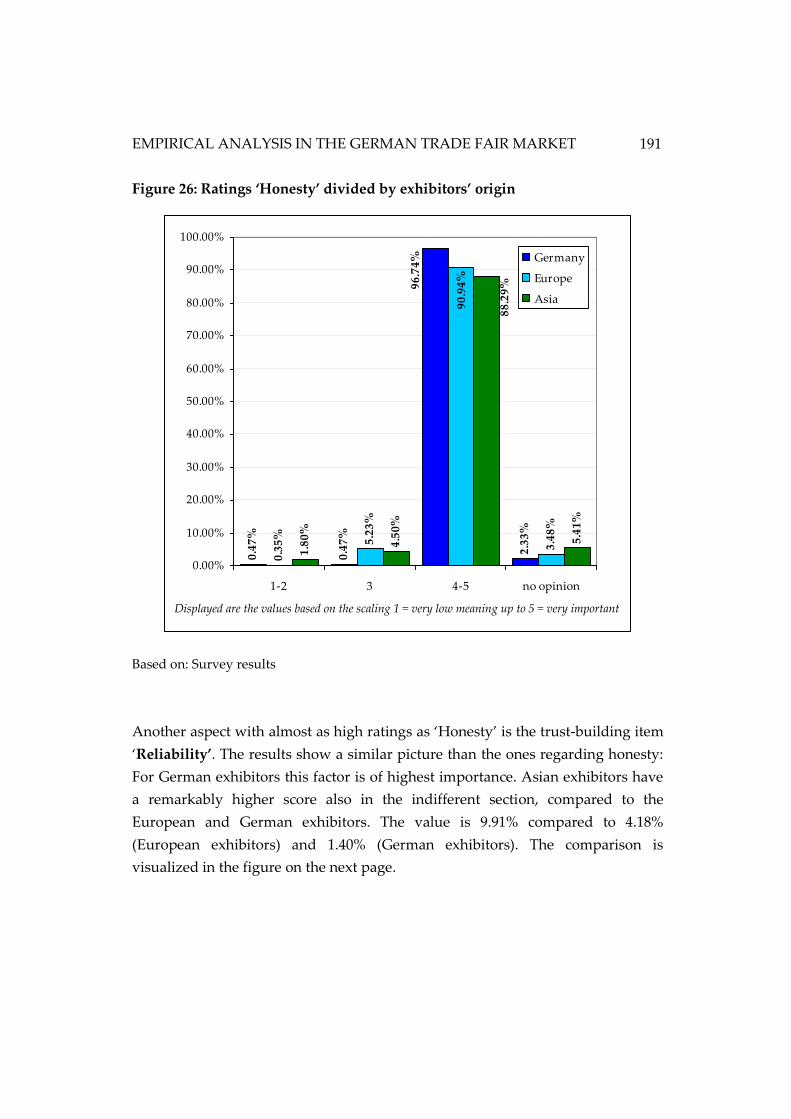
EMPIRICAL ANALYSIS IN THE GERMAN TRADE FAIR MARKET
191
Figure 26: Ratings ‘Honesty’ divided by exhibitors’ origin
Based on: Survey results
Another aspect with almost as high ratings as ‘Honesty’ is the trust-building item
‘Reliability’. The results show a similar picture than the ones regarding honesty:
For German exhibitors this factor is of highest importance. Asian exhibitors have
a remarkably higher score also in the indifferent section, compared to the
European and German exhibitors. The value is 9.91% compared to 4.18%
(European exhibitors) and 1.40% (German exhibitors). The comparison is
visualized in the figure on the next page.
0.4
7%
0.4
7%
2.3
3%
0.3
5% 5.2
3%
3.4
8%
1.8
0%
4.5
0%
5.4
1%
96
.74
%
90
.94
%
88
.29
%
0.00%
10.00%
20.00%
30.00%
40.00%
50.00%
60.00%
70.00%
80.00%
90.00%
100.00%
1-2 3 4-5 no opinion
Germany
Europe
Asia
Displayed are the values based on the scaling 1 = very low meaning up to 5 = very important
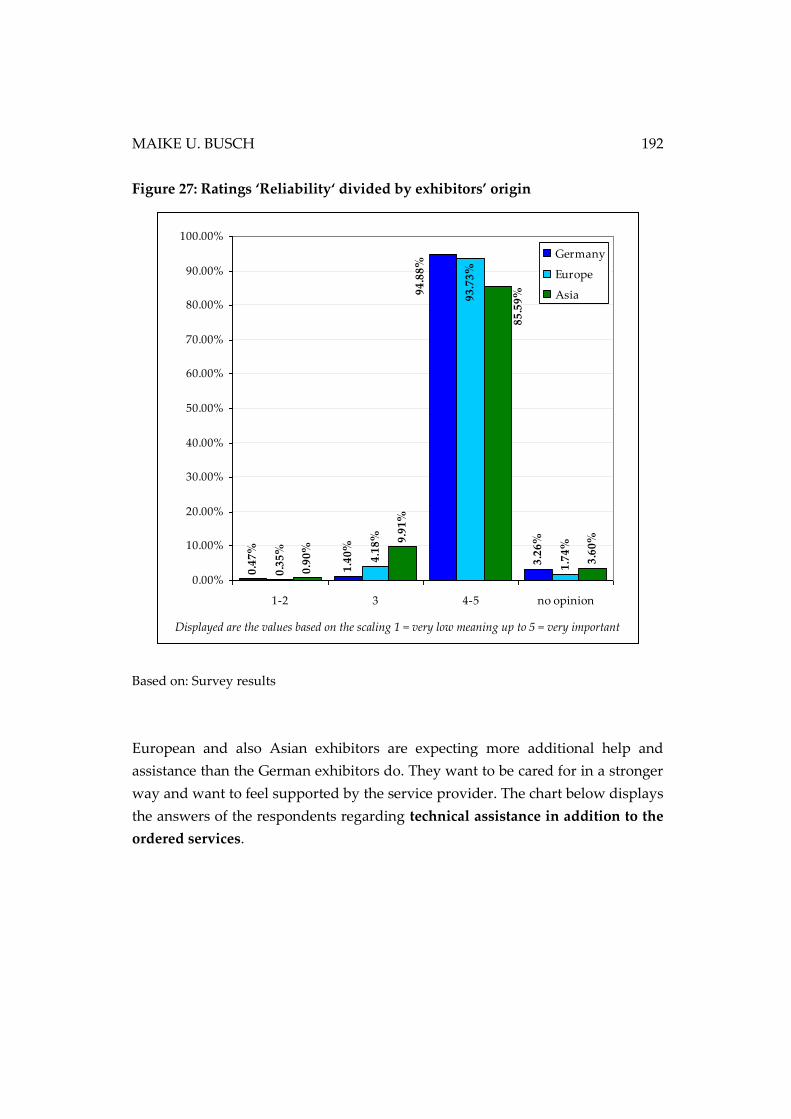
MAIKE U. BUSCH 192
Figure 27: Ratings ‘Reliability‘ divided by exhibitors’ origin
Based on: Survey results
European and also Asian exhibitors are expecting more additional help and
assistance than the German exhibitors do. They want to be cared for in a stronger
way and want to feel supported by the service provider. The chart below displays
the answers of the respondents regarding technical assistance in addition to the
ordered services.
0.4
7%
1.4
0%
3.2
6%
0.3
5%
4.1
8%
1.7
4%
0.9
0%
9.9
1%
3.6
0%
94
.88
%
93
.73
%
85
.59
%
0.00%
10.00%
20.00%
30.00%
40.00%
50.00%
60.00%
70.00%
80.00%
90.00%
100.00%
1-2 3 4-5 no opinion
Germany
Europe
Asia
Displayed are the values based on the scaling 1 = very low meaning up to 5 = very important
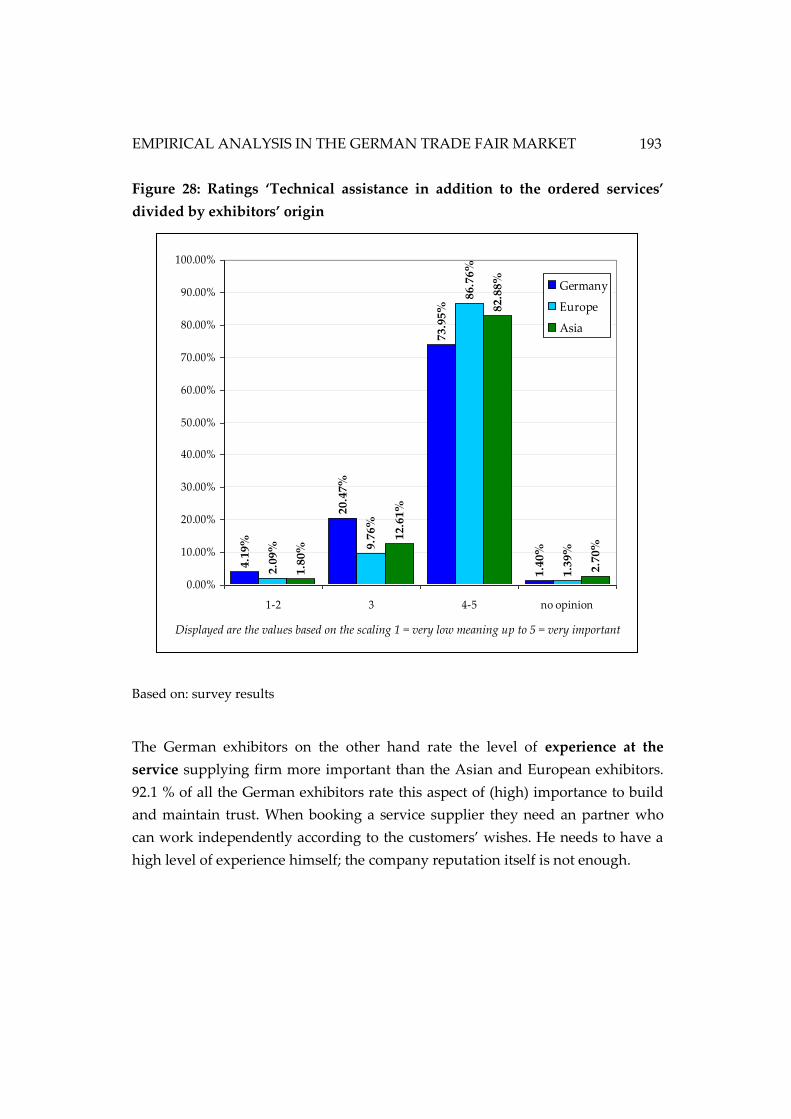
EMPIRICAL ANALYSIS IN THE GERMAN TRADE FAIR MARKET
193
Figure 28: Ratings ‘Technical assistance in addition to the ordered services’
divided by exhibitors’ origin
Based on: survey results
The German exhibitors on the other hand rate the level of experience at the
service supplying firm more important than the Asian and European exhibitors.
92.1 % of all the German exhibitors rate this aspect of (high) importance to build
and maintain trust. When booking a service supplier they need an partner who
can work independently according to the customers’ wishes. He needs to have a
high level of experience himself; the company reputation itself is not enough.
4.1
9%
20.4
7%
73.9
5%
1.4
0%
2.0
9% 9
.76%
86.7
6%
1.3
9%
1.8
0%
12.6
1%
82.8
8%
2.7
0%
0.00%
10.00%
20.00%
30.00%
40.00%
50.00%
60.00%
70.00%
80.00%
90.00%
100.00%
1-2 3 4-5 no opinion
Germany
Europe
Asia
Displayed are the values based on the scaling 1 = very low meaning up to 5 = very important
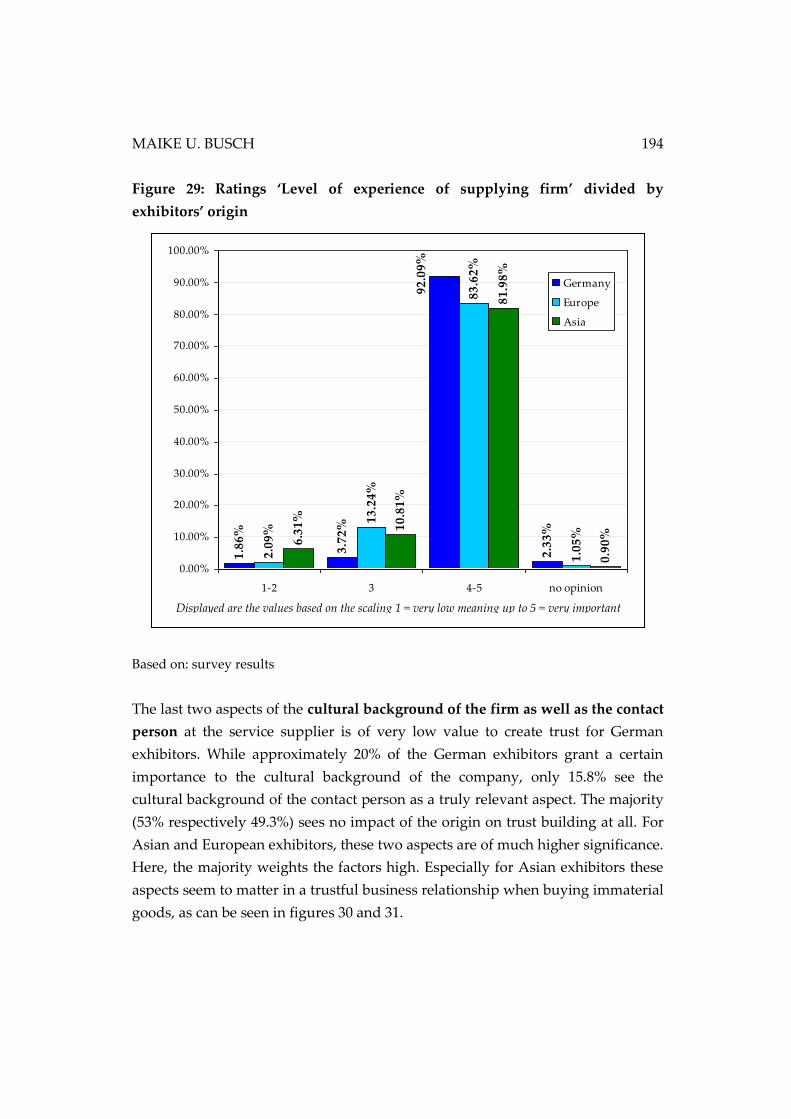
MAIKE U. BUSCH 194
Figure 29: Ratings ‘Level of experience of supplying firm’ divided by
exhibitors’ origin
Based on: survey results
The last two aspects of the cultural background of the firm as well as the contact
person at the service supplier is of very low value to create trust for German
exhibitors. While approximately 20% of the German exhibitors grant a certain
importance to the cultural background of the company, only 15.8% see the
cultural background of the contact person as a truly relevant aspect. The majority
(53% respectively 49.3%) sees no impact of the origin on trust building at all. For
Asian and European exhibitors, these two aspects are of much higher significance.
Here, the majority weights the factors high. Especially for Asian exhibitors these
aspects seem to matter in a trustful business relationship when buying immaterial
goods, as can be seen in figures 30 and 31.
3.7
2%
2.3
3%
2.0
9%
13
.24
%
83
.62
%
1.0
5%
6.3
1%
10
.81
%
81
.98
%
0.9
0%
92
.09
%
1.8
6%
0.00%
10.00%
20.00%
30.00%
40.00%
50.00%
60.00%
70.00%
80.00%
90.00%
100.00%
1-2 3 4-5 no opinion
Germany
Europe
Asia
Displayed are the values based on the scaling 1 = very low meaning up to 5 = very important
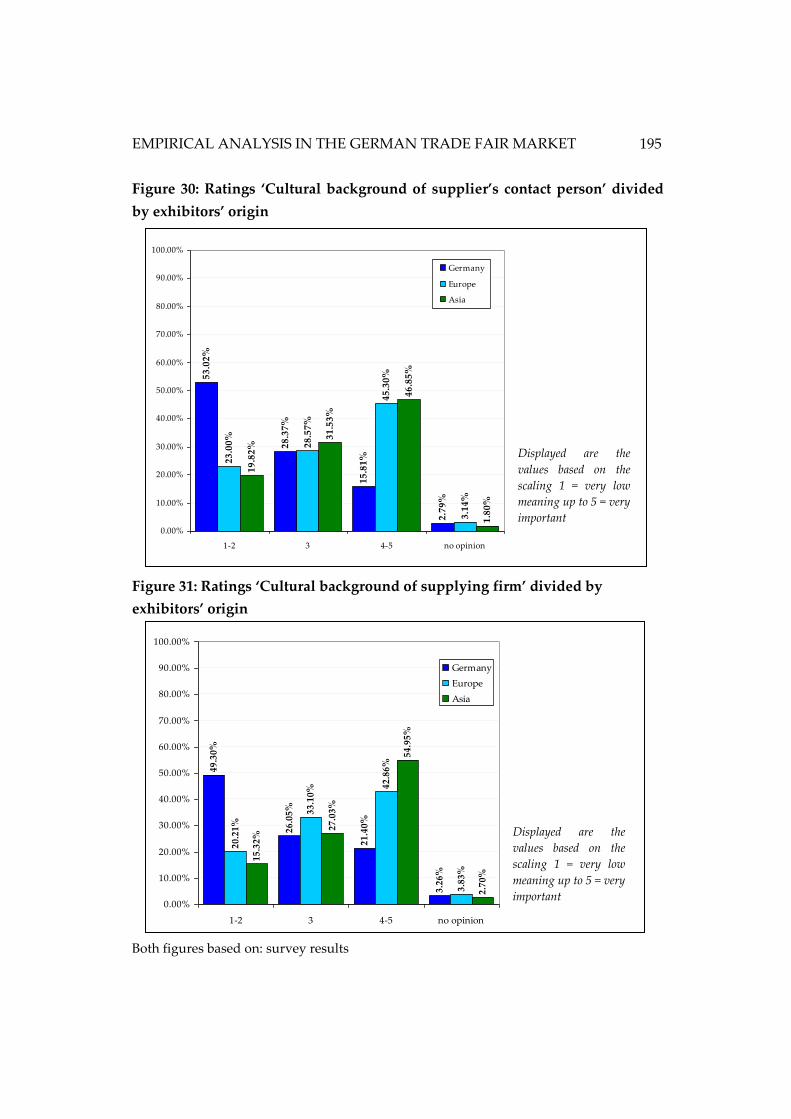
EMPIRICAL ANALYSIS IN THE GERMAN TRADE FAIR MARKET
195
Figure 30: Ratings ‘Cultural background of supplier’s contact person’ divided
by exhibitors’ origin
Figure 31: Ratings ‘Cultural background of supplying firm’ divided by
exhibitors’ origin
Both figures based on: survey results
Displayed are the
values based on the
scaling 1 = very low
meaning up to 5 = very
important
53
.02
%
28
.37
%
15
.81
%
2.7
9%
23
.00
%
28
.57
%
45
.30
%
3.1
4%
19
.82
%
31
.53
%
46
.85
%
1.8
0%
0.00%
10.00%
20.00%
30.00%
40.00%
50.00%
60.00%
70.00%
80.00%
90.00%
100.00%
1-2 3 4-5 no opinion
Germany
Europe
Asia
49
.30
%
26
.05
%
21
.40
%
3.2
6%
20
.21
%
33
.10
% 42
.86
%
3.8
3%
15
.32
%
27
.03
%
54
.95
%
2.7
0%
0.00%
10.00%
20.00%
30.00%
40.00%
50.00%
60.00%
70.00%
80.00%
90.00%
100.00%
1-2 3 4-5 no opinion
Germany
Europe
Asia
Displayed are the
values based on the
scaling 1 = very low
meaning up to 5 = very
important
MAIKE U. BUSCH 196
Therefore, as seen in the analysis and the results above, it can be presumed that
the origin of the exhibitor has a significant impact on how an exhibitor rates the
trust building determinants for a business relationship with a service provider.
Hypothesis 2c (H12c) cannot be rejected.
Summing up the findings on the analysis of the survey data regarding hypothesis
2, the aspects generally rated most important to build and maintain trust are
repeated again first. So for building and maintaining a trust based service
business relationship, the complete sample rates the aspect ‘Communication
between customer and supplier’ as most important. 94.20% of all respondents
marked it with a score of 4 or 5. Second in line are the factors ‘Honesty’ and
‘Reliability’ both with a share of 92.79% of all votes in the top scores 4 and 5. ‘The
supplier’s ability to fulfill the customers’ wishes, meaning his expertise, scored
with 91.54% of all exhibitors marking a score of 4 or 5 in the questionnaire. This is
followed by the trust building factor ‘Satisfaction with previous interactions’
(90.60% scores of 4 or 5 within the complete sample).
The hypothesis 2 asked if there are differences in the ratings of the trust
determinants among the sample according to the defined characteristics.
As was investigated, the exhibitor status has no influence on the valuation of the
trust building factors. No significant differences could be detected between the
two sub-samples consisting of either new or existing exhibitors.
Taking in focus the division of the sample by the stand size, only three aspects
revealed significant differentiation between the sub-samples: Exhibitors with
smaller stands seem to put a little more emphasis on previous working
experiences with the supplier than the bigger ones. However, as the correlation
test showed no significant results and as this aspect was generally rated very
highly by the whole sample, it can be regarded essential by the complete sample
and target group. Additionally, significant differences could be observed
concerning the cultural background either of the supplier’s firm itself or of the
contact person of the supplier’s. As the correlation test revealed, the importance
of this factor shrinks once the ordered stand sizes get bigger. Nevertheless, it
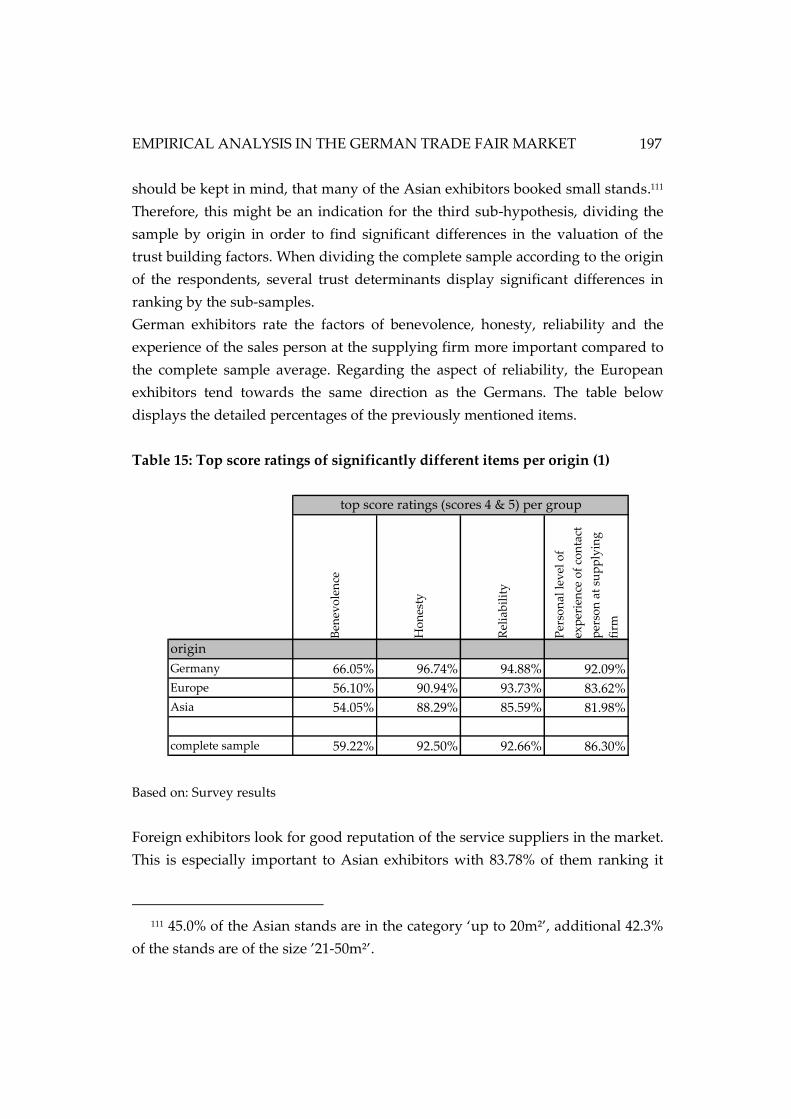
EMPIRICAL ANALYSIS IN THE GERMAN TRADE FAIR MARKET
197
should be kept in mind, that many of the Asian exhibitors booked small stands.111
Therefore, this might be an indication for the third sub-hypothesis, dividing the
sample by origin in order to find significant differences in the valuation of the
trust building factors. When dividing the complete sample according to the origin
of the respondents, several trust determinants display significant differences in
ranking by the sub-samples.
German exhibitors rate the factors of benevolence, honesty, reliability and the
experience of the sales person at the supplying firm more important compared to
the complete sample average. Regarding the aspect of reliability, the European
exhibitors tend towards the same direction as the Germans. The table below
displays the detailed percentages of the previously mentioned items.
Table 15: Top score ratings of significantly different items per origin (1)
Based on: Survey results
Foreign exhibitors look for good reputation of the service suppliers in the market.
This is especially important to Asian exhibitors with 83.78% of them ranking it
111 45.0% of the Asian stands are in the category ‘up to 20m²’, additional 42.3%
of the stands are of the size ’21-50m²’.
Ben
evo
len
ce
Ho
nes
ty
Rel
iab
ilit
y
Per
son
al l
evel
of
exp
erie
nce
of
con
tact
per
son
at
sup
ply
ing
firm
origin
Germany 66.05% 96.74% 94.88% 92.09%
Europe 56.10% 90.94% 93.73% 83.62%
Asia 54.05% 88.29% 85.59% 81.98%
complete sample 59.22% 92.50% 92.66% 86.30%
top score ratings (scores 4 & 5) per group
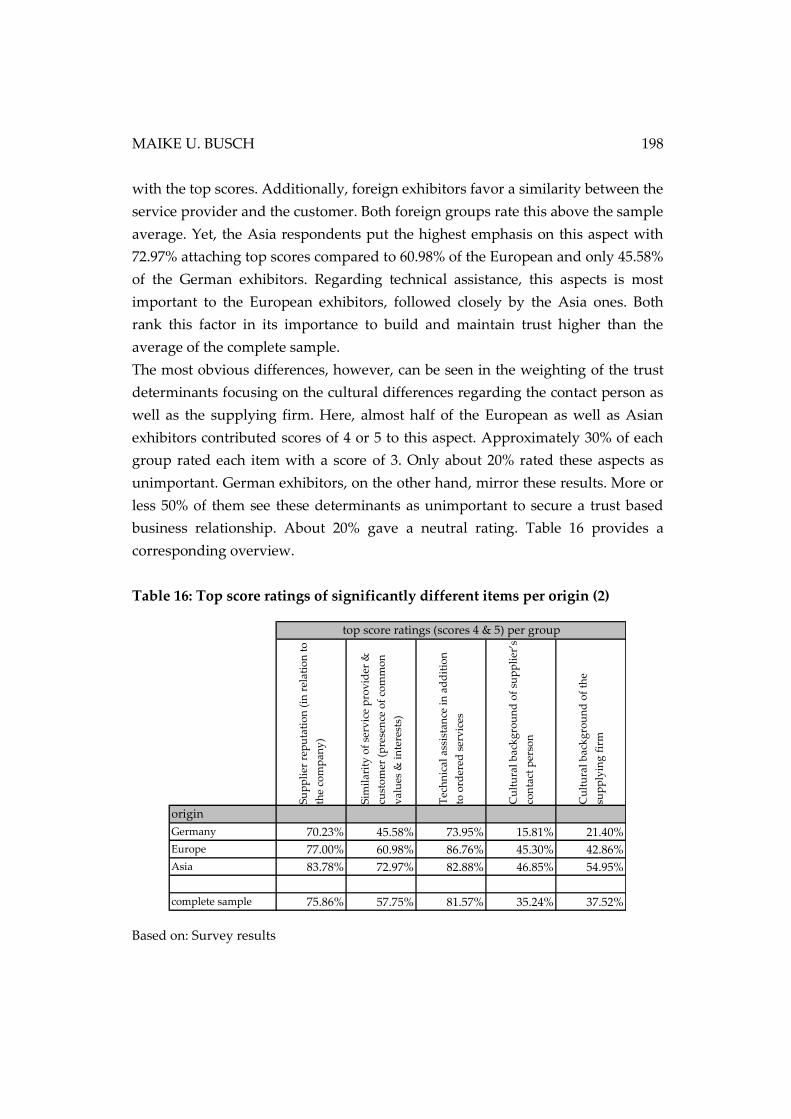
MAIKE U. BUSCH 198
with the top scores. Additionally, foreign exhibitors favor a similarity between the
service provider and the customer. Both foreign groups rate this above the sample
average. Yet, the Asia respondents put the highest emphasis on this aspect with
72.97% attaching top scores compared to 60.98% of the European and only 45.58%
of the German exhibitors. Regarding technical assistance, this aspects is most
important to the European exhibitors, followed closely by the Asia ones. Both
rank this factor in its importance to build and maintain trust higher than the
average of the complete sample.
The most obvious differences, however, can be seen in the weighting of the trust
determinants focusing on the cultural differences regarding the contact person as
well as the supplying firm. Here, almost half of the European as well as Asian
exhibitors contributed scores of 4 or 5 to this aspect. Approximately 30% of each
group rated each item with a score of 3. Only about 20% rated these aspects as
unimportant. German exhibitors, on the other hand, mirror these results. More or
less 50% of them see these determinants as unimportant to secure a trust based
business relationship. About 20% gave a neutral rating. Table 16 provides a
corresponding overview.
Table 16: Top score ratings of significantly different items per origin (2)
Based on: Survey results
Su
pp
lier
rep
uta
tio
n (
in r
elat
ion
to
the
com
pan
y)
Sim
ilar
ity
of
serv
ice
pro
vid
er &
cust
om
er (
pre
sen
ce o
f co
mm
on
val
ues
& i
nte
rest
s)
Tec
hn
ical
ass
ista
nce
in
ad
dit
ion
to o
rder
ed s
erv
ices
Cu
ltu
ral
bac
kg
rou
nd
of
sup
pli
er’s
con
tact
per
son
Cu
ltu
ral
bac
kg
rou
nd
of
the
sup
ply
ing
fir
m
origin
Germany 70.23% 45.58% 73.95% 15.81% 21.40%
Europe 77.00% 60.98% 86.76% 45.30% 42.86%
Asia 83.78% 72.97% 82.88% 46.85% 54.95%
complete sample 75.86% 57.75% 81.57% 35.24% 37.52%
top score ratings (scores 4 & 5) per group
EMPIRICAL ANALYSIS IN THE GERMAN TRADE FAIR MARKET
199
So, hypothesis 2 (H12) should not be rejected. Some characteristics by which the
target group can be divided, lead to different valuation of several determinants to
build and maintain trust in a business relationship between a service supplier and
his potential customer. These differences should be considered when trying to
establish a trust based relationship.
5.2.3.3 Testing of hypothesis 3
The analysis of the communication aspects in general shows a clear ranking of the
importance of the communication factors, but as found out in chapter 5.2.2, they
cannot be linked to any specific trust determinants.
However, even if the communication tools cannot be linked to specific trust
determinants, there might be variations regarding the optimal addressing of the
exhibitors with regard to their characteristics which are of interest for the trade
fair organizers and could be retrieved out of CRM systems for marketing
purposes. Thus, the analysis follows the division into the subgroups as done in
the previous analysis. Hypothesis 3 and its sub-hypotheses are:
H03: Exhibitors in the German trade fair market do not show significant
differences in their valuation of methods to establish a trust building
communication a service provider should direct towards his customers
according to their characteristics.
H13: Exhibitors in the German trade fair market show significant differences
in their valuation of methods to establish a trust building
communication a service provider should direct towards his customers
according to their characteristics.
H13a: Exhibitors in the German trade fair market show significant differences
in their valuation of methods to establish a trust building
communication a service provider should direct towards his customers
according to their exhibitor status.
MAIKE U. BUSCH 200
H13b: Exhibitors in the German trade fair market show significant differences
in their valuation of methods to establish a trust building
communication a service provider should direct towards his customers
according to their booked stand size.
H13c: Exhibitors in the German trade fair market show significant differences
in their valuation of methods to establish a trust building
communication a service provider should direct towards his customers
according to their origin.
The hypothesis is analyzed by the evaluation of the answers to question 6 of the
questionnaire. It reads as follows:
“When getting in touch with a potential service supplier, which aspects – besides prices
and discounts - are most important for you in order to consider the supplier for further
business?”
The respondents were asked to rate a number of 13 aspects according to the
importance they attach to each feature. As for the examination of hypotheses 2,
the median comparison is carried out as first to get a first impression on different
rating among the sub sample groups. For determining statistically significant
differences among the opinions per subgroup, significance test according to the
present data basis are carried out once more. For the significance tests the two
lower parameters (‘very low meaning’, value 1, and ‘low meaning’, value 2) are
combined. The same applies to the two scores ‘very important’ (value 5) and
‘important’ (value 4). The middle score as well as the ‘no opinion’-option stay
unpaired. As a result three categories for calculation develop from ‘unimportant’
to ‘indifferent’ to ‘important’. The answers ‘no opinion’ will be neglected per
item, as the answers have no explanatory value. Possible significant divergence
between the subgroups can then be calculated by using the statistical tests,
explained in chapter 5.1.4. In combination with the median results, deductions
about the target groups can be expressed.
EMPIRICAL ANALYSIS IN THE GERMAN TRADE FAIR MARKET
201
Exhibitor status
To begin with, the exhibitor status is in focus.
H13a: Exhibitors in the German trade fair market show significant differences
in their valuation of methods to establish a trust building
communication a service provider should direct towards his customers
according to their exhibitor status.
In a first step, the medians of the ratings regarding the trust-building and trust-
maintaining communication aspects are compared. The results show few
differences between the two subgroups as can be seen in figure 32.112 Only the
aspect of the experienced sales personnel seems to differ between the two groups.
112 Detailed median values can be viewed in appendix 27.
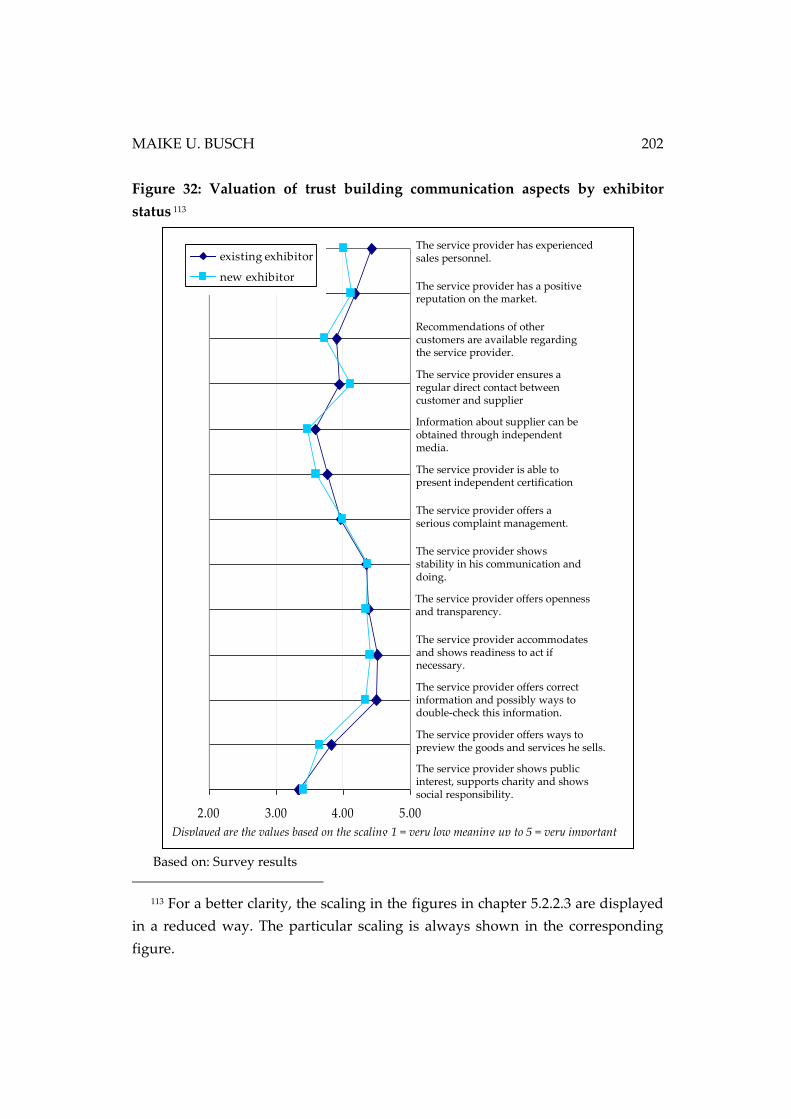
MAIKE U. BUSCH 202
Figure 32: Valuation of trust building communication aspects by exhibitor
status 113
113 For a better clarity, the scaling in the figures in chapter 5.2.2.3 are displayed
in a reduced way. The particular scaling is always shown in the corresponding
figure.
Based on: Survey results
Displayed are the values based on the scaling 1 = very low meaning up to 5 = very important
The service provider has experienced sales
personnel.
The service provider has a positive reputation on
the market.
Recommendations of other customers are available
regarding the service provider.
The service provider ensures a regular direct
contact between customer and supplier
Information about supplier can be obtained
through independent media.
The service provider is able to present independent
certification
The service provider offers a serious complaint
management.
The service provider shows stability in his
communication and doing.
The service provider offers openness and
transparency.
The service provider accommodates and shows
readiness to act if necessary.
The service provider offers correct information
and possibly ways to double-check this
information.
The service provider offers ways to preview the
goods and services he sells.
The service provider shows public interest,
supports charity and shows social responsibility.
2.00 3.00 4.00 5.00
existing exhibitor
new exhibitor
The service provider has experienced sales personnel.
The service provider has a positive reputation on the market.
Recommendations of other customers are available regarding the service provider.
The service provider ensures a regular direct contact between customer and supplier
Information about supplier can be obtained through independent media.
The service provider is able to present independent certification
The service provider offers a serious complaint management.
The service provider shows stability in his communication and doing.
The service provider offers openness and transparency.
The service provider accommodates and shows readiness to act if necessary.
The service provider offers correct information and possibly ways to double-check this information.
The service provider offers ways to preview the goods and services he sells.
The service provider shows public interest, supports charity and shows social responsibility.
The service provider has experienced sales
personnel.
The service provider has a positive reputation on
the market.
Recommendations of other customers are available
regarding the service provider.
The service provider ensures a regular direct
contact between customer and supplier
Information about supplier can be obtained
through independent media.
The service provider is able to present independent
certification
The service provider offers a serious complaint
management.
The service provider shows stability in his
communication and doing.
The service provider offers openness and
transparency.
The service provider accommodates and shows
readiness to act if necessary.
The service provider offers correct information
and possibly ways to double-check this
information.
The service provider offers ways to preview the
goods and services he sells.
The service provider shows public interest,
supports charity and shows social responsibility.
2.00 3.00 4.00 5.00
existing exhibitor
new exhibitor
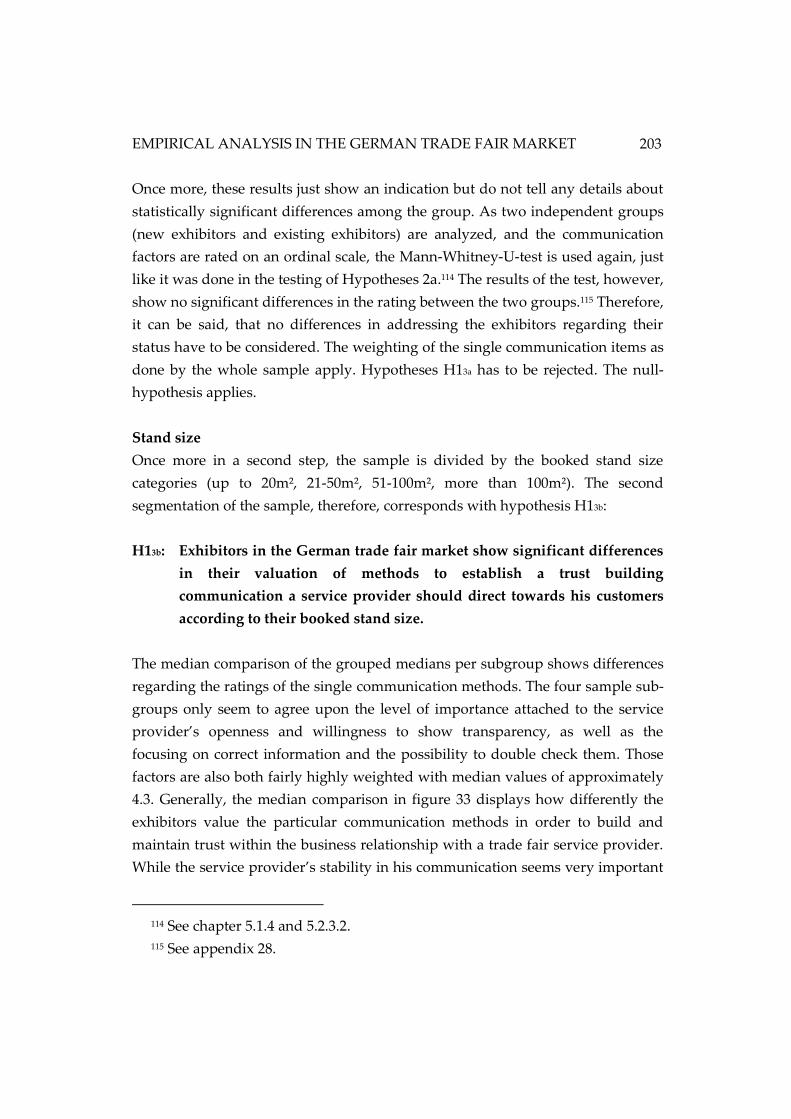
EMPIRICAL ANALYSIS IN THE GERMAN TRADE FAIR MARKET
203
Once more, these results just show an indication but do not tell any details about
statistically significant differences among the group. As two independent groups
(new exhibitors and existing exhibitors) are analyzed, and the communication
factors are rated on an ordinal scale, the Mann-Whitney-U-test is used again, just
like it was done in the testing of Hypotheses 2a.114 The results of the test, however,
show no significant differences in the rating between the two groups.115 Therefore,
it can be said, that no differences in addressing the exhibitors regarding their
status have to be considered. The weighting of the single communication items as
done by the whole sample apply. Hypotheses H13a has to be rejected. The null-
hypothesis applies.
Stand size
Once more in a second step, the sample is divided by the booked stand size
categories (up to 20m², 21-50m², 51-100m², more than 100m²). The second
segmentation of the sample, therefore, corresponds with hypothesis H13b:
H13b: Exhibitors in the German trade fair market show significant differences
in their valuation of methods to establish a trust building
communication a service provider should direct towards his customers
according to their booked stand size.
The median comparison of the grouped medians per subgroup shows differences
regarding the ratings of the single communication methods. The four sample sub-
groups only seem to agree upon the level of importance attached to the service
provider’s openness and willingness to show transparency, as well as the
focusing on correct information and the possibility to double check them. Those
factors are also both fairly highly weighted with median values of approximately
4.3. Generally, the median comparison in figure 33 displays how differently the
exhibitors value the particular communication methods in order to build and
maintain trust within the business relationship with a trade fair service provider.
While the service provider’s stability in his communication seems very important
114 See chapter 5.1.4 and 5.2.3.2.
115 See appendix 28.

MAIKE U. BUSCH 204
(median value = approx. 4.3), his commitment to support public interests or
charity is not fully essential when building trust (median value = less than 3.5), for
example. Detailed median values on this comparison can be found in appendix
29.
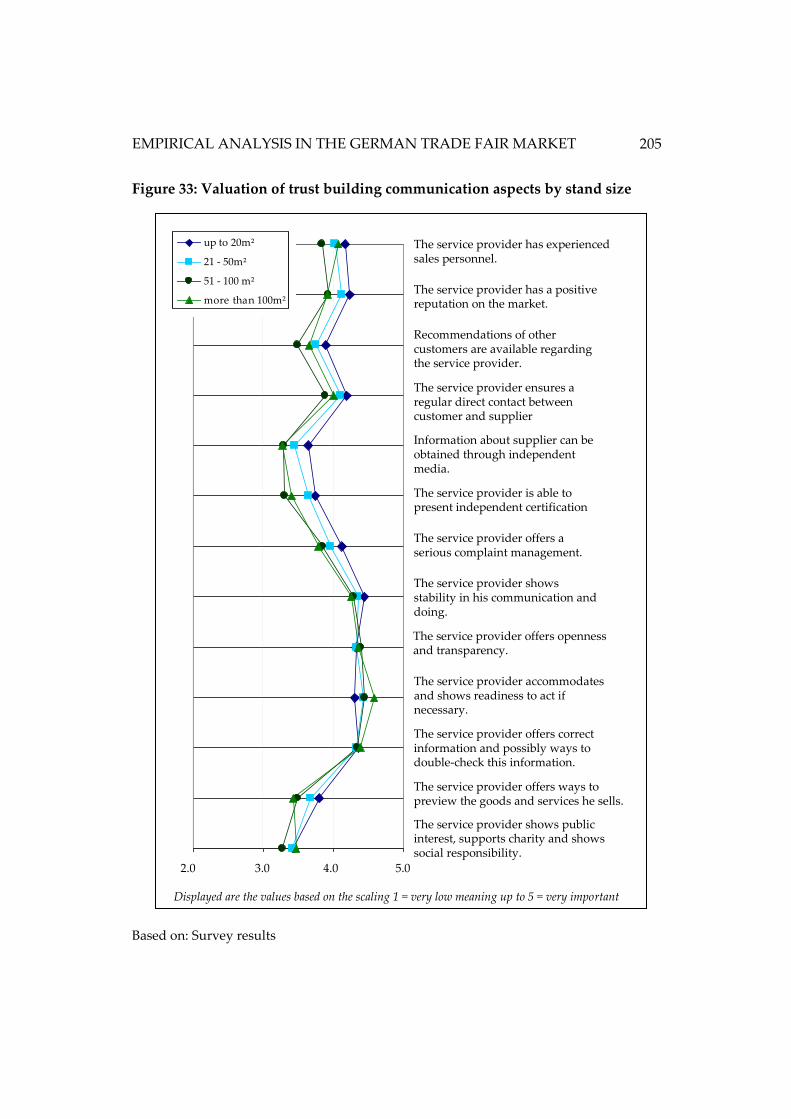
EMPIRICAL ANALYSIS IN THE GERMAN TRADE FAIR MARKET
205
Figure 33: Valuation of trust building communication aspects by stand size
Based on: Survey results
Displayed are the values based on the scaling 1 = very low meaning up to 5 = very important
The service provider has experienced sales personnel.
The service provider has a positive reputation on the market.
Recommendations of other customers are available regarding
the service provider.
The service provider ensures a regular direct contact between
customer and supplier
Information about supplier can be obtained through independent
media.
The service provider is able to present independent certification
The service provider offers a serious complaint management.
The service provider shows stability in his communication and
doing.
The service provider offers openness and transparency.
The service provider accommodates and shows readiness to act
if necessary.
The service provider offers correct information and possibly
ways to double-check this information.
The service provider offers ways to preview the goods and
services he sells.
The service provider shows public interest, supports charity and
shows social responsibility.
2.00 3.00 4.00 5.00
up to 20m²
21 - 50m²
51 - 100 m²
more than 100m²The service provider has experienced sales personnel.
The service provider has a positive reputation on the market.
Recommendations of other customers are available regarding the service provider.
The service provider ensures a regular direct contact between customer and supplier
Information about supplier can be obtained through independent media.
The service provider is able to present independent certification
The service provider offers a serious complaint management.
The service provider shows stability in his communication and doing.
The service provider offers openness and transparency.
The service provider accommodates and shows readiness to act if necessary.
The service provider offers correct information and possibly ways to double-check this information.
The service provider offers ways to preview the goods and services he sells.
The service provider shows public interest, supports charity and shows social responsibility.
The service provider has experienced sales personnel.
The service provider has a positive reputation on the market.
Recommendations of other customers are available regarding
the service provider.
The service provider ensures a regular direct contact between
customer and supplier
Information about supplier can be obtained through independent
media.
The service provider is able to present independent certification
The service provider offers a serious complaint management.
The service provider shows stability in his communication and
doing.
The service provider offers openness and transparency.
The service provider accommodates and shows readiness to act
if necessary.
The service provider offers correct information and possibly
ways to double-check this information.
The service provider offers ways to preview the goods and
services he sells.
The service provider shows public interest, supports charity and
shows social responsibility.
2.00 3.00 4.00 5.00
up to 20m²
21 - 50m²
51 - 100 m²
more than 100m²
2.0 3.0 4.0 5.0
MAIKE U. BUSCH 206
Again, the question is, are these variations between the ratings of the sample sub-
groups of statistical significance? This leads to the corresponding tests.
Four independent samples are analyzed. Ratings are given on an ordinal scale.
Therefore, the Kruskal-Wallis-test is used to discover significant differences
among the subgroups of the sample.116 Based on the outcomes of the Kruskal-
Wallis-test, five aspect show significant variations in the ratings:
- Recommendations of other customers are available regarding the service
provider (p-value = 0.017)
- Information about supplier can be obtained through independent media
(p-value = 0.005)
- The service provider is able to present independent certification (such as
quality certifications) (p-value = 0.002)
- The service provider offers a serious complaint management (p-value = 0.020)
- The service provider shows stability in his communication and doing
(p-value = 0.036).117
Going deeper into the details, the Mann-Whitney-U-test is performed as post-hoc-
test to compare the results of two groups against each other for discovering the
significant differences between the single subgroups.118 The performance of this
test per pair reveals the subsequent findings:
The opinions of the exhibitors with the smallest stands (up to 20m²) vary most
significantly from all the other exhibitors. Table 17 shows the significant p-values
based on pair-comparison carried out by using the Mann-Whitney-U-test. The left
column shows the two groups which are compared. Only the significant p-values
are shown in the table.
116 See chapter 5.1.4. 117 See appendix 30.
118 See chapter 5.1.4.
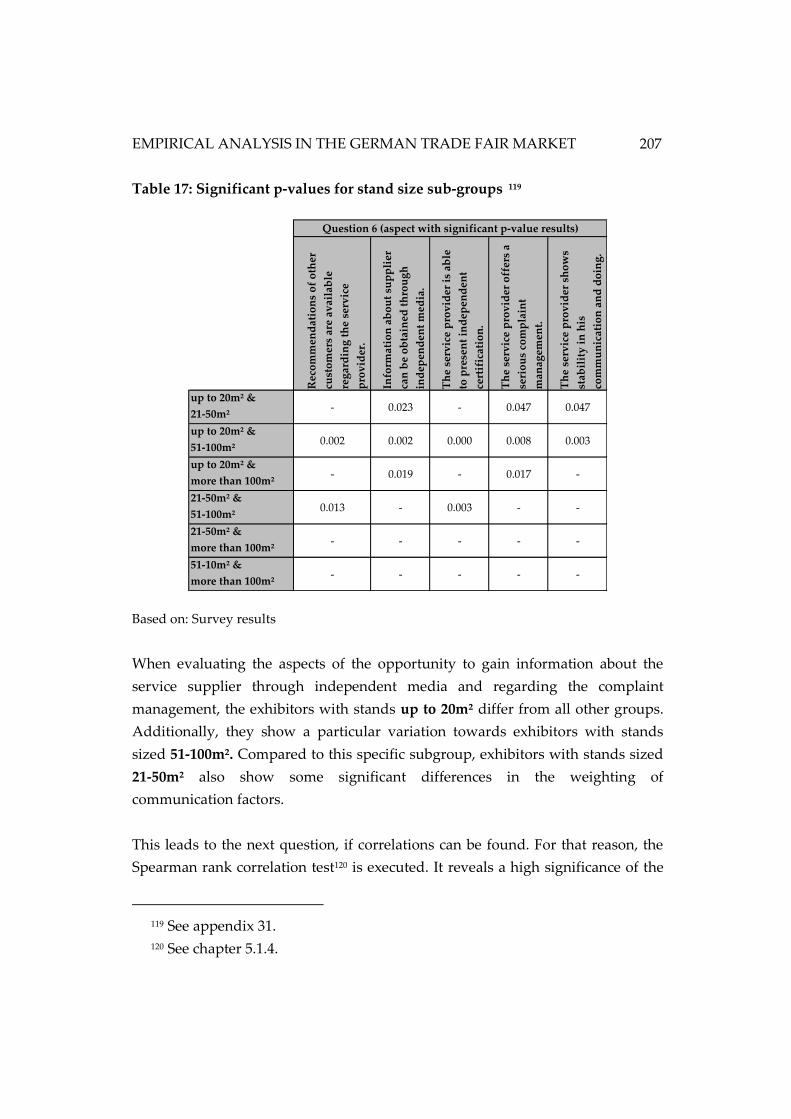
EMPIRICAL ANALYSIS IN THE GERMAN TRADE FAIR MARKET
207
Table 17: Significant p-values for stand size sub-groups 119
Based on: Survey results
When evaluating the aspects of the opportunity to gain information about the
service supplier through independent media and regarding the complaint
management, the exhibitors with stands up to 20m² differ from all other groups.
Additionally, they show a particular variation towards exhibitors with stands
sized 51-100m². Compared to this specific subgroup, exhibitors with stands sized
21-50m² also show some significant differences in the weighting of
communication factors.
This leads to the next question, if correlations can be found. For that reason, the
Spearman rank correlation test120 is executed. It reveals a high significance of the
119 See appendix 31.
120 See chapter 5.1.4.
Rec
om
men
dat
ion
s o
f o
ther
cust
om
ers
are
avai
lab
le
reg
ard
ing
th
e se
rvic
e
pro
vid
er.
Info
rmat
ion
ab
ou
t su
pp
lier
can
be
ob
tain
ed t
hro
ug
h
ind
epen
den
t m
edia
.
Th
e se
rvic
e p
rov
ider
is
able
to p
rese
nt
ind
epen
den
t
cert
ific
atio
n.
Th
e se
rvic
e p
rov
ider
off
ers
a
seri
ou
s co
mp
lain
t
man
agem
ent.
Th
e se
rvic
e p
rov
ider
sh
ow
s
stab
ilit
y i
n h
is
com
mu
nic
atio
n a
nd
do
ing
.
up to 20m² &
21-50m²- 0.023 - 0.047 0.047
up to 20m² &
51-100m²0.002 0.002 0.000 0.008 0.003
up to 20m² &
more than 100m²- 0.019 - 0.017 -
21-50m² &
51-100m²0.013 - 0.003 - -
21-50m² &
more than 100m²- - - - -
51-10m² &
more than 100m²- - - - -
Question 6 (aspect with significant p-value results)
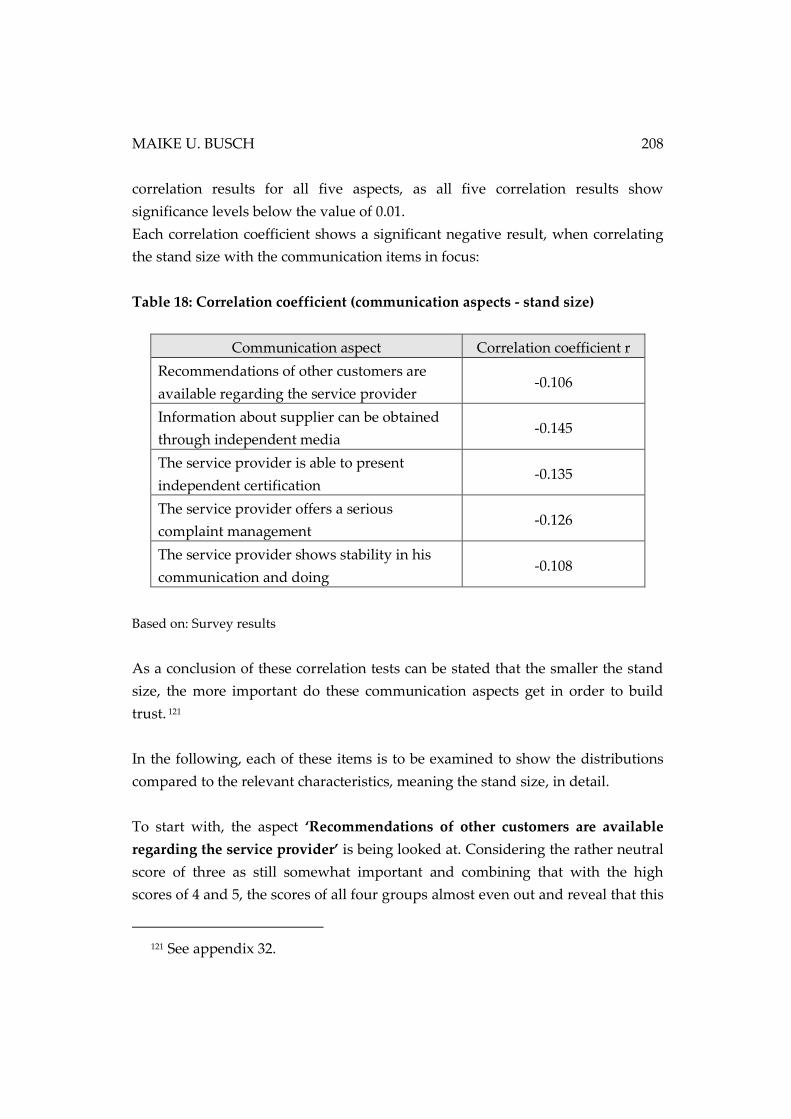
MAIKE U. BUSCH 208
correlation results for all five aspects, as all five correlation results show
significance levels below the value of 0.01.
Each correlation coefficient shows a significant negative result, when correlating
the stand size with the communication items in focus:
Table 18: Correlation coefficient (communication aspects - stand size)
Communication aspect Correlation coefficient r
Recommendations of other customers are
available regarding the service provider -0.106
Information about supplier can be obtained
through independent media -0.145
The service provider is able to present
independent certification -0.135
The service provider offers a serious
complaint management -0.126
The service provider shows stability in his
communication and doing -0.108
Based on: Survey results
As a conclusion of these correlation tests can be stated that the smaller the stand
size, the more important do these communication aspects get in order to build
trust. 121
In the following, each of these items is to be examined to show the distributions
compared to the relevant characteristics, meaning the stand size, in detail.
To start with, the aspect ‘Recommendations of other customers are available
regarding the service provider’ is being looked at. Considering the rather neutral
score of three as still somewhat important and combining that with the high
scores of 4 and 5, the scores of all four groups almost even out and reveal that this
121 See appendix 32.
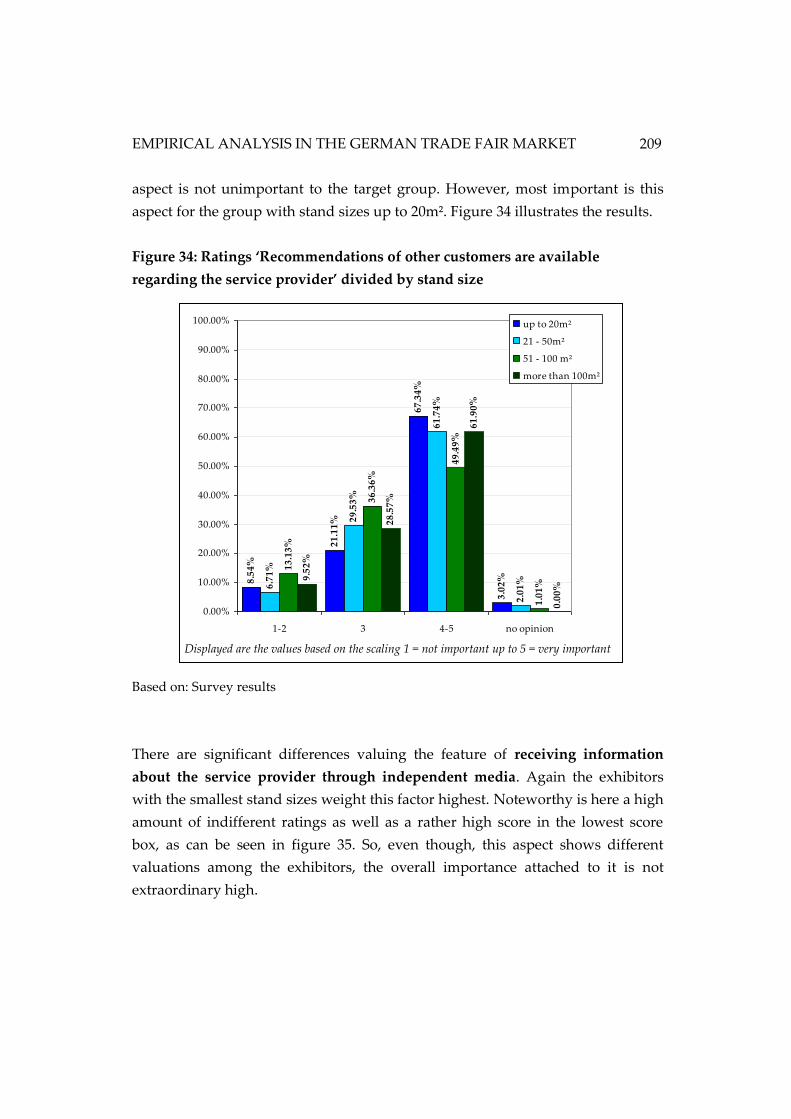
EMPIRICAL ANALYSIS IN THE GERMAN TRADE FAIR MARKET
209
aspect is not unimportant to the target group. However, most important is this
aspect for the group with stand sizes up to 20m². Figure 34 illustrates the results.
Figure 34: Ratings ‘Recommendations of other customers are available
regarding the service provider’ divided by stand size
Based on: Survey results
There are significant differences valuing the feature of receiving information
about the service provider through independent media. Again the exhibitors
with the smallest stand sizes weight this factor highest. Noteworthy is here a high
amount of indifferent ratings as well as a rather high score in the lowest score
box, as can be seen in figure 35. So, even though, this aspect shows different
valuations among the exhibitors, the overall importance attached to it is not
extraordinary high.
8.5
4%
21
.11
%
67
.34
%
3.0
2%
6.7
1%
29
.53
%
61
.74
%
2.0
1%
13
.13
%
36
.36
%
49
.49
%
1.0
1%
9.5
2%
28
.57
%
61
.90
%
0.0
0%
0.00%
10.00%
20.00%
30.00%
40.00%
50.00%
60.00%
70.00%
80.00%
90.00%
100.00%
1-2 3 4-5 no opinion
up to 20m²
21 - 50m²
51 - 100 m²
more than 100m²
Displayed are the values based on the scaling 1 = not important up to 5 = very important
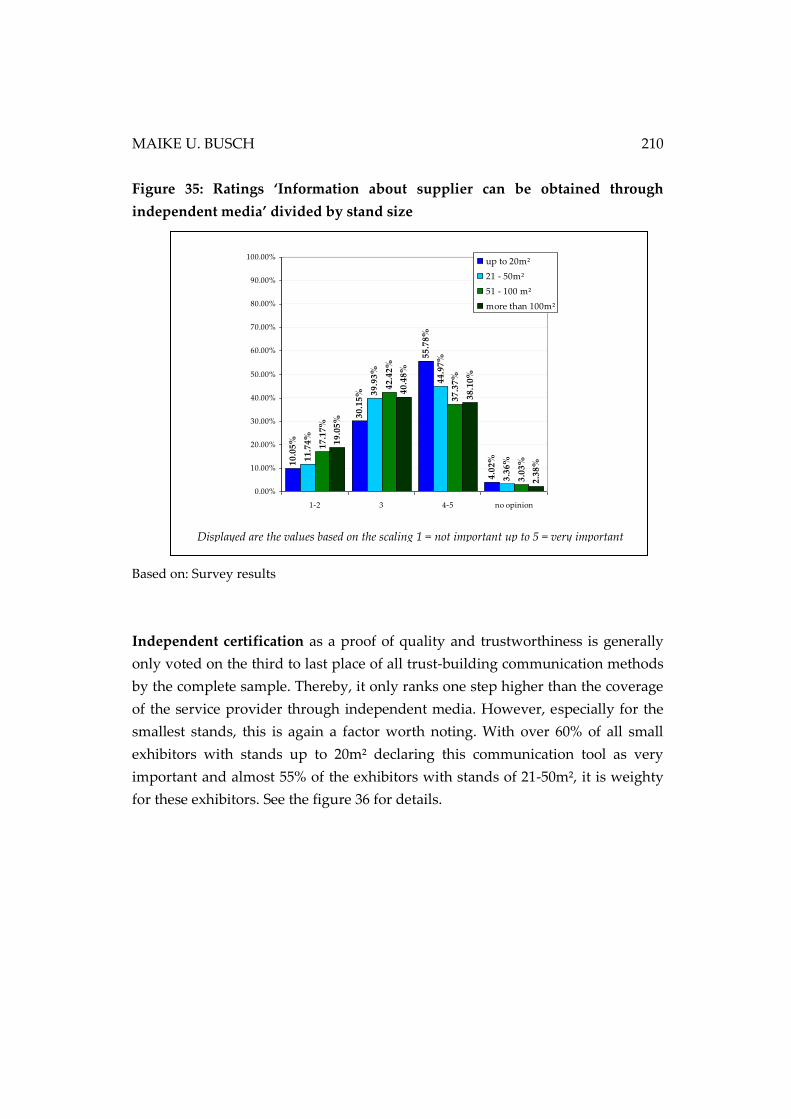
MAIKE U. BUSCH 210
Figure 35: Ratings ‘Information about supplier can be obtained through
independent media’ divided by stand size
Based on: Survey results
Independent certification as a proof of quality and trustworthiness is generally
only voted on the third to last place of all trust-building communication methods
by the complete sample. Thereby, it only ranks one step higher than the coverage
of the service provider through independent media. However, especially for the
smallest stands, this is again a factor worth noting. With over 60% of all small
exhibitors with stands up to 20m² declaring this communication tool as very
important and almost 55% of the exhibitors with stands of 21-50m², it is weighty
for these exhibitors. See the figure 36 for details.
10
.05
%
30
.15
%
55
.78
%
4.0
2%1
1.7
4%
39
.93
%
44
.97
%
3.3
6%
17
.17
%
42
.42
%
37
.37
%
3.0
3%
19
.05
%
40
.48
%
38
.10
%
2.3
8%
0.00%
10.00%
20.00%
30.00%
40.00%
50.00%
60.00%
70.00%
80.00%
90.00%
100.00%
1-2 3 4-5 no opinion
up to 20m²
21 - 50m²
51 - 100 m²
more than 100m²
Displayed are the values based on the scaling 1 = not important up to 5 = very important
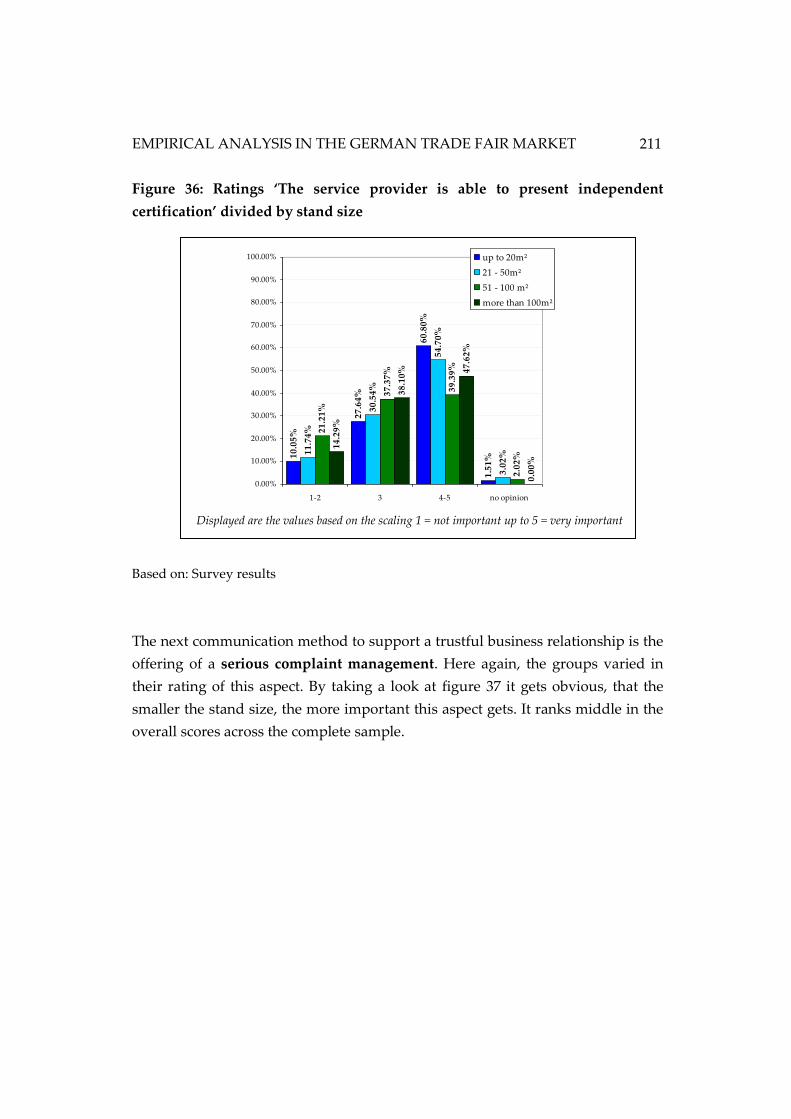
EMPIRICAL ANALYSIS IN THE GERMAN TRADE FAIR MARKET
211
Figure 36: Ratings ‘The service provider is able to present independent
certification’ divided by stand size
Based on: Survey results
The next communication method to support a trustful business relationship is the
offering of a serious complaint management. Here again, the groups varied in
their rating of this aspect. By taking a look at figure 37 it gets obvious, that the
smaller the stand size, the more important this aspect gets. It ranks middle in the
overall scores across the complete sample.
10
.05
%
27
.64
%
60
.80
%
1.5
1%
11
.74
%
30
.54
%
54
.70
%
3.0
2%
21
.21
%
37
.37
%
39
.39
%
2.0
2%
14
.29
%
38
.10
% 47
.62
%
0.0
0%
0.00%
10.00%
20.00%
30.00%
40.00%
50.00%
60.00%
70.00%
80.00%
90.00%
100.00%
1-2 3 4-5 no opinion
up to 20m²
21 - 50m²
51 - 100 m²
more than 100m²
Displayed are the values based on the scaling 1 = not important up to 5 = very important
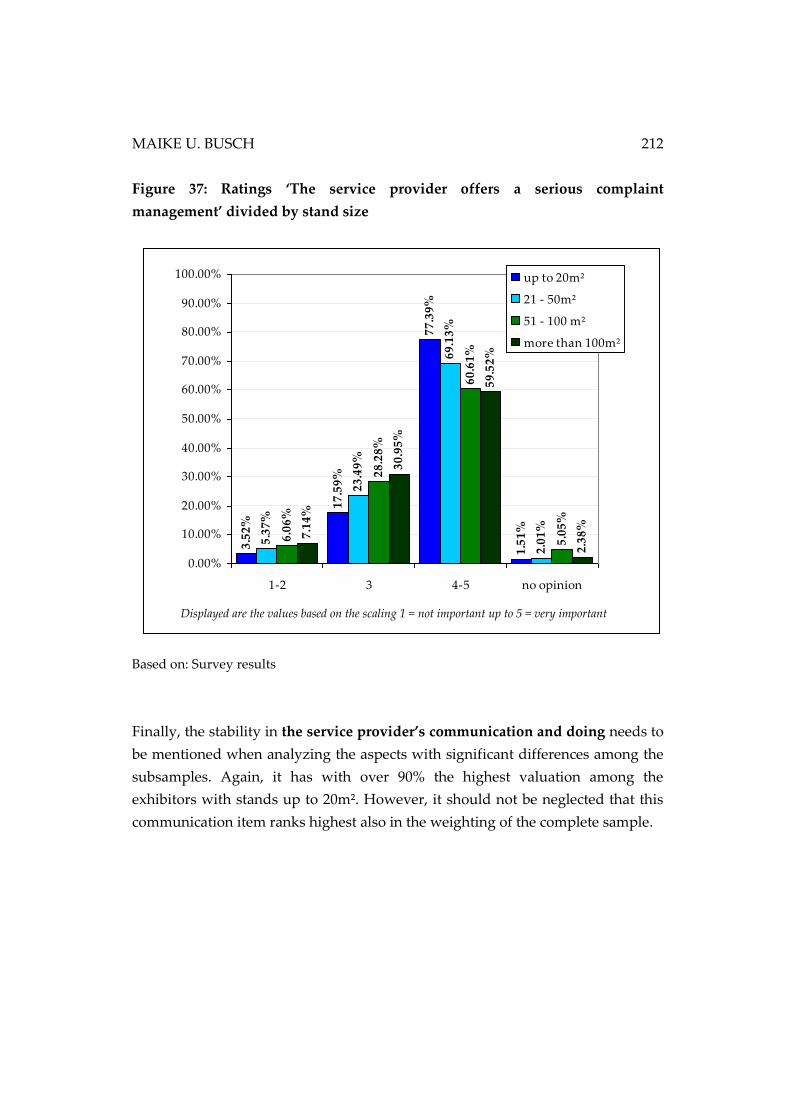
MAIKE U. BUSCH 212
Figure 37: Ratings ‘The service provider offers a serious complaint
management’ divided by stand size
Based on: Survey results
Finally, the stability in the service provider’s communication and doing needs to
be mentioned when analyzing the aspects with significant differences among the
subsamples. Again, it has with over 90% the highest valuation among the
exhibitors with stands up to 20m². However, it should not be neglected that this
communication item ranks highest also in the weighting of the complete sample.
3.5
2%
17
.59
%
77
.39
%
1.5
1%
5.3
7%
23
.49
%
69
.13
%
2.0
1%
6.0
6%
28
.28
%
60
.61
%
5.0
5%
7.1
4%
30
.95
%
59
.52
%
2.3
8%
0.00%
10.00%
20.00%
30.00%
40.00%
50.00%
60.00%
70.00%
80.00%
90.00%
100.00%
1-2 3 4-5 no opinion
up to 20m²
21 - 50m²
51 - 100 m²
more than 100m²
Displayed are the values based on the scaling 1 = not important up to 5 = very important
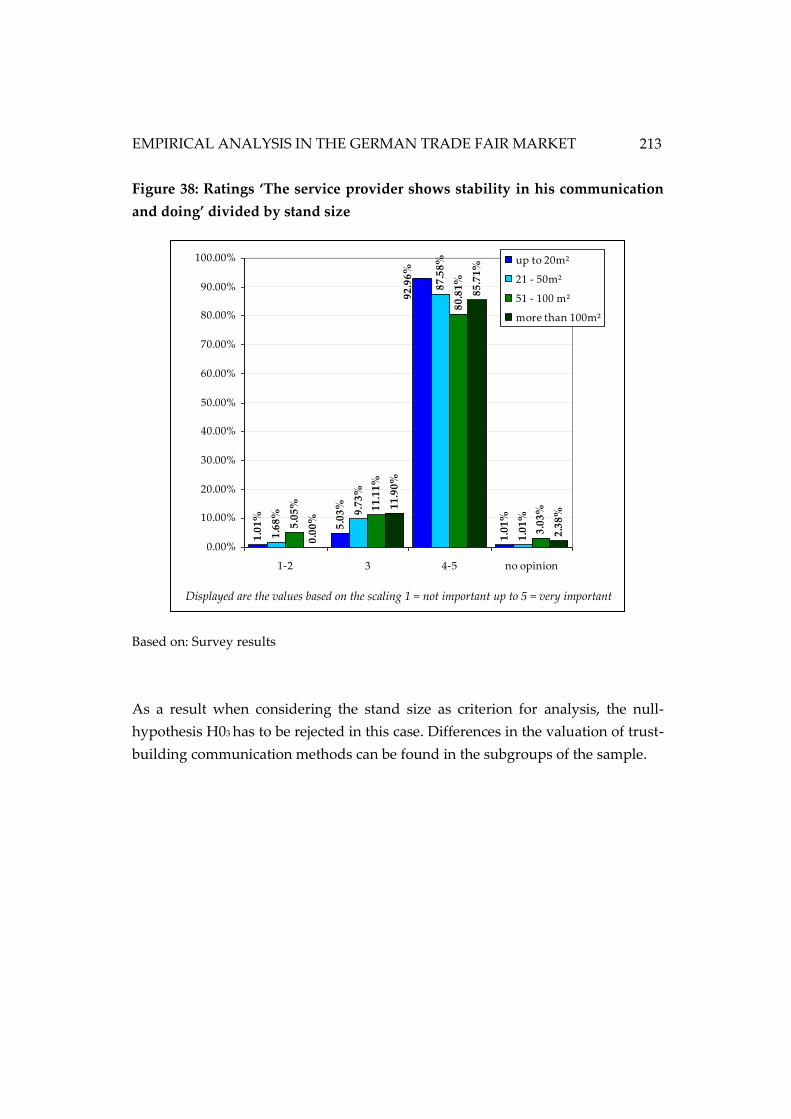
EMPIRICAL ANALYSIS IN THE GERMAN TRADE FAIR MARKET
213
Figure 38: Ratings ‘The service provider shows stability in his communication
and doing’ divided by stand size
Based on: Survey results
As a result when considering the stand size as criterion for analysis, the null-
hypothesis H03 has to be rejected in this case. Differences in the valuation of trust-
building communication methods can be found in the subgroups of the sample.
1.0
1%
5.0
3%
1.0
1%
1.6
8% 9
.73
%
87
.58
%
1.0
1%
5.0
5% 11
.11
%
80
.81
%
3.0
3%
0.0
0%
11
.90
%
85
.71
%
2.3
8%
92
.96
%
0.00%
10.00%
20.00%
30.00%
40.00%
50.00%
60.00%
70.00%
80.00%
90.00%
100.00%
1-2 3 4-5 no opinion
up to 20m²
21 - 50m²
51 - 100 m²
more than 100m²
Displayed are the values based on the scaling 1 = not important up to 5 = very important
MAIKE U. BUSCH 214
Origin
The last significance test in this respect is focusing on the origin of the exhibitor.
Are there significant differences in the evaluation of communication aspects with
regards to the origin of the exhibitors? Therefore, the hypothesis H13c is
formulated as follows:
H13c: Exhibitors in the German trade fair market show significant differences
in their valuation of methods to establish a trust building
communication a service provider should direct towards his customers
according to their origin.
Again, a first impression about the ratings is given by a median comparison
among the subgroups. They show some diversification among the groups. The
chart below gives an overview. Detailed median values on this comparison can be
found in appendix 33.
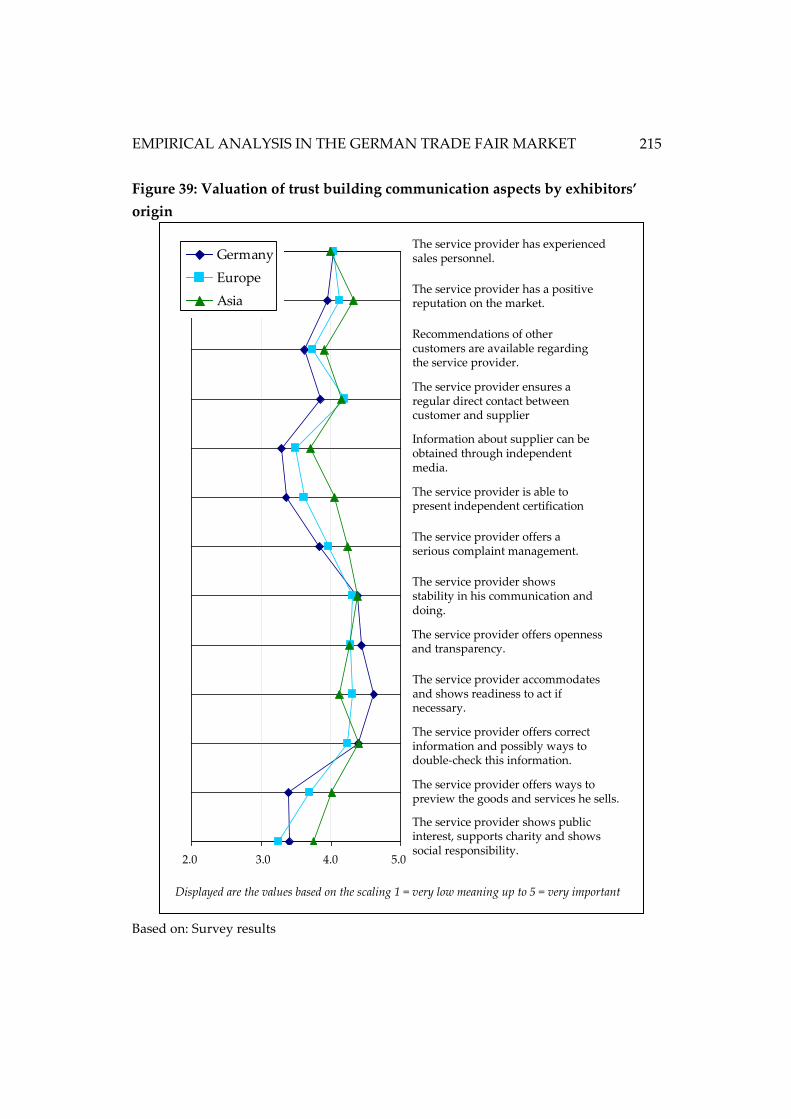
EMPIRICAL ANALYSIS IN THE GERMAN TRADE FAIR MARKET
215
Figure 39: Valuation of trust building communication aspects by exhibitors’
origin
Based on: Survey results
Displayed are the values based on the scaling 1 = very low meaning up to 5 = very important
The service provider shows public interest, supports
charity and shows social responsibility.
The service provider offers ways to preview the
goods and services he sells.
The service provider offers correct information and
possibly ways to double-check this information.
The service provider accommodates and shows
readiness to act if necessary.
The service provider offers openness and
transparency.
The service provider shows stability in his
communication and doing.
The service provider offers a serious complaint
management.
The service provider is able to present independent
certification
Information about supplier can be obtained through
independent media.
The service provider ensures a regular direct contact
between customer and supplier
Recommendations of other customers are available
regarding the service provider.
The service provider has a positive reputation on the
market.
The service provider has experienced sales
personnel.
2.00 3.00 4.00 5.00
Germany
Europe
Asia
The service provider has experienced sales personnel.
The service provider has a positive reputation on the market.
Recommendations of other customers are available regarding the service provider.
The service provider ensures a regular direct contact between customer and supplier
Information about supplier can be obtained through independent media.
The service provider is able to present independent certification
The service provider offers a serious complaint management.
The service provider shows stability in his communication and doing.
The service provider offers openness and transparency.
The service provider accommodates and shows readiness to act if necessary.
The service provider offers correct information and possibly ways to double-check this information.
The service provider offers ways to preview the goods and services he sells.
The service provider shows public interest, supports charity and shows social responsibility.
2.0 3.0 4.0 5.0
The service provider shows public interest, supports
charity and shows social responsibility.
The service provider offers ways to preview the
goods and services he sells.
The service provider offers correct information and
possibly ways to double-check this information.
The service provider accommodates and shows
readiness to act if necessary.
The service provider offers openness and
transparency.
The service provider shows stability in his
communication and doing.
The service provider offers a serious complaint
management.
The service provider is able to present independent
certification
Information about supplier can be obtained through
independent media.
The service provider ensures a regular direct contact
between customer and supplier
Recommendations of other customers are available
regarding the service provider.
The service provider has a positive reputation on the
market.
The service provider has experienced sales
personnel.
2.00 3.00 4.00 5.00
Germany
Europe
Asia
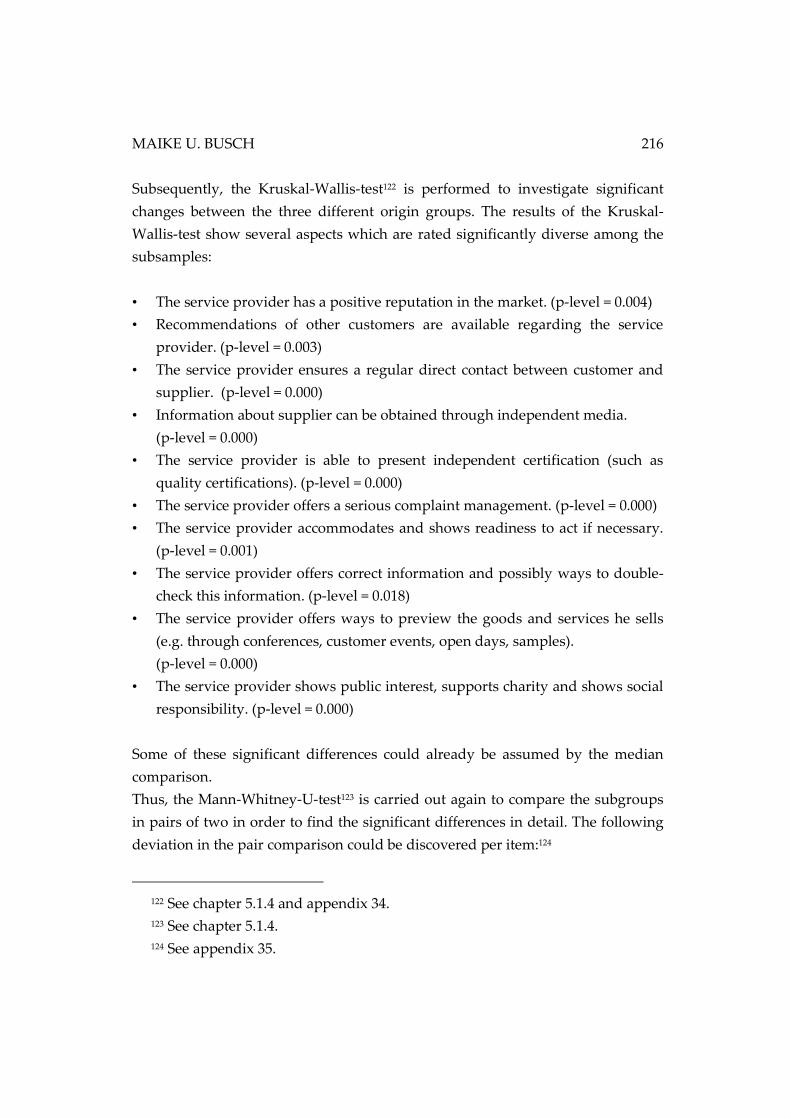
MAIKE U. BUSCH 216
Subsequently, the Kruskal-Wallis-test122 is performed to investigate significant
changes between the three different origin groups. The results of the Kruskal-
Wallis-test show several aspects which are rated significantly diverse among the
subsamples:
• The service provider has a positive reputation in the market. (p-level = 0.004)
• Recommendations of other customers are available regarding the service
provider. (p-level = 0.003)
• The service provider ensures a regular direct contact between customer and
supplier. (p-level = 0.000)
• Information about supplier can be obtained through independent media.
(p-level = 0.000)
• The service provider is able to present independent certification (such as
quality certifications). (p-level = 0.000)
• The service provider offers a serious complaint management. (p-level = 0.000)
• The service provider accommodates and shows readiness to act if necessary.
(p-level = 0.001)
• The service provider offers correct information and possibly ways to double-
check this information. (p-level = 0.018)
• The service provider offers ways to preview the goods and services he sells
(e.g. through conferences, customer events, open days, samples).
(p-level = 0.000)
• The service provider shows public interest, supports charity and shows social
responsibility. (p-level = 0.000)
Some of these significant differences could already be assumed by the median
comparison.
Thus, the Mann-Whitney-U-test123 is carried out again to compare the subgroups
in pairs of two in order to find the significant differences in detail. The following
deviation in the pair comparison could be discovered per item:124
122 See chapter 5.1.4 and appendix 34. 123 See chapter 5.1.4.
124 See appendix 35.
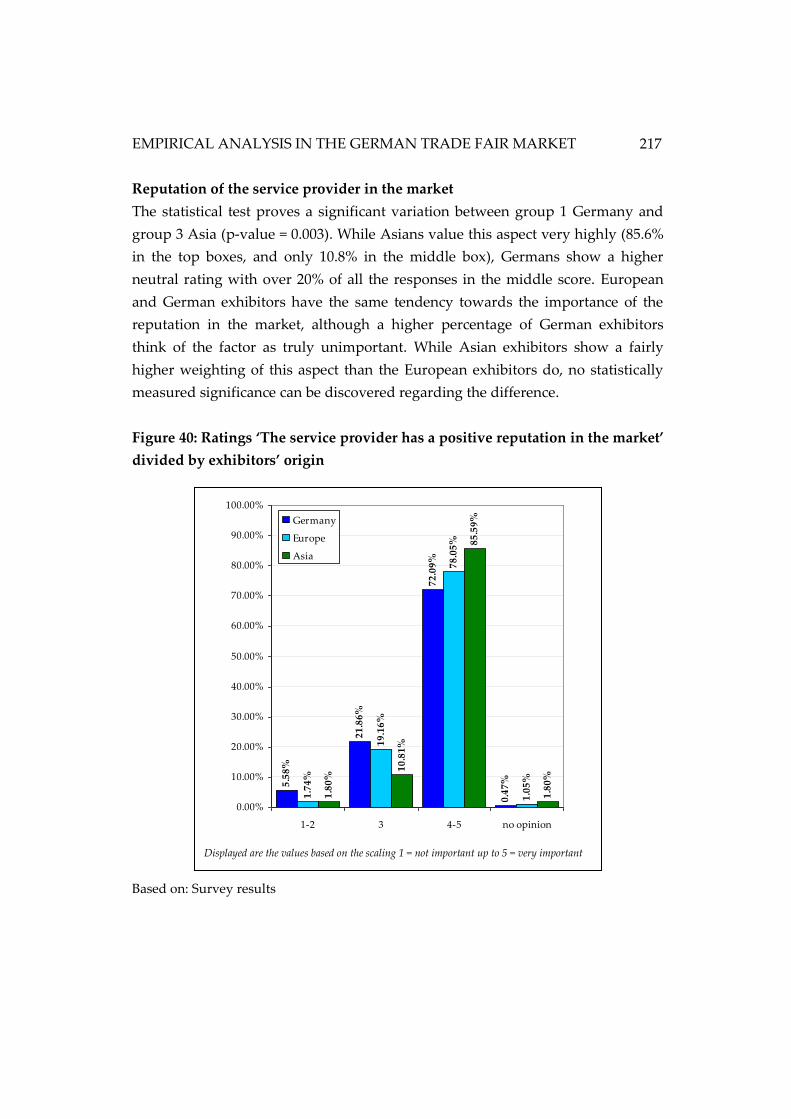
EMPIRICAL ANALYSIS IN THE GERMAN TRADE FAIR MARKET
217
Reputation of the service provider in the market
The statistical test proves a significant variation between group 1 Germany and
group 3 Asia (p-value = 0.003). While Asians value this aspect very highly (85.6%
in the top boxes, and only 10.8% in the middle box), Germans show a higher
neutral rating with over 20% of all the responses in the middle score. European
and German exhibitors have the same tendency towards the importance of the
reputation in the market, although a higher percentage of German exhibitors
think of the factor as truly unimportant. While Asian exhibitors show a fairly
higher weighting of this aspect than the European exhibitors do, no statistically
measured significance can be discovered regarding the difference.
Figure 40: Ratings ‘The service provider has a positive reputation in the market’
divided by exhibitors’ origin
Based on: Survey results
Displayed are the values based on the scaling 1 = not important up to 5 = very important
5.5
8%
21
.86
%
72
.09
%
0.4
7%
1.7
4%
19
.16
%
1.0
5%
1.8
0%
10
.81
%
85
.59
%
1.8
0%
78
.05
%
0.00%
10.00%
20.00%
30.00%
40.00%
50.00%
60.00%
70.00%
80.00%
90.00%
100.00%
1-2 3 4-5 no opinion
Germany
Europe
Asia
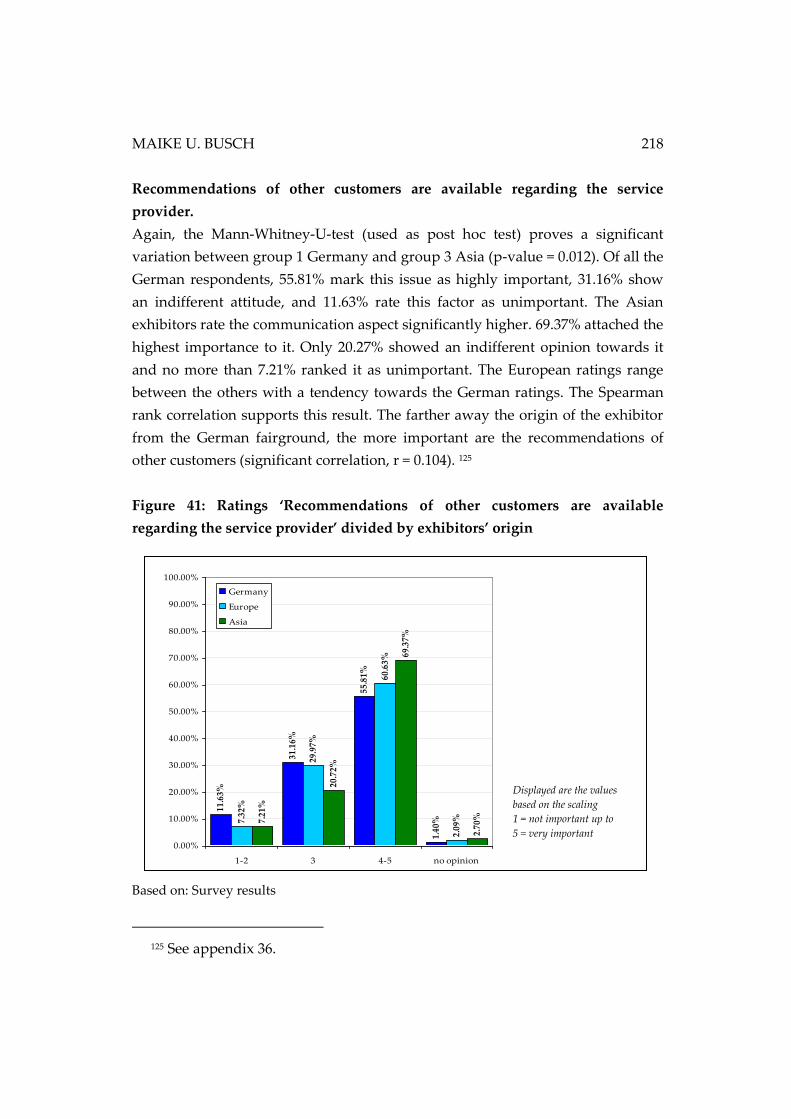
MAIKE U. BUSCH 218
Recommendations of other customers are available regarding the service
provider.
Again, the Mann-Whitney-U-test (used as post hoc test) proves a significant
variation between group 1 Germany and group 3 Asia (p-value = 0.012). Of all the
German respondents, 55.81% mark this issue as highly important, 31.16% show
an indifferent attitude, and 11.63% rate this factor as unimportant. The Asian
exhibitors rate the communication aspect significantly higher. 69.37% attached the
highest importance to it. Only 20.27% showed an indifferent opinion towards it
and no more than 7.21% ranked it as unimportant. The European ratings range
between the others with a tendency towards the German ratings. The Spearman
rank correlation supports this result. The farther away the origin of the exhibitor
from the German fairground, the more important are the recommendations of
other customers (significant correlation, r = 0.104). 125
Figure 41: Ratings ‘Recommendations of other customers are available
regarding the service provider’ divided by exhibitors’ origin
Based on: Survey results
125 See appendix 36.
11.6
3%
31.1
6%
55.8
1%
1.40
%7.32
%
29.9
7%
60.6
3%
2.09
%7.21
%
20.7
2%
69.3
7%
2.70
%
0.00%
10.00%
20.00%
30.00%
40.00%
50.00%
60.00%
70.00%
80.00%
90.00%
100.00%
1-2 3 4-5 no opinion
Germany
Europe
Asia
Displayed are the values
based on the scaling
1 = not important up to
5 = very important
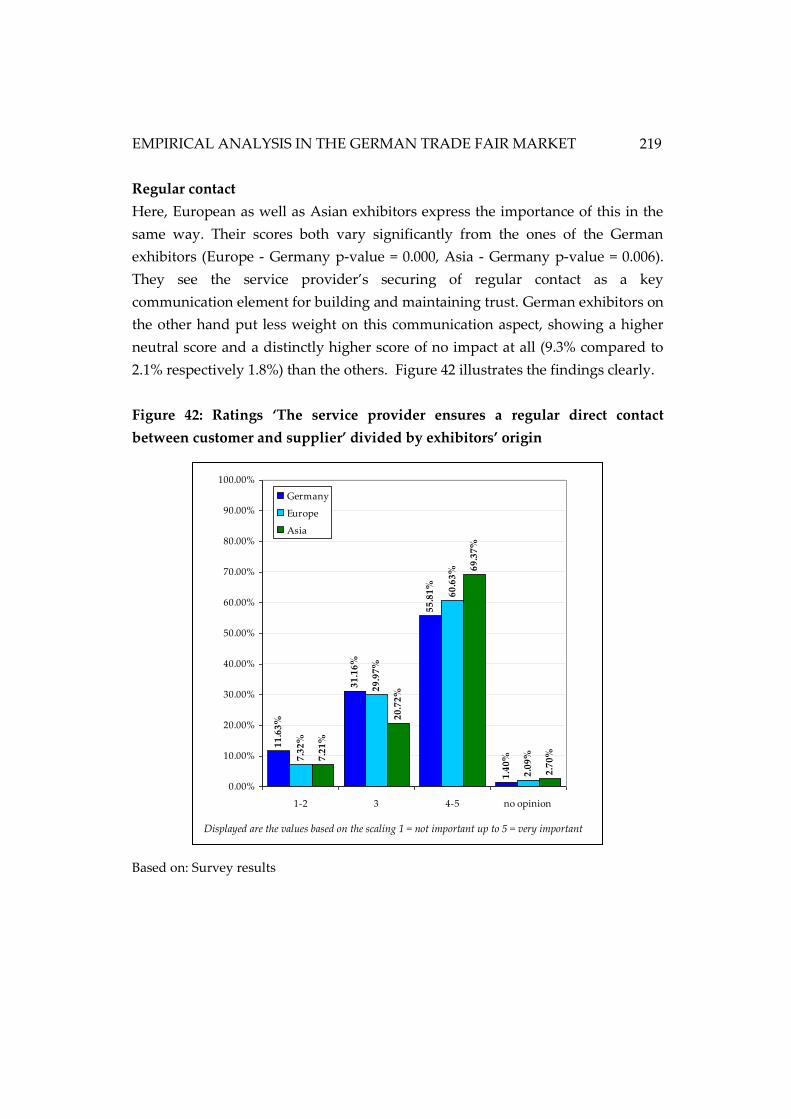
EMPIRICAL ANALYSIS IN THE GERMAN TRADE FAIR MARKET
219
Regular contact
Here, European as well as Asian exhibitors express the importance of this in the
same way. Their scores both vary significantly from the ones of the German
exhibitors (Europe - Germany p-value = 0.000, Asia - Germany p-value = 0.006).
They see the service provider’s securing of regular contact as a key
communication element for building and maintaining trust. German exhibitors on
the other hand put less weight on this communication aspect, showing a higher
neutral score and a distinctly higher score of no impact at all (9.3% compared to
2.1% respectively 1.8%) than the others. Figure 42 illustrates the findings clearly.
Figure 42: Ratings ‘The service provider ensures a regular direct contact
between customer and supplier’ divided by exhibitors’ origin
Based on: Survey results
11
.63
%
31
.16
%
55
.81
%
1.4
0%7
.32
%
29
.97
%
60
.63
%
2.0
9%7.2
1%
20
.72
%
69
.37
%
2.7
0%
0.00%
10.00%
20.00%
30.00%
40.00%
50.00%
60.00%
70.00%
80.00%
90.00%
100.00%
1-2 3 4-5 no opinion
Germany
Europe
Asia
Displayed are the values based on the scaling 1 = not important up to 5 = very important
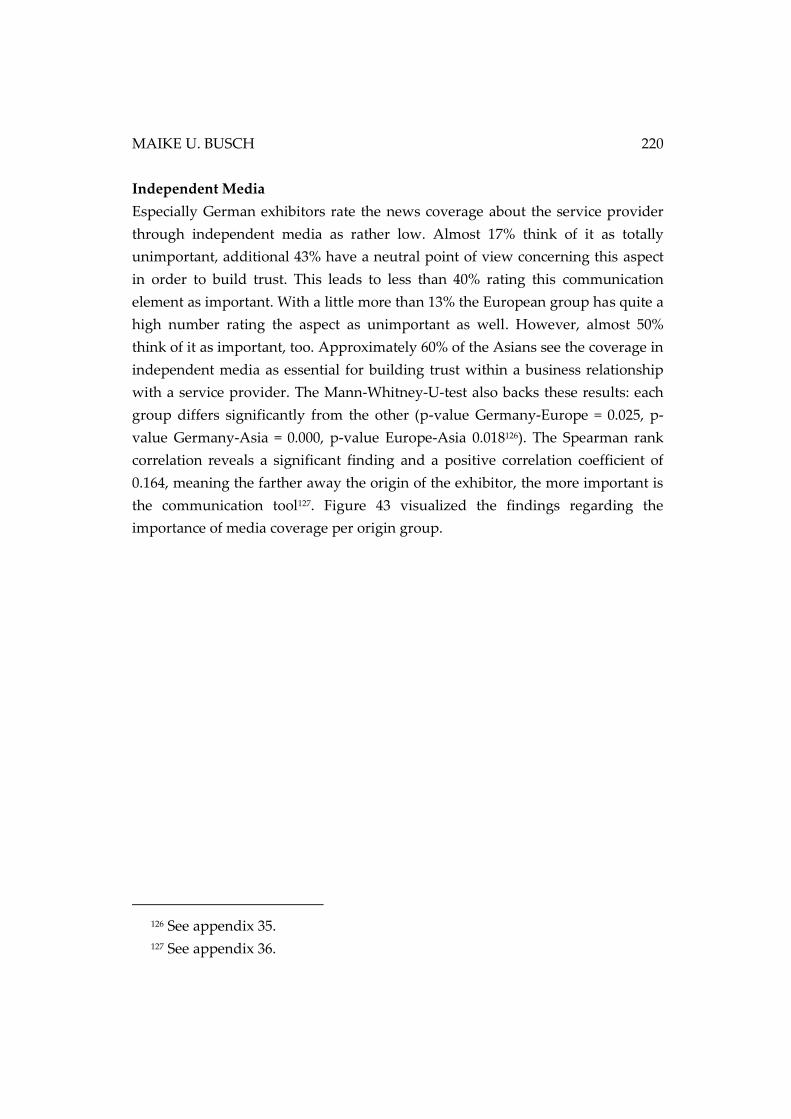
MAIKE U. BUSCH 220
Independent Media
Especially German exhibitors rate the news coverage about the service provider
through independent media as rather low. Almost 17% think of it as totally
unimportant, additional 43% have a neutral point of view concerning this aspect
in order to build trust. This leads to less than 40% rating this communication
element as important. With a little more than 13% the European group has quite a
high number rating the aspect as unimportant as well. However, almost 50%
think of it as important, too. Approximately 60% of the Asians see the coverage in
independent media as essential for building trust within a business relationship
with a service provider. The Mann-Whitney-U-test also backs these results: each
group differs significantly from the other (p-value Germany-Europe = 0.025, p-
value Germany-Asia = 0.000, p-value Europe-Asia 0.018126). The Spearman rank
correlation reveals a significant finding and a positive correlation coefficient of
0.164, meaning the farther away the origin of the exhibitor, the more important is
the communication tool127. Figure 43 visualized the findings regarding the
importance of media coverage per origin group.
126 See appendix 35.
127 See appendix 36.
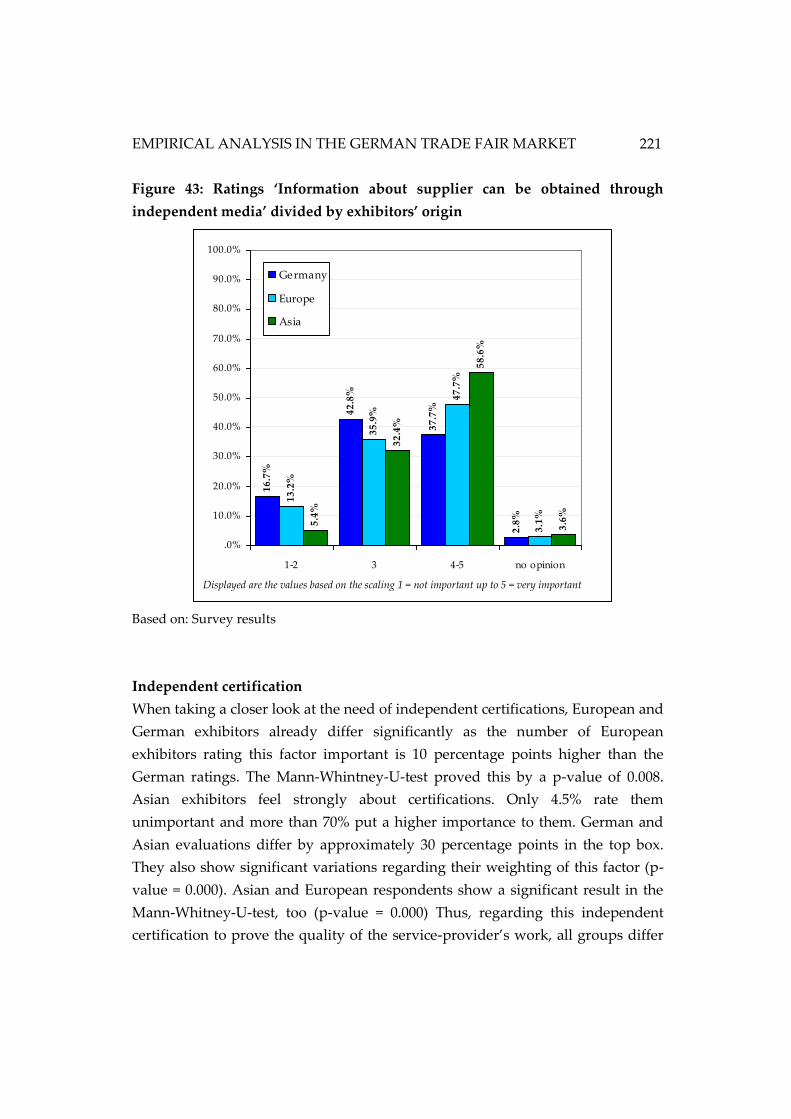
EMPIRICAL ANALYSIS IN THE GERMAN TRADE FAIR MARKET
221
Figure 43: Ratings ‘Information about supplier can be obtained through
independent media’ divided by exhibitors’ origin
Based on: Survey results
Independent certification
When taking a closer look at the need of independent certifications, European and
German exhibitors already differ significantly as the number of European
exhibitors rating this factor important is 10 percentage points higher than the
German ratings. The Mann-Whintney-U-test proved this by a p-value of 0.008.
Asian exhibitors feel strongly about certifications. Only 4.5% rate them
unimportant and more than 70% put a higher importance to them. German and
Asian evaluations differ by approximately 30 percentage points in the top box.
They also show significant variations regarding their weighting of this factor (p-
value = 0.000). Asian and European respondents show a significant result in the
Mann-Whitney-U-test, too (p-value = 0.000) Thus, regarding this independent
certification to prove the quality of the service-provider’s work, all groups differ
Displayed are the values based on the scaling 1 = not important up to 5 = very important
16
.7%
42
.8%
37
.7%
2.8
%
13
.2%
35
.9%
47
.7%
3.1
%
5.4
%
32
.4%
58
.6%
3.6
%
.0%
10.0%
20.0%
30.0%
40.0%
50.0%
60.0%
70.0%
80.0%
90.0%
100.0%
1-2 3 4-5 no opinion
Germany
Europe
Asia
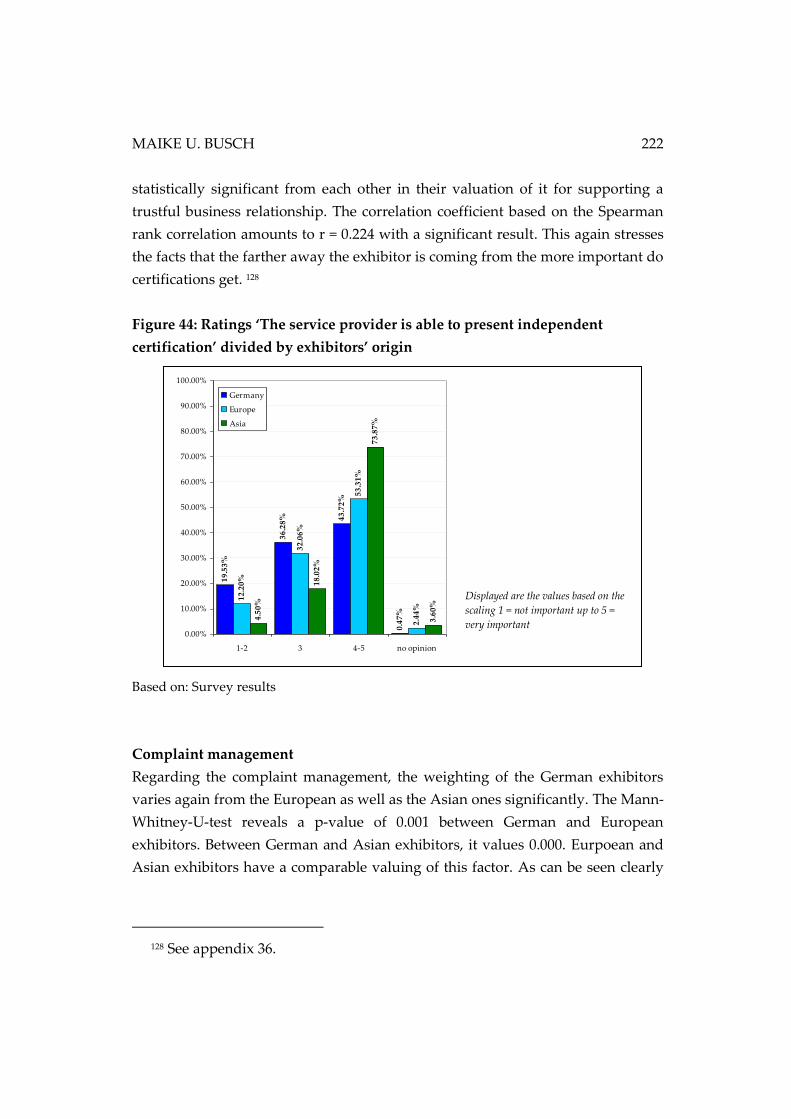
MAIKE U. BUSCH 222
statistically significant from each other in their valuation of it for supporting a
trustful business relationship. The correlation coefficient based on the Spearman
rank correlation amounts to r = 0.224 with a significant result. This again stresses
the facts that the farther away the exhibitor is coming from the more important do
certifications get. 128
Figure 44: Ratings ‘The service provider is able to present independent
certification’ divided by exhibitors’ origin
Based on: Survey results
Complaint management
Regarding the complaint management, the weighting of the German exhibitors
varies again from the European as well as the Asian ones significantly. The Mann-
Whitney-U-test reveals a p-value of 0.001 between German and European
exhibitors. Between German and Asian exhibitors, it values 0.000. Eurpoean and
Asian exhibitors have a comparable valuing of this factor. As can be seen clearly
128 See appendix 36.
Displayed are the values based on the
scaling 1 = not important up to 5 =
very important
19
.53
%
36
.28
% 43
.72
%
0.4
7%
12
.20
%
32
.06
%
53
.31
%
2.4
4%
4.5
0%
18
.02
%
73
.87
%
3.6
0%
0.00%
10.00%
20.00%
30.00%
40.00%
50.00%
60.00%
70.00%
80.00%
90.00%
100.00%
1-2 3 4-5 no opinion
Germany
Europe
Asia
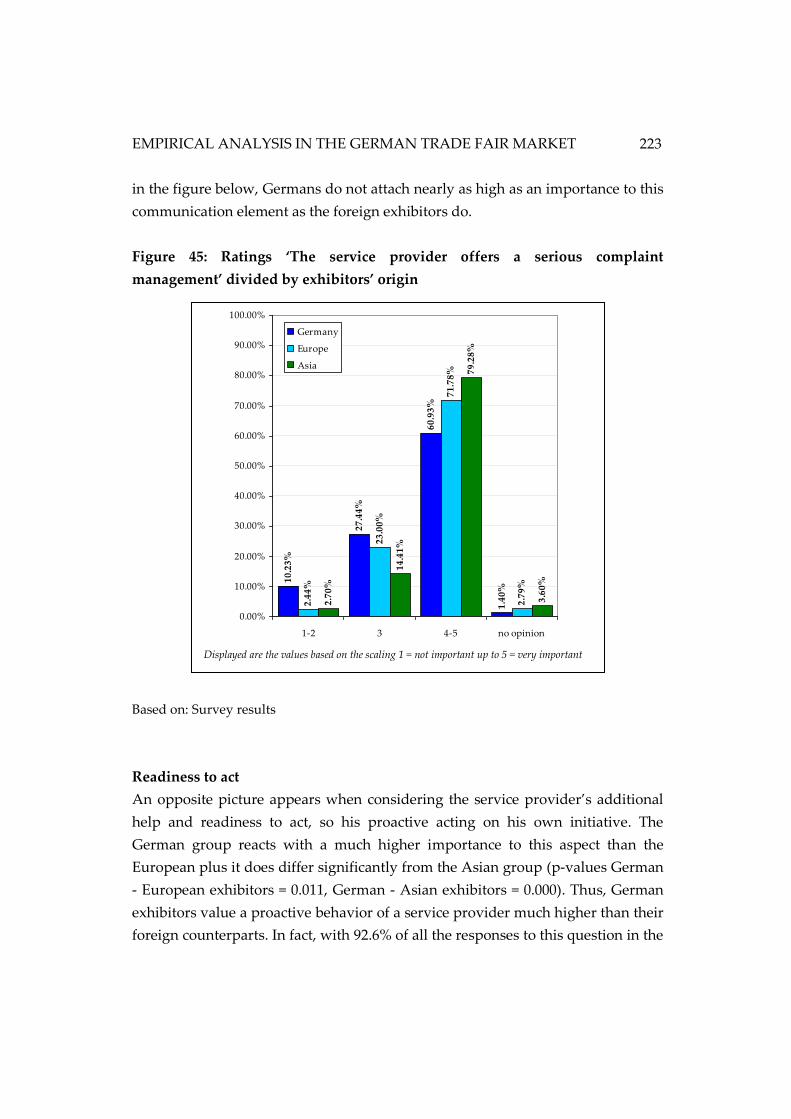
EMPIRICAL ANALYSIS IN THE GERMAN TRADE FAIR MARKET
223
in the figure below, Germans do not attach nearly as high as an importance to this
communication element as the foreign exhibitors do.
Figure 45: Ratings ‘The service provider offers a serious complaint
management’ divided by exhibitors’ origin
Based on: Survey results
Readiness to act
An opposite picture appears when considering the service provider’s additional
help and readiness to act, so his proactive acting on his own initiative. The
German group reacts with a much higher importance to this aspect than the
European plus it does differ significantly from the Asian group (p-values German
- European exhibitors = 0.011, German - Asian exhibitors = 0.000). Thus, German
exhibitors value a proactive behavior of a service provider much higher than their
foreign counterparts. In fact, with 92.6% of all the responses to this question in the
10
.23
%
27
.44
%
60
.93
%
1.4
0%
2.4
4%
23
.00
%
71
.78
%
2.7
9%
2.7
0%
14
.41
%
79
.28
%
3.6
0%
0.00%
10.00%
20.00%
30.00%
40.00%
50.00%
60.00%
70.00%
80.00%
90.00%
100.00%
1-2 3 4-5 no opinion
Germany
Europe
Asia
Displayed are the values based on the scaling 1 = not important up to 5 = very important
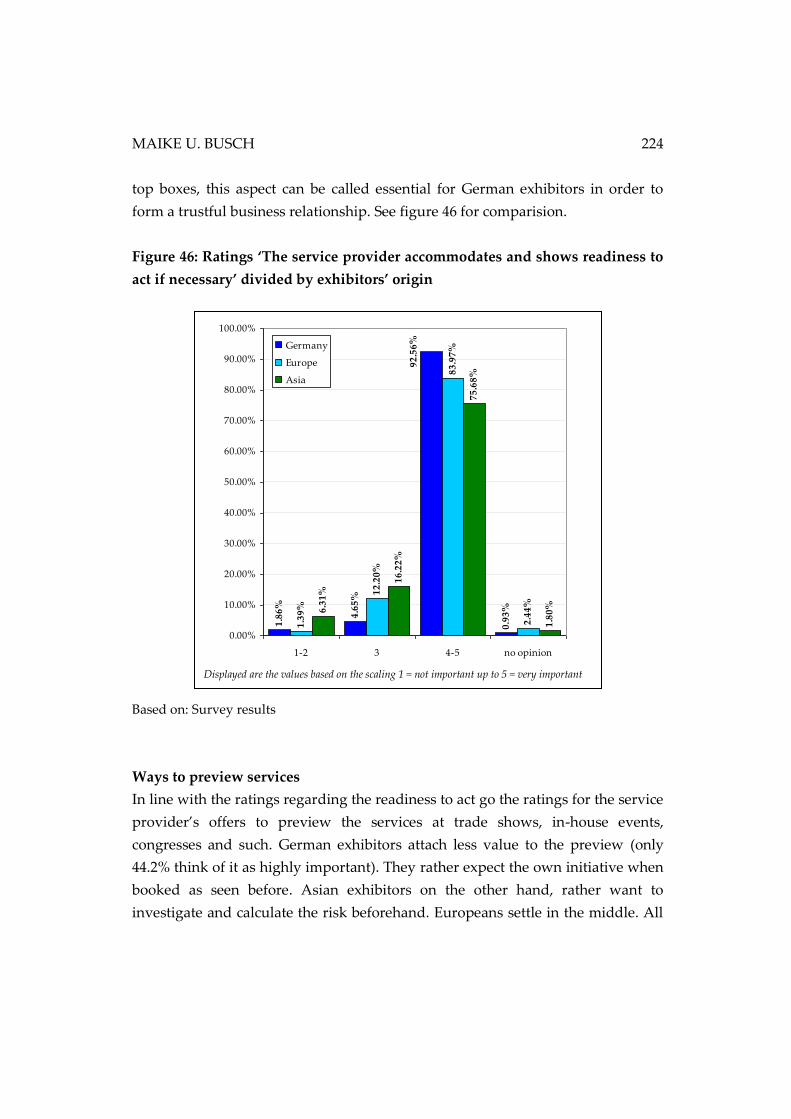
MAIKE U. BUSCH 224
top boxes, this aspect can be called essential for German exhibitors in order to
form a trustful business relationship. See figure 46 for comparision.
Figure 46: Ratings ‘The service provider accommodates and shows readiness to
act if necessary’ divided by exhibitors’ origin
Based on: Survey results
Ways to preview services
In line with the ratings regarding the readiness to act go the ratings for the service
provider’s offers to preview the services at trade shows, in-house events,
congresses and such. German exhibitors attach less value to the preview (only
44.2% think of it as highly important). They rather expect the own initiative when
booked as seen before. Asian exhibitors on the other hand, rather want to
investigate and calculate the risk beforehand. Europeans settle in the middle. All
Displayed are the values based on the scaling 1 = not important up to 5 = very important
1.8
6%
4.6
5%
0.9
3%
1.3
9%
12
.20
%
83
.97
%
2.4
4%
6.3
1%
16
.22
%
75
.68
%
1.8
0%
92
.56
%
0.00%
10.00%
20.00%
30.00%
40.00%
50.00%
60.00%
70.00%
80.00%
90.00%
100.00%
1-2 3 4-5 no opinion
Germany
Europe
Asia
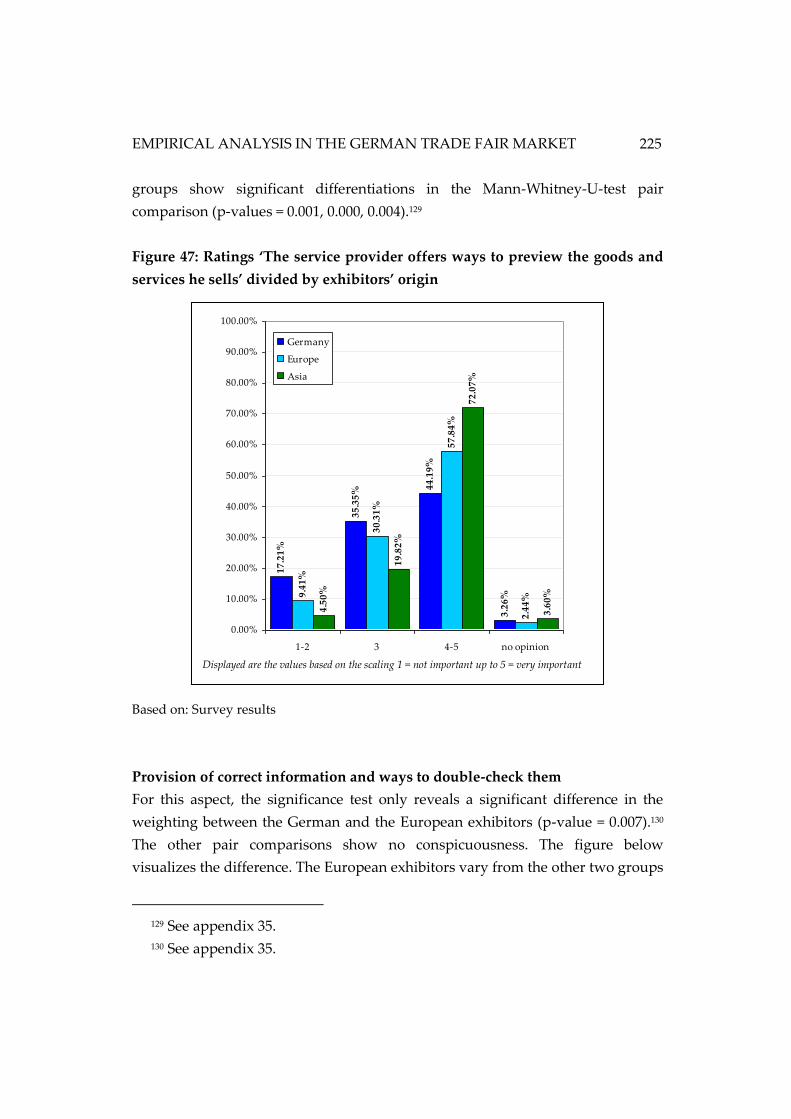
EMPIRICAL ANALYSIS IN THE GERMAN TRADE FAIR MARKET
225
groups show significant differentiations in the Mann-Whitney-U-test pair
comparison (p-values = 0.001, 0.000, 0.004).129
Figure 47: Ratings ‘The service provider offers ways to preview the goods and
services he sells’ divided by exhibitors’ origin
Based on: Survey results
Provision of correct information and ways to double-check them
For this aspect, the significance test only reveals a significant difference in the
weighting between the German and the European exhibitors (p-value = 0.007).130
The other pair comparisons show no conspicuousness. The figure below
visualizes the difference. The European exhibitors vary from the other two groups
129 See appendix 35.
130 See appendix 35.
17
.21
%
35
.35
% 44
.19
%
3.2
6%9
.41
%
30
.31
%
57
.84
%
2.4
4%
4.5
0%
19
.82
%
72
.07
%
3.6
0%
0.00%
10.00%
20.00%
30.00%
40.00%
50.00%
60.00%
70.00%
80.00%
90.00%
100.00%
1-2 3 4-5 no opinion
Germany
Europe
Asia
Displayed are the values based on the scaling 1 = not important up to 5 = very important
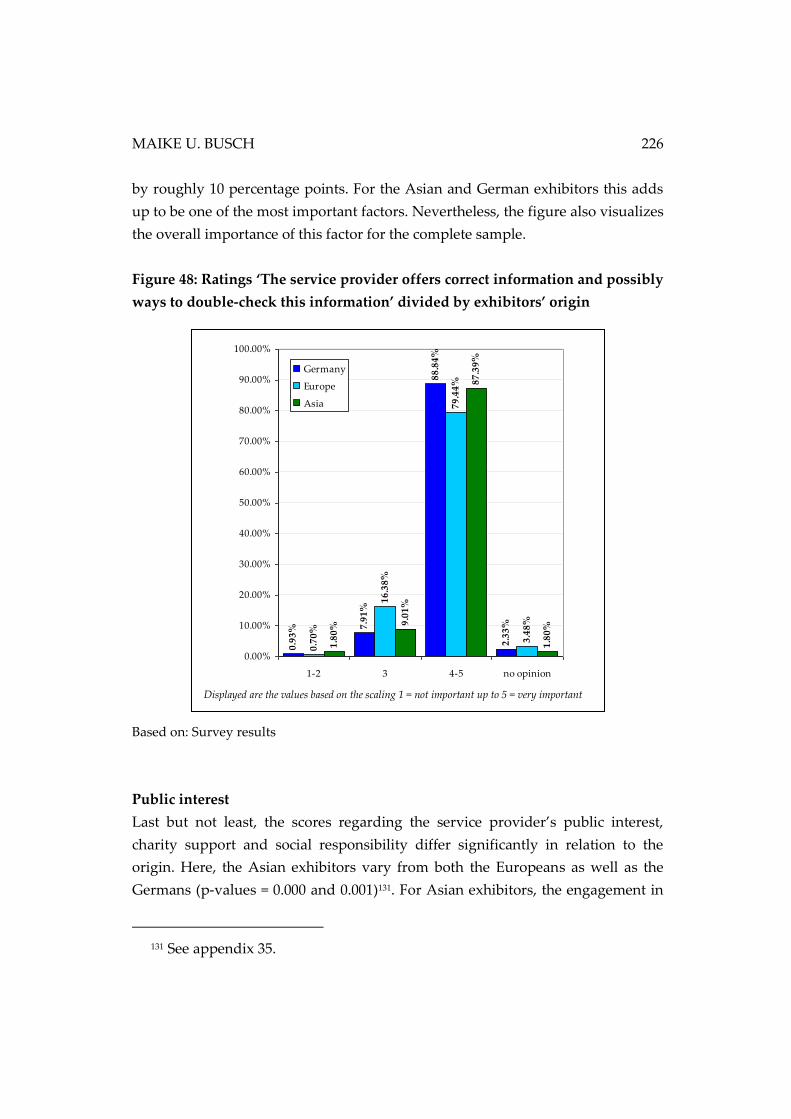
MAIKE U. BUSCH 226
by roughly 10 percentage points. For the Asian and German exhibitors this adds
up to be one of the most important factors. Nevertheless, the figure also visualizes
the overall importance of this factor for the complete sample.
Figure 48: Ratings ‘The service provider offers correct information and possibly
ways to double-check this information’ divided by exhibitors’ origin
Based on: Survey results
Public interest
Last but not least, the scores regarding the service provider’s public interest,
charity support and social responsibility differ significantly in relation to the
origin. Here, the Asian exhibitors vary from both the Europeans as well as the
Germans (p-values = 0.000 and 0.001)131. For Asian exhibitors, the engagement in
131 See appendix 35.
Displayed are the values based on the scaling 1 = not important up to 5 = very important
0.9
3% 7
.91
%
88
.84
%
2.3
3%
0.7
0%
16
.38
%
79
.44
%
3.4
8%
1.8
0% 9
.01
%
87
.39
%
1.8
0%
0.00%
10.00%
20.00%
30.00%
40.00%
50.00%
60.00%
70.00%
80.00%
90.00%
100.00%
1-2 3 4-5 no opinion
Germany
Europe
Asia
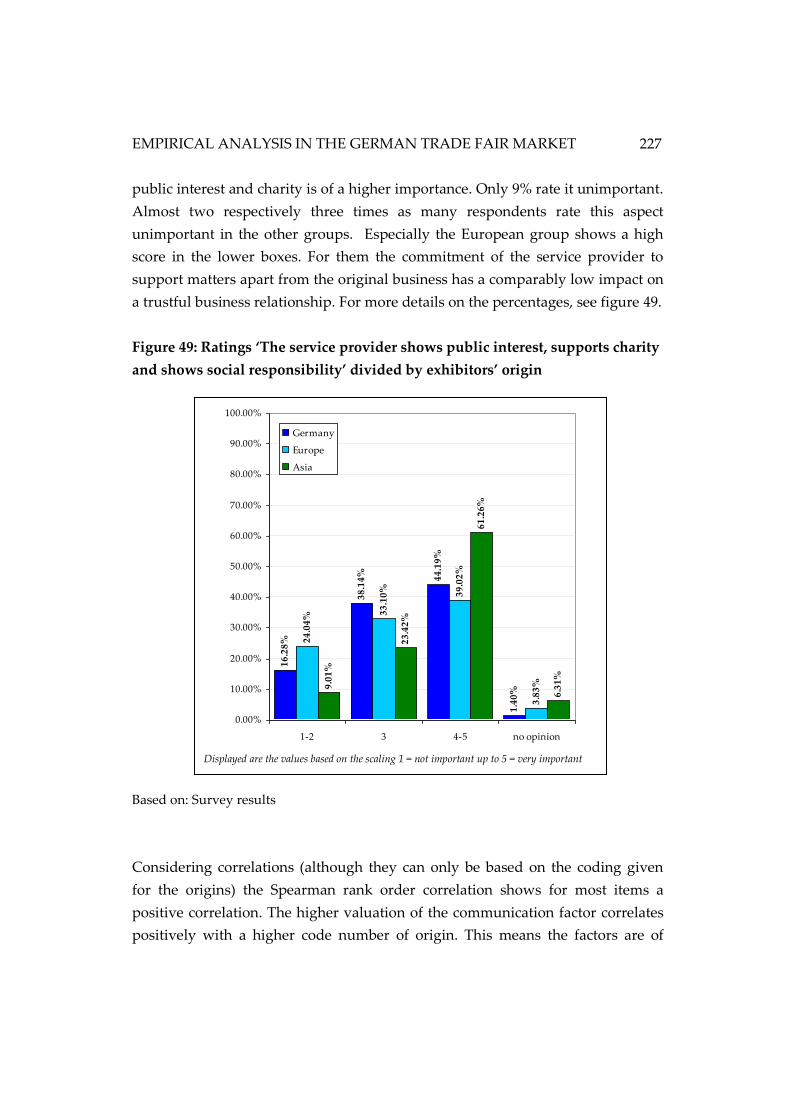
EMPIRICAL ANALYSIS IN THE GERMAN TRADE FAIR MARKET
227
public interest and charity is of a higher importance. Only 9% rate it unimportant.
Almost two respectively three times as many respondents rate this aspect
unimportant in the other groups. Especially the European group shows a high
score in the lower boxes. For them the commitment of the service provider to
support matters apart from the original business has a comparably low impact on
a trustful business relationship. For more details on the percentages, see figure 49.
Figure 49: Ratings ‘The service provider shows public interest, supports charity
and shows social responsibility’ divided by exhibitors’ origin
Based on: Survey results
Considering correlations (although they can only be based on the coding given
for the origins) the Spearman rank order correlation shows for most items a
positive correlation. The higher valuation of the communication factor correlates
positively with a higher code number of origin. This means the factors are of
16
.28
%
38
.14
% 44
.19
%
1.4
0%
24
.04
% 33
.10
% 39
.02
%
3.8
3%9.0
1%
23
.42
%
61
.26
%
6.3
1%
0.00%
10.00%
20.00%
30.00%
40.00%
50.00%
60.00%
70.00%
80.00%
90.00%
100.00%
1-2 3 4-5 no opinion
Germany
Europe
Asia
Displayed are the values based on the scaling 1 = not important up to 5 = very important
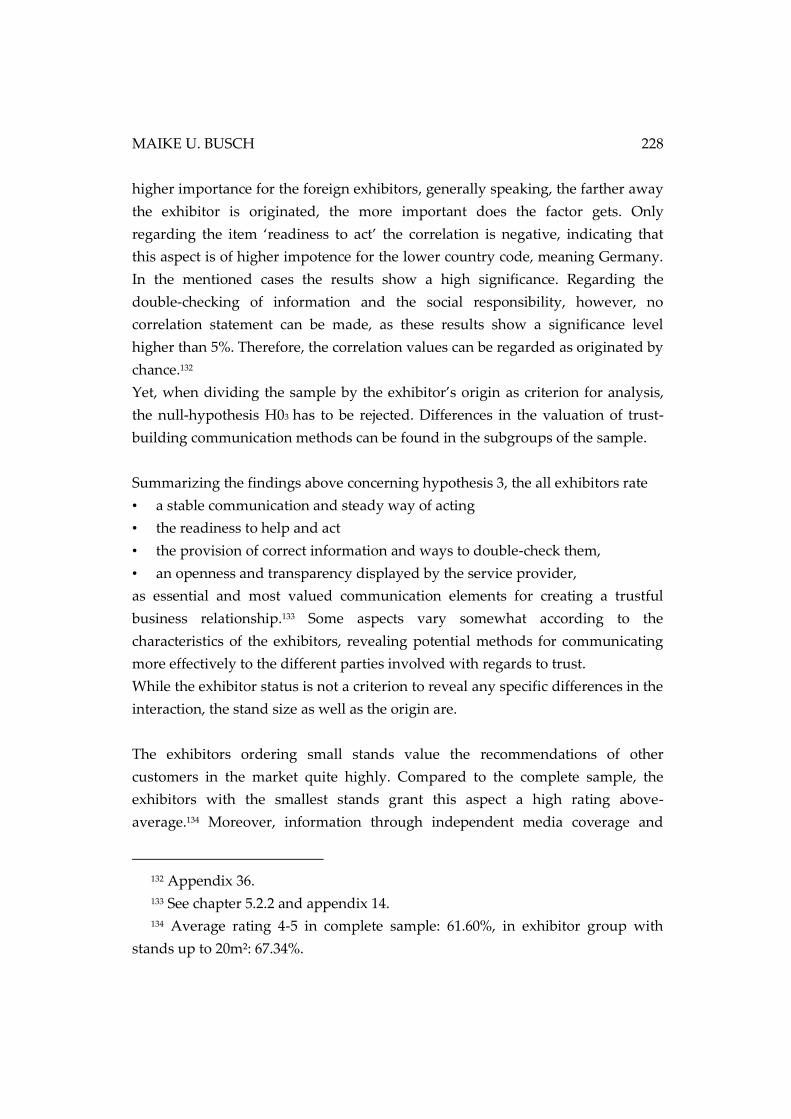
MAIKE U. BUSCH 228
higher importance for the foreign exhibitors, generally speaking, the farther away
the exhibitor is originated, the more important does the factor gets. Only
regarding the item ‘readiness to act’ the correlation is negative, indicating that
this aspect is of higher impotence for the lower country code, meaning Germany.
In the mentioned cases the results show a high significance. Regarding the
double-checking of information and the social responsibility, however, no
correlation statement can be made, as these results show a significance level
higher than 5%. Therefore, the correlation values can be regarded as originated by
chance.132
Yet, when dividing the sample by the exhibitor’s origin as criterion for analysis,
the null-hypothesis H03 has to be rejected. Differences in the valuation of trust-
building communication methods can be found in the subgroups of the sample.
Summarizing the findings above concerning hypothesis 3, the all exhibitors rate
• a stable communication and steady way of acting
• the readiness to help and act
• the provision of correct information and ways to double-check them,
• an openness and transparency displayed by the service provider,
as essential and most valued communication elements for creating a trustful
business relationship.133 Some aspects vary somewhat according to the
characteristics of the exhibitors, revealing potential methods for communicating
more effectively to the different parties involved with regards to trust.
While the exhibitor status is not a criterion to reveal any specific differences in the
interaction, the stand size as well as the origin are.
The exhibitors ordering small stands value the recommendations of other
customers in the market quite highly. Compared to the complete sample, the
exhibitors with the smallest stands grant this aspect a high rating above-
average.134 Moreover, information through independent media coverage and
132 Appendix 36.
133 See chapter 5.2.2 and appendix 14. 134 Average rating 4-5 in complete sample: 61.60%, in exhibitor group with
stands up to 20m²: 67.34%.
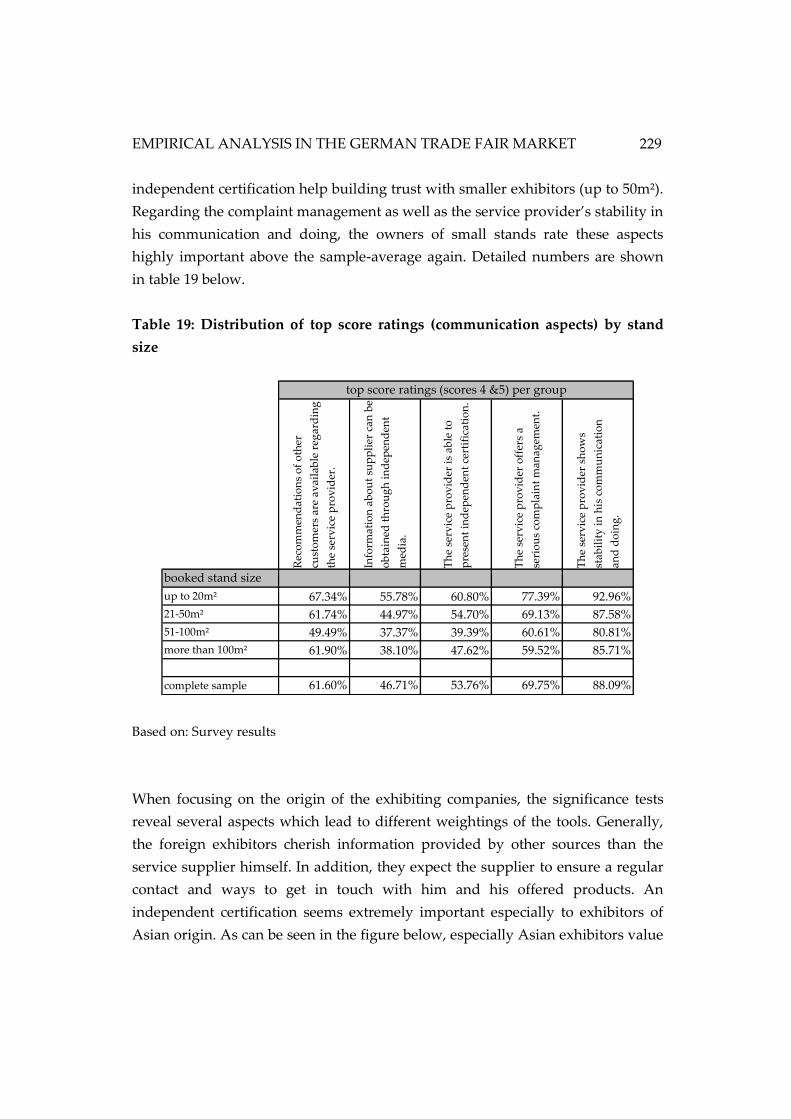
EMPIRICAL ANALYSIS IN THE GERMAN TRADE FAIR MARKET
229
Rec
om
men
da
tio
ns
of
oth
er
cust
om
ers
are
avai
lab
le r
egar
din
g
the
serv
ice
pro
vid
er.
Info
rmat
ion
ab
ou
t su
pp
lier
can
be
ob
tain
ed t
hro
ug
h i
nd
epen
den
t
med
ia.
Th
e se
rvic
e p
rov
ider
is
able
to
pre
sen
t in
dep
end
ent
cert
ific
atio
n.
Th
e se
rvic
e p
rov
ider
off
ers
a
seri
ou
s co
mp
lain
t m
anag
emen
t.
Th
e se
rvic
e p
rov
ider
sh
ow
s
stab
ilit
y i
n h
is c
om
mu
nic
atio
n
and
do
ing
.
booked stand size
up to 20m² 67.34% 55.78% 60.80% 77.39% 92.96%
21-50m² 61.74% 44.97% 54.70% 69.13% 87.58%
51-100m² 49.49% 37.37% 39.39% 60.61% 80.81%
more than 100m² 61.90% 38.10% 47.62% 59.52% 85.71%
complete sample 61.60% 46.71% 53.76% 69.75% 88.09%
top score ratings (scores 4 &5) per group
independent certification help building trust with smaller exhibitors (up to 50m²).
Regarding the complaint management as well as the service provider’s stability in
his communication and doing, the owners of small stands rate these aspects
highly important above the sample-average again. Detailed numbers are shown
in table 19 below.
Table 19: Distribution of top score ratings (communication aspects) by stand
size
Based on: Survey results
When focusing on the origin of the exhibiting companies, the significance tests
reveal several aspects which lead to different weightings of the tools. Generally,
the foreign exhibitors cherish information provided by other sources than the
service supplier himself. In addition, they expect the supplier to ensure a regular
contact and ways to get in touch with him and his offered products. An
independent certification seems extremely important especially to exhibitors of
Asian origin. As can be seen in the figure below, especially Asian exhibitors value
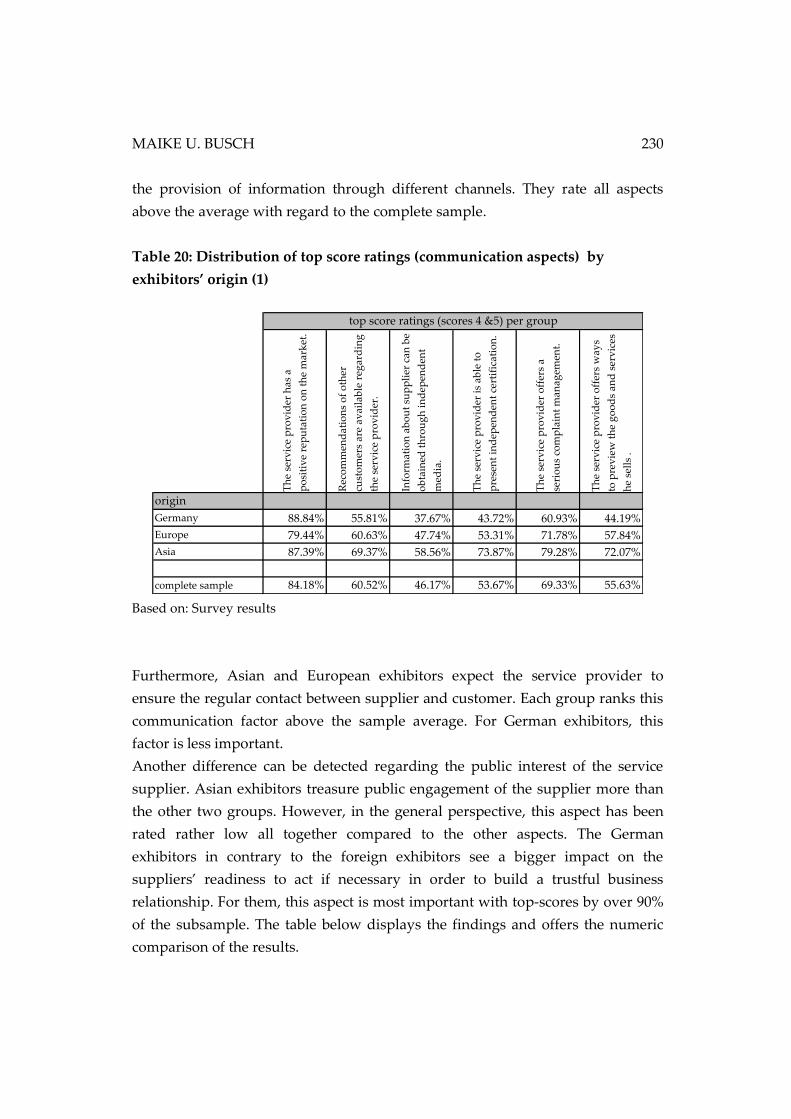
MAIKE U. BUSCH 230
Th
e se
rvic
e p
rov
ider
has
a
po
siti
ve
rep
uta
tio
n o
n t
he
mar
ket
.
Rec
om
men
dat
ion
s o
f o
ther
cust
om
ers
are
avai
lab
le r
egar
din
g
the
serv
ice
pro
vid
er.
Info
rmat
ion
ab
ou
t su
pp
lier
can
be
ob
tain
ed t
hro
ug
h i
nd
epen
den
t
med
ia.
Th
e se
rvic
e p
rov
ider
is
able
to
pre
sen
t in
dep
end
ent
cert
ific
atio
n.
Th
e se
rvic
e p
rov
ider
off
ers
a
seri
ou
s co
mp
lain
t m
anag
emen
t.
Th
e se
rvic
e p
rov
ider
off
ers
way
s
to p
rev
iew
th
e g
oo
ds
and
ser
vic
es
he
sell
s .
origin
Germany 88.84% 55.81% 37.67% 43.72% 60.93% 44.19%
Europe 79.44% 60.63% 47.74% 53.31% 71.78% 57.84%
Asia 87.39% 69.37% 58.56% 73.87% 79.28% 72.07%
complete sample 84.18% 60.52% 46.17% 53.67% 69.33% 55.63%
top score ratings (scores 4 &5) per group
the provision of information through different channels. They rate all aspects
above the average with regard to the complete sample.
Table 20: Distribution of top score ratings (communication aspects) by
exhibitors’ origin (1)
Based on: Survey results
Furthermore, Asian and European exhibitors expect the service provider to
ensure the regular contact between supplier and customer. Each group ranks this
communication factor above the sample average. For German exhibitors, this
factor is less important.
Another difference can be detected regarding the public interest of the service
supplier. Asian exhibitors treasure public engagement of the supplier more than
the other two groups. However, in the general perspective, this aspect has been
rated rather low all together compared to the other aspects. The German
exhibitors in contrary to the foreign exhibitors see a bigger impact on the
suppliers’ readiness to act if necessary in order to build a trustful business
relationship. For them, this aspect is most important with top-scores by over 90%
of the subsample. The table below displays the findings and offers the numeric
comparison of the results.
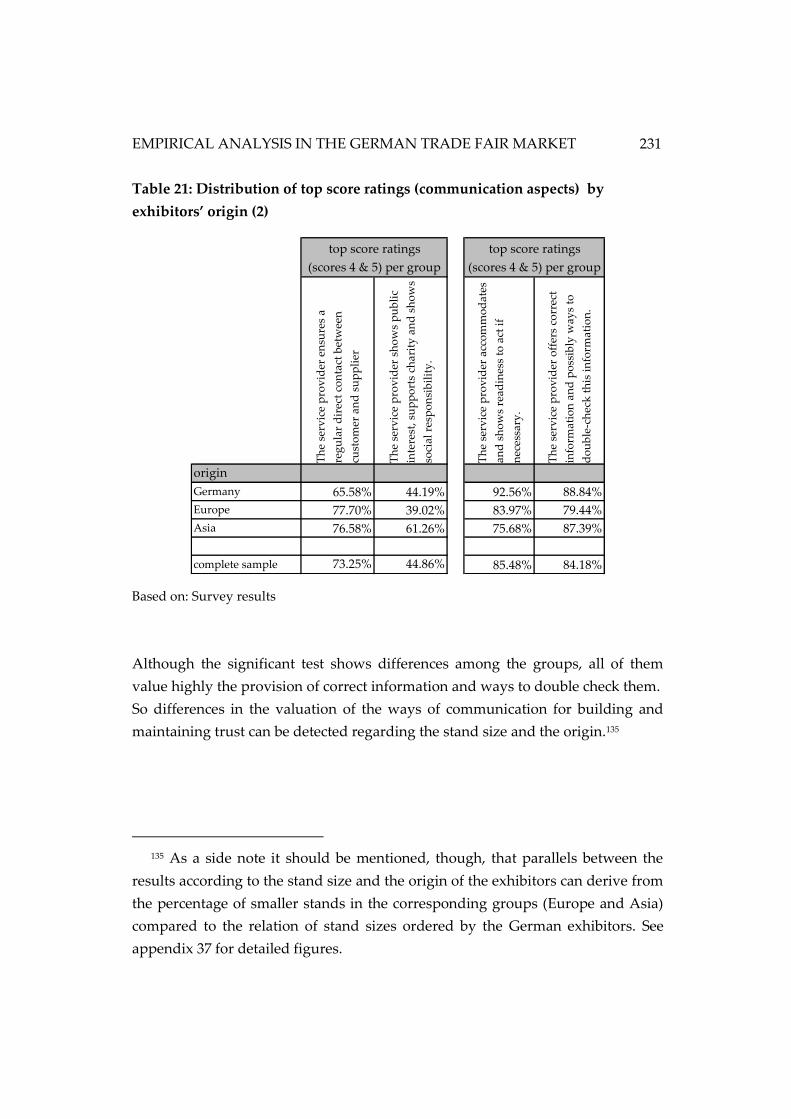
EMPIRICAL ANALYSIS IN THE GERMAN TRADE FAIR MARKET
231
Th
e se
rvic
e p
rov
ider
en
sure
s a
reg
ula
r d
irec
t co
nta
ct b
etw
een
cust
om
er a
nd
su
pp
lier
Th
e se
rvic
e p
rov
ider
sh
ow
s p
ub
lic
inte
rest
, su
pp
ort
s ch
arit
y a
nd
sh
ow
s
soci
al
resp
on
sib
ilit
y.
Th
e se
rvic
e p
rov
ider
acc
om
mo
da
tes
and
sh
ow
s re
ad
ines
s to
act
if
nec
essa
ry.
Th
e se
rvic
e p
rov
ider
off
ers
corr
ect
info
rmat
ion
an
d p
oss
ibly
way
s to
do
ub
le-c
hec
k t
his
in
form
atio
n.
origin
Germany 65.58% 44.19% 92.56% 88.84%
Europe 77.70% 39.02% 83.97% 79.44%
Asia 76.58% 61.26% 75.68% 87.39%
complete sample 73.25% 44.86% 85.48% 84.18%
top score ratings
(scores 4 & 5) per group
top score ratings
(scores 4 & 5) per group
Table 21: Distribution of top score ratings (communication aspects) by
exhibitors’ origin (2)
Based on: Survey results
Although the significant test shows differences among the groups, all of them
value highly the provision of correct information and ways to double check them.
So differences in the valuation of the ways of communication for building and
maintaining trust can be detected regarding the stand size and the origin.135
135 As a side note it should be mentioned, though, that parallels between the
results according to the stand size and the origin of the exhibitors can derive from
the percentage of smaller stands in the corresponding groups (Europe and Asia)
compared to the relation of stand sizes ordered by the German exhibitors. See
appendix 37 for detailed figures.
MAIKE U. BUSCH 232
5.2.4 Buying center analysis for the medical industry
Although the buying center analysis does not have any value in testing the
hypotheses, it is carried out in this research project. The literature review in
chapter 2.2 on the marketing in business markets stressed the importance of this
analysis in order to sell goods in business markets. Therefore, taking the distinct
characteristics of business markets and the actors in the markets into account
might support the building and maintaining of trustful business relationships for
selling services to business customers. The buying center analysis helps to secure
a purposeful marketing.
As expounded in chapter 2.2, the purchasing decisions in business-to-business
markets are taken differently from the purchasing process on consumers markets.
The buyer is the company, therefore, not (only) the personal penchants of a single
person are important but the buying center of the potential customer has to be
considered as customer. The members of the buying center generally act with
regard to the company’s meaning their employer’s benefit. However, these
members are also still independent human beings with different roles, functions,
concernment, experience and cultural backgrounds. In order to address the
buying center in an efficient way, it needs to be analyzed with its members in
charge of buying or otherwise relevant for the selling company. 136
In addition, the question arises whether clusters within the target group can be
formed. Is there a structure within the customers’ buying centers to be detected in
order to optimize the sales approach, meaning the supplier’s communication
towards his (potential) customers? Forming groups and clusters is “one of the most
basic abilities of living creatures” (Everitt 2011, pp. 1–2), so considering the trust
building communication items again, statistical test are to be performed to find
clues and details of possible clusters for a more pinpointed communication.
136 See chapter 2.2.2.
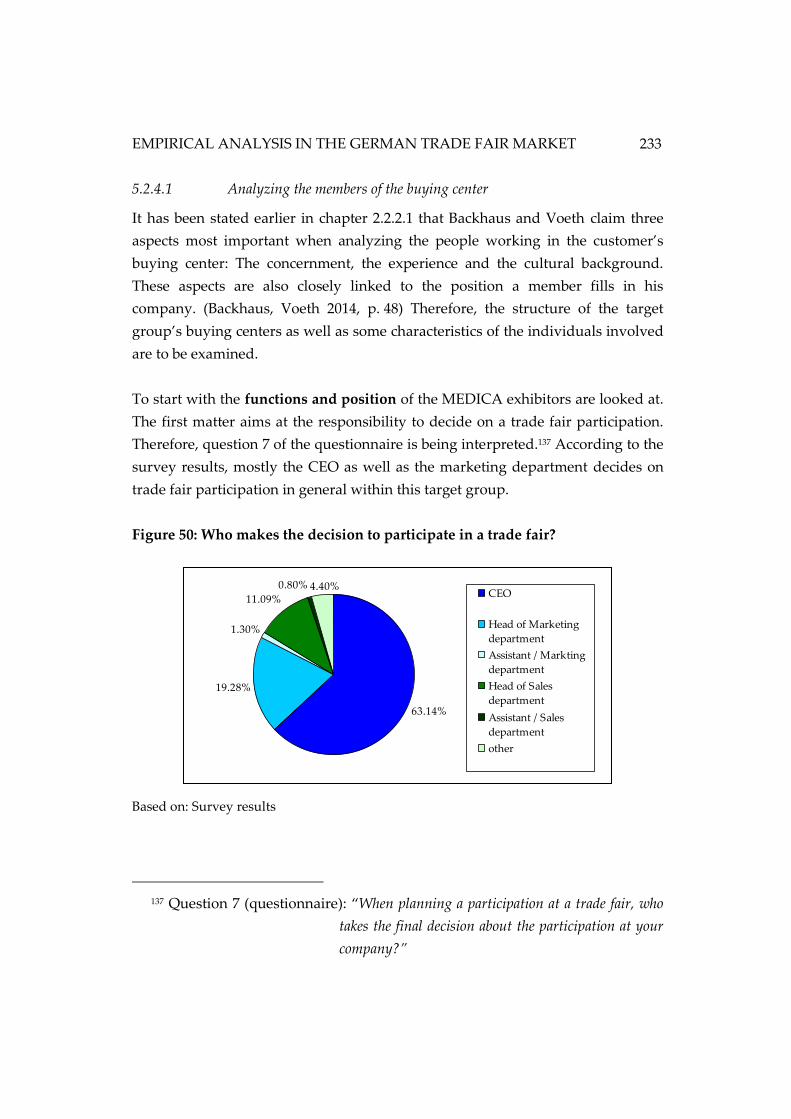
EMPIRICAL ANALYSIS IN THE GERMAN TRADE FAIR MARKET
233
5.2.4.1 Analyzing the members of the buying center
It has been stated earlier in chapter 2.2.2.1 that Backhaus and Voeth claim three
aspects most important when analyzing the people working in the customer’s
buying center: The concernment, the experience and the cultural background.
These aspects are also closely linked to the position a member fills in his
company. (Backhaus, Voeth 2014, p. 48) Therefore, the structure of the target
group’s buying centers as well as some characteristics of the individuals involved
are to be examined.
To start with the functions and position of the MEDICA exhibitors are looked at.
The first matter aims at the responsibility to decide on a trade fair participation.
Therefore, question 7 of the questionnaire is being interpreted.137 According to the
survey results, mostly the CEO as well as the marketing department decides on
trade fair participation in general within this target group.
Figure 50: Who makes the decision to participate in a trade fair?
Based on: Survey results
137 Question 7 (questionnaire): “When planning a participation at a trade fair, who
takes the final decision about the participation at your
company?”
63.14%
19.28%
1.30%
11.09%
0.80% 4.40%CEO
Head of Marketing
department
Assistant / Markting
department
Head of Sales
department
Assistant / Sales
department
other
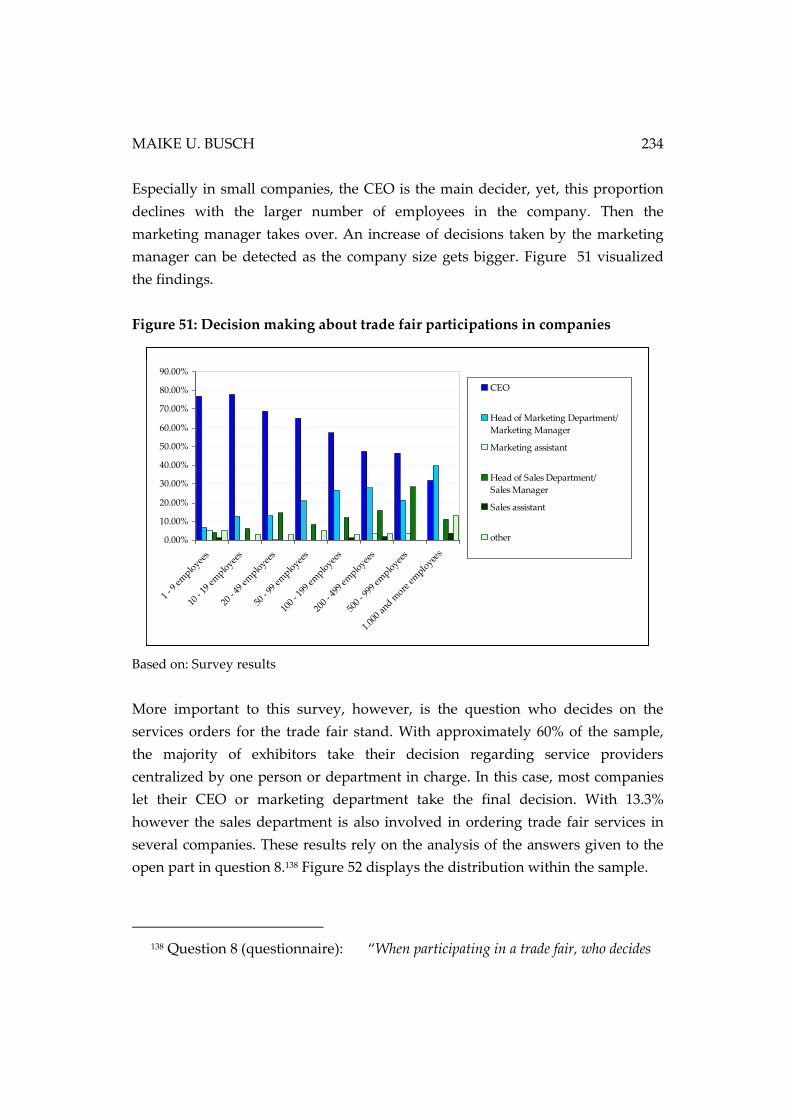
MAIKE U. BUSCH 234
Especially in small companies, the CEO is the main decider, yet, this proportion
declines with the larger number of employees in the company. Then the
marketing manager takes over. An increase of decisions taken by the marketing
manager can be detected as the company size gets bigger. Figure 51 visualized
the findings.
Figure 51: Decision making about trade fair participations in companies
Based on: Survey results
More important to this survey, however, is the question who decides on the
services orders for the trade fair stand. With approximately 60% of the sample,
the majority of exhibitors take their decision regarding service providers
centralized by one person or department in charge. In this case, most companies
let their CEO or marketing department take the final decision. With 13.3%
however the sales department is also involved in ordering trade fair services in
several companies. These results rely on the analysis of the answers given to the
open part in question 8.138 Figure 52 displays the distribution within the sample.
138 Question 8 (questionnaire): “When participating in a trade fair, who decides
0.00%
10.00%
20.00%
30.00%
40.00%
50.00%
60.00%
70.00%
80.00%
90.00%
1 - 9
em
ployee
s
10 -
19 e
mplo
yees
20 -
49 e
mplo
yees
50 -
99 e
mplo
yees
100
- 199
em
ployee
s
200
- 499
em
ployee
s
500
- 999
em
ployee
s
1.00
0 an
d more
em
ployee
s
CEO
Head of Marketing Department/
Marketing Manager
Marketing assistant
Head of Sales Department/
Sales Manager
Sales assistant
other
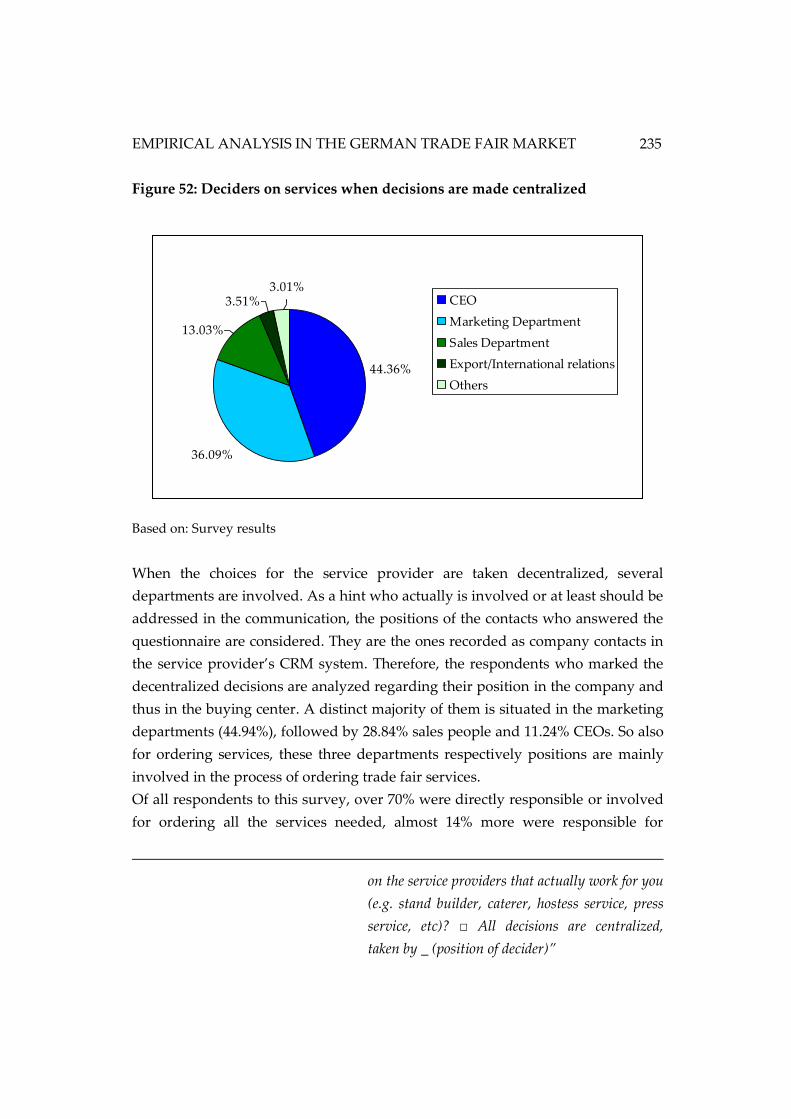
EMPIRICAL ANALYSIS IN THE GERMAN TRADE FAIR MARKET
235
Figure 52: Deciders on services when decisions are made centralized
Based on: Survey results
When the choices for the service provider are taken decentralized, several
departments are involved. As a hint who actually is involved or at least should be
addressed in the communication, the positions of the contacts who answered the
questionnaire are considered. They are the ones recorded as company contacts in
the service provider’s CRM system. Therefore, the respondents who marked the
decentralized decisions are analyzed regarding their position in the company and
thus in the buying center. A distinct majority of them is situated in the marketing
departments (44.94%), followed by 28.84% sales people and 11.24% CEOs. So also
for ordering services, these three departments respectively positions are mainly
involved in the process of ordering trade fair services.
Of all respondents to this survey, over 70% were directly responsible or involved
for ordering all the services needed, almost 14% more were responsible for
on the service providers that actually work for you
(e.g. stand builder, caterer, hostess service, press
service, etc)? □ All decisions are centralized,
taken by _ (position of decider)”
44.36%
36.09%
13.03%
3.51%3.01%
CEO
Marketing Department
Sales Department
Export/International relations
Others
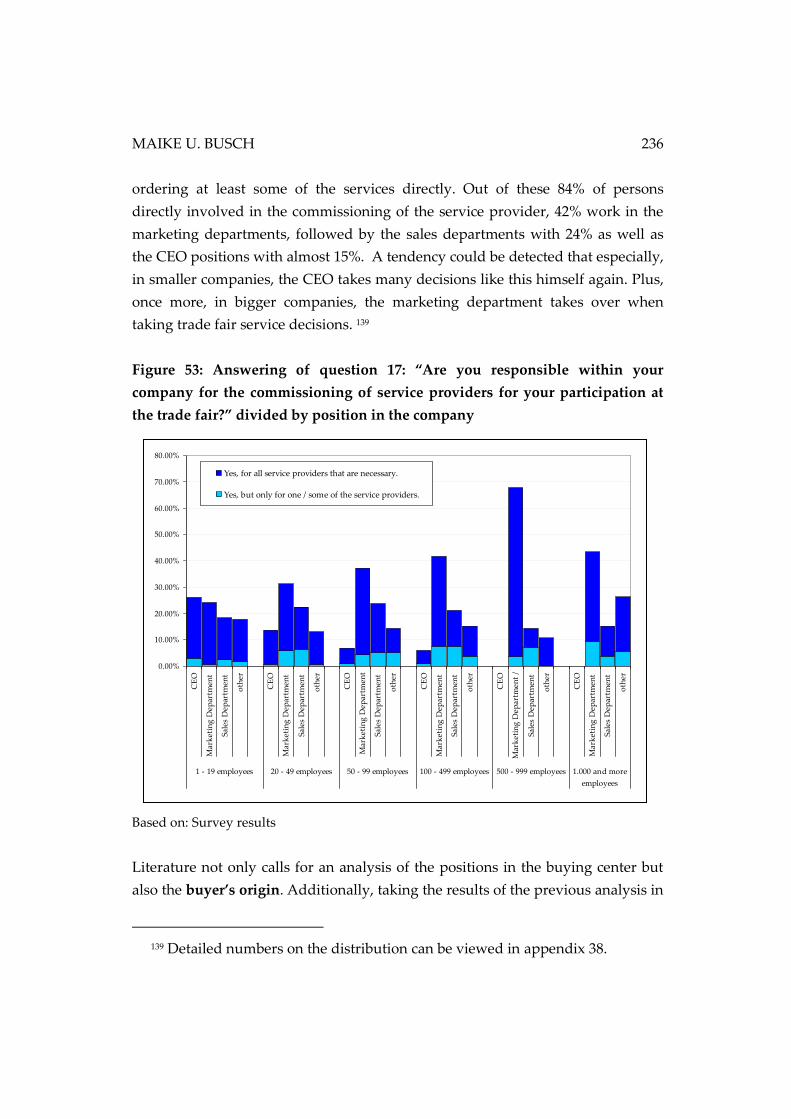
MAIKE U. BUSCH 236
ordering at least some of the services directly. Out of these 84% of persons
directly involved in the commissioning of the service provider, 42% work in the
marketing departments, followed by the sales departments with 24% as well as
the CEO positions with almost 15%. A tendency could be detected that especially,
in smaller companies, the CEO takes many decisions like this himself again. Plus,
once more, in bigger companies, the marketing department takes over when
taking trade fair service decisions. 139
Figure 53: Answering of question 17: “Are you responsible within your
company for the commissioning of service providers for your participation at
the trade fair?” divided by position in the company
Based on: Survey results
Literature not only calls for an analysis of the positions in the buying center but
also the buyer’s origin. Additionally, taking the results of the previous analysis in
139 Detailed numbers on the distribution can be viewed in appendix 38.
0.00%
10.00%
20.00%
30.00%
40.00%
50.00%
60.00%
70.00%
80.00%
CE
O
Mar
ket
ing
Dep
artm
ent
Sale
s D
epar
tmen
t
oth
er
CE
O
Mar
ket
ing
Dep
artm
ent
Sale
s D
epar
tmen
t
oth
er
CE
O
Mar
ket
ing
Dep
artm
ent
Sale
s D
epar
tmen
t
oth
er
CE
O
Mar
ket
ing
Dep
artm
ent
Sale
s D
epar
tmen
t
oth
er
CE
O
Mar
ket
ing
Dep
artm
ent
/
Sale
s D
epar
tmen
t
oth
er
CE
O
Mar
ket
ing
Dep
artm
ent
Sale
s D
epar
tmen
t
oth
er
1 - 19 employees 20 - 49 employees 50 - 99 employees 100 - 499 employees 500 - 999 employees 1.000 and more
employees
Yes, for all service providers that are necessary.
Yes, but only for one / some of the service providers.
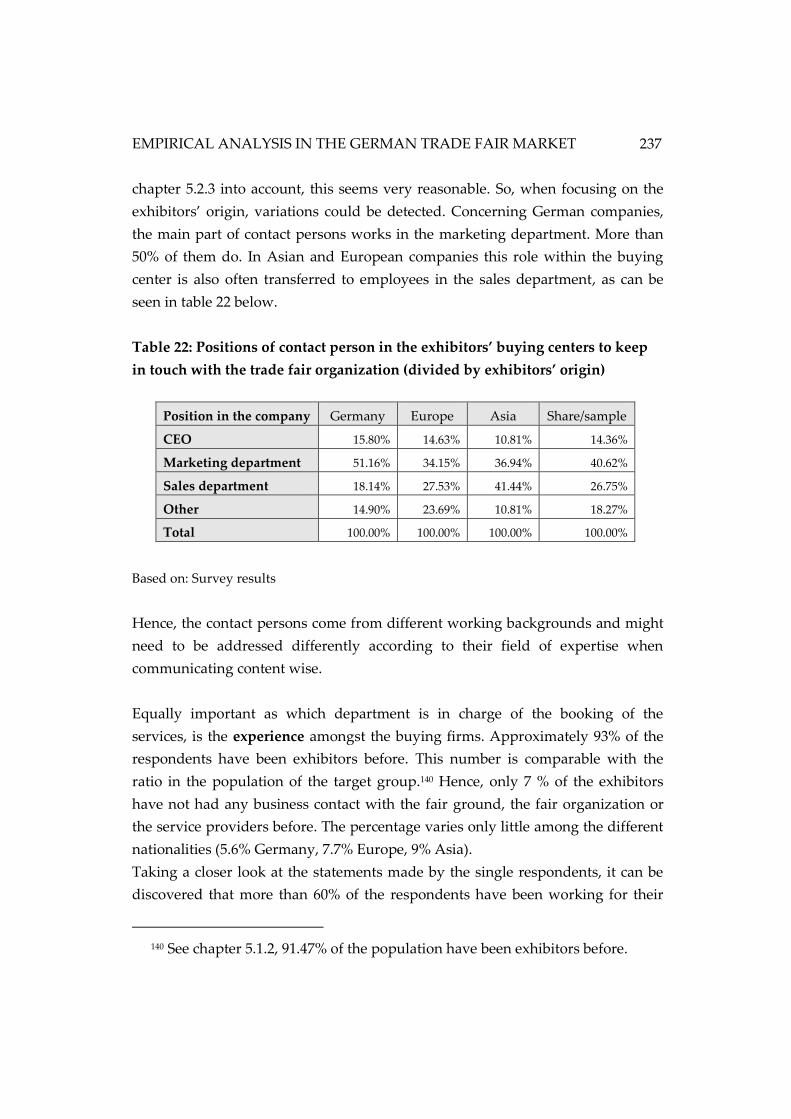
EMPIRICAL ANALYSIS IN THE GERMAN TRADE FAIR MARKET
237
chapter 5.2.3 into account, this seems very reasonable. So, when focusing on the
exhibitors’ origin, variations could be detected. Concerning German companies,
the main part of contact persons works in the marketing department. More than
50% of them do. In Asian and European companies this role within the buying
center is also often transferred to employees in the sales department, as can be
seen in table 22 below.
Table 22: Positions of contact person in the exhibitors’ buying centers to keep
in touch with the trade fair organization (divided by exhibitors’ origin)
Position in the company Germany Europe Asia Share/sample
CEO 15.80% 14.63% 10.81% 14.36%
Marketing department 51.16% 34.15% 36.94% 40.62%
Sales department 18.14% 27.53% 41.44% 26.75%
Other 14.90% 23.69% 10.81% 18.27%
Total 100.00% 100.00% 100.00% 100.00%
Based on: Survey results
Hence, the contact persons come from different working backgrounds and might
need to be addressed differently according to their field of expertise when
communicating content wise.
Equally important as which department is in charge of the booking of the
services, is the experience amongst the buying firms. Approximately 93% of the
respondents have been exhibitors before. This number is comparable with the
ratio in the population of the target group.140 Hence, only 7 % of the exhibitors
have not had any business contact with the fair ground, the fair organization or
the service providers before. The percentage varies only little among the different
nationalities (5.6% Germany, 7.7% Europe, 9% Asia).
Taking a closer look at the statements made by the single respondents, it can be
discovered that more than 60% of the respondents have been working for their
140 See chapter 5.1.2, 91.47% of the population have been exhibitors before.
MAIKE U. BUSCH 238
companies more than six years. Only a small proportion is new to their
companies (6%). This might be viewed as an indicator for the personal work
experiences. If doing so, the majority of the target group could be considered at
least somewhat experienced in their fields. Taking a deeper look into the different
origins again, the results hardly change. There is a small tendency for German
exhibitors to be the longest in their companies, declining slightly when looking at
Europe and then again at Asia.141 Thus, mainly the services are presumely sold to
experienced customers. However, a smaller percentage is new to their companies
and has no relationship to the trade fair organizers yet. As seen in the literature
research before, these customers might need more general information at first
while experiences customers seek for more specialized information.142
In addition, this results in the fact that for many customers, the ordering of the
services for the trade fair turns into a re-buy situation when considering the
buying techniques of the buying center. As the purpose of trade fairs is to present
and demonstrate new goods and as the exhibitors have to be worth seen by the
potential trade fair visitors, exhibitors tend to renew their presentation at the
exhibition each cycle. (Doyle 2011, pp. 160–161) Therefore, most of the time, the
ordering of the services can be considered a modified re-buy. The basic task of the
buying situation is still similar to the previous purchasing situation.143
Summarizing the first facts on the MEDICA exhibitors’ buying centers, the CEOs
mainly take the decisions to participate in a trade fair. Additional 13% of the
companies have their trade fair responsible in the sales department. There is a
shift from the CEO to the marketing department as decision taker once the
company size gets bigger. When ordering services, however, especially the
marketing departments get involved and take over in many companies.
Experience-wise, the target group consists mainly of experienced exhibitors. The
majority has been exhibitor at the MEDICA before and therefore knows the
141 See appendix 39.
142 See chapter 2.2.2.1. 143 See chapter 2.2.2.2.
EMPIRICAL ANALYSIS IN THE GERMAN TRADE FAIR MARKET
239
organization and the organizers. Only about 6% of the respondents are new to
their companies as employees. This could demonstrate a rather high level of
experience within the target group.
With reference to the cultural heritage, mainly the marketing departments are in
charge of organizing services for trade fairs. However, there is a tendency of
foreign exhibitors to have the trade fairs also organized through the sales
departments. Regarding the experience factor all geographical areas in focus
display similar results.
5.2.4.2 Determining buying center clusters for communication approaches
In a second step, the buying center is to by analyzed regarding trust building
determinants and the most effective communication methods. The main focus is
still to build and maintain trust between the principal and his agent. Yet, now the
buying center structure is to be considered as well and a connection between the
buying center structure and the trust building communication items is
investigated. Thus, the aim is to discover, whether clusters for the sales approach
can be formed among the exhibiting companies. Therefore, the first attempt is to
reduce the amount of single communication items by combining them to possible
factors based on the ratings of the sample. This can be carried out by using an
exploratory factor analysis. In a second step, a cluster analysis is performed to
find out whether clusters of exhibitor groups according to the discovered factors
can be structured and used for the practical implementation. Both analyses are
briefly explained in the following.
So, before a statistical cluster analysis is performed, an exploratory factor
analysis can be carried out. The main goal of the application of the (explorative)
factor analysis is to reduce the number of variables by finding factors which
connect a number of single variables for further investigation. The reduced
number of factors is supposed to make the analysis more manageable and
interpretable. (Bühl 2009, p. 556) This multivariate method of analysis (Überla
1971, p. 81) is commonly used for this purpose of data reduction. (Backhaus et al.
2000, p. 253; Kuß et al. 2014, p. 268; Bühl 2010, p. 556)
MAIKE U. BUSCH 240
The cluster analysis forms groups within a sample based on given variables.
(Bühl 2009, p. 593) The main goal is to form the clusters in away that they are
highly homogeneous inside one cluster and of great difference in comparison to
each other. (Bortz, Schuster 2010, p. 453) However, there is not only one way to
perform a cluster analysis, instead it is a generic term which combines several
methods to form clusters. Based on the statistical data at hand the researcher has
to decide on a suitable method. (Schendera 2008, pp. 8-10)
The clusters in this project are to be shaped regarding the communication items
that can ensure trust between the seller and the buyer of services for trade fairs.
Therefore, the aspects rated in question 6144 are of interest. However, the list of
aspects in question 6 contains 13 items. This is a rather large number to divide the
sample into clusters by. Thus, the exploratory factor analysis is carried out in
advance to reduce this number.
Before the exploratory factor analysis is carried out minor adaptations are made
to the raw data: The respondents had the possibility to mark a variable with ‘no
opinion’. These values are filtered and exchanged with the symbol for missing
values. In return, SPSS, the statistical program used for the examination, receives
the command to replace the missing values by the average mean so that the
results are not miscalculated or misinterpreted. (Bühl 2010, p. 556)
The factor analysis starts with the Kaiser-Meyer-Olkin measure of sampling
adequacy.145 The test calculation shows the value of 0.907 as result.
144 Question 6 (questionnaire): “When getting in touch with a potential service
supplier, which aspects – besides prices and discounts -
are most important for you in order to consider the
supplier for further business?”
145 It can be used to test whether a factor analysis is reasonable with the given
variables in focus or not. It measures the connecting between the variables (based
on the proportion of variance). (Backhaus et al. 2011, p. 342; Rasli 2006, pp. 14–15)
According to Backhaus et al. (2011, p. 342) it is recommended to carry out this
analysis before starting the factor analysis in detail because it is known as the best
methods in practice to evaluate the value of a following factor analysis based on
the correlation values.
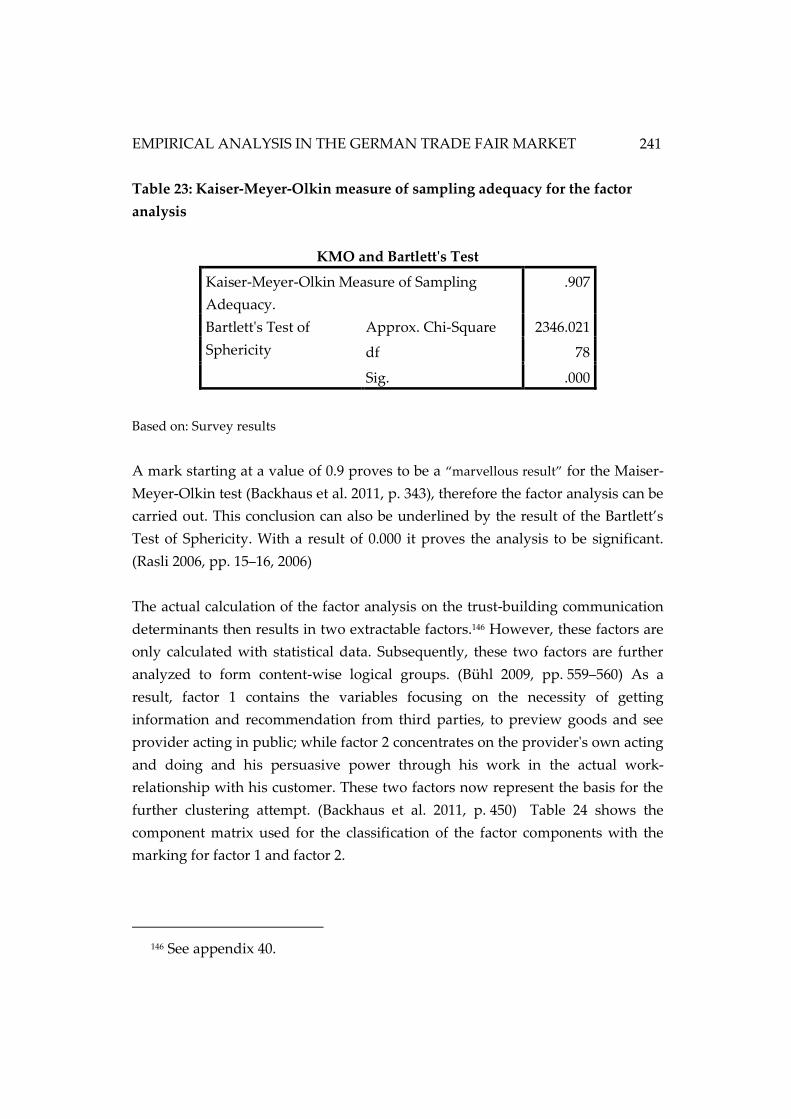
EMPIRICAL ANALYSIS IN THE GERMAN TRADE FAIR MARKET
241
Table 23: Kaiser-Meyer-Olkin measure of sampling adequacy for the factor
analysis
KMO and Bartlett's Test
Kaiser-Meyer-Olkin Measure of Sampling
Adequacy.
.907
Bartlett's Test of
Sphericity
Approx. Chi-Square 2346.021
df 78
Sig. .000
Based on: Survey results
A mark starting at a value of 0.9 proves to be a “marvellous result” for the Maiser-
Meyer-Olkin test (Backhaus et al. 2011, p. 343), therefore the factor analysis can be
carried out. This conclusion can also be underlined by the result of the Bartlett’s
Test of Sphericity. With a result of 0.000 it proves the analysis to be significant.
(Rasli 2006, pp. 15–16, 2006)
The actual calculation of the factor analysis on the trust-building communication
determinants then results in two extractable factors.146 However, these factors are
only calculated with statistical data. Subsequently, these two factors are further
analyzed to form content-wise logical groups. (Bühl 2009, pp. 559–560) As a
result, factor 1 contains the variables focusing on the necessity of getting
information and recommendation from third parties, to preview goods and see
provider acting in public; while factor 2 concentrates on the provider's own acting
and doing and his persuasive power through his work in the actual work-
relationship with his customer. These two factors now represent the basis for the
further clustering attempt. (Backhaus et al. 2011, p. 450) Table 24 shows the
component matrix used for the classification of the factor components with the
marking for factor 1 and factor 2.
146 See appendix 40.
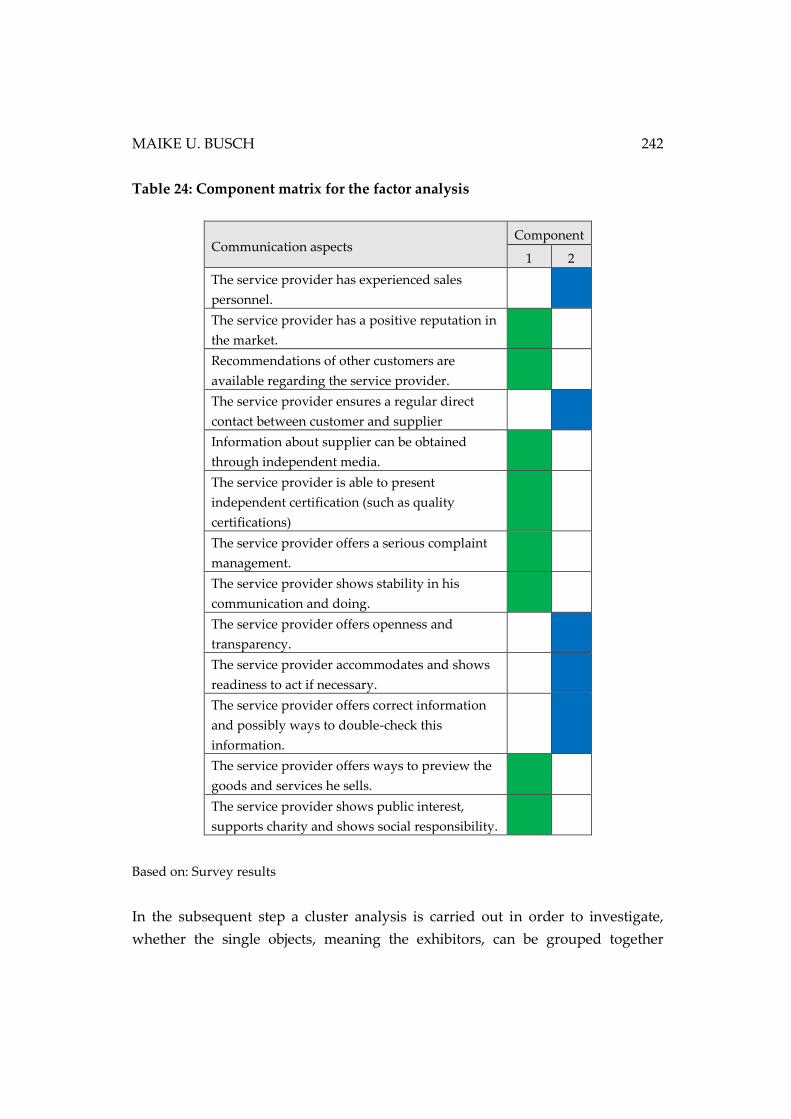
MAIKE U. BUSCH 242
Table 24: Component matrix for the factor analysis
Communication aspects Component
1 2
The service provider has experienced sales
personnel.
The service provider has a positive reputation in
the market.
Recommendations of other customers are
available regarding the service provider.
The service provider ensures a regular direct
contact between customer and supplier
Information about supplier can be obtained
through independent media.
The service provider is able to present
independent certification (such as quality
certifications)
The service provider offers a serious complaint
management.
The service provider shows stability in his
communication and doing.
The service provider offers openness and
transparency.
The service provider accommodates and shows
readiness to act if necessary.
The service provider offers correct information
and possibly ways to double-check this
information.
The service provider offers ways to preview the
goods and services he sells.
The service provider shows public interest,
supports charity and shows social responsibility.
Based on: Survey results
In the subsequent step a cluster analysis is carried out in order to investigate,
whether the single objects, meaning the exhibitors, can be grouped together
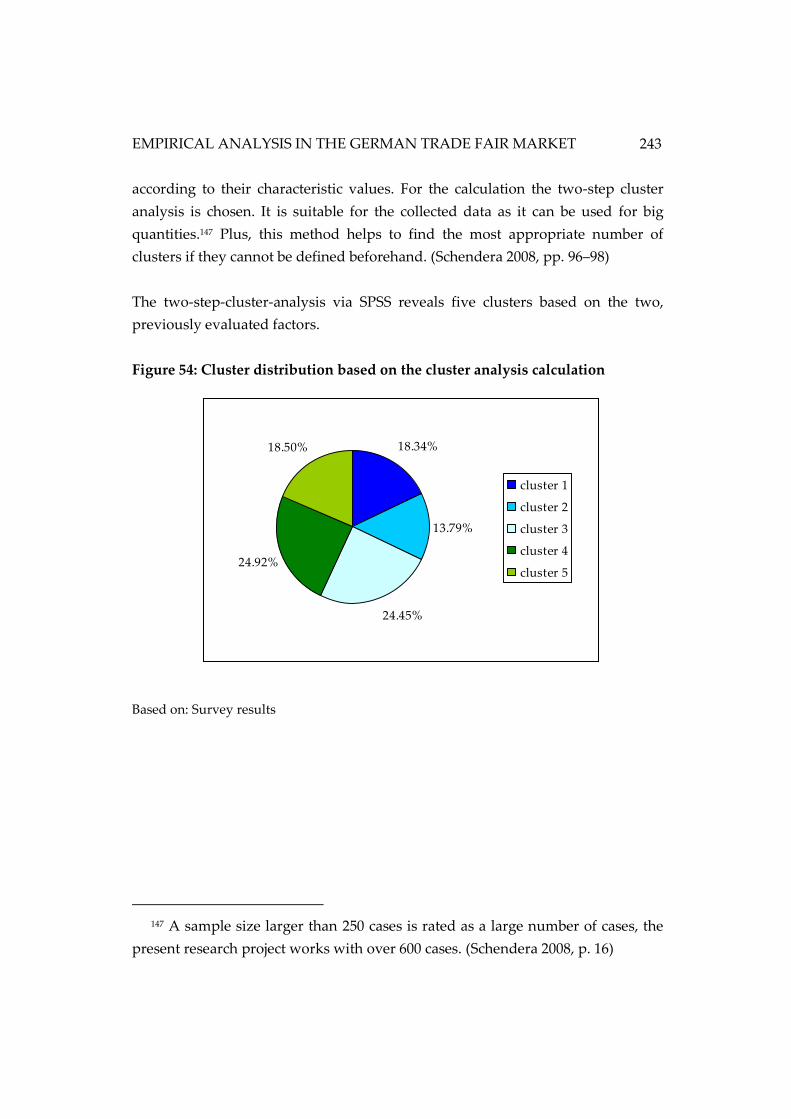
EMPIRICAL ANALYSIS IN THE GERMAN TRADE FAIR MARKET
243
according to their characteristic values. For the calculation the two-step cluster
analysis is chosen. It is suitable for the collected data as it can be used for big
quantities.147 Plus, this method helps to find the most appropriate number of
clusters if they cannot be defined beforehand. (Schendera 2008, pp. 96–98)
The two-step-cluster-analysis via SPSS reveals five clusters based on the two,
previously evaluated factors.
Figure 54: Cluster distribution based on the cluster analysis calculation
Based on: Survey results
147 A sample size larger than 250 cases is rated as a large number of cases, the
present research project works with over 600 cases. (Schendera 2008, p. 16)
18.34%
13.79%
24.45%
24.92%
18.50%
cluster 1
cluster 2
cluster 3
cluster 4
cluster 5
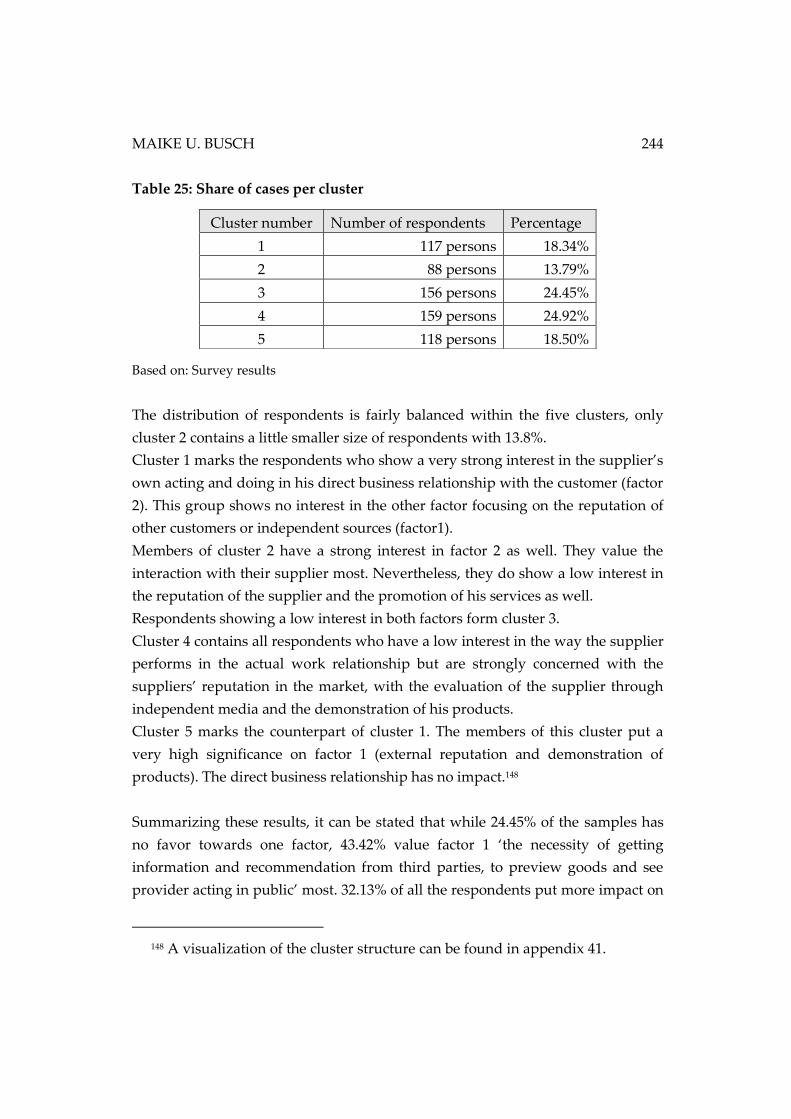
MAIKE U. BUSCH 244
Table 25: Share of cases per cluster
Based on: Survey results
The distribution of respondents is fairly balanced within the five clusters, only
cluster 2 contains a little smaller size of respondents with 13.8%.
Cluster 1 marks the respondents who show a very strong interest in the supplier’s
own acting and doing in his direct business relationship with the customer (factor
2). This group shows no interest in the other factor focusing on the reputation of
other customers or independent sources (factor1).
Members of cluster 2 have a strong interest in factor 2 as well. They value the
interaction with their supplier most. Nevertheless, they do show a low interest in
the reputation of the supplier and the promotion of his services as well.
Respondents showing a low interest in both factors form cluster 3.
Cluster 4 contains all respondents who have a low interest in the way the supplier
performs in the actual work relationship but are strongly concerned with the
suppliers’ reputation in the market, with the evaluation of the supplier through
independent media and the demonstration of his products.
Cluster 5 marks the counterpart of cluster 1. The members of this cluster put a
very high significance on factor 1 (external reputation and demonstration of
products). The direct business relationship has no impact.148
Summarizing these results, it can be stated that while 24.45% of the samples has
no favor towards one factor, 43.42% value factor 1 ‘the necessity of getting
information and recommendation from third parties, to preview goods and see
provider acting in public’ most. 32.13% of all the respondents put more impact on
148 A visualization of the cluster structure can be found in appendix 41.
Cluster number Number of respondents Percentage
1 117 persons 18.34%
2 88 persons 13.79%
3 156 persons 24.45%
4 159 persons 24.92%
5 118 persons 18.50%
EMPIRICAL ANALYSIS IN THE GERMAN TRADE FAIR MARKET
245
factor 2, meaning they concentrate more on the provider's own acting and doing
and his persuasive power through his work in the actual work relationship with
his customer.
In order to use these results in the communication within the sales approach, the
supplier needs to find out whether a structure in relation to the buying center
structure can be detected inside these clusters. Therefore, the five clusters are
hence subject to a deeper analysis according to buying center aspects which can
be revealed through the questionnaires based again on the aspects: expertise,
function and cultural background as earlier mentioned in chapter 2.2.2.1.
However, after analyzing the clusters no clear structure among the members of
the clusters could be found, except for the cultural relations which have already
been discovered. Additionally, there are only some tendencies:
• Rather new employees to the exhibiting companies tend to favor external
information of the market and independent media (factor 1).
• It seems that representatives of the sales departments generally have a higher
interest in aspects belonging to factor 1 as well. The marketing department in
general, on the other hand, shows a higher attraction to factor 2, getting their
own picture about the expertise of the supplier in an actual work relationship.
• Most decisions concerning the trade fair participation and the service orders
are taken by the CEO and the marketing departments, as already discovered
in the previous chapters. In all clusters, 70-80% of the decision-takers are
CEOs or marketing representatives. So there is no diversification among the
clusters in this respect.
• Only the cultural aspect leads to a possible differentiation: German exhibitors
put a higher value on factor 2 while Asian and European exhibitors are more
attracted by the items of factor 1.
Yet, as mentioned before, these are only tendencies.
Concluding the chapter on the buying center structures among the medical
industry, some results can be stated. First of all, mainly the CEO takes the
decisions on participations in a trade fair, followed by the marketing manager.
When it comes to deciding on services needed to perform the trade fair
MAIKE U. BUSCH 246
participation and prepare the booth, in many cases the marketing department
takes over the responsibilities from the CEO. The distribution of responsible
contacts shifts, therefore, in favor of the marketing department. Yet, in a part of
the companies, also the sales departments get involved here. This mainly happens
in European and Asian companies, not so much in German companies. Here, the
marketing department is primarily in charge of ordering services.
Regarding experiences, the target group is fairly homogeneous. The vast majority
has already participated in trade fairs before. Even the direct contacts for the
service department of the trade fair organization are mostly not new to their
companies. The buying technique used by most exhibitors is, thus, a modified re-
buy. Only the operative set-up, such as the layout of the booth, gets adjusted to
the current conditions. Thus, within the medical industry, the trade fair
organizations are working with experienced clientele.
In order to reduce the complexity of the trust-building communication
approaches, the number of communication aspects could be minimized to two
major factors relevant in the target group. One group focuses more on the
necessity of getting information and recommendation from third parties, to
preview goods and see provider acting in public. The second group concentrates
on the provider's own acting and doing and his persuasive power through his
work in the actual work relationship with his customer. While these two factors
could be fairly useful for the creation of marketing plans, the cluster analysis did
not proof distinct results regarding exhibitor characteristics within each cluster.
Only some tendencies could be retrieved for indications.
5.2.5 Transferability of survey results to other industries
The literature review on trust research has already determined the necessity to
examine trust building determinants as well as communication aspects to build
and maintain trust between a service supplier and his customer per industry.149
The trade fair industry, however, is very diverse regarding its customers.150 Thus,
149 See chapter 2.4.6.
150 See chapter 3.2.

EMPIRICAL ANALYSIS IN THE GERMAN TRADE FAIR MARKET
247
depending on the trade fair in focus, one industry uses the fairground as market
place. Therefore, it can be assumed that the research, which has exemplary been
performed on the global medical industry, needs to be performed per exhibition
target group focusing on it particular exhibitors.
In order to examine the transferability of the present research results and the
method of research, the primary survey has been conducted for a second target
group. The second industry of research interest, is the industry for glass
production, glass processing and glass products. This industry meets in a biennial
cycle at the trade fair ‘glasstec’ in Düsseldorf, Germany. This exhibition has been
chosen for various (practical) reasons. To begin with, the trade fair is in many
aspects different to the MEDICA: The exhibition is much smaller than the
MEDICA, it is a completely different industry, and it has a different trade fair
cycle. Nevertheless, it is also a trade fair taking place at one of the leading
German fairgrounds. Moreover, it is the leading international trade fair for its
industry. In addition, a practical reason has been the possibility of reaching the
target group in the same time frame as the previous group. (Messe Düsseldorf
GmbH 2015b; Biedermann et al. 2012)
The same analysis as for the MEDICA trade fair is performed for the glasstec. The
equal questionnaire and letters are used with only minor adaptations regarding
the wording.151 Subsequently, the results of the glasstec survey will be presented
and comparisons to the research results within the medical industry will be made.
However, due to the fact that the focus of this paper is set exemplarily on the
medical industry, the results of the glass industry are presented in a compressed
way. The main purpose is to test a possible transferability of the main results
between industries.
The response rate for the survey within the global glass industry amounts to over
20% of the addressed exhibitors. 936 main exhibitors were addressed with the
survey by email, and 194 responded. In order to verify the usefulness of the
sample regarding its validity, the Chi-sqaure goodness-of-fit test152 is carried out
151 See appendix 42 and appendix 43.
152 See chapter 5.1.4
MAIKE U. BUSCH 248
once more for each subsample based on the defined characteristics (exhibitor
status, stand size, origin). The test depicts differences in the distributions of the
sample compared to the population regarding the exhibitor status and the stand
size. Therefore, the sample does not show a statistically correct reduced image of
the population in these respects. Thus, results taken from these subgroups might
not be representative for the whole population. Only tendencies can be given.
Regarding the origin, however, the sample matches the distribution of the whole
population statistically. Therefore, conclusions taken from the analysis based on
the exhibitors’ origin can be transferred to the whole target group.153
General results of the survey (focus on complete sample)
Before the actual testing of the hypothesis, the answers of the complete sample
are viewed, just as it has been performed for the MEDICA sample. First, the trust
determinands are in focus. Regarding the trust determinants which seem
important to the target group, it can be said, that the following aspects are most
relevant to the target group in order to build and maintain trust in a business
relationship with a service supplier:
• Ability of the supplier to realize the customers wishes (expertise)
• Communication between customer and supplier
• Honesty
• Reliability
In each case, over 90% of the sample marked the top boxes of importance in the
questionnaire. These results go in line with the results given by the MEDICA
exhibitors. The following table illustrates the results of the MEDICA respondents
compared to the glasstec respondents. The percentages given represent the share
of exhibitors who gave the corresponding aspect an importance value of 4 or 5
(meaning important or very important) in the questionnaire.
153 See appendix 44.
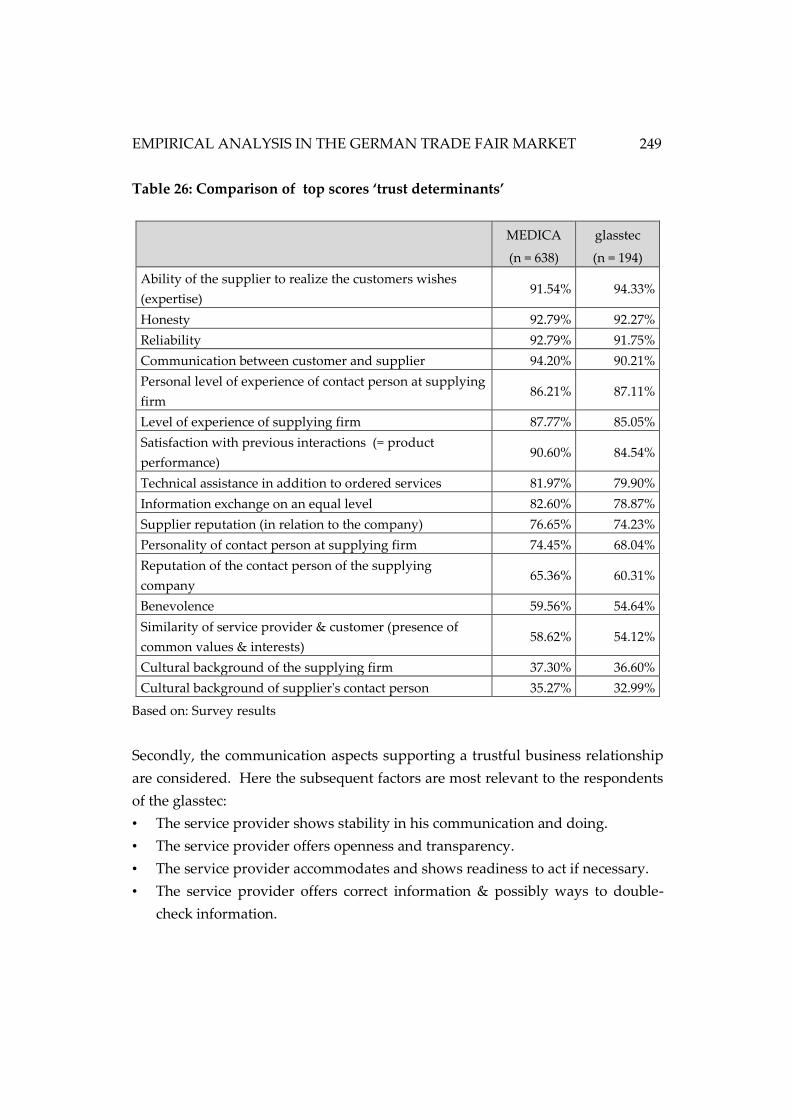
EMPIRICAL ANALYSIS IN THE GERMAN TRADE FAIR MARKET
249
Table 26: Comparison of top scores ‘trust determinants’
MEDICA
(n = 638)
glasstec
(n = 194)
Ability of the supplier to realize the customers wishes
(expertise) 91.54% 94.33%
Honesty 92.79% 92.27%
Reliability 92.79% 91.75%
Communication between customer and supplier 94.20% 90.21%
Personal level of experience of contact person at supplying
firm 86.21% 87.11%
Level of experience of supplying firm 87.77% 85.05%
Satisfaction with previous interactions (= product
performance) 90.60% 84.54%
Technical assistance in addition to ordered services 81.97% 79.90%
Information exchange on an equal level 82.60% 78.87%
Supplier reputation (in relation to the company) 76.65% 74.23%
Personality of contact person at supplying firm 74.45% 68.04%
Reputation of the contact person of the supplying
company 65.36% 60.31%
Benevolence 59.56% 54.64%
Similarity of service provider & customer (presence of
common values & interests) 58.62% 54.12%
Cultural background of the supplying firm 37.30% 36.60%
Cultural background of supplier's contact person 35.27% 32.99%
Based on: Survey results
Secondly, the communication aspects supporting a trustful business relationship
are considered. Here the subsequent factors are most relevant to the respondents
of the glasstec:
• The service provider shows stability in his communication and doing.
• The service provider offers openness and transparency.
• The service provider accommodates and shows readiness to act if necessary.
• The service provider offers correct information & possibly ways to double-
check information.
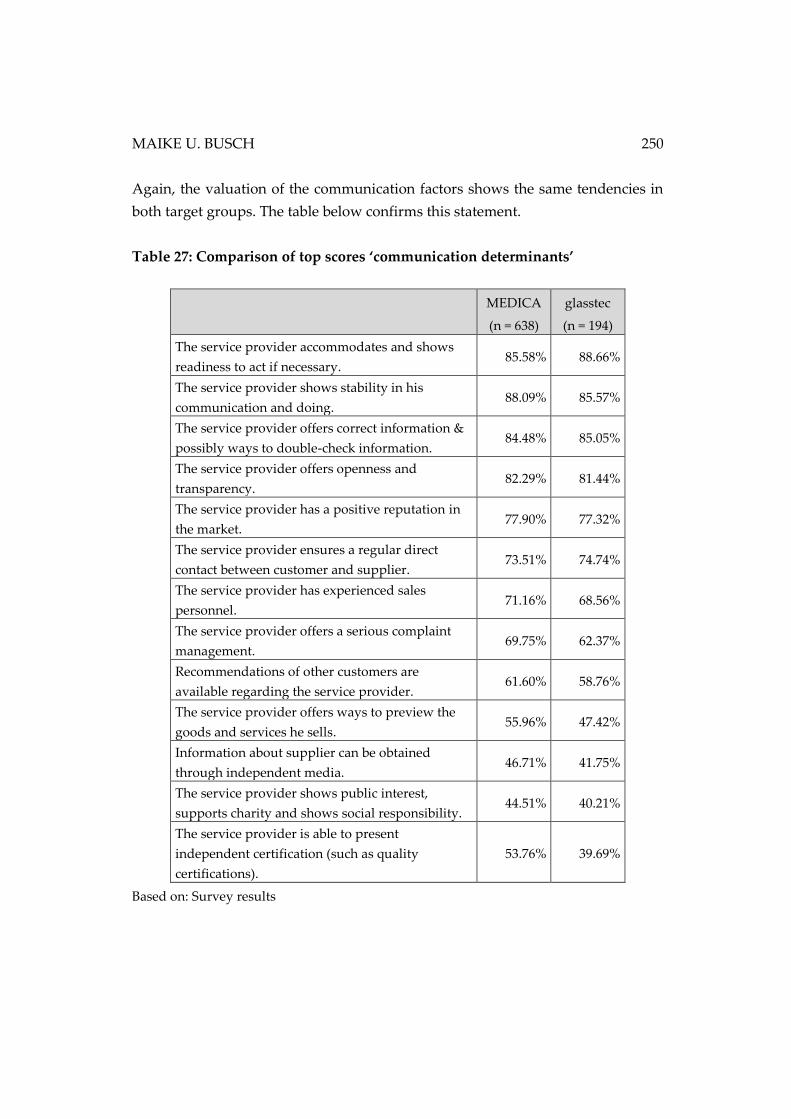
MAIKE U. BUSCH 250
Again, the valuation of the communication factors shows the same tendencies in
both target groups. The table below confirms this statement.
Table 27: Comparison of top scores ‘communication determinants’
MEDICA
(n = 638)
glasstec
(n = 194)
The service provider accommodates and shows
readiness to act if necessary. 85.58% 88.66%
The service provider shows stability in his
communication and doing. 88.09% 85.57%
The service provider offers correct information &
possibly ways to double-check information. 84.48% 85.05%
The service provider offers openness and
transparency. 82.29% 81.44%
The service provider has a positive reputation in
the market. 77.90% 77.32%
The service provider ensures a regular direct
contact between customer and supplier. 73.51% 74.74%
The service provider has experienced sales
personnel. 71.16% 68.56%
The service provider offers a serious complaint
management. 69.75% 62.37%
Recommendations of other customers are
available regarding the service provider. 61.60% 58.76%
The service provider offers ways to preview the
goods and services he sells. 55.96% 47.42%
Information about supplier can be obtained
through independent media. 46.71% 41.75%
The service provider shows public interest,
supports charity and shows social responsibility. 44.51% 40.21%
The service provider is able to present
independent certification (such as quality
certifications).
53.76% 39.69%
Based on: Survey results
EMPIRICAL ANALYSIS IN THE GERMAN TRADE FAIR MARKET
251
So regarding the trust and communication determinants in general, the exhibitors
of both industries show equal tendencies regarding the importance of each item
to fulfill the purpose of building and maintaining trust.
5.2.5.1 Testing of hypotheses
Subsequently, the hypotheses are tested in the same manner as done for the
MEDICA sample.
Hypothesis 1
In hypothesis 1 it is investigated whether an exhibitor seeking a long-lasting
relationship with his trade fair service provider also regards trust as an essential
factor to maintain such a business relationship.154 Using a cross-tabulation to
investigate the relationship between the two variables (question 3 and 4 in the
questionnaire155) the importance of the combination of both aspects becomes
obvious: 176 of the 194 respondents of the glass industry look for long lasting
business relationships with their trade fair service provider. Out of these 176
interviewees, 107 consider trust a ‘very important’ ingredient for such a
relationship; further 42 respondents rated trust as ‘important’. The table and
figure below give an overview of the results.
154 See chapter 4 for hypothesis.
155 Question 3: “When buying services, it is often difficult to foresee the end result. On
a scale from 1 to 5 how important do you rate the existence of
trust into the salespartner for establishing a long-term,
sustainable buyer and service provider relationship?
Question 4: “When buying services, are you looking for a long-term relationship (for
several trade fair cycles) with a service provider who implements your
wishes?”
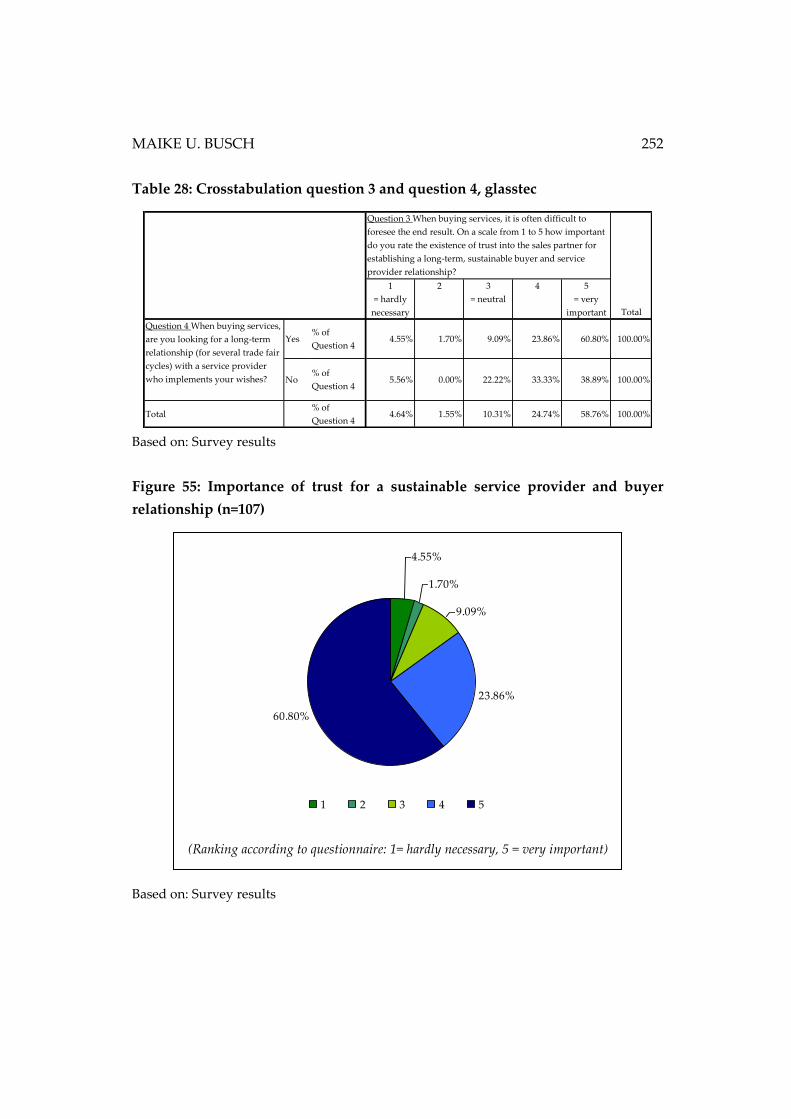
MAIKE U. BUSCH 252
Table 28: Crosstabulation question 3 and question 4, glasstec
Based on: Survey results
Figure 55: Importance of trust for a sustainable service provider and buyer
relationship (n=107)
Based on: Survey results
1
= hardly
necessary
2 3
= neutral
4 5
= very
important
Yes% of
Question 4 4.55% 1.70% 9.09% 23.86% 60.80% 100.00%
No% of
Question 4 5.56% 0.00% 22.22% 33.33% 38.89% 100.00%
Total% of
Question 4 4.64% 1.55% 10.31% 24.74% 58.76% 100.00%
Question 4 When buying services,
are you looking for a long-term
relationship (for several trade fair
cycles) with a service provider
who implements your wishes?
Question 3 When buying services, it is often difficult to
foresee the end result. On a scale from 1 to 5 how important
do you rate the existence of trust into the sales partner for
establishing a long-term, sustainable buyer and service
provider relationship?
Total
(Ranking according to questionnaire: 1= hardly necessary, 5 = very important)
4.55%
1.70%
9.09%
23.86%
60.80%
1 2 3 4 5
EMPIRICAL ANALYSIS IN THE GERMAN TRADE FAIR MARKET
253
The Spearman rank correlation, however, shows no significant value. Therefore, it
cannot be said, that the exhibitors valuing long-lasting business relationships find
trust more important than the ones who do not mind new service partners per
trade fair. 156 Nevertheless, it can be seen that similar to the exhibitors of the
medical industry, exhibitors of the glass processing industries rank long-lasting
business relationship very high and see trust as an essential factor to make them
function (almost 85% of this group).
Hypothesis 2
For the testing of hypothesis 2, question 2 of the questionnaire (focusing on the
rating of trust determinants) is brought to attention again. The hypothesis tries to
analyze if exhibitors show significant differences in their valuation of trust
building factors according to their characteristics. Again, the characteristics
exhibitor status, stand size and origin of the exhibitor are considered.157 For the
calculation, the answers marking values 1 or 2 respectively 4 and 5 on the ordinal
scale of the question are combined for meaningfuller results.
First, the exhibitor status is considered. The Mann-Whitney-U-test is carried out
as two independent samples are compared.158 Comparable to results of the
MEDICA exhibitors, no significant differences can be observed between new or
existing exhibitors when weighting the trust building factors. Therefore, the
overall results of the sample apply to both groups. 159
Second, the glasstec sample gets divided according to the booked stand sizes. As
four independent samples are analyzed, the Kruskal-Wallis-test is performed to
uncover possible differences between the subgroups. If any are found, paired
comparisons are carried out by using the Mann-Whitney-U-test for two
independent samples as post-hoc test.160
156 See appendix 45.
157 See chapter 4 for hypothesis.
158 See chapter 5.1.4. 159 Detailed results can be found in appendix 46.
160 See chapter 5.1.4.
MAIKE U. BUSCH 254
After executing the Kruskal-Wallis-test, however, no significant differences
between the different stand sizes were detected. Again, the overall results of the
complete sample can be transferred to each stand size subgroup.161
Third, the origin is in focus. Again the main subgroups of exhibitors originate
from Germany, Europe and Asia. Therefore, the division of the sample is done
according to the subgroups equally chosen for the survey on the MEDICA
exhibitors: Germany, Europe without Germany, and Asia. The performance of the
Kruskal-Wallis-test for three independent samples reveals significant differences
between the subgroups regarding the valuation of the subsequent trust
determinants:
• Technical assistance in addition to ordered services (p-value = 0.009)
• Personal level of experience of contact person at supplying firm
(p-value = 0.023)
• Cultural background of supplier’s contact person (p-value = 0.003)
• Cultural background of the supplying firm (p-value = 0.008)
Based on the Mann-Whitney-U-test for the paired comparison, the differences
between the groups of origin can be observed as displayed in table 29. 162
161 Detailed results can be found in appendix 47.
162 See appendix 48.
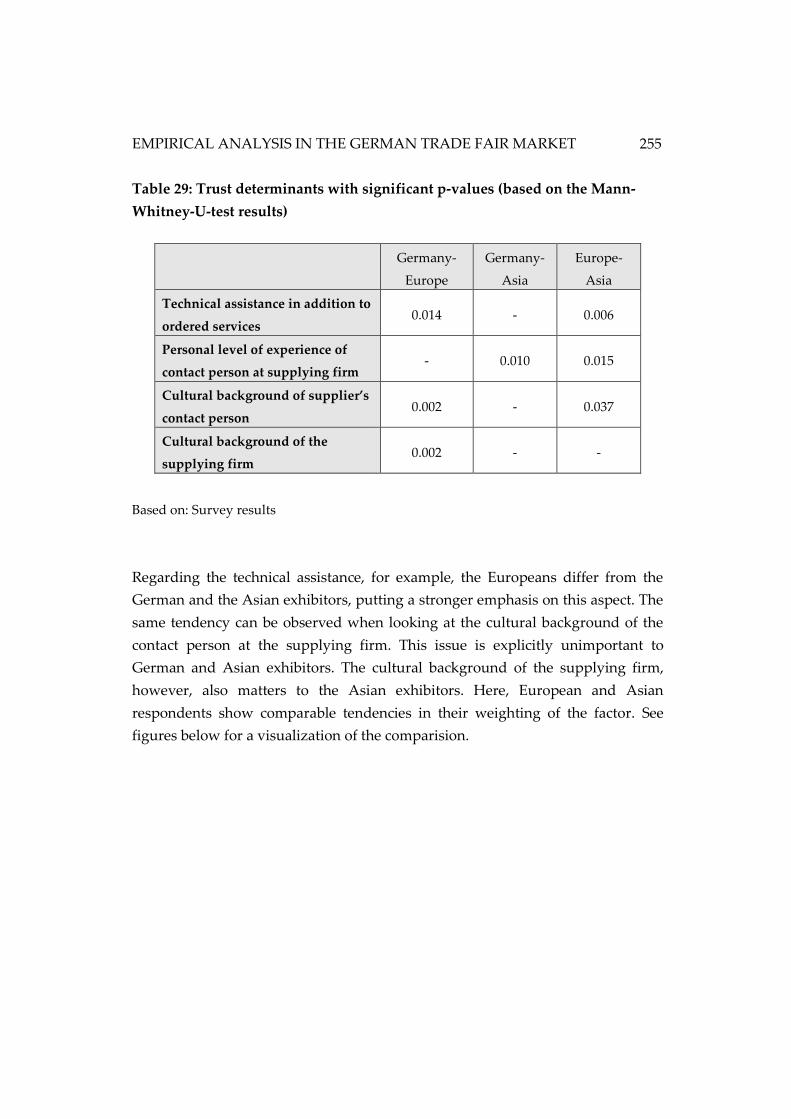
EMPIRICAL ANALYSIS IN THE GERMAN TRADE FAIR MARKET
255
Table 29: Trust determinants with significant p-values (based on the Mann-
Whitney-U-test results)
Germany-
Europe
Germany-
Asia
Europe-
Asia
Technical assistance in addition to
ordered services 0.014 - 0.006
Personal level of experience of
contact person at supplying firm - 0.010 0.015
Cultural background of supplier’s
contact person 0.002 - 0.037
Cultural background of the
supplying firm 0.002 - -
Based on: Survey results
Regarding the technical assistance, for example, the Europeans differ from the
German and the Asian exhibitors, putting a stronger emphasis on this aspect. The
same tendency can be observed when looking at the cultural background of the
contact person at the supplying firm. This issue is explicitly unimportant to
German and Asian exhibitors. The cultural background of the supplying firm,
however, also matters to the Asian exhibitors. Here, European and Asian
respondents show comparable tendencies in their weighting of the factor. See
figures below for a visualization of the comparision.
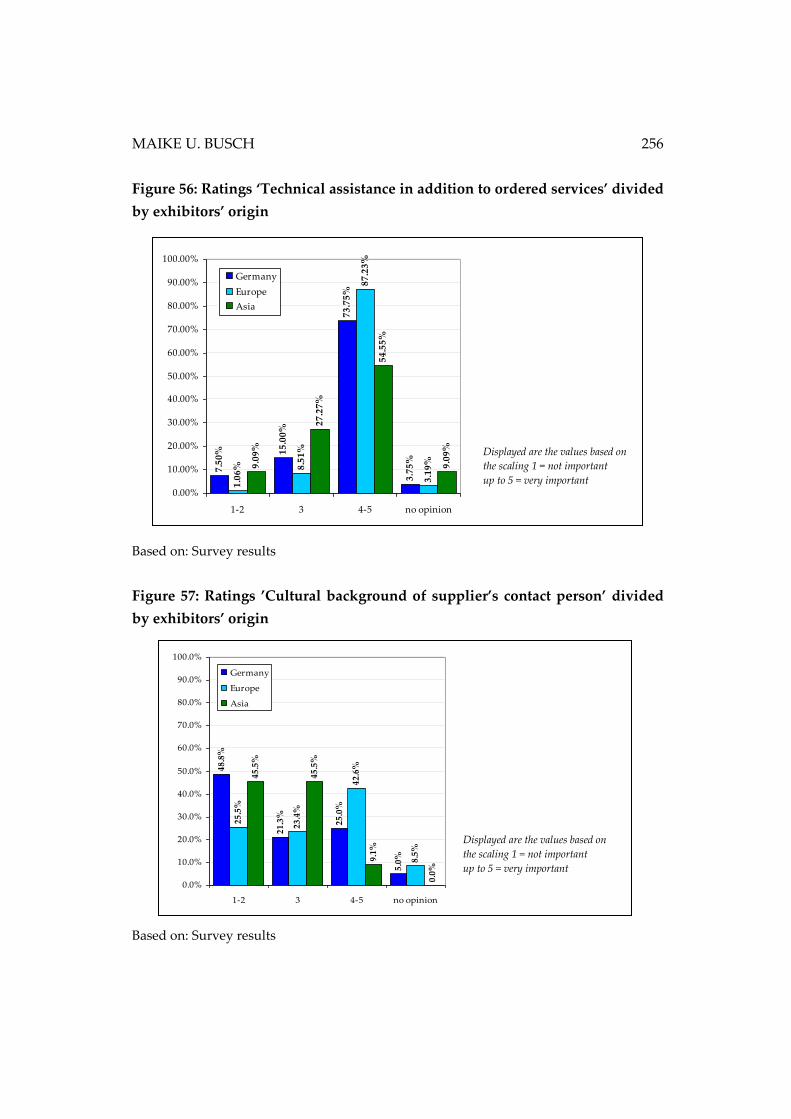
MAIKE U. BUSCH 256
Figure 56: Ratings ‘Technical assistance in addition to ordered services’ divided
by exhibitors’ origin
Based on: Survey results
Figure 57: Ratings ’Cultural background of supplier’s contact person’ divided
by exhibitors’ origin
Based on: Survey results
Displayed are the values based on
the scaling 1 = not important
up to 5 = very important
48
.8%
21
.3%
25
.0%
5.0
%
25
.5%
23
.4%
42
.6%
8.5
%
45
.5%
45
.5%
9.1
%
0.0
%
0.0%
10.0%
20.0%
30.0%
40.0%
50.0%
60.0%
70.0%
80.0%
90.0%
100.0%
1-2 3 4-5 no opinion
Germany
Europe
Asia
Displayed are the values based on
the scaling 1 = not important
up to 5 = very important
7.5
0% 1
5.0
0%
73
.75
%
3.7
5%
1.0
6% 8
.51
%
87
.23
%
3.1
9%9.0
9%
27
.27
%
54
.55
%
9.0
9%
0.00%
10.00%
20.00%
30.00%
40.00%
50.00%
60.00%
70.00%
80.00%
90.00%
100.00%
1-2 3 4-5 no opinion
Germany
Europe
Asia
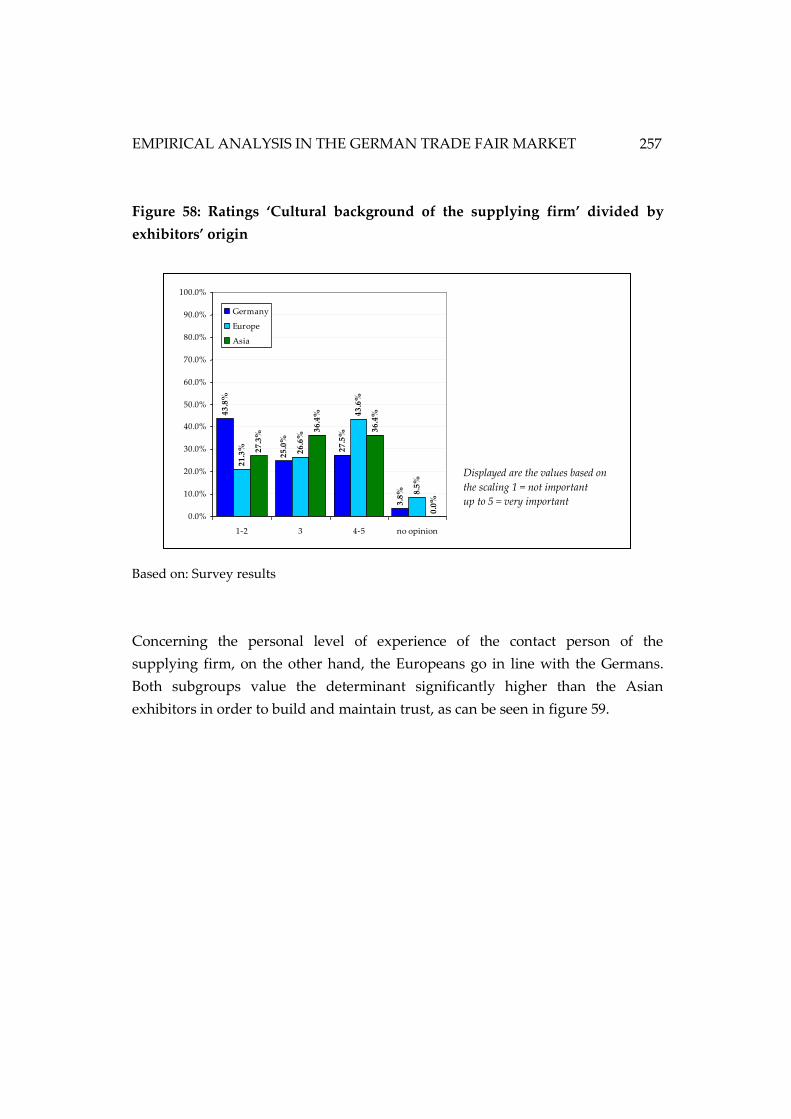
EMPIRICAL ANALYSIS IN THE GERMAN TRADE FAIR MARKET
257
Figure 58: Ratings ‘Cultural background of the supplying firm’ divided by
exhibitors’ origin
Based on: Survey results
Concerning the personal level of experience of the contact person of the
supplying firm, on the other hand, the Europeans go in line with the Germans.
Both subgroups value the determinant significantly higher than the Asian
exhibitors in order to build and maintain trust, as can be seen in figure 59.
43
.8%
25
.0%
27
.5%
3.8
%
21
.3% 26
.6%
43
.6%
8.5
%
27
.3%
36
.4%
36
.4%
0.0
%
0.0%
10.0%
20.0%
30.0%
40.0%
50.0%
60.0%
70.0%
80.0%
90.0%
100.0%
1-2 3 4-5 no opinion
Germany
Europe
Asia
Displayed are the values based on
the scaling 1 = not important
up to 5 = very important
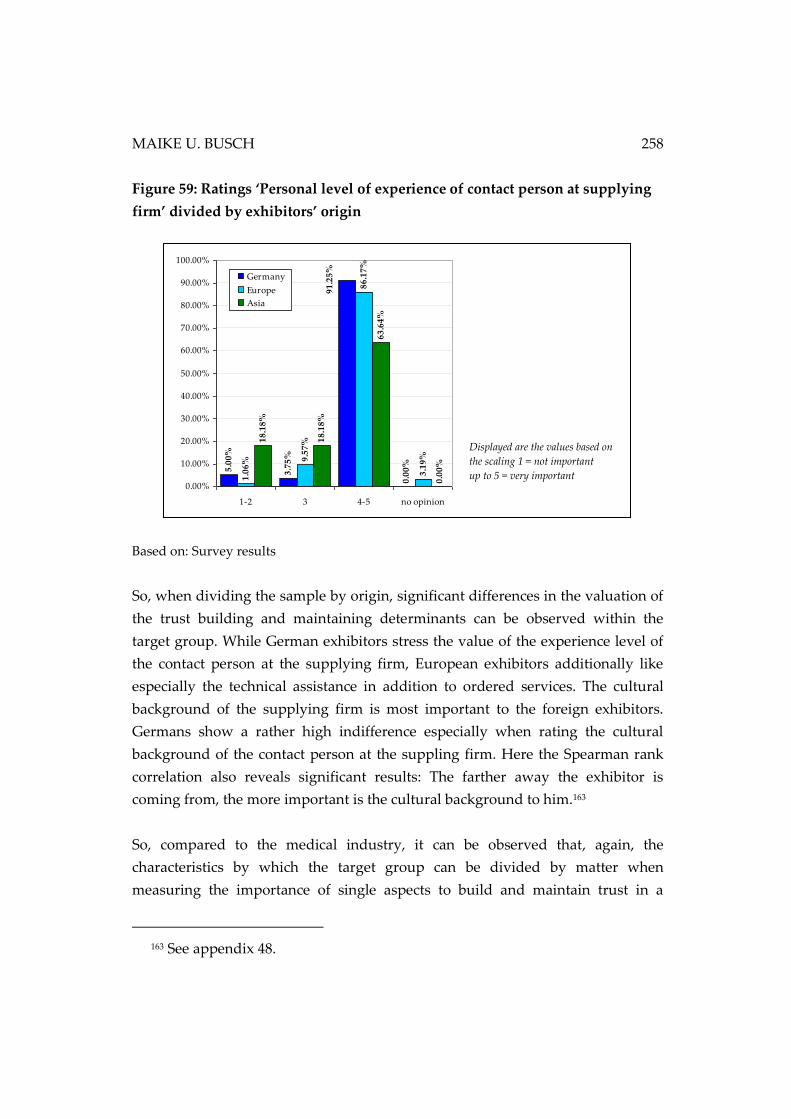
MAIKE U. BUSCH 258
Figure 59: Ratings ‘Personal level of experience of contact person at supplying
firm’ divided by exhibitors’ origin
Based on: Survey results
So, when dividing the sample by origin, significant differences in the valuation of
the trust building and maintaining determinants can be observed within the
target group. While German exhibitors stress the value of the experience level of
the contact person at the supplying firm, European exhibitors additionally like
especially the technical assistance in addition to ordered services. The cultural
background of the supplying firm is most important to the foreign exhibitors.
Germans show a rather high indifference especially when rating the cultural
background of the contact person at the suppling firm. Here the Spearman rank
correlation also reveals significant results: The farther away the exhibitor is
coming from, the more important is the cultural background to him.163
So, compared to the medical industry, it can be observed that, again, the
characteristics by which the target group can be divided by matter when
measuring the importance of single aspects to build and maintain trust in a
163 See appendix 48.
Displayed are the values based on
the scaling 1 = not important
up to 5 = very important
5.0
0%
3.7
5%
0.0
0%
1.0
6% 9
.57
%
86
.17
%
3.1
9%
18
.18
%
18
.18
%
63
.64
%
0.0
0%
91
.25
%
0.00%
10.00%
20.00%
30.00%
40.00%
50.00%
60.00%
70.00%
80.00%
90.00%
100.00%
1-2 3 4-5 no opinion
Germany
Europe
Asia
EMPIRICAL ANALYSIS IN THE GERMAN TRADE FAIR MARKET
259
business relationship. Yet, examining the single determinants itself, differences
between the weighting of each factor to fulfill its purpose are detected between
the subgroups. So the fact of differences between the subgroups is transferrable
between the industries, the importance of single determinants is not.
Nevertheless, the null-hypothesis H02 has to be rejected also for the glass
industry. Exhibitors show significant differences in their valuation of trust
building factors according to their characteristics.
Hypothesis 3
Hypothesis 3 focuses on significant differences in the exhibitors’ valuation of
trust building communication. Do exhibitors assess assorted communication
methods diversely according to their characteristics such as exhibitor status,
rented stand size or origin? Question 6 of the questionnaire given to the probands
states a variety of communication approaches.164 The exhibitors of the glass
manufacturing industries were ask to rate each item in the same way as the
respondents of the medical industry. On an ordinal scale they had to indicate the
importance they attach to each technique in order to build and maintain a trustful
business relationship with a service provider.
Regarding the exhibitor status the Mann-Whitney-U-test reveals one statistical
significant difference between the two groups. With a p-value of 0.030 it is the
aspect: ‘The service provider offers correct information and possibly ways to
double-check this information’.165 As can be seen in the following figure, this
aspect is of a higher importance to existing exhibitors than to the new ones.
164 See appendix 43.
165 See appendix 49.
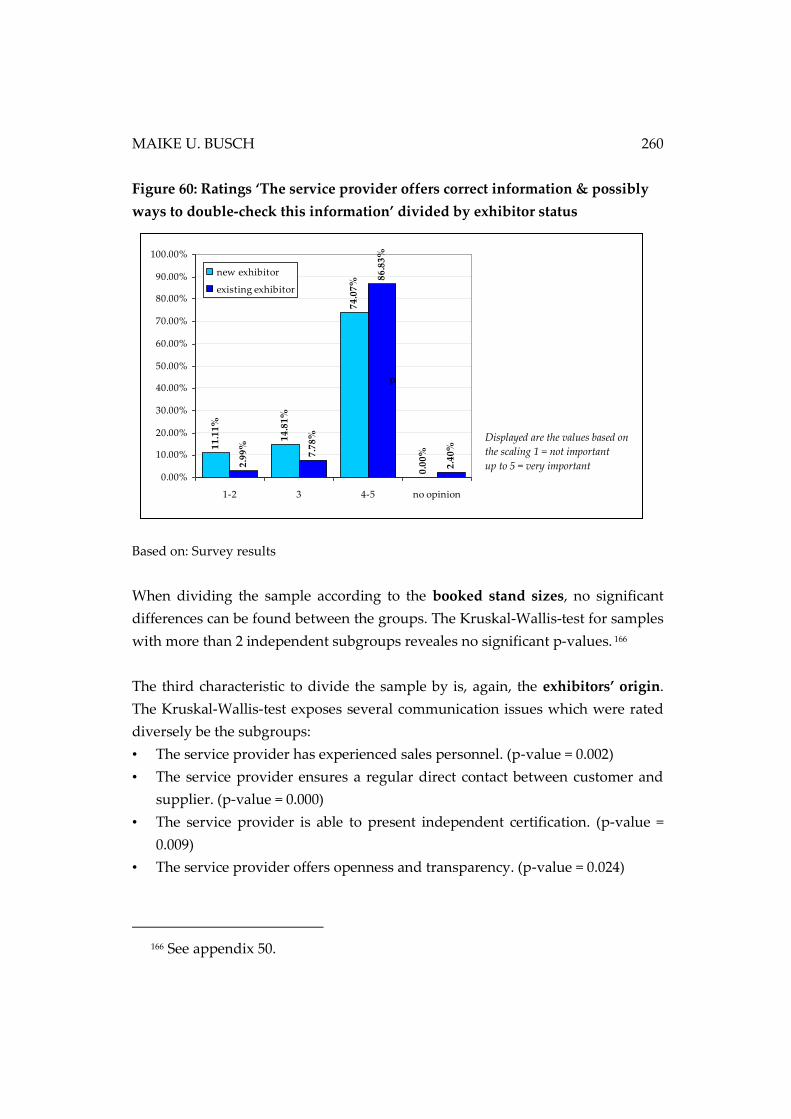
MAIKE U. BUSCH 260
Figure 60: Ratings ‘The service provider offers correct information & possibly
ways to double-check this information’ divided by exhibitor status
Based on: Survey results
When dividing the sample according to the booked stand sizes, no significant
differences can be found between the groups. The Kruskal-Wallis-test for samples
with more than 2 independent subgroups reveales no significant p-values. 166
The third characteristic to divide the sample by is, again, the exhibitors’ origin.
The Kruskal-Wallis-test exposes several communication issues which were rated
diversely be the subgroups:
• The service provider has experienced sales personnel. (p-value = 0.002)
• The service provider ensures a regular direct contact between customer and
supplier. (p-value = 0.000)
• The service provider is able to present independent certification. (p-value =
0.009)
• The service provider offers openness and transparency. (p-value = 0.024)
166 See appendix 50.
Displayed are the values based on
the scaling 1 = not important
up to 5 = very important
11
.11
%
14
.81
%
74
.07
%
0.0
0%
2.9
9%
7.7
8%
86
.83
%
2.4
0%
0.00%
10.00%
20.00%
30.00%
40.00%
50.00%
60.00%
70.00%
80.00%
90.00%
100.00%
1-2 3 4-5 no opinion
new exhibitor
existing exhibitor
p
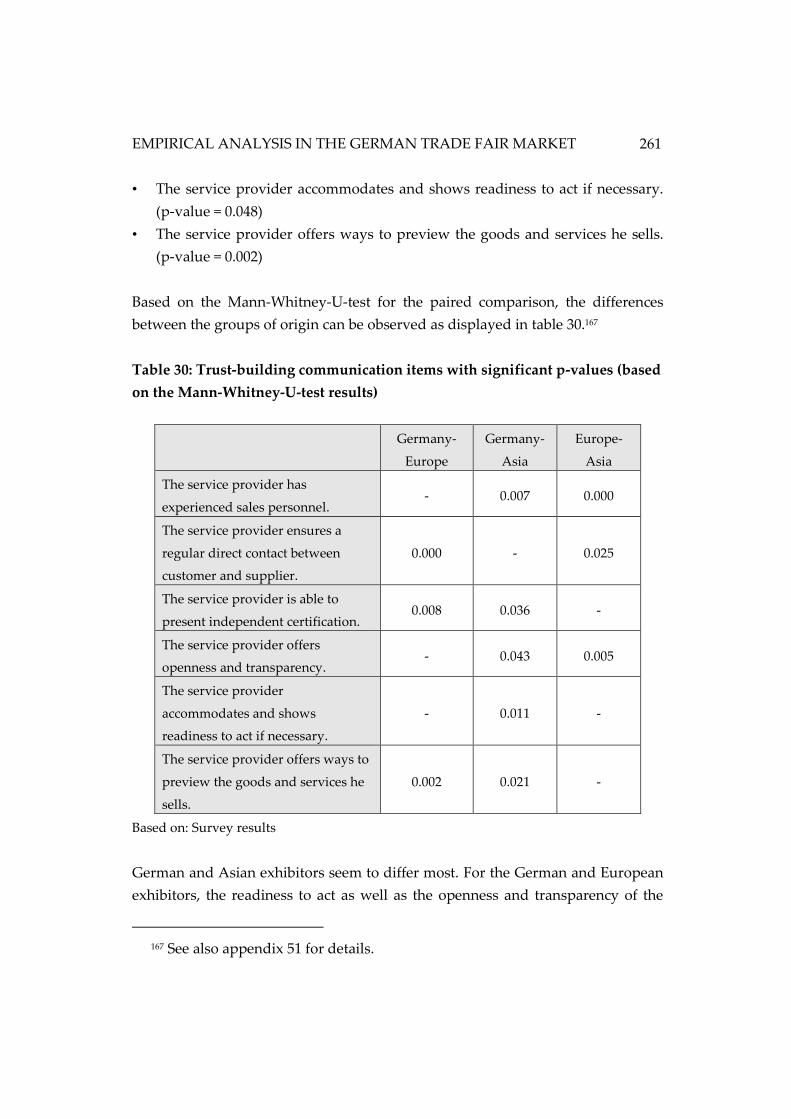
EMPIRICAL ANALYSIS IN THE GERMAN TRADE FAIR MARKET
261
• The service provider accommodates and shows readiness to act if necessary.
(p-value = 0.048)
• The service provider offers ways to preview the goods and services he sells.
(p-value = 0.002)
Based on the Mann-Whitney-U-test for the paired comparison, the differences
between the groups of origin can be observed as displayed in table 30.167
Table 30: Trust-building communication items with significant p-values (based
on the Mann-Whitney-U-test results)
Germany-
Europe
Germany-
Asia
Europe-
Asia
The service provider has
experienced sales personnel. - 0.007 0.000
The service provider ensures a
regular direct contact between
customer and supplier.
0.000 - 0.025
The service provider is able to
present independent certification. 0.008 0.036 -
The service provider offers
openness and transparency. - 0.043 0.005
The service provider
accommodates and shows
readiness to act if necessary.
- 0.011 -
The service provider offers ways to
preview the goods and services he
sells.
0.002 0.021 -
Based on: Survey results
German and Asian exhibitors seem to differ most. For the German and European
exhibitors, the readiness to act as well as the openness and transparency of the
167 See also appendix 51 for details.
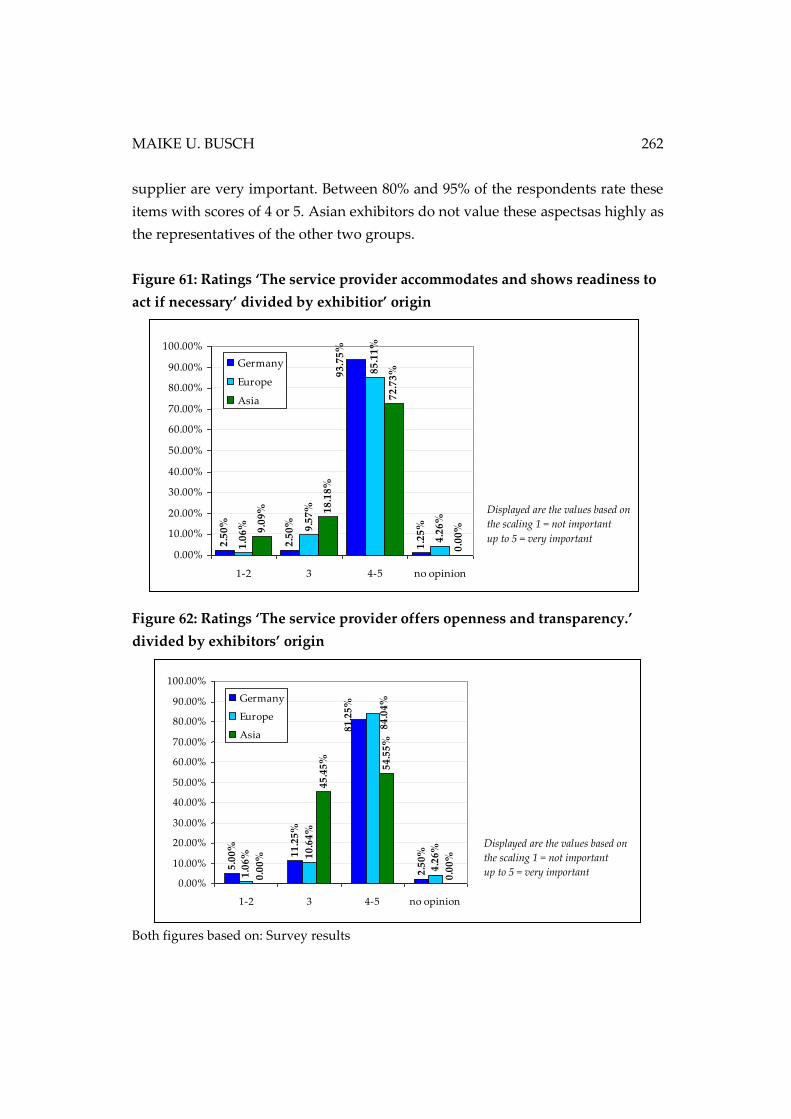
MAIKE U. BUSCH 262
supplier are very important. Between 80% and 95% of the respondents rate these
items with scores of 4 or 5. Asian exhibitors do not value these aspectsas highly as
the representatives of the other two groups.
Figure 61: Ratings ‘The service provider accommodates and shows readiness to
act if necessary’ divided by exhibitior’ origin
Figure 62: Ratings ‘The service provider offers openness and transparency.’
divided by exhibitors’ origin
Both figures based on: Survey results
Displayed are the values based on
the scaling 1 = not important
up to 5 = very important
2.5
0%
2.5
0%
1.2
5%
1.0
6% 9.5
7%
85
.11
%
4.2
6%
9.0
9% 1
8.1
8%
72
.73
%
0.0
0%
93
.75
%
0.00%
10.00%
20.00%
30.00%
40.00%
50.00%
60.00%
70.00%
80.00%
90.00%
100.00%
1-2 3 4-5 no opinion
Germany
Europe
Asia
Displayed are the values based on
the scaling 1 = not important
up to 5 = very important
11
.25
%
2.5
0%
1.0
6% 1
0.6
4%
4.2
6%
0.0
0%
45
.45
%
54
.55
%
0.0
0%
81
.25
%
5.0
0%
84
.04
%
0.00%
10.00%
20.00%
30.00%
40.00%
50.00%
60.00%
70.00%
80.00%
90.00%
100.00%
1-2 3 4-5 no opinion
Germany
Europe
Asia
EMPIRICAL ANALYSIS IN THE GERMAN TRADE FAIR MARKET
263
In addition, European exhibitors need to work with experienced sales personnel.
Almost 75% of the European respondents rate this issue as highly important to
build trust in a business relationship with a service provider. Only 27% of the
Asian exhibitors gave scores of 4 or 5 for this item.
Figure 63: Ratings ‘Experienced sales personnel’ divided by exhibitors’ origin
Based on: Survey results
Moreover, Europeans value an ensuring of a regular contact by the service
supplier highly. 87% of the European exhibitors gave scores in the top boxes. For
German and Asian exhibitors, this is less important. As to be seen in the figure
below, only about 60-65% of them rate this essential.
6.2
5%
27
.50
%
65
.00
%
1.2
5%
5.3
2%
18
.09
%
74
.47
%
2.1
3%
27
.27
%
45
.45
%
27
.27
%
0.0
0%
0.00%
10.00%
20.00%
30.00%
40.00%
50.00%
60.00%
70.00%
80.00%
90.00%
100.00%
1-2 3 4-5 no opinion
Germany
Europe
Asia
Displayed are the values based on
the scaling 1 = not important
up to 5 = very important
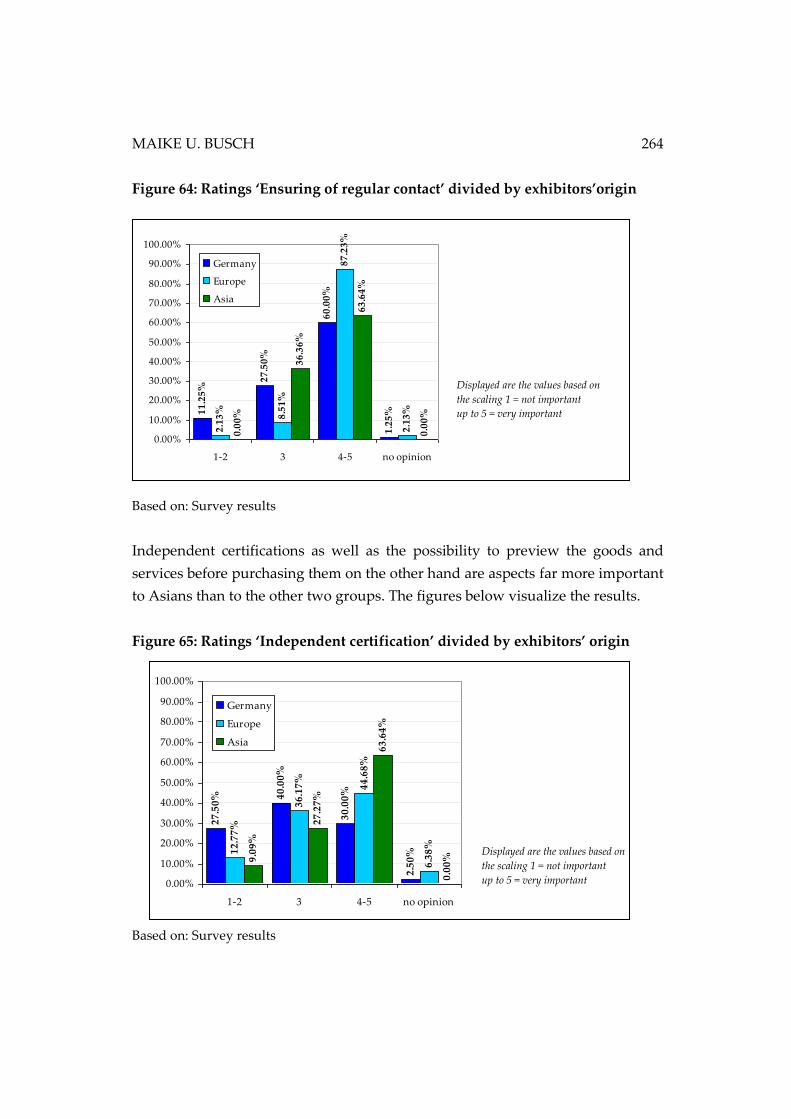
MAIKE U. BUSCH 264
Figure 64: Ratings ‘Ensuring of regular contact’ divided by exhibitors’origin
Based on: Survey results
Independent certifications as well as the possibility to preview the goods and
services before purchasing them on the other hand are aspects far more important
to Asians than to the other two groups. The figures below visualize the results.
Figure 65: Ratings ‘Independent certification’ divided by exhibitors’ origin
Based on: Survey results
Displayed are the values based on
the scaling 1 = not important
up to 5 = very important
11
.25
%
27
.50
%
60
.00
%
1.2
5%
2.1
3%
8.5
1%
87
.23
%
2.1
3%
0.0
0%
36
.36
%
63
.64
%
0.0
0%
0.00%
10.00%
20.00%
30.00%
40.00%
50.00%
60.00%
70.00%
80.00%
90.00%
100.00%
1-2 3 4-5 no opinion
Germany
Europe
Asia
Displayed are the values based on
the scaling 1 = not important
up to 5 = very important
27
.50
% 40
.00
%
30
.00
%
2.5
0%1
2.7
7%
36
.17
%
44
.68
%
6.3
8%
9.0
9%
27
.27
%
63
.64
%
0.0
0%
0.00%
10.00%
20.00%
30.00%
40.00%
50.00%
60.00%
70.00%
80.00%
90.00%
100.00%
1-2 3 4-5 no opinion
Germany
Europe
Asia
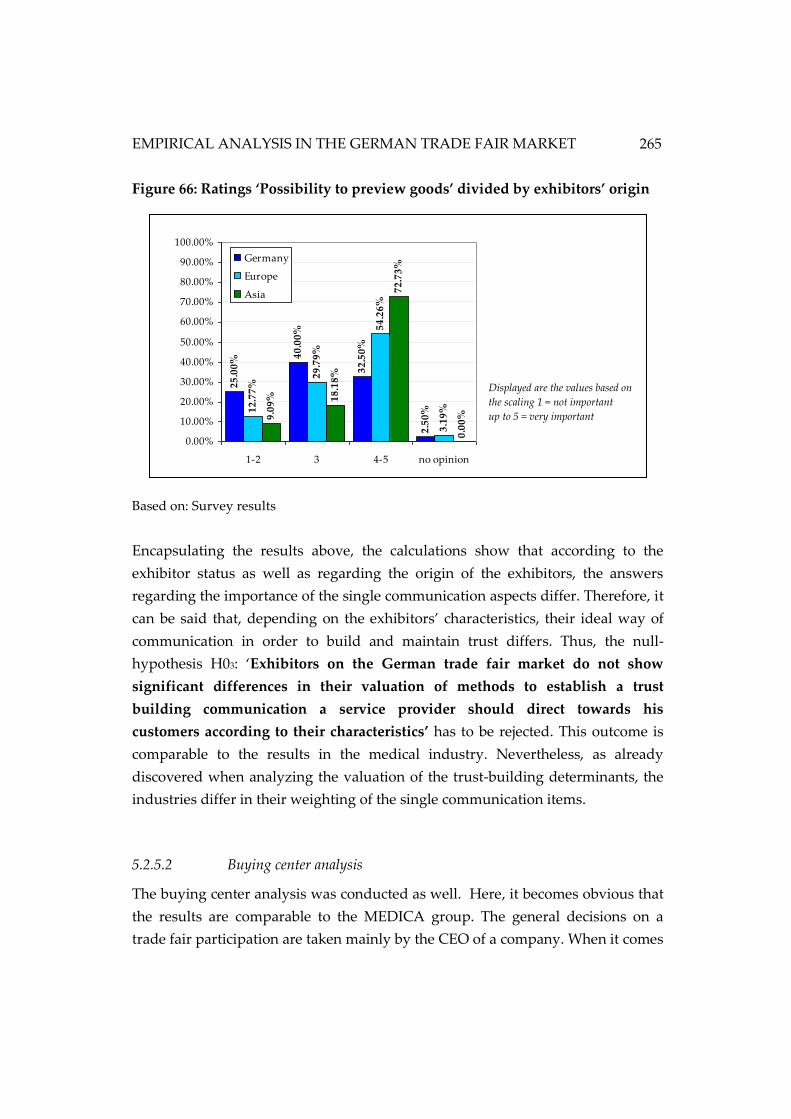
EMPIRICAL ANALYSIS IN THE GERMAN TRADE FAIR MARKET
265
Figure 66: Ratings ‘Possibility to preview goods’ divided by exhibitors’ origin
Based on: Survey results
Encapsulating the results above, the calculations show that according to the
exhibitor status as well as regarding the origin of the exhibitors, the answers
regarding the importance of the single communication aspects differ. Therefore, it
can be said that, depending on the exhibitors’ characteristics, their ideal way of
communication in order to build and maintain trust differs. Thus, the null-
hypothesis H03: ‘Exhibitors on the German trade fair market do not show
significant differences in their valuation of methods to establish a trust
building communication a service provider should direct towards his
customers according to their characteristics’ has to be rejected. This outcome is
comparable to the results in the medical industry. Nevertheless, as already
discovered when analyzing the valuation of the trust-building determinants, the
industries differ in their weighting of the single communication items.
5.2.5.2 Buying center analysis
The buying center analysis was conducted as well. Here, it becomes obvious that
the results are comparable to the MEDICA group. The general decisions on a
trade fair participation are taken mainly by the CEO of a company. When it comes
Displayed are the values based on
the scaling 1 = not important
up to 5 = very important
25
.00
% 40
.00
%
32
.50
%
2.5
0%1
2.7
7%
29
.79
%
54
.26
%
3.1
9%
9.0
9% 18
.18
%
72
.73
%
0.0
0%
0.00%
10.00%
20.00%
30.00%
40.00%
50.00%
60.00%
70.00%
80.00%
90.00%
100.00%
1-2 3 4-5 no opinion
Germany
Europe
Asia
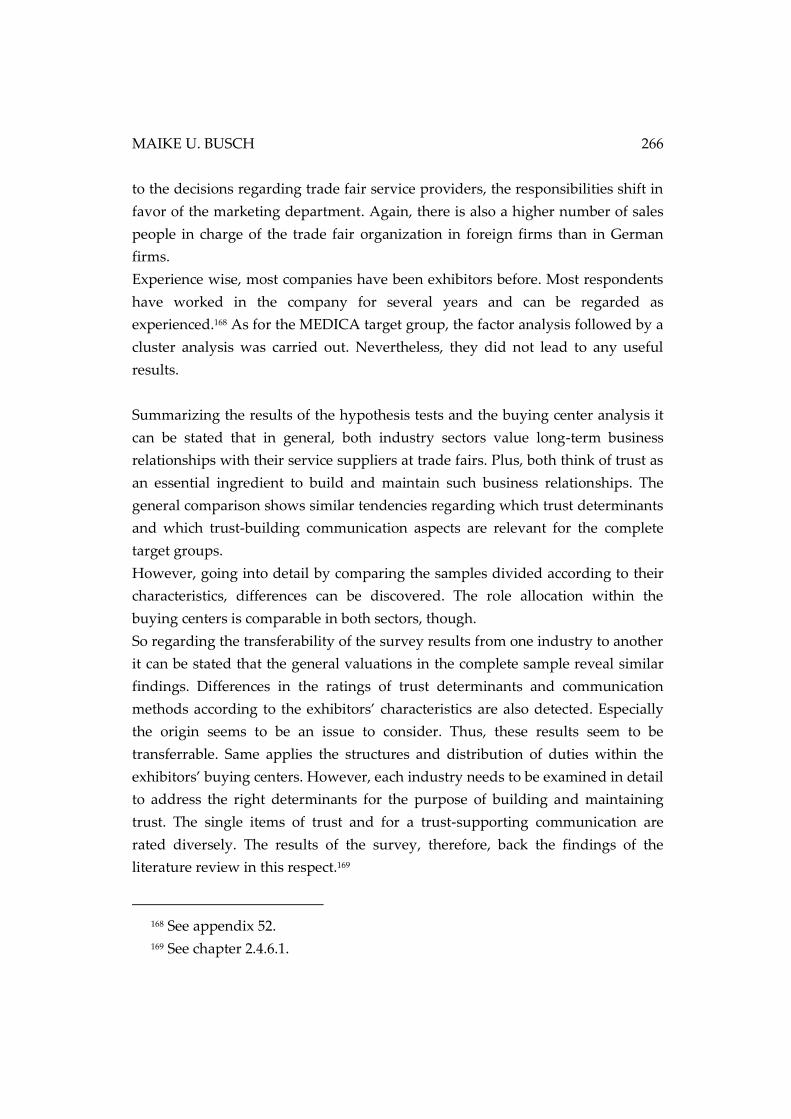
MAIKE U. BUSCH 266
to the decisions regarding trade fair service providers, the responsibilities shift in
favor of the marketing department. Again, there is also a higher number of sales
people in charge of the trade fair organization in foreign firms than in German
firms.
Experience wise, most companies have been exhibitors before. Most respondents
have worked in the company for several years and can be regarded as
experienced.168 As for the MEDICA target group, the factor analysis followed by a
cluster analysis was carried out. Nevertheless, they did not lead to any useful
results.
Summarizing the results of the hypothesis tests and the buying center analysis it
can be stated that in general, both industry sectors value long-term business
relationships with their service suppliers at trade fairs. Plus, both think of trust as
an essential ingredient to build and maintain such business relationships. The
general comparison shows similar tendencies regarding which trust determinants
and which trust-building communication aspects are relevant for the complete
target groups.
However, going into detail by comparing the samples divided according to their
characteristics, differences can be discovered. The role allocation within the
buying centers is comparable in both sectors, though.
So regarding the transferability of the survey results from one industry to another
it can be stated that the general valuations in the complete sample reveal similar
findings. Differences in the ratings of trust determinants and communication
methods according to the exhibitors’ characteristics are also detected. Especially
the origin seems to be an issue to consider. Thus, these results seem to be
transferrable. Same applies the structures and distribution of duties within the
exhibitors’ buying centers. However, each industry needs to be examined in detail
to address the right determinants for the purpose of building and maintaining
trust. The single items of trust and for a trust-supporting communication are
rated diversely. The results of the survey, therefore, back the findings of the
literature review in this respect.169
168 See appendix 52.
169 See chapter 2.4.6.1.
267
6 CONCLUSION
6.1 RECAPITULATION OF RESEARCH QUESTION, OBJECTIVES AND
RESEARCH APPROACH
This paper deals with the research question of how German trade fair organizing
companies with self-owned fair grounds can sell their services more effectively to
their exhibitors. The trade fair organizers’ core competence is the provision of
space respectively a platform for business exchange for different industries.
However, the execution of and participation in a trade fair requires a variety of
services. The trade fair organizers offer these services to their customers, just as
external service providers do, too. Nevertheless, the exhibitors do not seem
convinced by the offer. Service sales have not met the expectation of the trade fair
organizing companies, although marketing efforts have been increased over the
past years. The wish to change this situation is present. In addition, predictions
have been made by business associations, which state that the competitive
pressure in this field is going to intensify in the nearer future. Therefore, the trade
fair industry keeps searching for ways to improve the current situation.
Services are mainly immaterial goods which contain a high degree of credence
qualities. Although the customer is integrated in the process of creating the
service product, he is oftentimes incapable of assessing the quality of the service
and its production. Selling services in business markets, such as between a trade
fair organizer and an exhibiting company increases the complexity of the buying
situation and process. Relationship management comes in the picture, leading to
the theory of the New Institutional Economics and the principal-agent approach
in particular. The principal-agent approach broaches the issue of buyer-seller
relationships with the status of asymmetric information. Several ways of reducing
the information asymmetry have been researched and can be found in literature.
However, only the creation of trust seems to be effective when dealing with
goods of high credence qualities such as services.
MAIKE U. BUSCH 268
So, taking this as the basis for this research project, the literature review carried
out on the topics named above, led to the subsequent objectives for the empirical
research in the trade fair business:
• Do exhibitors see trust as a relevant aspect for selling and buying services
linked to their trade fair participation?
• If so, what determinants are relevant for the exhibitors in order to build and
maintain trust towards their service providers? Do differences exist among
exhibitors regarding their characteristics, such as origin, exhibitor status or
booked stand size?
• What are strategies and methods of communication to effectively address
these trust-building determinants and ensure a communication that actually
builds and maintains trust? And again, do they differ according to the
exhibitors’ characteristics?
• Who is the trade fair organizing company’s customer regarding service offers?
Do buying center structures lead to specific additional considerations for the
communication strategies?
• Finally, it needs to be taken into account that the trade fair business deals with
a very diverse target group. Customers are coming from various industries,
cultural backgrounds, company sizes and so on. Can results be transferred
from one industry to another? Or if results are not transmittable, could the
method of testing be used to establish a way of analyzing the different
industries present at trade fairs?
Subsequently, this chapter provides an overview of the empirical findings and the
concluding results for the German trade fair industry. Moreover, theoretical and
policy implications are stated and an outlook for future research is provided. The
chapter ends with a brief overview of the limitations of the study before the
closing statement.
CONCLUSION
269
6.2 EMPIRICAL FINDINGS AND RESULTS FOR THE GERMAN TRADE
FAIR INDUSTRY
As already mentioned the trade fair industry is very heterogeneous. Especially on
German fair grounds, many different industries meet for their exhibitions. In
order to not get too fragmented results in the survey, the number of industries in
focus had to be narrowed down. Therefore, the worldwide medical industry was
chosen as exemplary exhibiting industry in focus. It meets yearly at the MEDICA
trade fair. The results are to be summarized and presented in the following.
Additionally, the glass manufacturing industry was analyzed for comparison
reasons. Here, the main exhibitors of the glasstec were addressed to participate in
the survey. Results on the comparison are to be found later in this chapter.
6.2.1 Trust as success factor
First of all, trust between a service supplier and his customer is extremely highly
valued in the medical industry. Exhibitors therefore see the difficulty to judge a
service offer and production due to its credence qualities. With this result they
indicate the existence of an information asymmetry. It seems this gap could not be
bridged by the conventional marketing tools, meaning the signaling information
by the trade fair service supplier, so far. There is also a desire for long-lasting
business relationships with a trade fair service supplier. Especially the exhibitors
looking for a long-term connection value trust as a crucial factor. Same tendencies
could also be found in the analysis of the glass manufacturing industry.
Therefore, taking the research questions from the beginning into account it can be
concluded, that trust is an essential factor to sell services to most exhibitors on
German trade fair markets.
MAIKE U. BUSCH 270
6.2.2 Implications to build and maintain trust with exhibitors
Based on the literature research it became obvious that no distinct definition of
trust could be given. Especially trust research in economics could not provide an
explicit number of determinants responsible for building trust. Nor could a clear
picture be drawn what communication tools and methods are generally most
effective in this respect. Statements were made, that the results vary from
industry to industry and regarding the characteristics within a population. This
again supported the limitation of the sample to the medical industry.
6.2.2.1 Determinants of trust relevant for the medical industry
Most important for the complete sample of exhibitors is communication between
the customer and the service supplier in order to establish trust. Additionally,
almost equally important, are honesty and reliability to the respondents of the
survey. An exhibitor must be able to rely on the work of and the information
provided by the supplier. Services are not transportable. The trade fair does not
take place at the customer’s office. Therefore, it seems natural that these aspects
are of highest importance for the exhibitor. He must be able to rely on his service
provider to perform his work according to agreement without him being there to
control the supplier. The exhibitor does not favor surprises when arriving at his
booth for the opening of the trade fair. This element is additionally backed up
with the fact that the satisfaction with previous projects with the particular
supplier is also valued very highly.
Although the degree of experience is one of the most relevant features to analyze
the buying center by, the aspect whether a medical exhibitor had participated in
the trade show before or not is of no significant relevance for judging the relevant
determinants for trust.
When dividing the sample regarding the booked stand size, only minor
differences can be observed. The cultural differences of a supplier and a potential
customer seem to get less important as the company size increases. The same
tendency can be observed when the aspect of previous interactions with the
service supplier is in focus.
CONCLUSION
271
The cultural background, meaning the origin of the exhibitors, on the other hand
leads to partly significantly diverse results in several aspects. German exhibitors
differ from the Asian and European exhibitors as they rate the aspects
benevolence and the personal level of experience of the contact person at the
supplying firm higher. Both aspects are of higher value to them to build trust than
they are to the foreign exhibitors. Those, on the other hand, put a higher emphasis
on the supplier’s reputation in the market and on a similarity between the
supplier and themselves to establish a trustful business relationship. The
similarity refers to the presence of equal interests and values of both companies.
The supplier’s reputation is particularly important to the Asian exhibitors. They
also regard the technical assistance, meaning support that goes beyond the
ordered aspects, more important than the Germans do. It can be assumed, that
they like to rely on this fact since they are not so familiar with the conditions and
circumstances on the fairground, away from their home country. Supplementary
support can then reduce information asymmetries and ensure the maintenance of
trust for the customer. While the cultural aspects, such as the cultural background
of the supplier’s contact person or the cultural background of the supplying firm,
are highly unimportant to the German exhibitors, the foreign ones, and again,
especially the Asian ones, see a high value attached for the purpose of building
trust.
So, as can be seen and with regard to the research questions stated at the
beginning of this chapter, exhibitors value a variety of determinants in order to
establish trust in a business relationship with a service provider. Moreover,
exhibitors differ in their opinions according to their characteristics, especially the
origin. Nevertheless, communication between the service supplier and his
(potential) customer is most important to establish trust in a business relationship
to the complete target group. This leads to the analysis of the communication
aspects to be used to build and maintain trust.
6.2.2.2 Trust-building communication aspects relevant for the medical industry
The next question to be answered was how trade fair organizers can actually
communicate with their (potential) service customers effectively an establishment
MAIKE U. BUSCH 272
of trust. In a first analysis, the connection between the single trust determinants
and the communication items was reviewed. However, no particularly strong
correlations between a trust factor and a communication item, such as
recommendations by other customers or news coverage in independent media,
could be determined.
Next the communication aspects were inspected with regards to the target group.
The results show some aspects as generally relevant for the whole target group.
The exhibitors expect the supplier to show stability in his communication and
doing. This goes in line with the fact that the most relevant trust determinants are
a stable communication, honesty and reliability. The wish to receive correct
information and possibilities to double-check them supports this as well. It can be
assumed, that once a strong trust relationship is established, the necessity to
provide ways to constantly double-check the information given decreases to a
certain extent. However, especially in the beginning of a business relationship,
customers see this aspect as essential to build trust. The service supplier should
be aware of this fact, offering written statements, analysis or other insights to the
exhibitors. Moreover, of high importance for the target group is the supplier’s
way of handling possible problems or emergency situations. The exhibitors see it
as a key factor for building trust, that the supplier has an open attitude also to
express problems and difficulties and to act if necessary. Even if the situations are
not favorable, the exhibitor rather gets informed about such happenings instead
of finding out later that the supplier was whitewashing the situation. So for the
supplier it is to note that he should be open and show transparency. The
exhibitors gain confidence in believing in the supplier through this course of
action.
Besides these general expectations, some differences among the divided target
group are noteworthy. The determinants of trust already showed some variations
considering the booked stand size and particularly the origin of the exhibitors.
Again, all three relevant groups of characteristics were analyzed.
As before, the exhibitor status shows no significant differentiation regarding the
trust building communication methods. New and existing exhibitors think alike
in this respect. However, considering the stand size and the origin, differences
can be observed once more. Small stands differ significantly from the bigger
CONCLUSION
273
stands in several aspects. They put more emphasis on the recommendation which
are provided by other customers. They value information received through
independent media as well as independent certification much higher than the
bigger stands. Furthermore, they like the establishment of a serious complaint
management. All these aspects can be considered useful to smaller companies or
smaller stands as those exhibitors might not have the resources and power to
control these factors as bigger companies can. Ensuring these factors might
reduce their uncertainties and therefore lead to a higher level of trust. The
stability in the supplier’s communication and doing is rated highly by companies
of all stand sizes; however, again, it is most important to the companies with
smaller booths.
Considering the exhibitors’ origin, a positive reputation of the service supplier in
the market, recommendations by other customers, the ensuring of regular contact
by the service supplier, information through independent media, independent
certifications and a complaint management are of higher importance to foreign
exhibitors, than they are to German exhibitors. Most of these aspects are
especially important to Asian exhibitors. Asians also value the possibility to
preview the goods and services beforehand highly. As stated when discussing the
trust building determinants, these factors seem to take away uncertainties
especially amongst medical exhibitors who are situated farther away from the
fairground. All aspects support the reputation and the trustworthiness of a
service provider that cannot be visited easily. European and Asian exhibitors
value opinions and arguments from third parties to measure the quality of the
service supplier and his work. This makes it easier for them to ensure trust in the
supplier. They search for the reputation of the supplier in the market. This means,
they are looking for opinion and evaluations of the supplier and his performance
among other exhibitors. Therefore, the trade fair organizations should encourage
their satisfied customers to signal their satisfaction in the market. Moreover, the
trade fair organizations should ensure to distribute such statements as well.
However, the exhibitors stated their desire for receiving information from
independent sources. While German exhibitors do not see a very high relevance
in this, especially the Asian but also the European customers rate this valuable for
building trust. Thus, trade fair organizers should use their press contacts to
establish frequent documentation about the service performances of the trade fair
MAIKE U. BUSCH 274
organizers. Additionally, independent certifications that test the supplier and his
work are significantly higher rated by Asian exhibitors. Independent certifications
can ensure a reduction of uncertainty and, therefore, reduce the information
asymmetry. They help develop trust. ISO certification, TÜV certifications or other
internationally known qualifications should be considered by trade fair
organizers to reach their goal of selling more services.
Furthermore, especially Asian exhibitors – but also the European – approve of a
way to express their complaints if they occur. For them, it is highly trust-
supportive if the service supplier offers a serious complaint management. This
again goes in line with showing openness and transparency and being open to
criticism. This proves the supplier to be willing to support the exhibitor and adapt
according to his needs and wishes.
To prevent such complaints, the foreign exhibitors like to preview the service
offers. As mentioned in the literature review, it is difficult to display services.
However, the service supplier should determine ways to materialize services to a
certain extend. This could be done by photographic or cinematic documentaries,
invitations to other exhibitions, so they can see the performance of services in
action, or the organization of open days or road shows, for example. Such events
or products can clearly reduce the felt uncertainty as well as the information
asymmetry. The exhibitor can visualize and get an idea of the supplier’s service
performance and production process.
German exhibitors differ in the aspects of the readiness to act and the provision of
correct information which can be trusted without searching for more sources of
information. They rank these aspects higher than their foreign equivalents. Thus,
the German exhibitors focus more on the actual work project.
The aspect of public interest, social responsibility and charity got highest scores
only by about one half of the complete sample. It is, therefore, the least important
communication aspect of the list for the medical industry. Nevertheless, it should
be noted, that almost two-thirds of the Asian exhibitors gave it a score of 4 or 5 –
so for this subgroup, this aspect is still fairly relevant in order to build and
maintain trust.
Consequently, referring again to the research questions, it can be stated that the
communication between the service supplier and his customer plays an essential
CONCLUSION
275
role in building and maintaining trust. Yet, communication does not only refer to
the actual conversation between the two parties but also to other relevant
communication items around. While some of them are highly important to the
whole sample, again, differences can be observed when considering stand size or
especially when considering the exhibitors’ origin. Trade fair organizing
companies need to take these aspects into consideration.
Recapitulating the findings above, several expectations of the customers of the
worldwide medical industry could be retrieved from the study. The customers
indicate that trust is essential for a partnership with a service supplier. They also
indicate ways to build and maintain trust between the two parties. While many
aspects are generally similar valued within the industry in focus, booked stand
sizes as well as origin are characteristics to consider when planning to establish
trust within the business relationship between a trade fair exhibitor and a service
provider.
The two figures below summarize the findings on how to address the medical
industry for reaching the purpose of building and maintaining trust in the
business relationship. First, the general aspects of trust and the communication
are given, then, they are specified according to stand size respectively origin.
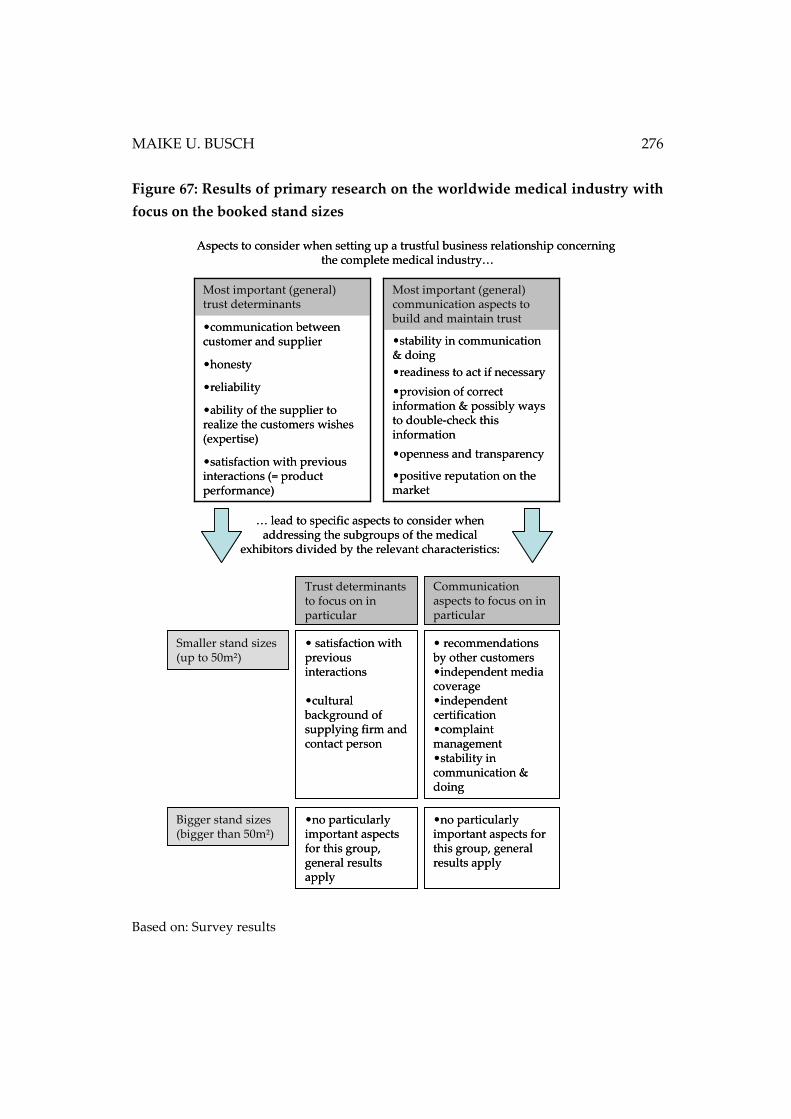
MAIKE U. BUSCH 276
Figure 67: Results of primary research on the worldwide medical industry with
focus on the booked stand sizes
Based on: Survey results
•satisfaction with previous interactions (= product performance)
•ability of the supplier to realize the customers wishes (expertise)
•reliability
•honesty
•communication between customer and supplier
Most important (general) trust determinants
•openness and transparency
•provision of correct information & possibly ways to double-check this information
•readiness to act if necessary
•stability in communication & doing
Most important (general) communication aspects to build and maintain trust
•positive reputation on the market
Aspects to consider when setting up a trustful business relationship concerning the complete medical industry…
… lead to specific aspects to consider when addressing the subgroups of the medical
exhibitors divided by the relevant characteristics:
Smaller stand sizes (up to 50m²)
Bigger stand sizes (bigger than 50m²)
Trust determinants to focus on in particular
Communication aspects to focus on in particular
• satisfaction with previous interactions
•cultural background of supplying firm and contact person
• recommendations by other customers•independent media coverage•independent certification•complaint management•stability in communication & doing
•no particularly important aspects for this group, general results apply
•no particularly important aspects for this group, general results apply
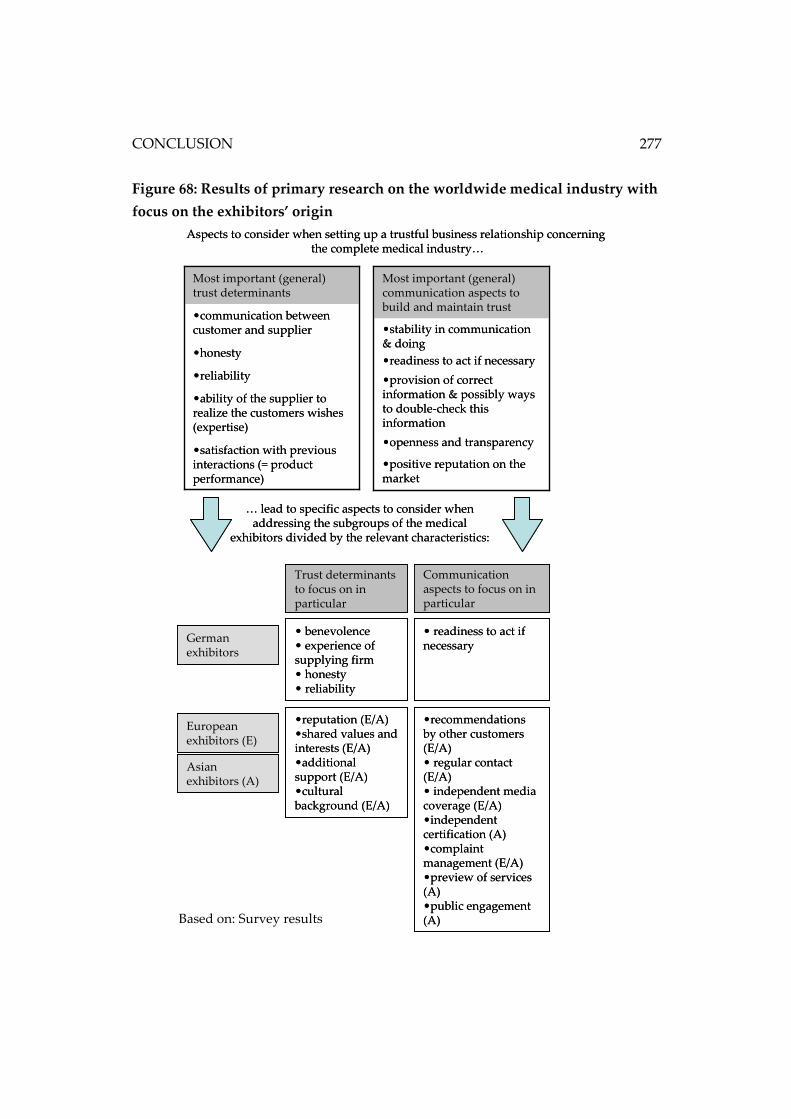
CONCLUSION
277
Figure 68: Results of primary research on the worldwide medical industry with
focus on the exhibitors’ origin
•satisfaction with previous interactions (= product performance)
•ability of the supplier to realize the customers wishes (expertise)
•reliability
•honesty
•communication between customer and supplier
Most important (general) trust determinants
•openness and transparency
•provision of correct information & possibly ways to double-check this information
•readiness to act if necessary
•stability in communication & doing
Most important (general) communication aspects to build and maintain trust
German exhibitors
European exhibitors (E)
Asian exhibitors (A)
• benevolence• experience of supplying firm• honesty • reliability
•reputation (E/A)•shared values and interests (E/A)•additional support (E/A)•cultural background (E/A)
• readiness to act if necessary
•recommendations by other customers (E/A)• regular contact (E/A)• independent media coverage (E/A)•independent certification (A)•complaint management (E/A)•preview of services (A)•public engagement (A)
•positive reputation on the market
Aspects to consider when setting up a trustful business relationship concerning the complete medical industry…
… lead to specific aspects to consider when addressing the subgroups of the medical
exhibitors divided by the relevant characteristics:
Trust determinants to focus on in particular
Communication aspects to focus on in particular
Based on: Survey results
MAIKE U. BUSCH 278
6.2.2.3 Buying center analysis (medical industry) to support a successful
business relationship
As retrieved from the literature review, the buying center plays an important part
in the establishment of a successful customer-supplier relationship in business
markets. The members of the buying center, their positions, experiences and
cultural backgrounds can give vital insights as scientific research has already
proven.
In the medical industry mainly CEOs and marketing officers take decisions
regarding trade fair participations. Yet, particularly in smaller firms, mostly the
CEO is the final decision taker. The CEOs should have a great insight in the
markets; however, it can be assumed that they are not all deeply familiar with the
absolute details of the service ordering for trade shows as they are not necessarily
the responsible persons for the operational trade fair preparations in the company
due to their range of tasks in their position. This gets obvious when considering
the responsibility of deciding on and taking final decisions about the services,
needed for a trade fair participation. Here, the marketing departments of the
companies (all sizes) take over. The marketing departments are then also the ones
keeping in touch with the trade fair organizing company, meaning they are the
contacts the organizers talk to. Additionally to the marketing departments, in
foreign companies, especially Asian, the contacts are also located in the sales
departments. So, the service supplier should be aware of the fact that the contact
might not be specialized in the marketing field as his main responsibilities lie in a
different area. The information asymmetry could be more distinct due to the
contact’s expertise in a different field. The communication with those contacts has
to be adapted according to the receivers’ state of knowledge and experience.
Presumably a more deeply informative style of communication can help bridging
the gaps here. The research also discovered a tendency to a higher need of
independent information and samples of goods in this subgroup compared to the
marketing contacts.
Nevertheless, in the target groups in focus, meaning the international medical
industry, a high level of experience with trade fair participations in general can be
detected.
CONCLUSION
279
6.2.2.4 Generalization of results
In order to validate the research results a step further, the survey was carried out
among another industry. As stated earlier, due to practical reasons, the glasstec,
meeting point for the worldwide glass manufacturing industry, was chosen.
As for the medical industry, trust is regarded important if not essential in order to
set up a functioning business relationship with a service provider. Moreover, the
majority also seeks for a long-time business relationship. So these results are
comparable and transferrable.
When considering the different trust determinants as well as the communication
aspects for building trust, the results of the complete sample were compared. The
results of how the single items are rated, is very similar in both target groups.
Aspects, exhibitors of the medical industry attached a high importance to, are the
same ones rated valuable by the exhibitors of the glass manufacturing industry.
So the overall results are transmittable.
Going into detail of testing the hypotheses, it can be stated that the characteristics
of the exhibitors, such as booked stand size or origin play an important part.
Depending on these variables, exhibitors in both industry sectors show significant
differences regarding the weighting of single trust determinants or
communication aspects. In both cases, the exhibitor status meaning the aspect, if
an exhibitor is new to the trade fair or not, does not lead to any or only to minor
variations in the rating. However, the specific items rated significantly differently
within the two target groups are not always the same ones. European exhibitors
of the medical industry differ, for example, in other aspects from their
comparable subgroups, as the exhibitors of the glass manufacturing industry do.
Here, differences can be observed between the two industries. This leads to the
conclusion that generally speaking, trade fair organizations wanting to sell their
own services, need to consider especially the origin as well as the booked stand
size in order to create trust.
Although the setting of the research project is situated in the trade fair industry,
the exhibiting industries are the ones that matter. Thus, the creation of trust as
well as trust itself is perceived differently in different industries exhibiting on
German fairgrounds.
Therefore, as the results cannot be transferred completely, the advice for German
trade fair companies trying to sell their services would be to use this survey
MAIKE U. BUSCH 280
method in means of the questionnaire and evaluation procedure and conduct
surveys in all relevant industries. Results could then be used for the customer
relationship procedures and for setting up a trust building communication with
the potential customers. These results therefore back the literature findings in this
respect.
Regarding the buying center structure, results in the investigated industries are
similar. The allocation of roles within the buying centers are comparable, also
when considering company sizes or the origin of the companies.

CONCLUSION
281
6.3 IMPLICATIONS OF THIS STUDY
According to scientific research, services are goods with a high level of credence
qualities and high degree of diversification due to its characteristics of the
integration of the external factor and the immateriality. The relationship between
the buyer and the provider, meaning the principal who orders the service and the
agent who actually provides it, is essential in such a business relationships.
Several techniques can be used to reduce the information asymmetries between
the two parties, however, according to the scientific state of the art, only building
trust can succeed when goods of high credence qualities are sold.
Therefore, theory has shown that the establishment of trust can be a useful way in
order to sell services more effectively. However, trust research is still a rather
young field of research in economics. Therefore, gaps are still present that need to
be filled.
Economic trust researchers have claimed that trust is a very complex and diverse
construct. It consists of a number of possibly relevant determinants that form
trust within business relationships. They have also detected a number of
communication methods to support this intention. Yet, they additionally have
discovered that the relevant aspects vary in their significances and priorities
according to the different industries and possibly characteristics of the
individuals within the industry itself.
From the findings of this research at hand, first of all it can be confirmed that trust
is an essential part in selling services. This study supports the previous findings.
It also supports the statement of importance of provider-buyer relationships for
the effective selling of service goods. Considering the overall results of the
complete sample, it can additionally be confirmed that the pool of trust-
developing determinants and communication methods seems to be proven
correct. However, just as previous research has investigated, too, the valuation of
these factors vary from industry to industry.
This study was performed within the German trade fair industry. First and most
important is the fact that the German trade fair industry itself is very diverse. In
MAIKE U. BUSCH 282
order to establish trust in the relationships between the exhibitor and the trade
fair organizer not the trade fair industry itself should be looked at. The exhibitors
need to be categorized by the industries sectors they are situated on. Then, these
industries mark the basis for the subsequent trust research.
The exhibitors value trust and look for trust when services are bought, especially
if the service is not the core business of the supplier.
Exhibitors show differences in their assessment of trust determinants according to
their characteristics. While the exhibitor status seems rather negligibly, the origin
and the booked stand size of the exhibitor has to be considered. Here, the
evaluation of single trust and trust-developing communication aspects differs
significantly among the groups, especially in the comparison from German to
foreign exhibitors.
Furthermore, the research has discovered an obstacle to group the trust-building
communication items generally into clusters. Each exhibiting industry, therefore,
requires an individual analysis.
Nevertheless, the established set-up method of this research can be transferred to
other industries to discover their trust behavior in detail.
CONCLUSION
283
6.4 LIMITATIONS OF THE STUDY AND RECOMMENDATIONS FOR
FUTURE RESEARCH
In the following a short description of the limitations of this study is given.
Moreover, future research recommendations are presented which at least partly
result from the limitations.
Trust research is still a rather young field in economic science. The author has
tried her best to collect and structure the scientific findings in order to conduct
this research at hand. Based on these findings the questionnaire was developed.
However, due to the so far limited research results, especially in this particular
field of economics, the author cannot guarantee an unmitigated coverage of all
trust determinants and trust effecting communication methods. Future research
might detect additional factors which then should be included in the practical
trust research in economic settings.
Furthermore, the research could only be carried out in two exhibitor industries,
the worldwide medical industry and the worldwide glass industry. So, the
findings are limited to them. Additionally, both trade fairs were located on the
same fair ground which might have had an impact on the answers as well. Since
Germany hosts one of the world’s busiest and biggest trade fair markets, future
research should be carried out to meet the variety of industries present on all
German fair grounds.
Moreover, the survey asked human beings to state their opinions and feelings.
The author has to trust the correctness of these answers.
For future research, a more detailed categorization of the trade fair services
according to their performance levels could also lead to more specific results.
Finally, the statistical analysis should be critically viewed with regards to the
alpha- and beta hypothesis testing. An alpha error or type I error occurs when a
researcher decided to reject the null hypotheses in favor of the alternative
hypothesis. However, the null hypothesis is true. Vice versa, the type II or also
called beta error occurs when the researcher fails to reject the false null
hypothesis. (Black 2012, p. 304) Both errors are linked to the sample. Since not the
MAIKE U. BUSCH 284
population was reached and gave their opinions, but only a sample, there is
always the possibility of having an unbalance in this sample. (Biemann 2009,
pp. 207–210)
Nevertheless, the attempt of this research was to discover the usefulness of trust
in selling services for Germany trade fair organizations. The intention was to shed
a light on economic trust research and the understanding of trust as well as its
usefulness for selling purposes in the service business. These goals have been
accomplished.
PUBLICATION BIBLIOGRAPHY
285
PUBLICATION BIBLIOGRAPHY
Alparslan, Adem (2006): Strukturalistische Prinzipal-Agent-Theorie. Eine
Reformulierung der Hidden-Action-Modelle aus der Perspektive des
Strukturalismus. Wiesbaden: Deutscher Universitäts-Verlag GWV Fachverlage
GmbH, Wiesbaden (Gabler Edition Wissenschaft).
Anderson, David R.; Sweeney, Dennis J.; Williams, Thomas A.; Freeman,
Neville James; Shoesmith, Eddie (2014): Statistics for business and economics.
Third edition, EMEA edition. Andover, Hampshire: Cengage Learning.
Anderson, Erin; Chu, Wujin; Weitz, Barton (1987): Industrial Purchasing: An
Empirical Exploration of the Buyclass Framework. In Journal Of Marketing 51,
pp. 71–86.
Andrich, René; Bamberger, Gustel; Boving, Dagmar; Böhm, Thomas; Büchner,
Mirko; Czech-Winkelmann, Susanne et al. (2008): Handbuch International
Business. Strategie, Praxis, Fallbeispiele. Berlin: Schmidt, Erich.
Arrow, Kenneth J. (1972): Gifts and Exchanges. In Philosophy and Public Affairs 1
(4), pp. 343–362.
Arrow, Kenneth J. (1969): The organization of economic activity: issues pertinent
to the choice of market versus nonmarket allocation. In The analysis and evaluation
of public expenditure: the PPB system (1), pp. 59–73.
Arrow, Kenneth J. (1984): The Economics of Agency. Edited by Center
for research on organizational efficiency. Stanford University. Stanford (Technical
Report, 451). Available online at
http://oai.dtic.mil/oai/oai?verb=getRecord&metadataPrefix=html&identifier=ADA
151436, checked on 7/15/2015.
Arrow, Kenneth J. (1985): The Economics of Agency. In John W. Pratt, Richard
Zeckhauser (Eds.): Principals and agents. The structure of business. Boston, Mass.:
Harvard Business School Press (Research colloquium / Harvard Business School),
pp. 37–51.
MAIKE U. BUSCH 286
Arzt, Rowena (2007): Wettbewerbsfähigkeit europäischer Messeveranstalter.
Entwicklung und empirische Anwendung eines multidimensionalen
Bezugsrahmens. Köln: Kölner Wissenschaftsverl. (Logistik und
Unternehmensführung).
Aulakh P., Kotabe M. Sahay A. (1996): Trust and performance in cross-border
marketing partnerships. a behavioral approach. In Journal of International Business
Studies; 1996 Special Issue, Vol. 27 Issue 5, p1005-1032 (Vol. 27, Issue 5), pp. 1005–
1032.
AUMA, Association of the German Trade Fair Industry (Ed.) (2011): German
Trade Fair Industry - Review 2010. Berlin.
AUMA, Association of the German Trade Fair Industry (Ed.) (2012): German
Trade Fair Industry Review 2011. Berlin. Available online at
http://www.auma.de/en/DownloadsPublications/PublicationDownloads/Review2
011.pdf, checked on 7/19/2015.
AUMA, Association of the German Trade Fair Industry (2015): AUMA Review
2014 Download. AUMA Association of the German Trade Fair Industry.
AUMA, Ausstellungs- und Messe-Ausschuss der Deutschen Wirtschaft e.V.
(2007): 100 Jahre Messeverband in Deutschland. Berlin..
AUMA, Ausstellungs- und Messe-Ausschuss der Deutschen Wirtschaft e.V.
(Ed.) (2012): Die Messewirtschaft Bilanz 2011. Berlin..
AUMA, Ausstellungs- und Messe-Ausschuss der Deutschen Wirtschaft e.V.
(Ed.) (2013a): AUMA_MesseTrend 2013. Berlin..
AUMA, Ausstellungs- und Messe-Ausschuss der Deutschen Wirtschaft e.V.
(Ed.) (2013b): Die deutsche Messewirtschaft: Fakten, Funktionen, Perspektiven.
AUMA_Statement_2.5. Berlin.
AUMA, Ausstellungs- und Messe-Ausschuss der Deutschen Wirtschaft e.V.
(Ed.) (2014): Messemarkt Deutschland - Der Messemarkt - AUMA.
AUMA, Ausstellungs- und Messe-Ausschuss der Deutschen Wirtschaft e.V.
(Ed.) (2015a): AUMA_MesseTrend 2015. Berlin.
PUBLICATION BIBLIOGRAPHY
287
AUMA, Ausstellungs- und Messe-Ausschuss der Deutschen Wirtschaft e.V.
(Ed.) (2015b): Die Messewirtschaft: Bilanz 2014. Berlin.
AUMA, Ausstellungs- und Messe-Ausschuss der Deutschen Wirtschaft e.V.
(Ed.) (2015c): Verhalten und Struktur der Fachbesucher auf deutschen Messen.
Berlin.
Backhaus, Klaus; Erichson, Bernd; Plinke, Wulff; Weiber, Rolf (2000):
Multivariate Analysemethoden. Eine anwendungsorientierte Einführung ; mit 230
Tabellen : mit 217 Abbildungen und 230 Tabellen. 9., überarb. und erw. Aufl.
Berlin [etc.]: Springer (Springer-Lehrbuch).
Backhaus, Klaus; Erichson, Bernd; Plinke, Wulff; Weiber, Rolf (2011):
Multivariate Analysemethoden. Eine anwendungsorientierte Einführung. 13.,
überarb. Aufl. Berlin [u.a.]: Springer (Springer-Lehrbuch).
Backhaus, Klaus; Günter, Bernd (1976): A phase-differentiated interaction
approach to industrial marketing decisions. In Industrial Marketing Management 5,
pp. 255–270.
Backhaus, Klaus; Voeth, Markus (2010): Industriegütermarketing. 9th ed.
München: Vahlen.
Backhaus, Klaus; Voeth, Markus (2014): Industriegütermarketing. 10 th ed.
München: Vahlen, Franz (Vahlens Handbücher der Wirtschafts- und
Sozialwissenschaften).
Bamberger, Burkhard (1994): Der Erfolg von Unternehmensakquisitionen in
Deutschland. Eine theoretische und empirische Untersuchung. Bergisch
Gladbach: Eul.
Barlett, James E.; Kotrlik, Joe W.; Higgins, Chadwick C. (2001): Organizational
Reseach: Determining Appropriate Sample Sizes in Survey Reseach. In Information
Technology, Learning, and Performance Journal 19 (1), pp. 43–50.
Baßeler, Ulrich; Heinrich, Jürgen; Koch, Walter A. S. (1995): Grundlagen und
Probleme der Volkswirtschaft. 14., überarb. und erw. Aufl., Studienausg. Köln:
Wirtschaftsverl. Bachem (Didaktische Reihe Ökonomie).
Bender, R.; Lange, S.; Ziegler, A. (2007): Wichtige Signifikanztests. In Deutsche
medizinische Wochenschrift (1946) 132 (1), pp. e24-e25.
MAIKE U. BUSCH 288
Berekoven, Ludwig (1983): Der Dienstleistungsmarkt in der Bundesrepublik
Deutschland. Theoretische Fundierung und empirische Analyse. 2 volumes.
Göttingen: Vandenhoeck & Ruprecht (1).
Berekoven, Ludwig; Eckert, Werner; Ellenrieder, Peter (2009): Marktforschung.
Methodische Grundlagen und praktische Anwendung. 12., überarb. und erw.
Aufl. Wiesbaden: Gabler (Gabler-Lehrbuch).
Berg, Hartmut; Cassel, Dieter; Hartwig, Karl-Hans (2007): Theorie der
Wirtschaftspolitik. In : Vahlens Kompendium der Wirtschaftstheorie und
Wirtschaftspolitik. 9., überarb. Aufl. München: Vahlen, pp. 243–368.
Berry, Leonard; Parasuraman, A. (2000): Services marketing starts from within. In
Richard J. Varey, Barbara R. Lewis (Eds.): Internal marketing. Directions for
management. London, New York: Routledge, pp. 173–191.
Beye, Daniel (2013): Transparenz und vertrauen in der beratung. Die bedeutung
von transparenz fur das vertrauen der. [S.l.]: Bachelor + Master Publish.
Biemann, Torsten (2009): Logik und Kritik des Hypothesentestens. In Sönke
Albers, Daniel Klapper, Udo Konradt, Achim Walter, Joachim Wolf (Eds.):
Methodik der empirischen Forschung. 3., überarb. und erw. Aufl. Wiesbaden:
Gabler, pp. 203–220.
Black, Ken (2012): Business statistics. For contemporary decision making. 7th ed.
Hoboken, NJ: Wiley.
Blackwell, Roger D.; Miniard, Paul W.; Engel, James F. (2006): Consumer
behavior. 10th ed. Mason, Ohio: Thomson/South Western.
Blankart, Charles B. (2011): Öffentliche Finanzen in der Demokratie. Eine
Einführung in die Finanzwissenschaft. 8., vollst. überarb. Aufl. München: Vahlen
(Vahlens Handbücher der Wirtschafts- und Sozialwissenschaften).
Bonoma, Thomas V. (2006): Major Sales - Who really does the buying? In Havard
Business Review (July-August 2006), pp. 172–181.
Bortz, Jürgen; Schuster, Christof (2010): Statistik für Human- und
Sozialwissenschaftler. 7., vollst. überarb. u. erw. Aufl. Berlin: Springer (Springer-
Lehrbuch).
PUBLICATION BIBLIOGRAPHY
289
Brosius, Felix (2013): SPSS 21: Verlagsgruppe Hüthig Jehle Rehm (mitp
Professional).
Bruhn, Manfred (2006): Qualitätsmanagement für Dienstleistungen. Grundlagen,
Konzepte, Methoden. 6., überarbeitete und erw. Aufl. Berlin: Springer.
Bruhn, Manfred (2009): Relationship Marketing. Das Management von
Kundenbeziehungen. 2., vollst. überarb. Aufl. München: Vahlen (Vahlens
Handbücher der Wirtschafts- und Sozialwissenschaften).
Bruhn, Manfred (2014): Marketing. Grundlagen für Studium und Praxis. 12.,
überarb. Aufl. 2014. Wiesbaden: Springer Gabler (SpringerLink : Bücher).
Bruhn, Manfred; Meffert, Heribert (2012): Handbuch Dienstleistungsmarketing.
Planung - Umsetzung - Kontrolle. Wiesbaden: Gabler (Meffert-Marketing-
Edition).
Bühl, Achim (2009): PASW 18. Einführung in die moderne Datenanalyse ;
[ehemals SPSS]. 12., aktualisierte Aufl. München, Boston [u.a.]: Pearson Studium
(Scientific tools).
Bühl, Achim (2010): SPSS 18. Einführung in die moderne Datenanalsyse (ehemals
PASW). 12th ed. München: Pearson Studium.
Bundesministeriums für Umwelt, Naturschutz, Bau und Reaktorsicherheit
(2013): Alle Gesetze und Verordnungen aus dem BMUB-Geschäftsbereich. Berlin.
Available online at http://www.bmub.bund.de/themen/strategien-bilanzen-
gesetze/gesetze-verordnungen/alle-gesetze-und-verordnungen-aus-dem-bmub-
geschaeftsbereich/#c8983; checked on 5/5/2015.
Burns, Alvin C.; Bush, Ronald F. (2000): Marketing research. 3rd ed. Upper
Saddle River, N.J.: Prentice Hall.
Burr, Wolfgang; Stephan, Michael (2006): Dienstleistungsmanagement.
Innovative Wertschöpfungskonzepte im Dienstleistungssektor. Stuttgart:
Kohlhammer ([W:]).
Busch, Paul; Wilson, David T. (1976): An Experimental Analysis of a Salesman's
Expert and Referent Bases of Social Power in the Buyer-Seller Dyad. In Journal of
Marketing Research 13 (1), pp. 3–11.
MAIKE U. BUSCH 290
Buß, Eugen (2007): Image und Reputation - Werttreiber für das Management. In
Manfred Piwinger, Ansgar Zerfaß (Eds.): Handbuch
Unternehmenskommunikation. Wiesbaden: Gabler, pp. 227–243.
Cassens, Brett J. (1992): Preventive medicine and public health. 2nd ed.
Baltimore, Malvern, Pa.: Williams & Wilkins; Harwal Pub. Co (The National
medical series for independent study).
Castaldo, Sandro; Premazzi, Katia; Zerbini, Fabrizio (2010): The Meaning(s) of
Trust. A Content Analysis on the Diverse Conceptualizations of Trust in Scholarly
Research on Business Relationships. In Journal of Business Ethics 96 (4), pp. 657–
668.
Clark, Colin (1940): The conditions of economic progress. London: Macmillan
and Co.
Coase, R. H. (1937): The Nature of the Firm. In Economica 4 (16), pp. 386–405.
Cochran, William G. (1977): Sampling techniques. 3d ed. New York: Wiley (A
Wiley publication in applied statistics).
Commons, John R. (1934): Institutional economics. Its place in political economy.
New York: Macmillan.
Cook, Karen S.; Schilke, Oliver (2010): The Role of Public, Relational and
Organizational Trust in Economic Affairs. In Corp Reputation Rev 13 (2), pp. 98–
109.
Corder, Gregory W.; Foreman, Dale I. (2009a): Nonparametric statistics for non-
statisticians. A step-by-step approach. Hoboken, N.J.: Wiley.
Corder, Gregory W.; Foreman, Dale I. (2009b): Nonparametric statistics for non-
statisticians. A step-by-step approach. Hoboken, N.J.: Wiley.
Cornelius, Christine (2008): Was ist Vertrauen? Der Vertrauensbegriff im
interdisziplinären Diskurs. München: GRIN Verlag GmbH.
Corsten, Hans; Gössinger, Ralf (2007): Dienstleistungsmanagement. 5th ed.
München u.a: Oldenbourg.
Cortekar, Jörg; Groth, Markus (2010): Die Bedeutung von Transaktionskosten
und Verfügungsrechten. In Wirtschaftsdienst 90 (12), pp. 826–830.
PUBLICATION BIBLIOGRAPHY
291
Coulter, Keith S.; Coulter, Robin A. (2002): Determinants of trust in a service
provider. The moderating role of length of relationship. In Journal of Services
Marketing 16 (1), pp. 35–50.
Crosby, Lawrence A.; Evans, Kenneth R.; Cowles, Deborah (1990): Relationship
Quality in Services Selling. An Interpersonal Influence Perspective. In Journal Of
Marketing 54 (3), pp. 68–81.
Darby, Michael R.; Karni, Edi (1973): Free Competition and the Optimal Amount
of Fraud. In Journal of Law and Economics 16 (1), pp. 67–88.
Day, George (2000): Capabilities for forging customer relationships. working
paper. working paper. Marketing Science Institute. Cambridge, MA (00-118).
Decker, Franz (1975): Einführung in die Dienstleistungsökonomie. Paderborn:
Schöningh (Uni-Taschenbücher, 505).
Delfmann, Werner; Arzt, Rowena (2005a): Besonderheiten der Strategischen
Positionierung von Messegesellschaften im Wettbewerb. In Werner Delfmann
(Ed.): Kölner Kompendium der Messewirtschaft. Das Management von
Messegesellschaften. Köln: Kölner Wiss.-Verl., pp. 105–115.
Delfmann, Werner; Arzt, Rowena (2005b): Intgegrierte Messelogistik als
strategischer Erfolgsfaktor. In Werner Delfmann (Ed.): Kölner Kompendium der
Messewirtschaft. Das Management von Messegesellschaften. Köln: Kölner Wiss.-
Verl., pp. 445–473.
Delfmann, Werner; Arzt, Rowena (2005c): Möglichkeiten zur Generierung von
Wettbewerbsvorteilen bei Messegesellschaften. In Werner Delfmann (Ed.): Kölner
Kompendium der Messewirtschaft. Das Management von Messegesellschaften.
Köln: Kölner Wiss.-Verl., pp. 117–139.
Denize, Sara; Young, Louise (2007): Concerning trust and information. In
Industrial Marketing Management 36 (7), pp. 968–982.
Deutsche Messe AG (Ed.) (2014): Portrait EMO Hannover. Available online at
http://www.emo-hannover.de/en/about-the-trade-show/facts-
figures/profile/portrait-emo-hannover.
Dibb, Sally; Simkin, Lyndon (2009): Marketing essentials. Australia, London:
South-Western Cengage Learning.
MAIKE U. BUSCH 292
Doney, Patricia M.; Cannon, Joseph P. (1997): An Examination of the Nature of
Trust in Buyer-Seller Relationships. In Journal Of Marketing (61), pp. 35–51.
Döring, Wilhelm (1956): Handbuch der Messen und Ausstellungen. Darmstadt:
Verkehrs- und Wirtschaftsarchiv.
Doyle, Charles (2011): A dictionary of marketing. Oxford, New York: Oxford
University Press (Oxford paperback reference series).
Dührkop, Claudia (2010): Besonderheiten der Kommunikationspüolitik im
Dienstleistungsmarketing. In Jost W. Kramer (Ed.): Neue Entwicklungslinien im
Dienstleistungsmarketing. 1st ed. Bremen: Europäischer Hochschulverlag
(Wismarer Schriften zu Management und Recht, 50), pp. 133–166.
Dwyer, F. Robert; Schurr, Paul H.; Oh, Sejo (1987): Developing Buyer-Seller
Relationships. In Journal Of Marketing 51 (2), pp. 11–27.
Ebert, Tara A. E. (2009): Facets of Trust in Relationships – A Literature Synthesis
of Highly Ranked Trust Articles. In Journal of Business Market Management 3 (1),
pp. 65–84.
Eckardt, Gordon H. (2010): Business-to-Business-Marketing. Eine Einführung für
Studium und Beruf. Stuttgart: Schäffer-Poeschel.
Eichenberger, Philippe; Hulliger, Beat; Potterat, Jan (2011): Two Measures for
Sample Size Determination. In Survey Research Methods 5 (1), pp. 27–37.
Einwiller, Sabine (2003): Vertrauen durch Reputation im elektronischen Handel.
Gabler Edition Wissenschaft. Wiesbaden: Deutscher Universitätsverlag.
Endress, Martin (2001): Vertrauen. Bielefeld: Transcript (Einsichten: Themen der
Soziologie).
Endreß, Martin (2013): Soziologische Theorien kompakt. 2., aktualisierte Aufl.
München: Oldenbourg (Soziologie kompakt).
Engelhardt, Werner H. (1990): Dienstleistungsorientiertes Marketing — Antwort
auf die Herausforderung durch neue Technologien. In Dietrich Adam, Klaus
Backhaus, Heribert Meffert, Helmut Wagner (Eds.): Integration und Flexibilität.
Eine Herausforderung für die Allgemeine Betriebswirtschaftslehre. Wiesbaden:
Gabler Verlag, pp. 269–288.
PUBLICATION BIBLIOGRAPHY
293
Engelhardt, Werner H.; Kleinaltenkamp, Michael; Reckenfelderbäumer, Martin
(1992): Dienstleistungen als Absatzobjekt. Bochum (Arbeitsbericht / Institut für
Unternehmensführung und Unternehmensforschung, Ruhr-Universität Bochum,
Nr. 52).
Engelhardt, Werner H.; Kleinaltenkamp, Michael; Reckenfelderbäumer, Martin
(1993): Leistungsbündel als Absatzobjekte. In Zeitschrift für betriebswirtschaftliche
Forschung 45 (5), pp. 395–426.
Enke, Margit; Greschuchna, Larissa (2005): Aufbau von Vertrauen in
Dienstleistungsinteraktionen durch Instrumente der Kommunikationspolitik.
dargestellt am Beispiel der Beratung kleiner und mittlerer Unternehmen. Edited
by Technische Universität Bergakademie Freiberg (Freiberger Arbeitspapiere, 6).
Erikson, Erik H. (1953): Growth and crises of the healthy personality. In Psyche 4
(7), pp. 1–31.
Erikson, Erik H. (1963): Childhood and society. Rev. ed. London: W. W. Norton &
Company.
Erikson, Erik H. (1995, ©1963): Childhood and society. Rev. ed. London: Vintage.
Erlei, Mathias; Sauerland, Dirk; Leschke, Martin (2007): Neue
Institutionenökonomik. 2nd ed. Stuttgart: Schäffer-Poeschel.
Erlei, Matthias (2007): Mikroökonomik. In: Vahlens Kompendium der
Wirtschaftstheorie und Wirtschaftspolitik. 9., überarb. Aufl. München: Vahlen,
pp. 1–140.
Essig, Michael; Amann, Markus (2013): E-procurement and Its Role in Supply
Management and Supplier Valuation. In Christine Harland, Guido Nassimbeni,
Eugene Stewart Schneller (Eds.): The SAGE handbook of strategic supply
management. Relationships, chains, networks and sectors. London: SAGE.
Everitt, Brian (2011): Cluster analysis. 5th ed. Chichester, West Sussex, U.K.:
Wiley (Wiley series in probability and statistics).
MAIKE U. BUSCH 294
FAMAB e.V. - Verband Direkte Wirtschaftskommunikation (Ed.) (2015):
Branchenbrief für die Direkte Wirtschaftskommunikation 2015. Rheda-
Wiedenbrück. Available online at
http://famab.de/fileadmin/user_upload/3.0_Aktuelles/3.5_Brancheninformationen
/Branchenbrief_14_15.pdf, checked on 7/7/2015.
Fliess, Sabine (2009): Dienstleistungsmanagement. Kundenintegration gestalten
und steuern. Wiesbaden: Gabler (Lehrbuch).
Fourastié, Jean (1949): Le grand espoir du XXe siècle;. Progrès technique, progrès
économique, progrès social. Paris: Presses universitaires de France.
Frambach, Hans (2003): Vertrauen in der Neuen Institutionenökonomie. In
Michael Schmid, Andrea Maurer (Eds.): Ökonomischer und soziologischer
Institutionalismus. Interdisziplinäre Beiträge und Perspektiven der
Institutionentheorie und -analyse. Marburg: Metropolis, pp. 227–244.
Freeman, Jim; Shoesmith, Eddie; Sweeney, Dennis J.; Anderson, David R.;
Williams, Thomas A. (2014): Statistics for business and economics. 3. edition.
Andover: Cengage Learning.
Frey, Dieter; Bierhoff, Hans-Werner (2011): Sozialpsychologie - Interaktion und
Gruppe. Göttingen, Bern, Wien [u.a.]: Hogrefe (Psychlehrbuch plus).
Fried, Johannes; Boockmann, Hartmut (Eds.) (1990): Die Frankfurter Messe. 750
Jahre Messen in Frankfurt ; Besucher und Bewunderer; literarische Zeugnisse aus
ihren ersten acht Jahrhunderten. Frankfurt am Main: Umschau-Verl.
Friese, Malte; Hofmann, Wilhelm; Naumann, Ewald; Rasch, Björn (2010):
Quantitative Methoden. Einführung in die Statistik für Psychologen und
Sozialwissenschaftler. 3., erw. Aufl. Berlin [u.a.]: Springer (Springer-Lehrbuch
Bachelor).
Frietzsche, Ursula; Scheuch, Fritz (2001): Externe Faktoren in der
Dienstleistungsproduktion. Ansätze zur Lösung von Erfassungs- und
Bewertungsproblemen. 1. Aufl. Wiesbaden: Dt. Univ.-Verl. (Gabler Edition
Wissenschaft).
PUBLICATION BIBLIOGRAPHY
295
Friman, Margareta; Gärling, Tommy; Millett, Bruce; Mattsson, Jan; Johnston,
Robert (2002): An analysis of international business-to-business relationships
based on the Commitment–Trust theory. In Industrial Marketing Management 31
(5), pp. 403–409.
Fritsch, Michael (2014): Marktversagen und Wirtschaftspolitik.
Mikroökonomische Grundlagen staatlichen Handelns. 9. Aufl. München: Vahlen,
Franz (Vahlens Handbücher der Wirtschafts- und Sozialwissenschaften).
Furubotn, Eirik Grundtvig; Richter, Rudolf (2005): Institutions and economic
theory. The contribution of the new institutional economics. 2nd ed. Ann Arbor:
University of Michigan Press.
Ganesan, Shankar (1994): Determinants of long-term orientation in buyer-seller
relationships. In Journal Of Marketing 58 (2), pp. 1–19.
Gebauer, Heiko (2008): Identifying service strategies in product manufacturing
companies by exploring environment–strategy configurations. In Industrial
Marketing Management 37 (3), pp. 278–291.
Geißler, Rainer (2014): Die Sozialstruktur Deutschlands. 7th ed.: Springer
Fachmedien Wiesbaden.
Gemeinschaft Deutscher Großmessen e.V. (2014): Gemeinschaft Deutscher
Großmessen e.V. wählt Klaus Dittrich zum Vorstandssprecher. München.
Mohanty, Alexander, [email protected], checked on
7/7/2015.
GfK Polonia (Ed.) (2013): Analysis of sample size in consumer surveys. Available
online at
http://ec.europa.eu/economy_finance/db_indicators/surveys/documents/worksho
ps/2013/pl-gfk_k._pusczak_-_sample_size_in_customer_surveys_v2_2.pdf,
checked on 12/6/2015.
Giddens, Anthony (1991): Modernity and self-identity. Cambridge: Polity Press.
Gilbert, Dirk Ulrich (2007): Vertrauen als Gegenstand der ökonomischen
Theorie. In ZS Manag 2 (1), pp. 60–107.
MAIKE U. BUSCH 296
Godefroid, Peter; Pförtsch, Waldemar A. (2013): Business-to-Business-Marketing.
5. Aufl. Herne, Westf: NWB Verlag (Modernes Marketing für Studium und
Praxis).
Goebel, Elisabeth (2002): Neue Institutionenökonomik. Konzeption und
betriebswirtschaftliche Anwendungen. Stuttgart: Lucius & Lucius.
Gonzalez, Richard (2009): Data analysis for experimental design. New York:
Guilford Press.
Grimm, Cornelia (2004): Möglichkeiten und Grenzen des Beziehungsmarketing
im Messewesen. Theoretische und empirische Analyse der Eignung des
Beziehungsmarketing-Konzepts für Fachbesucher. Nürnberg: Wiss. Ges. für
Innovatives Marketing (Schriften zum innovativen Marketing, Bd. 11).
Groß, W.-D. (2004): Kein freies Spiel der Kräfte. In m+a report (4), pp. 18–20.
Groucutt, Jon; Leadley, Peter; Forsyth, Patrick (2004): Marketing. Essential
principles, new realities. London, Sterling, VA: Kogan Page.
Hadwich, Karsten (2003): Beziehungsqualität im Relationship Marketing.
Konzeption und empirische Analyse eines Wirkungsmodells. Wiesbaden: Gabler
Verlag (Basler Schriften zum Marketing).
Haeberle, Karl Erich; Bühler, Karl (1992): Messe-Logistik als Determinante des
Messeerfolgs. In Karl-Heinz Strothmann, Manfred Busche (Eds.): Handbuch
Messemarketing. Wiesbaden: Gabler Verlag, pp. 271–286.
Haller, Sabine (2005): Dienstleistungsmanagement. Grundlagen, Konzepte,
Instrumente. 3., aktualisierte und erw. Aufl. Wiesbaden: Gabler (Lehrbuch).
Haller, Sabine (2015): Dienstleistungsmanagement. Grundlagen - Konzepte -
Instrumente. 6., vollst. erw. u. überarb. Aufl. 2015. Wiesbaden: Springer
Fachmedien Wiesbaden GmbH.
Hayek, Friedrich A. von (1952a): Der Sinn des Wettbewerbs. In Friedrich A. von
Hayek, Kurt R. Leube: Individualismus und wirtschaftliche Ordnung. 2., erw.
Aufl. Zürich: Erlenbach, pp. 122–140.
PUBLICATION BIBLIOGRAPHY
297
Hayek, Friedrich A. von (1952b): Die Verwertung des Wissens in der
Gesellschaft. In Friedrich A. von Hayek, Kurt R. Leube: Individualismus und
wirtschaftliche Ordnung. 2., erw. Aufl. Zürich: Erlenbach, pp. 103–121.
Hays, William L. (1994): Statistics. 5th ed. Fort Worth: Harcourt Brace College
Publishers.
Held, Martin; Kubon-Gilke, Gisela; Sturm, Richard (2005): Reputation und
Vertrauen. Marburg: Metropolis-Verl. (Jahrbuch normative und institutionelle
Grundfragen der Ökonomik, 4).
Helm, Sabrina (2007): Unternehmensreputation und Stakeholder-Loyalität. 1.
Aufl. Wiesbaden: Dt. Univ.-Verl. (Neue betriebswirtschaftliche Forschung, 356).
Hentschel, Bert (1992): Dienstleistungsqualität aus Kundensicht. Vom merkmals-
zum ereignisorientierten Ansatz. Wiesbaden: Dt. Univ.-Verl. u.a (DUV :
Wirtschaftswissenschaft).
Herger, Nikodemus (2006): Vertrauen und Organisationskommunikation.
Identität - Marke - Image - Reputation. 1. Aufl. Wiesbaden: VS Verlag für
Sozialwissenschaften (Organisationskommunikation).
Hilke, Wolfgang (1989): Dienstleistungs-Marketing. Banken und Versicherungen.
Freie Berufe. Handel und Transport. Wiesbaden: Gabler Verlag (Schriften zur
Unternehmensführung).
Hippe, Alan (1997): Interdependenzen von Strategie und Controlling in
Unternehmensnetzwerken. Wiesbaden: Gabler Verlag (nbf Neue
Betriebswirtschaftliche Forschung, 213).
Hippner, Hajo; Hubrich, Beate; Wilde, Klaus D. (2011): Grundlagen des CRM.
Strategie, Geschäftsprozesse und IT-Unterstützung. 3., vollständig überarbeitete
und erw. Aufl. Wiesbaden: Gabler Verlag / Springer Fachmedien Wiesbaden,
Wiesbaden.
Hodgson, Geoffrey M. (2006): What Are Institutions? In JOURNAL OF
ECONOMIC ISSUES XL (1).
Hogg, Michael A.; Vaughan, Graham M. (2008): Social psychology. 5th ed.
Harlow: Prentice Hall.
MAIKE U. BUSCH 298
Holl, Christopher (2004): Wahrnehmung, menschliches Handeln und
Institutionen. Von Hayeks Institutionenökonomik und deren Weiterentwicklung.
Tübingen: Mohr Siebeck (Untersuchungen zur Ordnungstheorie und
Ordnungspolitik, 47).
Hopf, Michael (1983): Ausgewählte Probleme zur Informationsökonomie. In
Wirtschaftswissenschaftliches Studium 10, pp. 313–318.
Hornby, Albert Sydney; Crowther, Jonathan (Eds.) (1995): Oxford advanced
learner's dictionary of current English. 5th ed. Oxford, England: Oxford
University Press.
Hubig, Christoph; Siemoneit, Oliver (2007): Vertrauen und Glaubwürdigkeit in
der Unternehmenskommunikation. In Manfred Piwinger, Ansgar Zerfaß (Eds.):
Handbuch Unternehmenskommunikation. 1. Aufl. Wiesbaden: Gabler, pp. 171–
188.
Hutt, Michael D.; Speh, Thomas W. (2013): Business marketing management.
B2B. 11th ed. Australia, Mason, OH: South-Western, Cengage Learning.
Jackson, Don D.; Beavin Bavelas, Janet; Watzlawick, Paul (2011): Pragmatics of
Human Communication: A Study of Interactional Patterns, Pathologies and
Paradoxes: W. W. Norton & Company.
Jacoby, Jacob (1977): Information Load and Decision Quality: Some Contested
Issues. In Journal of Marketing Research 14 (4), pp. 569–573.
Janssen, Jürgen; Laatz, Wilfried (2003): Statistische Datenanalyse mit SPSS für
Windows. Eine anwendungsorientierte Einführung in das Basissystem und das
Modul Exakte Tests. 4, neubearbeitete und erweiterte Auflage. Berlin, Heidelberg:
Springer Berlin Heidelberg; Imprint: Springer.
Jarnut, Jörg (1991): Die Anfänge des europäischen Messewesens. In Rainer Koch
(Ed.): Brücke zwischen den Völkern. Zur Geschichte der Frankfurter Messe; 3
Bände. 3 volumes. Frankfurt am Main: Historisches Museum (1), pp. 1–13.
Järvinen, Joel; Tollinen, Aarne; Karjaluoto, Heikki; Jayawardhena, Chanaka
(2012): Digital and Social Media Marketing Usage in B2B Industrial Section. In
Marketing Management Journal 22 (2), pp. 102–117.
PUBLICATION BIBLIOGRAPHY
299
Jensen, Michael C.; Meckling, William H. (1976): Theory of the firm: Managerial
behavior, agency costs and ownership structure. In Journal of Financial Economics
(3), pp. 305–360.
Johnson, Devon; Grayson, Kent (2005): Cognitive and affective trust in service
relationships. In Journal of Business Research 58 (4), pp. 500–507.
Jost, Peter-J (2001): Die Prinzipal-Agenten-Theorie in der
Betriebswirtschaftslehre. Stuttgart: Schäffer-Poeschel.
Justitz, Robert (2013): Werbung im Wandel. Von der Reichweite zur Relevanz. 1.,
neue Ausg. Norderstedt: Books on Demand.
Kaas, Klaus Peter (1992): Kontraktgütermarketing als Kooperation zwischen
Prinzipalen und Agenten. In Zeitschrift für betriebswirtschaftliche Forschung 44 (10),
pp. 884–901.
Kaas, Klaus Peter (1995a): Marketing und neue Institutionenökonomik. In Klaus
Peter Kaas (Ed.): Kontrakte, Geschäftsbeziehungen, Netzwerke - Marketing und
Neue Institutionenökonomik. Düsseldorf: Fachverl. Verl.-Gruppe Handelsblatt
(Schmalenbachs Zeitschrift für betriebswirtschaftliche Forschung: Sonderheft, 35),
pp. 1–17.
Kaas, Klaus Peter (1995b): Marketing zwischen Markt und Hierarchie. In Klaus
Peter Kaas (Ed.): Kontrakte, Geschäftsbeziehungen, Netzwerke - Marketing und
Neue Institutionenökonomik. Düsseldorf: Fachverl. Verl.-Gruppe Handelsblatt
(Schmalenbachs Zeitschrift für betriebswirtschaftliche Forschung: Sonderheft, 35),
pp. 19–60.
Kaas, Klaus-Peter (1995c): Informationsökonomik. In Bruno Tietz, Richard
Köhler, Joachim Zentes (Eds.): Handwörterbuch des Marketing. 2., völlig neu
gestaltete Aufl. Stuttgart: Schäffer-Poeschel Verlag (Enzyklopädie der
Betriebswirtschaftslehre, Bd. 4), pp. 971–981.
Kalka, Regine (2005): Produkt- und Servicepolitik. In Werner Delfmann (Ed.):
Kölner Kompendium der Messewirtschaft. Das Management von
Messegesellschaften. Köln: Kölner Wiss.-Verl., pp. 341–358.
MAIKE U. BUSCH 300
Kaufhold, Karl Heinrich (1996): Messen und Wirtschaftsausstellungen von 1650
bis 1914. In Peter Johanek, Heinz Stoob (Eds.): Europäische Messen und
Märktesysteme in Mittelalter und Neuzeit. Köln: Böhlau (Städteforschung: Reihe
A: Darstellungen, 39), pp. 239–294.
Keegan, Warren J.; Green, Mark C. (2013): Global marketing. 7th ed., global ed.
Boston, Mass., London: Pearson.
Kenning, Peter; Blut, Markus (2006): Vertrauen: ein Objekt des
Marketingmanagements?! In Hans H. Bauer, Marcus M. Neumann, Anja Schüle
(Eds.): Konsumentenvertrauen. Konzepte und Anwendungen für ein nachhaltiges
Kundenbindungsmanagement. München: Vahlen, pp. 3–16.
Kiefer, Markus (2013): Unternehmenskommunikation in 4 Minuten.
Denkanstöße, Anwendungen und Literaturempfehlungen. Stadtlohn: Wirtschaft-
Aktuell-Verl.
Kieser, Alfred (2006): Organisationstheorien. 6th ed. Stuttgart: Kohlhammer
([W:]).
Kirchgeorg, Manfred; Ermer, Beatrice; Wiedmann, Martin (2012):
Szenarioanalyse. Messen & Live Communication 2020. Edited by AUMA,
Ausstellungs- und Messe-Ausschuss der Deutschen Wirtschaft e.V. Berlin.
Kirchgeorg, Manfred; Springer, Christiane (2010): Relevanz und Ausgestaltung
der Messebeteiligungen für B-2-B-Marken. In Carsten Baumgarth (Ed.): B-to-B-
Markenführung. Grundlagen - Konzepte - best practice. Wiesbaden: Gabler,
pp. 539–560.
Kirmani, Amna; Rao, Akshay R. (2000): No Pain, No Gain:A Criticai Review of
the Literature on Signaling Unobservable Product Quality. In Journal Of Marketing
64, pp. 66–79.
Klante, Oliver (2008): Aktuelle Perspektiven des Marketingmanagements.
Reflektionen aus den Bereichen Holistic Branding, Media-Management und
Sustainability-Marketing ; Festschrift für Prof. Dr. Manfred Kirchgeorg zum 50.
Geburtstag. With assistance of Manfred Kirchgeorg. 1. Aufl. Wiesbaden: Gabler
(Gabler-Edition Wissenschaft).
PUBLICATION BIBLIOGRAPHY
301
Kleinaltenkamp, Michael; Jacob, Frank (2002a): German approaches to business-
to-business marketing theory. origins and structure. In Journal of Business Research
(55), pp. 149–155.
Kleinaltenkamp, Michael; Jacob, Frank (2002b): German approaches to business-
to-business marketing theory Origins and structure. In Journal of Business Research
2002 (55), pp. 149–155.
Kleinaltenkamp, Michael; Plinke, Wulff; Geiger, Ingmar; Jacob, Frank; Söllner,
Albrecht (Eds.) (2015): Business Relationship Management and Marketing.
Mastering Business Markets. Aufl. 2015. Berlin, Heidelberg: Springer Berlin
Heidelberg (Springer texts in business and economics).
Kliche, Mario; Baaken, Thomas; Pörner, Ronald (1990):
Investitionsgütermarketing. Positionsbestimmung und Perspektiven. Wiesbaden:
Gabler Verlag.
Kotler, Philip; Armstrong, Gary (2014): Principles of marketing. 15th ed., global
ed. Harlow [etc.]: Pearson.
Kotler, Philip; Keller, Kevin Lane; Opresnik, Marc Oliver (2015): Marketing-
Management. Konzepte - Instrumente - Unternehmensfallstudien. 14.,
aktualisierte Auflage. Hallbergmoos: Pearson (Pearson Studium - Economic
BWL).
Kotler, Philip; Pfoertsch, Waldemar; Michi, Ines (2006): B2B brand management.
Berlin, New York: Springer.
Kötter, Harald (2013): AUMA. In Michael Dinkel, Stefan Luppold, Carsten
Schröer (Eds.): Handbuch Messe-, Kongress- und Eventmanagement. Sternenfels:
Verlag Wissenschaft & Praxis, pp. 23–24.
Krause, Detlef (1999): Luhmann-Lexikon. Eine Einführung in das Gesamtwerk
von Niklas Luhmann: mit über 500 Stichworten. 2., vollst. überarb., erw. und
aktualisierte Aufl. Stuttgart: Enke.
MAIKE U. BUSCH 302
Kresse, Hermann (2003): Die Bedeutung von Verbänden und Istitutionen in der
Messewirtschaft. In Manfred Kirchgeorg, Werner M. Dornscheidt, Wilhelm Giese,
Norbert Stoeck (Eds.): Handbuch Messemanagement. Planung, Durchführung
und Kontrolle von Messen, Kongressen und Events. Wiesbaden: Gabler, pp. 103–
115.
Kroeber-Riel, Werner; Weinberg, Peter; Gröppel-Klein, Andrea (2009):
Konsumentenverhalten. 9., überarb., aktualisierte und erg. Aufl. München:
Vahlen (Vahlens Handbücher der Wirtschafts- und Sozialwissenschaften).
Kumar, V.; Reinartz, Werner (2012): Customer Relationship Management.
Concept, Strategy, and Tools. 2nd ed. Dordrecht: Springer (Springer texts in
business and economics).
Kuß, Alfred (2012): Marktforschung. Grundlagen der Datenerhebung und
Datenanalyse. 4., überarb. Aufl. 2012. Wiesbaden: Gabler Verlag.
Kuß, Alfred; Wildner, Raimund; Kreis, Henning (2014): Marktforschung.
Grundlagen der Datenerhebung und Datenanalyse. 5., vollst. überarb. u. erw.
Aufl. 2014. Wiesbaden: Gabler (SpringerLink : Bücher).
Laux, Helmut (1988): Entscheidungstheorie II. Erweiterung und Vertiefung.
Zweite Auflage. Berlin, Heidelberg: Springer Berlin Heidelberg (Heidelberger
Lehrtexte Wirtschaftswissenschaften).
Lehmann, Axel P. (1998): Qualität und Produktivität im
Dienstleistungsmanagement. Strategische Handlungsfelder im Versicherungs-
und Finanzdienstleistungswettbewerb. Wiesbaden: Gabler Verlag (Neue
betriebswirtschaftliche Forschung, 246).
Leonidou, Leonidas C. (2004): Industrial manufacturer–customer relationships.
The discriminating role of the buying situation. In Industrial Marketing
Management 33 (8), pp. 731–742.
Lewicki, Roy J.; Benedict Bunker, Barbara (1996): Developing and Maintaining
Trust in Work Relationships. In Roderick M. Kramer, Tom R. Tyler (Eds.): Trust in
organizations. Frontiers of theory and research. Thousand Oaks, Calif.: Sage
Publications, pp. 114–139.
PUBLICATION BIBLIOGRAPHY
303
Lilien, Gary L.; Grewal, Rajdeep (2012): Handbook of Business-to-Business
Marketing. Cheltenham: Edward Elgar Pub.
Lindskold, Svenn (1978): Trust development, the GRIT proposal, and the effects
of conciliatory acts on conflict and cooperation. In Psychological Bulletin 85 (4),
pp. 772–793.
Loudon, David L.; Della Bitta, Albert J. (1993): Consumer behavior. Concepts
and applications. 4th ed. New York: McGraw Hill (McGraw-Hill Series in
Marketing).
Ludwig, Jörg (1999): Die Leipziger Messe in den ersten Jahren des Zollvereins
(1834-1860). In Hartmut Zwahr, Thomas Topfstedt, Günter Bentele (Eds.):
Leipzigs Messen 1497-1997. Gestaltwandel, Umbrüche, Neubeginn. Köln: Böhlau
(Geschichte und Politik in Sachsen, Bd. 9), pp. 351–366.
Luhmann, Niklas (2000): Vertrauen. Ein Mechanismus der Reduktion sozialer
Komplexität. 4. Aufl. Stuttgart: Lucius und Lucius (UTB für Wissenschaft, 2185).
m+a Internationale Messemedien, Deutsche Fachverlag GmbH (Ed.) (2015): m+a
expodatabase. Messen in Deutschland. Available online at
http://www.expodatabase.de/messen-deutschland/, checked on 12/5/2015.
Mai, Robert (2011): Der Herkunftslandeffekt. Eine kritische Würdigung des State
of the Art. In Journal für Betriebswirtschaft 61 (2-3), pp. 91–121.
Maier, Matthias (1997): Institutionen der außeruniversitären
Grundlagenforschung. Eine Analyse der Kaiser-Wilhelm-Gesellschaft und der
Max-Planck-Gesellschaft. Gabler Edition Wissenschaft. Wiesbaden: Springer
Fachmedien Wiesbaden (Markt- und Unternehmensentwicklung / Markets and
Organisations).
Maleri, Rudolf; Frietzsche, Ursula (2008): Grundlagen der
Dienstleistungsproduktion. 5., vollst. überarb. Aufl. Berlin, Heidelberg: Springer
(Springer-Lehrbuch).
Maurer, Emil (1970): Geschichte der europäischen Messen und Ausstellungen.
München-Hannover: Wirtschafts-Kurier.
MAIKE U. BUSCH 304
Mauro da Costa Hernandez; José; Cincotto dos Santos, Claudia (2010):
Development-based Trust: Proposing and Validating a New Trust Measurement
Model for Buyer-Seller Relationships. In Brazilian Administration Review 7 (2),
pp. 172–197.
Mayer, Horst O. (2009): Interview und schriftliche Befragung. Entwicklung,
Durchführung und Auswertung. 5., überarb. Aufl. München, Wien: Oldenbourg.
Mayer, Roger C.; Davis, James H.; Schoorman, F. David (1995): An Integrative
Model of Organizational Trust. In Academy of Management Review 20 (3), pp. 709–
734.
McCarthy, E. Jerome (1960): Basic Marketing. A managerial approach.
Homewood, Ill.: R.D. Irwin.
Meffert, Heribert (1994): Marktorientierte Führung von
Dienstleistungsunternehmen. - neue Entwicklungen in Theorie und Paxis. In Die
Betriebswirtschaft 54 (4), pp. 519–541.
Meffert, Heribert; Bruhn, Manfred (2009): Dienstleistungsmarketing.
Grundlagen - Konzepte - Methoden. 6th ed. Wiesbaden: Gabler Verlag / GWV
Fachverlage GmbH Wiesbaden.
Meffert, Heribert; Burmann, Christoph; Kirchgeorg, Manfred (2014): Marketing.
12., überarb. u. aktual. Aufl. Wiesbaden: Gabler.
Merriam-Webster (Ed.) (2014): Dictionary. key word: public relations: Merriam-
Webster, Incorporated (Merriam-Webster Dictionary). Available online at
http://www.merriam-webster.com/dictionary/public%20relations, checked on
6/5/2014.
Merten, Klaus (2007): Grundlagen der Kommunikationswissenschaft. 3. Aufl.
Berlin [u.a.]: LIT-Verl. (Einführung in die Kommunikationswissenschaft, / Klaus
Merten ; Bd. 1).
Messe Düsseldorf GmbH (Ed.) (2014): METAV. Available online at
www.metav.com, checked on 7/7/2015.
PUBLICATION BIBLIOGRAPHY
305
Messe Düsseldorf GmbH (Ed.) (2015a): Besucherinformationen. Willkommen auf
der MEDICA! Available online at
http://www.medica.de/cipp/md_medica/custom/pub/content,oid,40952/lang,1/tic
ket,g_u_e_s_t/~/Das_ist_die_MEDICA.html, checked on 7/21/2015.
Messe Düsseldorf GmbH (Ed.) (2015b): glasstec online. Available online at
http://www.glasstec-online.com, checked on 10/9/2015.
Messe Düsseldorf GmbH (Ed.) (2015c): MEDICA 2015. Düsseldorf. Available
online at
http://www.medica.de/cipp/md_medica/lib/all/lob/return_download,ticket,g_u_e
_s_t/bid,6294/no_mime_type,0/~/med15_gesamt_D_link.pdf, checked on
7/21/2015.
Messe Düsseldorf GmbH (Ed.) (2015d): MEDICA-
WORLD FORUM FOR MEDICINE. Data, Facts and Background for Exhibitors.
Düsseldorf, checked on 7/21/2015.
Messe München GmbH (Ed.) (2014): bauma - Exhibiting is worthwhile.
Available online at http://www.bauma.de/trade-fair/exhibitors/exhibiting-is-
worthwhile/, checked on 7/7/2015.
Meyer, Anton (1994): Dienstleistungsmarketing. Erkenntnisse u. prakt. Beispiele.
6th ed. Augsburg: FGM-Verlag (Schwerpunkt Marketing, Bd. 20).
Mohr, Jakki; Nevin, John R. (1990): Communication Strategies in Marketing
Channels. A Theoretical Perspective. In Journal Of Marketing 54 (4), p. 36.
Möllering, Guido; Sydow, Jörg (2005): Kollektiv, kooperativ, retlexiv: Vertrauen
und Glaubwlirdigkeit in Unternehmungen und Unternehmungsnetzwerken. In
Beatrice Dernbach, Michael Meyer (Eds.): Vertrauen und Glaubwürdigkeit.
Interdisziplinäre Perspektiven. Wiesbaden: VS Verlag für Sozialwissenschaften,
pp. 64–93.
Moon, Junyean; Tikoo, Surinder (2002): Buying decision approaches of
organizational buyers and users. In Journal of Business Research 55, pp. 293–299.
Moorman, Christine; Zaltman, Gerald; Deshpande, Rohit (1992): Relationships
Between Providers and Users of Market Research: The Dynamics of Trust Within
and Between Organizations. In Journal of Marketing Research 29 (3), pp. 314–328.
MAIKE U. BUSCH 306
Morgan, Robert M.; Hunt, Shelby D. (1994): The Commitment-Trust Theory of
Relationship Marketing. In Journal Of Marketing (58), pp. 20–38.
Morien, Diane (2013): Business statistics. 2nd edition. South Melbourne, Victoria:
Cengage Learning Australia.
Moschuris, Socrates J. (2007): Triggering Mechanisms in Make-or-Buy Decisions:
An Empirical Analysis. In Journal of Supply Chain Management 43 (1), pp. 40–49.
Moulines, Carles Ulises (2008): Die Entwicklung der modernen
Wissenschaftstheorie (1890-2000). Eine historische Einführung. Hamburg,
Münster: Lit (Einführungen / Philosophie, Bd. 6).
Münscher, Robert (2011): Vertrauensentwicklung im interkulturellen
Management. Ein empirischer Beitrag am Beispiel der deutsch-französischen
Zusammenarbeit. Wiesbaden: Gabler Verlag / Springer Fachmedien Wiesbaden,
Wiesbaden (Internationale Wirtschaftspartner).
Nelson, Phillip (1970): Information and Consumer Behavior. In Journal of Political
Economy 78 (2), pp. 311–329.
Nerlove, Marc; Arrow, Kenneth J. (1962): Optimal Advertising Policy under
Dynamic Conditions. In Economica 29 (114), pp. 129–142.
Neuberger, Oswald (2006): Vertrauen vertrauen? Misstrauen als Sozialkapital. In
Klaus Götz (Ed.): Vertrauen in Organisationen. Mering: Rainer Hampp Verlag
(Managementkonzepte, 30), pp. 11–56.
Neumann, Marcus M. (2007): Konsumentenvertrauen. Messung, Determinanten,
Konsequenzen. 1. Aufl. Wiesbaden: Dt. Univ.-Verl. (Gabler-Edition Wissenschaft :
Schriftenreihe des Instituts für Marktorientierte Unternehmensführung (IMU),
Universität Mannheim).
Neven, Peter (2002): Fachbesucher auf deutschen Messen. Strukturanalyse auf der
Basis repräsentativer Befragungen. Edited by AUMA, Ausstellungs- und Messe-
Ausschuss der Deutschen Wirtschaft e.V. Berlin (AUMA-Edition / Hrsg.
Ausstellungs- und Messe-Ausschuss der Deutschen Wirtschaft e.V. (AUMA)).
Neven, Peter (2005): Geschichte und Entwicklung der Messewirtschaft. In Werner
Delfmann (Ed.): Kölner Kompendium der Messewirtschaft. Das Management von
Messegesellschaften. Köln: Kölner Wiss.-Verl., pp. 73–90.
PUBLICATION BIBLIOGRAPHY
307
Nienaber, Ann-Marie; Schewe, Gerhard (2011): Merkmale einer
vertrauensvollen Kommunikation zwischen Organisationen – eine empirische
Analyse. In Zeitschrift für Management 6 (1), pp. 3–28.
Nieschlag, Robert; Dichtl, Erwin; Hörschgen, Hans (2002): Marketing. 19.,
überarb. und erg. Aufl. Berlin: Duncker & Humblot.
North, Douglass C. (1991): Institutions. In Journal of Economic Perspectives 5 (1),
pp. 97–112.
North, Douglass C. (1992): Institutionen, institutioneller Wandel und
Wirtschaftsleistung. Tübingen: Mohr (Einheit der Gesellschaftswissenschaften,
Bd. 76).
Onkvisit, Sak; Shaw, John J. (2004): International marketing. Analysis and
strategy. 4th ed. New York: Routledge.
Opper, Sonja (2001): Der Stand der Neuen Institutionsökonomik. In
Wirtschaftsdienst. Zeitschrift für Wirtschaftspolitik 81 (10), pp. 601–608.
Ostrom, Elinor (1990): Governing the commons. The evolution of institutions for
collective action. Cambridge, New York: Cambridge University Press (The
Political economy of institutions and decisions).
Oswald, M. E.; Fuchs, T. (1998): Readiness to trust in complex situations. In Swiss
Journal of Psychology (57), pp. 248–254.
Oswald, Margit E. (2010): Vertrauen in Organisationen. In Martin K. W. Schweer
(Ed.): Vertrauensforschung 2010. A state of the art. Frankfurt am Main, New
York: Lang (Psychologie und Gesellschaft, Bd. 9), pp. 63–86.
Oxford University Press (Ed.) (2015): Oxford Dictionaries. key word: trust.
Oxford: Oxford University Press. Available online at
http://www.oxforddictionaries.com/definition/english/trust, checked on
9/17/2015.
Pepels, Werner (2014): Kommunikationsmanagement. Die Kommunikations- und
Identitätspolitik im Marketing. 5., vollst. überarb. Aufl. Berlin: Duncker et
Humblot.
MAIKE U. BUSCH 308
Petermann, Franz (2013): Psychologie des Vertrauens. 4., überarb. Aufl.
Göttingen: Hogrefe.
Picot, Arnold (1981): Beitrag der Theorie der Verfügungsrechte zur
ökonomischen Analyse von Unternehmensverfassungen. In Kurt Bohr, Jochen
Drukarczyk, Hans-Jürgen Drumm, Gerhard Scherrer (Eds.):
Unternehmensverfassung als Problem der Betriebswirtschaftslehre: Erich Schmidt
Verlag, pp. 153–197.
Picot, Arnold; Dietl, Helmut; Franck, Egon (2002): Organisation. Eine
ökonomische Perspektive. 3., überarb. und erw. Aufl. Stuttgart: Schäffer-Poeschel.
Plichta, Stacey Beth; Garzon, Laurel S. (2009): Statistics for nursing and allied
health. Philadelphia: Wolters Kluwer/Lippincott Williams & Wilkins Health.
Popper, Karl R. (1973): Objektive Erkenntnis. Ein evolutionärer Entwurf.
Hamburg: Hoffmann, Campe (Kritische Wissenschaft).
Popper, Karl R. (1996): In search of a better world. Lectures and essays from
thirty years. London, New York: Routledge.
Prager, Wolfgang (2012): Besprechung zum Dienstleistungsangebot von
Messegesellschaften to Maike Busch. Düsseldorf, Germany, 09/17/2012.
Prager Wolfgang; Biedermann, Barbara; Prinz, Dagmar (2012): Besprechung zur
Durchführung der Primärfoschung to Maike Busch. Düsseldorf, 11/14/2012.
Pratt, John W.; Zeckhauser, Richard (Eds.) (1985): Principals and agents. The
structure of business. Boston, Mass.: Harvard Business School Press (Research
colloquium / Harvard Business School).
Pratt, John W.; Zeckhauser, Richard J. (1991): Principals and Agents: An
Overview. In John W. Pratt, Richard J. Zeckhauser (Eds.): Principals and Agents:
The Structure of Business. Boston: Harvard Business School Press, pp. 1–36.
Praxmarer, Sandra (2009): Warum kann die Wirkung von Maßnahmen eines
Unternehmens auf das Vertrauen des Partners kulturabhängig sein? In Zeitschrift
für Betriebswirtschaft 79 (5), pp. 609–632.
PUBLICATION BIBLIOGRAPHY
309
Preisendörfer, Peter (1995): Vertrauen als soziologische Kategorie. Möglichkeiten
und Grenzen einer entscheidungstheoretischen Fundierung des
Vertrauenskonzepts. In Zeitschrift für Soziologie 24 (4), pp. 263–272.
PricewaterhouseCoopers (2015): Medizintechnik – hohes Wachstum auf
ausländischen Zukunftsmärkten. Frankfurt am Main. Papenstein, Bernd;
Isphording, Andrea. Available online at
http://www.pwc.de/de/internationalisierung/medizintechnik-hohes-wachstum-
auf-auslaendischen-zukunftsmaerkten.jhtml.
PwC, U. S.A. (Ed.) (2012): Emerging mHealth: Paths for growth. Available online
at http://www.pwc.de/de_DE/de/gesundheitswesen-und-pharma/assets/pwc-
emerging-mhealth.pdf, checked on 7/20/2015.
Rao, K. Rama Mohana (2007): Services marketing. New Delhi: Dorling
Kindersley (India).
Rasli, Amran (2006): Data analysis and interpretation. A handbook for
postgraduate social scientists. Skudai, Johor: Penerbit Universiti Teknologi
Malaysia.
Reckwitz, Andreas (1999): Anthony Giddens. In Dirk Kaesler (Ed.): Klassiker der
Soziologie. München: Beck (Beck'sche Reihe, 1289), pp. 311–337.
Reed Exhibitions Deutschland GmbH (Ed.) (2015): Reed Exhibitions
Deutschland. Available online at
http://www.reedexpo.de/reed_exhibitions_deutschland_68.html.
Richter, Rudolf; Furubotn, Eirik Grundtvig (2010): Neue Institutionenökonomik.
Eine Einführung und kritische Würdigung. With assistance of Monika Streissler.
4th ed. Tübingen: Mohr Siebeck.
Riedel, Gabriele (2009): Theoretischer Vergleich ökonomischer und
soziologischer Institutionentheorien und praktische Implikationen für
betriebliche Anreizsysteme. GRIN Verlag. München.
Ripperger, Tanja (2003): Ökonomik des Vertrauens. Analyse eines
Organisationsprinzips. 2. Aufl., Studienausg., Nachdr. der 1. Aufl. Tübingen:
Mohr Siebeck (Die Einheit der Gesellschaftswissenschaften, Bd. 101).

MAIKE U. BUSCH 310
Rizal, Hamid; Jeng, Don Jyh-Fu; Chang, Hsin Hsin (2015): The role of ethnicity
in domestic intercultural service encounters. In Service Business.
Robertz, Gerd (1999): Strategisches Messemanagement im Wettbewerb. Ein
markt-, ressourcen- und koalitionsorientierter Ansatz. Gabler Edition
Wissenschaft. Wiesbaden: Deutscher Universitätsverlag (Schriftenreihe der
Handelshochschule Leipzig).
Robinson, Patrick J.; Faris, Charles W.; Wind, Yoram (1967): Industrial buying
and creative marketing. Boston: Allyn & Bacon (Marketing Science Institute Series
Of books).
Rodekamp, Volker (1997): Messe im 20. Jahrhundert. Wendezeiten - Zeitbilder. In
Volker Rodekamp (Ed.): Leipzig, Stadt der wa(h)ren Wunder. 500 Jahre
Reichsmesseprivileg; [Ausstellung vom 20. Juli 1997 bis 13. April 1998 im Alten
Rathaus zu Leipzig]. [Leipzig]: Leipziger Messe-Verl. (Veröffentlichungen des
Stadtgeschichtlichen Museums Leipzig), pp. 353–357.
Rodekamp, Volker (2003): Zur Geschichte der Messen in Deutschland und
Europa. In Manfred Kirchgeorg, Werner M. Dornscheidt, Wilhelm Giese, Norbert
Stoeck (Eds.): Handbuch Messemanagement. Planung, Durchführung und
Kontrolle von Messen, Kongressen und Events. Wiesbaden: Gabler, pp. 5–13.
Roloff, Eberhard (1992): Messen und Medien. Ein sozialpsychologischer Ansatz
zur Öffentlichkeitsarbeit. Wiesbaden: Deutscher Universitätsverlag.
Ross, Stephen A. (1973): The Economic Theory of Agency: The Principal's
Problem. In American Economic Review 63 (2), pp. 134–139.
Rossmann, Alexander (2010): Vertrauen in Kundenbeziehungen. Wiesbaden:
Gabler Verlag / Springer Fachmedien Wiesbaden, Wiesbaden.
Rotter, Julian B. (1967): A new scale for the measurement of interpersonal trust.
In Journal of Personality 35 (4), pp. 651–665.
Rotter, Julian B. (1971): Generalized expectancies for interpersonal trust. In
American Psychologist 26 (5), pp. 443–452.
Sakoa, Mari; Helper, Susan (1998): Determinants of trust in supplier relations:
Evidence from the automotive industry in Japan and the United States. In Journal
of Economic Behavior & Organization (34), pp. 387–417.
PUBLICATION BIBLIOGRAPHY
311
Sander, Matthias; Weywara, Berthold (2006): Markenvertrauen im Rahmen des
Markenmanagements. In Hans H. Bauer, Marcus M. Neumann, Anja Schüle
(Eds.): Konsumentenvertrauen. Konzepte und Anwendungen für ein nachhaltiges
Kundenbindungsmanagement. München: Vahlen, pp. 249-264.
Schendera, Christian (2008): Clusteranalyse mit SPSS. München: Oldenbourg, R.
Schneider, Dieter J. G. (2002): Einführung in das Technologie-Marketing.
München: Oldenbourg.
Schoop, Kurt (2003): Historie und Entwicklung von Fachmessekonzepten. In
Manfred Kirchgeorg, Werner M. Dornscheidt, Wilhelm Giese, Norbert Stoeck
(Eds.): Handbuch Messemanagement. Planung, Durchführung und Kontrolle von
Messen, Kongressen und Events. Wiesbaden: Gabler, pp. 15–29.
Schottlaender, Rudolf (1955): Zur ethischen Theorie des Vertrauens. In Zeitschrift
für philosophische Forschung 9 (2), pp. 348–357.
Schottlaender, Rudolf (1957): Theorie des Vertrauens: de Gruyter.
Schumann, Jochen; Meyer, Ulrich; Ströbele, Wolfgang (2007): Grundzüge der
mikroökonomischen Theorie. Mit 15 Tabellen. 8., überarb. Aufl. Berlin [u.a.]:
Springer (Springer-Lehrbuch).
Schurz, Gerhard (2013): Das Problem der Induktion. In Herbert Keuth (Ed.): Karl
Popper. Logik der Forschung. Berlin: Akademie Verlag (Klassiker auslegen, Band
12), pp. 25–40.
Schweer, Martin K.W. (2008): Vertrauen und soziales Handeln — Eine
differentialpsychologische Perspektive. In Elias Jammal (Ed.): Vertrauen im
interkulturellen Kontext. Wiesbaden: VS, Verl. für Sozialwiss (VS research:
Perspectives of the other), pp. 13–26.
Secord, Paul F.; Backman, Carl W. (1997): Sozialpsychologie. Ein Lehrbuch für
Psychologen, Soziologen, Pädagogen. 5. Aufl.: Eschborn.
Selinski, Hannelore; Sperling, Ute A. (1995): Marketinginstrument Messe.
Arbeitsbuch für Studium und Praxis. Köln: Wirtschaftsverl. Bachem.
MAIKE U. BUSCH 312
Shanghai New International Expo Centre Co., Ltd. (Ed.) (2011): About SNIEC.
Available online at http://www.sniec.net/about_aboutsniec.php, checked on
7/7/2015.
Shepherd, Lisa (2012): Market smart. How to gain customers and increase profits
with B2B marketing. Bloomington, IN: AuthorHouse.
Sheskin, David (2004): Handbook of parametric and nonparametric statistical
procedures. Boca Raton: Chapman & Hall Crc.
Sheth, Jagdish N.; Parvatiyar, Atul (1995): The evolution of relationship
marketing. In International Business Review 4 (4), pp. 397–418.
Shy, Oz (1996): Industrial organization. Theory and applications. Cambridge,
Mass.: MIT Press.
Siamagka, Nikoletta-Theofania; Christodoulides, George; Michaelidou, Nina;
Valvi, Aikaterini (2015): Determinants of social media adoption by B2B
organizations. In Industrial Marketing Management (51), pp. 89-99.
Sichtmann, Christina (2007): An analysis of antecedents and consequences of
trust in a corporate brand. In European Journal of Marketing 41 (9/10), pp. 999–1015.
Sichtmann, Christina; Selasinsky, Maren (2009): Produktbegleitende
Dienstleistungen international vermarkten. In Thexis 26 (3), pp. 16–21.
Singh, Jagdip; Sirdeshmukh, Deepak (2000): Agency and Trust Mechanisms in
Consumer Satisfaction and Loyalty Judgments. In Journal of the Academy of
Marketing Science 28 (1), pp. 150–167.
Sitkin, Sim B.; Roth, Nancy L. (1993): Explaining the limited effectiveness of
legalistic "remedies" for trust/distrust. In Organization Science 4 (3), pp. 367–392.
Snyder, Christopher; Nicholson, Walter (2012): Microeconomic theory. Basic
principles and extensions. 11th ed. [Mason, Ohio?]: South-Western Cengage
Learning.
Springer Gabler Verlag (Ed.) (2015a): Gabler Wirtschaftslexikon. key word:
Homo oeconomicus: Springer Gabler Verlag (Gabler Wirtschaftslexikon).
Available online at http://wirtschaftslexikon.gabler.de/Archiv/8004/homo-
oeconomicus-v12.html, checked on 6/11/2015.
PUBLICATION BIBLIOGRAPHY
313
Springer Gabler Verlag (Ed.) (2015b): Gabler Wirtschaftslexikon. key word: Neue
Institutionenökonomik: Springer Gabler Verlag (Gabler Wirtschaftslexikon).
Available online at http://wirtschaftslexikon.gabler.de/Archiv/1470/neue-
institutionenoekonomik-v12.html, checked on 6/11/2015.
Statistisches Bundesamt (Destatis) (2013): Länderprofil "Europäische Union"
(EU-28). Statistische Länderprofile G20 Industrie- und Schwellenländer. Available
online at
https://www.destatis.de/DE/Publikationen/Thematisch/Internationales/Laenderpr
ofile/EuropaeischeUnion2013.pdf;jsessionid=3213568ABF69C4F7FC8A80F2E5BED
6AA.cae4?__blob=publicationFile, checked on 11/29/2015.
Stauss, B. (1995): Internationales Dienstleistungsmarketing. In Arnold Hermanns
(Ed.): Internationales Marketing-Management. Grundlagen, Strategien,
Instrumente, Kontrolle und Organisation. München: Vahlen, pp. 437–474.
Stiglitz; Joseph E. (1975): The Theory of "Screening", Education, and the
Distribution of Income. In The American Economic Review 65 (3), pp. 283–300.
Strzysch, Marianne; Weiß, Joachim (Eds.) (1998): Der Brockhaus. In 15 Bänden.
15 volumes. Leipzig, Mannheim: Brockhaus (6).
Tandetzki, Edmund; Kock, Albert (1999): 75 Jahre Kölner Messe. Von der
rheinischen Messe zum Welthandelsplatz. Köln: Messe- und
Ausstellungsgesellschaft.
Tasch, Dieter (1997): 50 Jahre Zukunft. Messen in Hannover 1947 - 1997.
Hannover: Grütter.
Taylor, Karen; Ronte, Hanno; Hammet, Simon (2014): Healthcare and Life
Sciences Predictions 2020. A bold future? The Deloitte Centre for Health
Solutions. London. Available online at
http://www2.deloitte.com/content/dam/Deloitte/uk/Documents/life-sciences-
health-care/healthcare-and-life-sciences-predictions-2020.pdf, checked on
7/20/2015.
MAIKE U. BUSCH 314
Thomas, Alexander (2005): Vertrauen im interkulturellen Kontext aus Sicht der
Psychologie. In Jörg Maier (Ed.): Die Rolle von Vertrauen in
Unternehmensplanung und Regionalentwicklung. Ein interdisziplinärer Diskurs.
München: Forost (Forost-Arbeitspapiere / Forschungsverbund Ost- und
Südosteuropa, Nr. 27), pp. 19–48.
Töpfer, Armin (2010): Erfolgreich Forschen. Ein Leitfaden für Bachelor-, Master-
Studierende und Doktoranden. 2., überarb. u. erw. Aufl. Heidelberg [u.a.]:
Springer (Springer-Lehrbuch).
Überla, K. (1971): Faktorenanalyse. Eine systematische Einführung für
Psychologen, Mediziner, Wirtschafts- und Sozialwissenschaftler. Nachdruck der
zweiten Auflage. Berlin, Heidelberg: Springer Berlin Heidelberg.
Ueding, Ralf (1998): Management von Messebeteiligungen. Identifikation und
Erklärung messespezifischer Grundhaltungen auf der Basis einer empirischen
Untersuchung. Frankfurt am Main, New York: P. Lang (Schriften zu Marketing
und Management, Bd. 34).
Usunier, Jean-Claude; Lee, Julie Anne (2009): Marketing across cultures. 5th ed.
Harlow: FT Prentice Hall.
Vaihinger, Hans (2013): Die Philosophie des Als Ob., [Nachdr.]. Paderborn:
Salzwasser.
VDW Verein Deutscher Werkzeugmaschinenfabriken e.V. (Ed.) (2015): VDW -
about us. Available online at http://www.vdw.de/web-
bin/owa/homepage?p_bereich=vdw&p_menue_id=1000000045&p_sprache=e,
checked on 7/7/2015.
Vögele-Ebering, Tilman (2004): Eine pfiffige Service-Strategie zahlt sich auf
Heller und Pfennig aus. Industrielle Dienstleistungen: Mittelstand muss
Potenziale des Wachstumsmarktes ausschöpfen. In Industrieanzeiger (9), p. 18.
Voinov, Vassiliy; Nikulin, M. S.; Balakrishnan, N. (2013): Chi-squared goodness
of fit tests with applications. Waltham, MA: Academic Press.
Voldnes, Gøril; Grønhaug, Kjell; Nilssen, Frode (2012): Satisfaction in buyer–
seller relationships—Influence of cultural differences. In Industrial Marketing
Management 41 (7), pp. 1081–1093.
PUBLICATION BIBLIOGRAPHY
315
Vu, Quang Hieu; Lupu, Mihai; Ooi, Beng Chin (2010): Peer-to-peer computing.
Principles and applications. Heidelberg, New York: Springer.
Watzenberg, Anja (2014): Der homo oeconomicus und seine Vorurteile. Eine
Analyse des zivilrechtlichen Benachteiligungsverbots. Berlin: de Gruyter
(Schriften zum Europäischen und Internationalen Privat-, Bank- und
Wirtschaftsrecht).
Webster, Frederick E. (1991): Industrial marketing strategy. 3rd ed. New York:
Wiley.
Webster, Frederick E. (1992): The Changing Role of Marketing in the
Corporation. In Journal Of Marketing 56 (4), pp. 1–17.
Webster, Frederick E.; Wind, Yoram (1972): A General Model for Understanding
Organizational Buying Behavior. In Journal Of Marketing 36 (2), pp. 12–19.
Weiber, Rolf; Adler, Jost (1995): Informationsökonomisch begründete
Typologisierung von Kaufprozessen. In Schmalenbachs Zeitschrift für
betriebswirtschaftliche Forschung 47 (1), pp. 43–65.
Weis, Hans C.; Steinmetz, Peter (2008): Marktforschung. 7., Aufl. Ludwigshafen
am Rhein: Kiehl, F (Modernes Marketing für Studium und Praxis).
Weis, Hans Christian (2012): Marketing. 16., verbesserte und aktualisierte
Auflage. Herne, Westf: NWB Verlag (Kompendium der praktischen
Betriebswirtschaft).
Weiten, Wayne (Composer) (2008): Psychology applied to modern life.
Adjustment in the 21st century. Sound disc. Princeton, N.J.: Recording for the
Blind & Dyslexic.
Wesemeier, Jochen (2002): Vertrauen als Strategie der Kundenbindung. Eine
Operationalisierung und empirische Überprüfung im Dienstleistungssektor.
Hamburg: Kovac (Management, 3).
Wiesner, Knut A.; Sponholz, Uwe (2007): Dienstleistungsmarketing. München
u.a: Oldenbourg (WiSorium - Wirtschafts- und Sozialwissenschaftliches
Repetitorium).
MAIKE U. BUSCH 316
Williamson, Oliver E. (1985): The economic institutions of capitalism. Firms,
markets, relational contracting. New York, London: Free Press; Collier Macmillan.
Windsperger, Josef (1996): Transaktionskostenansatz der Entstehung der
Unternehmensorganisation. Heidelberg: Physica-Verlag HD
(Wirtschaftswissenschaftliche Beiträge).
Witt, Jochen (2003): Bedeutung von Non-Space-Produkten im Messewesen. In
Manfred Kirchgeorg, Werner M. Dornscheidt, Wilhelm Giese, Norbert Stoeck
(Eds.): Handbuch Messemanagement. Planung, Durchführung und Kontrolle von
Messen, Kongressen und Events, pp. 503-512. Wiesbaden: Gabler.
Witt, Jochen (2005): Wettbewerbssituation in Deutschland und weltweit. In
Werner Delfmann (Ed.): Kölner Kompendium der Messewirtschaft. Das
Management von Messegesellschaften. Köln: Kölner Wiss.-Verl., pp. 3–28.
Woratschek, Herbert (1996): Die typologie von Dienstleistungen aus
informationsökonomischer sicht. In Journal für Marketing 35 (1), pp. 59–71.
Woratschek, Herbert (1998): Positionierung. Analysemethoden, Entscheidungen,
Umsetzung. In Anton Meyer (Ed.): Handbuch Dienstleistungs-Marketing. 2
volumes. Stuttgart: Schäffer-Poeschel Verlag (1), pp. 693–710.
Yamagishi, Toshio; Yamagishi, Midori (1994): Trust and commitment in the
United States and Japan. In Motiv Emot 18 (2), pp. 129–166.
Yousafzai, Shumaila; Pallister, John; Foxall, Gordon (2009): Multi-dimensional
role of trust in Internet banking adoption. In The Service Industries Journal 29 (5),
pp. 591–605.
Zeithaml, Valarie A.; Bitner, Mary Jo; Gremler, Dwayne D. (2013): Services
marketing. Integrating Customer Focus Across the Firm. 6th ed. New York,
London: McGraw-Hill Higher Education; McGraw-Hill [distributor].
Zentes, Joachim; Swoboda, Bernhard; Schramm-Klein, Hanna (2013):
Internationales Marketing. 3rd ed. München: Vahlen (Vahlens Handbücher der
Wirtschafts- und Sozialwissenschaften).
Zimbardo, Philip G.; Gerrig, Richard J.; Graf, Ralf (2008): Psychologie. 18.,
aktualisierte Aufl. München, Boston [u.a.]: Pearson Studium (Psychologie).

PUBLICATION BIBLIOGRAPHY
317
Zimmerman, Alan S.; Blythe, Jim (2013): Business-to-business marketing
management. A global perspective. 2nd ed. New York, NY: Routledge.
Zucker, Lynne G. (1986): Production of trust : institutional sources of economic
structure, 1840 - 1920. In Research in Organizational Behavior 8, pp. 53–111.
Zygojannis, Michael E. (2005): Akteure der Messewirtschaft. In Werner
Delfmann (Ed.): Kölner Kompendium der Messewirtschaft. Das Management von
Messegesellschaften. Köln: Kölner Wiss.-Verl., pp. 29–54.
MAIKE U. BUSCH 318
APPENDIX
Appendix 1: Memo: Conversation with Wolfgang Prager about service offers
at trade fairs, September, 2012 ............................................................ 321
Appendix 2: Turnover of exhibition companies worldwide (more than Euro
100 million) ............................................................................................ 322
Appendix 3: Foreign exhibitors at trade fairs in Germany, 2014 ........................... 323
Appendix 4: Investments in trade fair participations and the importance of
trade fairs in the maketing mix (exhibitor survey) .......................... 324
Appendix 5: Memo: Meeting with Wolfgang Prager, Dagmar Prinz (both
Messe Düsseldorf GmbH) and Barbara Biedermann (Wissler &
Partner), November 14, 2012 ............................................................... 325
Appendix 6: Correlation matrix company size – booked stand size ..................... 327
Appendix 7: Final cover letter MEDICA survey – English version ....................... 328
Appendix 8: Final cover letter MEDICA survey – German version ...................... 329
Appendix 9: Final questionnaire MEDICA survey – English version ................... 330
Appendix 10: Final questionnaire MEDICA survey – German version ................ 337
Appendix 11: Chi-square goodness-of-fit test for the MEDICA sample ............... 344
Appendix 12: Survey results (frequencies) of questions 3, 4, and 5 of the
questionnaire ......................................................................................... 346
Appendix 13: Survey results (frequencies) of question 2 of the questionnaire .... 347
Appendix 14: Survey results (frequencies) of question 6 of the questionnaire .... 353
Appendix 15: Crosstabulations trust determinants & trustbuilding
communication items (highest rankings, scores 4 and 5) ............... 358
Appendix 16: Spearman’s rank correlation carried out between the trust
deteminants and the trust-building communication items ............ 364
APPENDIX
319
Appendix 17: Median comparision (evaluation of trust determinants) based
on exhibitor status ................................................................................ 369
Appendix 18: Mann-Whitney-U-test: trust determinants tested on exhibitor
status....................................................................................................... 370
Appendix 19: Median comparision (evaluation of trust determinants) based
on stand .................................................................................................. 372
Appendix 20: Kruskal-Wallis-test: trust determinants – stand size ....................... 373
Appendix 21: Mann-Whitney-U-test: significant trust determinants tested on
stand size ............................................................................................... 375
Appendix 22: Spearmann rank correlation – significant trust determinants
and stand size ........................................................................................ 378
Appendix 23: Median copmparision (evaluation of trust determinants) based
on exhibitiors’ origin ............................................................................ 379
Appendix 24: Kruskal Wallis test: trust determinants tested on exhibitors’
origin ...................................................................................................... 380
Appendix 25: Mann-Whitney-U-test: trust determinants tested on exhibitors’
origin ...................................................................................................... 382
Appendix 26: Spearman rank correlation: trust determinants tested on
exhibitor’s origin ................................................................................... 387
Appendix 27: Median comparision (evaluation of communication items)
based on exhibitor status ..................................................................... 390
Appendix 28: Mann-Whintey-U test (evaluation of communication items)
based on exhibitor status ..................................................................... 391
Appendix 29: Median comparision (evaluation of communication items)
based on stand size ............................................................................... 393
Appendix 30: Krustkal-Wallis test (evaluation of communication items)
based on stand size ............................................................................... 394
Appendix 31: Mann-Whitney-U-test (evaluation of significant communica-
tion items) based on stand size ........................................................... 396
MAIKE U. BUSCH 320
Appendix 32: Spearman rank correlation (evaluation of significant
communication items) based on stand size ...................................... 399
Appendix 33: Median comparision (evaluation of communication items)
based on exhibitors’ origin .................................................................. 401
Appendix 34: Kruskal-Wallis-test (evaluation of communication items)
based on exhibitors’ origin .................................................................. 402
Appendix 35: Mann-Whitney-U-test (evaluation of significant communica-
tion items) based on exhibitors’ origin .............................................. 404
Appendix 36: Spearman rank correlation (evaluation of significant
communication items) based on exhibitors’ origin ......................... 407
Appendix 37: Crosstable booked stand size – exhibitors’ origin ........................... 410
Appendix 38: Crosstable booked stand size – exhibitor origin .............................. 411
Appendix 39: Experience in the company, divided by origin ............................... 412
Appendix 40: Factoranalysis of the communication items ..................................... 413
Appendix 41: Vizualization of the cluster analysis and cluster structures ........... 419
Appendix 42: Final cover letter glasstec survey – English version ........................ 429
Appendix 43: Final questionnaire glasstec survey – English version .................... 430
Appendix 44: Chi-square goodness-of-fit test – glasstec sample ........................... 437
Appendix 45: Testing of hypothesis 1, glasstec – Spearman rank correlation ..... 439
Appendix 46: Testing of hypothesis 2, glasstec, exhibitor status – Mann-
Whitney-U-test ...................................................................................... 440
Appendix 47: Testing of hypothesis 2, glasstec, stand size – Kruskal-Wallis-test 442
Appendix 48: Testing of hypothesis 2, glasstec, exhibitors’ origin ........................ 444
Appendix 49: Testing of hypothesis 3, glasstec, exhibitor status ........................... 449
Appendix 50: Testing of hypothesis 3, glasstec, stand size ..................................... 451
Appendix 51: Testing of hypothesis 3, glasstec, exhibitors’ origin ........................ 453
Appendix 52: Buying center analysis, glasstec ......................................................... 460
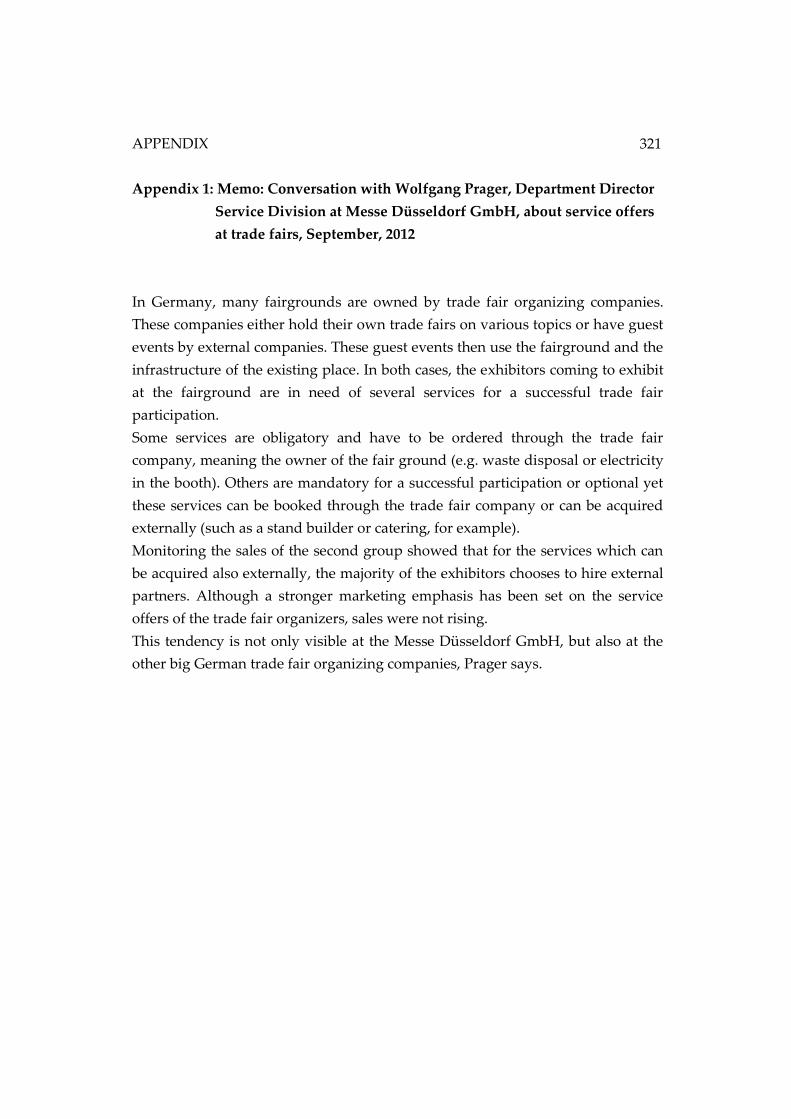
APPENDIX
321
Appendix 1: Memo: Conversation with Wolfgang Prager, Department Director
Service Division at Messe Düsseldorf GmbH, about service offers
at trade fairs, September, 2012
In Germany, many fairgrounds are owned by trade fair organizing companies.
These companies either hold their own trade fairs on various topics or have guest
events by external companies. These guest events then use the fairground and the
infrastructure of the existing place. In both cases, the exhibitors coming to exhibit
at the fairground are in need of several services for a successful trade fair
participation.
Some services are obligatory and have to be ordered through the trade fair
company, meaning the owner of the fair ground (e.g. waste disposal or electricity
in the booth). Others are mandatory for a successful participation or optional yet
these services can be booked through the trade fair company or can be acquired
externally (such as a stand builder or catering, for example).
Monitoring the sales of the second group showed that for the services which can
be acquired also externally, the majority of the exhibitors chooses to hire external
partners. Although a stronger marketing emphasis has been set on the service
offers of the trade fair organizers, sales were not rising.
This tendency is not only visible at the Messe Düsseldorf GmbH, but also at the
other big German trade fair organizing companies, Prager says.
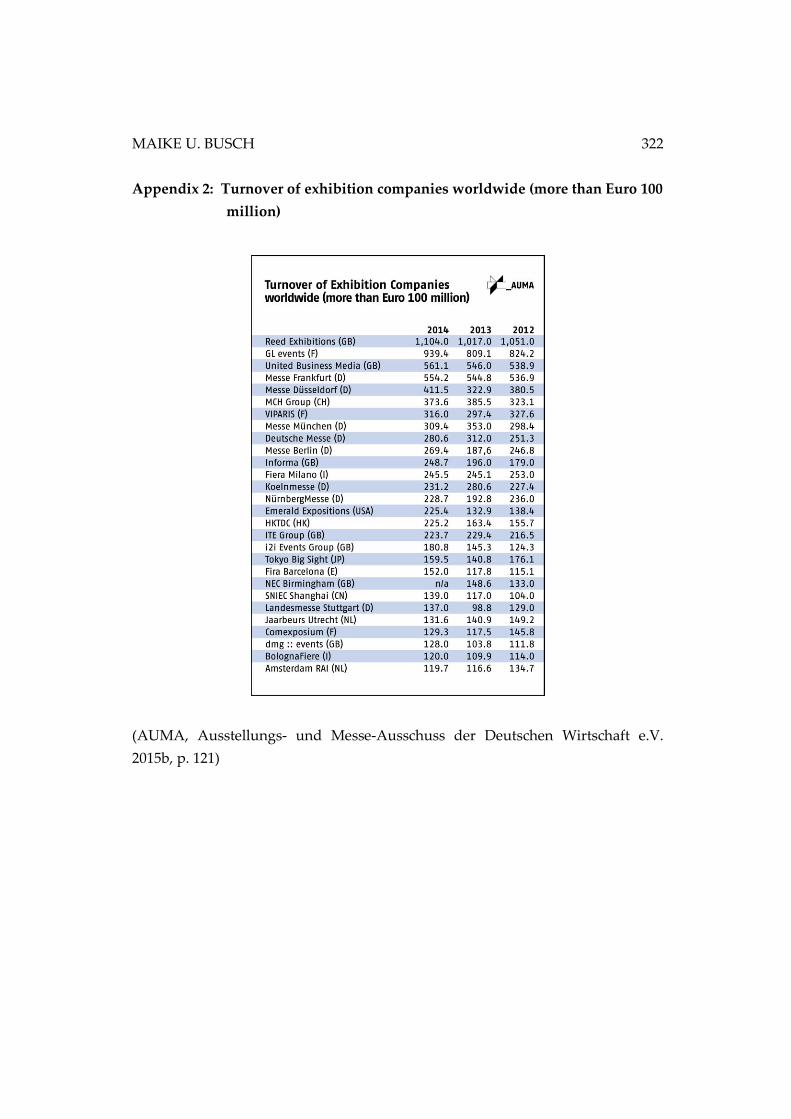
MAIKE U. BUSCH 322
Appendix 2: Turnover of exhibition companies worldwide (more than Euro 100
million)
(AUMA, Ausstellungs- und Messe-Ausschuss der Deutschen Wirtschaft e.V.
2015b, p. 121)
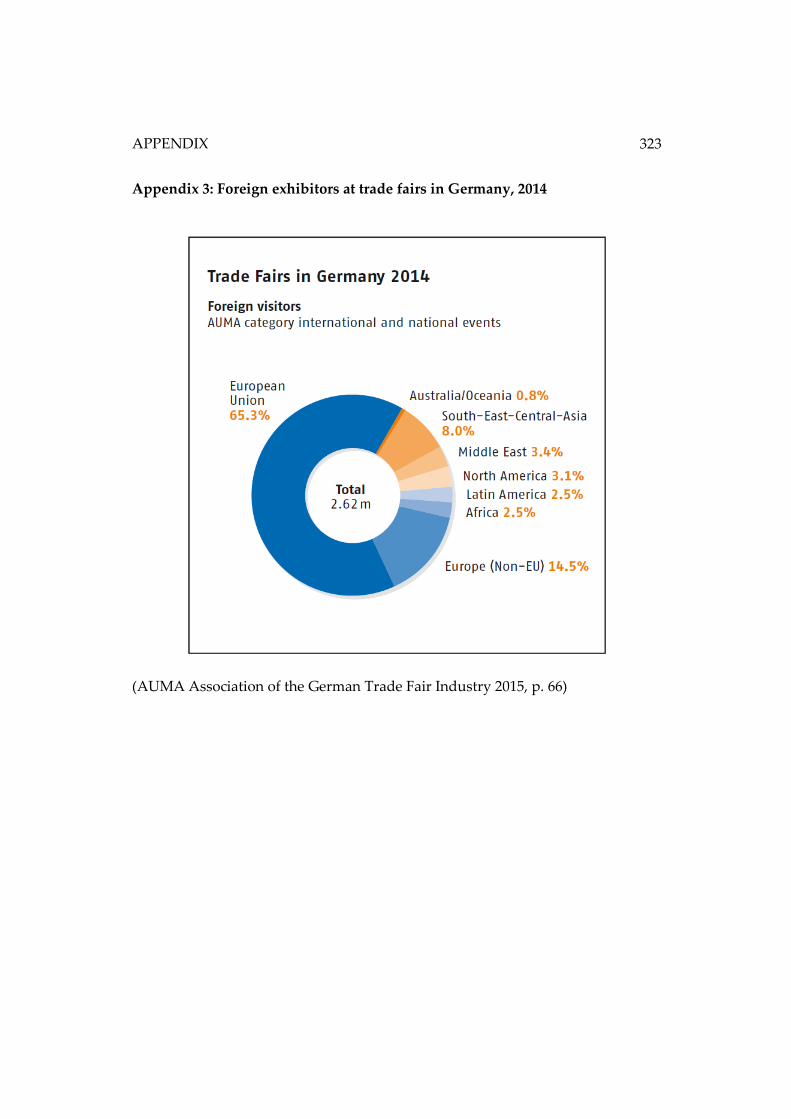
APPENDIX
323
Appendix 3: Foreign exhibitors at trade fairs in Germany, 2014
(AUMA Association of the German Trade Fair Industry 2015, p. 66)
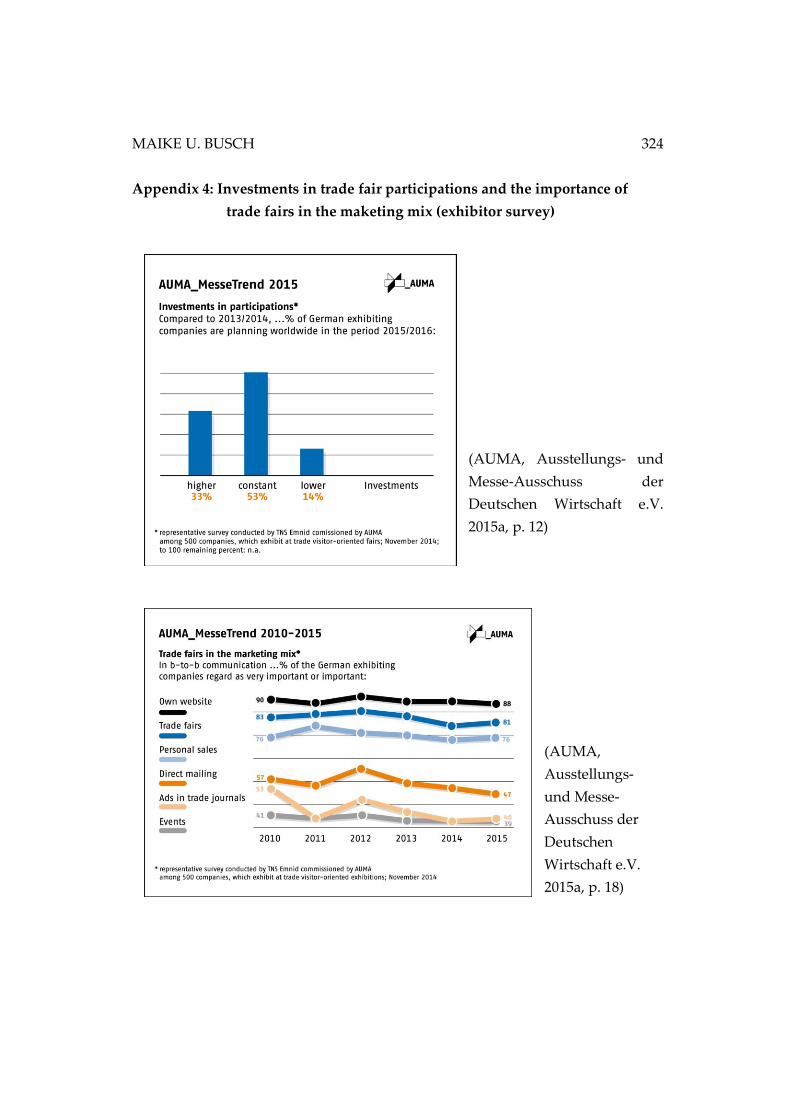
MAIKE U. BUSCH 324
Appendix 4: Investments in trade fair participations and the importance of
trade fairs in the maketing mix (exhibitor survey)
(AUMA, Ausstellungs- und
Messe-Ausschuss der
Deutschen Wirtschaft e.V.
2015a, p. 12)
(AUMA,
Ausstellungs-
und Messe-
Ausschuss der
Deutschen
Wirtschaft e.V.
2015a, p. 18)
APPENDIX
325
Appendix 5: Memo: Meeting with Wolfgang Prager, Dagmar Prinz (both
MesseDüsseldorf GmbH) and Barbara Biedermann (Wissler &
Partner), November 14, 2012
Sample size / definition of target group:
• All main exhibitors of the glasstec 2012 and MEDICA 2012 will be addressed.
Each member of the target groups therefore has the same chances to
participate.
• Precise numbers of the target groups’ sizes can be obtained through the
project teams MEDICA and glasstec.
• First goal is to not make any restrictions of who is going to be addressed.
However, due to only a small number of exhibitors form regions outside
Europe and Asia, these exhibitor groups might be neglected later on due to an
insufficient return rate.
Exhibitors’ origin:
• The original mailing list can be made available for calculations regarding the
exhibitors’ origin in the target group addressed in order to verify the sample
structure later on.
Details on the questionnaire:
• The questionnaire, created by Maike Busch, will be made available online to
the exhibitors through Wissler & Partner. This way exhibitors’ data can be
protected.
• Questions about the scales of the questionnaire-questions 2 and 6 were raised.
Should the scales be with an even or an uneven number? Should there be a
‘no opinion’ option? Here the expert on conducting market research, Barbara
Biedermann, gives some insight from her longtime practical experiences in
this field. She suggests using a 5-points scale plus a ‘no opinion’ option.
Although, a 4-point scale offers a clear decision to one side or the other, many
respondents have difficulties answering such questions – and then tend to
quit the survey. Furthermore, especially in international market research with
Japanese probands, experience has shown the necessity of having an option to
MAIKE U. BUSCH 326
mark ‘the middle’. This leads to a lower stop rate and to a lower percentage of
respondents marking the ‘no opinion’ option, which yet is an escape-option if
no statement can be made. Regarding the evaluation, Biedermann does not
see a problem. If a respondent is clearly opposed of a statement, he usually
has no hesitation displaying his opinion by marking a lower score. If,
however, a respondent marks the middle, he is not clearly against the
statement and can therefore be evaluated as slightly positive, she says.
• Regarding the evaluation concerning the characteristics of the exhibitors,
Wolfgang Prager suggests to focus on stand size, the origin of the exhibitor as
well as hi status, meaning if he is a new or an existing exhibitor. Previously
conducted researches have also focused on there classifications and have
proofen to be useful for further use in the practical work of the trade fair
organizers.
Cover letter for survey:
• It is decided to not put in the information that a student is conducting the
survey. Having the company, Messe Düsseldorf GmbH, sign the letter might
put more emphasis on the importance of the survey.
Timeframe of the survey:
• The survey will be sent out in January, after the Christmas and New Year
holidays. This way, the exhibitors will have enough time to finish up their
postprocessing of their corresponding trade fair and close the business year. A
higher respond rate is expected this way. The survey will be sent out on a
Tuesday/Wednesday to avoid the mass of emails arriving over the weekend.
If not enough questionnaire will be returned a reminder will be sent out,
about two weeks after the actual survey.
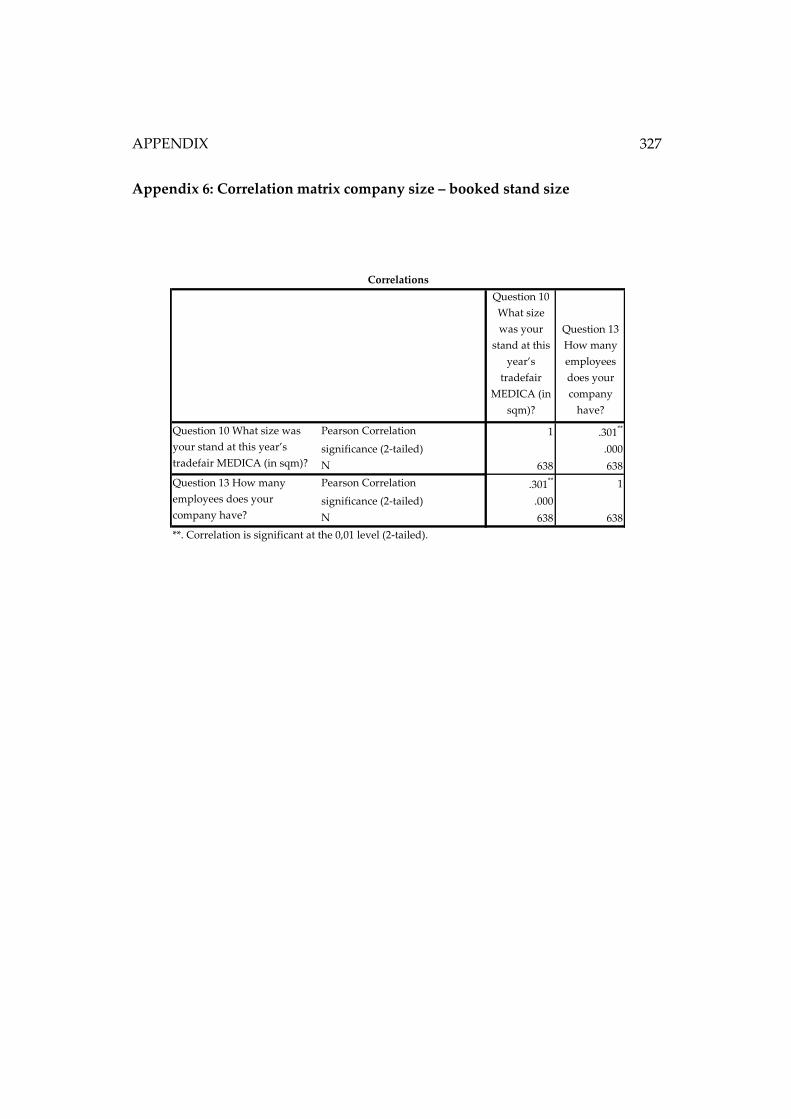
APPENDIX
327
Appendix 6: Correlation matrix company size – booked stand size
Question 10
What size
was your
stand at this
year’s
tradefair
MEDICA (in
sqm)?
Question 13
How many
employees
does your
company
have?
Pearson Correlation 1 .301**
significance (2-tailed) .000
N 638 638
Pearson Correlation .301** 1
significance (2-tailed) .000
N 638 638
**. Correlation is significant at the 0,01 level (2-tailed).
Correlations
Question 10 What size was
your stand at this year’s
tradefair MEDICA (in sqm)?
Question 13 How many
employees does your
company have?

MAIKE U. BUSCH 328
Appendix 7: Final cover letter MEDICA survey – English version
Dear Sir...
We hope, you have started well into the new year and we would also like to take the
chance again to wish you a happy and successful year 2013.
Last November you participated as an exhibitor in the MEDICA 2012 in Düsseldorf. You
already gave us your feedback to this event in the previous survey and we thank you for
your support.
Today, we would like to ask you some further questions, however not about the MEDICA
itself but about the exhibitor services we offer to you during your trade fair preparations.
Our aim is to improve these offers in order to meet your needs even better and to support
you best as a partner in your trade fair preparations.
The results of this survey will provide us important insight for the future development of
our service offers to you. Your answers will be treated strictly confidential, of course.
We have authorized the institute Wissler & Partner Trade Fair Marketing in
Basel/Switzerland to carry out the survey for us.
Please click on the link below. The questionnaire will open on your screen and you will be
able to fill in your answers directly online. Completing the questionnaire will require
approximately 5 to 10 minutes.
Thank you very much for your support!
LINK
For safety-reason, you will need the following PIN-code in order to access the survey:
PIN-Code:
We would appreciate it very much if you completed the survey by Friday, February 1st,
2013.
If you have any technical problems or questions during completion of the survey, please
contact:
CONTACT INFORMATION
With kind regards,
Messe Düsseldorf GmbH
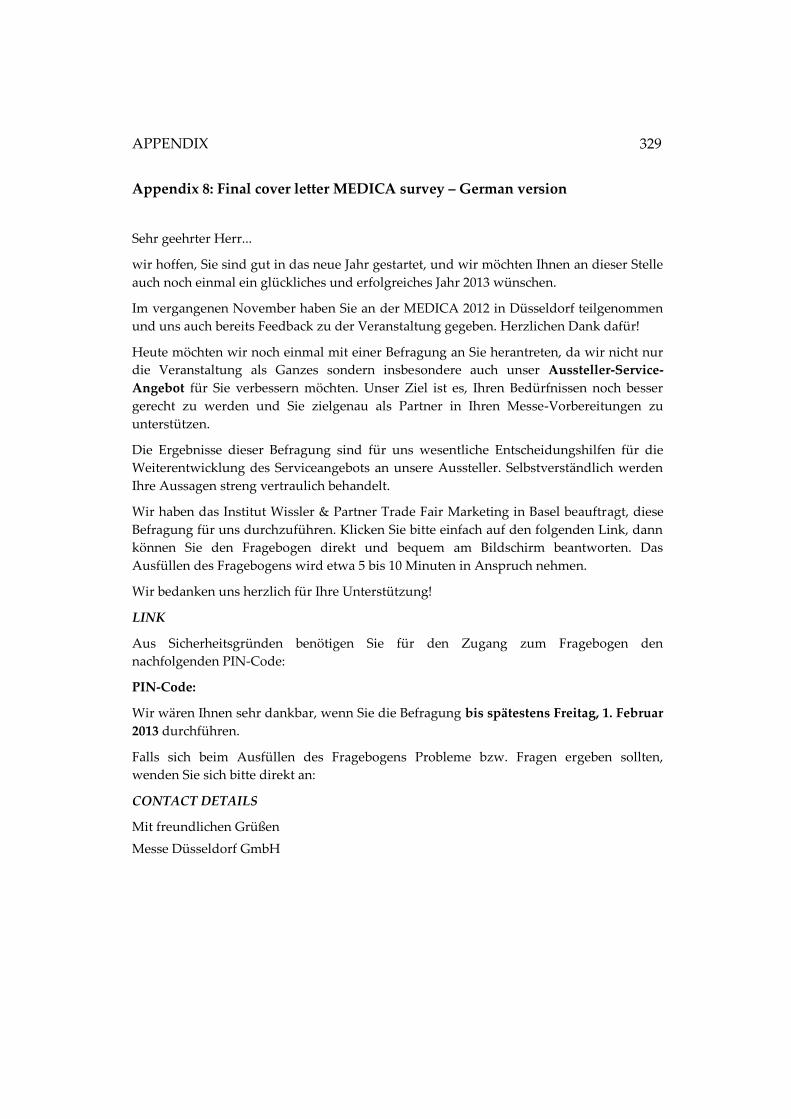
APPENDIX
329
Appendix 8: Final cover letter MEDICA survey – German version
Sehr geehrter Herr...
wir hoffen, Sie sind gut in das neue Jahr gestartet, und wir möchten Ihnen an dieser Stelle
auch noch einmal ein glückliches und erfolgreiches Jahr 2013 wünschen.
Im vergangenen November haben Sie an der MEDICA 2012 in Düsseldorf teilgenommen
und uns auch bereits Feedback zu der Veranstaltung gegeben. Herzlichen Dank dafür!
Heute möchten wir noch einmal mit einer Befragung an Sie herantreten, da wir nicht nur
die Veranstaltung als Ganzes sondern insbesondere auch unser Aussteller-Service-
Angebot für Sie verbessern möchten. Unser Ziel ist es, Ihren Bedürfnissen noch besser
gerecht zu werden und Sie zielgenau als Partner in Ihren Messe-Vorbereitungen zu
unterstützen.
Die Ergebnisse dieser Befragung sind für uns wesentliche Entscheidungshilfen für die
Weiterentwicklung des Serviceangebots an unsere Aussteller. Selbstverständlich werden
Ihre Aussagen streng vertraulich behandelt.
Wir haben das Institut Wissler & Partner Trade Fair Marketing in Basel beauftragt, diese
Befragung für uns durchzuführen. Klicken Sie bitte einfach auf den folgenden Link, dann
können Sie den Fragebogen direkt und bequem am Bildschirm beantworten. Das
Ausfüllen des Fragebogens wird etwa 5 bis 10 Minuten in Anspruch nehmen.
Wir bedanken uns herzlich für Ihre Unterstützung!
LINK
Aus Sicherheitsgründen benötigen Sie für den Zugang zum Fragebogen den
nachfolgenden PIN-Code:
PIN-Code:
Wir wären Ihnen sehr dankbar, wenn Sie die Befragung bis spätestens Freitag, 1. Februar
2013 durchführen.
Falls sich beim Ausfüllen des Fragebogens Probleme bzw. Fragen ergeben sollten,
wenden Sie sich bitte direkt an:
CONTACT DETAILS
Mit freundlichen Grüßen
Messe Düsseldorf GmbH
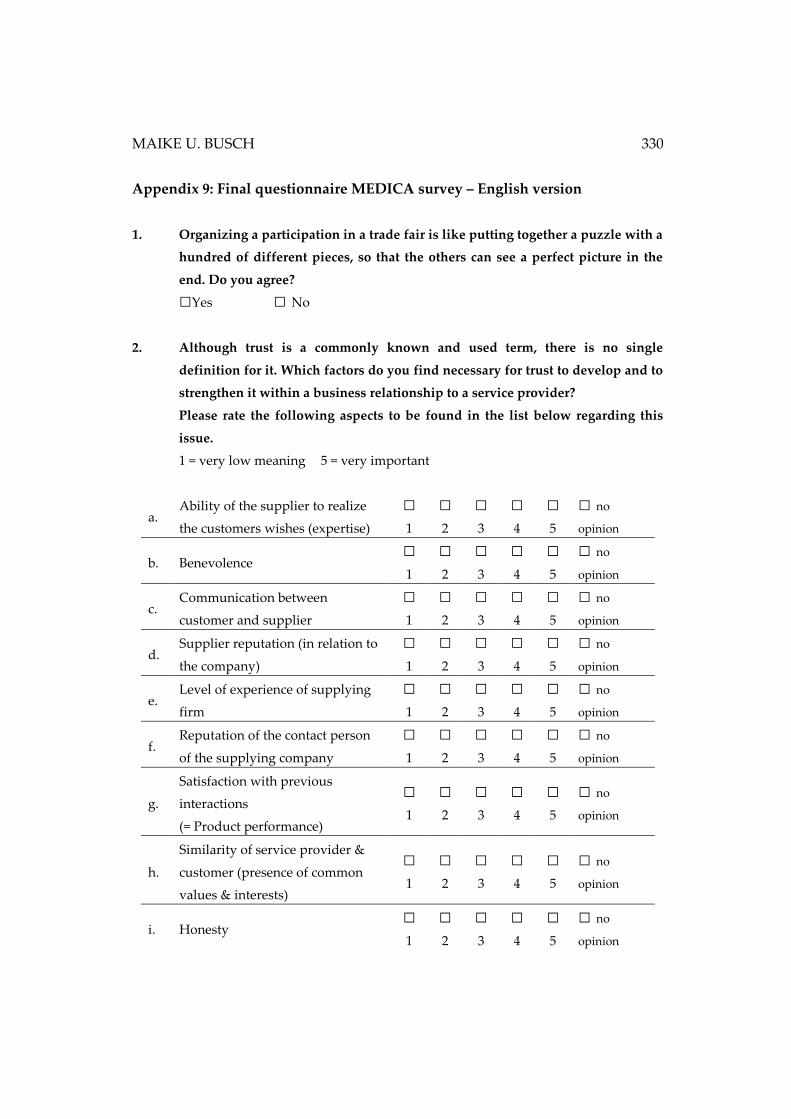
MAIKE U. BUSCH 330
Appendix 9: Final questionnaire MEDICA survey – English version
1. Organizing a participation in a trade fair is like putting together a puzzle with a
hundred of different pieces, so that the others can see a perfect picture in the
end. Do you agree?
□Yes □ No
2. Although trust is a commonly known and used term, there is no single
definition for it. Which factors do you find necessary for trust to develop and to
strengthen it within a business relationship to a service provider?
Please rate the following aspects to be found in the list below regarding this
issue.
1 = very low meaning 5 = very important
a. Ability of the supplier to realize
the customers wishes (expertise)
□ 1
□ 2
□ 3
□ 4
□ 5
□ no
opinion
b. Benevolence □ 1
□ 2
□ 3
□ 4
□ 5
□ no
opinion
c. Communication between
customer and supplier
□ 1
□ 2
□ 3
□ 4
□ 5
□ no
opinion
d. Supplier reputation (in relation to
the company)
□ 1
□ 2
□ 3
□ 4
□ 5
□ no
opinion
e. Level of experience of supplying
firm
□ 1
□ 2
□ 3
□ 4
□ 5
□ no
opinion
f. Reputation of the contact person
of the supplying company
□ 1
□ 2
□ 3
□ 4
□ 5
□ no
opinion
g.
Satisfaction with previous
interactions
(= Product performance)
□ 1
□ 2
□ 3
□ 4
□ 5
□ no
opinion
h.
Similarity of service provider &
customer (presence of common
values & interests)
□ 1
□ 2
□ 3
□ 4
□ 5
□ no
opinion
i. Honesty □ 1
□ 2
□ 3
□ 4
□ 5
□ no
opinion
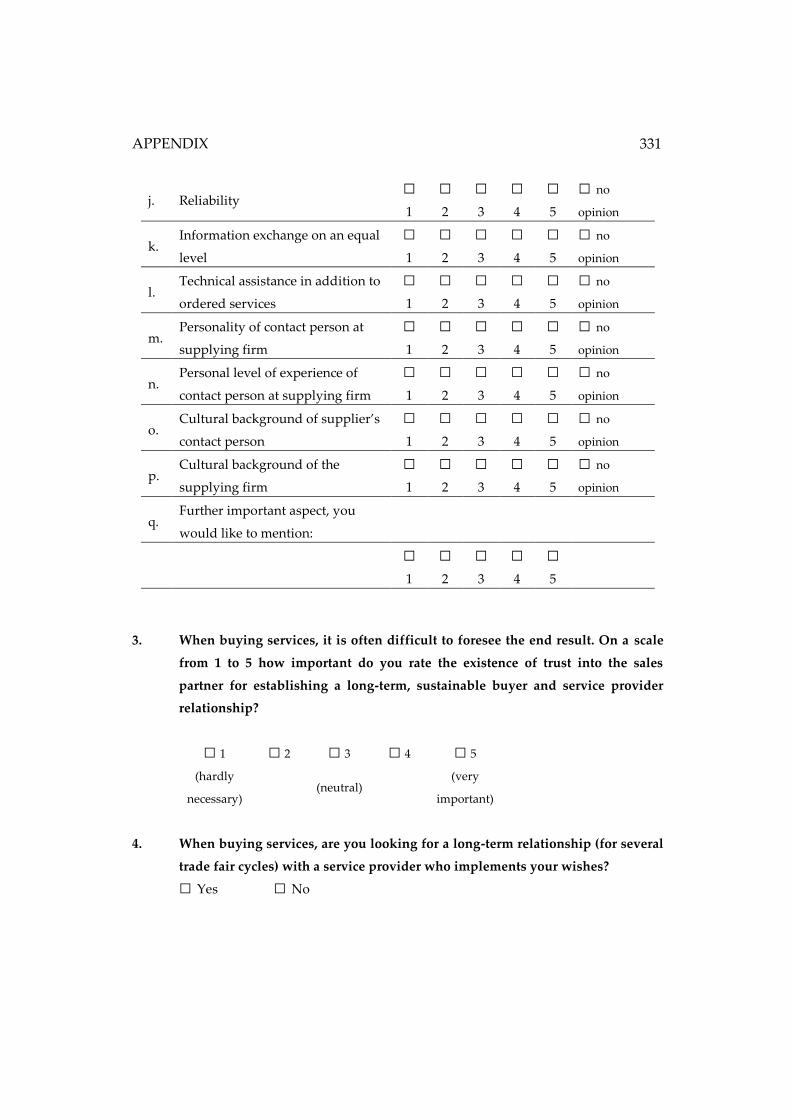
APPENDIX
331
j. Reliability □ 1
□ 2
□ 3
□ 4
□ 5
□ no
opinion
k. Information exchange on an equal
level
□ 1
□ 2
□ 3
□ 4
□ 5
□ no
opinion
l. Technical assistance in addition to
ordered services
□ 1
□ 2
□ 3
□ 4
□ 5
□ no
opinion
m. Personality of contact person at
supplying firm
□ 1
□ 2
□ 3
□ 4
□ 5
□ no
opinion
n. Personal level of experience of
contact person at supplying firm
□ 1
□ 2
□ 3
□ 4
□ 5
□ no
opinion
o. Cultural background of supplier’s
contact person
□ 1
□ 2
□ 3
□ 4
□ 5
□ no
opinion
p. Cultural background of the
supplying firm
□ 1
□ 2
□ 3
□ 4
□ 5
□ no
opinion
q. Further important aspect, you
would like to mention:
□ 1
□ 2
□ 3
□ 4
□ 5
3. When buying services, it is often difficult to foresee the end result. On a scale
from 1 to 5 how important do you rate the existence of trust into the sales
partner for establishing a long-term, sustainable buyer and service provider
relationship?
□ 1 □ 2 □ 3 □ 4 □ 5
(hardly
necessary) (neutral)
(very
important)
4. When buying services, are you looking for a long-term relationship (for several
trade fair cycles) with a service provider who implements your wishes?
□ Yes □ No
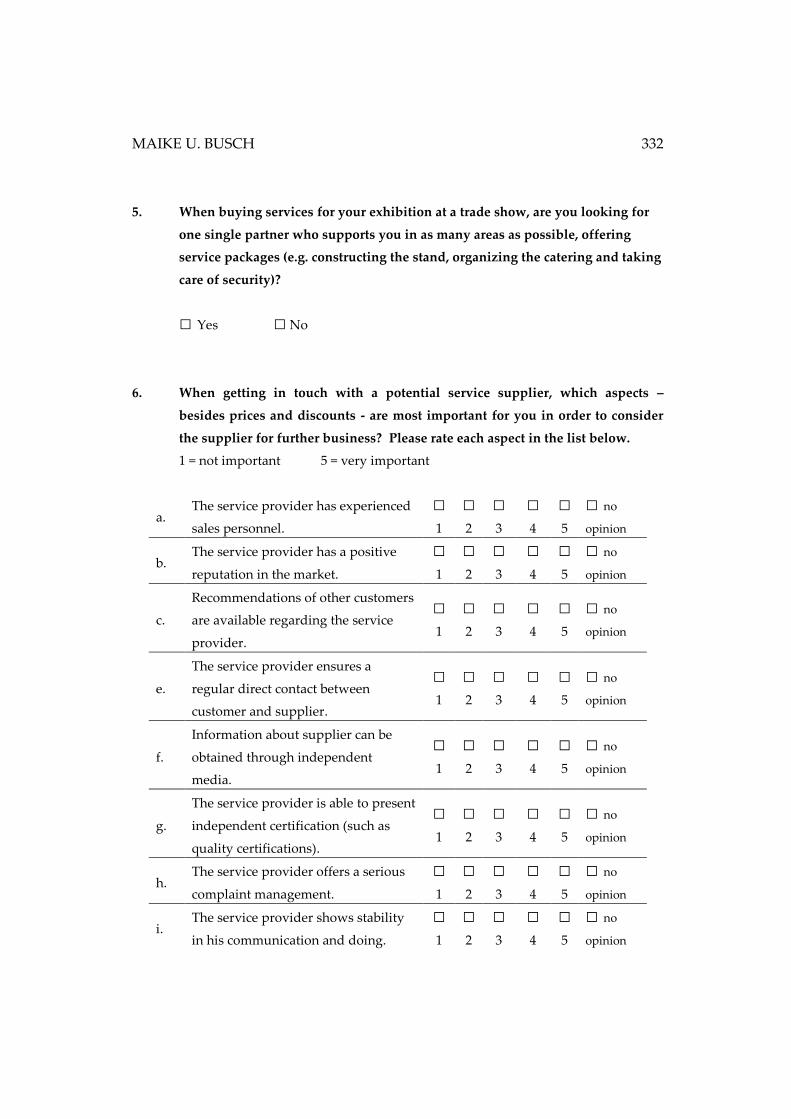
MAIKE U. BUSCH 332
5. When buying services for your exhibition at a trade show, are you looking for
one single partner who supports you in as many areas as possible, offering
service packages (e.g. constructing the stand, organizing the catering and taking
care of security)?
□ Yes □ No
6. When getting in touch with a potential service supplier, which aspects –
besides prices and discounts - are most important for you in order to consider
the supplier for further business? Please rate each aspect in the list below.
1 = not important 5 = very important
a. The service provider has experienced
sales personnel.
□ 1
□ 2
□ 3
□ 4
□ 5
□ no
opinion
b. The service provider has a positive
reputation in the market.
□ 1
□ 2
□ 3
□ 4
□ 5
□ no
opinion
c.
Recommendations of other customers
are available regarding the service
provider.
□ 1
□ 2
□ 3
□ 4
□ 5
□ no
opinion
e.
The service provider ensures a
regular direct contact between
customer and supplier.
□ 1
□ 2
□ 3
□ 4
□ 5
□ no
opinion
f.
Information about supplier can be
obtained through independent
media.
□ 1
□ 2
□ 3
□ 4
□ 5
□ no
opinion
g.
The service provider is able to present
independent certification (such as
quality certifications).
□ 1
□ 2
□ 3
□ 4
□ 5
□ no
opinion
h. The service provider offers a serious
complaint management.
□ 1
□ 2
□ 3
□ 4
□ 5
□ no
opinion
i. The service provider shows stability
in his communication and doing.
□ 1
□ 2
□ 3
□ 4
□ 5
□ no
opinion
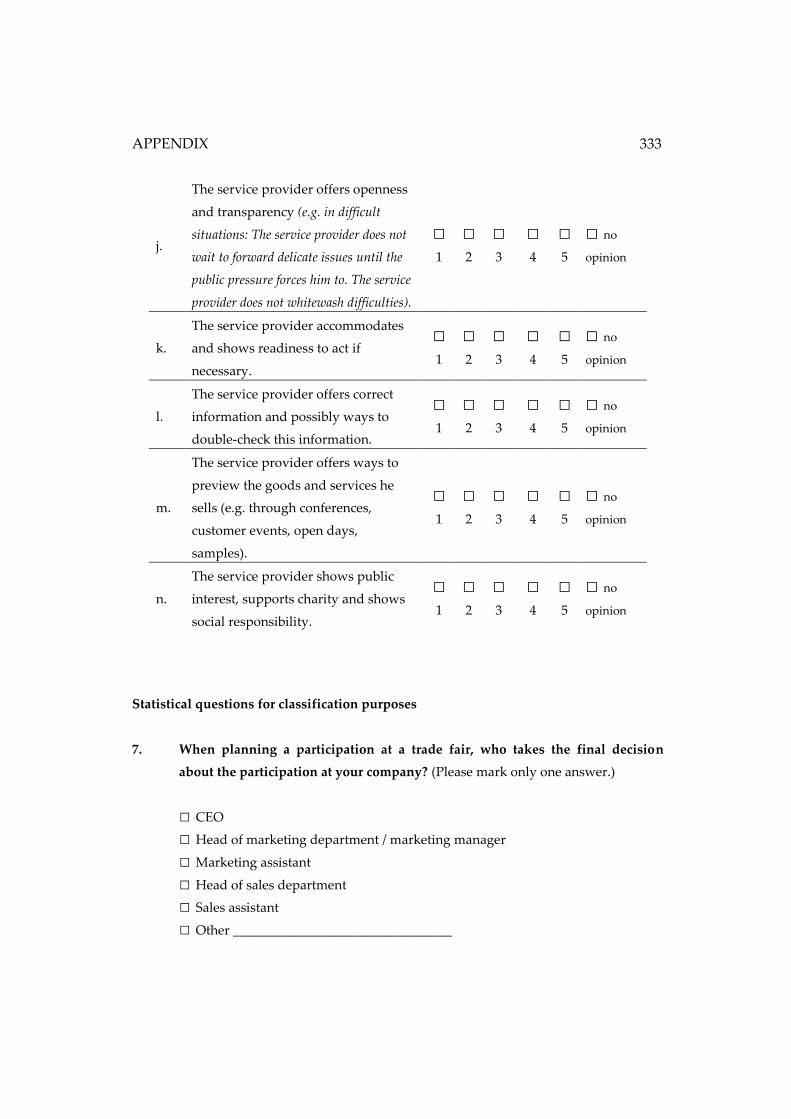
APPENDIX
333
j.
The service provider offers openness
and transparency (e.g. in difficult
situations: The service provider does not
wait to forward delicate issues until the
public pressure forces him to. The service
provider does not whitewash difficulties).
□ 1
□ 2
□ 3
□ 4
□ 5
□ no
opinion
k.
The service provider accommodates
and shows readiness to act if
necessary.
□ 1
□ 2
□ 3
□ 4
□ 5
□ no
opinion
l.
The service provider offers correct
information and possibly ways to
double-check this information.
□ 1
□ 2
□ 3
□ 4
□ 5
□ no
opinion
m.
The service provider offers ways to
preview the goods and services he
sells (e.g. through conferences,
customer events, open days,
samples).
□ 1
□ 2
□ 3
□ 4
□ 5
□ no
opinion
n.
The service provider shows public
interest, supports charity and shows
social responsibility.
□ 1
□ 2
□ 3
□ 4
□ 5
□ no
opinion
Statistical questions for classification purposes
7. When planning a participation at a trade fair, who takes the final decision
about the participation at your company? (Please mark only one answer.)
□ CEO
□ Head of marketing department / marketing manager
□ Marketing assistant
□ Head of sales department
□ Sales assistant
□ Other _________________________________

MAIKE U. BUSCH 334
8. When participating in a trade fair, who decides on the service providers that
actually work for you (e.g. stand builder, caterer, hostess service, press service,
etc)?
□ All decisions are centralized, taken by ________________________________
(position of decider)
□ Decisions are taken decentralized within the correspondent department (e.g.
the Press service is decided on in the PR department)
9a. Was this your first participation in the trade fair MEDICA?
□ Yes □ No, my company has been exhibitor at the MEDICA before.
b. How often have you been an exhibitor at the MEDICA within the previous 5 years?
□ 2nd participation
□ 3rd participation
□ 4th participation
□ 5th participation
10. What size was your stand at this year’s trade fair MEDICA (in sqm)?
□ up to 20 sqm □ 51 – 100 sqm
□ 21 – 50 sqm □ More than 100 sqm
11. Do you exhibit on other fairs grounds other than in Düsseldorf?
□ Yes □ No
12 a. Where is the headquarter of your company located (country)?
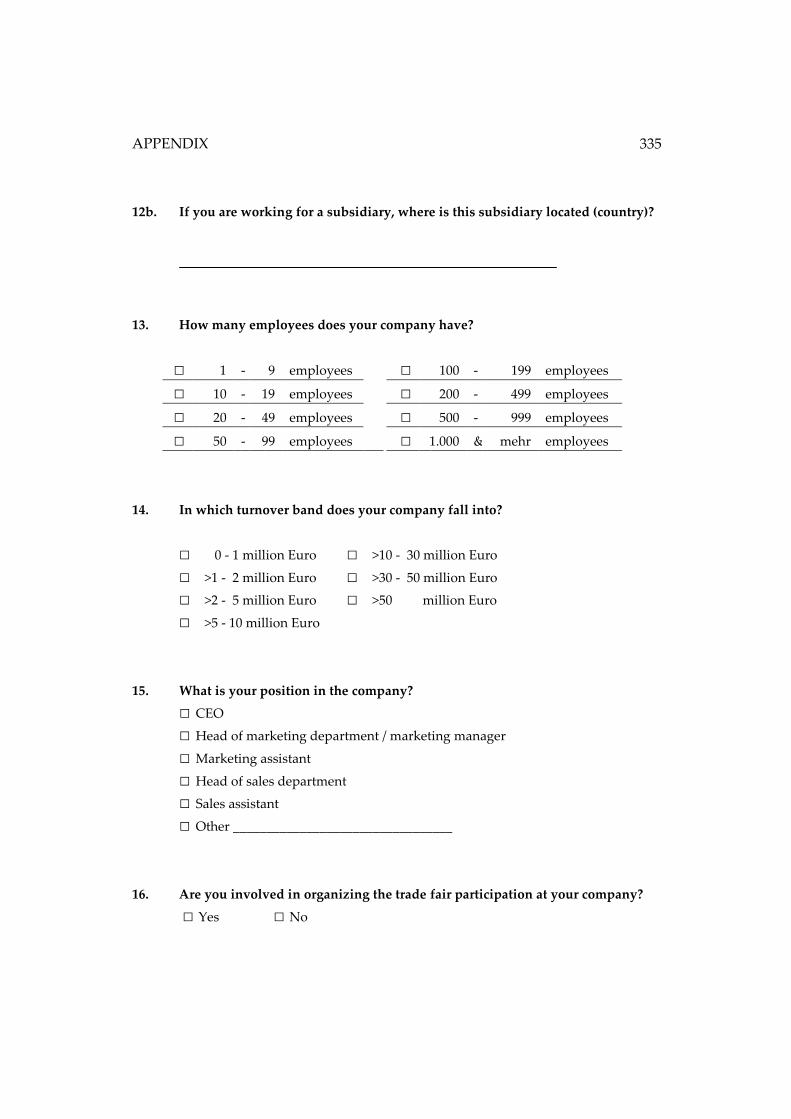
APPENDIX
335
12b. If you are working for a subsidiary, where is this subsidiary located (country)?
13. How many employees does your company have?
□ 1 - 9 employees □ 100 - 199 employees
□ 10 - 19 employees □ 200 - 499 employees
□ 20 - 49 employees □ 500 - 999 employees
□ 50 - 99 employees □ 1.000 & mehr employees
14. In which turnover band does your company fall into?
□ 0 - 1 million Euro □ >10 - 30 million Euro
□ >1 - 2 million Euro □ >30 - 50 million Euro
□ >2 - 5 million Euro □ >50 million Euro
□ >5 - 10 million Euro
15. What is your position in the company?
□ CEO
□ Head of marketing department / marketing manager
□ Marketing assistant
□ Head of sales department
□ Sales assistant
□ Other _________________________________
16. Are you involved in organizing the trade fair participation at your company?
□ Yes □ No
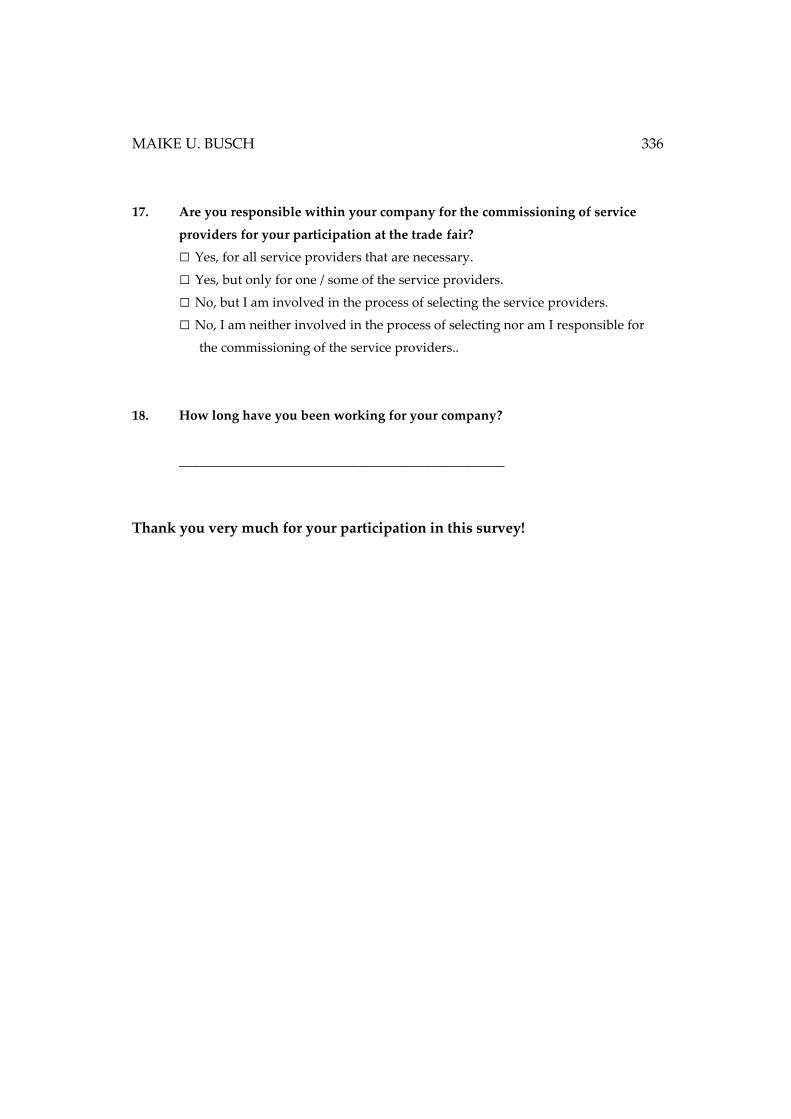
MAIKE U. BUSCH 336
17. Are you responsible within your company for the commissioning of service
providers for your participation at the trade fair?
□ Yes, for all service providers that are necessary.
□ Yes, but only for one / some of the service providers.
□ No, but I am involved in the process of selecting the service providers.
□ No, I am neither involved in the process of selecting nor am I responsible for
the commissioning of the service providers..
18. How long have you been working for your company?
_________________________________________________
Thank you very much for your participation in this survey!
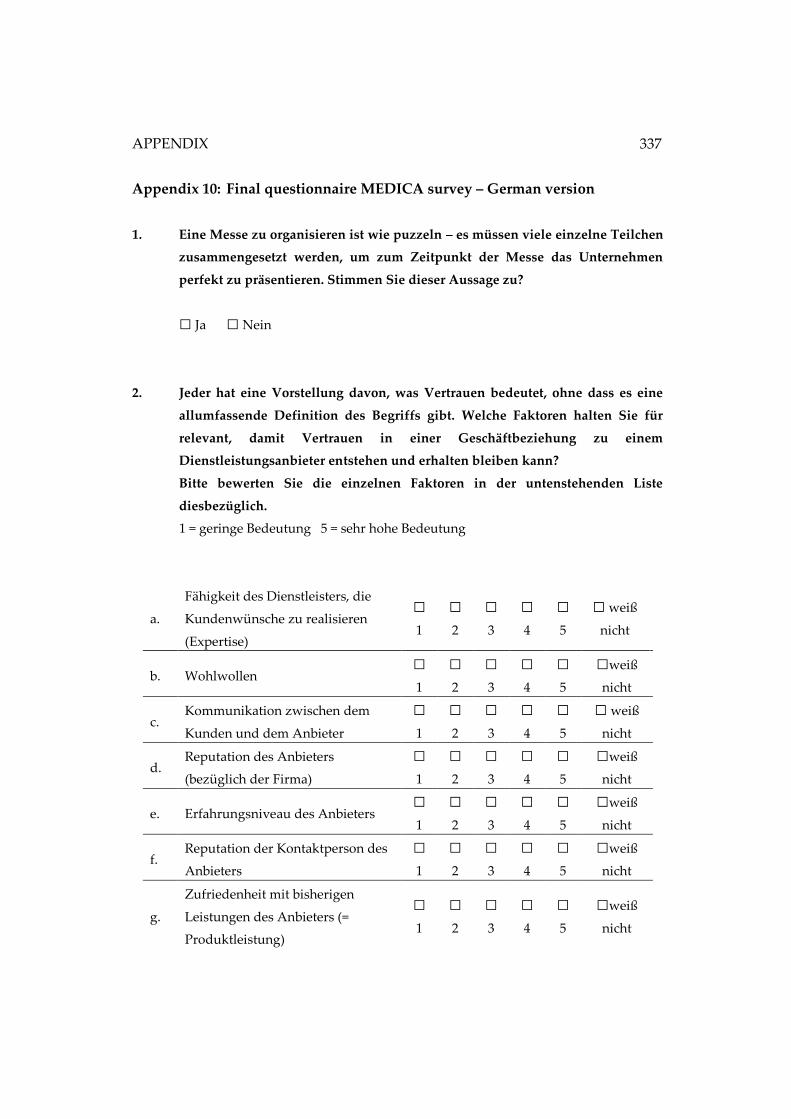
APPENDIX
337
Appendix 10: Final questionnaire MEDICA survey – German version
1. Eine Messe zu organisieren ist wie puzzeln – es müssen viele einzelne Teilchen
zusammengesetzt werden, um zum Zeitpunkt der Messe das Unternehmen
perfekt zu präsentieren. Stimmen Sie dieser Aussage zu?
□ Ja □ Nein
2. Jeder hat eine Vorstellung davon, was Vertrauen bedeutet, ohne dass es eine
allumfassende Definition des Begriffs gibt. Welche Faktoren halten Sie für
relevant, damit Vertrauen in einer Geschäftbeziehung zu einem
Dienstleistungsanbieter entstehen und erhalten bleiben kann?
Bitte bewerten Sie die einzelnen Faktoren in der untenstehenden Liste
diesbezüglich.
1 = geringe Bedeutung 5 = sehr hohe Bedeutung
a.
Fähigkeit des Dienstleisters, die
Kundenwünsche zu realisieren
(Expertise)
□ 1
□ 2
□ 3
□ 4
□ 5
□ weiß
nicht
b. Wohlwollen □ 1
□ 2
□ 3
□ 4
□ 5
□weiß
nicht
c. Kommunikation zwischen dem
Kunden und dem Anbieter
□ 1
□ 2
□ 3
□ 4
□ 5
□ weiß
nicht
d. Reputation des Anbieters
(bezüglich der Firma)
□ 1
□ 2
□ 3
□ 4
□ 5
□weiß
nicht
e. Erfahrungsniveau des Anbieters □ 1
□ 2
□ 3
□ 4
□ 5
□weiß
nicht
f. Reputation der Kontaktperson des
Anbieters
□ 1
□ 2
□ 3
□ 4
□ 5
□weiß
nicht
g.
Zufriedenheit mit bisherigen
Leistungen des Anbieters (=
Produktleistung)
□ 1
□ 2
□ 3
□ 4
□ 5
□weiß
nicht
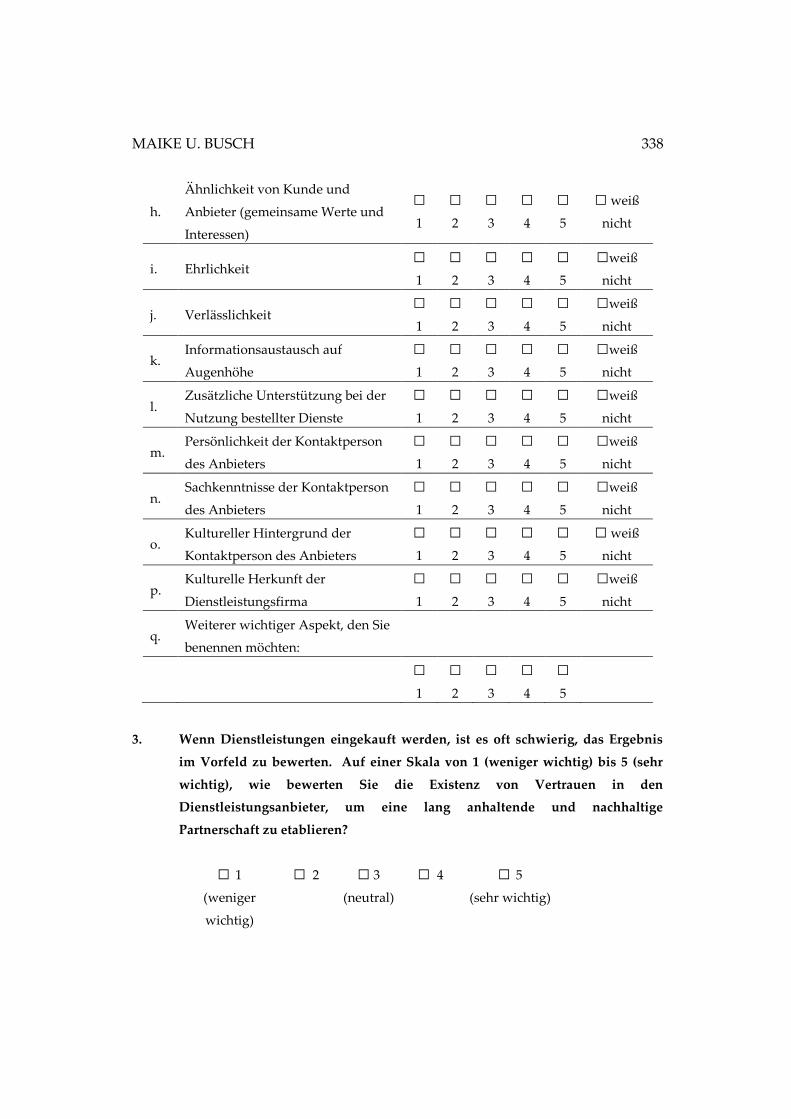
MAIKE U. BUSCH 338
h.
Ähnlichkeit von Kunde und
Anbieter (gemeinsame Werte und
Interessen)
□ 1
□ 2
□ 3
□ 4
□ 5
□ weiß
nicht
i. Ehrlichkeit □ 1
□ 2
□ 3
□ 4
□ 5
□weiß
nicht
j. Verlässlichkeit □ 1
□ 2
□ 3
□ 4
□ 5
□weiß
nicht
k. Informationsaustausch auf
Augenhöhe
□ 1
□ 2
□ 3
□ 4
□ 5
□weiß
nicht
l. Zusätzliche Unterstützung bei der
Nutzung bestellter Dienste
□ 1
□ 2
□ 3
□ 4
□ 5
□weiß
nicht
m. Persönlichkeit der Kontaktperson
des Anbieters
□ 1
□ 2
□ 3
□ 4
□ 5
□weiß
nicht
n. Sachkenntnisse der Kontaktperson
des Anbieters
□ 1
□ 2
□ 3
□ 4
□ 5
□weiß
nicht
o. Kultureller Hintergrund der
Kontaktperson des Anbieters
□ 1
□ 2
□ 3
□ 4
□ 5
□ weiß
nicht
p. Kulturelle Herkunft der
Dienstleistungsfirma
□ 1
□ 2
□ 3
□ 4
□ 5
□weiß
nicht
q. Weiterer wichtiger Aspekt, den Sie
benennen möchten:
□ 1
□ 2
□ 3
□ 4
□ 5
3. Wenn Dienstleistungen eingekauft werden, ist es oft schwierig, das Ergebnis
im Vorfeld zu bewerten. Auf einer Skala von 1 (weniger wichtig) bis 5 (sehr
wichtig), wie bewerten Sie die Existenz von Vertrauen in den
Dienstleistungsanbieter, um eine lang anhaltende und nachhaltige
Partnerschaft zu etablieren?
□ 1
(weniger
wichtig)
□ 2
□ 3
(neutral)
□ 4
□ 5
(sehr wichtig)

APPENDIX
339
4. Wenn Sie die Dienstleistungen für einen Messeauftritt kaufen, wünschen Sie
sich eine langfristige Geschäftbeziehung (über mehrer Messeturnusse hinweg)
mit dem Anbieter, der Ihre Vorstellungen umsetzt?
□ Ja □ Nein
5. Wenn Sie Dienstleistungen für Ihren Messeauftritt buchen, wünschen Sie sich
einen Dienstleister, der Sie in möglichst vielen Belangen unterstützen kann,
also Dienstleistungspakete anbietet (z.B. Standbau, Catering,
Standbewachung)?
□ Ja □ Nein
6. Wenn Sie mit einem für Sie potenziellen Dienstleistungsanbieter in Kontakt
treten, welche Aspekte – abgesehen von Preisen und Rabatten – sind für Sie
relevant, um den Anbieter für zukünftige Geschäfte in Betracht zu ziehen?
Bitte Bewerten Sie die unten stehenden Aspekte.
1 = geringe Bedeutung 5 = sehr hohe Bedeutung
a. Der Dienstleistungsanbieter hat
erfahrenes Verkaufspersonal.
□ 1
□ 2
□ 3
□ 4
□ 5
□ weiß
nicht
b. Der Dienstleistungsanbieter hat eine
positive Reputation auf dem Markt.
□ 1
□ 2
□ 3
□ 4
□ 5
□ weiß
nicht
c.
Empfehlungen anderer Kunden
bezüglich des Anbieters sind
verfügbar.
□ 1
□ 2
□ 3
□ 4
□ 5
□ weiß
nicht
e.
Der Anbieter sorgt für regelmäßigen
Kontakt zwischen dem Kunden &
dem Anbieter.
□ 1
□ 2
□ 3
□ 4
□ 5
□ weiß
nicht
f.
Informationen über den Dienstleister
können über unabhängige Medien
generiert werden.
□ 1
□ 2
□ 3
□ 4
□ 5
□ weiß
nicht
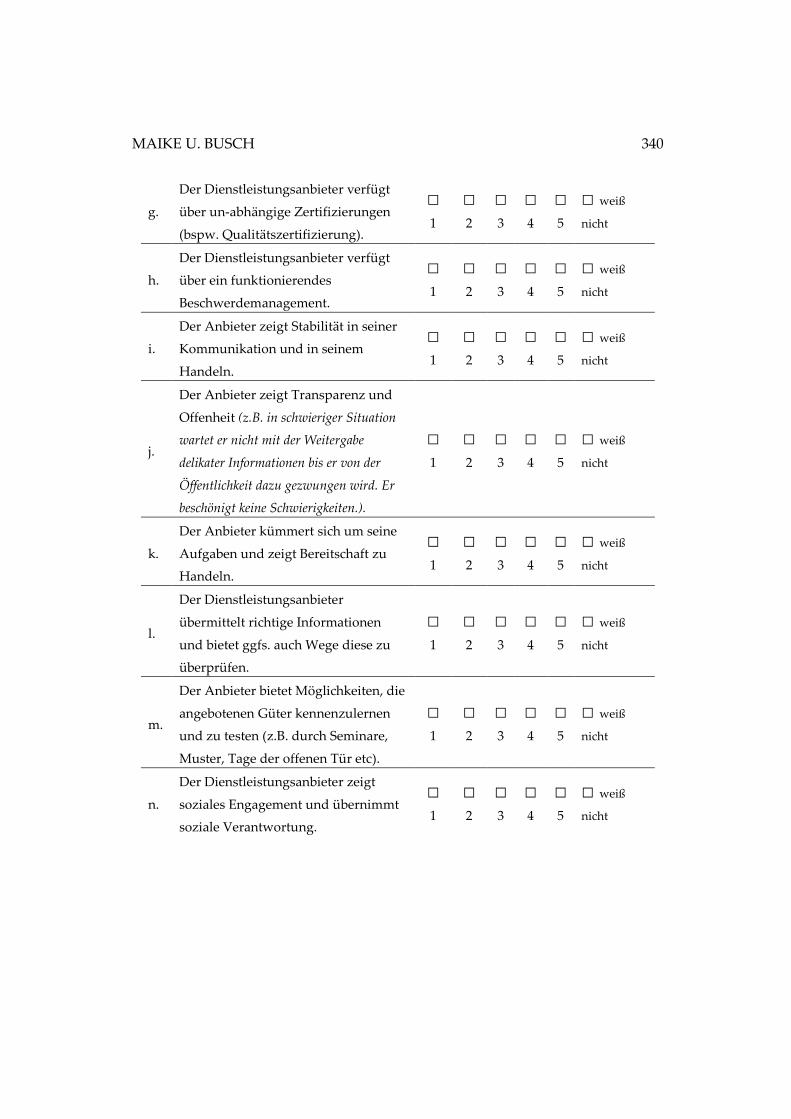
MAIKE U. BUSCH 340
g.
Der Dienstleistungsanbieter verfügt
über un-abhängige Zertifizierungen
(bspw. Qualitätszertifizierung).
□ 1
□ 2
□ 3
□ 4
□ 5
□ weiß
nicht
h.
Der Dienstleistungsanbieter verfügt
über ein funktionierendes
Beschwerdemanagement.
□ 1
□ 2
□ 3
□ 4
□ 5
□ weiß
nicht
i.
Der Anbieter zeigt Stabilität in seiner
Kommunikation und in seinem
Handeln.
□ 1
□ 2
□ 3
□ 4
□ 5
□ weiß
nicht
j.
Der Anbieter zeigt Transparenz und
Offenheit (z.B. in schwieriger Situation
wartet er nicht mit der Weitergabe
delikater Informationen bis er von der
Öffentlichkeit dazu gezwungen wird. Er
beschönigt keine Schwierigkeiten.).
□ 1
□ 2
□ 3
□ 4
□ 5
□ weiß
nicht
k.
Der Anbieter kümmert sich um seine
Aufgaben und zeigt Bereitschaft zu
Handeln.
□ 1
□ 2
□ 3
□ 4
□ 5
□ weiß
nicht
l.
Der Dienstleistungsanbieter
übermittelt richtige Informationen
und bietet ggfs. auch Wege diese zu
überprüfen.
□ 1
□ 2
□ 3
□ 4
□ 5
□ weiß
nicht
m.
Der Anbieter bietet Möglichkeiten, die
angebotenen Güter kennenzulernen
und zu testen (z.B. durch Seminare,
Muster, Tage der offenen Tür etc).
□ 1
□ 2
□ 3
□ 4
□ 5
□ weiß
nicht
n.
Der Dienstleistungsanbieter zeigt
soziales Engagement und übernimmt
soziale Verantwortung.
□ 1
□ 2
□ 3
□ 4
□ 5
□ weiß
nicht

APPENDIX
341
Statistische Fragen zu Klassifizierungszwecken
7. Wenn in Ihrem Unternehmen die Teilnahme an einer Messe geplant wird, wer
trifft letztlich die Entscheidung über die Teilnahme? (Bitte nur eine Antwort
markieren)
□ CEO
□ Leiter Marketing-Abteilung / Marketing Manager
□ Mitarbeiter der Marketing-Abteilung
□ Leiter Sales-Abteilung / Sales Manager
□ Mitarbeiter der Sales-Abteilung
□ andere _________________________________
8. Wenn an einer Messe teilgenommen wird, wer entscheidet über einen
bestimmen Serviceanbieters, der dann den Auftrag von Ihnen erhält (z.B.
Standbauer, Hostessen-Service, Presseservice, etc)?
□ Alle Entscheidungen werden zentral übernommen durch
____________________________________________(Position des Entscheiders)
□ Die Entscheidungen werden dezentral in den entsprechenden Abteilungen
getroffen (z.B. Buchung des Presseservice übernimmt die PR-Abteilung)
9.a War dies Ihre erste Teilnahme an der Messe MEDICA?
□ Ja □Nein, meine Firma hat bereits zuvor an der MEDICA teilgenommen.
b. Wie oft haben Sie in den letzten 5 Jahren an der MEDICA teilgenommen?
□ 2. Teilnahme
□ 3. Teilnahme
□ 4. Teilnahme
□ 5. Teilnahme
10. Welche Größe hatte Ihr Messestand bei der diesjährigen Messe MEDICA?

MAIKE U. BUSCH 342
□ bis zu 20 m² □ 51 – 100 m²
□ 21 – 50 m² □ mehr als 100 m²
11. Stellen Sie auch auf anderen Messeplätzen als in Düsseldorf aus?
□ Ja □ Nein
12a. Wo befindet sich der Hauptsitz Ihrer Firma (Land)?
______________________________________________________________
12b. Falls Sie für eine Niederlassung/Tochtergesellschaft Ihrer Firma arbeiten, wo
befindet sich der Standort (Land)?
_____________________________________________________________
13. Wie viele Mitarbeiter hat Ihre Firma?
□ 1 - 9 Mitarbeiter □ 100 - 199 Mitarbeiter
□ 10 - 19 Mitarbeiter □ 200 - 499 Mitarbeiter
□ 20 - 49 Mitarbeiter □ 500 - 999 Mitarbeiter
□ 50 - 99 Mitarbeiter □ 1.000 & mehr Mitarbeiter
14. In welche Umsatz-Klasse fällt Ihr Unternehmen?
□ 0 - 1 Millionen Euro □ >10 - 30 Millionen Euro
□ >1 - 2 Millionen Euro □ >30 - 50 Millionen Euro
□ >2 - 5 Millionen Euro □ >50 Millionen Euro
□ >5 - 10 Millionen Euro
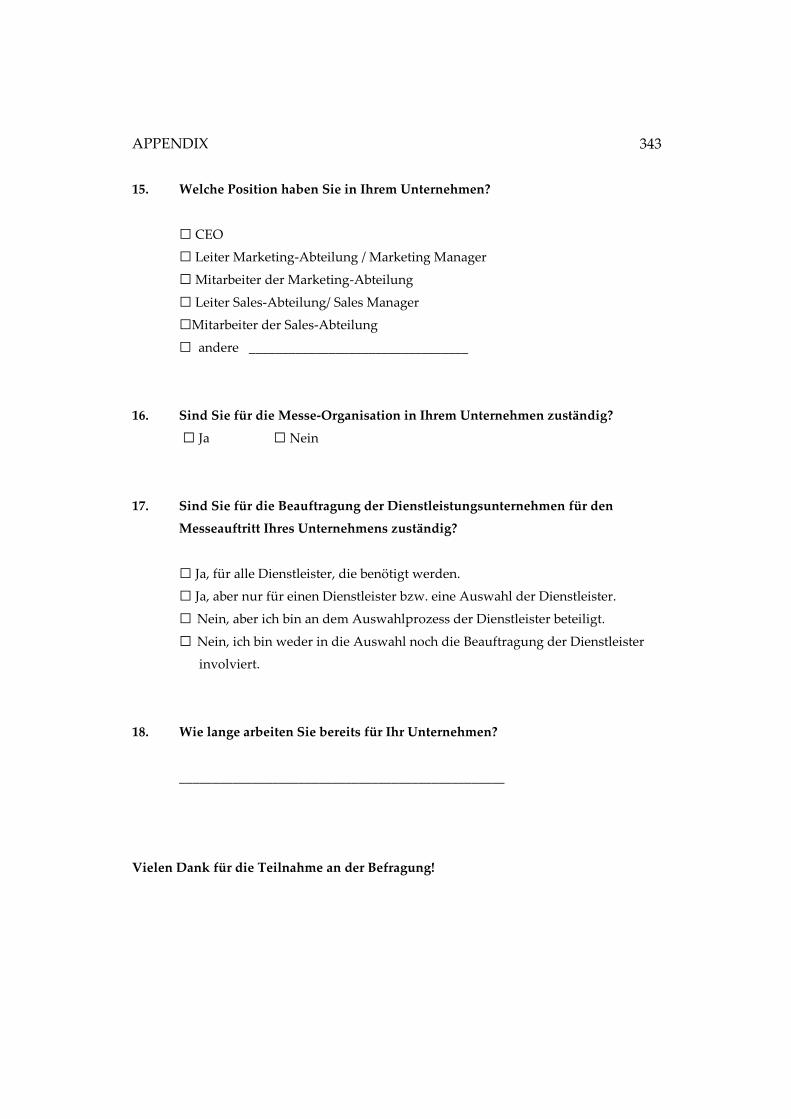
APPENDIX
343
15. Welche Position haben Sie in Ihrem Unternehmen?
□ CEO
□ Leiter Marketing-Abteilung / Marketing Manager
□ Mitarbeiter der Marketing-Abteilung
□ Leiter Sales-Abteilung/ Sales Manager
□Mitarbeiter der Sales-Abteilung
□ andere _________________________________
16. Sind Sie für die Messe-Organisation in Ihrem Unternehmen zuständig?
□ Ja □ Nein
17. Sind Sie für die Beauftragung der Dienstleistungsunternehmen für den
Messeauftritt Ihres Unternehmens zuständig?
□ Ja, für alle Dienstleister, die benötigt werden.
□ Ja, aber nur für einen Dienstleister bzw. eine Auswahl der Dienstleister.
□ Nein, aber ich bin an dem Auswahlprozess der Dienstleister beteiligt.
□ Nein, ich bin weder in die Auswahl noch die Beauftragung der Dienstleister
involviert.
18. Wie lange arbeiten Sie bereits für Ihr Unternehmen?
_________________________________________________
Vielen Dank für die Teilnahme an der Befragung!
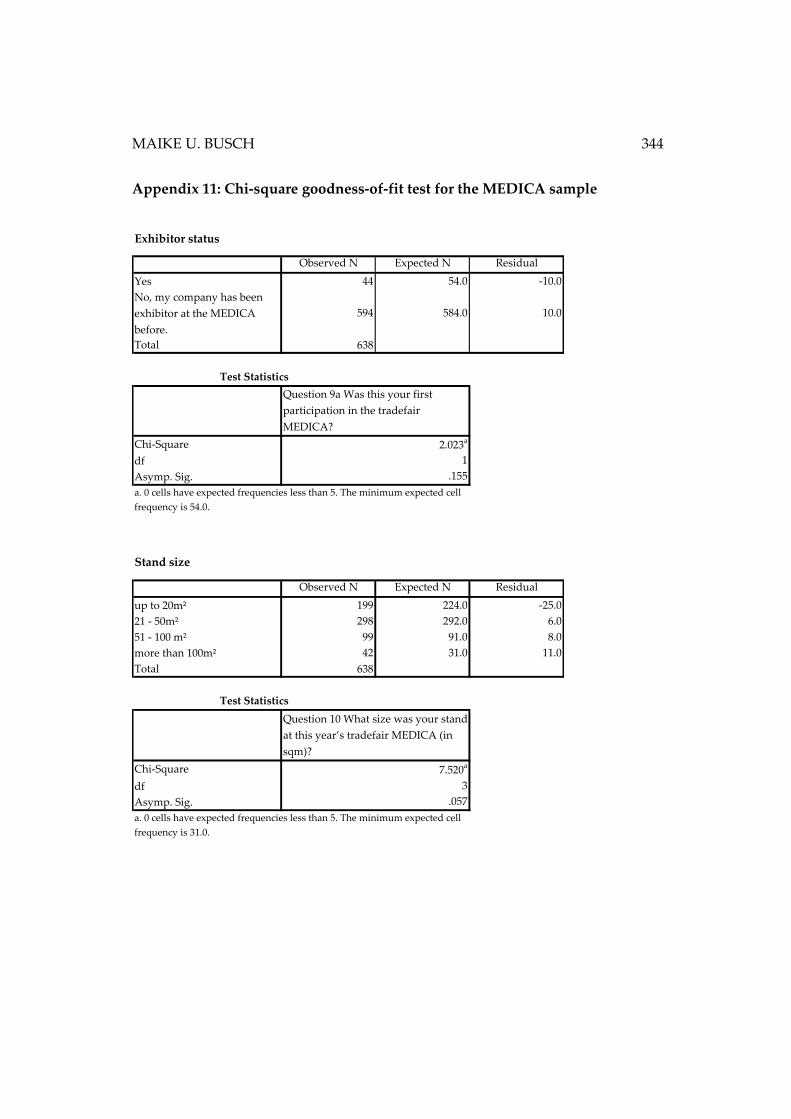
MAIKE U. BUSCH 344
Appendix 11: Chi-square goodness-of-fit test for the MEDICA sample
Observed N Expected N Residual
Yes 44 54.0 -10.0
No, my company has been
exhibitor at the MEDICA
before.
594 584.0 10.0
Total 638
Chi-Square
df
Asymp. Sig.
Question 9a Was this your first
participation in the tradefair
MEDICA?
2.023a
1
.155
a. 0 cells have expected frequencies less than 5. The minimum expected cell
frequency is 54.0.
Exhibitor status
Test Statistics
Observed N Expected N Residual
up to 20m² 199 224.0 -25.0
21 - 50m² 298 292.0 6.0
51 - 100 m² 99 91.0 8.0
more than 100m² 42 31.0 11.0
Total 638
Chi-Square
df
Asymp. Sig.
Question 10 What size was your stand
at this year’s tradefair MEDICA (in
sqm)?
7.520a
3
.057
a. 0 cells have expected frequencies less than 5. The minimum expected cell
frequency is 31.0.
Stand size
Test Statistics
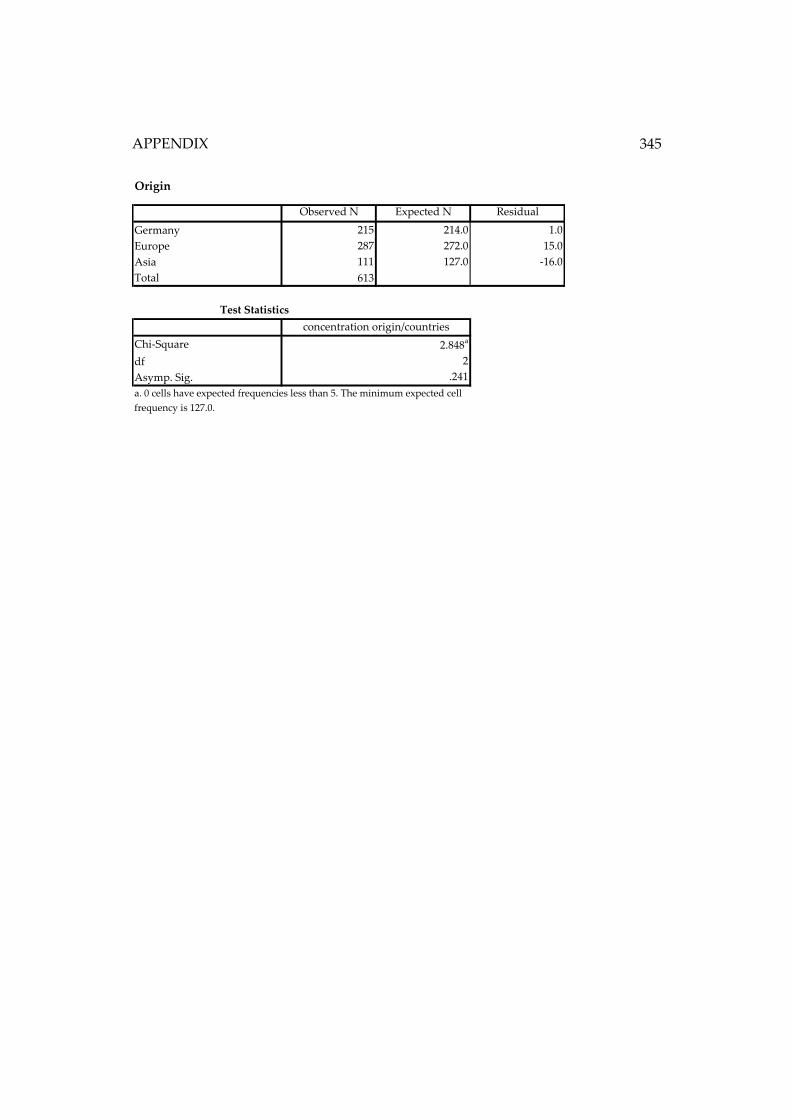
APPENDIX
345
Observed N Expected N Residual
Germany 215 214.0 1.0
Europe 287 272.0 15.0
Asia 111 127.0 -16.0
Total 613
Chi-Square
df
Asymp. Sig.
2.848a
2
.241
a. 0 cells have expected frequencies less than 5. The minimum expected cell
frequency is 127.0.
Test Statistics
Origin
concentration origin/countries
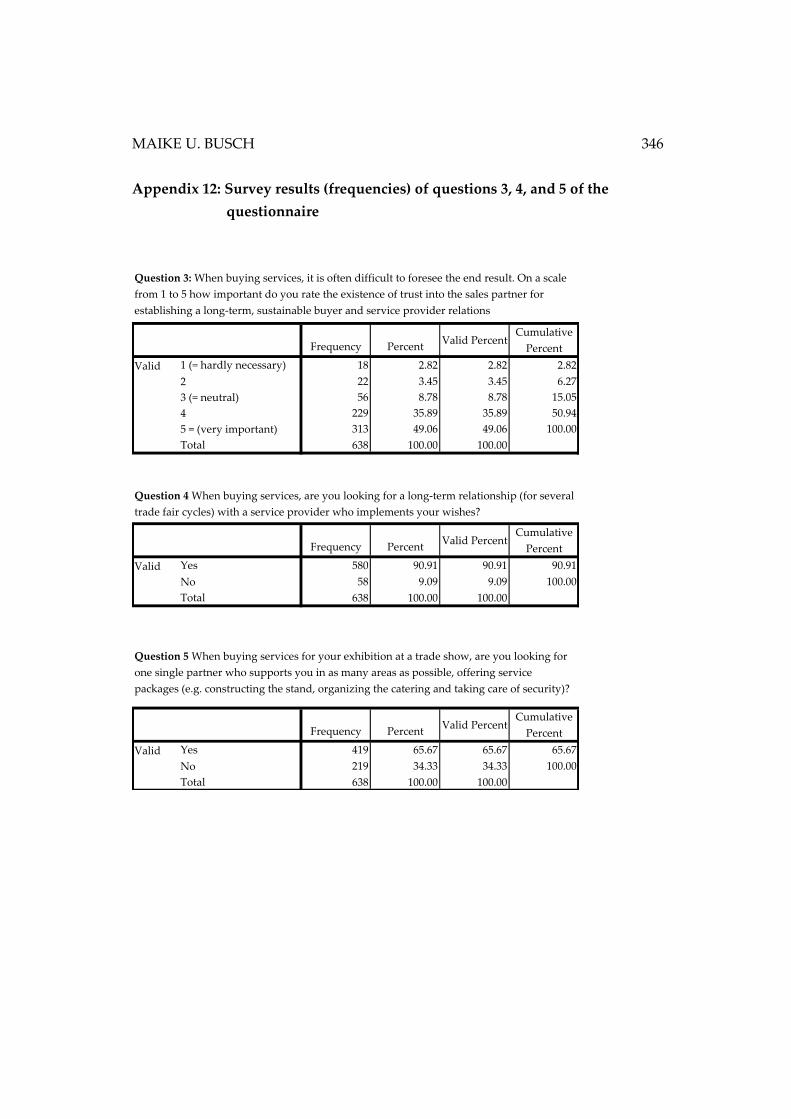
MAIKE U. BUSCH 346
Appendix 12: Survey results (frequencies) of questions 3, 4, and 5 of the
questionnaire
Frequency PercentValid Percent
Cumulative
Percent
1 (= hardly necessary) 18 2.82 2.82 2.82
2 22 3.45 3.45 6.27
3 (= neutral) 56 8.78 8.78 15.05
4 229 35.89 35.89 50.94
5 = (very important) 313 49.06 49.06 100.00
Total 638 100.00 100.00
Frequency PercentValid Percent
Cumulative
Percent
Yes 580 90.91 90.91 90.91
No 58 9.09 9.09 100.00
Total 638 100.00 100.00
Frequency PercentValid Percent
Cumulative
Percent
Yes 419 65.67 65.67 65.67
No 219 34.33 34.33 100.00
Total 638 100.00 100.00
Valid
Valid
Question 5 When buying services for your exhibition at a trade show, are you looking for
one single partner who supports you in as many areas as possible, offering service
packages (e.g. constructing the stand, organizing the catering and taking care of security)?
Question 3: When buying services, it is often difficult to foresee the end result. On a scale
from 1 to 5 how important do you rate the existence of trust into the sales partner for
establishing a long-term, sustainable buyer and service provider relations
Valid
Question 4 When buying services, are you looking for a long-term relationship (for several
trade fair cycles) with a service provider who implements your wishes?
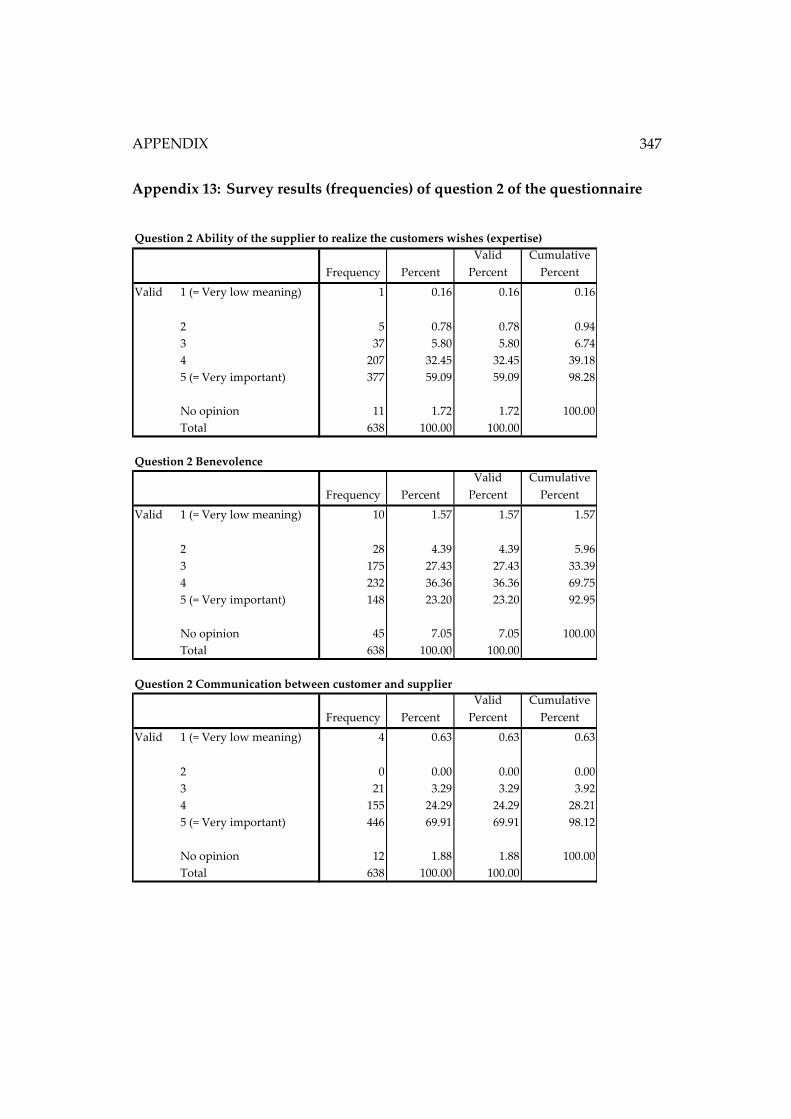
APPENDIX
347
Appendix 13: Survey results (frequencies) of question 2 of the questionnaire
Frequency Percent
Valid
Percent
Cumulative
Percent
1 (= Very low meaning) 1 0.16 0.16 0.16
2 5 0.78 0.78 0.94
3 37 5.80 5.80 6.74
4 207 32.45 32.45 39.18
5 (= Very important) 377 59.09 59.09 98.28
No opinion 11 1.72 1.72 100.00
Total 638 100.00 100.00
Frequency Percent
Valid
Percent
Cumulative
Percent
1 (= Very low meaning) 10 1.57 1.57 1.57
2 28 4.39 4.39 5.96
3 175 27.43 27.43 33.39
4 232 36.36 36.36 69.75
5 (= Very important) 148 23.20 23.20 92.95
No opinion 45 7.05 7.05 100.00
Total 638 100.00 100.00
Frequency Percent
Valid
Percent
Cumulative
Percent
1 (= Very low meaning) 4 0.63 0.63 0.63
2 0 0.00 0.00 0.00
3 21 3.29 3.29 3.92
4 155 24.29 24.29 28.21
5 (= Very important) 446 69.91 69.91 98.12
No opinion 12 1.88 1.88 100.00
Total 638 100.00 100.00
Frequency Percent
Valid
Percent
Cumulative
Percent
1 (= Very low meaning) 4 0.63 0.63 0.63
2 15 2.35 2.35 2.98
3 117 18.34 18.34 21.32
4 269 42.16 42.16 63.48
5 (= Very important) 220 34.48 34.48 97.96
No opinion 13 2.04 2.04 100.00
Total 638 100.00 100.00
Valid
Question 2 Supplier reputation (in relation to the company)
Valid
Valid
Question 2 Communication between customer and supplier
Question 2 Ability of the supplier to realize the customers wishes (expertise)
Valid
Question 2 Benevolence
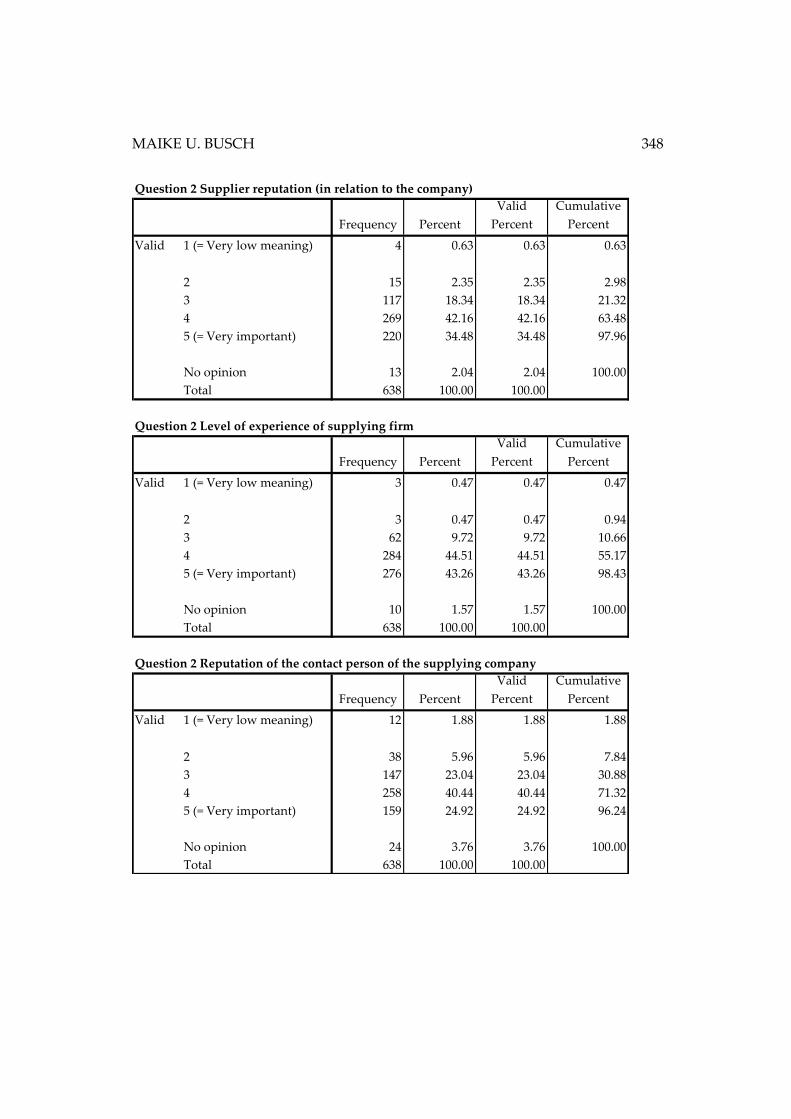
MAIKE U. BUSCH 348
Frequency Percent
Valid
Percent
Cumulative
Percent
1 (= Very low meaning) 4 0.63 0.63 0.63
2 15 2.35 2.35 2.98
3 117 18.34 18.34 21.32
4 269 42.16 42.16 63.48
5 (= Very important) 220 34.48 34.48 97.96
No opinion 13 2.04 2.04 100.00
Total 638 100.00 100.00
Frequency Percent
Valid
Percent
Cumulative
Percent
1 (= Very low meaning) 3 0.47 0.47 0.47
2 3 0.47 0.47 0.94
3 62 9.72 9.72 10.66
4 284 44.51 44.51 55.17
5 (= Very important) 276 43.26 43.26 98.43
No opinion 10 1.57 1.57 100.00
Total 638 100.00 100.00
Frequency Percent
Valid
Percent
Cumulative
Percent
1 (= Very low meaning) 12 1.88 1.88 1.88
2 38 5.96 5.96 7.84
3 147 23.04 23.04 30.88
4 258 40.44 40.44 71.32
5 (= Very important) 159 24.92 24.92 96.24
No opinion 24 3.76 3.76 100.00
Total 638 100.00 100.00
Valid
Question 2 Level of experience of supplying firm
Valid
Question 2 Reputation of the contact person of the supplying company
Question 2 Supplier reputation (in relation to the company)
Valid
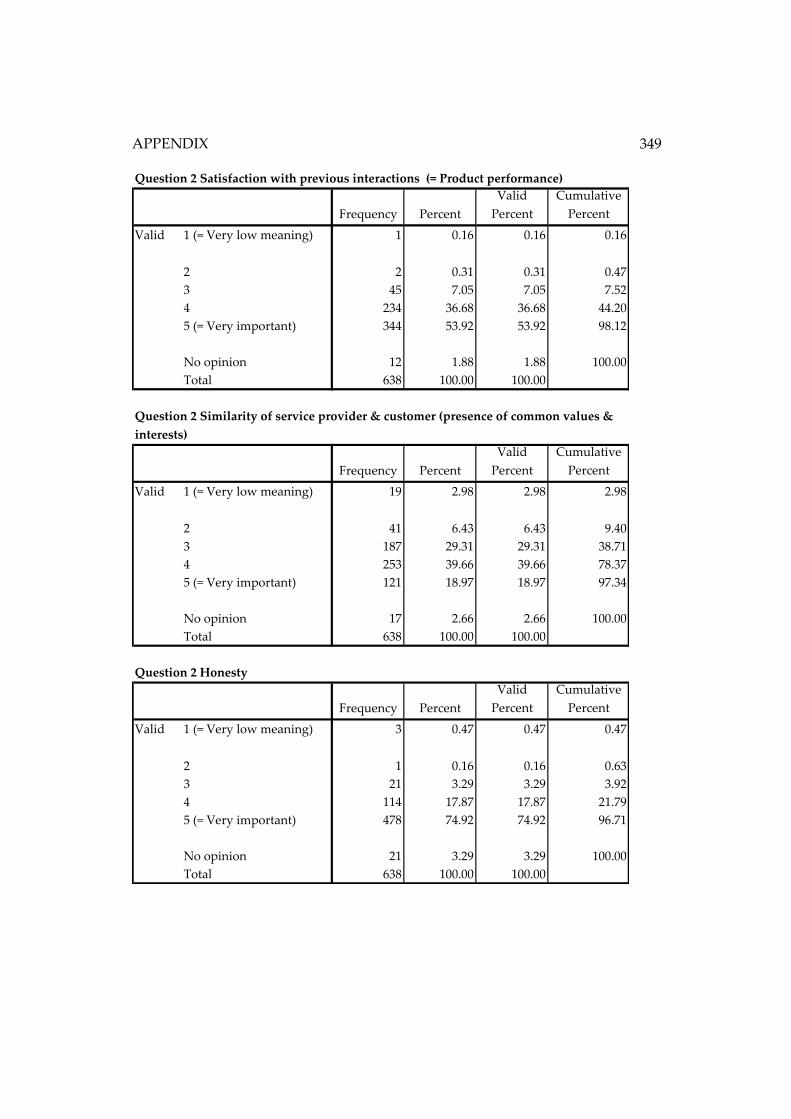
APPENDIX
349
Frequency Percent
Valid
Percent
Cumulative
Percent
1 (= Very low meaning) 1 0.16 0.16 0.16
2 2 0.31 0.31 0.47
3 45 7.05 7.05 7.52
4 234 36.68 36.68 44.20
5 (= Very important) 344 53.92 53.92 98.12
No opinion 12 1.88 1.88 100.00
Total 638 100.00 100.00
Frequency Percent
Valid
Percent
Cumulative
Percent
1 (= Very low meaning) 19 2.98 2.98 2.98
2 41 6.43 6.43 9.40
3 187 29.31 29.31 38.71
4 253 39.66 39.66 78.37
5 (= Very important) 121 18.97 18.97 97.34
No opinion 17 2.66 2.66 100.00
Total 638 100.00 100.00
Frequency Percent
Valid
Percent
Cumulative
Percent
1 (= Very low meaning) 3 0.47 0.47 0.47
2 1 0.16 0.16 0.63
3 21 3.29 3.29 3.92
4 114 17.87 17.87 21.79
5 (= Very important) 478 74.92 74.92 96.71
No opinion 21 3.29 3.29 100.00
Total 638 100.00 100.00
Question 2 Honesty
Valid
Valid
Question 2 Similarity of service provider & customer (presence of common values &
interests)
Valid
Question 2 Satisfaction with previous interactions (= Product performance)
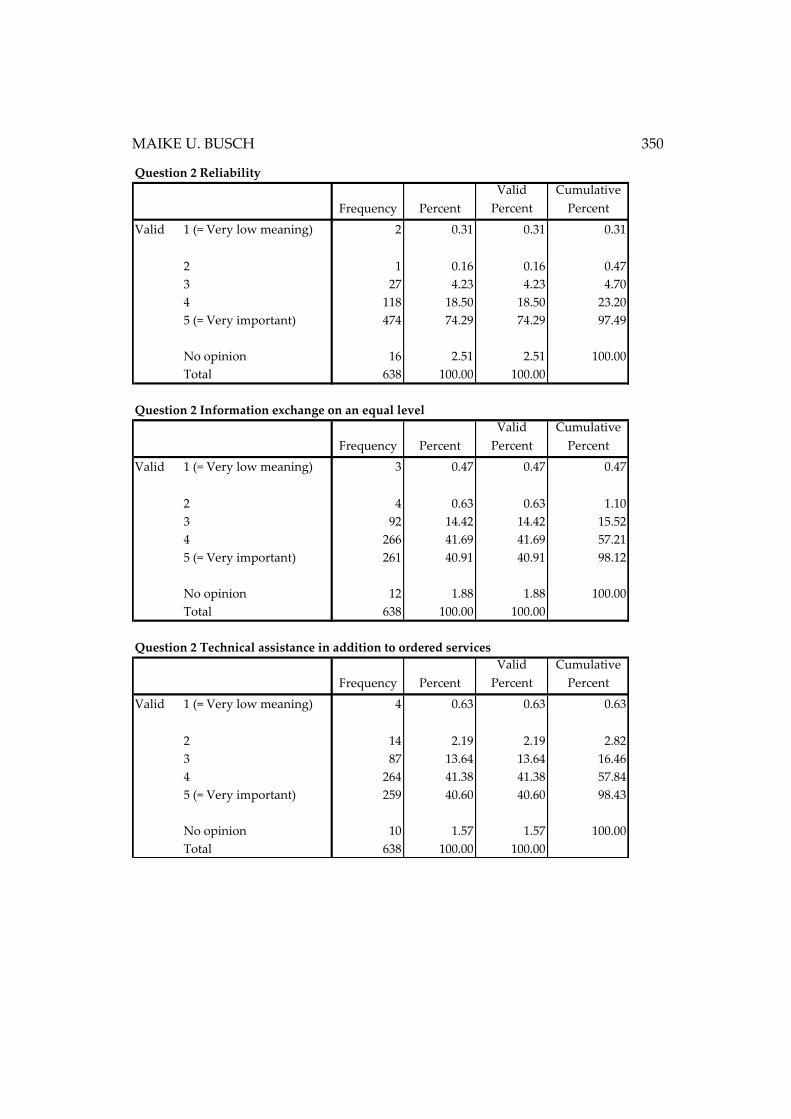
MAIKE U. BUSCH 350
Frequency Percent
Valid
Percent
Cumulative
Percent
1 (= Very low meaning) 2 0.31 0.31 0.31
2 1 0.16 0.16 0.47
3 27 4.23 4.23 4.70
4 118 18.50 18.50 23.20
5 (= Very important) 474 74.29 74.29 97.49
No opinion 16 2.51 2.51 100.00
Total 638 100.00 100.00
Frequency Percent
Valid
Percent
Cumulative
Percent
1 (= Very low meaning) 3 0.47 0.47 0.47
2 4 0.63 0.63 1.10
3 92 14.42 14.42 15.52
4 266 41.69 41.69 57.21
5 (= Very important) 261 40.91 40.91 98.12
No opinion 12 1.88 1.88 100.00
Total 638 100.00 100.00
Frequency Percent
Valid
Percent
Cumulative
Percent
1 (= Very low meaning) 4 0.63 0.63 0.63
2 14 2.19 2.19 2.82
3 87 13.64 13.64 16.46
4 264 41.38 41.38 57.84
5 (= Very important) 259 40.60 40.60 98.43
No opinion 10 1.57 1.57 100.00
Total 638 100.00 100.00
Valid
Question 2 Technical assistance in addition to ordered services
Valid
Valid
Question 2 Information exchange on an equal level
Question 2 Reliability
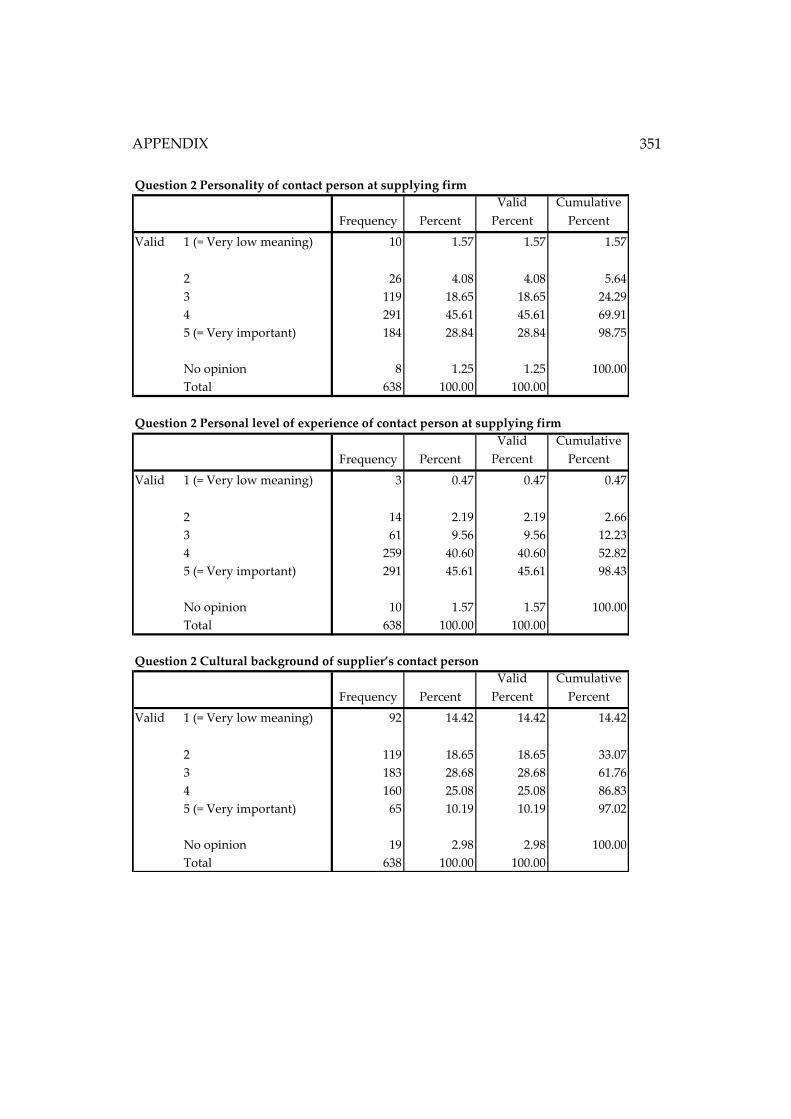
APPENDIX
351
Frequency Percent
Valid
Percent
Cumulative
Percent
1 (= Very low meaning) 10 1.57 1.57 1.57
2 26 4.08 4.08 5.64
3 119 18.65 18.65 24.29
4 291 45.61 45.61 69.91
5 (= Very important) 184 28.84 28.84 98.75
No opinion 8 1.25 1.25 100.00
Total 638 100.00 100.00
Frequency Percent
Valid
Percent
Cumulative
Percent
1 (= Very low meaning) 3 0.47 0.47 0.47
2 14 2.19 2.19 2.66
3 61 9.56 9.56 12.23
4 259 40.60 40.60 52.82
5 (= Very important) 291 45.61 45.61 98.43
No opinion 10 1.57 1.57 100.00
Total 638 100.00 100.00
Frequency Percent
Valid
Percent
Cumulative
Percent
1 (= Very low meaning) 92 14.42 14.42 14.42
2 119 18.65 18.65 33.07
3 183 28.68 28.68 61.76
4 160 25.08 25.08 86.83
5 (= Very important) 65 10.19 10.19 97.02
No opinion 19 2.98 2.98 100.00
Total 638 100.00 100.00
Valid
Valid
Question 2 Cultural background of supplier’s contact person
Question 2 Personality of contact person at supplying firm
Valid
Question 2 Personal level of experience of contact person at supplying firm
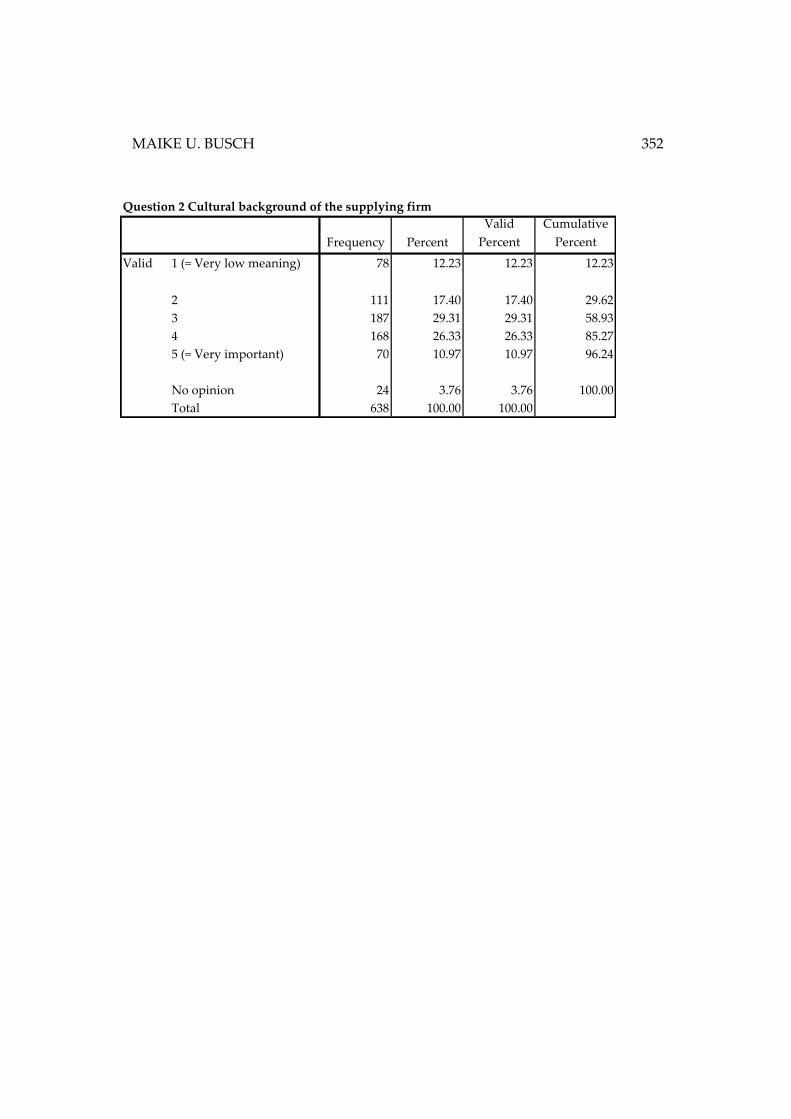
MAIKE U. BUSCH 352
Frequency Percent
Valid
Percent
Cumulative
Percent
1 (= Very low meaning) 78 12.23 12.23 12.23
2 111 17.40 17.40 29.62
3 187 29.31 29.31 58.93
4 168 26.33 26.33 85.27
5 (= Very important) 70 10.97 10.97 96.24
No opinion 24 3.76 3.76 100.00
Total 638 100.00 100.00
Question 2 Cultural background of the supplying firm
Valid
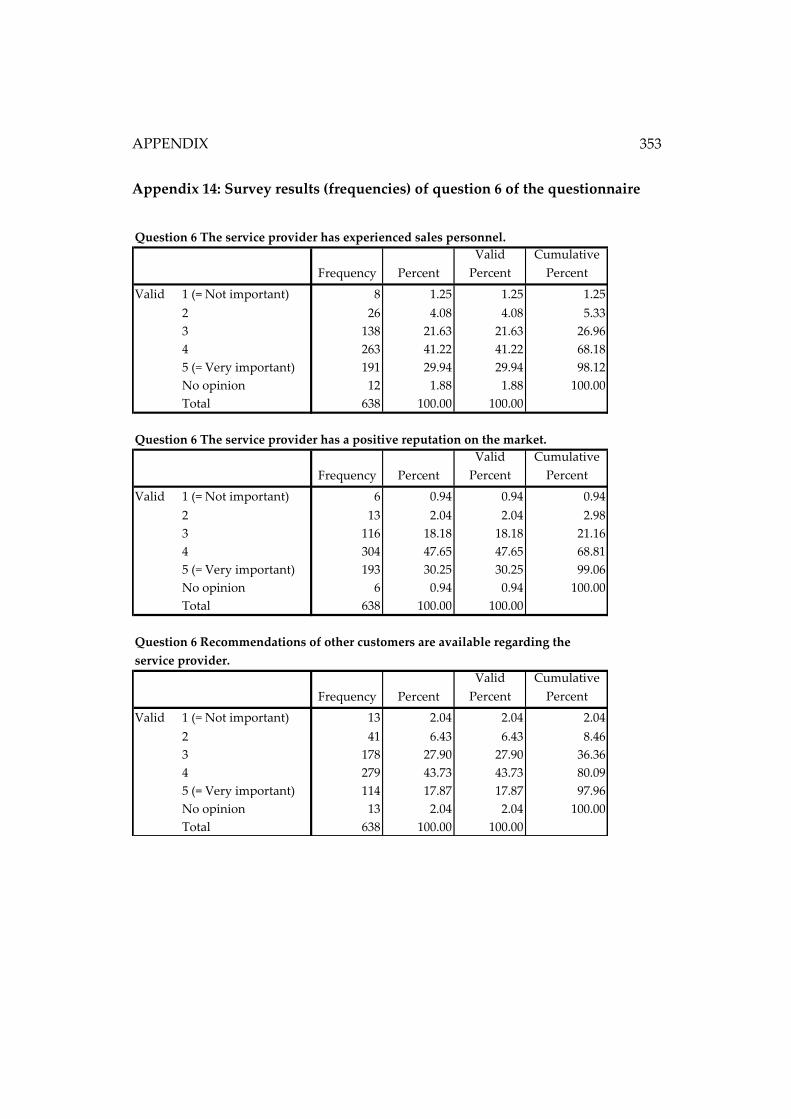
APPENDIX
353
Appendix 14: Survey results (frequencies) of question 6 of the questionnaire
Frequency Percent
Valid
Percent
Cumulative
Percent
1 (= Not important) 8 1.25 1.25 1.25
2 26 4.08 4.08 5.33
3 138 21.63 21.63 26.96
4 263 41.22 41.22 68.18
5 (= Very important) 191 29.94 29.94 98.12
No opinion 12 1.88 1.88 100.00
Total 638 100.00 100.00
Frequency Percent
Valid
Percent
Cumulative
Percent
1 (= Not important) 6 0.94 0.94 0.94
2 13 2.04 2.04 2.98
3 116 18.18 18.18 21.16
4 304 47.65 47.65 68.81
5 (= Very important) 193 30.25 30.25 99.06
No opinion 6 0.94 0.94 100.00
Total 638 100.00 100.00
Frequency Percent
Valid
Percent
Cumulative
Percent
1 (= Not important) 13 2.04 2.04 2.04
2 41 6.43 6.43 8.46
3 178 27.90 27.90 36.36
4 279 43.73 43.73 80.09
5 (= Very important) 114 17.87 17.87 97.96
No opinion 13 2.04 2.04 100.00
Total 638 100.00 100.00
Valid
Valid
Question 6 Recommendations of other customers are available regarding the
service provider.
Question 6 The service provider has experienced sales personnel.
Valid
Question 6 The service provider has a positive reputation on the market.
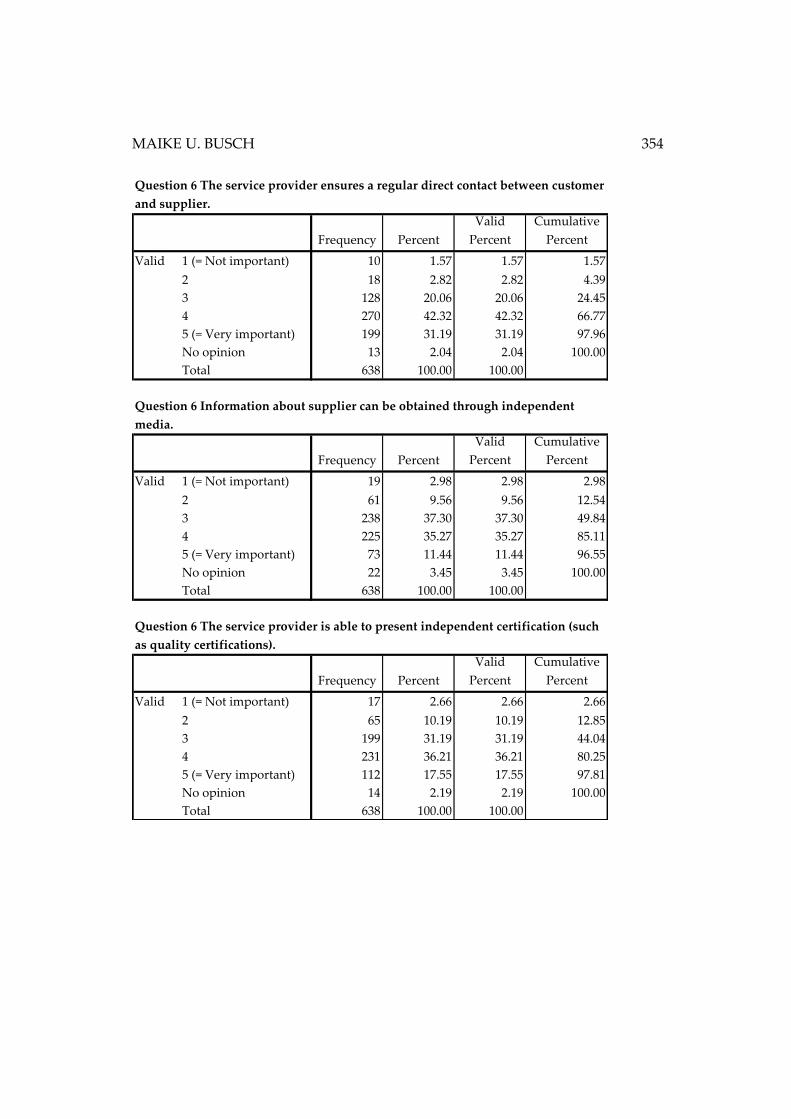
MAIKE U. BUSCH 354
Frequency Percent
Valid
Percent
Cumulative
Percent
1 (= Not important) 10 1.57 1.57 1.57
2 18 2.82 2.82 4.39
3 128 20.06 20.06 24.45
4 270 42.32 42.32 66.77
5 (= Very important) 199 31.19 31.19 97.96
No opinion 13 2.04 2.04 100.00
Total 638 100.00 100.00
Frequency Percent
Valid
Percent
Cumulative
Percent
1 (= Not important) 19 2.98 2.98 2.98
2 61 9.56 9.56 12.54
3 238 37.30 37.30 49.84
4 225 35.27 35.27 85.11
5 (= Very important) 73 11.44 11.44 96.55
No opinion 22 3.45 3.45 100.00
Total 638 100.00 100.00
Frequency Percent
Valid
Percent
Cumulative
Percent
1 (= Not important) 17 2.66 2.66 2.66
2 65 10.19 10.19 12.85
3 199 31.19 31.19 44.04
4 231 36.21 36.21 80.25
5 (= Very important) 112 17.55 17.55 97.81
No opinion 14 2.19 2.19 100.00
Total 638 100.00 100.00
Valid
Question 6 Information about supplier can be obtained through independent
media.
Valid
Question 6 The service provider is able to present independent certification (such
as quality certifications).
Question 6 The service provider ensures a regular direct contact between customer
and supplier.
Valid
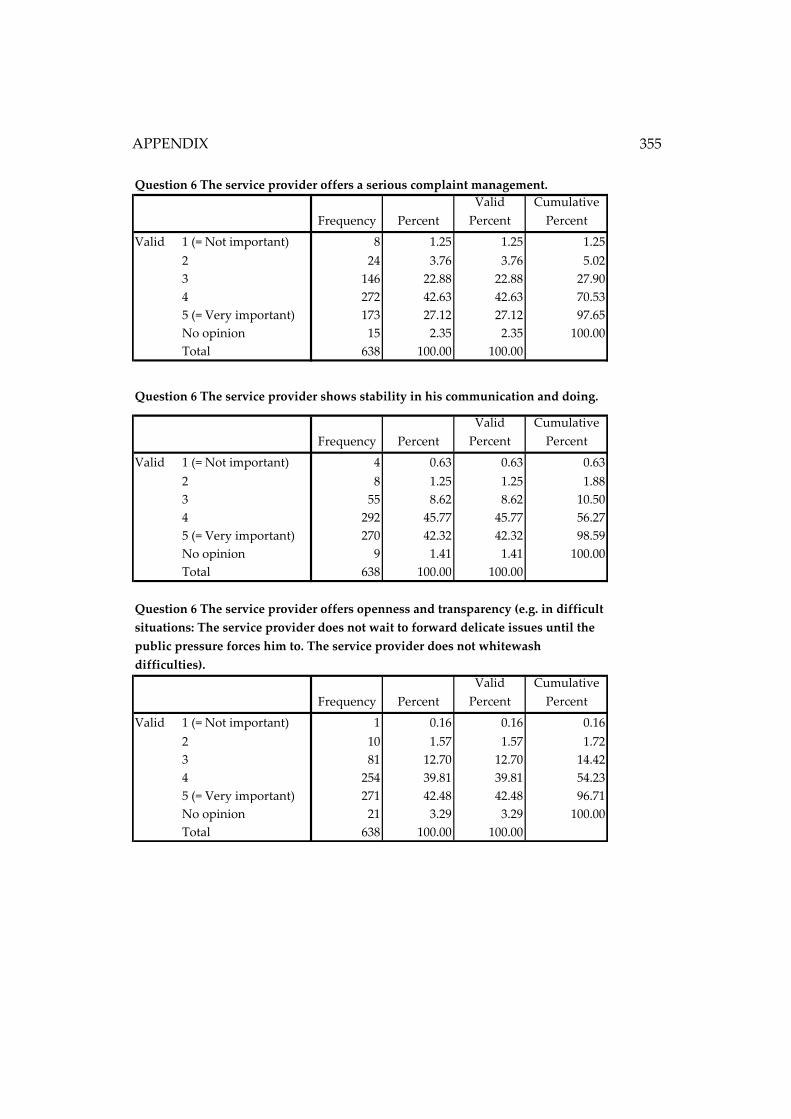
APPENDIX
355
Frequency Percent
Valid
Percent
Cumulative
Percent
1 (= Not important) 8 1.25 1.25 1.25
2 24 3.76 3.76 5.02
3 146 22.88 22.88 27.90
4 272 42.63 42.63 70.53
5 (= Very important) 173 27.12 27.12 97.65
No opinion 15 2.35 2.35 100.00
Total 638 100.00 100.00
Frequency Percent
Valid
Percent
Cumulative
Percent
1 (= Not important) 4 0.63 0.63 0.63
2 8 1.25 1.25 1.88
3 55 8.62 8.62 10.50
4 292 45.77 45.77 56.27
5 (= Very important) 270 42.32 42.32 98.59
No opinion 9 1.41 1.41 100.00
Total 638 100.00 100.00
Frequency Percent
Valid
Percent
Cumulative
Percent
1 (= Not important) 1 0.16 0.16 0.16
2 10 1.57 1.57 1.72
3 81 12.70 12.70 14.42
4 254 39.81 39.81 54.23
5 (= Very important) 271 42.48 42.48 96.71
No opinion 21 3.29 3.29 100.00
Total 638 100.00 100.00
Question 6 The service provider offers openness and transparency (e.g. in difficult
situations: The service provider does not wait to forward delicate issues until the
public pressure forces him to. The service provider does not whitewash
difficulties).
Valid
Valid
Question 6 The service provider shows stability in his communication and doing.
Valid
Question 6 The service provider offers a serious complaint management.
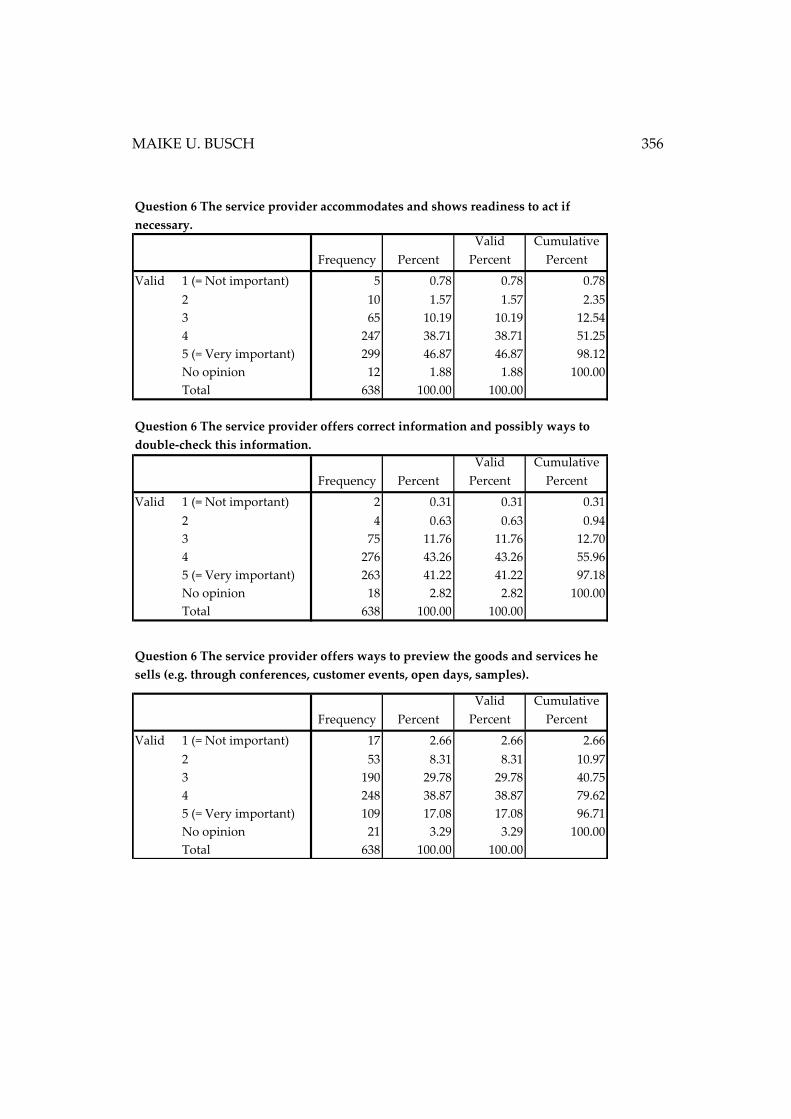
MAIKE U. BUSCH 356
Frequency Percent
Valid
Percent
Cumulative
Percent
1 (= Not important) 5 0.78 0.78 0.78
2 10 1.57 1.57 2.35
3 65 10.19 10.19 12.54
4 247 38.71 38.71 51.25
5 (= Very important) 299 46.87 46.87 98.12
No opinion 12 1.88 1.88 100.00
Total 638 100.00 100.00
Frequency Percent
Valid
Percent
Cumulative
Percent
1 (= Not important) 2 0.31 0.31 0.31
2 4 0.63 0.63 0.94
3 75 11.76 11.76 12.70
4 276 43.26 43.26 55.96
5 (= Very important) 263 41.22 41.22 97.18
No opinion 18 2.82 2.82 100.00
Total 638 100.00 100.00
Frequency Percent
Valid
Percent
Cumulative
Percent
1 (= Not important) 17 2.66 2.66 2.66
2 53 8.31 8.31 10.97
3 190 29.78 29.78 40.75
4 248 38.87 38.87 79.62
5 (= Very important) 109 17.08 17.08 96.71
No opinion 21 3.29 3.29 100.00
Total 638 100.00 100.00
Valid
Question 6 The service provider offers ways to preview the goods and services he
sells (e.g. through conferences, customer events, open days, samples).
Valid
Valid
Question 6 The service provider offers correct information and possibly ways to
double-check this information.
Question 6 The service provider accommodates and shows readiness to act if
necessary.
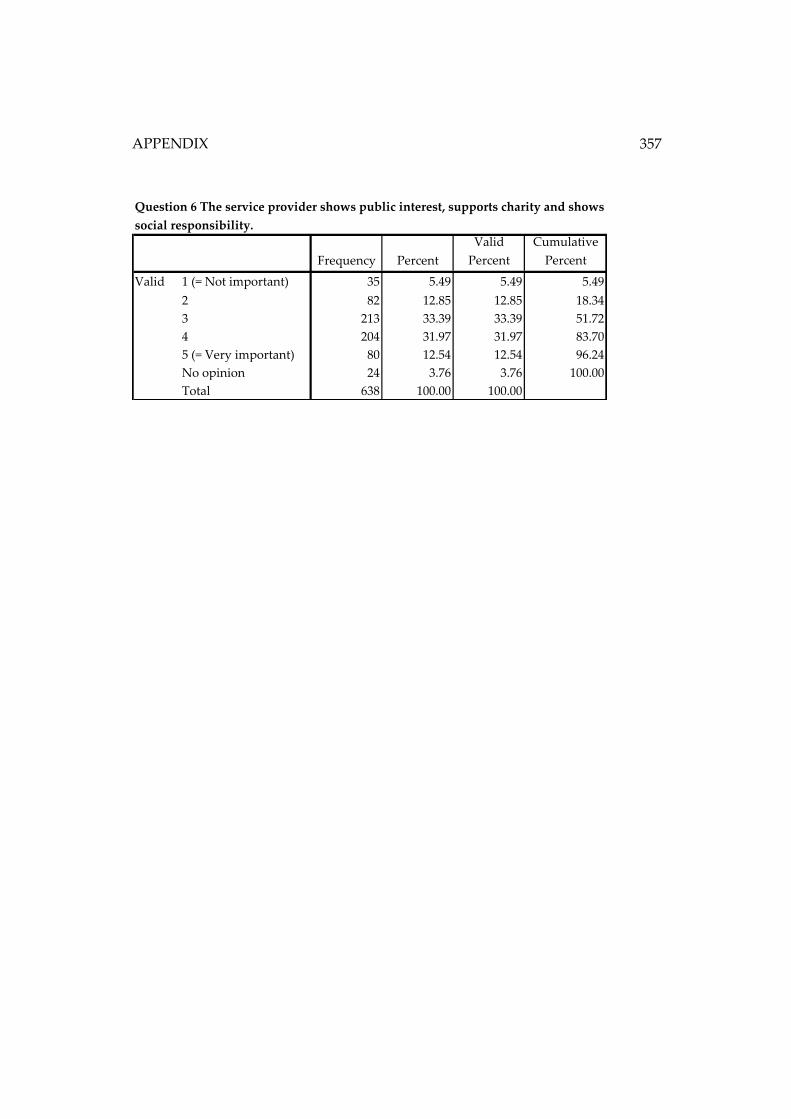
APPENDIX
357
Frequency Percent
Valid
Percent
Cumulative
Percent
1 (= Not important) 35 5.49 5.49 5.49
2 82 12.85 12.85 18.34
3 213 33.39 33.39 51.72
4 204 31.97 31.97 83.70
5 (= Very important) 80 12.54 12.54 96.24
No opinion 24 3.76 3.76 100.00
Total 638 100.00 100.00
Question 6 The service provider shows public interest, supports charity and shows
social responsibility.
Valid
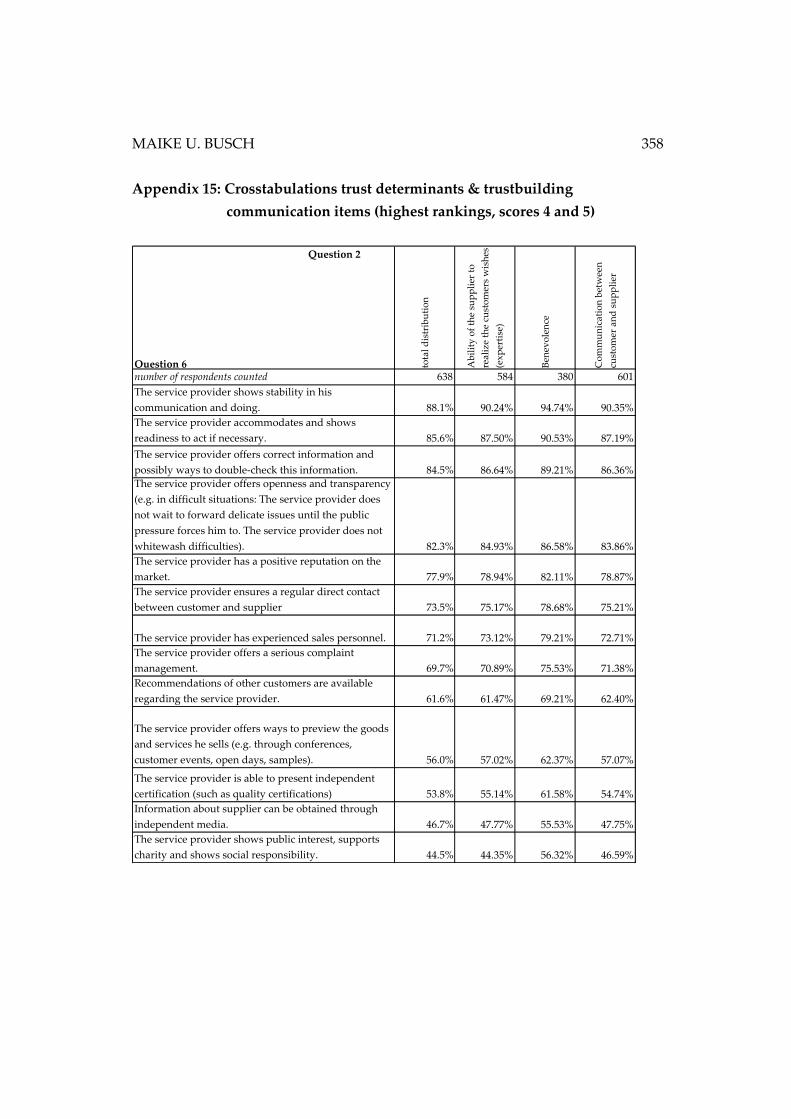
MAIKE U. BUSCH 358
Appendix 15: Crosstabulations trust determinants & trustbuilding
communication items (highest rankings, scores 4 and 5)
Question 2
Question 6 tota
l d
istr
ibu
tio
n
Ab
ilit
y o
f th
e su
pp
lier
to
real
ize
the
cust
om
ers
wis
hes
(ex
per
tise
)
Ben
evo
len
ce
Co
mm
un
icat
ion
bet
wee
n
cust
om
er a
nd
su
pp
lier
number of respondents counted 638 584 380 601
The service provider shows stability in his
communication and doing. 88.1% 90.24% 94.74% 90.35%
The service provider accommodates and shows
readiness to act if necessary. 85.6% 87.50% 90.53% 87.19%
The service provider offers correct information and
possibly ways to double-check this information. 84.5% 86.64% 89.21% 86.36%
The service provider offers openness and transparency
(e.g. in difficult situations: The service provider does
not wait to forward delicate issues until the public
pressure forces him to. The service provider does not
whitewash difficulties). 82.3% 84.93% 86.58% 83.86%
The service provider has a positive reputation on the
market. 77.9% 78.94% 82.11% 78.87%
The service provider ensures a regular direct contact
between customer and supplier 73.5% 75.17% 78.68% 75.21%
The service provider has experienced sales personnel. 71.2% 73.12% 79.21% 72.71%
The service provider offers a serious complaint
management. 69.7% 70.89% 75.53% 71.38%
Recommendations of other customers are available
regarding the service provider. 61.6% 61.47% 69.21% 62.40%
The service provider offers ways to preview the goods
and services he sells (e.g. through conferences,
customer events, open days, samples). 56.0% 57.02% 62.37% 57.07%
The service provider is able to present independent
certification (such as quality certifications) 53.8% 55.14% 61.58% 54.74%
Information about supplier can be obtained through
independent media. 46.7% 47.77% 55.53% 47.75%
The service provider shows public interest, supports
charity and shows social responsibility. 44.5% 44.35% 56.32% 46.59%
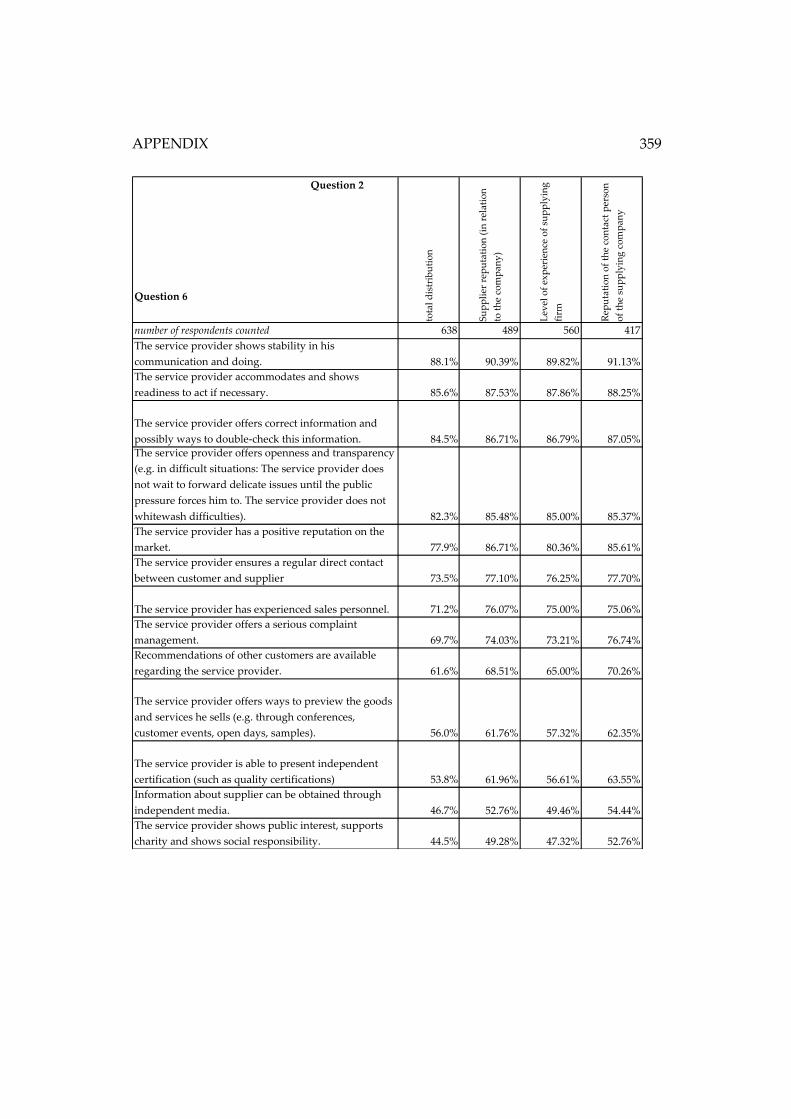
APPENDIX
359
Question 2
Question 6
tota
l d
istr
ibu
tio
n
Su
pp
lier
rep
uta
tio
n (
in r
elat
ion
to t
he
com
pan
y)
Lev
el o
f ex
per
ien
ce o
f su
pp
lyin
g
firm
Rep
uta
tio
n o
f th
e co
nta
ct p
erso
n
of
the
sup
ply
ing
co
mp
any
number of respondents counted 638 489 560 417
The service provider shows stability in his
communication and doing. 88.1% 90.39% 89.82% 91.13%
The service provider accommodates and shows
readiness to act if necessary. 85.6% 87.53% 87.86% 88.25%
The service provider offers correct information and
possibly ways to double-check this information. 84.5% 86.71% 86.79% 87.05%
The service provider offers openness and transparency
(e.g. in difficult situations: The service provider does
not wait to forward delicate issues until the public
pressure forces him to. The service provider does not
whitewash difficulties). 82.3% 85.48% 85.00% 85.37%
The service provider has a positive reputation on the
market. 77.9% 86.71% 80.36% 85.61%
The service provider ensures a regular direct contact
between customer and supplier 73.5% 77.10% 76.25% 77.70%
The service provider has experienced sales personnel. 71.2% 76.07% 75.00% 75.06%
The service provider offers a serious complaint
management. 69.7% 74.03% 73.21% 76.74%
Recommendations of other customers are available
regarding the service provider. 61.6% 68.51% 65.00% 70.26%
The service provider offers ways to preview the goods
and services he sells (e.g. through conferences,
customer events, open days, samples). 56.0% 61.76% 57.32% 62.35%
The service provider is able to present independent
certification (such as quality certifications) 53.8% 61.96% 56.61% 63.55%
Information about supplier can be obtained through
independent media. 46.7% 52.76% 49.46% 54.44%
The service provider shows public interest, supports
charity and shows social responsibility. 44.5% 49.28% 47.32% 52.76%
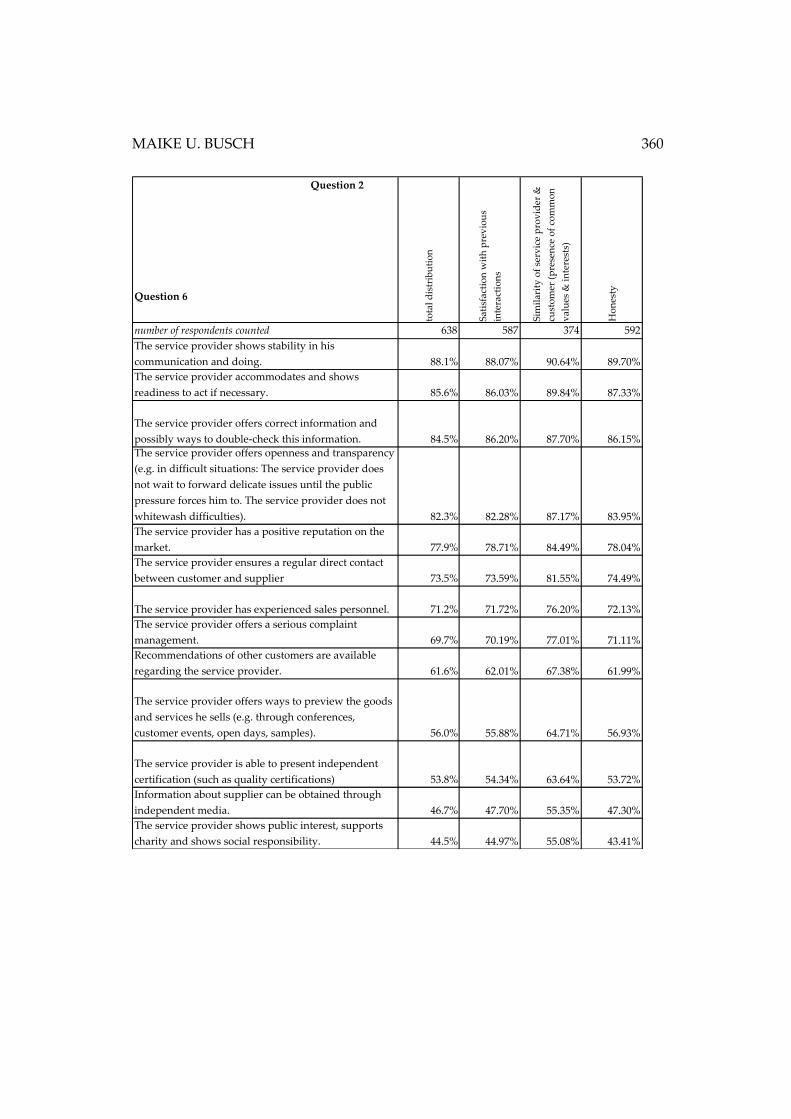
MAIKE U. BUSCH 360
Question 2
Question 6
tota
l d
istr
ibu
tio
n
Sat
isfa
ctio
n w
ith
pre
vio
us
inte
ract
ion
s
Sim
ilar
ity
of
serv
ice
pro
vid
er &
cust
om
er (
pre
sen
ce o
f co
mm
on
val
ues
& i
nte
rest
s)
Ho
nes
ty
number of respondents counted 638 587 374 592
The service provider shows stability in his
communication and doing. 88.1% 88.07% 90.64% 89.70%
The service provider accommodates and shows
readiness to act if necessary. 85.6% 86.03% 89.84% 87.33%
The service provider offers correct information and
possibly ways to double-check this information. 84.5% 86.20% 87.70% 86.15%
The service provider offers openness and transparency
(e.g. in difficult situations: The service provider does
not wait to forward delicate issues until the public
pressure forces him to. The service provider does not
whitewash difficulties). 82.3% 82.28% 87.17% 83.95%
The service provider has a positive reputation on the
market. 77.9% 78.71% 84.49% 78.04%
The service provider ensures a regular direct contact
between customer and supplier 73.5% 73.59% 81.55% 74.49%
The service provider has experienced sales personnel. 71.2% 71.72% 76.20% 72.13%
The service provider offers a serious complaint
management. 69.7% 70.19% 77.01% 71.11%
Recommendations of other customers are available
regarding the service provider. 61.6% 62.01% 67.38% 61.99%
The service provider offers ways to preview the goods
and services he sells (e.g. through conferences,
customer events, open days, samples). 56.0% 55.88% 64.71% 56.93%
The service provider is able to present independent
certification (such as quality certifications) 53.8% 54.34% 63.64% 53.72%
Information about supplier can be obtained through
independent media. 46.7% 47.70% 55.35% 47.30%
The service provider shows public interest, supports
charity and shows social responsibility. 44.5% 44.97% 55.08% 43.41%
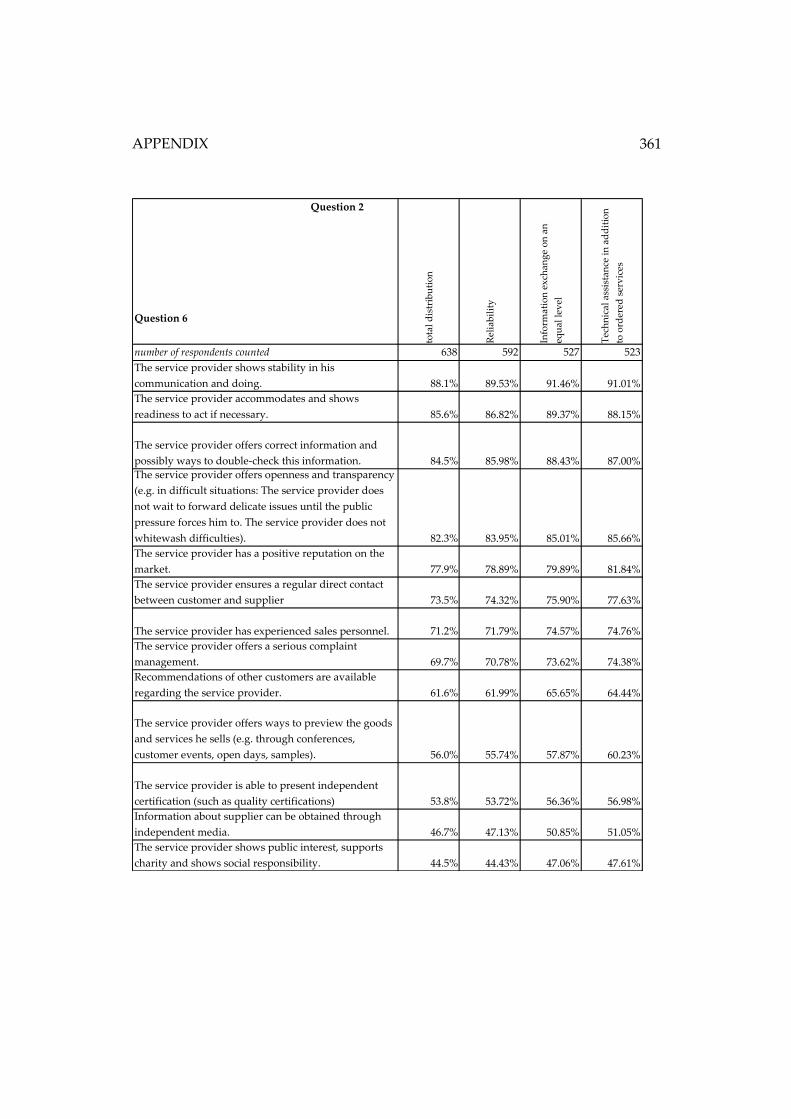
APPENDIX
361
Question 2
Question 6
tota
l d
istr
ibu
tio
n
Rel
iab
ilit
y
Info
rmat
ion
ex
chan
ge
on
an
equ
al l
evel
Tec
hn
ical
ass
ista
nce
in
ad
dit
ion
to o
rder
ed s
erv
ices
number of respondents counted 638 592 527 523
The service provider shows stability in his
communication and doing. 88.1% 89.53% 91.46% 91.01%
The service provider accommodates and shows
readiness to act if necessary. 85.6% 86.82% 89.37% 88.15%
The service provider offers correct information and
possibly ways to double-check this information. 84.5% 85.98% 88.43% 87.00%
The service provider offers openness and transparency
(e.g. in difficult situations: The service provider does
not wait to forward delicate issues until the public
pressure forces him to. The service provider does not
whitewash difficulties). 82.3% 83.95% 85.01% 85.66%
The service provider has a positive reputation on the
market. 77.9% 78.89% 79.89% 81.84%
The service provider ensures a regular direct contact
between customer and supplier 73.5% 74.32% 75.90% 77.63%
The service provider has experienced sales personnel. 71.2% 71.79% 74.57% 74.76%
The service provider offers a serious complaint
management. 69.7% 70.78% 73.62% 74.38%
Recommendations of other customers are available
regarding the service provider. 61.6% 61.99% 65.65% 64.44%
The service provider offers ways to preview the goods
and services he sells (e.g. through conferences,
customer events, open days, samples). 56.0% 55.74% 57.87% 60.23%
The service provider is able to present independent
certification (such as quality certifications) 53.8% 53.72% 56.36% 56.98%
Information about supplier can be obtained through
independent media. 46.7% 47.13% 50.85% 51.05%
The service provider shows public interest, supports
charity and shows social responsibility. 44.5% 44.43% 47.06% 47.61%
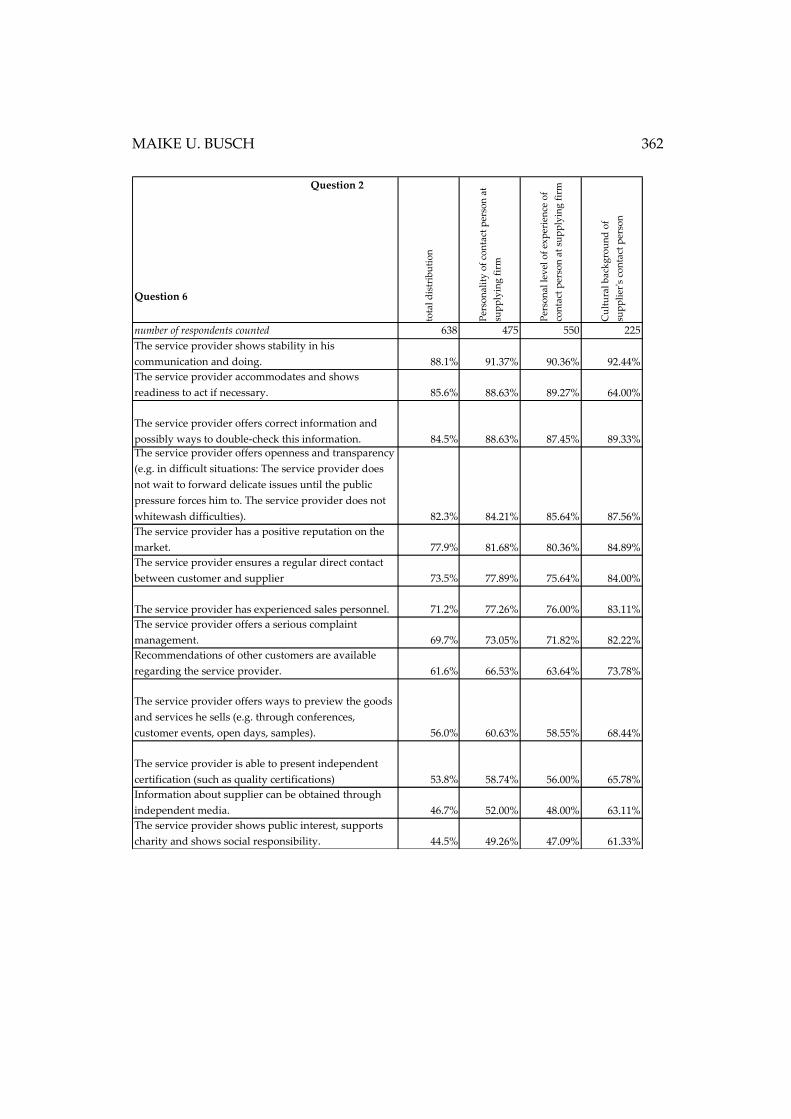
MAIKE U. BUSCH 362
Question 2
Question 6
tota
l d
istr
ibu
tio
n
Per
son
alit
y o
f co
nta
ct p
erso
n a
t
sup
ply
ing
fir
m
Per
son
al l
evel
of
exp
erie
nce
of
con
tact
per
son
at
sup
ply
ing
fir
m
Cu
ltu
ral
bac
kg
rou
nd
of
sup
pli
er's
co
nta
ct p
erso
n
number of respondents counted 638 475 550 225
The service provider shows stability in his
communication and doing. 88.1% 91.37% 90.36% 92.44%
The service provider accommodates and shows
readiness to act if necessary. 85.6% 88.63% 89.27% 64.00%
The service provider offers correct information and
possibly ways to double-check this information. 84.5% 88.63% 87.45% 89.33%
The service provider offers openness and transparency
(e.g. in difficult situations: The service provider does
not wait to forward delicate issues until the public
pressure forces him to. The service provider does not
whitewash difficulties). 82.3% 84.21% 85.64% 87.56%
The service provider has a positive reputation on the
market. 77.9% 81.68% 80.36% 84.89%
The service provider ensures a regular direct contact
between customer and supplier 73.5% 77.89% 75.64% 84.00%
The service provider has experienced sales personnel. 71.2% 77.26% 76.00% 83.11%
The service provider offers a serious complaint
management. 69.7% 73.05% 71.82% 82.22%
Recommendations of other customers are available
regarding the service provider. 61.6% 66.53% 63.64% 73.78%
The service provider offers ways to preview the goods
and services he sells (e.g. through conferences,
customer events, open days, samples). 56.0% 60.63% 58.55% 68.44%
The service provider is able to present independent
certification (such as quality certifications) 53.8% 58.74% 56.00% 65.78%
Information about supplier can be obtained through
independent media. 46.7% 52.00% 48.00% 63.11%
The service provider shows public interest, supports
charity and shows social responsibility. 44.5% 49.26% 47.09% 61.33%
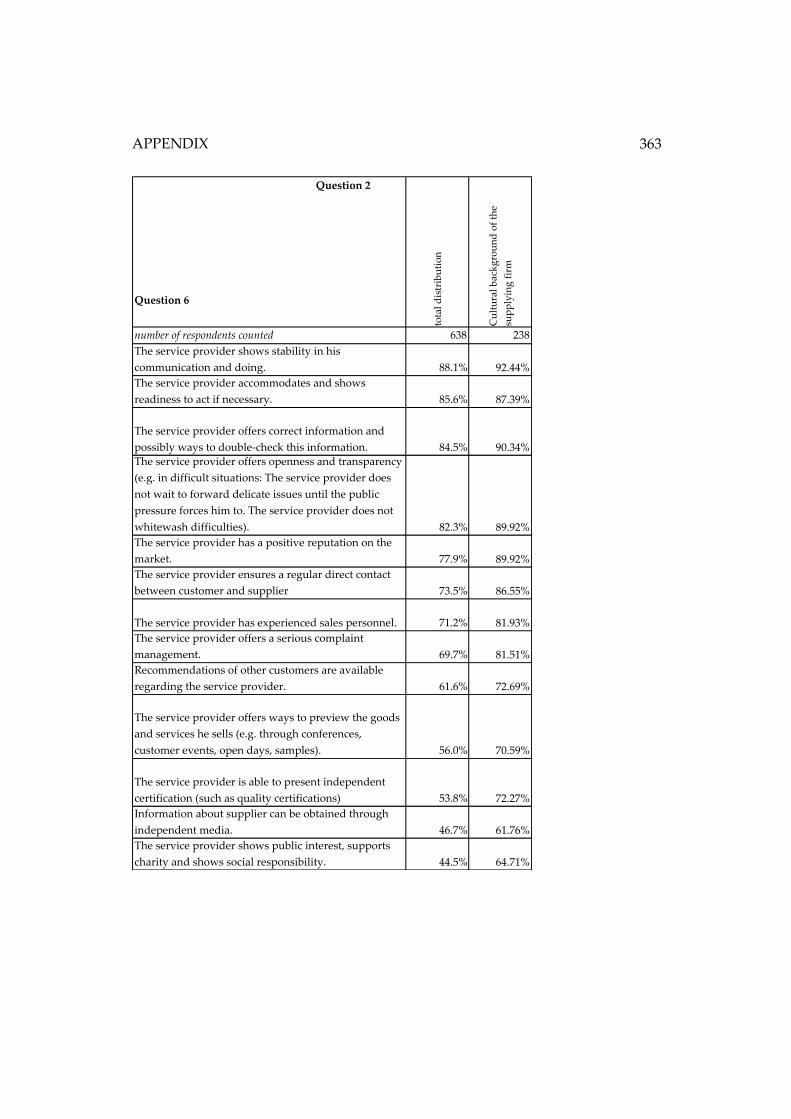
APPENDIX
363
Question 2
Question 6
tota
l d
istr
ibu
tio
n
Cu
ltu
ral
ba
ckg
rou
nd
of
the
sup
ply
ing
fir
m
number of respondents counted 638 238
The service provider shows stability in his
communication and doing. 88.1% 92.44%
The service provider accommodates and shows
readiness to act if necessary. 85.6% 87.39%
The service provider offers correct information and
possibly ways to double-check this information. 84.5% 90.34%
The service provider offers openness and transparency
(e.g. in difficult situations: The service provider does
not wait to forward delicate issues until the public
pressure forces him to. The service provider does not
whitewash difficulties). 82.3% 89.92%
The service provider has a positive reputation on the
market. 77.9% 89.92%
The service provider ensures a regular direct contact
between customer and supplier 73.5% 86.55%
The service provider has experienced sales personnel. 71.2% 81.93%
The service provider offers a serious complaint
management. 69.7% 81.51%
Recommendations of other customers are available
regarding the service provider. 61.6% 72.69%
The service provider offers ways to preview the goods
and services he sells (e.g. through conferences,
customer events, open days, samples). 56.0% 70.59%
The service provider is able to present independent
certification (such as quality certifications) 53.8% 72.27%
Information about supplier can be obtained through
independent media. 46.7% 61.76%
The service provider shows public interest, supports
charity and shows social responsibility. 44.5% 64.71%
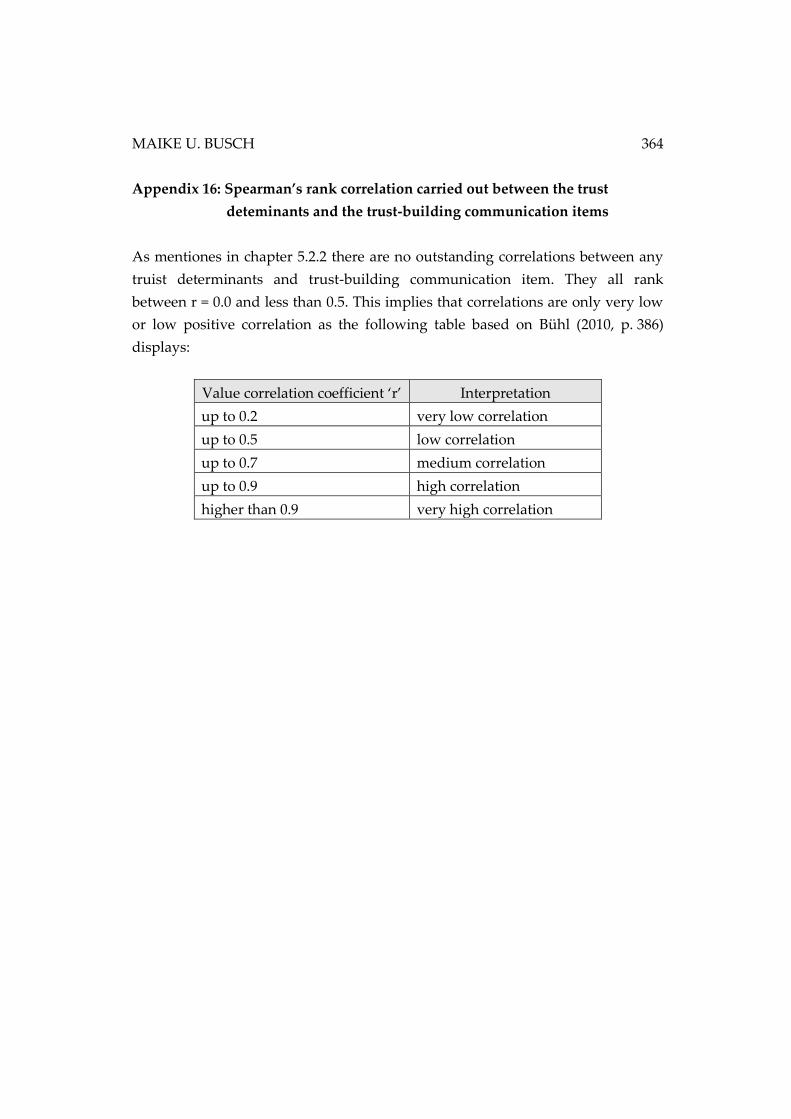
MAIKE U. BUSCH 364
Appendix 16: Spearman’s rank correlation carried out between the trust
deteminants and the trust-building communication items
As mentiones in chapter 5.2.2 there are no outstanding correlations between any
truist determinants and trust-building communication item. They all rank
between r = 0.0 and less than 0.5. This implies that correlations are only very low
or low positive correlation as the following table based on Bühl (2010, p. 386)
displays:
Value correlation coefficient ‘r’ Interpretation
up to 0.2 very low correlation
up to 0.5 low correlation
up to 0.7 medium correlation
up to 0.9 high correlation
higher than 0.9 very high correlation
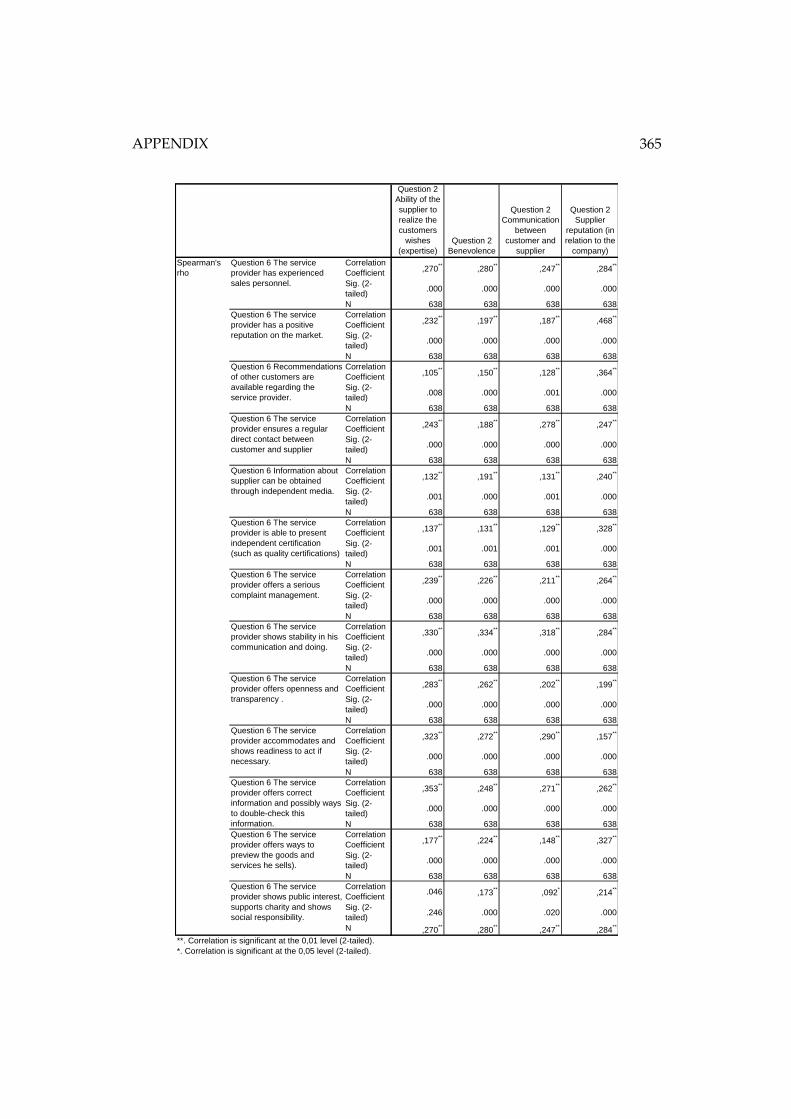
APPENDIX
365
Question 2
Ability of the
supplier to
realize the
customers
wishes
(expertise)
Question 2
Benevolence
Question 2
Communication
between
customer and
supplier
Question 2
Supplier
reputation (in
relation to the
company)
Correlation
Coefficient ,270
**,280
**,247
**,284
**
Sig. (2-
tailed).000 .000 .000 .000
N 638 638 638 638
Correlation
Coefficient ,232
**,197
**,187
**,468
**
Sig. (2-
tailed).000 .000 .000 .000
N 638 638 638 638
Correlation
Coefficient ,105
**,150
**,128
**,364
**
Sig. (2-
tailed).008 .000 .001 .000
N 638 638 638 638
Correlation
Coefficient ,243
**,188
**,278
**,247
**
Sig. (2-
tailed).000 .000 .000 .000
N 638 638 638 638
Correlation
Coefficient ,132
**,191
**,131
**,240
**
Sig. (2-
tailed).001 .000 .001 .000
N 638 638 638 638
Correlation
Coefficient ,137
**,131
**,129
**,328
**
Sig. (2-
tailed).001 .001 .001 .000
N 638 638 638 638
Correlation
Coefficient ,239
**,226
**,211
**,264
**
Sig. (2-
tailed).000 .000 .000 .000
N 638 638 638 638
Correlation
Coefficient ,330
**,334
**,318
**,284
**
Sig. (2-
tailed).000 .000 .000 .000
N 638 638 638 638
Correlation
Coefficient ,283
**,262
**,202
**,199
**
Sig. (2-
tailed).000 .000 .000 .000
N 638 638 638 638
Correlation
Coefficient ,323
**,272
**,290
**,157
**
Sig. (2-
tailed).000 .000 .000 .000
N 638 638 638 638
Correlation
Coefficient ,353
**,248
**,271
**,262
**
Sig. (2-
tailed).000 .000 .000 .000
N 638 638 638 638
Correlation
Coefficient ,177
**,224
**,148
**,327
**
Sig. (2-
tailed).000 .000 .000 .000
N 638 638 638 638
Correlation
Coefficient .046 ,173
**,092
*,214
**
Sig. (2-
tailed).246 .000 .020 .000
N ,270**
,280**
,247**
,284**
**. Correlation is significant at the 0,01 level (2-tailed).
*. Correlation is significant at the 0,05 level (2-tailed).
Spearman's
rho
Question 6 The service
provider has experienced
sales personnel.
Question 6 The service
provider has a positive
reputation on the market.
Question 6 Recommendations
of other customers are
available regarding the
service provider.
Question 6 The service
provider ensures a regular
direct contact between
customer and supplier
Question 6 Information about
supplier can be obtained
through independent media.
Question 6 The service
provider is able to present
independent certification
(such as quality certifications)
Question 6 The service
provider offers a serious
complaint management.
Question 6 The service
provider shows stability in his
communication and doing.
Question 6 The service
provider offers openness and
transparency .
Question 6 The service
provider accommodates and
shows readiness to act if
necessary.
Question 6 The service
provider offers correct
information and possibly ways
to double-check this
information.
Question 6 The service
provider offers ways to
preview the goods and
services he sells).
Question 6 The service
provider shows public interest,
supports charity and shows
social responsibility.
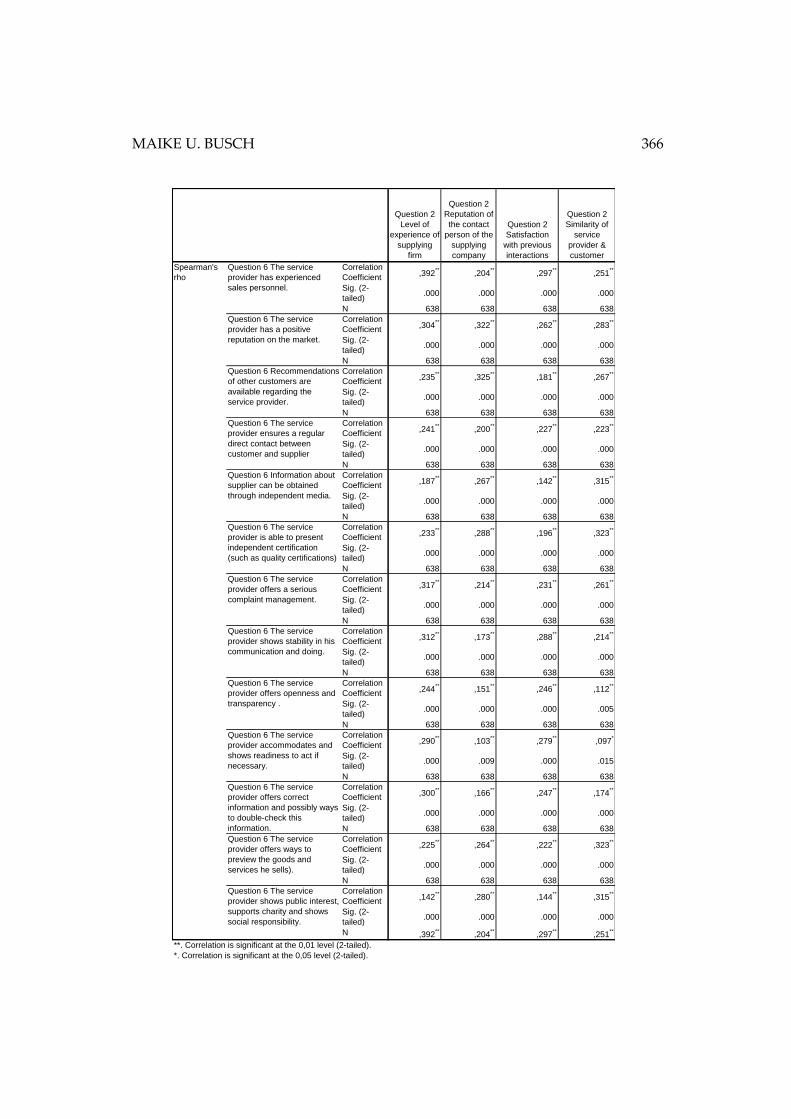
MAIKE U. BUSCH 366
Question 2
Level of
experience of
supplying
firm
Question 2
Reputation of
the contact
person of the
supplying
company
Question 2
Satisfaction
with previous
interactions
Question 2
Similarity of
service
provider &
customer
Correlation
Coefficient ,392
**,204
**,297
**,251
**
Sig. (2-
tailed).000 .000 .000 .000
N 638 638 638 638
Correlation
Coefficient ,304
**,322
**,262
**,283
**
Sig. (2-
tailed).000 .000 .000 .000
N 638 638 638 638
Correlation
Coefficient ,235
**,325
**,181
**,267
**
Sig. (2-
tailed).000 .000 .000 .000
N 638 638 638 638
Correlation
Coefficient ,241
**,200
**,227
**,223
**
Sig. (2-
tailed).000 .000 .000 .000
N 638 638 638 638
Correlation
Coefficient ,187
**,267
**,142
**,315
**
Sig. (2-
tailed).000 .000 .000 .000
N 638 638 638 638
Correlation
Coefficient ,233
**,288
**,196
**,323
**
Sig. (2-
tailed).000 .000 .000 .000
N 638 638 638 638
Correlation
Coefficient ,317
**,214
**,231
**,261
**
Sig. (2-
tailed).000 .000 .000 .000
N 638 638 638 638
Correlation
Coefficient ,312
**,173
**,288
**,214
**
Sig. (2-
tailed).000 .000 .000 .000
N 638 638 638 638
Correlation
Coefficient ,244
**,151
**,246
**,112
**
Sig. (2-
tailed).000 .000 .000 .005
N 638 638 638 638
Correlation
Coefficient ,290
**,103
**,279
**,097
*
Sig. (2-
tailed).000 .009 .000 .015
N 638 638 638 638
Correlation
Coefficient ,300
**,166
**,247
**,174
**
Sig. (2-
tailed).000 .000 .000 .000
N 638 638 638 638
Correlation
Coefficient ,225
**,264
**,222
**,323
**
Sig. (2-
tailed).000 .000 .000 .000
N 638 638 638 638
Correlation
Coefficient ,142
**,280
**,144
**,315
**
Sig. (2-
tailed).000 .000 .000 .000
N ,392**
,204**
,297**
,251**
**. Correlation is significant at the 0,01 level (2-tailed).
*. Correlation is significant at the 0,05 level (2-tailed).
Question 6 The service
provider accommodates and
shows readiness to act if
necessary.
Question 6 The service
provider offers correct
information and possibly ways
to double-check this
information.
Question 6 The service
provider offers ways to
preview the goods and
services he sells).
Question 6 The service
provider shows public interest,
supports charity and shows
social responsibility.
Spearman's
rho
Question 6 The service
provider has experienced
sales personnel.
Question 6 The service
provider has a positive
reputation on the market.
Question 6 Recommendations
of other customers are
available regarding the
service provider.
Question 6 The service
provider ensures a regular
direct contact between
customer and supplier
Question 6 Information about
supplier can be obtained
through independent media.
Question 6 The service
provider is able to present
independent certification
(such as quality certifications)
Question 6 The service
provider offers a serious
complaint management.
Question 6 The service
provider shows stability in his
communication and doing.
Question 6 The service
provider offers openness and
transparency .
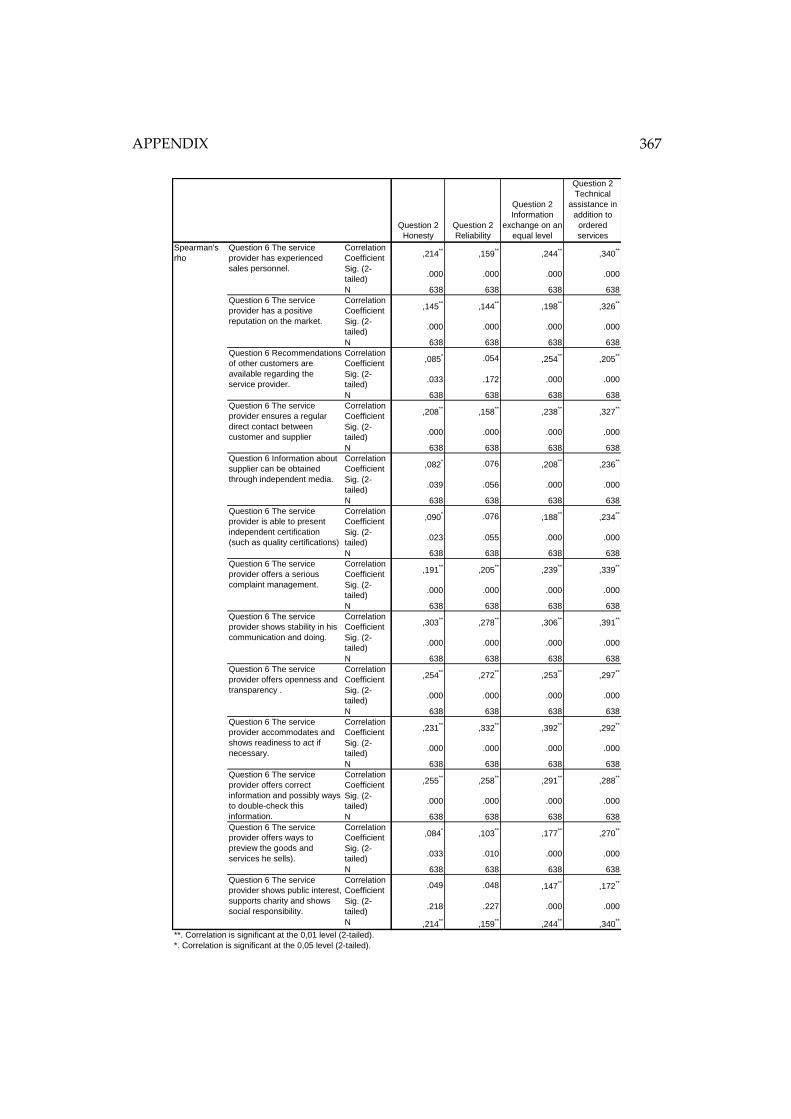
APPENDIX
367
Question 2
Honesty
Question 2
Reliability
Question 2
Information
exchange on an
equal level
Question 2
Technical
assistance in
addition to
ordered
services
Correlation
Coefficient ,214
**,159
**,244
**,340
**
Sig. (2-
tailed).000 .000 .000 .000
N 638 638 638 638
Correlation
Coefficient ,145
**,144
**,198
**,326
**
Sig. (2-
tailed).000 .000 .000 .000
N 638 638 638 638
Correlation
Coefficient ,085
* .054 ,254**
,205**
Sig. (2-
tailed).033 .172 .000 .000
N 638 638 638 638
Correlation
Coefficient ,208
**,158
**,238
**,327
**
Sig. (2-
tailed).000 .000 .000 .000
N 638 638 638 638
Correlation
Coefficient ,082
* .076 ,208**
,236**
Sig. (2-
tailed).039 .056 .000 .000
N 638 638 638 638
Correlation
Coefficient ,090
* .076 ,188**
,234**
Sig. (2-
tailed).023 .055 .000 .000
N 638 638 638 638
Correlation
Coefficient ,191
**,205
**,239
**,339
**
Sig. (2-
tailed).000 .000 .000 .000
N 638 638 638 638
Correlation
Coefficient ,303
**,278
**,306
**,391
**
Sig. (2-
tailed).000 .000 .000 .000
N 638 638 638 638
Correlation
Coefficient ,254
**,272
**,253
**,297
**
Sig. (2-
tailed).000 .000 .000 .000
N 638 638 638 638
Correlation
Coefficient ,231
**,332
**,392
**,292
**
Sig. (2-
tailed).000 .000 .000 .000
N 638 638 638 638
Correlation
Coefficient ,255
**,258
**,291
**,288
**
Sig. (2-
tailed).000 .000 .000 .000
N 638 638 638 638
Correlation
Coefficient ,084
*,103
**,177
**,270
**
Sig. (2-
tailed).033 .010 .000 .000
N 638 638 638 638
Correlation
Coefficient .049 .048 ,147
**,172
**
Sig. (2-
tailed).218 .227 .000 .000
N ,214**
,159**
,244**
,340**
**. Correlation is significant at the 0,01 level (2-tailed).
*. Correlation is significant at the 0,05 level (2-tailed).
Question 6 The service
provider shows public interest,
supports charity and shows
social responsibility.
Question 6 The service
provider offers openness and
transparency .
Question 6 The service
provider accommodates and
shows readiness to act if
necessary.
Question 6 The service
provider offers correct
information and possibly ways
to double-check this
information.
Question 6 The service
provider offers ways to
preview the goods and
services he sells).
Spearman's
rho
Question 6 The service
provider has experienced
sales personnel.
Question 6 The service
provider has a positive
reputation on the market.
Question 6 Recommendations
of other customers are
available regarding the
service provider.
Question 6 The service
provider ensures a regular
direct contact between
customer and supplier
Question 6 Information about
supplier can be obtained
through independent media.
Question 6 The service
provider is able to present
independent certification
(such as quality certifications)
Question 6 The service
provider offers a serious
complaint management.
Question 6 The service
provider shows stability in his
communication and doing.
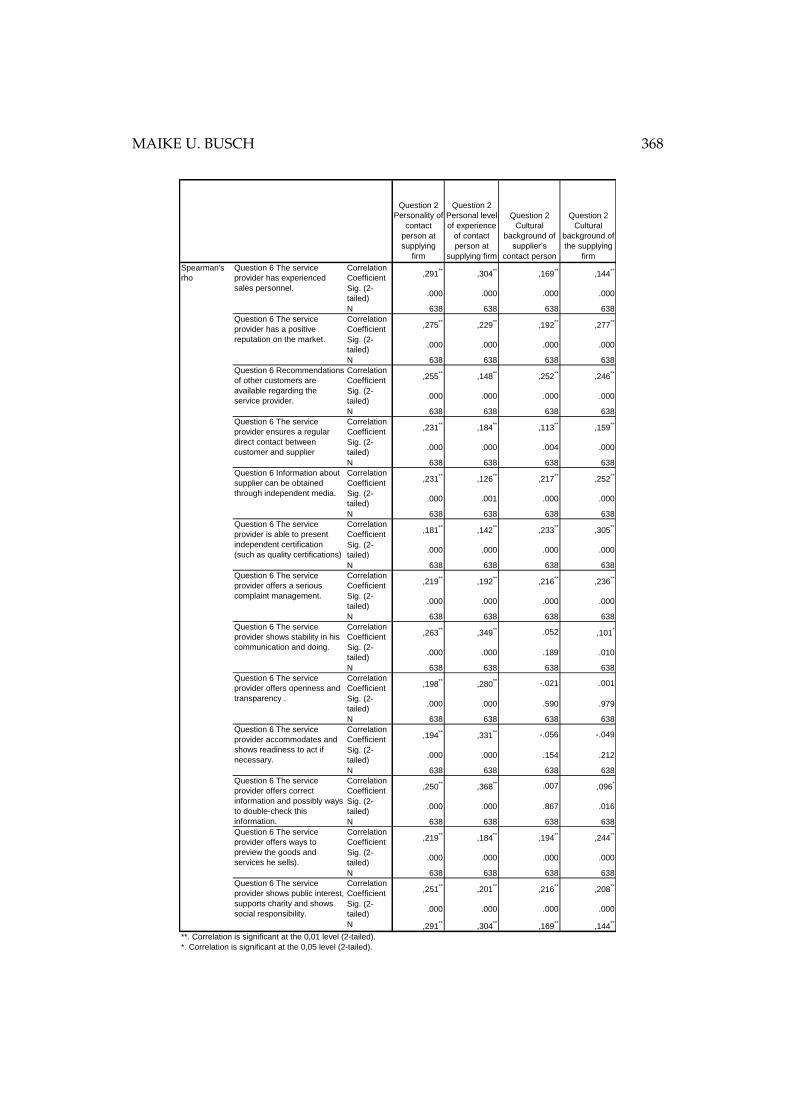
MAIKE U. BUSCH 368
Question 2
Personality of
contact
person at
supplying
firm
Question 2
Personal level
of experience
of contact
person at
supplying firm
Question 2
Cultural
background of
supplier’s
contact person
Question 2
Cultural
background of
the supplying
firm
Correlation
Coefficient ,291
**,304
**,169
**,144
**
Sig. (2-
tailed).000 .000 .000 .000
N 638 638 638 638
Correlation
Coefficient ,275
**,229
**,192
**,277
**
Sig. (2-
tailed).000 .000 .000 .000
N 638 638 638 638
Correlation
Coefficient ,255
**,148
**,252
**,246
**
Sig. (2-
tailed).000 .000 .000 .000
N 638 638 638 638
Correlation
Coefficient ,231
**,184
**,113
**,159
**
Sig. (2-
tailed).000 .000 .004 .000
N 638 638 638 638
Correlation
Coefficient ,231
**,126
**,217
**,252
**
Sig. (2-
tailed).000 .001 .000 .000
N 638 638 638 638
Correlation
Coefficient ,181
**,142
**,233
**,305
**
Sig. (2-
tailed).000 .000 .000 .000
N 638 638 638 638
Correlation
Coefficient ,219
**,192
**,216
**,236
**
Sig. (2-
tailed).000 .000 .000 .000
N 638 638 638 638
Correlation
Coefficient ,263
**,349
** .052 ,101*
Sig. (2-
tailed).000 .000 .189 .010
N 638 638 638 638
Correlation
Coefficient ,198
**,280
** -.021 .001
Sig. (2-
tailed).000 .000 .590 .979
N 638 638 638 638
Correlation
Coefficient ,194
**,331
** -.056 -.049
Sig. (2-
tailed).000 .000 .154 .212
N 638 638 638 638
Correlation
Coefficient ,250
**,368
** .007 ,096*
Sig. (2-
tailed).000 .000 .867 .016
N 638 638 638 638
Correlation
Coefficient ,219
**,184
**,194
**,244
**
Sig. (2-
tailed).000 .000 .000 .000
N 638 638 638 638
Correlation
Coefficient ,251
**,201
**,216
**,208
**
Sig. (2-
tailed).000 .000 .000 .000
N ,291**
,304**
,169**
,144**
*. Correlation is significant at the 0,05 level (2-tailed).
**. Correlation is significant at the 0,01 level (2-tailed).
Question 6 The service
provider offers ways to
preview the goods and
services he sells).
Question 6 The service
provider shows public interest,
supports charity and shows
social responsibility.
Question 6 The service
provider shows stability in his
communication and doing.
Question 6 The service
provider offers openness and
transparency .
Question 6 The service
provider accommodates and
shows readiness to act if
necessary.
Question 6 The service
provider offers correct
information and possibly ways
to double-check this
information.
Spearman's
rho
Question 6 The service
provider has experienced
sales personnel.
Question 6 The service
provider has a positive
reputation on the market.
Question 6 Recommendations
of other customers are
available regarding the
service provider.
Question 6 The service
provider ensures a regular
direct contact between
customer and supplier
Question 6 Information about
supplier can be obtained
through independent media.
Question 6 The service
provider is able to present
independent certification
(such as quality certifications)
Question 6 The service
provider offers a serious
complaint management.
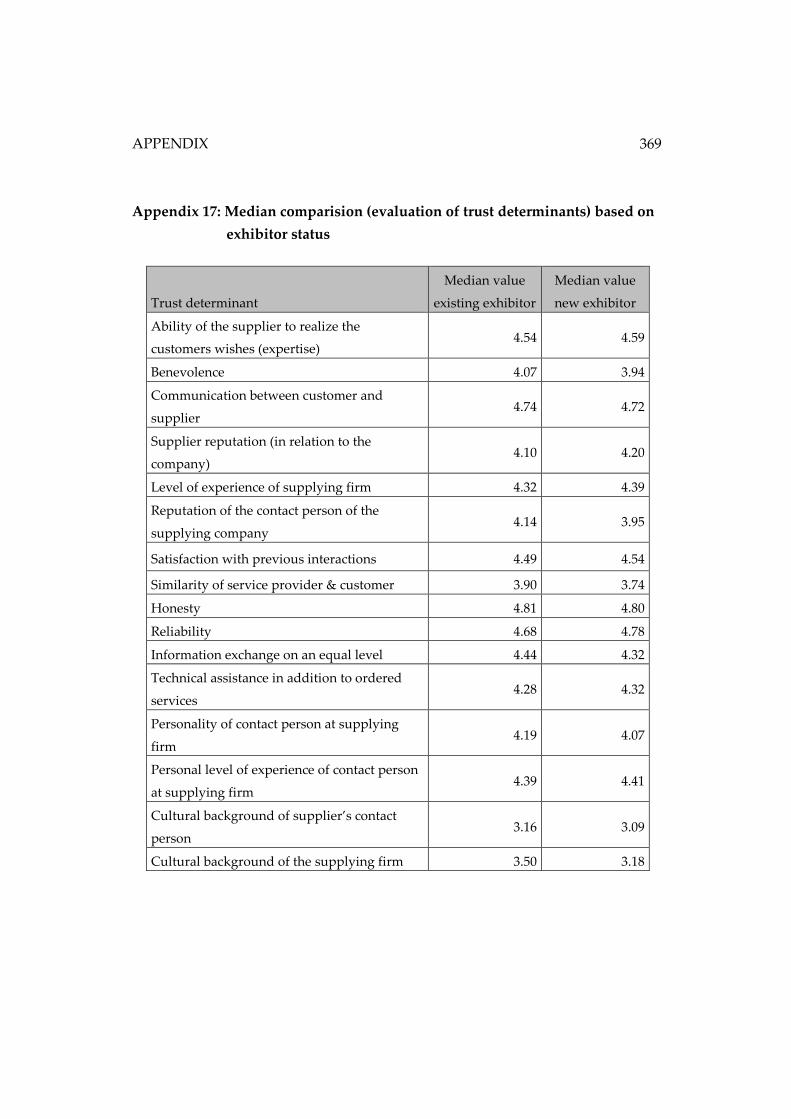
APPENDIX
369
Appendix 17: Median comparision (evaluation of trust determinants) based on
exhibitor status
Trust determinant
Median value
existing exhibitor
Median value
new exhibitor
Ability of the supplier to realize the
customers wishes (expertise) 4.54 4.59
Benevolence 4.07 3.94
Communication between customer and
supplier 4.74 4.72
Supplier reputation (in relation to the
company) 4.10 4.20
Level of experience of supplying firm 4.32 4.39
Reputation of the contact person of the
supplying company 4.14 3.95
Satisfaction with previous interactions 4.49 4.54
Similarity of service provider & customer 3.90 3.74
Honesty 4.81 4.80
Reliability 4.68 4.78
Information exchange on an equal level 4.44 4.32
Technical assistance in addition to ordered
services 4.28 4.32
Personality of contact person at supplying
firm 4.19 4.07
Personal level of experience of contact person
at supplying firm 4.39 4.41
Cultural background of supplier’s contact
person 3.16 3.09
Cultural background of the supplying firm 3.50 3.18
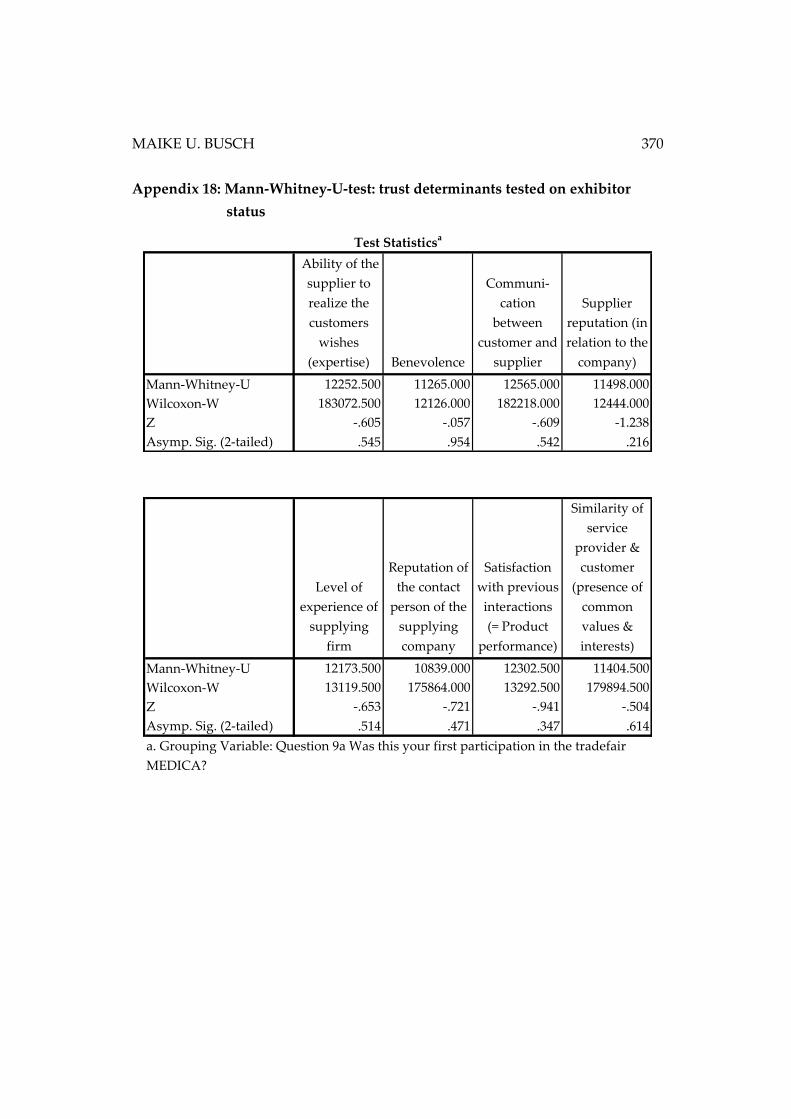
MAIKE U. BUSCH 370
Appendix 18: Mann-Whitney-U-test: trust determinants tested on exhibitor
status
Ability of the
supplier to
realize the
customers
wishes
(expertise) Benevolence
Communi-
cation
between
customer and
supplier
Supplier
reputation (in
relation to the
company)
Mann-Whitney-U 12252.500 11265.000 12565.000 11498.000
Wilcoxon-W 183072.500 12126.000 182218.000 12444.000
Z -.605 -.057 -.609 -1.238
Asymp. Sig. (2-tailed) .545 .954 .542 .216
Test Statisticsa
Level of
experience of
supplying
firm
Reputation of
the contact
person of the
supplying
company
Satisfaction
with previous
interactions
(= Product
performance)
Similarity of
service
provider &
customer
(presence of
common
values &
interests)
Mann-Whitney-U 12173.500 10839.000 12302.500 11404.500
Wilcoxon-W 13119.500 175864.000 13292.500 179894.500
Z -.653 -.721 -.941 -.504
Asymp. Sig. (2-tailed) .514 .471 .347 .614
a. Grouping Variable: Question 9a Was this your first participation in the tradefair
MEDICA?
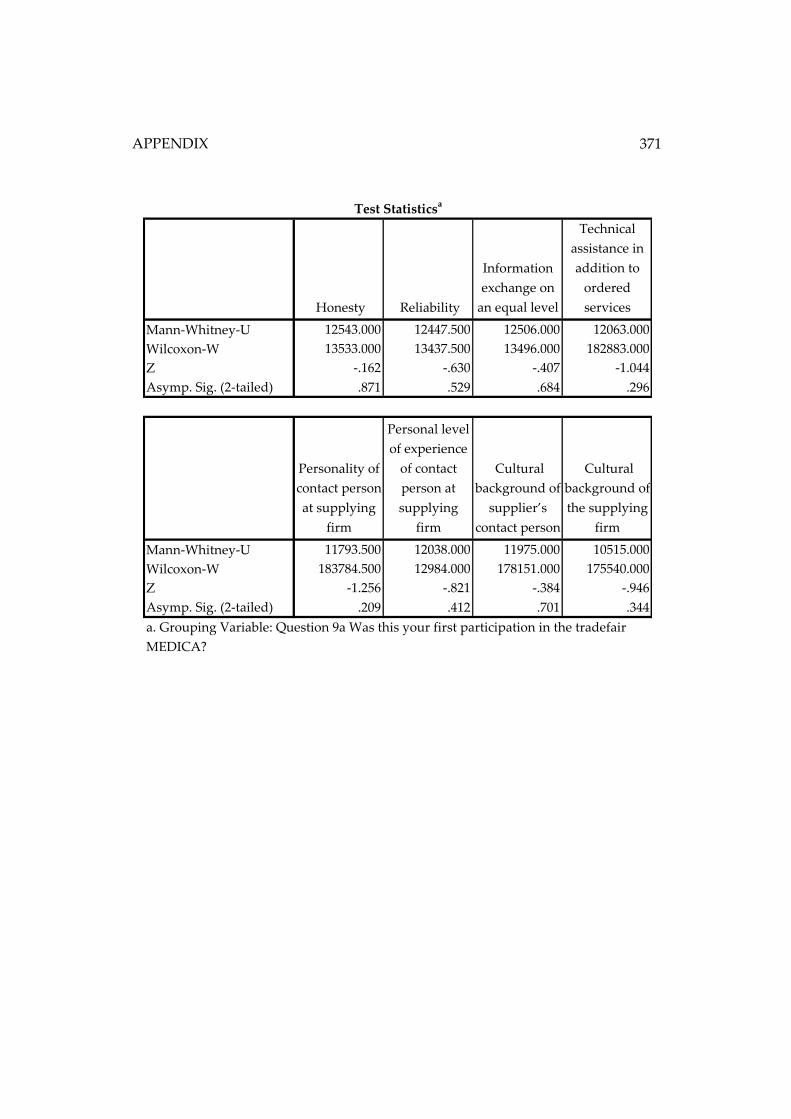
APPENDIX
371
Honesty Reliability
Information
exchange on
an equal level
Technical
assistance in
addition to
ordered
services
Mann-Whitney-U 12543.000 12447.500 12506.000 12063.000
Wilcoxon-W 13533.000 13437.500 13496.000 182883.000
Z -.162 -.630 -.407 -1.044
Asymp. Sig. (2-tailed) .871 .529 .684 .296
Personality of
contact person
at supplying
firm
Personal level
of experience
of contact
person at
supplying
firm
Cultural
background of
supplier’s
contact person
Cultural
background of
the supplying
firm
Mann-Whitney-U 11793.500 12038.000 11975.000 10515.000
Wilcoxon-W 183784.500 12984.000 178151.000 175540.000
Z -1.256 -.821 -.384 -.946
Asymp. Sig. (2-tailed) .209 .412 .701 .344
a. Grouping Variable: Question 9a Was this your first participation in the tradefair
MEDICA?
Test Statisticsa
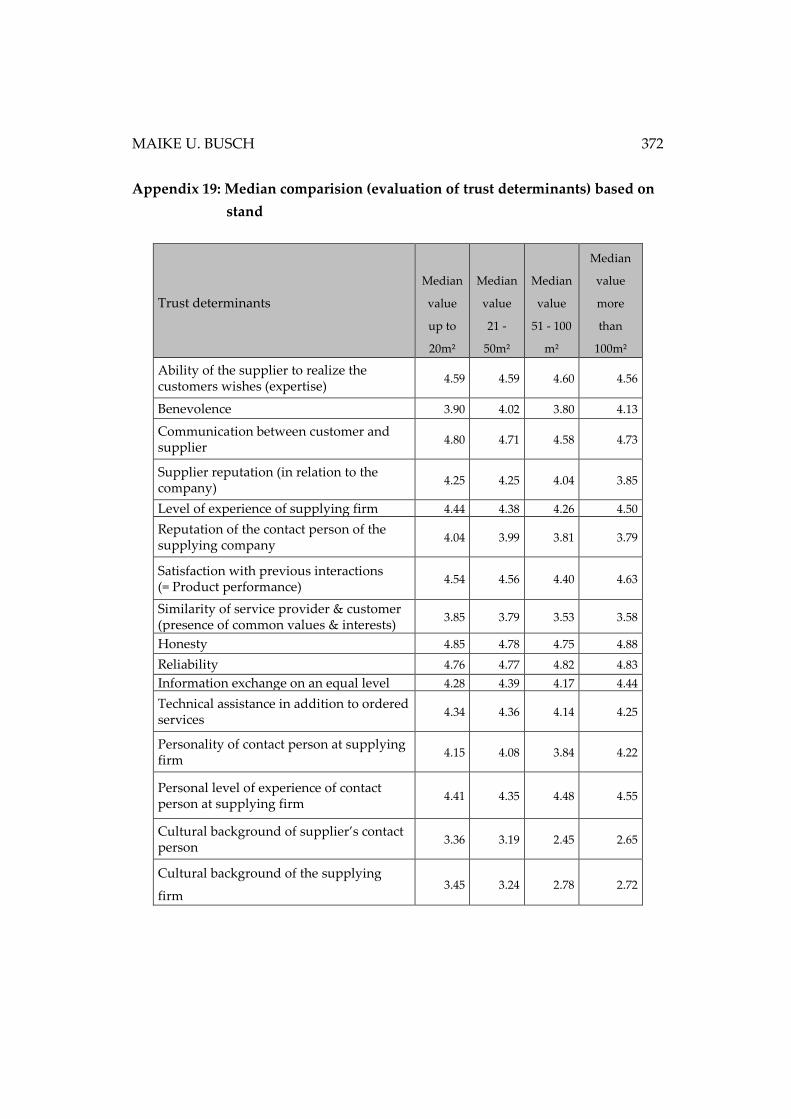
MAIKE U. BUSCH 372
Appendix 19: Median comparision (evaluation of trust determinants) based on
stand
Trust determinants
Median
value
up to
20m²
Median
value
21 -
50m²
Median
value
51 - 100
m²
Median
value
more
than
100m²
Ability of the supplier to realize the customers wishes (expertise)
4.59 4.59 4.60 4.56
Benevolence 3.90 4.02 3.80 4.13
Communication between customer and supplier
4.80 4.71 4.58 4.73
Supplier reputation (in relation to the company)
4.25 4.25 4.04 3.85
Level of experience of supplying firm 4.44 4.38 4.26 4.50
Reputation of the contact person of the supplying company
4.04 3.99 3.81 3.79
Satisfaction with previous interactions (= Product performance)
4.54 4.56 4.40 4.63
Similarity of service provider & customer (presence of common values & interests)
3.85 3.79 3.53 3.58
Honesty 4.85 4.78 4.75 4.88
Reliability 4.76 4.77 4.82 4.83
Information exchange on an equal level 4.28 4.39 4.17 4.44
Technical assistance in addition to ordered services
4.34 4.36 4.14 4.25
Personality of contact person at supplying firm
4.15 4.08 3.84 4.22
Personal level of experience of contact person at supplying firm
4.41 4.35 4.48 4.55
Cultural background of supplier’s contact person
3.36 3.19 2.45 2.65
Cultural background of the supplying
firm 3.45 3.24 2.78 2.72
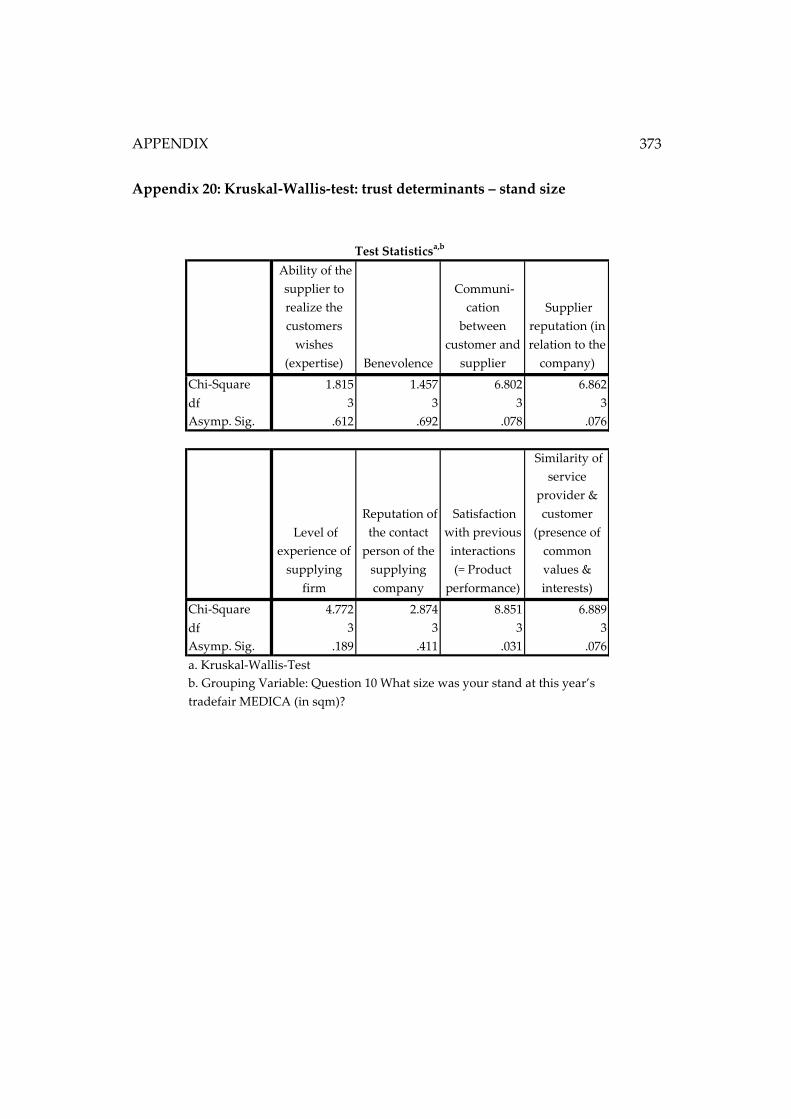
APPENDIX
373
Appendix 20: Kruskal-Wallis-test: trust determinants – stand size
Ability of the
supplier to
realize the
customers
wishes
(expertise) Benevolence
Communi-
cation
between
customer and
supplier
Supplier
reputation (in
relation to the
company)
Chi-Square 1.815 1.457 6.802 6.862
df 3 3 3 3
Asymp. Sig. .612 .692 .078 .076
Level of
experience of
supplying
firm
Reputation of
the contact
person of the
supplying
company
Satisfaction
with previous
interactions
(= Product
performance)
Similarity of
service
provider &
customer
(presence of
common
values &
interests)
Chi-Square 4.772 2.874 8.851 6.889
df 3 3 3 3
Asymp. Sig. .189 .411 .031 .076
Test Statisticsa,b
b. Grouping Variable: Question 10 What size was your stand at this year’s
tradefair MEDICA (in sqm)?
a. Kruskal-Wallis-Test
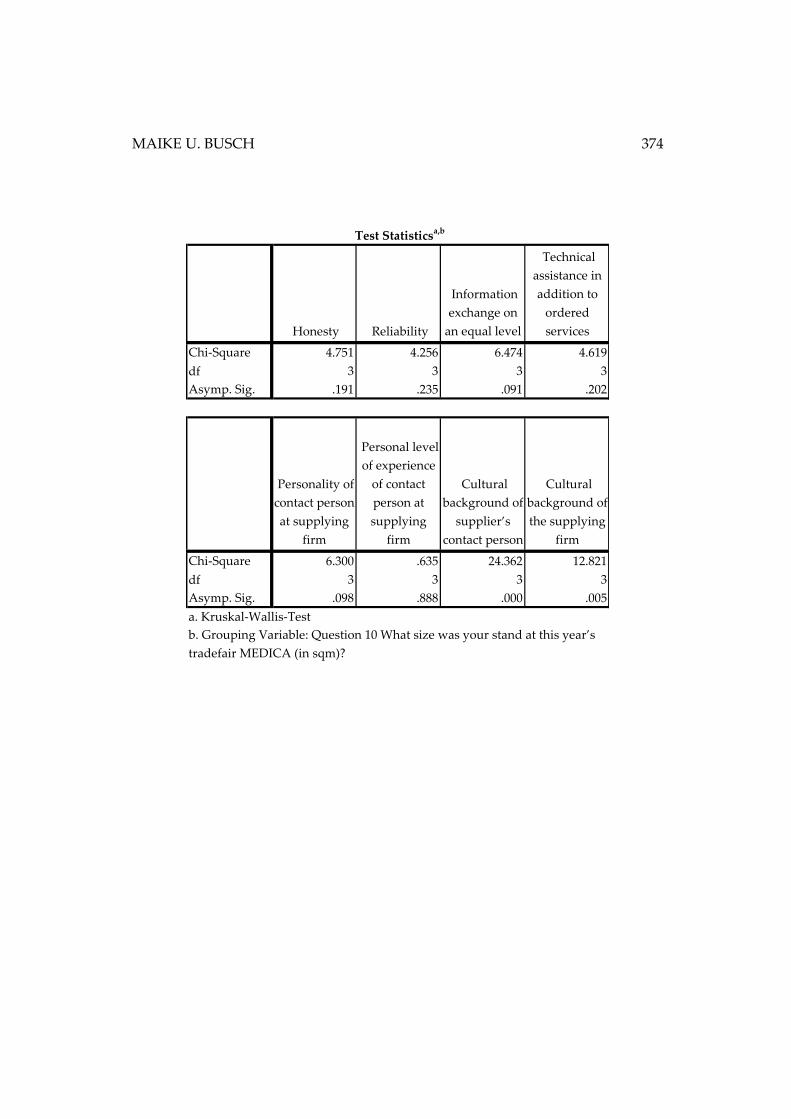
MAIKE U. BUSCH 374
Honesty Reliability
Information
exchange on
an equal level
Technical
assistance in
addition to
ordered
services
Chi-Square 4.751 4.256 6.474 4.619
df 3 3 3 3
Asymp. Sig. .191 .235 .091 .202
Personality of
contact person
at supplying
firm
Personal level
of experience
of contact
person at
supplying
firm
Cultural
background of
supplier’s
contact person
Cultural
background of
the supplying
firm
Chi-Square 6.300 .635 24.362 12.821
df 3 3 3 3
Asymp. Sig. .098 .888 .000 .005
Test Statisticsa,b
a. Kruskal-Wallis-Test
b. Grouping Variable: Question 10 What size was your stand at this year’s
tradefair MEDICA (in sqm)?
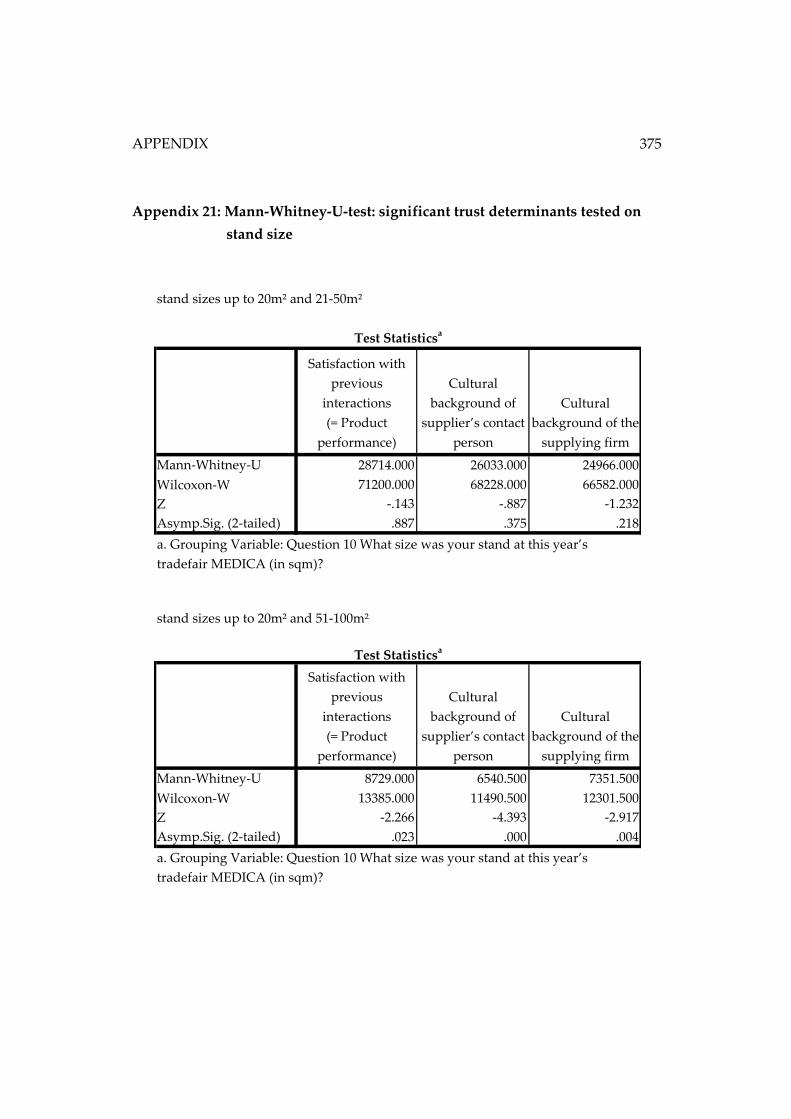
APPENDIX
375
Appendix 21: Mann-Whitney-U-test: significant trust determinants tested on
stand size
stand sizes up to 20m² and 21-50m²
Satisfaction with
previous
interactions
(= Product
performance)
Cultural
background of
supplier’s contact
person
Cultural
background of the
supplying firm
Mann-Whitney-U 28714.000 26033.000 24966.000
Wilcoxon-W 71200.000 68228.000 66582.000
Z -.143 -.887 -1.232
Asymp.Sig. (2-tailed) .887 .375 .218
stand sizes up to 20m² and 51-100m²
Satisfaction with
previous
interactions
(= Product
performance)
Cultural
background of
supplier’s contact
person
Cultural
background of the
supplying firm
Mann-Whitney-U 8729.000 6540.500 7351.500
Wilcoxon-W 13385.000 11490.500 12301.500
Z -2.266 -4.393 -2.917
Asymp.Sig. (2-tailed) .023 .000 .004
a. Grouping Variable: Question 10 What size was your stand at this year’s
tradefair MEDICA (in sqm)?
Test Statisticsa
a. Grouping Variable: Question 10 What size was your stand at this year’s
tradefair MEDICA (in sqm)?
Test Statisticsa
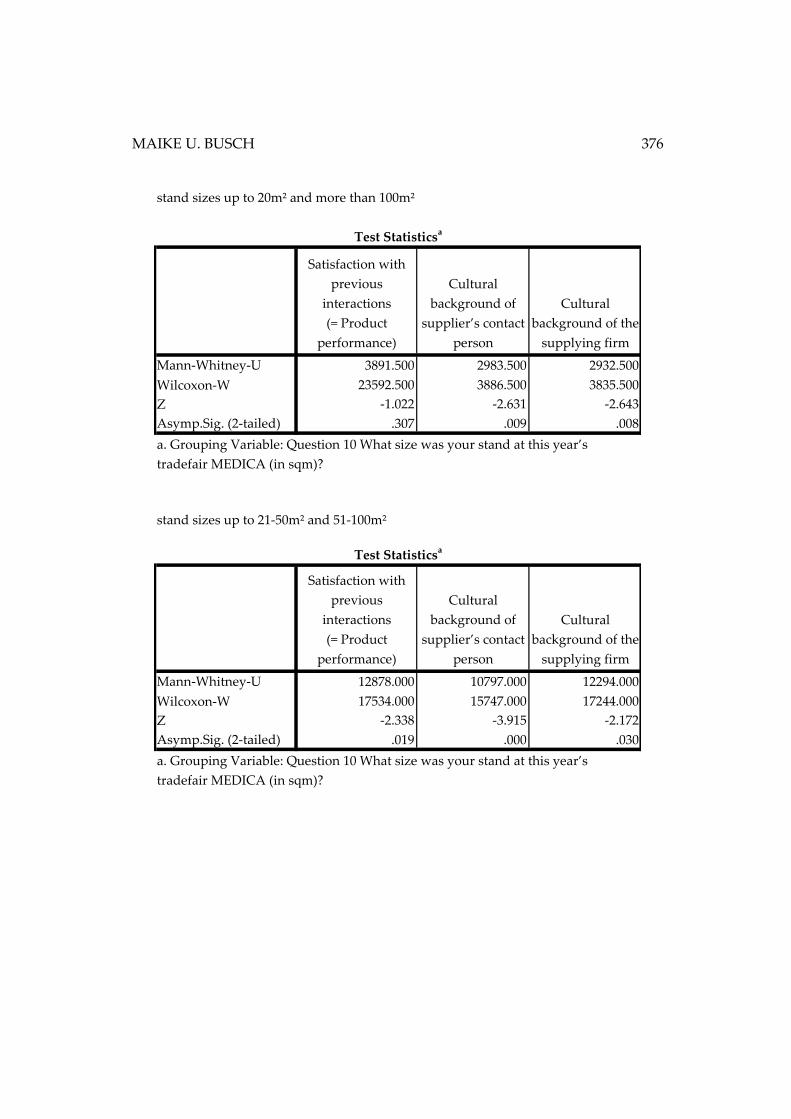
MAIKE U. BUSCH 376
stand sizes up to 20m² and more than 100m²
Satisfaction with
previous
interactions
(= Product
performance)
Cultural
background of
supplier’s contact
person
Cultural
background of the
supplying firm
Mann-Whitney-U 3891.500 2983.500 2932.500
Wilcoxon-W 23592.500 3886.500 3835.500
Z -1.022 -2.631 -2.643
Asymp.Sig. (2-tailed) .307 .009 .008
stand sizes up to 21-50m² and 51-100m²
Satisfaction with
previous
interactions
(= Product
performance)
Cultural
background of
supplier’s contact
person
Cultural
background of the
supplying firm
Mann-Whitney-U 12878.000 10797.000 12294.000
Wilcoxon-W 17534.000 15747.000 17244.000
Z -2.338 -3.915 -2.172
Asymp.Sig. (2-tailed) .019 .000 .030
a. Grouping Variable: Question 10 What size was your stand at this year’s
tradefair MEDICA (in sqm)?
Test Statisticsa
a. Grouping Variable: Question 10 What size was your stand at this year’s
tradefair MEDICA (in sqm)?
Test Statisticsa
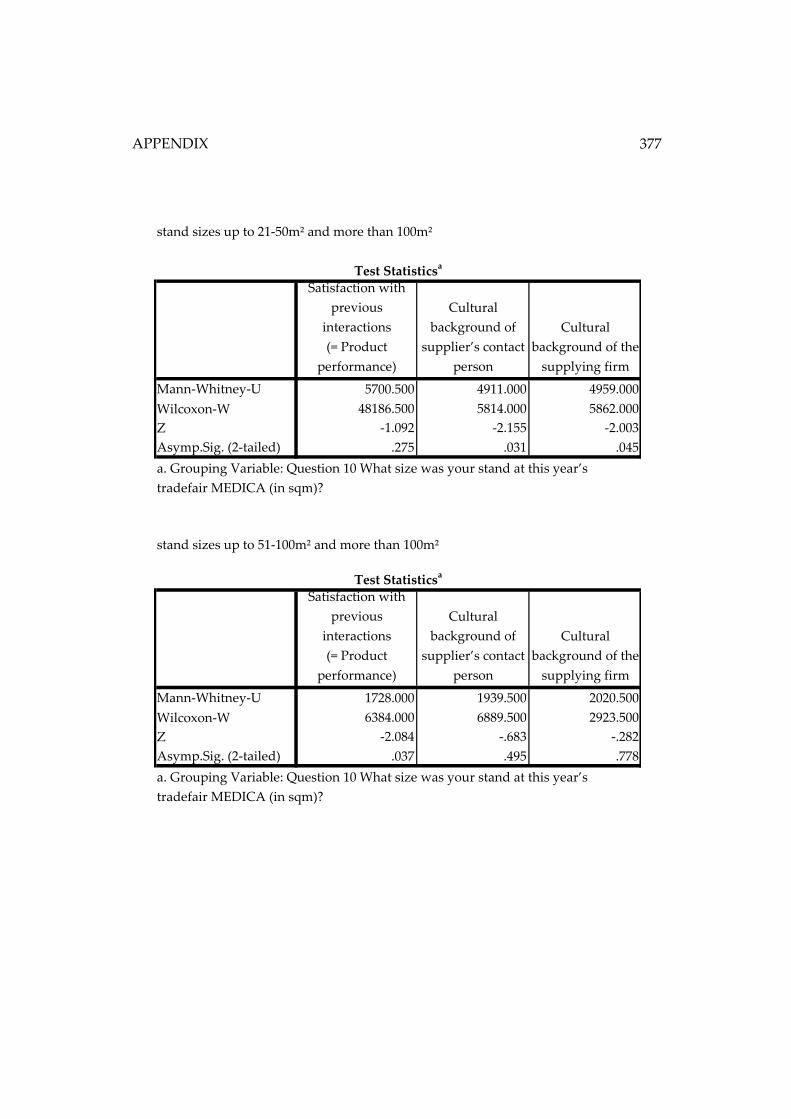
APPENDIX
377
stand sizes up to 21-50m² and more than 100m²
Satisfaction with
previous
interactions
(= Product
performance)
Cultural
background of
supplier’s contact
person
Cultural
background of the
supplying firm
Mann-Whitney-U 5700.500 4911.000 4959.000
Wilcoxon-W 48186.500 5814.000 5862.000
Z -1.092 -2.155 -2.003
Asymp.Sig. (2-tailed) .275 .031 .045
stand sizes up to 51-100m² and more than 100m²
Satisfaction with
previous
interactions
(= Product
performance)
Cultural
background of
supplier’s contact
person
Cultural
background of the
supplying firm
Mann-Whitney-U 1728.000 1939.500 2020.500
Wilcoxon-W 6384.000 6889.500 2923.500
Z -2.084 -.683 -.282
Asymp.Sig. (2-tailed) .037 .495 .778
a. Grouping Variable: Question 10 What size was your stand at this year’s
tradefair MEDICA (in sqm)?
Test Statisticsa
a. Grouping Variable: Question 10 What size was your stand at this year’s
tradefair MEDICA (in sqm)?
Test Statisticsa
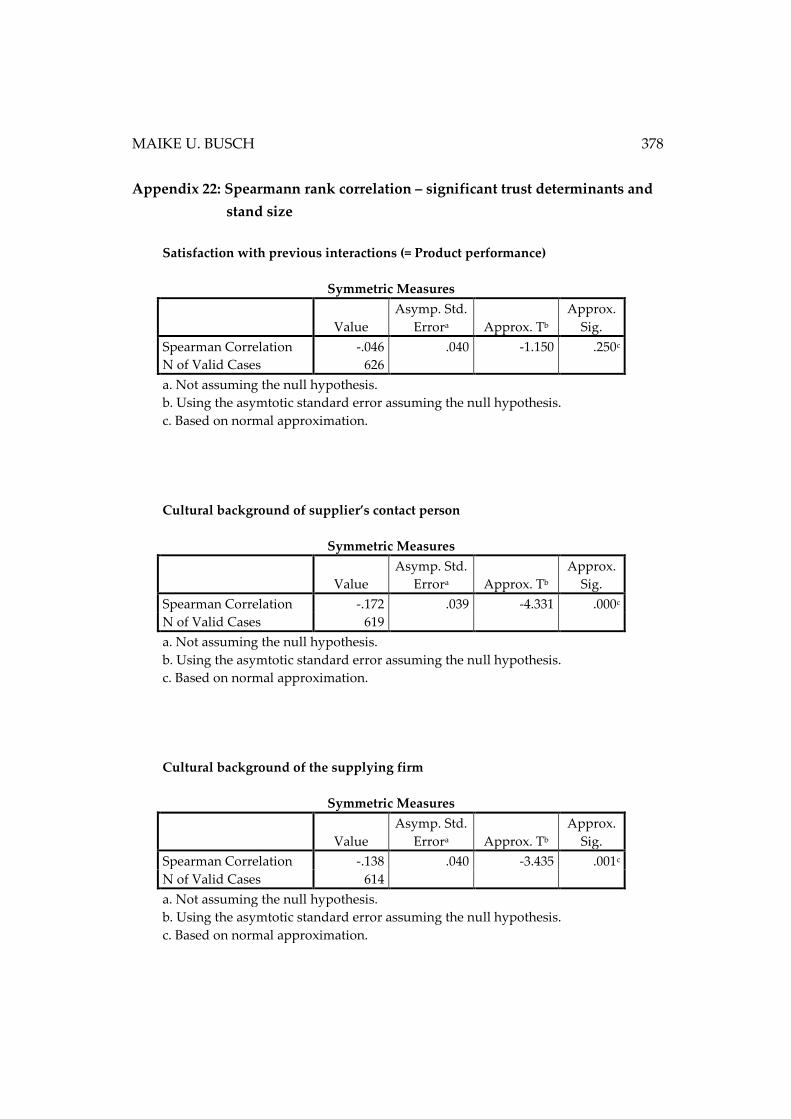
MAIKE U. BUSCH 378
Appendix 22: Spearmann rank correlation – significant trust determinants and
stand size
Satisfaction with previous interactions (= Product performance)
Symmetric Measures
Value
Asymp. Std.
Errora Approx. Tb
Approx.
Sig.
Spearman Correlation -.046 .040 -1.150 .250c
N of Valid Cases 626
a. Not assuming the null hypothesis.
b. Using the asymtotic standard error assuming the null hypothesis.
c. Based on normal approximation.
Cultural background of supplier’s contact person
Symmetric Measures
Value
Asymp. Std.
Errora Approx. Tb
Approx.
Sig.
Spearman Correlation -.172 .039 -4.331 .000c
N of Valid Cases 619
a. Not assuming the null hypothesis.
b. Using the asymtotic standard error assuming the null hypothesis.
c. Based on normal approximation.
Cultural background of the supplying firm
Symmetric Measures
Value
Asymp. Std.
Errora Approx. Tb
Approx.
Sig.
Spearman Correlation -.138 .040 -3.435 .001c
N of Valid Cases 614
a. Not assuming the null hypothesis.
b. Using the asymtotic standard error assuming the null hypothesis.
c. Based on normal approximation.
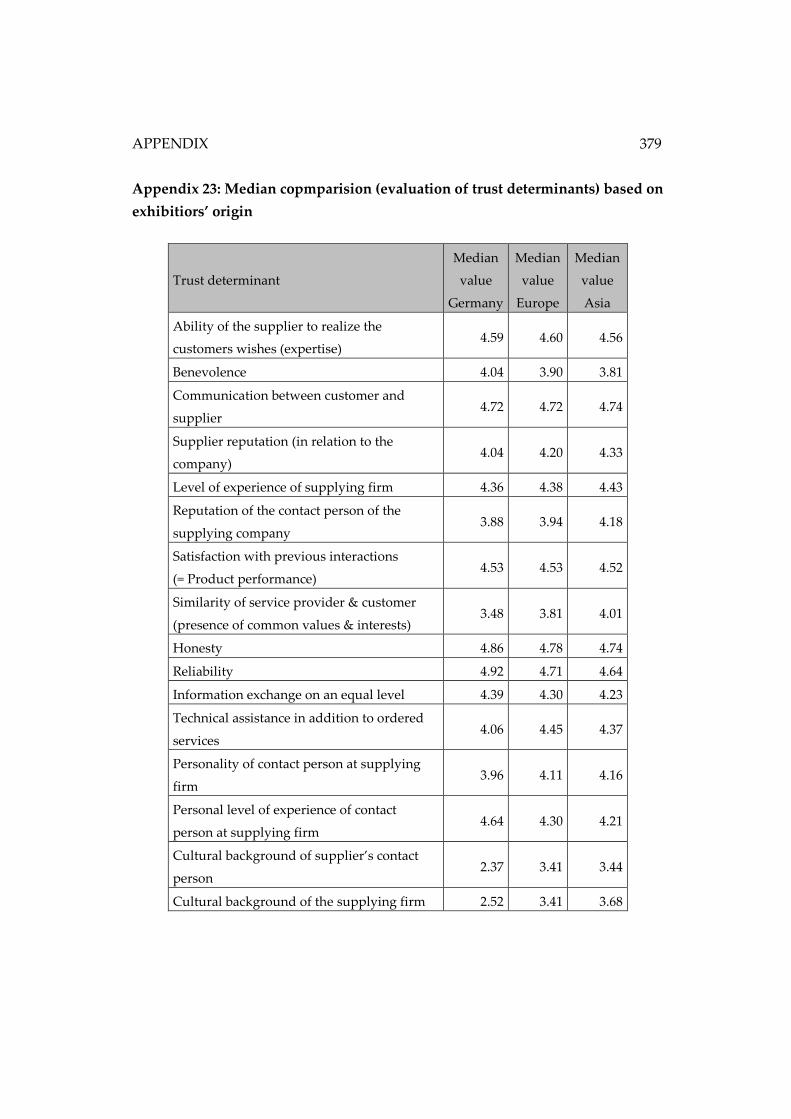
APPENDIX
379
Appendix 23: Median copmparision (evaluation of trust determinants) based on
exhibitiors’ origin
Trust determinant
Median
value
Germany
Median
value
Europe
Median
value
Asia
Ability of the supplier to realize the
customers wishes (expertise) 4.59 4.60 4.56
Benevolence 4.04 3.90 3.81
Communication between customer and
supplier 4.72 4.72 4.74
Supplier reputation (in relation to the
company) 4.04 4.20 4.33
Level of experience of supplying firm 4.36 4.38 4.43
Reputation of the contact person of the
supplying company 3.88 3.94 4.18
Satisfaction with previous interactions
(= Product performance) 4.53 4.53 4.52
Similarity of service provider & customer
(presence of common values & interests) 3.48 3.81 4.01
Honesty 4.86 4.78 4.74
Reliability 4.92 4.71 4.64
Information exchange on an equal level 4.39 4.30 4.23
Technical assistance in addition to ordered
services 4.06 4.45 4.37
Personality of contact person at supplying
firm 3.96 4.11 4.16
Personal level of experience of contact
person at supplying firm 4.64 4.30 4.21
Cultural background of supplier’s contact
person 2.37 3.41 3.44
Cultural background of the supplying firm 2.52 3.41 3.68
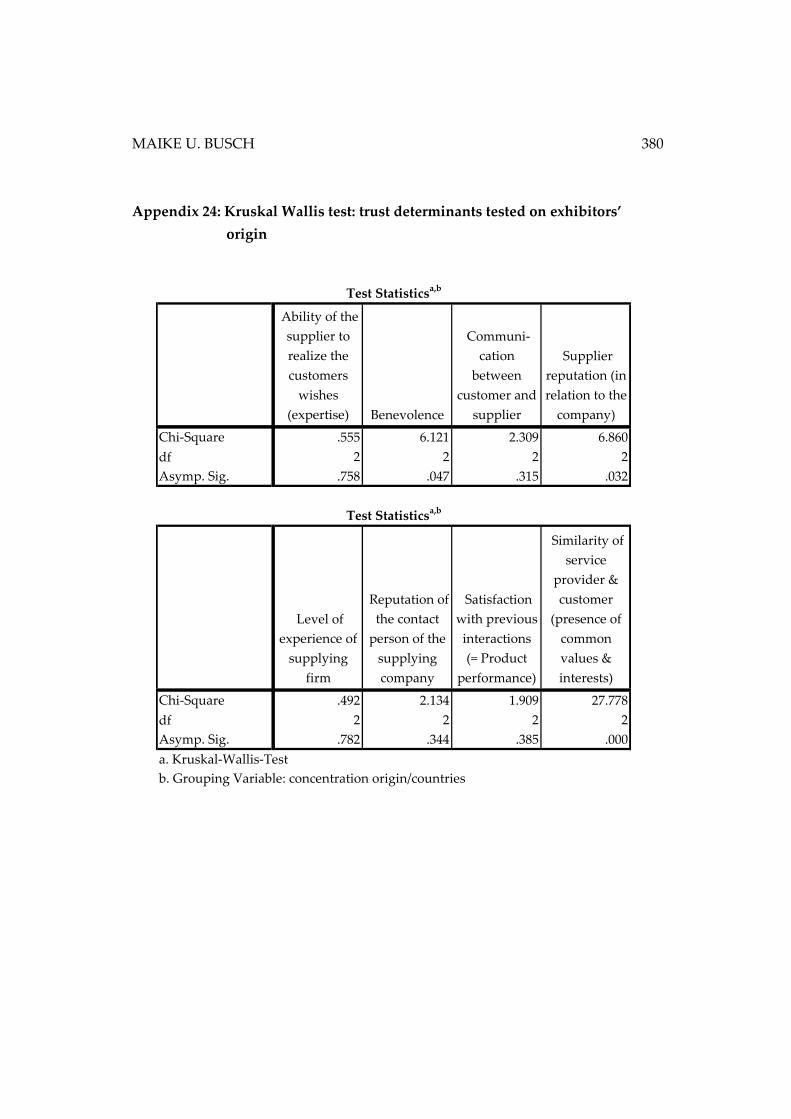
MAIKE U. BUSCH 380
Appendix 24: Kruskal Wallis test: trust determinants tested on exhibitors’
origin
Ability of the
supplier to
realize the
customers
wishes
(expertise) Benevolence
Communi-
cation
between
customer and
supplier
Supplier
reputation (in
relation to the
company)
Chi-Square .555 6.121 2.309 6.860
df 2 2 2 2
Asymp. Sig. .758 .047 .315 .032
Level of
experience of
supplying
firm
Reputation of
the contact
person of the
supplying
company
Satisfaction
with previous
interactions
(= Product
performance)
Similarity of
service
provider &
customer
(presence of
common
values &
interests)
Chi-Square .492 2.134 1.909 27.778
df 2 2 2 2
Asymp. Sig. .782 .344 .385 .000
Test Statisticsa,b
Test Statisticsa,b
a. Kruskal-Wallis-Test
b. Grouping Variable: concentration origin/countries
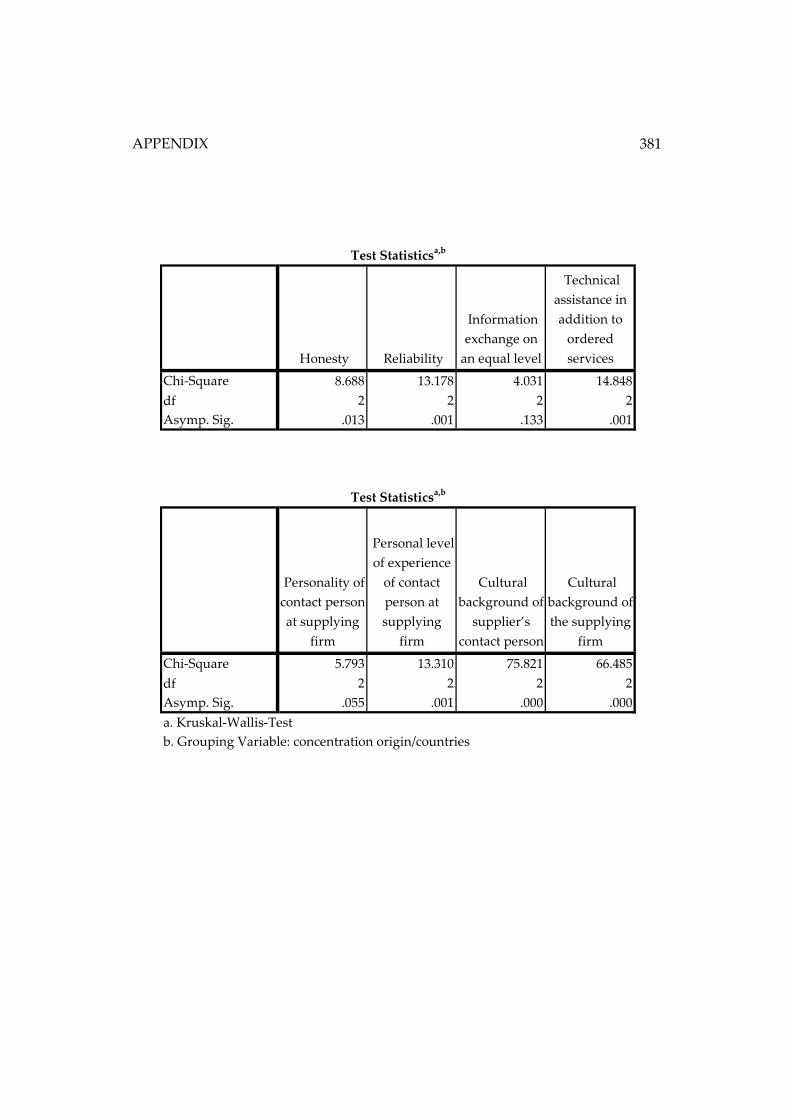
APPENDIX
381
Honesty Reliability
Information
exchange on
an equal level
Technical
assistance in
addition to
ordered
services
Chi-Square 8.688 13.178 4.031 14.848
df 2 2 2 2
Asymp. Sig. .013 .001 .133 .001
Personality of
contact person
at supplying
firm
Personal level
of experience
of contact
person at
supplying
firm
Cultural
background of
supplier’s
contact person
Cultural
background of
the supplying
firm
Chi-Square 5.793 13.310 75.821 66.485
df 2 2 2 2
Asymp. Sig. .055 .001 .000 .000
a. Kruskal-Wallis-Test
b. Grouping Variable: concentration origin/countries
Test Statisticsa,b
Test Statisticsa,b
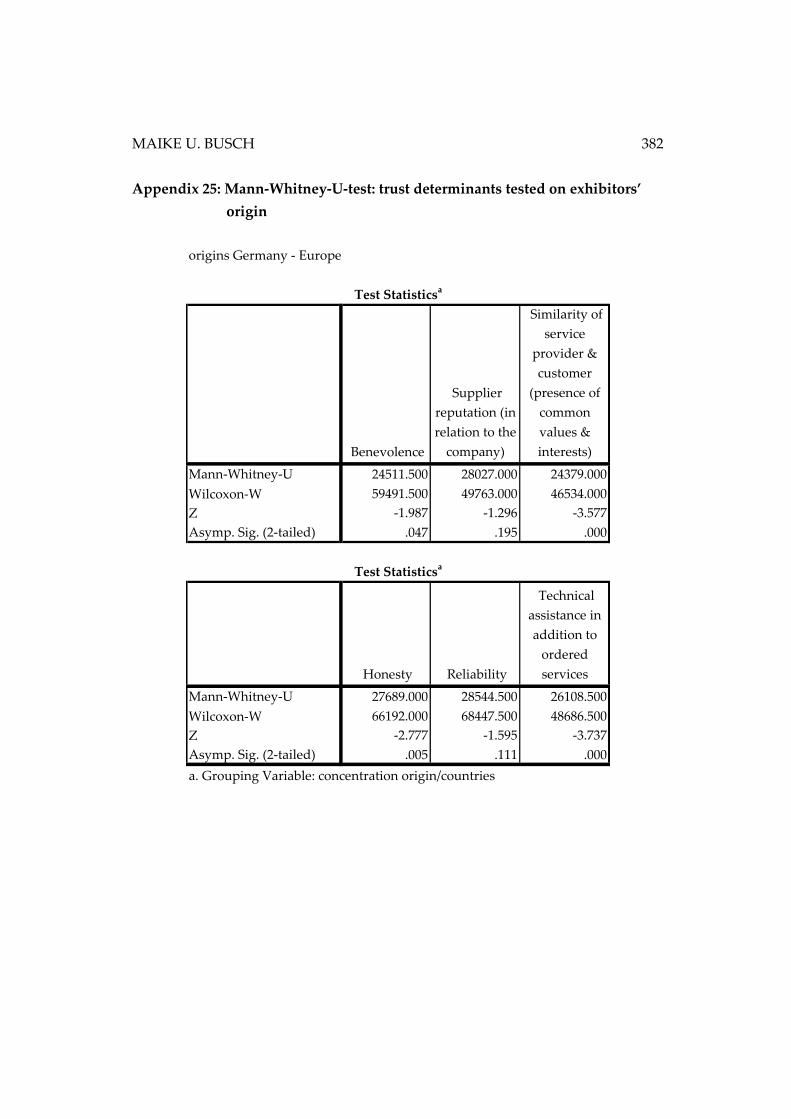
MAIKE U. BUSCH 382
Appendix 25: Mann-Whitney-U-test: trust determinants tested on exhibitors’
origin
origins Germany - Europe
Benevolence
Supplier
reputation (in
relation to the
company)
Similarity of
service
provider &
customer
(presence of
common
values &
interests)
Mann-Whitney-U 24511.500 28027.000 24379.000
Wilcoxon-W 59491.500 49763.000 46534.000
Z -1.987 -1.296 -3.577
Asymp. Sig. (2-tailed) .047 .195 .000
Honesty Reliability
Technical
assistance in
addition to
ordered
services
Mann-Whitney-U 27689.000 28544.500 26108.500
Wilcoxon-W 66192.000 68447.500 48686.500
Z -2.777 -1.595 -3.737
Asymp. Sig. (2-tailed) .005 .111 .000
Test Statisticsa
Test Statisticsa
a. Grouping Variable: concentration origin/countries
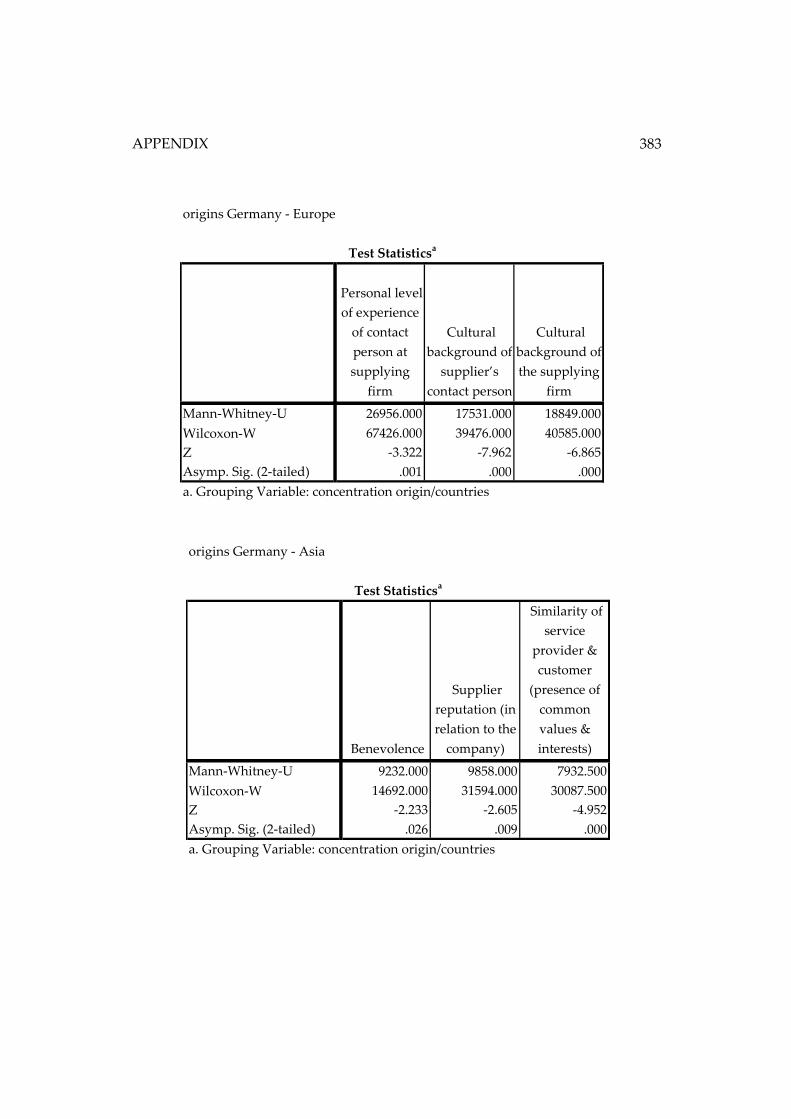
APPENDIX
383
origins Germany - Europe
Personal level
of experience
of contact
person at
supplying
firm
Cultural
background of
supplier’s
contact person
Cultural
background of
the supplying
firm
Mann-Whitney-U 26956.000 17531.000 18849.000
Wilcoxon-W 67426.000 39476.000 40585.000
Z -3.322 -7.962 -6.865
Asymp. Sig. (2-tailed) .001 .000 .000
Test Statisticsa
a. Grouping Variable: concentration origin/countries
origins Germany - Asia
Benevolence
Supplier
reputation (in
relation to the
company)
Similarity of
service
provider &
customer
(presence of
common
values &
interests)
Mann-Whitney-U 9232.000 9858.000 7932.500
Wilcoxon-W 14692.000 31594.000 30087.500
Z -2.233 -2.605 -4.952
Asymp. Sig. (2-tailed) .026 .009 .000
a. Grouping Variable: concentration origin/countries
Test Statisticsa
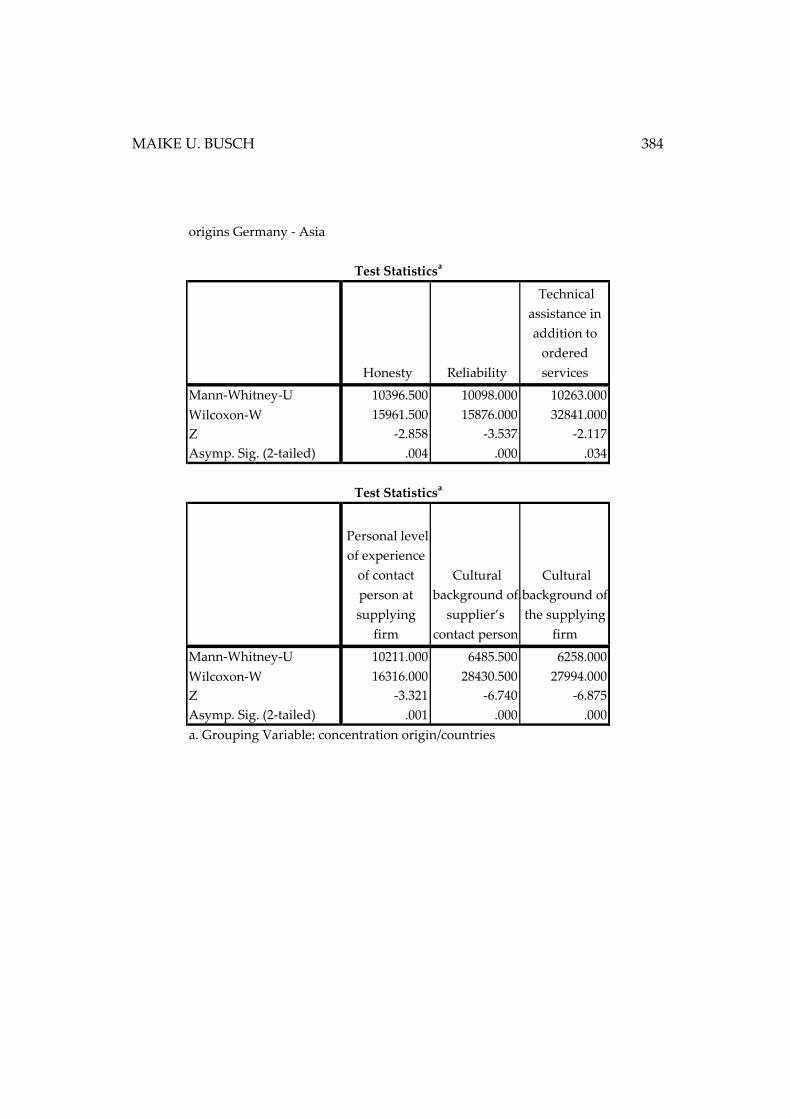
MAIKE U. BUSCH 384
origins Germany - Asia
Honesty Reliability
Technical
assistance in
addition to
ordered
services
Mann-Whitney-U 10396.500 10098.000 10263.000
Wilcoxon-W 15961.500 15876.000 32841.000
Z -2.858 -3.537 -2.117
Asymp. Sig. (2-tailed) .004 .000 .034
Personal level
of experience
of contact
person at
supplying
firm
Cultural
background of
supplier’s
contact person
Cultural
background of
the supplying
firm
Mann-Whitney-U 10211.000 6485.500 6258.000
Wilcoxon-W 16316.000 28430.500 27994.000
Z -3.321 -6.740 -6.875
Asymp. Sig. (2-tailed) .001 .000 .000
Test Statisticsa
Test Statisticsa
a. Grouping Variable: concentration origin/countries
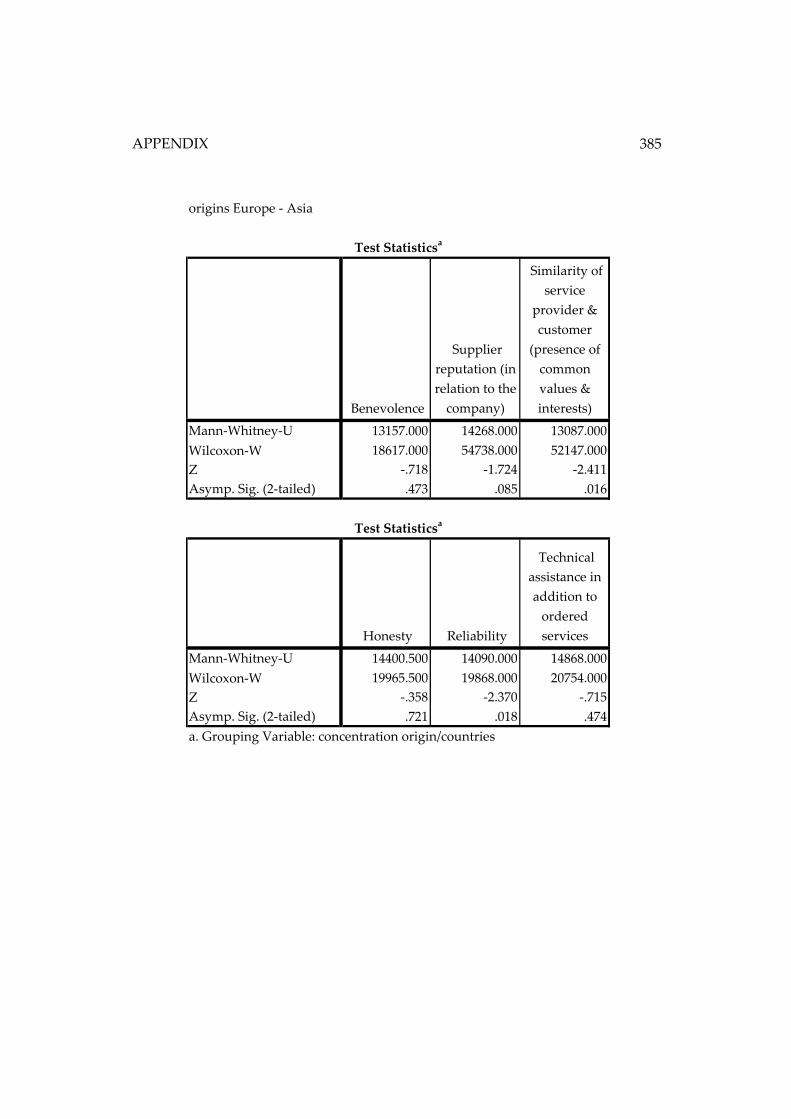
APPENDIX
385
origins Europe - Asia
Benevolence
Supplier
reputation (in
relation to the
company)
Similarity of
service
provider &
customer
(presence of
common
values &
interests)
Mann-Whitney-U 13157.000 14268.000 13087.000
Wilcoxon-W 18617.000 54738.000 52147.000
Z -.718 -1.724 -2.411
Asymp. Sig. (2-tailed) .473 .085 .016
Honesty Reliability
Technical
assistance in
addition to
ordered
services
Mann-Whitney-U 14400.500 14090.000 14868.000
Wilcoxon-W 19965.500 19868.000 20754.000
Z -.358 -2.370 -.715
Asymp. Sig. (2-tailed) .721 .018 .474
Test Statisticsa
a. Grouping Variable: concentration origin/countries
Test Statisticsa
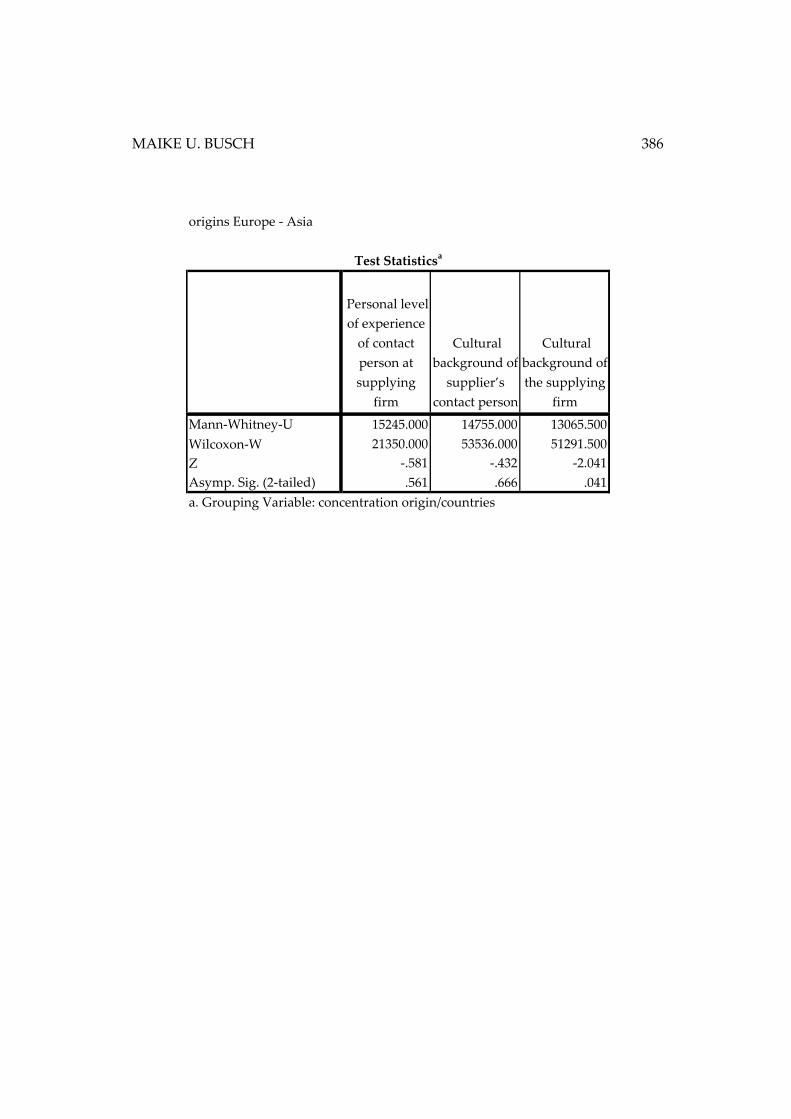
MAIKE U. BUSCH 386
origins Europe - Asia
Personal level
of experience
of contact
person at
supplying
firm
Cultural
background of
supplier’s
contact person
Cultural
background of
the supplying
firm
Mann-Whitney-U 15245.000 14755.000 13065.500
Wilcoxon-W 21350.000 53536.000 51291.500
Z -.581 -.432 -2.041
Asymp. Sig. (2-tailed) .561 .666 .041
Test Statisticsa
a. Grouping Variable: concentration origin/countries
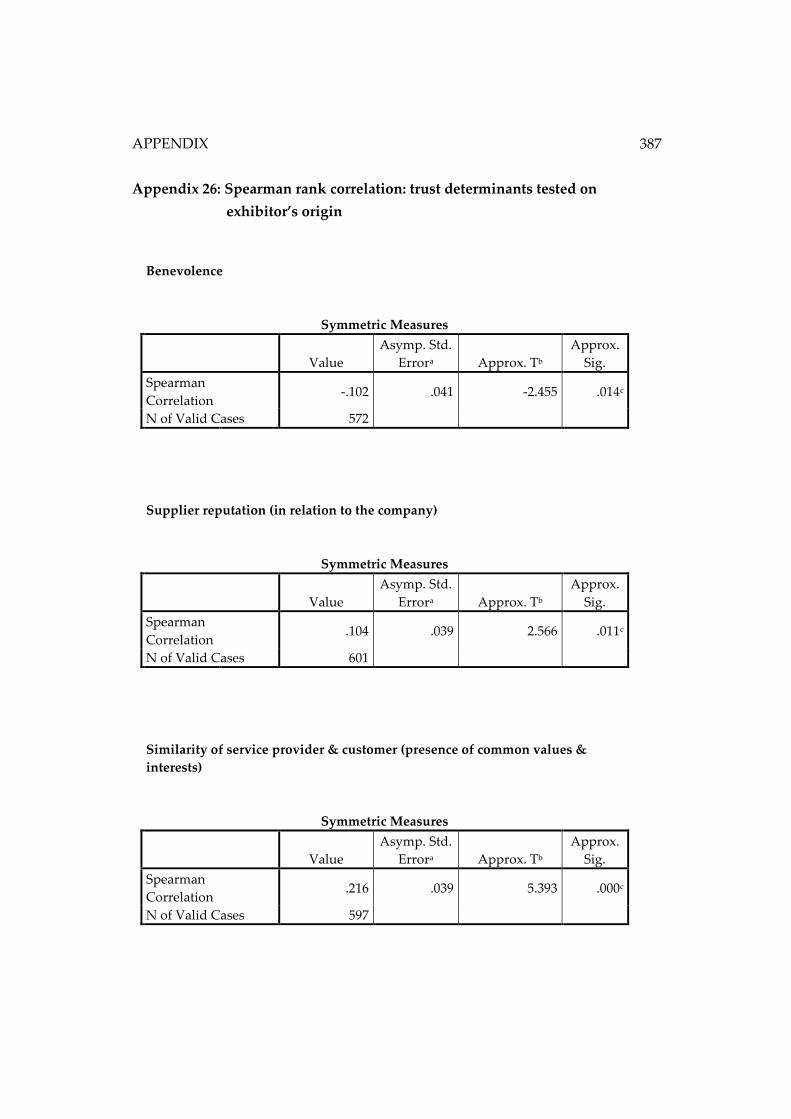
APPENDIX
387
Appendix 26: Spearman rank correlation: trust determinants tested on
exhibitor’s origin
Benevolence
Symmetric Measures
Value
Asymp. Std.
Errora Approx. Tb
Approx.
Sig.
Spearman
Correlation -.102 .041 -2.455 .014c
N of Valid Cases 572
Supplier reputation (in relation to the company)
Symmetric Measures
Value
Asymp. Std.
Errora Approx. Tb
Approx.
Sig.
Spearman
Correlation .104 .039 2.566 .011c
N of Valid Cases 601
Similarity of service provider & customer (presence of common values &
interests)
Symmetric Measures
Value
Asymp. Std.
Errora Approx. Tb
Approx.
Sig.
Spearman
Correlation .216 .039 5.393 .000c
N of Valid Cases 597

MAIKE U. BUSCH 388
a. Not assuming the null hypothesis.
b. Using the asymtotic standard error assuming the null hypothesis.
c. Based on normal approximation.
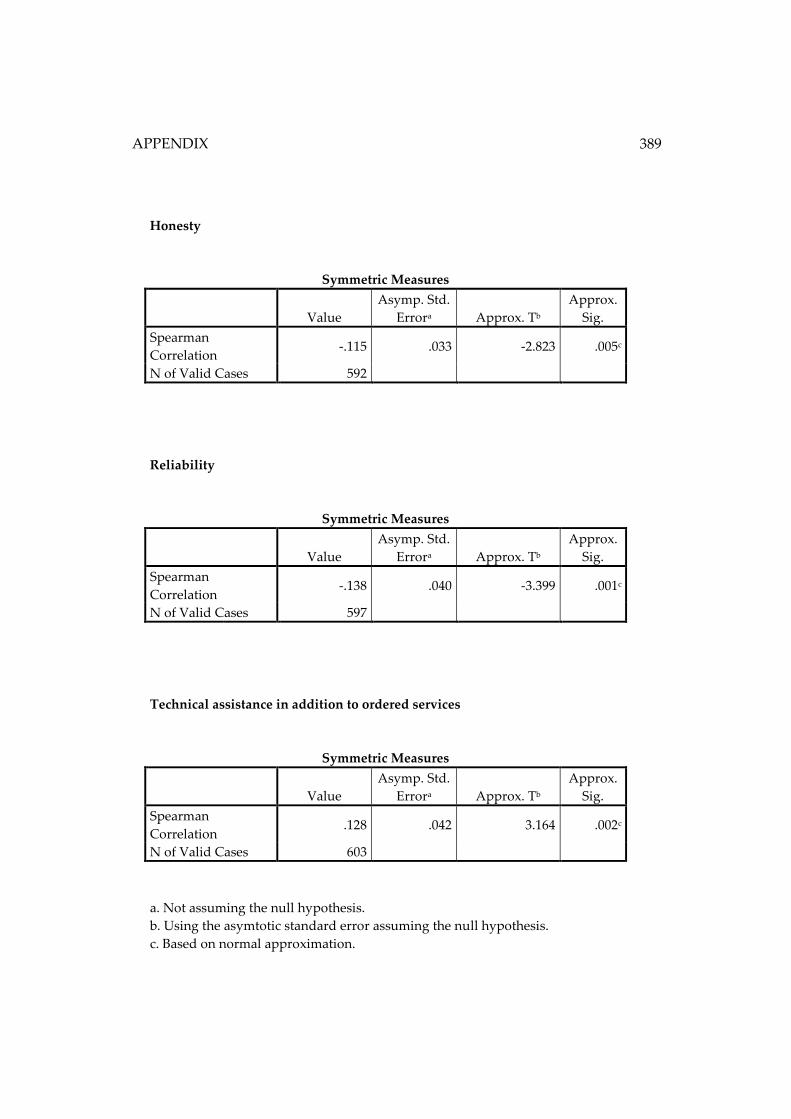
APPENDIX
389
Honesty
Symmetric Measures
Value
Asymp. Std.
Errora Approx. Tb
Approx.
Sig.
Spearman
Correlation -.115 .033 -2.823 .005c
N of Valid Cases 592
Reliability
Symmetric Measures
Value
Asymp. Std.
Errora Approx. Tb
Approx.
Sig.
Spearman
Correlation -.138 .040 -3.399 .001c
N of Valid Cases 597
Technical assistance in addition to ordered services
Symmetric Measures
Value
Asymp. Std.
Errora Approx. Tb
Approx.
Sig.
Spearman
Correlation .128 .042 3.164 .002c
N of Valid Cases 603
a. Not assuming the null hypothesis.
b. Using the asymtotic standard error assuming the null hypothesis.
c. Based on normal approximation.

MAIKE U. BUSCH 390
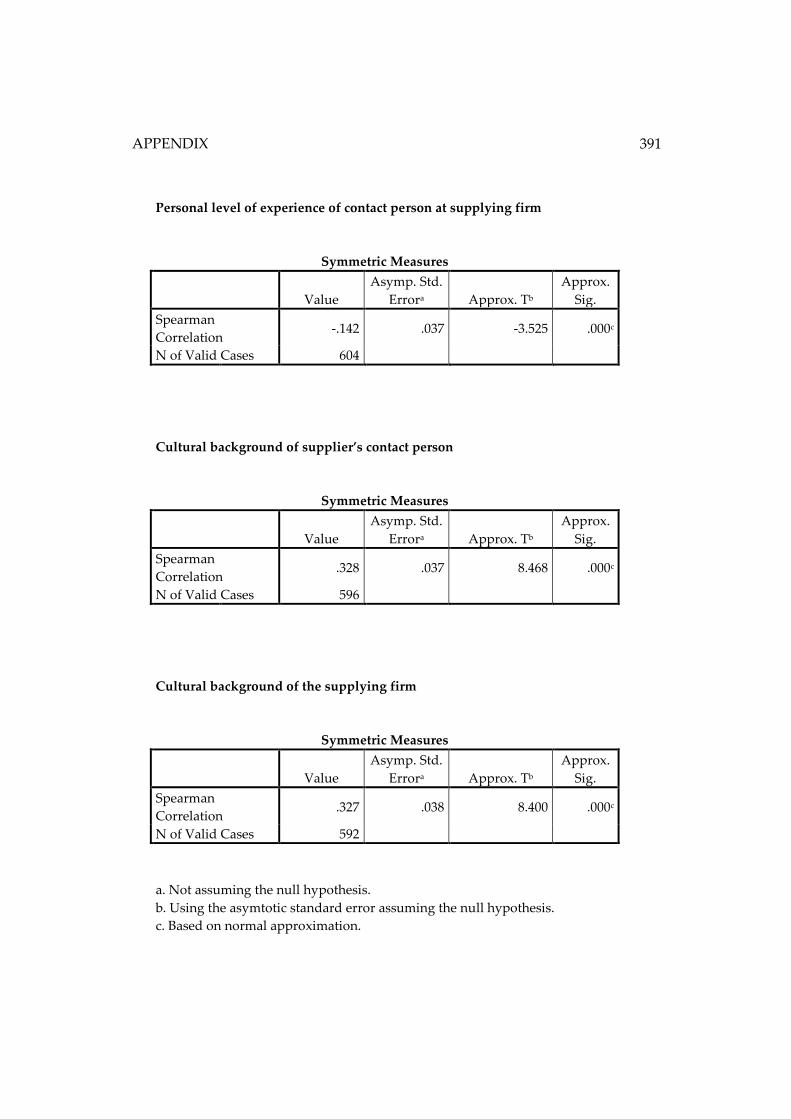
APPENDIX
391
Personal level of experience of contact person at supplying firm
Symmetric Measures
Value
Asymp. Std.
Errora Approx. Tb
Approx.
Sig.
Spearman
Correlation -.142 .037 -3.525 .000c
N of Valid Cases 604
Cultural background of supplier’s contact person
Symmetric Measures
Value
Asymp. Std.
Errora Approx. Tb
Approx.
Sig.
Spearman
Correlation .328 .037 8.468 .000c
N of Valid Cases 596
Cultural background of the supplying firm
Symmetric Measures
Value
Asymp. Std.
Errora Approx. Tb
Approx.
Sig.
Spearman
Correlation .327 .038 8.400 .000c
N of Valid Cases 592
a. Not assuming the null hypothesis.
b. Using the asymtotic standard error assuming the null hypothesis.
c. Based on normal approximation.
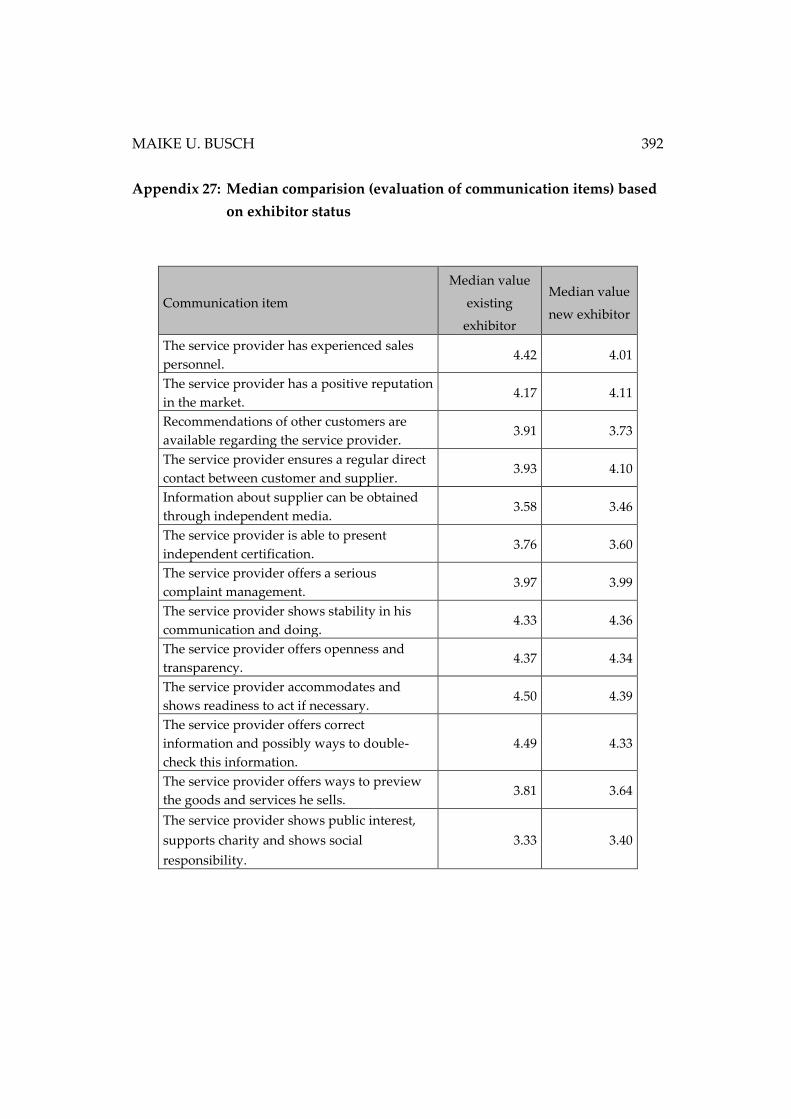
MAIKE U. BUSCH 392
Appendix 27: Median comparision (evaluation of communication items) based
on exhibitor status
Communication item
Median value
existing
exhibitor
Median value
new exhibitor
The service provider has experienced sales
personnel. 4.42 4.01
The service provider has a positive reputation
in the market. 4.17 4.11
Recommendations of other customers are
available regarding the service provider. 3.91 3.73
The service provider ensures a regular direct
contact between customer and supplier. 3.93 4.10
Information about supplier can be obtained
through independent media. 3.58 3.46
The service provider is able to present
independent certification. 3.76 3.60
The service provider offers a serious
complaint management. 3.97 3.99
The service provider shows stability in his
communication and doing. 4.33 4.36
The service provider offers openness and
transparency. 4.37 4.34
The service provider accommodates and
shows readiness to act if necessary. 4.50 4.39
The service provider offers correct
information and possibly ways to double-
check this information.
4.49 4.33
The service provider offers ways to preview
the goods and services he sells. 3.81 3.64
The service provider shows public interest,
supports charity and shows social
responsibility.
3.33 3.40
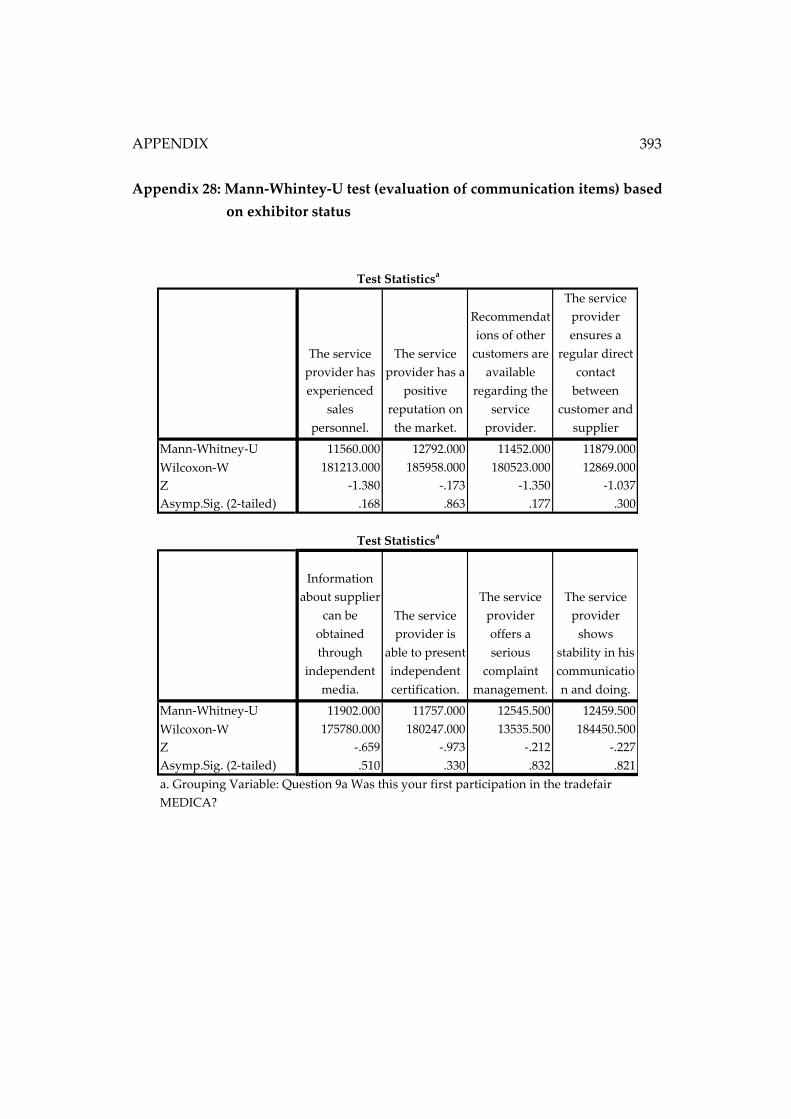
APPENDIX
393
Appendix 28: Mann-Whintey-U test (evaluation of communication items) based
on exhibitor status
The service
provider has
experienced
sales
personnel.
The service
provider has a
positive
reputation on
the market.
Recommendat
ions of other
customers are
available
regarding the
service
provider.
The service
provider
ensures a
regular direct
contact
between
customer and
supplier
Mann-Whitney-U 11560.000 12792.000 11452.000 11879.000
Wilcoxon-W 181213.000 185958.000 180523.000 12869.000
Z -1.380 -.173 -1.350 -1.037
Asymp.Sig. (2-tailed) .168 .863 .177 .300
Information
about supplier
can be
obtained
through
independent
media.
The service
provider is
able to present
independent
certification.
The service
provider
offers a
serious
complaint
management.
The service
provider
shows
stability in his
communicatio
n and doing.
Mann-Whitney-U 11902.000 11757.000 12545.500 12459.500
Wilcoxon-W 175780.000 180247.000 13535.500 184450.500
Z -.659 -.973 -.212 -.227
Asymp.Sig. (2-tailed) .510 .330 .832 .821
Test Statisticsa
a. Grouping Variable: Question 9a Was this your first participation in the tradefair
MEDICA?
Test Statisticsa
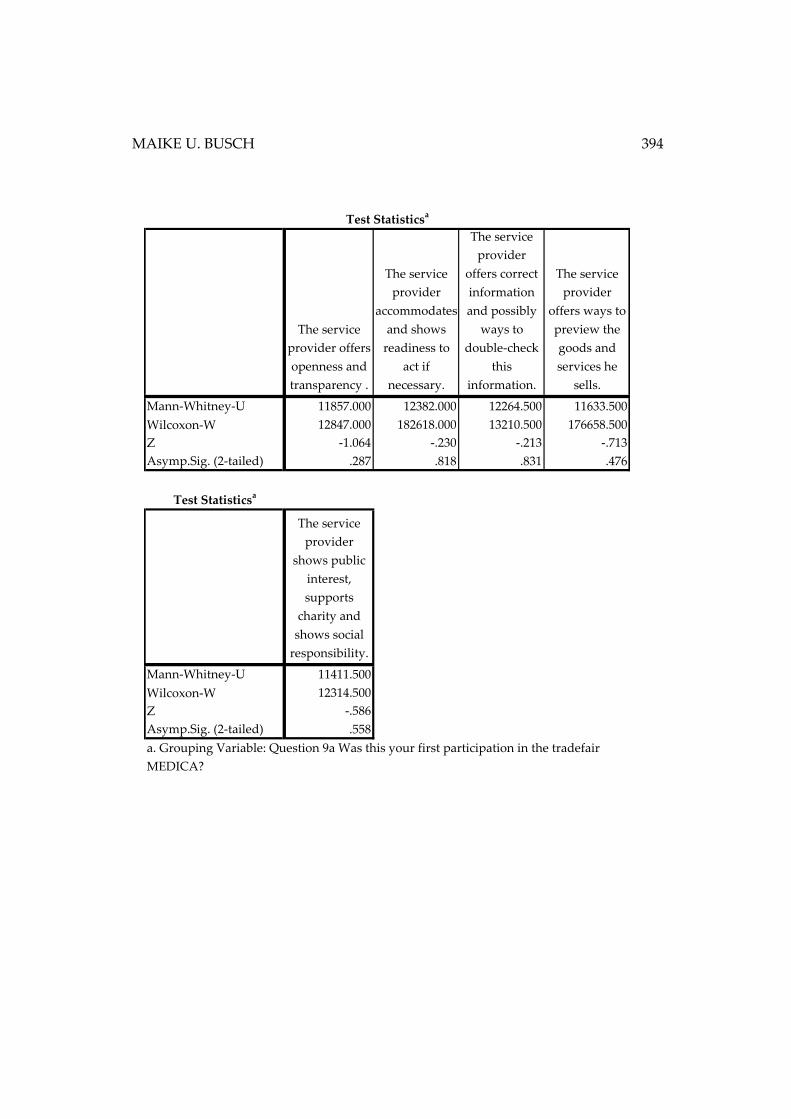
MAIKE U. BUSCH 394
The service
provider offers
openness and
transparency .
The service
provider
accommodates
and shows
readiness to
act if
necessary.
The service
provider
offers correct
information
and possibly
ways to
double-check
this
information.
The service
provider
offers ways to
preview the
goods and
services he
sells.
Mann-Whitney-U 11857.000 12382.000 12264.500 11633.500
Wilcoxon-W 12847.000 182618.000 13210.500 176658.500
Z -1.064 -.230 -.213 -.713
Asymp.Sig. (2-tailed) .287 .818 .831 .476
Test Statisticsa
The service
provider
shows public
interest,
supports
charity and
shows social
responsibility.
Mann-Whitney-U 11411.500
Wilcoxon-W 12314.500
Z -.586
Asymp.Sig. (2-tailed) .558
Test Statisticsa
a. Grouping Variable: Question 9a Was this your first participation in the tradefair
MEDICA?
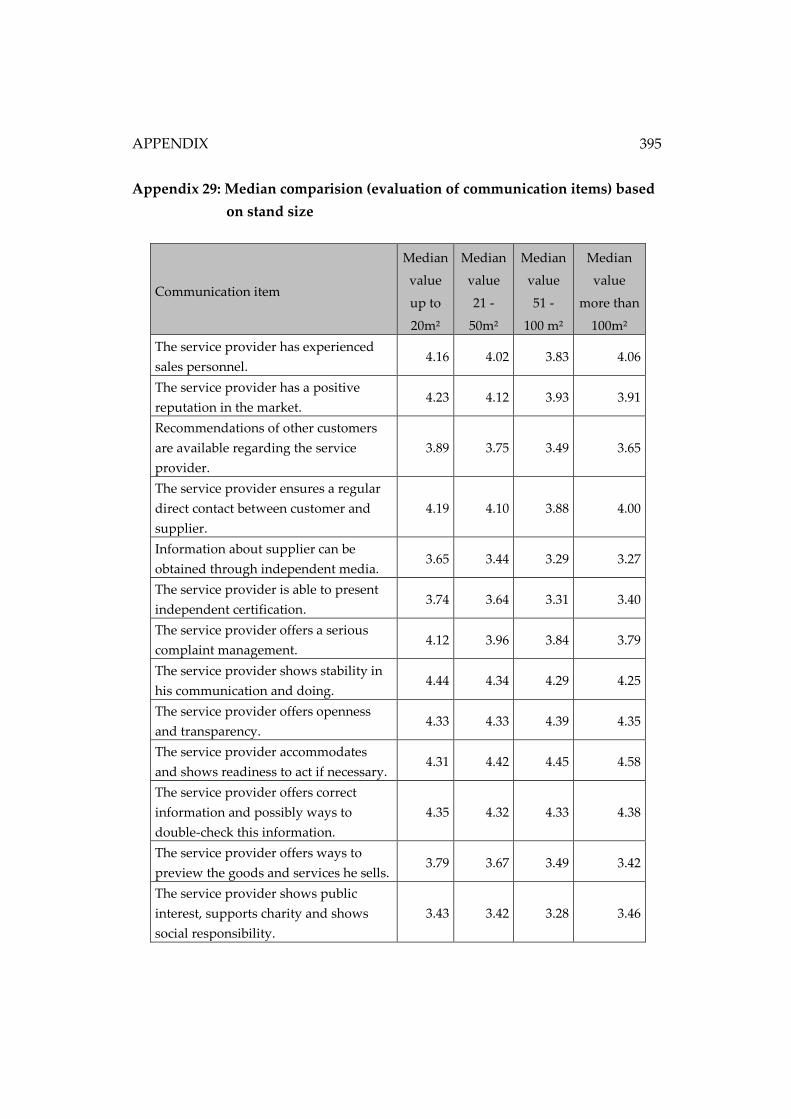
APPENDIX
395
Appendix 29: Median comparision (evaluation of communication items) based
on stand size
Communication item
Median
value
up to
20m²
Median
value
21 -
50m²
Median
value
51 -
100 m²
Median
value
more than
100m²
The service provider has experienced
sales personnel. 4.16 4.02 3.83 4.06
The service provider has a positive
reputation in the market. 4.23 4.12 3.93 3.91
Recommendations of other customers
are available regarding the service
provider.
3.89 3.75 3.49 3.65
The service provider ensures a regular
direct contact between customer and
supplier.
4.19 4.10 3.88 4.00
Information about supplier can be
obtained through independent media. 3.65 3.44 3.29 3.27
The service provider is able to present
independent certification. 3.74 3.64 3.31 3.40
The service provider offers a serious
complaint management. 4.12 3.96 3.84 3.79
The service provider shows stability in
his communication and doing. 4.44 4.34 4.29 4.25
The service provider offers openness
and transparency. 4.33 4.33 4.39 4.35
The service provider accommodates
and shows readiness to act if necessary. 4.31 4.42 4.45 4.58
The service provider offers correct
information and possibly ways to
double-check this information.
4.35 4.32 4.33 4.38
The service provider offers ways to
preview the goods and services he sells. 3.79 3.67 3.49 3.42
The service provider shows public
interest, supports charity and shows
social responsibility.
3.43 3.42 3.28 3.46
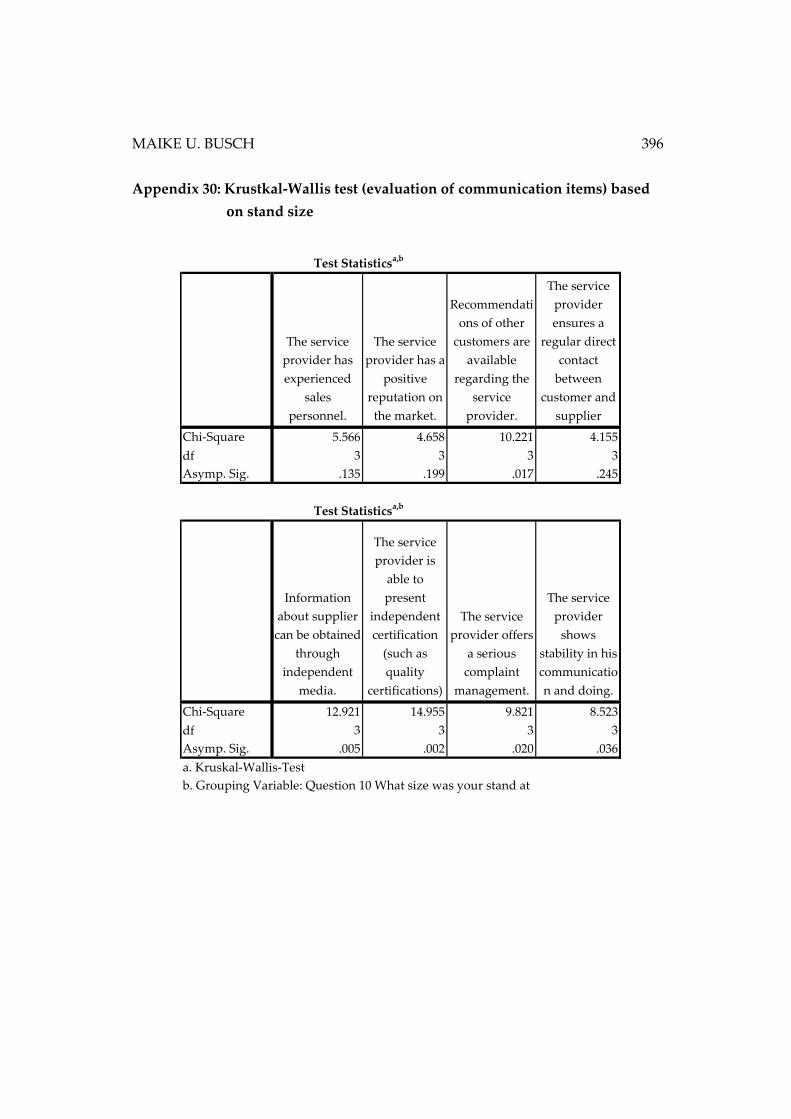
MAIKE U. BUSCH 396
Appendix 30: Krustkal-Wallis test (evaluation of communication items) based
on stand size
The service
provider has
experienced
sales
personnel.
The service
provider has a
positive
reputation on
the market.
Recommendati
ons of other
customers are
available
regarding the
service
provider.
The service
provider
ensures a
regular direct
contact
between
customer and
supplier
Chi-Square 5.566 4.658 10.221 4.155
df 3 3 3 3
Asymp. Sig. .135 .199 .017 .245
Information
about supplier
can be obtained
through
independent
media.
The service
provider is
able to
present
independent
certification
(such as
quality
certifications)
The service
provider offers
a serious
complaint
management.
The service
provider
shows
stability in his
communicatio
n and doing.
Chi-Square 12.921 14.955 9.821 8.523
df 3 3 3 3
Asymp. Sig. .005 .002 .020 .036
Test Statisticsa,b
Test Statisticsa,b
a. Kruskal-Wallis-Test
b. Grouping Variable: Question 10 What size was your stand at
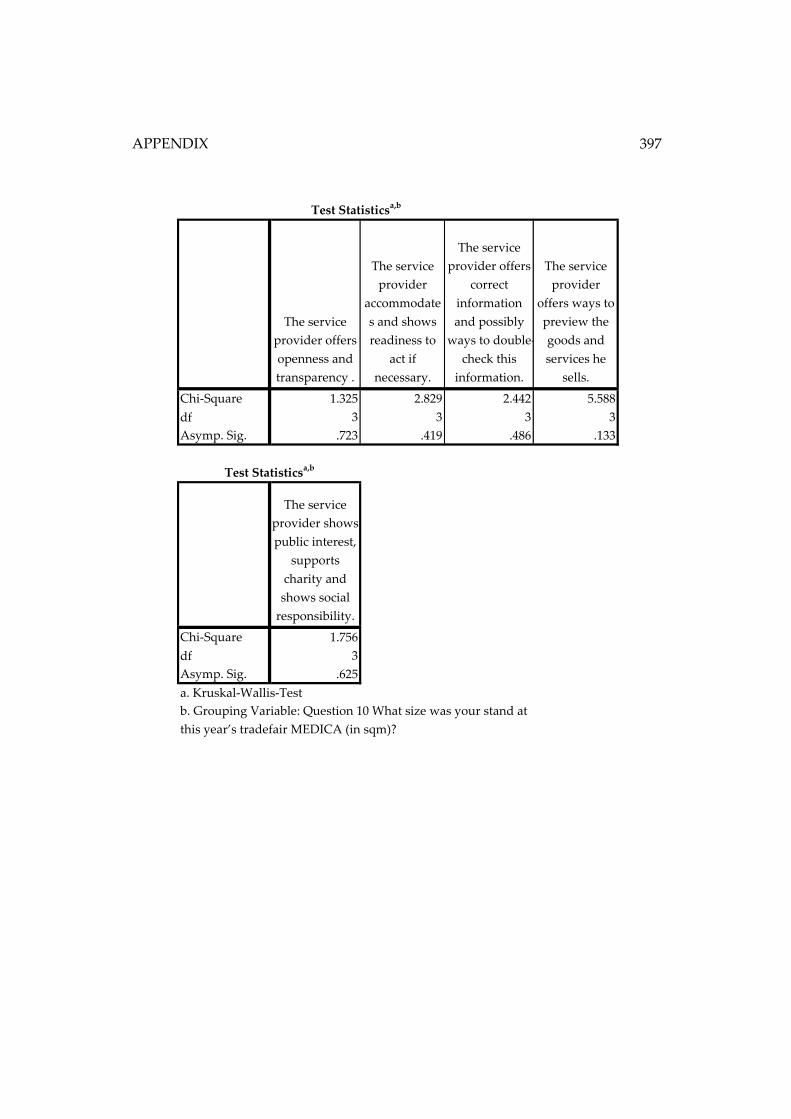
APPENDIX
397
The service
provider offers
openness and
transparency .
The service
provider
accommodate
s and shows
readiness to
act if
necessary.
The service
provider offers
correct
information
and possibly
ways to double-
check this
information.
The service
provider
offers ways to
preview the
goods and
services he
sells.
Chi-Square 1.325 2.829 2.442 5.588
df 3 3 3 3
Asymp. Sig. .723 .419 .486 .133
The service
provider shows
public interest,
supports
charity and
shows social
responsibility.
Chi-Square 1.756
df 3
Asymp. Sig. .625
Test Statisticsa,b
a. Kruskal-Wallis-Test
b. Grouping Variable: Question 10 What size was your stand at
this year’s tradefair MEDICA (in sqm)?
Test Statisticsa,b
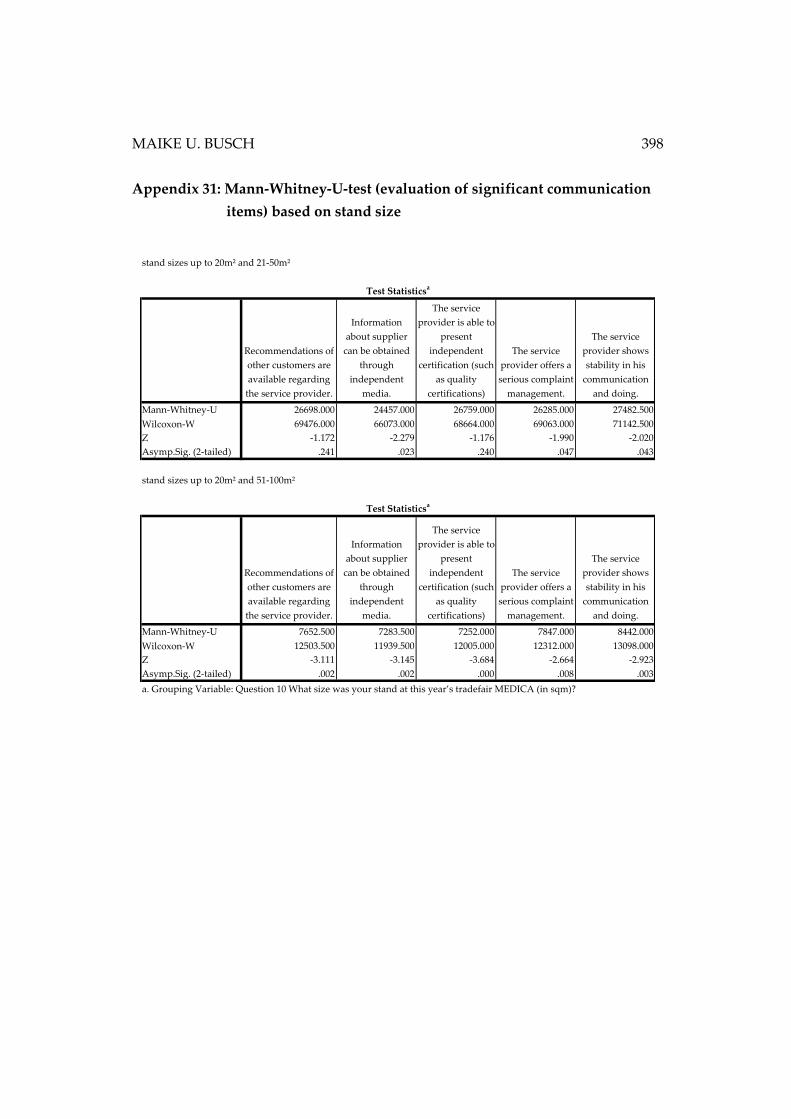
MAIKE U. BUSCH 398
Appendix 31: Mann-Whitney-U-test (evaluation of significant communication
items) based on stand size
stand sizes up to 20m² and 21-50m²
Recommendations of
other customers are
available regarding
the service provider.
Information
about supplier
can be obtained
through
independent
media.
The service
provider is able to
present
independent
certification (such
as quality
certifications)
The service
provider offers a
serious complaint
management.
The service
provider shows
stability in his
communication
and doing.
Mann-Whitney-U 26698.000 24457.000 26759.000 26285.000 27482.500
Wilcoxon-W 69476.000 66073.000 68664.000 69063.000 71142.500
Z -1.172 -2.279 -1.176 -1.990 -2.020
Asymp.Sig. (2-tailed) .241 .023 .240 .047 .043
stand sizes up to 20m² and 51-100m²
Recommendations of
other customers are
available regarding
the service provider.
Information
about supplier
can be obtained
through
independent
media.
The service
provider is able to
present
independent
certification (such
as quality
certifications)
The service
provider offers a
serious complaint
management.
The service
provider shows
stability in his
communication
and doing.
Mann-Whitney-U 7652.500 7283.500 7252.000 7847.000 8442.000
Wilcoxon-W 12503.500 11939.500 12005.000 12312.000 13098.000
Z -3.111 -3.145 -3.684 -2.664 -2.923
Asymp.Sig. (2-tailed) .002 .002 .000 .008 .003
a. Grouping Variable: Question 10 What size was your stand at this year’s tradefair MEDICA (in sqm)?
Test Statisticsa
Test Statisticsa
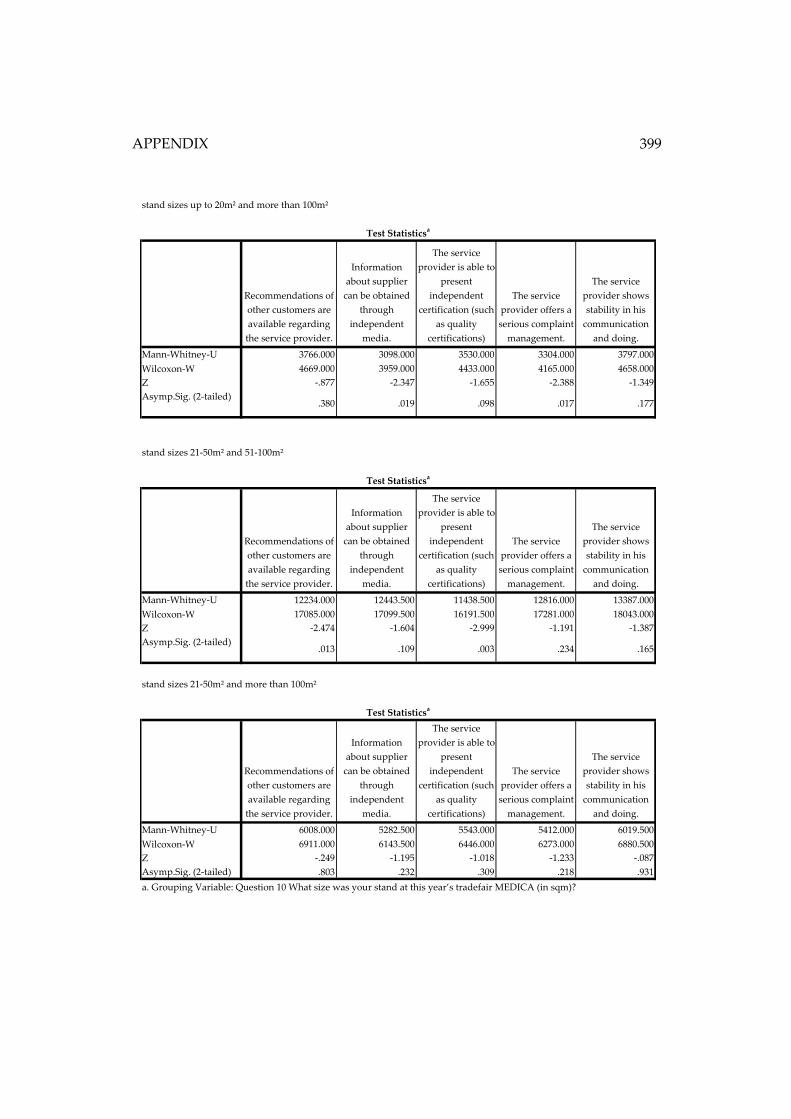
APPENDIX
399
stand sizes up to 20m² and more than 100m²
Recommendations of
other customers are
available regarding
the service provider.
Information
about supplier
can be obtained
through
independent
media.
The service
provider is able to
present
independent
certification (such
as quality
certifications)
The service
provider offers a
serious complaint
management.
The service
provider shows
stability in his
communication
and doing.
Mann-Whitney-U 3766.000 3098.000 3530.000 3304.000 3797.000
Wilcoxon-W 4669.000 3959.000 4433.000 4165.000 4658.000
Z -.877 -2.347 -1.655 -2.388 -1.349
Asymp.Sig. (2-tailed).380 .019 .098 .017 .177
stand sizes 21-50m² and 51-100m²
Recommendations of
other customers are
available regarding
the service provider.
Information
about supplier
can be obtained
through
independent
media.
The service
provider is able to
present
independent
certification (such
as quality
certifications)
The service
provider offers a
serious complaint
management.
The service
provider shows
stability in his
communication
and doing.
Mann-Whitney-U 12234.000 12443.500 11438.500 12816.000 13387.000
Wilcoxon-W 17085.000 17099.500 16191.500 17281.000 18043.000
Z -2.474 -1.604 -2.999 -1.191 -1.387
Asymp.Sig. (2-tailed).013 .109 .003 .234 .165
stand sizes 21-50m² and more than 100m²
Recommendations of
other customers are
available regarding
the service provider.
Information
about supplier
can be obtained
through
independent
media.
The service
provider is able to
present
independent
certification (such
as quality
certifications)
The service
provider offers a
serious complaint
management.
The service
provider shows
stability in his
communication
and doing.
Mann-Whitney-U 6008.000 5282.500 5543.000 5412.000 6019.500
Wilcoxon-W 6911.000 6143.500 6446.000 6273.000 6880.500
Z -.249 -1.195 -1.018 -1.233 -.087
Asymp.Sig. (2-tailed) .803 .232 .309 .218 .931
Test Statisticsa
a. Grouping Variable: Question 10 What size was your stand at this year’s tradefair MEDICA (in sqm)?
Test Statisticsa
Test Statisticsa
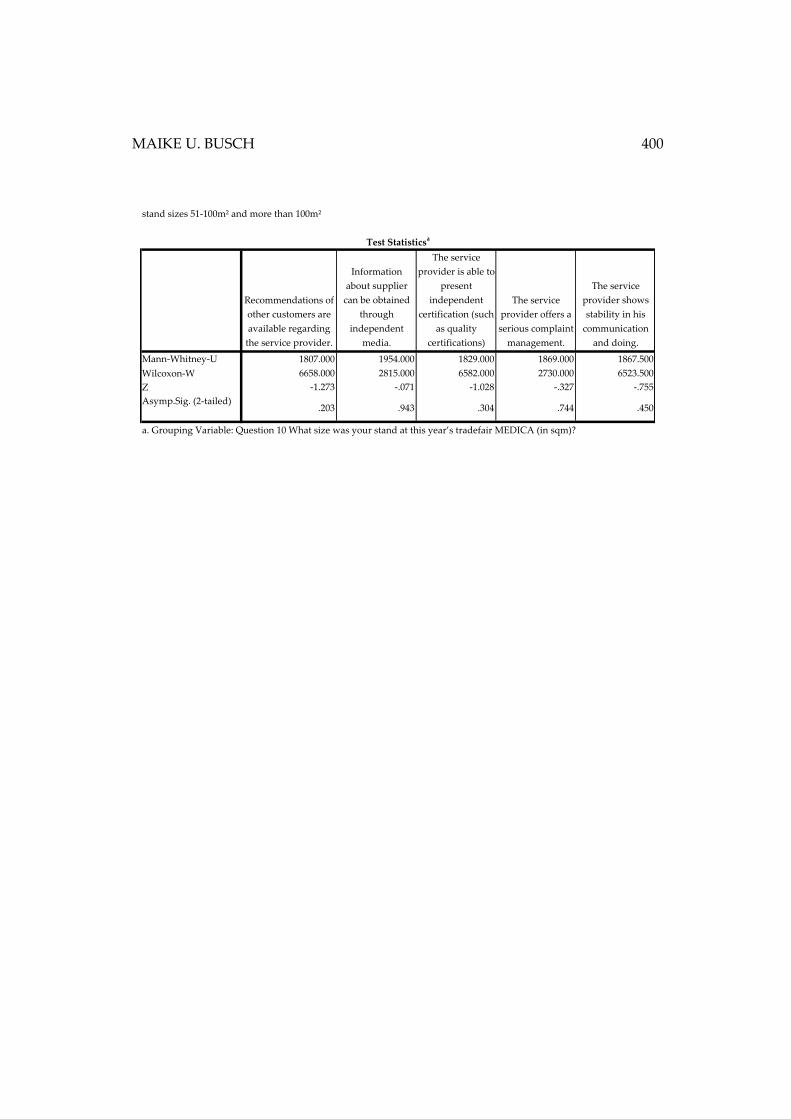
MAIKE U. BUSCH 400
stand sizes 51-100m² and more than 100m²
Recommendations of
other customers are
available regarding
the service provider.
Information
about supplier
can be obtained
through
independent
media.
The service
provider is able to
present
independent
certification (such
as quality
certifications)
The service
provider offers a
serious complaint
management.
The service
provider shows
stability in his
communication
and doing.
Mann-Whitney-U 1807.000 1954.000 1829.000 1869.000 1867.500
Wilcoxon-W 6658.000 2815.000 6582.000 2730.000 6523.500
Z -1.273 -.071 -1.028 -.327 -.755
Asymp.Sig. (2-tailed).203 .943 .304 .744 .450
a. Grouping Variable: Question 10 What size was your stand at this year’s tradefair MEDICA (in sqm)?
Test Statisticsa
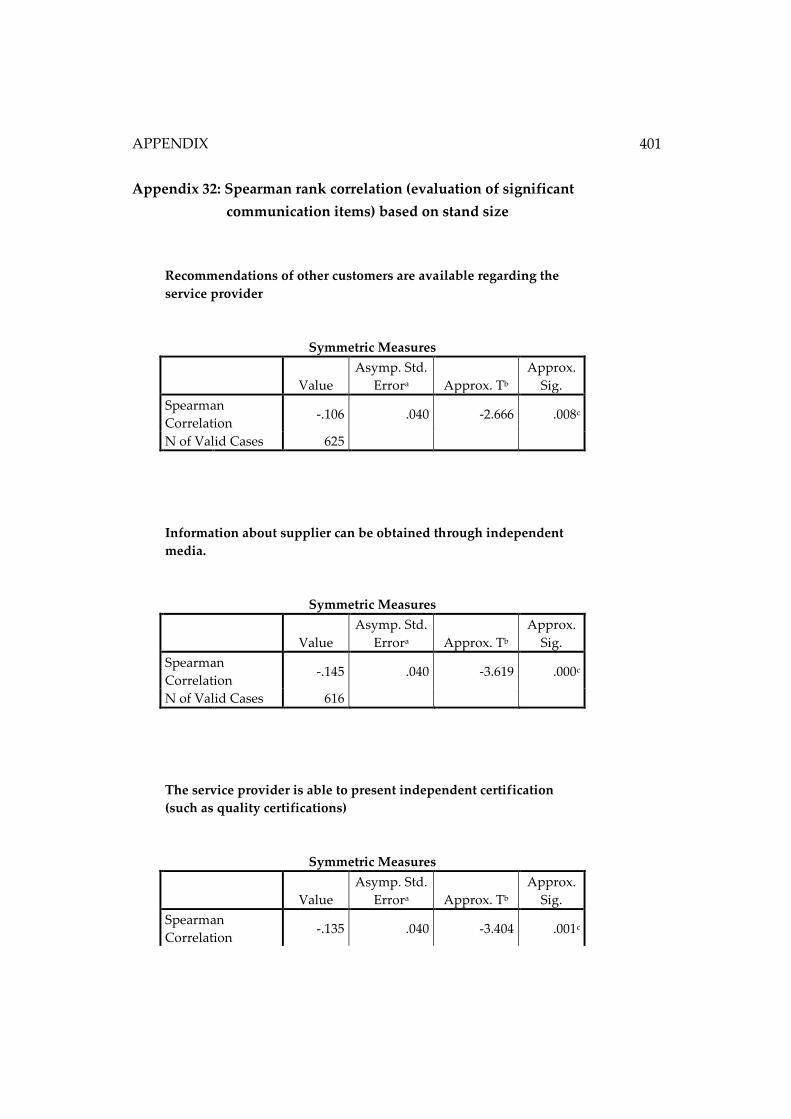
APPENDIX
401
Appendix 32: Spearman rank correlation (evaluation of significant
communication items) based on stand size
Recommendations of other customers are available regarding the
service provider
Symmetric Measures
Value
Asymp. Std.
Errora Approx. Tb
Approx.
Sig.
Spearman
Correlation -.106 .040 -2.666 .008c
N of Valid Cases 625
Information about supplier can be obtained through independent
media.
Symmetric Measures
Value
Asymp. Std.
Errora Approx. Tb
Approx.
Sig.
Spearman
Correlation -.145 .040 -3.619 .000c
N of Valid Cases 616
The service provider is able to present independent certification
(such as quality certifications)
Symmetric Measures
Value
Asymp. Std.
Errora Approx. Tb
Approx.
Sig.
Spearman
Correlation -.135 .040 -3.404 .001c

MAIKE U. BUSCH 402
N of Valid Cases 624
a. Not assuming the null hypothesis.
b. Using the asymtotic standard error assuming the null hypothesis.
c. Based on normal approximation.
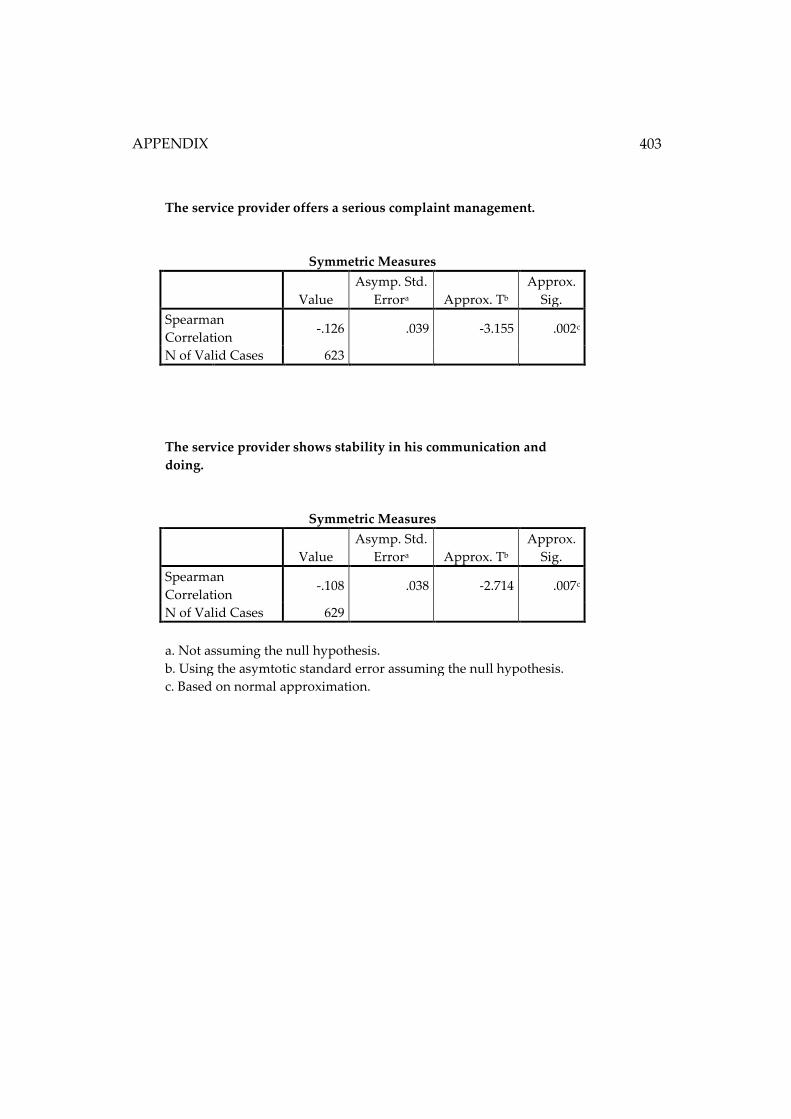
APPENDIX
403
The service provider offers a serious complaint management.
Symmetric Measures
Value
Asymp. Std.
Errora Approx. Tb
Approx.
Sig.
Spearman
Correlation -.126 .039 -3.155 .002c
N of Valid Cases 623
The service provider shows stability in his communication and
doing.
Symmetric Measures
Value
Asymp. Std.
Errora Approx. Tb
Approx.
Sig.
Spearman
Correlation -.108 .038 -2.714 .007c
N of Valid Cases 629
a. Not assuming the null hypothesis.
b. Using the asymtotic standard error assuming the null hypothesis.
c. Based on normal approximation.
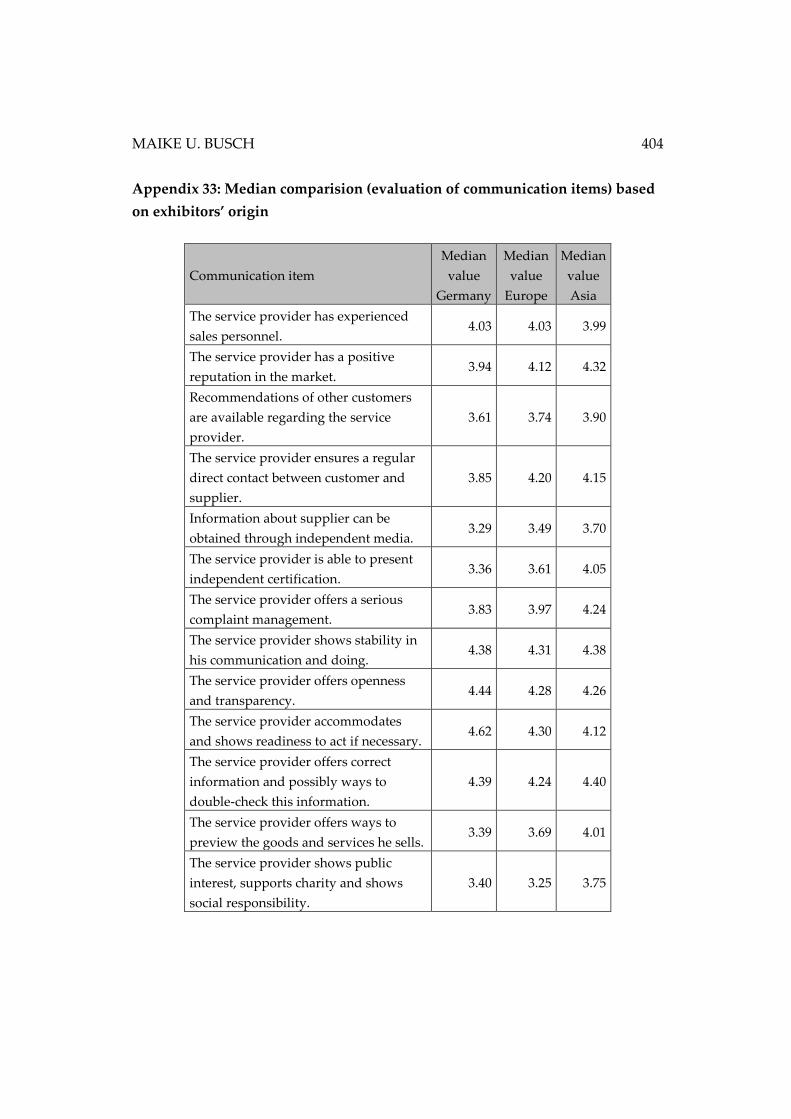
MAIKE U. BUSCH 404
Appendix 33: Median comparision (evaluation of communication items) based
on exhibitors’ origin
Communication item
Median
value
Germany
Median
value
Europe
Median
value
Asia
The service provider has experienced
sales personnel. 4.03 4.03 3.99
The service provider has a positive
reputation in the market. 3.94 4.12 4.32
Recommendations of other customers
are available regarding the service
provider.
3.61 3.74 3.90
The service provider ensures a regular
direct contact between customer and
supplier.
3.85 4.20 4.15
Information about supplier can be
obtained through independent media. 3.29 3.49 3.70
The service provider is able to present
independent certification. 3.36 3.61 4.05
The service provider offers a serious
complaint management. 3.83 3.97 4.24
The service provider shows stability in
his communication and doing. 4.38 4.31 4.38
The service provider offers openness
and transparency. 4.44 4.28 4.26
The service provider accommodates
and shows readiness to act if necessary. 4.62 4.30 4.12
The service provider offers correct
information and possibly ways to
double-check this information.
4.39 4.24 4.40
The service provider offers ways to
preview the goods and services he sells. 3.39 3.69 4.01
The service provider shows public
interest, supports charity and shows
social responsibility.
3.40 3.25 3.75
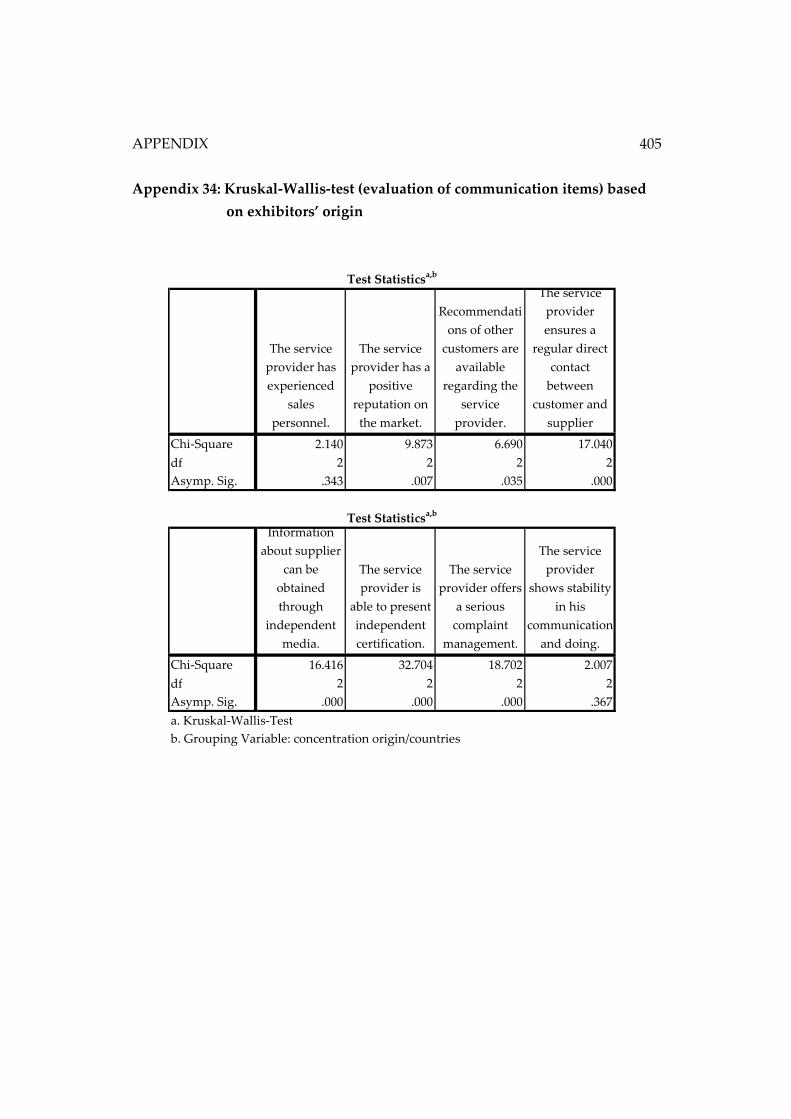
APPENDIX
405
Appendix 34: Kruskal-Wallis-test (evaluation of communication items) based
on exhibitors’ origin
The service
provider has
experienced
sales
personnel.
The service
provider has a
positive
reputation on
the market.
Recommendati
ons of other
customers are
available
regarding the
service
provider.
The service
provider
ensures a
regular direct
contact
between
customer and
supplier
Chi-Square 2.140 9.873 6.690 17.040
df 2 2 2 2
Asymp. Sig. .343 .007 .035 .000
Information
about supplier
can be
obtained
through
independent
media.
The service
provider is
able to present
independent
certification.
The service
provider offers
a serious
complaint
management.
The service
provider
shows stability
in his
communication
and doing.
Chi-Square 16.416 32.704 18.702 2.007
df 2 2 2 2
Asymp. Sig. .000 .000 .000 .367
a. Kruskal-Wallis-Test
b. Grouping Variable: concentration origin/countries
Test Statisticsa,b
Test Statisticsa,b
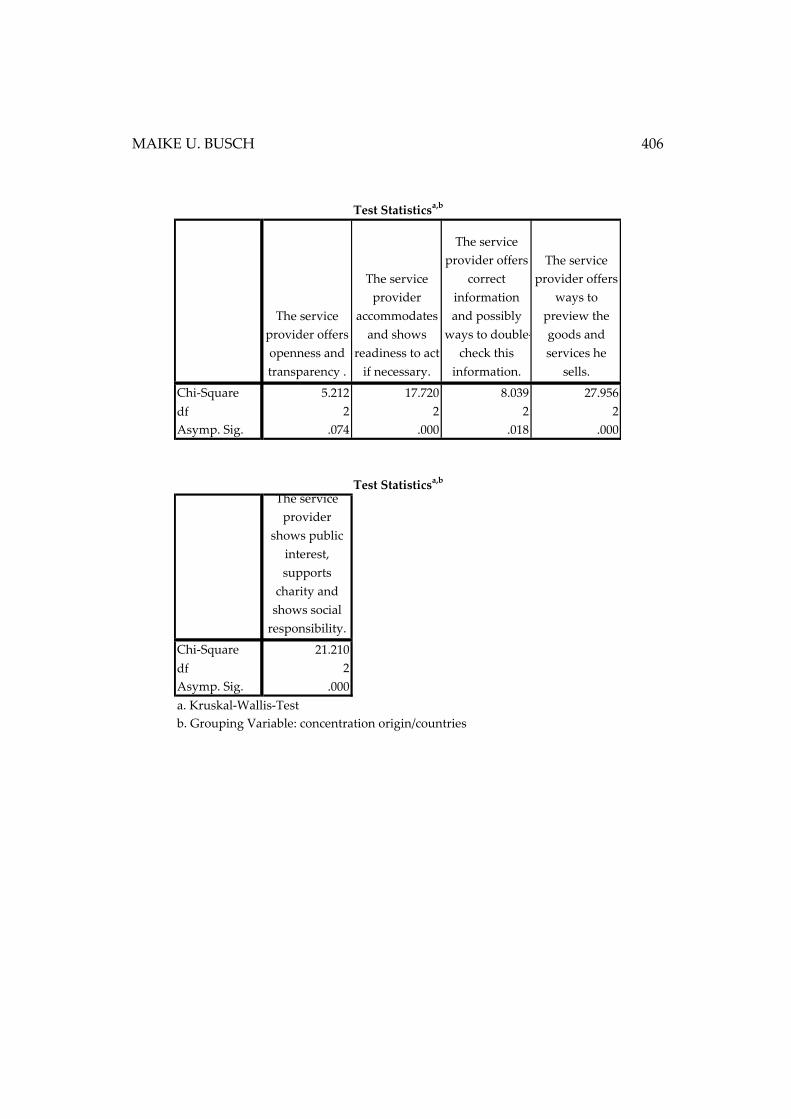
MAIKE U. BUSCH 406
The service
provider offers
openness and
transparency .
The service
provider
accommodates
and shows
readiness to act
if necessary.
The service
provider offers
correct
information
and possibly
ways to double-
check this
information.
The service
provider offers
ways to
preview the
goods and
services he
sells.
Chi-Square 5.212 17.720 8.039 27.956
df 2 2 2 2
Asymp. Sig. .074 .000 .018 .000
The service
provider
shows public
interest,
supports
charity and
shows social
responsibility.
Chi-Square 21.210
df 2
Asymp. Sig. .000
Test Statisticsa,b
a. Kruskal-Wallis-Test
b. Grouping Variable: concentration origin/countries
Test Statisticsa,b
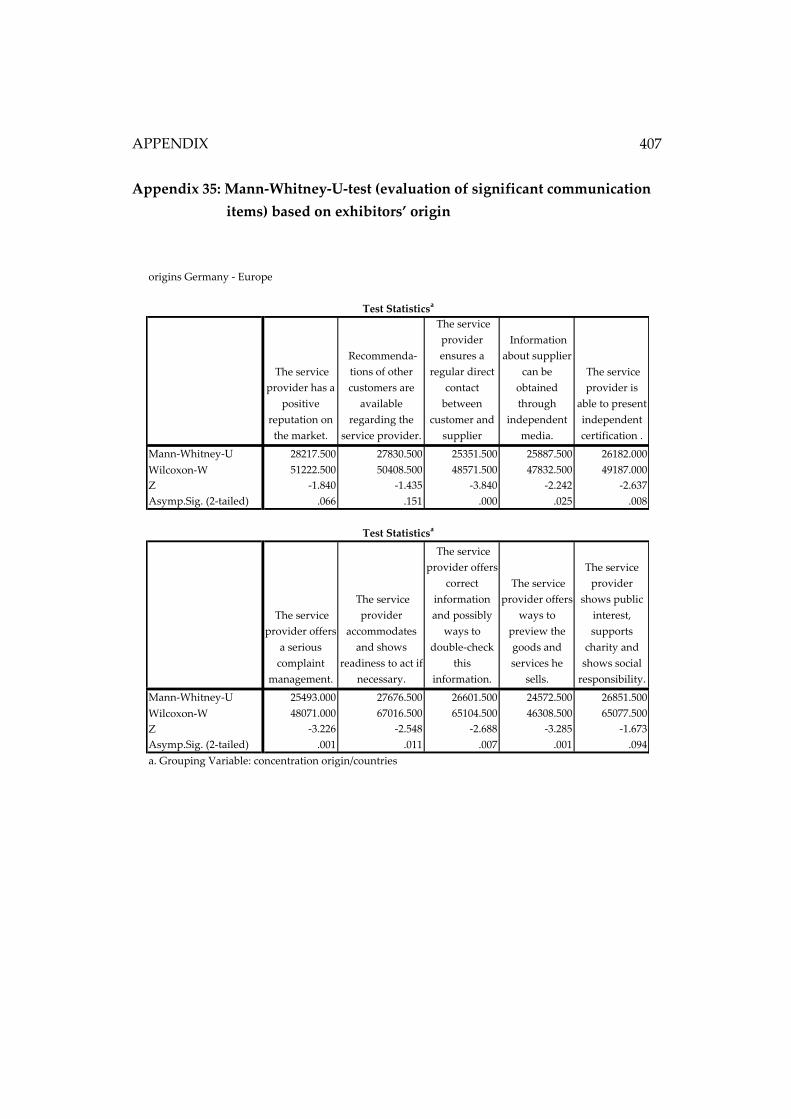
APPENDIX
407
Appendix 35: Mann-Whitney-U-test (evaluation of significant communication
items) based on exhibitors’ origin
origins Germany - Europe
The service
provider has a
positive
reputation on
the market.
Recommenda-
tions of other
customers are
available
regarding the
service provider.
The service
provider
ensures a
regular direct
contact
between
customer and
supplier
Information
about supplier
can be
obtained
through
independent
media.
The service
provider is
able to present
independent
certification .
Mann-Whitney-U 28217.500 27830.500 25351.500 25887.500 26182.000
Wilcoxon-W 51222.500 50408.500 48571.500 47832.500 49187.000
Z -1.840 -1.435 -3.840 -2.242 -2.637
Asymp.Sig. (2-tailed) .066 .151 .000 .025 .008
The service
provider offers
a serious
complaint
management.
The service
provider
accommodates
and shows
readiness to act if
necessary.
The service
provider offers
correct
information
and possibly
ways to
double-check
this
information.
The service
provider offers
ways to
preview the
goods and
services he
sells.
The service
provider
shows public
interest,
supports
charity and
shows social
responsibility.
Mann-Whitney-U 25493.000 27676.500 26601.500 24572.500 26851.500
Wilcoxon-W 48071.000 67016.500 65104.500 46308.500 65077.500
Z -3.226 -2.548 -2.688 -3.285 -1.673
Asymp.Sig. (2-tailed) .001 .011 .007 .001 .094
Test Statisticsa
Test Statisticsa
a. Grouping Variable: concentration origin/countries
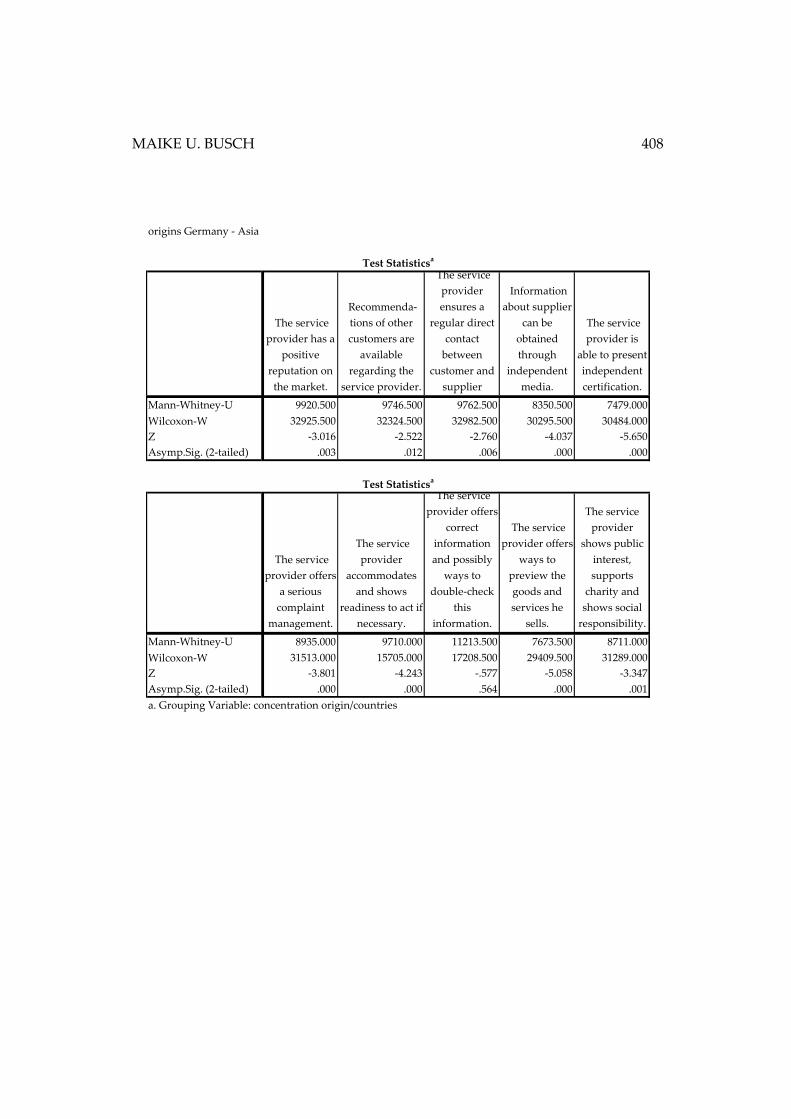
MAIKE U. BUSCH 408
origins Germany - Asia
The service
provider has a
positive
reputation on
the market.
Recommenda-
tions of other
customers are
available
regarding the
service provider.
The service
provider
ensures a
regular direct
contact
between
customer and
supplier
Information
about supplier
can be
obtained
through
independent
media.
The service
provider is
able to present
independent
certification.
Mann-Whitney-U 9920.500 9746.500 9762.500 8350.500 7479.000
Wilcoxon-W 32925.500 32324.500 32982.500 30295.500 30484.000
Z -3.016 -2.522 -2.760 -4.037 -5.650
Asymp.Sig. (2-tailed) .003 .012 .006 .000 .000
The service
provider offers
a serious
complaint
management.
The service
provider
accommodates
and shows
readiness to act if
necessary.
The service
provider offers
correct
information
and possibly
ways to
double-check
this
information.
The service
provider offers
ways to
preview the
goods and
services he
sells.
The service
provider
shows public
interest,
supports
charity and
shows social
responsibility.
Mann-Whitney-U 8935.000 9710.000 11213.500 7673.500 8711.000
Wilcoxon-W 31513.000 15705.000 17208.500 29409.500 31289.000
Z -3.801 -4.243 -.577 -5.058 -3.347
Asymp.Sig. (2-tailed) .000 .000 .564 .000 .001
Test Statisticsa
Test Statisticsa
a. Grouping Variable: concentration origin/countries
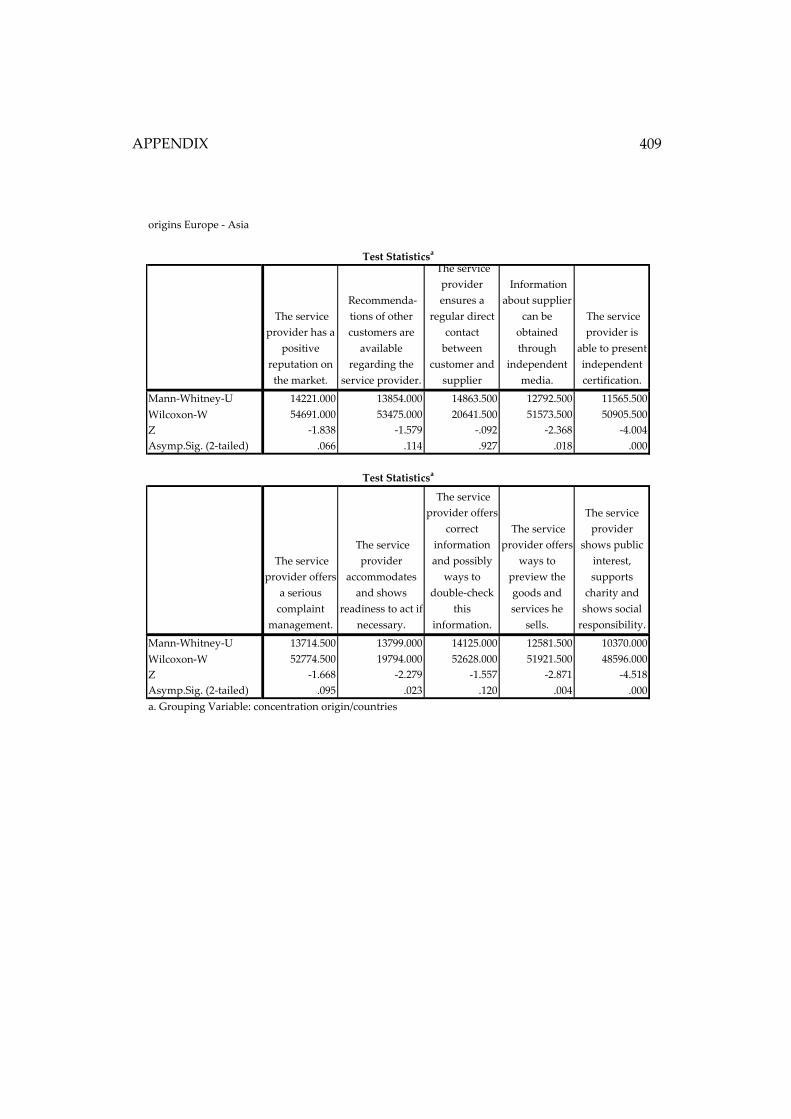
APPENDIX
409
origins Europe - Asia
The service
provider has a
positive
reputation on
the market.
Recommenda-
tions of other
customers are
available
regarding the
service provider.
The service
provider
ensures a
regular direct
contact
between
customer and
supplier
Information
about supplier
can be
obtained
through
independent
media.
The service
provider is
able to present
independent
certification.
Mann-Whitney-U 14221.000 13854.000 14863.500 12792.500 11565.500
Wilcoxon-W 54691.000 53475.000 20641.500 51573.500 50905.500
Z -1.838 -1.579 -.092 -2.368 -4.004
Asymp.Sig. (2-tailed) .066 .114 .927 .018 .000
The service
provider offers
a serious
complaint
management.
The service
provider
accommodates
and shows
readiness to act if
necessary.
The service
provider offers
correct
information
and possibly
ways to
double-check
this
information.
The service
provider offers
ways to
preview the
goods and
services he
sells.
The service
provider
shows public
interest,
supports
charity and
shows social
responsibility.
Mann-Whitney-U 13714.500 13799.000 14125.000 12581.500 10370.000
Wilcoxon-W 52774.500 19794.000 52628.000 51921.500 48596.000
Z -1.668 -2.279 -1.557 -2.871 -4.518
Asymp.Sig. (2-tailed) .095 .023 .120 .004 .000
Test Statisticsa
Test Statisticsa
a. Grouping Variable: concentration origin/countries
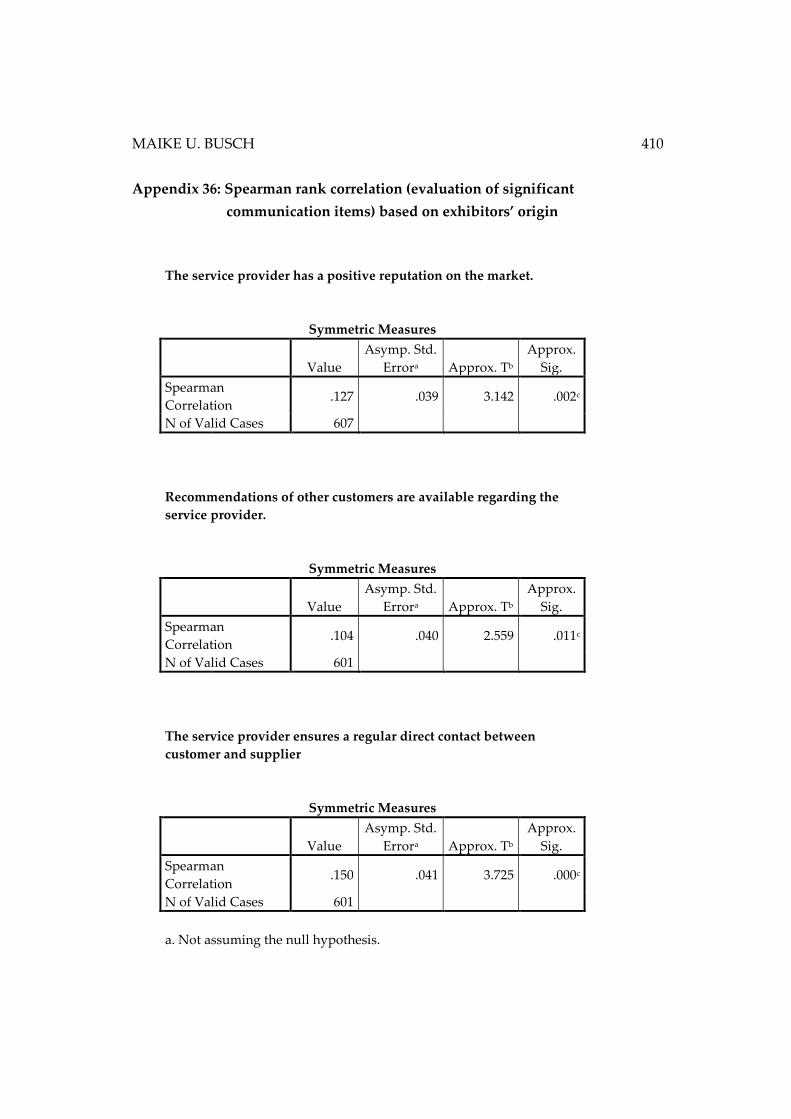
MAIKE U. BUSCH 410
Appendix 36: Spearman rank correlation (evaluation of significant
communication items) based on exhibitors’ origin
The service provider has a positive reputation on the market.
Symmetric Measures
Value
Asymp. Std.
Errora Approx. Tb
Approx.
Sig.
Spearman
Correlation .127 .039 3.142 .002c
N of Valid Cases 607
Recommendations of other customers are available regarding the
service provider.
Symmetric Measures
Value
Asymp. Std.
Errora Approx. Tb
Approx.
Sig.
Spearman
Correlation .104 .040 2.559 .011c
N of Valid Cases 601
The service provider ensures a regular direct contact between
customer and supplier
Symmetric Measures
Value
Asymp. Std.
Errora Approx. Tb
Approx.
Sig.
Spearman
Correlation .150 .041 3.725 .000c
N of Valid Cases 601
a. Not assuming the null hypothesis.

APPENDIX
411
b. Using the asymtotic standard error assuming the null hypothesis.
c. Based on normal approximation.
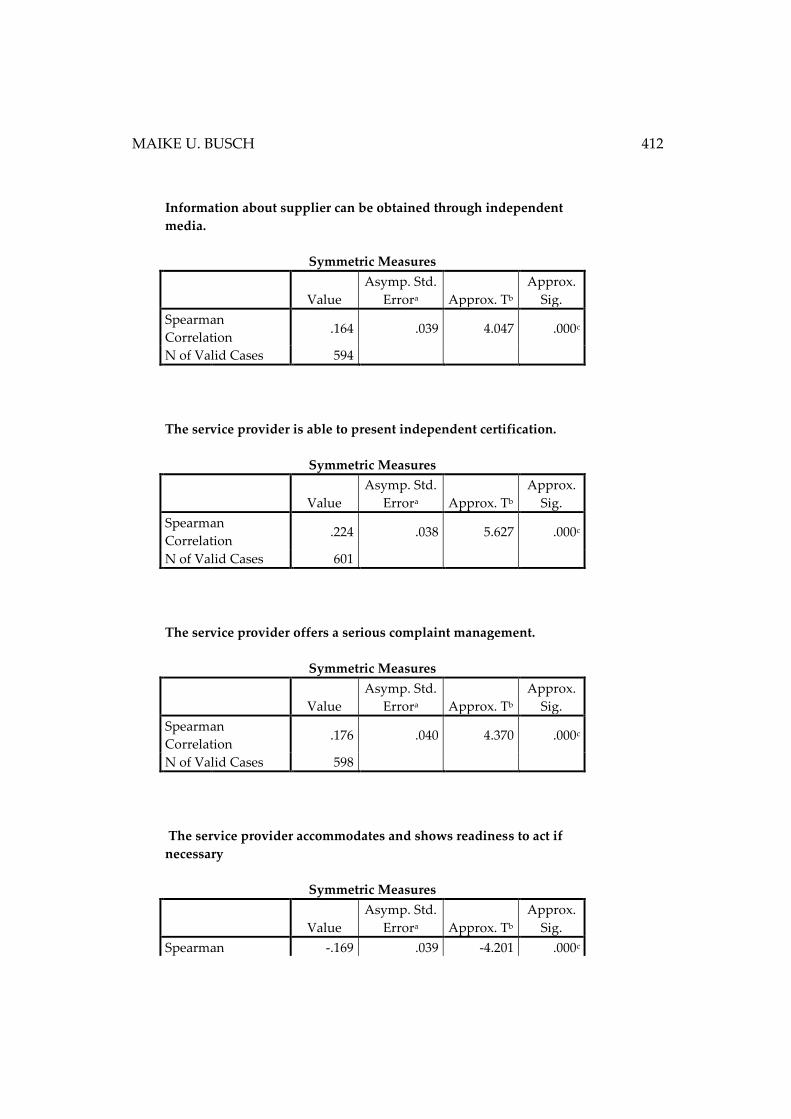
MAIKE U. BUSCH 412
Information about supplier can be obtained through independent
media.
Symmetric Measures
Value
Asymp. Std.
Errora Approx. Tb
Approx.
Sig.
Spearman
Correlation .164 .039 4.047 .000c
N of Valid Cases 594
The service provider is able to present independent certification.
Symmetric Measures
Value
Asymp. Std.
Errora Approx. Tb
Approx.
Sig.
Spearman
Correlation .224 .038 5.627 .000c
N of Valid Cases 601
The service provider offers a serious complaint management.
Symmetric Measures
Value
Asymp. Std.
Errora Approx. Tb
Approx.
Sig.
Spearman
Correlation .176 .040 4.370 .000c
N of Valid Cases 598
The service provider accommodates and shows readiness to act if
necessary
Symmetric Measures
Value
Asymp. Std.
Errora Approx. Tb
Approx.
Sig.
Spearman -.169 .039 -4.201 .000c
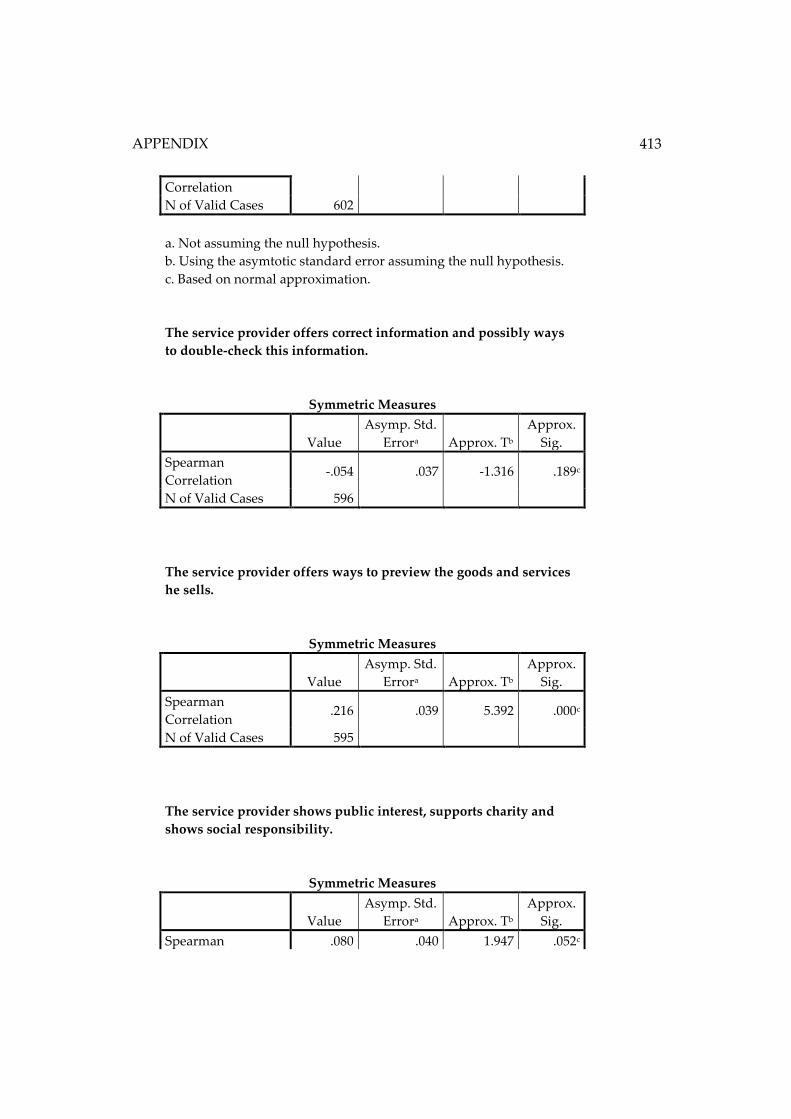
APPENDIX
413
Correlation
N of Valid Cases 602
a. Not assuming the null hypothesis.
b. Using the asymtotic standard error assuming the null hypothesis.
c. Based on normal approximation.
The service provider offers correct information and possibly ways
to double-check this information.
Symmetric Measures
Value
Asymp. Std.
Errora Approx. Tb
Approx.
Sig.
Spearman
Correlation -.054 .037 -1.316 .189c
N of Valid Cases 596
The service provider offers ways to preview the goods and services
he sells.
Symmetric Measures
Value
Asymp. Std.
Errora Approx. Tb
Approx.
Sig.
Spearman
Correlation .216 .039 5.392 .000c
N of Valid Cases 595
The service provider shows public interest, supports charity and
shows social responsibility.
Symmetric Measures
Value
Asymp. Std.
Errora Approx. Tb
Approx.
Sig.
Spearman .080 .040 1.947 .052c

MAIKE U. BUSCH 414
Correlation
N of Valid Cases 592
a. Not assuming the null hypothesis.
b. Using the asymtotic standard error assuming the null hypothesis.
c. Based on normal approximation.
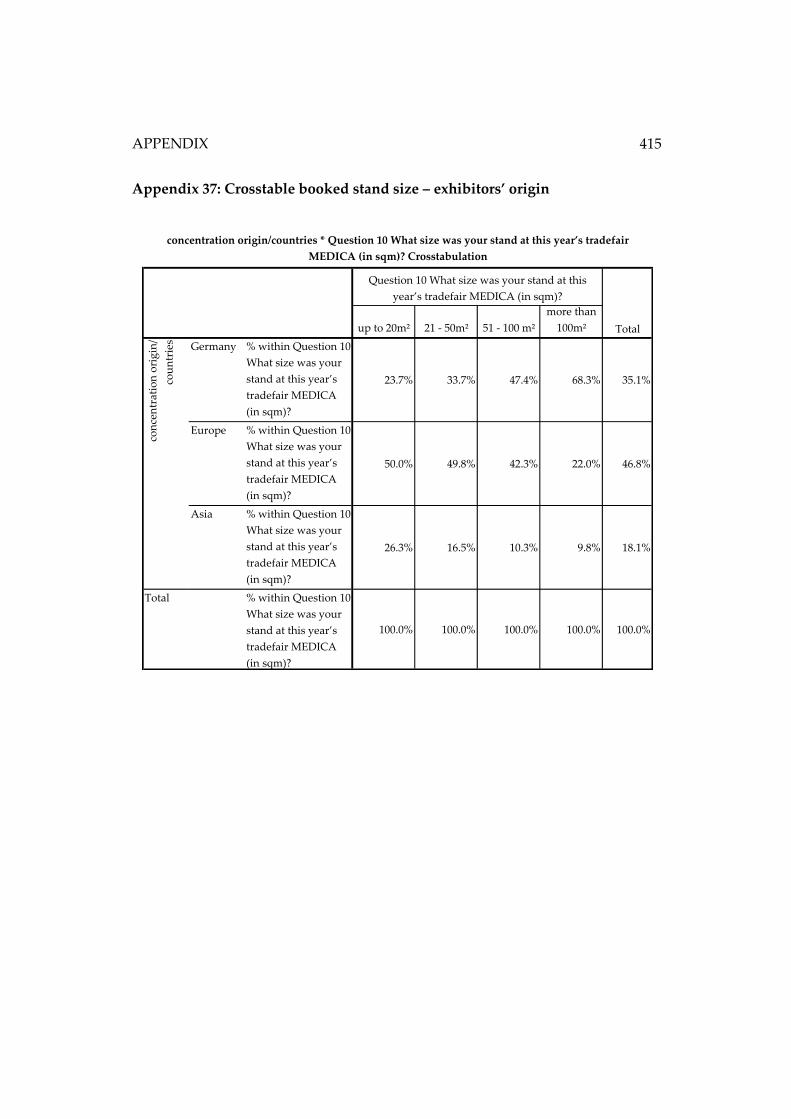
APPENDIX
415
Appendix 37: Crosstable booked stand size – exhibitors’ origin
up to 20m² 21 - 50m² 51 - 100 m²
more than
100m²
Germany % within Question 10
What size was your
stand at this year’s
tradefair MEDICA
(in sqm)?
23.7% 33.7% 47.4% 68.3% 35.1%
Europe % within Question 10
What size was your
stand at this year’s
tradefair MEDICA
(in sqm)?
50.0% 49.8% 42.3% 22.0% 46.8%
Asia % within Question 10
What size was your
stand at this year’s
tradefair MEDICA
(in sqm)?
26.3% 16.5% 10.3% 9.8% 18.1%
Total % within Question 10
What size was your
stand at this year’s
tradefair MEDICA
(in sqm)?
100.0% 100.0% 100.0% 100.0% 100.0%
con
cen
trat
ion
ori
gin
/
cou
ntr
ies
concentration origin/countries * Question 10 What size was your stand at this year’s tradefair
MEDICA (in sqm)? Crosstabulation
Question 10 What size was your stand at this
year’s tradefair MEDICA (in sqm)?
Total
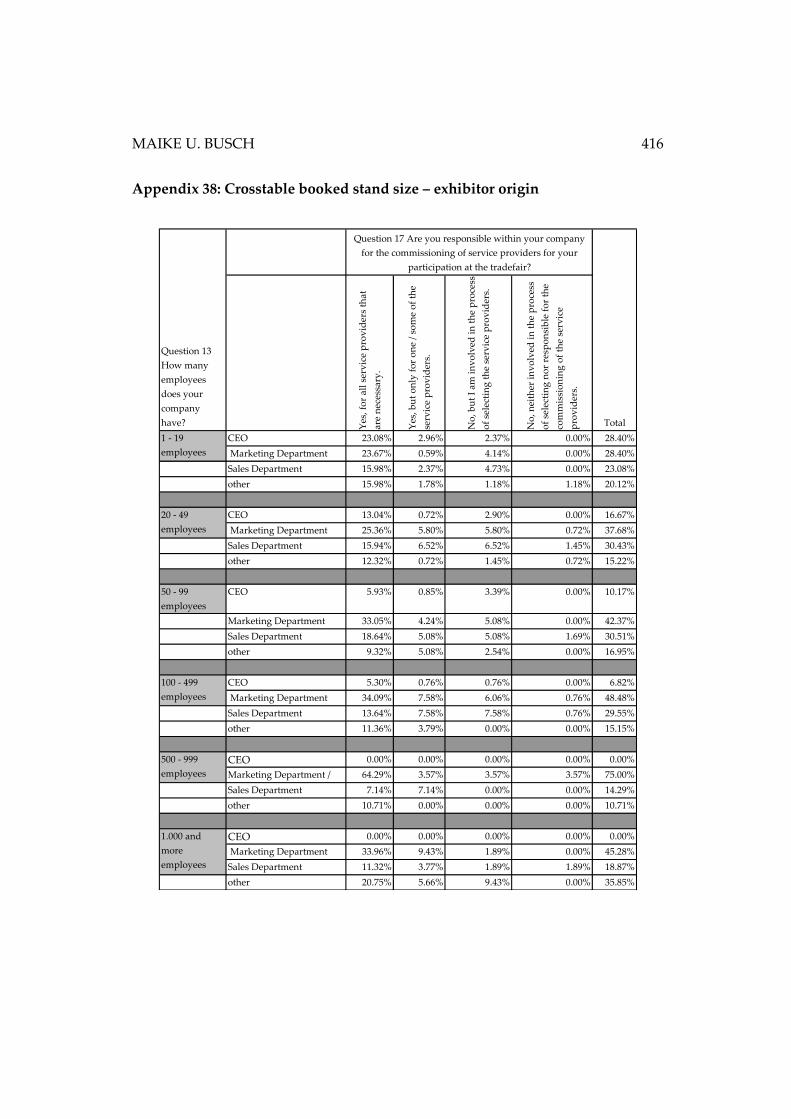
MAIKE U. BUSCH 416
Appendix 38: Crosstable booked stand size – exhibitor origin
Yes
, fo
r al
l se
rvic
e p
rov
ider
s th
at
are
nec
essa
ry.
Yes
, bu
t o
nly
fo
r o
ne
/ so
me
of
the
serv
ice
pro
vid
ers.
No
, bu
t I
am i
nv
olv
ed i
n t
he
pro
cess
of
sele
ctin
g t
he
serv
ice
pro
vid
ers.
No
, nei
ther
in
vo
lved
in
th
e p
roce
ss
of
sele
ctin
g n
or
resp
on
sib
le f
or
the
com
mis
sio
nin
g o
f th
e se
rvic
e
pro
vid
ers.
CEO 23.08% 2.96% 2.37% 0.00% 28.40%
Marketing Department 23.67% 0.59% 4.14% 0.00% 28.40%
Sales Department 15.98% 2.37% 4.73% 0.00% 23.08%
other 15.98% 1.78% 1.18% 1.18% 20.12%
CEO 13.04% 0.72% 2.90% 0.00% 16.67%
Marketing Department 25.36% 5.80% 5.80% 0.72% 37.68%
Sales Department 15.94% 6.52% 6.52% 1.45% 30.43%
other 12.32% 0.72% 1.45% 0.72% 15.22%
50 - 99
employees
CEO 5.93% 0.85% 3.39% 0.00% 10.17%
Marketing Department 33.05% 4.24% 5.08% 0.00% 42.37%
Sales Department 18.64% 5.08% 5.08% 1.69% 30.51%
other 9.32% 5.08% 2.54% 0.00% 16.95%
CEO 5.30% 0.76% 0.76% 0.00% 6.82%
Marketing Department 34.09% 7.58% 6.06% 0.76% 48.48%
Sales Department 13.64% 7.58% 7.58% 0.76% 29.55%
other 11.36% 3.79% 0.00% 0.00% 15.15%
CEO 0.00% 0.00% 0.00% 0.00% 0.00%
Marketing Department / 64.29% 3.57% 3.57% 3.57% 75.00%
Sales Department 7.14% 7.14% 0.00% 0.00% 14.29%
other 10.71% 0.00% 0.00% 0.00% 10.71%
CEO 0.00% 0.00% 0.00% 0.00% 0.00%
Marketing Department 33.96% 9.43% 1.89% 0.00% 45.28%
Sales Department 11.32% 3.77% 1.89% 1.89% 18.87%
other 20.75% 5.66% 9.43% 0.00% 35.85%
20 - 49
employees
100 - 499
employees
500 - 999
employees
1.000 and
more
employees
Question 17 Are you responsible within your company
for the commissioning of service providers for your
participation at the tradefair?
Total
Question 13
How many
employees
does your
company
have?
1 - 19
employees
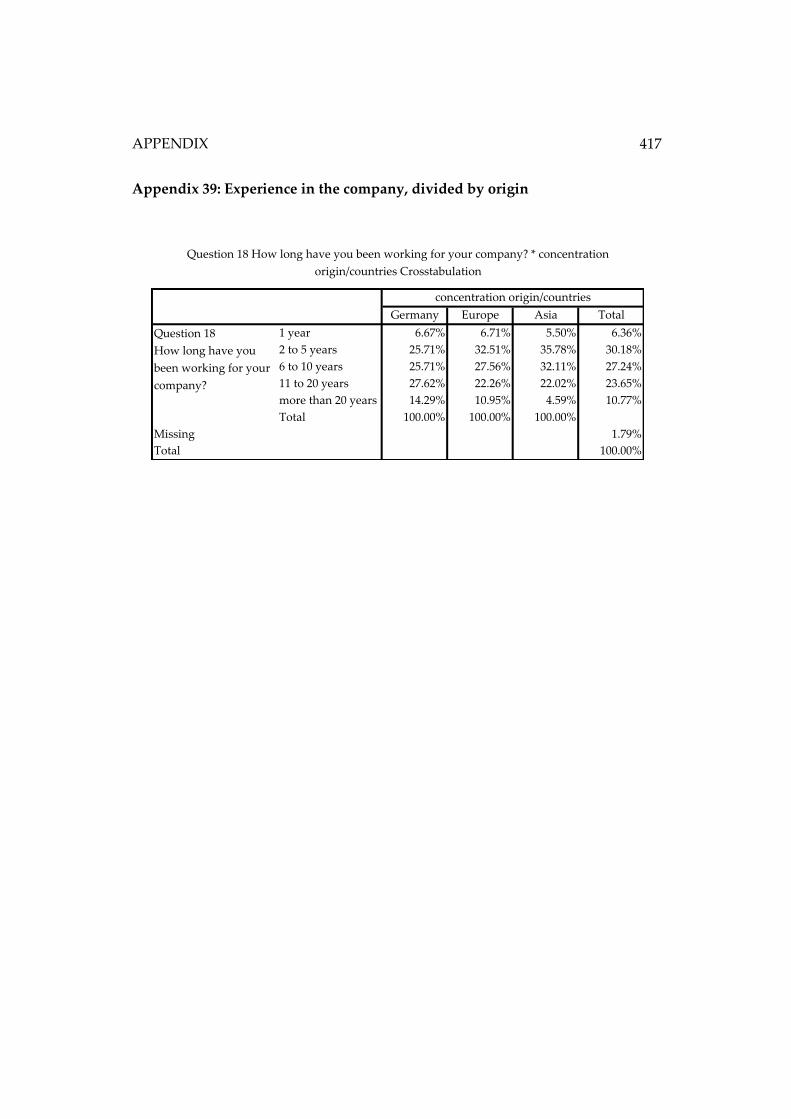
APPENDIX
417
Appendix 39: Experience in the company, divided by origin
Germany Europe Asia Total
1 year 6.67% 6.71% 5.50% 6.36%
2 to 5 years 25.71% 32.51% 35.78% 30.18%
6 to 10 years 25.71% 27.56% 32.11% 27.24%
11 to 20 years 27.62% 22.26% 22.02% 23.65%
more than 20 years 14.29% 10.95% 4.59% 10.77%
Total 100.00% 100.00% 100.00%
Missing 1.79%
Total 100.00%
Question 18
How long have you
been working for your
company?
concentration origin/countries
Question 18 How long have you been working for your company? * concentration
origin/countries Crosstabulation
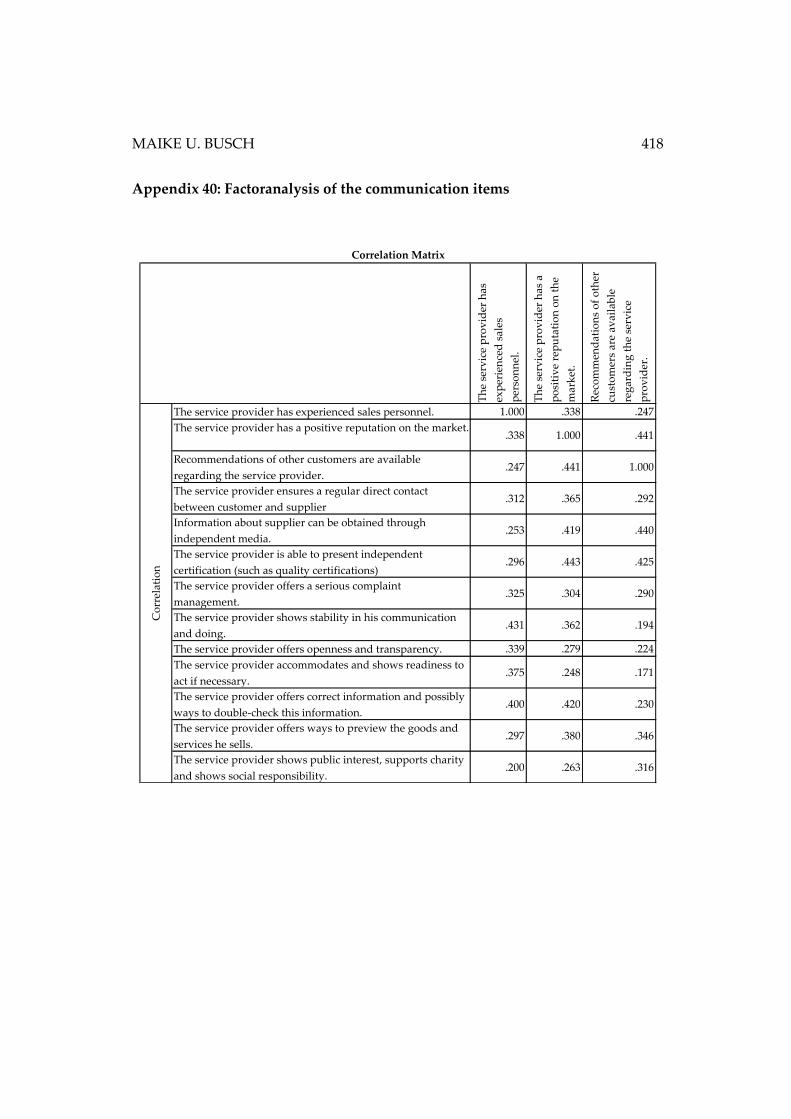
MAIKE U. BUSCH 418
Appendix 40: Factoranalysis of the communication items
Th
e se
rvic
e p
rov
ider
has
exp
erie
nce
d s
ales
per
son
nel
.
Th
e se
rvic
e p
rov
ider
has
a
po
siti
ve
rep
uta
tio
n o
n t
he
mar
ket
.
Rec
om
men
dat
ion
s o
f o
ther
cust
om
ers
are
avai
lab
le
reg
ard
ing
th
e se
rvic
e
pro
vid
er.
The service provider has experienced sales personnel. 1.000 .338 .247
The service provider has a positive reputation on the market..338 1.000 .441
Recommendations of other customers are available
regarding the service provider..247 .441 1.000
The service provider ensures a regular direct contact
between customer and supplier.312 .365 .292
Information about supplier can be obtained through
independent media..253 .419 .440
The service provider is able to present independent
certification (such as quality certifications).296 .443 .425
The service provider offers a serious complaint
management..325 .304 .290
The service provider shows stability in his communication
and doing..431 .362 .194
The service provider offers openness and transparency. .339 .279 .224
The service provider accommodates and shows readiness to
act if necessary..375 .248 .171
The service provider offers correct information and possibly
ways to double-check this information..400 .420 .230
The service provider offers ways to preview the goods and
services he sells..297 .380 .346
The service provider shows public interest, supports charity
and shows social responsibility..200 .263 .316
Co
rrel
atio
n
Correlation Matrix
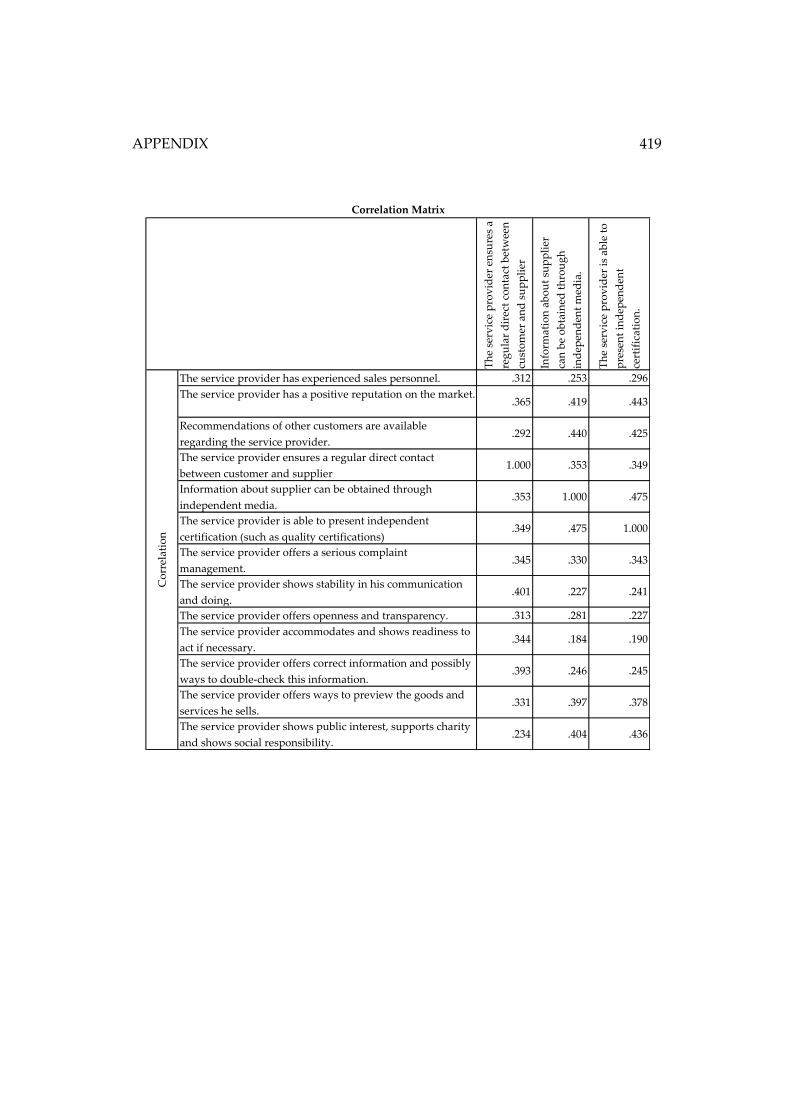
APPENDIX
419
Th
e se
rvic
e p
rov
ider
en
sure
s a
reg
ula
r d
irec
t co
nta
ct b
etw
een
cust
om
er a
nd
su
pp
lier
Info
rmat
ion
ab
ou
t su
pp
lier
can
be
ob
tain
ed t
hro
ug
h
ind
epen
den
t m
edia
.
Th
e se
rvic
e p
rov
ider
is
able
to
pre
sen
t in
dep
end
ent
cert
ific
atio
n.
The service provider has experienced sales personnel. .312 .253 .296
The service provider has a positive reputation on the market..365 .419 .443
Recommendations of other customers are available
regarding the service provider..292 .440 .425
The service provider ensures a regular direct contact
between customer and supplier1.000 .353 .349
Information about supplier can be obtained through
independent media..353 1.000 .475
The service provider is able to present independent
certification (such as quality certifications).349 .475 1.000
The service provider offers a serious complaint
management..345 .330 .343
The service provider shows stability in his communication
and doing..401 .227 .241
The service provider offers openness and transparency. .313 .281 .227
The service provider accommodates and shows readiness to
act if necessary..344 .184 .190
The service provider offers correct information and possibly
ways to double-check this information..393 .246 .245
The service provider offers ways to preview the goods and
services he sells..331 .397 .378
The service provider shows public interest, supports charity
and shows social responsibility..234 .404 .436
Correlation Matrix
Co
rrel
atio
n

MAIKE U. BUSCH 420
Th
e se
rvic
e p
rov
ider
off
ers
a se
rio
us
com
pla
int
man
agem
ent.
Th
e se
rvic
e p
rov
ider
sh
ow
s
stab
ilit
y i
n h
is
com
mu
nic
atio
n a
nd
do
ing
.
Th
e se
rvic
e p
rov
ider
off
ers
op
enn
ess
and
tra
nsp
aren
cy
.
The service provider has experienced sales personnel. .325 .431 .339
The service provider has a positive reputation on the market..304 .362 .279
Recommendations of other customers are available
regarding the service provider..290 .194 .224
The service provider ensures a regular direct contact
between customer and supplier.345 .401 .313
Information about supplier can be obtained through
independent media..330 .227 .281
The service provider is able to present independent
certification (such as quality certifications).343 .241 .227
The service provider offers a serious complaint
management.1.000 .337 .350
The service provider shows stability in his communication
and doing..337 1.000 .453
The service provider offers openness and transparency. .350 .453 1.000
The service provider accommodates and shows readiness to
act if necessary..241 .510 .501
The service provider offers correct information and possibly
ways to double-check this information..324 .515 .435
The service provider offers ways to preview the goods and
services he sells..297 .254 .227
The service provider shows public interest, supports charity
and shows social responsibility..245 .243 .217
Correlation Matrix
Co
rrel
atio
n
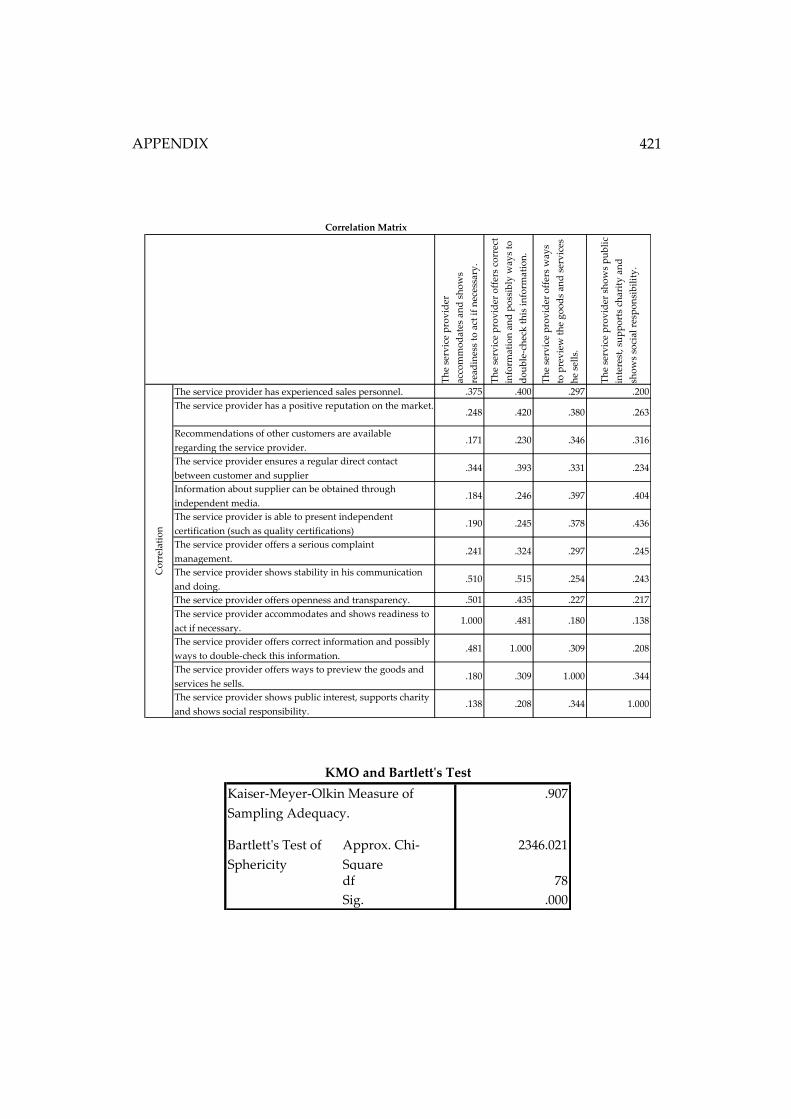
APPENDIX
421
Th
e se
rvic
e p
rov
ider
acco
mm
od
ates
an
d s
ho
ws
read
ines
s to
act
if
nec
essa
ry.
Th
e se
rvic
e p
rov
ider
off
ers
corr
ect
info
rmat
ion
an
d p
oss
ibly
way
s to
do
ub
le-c
hec
k t
his
in
form
atio
n.
Th
e se
rvic
e p
rov
ider
off
ers
way
s
to p
rev
iew
th
e g
oo
ds
and
ser
vic
es
he
sell
s.
Th
e se
rvic
e p
rov
ider
sh
ow
s p
ub
lic
inte
rest
, su
pp
ort
s ch
arit
y a
nd
sho
ws
soci
al r
esp
on
sib
ilit
y.
The service provider has experienced sales personnel. .375 .400 .297 .200
The service provider has a positive reputation on the market..248 .420 .380 .263
Recommendations of other customers are available
regarding the service provider..171 .230 .346 .316
The service provider ensures a regular direct contact
between customer and supplier.344 .393 .331 .234
Information about supplier can be obtained through
independent media..184 .246 .397 .404
The service provider is able to present independent
certification (such as quality certifications).190 .245 .378 .436
The service provider offers a serious complaint
management..241 .324 .297 .245
The service provider shows stability in his communication
and doing..510 .515 .254 .243
The service provider offers openness and transparency. .501 .435 .227 .217
The service provider accommodates and shows readiness to
act if necessary.1.000 .481 .180 .138
The service provider offers correct information and possibly
ways to double-check this information..481 1.000 .309 .208
The service provider offers ways to preview the goods and
services he sells..180 .309 1.000 .344
The service provider shows public interest, supports charity
and shows social responsibility..138 .208 .344 1.000
Co
rrel
atio
n
Correlation Matrix
.907
Approx. Chi-
Square
2346.021
df 78
Sig. .000
KMO and Bartlett's Test
Kaiser-Meyer-Olkin Measure of
Sampling Adequacy.
Bartlett's Test of
Sphericity
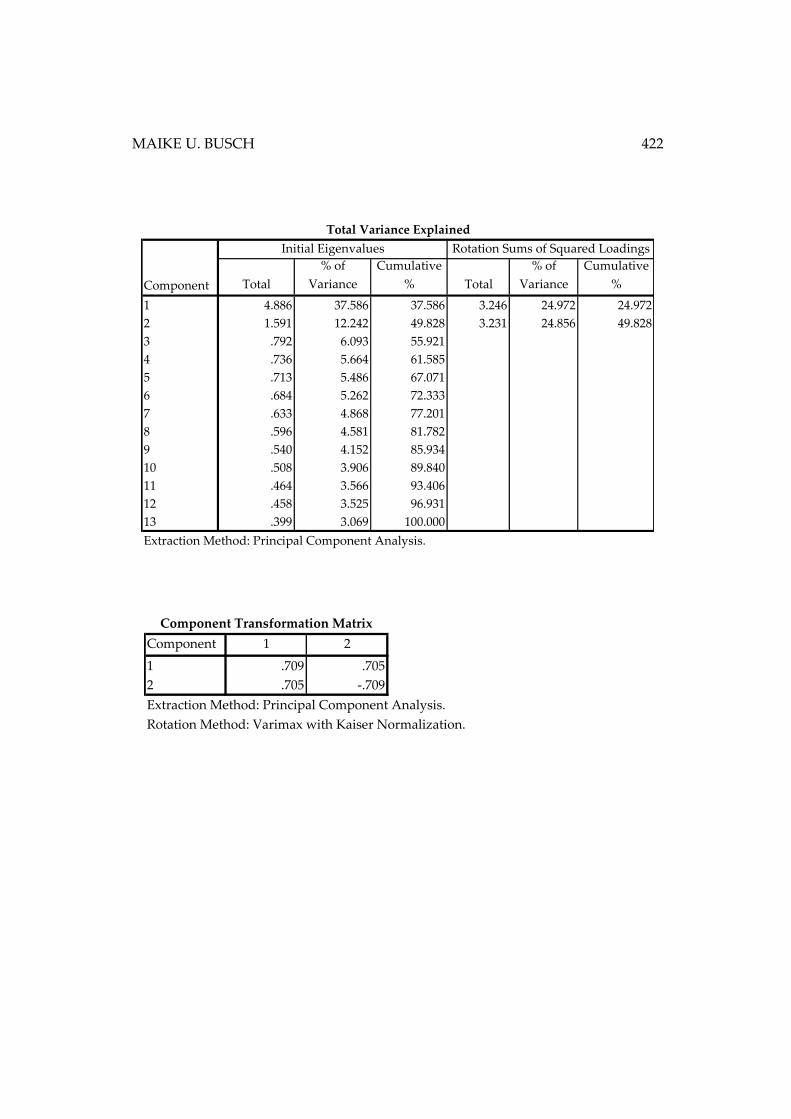
MAIKE U. BUSCH 422
Total
% of
Variance
Cumulative
% Total
% of
Variance
Cumulative
%
1 4.886 37.586 37.586 3.246 24.972 24.972
2 1.591 12.242 49.828 3.231 24.856 49.828
3 .792 6.093 55.921
4 .736 5.664 61.585
5 .713 5.486 67.071
6 .684 5.262 72.333
7 .633 4.868 77.201
8 .596 4.581 81.782
9 .540 4.152 85.934
10 .508 3.906 89.840
11 .464 3.566 93.406
12 .458 3.525 96.931
13 .399 3.069 100.000
Extraction Method: Principal Component Analysis.
Total Variance Explained
Component
Initial Eigenvalues Rotation Sums of Squared Loadings
Component 1 2
1 .709 .705
2 .705 -.709
Component Transformation Matrix
Extraction Method: Principal Component Analysis.
Rotation Method: Varimax with Kaiser Normalization.
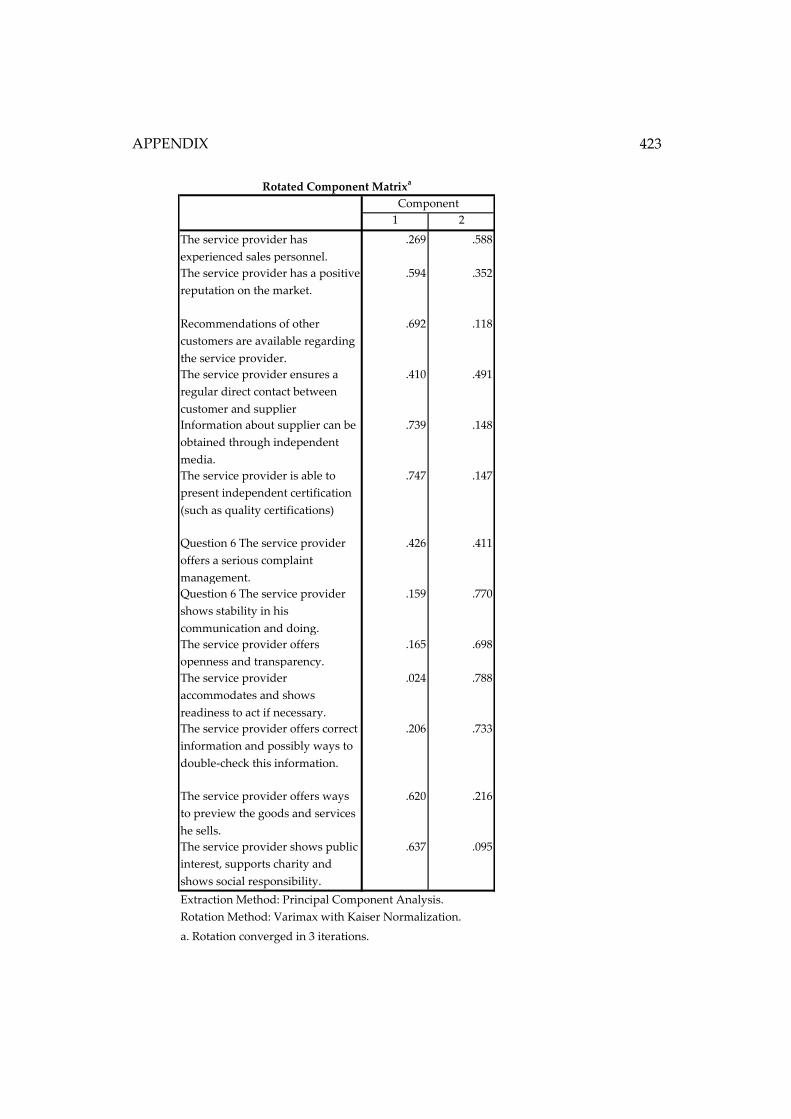
APPENDIX
423
1 2
The service provider has
experienced sales personnel.
.269 .588
The service provider has a positive
reputation on the market.
.594 .352
Recommendations of other
customers are available regarding
the service provider.
.692 .118
The service provider ensures a
regular direct contact between
customer and supplier
.410 .491
Information about supplier can be
obtained through independent
media.
.739 .148
The service provider is able to
present independent certification
(such as quality certifications)
.747 .147
Question 6 The service provider
offers a serious complaint
management.
.426 .411
Question 6 The service provider
shows stability in his
communication and doing.
.159 .770
The service provider offers
openness and transparency.
.165 .698
The service provider
accommodates and shows
readiness to act if necessary.
.024 .788
The service provider offers correct
information and possibly ways to
double-check this information.
.206 .733
The service provider offers ways
to preview the goods and services
he sells.
.620 .216
The service provider shows public
interest, supports charity and
shows social responsibility.
.637 .095
Extraction Method: Principal Component Analysis.
Rotation Method: Varimax with Kaiser Normalization.
a. Rotation converged in 3 iterations.
Rotated Component Matrixa
Component
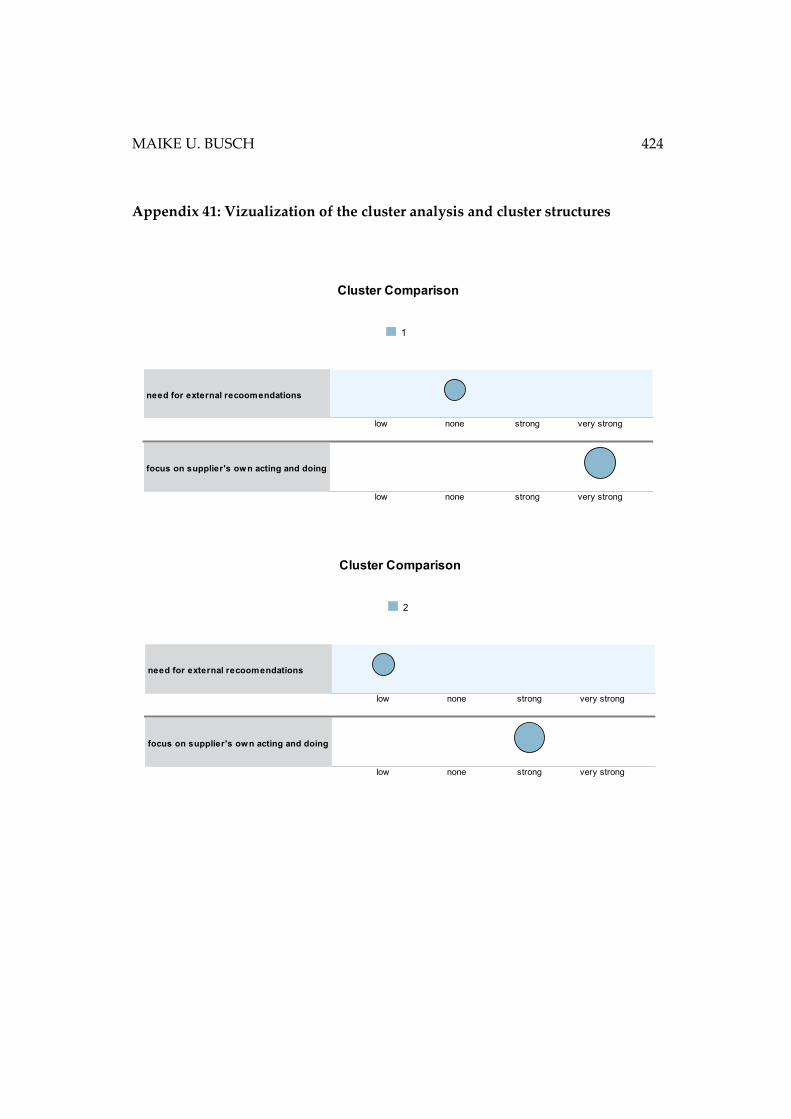
MAIKE U. BUSCH 424
Appendix 41: Vizualization of the cluster analysis and cluster structures
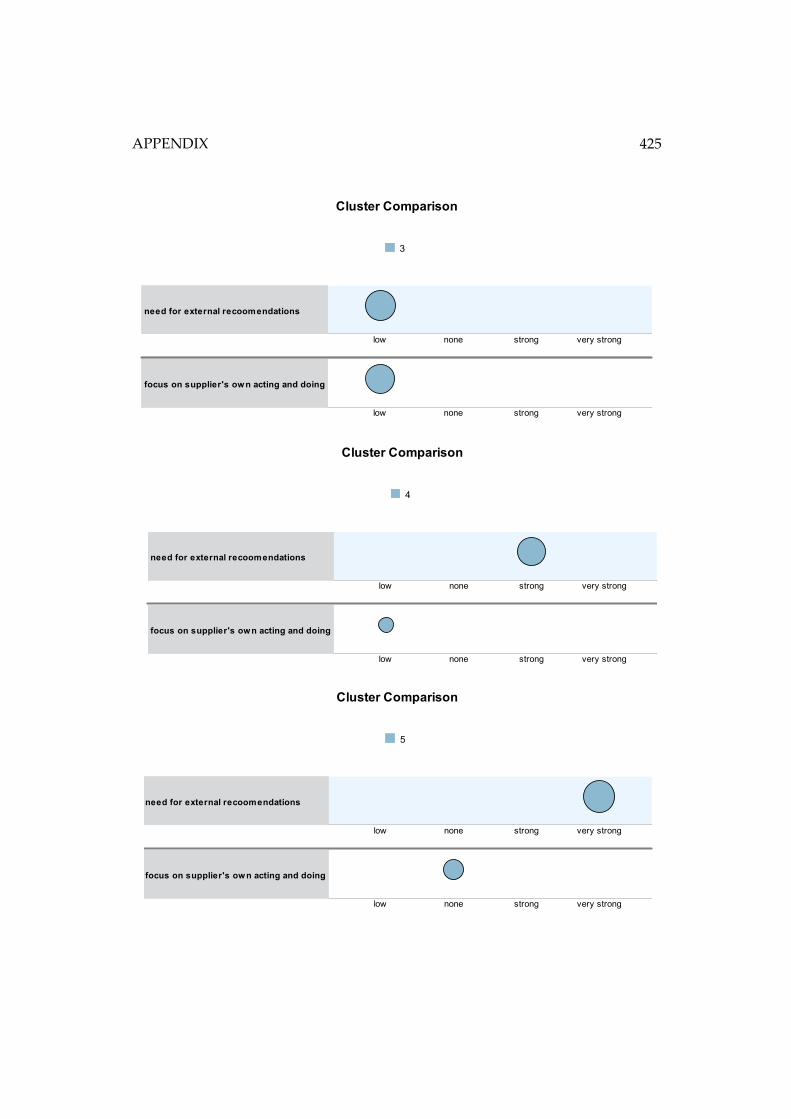
APPENDIX
425
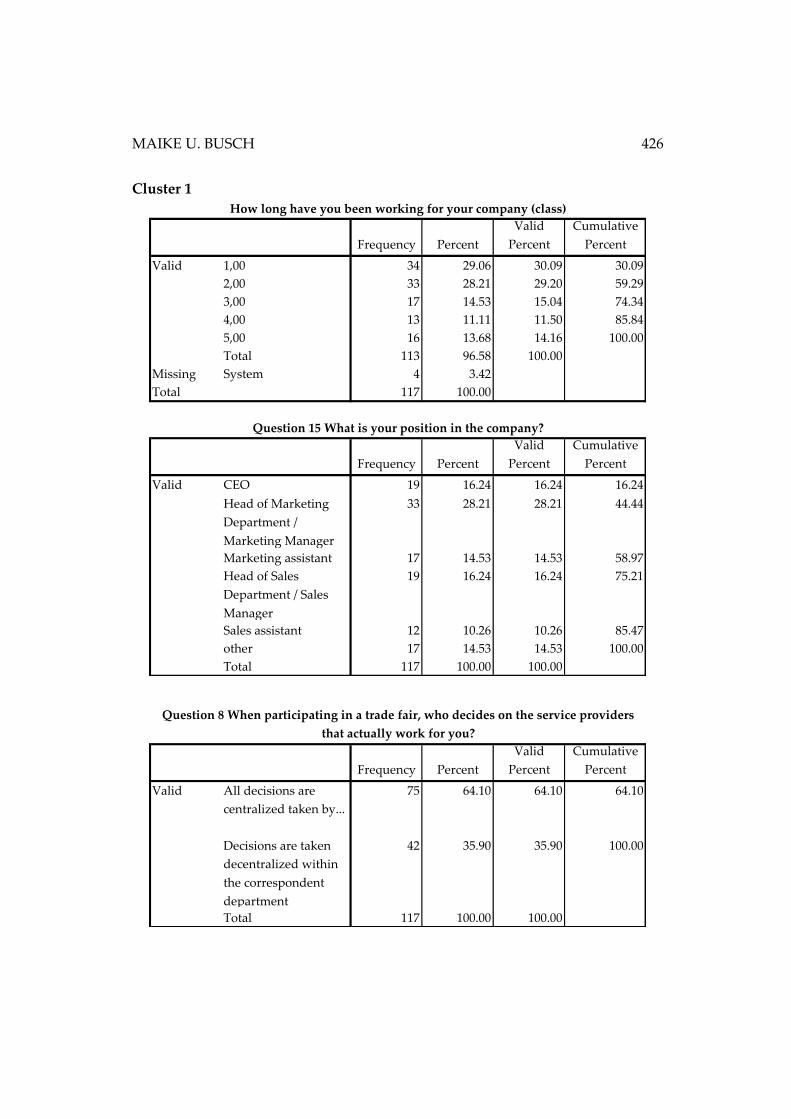
MAIKE U. BUSCH 426
Cluster 1
Frequency Percent
Valid
Percent
Cumulative
Percent
1,00 34 29.06 30.09 30.09
2,00 33 28.21 29.20 59.29
3,00 17 14.53 15.04 74.34
4,00 13 11.11 11.50 85.84
5,00 16 13.68 14.16 100.00
Total 113 96.58 100.00
Missing System 4 3.42
117 100.00
Frequency Percent
Valid
Percent
Cumulative
Percent
CEO 19 16.24 16.24 16.24
Head of Marketing
Department /
Marketing Manager
33 28.21 28.21 44.44
Marketing assistant 17 14.53 14.53 58.97
Head of Sales
Department / Sales
Manager
19 16.24 16.24 75.21
Sales assistant 12 10.26 10.26 85.47
other 17 14.53 14.53 100.00
Total 117 100.00 100.00
Valid
Question 15 What is your position in the company?
How long have you been working for your company (class)
Valid
Total
Frequency Percent
Valid
Percent
Cumulative
Percent
All decisions are
centralized taken by...
75 64.10 64.10 64.10
Decisions are taken
decentralized within
the correspondent
department
42 35.90 35.90 100.00
Total 117 100.00 100.00
Question 8 When participating in a trade fair, who decides on the service providers
that actually work for you?
Valid
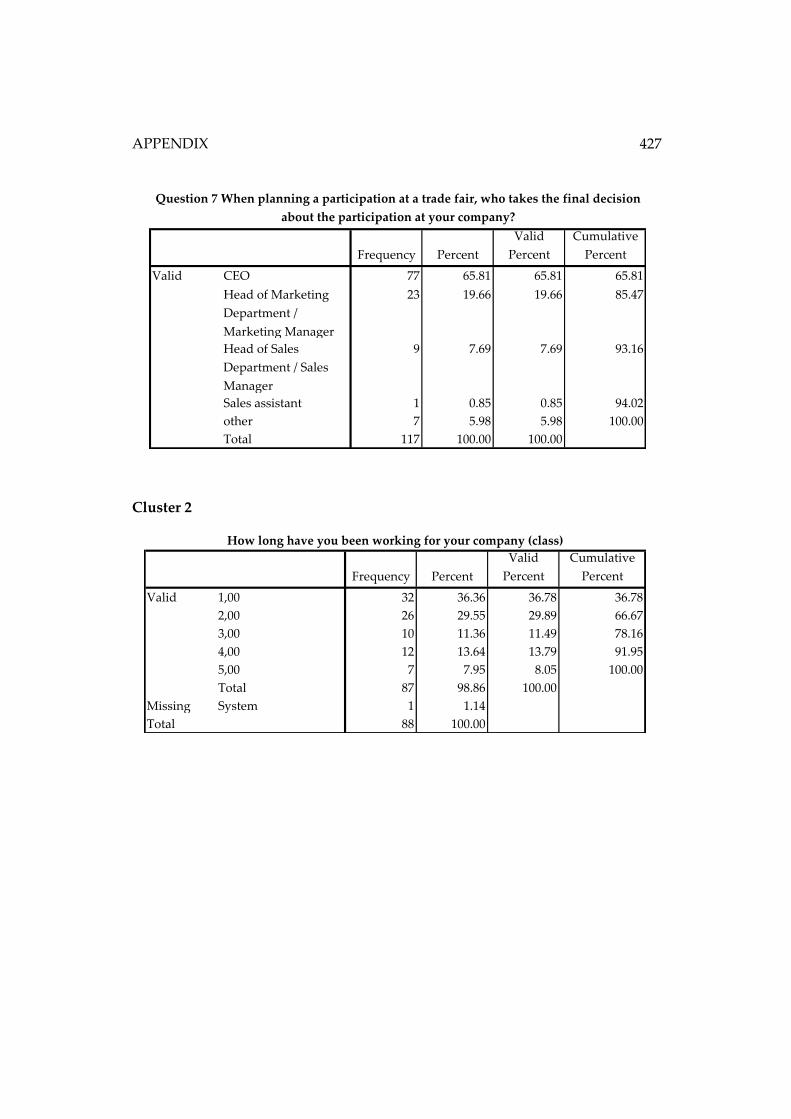
APPENDIX
427
Cluster 2
Frequency Percent
Valid
Percent
Cumulative
Percent
CEO 77 65.81 65.81 65.81
Head of Marketing
Department /
Marketing Manager
23 19.66 19.66 85.47
Head of Sales
Department / Sales
Manager
9 7.69 7.69 93.16
Sales assistant 1 0.85 0.85 94.02
other 7 5.98 5.98 100.00
Total 117 100.00 100.00
Question 7 When planning a participation at a trade fair, who takes the final decision
about the participation at your company?
Valid
Frequency Percent
Valid
Percent
Cumulative
Percent
1,00 32 36.36 36.78 36.78
2,00 26 29.55 29.89 66.67
3,00 10 11.36 11.49 78.16
4,00 12 13.64 13.79 91.95
5,00 7 7.95 8.05 100.00
Total 87 98.86 100.00
Missing System 1 1.14
88 100.00
Valid
Total
How long have you been working for your company (class)
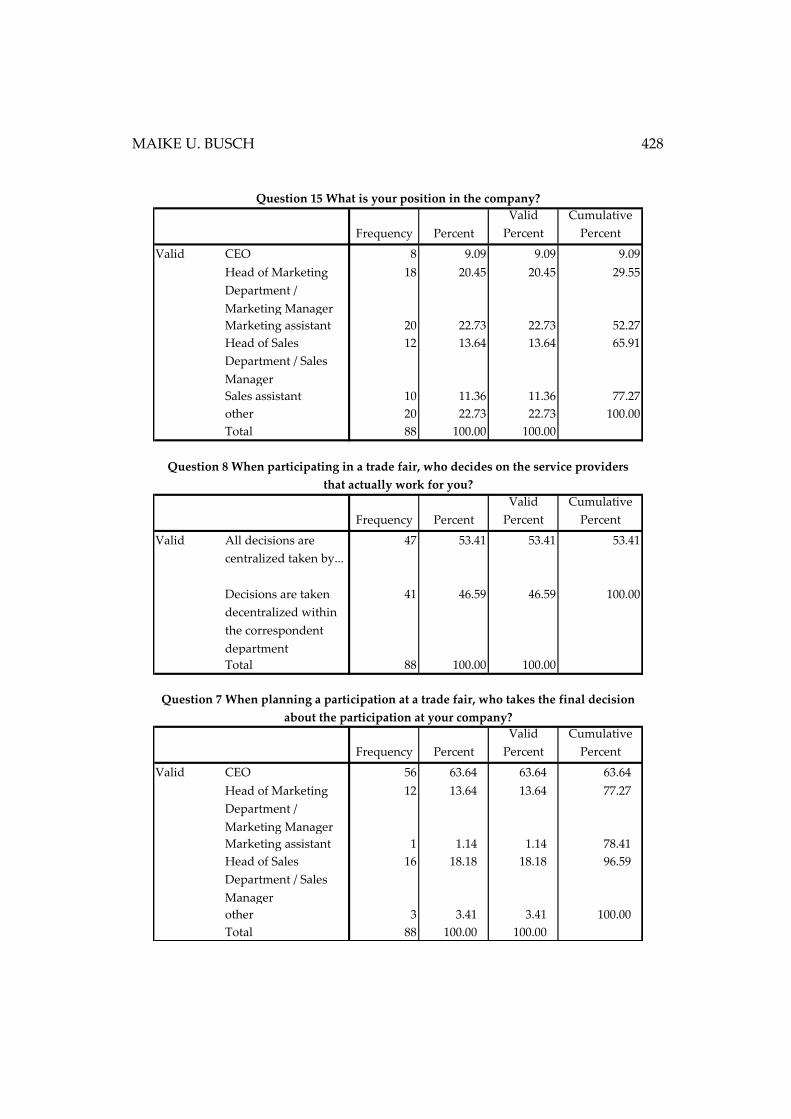
MAIKE U. BUSCH 428
Frequency Percent
Valid
Percent
Cumulative
Percent
CEO 8 9.09 9.09 9.09
Head of Marketing
Department /
Marketing Manager
18 20.45 20.45 29.55
Marketing assistant 20 22.73 22.73 52.27
Head of Sales
Department / Sales
Manager
12 13.64 13.64 65.91
Sales assistant 10 11.36 11.36 77.27
other 20 22.73 22.73 100.00
Total 88 100.00 100.00
Frequency Percent
Valid
Percent
Cumulative
Percent
All decisions are
centralized taken by...
47 53.41 53.41 53.41
Decisions are taken
decentralized within
the correspondent
department
41 46.59 46.59 100.00
Total 88 100.00 100.00
Frequency Percent
Valid
Percent
Cumulative
Percent
CEO 56 63.64 63.64 63.64
Head of Marketing
Department /
Marketing Manager
12 13.64 13.64 77.27
Marketing assistant 1 1.14 1.14 78.41
Head of Sales
Department / Sales
Manager
16 18.18 18.18 96.59
other 3 3.41 3.41 100.00
Total 88 100.00 100.00
Valid
Question 7 When planning a participation at a trade fair, who takes the final decision
about the participation at your company?
Valid
Valid
Question 8 When participating in a trade fair, who decides on the service providers
that actually work for you?
Question 15 What is your position in the company?
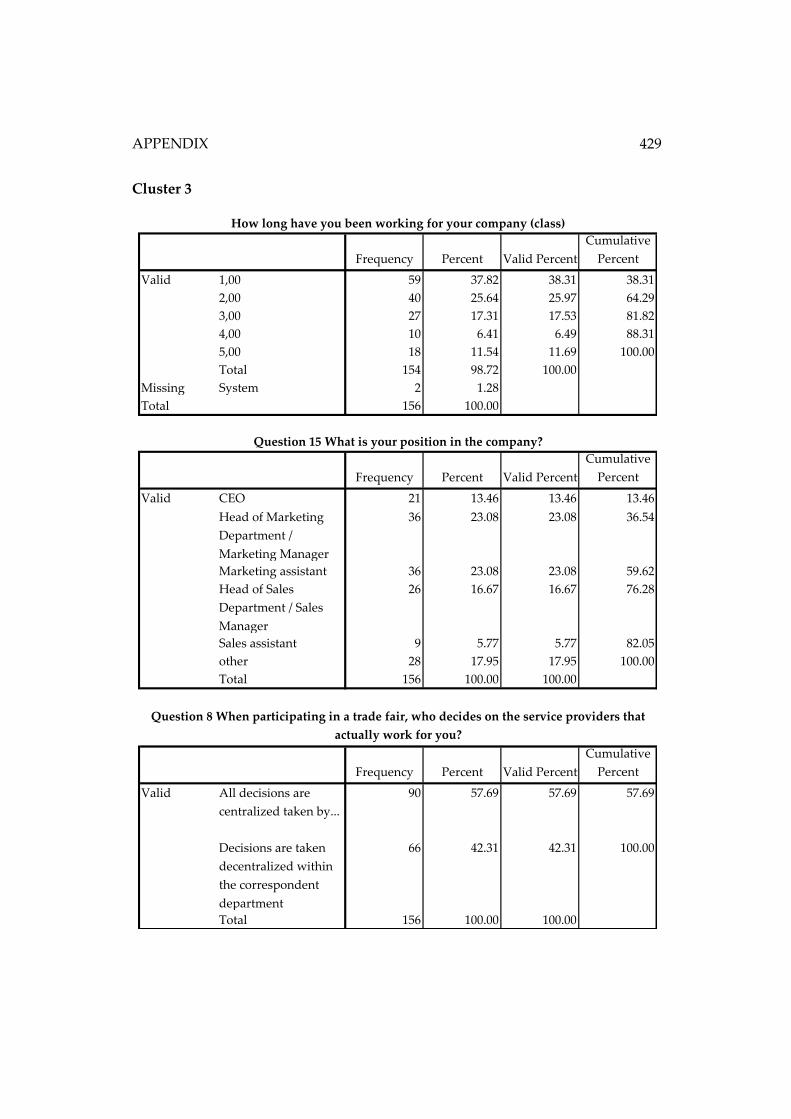
APPENDIX
429
Cluster 3
Frequency Percent Valid Percent
Cumulative
Percent
1,00 59 37.82 38.31 38.31
2,00 40 25.64 25.97 64.29
3,00 27 17.31 17.53 81.82
4,00 10 6.41 6.49 88.31
5,00 18 11.54 11.69 100.00
Total 154 98.72 100.00
Missing System 2 1.28
156 100.00
Frequency Percent Valid Percent
Cumulative
Percent
CEO 21 13.46 13.46 13.46
Head of Marketing
Department /
Marketing Manager
36 23.08 23.08 36.54
Marketing assistant 36 23.08 23.08 59.62
Head of Sales
Department / Sales
Manager
26 16.67 16.67 76.28
Sales assistant 9 5.77 5.77 82.05
other 28 17.95 17.95 100.00
Total 156 100.00 100.00
Frequency Percent Valid Percent
Cumulative
Percent
All decisions are
centralized taken by...
90 57.69 57.69 57.69
Decisions are taken
decentralized within
the correspondent
department
66 42.31 42.31 100.00
Total 156 100.00 100.00
Valid
Question 15 What is your position in the company?
Valid
Question 8 When participating in a trade fair, who decides on the service providers that
actually work for you?
How long have you been working for your company (class)
Valid
Total
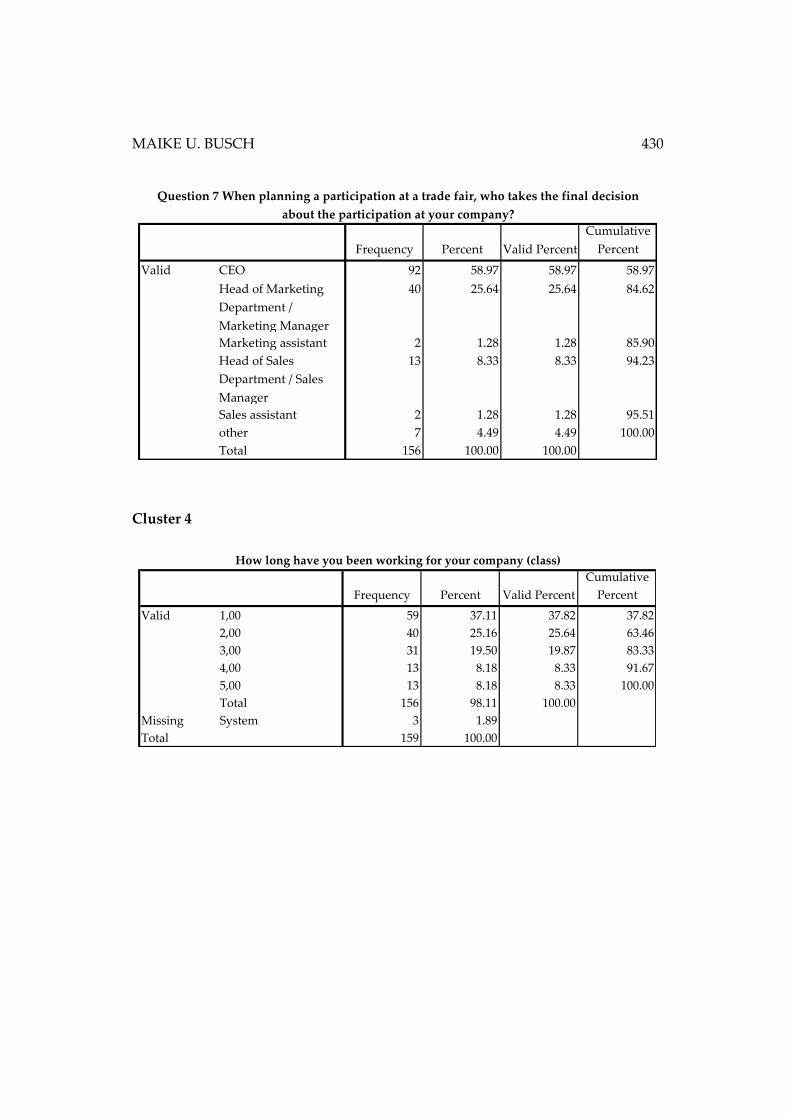
MAIKE U. BUSCH 430
Cluster 4
Frequency Percent Valid Percent
Cumulative
Percent
CEO 92 58.97 58.97 58.97
Head of Marketing
Department /
Marketing Manager
40 25.64 25.64 84.62
Marketing assistant 2 1.28 1.28 85.90
Head of Sales
Department / Sales
Manager
13 8.33 8.33 94.23
Sales assistant 2 1.28 1.28 95.51
other 7 4.49 4.49 100.00
Total 156 100.00 100.00
Valid
Question 7 When planning a participation at a trade fair, who takes the final decision
about the participation at your company?
Frequency Percent Valid Percent
Cumulative
Percent
1,00 59 37.11 37.82 37.82
2,00 40 25.16 25.64 63.46
3,00 31 19.50 19.87 83.33
4,00 13 8.18 8.33 91.67
5,00 13 8.18 8.33 100.00
Total 156 98.11 100.00
Missing System 3 1.89
159 100.00
How long have you been working for your company (class)
Valid
Total
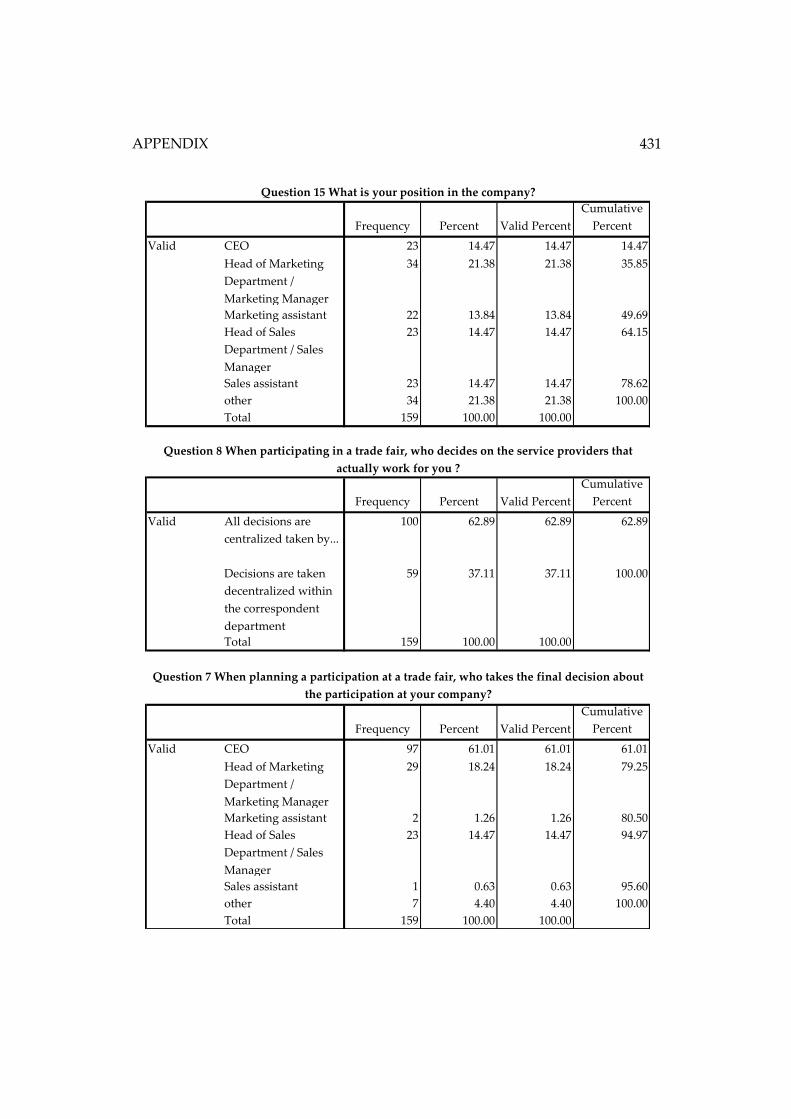
APPENDIX
431
Frequency Percent Valid Percent
Cumulative
Percent
CEO 23 14.47 14.47 14.47
Head of Marketing
Department /
Marketing Manager
34 21.38 21.38 35.85
Marketing assistant 22 13.84 13.84 49.69
Head of Sales
Department / Sales
Manager
23 14.47 14.47 64.15
Sales assistant 23 14.47 14.47 78.62
other 34 21.38 21.38 100.00
Total 159 100.00 100.00
Frequency Percent Valid Percent
Cumulative
Percent
All decisions are
centralized taken by...
100 62.89 62.89 62.89
Decisions are taken
decentralized within
the correspondent
department
59 37.11 37.11 100.00
Total 159 100.00 100.00
Frequency Percent Valid Percent
Cumulative
Percent
CEO 97 61.01 61.01 61.01
Head of Marketing
Department /
Marketing Manager
29 18.24 18.24 79.25
Marketing assistant 2 1.26 1.26 80.50
Head of Sales
Department / Sales
Manager
23 14.47 14.47 94.97
Sales assistant 1 0.63 0.63 95.60
other 7 4.40 4.40 100.00
Total 159 100.00 100.00
Valid
Valid
Question 7 When planning a participation at a trade fair, who takes the final decision about
the participation at your company?
Question 15 What is your position in the company?
Valid
Question 8 When participating in a trade fair, who decides on the service providers that
actually work for you ?
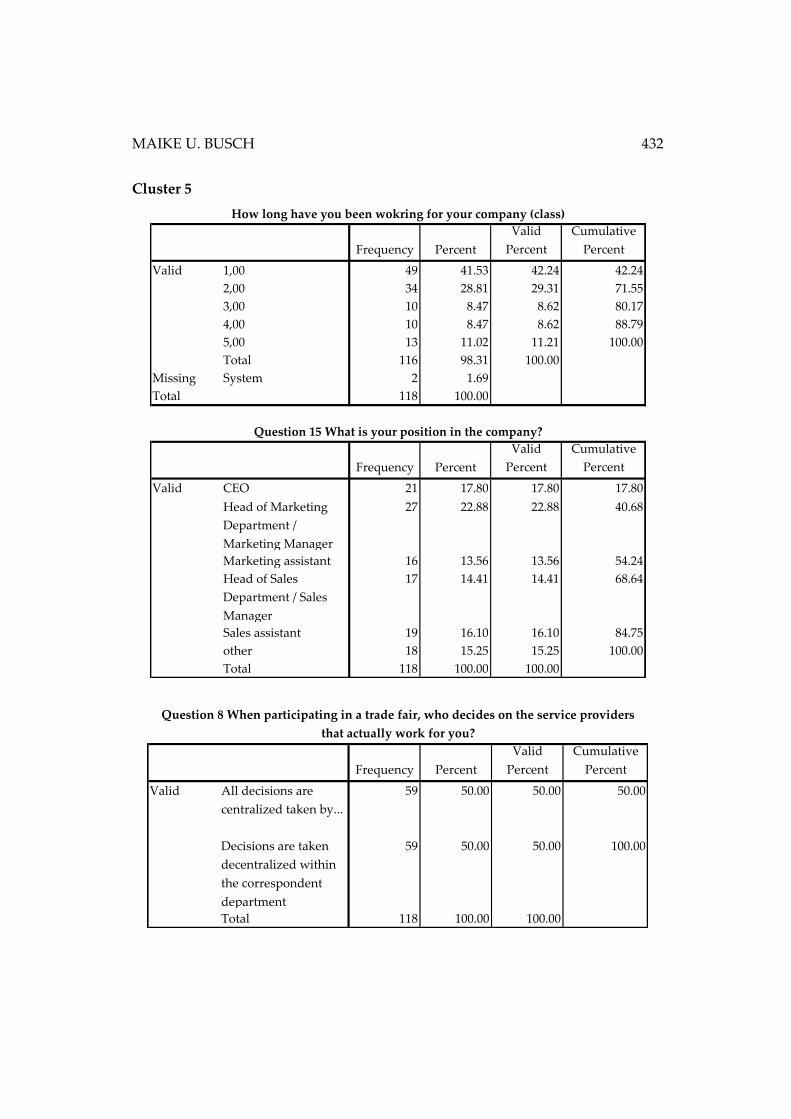
MAIKE U. BUSCH 432
Cluster 5
Frequency Percent
Valid
Percent
Cumulative
Percent
1,00 49 41.53 42.24 42.24
2,00 34 28.81 29.31 71.55
3,00 10 8.47 8.62 80.17
4,00 10 8.47 8.62 88.79
5,00 13 11.02 11.21 100.00
Total 116 98.31 100.00
Missing System 2 1.69
118 100.00
Frequency Percent
Valid
Percent
Cumulative
Percent
CEO 21 17.80 17.80 17.80
Head of Marketing
Department /
Marketing Manager
27 22.88 22.88 40.68
Marketing assistant 16 13.56 13.56 54.24
Head of Sales
Department / Sales
Manager
17 14.41 14.41 68.64
Sales assistant 19 16.10 16.10 84.75
other 18 15.25 15.25 100.00
Total 118 100.00 100.00
Question 15 What is your position in the company?
Valid
How long have you been wokring for your company (class)
Valid
Total
Frequency Percent
Valid
Percent
Cumulative
Percent
All decisions are
centralized taken by...
59 50.00 50.00 50.00
Decisions are taken
decentralized within
the correspondent
department
59 50.00 50.00 100.00
Total 118 100.00 100.00
Valid
Question 8 When participating in a trade fair, who decides on the service providers
that actually work for you?
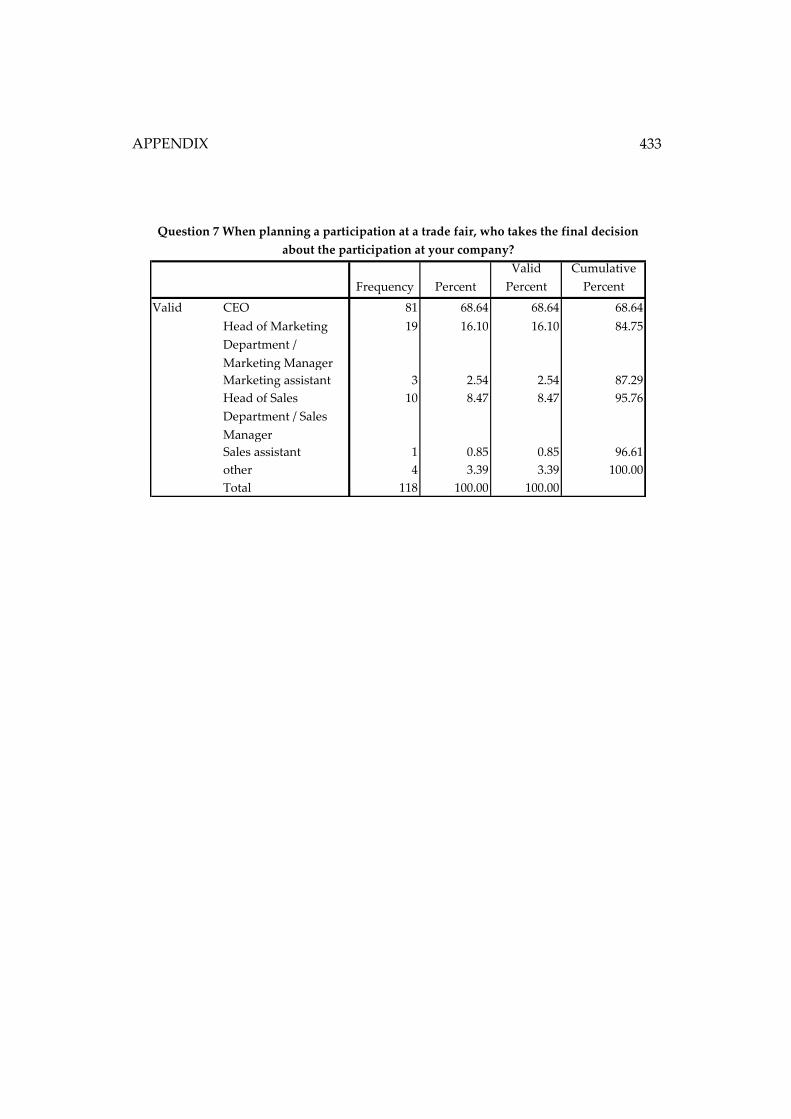
APPENDIX
433
Frequency Percent
Valid
Percent
Cumulative
Percent
CEO 81 68.64 68.64 68.64
Head of Marketing
Department /
Marketing Manager
19 16.10 16.10 84.75
Marketing assistant 3 2.54 2.54 87.29
Head of Sales
Department / Sales
Manager
10 8.47 8.47 95.76
Sales assistant 1 0.85 0.85 96.61
other 4 3.39 3.39 100.00
Total 118 100.00 100.00
Valid
Question 7 When planning a participation at a trade fair, who takes the final decision
about the participation at your company?

MAIKE U. BUSCH 434
Appendix 42: Final cover letter glasstec survey – English version
Dear Sir...
We hope, you have started well into the New Year and we would also like to take the chance again to wish you a happy and successful year 2013.
Last October you participated as an exhibitor in the glasstec 2012 in Düsseldorf. You already gave us your feedback to this event in the previous survey and we thank you for your support.
Today, we would like to ask you some further questions, however not about the glasstec itself but about the exhibitor services we offer to you during your trade fair preparations. Our aim is to improve these offers in order to meet your needs even better and to support you best as a partner in your trade fair preparations.
The results of this survey will provide us important insight for the future development of our service offers to you. Your answers will be treated strictly confidential, of course.
We have authorized the institute Wissler & Partner Trade Fair Marketing in Basel/Switzerland to carry out the survey for us.
Please click on the link below. The questionnaire will open on your screen and you will be able to fill in your answers directly online. Completing the questionnaire will require approximately 5 to 10 minutes.
Thank you very much for your support!
LINK
For safety-reason, you will need the following PIN-code in order to access the survey:
PIN-Code: test
We would appreciate it very much if you completed the survey by Friday, February 1st, 2013.
If you have any technical problems or questions during completion of the survey, please contact:
CONTACT INFORMATION
With kind regards,
Messe Düsseldorf GmbH

APPENDIX
435
Appendix 43: Final questionnaire glasstec survey – English version
1. Organizing a participation in a trade fair is like putting together a puzzle with a
hundred of different pieces, so that the others can see a perfect picture in the
end. Do you agree?
□Yes □ No
2. Although trust is a commonly known and used term, there is no single
definition for it. Which factors do you find necessary for trust to develop and to
strengthen it within a business relationship to a service provider?
Please rate the following aspects to be found in the list below regarding this
issue.
1 = very low meaning 5 = very important
a. Ability of the supplier to realize
the customers wishes (expertise)
□ 1
□ 2
□ 3
□ 4
□ 5
□ no
opinion
b. Benevolence □ 1
□ 2
□ 3
□ 4
□ 5
□ no
opinion
c. Communication between
customer and supplier
□ 1
□ 2
□ 3
□ 4
□ 5
□ no
opinion
d. Supplier reputation (in relation to
the company)
□ 1
□ 2
□ 3
□ 4
□ 5
□ no
opinion
e. Level of experience of supplying
firm
□ 1
□ 2
□ 3
□ 4
□ 5
□ no
opinion
f. Reputation of the contact person
of the supplying company
□ 1
□ 2
□ 3
□ 4
□ 5
□ no
opinion
g.
Satisfaction with previous
interactions
(= Product performance)
□ 1
□ 2
□ 3
□ 4
□ 5
□ no
opinion
h.
Similarity of service provider &
customer (presence of common
values & interests)
□ 1
□ 2
□ 3
□ 4
□ 5
□ no
opinion
i. Honesty □ 1
□ 2
□ 3
□ 4
□ 5
□ no
opinion

MAIKE U. BUSCH 436
j. Reliability □ 1
□ 2
□ 3
□ 4
□ 5
□ no
opinion
k. Information exchange on an equal
level
□ 1
□ 2
□ 3
□ 4
□ 5
□ no
opinion
l. Technical assistance in addition to
ordered services
□ 1
□ 2
□ 3
□ 4
□ 5
□ no
opinion
m. Personality of contact person at
supplying firm
□ 1
□ 2
□ 3
□ 4
□ 5
□ no
opinion
n. Personal level of experience of
contact person at supplying firm
□ 1
□ 2
□ 3
□ 4
□ 5
□ no
opinion
o. Cultural background of supplier’s
contact person
□ 1
□ 2
□ 3
□ 4
□ 5
□ no
opinion
p. Cultural background of the
supplying firm
□ 1
□ 2
□ 3
□ 4
□ 5
□ no
opinion
q. Further important aspect, you
would like to mention:
□ 1
□ 2
□ 3
□ 4
□ 5
3. When buying services, it is often difficult to foresee the end result. On a scale
from 1 to 5 how important do you rate the existence of trust into the sales
partner for establishing a long-term, sustainable buyer and service provider
relationship?
□ 1 □ 2 □ 3 □ 4 □ 5
(hardly
necessary) (neutral)
(very
important)
4. When buying services, are you looking for a long-term relationship (for several
trade fair cycles) with a service provider who implements your wishes?
□ Yes □ No
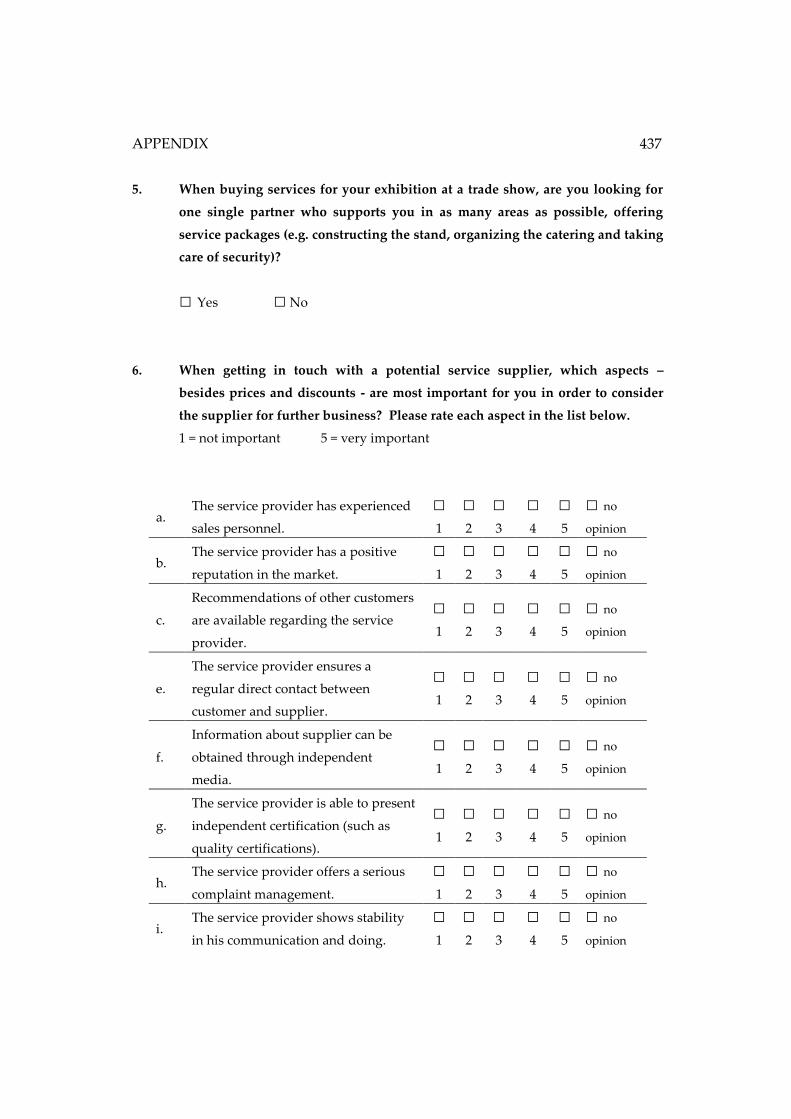
APPENDIX
437
5. When buying services for your exhibition at a trade show, are you looking for
one single partner who supports you in as many areas as possible, offering
service packages (e.g. constructing the stand, organizing the catering and taking
care of security)?
□ Yes □ No
6. When getting in touch with a potential service supplier, which aspects –
besides prices and discounts - are most important for you in order to consider
the supplier for further business? Please rate each aspect in the list below.
1 = not important 5 = very important
a. The service provider has experienced
sales personnel.
□ 1
□ 2
□ 3
□ 4
□ 5
□ no
opinion
b. The service provider has a positive
reputation in the market.
□ 1
□ 2
□ 3
□ 4
□ 5
□ no
opinion
c.
Recommendations of other customers
are available regarding the service
provider.
□ 1
□ 2
□ 3
□ 4
□ 5
□ no
opinion
e.
The service provider ensures a
regular direct contact between
customer and supplier.
□ 1
□ 2
□ 3
□ 4
□ 5
□ no
opinion
f.
Information about supplier can be
obtained through independent
media.
□ 1
□ 2
□ 3
□ 4
□ 5
□ no
opinion
g.
The service provider is able to present
independent certification (such as
quality certifications).
□ 1
□ 2
□ 3
□ 4
□ 5
□ no
opinion
h. The service provider offers a serious
complaint management.
□ 1
□ 2
□ 3
□ 4
□ 5
□ no
opinion
i. The service provider shows stability
in his communication and doing.
□ 1
□ 2
□ 3
□ 4
□ 5
□ no
opinion
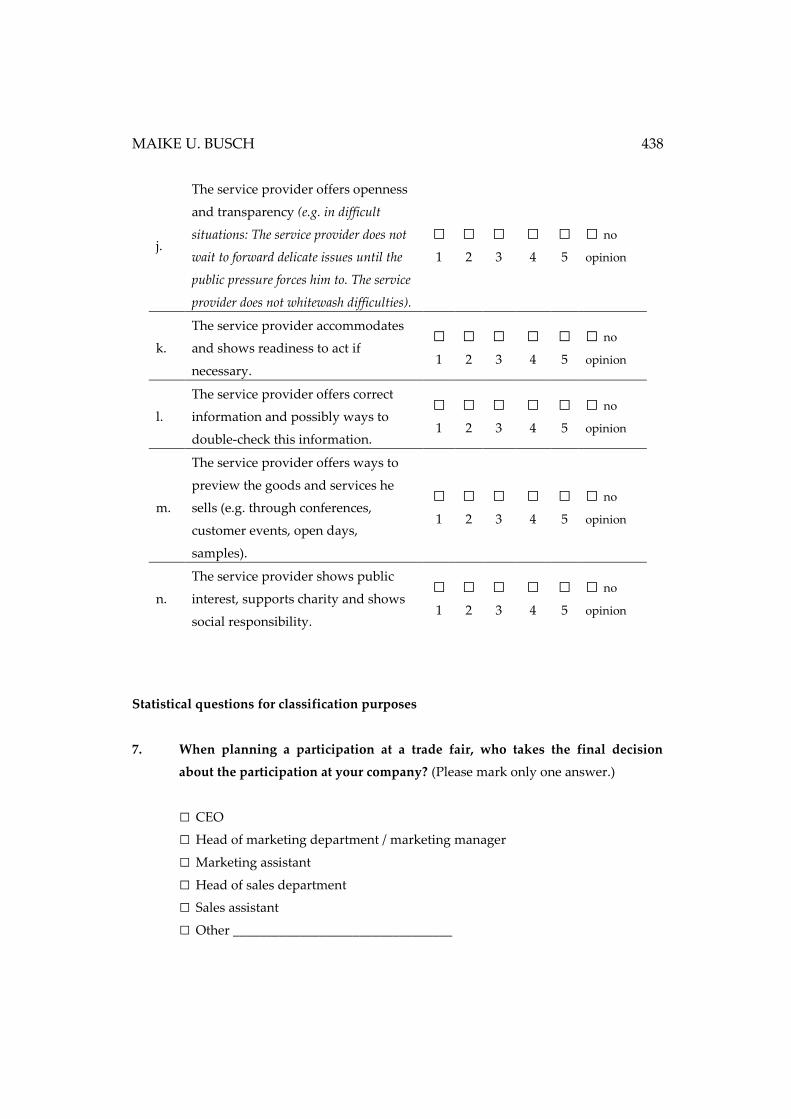
MAIKE U. BUSCH 438
j.
The service provider offers openness
and transparency (e.g. in difficult
situations: The service provider does not
wait to forward delicate issues until the
public pressure forces him to. The service
provider does not whitewash difficulties).
□ 1
□ 2
□ 3
□ 4
□ 5
□ no
opinion
k.
The service provider accommodates
and shows readiness to act if
necessary.
□ 1
□ 2
□ 3
□ 4
□ 5
□ no
opinion
l.
The service provider offers correct
information and possibly ways to
double-check this information.
□ 1
□ 2
□ 3
□ 4
□ 5
□ no
opinion
m.
The service provider offers ways to
preview the goods and services he
sells (e.g. through conferences,
customer events, open days,
samples).
□ 1
□ 2
□ 3
□ 4
□ 5
□ no
opinion
n.
The service provider shows public
interest, supports charity and shows
social responsibility.
□ 1
□ 2
□ 3
□ 4
□ 5
□ no
opinion
Statistical questions for classification purposes
7. When planning a participation at a trade fair, who takes the final decision
about the participation at your company? (Please mark only one answer.)
□ CEO
□ Head of marketing department / marketing manager
□ Marketing assistant
□ Head of sales department
□ Sales assistant
□ Other _________________________________

APPENDIX
439
8. When participating in a trade fair, who decides on the service providers that
actually work for you (e.g. stand builder, caterer, hostess service, press service,
etc)?
□ All decisions are centralized, taken by ________________________________
(position of decider)
□ Decisions are taken decentralized within the correspondent department (e.g.
the Press service is decided on in the PR department)
9a. Was this your first participation in the trade fair glasstec?
□ Yes □ No, my company has been exhibitor at the glasstec before.
c. How often have you been an exhibitor at the glasstec within the previous 5 years?
□ 2nd participation
□ 3rd participation
10. What size was your stand at this year’s trade fair glasstec (in sqm)?
□ up to 20 sqm □ 51 – 100 sqm
□ 21 – 50 sqm □ More than 100 sqm
11. Do you exhibit on other fairs grounds other than in Düsseldorf?
□ Yes □ No
12 a. Where is the headquarter of your company located (country)?
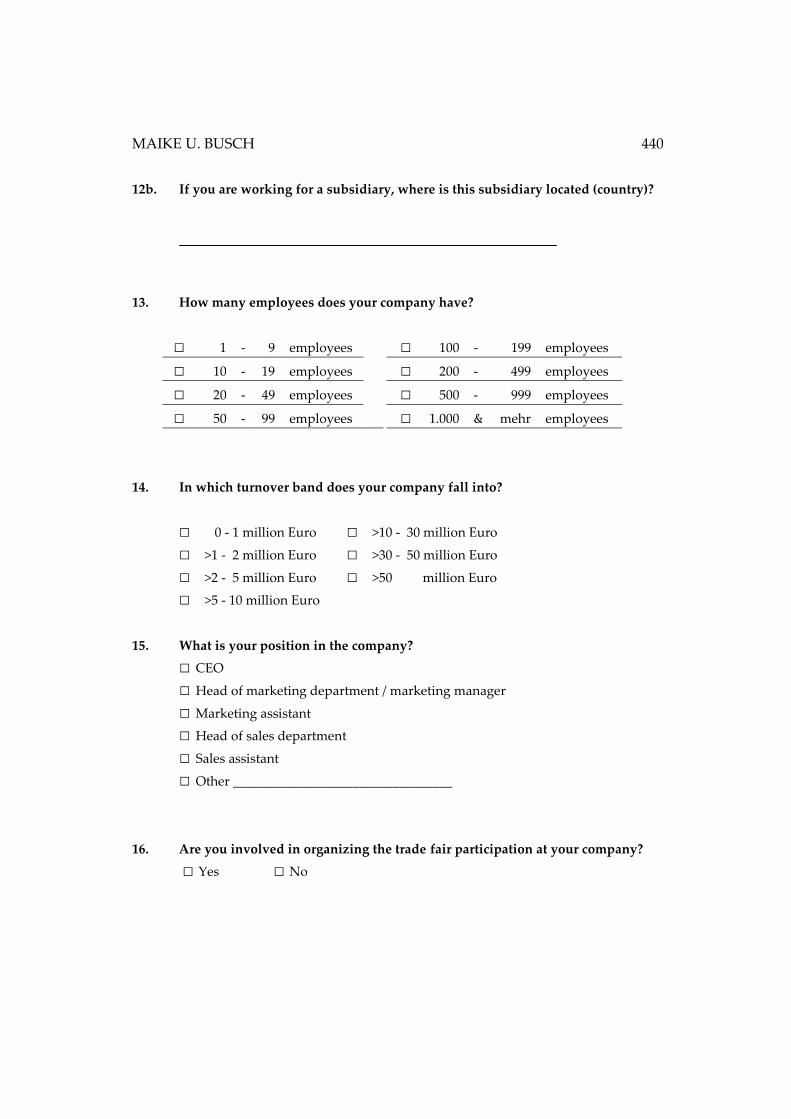
MAIKE U. BUSCH 440
12b. If you are working for a subsidiary, where is this subsidiary located (country)?
13. How many employees does your company have?
□ 1 - 9 employees □ 100 - 199 employees
□ 10 - 19 employees □ 200 - 499 employees
□ 20 - 49 employees □ 500 - 999 employees
□ 50 - 99 employees □ 1.000 & mehr employees
14. In which turnover band does your company fall into?
□ 0 - 1 million Euro □ >10 - 30 million Euro
□ >1 - 2 million Euro □ >30 - 50 million Euro
□ >2 - 5 million Euro □ >50 million Euro
□ >5 - 10 million Euro
15. What is your position in the company?
□ CEO
□ Head of marketing department / marketing manager
□ Marketing assistant
□ Head of sales department
□ Sales assistant
□ Other _________________________________
16. Are you involved in organizing the trade fair participation at your company?
□ Yes □ No

APPENDIX
441
17. Are you responsible within your company for the commissioning of service
providers for your participation at the trade fair?
□ Yes, for all service providers that are necessary.
□ Yes, but only for one / some of the service providers.
□ No, but I am involved in the process of selecting the service providers.
□ No, I am neither involved in the process of selecting nor am I responsible for
the commissioning of the service providers..
18. How long have you been working for your company?
_________________________________________________
Thank you very much for your participation in this survey!
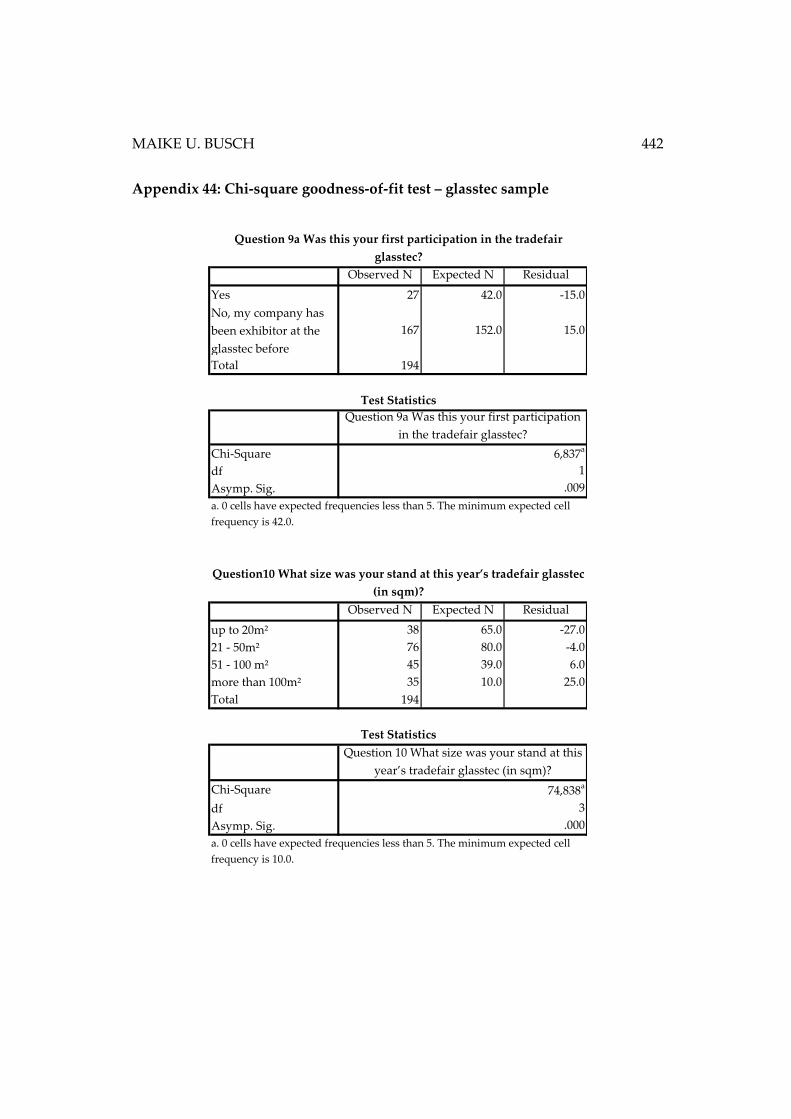
MAIKE U. BUSCH 442
Appendix 44: Chi-square goodness-of-fit test – glasstec sample
Observed N Expected N Residual
Yes 27 42.0 -15.0
No, my company has
been exhibitor at the
glasstec before
167 152.0 15.0
Total 194
Chi-Square
df
Asymp. Sig.
Observed N Expected N Residual
up to 20m² 38 65.0 -27.0
21 - 50m² 76 80.0 -4.0
51 - 100 m² 45 39.0 6.0
more than 100m² 35 10.0 25.0
Total 194
Chi-Square
df
Asymp. Sig.
a. 0 cells have expected frequencies less than 5. The minimum expected cell
frequency is 42.0.
Question 10 What size was your stand at this
year’s tradefair glasstec (in sqm)?
a. 0 cells have expected frequencies less than 5. The minimum expected cell
frequency is 10.0.
.000
3
74,838a
Question10 What size was your stand at this year’s tradefair glasstec
(in sqm)?
6,837a
1
.009
Test Statistics
Question 9a Was this your first participation in the tradefair
glasstec?
Question 9a Was this your first participation
in the tradefair glasstec?
Test Statistics
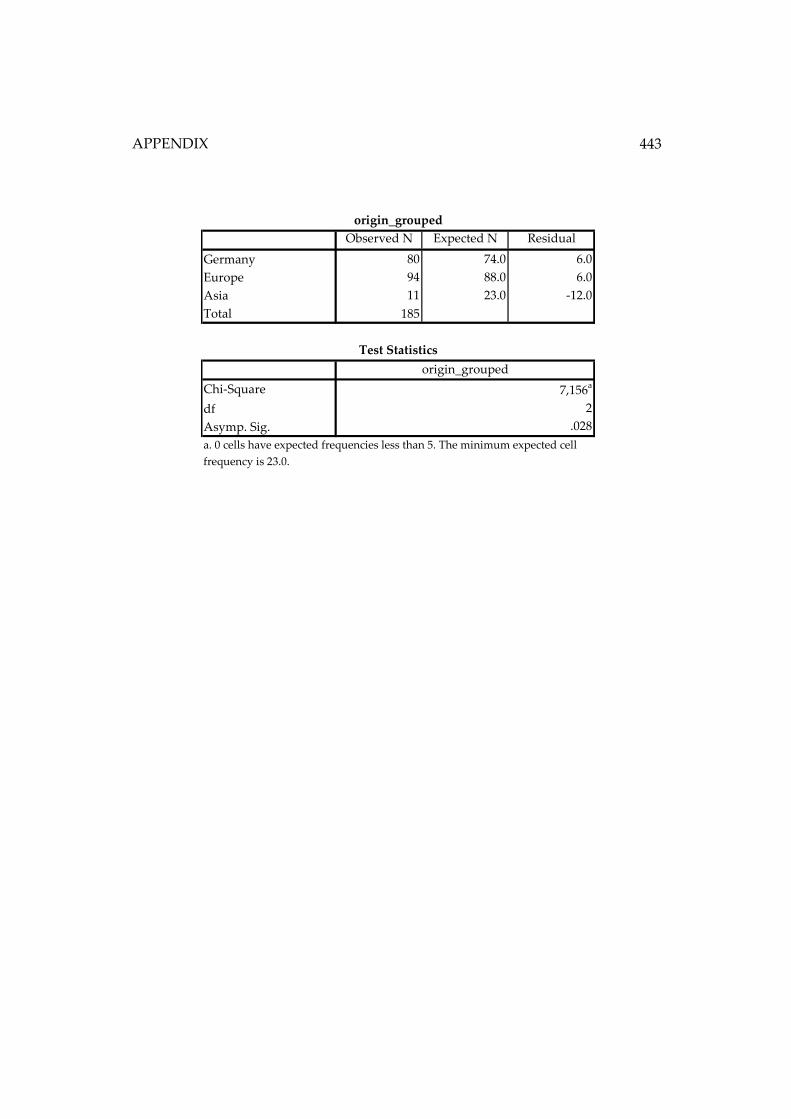
APPENDIX
443
Observed N Expected N Residual
Germany 80 74.0 6.0
Europe 94 88.0 6.0
Asia 11 23.0 -12.0
Total 185
Chi-Square
df
Asymp. Sig.
a. 0 cells have expected frequencies less than 5. The minimum expected cell
frequency is 23.0.
Test Statistics
origin_grouped
7,156a
2
.028
origin_grouped
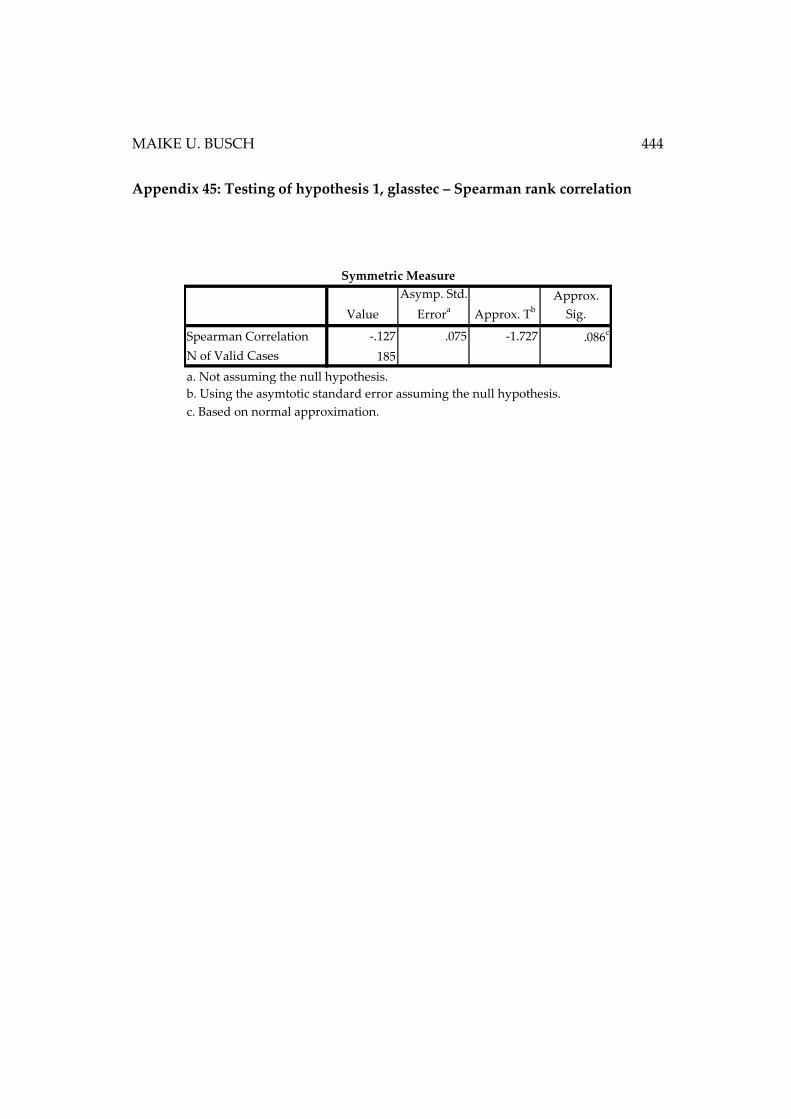
MAIKE U. BUSCH 444
Appendix 45: Testing of hypothesis 1, glasstec – Spearman rank correlation
Value
Asymp. Std.
Errora Approx. Tb
Approx.
Sig.
-.127 .075 -1.727 .086c
185
b. Using the asymtotic standard error assuming the null hypothesis.
c. Based on normal approximation.
Spearman Correlation
Symmetric Measure
N of Valid Cases
a. Not assuming the null hypothesis.
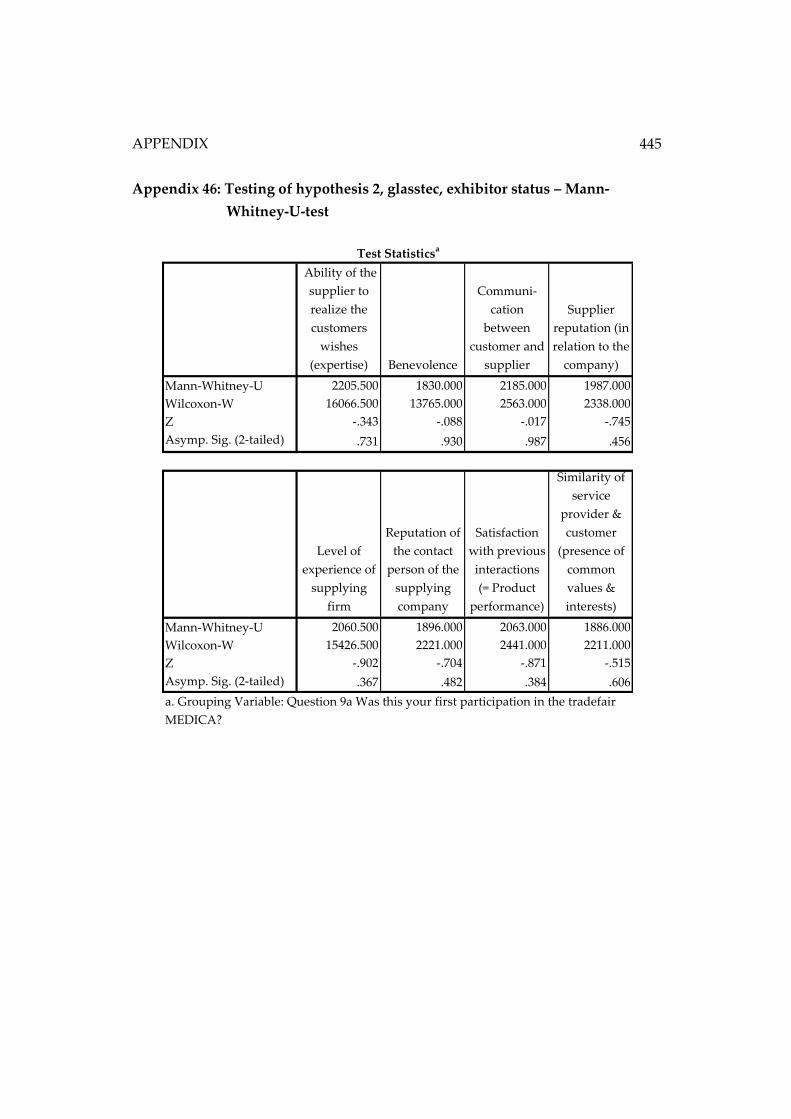
APPENDIX
445
Appendix 46: Testing of hypothesis 2, glasstec, exhibitor status – Mann-
Whitney-U-test
Ability of the
supplier to
realize the
customers
wishes
(expertise) Benevolence
Communi-
cation
between
customer and
supplier
Supplier
reputation (in
relation to the
company)
Mann-Whitney-U 2205.500 1830.000 2185.000 1987.000
Wilcoxon-W 16066.500 13765.000 2563.000 2338.000
Z -.343 -.088 -.017 -.745
Asymp. Sig. (2-tailed) .731 .930 .987 .456
Level of
experience of
supplying
firm
Reputation of
the contact
person of the
supplying
company
Satisfaction
with previous
interactions
(= Product
performance)
Similarity of
service
provider &
customer
(presence of
common
values &
interests)
Mann-Whitney-U 2060.500 1896.000 2063.000 1886.000
Wilcoxon-W 15426.500 2221.000 2441.000 2211.000
Z -.902 -.704 -.871 -.515
Asymp. Sig. (2-tailed) .367 .482 .384 .606
a. Grouping Variable: Question 9a Was this your first participation in the tradefair
MEDICA?
Test Statisticsa
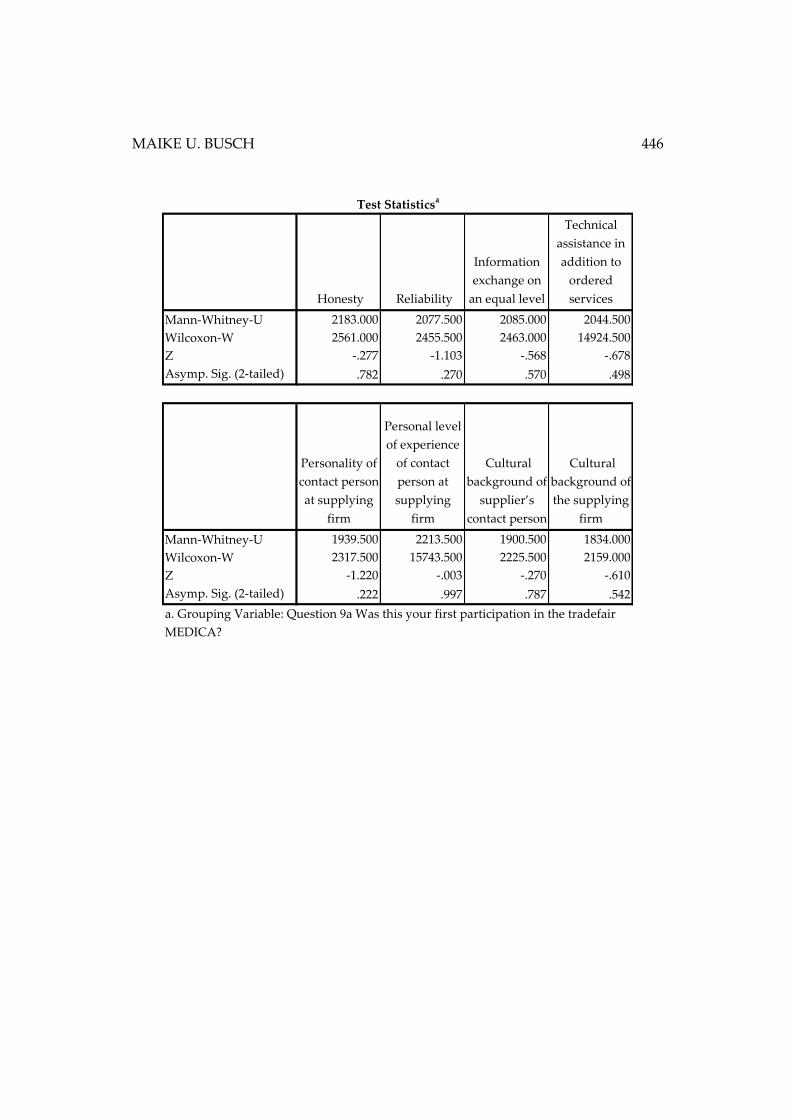
MAIKE U. BUSCH 446
Honesty Reliability
Information
exchange on
an equal level
Technical
assistance in
addition to
ordered
services
Mann-Whitney-U 2183.000 2077.500 2085.000 2044.500
Wilcoxon-W 2561.000 2455.500 2463.000 14924.500
Z -.277 -1.103 -.568 -.678
Asymp. Sig. (2-tailed) .782 .270 .570 .498
Personality of
contact person
at supplying
firm
Personal level
of experience
of contact
person at
supplying
firm
Cultural
background of
supplier’s
contact person
Cultural
background of
the supplying
firm
Mann-Whitney-U 1939.500 2213.500 1900.500 1834.000
Wilcoxon-W 2317.500 15743.500 2225.500 2159.000
Z -1.220 -.003 -.270 -.610
Asymp. Sig. (2-tailed) .222 .997 .787 .542
a. Grouping Variable: Question 9a Was this your first participation in the tradefair
MEDICA?
Test Statisticsa
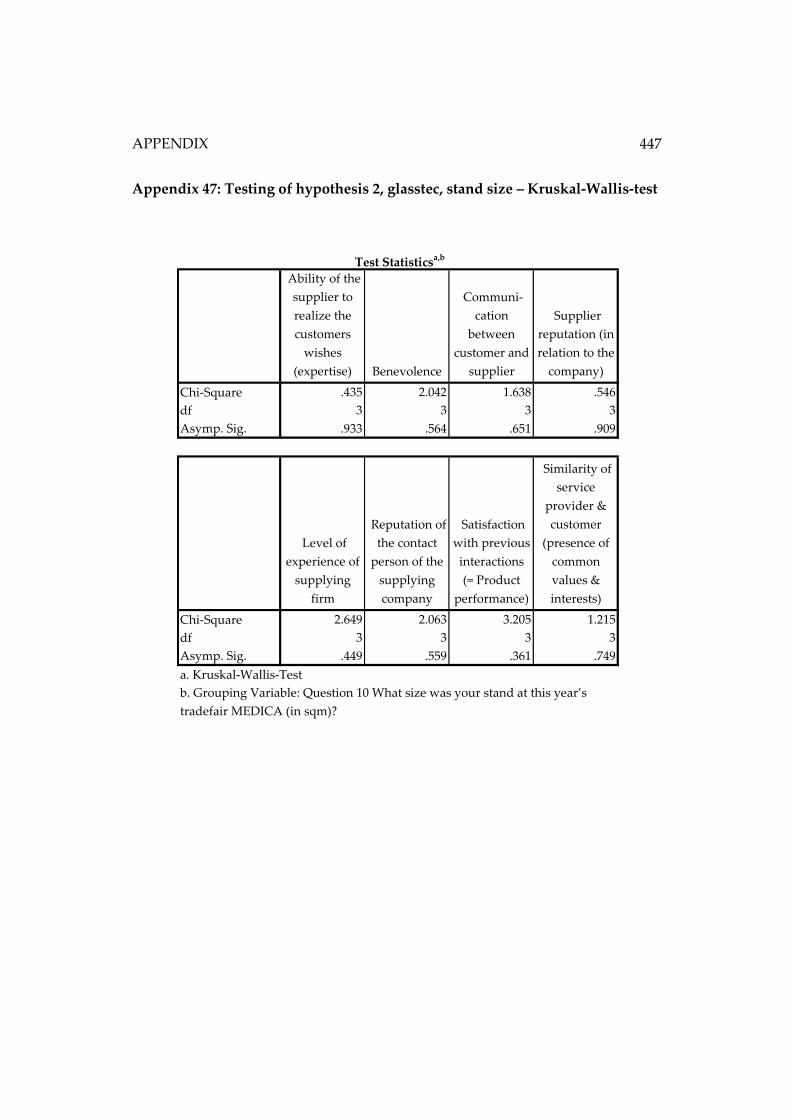
APPENDIX
447
Appendix 47: Testing of hypothesis 2, glasstec, stand size – Kruskal-Wallis-test
Ability of the
supplier to
realize the
customers
wishes
(expertise) Benevolence
Communi-
cation
between
customer and
supplier
Supplier
reputation (in
relation to the
company)
Chi-Square .435 2.042 1.638 .546
df 3 3 3 3
Asymp. Sig. .933 .564 .651 .909
Level of
experience of
supplying
firm
Reputation of
the contact
person of the
supplying
company
Satisfaction
with previous
interactions
(= Product
performance)
Similarity of
service
provider &
customer
(presence of
common
values &
interests)
Chi-Square 2.649 2.063 3.205 1.215
df 3 3 3 3
Asymp. Sig. .449 .559 .361 .749
Test Statisticsa,b
a. Kruskal-Wallis-Test
b. Grouping Variable: Question 10 What size was your stand at this year’s
tradefair MEDICA (in sqm)?
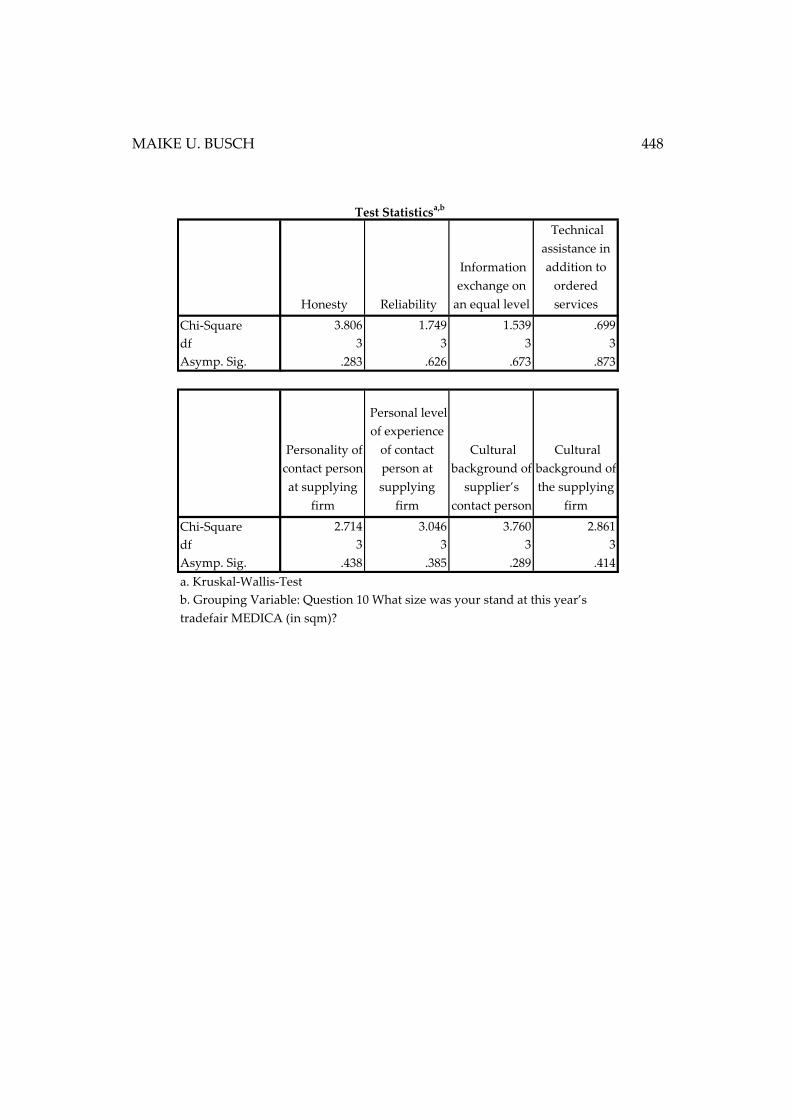
MAIKE U. BUSCH 448
Honesty Reliability
Information
exchange on
an equal level
Technical
assistance in
addition to
ordered
services
Chi-Square 3.806 1.749 1.539 .699
df 3 3 3 3
Asymp. Sig. .283 .626 .673 .873
Personality of
contact person
at supplying
firm
Personal level
of experience
of contact
person at
supplying
firm
Cultural
background of
supplier’s
contact person
Cultural
background of
the supplying
firm
Chi-Square 2.714 3.046 3.760 2.861
df 3 3 3 3
Asymp. Sig. .438 .385 .289 .414
Test Statisticsa,b
a. Kruskal-Wallis-Test
b. Grouping Variable: Question 10 What size was your stand at this year’s
tradefair MEDICA (in sqm)?
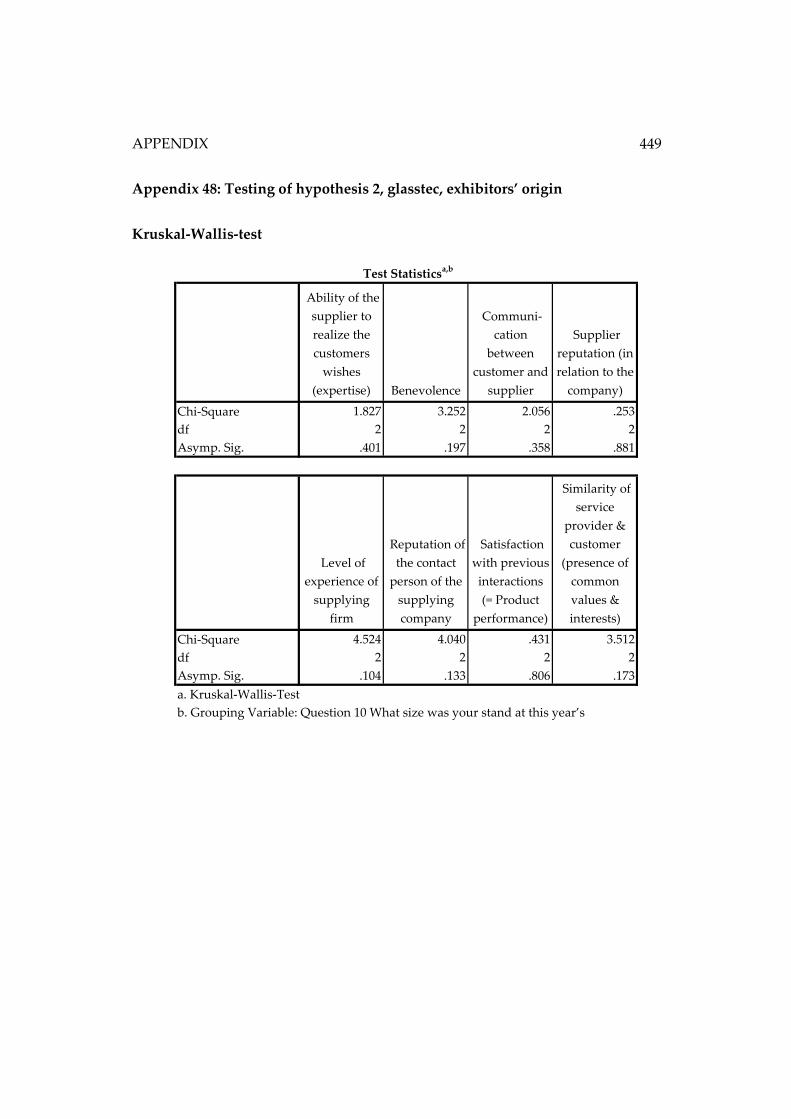
APPENDIX
449
Appendix 48: Testing of hypothesis 2, glasstec, exhibitors’ origin
Kruskal-Wallis-test
Ability of the
supplier to
realize the
customers
wishes
(expertise) Benevolence
Communi-
cation
between
customer and
supplier
Supplier
reputation (in
relation to the
company)
Chi-Square 1.827 3.252 2.056 .253
df 2 2 2 2
Asymp. Sig. .401 .197 .358 .881
Level of
experience of
supplying
firm
Reputation of
the contact
person of the
supplying
company
Satisfaction
with previous
interactions
(= Product
performance)
Similarity of
service
provider &
customer
(presence of
common
values &
interests)
Chi-Square 4.524 4.040 .431 3.512
df 2 2 2 2
Asymp. Sig. .104 .133 .806 .173
Test Statisticsa,b
a. Kruskal-Wallis-Test
b. Grouping Variable: Question 10 What size was your stand at this year’s
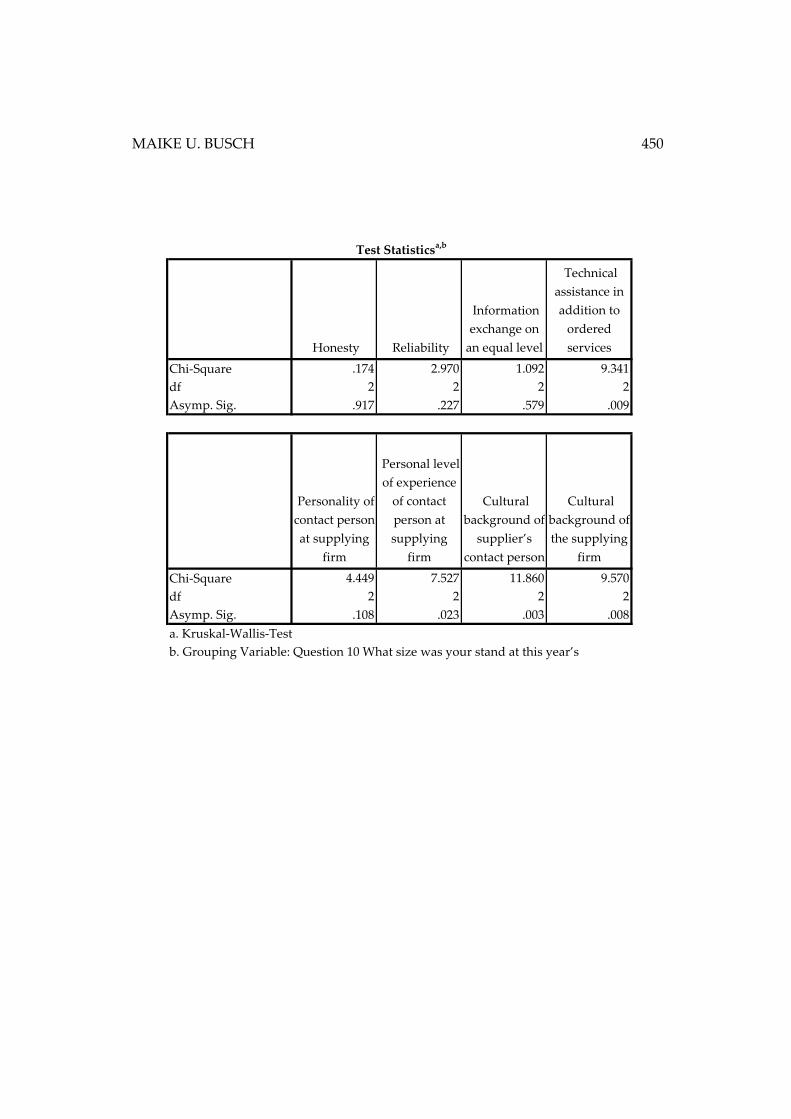
MAIKE U. BUSCH 450
Honesty Reliability
Information
exchange on
an equal level
Technical
assistance in
addition to
ordered
services
Chi-Square .174 2.970 1.092 9.341
df 2 2 2 2
Asymp. Sig. .917 .227 .579 .009
Personality of
contact person
at supplying
firm
Personal level
of experience
of contact
person at
supplying
firm
Cultural
background of
supplier’s
contact person
Cultural
background of
the supplying
firm
Chi-Square 4.449 7.527 11.860 9.570
df 2 2 2 2
Asymp. Sig. .108 .023 .003 .008
Test Statisticsa,b
a. Kruskal-Wallis-Test
b. Grouping Variable: Question 10 What size was your stand at this year’s
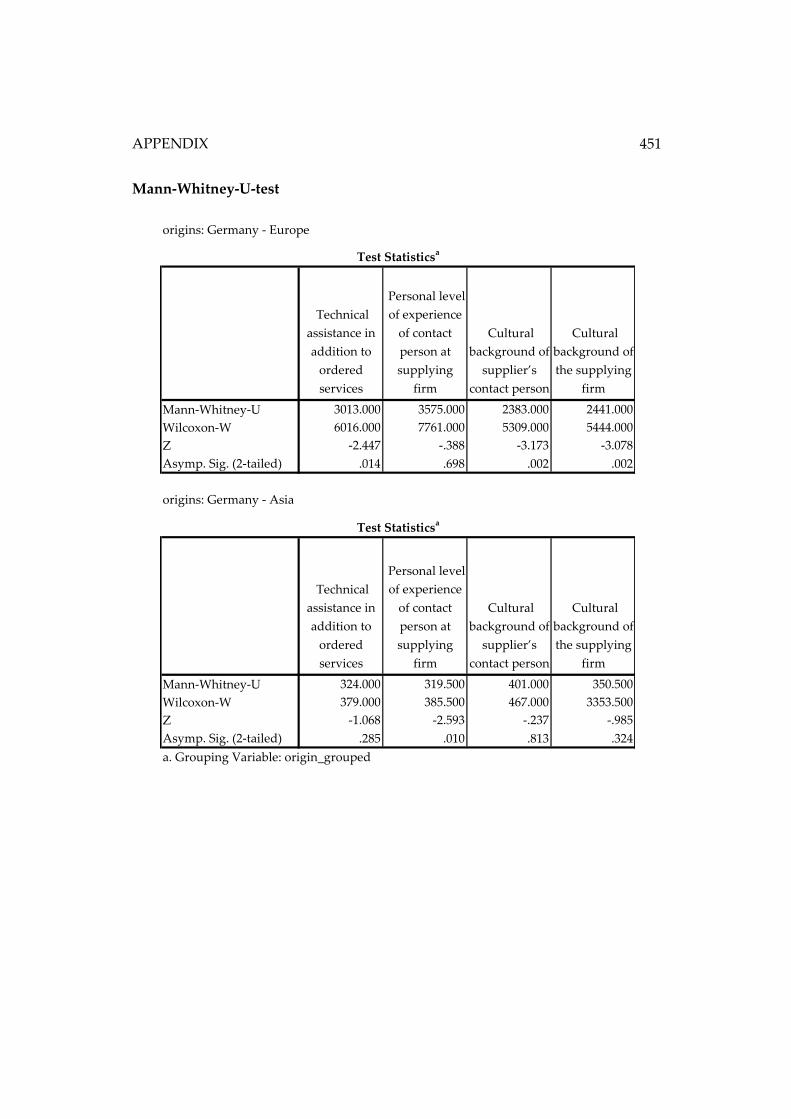
APPENDIX
451
Mann-Whitney-U-test
origins: Germany - Europe
Technical
assistance in
addition to
ordered
services
Personal level
of experience
of contact
person at
supplying
firm
Cultural
background of
supplier’s
contact person
Cultural
background of
the supplying
firm
Mann-Whitney-U 3013.000 3575.000 2383.000 2441.000
Wilcoxon-W 6016.000 7761.000 5309.000 5444.000
Z -2.447 -.388 -3.173 -3.078
Asymp. Sig. (2-tailed) .014 .698 .002 .002
origins: Germany - Asia
Technical
assistance in
addition to
ordered
services
Personal level
of experience
of contact
person at
supplying
firm
Cultural
background of
supplier’s
contact person
Cultural
background of
the supplying
firm
Mann-Whitney-U 324.000 319.500 401.000 350.500
Wilcoxon-W 379.000 385.500 467.000 3353.500
Z -1.068 -2.593 -.237 -.985
Asymp. Sig. (2-tailed) .285 .010 .813 .324
a. Grouping Variable: origin_grouped
Test Statisticsa
Test Statisticsa
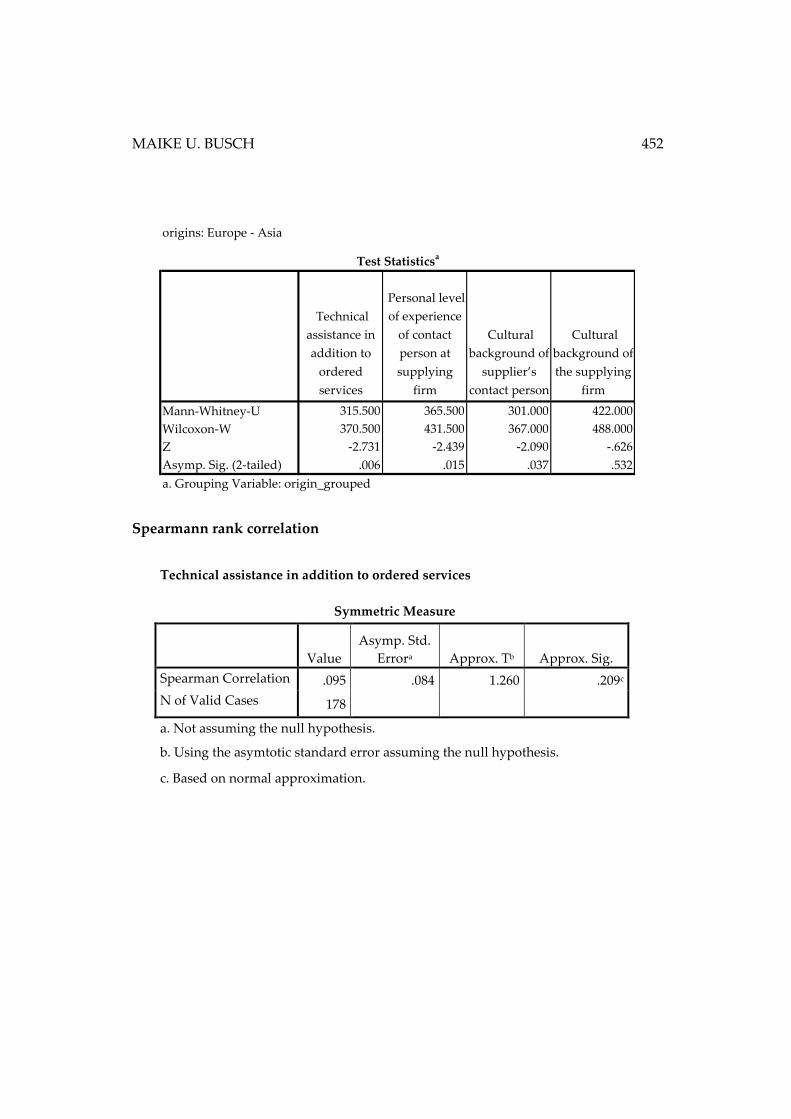
MAIKE U. BUSCH 452
Spearmann rank correlation
Technical assistance in addition to ordered services
Symmetric Measure
Value
Asymp. Std.
Errora Approx. Tb Approx. Sig.
Spearman Correlation .095 .084 1.260 .209c
N of Valid Cases 178
a. Not assuming the null hypothesis.
b. Using the asymtotic standard error assuming the null hypothesis.
c. Based on normal approximation.
origins: Europe - Asia
Technical
assistance in
addition to
ordered
services
Personal level
of experience
of contact
person at
supplying
firm
Cultural
background of
supplier’s
contact person
Cultural
background of
the supplying
firm
Mann-Whitney-U 315.500 365.500 301.000 422.000
Wilcoxon-W 370.500 431.500 367.000 488.000
Z -2.731 -2.439 -2.090 -.626
Asymp. Sig. (2-tailed) .006 .015 .037 .532
a. Grouping Variable: origin_grouped
Test Statisticsa
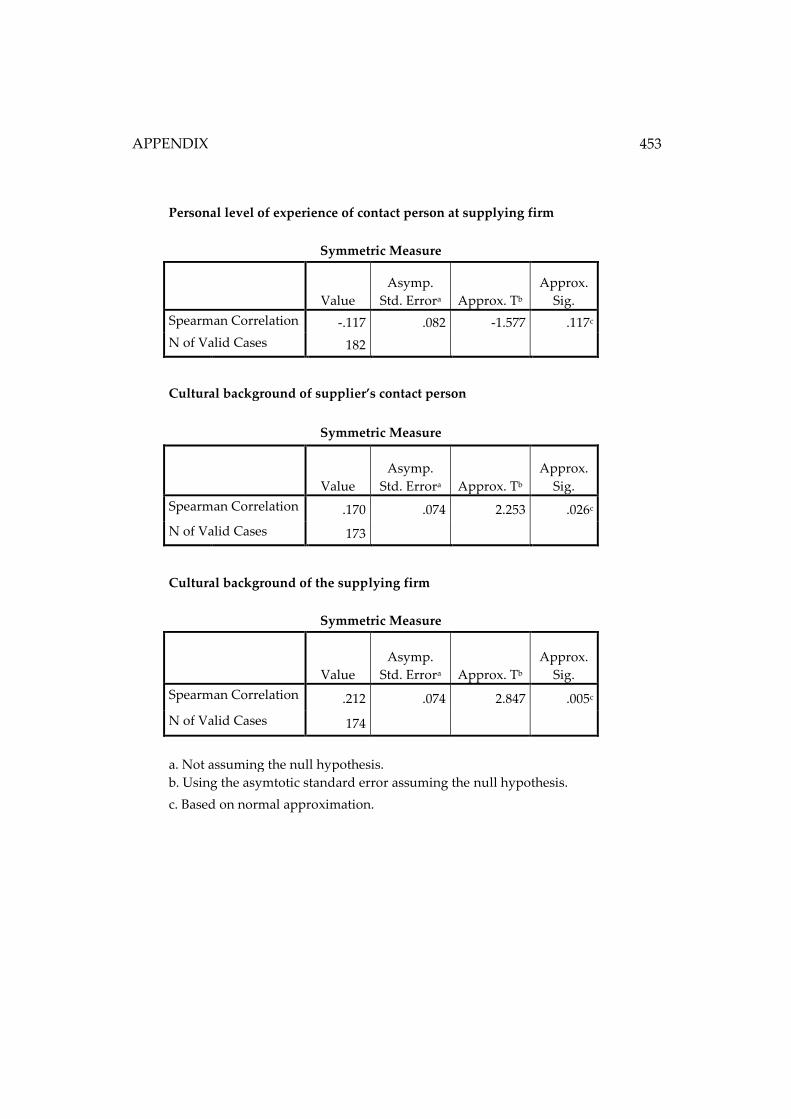
APPENDIX
453
Personal level of experience of contact person at supplying firm
Symmetric Measure
Value
Asymp.
Std. Errora Approx. Tb
Approx.
Sig.
Spearman Correlation -.117 .082 -1.577 .117c
N of Valid Cases 182
Cultural background of supplier’s contact person
Symmetric Measure
Value
Asymp.
Std. Errora Approx. Tb
Approx.
Sig.
Spearman Correlation .170 .074 2.253 .026c
N of Valid Cases 173
Cultural background of the supplying firm
Symmetric Measure
Value
Asymp.
Std. Errora Approx. Tb
Approx.
Sig.
Spearman Correlation .212 .074 2.847 .005c
N of Valid Cases 174
a. Not assuming the null hypothesis.
b. Using the asymtotic standard error assuming the null hypothesis.
c. Based on normal approximation.
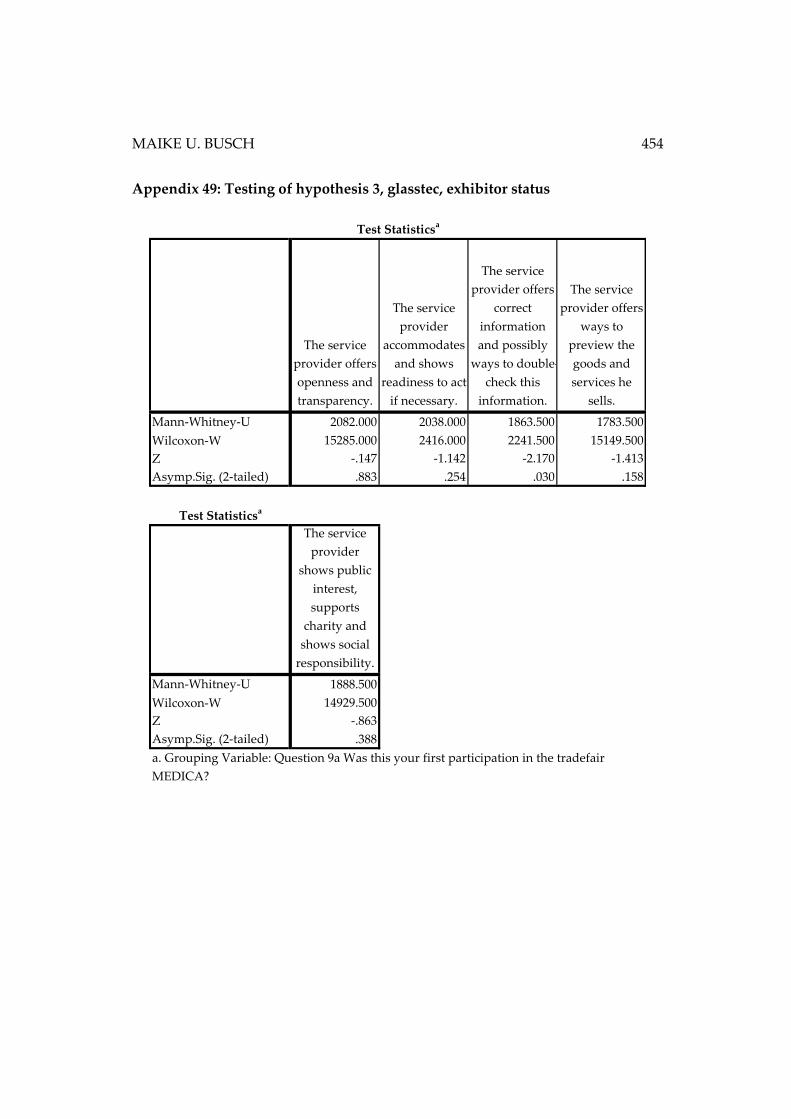
MAIKE U. BUSCH 454
Appendix 49: Testing of hypothesis 3, glasstec, exhibitor status
The service
provider offers
openness and
transparency.
The service
provider
accommodates
and shows
readiness to act
if necessary.
The service
provider offers
correct
information
and possibly
ways to double-
check this
information.
The service
provider offers
ways to
preview the
goods and
services he
sells.
Mann-Whitney-U 2082.000 2038.000 1863.500 1783.500
Wilcoxon-W 15285.000 2416.000 2241.500 15149.500
Z -.147 -1.142 -2.170 -1.413
Asymp.Sig. (2-tailed) .883 .254 .030 .158
Test Statisticsa
The service
provider
shows public
interest,
supports
charity and
shows social
responsibility.
Mann-Whitney-U 1888.500
Wilcoxon-W 14929.500
Z -.863
Asymp.Sig. (2-tailed) .388
Test Statisticsa
a. Grouping Variable: Question 9a Was this your first participation in the tradefair
MEDICA?
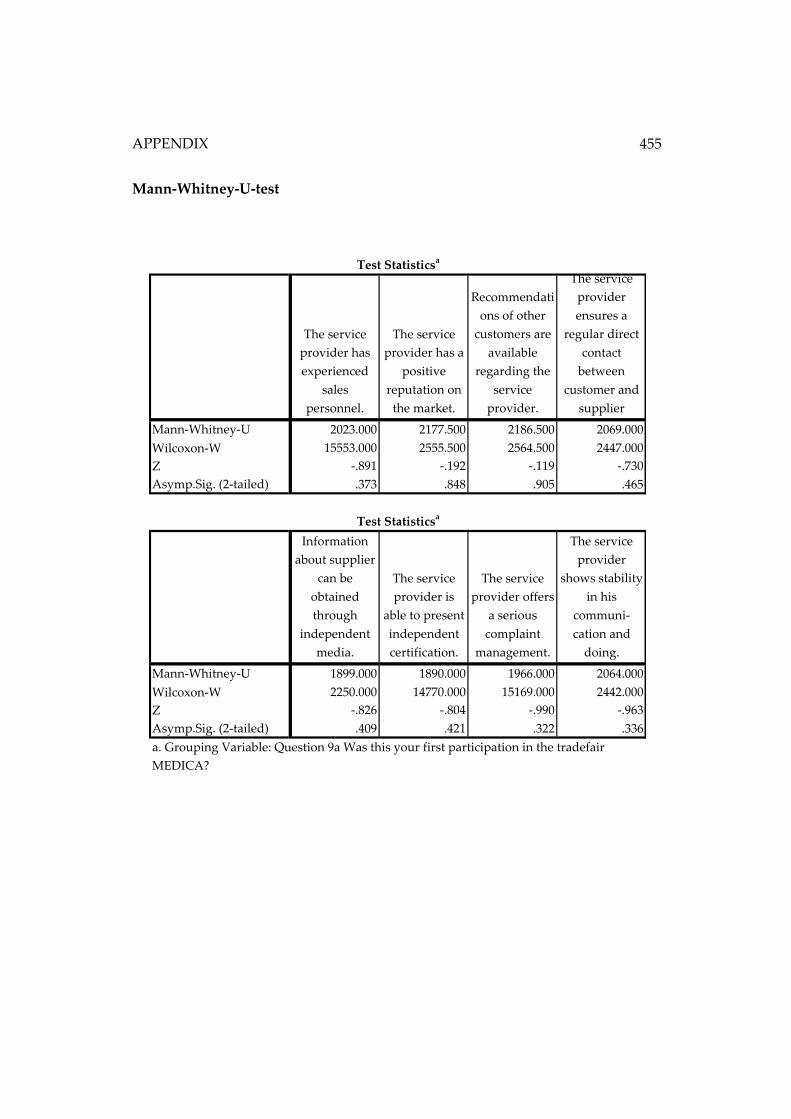
APPENDIX
455
Mann-Whitney-U-test
The service
provider has
experienced
sales
personnel.
The service
provider has a
positive
reputation on
the market.
Recommendati
ons of other
customers are
available
regarding the
service
provider.
The service
provider
ensures a
regular direct
contact
between
customer and
supplier
Mann-Whitney-U 2023.000 2177.500 2186.500 2069.000
Wilcoxon-W 15553.000 2555.500 2564.500 2447.000
Z -.891 -.192 -.119 -.730
Asymp.Sig. (2-tailed) .373 .848 .905 .465
Information
about supplier
can be
obtained
through
independent
media.
The service
provider is
able to present
independent
certification.
The service
provider offers
a serious
complaint
management.
The service
provider
shows stability
in his
communi-
cation and
doing.
Mann-Whitney-U 1899.000 1890.000 1966.000 2064.000
Wilcoxon-W 2250.000 14770.000 15169.000 2442.000
Z -.826 -.804 -.990 -.963
Asymp.Sig. (2-tailed) .409 .421 .322 .336
Test Statisticsa
Test Statisticsa
a. Grouping Variable: Question 9a Was this your first participation in the tradefair
MEDICA?
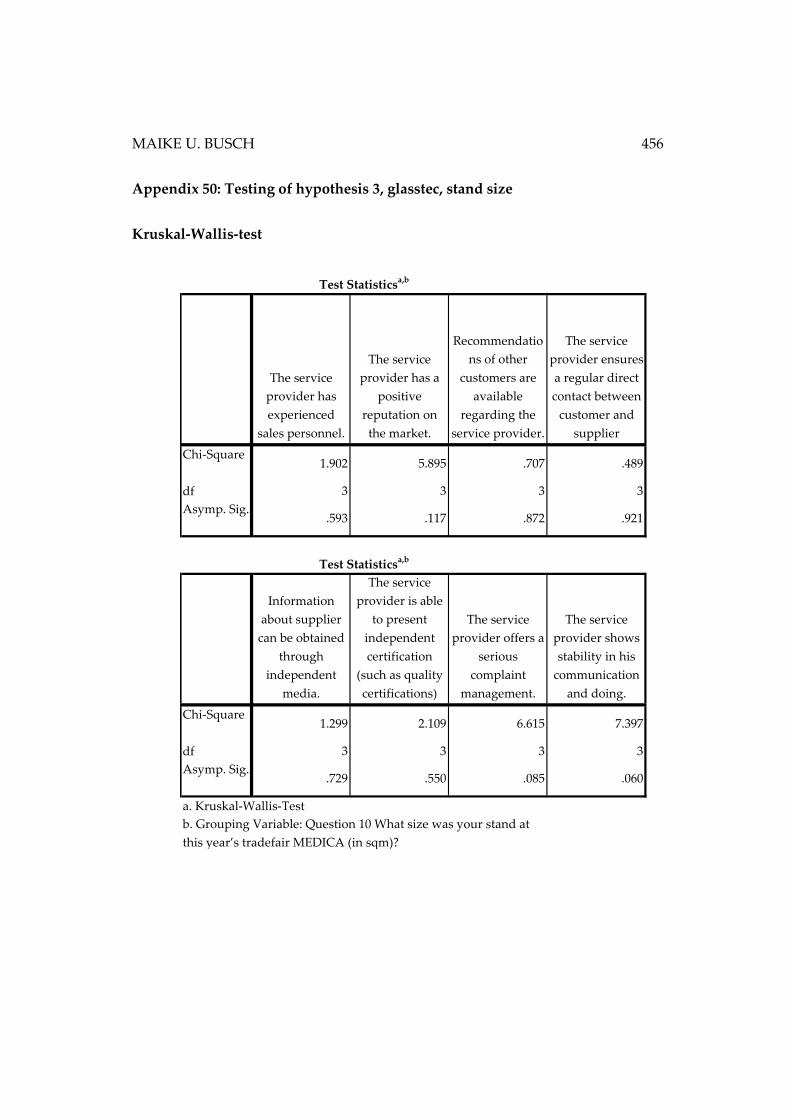
MAIKE U. BUSCH 456
Appendix 50: Testing of hypothesis 3, glasstec, stand size
Kruskal-Wallis-test
The service
provider has
experienced
sales personnel.
The service
provider has a
positive
reputation on
the market.
Recommendatio
ns of other
customers are
available
regarding the
service provider.
The service
provider ensures
a regular direct
contact between
customer and
supplier
Chi-Square1.902 5.895 .707 .489
df 3 3 3 3
Asymp. Sig..593 .117 .872 .921
Information
about supplier
can be obtained
through
independent
media.
The service
provider is able
to present
independent
certification
(such as quality
certifications)
The service
provider offers a
serious
complaint
management.
The service
provider shows
stability in his
communication
and doing.
Chi-Square1.299 2.109 6.615 7.397
df 3 3 3 3
Asymp. Sig..729 .550 .085 .060
Test Statisticsa,b
Test Statisticsa,b
a. Kruskal-Wallis-Test
b. Grouping Variable: Question 10 What size was your stand at
this year’s tradefair MEDICA (in sqm)?
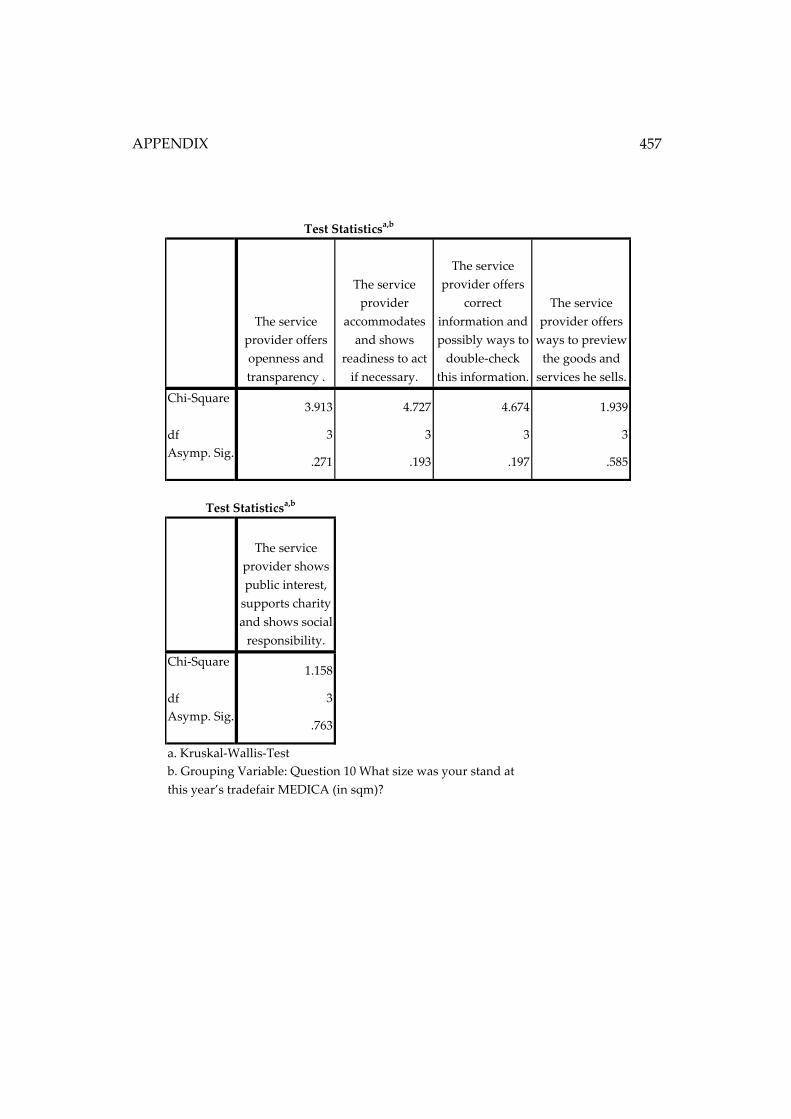
APPENDIX
457
The service
provider offers
openness and
transparency .
The service
provider
accommodates
and shows
readiness to act
if necessary.
The service
provider offers
correct
information and
possibly ways to
double-check
this information.
The service
provider offers
ways to preview
the goods and
services he sells.
Chi-Square3.913 4.727 4.674 1.939
df 3 3 3 3
Asymp. Sig..271 .193 .197 .585
The service
provider shows
public interest,
supports charity
and shows social
responsibility.
Chi-Square1.158
df 3
Asymp. Sig..763
Test Statisticsa,b
Test Statisticsa,b
a. Kruskal-Wallis-Test
b. Grouping Variable: Question 10 What size was your stand at
this year’s tradefair MEDICA (in sqm)?
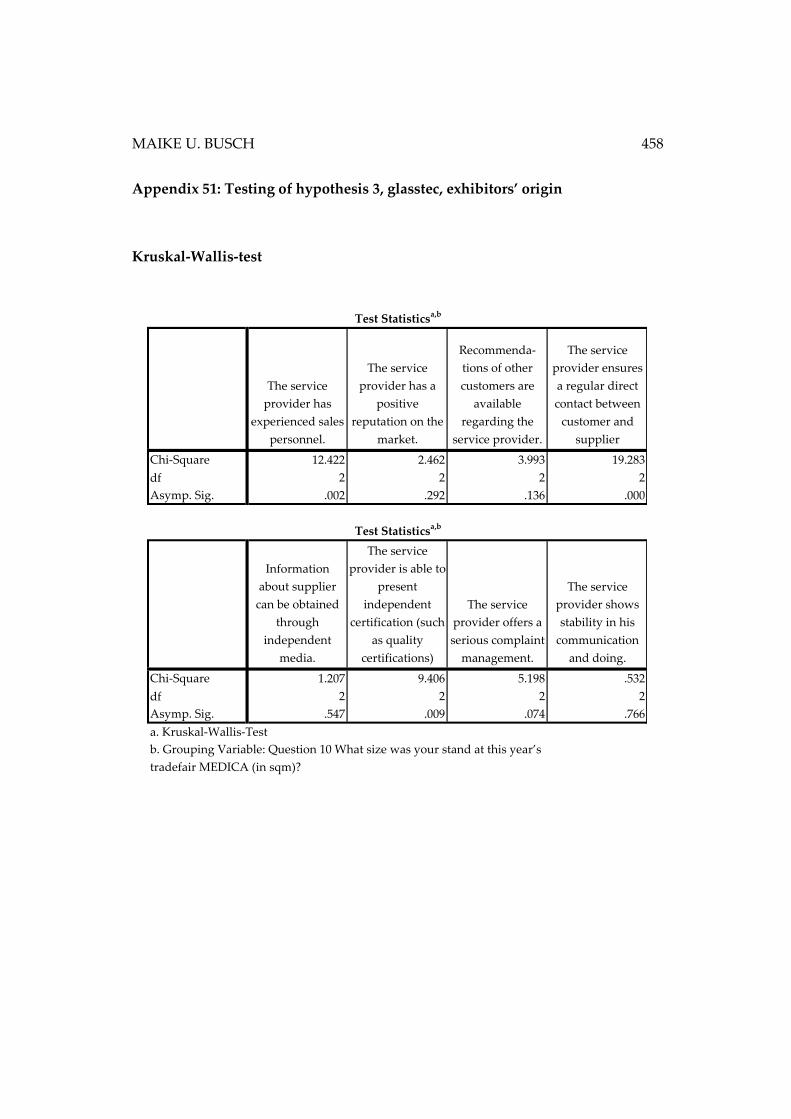
MAIKE U. BUSCH 458
Appendix 51: Testing of hypothesis 3, glasstec, exhibitors’ origin
Kruskal-Wallis-test
The service
provider has
experienced sales
personnel.
The service
provider has a
positive
reputation on the
market.
Recommenda-
tions of other
customers are
available
regarding the
service provider.
The service
provider ensures
a regular direct
contact between
customer and
supplier
Chi-Square 12.422 2.462 3.993 19.283
df 2 2 2 2
Asymp. Sig. .002 .292 .136 .000
Information
about supplier
can be obtained
through
independent
media.
The service
provider is able to
present
independent
certification (such
as quality
certifications)
The service
provider offers a
serious complaint
management.
The service
provider shows
stability in his
communication
and doing.
Chi-Square 1.207 9.406 5.198 .532
df 2 2 2 2
Asymp. Sig. .547 .009 .074 .766
a. Kruskal-Wallis-Test
b. Grouping Variable: Question 10 What size was your stand at this year’s
tradefair MEDICA (in sqm)?
Test Statisticsa,b
Test Statisticsa,b
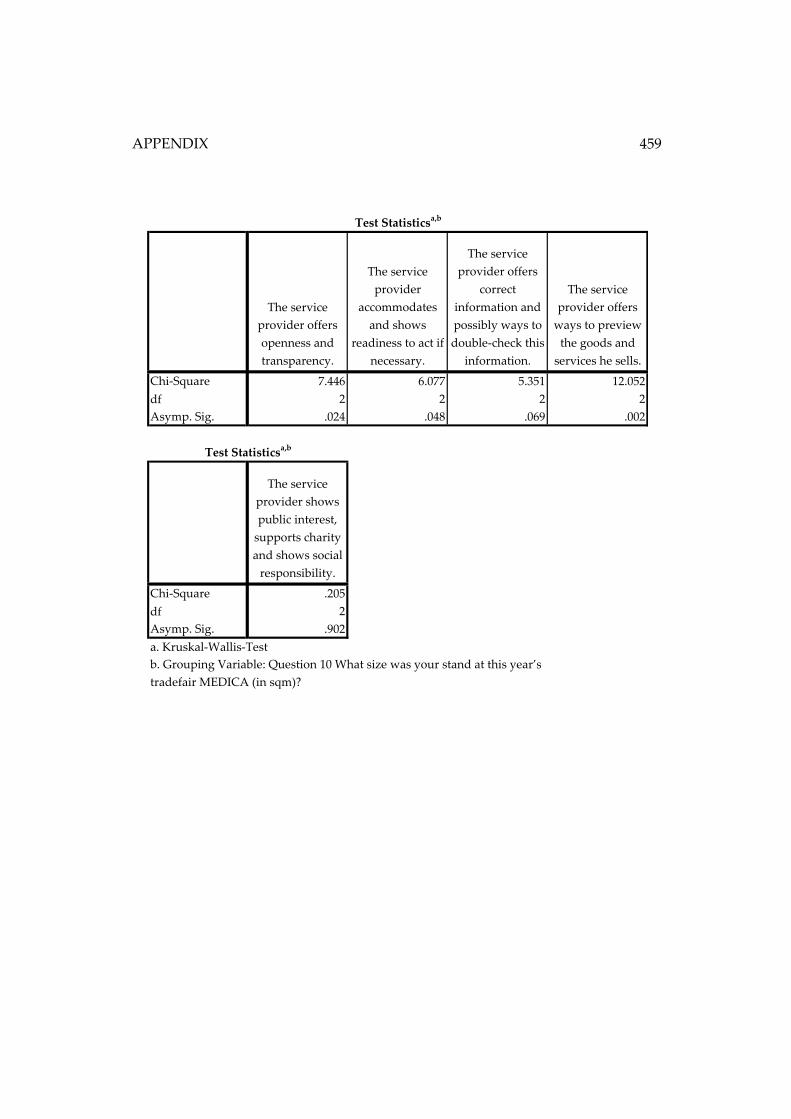
APPENDIX
459
The service
provider offers
openness and
transparency.
The service
provider
accommodates
and shows
readiness to act if
necessary.
The service
provider offers
correct
information and
possibly ways to
double-check this
information.
The service
provider offers
ways to preview
the goods and
services he sells.
Chi-Square 7.446 6.077 5.351 12.052
df 2 2 2 2
Asymp. Sig. .024 .048 .069 .002
The service
provider shows
public interest,
supports charity
and shows social
responsibility.
Chi-Square .205
df 2
Asymp. Sig. .902
Test Statisticsa,b
a. Kruskal-Wallis-Test
b. Grouping Variable: Question 10 What size was your stand at this year’s
tradefair MEDICA (in sqm)?
Test Statisticsa,b
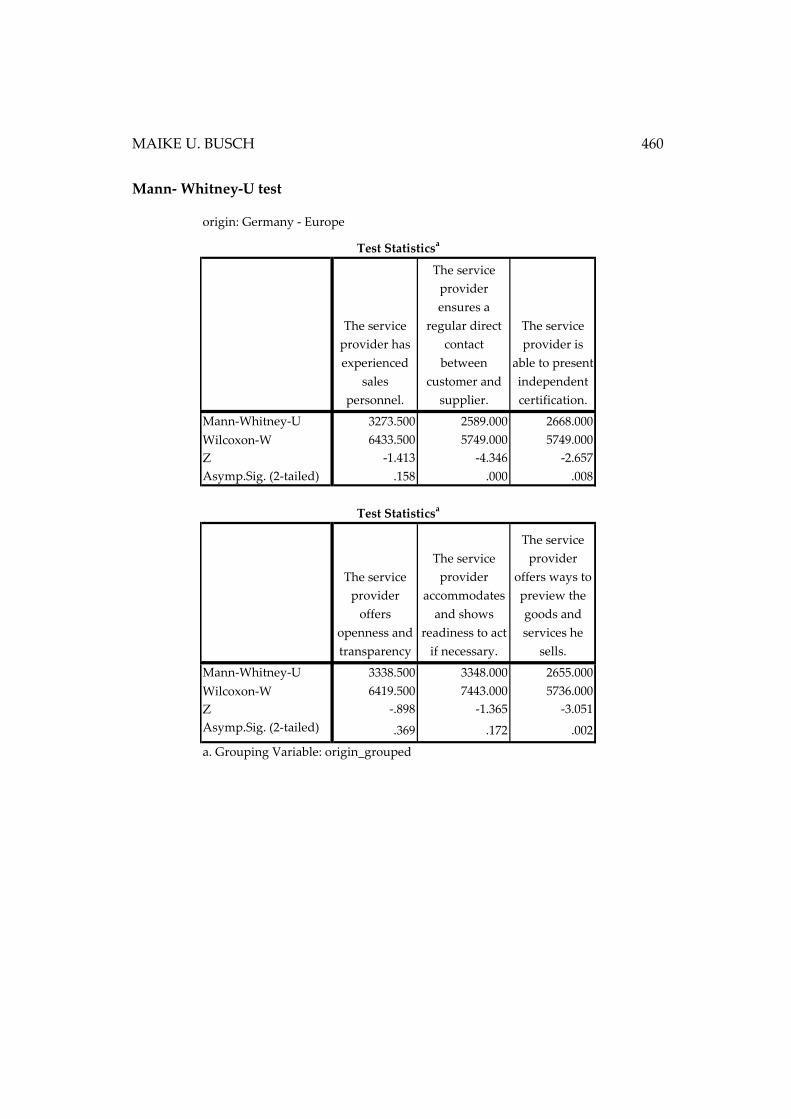
MAIKE U. BUSCH 460
Mann- Whitney-U test
origin: Germany - Europe
The service
provider has
experienced
sales
personnel.
The service
provider
ensures a
regular direct
contact
between
customer and
supplier.
The service
provider is
able to present
independent
certification.
Mann-Whitney-U 3273.500 2589.000 2668.000
Wilcoxon-W 6433.500 5749.000 5749.000
Z -1.413 -4.346 -2.657
Asymp.Sig. (2-tailed) .158 .000 .008
The service
provider
offers
openness and
transparency
The service
provider
accommodates
and shows
readiness to act
if necessary.
The service
provider
offers ways to
preview the
goods and
services he
sells.
Mann-Whitney-U 3338.500 3348.000 2655.000
Wilcoxon-W 6419.500 7443.000 5736.000
Z -.898 -1.365 -3.051
Asymp.Sig. (2-tailed) .369 .172 .002
a. Grouping Variable: origin_grouped
Test Statisticsa
Test Statisticsa
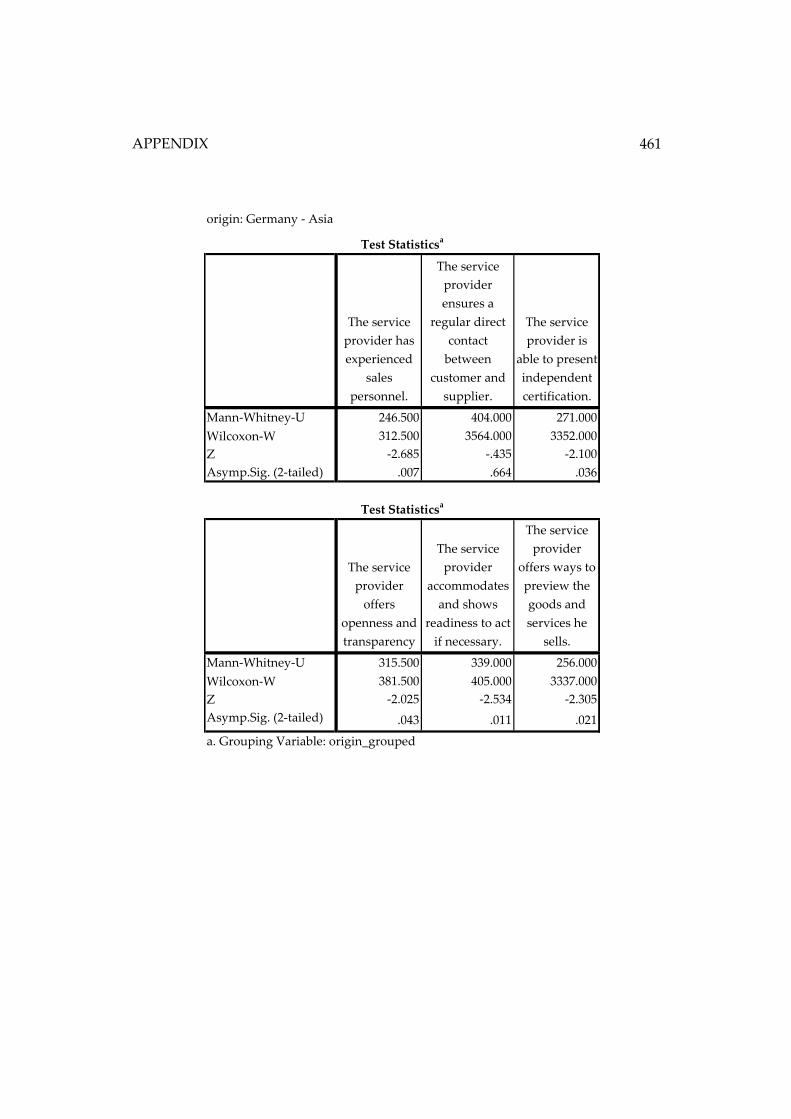
APPENDIX
461
origin: Germany - Asia
The service
provider has
experienced
sales
personnel.
The service
provider
ensures a
regular direct
contact
between
customer and
supplier.
The service
provider is
able to present
independent
certification.
Mann-Whitney-U 246.500 404.000 271.000
Wilcoxon-W 312.500 3564.000 3352.000
Z -2.685 -.435 -2.100
Asymp.Sig. (2-tailed) .007 .664 .036
The service
provider
offers
openness and
transparency
The service
provider
accommodates
and shows
readiness to act
if necessary.
The service
provider
offers ways to
preview the
goods and
services he
sells.
Mann-Whitney-U 315.500 339.000 256.000
Wilcoxon-W 381.500 405.000 3337.000
Z -2.025 -2.534 -2.305
Asymp.Sig. (2-tailed) .043 .011 .021
a. Grouping Variable: origin_grouped
Test Statisticsa
Test Statisticsa
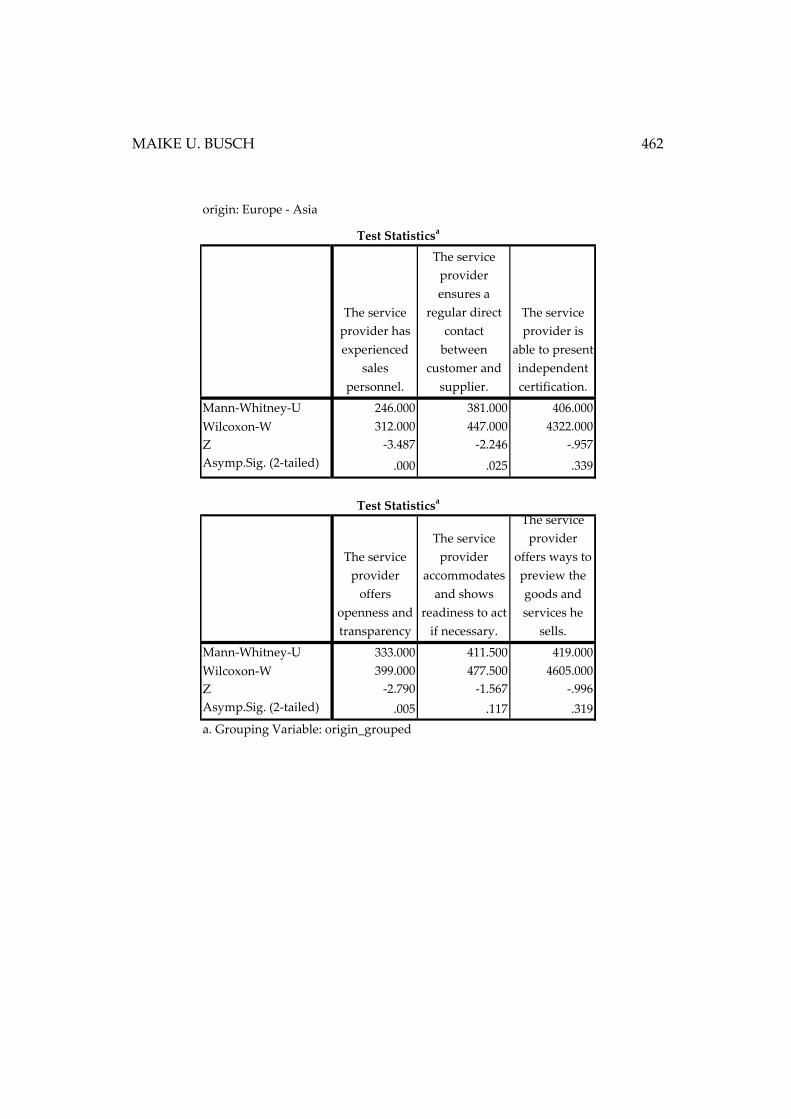
MAIKE U. BUSCH 462
origin: Europe - Asia
The service
provider has
experienced
sales
personnel.
The service
provider
ensures a
regular direct
contact
between
customer and
supplier.
The service
provider is
able to present
independent
certification.
Mann-Whitney-U 246.000 381.000 406.000
Wilcoxon-W 312.000 447.000 4322.000
Z -3.487 -2.246 -.957
Asymp.Sig. (2-tailed) .000 .025 .339
The service
provider
offers
openness and
transparency
The service
provider
accommodates
and shows
readiness to act
if necessary.
The service
provider
offers ways to
preview the
goods and
services he
sells.
Mann-Whitney-U 333.000 411.500 419.000
Wilcoxon-W 399.000 477.500 4605.000
Z -2.790 -1.567 -.996
Asymp.Sig. (2-tailed) .005 .117 .319
Test Statisticsa
a. Grouping Variable: origin_grouped
Test Statisticsa
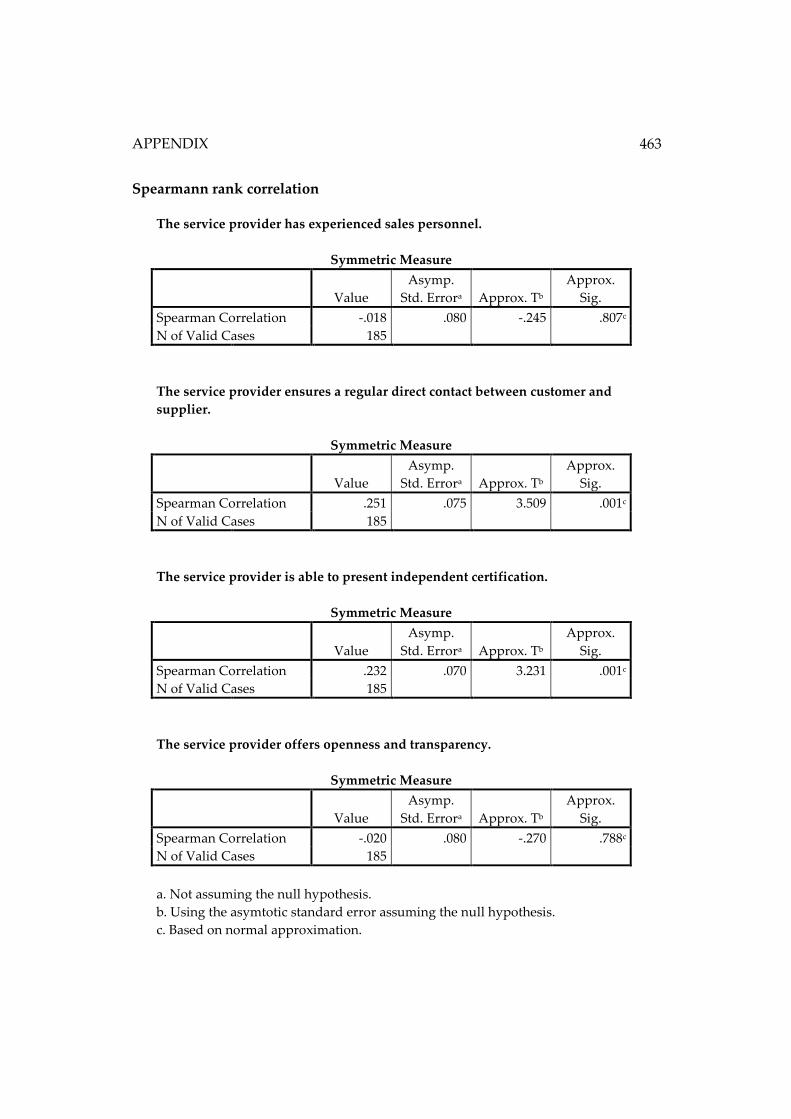
APPENDIX
463
Spearmann rank correlation
The service provider has experienced sales personnel.
Symmetric Measure
Value
Asymp.
Std. Errora Approx. Tb
Approx.
Sig.
Spearman Correlation -.018 .080 -.245 .807c
N of Valid Cases 185
The service provider ensures a regular direct contact between customer and
supplier.
Symmetric Measure
Value
Asymp.
Std. Errora Approx. Tb
Approx.
Sig.
Spearman Correlation .251 .075 3.509 .001c
N of Valid Cases 185
The service provider is able to present independent certification.
Symmetric Measure
Value
Asymp.
Std. Errora Approx. Tb
Approx.
Sig.
Spearman Correlation .232 .070 3.231 .001c
N of Valid Cases 185
The service provider offers openness and transparency.
Symmetric Measure
Value
Asymp.
Std. Errora Approx. Tb
Approx.
Sig.
Spearman Correlation -.020 .080 -.270 .788c
N of Valid Cases 185
a. Not assuming the null hypothesis.
b. Using the asymtotic standard error assuming the null hypothesis.
c. Based on normal approximation.
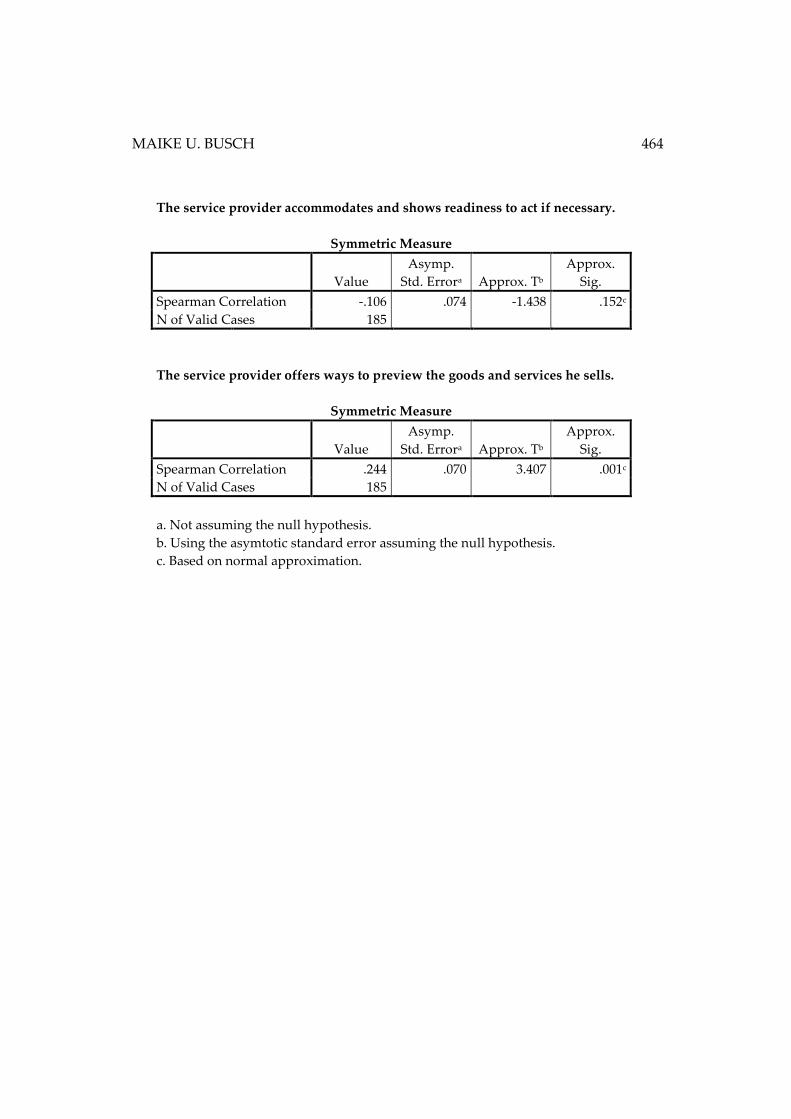
MAIKE U. BUSCH 464
The service provider accommodates and shows readiness to act if necessary.
Symmetric Measure
Value
Asymp.
Std. Errora Approx. Tb
Approx.
Sig.
Spearman Correlation -.106 .074 -1.438 .152c
N of Valid Cases 185
The service provider offers ways to preview the goods and services he sells.
Symmetric Measure
Value
Asymp.
Std. Errora Approx. Tb
Approx.
Sig.
Spearman Correlation .244 .070 3.407 .001c
N of Valid Cases 185
a. Not assuming the null hypothesis.
b. Using the asymtotic standard error assuming the null hypothesis.
c. Based on normal approximation.
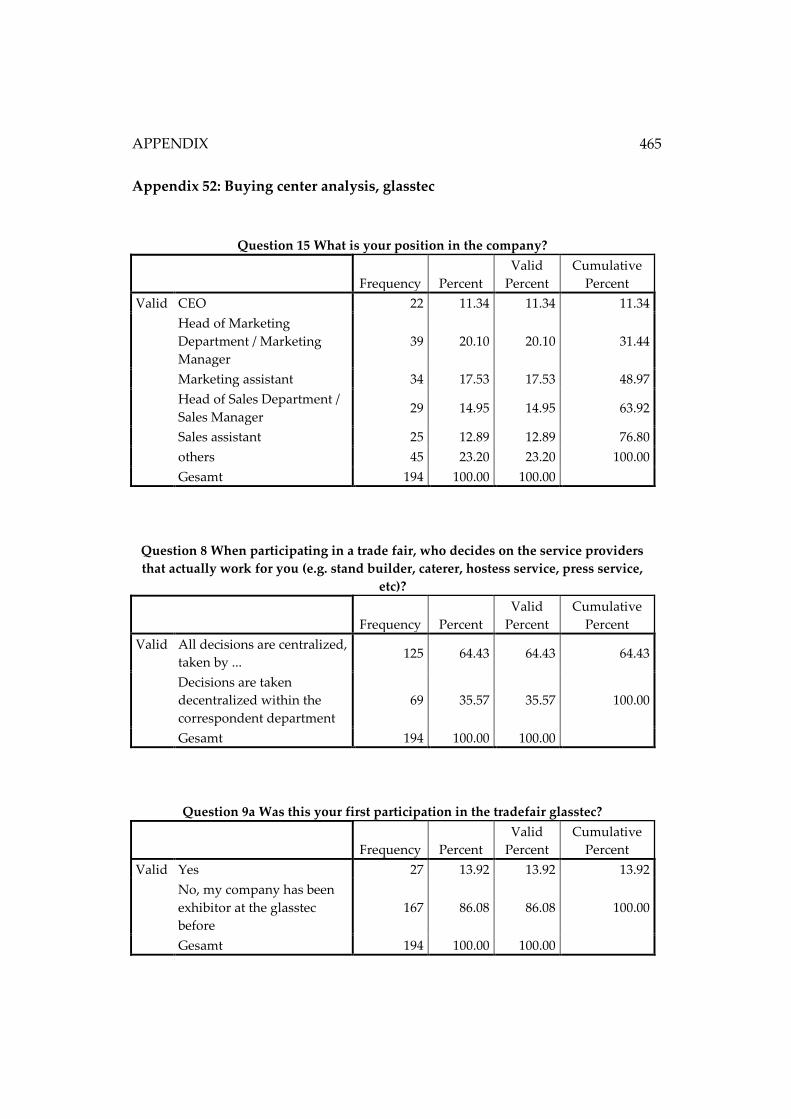
APPENDIX
465
Appendix 52: Buying center analysis, glasstec
Question 15 What is your position in the company?
Frequency Percent
Valid
Percent
Cumulative
Percent
Valid CEO 22 11.34 11.34 11.34
Head of Marketing
Department / Marketing
Manager
39 20.10 20.10 31.44
Marketing assistant 34 17.53 17.53 48.97
Head of Sales Department /
Sales Manager 29 14.95 14.95 63.92
Sales assistant 25 12.89 12.89 76.80
others 45 23.20 23.20 100.00
Gesamt 194 100.00 100.00
Question 8 When participating in a trade fair, who decides on the service providers
that actually work for you (e.g. stand builder, caterer, hostess service, press service,
etc)?
Frequency Percent
Valid
Percent
Cumulative
Percent
Valid All decisions are centralized,
taken by ... 125 64.43 64.43 64.43
Decisions are taken
decentralized within the
correspondent department
69 35.57 35.57 100.00
Gesamt 194 100.00 100.00
Question 9a Was this your first participation in the tradefair glasstec?
Frequency Percent
Valid
Percent
Cumulative
Percent
Valid Yes 27 13.92 13.92 13.92
No, my company has been
exhibitor at the glasstec
before
167 86.08 86.08 100.00
Gesamt 194 100.00 100.00
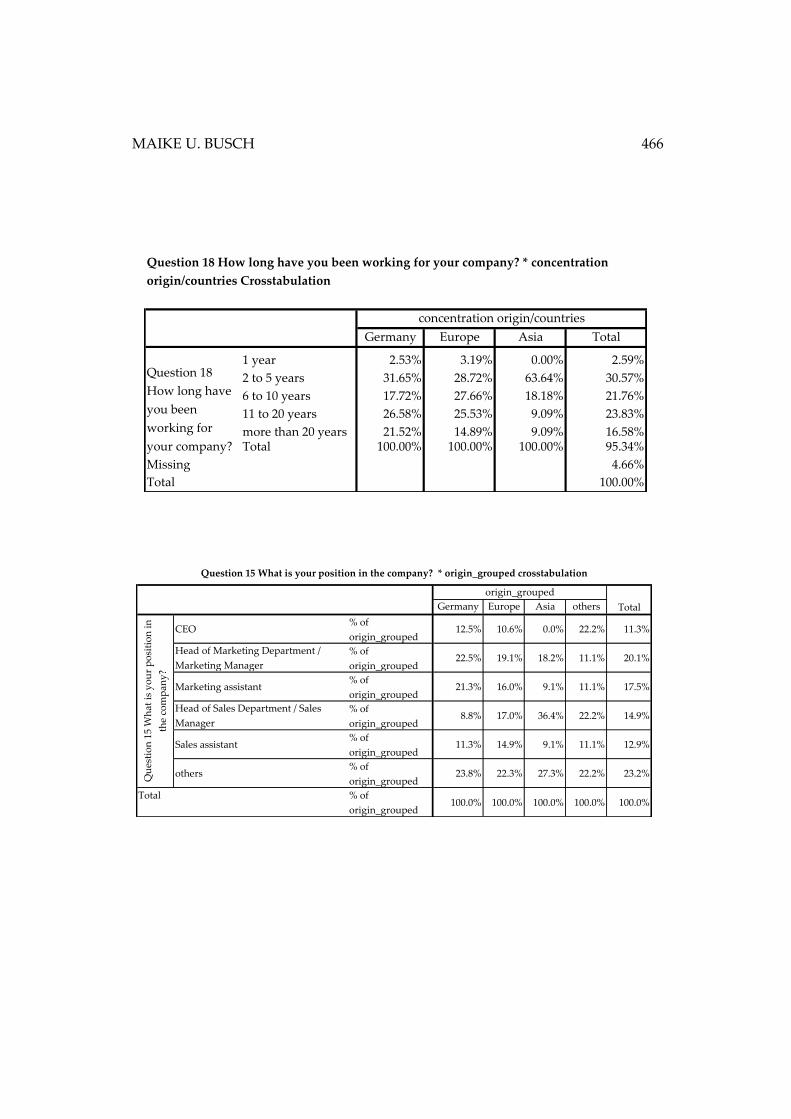
MAIKE U. BUSCH 466
Germany Europe Asia Total
1 year 2.53% 3.19% 0.00% 2.59%
2 to 5 years 31.65% 28.72% 63.64% 30.57%
6 to 10 years 17.72% 27.66% 18.18% 21.76%
11 to 20 years 26.58% 25.53% 9.09% 23.83%
more than 20 years 21.52% 14.89% 9.09% 16.58%Total 100.00% 100.00% 100.00% 95.34%
Missing 4.66%
Total 100.00%
Question 18
How long have
you been
working for
your company?
Question 18 How long have you been working for your company? * concentration
origin/countries Crosstabulation
concentration origin/countries
Germany Europe Asia others
CEO% of
origin_grouped12.5% 10.6% 0.0% 22.2% 11.3%
Head of Marketing Department /
Marketing Manager
% of
origin_grouped22.5% 19.1% 18.2% 11.1% 20.1%
Marketing assistant% of
origin_grouped21.3% 16.0% 9.1% 11.1% 17.5%
Head of Sales Department / Sales
Manager
% of
origin_grouped8.8% 17.0% 36.4% 22.2% 14.9%
Sales assistant% of
origin_grouped11.3% 14.9% 9.1% 11.1% 12.9%
others% of
origin_grouped23.8% 22.3% 27.3% 22.2% 23.2%
% of
origin_grouped100.0% 100.0% 100.0% 100.0% 100.0%
Qu
esti
on
15
Wh
at i
s y
ou
r p
osi
tio
n i
n
the
com
pan
y?
Total
Question 15 What is your position in the company? * origin_grouped crosstabulation
origin_grouped
Total