Embed Size (px)
Citation preview
0018-9545 (c) 2017 IEEE. Personal use is permitted, but republication/redistribution requires IEEE permission. See http://www.ieee.org/publications_standards/publications/rights/index.html for more information.
This article has been accepted for publication in a future issue of this journal, but has not been fully edited. Content may change prior to final publication. Citation information: DOI 10.1109/TVT.2017.2776999, IEEETransactions on Vehicular Technology
1
Self-tuning of service priority parameters foroptimizing Quality of Experience in LTE
P. Oliver-Balsalobre∗, M. Toril∗, S. Luna-Ramırez∗, R. Garcıa †∗Department of Communication Engineering, University of Malaga, 29071, Malaga, Spain.
Email: {pob,mtoril,sluna}@ic.uma.es† Ericsson, Severo Ochoa, 51, E-29590 Malaga, Spain.
Email: [email protected]
Abstract—Rising user expectations are changing theway mobile operators manage their networks. In thispaper, a self-tuning algorithm for adjusting parametersin a multi-service packet scheduler of a Long TermEvolution (LTE) base station is proposed to optimizethe overall system Quality of Experience (QoE) basedon network performance statistics. For this purpose, thealgorithm iteratively changes service priority parametersto re-prioritize services so as to make the most of availableresources. The proposed algorithm ensures that the bestoverall system QoE is always reached by analyzingoptimality conditions, unlike previous works, which onlyguarantee a minimum user satisfaction level or aimto balance QoE among services. Method assessment iscarried out with a dynamic system-level simulator in arealistic service scenario. Simulation results show that theoverall network QoE can be improved by up to 35% bytuning service priority parameters.
Index Terms—Quality of Experience, Long TermEvolution, Self-Organizing Network, optimization, re-prioritization, services.
I. INTRODUCTION
In years to come, an exponential growth in mobilebroadband traffic is foreseen. It is expected that, from2015 to 2021, mobile traffic will be multiplied by10, reaching 25% of Internet total traffic [1]. At thesame time, continuous advances in smartphones andtablets are modifying the general profile of servicesdemanded by mobile users. In the past, mobile ser-vices only required very high data rates. Nowadays,most applications also require a permanent connection,significantly increasing network signaling load [2]. Allthese changes have made mobile network managementa very challenging task [3]. In parallel, the success ofmobile services has made that customers have greaterchoice for devices, services and applications. In acompetitive market where most network and serviceproviders offer similar products, user experience (a.k.a.Quality of Experience, QoE) has become the key dif-ferentiating factor between companies. For this reason,
Copyright (c) 2015 IEEE. Personal use of this material is permit-ted. However, permission to use this material for any other purposesmust be obtained from the IEEE by sending a request to [email protected].
Customer Experience Management (CEM) has beenincorporated into the daily routine of operators [4].
QoE characterization has received a great deal ofattention by the mobile industry. In live networks, userexperience is usually estimated from Quality of Service(QoS) metrics collected by the network, since end-to-end performance indicators are seldom available.Then, QoE modeling relates QoS and QoE indicatorsby means of simple analytical functions [5][6]. FirstQoE models for mobile services (e.g., voice [7], video-telephony [8] or video-streaming [9]) were built basedon very simple network performance indicators. Asvendor equipment evolves, more indicators are avail-able for the construction of new QoE models [10][11].More advanced QoE models also consider the impactof context on user quality perception [12][13]. Thus,two mobile users with the same QoS level mightperceive very different QoE due to context features,such as user location, device technology, time of dayor age.
From QoS measurements, QoE control proceduresassign network resources to ensure an adequate userexperience. To cope with the diversity of servicerequirements, the 3rd Generation Partnership Project(3GPP) has defined the QoS Class Identifier (QCI)to discriminate among different service classes [14].Based on QCI, dynamic Packet Scheduling (PS) algo-rithms assign radio resources (i.e., power, frequencyand time slots) based on QoS thresholds [15][16][17].Basic schedulers provide differentiated services, QoSand user fairness by assigning appropriate weightsto each user queue. More sophisticated schedulersexploit multiuser diversity gain to achieve optimalsystem performance [18][19][20]. In [19], a schedulingalgorithm is proposed to deal with real-time and non-real time traffic in a proportional fair manner. Morerecent works [21][22] propose QoE-aware schedulersthat ensure a minimum QoE for all users. All theseschedulers decide the exact resources assigned to everysingle user in real time, which makes them suitablefor minimum QoS/QoE assurance. However, the aimof most schedulers is to ensure a minimum satisfac-
0018-9545 (c) 2017 IEEE. Personal use is permitted, but republication/redistribution requires IEEE permission. See http://www.ieee.org/publications_standards/publications/rights/index.html for more information.
This article has been accepted for publication in a future issue of this journal, but has not been fully edited. Content may change prior to final publication. Citation information: DOI 10.1109/TVT.2017.2776999, IEEETransactions on Vehicular Technology
2
tion level for the worst users, rather than maximizingthe overall system QoE. Moreover, implementing newadvanced schedulers would require upgrading networkequipment, which is not desired by network operators.
Alternatively, the overall system QoE can alsobe improved by tuning parameters in an existingscheduler. In [23], a self-tuning algorithm for thecontention window parameter in IEEE 802.11 WLANsis presented. Such an algorithm does not discriminatebetween services. Similarly, an adaptation scheme isproposed in [24] for adjusting service priorities tocomply with end-to-end delay constraints. In [25],another adaptive controller is proposed to enforce amaximum delay constraint for multimedia services byadjusting flow priorities. In that work, decisions aremade per service, as each flow has its own controllerindependent from the others. Thus, the aim of eachcontroller is to ensure that every individual traffic flowreaches a target QoS, but neglecting the requirementsof other flows, which could lead to system instabil-ity. In a previous work [26], a self-tuning algorithmfor a multi-service scheduler in LTE is proposed toequalize QoE among services in the context of a Self-Organizing Network (SON). In that work, QoE balanceis ensured by tuning service priorities, increasing thepriority of services with lower QoE. However, QoEbalance does not necessarily lead to the maximumoverall system QoE. To the authors’ knowledge, nomethod has been proposed to adjust service priorityparameters in a multi-service and multi-user schedulerof a radio base station so that optimal overall systemQoE is guaranteed under all traffic load conditions.
In this paper, a self-tuning algorithm for adjust-ing service priority parameters in a classical multi-service multi-user packet scheduler of a LTE basestation is proposed. Similarly to [26], the algorithmiteratively changes service priority parameters to re-prioritize services so as to make the most of availableresources. Unlike in [26], the aim of the algorithmproposed here is to optimize the overall system QoEbased on performance statistics in the network manage-ment system. For this purpose, an optimality conditionis explicitly derived, which is then used to designthe controller that ensures the optimal overall systemQoE. In the problem formulation, context-aware QoEmanagement is considered by reflecting the impact ofuser location on QoE perception. For this purpose, twodifferent QoE models are provided for outdoor andindoor users. Method assessment is carried out in adynamic system-level LTE simulator implementing aregular macrocellular scenario.
The main contributions of this work are: a) theformulation of an optimality condition for the globalQoE when re-prioritizing services, b) the design ofa self-tuning algorithm for adjusting service priorityparameters in a LTE scheduler to maximize the global
QoE, and c) a performance analysis of the proposedcontroller in a realistic multi-service LTE scenario.
The rest of the paper is organized as follows. Sec-tion II formulates the problem of optimizing the overallQoE in a mobile network by re-prioritizing serviceswith scheduler parameters. Section III presents theproposed self-tuning algorithm to optimize the overallsystem QoE. Section IV describes simulation resultsand Section V presents the main conclusions of thework.
II. PROBLEM FORMULATION
In this section, the system model is first outlined,including service models, scheduling algorithm andutility functions. Then, the tuning of service priorityparameters is formulated as an optimization problem.
A. Service models
Service models are identical to those presentedin [26]. Four services are considered:
• Voice over Internet Protocol (VoIP) is a conversa-tional real-time service generating packets of 20bytes every 10 ms, i.e., a bit rate of 16 kbps. AVoIP call is dropped when a user does not receiveenough resources for one second.
• VIDEO service is a buffered videostreaming ser-vice where the packet arrival process is taken fromreal H.264/MPEG-4 AVC file traces. The loadof player’s buffer at the client side varies withavailable bandwidth and video bit rate.
• WEB service is a Hypertext Transfer Protocol(HTTP) web browsing service. A WEB sessionconsists in a number of web pages separated by areading time. The number of pages per session,pages size and reading time are derived fromprobabilistic models [27].
• FTP (File Transfer Protocol) service is a filedownload service. FTP session time is determinedby the time spent downloading the file. As an FTPuser tries to download the file at full speed, FTPsession time depends on the amount of resourcesreceived during the download.
B. Scheduling algorithm
The considered PS algorithm is implemented basedon the classical exponential/proportional fair (EXP/PF)scheme [18], designed for the provision of real-timeservices with different QoS together with non-realtime services. That scheduler is extended in [26] withservice priority parameters to allow re-prioritization ofservices. The reader is referred to [26] for more detailson the scheduling algorithm.
0018-9545 (c) 2017 IEEE. Personal use is permitted, but republication/redistribution requires IEEE permission. See http://www.ieee.org/publications_standards/publications/rights/index.html for more information.
This article has been accepted for publication in a future issue of this journal, but has not been fully edited. Content may change prior to final publication. Citation information: DOI 10.1109/TVT.2017.2776999, IEEETransactions on Vehicular Technology
3
C. Utility functions
Utility functions are closed-form expressions usedto quantify user experience (i.e., QoE) from selectedQoS network statistics. Due to their different nature,each service has its own utility function. In this work,context information is also considered by differentiat-ing between indoor and outdoor locations. Thus, twoutility functions are defined per service, depending onuser location, QoE(jc), where j ∈ {VoIP, VIDEO,FTP, WEB} and c ∈ {outdoor, indoor}. In all utilityfunctions, the output is a Mean Opinion Score (MOS)value, ranging from 1 (worst) to 5 (best). To makeanalysis easier, indoor utility functions are obtainedby changing QoS thresholds in the utility functionsreported in the literature (associated here with outdoorusers). Such changes are introduced to force that indoorusers are more demanding in terms of QoS.
The VoIP utility functions are [28]
QoE(V oIPoutdoor) = 1 + 0.035R
+ 7× 10⁻⁶R(R− 60)(100−R) ,(1)
QoE(V oIPindoor) = 1 + 0.035 R1.5
+ 7× 10⁻⁶ R1.5 ( R
1.5 − 60)(100− R1.5 ) ,
(2)
where R is a factor related to traffic delay (i.e., R = 0when highest delays are experienced, and R = 100for the lowest values). From (1) and (2), it is deducedthat QoE(V oIPoutdoor) and QoE(V oIPindoor) are upperlimited to 4.5 and 3.44, respectively, due to the factthat, even for ideal test conditions, some users maynot rank service experience as flawless.
For buffered videostreaming services, such asYouTube or Netflix, QoE depends on how longthe video takes to start (initial buffering time) andhow many times and for how long the video isfrozen (known as stalling or re-buffering event). Thus,videostreaming utility functions are [9]
QoE(V IDEOoutdoor) = 4.23− 0.0672 Tinit
−0.742 Freb − 0.106 Treb ,(3)
QoE(V IDEOindoor) = 4.23− 0.0672 (1.5 Tinit)
−0.742 (1.5 Freb)− 0.106 (1.5 Treb) ,(4)
where Tinit stands for the initial buffering timein seconds, Freb is the average frequency ofre-buffering events in times per second, andTreb is the total re-buffering time during videoreproduction in seconds [9]. As in the VoIPcase, the model is upper limited to a valuelower than 5 (i.e., max(QoE(V IDEOoutdoor)) =max(QoE(V IDEOindoor)) = 4.23).
The utility functions of FTP and WEB services areboth based on user data throughput, as [29]
QoE(FTPoutdoor) = max(1,min(5, 0.0065 T − 0.54)) , (5)
QoE(FTPindoor) = max(1,min(5, 0.0065T
1.5− 0.54)) , (6)
QoE(WEBoutdoor) = 5− 578
1 +(T+541.145.98
)2 , (7)
QoE(WEBindoor) = 5− 578
1 +(
T1.5+541.1
45.98
)2 , (8)
where T is the average user throughput in kbps. Bycomparing WEB and FTP functions, it is deducedthat WEB is not as demanding as FTP. On the onehand, QoE(WEBoutdoor) > QoE(FTPoutdoor) for lowT values, showing that a WEB user needs fewerresources to perceive an acceptable service level. Onthe other hand, QoE(WEBoutdoor) < QoE(FTPoutdoor)
for high T values, so that, from some value on, higherthroughput does not influence web user satisfaction,but does influence on an FTP user.
D. Optimization problem
The problem of tuning service priority parametersin the scheduler of a base station can be formulated asa classical optimization problem.
The decision variables are the service priority pa-rameters, hereafter denoted as SPI(j), j ∈ {VoIP,VIDEO, FTP, WEB}. The Figure of Merit (FoM) tobe maximized is the overall system QoE, QoEglobal,defined as
QoEglobal =1
Ns
Ns∑
j=1
QoE(j)
, (9)
where Ns is the number of services in the network (4,in this work), and QoE
(j)is the average QoE for users
of service j, calculated as
QoE(j)
=1
Nj
Nj∑
u=1
QoE(j)(u) , (10)
where Nj is the number of users for service j andQoE(j)(u) is the QoE perceived by user u of servicej, estimated from utility functions in (1)-(8).
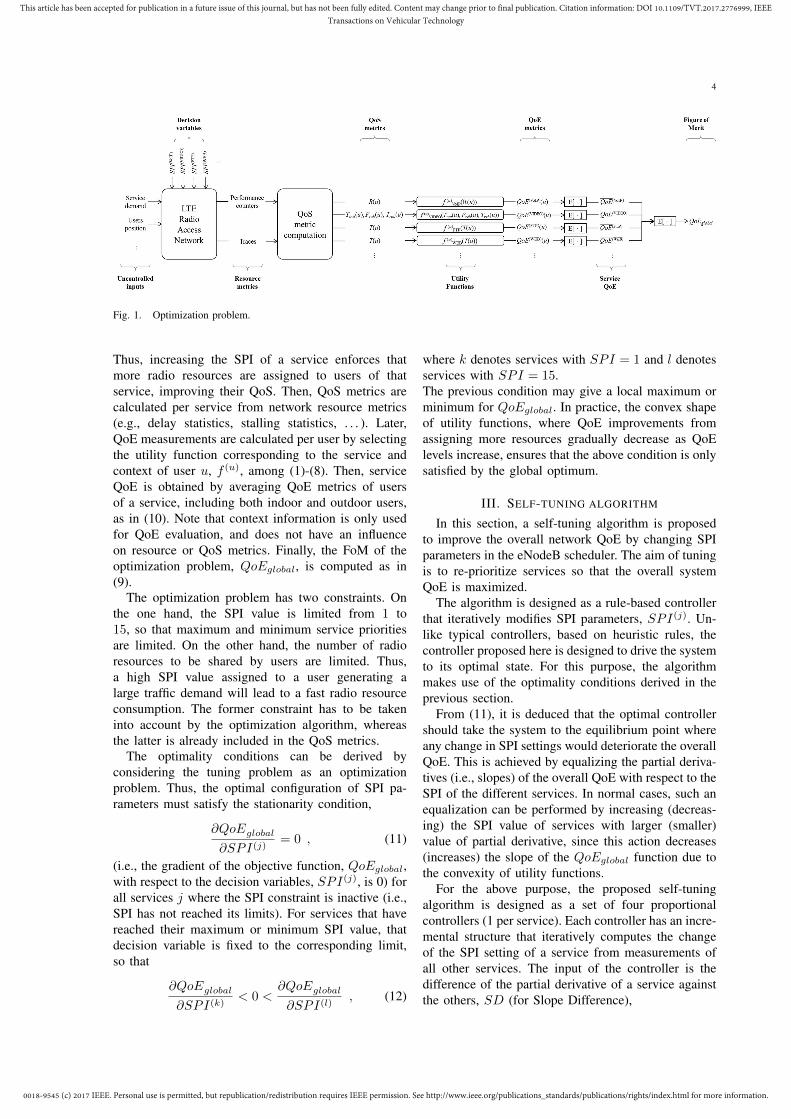
In the previous formulas, the dependence of FoM(overall system QoE) on decision variables (SPI set-tings) is omitted for the sake of clarity. Fig. 1 breaksdown all the terms involved in such a relationship. Onthe left of the figure, network performance dependson uncontrolled inputs (e.g., service user demand, userlocations, . . . ) and decision variables (i.e., SPI(j)).
0018-9545 (c) 2017 IEEE. Personal use is permitted, but republication/redistribution requires IEEE permission. See http://www.ieee.org/publications_standards/publications/rights/index.html for more information.
This article has been accepted for publication in a future issue of this journal, but has not been fully edited. Content may change prior to final publication. Citation information: DOI 10.1109/TVT.2017.2776999, IEEETransactions on Vehicular Technology
4
Fig. 1. Optimization problem.
Thus, increasing the SPI of a service enforces thatmore radio resources are assigned to users of thatservice, improving their QoS. Then, QoS metrics arecalculated per service from network resource metrics(e.g., delay statistics, stalling statistics, . . . ). Later,QoE measurements are calculated per user by selectingthe utility function corresponding to the service andcontext of user u, f (u), among (1)-(8). Then, serviceQoE is obtained by averaging QoE metrics of usersof a service, including both indoor and outdoor users,as in (10). Note that context information is only usedfor QoE evaluation, and does not have an influenceon resource or QoS metrics. Finally, the FoM of theoptimization problem, QoEglobal, is computed as in(9).
The optimization problem has two constraints. Onthe one hand, the SPI value is limited from 1 to15, so that maximum and minimum service prioritiesare limited. On the other hand, the number of radioresources to be shared by users are limited. Thus,a high SPI value assigned to a user generating alarge traffic demand will lead to a fast radio resourceconsumption. The former constraint has to be takeninto account by the optimization algorithm, whereasthe latter is already included in the QoS metrics.
The optimality conditions can be derived byconsidering the tuning problem as an optimizationproblem. Thus, the optimal configuration of SPI pa-rameters must satisfy the stationarity condition,
∂QoEglobal
∂SPI(j)= 0 , (11)
(i.e., the gradient of the objective function, QoEglobal,with respect to the decision variables, SPI(j), is 0) forall services j where the SPI constraint is inactive (i.e.,SPI has not reached its limits). For services that havereached their maximum or minimum SPI value, thatdecision variable is fixed to the corresponding limit,so that
∂QoEglobal
∂SPI(k)< 0 <
∂QoEglobal
∂SPI(l), (12)
where k denotes services with SPI = 1 and l denotesservices with SPI = 15.The previous condition may give a local maximum orminimum for QoEglobal. In practice, the convex shapeof utility functions, where QoE improvements fromassigning more resources gradually decrease as QoElevels increase, ensures that the above condition is onlysatisfied by the global optimum.
III. SELF-TUNING ALGORITHM
In this section, a self-tuning algorithm is proposedto improve the overall network QoE by changing SPIparameters in the eNodeB scheduler. The aim of tuningis to re-prioritize services so that the overall systemQoE is maximized.
The algorithm is designed as a rule-based controllerthat iteratively modifies SPI parameters, SPI(j). Un-like typical controllers, based on heuristic rules, thecontroller proposed here is designed to drive the systemto its optimal state. For this purpose, the algorithmmakes use of the optimality conditions derived in theprevious section.
From (11), it is deduced that the optimal controllershould take the system to the equilibrium point whereany change in SPI settings would deteriorate the overallQoE. This is achieved by equalizing the partial deriva-tives (i.e., slopes) of the overall QoE with respect to theSPI of the different services. In normal cases, such anequalization can be performed by increasing (decreas-ing) the SPI value of services with larger (smaller)value of partial derivative, since this action decreases(increases) the slope of the QoEglobal function due tothe convexity of utility functions.
For the above purpose, the proposed self-tuningalgorithm is designed as a set of four proportionalcontrollers (1 per service). Each controller has an incre-mental structure that iteratively computes the changeof the SPI setting of a service from measurements ofall other services. The input of the controller is thedifference of the partial derivative of a service againstthe others, SD (for Slope Difference),
0018-9545 (c) 2017 IEEE. Personal use is permitted, but republication/redistribution requires IEEE permission. See http://www.ieee.org/publications_standards/publications/rights/index.html for more information.
This article has been accepted for publication in a future issue of this journal, but has not been fully edited. Content may change prior to final publication. Citation information: DOI 10.1109/TVT.2017.2776999, IEEETransactions on Vehicular Technology
5
SD(j) =∂QoEglobal
∂SPI(j)− 1
Ns − 1
∑
k 6=j
∂QoEglobal
∂SPI(k), (13)
i.e., the slope of QoEglobal with respect to SPI ofservice j, SPI(j), minus the average of that of theother services. A positive value of SD(j) indicates that∂QoEglobal
∂SPI(j) is larger than the average of ∂QoEglobal
∂SPI(k) , sothat SPI(j) should be increased. In contrast, a negativevalue of SD(j) indicates that ∂QoEglobal
∂SPI(j) is smallerthan the average of ∂QoEglobal
∂SPI(k) , meaning that SPI(j)
should be decreased. For brevity, the expressions ofpartial derivatives for different services are describedin Appendix A.
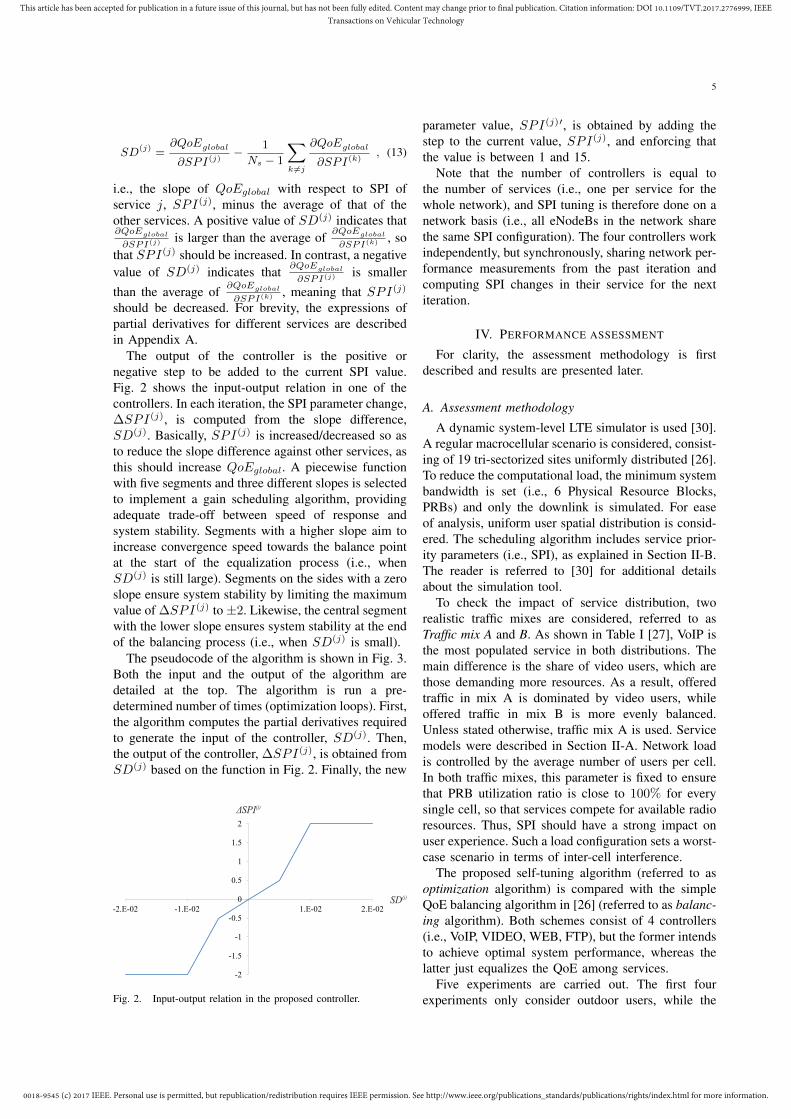
The output of the controller is the positive ornegative step to be added to the current SPI value.Fig. 2 shows the input-output relation in one of thecontrollers. In each iteration, the SPI parameter change,∆SPI(j), is computed from the slope difference,SD(j). Basically, SPI(j) is increased/decreased so asto reduce the slope difference against other services, asthis should increase QoEglobal. A piecewise functionwith five segments and three different slopes is selectedto implement a gain scheduling algorithm, providingadequate trade-off between speed of response andsystem stability. Segments with a higher slope aim toincrease convergence speed towards the balance pointat the start of the equalization process (i.e., whenSD(j) is still large). Segments on the sides with a zeroslope ensure system stability by limiting the maximumvalue of ∆SPI(j) to ±2. Likewise, the central segmentwith the lower slope ensures system stability at the endof the balancing process (i.e., when SD(j) is small).
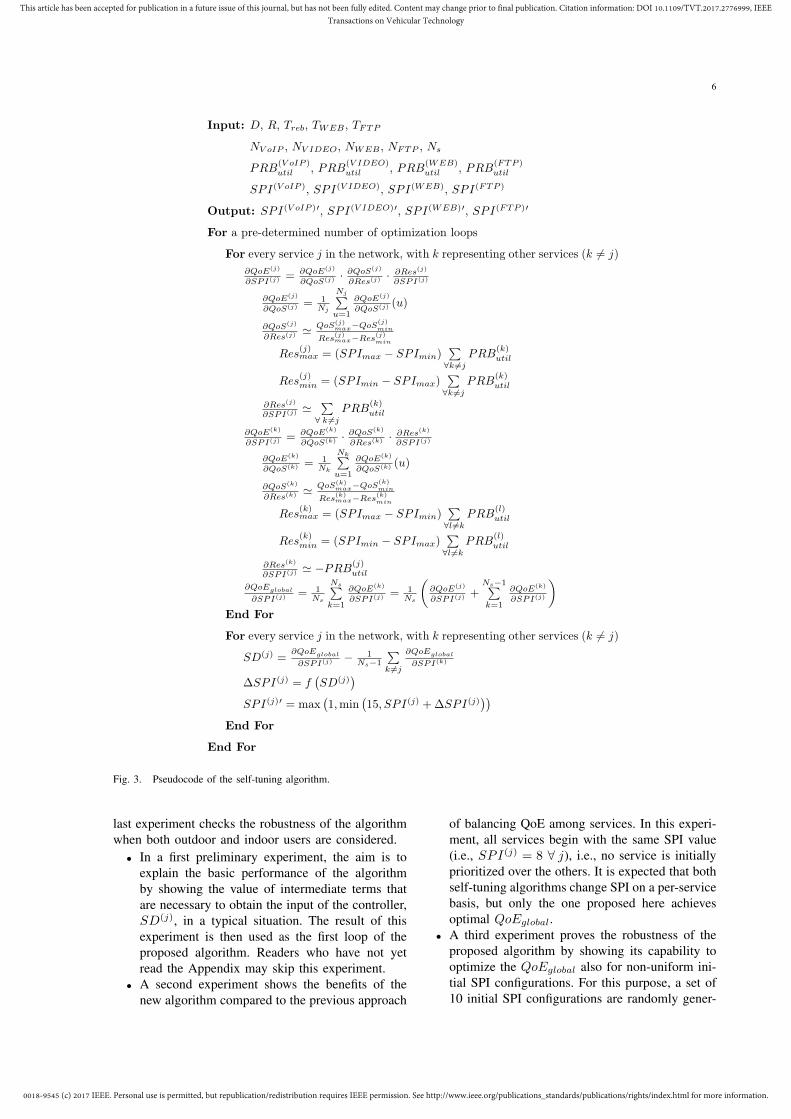
The pseudocode of the algorithm is shown in Fig. 3.Both the input and the output of the algorithm aredetailed at the top. The algorithm is run a pre-determined number of times (optimization loops). First,the algorithm computes the partial derivatives requiredto generate the input of the controller, SD(j). Then,the output of the controller, ∆SPI(j), is obtained fromSD(j) based on the function in Fig. 2. Finally, the new
ΔSPI(j)
-2
-1.5
-1
-0.5
0
0.5
1
1.5
2
-2.E-02 -1.E-02 1.E-02 2.E-02
SD(j)
Fig. 2. Input-output relation in the proposed controller.
parameter value, SPI(j)′, is obtained by adding thestep to the current value, SPI(j), and enforcing thatthe value is between 1 and 15.
Note that the number of controllers is equal tothe number of services (i.e., one per service for thewhole network), and SPI tuning is therefore done on anetwork basis (i.e., all eNodeBs in the network sharethe same SPI configuration). The four controllers workindependently, but synchronously, sharing network per-formance measurements from the past iteration andcomputing SPI changes in their service for the nextiteration.
IV. PERFORMANCE ASSESSMENT
For clarity, the assessment methodology is firstdescribed and results are presented later.
A. Assessment methodology
A dynamic system-level LTE simulator is used [30].A regular macrocellular scenario is considered, consist-ing of 19 tri-sectorized sites uniformly distributed [26].To reduce the computational load, the minimum systembandwidth is set (i.e., 6 Physical Resource Blocks,PRBs) and only the downlink is simulated. For easeof analysis, uniform user spatial distribution is consid-ered. The scheduling algorithm includes service prior-ity parameters (i.e., SPI), as explained in Section II-B.The reader is referred to [30] for additional detailsabout the simulation tool.
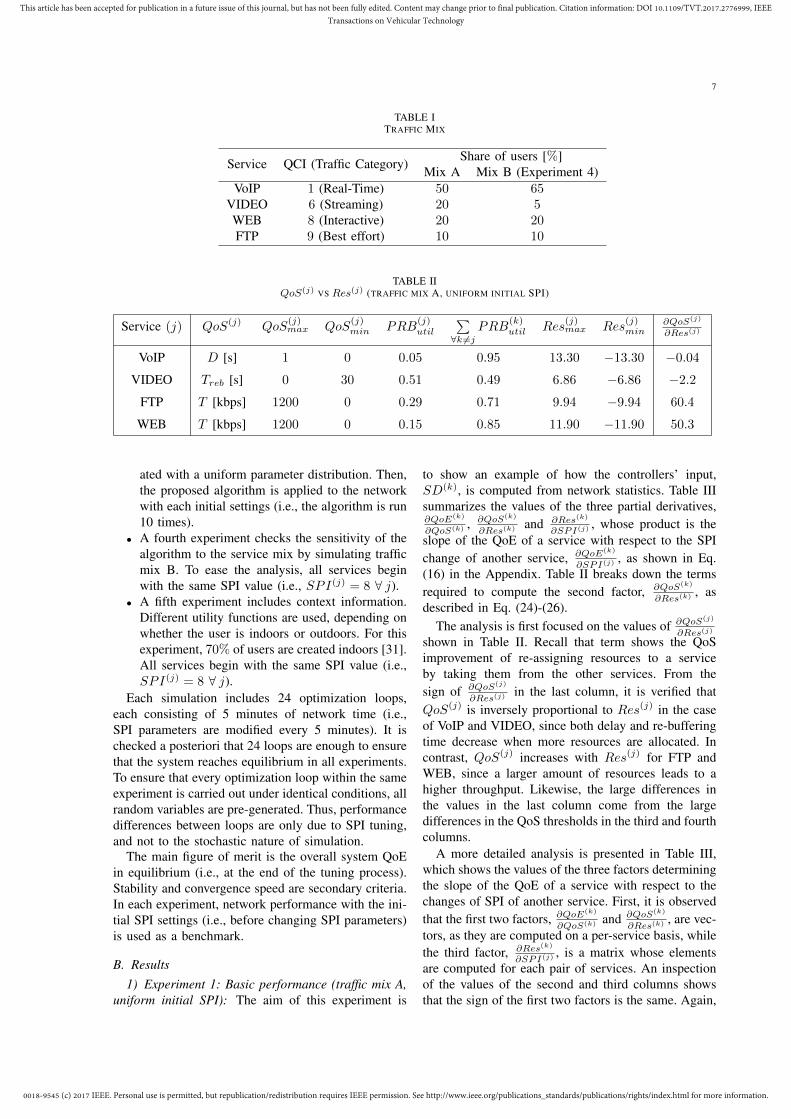
To check the impact of service distribution, tworealistic traffic mixes are considered, referred to asTraffic mix A and B. As shown in Table I [27], VoIP isthe most populated service in both distributions. Themain difference is the share of video users, which arethose demanding more resources. As a result, offeredtraffic in mix A is dominated by video users, whileoffered traffic in mix B is more evenly balanced.Unless stated otherwise, traffic mix A is used. Servicemodels were described in Section II-A. Network loadis controlled by the average number of users per cell.In both traffic mixes, this parameter is fixed to ensurethat PRB utilization ratio is close to 100% for everysingle cell, so that services compete for available radioresources. Thus, SPI should have a strong impact onuser experience. Such a load configuration sets a worst-case scenario in terms of inter-cell interference.
The proposed self-tuning algorithm (referred to asoptimization algorithm) is compared with the simpleQoE balancing algorithm in [26] (referred to as balanc-ing algorithm). Both schemes consist of 4 controllers(i.e., VoIP, VIDEO, WEB, FTP), but the former intendsto achieve optimal system performance, whereas thelatter just equalizes the QoE among services.
Five experiments are carried out. The first fourexperiments only consider outdoor users, while the
0018-9545 (c) 2017 IEEE. Personal use is permitted, but republication/redistribution requires IEEE permission. See http://www.ieee.org/publications_standards/publications/rights/index.html for more information.
This article has been accepted for publication in a future issue of this journal, but has not been fully edited. Content may change prior to final publication. Citation information: DOI 10.1109/TVT.2017.2776999, IEEETransactions on Vehicular Technology
6
Input: D, R, Treb, TWEB, TFTP
NV oIP , NV IDEO, NWEB, NFTP , Ns
PRB(V oIP )util , PRB
(V IDEO)util , PRB
(WEB)util , PRB
(FTP )util
SPI(V oIP ), SPI(V IDEO), SPI(WEB), SPI(FTP )
Output: SPI(V oIP )′, SPI(V IDEO)′, SPI(WEB)′, SPI(FTP )′
For a pre-determined number of optimization loops
For every service j in the network, with k representing other services (k 6= j)
∂QoE(j)
∂SPI(j) = ∂QoE(j)
∂QoS(j) · ∂QoS(j)
∂Res(j)· ∂Res(j)
∂SPI(j)
∂QoE(j)
∂QoS(j) = 1Nj
Nj∑u=1
∂QoE(j)
∂QoS(j) (u)
∂QoS(j)
∂Res(j)≃ QoS(j)
max−QoS(j)min
Res(j)max−Res
(j)min
Res(j)max = (SPImax − SPImin)
∑∀k 6=j
PRB(k)util
Res(j)min = (SPImin − SPImax)
∑∀k 6=j
PRB(k)util
∂Res(j)
∂SPI(j) ≃ ∑∀ k 6=j
PRB(k)util
∂QoE(k)
∂SPI(j) = ∂QoE(k)
∂QoS(k) · ∂QoS(k)
∂Res(k) · ∂Res(k)
∂SPI(j)
∂QoE(k)
∂QoS(k) = 1Nk
Nk∑u=1
∂QoE(k)
∂QoS(k) (u)
∂QoS(k)
∂Res(k) ≃ QoS(k)max−QoS
(k)min
Res(k)max−Res
(k)min
Res(k)max = (SPImax − SPImin)
∑∀l 6=k
PRB(l)util
Res(k)min = (SPImin − SPImax)
∑∀l 6=k
PRB(l)util
∂Res(k)
∂SPI(j) ≃ −PRB(j)util
∂QoEglobal
∂SPI(j) = 1Ns
Ns∑k=1
∂QoE(k)
∂SPI(j) = 1Ns
(∂QoE(j)
∂SPI(j) +Ns−1∑k=1
∂QoE(k)
∂SPI(j)
)
End For
For every service j in the network, with k representing other services (k 6= j)
SD(j) =∂QoEglobal
∂SPI(j) − 1Ns−1
∑k 6=j
∂QoEglobal
∂SPI(k)
∆SPI(j) = f(SD(j)
)
SPI(j)′ = max(1,min
(15, SPI(j) +∆SPI(j)
))
End For
End For
Fig. 3. Pseudocode of the self-tuning algorithm.
last experiment checks the robustness of the algorithmwhen both outdoor and indoor users are considered.• In a first preliminary experiment, the aim is to
explain the basic performance of the algorithmby showing the value of intermediate terms thatare necessary to obtain the input of the controller,SD(j), in a typical situation. The result of thisexperiment is then used as the first loop of theproposed algorithm. Readers who have not yetread the Appendix may skip this experiment.
• A second experiment shows the benefits of thenew algorithm compared to the previous approach
of balancing QoE among services. In this experi-ment, all services begin with the same SPI value(i.e., SPI(j) = 8 ∀ j), i.e., no service is initiallyprioritized over the others. It is expected that bothself-tuning algorithms change SPI on a per-servicebasis, but only the one proposed here achievesoptimal QoEglobal.
• A third experiment proves the robustness of theproposed algorithm by showing its capability tooptimize the QoEglobal also for non-uniform ini-tial SPI configurations. For this purpose, a set of10 initial SPI configurations are randomly gener-
0018-9545 (c) 2017 IEEE. Personal use is permitted, but republication/redistribution requires IEEE permission. See http://www.ieee.org/publications_standards/publications/rights/index.html for more information.
This article has been accepted for publication in a future issue of this journal, but has not been fully edited. Content may change prior to final publication. Citation information: DOI 10.1109/TVT.2017.2776999, IEEETransactions on Vehicular Technology
7
TABLE ITRAFFIC MIX
Service QCI (Traffic Category) Share of users [%]Mix A Mix B (Experiment 4)
VoIP 1 (Real-Time) 50 65VIDEO 6 (Streaming) 20 5WEB 8 (Interactive) 20 20FTP 9 (Best effort) 10 10
TABLE IIQoS(j) VS Res(j) (TRAFFIC MIX A, UNIFORM INITIAL SPI)
Service (j) QoS(j) QoS(j)max QoS
(j)min PRB
(j)util
∑∀k 6=j
PRB(k)util Res
(j)max Res
(j)min
∂QoS(j)
∂Res(j)
VoIP D [s] 1 0 0.05 0.95 13.30 −13.30 −0.04
VIDEO Treb [s] 0 30 0.51 0.49 6.86 −6.86 −2.2
FTP T [kbps] 1200 0 0.29 0.71 9.94 −9.94 60.4
WEB T [kbps] 1200 0 0.15 0.85 11.90 −11.90 50.3
ated with a uniform parameter distribution. Then,the proposed algorithm is applied to the networkwith each initial settings (i.e., the algorithm is run10 times).
• A fourth experiment checks the sensitivity of thealgorithm to the service mix by simulating trafficmix B. To ease the analysis, all services beginwith the same SPI value (i.e., SPI(j) = 8 ∀ j).
• A fifth experiment includes context information.Different utility functions are used, depending onwhether the user is indoors or outdoors. For thisexperiment, 70% of users are created indoors [31].All services begin with the same SPI value (i.e.,SPI(j) = 8 ∀ j).
Each simulation includes 24 optimization loops,each consisting of 5 minutes of network time (i.e.,SPI parameters are modified every 5 minutes). It ischecked a posteriori that 24 loops are enough to ensurethat the system reaches equilibrium in all experiments.To ensure that every optimization loop within the sameexperiment is carried out under identical conditions, allrandom variables are pre-generated. Thus, performancedifferences between loops are only due to SPI tuning,and not to the stochastic nature of simulation.
The main figure of merit is the overall system QoEin equilibrium (i.e., at the end of the tuning process).Stability and convergence speed are secondary criteria.In each experiment, network performance with the ini-tial SPI settings (i.e., before changing SPI parameters)is used as a benchmark.
B. Results1) Experiment 1: Basic performance (traffic mix A,
uniform initial SPI): The aim of this experiment is
to show an example of how the controllers’ input,SD(k), is computed from network statistics. Table IIIsummarizes the values of the three partial derivatives,∂QoE(k)
∂QoS(k) , ∂QoS(k)
∂Res(k) and ∂Res(k)
∂SPI(j) , whose product is theslope of the QoE of a service with respect to the SPIchange of another service, ∂QoE(k)
∂SPI(j) , as shown in Eq.(16) in the Appendix. Table II breaks down the termsrequired to compute the second factor, ∂QoS(k)
∂Res(k) , asdescribed in Eq. (24)-(26).
The analysis is first focused on the values of ∂QoS(j)
∂Res(j)
shown in Table II. Recall that term shows the QoSimprovement of re-assigning resources to a serviceby taking them from the other services. From thesign of ∂QoS(j)
∂Res(j)in the last column, it is verified that
QoS(j) is inversely proportional to Res(j) in the caseof VoIP and VIDEO, since both delay and re-bufferingtime decrease when more resources are allocated. Incontrast, QoS(j) increases with Res(j) for FTP andWEB, since a larger amount of resources leads to ahigher throughput. Likewise, the large differences inthe values in the last column come from the largedifferences in the QoS thresholds in the third and fourthcolumns.
A more detailed analysis is presented in Table III,which shows the values of the three factors determiningthe slope of the QoE of a service with respect to thechanges of SPI of another service. First, it is observedthat the first two factors, ∂QoE(k)
∂QoS(k) and ∂QoS(k)
∂Res(k) , are vec-tors, as they are computed on a per-service basis, whilethe third factor, ∂Res(k)
∂SPI(j) , is a matrix whose elementsare computed for each pair of services. An inspectionof the values of the second and third columns showsthat the sign of the first two factors is the same. Again,
0018-9545 (c) 2017 IEEE. Personal use is permitted, but republication/redistribution requires IEEE permission. See http://www.ieee.org/publications_standards/publications/rights/index.html for more information.
This article has been accepted for publication in a future issue of this journal, but has not been fully edited. Content may change prior to final publication. Citation information: DOI 10.1109/TVT.2017.2776999, IEEETransactions on Vehicular Technology
8
TABLE IIIQoE(k) VS SPI(j) (TRAFFIC MIX A, UNIFORM INITIAL SPI)
Service ∂QoE(k)
∂QoS(k)
∂QoS(k)
∂Res(k)∂Res(k)
∂SPI(j)
∂QoE(k)
∂SPI(j) = ∂QoE(k)
∂QoS(k) · ∂QoS(k)
∂Res(k) · ∂Res(k)
∂SPI(j) SD(k) ∆SPI(k)
(k) VoIP VIDEO FTP WEB VoIP VIDEO FTP WEB
VoIP −1.06 −0.04 0.95 −0.51 −0.29 −0.15 0.04 −0.02 −0.01 −0.01 0.004 0.39
VIDEO −0.08 −2.2 −0.05 0.49 −0.29 −0.15 −0.01 0.09 −0.05 −0.03 −0.044 −2.00
FTP 0.003 60.4 −0.05 −0.51 0.71 −0.15 −0.01 −0.09 0.13 −0.03 0.004 0.43
WEB 0.004 50.3 −0.05 −0.51 −0.29 0.85 −0.01 −0.10 −0.06 0.17 0.036 2.00
for VoIP and VIDEO, a decrease in the QoS indicator(i.e., average delay and re-buffering time) improvesQoE, whereas, for FTP and WEB, it is an increasein the QoS indicator (i.e., average user throughput)that improves QoE. Regarding the ∂QoE(k)
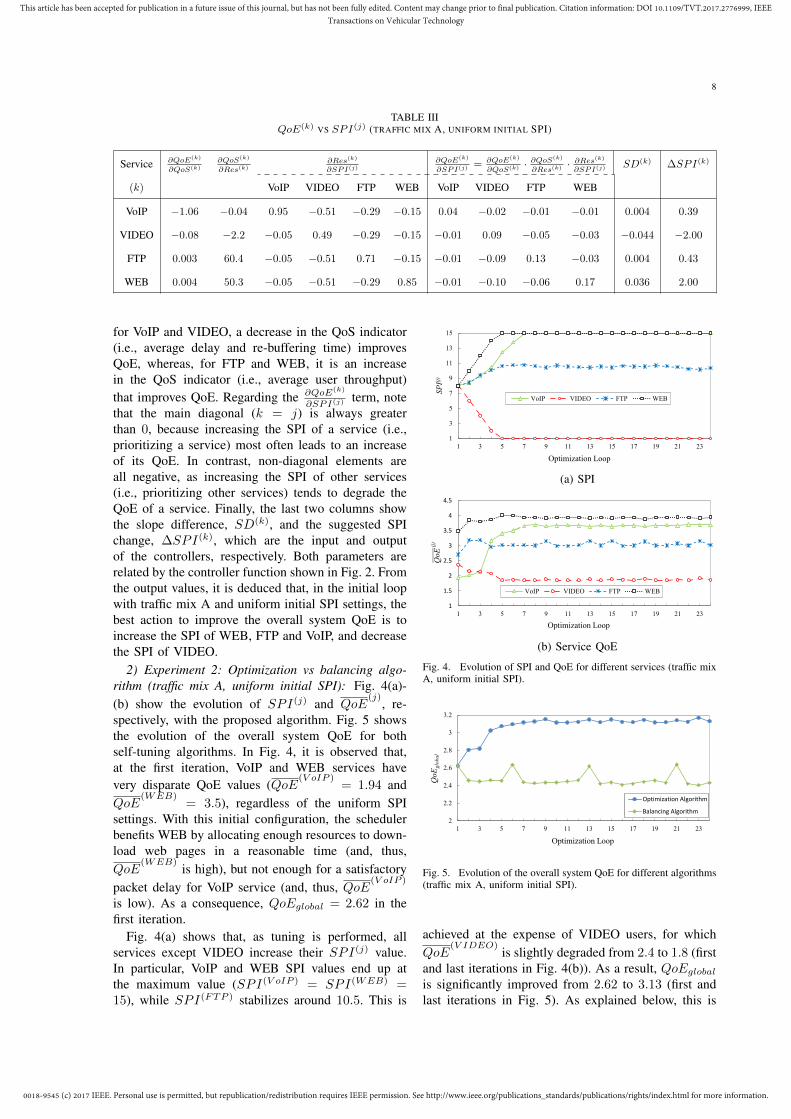
∂SPI(j) term, notethat the main diagonal (k = j) is always greaterthan 0, because increasing the SPI of a service (i.e.,prioritizing a service) most often leads to an increaseof its QoE. In contrast, non-diagonal elements areall negative, as increasing the SPI of other services(i.e., prioritizing other services) tends to degrade theQoE of a service. Finally, the last two columns showthe slope difference, SD(k), and the suggested SPIchange, ∆SPI(k), which are the input and outputof the controllers, respectively. Both parameters arerelated by the controller function shown in Fig. 2. Fromthe output values, it is deduced that, in the initial loopwith traffic mix A and uniform initial SPI settings, thebest action to improve the overall system QoE is toincrease the SPI of WEB, FTP and VoIP, and decreasethe SPI of VIDEO.
2) Experiment 2: Optimization vs balancing algo-rithm (traffic mix A, uniform initial SPI): Fig. 4(a)-(b) show the evolution of SPI(j) and QoE
(j), re-
spectively, with the proposed algorithm. Fig. 5 showsthe evolution of the overall system QoE for bothself-tuning algorithms. In Fig. 4, it is observed that,at the first iteration, VoIP and WEB services havevery disparate QoE values (QoE
(V oIP )= 1.94 and
QoE(WEB)
= 3.5), regardless of the uniform SPIsettings. With this initial configuration, the schedulerbenefits WEB by allocating enough resources to down-load web pages in a reasonable time (and, thus,QoE
(WEB)is high), but not enough for a satisfactory
packet delay for VoIP service (and, thus, QoE(V oIP )
is low). As a consequence, QoEglobal = 2.62 in thefirst iteration.
Fig. 4(a) shows that, as tuning is performed, allservices except VIDEO increase their SPI(j) value.In particular, VoIP and WEB SPI values end up atthe maximum value (SPI(V oIP ) = SPI(WEB) =15), while SPI(FTP ) stabilizes around 10.5. This is
1
3
5
7
9
11
13
15
1 3 5 7 9 11 13 15 17 19 21 23
SPI(j)
Optimization Loop
VoIP VIDEO FTP WEB
(a) SPI
1
1.5
2
2.5
3
3.5
4
4.5
1 3 5 7 9 11 13 15 17 19 21 23
QoE(j)
Optimization Loop
VoIP VIDEO FTP WEB
(b) Service QoE
Fig. 4. Evolution of SPI and QoE for different services (traffic mixA, uniform initial SPI).
2
2.2
2.4
2.6
2.8
3
3.2
1 3 5 7 9 11 13 15 17 19 21 23
QoEglobal
Optimization Loop
Optimization Algorithm
Balancing Algorithm
Fig. 5. Evolution of the overall system QoE for different algorithms(traffic mix A, uniform initial SPI).
achieved at the expense of VIDEO users, for whichQoE
(V IDEO)is slightly degraded from 2.4 to 1.8 (first
and last iterations in Fig. 4(b)). As a result, QoEglobal
is significantly improved from 2.62 to 3.13 (first andlast iterations in Fig. 5). As explained below, this is
0018-9545 (c) 2017 IEEE. Personal use is permitted, but republication/redistribution requires IEEE permission. See http://www.ieee.org/publications_standards/publications/rights/index.html for more information.
This article has been accepted for publication in a future issue of this journal, but has not been fully edited. Content may change prior to final publication. Citation information: DOI 10.1109/TVT.2017.2776999, IEEETransactions on Vehicular Technology
9
just a consequence of the re-prioritization of servicesthat leads to the re-assignment of the large amountof resources initially used by VIDEO users to otherservices.
The self-tuning algorithm mainly acts in the firsteight iterations, with no significant changes of SPIand QoE indicators in subsequent iterations. In Fig. 5,an abrupt change in QoEglobal is seen in the 4th
optimization loop. That is the point when the pri-ority of the voice service becomes higher than FTPservice priority (i.e., SPI(V oIP ) > SPI(FTP )). Amore detailed analysis (not shown here) reveals thatQoEglobal is considerably increased every time theSPI value of a service with a high demand of radioresources (FTP and VIDEO in this work) falls belowthe SPI of another service. Similar peaks are observedin the overall system QoE for the QoE balancingalgorithm. More importantly, the proposed self-tuningalgorithm based on the optimality condition achievesa 20% improvement in the global QoE (i.e., from2.62 to 3.13), whereas the QoE balancing algorithmdeteriorates the global QoE by 7% (i.e., from 2.62 to2.43).
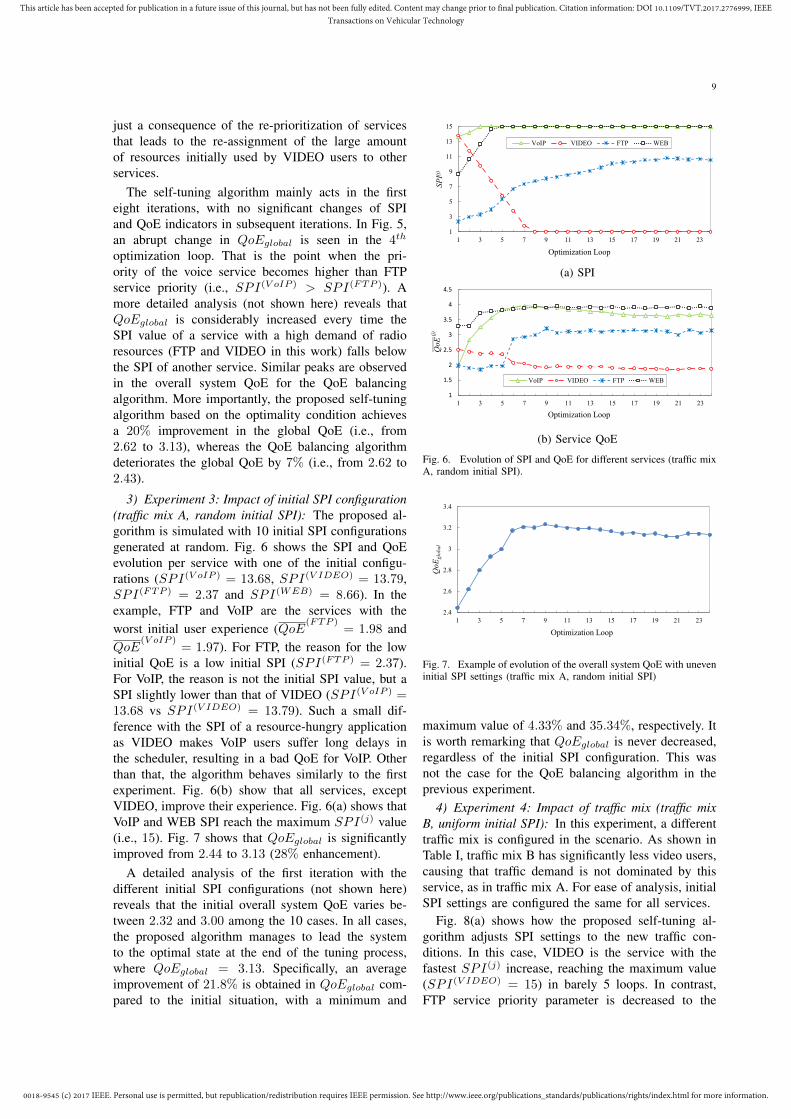
3) Experiment 3: Impact of initial SPI configuration(traffic mix A, random initial SPI): The proposed al-gorithm is simulated with 10 initial SPI configurationsgenerated at random. Fig. 6 shows the SPI and QoEevolution per service with one of the initial configu-rations (SPI(V oIP ) = 13.68, SPI(V IDEO) = 13.79,SPI(FTP ) = 2.37 and SPI(WEB) = 8.66). In theexample, FTP and VoIP are the services with theworst initial user experience (QoE
(FTP )= 1.98 and
QoE(V oIP )
= 1.97). For FTP, the reason for the lowinitial QoE is a low initial SPI (SPI(FTP ) = 2.37).For VoIP, the reason is not the initial SPI value, but aSPI slightly lower than that of VIDEO (SPI(V oIP ) =13.68 vs SPI(V IDEO) = 13.79). Such a small dif-ference with the SPI of a resource-hungry applicationas VIDEO makes VoIP users suffer long delays inthe scheduler, resulting in a bad QoE for VoIP. Otherthan that, the algorithm behaves similarly to the firstexperiment. Fig. 6(b) show that all services, exceptVIDEO, improve their experience. Fig. 6(a) shows thatVoIP and WEB SPI reach the maximum SPI(j) value(i.e., 15). Fig. 7 shows that QoEglobal is significantlyimproved from 2.44 to 3.13 (28% enhancement).
A detailed analysis of the first iteration with thedifferent initial SPI configurations (not shown here)reveals that the initial overall system QoE varies be-tween 2.32 and 3.00 among the 10 cases. In all cases,the proposed algorithm manages to lead the systemto the optimal state at the end of the tuning process,where QoEglobal = 3.13. Specifically, an averageimprovement of 21.8% is obtained in QoEglobal com-pared to the initial situation, with a minimum and
1
3
5
7
9
11
13
15
1 3 5 7 9 11 13 15 17 19 21 23
SPI(j)
Optimization Loop
VoIP VIDEO FTP WEB
(a) SPI
1
1.5
2
2.5
3
3.5
4
4.5
1 3 5 7 9 11 13 15 17 19 21 23
QoE(j)
Optimization Loop
VoIP VIDEO FTP WEB
(b) Service QoE
Fig. 6. Evolution of SPI and QoE for different services (traffic mixA, random initial SPI).
2.4
2.6
2.8
3
3.2
3.4
1 3 5 7 9 11 13 15 17 19 21 23
QoEglobal
Optimization Loop
Fig. 7. Example of evolution of the overall system QoE with uneveninitial SPI settings (traffic mix A, random initial SPI)
maximum value of 4.33% and 35.34%, respectively. Itis worth remarking that QoEglobal is never decreased,regardless of the initial SPI configuration. This wasnot the case for the QoE balancing algorithm in theprevious experiment.
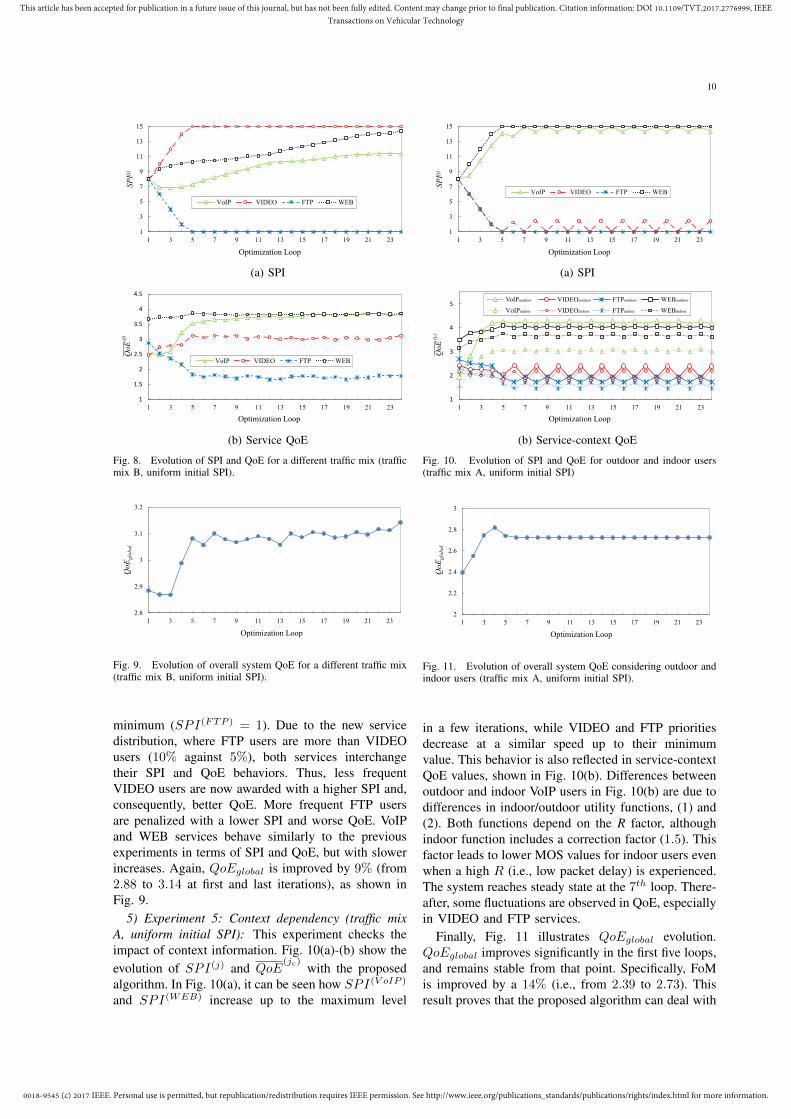
4) Experiment 4: Impact of traffic mix (traffic mixB, uniform initial SPI): In this experiment, a differenttraffic mix is configured in the scenario. As shown inTable I, traffic mix B has significantly less video users,causing that traffic demand is not dominated by thisservice, as in traffic mix A. For ease of analysis, initialSPI settings are configured the same for all services.
Fig. 8(a) shows how the proposed self-tuning al-gorithm adjusts SPI settings to the new traffic con-ditions. In this case, VIDEO is the service with thefastest SPI(j) increase, reaching the maximum value(SPI(V IDEO) = 15) in barely 5 loops. In contrast,FTP service priority parameter is decreased to the
0018-9545 (c) 2017 IEEE. Personal use is permitted, but republication/redistribution requires IEEE permission. See http://www.ieee.org/publications_standards/publications/rights/index.html for more information.
This article has been accepted for publication in a future issue of this journal, but has not been fully edited. Content may change prior to final publication. Citation information: DOI 10.1109/TVT.2017.2776999, IEEETransactions on Vehicular Technology
10
1
3
5
7
9
11
13
15
1 3 5 7 9 11 13 15 17 19 21 23
SPI(j)
Optimization Loop
VoIP VIDEO FTP WEB
(a) SPI
1
1.5
2
2.5
3
3.5
4
4.5
1 3 5 7 9 11 13 15 17 19 21 23
QoE(j)
Optimization Loop
VoIP VIDEO FTP WEB
(b) Service QoE
Fig. 8. Evolution of SPI and QoE for a different traffic mix (trafficmix B, uniform initial SPI).
2.8
2.9
3
3.1
3.2
1 3 5 7 9 11 13 15 17 19 21 23
QoEglobal
Optimization Loop
Fig. 9. Evolution of overall system QoE for a different traffic mix(traffic mix B, uniform initial SPI).
minimum (SPI(FTP ) = 1). Due to the new servicedistribution, where FTP users are more than VIDEOusers (10% against 5%), both services interchangetheir SPI and QoE behaviors. Thus, less frequentVIDEO users are now awarded with a higher SPI and,consequently, better QoE. More frequent FTP usersare penalized with a lower SPI and worse QoE. VoIPand WEB services behave similarly to the previousexperiments in terms of SPI and QoE, but with slowerincreases. Again, QoEglobal is improved by 9% (from2.88 to 3.14 at first and last iterations), as shown inFig. 9.
5) Experiment 5: Context dependency (traffic mixA, uniform initial SPI): This experiment checks theimpact of context information. Fig. 10(a)-(b) show theevolution of SPI(j) and QoE
(jc) with the proposedalgorithm. In Fig. 10(a), it can be seen how SPI(V oIP )
and SPI(WEB) increase up to the maximum level
1
3
5
7
9
11
13
15
1 3 5 7 9 11 13 15 17 19 21 23
SPI(j)
Optimization Loop
VoIP VIDEO FTP WEB
(a) SPI
1
2
3
4
5
1 3 5 7 9 11 13 15 17 19 21 23
Optimization Loop
VoIPoutdoor VIDEOoutdoor FTPoutdoor WEBoutdoor
VoIPindoor VIDEOindoor FTPindoor WEBindoor
QoE(jc)
(b) Service-context QoE
Fig. 10. Evolution of SPI and QoE for outdoor and indoor users(traffic mix A, uniform initial SPI)
2
2.2
2.4
2.6
2.8
3
1 3 5 7 9 11 13 15 17 19 21 23
QoEglobal
Optimization Loop
Fig. 11. Evolution of overall system QoE considering outdoor andindoor users (traffic mix A, uniform initial SPI).
in a few iterations, while VIDEO and FTP prioritiesdecrease at a similar speed up to their minimumvalue. This behavior is also reflected in service-contextQoE values, shown in Fig. 10(b). Differences betweenoutdoor and indoor VoIP users in Fig. 10(b) are due todifferences in indoor/outdoor utility functions, (1) and(2). Both functions depend on the R factor, althoughindoor function includes a correction factor (1.5). Thisfactor leads to lower MOS values for indoor users evenwhen a high R (i.e., low packet delay) is experienced.The system reaches steady state at the 7th loop. There-after, some fluctuations are observed in QoE, especiallyin VIDEO and FTP services.
Finally, Fig. 11 illustrates QoEglobal evolution.QoEglobal improves significantly in the first five loops,and remains stable from that point. Specifically, FoMis improved by a 14% (i.e., from 2.39 to 2.73). Thisresult proves that the proposed algorithm can deal with
0018-9545 (c) 2017 IEEE. Personal use is permitted, but republication/redistribution requires IEEE permission. See http://www.ieee.org/publications_standards/publications/rights/index.html for more information.
This article has been accepted for publication in a future issue of this journal, but has not been fully edited. Content may change prior to final publication. Citation information: DOI 10.1109/TVT.2017.2776999, IEEETransactions on Vehicular Technology
11
several utility functions per service for context-awareQoE modeling.
V. CONCLUSIONS
In this paper, a self-tuning algorithm for a classicalmulti-service packet scheduler in a LTE base stationhas been proposed. The aim of the algorithm is toachieve the optimum overall system QoE by modifyingservice priorities, regardless of network conditions. Forthis purpose, the proposed algorithm changes servicepriority parameters to re-prioritize services by an iter-ative process based on network statistics. Briefly, thealgorithm tends to increase the priority of services thatwould make the most of additional resources and areoccupying less resources. Method assessment has beencarried out in a dynamic system-level LTE simula-tor. Results have shown that tuning service priorityparameters can improve the overall system QoE fordifferent initial configurations and traffic mixes, withgains of up to 35%. Such an improvement is obtainedwithout changing the existing scheduling algorithm.Furthermore, the proposed algorithm also improvesnetwork performance when user location informationis included in QoE models. It is left for future work theinclusion of other context attributes in QoE models.
The proposed self-tuning algorithm is conceived asa centralized algorithm for the network managementsystem, where service performance indicators and pri-ority parameters are collected and set on a networkbasis. However, it can also be designed as a distributedalgorithm executed in every eNodeB, provided thatservice performance statistics are available and priorityparameters can be adjusted on a site or cell basis.
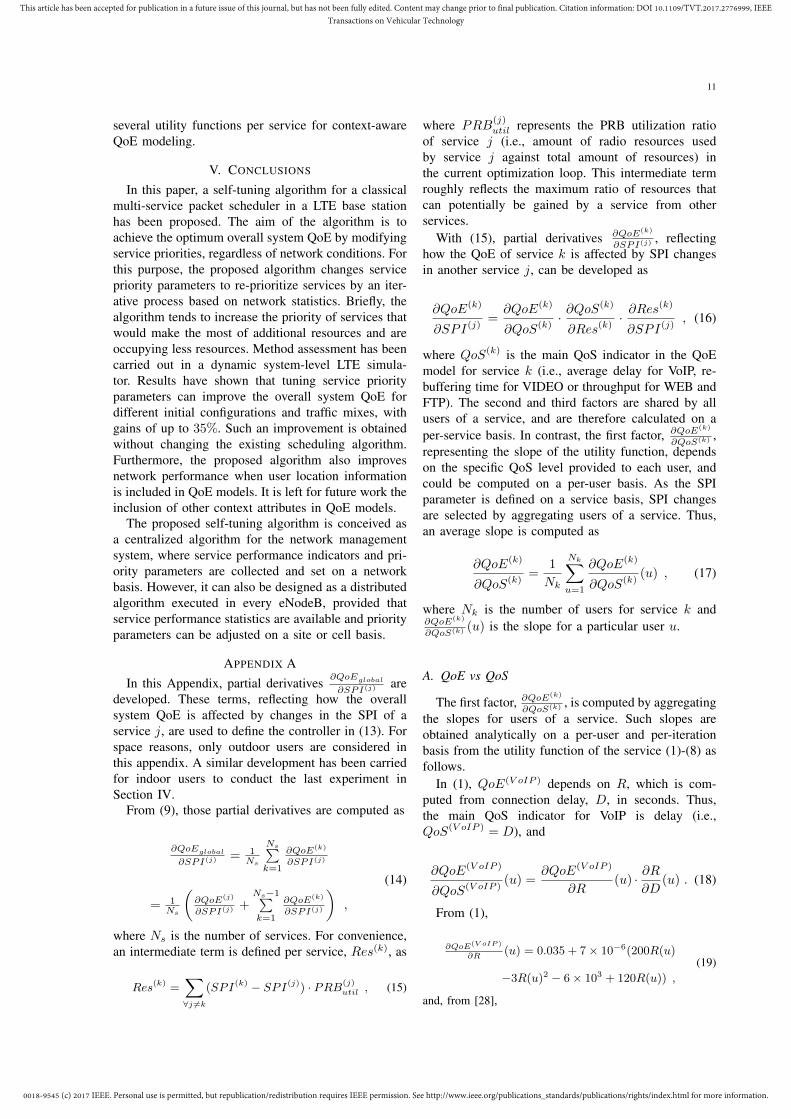
APPENDIX AIn this Appendix, partial derivatives ∂QoEglobal
∂SPI(j) aredeveloped. These terms, reflecting how the overallsystem QoE is affected by changes in the SPI of aservice j, are used to define the controller in (13). Forspace reasons, only outdoor users are considered inthis appendix. A similar development has been carriedfor indoor users to conduct the last experiment inSection IV.
From (9), those partial derivatives are computed as
∂QoEglobal
∂SPI(j) = 1Ns
Ns∑k=1
∂QoE(k)
∂SPI(j)
= 1Ns
(∂QoE(j)
∂SPI(j) +Ns−1∑k=1
∂QoE(k)
∂SPI(j)
),
(14)
where Ns is the number of services. For convenience,an intermediate term is defined per service, Res(k), as
Res(k) =∑
∀j 6=k
(SPI(k) − SPI(j)) · PRB(j)util , (15)
where PRB(j)util represents the PRB utilization ratio
of service j (i.e., amount of radio resources usedby service j against total amount of resources) inthe current optimization loop. This intermediate termroughly reflects the maximum ratio of resources thatcan potentially be gained by a service from otherservices.
With (15), partial derivatives ∂QoE(k)
∂SPI(j) , reflectinghow the QoE of service k is affected by SPI changesin another service j, can be developed as
∂QoE(k)
∂SPI(j)=
∂QoE(k)
∂QoS(k)· ∂QoS(k)
∂Res(k)· ∂Res(k)
∂SPI(j), (16)
where QoS(k) is the main QoS indicator in the QoEmodel for service k (i.e., average delay for VoIP, re-buffering time for VIDEO or throughput for WEB andFTP). The second and third factors are shared by allusers of a service, and are therefore calculated on aper-service basis. In contrast, the first factor, ∂QoE(k)
∂QoS(k) ,representing the slope of the utility function, dependson the specific QoS level provided to each user, andcould be computed on a per-user basis. As the SPIparameter is defined on a service basis, SPI changesare selected by aggregating users of a service. Thus,an average slope is computed as
∂QoE(k)
∂QoS(k)=
1
Nk
Nk∑
u=1
∂QoE(k)
∂QoS(k)(u) , (17)
where Nk is the number of users for service k and∂QoE(k)
∂QoS(k) (u) is the slope for a particular user u.
A. QoE vs QoS
The first factor, ∂QoE(k)
∂QoS(k) , is computed by aggregatingthe slopes for users of a service. Such slopes areobtained analytically on a per-user and per-iterationbasis from the utility function of the service (1)-(8) asfollows.
In (1), QoE(V oIP ) depends on R, which is com-puted from connection delay, D, in seconds. Thus,the main QoS indicator for VoIP is delay (i.e.,QoS(V oIP ) = D), and
∂QoE(V oIP )
∂QoS(V oIP )(u) =
∂QoE(V oIP )
∂R(u) · ∂R
∂D(u) . (18)
From (1),
∂QoE(V oIP )
∂R(u) = 0.035 + 7× 10⁻⁶(200R(u)
−3R(u)2 − 6× 10³ + 120R(u)) ,
(19)
and, from [28],
0018-9545 (c) 2017 IEEE. Personal use is permitted, but republication/redistribution requires IEEE permission. See http://www.ieee.org/publications_standards/publications/rights/index.html for more information.
This article has been accepted for publication in a future issue of this journal, but has not been fully edited. Content may change prior to final publication. Citation information: DOI 10.1109/TVT.2017.2776999, IEEETransactions on Vehicular Technology
12
∂R∂D
(u) = −0.024− 0.11 H(D(u)− 177.3) /
H(D(u)− x) =
{0 D(u) < x
1 D(u) ≥ x.
(20)
In (3), the re-buffering time component tends to dominatethe QoE of VIDEO, so that QoE(V IDEO) ≈ 4.23 −0.106 Treb. Thus, the main QoS indicator for VIDEO is there-buffering time in seconds (i.e., QoS(V IDEO) = Treb),and
∂QoE(V IDEO)
∂QoS(V IDEO) (u) =∂QoE(V IDEO)
∂Treb(u)
=
{−0.106 Treb(u) < 30
0 Treb(u) ≥ 30,
(21)
where Treb(u) = 30 is the threshold from whichQoE(V IDEO) is always minimum (= 1).
In (5) and (7), the main QoS indicator for FTP andWEB services is average user throughput in kbps (i.e.,QoS(WEB) = TWEB and QoS(FTP ) = TFTP ), and
∂QoE(WEB)
∂QoS(WEB) (u) =∂QoE(WEB)
∂TWEB(u)
=578 ( 1
45.98 )2(2 TWEB(u)+1.082)(
1+(
TWEB(u)+541.1
45.98
)2)2 ,(22)
∂QoE(FTP )
∂QoS(FTP ) (u) =∂QoE(FTP )
∂TFTP(u)
=
{0 TFTP (u) ≤ 236.5
0.0065 236.5 < TFTP (u) < 852.50 TFTP (u) ≥ 852.5
.
(23)
In (23), throughput values represent the thresholds asso-ciated with the minimum (= 1) and maximum (= 5) valuesof the MOS scale for FTP.
B. QoS vs Res
The second factor, ∂QoS(k)
∂Res(k) , is estimated on a per-iterationand per-service basis as
∂QoS(j)
∂Res(j)' QoS
(j)max −QoS
(j)min
Res(j)max −Res
(j)min
, (24)
where QoS(j)max and QoS
(j)min stand for the maximum and
minimum value of the main QoS indicator per service,respectively, and Res
(j)max and Res
(j)min are obtained as
Res(j)max = (SPImax − SPImin)∑
∀k 6=j
PRB(k)util , (25)
Res(j)min = (SPImin − SPImax)
∑
∀k 6=j
PRB(k)util . (26)
C. Res vs SPIThe third factor, ∂Res(k)
∂SPI(j), is approximated on a per-
iteration and per-service basis by
∂Res(k)
∂SPI(j)'
−PRB(j)util k 6= j
∑∀ l6=k
PRB(l)util k = j
. (27)
ACKNOWLEDGMENT
This work has been funded by the SpanishMinistry of Economy and Competitiveness(TEC2015-69982-R) and Optimi-Ericsson and AgenciaIDEA (Consejerıa de Ciencia, Innovacion y Empresa, Juntade Andalucıa, ref. 59288), co-funded by FEDER.
REFERENCES
[1] Ericsson, “Mobility report: On the pulse of the Net-worked Society,” White Paper, 2016.
[2] Nokia Siemens Networks, “Understanding SmartphoneBehavior in the Network,” White Paper, 2011.
[3] D. Soldani, S. K. Das, M. Hassan, J. A. Hassan,and G. D. Mandyam, “Traffic Management for MobileBroadband Networks,” IEEE Communications Maga-zine, vol. 49, no. 10, pp. 98–100, 2011.
[4] A. Banerjee, “Revolutionizing CEM with subscriber-centric network operations and QoE strategy,” Whitepaper, Heavy Reading, July 2014.
[5] M. Fiedler, T. Hossfeld, and P. Tran-Gia, “A genericquantitative relationship between quality of experienceand quality of service,” IEEE Network, vol. 24, no. 2,pp. 36–41, 2010.
[6] P. Reichl, B. Tuffin, and R. Schatz, “Logarithmiclaws in service quality perception: where microeco-nomics meets psychophysics and quality of experi-ence,” Telecommunication Systems, vol. 52, no. 2, pp.587–600, 2013.
[7] ITU-T Recommendation G.107, “The E-model, a com-putational model for use in transmission planning,”Dec. 1998, p. 8.
[8] ITU-T Recommendation G.1070, “Opinion Model forVideo-Telephony Applications,” Apr. 2007.
[9] R. K. Mok, E. W. Chan, and R. K. Chang, “Measuringthe Quality of Experience of HTTP Video Streaming,”in IFIP/IEEE International Symposium on IntegratedNetwork Management (IM), 2011, pp. 485–492.
[10] G. Gomez, J. Lorca, R. Garcıa, and Q. Perez, “Towardsa QoE-Driven Resource Control in LTE and LTE-ANetworks,” Journal of Computer Networks and Com-munications, 2013.
[11] F. Lozano, G. Gomez, M.-C. Aguayo-Torres,C. Cardenas, A. Plaza, A. Garrido, J. Banos-Polglase,and J. Poncela, “Network Performance Testing SystemIntegrating Models for Automatic Qoe Evaluation ofPopular Services: Youtube and Facebook,” WirelessPersonal Communications, vol. 81, no. 4, pp. 1377–1397, 2015.
[12] K. De Moor, I. Ketyko, W. Joseph, T. Deryckere,L. De Marez, L. Martens, and G. Verleye, “Proposedframework for evaluating quality of experience in amobile, testbed-oriented living lab setting,” Mobile Net-works and Applications, vol. 15, no. 3, pp. 378–391,2010.
[13] K. Mitra, A. Zaslavsky, and C. Ahlund, “Context-aware QoE modelling, measurement, and predictionin mobile computing systems,” IEEE Transactions onMobile Computing, vol. 14, no. 5, pp. 920–936, 2015.
0018-9545 (c) 2017 IEEE. Personal use is permitted, but republication/redistribution requires IEEE permission. See http://www.ieee.org/publications_standards/publications/rights/index.html for more information.
This article has been accepted for publication in a future issue of this journal, but has not been fully edited. Content may change prior to final publication. Citation information: DOI 10.1109/TVT.2017.2776999, IEEETransactions on Vehicular Technology
13
[14] 3GPP TS 23.203, “Technical Specification Group Ser-vices and System Aspects; Policy and charging controlarchitecture, Version 13.1.0,” Sep. 2014.
[15] H. Holma and A. Toskala, LTE for UMTS-OFDMA andSC-FDMA Based Radio Access. John Wiley & Sons(UK), 2009.
[16] K. I. Pedersen et al., “An Overview of DownlinkRadio Resource Management for UTRAN Long-TermEvolution,” IEEE Communications Magazine, vol. 47,no. 7, pp. 86–93, 2009.
[17] F. R. M. Lima, T. F. Maciel, W. C. Freitas, andF. R. P. Cavalcanti, “Resource Assignment for RateMaximization with QoS Guarantees in MultiserviceWireless Systems,” IEEE Transactions on VehicularTechnology, vol. 61, no. 3, pp. 1318–1332, 2012.
[18] J.-H. Rhee, J. M. Holtzman, and D.-K. Kim, “Schedul-ing of Real/Non-real Time Services: Adaptive EXP/PFAlgorithm,” in IEEE 57th Semiannual Vehicular Tech-nology Conference (VTC 2003-Spring), vol. 1, 2003,pp. 462–466.
[19] X. Li, Y. Zaki, Y. Dong, N. Zahariev, and C. Goerg,“SON Potential for LTE Downlink MAC Scheduler,” inIEEE 6th Joint IFIP Wireless and Mobile NetworkingConference (WMNC), 2013, pp. 1–7.
[20] T. Farkhondeh, Y. Chan, and J. Lee, “Scheduling withQuality of Service Support in Wireless System,” Jun.25th 2014, EP Patent 2,277,329. [Online]. Available:http://www.google.com/patents/EP2277329B1?cl=en.Access date: October 2014
[21] S. Khan, S. Duhovnikov, E. Steinbach, and W. Kellerer,“MOS-Based Multiuser Multiapplication Cross-LayerOptimization for Mobile Multimedia Communication,”Advances in Multimedia, 2007.
[22] P. Ameigeiras, J. J. Ramos-Munoz, J. Navarro-Ortiz,P. Mogensen, and J. M. Lopez-Soler, “QoE orientedcross-layer design of a resource allocation algorithmin beyond 3G systems,” Computer Communications,vol. 33, no. 5, pp. 571–582, 2010.
[23] P. Patras, A. Banchs, and P. Serrano, “A ControlTheoretic Approach for Throughput Optimization inIEEE 802.11e EDCA WLANs,” Mobile Networks andApplications, vol. 14, no. 6, pp. 697–708, 2009.
[24] W. He, K. Nahrstedt, and X. Liu, “End-to-End De-lay Control of Multimedia Applications over MultihopWireless Links,” ACM Transactions on MultimediaComputing, Communications and Applications (TOM-CCAP), vol. 5, no. 2, 2008.
[25] H. Luo and M.-L. Shyu, “Quality of service provisionin mobile multimedia - A survey,” Human-centric Com-puting and Information Sciences, vol. 1, no. 1, pp. 1–15,2011.
[26] P. Oliver-Balsalobre, M. Toril, S. Luna-Ramırez, andJ. M. Ruiz Aviles, “Self-tuning of scheduling param-eters for balancing the quality of experience amongservices in LTE,” EURASIP Journal on Wireless Com-munications and Networking, no. 1, 2016.
[27] 3GPP TSG-RAN1#48, “LTE physical layer frameworkfor performance verification, R1-070674,” Feb. 2007.
[28] ITU-T Recommendation G.114, “One-way transmis-sion time,” May 2000.
[29] J. Navarro-Ortiz, J. M. Lopez-Soler, and G. Steay,“Quality of Experience Based Resource Sharing inIEEE 802.11e HCCA,” in IEEE European WirelessConference (EW), 2010, pp. 454–461.
[30] P. Munoz, I. de la Bandera, F. Ruiz, S. Luna-Ramırez,R. Barco, M. Toril, P. Lazaro, and J. Rodrıguez,“Computationally-Efficient Design of a Dynamic
System-Level LTE Simulator,” Int. Journal of Elec-tronics and Telecommunications, vol. 57, pp. 347–358,2011.
[31] J. M. Ruiz-Aviles, S. Luna-Ramırez, M. Toril, andF. Ruiz, “Traffic steering by self-tuning controllers inenterprise lte femtocells,” EURASIP Journal on Wire-less Communications and Networking, vol. 2012, no. 1,p. 337, 2012.
Pablo Oliver-Balsalobre received his M.S.degree in Telecommunication Engineeringfrom the University of Malaga, Spain, in2013. In 2014, he joined the Communica-tions Engineering Department, Universityof Malaga, where he worked toward thePh.D. degree in Telecommunications En-gineering in a collaborative project withEricsson. His research interests are focusedon self-planning and self-optimization ofmobile radio access networks based on
customer experience.
Matas Toril received his M.S. in Telecom-munication Engineering and Ph.D. degreesfrom the University of Malaga, Spain,in 1995 and 2007, respectively. Since1997, he is Lecturer in the Communica-tions Engineering Department, Universityof Malaga, where he is currently AssociateProfessor. He has authored more than 110publications in leading conferences andjournals and 3 patents owned by NokiaCorporation. His current research interests
include self-organizing networks, radio resource management anddata analytics.
Salvador Luna-Ramırez received hisM.S. in Telecommunication Engineeringand the Ph.D. degrees from the Universityof Malaga, Spain, in 2000 and 2010, re-spectively. Since 2000, he has been withthe Department of Communications Engi-neering, University of Malaga, where heis currently Associate Professor. His re-search interests include self-optimizationof mobile radio access networks and radioresource management.
Rafael Garcıa Garaluz received his M.S.in Telecommunication Engineering fromthe University of Malaga, Spain, in 2004.From 2004 to 2010 he was with Optimi inMalaga, working in the R&D deparment.In 2011 he joined Ericcson as developmentleader, changing to researcher on 2013. Hehas lead several research projects related tomobile networks in the areas of capacityplanning, network performance monitoringand troubleshooting and user experience
monitoring. His current research interests include user experienceon mobile networks and high scale data processing.