Embed Size (px)
Citation preview

Chapter 25/Workbook Page 1
Section VII Workbook, Exercises, Bibliography
and Appendix
Chapter 26 Level Three Leadership Workbook
INTRODUCTORY CONCEPTS
The Diamond Model of Leadership The Leadership Point of View
Managing the Fear of Rejection
Leadership Levels Assessment
STRATEGIC FRAMES
Strategic Challenges
Leadership Implications of My Strategic Challenges
My Leadership Future
Charter for My Organization
Charter for My Work Group
My Personal Charter
Survey of Managerial Style
SELF LEADERSHIP
My Personal Leadership Development Goals (Keep, Lose, Add)
Leadership Intelligence Self‐Assessment
Managing Your Energy Exercise
Life’s Dream Exercise
SELF
ORGANIZATION
OTHERS TASK
Chapter 25/Workbook Page 2
Balancing Your Life Exercise
LEADING OTHERS
Leadership Language Exercise
Leadership Steps Assessment
Life’s Story Assignment
Assessing the Moral Foundation of Your Leadership
Team Assessment Exercise
LEADING BY DESIGN
OH: One View of the World
Systems and Processes in My Organization That Need Redesigning
My Personal Model of Change
CONCLUSION
What Do I Want to Do Next?
Your Central Point

Chapter 25/Workbook Page 3
THE DIAMOND MODEL OF LEADERSHIP Here’s the basic leadership model developed in the book for your review.
Figure 26-1. Diamond Model of Leadership
TASK
ORGANI-ZATION
OTHERS
LEADERRESULTS
Customer Satisfaction
Operating Efficiency
Learning
Financials
Environmental Effects
THE LEADERSHIP POINT OF VIEW
1. Do you SEE what needs to be done? 2. Do you UNDERSTAND all of the forces at play? 3. Do you have the COURAGE TO ACT to make things better?

Chapter 25/Workbook Page 4
MANAGING THE FEAR OF REJECTION
Given the discussion in Chapter 1, note here the things that you’ve done in the last week to avoid rejection. When have you changed what you would have said or done in order to be acceptable to others? How does this tendency impact your ability to lead?
Locus of Control
INSIDE
100%
0%
How much of your life do you live inside-out vs. outside-in?
Figure 1-1
OUTSIDE
FoR
Assertiveness
Chapter 25/Workbook Page 5
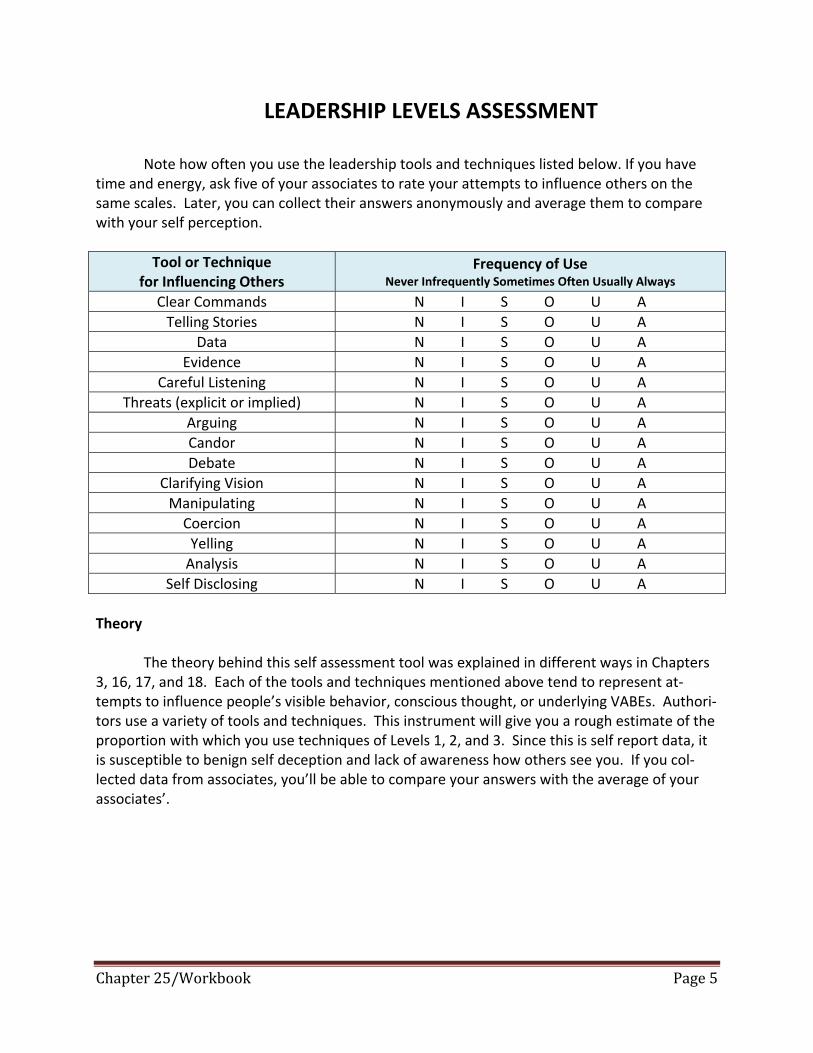
LEADERSHIP LEVELS ASSESSMENT Note how often you use the leadership tools and techniques listed below. If you have time and energy, ask five of your associates to rate your attempts to influence others on the same scales. Later, you can collect their answers anonymously and average them to compare with your self perception.
Tool or Technique for Influencing Others
Frequency of Use Never Infrequently Sometimes Often Usually Always
Clear Commands N I S O U A Telling Stories N I S O U A
Data N I S O U A Evidence N I S O U A
Careful Listening N I S O U A Threats (explicit or implied) N I S O U A
Arguing N I S O U A Candor N I S O U A Debate N I S O U A
Clarifying Vision N I S O U A Manipulating N I S O U A Coercion N I S O U A Yelling N I S O U A Analysis N I S O U A
Self Disclosing N I S O U A Theory The theory behind this self assessment tool was explained in different ways in Chapters 3, 16, 17, and 18. Each of the tools and techniques mentioned above tend to represent at‐tempts to influence people’s visible behavior, conscious thought, or underlying VABEs. Authori‐tors use a variety of tools and techniques. This instrument will give you a rough estimate of the proportion with which you use techniques of Levels 1, 2, and 3. Since this is self report data, it is susceptible to benign self deception and lack of awareness how others see you. If you col‐lected data from associates, you’ll be able to compare your answers with the average of your associates’.

Chapter 25/Workbook Page 6
Scoring Your Responses Use the table below to score your responses above.
Tool or Technique Frequency of Use Never Infrequently Sometimes Often Usually Always
1. Clear Commands L1 1 2 3 4 5 6 2. Telling Stories L3 1 2 3 4 5 6 3. Data L2 1 2 3 4 5 6 4. Evidence L2 1 2 3 4 5 6 5. Careful Listening L3 1 2 3 4 5 6 6. Threats (explicit or implied) L1 1 2 3 4 5 6 7. Arguing L2 1 2 3 4 5 6 8. Candor L3 1 2 3 4 5 6 9. Debate L2 1 2 3 4 5 6 10. Clarifying Vision L3 1 2 3 4 5 6 11. Manipulating L1 1 2 3 4 5 6 12. Coercion L1 1 2 3 4 5 6 13. Yelling L1 1 2 3 4 5 6 14. Analysis L2 1 2 3 4 5 6 15. Self Disclosing L3 1 2 3 4 5 6
Level One Scores Totals PERCENT
Q1 + Q6 + Q11 + Q12 + Q13 = + + + + = Level Two Scores
Q3 + Q4 + Q7 + Q9 + Q14 = + + + + = Level Three Scores
Q2 + Q5 + Q8 + Q10 +Q15 = + + + + = TOTAL = 100%
Calculate the percentage of each score by dividing each of them by the total and multip‐lying by 100. Interpreting Your Scores Given your percentages above, what inferences can you draw about your typical at‐tempts to influence others? Do you tend to use Level 1, 2 or 3? What are the implications of this profile for your long‐term leadership effectiveness?
Chapter 25/Workbook Page 7
STRATEGIC CHALLENGES
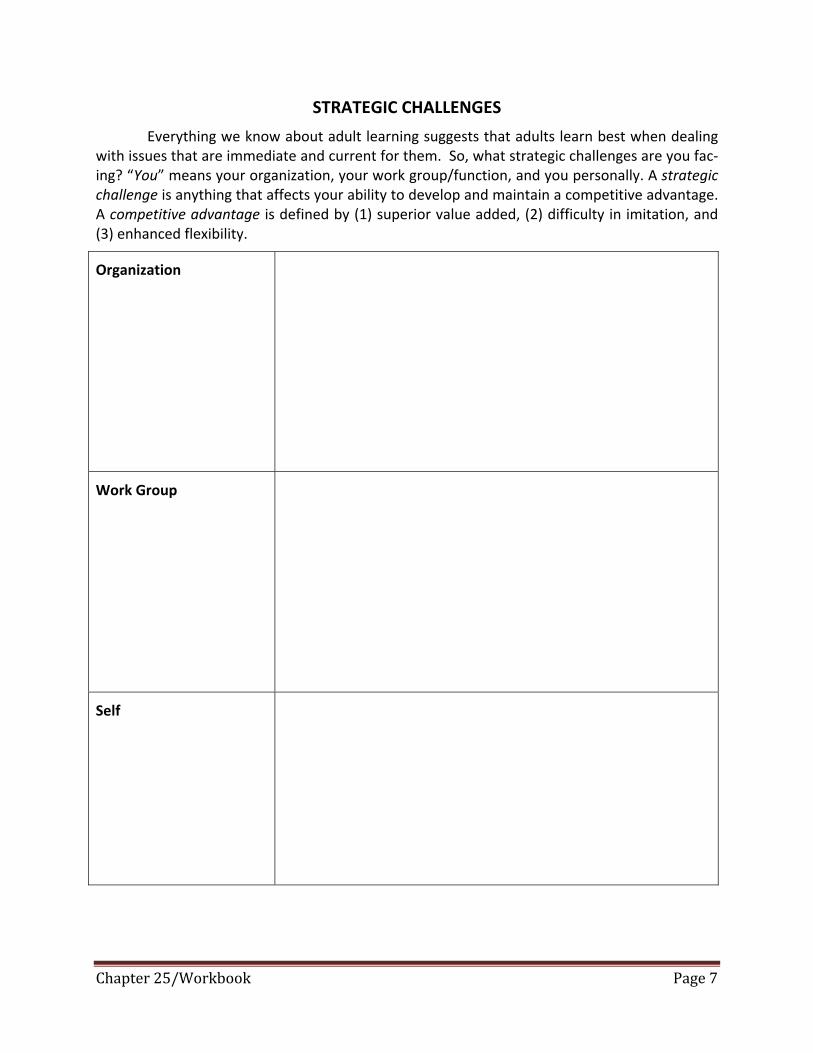
Everything we know about adult learning suggests that adults learn best when dealing with issues that are immediate and current for them. So, what strategic challenges are you fac‐ing? “You” means your organization, your work group/function, and you personally. A strategic challenge is anything that affects your ability to develop and maintain a competitive advantage. A competitive advantage is defined by (1) superior value added, (2) difficulty in imitation, and (3) enhanced flexibility.
Organization
Work Group
Self

Chapter 25/Workbook Page 8
LEADERSHIP IMPLICATIONS OF MY STRATEGIC CHALLENGES
What kind of leadership traits and abilities will be necessary to meet the strategic chal‐lenges you identified above? In other words, what kind of leader do you need to become to meet and overcome the challenges you identified?
Organization Leadership
Work Group Leadership
Self‐Leadership

Chapter 25/Workbook Page 9
MY LEADERSHIP FUTURE
Organizations I Expect to Lead My Core Leadership Principles
In a reasonable scenario, what organizations will you be called on to lead over the course of the rest of your life? What’s the next organization you expect to lead after the one you are in charge of now? The one after that? And so on.
What has your life taught you thus far about what it means to be an effective leader? What are your core leadership principles as of this moment?

Chapter 25/Workbook Page 10
CHARTER FOR MY ORGANIZATION
Mission
Vision
Values
Strategy
Short‐Term Operating Goals
Leadership (Who’s decid‐ing all of these ele‐ments?)

Chapter 25/Workbook Page 11
CHARTER FOR MY WORK GROUP
Mission
Vision
Values
Strategy
Short Term Operating Goals
Leadership (Who’s de‐ciding all of these ele‐ments?)

Chapter 25/Workbook Page 12
MY PERSONAL CHARTER
Mission/Purpose & LDint (How I want to feel?)
Vision
Values
Strategy
Short Term Operat‐ing Goals
Leadership (Who’s deciding all of these elements?)

Chapter 25/Workbook Page 13
Survey of Managerial Style1 This instrument is also available on www.CareerNextStep.com.
anagers constantly identify desirable behavior both in themselves and in others with whom they work. Much of this behavior takes on a characteristic pattern. Knowing something about these different patterns may help us to become more
productive professionals. This instrument measures an aspect of managerial style. Please com‐plete all items, then score and interpret them according to the instructions that follow.
Note that people will often rate questions like those included in this packet in terms of how they think they should answer or in terms of the way that they would like to be. This approach is not the objective here. Please answer the items in terms of how much you agree with a statement as it applies to what you actually do. Give careful thought to your answers and re‐member that your results are only valuable to the extent that they reflect what you do, not what you think you should do. If you are a student now, consider the last job you held as you answer these questions. If you have not worked before, think about what you think your first job experience will be like.
As you complete the survey, please answer ALL items. You will probably note that some of the items on the survey are similar; this repetition is necessary to ensure that the survey infor‐mation is statistically reliable. Please rate each item independently without regard to your res‐ponses to previous items. Finally, please note that there are no right or wrong answers on this survey.
1 This exercise was prepared by S. Gail Pearl under the supervision of James G. Clawson. We ac‐knowledge the ideas and previous, related drafts contributed to this work by Paul D. McKinnon of Novations, Inc., and Dell Computer and Quentin Englerth of The World Group, Inc. Registered with Darden Publishing as “Survey of Managerial Style,” (UVA‐OB‐0358). Copyright © 1988, 2001 by the University of Virginia Darden School Foundation, Charlottesville, VA. All rights re‐served. To order copies, send an e‐mail to or visit [email protected] or visit www.dardenbusinesspublishing.com. No part of this publication may be reproduced, stored in a retrieval system, used in a spreadsheet, or transmitted in any form or by any means—electronic, mechanical, photocopying, recording, or otherwise—without the permission of the Darden School Foundation. Rev. 5/01.
M

Chapter 25/Workbook Page 14
SECTION I: GENERAL INFORMATION
1. How many major organizational levels are there in your organization from the chief execu‐tive to the lowest rank?
Number of major levels in your organization: _____
2. If the chief executive is at level one in your organization, at what numerical level are you?
Your organizational level: _____
3. How many people report directly to you?
Number of direct reports: _____
4. Overall, how many people are in your reporting line of authority? For example, in item 3, if you mentioned four direct reports and the first has 30 employees, the second has 49, the third has 12, and the fourth has 29, and none of their subordinates has subordinates, then the overall number in your line of authority is 120.
Overall number in your reporting line of authority:
SECTION II: MANAGEMENT STYLE QUESTIONS (ITEMS)
Directions: For the following 30 items, read each item and rate it in terms of how much you agree that the item describes you.
On the scale, SA = Strongly Agree, MA = Moderately Agree, LA = Slightly Agree, LD = Slightly Disagree, MD = Moderately Disagree, and SD = Strongly Disagree.
Item Agreement Disagreement
1. Managing company progress toward a vi‐sion represents a major portion of what I do in my job.
+SA +MA +LA ‐LD ‐MD ‐SD
2. I am methodical in the way that I carry out my job responsibilities
+SA +MA +LA ‐LD ‐MD ‐SD
3. Most of my work‐related activity is in think‐ing about the future of my organization.
+SA +MA +LA ‐LD ‐MD ‐SD
4. I am a real “take charge” type of person. +SA +MA +LA ‐LD ‐MD ‐SD
5. Garnering commitment in people toward meeting some organizational goal represents a major portion of what I do in my job.
+SA +MA +LA ‐LD ‐MD ‐SD
6. I am very decisive. When I must make a de‐cision, I stick to it.
+SA +MA +LA ‐LD ‐MD ‐SD

Chapter 25/Workbook Page 15
7. Whenever I must present information to a group, I typically speak without notes or outlines.
+SA +MA +LA ‐LD ‐MD ‐SD
8. I focus my professional energies on envi‐sioning the future of the organization.
+SA +MA +LA ‐LD ‐MD ‐SD
9. Whenever I must present information to a group, I write out the speech, then read it to the group.
+SA +MA +LA ‐LD ‐MD ‐SD
10. I am self‐confident. +SA +MA +LA ‐LD ‐MD ‐SD
11. I focus my professional energies on getting people in my organization to build their commitments to our organization and its goals.
+SA +MA +LA ‐LD ‐MD ‐SD
12. I learn best by diving in and seeing whether something works or doesn’t work.
+SA +MA +LA ‐LD ‐MD ‐SD
13. Most of my work‐related activity is watch‐ing and managing indicators of organiza‐tional activity.
+SA +MA +LA ‐LD ‐MD ‐SD
14. I spend most of my professional time consi‐dering views of what my organization can become.
+SA +MA +LA ‐LD ‐MD ‐SD
15. Most of my work‐related activity is in pull‐ing people together for the purpose of at‐taining an organizational goal.
+SA +MA +LA ‐LD ‐MD ‐SD
16. I think that the most important aspect of my job is preparing for future needs of the or‐ganization.
+SA +MA +LA ‐LD ‐MD ‐SD
17. I manage my professional time efficiently. +SA +MA +LA ‐LD ‐MD ‐SD
18. I think that the most important aspect of my job is persuading people to accept my vision for our organization.
+SA +MA +LA ‐LD ‐MD ‐SD
19. I make an effort to participate in group ac‐tivities.
+SA +MA +LA ‐LD ‐MD ‐SD
20. I focus my professional energies on manag‐ing and monitoring my organization’s progress toward a goal.
+SA +MA +LA ‐LD ‐MD ‐SD
21. Thinking about what my organization might look like in the future represents a major
+SA +MA +LA ‐LD ‐MD ‐SD
Chapter 25/Workbook Page 16
portion of what I do in my job.
22. I am a predictable person. I think that people know what to expect of me.
+SA +MA +LA ‐LD ‐MD ‐SD
23. At work I try to foster close personal rela‐tionships with my coworkers.
+SA +MA +LA ‐LD ‐MD ‐SD
24. I spend most of my professional time in managing company progress toward a vi‐sion.
+SA +MA +LA ‐LD ‐MD ‐SD
25. Solving problems in unstructured situations is an important part of what I do.
+SA +MA +LA ‐LD ‐MD ‐SD
26. I would rather do something myself than delegate responsibility to someone else.
+SA +MA +LA ‐LD ‐MD ‐SD
27. I learn on my own first, then apply what I have learned.
+SA +MA +LA ‐LD ‐MD ‐SD
28. I spend most of my professional time con‐vincing others in my organization to carry out a plan.
+SA +MA +LA ‐LD ‐MD ‐SD
29. Whenever I must present information to a group, I speak while using an outline as a reference.
+SA +MA +LA ‐LD ‐MD ‐SD
30. I think that the most important aspect of my job is looking at how my company is per‐forming and determining what it needs to do to stick to the company plan.
+SA +MA +LA ‐LD ‐MD ‐SD
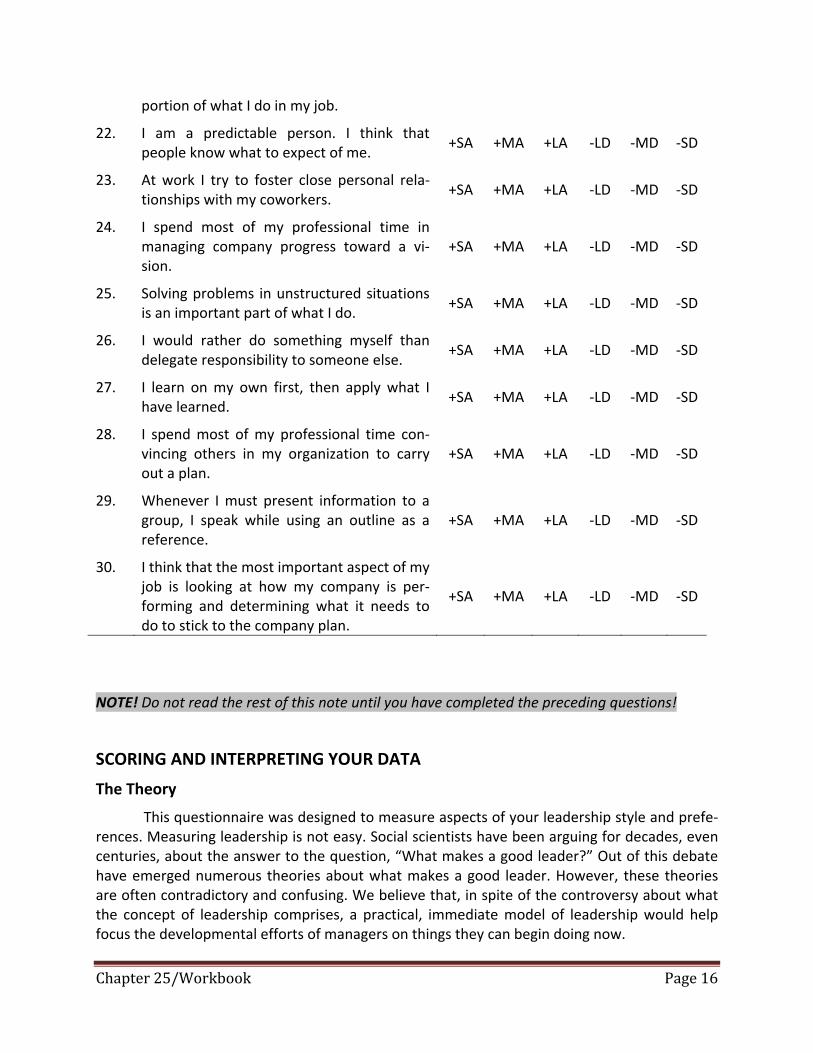
NOTE! Do not read the rest of this note until you have completed the preceding questions!
SCORING AND INTERPRETING YOUR DATA
The Theory
This questionnaire was designed to measure aspects of your leadership style and prefe‐rences. Measuring leadership is not easy. Social scientists have been arguing for decades, even centuries, about the answer to the question, “What makes a good leader?” Out of this debate have emerged numerous theories about what makes a good leader. However, these theories are often contradictory and confusing. We believe that, in spite of the controversy about what the concept of leadership comprises, a practical, immediate model of leadership would help focus the developmental efforts of managers on things they can begin doing now.
Chapter 25/Workbook Page 17
Given our reading of leadership studies and our observation of leaders in the world, we have concluded that leadership includes three fundamental clusters of skills and abilities: creat‐ing vision, garnering commitment to that vision, and monitoring and managing progress toward the realization of that vision.
Vision
Powerful leaders have a clear vision of where they want their organization to go. Vision is the view a person holds about what the organization will look like and do in the future. Ob‐viously, some people have greater visions than others, and some have visions that extend fur‐ther into the future than others. And some have visions that don’t work or come to fruition. Each manager can, and we believe, ought to have a vision of his or her organization, what it can become, where it is going, how it should be operating, and what it should be like to work within it.
Vision is an essential part of leadership. Having a vision requires creativity; one must be able to think and see beyond the present timeframe and beyond the usual options. The ability to see ahead and to see nontraditional alternatives are creative parts of leadership. So is the ability to frame the context of a business problem in broader terms that question current assumptions. The ability to incorporate these often unusual thoughts into a cohesive vision of the future of the company defines the first set of leadership skills.
Commitment
The ability to garner the commitment of others to one’s vision is a key cluster of leadership skills. A leader may have a vision of what an organization can become, but unless others receive and become committed to that vision, it is unlikely to be realized. Leaders can create visions, but commitment, on the other hand, is offered by followers. This commitment allows leaders to build their visions into organizational realities. A key task of the leader, then, is to garner com‐mitment from those people who are critical to his or her success.
Leaders may foster commitment in a variety of ways: public communications, one‐on‐one interactions, involving others in the decision‐making process, and by modeling commitment to an idea, to name a few. However successful leaders go about it, they are able to develop and maintain strong commitments from others to their vision for the organization.
Monitoring and Managing Progress Toward the Vision
The third cluster of skills in leadership that we see is the ability to monitor and manage progress of the organization toward the vision. For us, it is the bulk of “management” education today: ascertaining what the right measures are to monitor and the techniques and tools of getting those indicators to yield the right results. This aspect of leadership focuses on the de‐tails of the business. That we classify monitoring and management as a subset of leadership does not denigrate it. Instead, it points out that while managers can indeed be leaders, in our view, they need to augment their skills with the visionary and commitment‐building skills as outlined. To us, management is a component of leadership. Ensuring that deadlines are met, objectives are achieved, and budgets are used appropriately are valuable and necessary (but not sufficient) leadership skills.

Chapter 25/Workbook Page 18
Leadership and the Survey of Managerial Style (SMS)
Although some writers draw a provocative and dichotomous distinction between leadership and management, we believe they are closely related and that a consideration of the fluid rela‐tionship between them is more productive. Hence, we assert that leadership is not so much a question of whether someone is either a manager or a leader, but rather how much emphasis one places on the component skills of leadership including management. Knowing something about how a person tends to emphasize creating vision, garnering commitment, and monitor‐ing and managing progress toward the vision can help that person in several ways. We’ll outline some of those elements, but first, let’s score the data you generated.
Parts I and II of the SMS are designed to gather general information about you and to measure your self‐perception of your work behavior regarding each of the three clusters men‐tioned. From these data, you can begin to construct a picture of your leadership profile; that is, how much you emphasize leadership overall and how much you emphasize the three different clusters of leadership as outlined previously. With these data, you can begin to consider how strong your desire to be a leader is and how your behavior is distributed across the three di‐mensions of leadership.
SCORING YOUR DATA
Step 1: On the Scoring Form that follows, you will see that values are associated with each point on the scale used in Section II of the survey:
For each section of the scoring form, indicate the score for each of the items listed. For example, if you checked “slightly agree” for item 3 and “agree” for item 8, your scores for these items would be 4 and 5, respectively. Please note that in Section II scoring, not all items are scored. The extra items in Section II of the survey are in‐cluded to control measurement error and are not included in the individual scoring procedure.
Step 2: Sum the scores in each column to derive scores for vision, commitment, and man‐agement.
Step 3: Sum the scores for vision, commitment, and management to derive your total score.
Step 4: Compute proportional values for vision, commitment, and management by dividing the scale score by the total score.
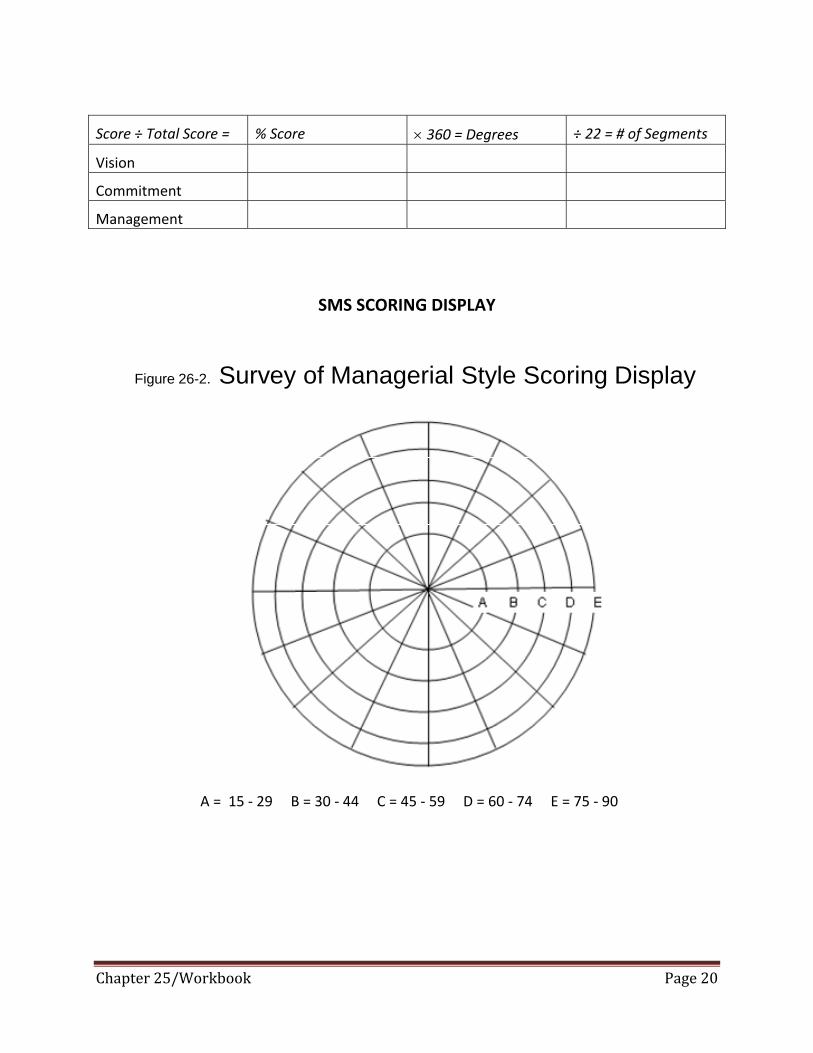
Step 5: Next, complete the SMS Profile two pages ahead. The concentric circles represent varying strengths of leadership: the larger the circle, the greater the interest in lea‐dership. The letters associated with each circle correspond to the total score ob‐tained in Section II of the survey. Find the circle that corresponds to your total score in Section II and trace the circle with a heavy marking pen.
Step 6: In the scoring profile, there are 16 pie segments that you can use to create your pro‐file. First, starting anywhere, draw a solid line from the center of the profile diagram out to the circle corresponding with your total score. (A, B, C, D, or E). Then, note that each dotted pie segment represents about 22 degrees (22.5˚ exactly) out of the

Chapter 25/Workbook Page 19
360 degrees in a circle. If your V score was 40 percent of your total score, then 0.40 × 360 = 144 degrees. 144 ÷ 22 degrees for each dotted segment = 6.5, so you would count 6.5 segments around the circle from your first line and draw a second one from the center to the circumference. This will be your “V” segment. Do the same for each of your other scores to produce a pie chart with three segments, one each for V, C, and M. Label each segment with their corresponding V, C, or M.
Note: When you finish scoring your data, you should have a pie chart with three di‐visions in it. The size of the pie reflects your overall interest in being a leader. The size of each of the three wedges, (one each for creating vision, garnering commit‐ment, and monitoring and managing progress toward the vision) indicates the rela‐tive strength of each leadership skill area. When you have completed the profile, proceed to the interpretation section.
SMS SCORING WORKSHEET
Score your responses as shown here.
Strongly Agree = 6
Moderately Agree = 5
Slightly Agree = 4
Slightly Disagree = 3
Moderately Disagree = 2
Strongly Disagree = 1
Item Score Item Score Item Score
Item 3 ________ Item 5 ________ Item 1 ________
Item 8 ________ Item 11 ________ Item 13 ________
Item 14 ________ Item 15 ________ Item 20 ________
Item 16 ________ Item 18 ________ Item 24 ________
Item 21 ________ Item 28 ________ Item 30 ________
Sum Sum Sum
Vision Commitment Management
________+ ________+ ________=
Total Score
Note: Maximum Scale Score = 30, Minimum Scale Score = 5
Chapter 25/Workbook Page 20
Score ÷ Total Score = % Score × 360 = Degrees ÷ 22 = # of Segments
Vision
Commitment
Management
SMS SCORING DISPLAY
Figure 26-2. Survey of Managerial Style Scoring Display
A = 15 ‐ 29 B = 30 ‐ 44 C = 45 ‐ 59 D = 60 ‐ 74 E = 75 ‐ 90

Chapter 25/Workbook Page 21
INTERPRETING YOUR PROFILE
The SMS Profile shows a graphical image of your current, self‐assessed interest in leader‐ship overall (the size of the circle you highlighted) and the relative strengths of your self‐assessed skill clusters in visioning, garnering commitment, and managing progress toward your vision. Let’s begin with the size of your circle.
The first thing to note is that it is not necessarily good or bad to desire to be or not to be a leader. People play different roles in life and in fact have influence in a wide variety of different situations. Leadership roles place demands on individuals just like all positions in life do; some people enjoy that set of demands while others do not. Regardless of how superficially attractive the recognition and apparent influence of leadership roles may be (e.g., “Wouldn’t it be nice to be the divisional president?”), unless one’s personal skills and interests fit the demands of a particular leadership position, one is not likely to be happy or successful in that position. Thus, the size of your leadership pie is not a value judgment about you or your worth in your organi‐zation or in society. Rather, it is a description of your present preferences regarding leadership activities and as such can be used to make more sound decisions about you and your work. If your pie is smaller than you “want” it to be, you might consider the various demands placed on leaders as reflected in the items in the survey. Do you really enjoy doing those activities? If not, perhaps you are not as enamored with being a leader as you may think at first blush. If you con‐clude you want your pie to be bigger; that is, that you’d like to have more interest in leadership activities, you might lay out a plan for involving yourself in more of those activities. Practice in leadership is like practice in other skill arenas—there’s no substitute for it.
As for the relative strength of your V, C, and M segments, knowing something about your relative skills at visioning, garnering commitment, and managing progress can certainly help you to clarify where you’re strong and where you might want to create a developmental plan. If your three V, C, and M segments are roughly the same size, you might conclude that your de‐velopment as a leader so far has been relatively balanced. If one of the segments is, in your view, too large or too small, you might begin thinking about how you could develop that side of your leadership skill set. We offer some suggestions shortly.
Remember that these relative strengths are not fixed, nor are they necessarily equally de‐sirable. Each profile, of course, will have different implications for your planning, development activities, and perhaps for the way you manage your work. Each profile will have certain strengths and weaknesses. The goal here is to be more aware of your leadership skill set and to be consciously managing your development in each arena.
Sometimes people will generate a small V score and comment that “Well, my current job doesn’t require me to be visionary or to think strategically, so it’s more a function of my job than of my personal characteristics.” This hypothesis is interesting, because if it were true, we might expect to find a highly correlated relationship between “level in your organization” and “V score.” The hypothesis seems to be that the higher our level, the more visioning our jobs will demand, and the more V we will manifest. In fact, after collecting data from some 600 business executives over several years, and testing this hypothesis, it seems not to be true. A scatter dia‐gram of the data points on “level in the organization” and “V score” shows points all over the quadrant; nothing approaching a diagonal trend line. This result suggests that people with
Chapter 25/Workbook Page 22
strong visioning skills and habits can be found at virtually any level in most organizations. If this is the case, we might surmise that when it comes to being promoted, presumably to higher‐level jobs that require more visioning skills, all things being equal, the candidate with the stronger visioning skills is likely to be chosen. The implication here is clear: it’s never too early to begin developing and strengthening your visioning skills.
Let’s review some of the common VCM profile patterns. Look at the sample profiles shown here. What are the strengths and weaknesses of each of the profiles? Can you think of people, either at your work or in the public business eye, who seem to fit those profiles?
Now, compare your profile to the ones shown and your analysis of them. What strengths and weaknesses did you list for “your” profile? If you wanted to “strengthen” your profile, what could you do?
INTERPRETIVE ALTERNATIVES
For each of the following alternative profiles, write your interpretation of what it might mean to the individual or corporation that has it. See if you can identify individuals who fit each pattern.
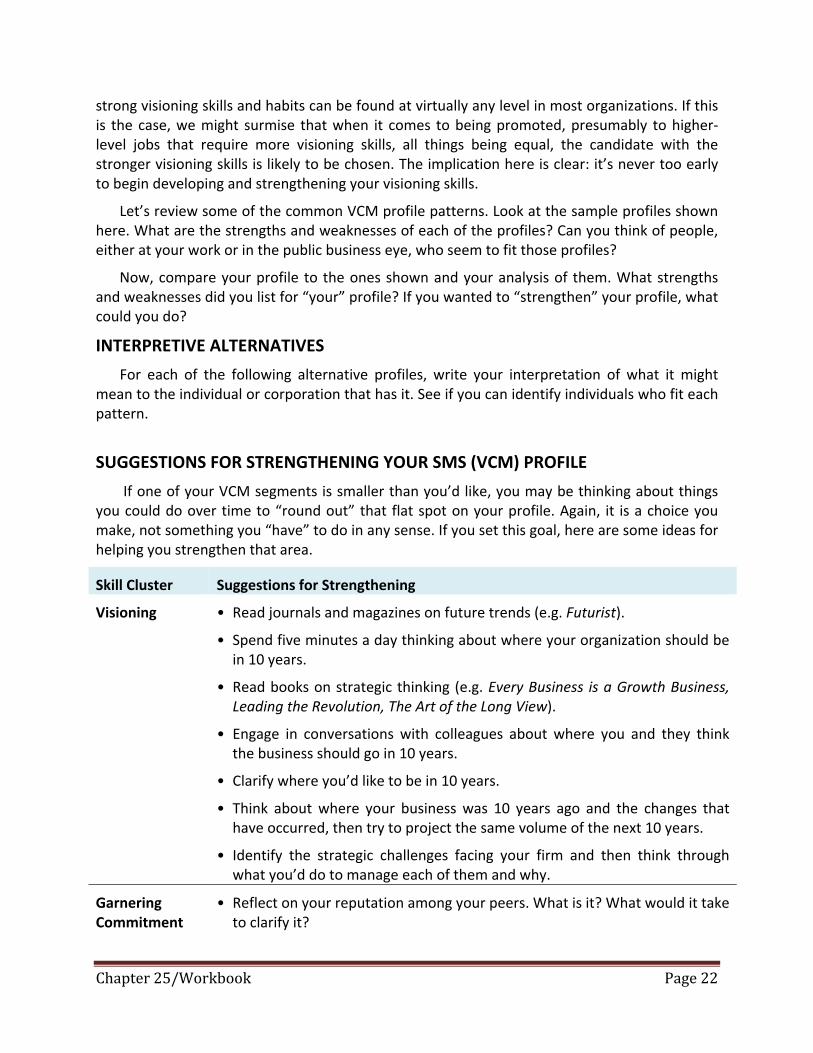
SUGGESTIONS FOR STRENGTHENING YOUR SMS (VCM) PROFILE
If one of your VCM segments is smaller than you’d like, you may be thinking about things you could do over time to “round out” that flat spot on your profile. Again, it is a choice you make, not something you “have” to do in any sense. If you set this goal, here are some ideas for helping you strengthen that area.
Skill Cluster Suggestions for Strengthening
Visioning • Read journals and magazines on future trends (e.g. Futurist).
• Spend five minutes a day thinking about where your organization should be in 10 years.
• Read books on strategic thinking (e.g. Every Business is a Growth Business, Leading the Revolution, The Art of the Long View).
• Engage in conversations with colleagues about where you and they think the business should go in 10 years.
• Clarify where you’d like to be in 10 years.
• Think about where your business was 10 years ago and the changes that have occurred, then try to project the same volume of the next 10 years.
• Identify the strategic challenges facing your firm and then think through what you’d do to manage each of them and why.
Garnering Commitment
• Reflect on your reputation among your peers. What is it? What would it take to clarify it?

Chapter 25/Workbook Page 23
• What techniques do you usually use to influence your peers? How many dif‐ferent techniques do you use? What new ones could you add?
• Practice listing and discussing the major pros and cons of key issues in the next several meetings you are in. See if you can demon‐strate a balanced view to your peers on each topic/issue rather than just buttressing your opinion with a one‐sided view.
• Try listening for complete understanding of your peers’ ideas before you present your own.
• Pay attention to how often you interrupt people. Try to reduce that fre‐quency.
Managing Progress To‐ward the Vision
• List on paper at the end of each day what you did, however small, that moved your organization toward its goals.
• List your goals (personal and professional) for the next three months.
• Invite those who report to you to do the same and then discuss them.
• Read your company’s annual report in detail. Can you see progress? If not, what can you do to improve it?
• What could you delegate to others so you could focus on getting the impor‐tant things done?
• How clear are you in performance reviews about exactly what you want the other person to do? How well do you listen to what they want to do and how you can help make that happen?
CONCLUSION
Leadership is comprised of many skills. This exercise was intended to help you identify your current self‐assessment on three clusters of key leadership skills: visioning, garnering commit‐ment toward your vision, and managing progress toward it. We hope that the scores on the V, C, and M scales and the graphical portrayal of their size and relative strengths will help you think about your own leadership profile and how you might go about strengthening it—if your goal is to do so. This instrument is only one among many. We encourage you to utilize all the data you can as you continue your quest to strengthen your leadership.
Chapter 25/Workbook Page 24
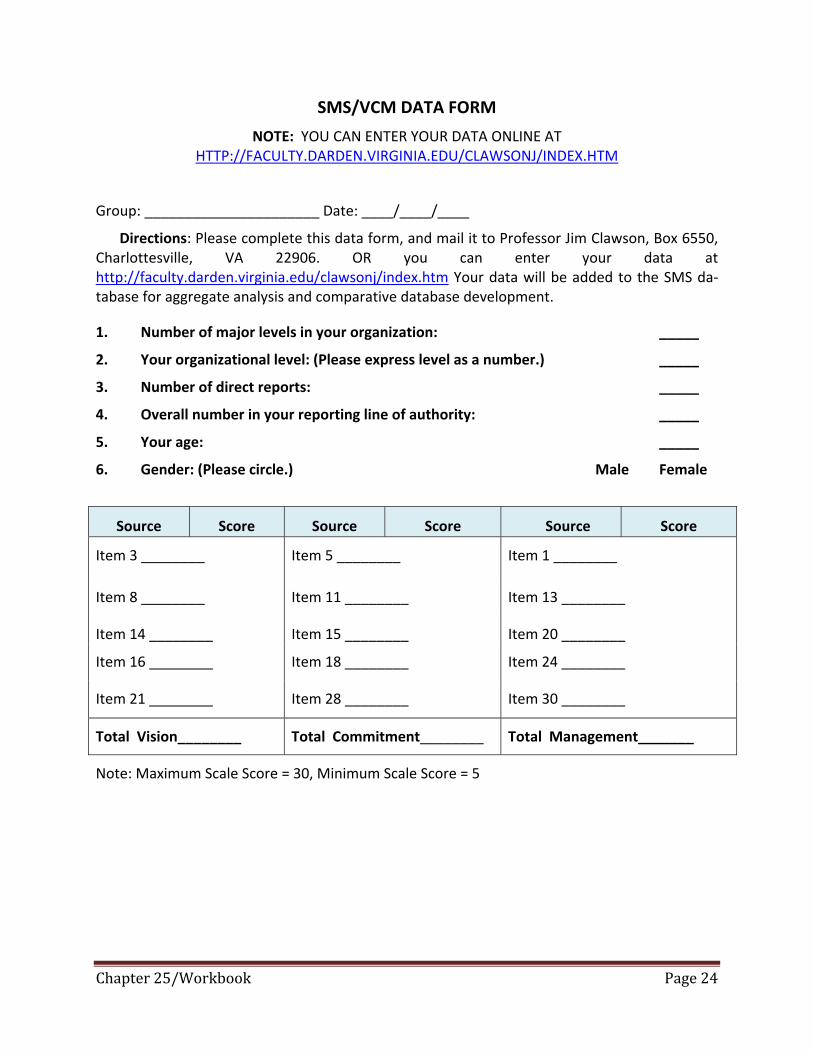
SMS/VCM DATA FORM
NOTE: YOU CAN ENTER YOUR DATA ONLINE AT HTTP://FACULTY.DARDEN.VIRGINIA.EDU/CLAWSONJ/INDEX.HTM
Group: ______________________ Date: ____/____/____
Directions: Please complete this data form, and mail it to Professor Jim Clawson, Box 6550, Charlottesville, VA 22906. OR you can enter your data at http://faculty.darden.virginia.edu/clawsonj/index.htm Your data will be added to the SMS da‐tabase for aggregate analysis and comparative database development.
1. Number of major levels in your organization: _____
2. Your organizational level: (Please express level as a number.) _____
3. Number of direct reports: _____
4. Overall number in your reporting line of authority: _____
5. Your age: _____
6. Gender: (Please circle.) Male Female
Source Score Source Score Source Score
Item 3 ________ Item 5 ________ Item 1 ________
Item 8 ________ Item 11 ________ Item 13 ________
Item 14 ________ Item 15 ________ Item 20 ________
Item 16 ________ Item 18 ________ Item 24 ________
Item 21 ________ Item 28 ________ Item 30 ________
Total Vision________ Total Commitment________ Total Management_______
Note: Maximum Scale Score = 30, Minimum Scale Score = 5

Chapter 25/Workbook Page 25
MY PERSONAL LEADERSHIP DEVELOPMENT GOALS (KEEP, LOSE, ADD)
Following your class discussion of personal blind spots and the personal change process, consider your own leadership style as you now understand it and note the aspects of your leadership style that you’d like to keep, lose, or add. You can use this assessment as your personal leadership development plan.
KEEP LOSE ADD

Chapter 25/Workbook Page 26
LEADERSHIP INTELLIGENCE SELF‐ASSESSMENT
Following the discussion of leadership and intelligence and/or reading Chapter 12, as‐sess your intelligence in each of the following categories by making check marks as appropriate. You may wish to check your self‐assessment with others who know you well.
Low Medium High
Intellectual Intelligence (IQ):
Inherited abilities
Curiosity
Discipline
Range of interests
Emotional Intelligence (EQ):
Recognizing emotions in yourself
Managing your emotions
Using productive self‐talk
Avoiding emotional hijackings
Social Intelligence (SQ):
Recognizing emotions in others
Caring about the emotions of others
Counseling others in managing their emotions
Change Intelligence (CQ):
Recognizing the need to change
Understanding the change process
Skill in managing the change process

Chapter 25/Workbook Page 27
Managing Your Energy2 In the midst of busy lives, most people focus their organizational efforts on time manage‐
ment. Books have been written about how to help people with this issue (e.g., How to Get Con‐trol of Your Life and Your Time and The Time Trap). Many consultants make a nice living advising people how to manage their time. Indeed, whole companies have sprung up and made a profit‐able existence trying to advise people about how to manage their time (e.g., Franklin‐Covey, Inc.). Clearly, time is a critical resource and an important input into our productivity and enjoy‐ment of life. But your productivity and enjoyment do not depend on your time management alone. Many factors affect our outputs and satisfactions in life. They include our talents, our choices, and surely, our personal energy level. In fact, the amount of energy we bring to our allotted time on the earth (beginning with the fixed 168 hours per week) may well determine much more about how much we give and get in life than our allocation and use of time.
The choices we make about how we eat, how we use our time, how we sleep, how we exer‐cise, and how we manage our relationships all contribute to the amount of energy we have in life. We would probably be better off if we paid more attention to our energy management than to our time management. Consider, for example, the case of physicians. A typical emer‐gency room attending physician or a typical thoracic surgeon might work up to 110 hours a week. How do they have enough energy and stamina to live this kind of life, year after year? How would their energy level compare to that of an assembly line worker who spends 40 to 45 hours a week on the job? Is it just because physicians are dealing with life‐and‐death situa‐tions? Are they workaholics? Or are they managing their personal energy levels more effective‐ly?
One of the best definitions of leadership is the ability to manage energy, first in yourself and then in those around you. If your interactions with people are building their energy, you are probably leading them. If your interactions are sucking energy out of people, you may be in charge, but you’re probably not leading.
The goal of this exercise is to help you begin to clarify those things in your life that energize you and those that de‐energize or debilitate you. Use the following table to help clarify how your choices affect your energy level. You may find the references at the end interesting in helping you to learn more about how you might manage your energy on a regular basis.
2 This note was prepared by James G. Clawson, professor of Business Administration, Darden Graduate School of Business Administration, University of Virginia, and includes some ideas of Dr. Curt Tribble, M.D. formerly of the UVA Thoracic Surgery Department. It was written as a basis for class discussion rather than to illustrate effective or ineffective handling of an administrative situation. Registered with Darden Publishing as “Energy Management Exercise,” (UVA‐OB‐0716). Copyright © 2000, 2003 by the University of Virginia Darden School Foundation, Char‐lottesville, VA. All rights reserved. To order copies, send an e‐mail to or visit [email protected] or visit www.dardenbusinesspublishing.com. No part of this publication may be reproduced, stored in a retrieval system, used in a spreadsheet, or transmitted in any form or by any means—electronic, mechanical, photocopying, recording, or otherwise—without the permission of the Darden School Foundation.

Chapter 25/Workbook Page 28
Category of Activities Things That Energize Me Things That Drain My Energy
Activities
Foods
Sleep
Relationships
Entertainment
Exercise
Other
ENERGY ACTION ITEMS
Once you have listed as many items as you can under the categories in the table, reflect on the two columns. Identify one to five things you could do to increase your energy level. Try one or two of these things for the next week, and make daily, written observations about how your energy level is affected by them. These self‐observations will be important in helping you see the connection between your choices and your energy level.
Energy management goals for the coming week:
1.
2.
3.
REFLECTIONS
Once you have tried one or two things for a week, make some written inferences about their impact on you and your energy level. Write down these insights so you can see them and refer to them. Which ones do you want to continue? What makes it difficult to continue doing them? What can you do to ensure that these goals become positive, repeating habits?
ENERGY AND LEADERSHIP
If you agree with the notion that leadership is about managing energy, first in yourself and then in those around you, you might ask yourself, “Do people see me as a net energy sucker or a net energy contributor? Why?” This assessment may help you think about how you might raise your energy level when you’re dealing with yourself and then others.
REFERENCES
Covey, Stephen. Seven Habits of Highly Effective People. New York: Simon & Schuster, 1991.
Lakein, Alan. How to Get Control of Your Time and Your Life. New York: Dutton, 1974.
Maas, James B. Power Sleep. New York: Harper Collins, 1999.
MacKenzie, R. Alec. The Time Trap. New York: AMACOM, 1997.
Robbins, Anthony. Unlimited Power. New York: Simon & Schuster, 1997.

Chapter 25/Workbook Page 29
Life’s Dream Exercise3 This exercise is also available online at www.CareerNextStep.com.
his exercise is designed to help you identify your life’s dream(s). We will explore two definitions of “life’s dream.” First, we refer to an “external life’s dream” or Dext based on achievements and accomplishments, which is the typical definition that most
people understand. Dext relates to one’s early dreams in life to become something or accom‐plish something. Sometimes people refer to their Dext as, “What I want to be when I grow up.” The central question for Dext is, “What do you dream of doing or becoming?” Examples might be “CEO of a company,” “a pilot,” “wealthy,” or “a good parent.” Many people refer to their life’s dream when they mean their “goal in life.” Goals are not dreams, especially as we are us‐ing the term here.
Second, we will also refer to an “internal life’s dream” or Dint. An internal life’s dream is de‐fined by our emotional experiencing. In other words, the target for understanding Dint is to fo‐cus on your feelings. For Dint, the question is, “How do you want to feel?” Examples might be “fully engaged,” “easy speed,” “productive,” or “peaceful.”
A danger comes in focusing too much either on Dext or Dint. If you focus on Dext to the ex‐clusion of Dint, you may find yourself one day wealthy and miserable. If you focus on Dint to the exclusion of Dext, you may find yourself peaceful and poor. The challenge is to pay atten‐tion to both Dext and Dint. In our experience, most people focus heavily on Dext, so the more common error is to live relatively unaware of one’s experience.
The following questions are designed to help you identify your Dext and Dint and to distin‐guish between them. In our experience, it is more difficult to define Dint than Dext. So, if you cannot write satisfactory answers on your first try, don’t despair. It may take considerable thinking and reflection before you settle on a Dint with which you are comfortable. Some people seem to figure them out quickly; others may take a year or more to find the “right” wording and comprehensiveness.
IDENTIFYING YOUR EXTERNAL LIFE’S DREAM (Dext)
Use the following table to draft your external life’s dream or Dext.
3 This exercise was prepared by James G. Clawson, adapted from ideas by Doug Newburg. Copy‐right © 2001, 2003 by the University of Virginia Darden School Foundation, Charlottesville, VA. All rights reserved. To order copies, send an e‐mail to [email protected]. No part of this publication may be reproduced, stored in a retrieval system, used in a spreadsheet, or transmitted in any form or by any means—electronic, mechanical, photocopying, recording, or otherwise—without the permission of the Darden School Foundation.
T

Chapter 25/Workbook Page 30
1. What do you want to be doing at age ___? (Add 15 years to your current age.)
2. What do you want to be at age ___? (Add 15 years to your current age.)
3. What do you want people to remember you for?
4. What do you want your epitaph to say?
5. When you were little, what did you want to become? What happened to that dream?
6. If you were independently wealthy now, what would you do?
7. Meld all of the preceding answers into one description of your Dext.
Note that all of these questions focus on things that you DO, or positions or titles that you HOLD. These can all be measured externally, that is, by observation by others.
IDENTIFYING YOUR INTERNAL LIFE’S DREAM (Dint)
The next set of questions asks you to consider your emotional dream by focusing on feelings. Again, we presume you have had a discussion in class exploring the concept of resonance. Try to be as descriptive as you can while still being concise. Finding the right words is key. Short an‐swers such as “happy” may be true, but not especially helpful. How do you feel when you are happy? Long answers may be confusing and obfuscating. Try to distill your descriptions down to a phrase.
1. When in your life have you experienced “flow” or “resonance”? What were you doing?
2. How did you feel when you were in flow? What aspects of it were satisfying to you?
3. How are you feeling when you are performing at your peak and enjoying it?
4. When were you most productive in your life? How did it feel?
5. What kind of experience are you willing to work for?
6. When you are “successful,” how do you feel?
7. Use your preceding answers to help you distill

Chapter 25/Workbook Page 31
a single Dint here: HOW DO YOU WANT TO FEEL ON A DAILY BASIS?
8. What does it take to feel that way? (Prepara‐tion)
9. What keeps you from feeling that way? (Ob‐stacles)
10. What does it take to get that feeling back? (Revisiting Your Dream)
11. What are you willing to work for? (Energy Cycle)
We expect that this will not be your final draft of either your Dext or your Dint. We encour‐age you to keep these definitions handy and to reflect on them regularly. Revise and refine them as your “eyes‐open” dreaming becomes clearer. The following table may help you track your life’s dreams as they evolve over time.
Date External Life’s Dream (Dext) Internal Life’s Dream (Dint)
IMPLEMENTING YOUR LIFE’S DREAM (Dint)
The next challenge after identifying your Dint will be to utilize it. In my experience, I have been so conditioned to focus on “to‐do” lists and external achievements, it has become difficult to remember to focus on Dint and then refer to it regularly. In other words, I, like mil‐lions of others, get caught in the “duty cycle,” bouncing back and forth between work/preparation and obstacles and forget to “revisit my dream.” Here are a couple of sugges‐tions that will help you recognize how much you focus on Dext and how to focus more on Dint.
1. Keep your Dint definition posted somewhere in your morning routine, perhaps in your bath‐room, to remind you of it.
2. Every time you find yourself making a “to‐do” list for the day or week, be sure to add the full definition (not just “live my Dint”) to your list.
3. If you keep a daybook or a PDA schedule, mark each day that you live your Dint with a sym‐bol (perhaps a “D”). At the end of the month as you scan your daybook, you can see how many days out of the month you lived your experiential dream and whether you’re getting better at it.

Chapter 25/Workbook Page 32
Balancing Your Life4 This instrument is also available at www.CareerNextStep.com.
Then one evening I phoned home to tell the boys I wouldn’t make it back in time to say good night. I’d already missed five bedtimes in a row. Sam, the younger of the two, said that was O.K., but asked me to wake him up whenever I got home. I explained that I’d be back so late that he would have gone to sleep long before; it was probably better if I saw him the next morning. But he insisted. I asked him why. He said he just wanted to know I was there, at home. To this day, I can’t ex‐plain precisely what happened to me at that moment. Yet I suddenly knew I had to leave my job.
The central paradox is this: Most of us are earning more money and living better in material terms than we (or our parents) did a quarter century ago, around the time when some of the technologies on which the new economy is based—the microchip, the personal computer, the Internet—first emerged. You’d think, therefore, that it would be easier, not harder, to attend to the parts of our lives that exist outside paid work. Yet by most measures we’re working longer and more frantically than before, and the time and energy left for our non‐working lives are evaporating.
—ROBERT REICH,
former Secretary of Labor, The Future of Success, pp. 3, 5
eaders in the modern era face the significant challenge of finding the right balance in their lives between work, family, self, and other interests. The constantly growing and competing demands of life on many fronts push us all to make daily behavioral deci‐
sions about how we spend our time and talents, often without taking the time to think clearly about the consequences of those decisions. Making those decisions without a clear picture of their consequences can be devastating for us all—leaders, managers, and employees.
Some people naturally seem to find a balance that fits them and their own definition of suc‐cess over the years. Others have a more difficult time finding it. Far too many at middle or late middle age find that they are deeply dissatisfied with the way their lives have turned out. Erik Eriksson in Childhood and Society, for example, outlined eight ages of humankind, each charac‐terized by binary dilemmas. Even though it is admittedly and primarily a Western approach, his
4 This exercise was prepared by James G. Clawson. Copyright © 1986, 2007 by the University of Virginia Darden School Foundation, Charlottesville, VA. All rights reserved. To order copies, send an e‐mail to sales@darden pub‐lishing.com. No part of this publication may be reproduced, stored in a retrieval system, used in a spreadsheet, or transmitted in any form or by any means—electronic, mechanical, photocopying, recording, or otherwise—without the permission of the Darden School Foundation.
L

Chapter 25/Workbook Page 33
eighth stage in which older people wrestle with feelings of despair or integrity is instructive. His observation is that later in life we see that it’s too late to change much in our lives. We either realize that life has come together much in the way that we hoped and dreamed it would (inte‐grity in the sense of integration into a complete whole) or we realize that life hasn’t turned out as we thought it would, and because it’s too late to change, we begin to despair. Eriksson’s as‐sertion is confirmed in the publication of books such as The Failure of Success; Must Success Cost So Much?; Career Success/Personal Failure; Workaholics; Work, Family and the Career; Tradeoffs: Executive, Family and Organizational Life; and the former Secretary of Labor’s book, The Future of Success, quoted above. All of these books examine the ways in which our daily, weekly, and yearly choices repeated over and over structure our lives—sometimes in ways that we later deeply regret. The potential tragedy is have to make those choices without thinking or anticipating their outcomes.
What we can learn from these commentaries is not to seek a common “right” balance. In‐stead, we should be aware of our current choices of time and energy allocation and make ad‐justments that point us toward our personal definitions of success in life, not just “career.” The often‐quoted line, “How many of us, on our deathbeds, with our last gasp will breathe, ‘If only I had spent more time at the office!’” makes the point. No one wants to make daily decisions that add up over a lifetime to a balance that one realizes, in retrospect, was not what one would have consciously chosen.
This exercise is designed to help you see your current behavioral allocation of time and how it matches up with your personal definition of success. The exercise is built upon some funda‐mental assumptions:
1. We all have a limited, but equal, 168 hours per week of time.
2. We all have some freedom in choosing how we spend that time.
3. We all have some talent to apply to the time we have.
4. We all have various dimensions to our lives that we choose, consciously or unconscious‐ly, to develop or ignore.
A list of these dimensions is given in Table 1. Some of the definitions may not be just what you immediately think, so please look at the parenthetical definitions so you’ll know what we mean for each dimension. You may be able to think of other dimensions of life that should be added to the list. The point is that, because life consists of a number of facets, by choosing to spend time, energy, and talent in some areas, we necessarily neglect others. Alex Horniman of‐ten declares, “Excellence is a neurotic lifestyle,” suggesting that to excel, most of us have to fo‐cus our time and attention in powerful ways. When we engage intensely and consciously, as in the case of an Olympic hopeful athlete, we acknowledge the sacrifice that we are making in other aspects of life and become singular in our focus. Others prefer to have a more rounded lifestyle, and in so doing, may recognize the sacrifice of excellence in any one area. The chal‐lenge is to know what your choices are and what they mean for you. Perhaps this exercise can help.
Completing the exercise requires several steps:

Chapter 25/Workbook Page 34
1. Clarify your personal definition of success. Write it down in the following space. What does it mean to you now to be “successful?” Research shows that a person’s definition of success may vary over that person’s lifetime, but we need a place to start. You may not have thought about it before, so it may take some reflection to clarify what it means to you to be “successful.” Approach this exercise broadly—consider what it means to be successful in life, not just your career. It’s your life, only you can live it, and you are the primary shaper of it. What do you want it to be? Try to be specific as you can. “To be happy” may be true, but it’s not especially helpful. What will make you happy? The clarity of the definition will make the exercise more powerful for you.
Table 1
Aspects of Adult Life
Professional (working, earning in career and job)
Financial (managing money affairs)
Material (collecting things)
Recreational (playing)
Physical (exercising)
Sleep
Intellectual (learning, committing to memory, thinking)
Emotional (feeling, sensing, being aware of emotions)
Spiritual/Philosophical (praying, meditating, communing, reflecting)
Marital (with your spouse)
Parental (with your children)
Familial (with your parents)
Social (with your friends)
Societal (community work)
Sexual
Political (political work)
Ecclesiastical (church work)
Success is:

Chapter 25/Workbook Page 35
Keep your definition where you can refer to it often; revise it as you feel it necessary. For the ship with no destination, any port will do, but the ship with a destination has a course and a purpose to its sailing. You may wish to consider the various aspects in Table 1 again as you write your personal definition. Reflect on the comment by the famous comedienne, Lily Tomlin: “I always wanted to be somebody. Maybe I should have been more specific.”
You may also wish to include some principles of measuring success along the way. That is, what if success were not a single place or condition? In that case, you may wish to define “success” in terms of the directions you’re moving at any one point in time. This approach would not re‐quire you to define what you’d look like at age, say, 65, rather only what you processes you’d like to have in place as you move toward that milestone. This is a process oriented definition, not a “point” definition.
2. Assess your current level of development. On the wheel diagram in Figure 26‐3 assess your current level of personal development on each dimension. Use a scale of 1–10, where 1 is completely undeveloped and 10 is perfectly developed; that is, at a world‐class level. A “10” on the physical dimension, for example, would be an Olympic medalist; a “1” would be not being able to walk around the block comfortably. The zero point is at the center of the dia‐gram. When you have marked your level of development on each dimension, shade in the area of your development across all dimensions. The result will show your perception of your life’s developmental balance at this point. You may find the shape of your profile in‐structive as you think about how it compares with your definition of success. This diagram is the central piece of this exercise.
Secondly, you can draw your goal or target profile on this same Balance Wheel using another color. This target profile will help you highlight the gaps in your present level of de‐velopment.
The definitions in Table 2 suggest another way of delineating your development. You may wish to keep these definitions in mind as you determine how to assess and shade in your development profile.
3. Assess your current allocation of time. Using the list of aspects of life shown again in Table 3, estimate how much time a week you spend on each one. Without reviewing your day planner, just estimate in Column A how much time you spend on each dimension.

Chapter 25/Workbook Page 36
Figures 26‐3. A Personal Developmental Balance Wheel
Physical
Intellectual
Spiritual
Emotional
Professional
Financial
Material
Political
Familial
Marital
Parental
Social
0
4
6
810
2
Table 2
Stages of Growth
One way of thinking about movement from the center of the diagram or embryonic level of de‐velopment is in terms of “maturity.” Using the following definitions, you can gauge your devel‐opment on each dimension. These terms are intended to be descriptive, not evaluative.
1. Embryonic: Unaware that the dimension exists and therefore pays no attention to it.
2. Youth: Aware that the dimension exists but does little intentionally to develop it.
3. Adolescent: Aware that the dimension exists but believes that it can be developed later; therefore, does a little about developing it now and then moves on.
4. Young Adult: Aware that the dimension exists and concerned about developing it. Has a superficial awareness that one must work at developing it all along and makes modest ef‐forts to develop it.
5. Mature Adult: Aware that the dimension exists and concerned about developing it. Has a deep awareness of the need to develop the dimension constantly and is working hard to develop it.

Chapter 25/Workbook Page 37
Table 3
Personal Allocation of Time
TIME SPENT LAST WEEK
ASPECT OF LIFE ESTIMATED TOTAL (FROM TABLE 5)
Professional
Financial
Material
Recreational
Physical
Sleep
Intellectual
Emotional
Spiritual/Philosophical
Marital
Sexual
Parental
Familial
Social
Societal
Political
Ecclesiastical
Total (168?)
Note daily your use of time in each of the following life dimensions: Working, Sleeping, Ex‐ercising, Managing Personal Hygiene (dressing, eating, bathing—you might include this in Phys‐ical if you don’t want a separate look at your exercise), Reading and Learning (Intellectual), Managing Finances, Recreating (including most TV), Attending to Material Things, Parenting, Being with Significant Other, Being with Parents, Being with Friends, Working in the Communi‐ty, Working in Political Events, Being in Church, Meditating/Communing/Praying. Include your “shadow hours” in parentheses. Then summarize the results in Table 5.
If you have time, you may wish to actually keep track of your time for a week. Like our per‐ceptions of our spending habits, our perceptions of how we spend our time do not often match up with the realities. You can use the form in Table 4 to keep a weekly time diary and then

Chapter 25/Workbook Page 38
transform your results in Table 5 to show how much time you spent during the week on each dimension. Then enter the totals in Column B in Table 3.
As you work through this exercise, you will notice that some dimensions overlap, that is, you could be working on more than one dimension at the same time. If you work construction, you are probably getting lots of exercise while you are working. Likewise some aspects of work may involve new learning that stretches your mind intellectually and spending time socially can be as emotionally powerful as when you are comforting grieving friends. You might deal with this overlap by first allocating the 168 hours that you have each week to the dominant aspect and then returning to add “shadow hours” in parentheses to indicate that time spent elsewhere really had developmental impact in another area. For instance, if you find that your work re‐quires you to be learning (not just repeating what you can already do), you might assess how much of your work time is like that and add that number to the Intellectual box in parentheses. In this way, your week of 168 hours is leveraged; you can assess how rewarding on how many dimensions your time choices are. If you play golf with your peers, for example, you can
Table 4
Time Diary for One Week
TIME MON TUES WED THU FRI SAT SUN
12:00 midnight
2:00 a.m.
4:00 a.m.
6:00 a.m.
8:00 a.m.
10:00 a.m.
12:00 noon
2:00 p.m.
4:00 p.m.
6:00 p.m.
8:00 p.m.
10:00 p.m.
Table 5
Allocating Time Over the Aspects of Adult Life
TIME SPENT DURING THE WEEK OF ___/___/___
ASPECT MON TUE WED THU FRI SAT SUN TOTAL

Chapter 25/Workbook Page 39
Professional
Financial
Material
Recreational
Physical
Sleep
Intellectual
Emotional
Spiritual
Marital
Sexual
Parental
Familial
Social
Societal
Political
Ecclesiastical
Other:
ACTUAL TOTAL 24 24 24 24 24 24 24 168
SHADOW TIME
TOTAL TIME
count that time as recreation, but probably not include any shadow hours in parental time. If you play golf as a family, you could have recreation time and shadow time with marital and pa‐rental aspects. You may find it interesting to see how much of your work time has shadow ben‐efits to other aspects of life; that is, are you learning at work? Are you growing socially at work? You may find that you have no time, shadow or otherwise, for a particular dimension or that the only time you have for a dimension is shadow time. It may be that your shadow time is not as productive as “hard time” in which your attention and efforts are concentrated. You decide what to include and how effective both hard and shadow times are. When you’re done, you can add up your total hard hours and your shadow hours in Table 5.
If you don’t have time to complete an actual diary (which is also interesting—it’s all data), think back on the previous week and try to allocate the time you spent on each dimension. Use Table 4 and 5 to help you and then enter your retrospective look in Column B in Table 3.

Chapter 25/Workbook Page 40
4. Create a profile of your current time allocation. You can create a profile in two ways. First, you could use the second wheel diagram in Figure 2 to mark and fill in your time allocations. The wheel is the same size and shape as the one in Figure 1, but the scale is now “Five times the hours of time” so that “10” means you spend 50 hours a week on this dimension. In‐clude your shadow time in this calculation. I realize that some of you may be working 60, 70, 80, or even 90 hours a week. If so, extend your Professional pie segment beyond the outer circle in scale to your current level of work.
An alternative approach here would be to use a spreadsheet graphing program, if you have one, to create a pie chart of how much time you spent on each dimension last week using the data from step 3. The result won’t match the format of your developmental pro‐file, but you can use it to compare mentally. [You could also create a wheel by hand using a compass and protractor by drawing a circle and calculating the percentage of time for each dimension (number of hours / 168 × 100) and multiply by 360 to get the number of degrees around the circle for each dimension. For example, if you spent 55 hours working, then 55/168 × 100 = 33% × 360 degrees = 120 degrees of arc around the circle for that dimen‐sion.]
5. Compare and reflect. Now, consider the relationships between your definition of success, your goal or target profile, your current self‐assessed level of development, and your cur‐rent time allocations. The following questions may help guide your reflection.
1. What connections do you see? What disparities or gaps?
2. Do any “flat spots” on either wheel diagram concern you?
3. How do they relate to your definition of success and your allocation of time?
4. Do you want to do anything about them? How much time and talent will it take?
5. What will the impact of your current time allocation be on your development over the course of your life? That is, where logically does your present time allocation pattern take you 20 or 30 years into the future?
REFERENCES
Derr, Brooklyn. Work, Family and the Career. New York: Praeger Special Studies, 1980.
Evans, Paul, and Fernando Bartolome. Must Success Cost So Much? New York: Basic Books, 1980.
Fassel, Diane. Working Ourselves to Death. New York: Harper Collins, 1990.
Greiff, Barrie S., and Preston K. Munter, Tradeoffs: Executive, Family and Organizational Life. New York: New American Library, 1980.
Korman, Abraham K. Career Success/Personal Failure. New York: Prentice Hall, 1980.
Lee, Mary Dean, and Rabindra N. Kanungo. Management of Work and Personal Life. New York: Praeger Special Studies, 1984.
Marrow, Alfred. The Failure of Success. New York: Amacom, 1972.

Chapter 25/Workbook Page 41
Machlowitz, Marilyn. Workaholics. Reading, MA: Addison‐Wesley, 1977.
Reich, Robert. The Future of Success. New York: Alfred Knopf, 2001.
Chapter 25/Workbook Page 42
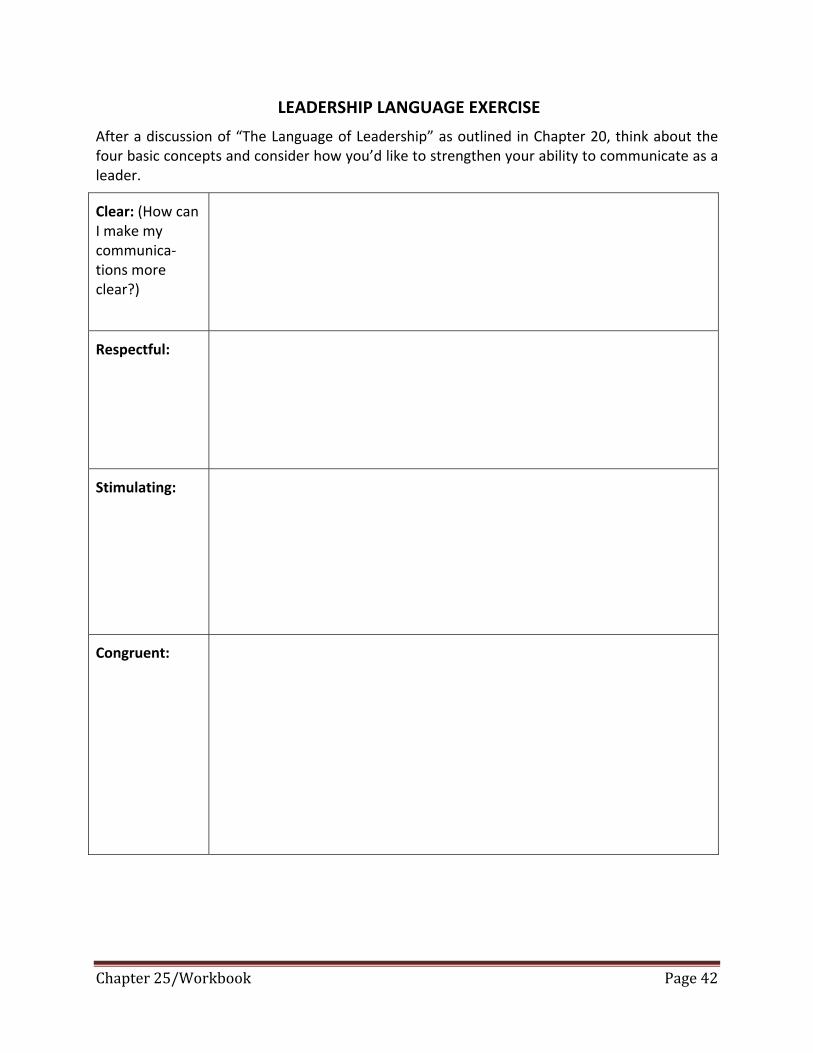
LEADERSHIP LANGUAGE EXERCISE
After a discussion of “The Language of Leadership” as outlined in Chapter 20, think about the four basic concepts and consider how you’d like to strengthen your ability to communicate as a leader.
Clear: (How can I make my communica‐tions more clear?)
Respectful:
Stimulating:
Congruent:

Chapter 25/Workbook Page 43
Leadership Steps Assessment (LSA)5 This instrument is also available online at www.CareerNextStep.com.
eadership has many different components. This exercise offers the opportunity to as‐sess your leadership activity on several of these dimensions. You will be asked in Part I to rate a series of descriptors (adjectives) for how well they currently describe you,
and then in Part II to rate a number of sentences as to how well they apply to you. You should answer regarding how you currently see yourself, not how you think that you should be, or would like to be. There is no benefit to trying to “game” the assessment—just make the best assessment you can of how you currently are on items in the inventory.
Important: Please do not read ahead. After you have completed all of the items, you can go on to the theory, scoring, and interpretation sections. These sections will explain the nature of the instrument and what it is measuring. If you read ahead, you may bias your responses and reduce the value of the data to you.
The instrument will take between 30 and 60 minutes to complete. Please leave yourself enough time to complete the instrument and work through the scoring and interpretation. When you are ready, please turn the page and begin.
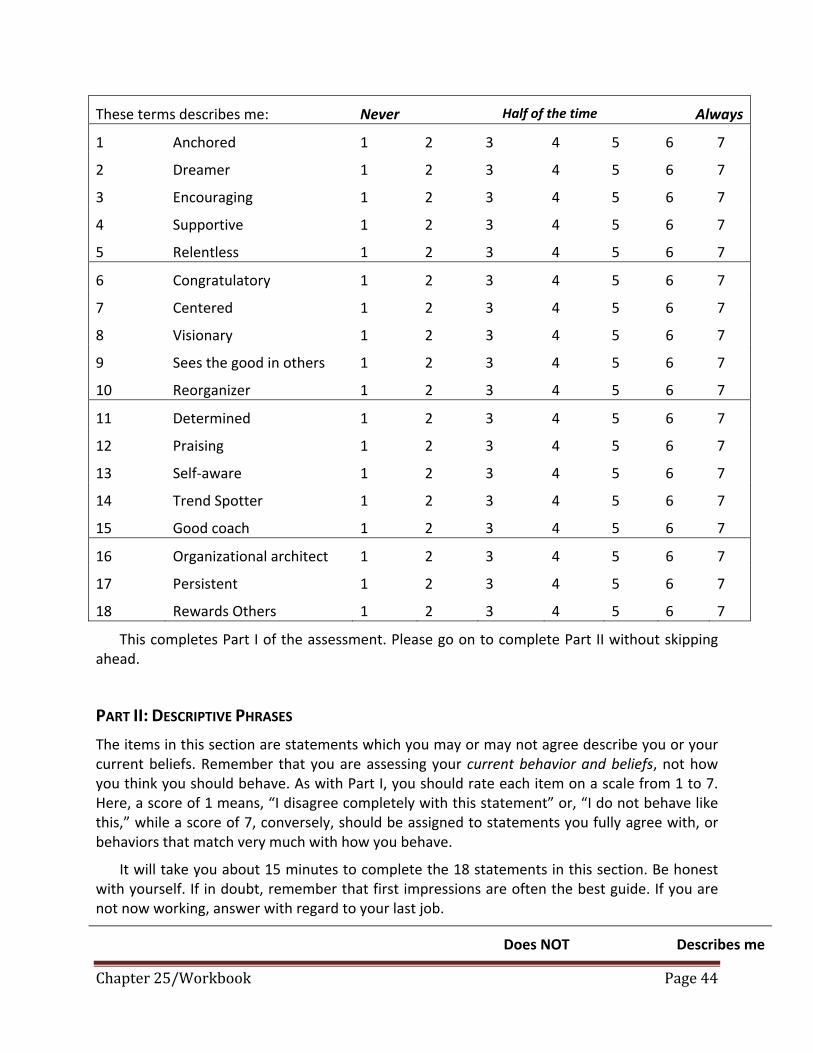
PART I: DESCRIPTORS/ADJECTIVES
For this part, please reflect on your activities at work and your relationships with your col‐leagues at work. This section consists of 18 items that are descriptors: adjectives that may or may not describe you. Rate yourself using the 7‐point scales:
1 = Does not describe me at all 5 = Describes me more than half the time
2 = Describes me rarely 6 = Describes me usually
3 = Describes me occasionally 7 = Describes me all of the time
4 = Describes me half of the time
5 This exercise, UVA‐OB‐0733, was prepared by James G. Clawson. Copyright © 2001 by the University of Virginia Darden School Foundation, Charlottesville, VA. All rights reserved. To or‐der copies, send an e‐mail to sales@darden publishing.com. No part of this publication may be reproduced, stored in a retrieval system, used in a spreadsheet, or transmitted in any form or by any means—electronic, mechanical, photocopying, recording, or otherwise—without the per‐mission of the Darden School Foundation.
L
Chapter 25/Workbook Page 44
These terms describes me: Never Half of the time Always
1 Anchored 1 2 3 4 5 6 7
2 Dreamer 1 2 3 4 5 6 7
3 Encouraging 1 2 3 4 5 6 7
4 Supportive 1 2 3 4 5 6 7
5 Relentless 1 2 3 4 5 6 7
6 Congratulatory 1 2 3 4 5 6 7
7 Centered 1 2 3 4 5 6 7
8 Visionary 1 2 3 4 5 6 7
9 Sees the good in others 1 2 3 4 5 6 7
10 Reorganizer 1 2 3 4 5 6 7
11 Determined 1 2 3 4 5 6 7
12 Praising 1 2 3 4 5 6 7
13 Self‐aware 1 2 3 4 5 6 7
14 Trend Spotter 1 2 3 4 5 6 7
15 Good coach 1 2 3 4 5 6 7
16 Organizational architect 1 2 3 4 5 6 7
17 Persistent 1 2 3 4 5 6 7
18 Rewards Others 1 2 3 4 5 6 7
This completes Part I of the assessment. Please go on to complete Part II without skipping ahead.
PART II: DESCRIPTIVE PHRASES
The items in this section are statements which you may or may not agree describe you or your current beliefs. Remember that you are assessing your current behavior and beliefs, not how you think you should behave. As with Part I, you should rate each item on a scale from 1 to 7. Here, a score of 1 means, “I disagree completely with this statement” or, “I do not behave like this,” while a score of 7, conversely, should be assigned to statements you fully agree with, or behaviors that match very much with how you behave.
It will take you about 15 minutes to complete the 18 statements in this section. Be honest with yourself. If in doubt, remember that first impressions are often the best guide. If you are not now working, answer with regard to your last job.
Does NOT Describes me

Chapter 25/Workbook Page 45
describe me or my beliefs.
or my beliefs VERY well.
19 I am clear on what I stand for. 1 2 3 4 5 6 7
20 I spend time envisioning what our company should become. 1 2 3 4 5 6 7
21 I look for the talents others have to offer. 1 2 3 4 5 6 7
22 I try to remove the barriers to getting good work done. 1 2 3 4 5 6 7
23 I am determined to achieve my goals. 1 2 3 4 5 6 7
24 I like to congratulate people on a job well done. 1 2 3 4 5 6 7
25 I could write down my core beliefs and values. 1 2 3 4 5 6 7
26 I enjoy imagining where we should be going. 1 2 3 4 5 6 7
27 I try to see what others have to contribute. 1 2 3 4 5 6 7
28 I often reorganize, trying to find a better way. 1 2 3 4 5 6 7
29 I am persistent in my pursuits. 1 2 3 4 5 6 7
30 Good leaders reward progress openly. 1 2 3 4 5 6 7
31 I am clear on what I will and will not do to succeed. 1 2 3 4 5 6 7
32 I have a clear picture of what the company should be. 1 2 3 4 5 6 7
33 I look for people’s strengths rather than their weak‐nesses. 1 2 3 4 5 6 7
34 Good leaders work hard to support their people and their efforts. 1 2 3 4 5 6 7
35 I never give up. 1 2 3 4 5 6 7
36 One should always praise progress, however small. 1 2 3 4 5 6 7
This concludes Part II. Please turn the page to learn about the theory underlying the instru‐ment and how to score your responses.
PART III: THE THEORY
There are many theories about the elements that make up leadership. The exercise you com‐pleted and the scoring you will do in a moment are based on a model of leadership designed not only to describe necessary components of leadership, but also to provide a framework for improving your own leadership ability. This framework identifies six key leadership principles:
1. Clarifying your center

Chapter 25/Workbook Page 46
2. Clarifying what’s possible
3. Clarifying what others can contribute
4. Supporting others so they can contribute
5. Being relentless
6. Measuring and celebrating progress
Let’s make sure the six concepts are clear; then we’ll lay out the scoring system. We use the term “clarifying” in the first three concepts because we believe that one may never really final‐ize one’s core values, vision for the future, or the ways in which others can help achieve that vision. Each of these leadership principles will continue to emerge and evolve as we progress through life. The “clarifying” measures here refer to ongoing processes of leadership.
1. Clarifying Your Center. We use the term center in the sense in which it is often used in Asian philosophy to refer to one’s center of gravity or one‐point, either physically (as in martial arts traditions) or spiritually (as in meditative practices). By “clarifying your center,” we mean becoming clearer about what you stand for, what you value, and your personal ethical and moral rules. Clarity of core values is a key leadership characteristic, because if one is not inter‐nally clear about priorities, what is good to do, what is ethically acceptable, and so on, the in‐fluence of others may sway one’s behavior away from achieving one’s goals or from ethical means of achieving them. A clear set of personal values helps one have confidence in one’s chosen course. The absence of a well‐defined center is likely to encourage one to respond to others rather than to lead them.
2. Clarifying What’s Possible. Leadership efforts will go nowhere if there is no target, no direction, or no vision of where one believes the organization (or one’s part of an organization) should be headed. As with one’s core values, seldom is a vision of the future fully formed at any one time. Rather, it emerges and evolves the more one thinks about how one wishes the future to be. Often, this visioning is intentional. Leaders work to clarify the futures they want to see created, first in their minds, and later in reality. This clarification is not so much trying to identi‐fy what will be as it is identifying what one wants to be.
3. Clarifying What Others Can Contribute. Leaders are not leaders without followers. People with a tendency to make immediate and negative judgments about others may miss what others have to contribute to their visions. The ability to see a wide range of possibilities in what others might add to your team is a key part of effective leadership. The challenge is to as‐sess others in terms of their potential capabilities, rather than with a hypercritical eye. The question is, “What can they do?” rather than, “What can they not do?” An initial critical and negative interpretation of others will tend to shut down possibilities and perhaps significant support for one’s goals and visions.
4. Supporting Others So They Can Contribute. By support here we mean reorganizing the surrounding work context in a way that removes barriers and frees up employee creativity, energy, and productivity. Effective leaders understand that even the best vision and the most motivated workforce will be hampered by poorly designed organizations. Consequently, they are working hard to make sure that organizational barriers to high performance are minimized
Chapter 25/Workbook Page 47
or eliminated. Structure and the various organizational systems, including recruiting and selec‐tion, reward, appraisal, and education need to be aligned and synchronized for the people in them to be working efficiently.
5. Being Relentless. Powerful leaders don’t give up. Persistent striving for your goals in the face of adversity requires a high level of self‐confidence and belief in the value of your goals. Without such strong commitment and an internal drive to achieve, one can become di‐verted from one’s goals. Clarifying one’s center is important here: if you know what you are aiming for and why, your commitment will likely be stronger and relentless pursuit of that ideal easier. A fine line divides relentlessness from stubbornness; they are not the same. Good lead‐ers are flexible, especially on means, but rigidly determined when it comes to outcomes. With‐out a strong internal drive, however, would‐be leaders falter before achieving their goals.
6. Measuring and Celebrating Progress. Most people need encouragement as they work. It’s hard to keep plugging away at a distant goal without ever getting some sign that you’re on the right track. Without some measure of progress, motivation dies. Strong leaders continuous‐ly identify and set appropriate intermediate goals on the path toward their vision or goal; they celebrate goals reached with the people who contributed to the achievement. The central fea‐ture of such celebration is the recognition of a job well done, as well as achievement and of the joy of doing, rather than receiving a tangible reward.
These six principles of effective leadership constitute values of leadership—principles that effective leaders hold to be true. The next section describes how to score your responses on items designed to measure these six principles.
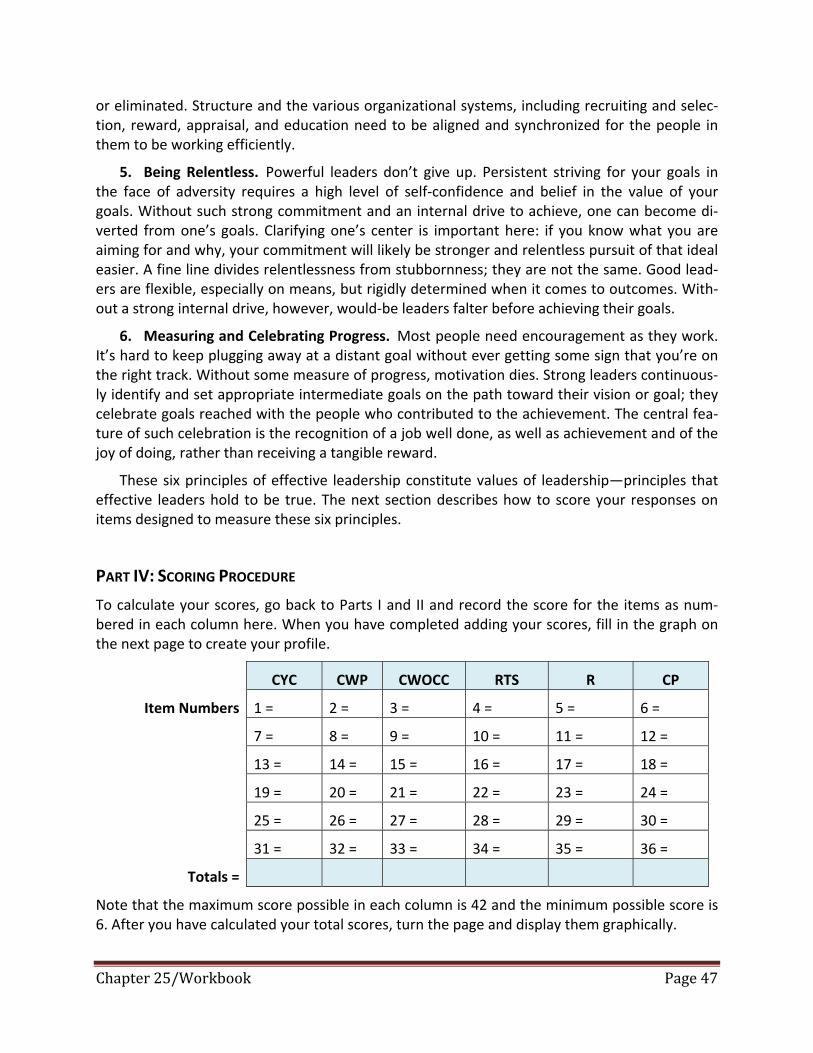
PART IV: SCORING PROCEDURE
To calculate your scores, go back to Parts I and II and record the score for the items as num‐bered in each column here. When you have completed adding your scores, fill in the graph on the next page to create your profile.
CYC CWP CWOCC RTS R CP
Item Numbers 1 = 2 = 3 = 4 = 5 = 6 =
7 = 8 = 9 = 10 = 11 = 12 =
13 = 14 = 15 = 16 = 17 = 18 =
19 = 20 = 21 = 22 = 23 = 24 =
25 = 26 = 27 = 28 = 29 = 30 =
31 = 32 = 33 = 34 = 35 = 36 =
Totals =
Note that the maximum score possible in each column is 42 and the minimum possible score is 6. After you have calculated your total scores, turn the page and display them graphically.

Chapter 25/Workbook Page 48
PART V: DISPLAYING YOUR SCORES
Chart your scores on the following diagram to develop a profile of your Leadership Steps As‐sessment scores.

Chapter 25/Workbook Page 49
PART VI: INTERPRETING YOUR SCORES
The six concepts used as the basis for this self‐assessment measure have been tested and discussed for many years in the classroom with practicing executives. We do not doubt their validity and usefulness as elements of leadership. This measure itself is a new tool, and we are in the process of establishing the norms for responses from people of different leadership abili‐ties and strengths. Although we do not have enough data to provide normalized distributions of scores, we do have preliminary comparative data from 59 people from three executive educa‐tion programs. These programs included middle and upper‐middle level managers. You can compare your scores with the maximums, minimums, averages, and standard deviations from these 59 executives from a variety of industries. See the data and chart in Exhibit 1. For each of the following concepts, consider your score, and if you feel you would like to work on that as‐pect of your leadership, read that section for some suggestions on how to do that.
Clarifying Your Center
People with strong core values have a calmness about them, tend to be less defensive, and are more likely to stand firm in a storm than those whose core values are more ambivalent or un‐certain. People with clear values are more likely to adhere to those values in situations where they are pressured to depart from them. In Stephen Covey’s terms, people who have clarified their core values have won the private victory before the public battle.6 If your score on clarify‐ing your center was lower than you would have liked, you might consider some exercises that would help you clarify your core leadership values and principles.
1. Begin by sitting down and writing out a list of the core beliefs you have developed thus far in your life. Putting them on paper makes it easier to see and examine them, and subse‐quently to modify and polish them.
2. Complete the Life’s Story Assignment exercise in which you are invited to write your life’s story in 400 words or less, chart your ups and downs, and then draw some conclusions about the lessons you learned from those experiences. These major turning points in life tend to reveal our core values or to shape them.
3. Ask those who know you well, perhaps family members or work associates, to make a list of the things that they believe you stand for. Their take will be a behavioral one in that they will infer your values from what you do and how you behave around them. This list may vary from your “espoused values” in exercise 1. Reviewing the gaps, if any, can be enligh‐tening as you consider what you think your core values are and what others observe them to be.
4. Take a week or a weekend and enroll in a seminar devoted to values clarification. These seminars are taught in many large cities periodically and can be helpful in guiding you to a deeper understanding of just what is important to you.
6 See Stephen Covey, The Seven Habits of Highly Effective People (New York: Simon and Schuster, 1989), Chapter 2.
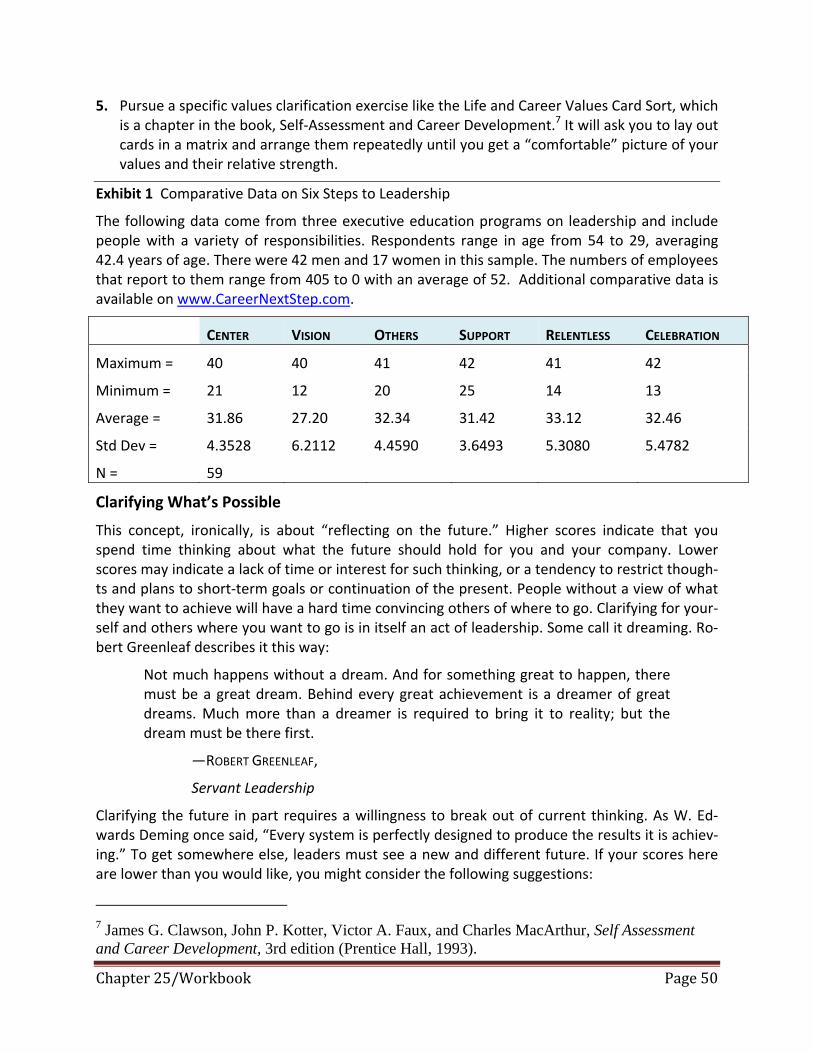
Chapter 25/Workbook Page 50
5. Pursue a specific values clarification exercise like the Life and Career Values Card Sort, which is a chapter in the book, Self‐Assessment and Career Development.7 It will ask you to lay out cards in a matrix and arrange them repeatedly until you get a “comfortable” picture of your values and their relative strength.
Exhibit 1 Comparative Data on Six Steps to Leadership
The following data come from three executive education programs on leadership and include people with a variety of responsibilities. Respondents range in age from 54 to 29, averaging 42.4 years of age. There were 42 men and 17 women in this sample. The numbers of employees that report to them range from 405 to 0 with an average of 52. Additional comparative data is available on www.CareerNextStep.com.
CENTER VISION OTHERS SUPPORT RELENTLESS CELEBRATION
Maximum = 40 40 41 42 41 42
Minimum = 21 12 20 25 14 13
Average = 31.86 27.20 32.34 31.42 33.12 32.46
Std Dev = 4.3528 6.2112 4.4590 3.6493 5.3080 5.4782
N = 59
Clarifying What’s Possible
This concept, ironically, is about “reflecting on the future.” Higher scores indicate that you spend time thinking about what the future should hold for you and your company. Lower scores may indicate a lack of time or interest for such thinking, or a tendency to restrict though‐ts and plans to short‐term goals or continuation of the present. People without a view of what they want to achieve will have a hard time convincing others of where to go. Clarifying for your‐self and others where you want to go is in itself an act of leadership. Some call it dreaming. Ro‐bert Greenleaf describes it this way:
Not much happens without a dream. And for something great to happen, there must be a great dream. Behind every great achievement is a dreamer of great dreams. Much more than a dreamer is required to bring it to reality; but the dream must be there first.
—ROBERT GREENLEAF,
Servant Leadership
Clarifying the future in part requires a willingness to break out of current thinking. As W. Ed‐wards Deming once said, “Every system is perfectly designed to produce the results it is achiev‐ing.” To get somewhere else, leaders must see a new and different future. If your scores here are lower than you would like, you might consider the following suggestions:
7 James G. Clawson, John P. Kotter, Victor A. Faux, and Charles MacArthur, Self Assessment and Career Development, 3rd edition (Prentice Hall, 1993).
Chapter 25/Workbook Page 51
1. Set aside time weekly, perhaps an hour, to focus just on thinking about what your company, your part of the company, or you will look like in five years.
2. Read a futuristic novel like The Gate to Women’s Country8 or A Canticle for Liebowitz9 or Dune10. Then reflect on what kinds of changes must have happened to have created those worlds and whether you see signs of them around you.
3. Learn about scenario planning and begin to practice its principles. It is much more than simply guessing about “best‐case, worst‐case” outcomes. The Art of the Long View11 by Pe‐ter Schwartz is a good place to start.
4. Think of your parents or grandparents. What changes have they seen in their lives? What changes might you expect during your lifetime? What changes would you like to see?
5. Subscribe to a new magazine, for example, Futurist that you feel will stimulate your thinking about societal trends that may or may not affect your industry. Commit to reading one or two articles in each issue.
6. Go visit some places you’ve never been before: a soup kitchen, a rehab center for children, a ballet, a country with a different culture, or a business you’ve never been to. Ask yourself why things are working the way they do and what the underlying assumptions must be to make them so.
7. Seek out people unlike yourself at social functions and ask them about their view of the world and what they see. This exercise is an easy thing to do—most people are quite happy to talk about their views. The challenge will be to listen to their new ideas without inter‐rupting or tuning out.
Clarifying What Others Have to Contribute
This principle has to do with looking for what people can do rather than what they cannot do. Higher scores tend to indicate that you are willing to listen to a wide range of people, see their ideas for what they are worth, and look for abilities in people (“seeing the glass half‐full rather than half‐empty”) rather than their faults.
Many of us are trained professionally to find fault. Perhaps we learned it at an early age from our parents for whom our work was never quite good enough. Perhaps we learned it from our education where we learned systematic ways of striving for perfection or “six sigma quali‐ty” programs. Whatever the source, if we learned a habit of seeing what’s not there as opposed to what is there, our attempts to lead may be thwarted. Followers who feel constantly “not good enough” find it difficult to be enthusiastic and motivated. If you would prefer higher scores on this dimension, you might consider the following:
1. For the next five conversations, consciously focus in your mind on the positive qualities of 8 Sherri Tepper, The Gate to Women's Country (Spectra, Reissue Edition: February 1, 1993). 9 Frank Herbert, Dune (ACE Charter, 25th Anniversary Edition: February 1, 1996). 10 Walter M. Miller, Jr., A Canticle for Leibowitz (Spectra, Reprint Edition: September 2, 1997). 11 Peter Schwartz, The Art of the Long View (Currency: April 15, 1996).

Chapter 25/Workbook Page 52
the person you’re talking with. Find occasion in the conversation to compliment them even if the conversation doesn’t seem to call for it. For example, if at the end of a conversation you haven’t found an opportunity to compliment someone, try something like this: “You know, Elliott, I just wanted you to know that I really admire your ability to manage so many things. You do a great job at being organized.”
2. You might also, at the end of a day, consider the subordinates who work for you and make a written list of their strong points. A simple list will do, but it’s important to write it down. A translation occurs between thought and written expression that is important to cross.
3. In five conversations this week, discuss with your subordinates their potential skills. You might begin by asking what goals they have for developing skills in the coming year, and then you might suggest one or two that you think they could achieve—that would make them much more valuable to the organization. Identify ways in which you would like to see your subordinates grow, describing the specific skills that you’d like them to develop. Then, in a private conversation, mention to them your desires and beliefs that they could, in fact, develop those skills. Offer to help them if you can.
4. The next time you face a difficult task, identify those who could help you accomplish it and ask them if they feel up to it. Give them a significant responsibility and comment on how you are confident that they can accomplish the task. Most people will work hard to rise to this kind of occasion.
5. Think of the people at work of whom you may have a modest opinion. Stop for a moment and think of their strong points. Why did they get the job they have? What skills do they bring to their jobs? Can you identify what they can do as opposed to what they cannot do?
Our guess is that you may find some of these suggestions, at first blush, “silly” or “hard to do.” That’s the point. If they came naturally to you, you would have scored higher on “clarifying what others have to contribute.” Try these simple suggestions for a week and see if they don’t make a difference in what you “see” in your colleagues.
True followership is a voluntary process; unless your followers are responding voluntarily, you are not really leading them. The challenge here is to see what others have to offer toward your goals. Some people in leadership roles are fundamentally negative, searching for things to criticize and ways to find fault with others. This tendency to overlook underlying strengths and skills can be de‐motivating for the people involved. Powerful leaders look and listen for possibil‐ities in the people they work with, asking themselves what these people can do rather than what they cannot do.
Supporting Others So They Can Contribute
Sometimes organizational structures or systems can inhibit the efforts people make to ac‐complish the organization’s goals. Jack Welch’s well‐known Work‐Out effort in the late 1980s and early 1990s was an attempt to remove the bureaucratic red tape that many said was slow‐ing down decision‐making and development cycles. Effective leaders look for ways to remove these organizational barriers by redesigning the systems that create them. Perhaps the reward

Chapter 25/Workbook Page 53
system encourages behavior A while management hopes that behavior B will occur.12 Or the information system produces a volume and range of reports that few can interpret and use. Or the decision‐making structure stifles innovativeness and creativity. The list is potentially limit‐less. When leaders are oblivious to the ways in which their organizations constrain their work‐force, they are thus tolerating the resulting cynicism and frustration in their workforce.
If you would like to improve your scores on this dimension, you might consider the follow‐ing suggestions.
1. Survey your direct reports and have them survey theirs and find out what organizational systems they believe get in the way of getting key tasks done. Then, ask them to come up with better designs, sooner rather than later.
2. Walk around your organization and ask, “What process, policy, or procedure recently has gotten in the way of you doing your best work? How might we change it?”
3. In your performance reviews, include a series of questions that focus on the efficiency of your organizational processes, procedures, and systems. Expect that each subordinate will pay attention and be making suggestions—specific suggestions—for how to mend them. This activity is consistent with one of the four corners of the balanced scorecard.13 If you pay attention to this aspect of your organization, so will your subordinates and you’ll find yourself repeatedly acknowledging organizational adjustments here and there that you had no idea were getting in the way.
Being Relentless
Relentlessness is a hallmark of effective leadership. Powerful leaders don’t easily give up. If you find that your score on this dimension was lower than you would have liked, you might try the following:
1. On your current to‐do list, mark the items that are overdue. Ask yourself why, and write down the reasons. If you’ve overcommitted, consider the old saw, “Less is more.” Even though it’s true that people who do more often get more assignments, there is a point at which one’s ability to produce declines. Pay attention to this point.
2. Review your New Year’s resolutions and how often you’ve made them and not followed through. Spend some time thinking seriously about why that is. What do you need to do to follow through on a goal?
3. Identify a small thing you’d like to try doing differently (perhaps from the preceding lists of suggestions) and commit to yourself to try it for three days. If three days is too long, try one or two. Then pick another—just to see if you can commit to something for more than a short period of time. Broken promises to ourselves on any dimension undermine our self‐confidence and capacity for following through.
12 See Steve A. Kerr, “On the Folly of Hoping for A While Rewarding B,” Academy of Management Journal (August 15, 1988): 298. 13 See R. S. Kaplan and D. P. Norton, “Balanced Scorecard: Measures That Drive Performance,” Harvard Business Review (January 1992), reprint #92105.

Chapter 25/Workbook Page 54
4. Identify the longest project or endeavor you have stayed with in your life. Reflect on why you stayed with it rather than others. What about it captured your intensity and determina‐tion? How might you carry those characteristics to other endeavors?
Measuring and Celebrating Progress
Followers need to know that they are doing well. A few can make that assessment them‐selves, but most people thrive on positive feedback, whether it is from others or from the re‐sults of their work. Few of us have the stamina to persist in lengthy pursuits without some en‐couragement from positive feedback—whether it is social or natural. If you’d like to strengthen your skills in this area, consider the following:
1. List the celebrations you have at home or at work. What do you celebrate? How often do you celebrate? How long do you typically wait between celebrations?
2. How often do you praise the people around you? When was the last time you praised someone, a family member or a coworker?
3. When someone you know achieves something, how long do you spend congratulating them? Do you tend to skim over their accomplishments and point to the next hurdle, or as‐sume that their progress was “normal” or “expected”?
4. How do you celebrate when you accomplish something you’re working on? How long does your celebration last? How do you make the transition from accomplishment to commit‐ment to the next objective?
CONCLUSION
We hope that this exercise has been of value to you by adding to your insights about lea‐dership and your own leadership skills. Perhaps it has helped you identify an area or two in which you wish to work to improve your leadership abilities.

Chapter 25/Workbook Page 55
LSA DATA COLLECTION
Please take a moment to fill out the data page that follows and send it to Jim Clawson, Box 6550, Charlottesville, VA, 22906 and we’ll add your data to the database. This anonymous data collection is invaluable as we set population norms for the concepts measured here. Alternate‐ly, you can go to the Web site http://faculty.darden.edu/clawsonj and click on the LSA SURVEY button to input your data there. Thank you!
Date and Group (course or program)
Age
Gender Female Male
College major
Job title
Job functional area (student, finance, market‐ing, operations, IT, etc.)
Number of people who report to you in your responsibility cone (all the way down)
Scores:
Clarifying Your Center
Clarifying What’s Possible
Clarifying What Others Can Contribute
Supporting Others So They Can Contribute
Being Relentless
Measuring and Celebrating Progress
Thank you for your willingness to add your data.

Chapter 25/Workbook Page 56
Life’s Story Assignment14 This instrument is also available online at www.CareerNextStep.com.
eople who are willing to share their life’s story with others often find that this simple approach has powerful results. These short, biographical sketches help associates and subordinates understand the leader’s background, and “where they are coming
from.” These sketches also tend to be easy to remember and strong communicators of the sto‐ryteller’s basic beliefs. In this sense, telling your life’s story can be a powerful Level Three lea‐dership tool. This assignment is designed to help you clarify your Level Three leadership story and has three parts.
1. Write your life’s story in 400 words or less. This word limit will require you to condense, fo‐cusing on the highlights and major events. You can use the blank sheet provided if you wish.
2. In the table on page (here +2), list the key events you mentioned in the 400‐word story in the left column, one event per row. Then note the extent to which each event was an emo‐tional “up” or “down” or whether it was neutral. Then try to summarize the key learning from that event in the third column. How did this experience shape your life? What did it teach you? What did you learn from each experience about leadership? How did this event contribute to your current model of leadership?
3. Using the blank chart that follows, chart the key events in your life in terms of their emo‐tional height, chronologically from left to right. Then, label the peaks and valleys with the events they represent.
Your primary use for being clear about your life’s major events and their impact on your leadership beliefs will be at various times and places in the future when, as a leader, you need to connect with your people and let them know why you believe what you do and where your motivations come from.
14 This exercise, UVA‐OB‐0692, was prepared by James G. Clawson. Copyright © 1999 by the University of Virginia Darden School Foundation, Charlottesville, VA. All rights reserved. To order copies, send an e‐mail to sales@darden publishing.com. No part of this publication may be reproduced, stored in a retrieval system, used in a spreadsheet, or transmitted in any form or by any means—electronic, mechanical, photocopying, recording, or otherwise—without the permission of the Darden School Foundation.
P

Chapter 25/Workbook Page 57
MY LIFE’S STORY IN 400 WORDS OR LESS

Chapter 25/Workbook Page 58
MY LIFE’S STORY KEY EVENTS TABLE
Key Event Emotional Impact
(+5 to 0 to ‐5)
Key Learning or Insight
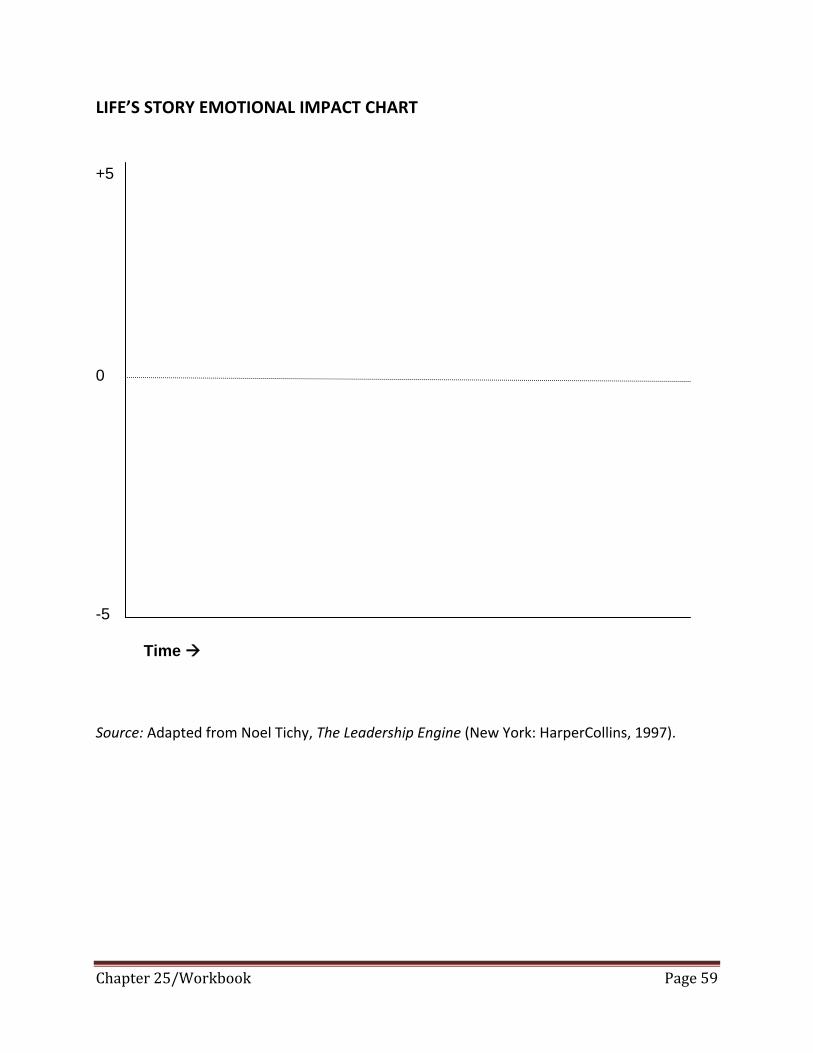
Chapter 25/Workbook Page 59
LIFE’S STORY EMOTIONAL IMPACT CHART
+5 0 -5
Time
Source: Adapted from Noel Tichy, The Leadership Engine (New York: HarperCollins, 1997).

Chapter 25/Workbook Page 60
ASSESSING THE MORAL FOUNDATION OF YOUR LEADERSHIP15
fter you have discussed the moral foundation of leadership, use this form to be‐gin your leadership team assessment. First, make copies of the form and give one to each member of your team and have them assess your team. Second, answer
each question according to your view of your current management team and its interactions. Third, collect each team member’s answers (anonymously if you wish) and summarize the data. Fourth, hold a team meeting in which you discuss the results (average scores, variation, differ‐ence from expectations or hopes) and make joint plans for how to improve your scores. To an‐swer, circle the number that represents the percent of the time that each principle describes your leadership team.
Cornerstone Principle Percent of the Time That
This Principle Describes Our Team 1. Truth Telling: We tell the truth to each oth‐er and don’t hide things or talk behind others’ backs. We know where each person stands.
10 20 30 40 50 60 70 80 90 100
2. Promise Keeping: We keep our promises to each other no matter how large or small.
10 20 30 40 50 60 70 80 90 100
3. Fairness: We treat each other fairly and do not try to take advantage of each other.
10 20 30 40 50 60 70 80 90 100
4. Respect for the Individual: We show re‐spect for each other and other members of our organization in our speech, action, and courtesy.
10 20 30 40 50 60 70 80 90 100
15 This instrument, UVA‐OB‐0734, note was prepared by James G. Clawson. Copyright © 2001 by the University of Virginia Darden School Foundation, Charlottesville, VA. All rights reserved. To order copies, send an e‐mail to [email protected]. No part of this publication may be reproduced, stored in a retrieval system, used in a spreadsheet, or transmitted in any form or by any means—electronic, mechanical, photocopying, recording, or oth‐erwise—without the permission of the Darden School Foundation. Revised 08‐04.
A

Chapter 25/Workbook Page 61
Team Scoring Team Average My Assessment Difference
Truth Telling
Promise Keeping
Fairness
Respect for the Individual
Note again that each of these principles is really only a different window onto the same central concept. In other words, if you tell the truth, you have to keep your promises. If you are fair,
you’ll have respect for the individual. TEAM SELF ASSESSMENT16
The following 17 items invite your assessment of your work team in terms of dimensions shown in the current literature to describe highly effective teams. Please rate your current team on each item as to how well the item describes what you do (where 1 = NOT TRUE about your team, 4 = TRUE HALF THE TIME, and 7 = ALWAYS TRUE about your team) and then follow your instructor’s instructions for developing aggregate indicators.
ITEM Not Half Always
True True True
1. We share leadership roles rather than relying on one strong, clearly focused leader.
1 2 3 4 5 6 7
2.
We hold the team as well as individuals accountable ra‐ther than just looking at individuals for accountability.
1 2 3 4 5 6 7
3. We have developed a team purpose that we deliver ra‐ther than just assuming the team’s purpose is the same as the organization’s.
1 2 3 4 5 6 7
4. We have real collective products rather than a collection of individual products (strung together at the end).
1 2 3 4 5 6 7
5. We encourage open‐ended discussion and active prob‐lem‐solving in meetings rather than trying to run efficient
1 2 3 4 5 6 7
16 This exercise, UVA‐OB‐694, was prepared by James G. Clawson. Copyright © 2000, by the University of Virginia Darden School Foundation, Charlottesville, VA. All rights reserved. To or‐der copies, send an e‐mail to [email protected]. No part of this publication may be reproduced, stored in a retrieval system, used in a spreadsheet, or transmitted in any form or by any means—electronic, mechanical, photocopying, recording, or otherwise—without the per‐mission of the Darden School Foundation.

Chapter 25/Workbook Page 62
meetings.
6.
We measure our performance directly by assessing our collective work‐products rather than measuring perfor‐mance indirectly (e.g. financial performance of the busi‐ness as a whole).
1 2 3 4 5 6 7
7. We discuss, decide, and DO real work together rather than discussing, deciding, and delegating real work to others to do.
1 2 3 4 5 6 7
8.
We try to establish links with key resource organizations well BEFORE we need them rather than waiting for an emergency to make contact.
1 2 3 4 5 6 7
9.
We only do real teamwork in teams rather than trying to get lots of people involved on basically individual tasks.
1 2 3 4 5 6 7
10.
We don’t refer to ourselves as a team when in fact we manage members as individuals (rewards, etc.)
1 2 3 4 5 6 7
11.
Our “leaders” only specify the desired end states and leave the means to the team members rather than trying to specify both means and ends.
1 2 3 4 5 6 7
12. We have a good mix of talent on our team. We have the right mix of people involved.
1 2 3 4 5 6 7
13.
We insure that our team has a discrete, identifiable job to do rather than dividing the work into such tiny pieces that members cannot see the “whole” that they are con‐tributing to.
1 2 3 4 5 6 7
14. The things we “have to do” and “cannot do” are clear and unambiguous to all team members.
1 2 3 4 5 6 7
15.
We insure that the team has the appropriate organiza‐tional support it needs to get its job done rather than demanding big, hairy goals, but skimping on organiza‐tional support.
1 2 3 4 5 6 7
16. We assume that all team members need to be learning and growing rather than assuming that we have all the talent and learning we need.
1 2 3 4 5 6 7
17.
We have devised internally real time, analog measures of our performance which we monitor and watch conti‐nuously rather than relying on measures others have de‐veloped that only show historical performance after the fact.
1 2 3 4 5 6 7

Chapter 25/Workbook Page 63
References: “Why Teams Don’t Work,” Richard J. Hackman, Leader to Leader, Winter 1998, p24 ff, Peter
Drucker Institute, Claremont College, adapted from author’s chapter in Applications of Theory and Research on Groups to Social Issues, edited by R.S. Tinadale, J. Edwards, and E.J. Posavac. Plenum Publishers.
“The Discipline of Teams,” by Jon R. Katzenbach and Douglas K. Smith, Harvard Business Re‐
view, reprint 93207 and the book by the same title. “How Bell Labs Creates Star Performers,” Robert Kelley and Janet Caplan, Harvard Business Re‐
view, (HBR 93405, July‐August 1993.) “How the Right Measures Help Teams Excel,” Christopher Meyer, Harvard Business Review
(HBR 94305)
Chapter 25/Workbook Page 64
OH: One View of the World17
his self‐assessment instrument is designed to give you some personal feedback on an important dimension of human behavior in organizations. After you’ve generated your data, we’ll explain that dimension, but for the moment and for the purpose of
minimizing your biases, we ask you to just answer the survey questions (generate your data) and then learn something about the theory of the instrument.
This assessment contains 60 questions. For each question you will be asked to indicate one of five answers: strongly disagree, disagree, not sure, agree, and strongly agree. We’ll guide you through the scoring and interpretation of your responses afterward.
Plan to devote about an hour to this exercise. When you’re ready to begin, you may turn the page and start.
17 This note, UVA‐OB‐0794, was prepared by James G. Clawson and Gerry Yemen. Copyright © 2003 by the Univer‐sity of Virginia Darden School Foundation, Charlottesville, VA. All rights reserved. To order copies, send an e‐mail to [email protected]. No part of this publication may be reproduced, stored in a retrieval system, used in a spreadsheet, or transmitted in any form or by any means—electronic, mechanical, photocopying, recording, or oth‐erwise—without the permission of the Darden School Foundation. Revised 08‐04.
T

Chapter 25/Workbook Page 65
DATA GENERATION
Please answer the following questions as indicated by placing a mark whether you:
Strongly
Disagree (SD) Disagree (D) Not Sure (NS) Agree (A)
Strongly
Agree (SA)
Note that there are no right or wrong answers.
SD D NS A SA
1. Making changes is a good thing. SD D NS A SA
2. Information is power and should be protected. SD D NS A SA
3. People perform better when allowed to work indepen‐dently.
SD D NS A SA
4. It is important to communicate through formal channels. SD D NS A SA
5. Group equality should be our ideal. SD D NS A SA
6. It is important to climb the ladder. SD D NS A SA
7. Many employees would misuse information about our organization, so we need to protect it.
SD D NS A SA
8. Traditional management structures continue to serve us well.
SD D NS A SA
9. There’s always a better way. SD D NS A SA
10. No one group should dominate. SD D NS A SA
11. When I meet new people, I ask them what they do for a living.
SD D NS A SA
12. I wait to see if my bosses accept changes before I accept them.
SD D NS A SA
13. If it’s not broken, don’t fix it. SD D NS A SA
14. Employees should obey the boss regardless of their per‐sonal feelings toward the person.
SD D NS A SA
15. Inferior groups should stay in their place. SD D NS A SA
16. Each person in an organization is accountable to the next higher person in the organization.
SD D NS A SA
17. An employee should try to do the right thing regardless of what the boss says.
SD D NS A SA
18. I pay close attention to status. SD D NS A SA
19. I am open to new opportunities and frameworks. SD D NS A SA

Chapter 25/Workbook Page 66
20. To get ahead in life, we sometimes have to step on oth‐ers.
SD D NS A SA
21. Employees can justify their actions if they were doing what the boss instructed.
SD D NS A SA
22. I try not to rock the boat. SD D NS A SA
23. All employees should have access to all company infor‐mation.
SD D NS A SA
24. The boss is always accountable for the organization’s re‐sults.
SD D NS A SA
25. The information flow within an organization should be carefully managed.
SD D NS A SA
26. It’s probably a good thing certain groups are at the top and other groups are at the bottom.
SD D NS A SA
27. People naturally form vertical hierarchies. SD D NS A SA
28. Executives and managers should control the information in a company.
SD D NS A SA
29. People low in an organization may often have great ideas.
SD D NS A SA
30. Employees with more access to company information make better decisions.
SD D NS A SA
31. I am willing to go outside usual procedures to finish a task.
SD D NS A SA
32. It is important to know the rank of the person you’re talking with.
SD D NS A SA
33. We should do what we can to equalize conditions for dif‐ferent groups.
SD D NS A SA
34. You should do what your boss asks regardless of what it is.
SD D NS A SA
35. Employees should not decide what to do—only how to do it.
SD D NS A SA
36. When it comes to organizational information, employees should be on a “need‐to‐know” basis only.
SD D NS A SA
37. In a new situation or group, I try to find out where I fit into the pecking order.
SD D NS A SA
38. If certain groups stayed in their place, we would have fewer problems.
SD D NS A SA
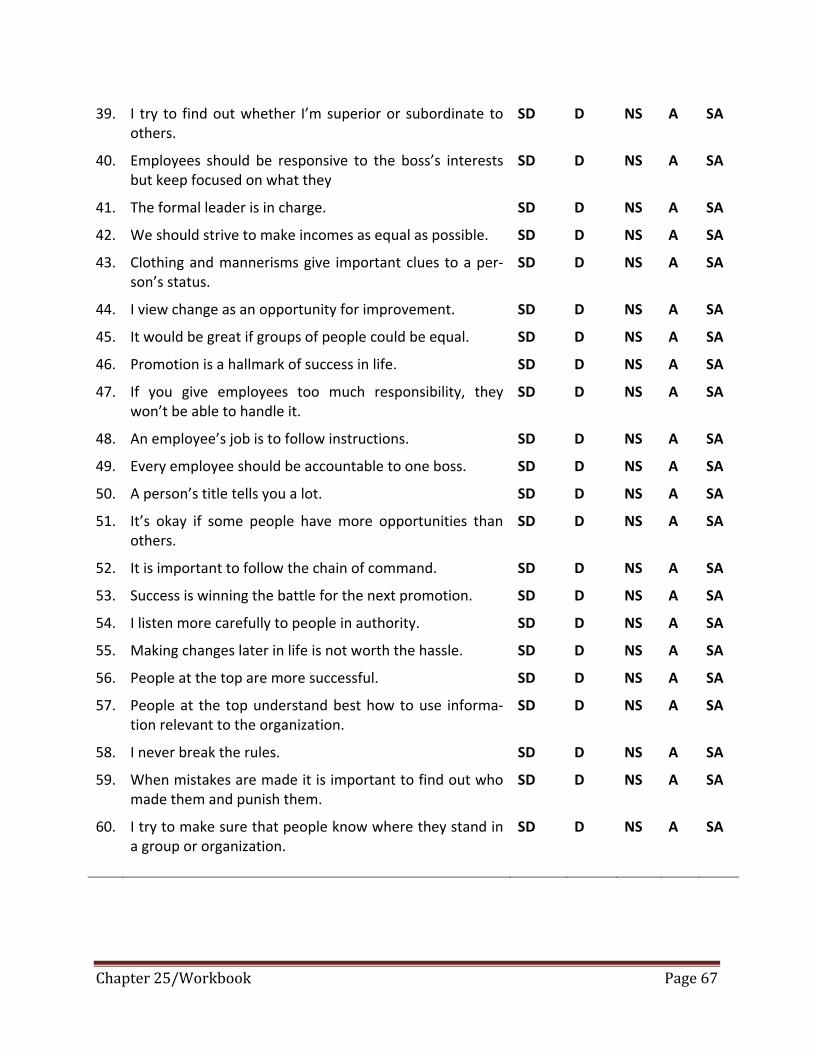
Chapter 25/Workbook Page 67
39. I try to find out whether I’m superior or subordinate to others.
SD D NS A SA
40. Employees should be responsive to the boss’s interests but keep focused on what they
SD D NS A SA
41. The formal leader is in charge. SD D NS A SA
42. We should strive to make incomes as equal as possible. SD D NS A SA
43. Clothing and mannerisms give important clues to a per‐son’s status.
SD D NS A SA
44. I view change as an opportunity for improvement. SD D NS A SA
45. It would be great if groups of people could be equal. SD D NS A SA
46. Promotion is a hallmark of success in life. SD D NS A SA
47. If you give employees too much responsibility, they won’t be able to handle it.
SD D NS A SA
48. An employee’s job is to follow instructions. SD D NS A SA
49. Every employee should be accountable to one boss. SD D NS A SA
50. A person’s title tells you a lot. SD D NS A SA
51. It’s okay if some people have more opportunities than others.
SD D NS A SA
52. It is important to follow the chain of command. SD D NS A SA
53. Success is winning the battle for the next promotion. SD D NS A SA
54. I listen more carefully to people in authority. SD D NS A SA
55. Making changes later in life is not worth the hassle. SD D NS A SA
56. People at the top are more successful. SD D NS A SA
57. People at the top understand best how to use informa‐tion relevant to the organization.
SD D NS A SA
58. I never break the rules. SD D NS A SA
59. When mistakes are made it is important to find out who made them and punish them.
SD D NS A SA
60. I try to make sure that people know where they stand in a group or organization.
SD D NS A SA

Chapter 25/Workbook Page 68
THEORY
This instrument was designed to measure something we call Orientation to Hierarchy (OH). We believe that people vary in their OH; some people are more likely to look for and create hie‐rarchies in their social settings than other people. The goal of this instrument is to detect and measure those differences. Why would we want to do that?
First, in human history we have never found an unstratified human group. There has always been a leader, a shaman, a guru, or head person, and emanating from these leaders, varying levels of status, some formal and some informal. Like chickens, dolphins, apes, and dogs, hu‐mans tend to create hierarchies in their groups. Sometimes these hierarchical structures are practical (e.g., based on strength, political prowess, a set of skills like science, etc.); other times they might even be dysfunctional or irrelevant (e.g., racism, sexism, etc.).
Second, if you accept the premise that all human groups tend to stratify, then you may wonder along what dimensions. We could talk about “functional hierarchies,” along lines of merit and performance in groups, and we could talk about “dysfunctional hierarchies,” where the dimensions of status may have to do more with whom you know and other nonperfor‐mance‐related links. Either way, we end up in hierarchies. Some people seem determined to see, create, and perpetuate hierarchies—they believe in them. Others seem to prefer flatter, more egalitarian structures.
Third, with the advent of the Information Age and the growing access to global information, organizations that have long relied on stratified structures are now evolving toward more team‐ and information‐based models that place less emphasis on hierarchy.18 In the new Information Age, traditional hierarchies may no longer be as useful as they were in the past. These new “in‐focracies” tend to be flatter and have less formal structure than is found in many traditional bureaucracies. It seems logical that people with a strong OH (i.e., people who look for the sta‐tus differentials in most of their interactions and who habitually and systematically create sta‐tus hierarchies, whether there is a natural one or not) may not flourish as well in these new or‐ganizations as people with a low OH. Further, people with a high OH may be more resistant to change in organizations than those with a low OH.
THE CONSTRUCT OF ORIENTATION TO HIERARCHY
The literature includes studies of concepts related to OH, including status sensitivity, the desire to move upward through the perceived hierarchy, preoccupation with control and discip‐line, aversion to accountability, resistance to change, and the value placed on hierarchically structured relationships among social groups.19 The presence and strength of these characteris‐tics probably varies across members of the general population. Taken together, they may com‐
18 James G. Clawson, “Leadership Implications of the New Information Age,” Ivey Business Journal (June 2000). 19 James G. Clawson and Greg Bevan, “Orientation to Hierarchy,” working paper, Darden School; Jim Sidanius and Felicia Pratto, Social Dominance: An Intergroup Theory of Social Hie-rarchy and Oppression (Cambridge: University Press, 1999), p. 61.

Chapter 25/Workbook Page 69
prise a collective continuum we can think of as Orientation to Hierarchy. A strong OH would in‐dicate a strong presence of these characteristics; a weak OH, a relative absence of them.
Several social scientists have explored these six dimensions. Edward Laumann and Richard Senter explored status sensitivity and the desire to move upward through social hierarchies.20 Mark Mulder offered further evidence for the latter dimension.21 Frederic Berman and John Miner arrived at the same conclusion as Laumann—that, within the context of organizational hierarchies, a desire existed to associate with people in high‐status occupations, regardless of one’s own position in the social strata.22 Jim Sidanius and Felicia Pratto developed a tool to measure an individual’s level of support for a system of group‐based social hierarchies.23 Scott Shane and S. Venkataraman’s findings suggested that orientation to change, control, and discip‐line varies even within the confines of a highly stratified environment.24 Joseph DeMent de‐scribed efforts to assess different individual orientations to control, and William Stevenson demonstrated varying reactions toward efforts to bring about accountability within an organi‐zation.25
Evidence also exists that suggests that one’s OH can influence managerial effectiveness. DeMent’s study of Unisys indicated that the ability to overcome a preoccupation with control was crucial for managers operating in the new team‐oriented paradigm. Even in a highly strati‐fied setting, Shane and Venkataraman argued, the key to successful innovation may be a less‐than‐reverent attitude toward regulations and the status quo. Samuel Culbert and Jon Ullmen make a distinction between structural and relationship hierarchies. They acknowledge a hie‐rarchy’s beneficial role as a structure to achieve organizational focus. At the same time, they convincingly argue that hierarchical relationships create dominant/subordinate interactions that result in “warped communication, corrupt internal politics, illusionary teamwork, personal dispiriting, and pass‐the‐buck accountability.”26 Berman and Miner’s study of two groups of top executives—those who worked their way up a bureaucratic hierarchy and those who did not—
20 E. O. Laumann and Richard Senter, “Subjective Social Distance, Occupational Stratification, and Forms of Status and Class Consciousness: A Cross‐National Replication and Extension,” American Journal of Sociology 81 (1976), pp. 1304–1338. 21 Mark Mulder, “Power Equalization through Participation?” Administrative Science Quarterly 16 (1971), pp. 31–38. 22 F. E. Berman and J. B. Miner, “Motivation to Manage at the Top Executive Level: A Test of Hierarchic Role Moti‐vation Theory,” Personnel Psychology 38 (1985), pp. 377–391. 23 Jim Sidanius and Felica Pratto, Social Dominance: An Intergroup Theory of Social Hierarchy and Oppression (Cambridge: University Press, 1999), p. 68. 24 S. Shane and S. Venkataraman, “Renegade and Rational Championing Strategies,” Organization Studies 17 (1996), pp. 751–771. 25 J. DeMent, “Managers, Leaders, and Teams in a Team‐Based Environment,” Hospital Material Management Quarterly 18 (1996), pp. 1–9. 26 Samuel A. Culbert and John B. Ullmen, Don’t Kill the Bosses (San Francisco: Berrett‐Koehler, 2001), p. 14.

Chapter 25/Workbook Page 70
pursues a line of inquiry that gauged the “managerial motivation at the top executive level.”27
If one accepts these two premises—that there is something we could call orientation to hie‐rarchy and that it can influence managerial effectiveness, especially in relation to change initia‐tives—then the first issue is whether it can be measured. That is the focus of this instrument. If it can be measured, one wonders what influence OH might have on efforts to introduce change in bureaucracies and then whether OH could be trained one way or another. With a measuring instrument, one can begin to answer these latter questions.
For example, OH may prove to be tractable in some individuals but not in others—or it may prove to be an emergent phenomenon for a situation. A number of researchers explored the relationship between a manager’s leadership style and larger situational factors. F. E. Fiedler,28 R. Tannenbaum and W. Schmidt,29 P. Hersey and K. Blanchard,30 and C. Argyris31 all share a con‐cern for leader‐situation “fit” and address the question of whether the adjustments necessary for proper fit can be made on the part of the individual. These studies were conducted before the advent of the large‐scale paradigm shift in the Information Age, so they may have seen “fit” in a more bureaucratic context.
Further, on a larger scale, Geert Hofstede created a cross‐cultural inquiry into a concept he called “power distance,” which is the disparity in power between different members of a hie‐rarchy as perceived by the less powerful of the two.32 His conclusions focused on the differenc‐es in the extent of stratification across national cultures. Power distance is perhaps the closest concept to OH that we’ve discovered in the literature, but we’re interested here in individual measures rather than societal measures. Further, Hofstede’s questionnaire included only a few items related to power distance and certainly did not break it down into the six dimensions we’ve identified here.
The “social dominance orientation” that Sidanius and Pratto introduced is built upon several theories of social attitudes and intergroup relations. Their concept examines the degree to which individuals support group‐based hierarchies—in particular the groups they identify with. This idea is important to OH because attitudes, values, and beliefs associated with social prac‐tices play out in institutional settings—especially in corporate cultures. If certain ideologies drive one’s desire for group‐based social dominance, policies may be adopted institutionally
27 F. E. Berman and J. B. Miner, “Motivation to Manage at the Top Executive Level: A Test of Hierarchic Role‐Motivation Theory,” Personnel Psychology 38 (1985), pp. 377–391. 28 F. E. Fiedler, “A Contingency Model of Leadership Effectiveness,” L. Berkowitz (ed.), Advances in Experimental Social Psychology 1 (1964). 29 R. Tannenbaum and W. H. Schmidt, “How to Choose a Leadership Pattern,” Harvard Business Review 36 (1958), pp. 95–101. 30 P. Hersey and K. H. Blanchard, “Lifecycle Theory of Leadership,” Training and Development Journal (1969), pp. 26–34. 31 C. Argyris, “Theories of Action That Inhibit Individual Learning,” American Psychologist 31 (August 1976), pp. 638–654. 32 G. Hofstede, Culture’s Consequences: International Differences in Work‐Related Values (Beverly Hills, CA: Sage, 1984), p. 92.
Chapter 25/Workbook Page 71
and reflected in an organization. The social dominance tool predicts who within a society will use ideologies to enhance versus attenuate hierarchy.33
So, the term orientation to hierarchy is a new one introduced here, and the literature on re‐lated topics suggests that the six logical and reasonable dimensions that might contribute to one’s orientation to hierarchy include the following:
1. Attitude toward information
2. Attitude toward accountability
3. Tendency to stratify social interactions
4. Focus on personal and positional power
5. Resistance to change
6. Social dominance orientation
Now, we will explain and explore these dimensions.
Attitude Toward Information
In traditional, hierarchical organizations, position or status was often denoted by one’s access to information. Those in positions of power had access to more information and the sub‐sequent ability to make decisions. It seems logical then, that a person with a high OH would be‐lieve that access to information should be restricted. Conversely, those with a low OH are likely to believe that information should be more widely available. In modern infocracies, information is becoming more widely available—a fact that would distress people with high OH.
Attitude Toward Accountability
In formal hierarchies, the relative positions of superior and subordinate and their re‐sponsibilities are clearly delineated. In the bureaucratic world, the higher one goes in the hie‐rarchy, the more responsibility he or she has. In flatter organizations, responsibilities are not so clearly defined. Consequently, the desire to have clear accountability and, in particular, to know exactly whom to blame if something goes wrong seems related to a high OH. Thus a person with a high OH is likely to prefer clear responsibilities as associated with a bureaucracy and—if that clarity is not there—is likely to try to find someone to blame when things go wrong.
Tendency to Stratify Social Interactions
This attribute is at the heart of OH. By “tendency to stratify social interactions,” we mean a person who is naturally and constantly assessing relative status in human groups. In the absence of a clear, imposed hierarchy (like that given by traditional job titles), high OH individu‐als will likely create a hierarchy of their own. They will strive to identify the “boss” and “who is up on who.” High OH individuals are likely to be aware of whether they are “one up or one down” in most social interactions. A high OH person will also likely manifest a desire to pre‐serve existing hierarchies and in their absence to create them. 33 Sidanius and Pratto, Social Dominance, p. 100.

Chapter 25/Workbook Page 72
Focus on Personal and Positional Power
In every grouping, it seems, humans form informal hierarchies based on family lineage, beauty, wealth, strength, intelligence, and various other dimensions. In particular, ability and knowledge can lead to power within an organization that is independent of power by right of position (where the word bureaucracy originally comes from). As organizational layers disap‐pear and hierarchies are removed, personal power becomes increasingly important and posi‐tional power less so. One aspect of a high OH, then, is a belief in the value of positional power versus personal power, in the value of title versus expertise. A person with a high OH is likely to respond more to the person with the title rather than the person who has the relevant exper‐tise for the task at hand.
Resistance to Change
Most of us are comfortable with our own behavior, thoughts, and beliefs. We develop familiar routines in the workplace, at home, and with those we know well. With time, many of us become inflexible to the idea of change. But eventually we face unfamiliar situations and confront the need to change. People with a high OH are likely to have higher respect for the traditions of the past and therefore be resistant to change. Here, the hierarchy is the hierarchy of time with the old and time‐tested being more respected than the new and innovative. People with a high OH are more likely to resist change in traditions and bureaucracies and to strive to protect the past or the status quo.
Social Dominance Orientation
Group‐based social hierarchies produce rules, procedures, and actions that may or may not be intended, that result in unequal allocations of positive or negative social values across social status hierarchy.34 Those with a high OH are more likely to favor social dominance orientation and produce policies with higher levels of group‐based social inequality than individuals with lower OH.
Given these six dimensions of OH, we constructed or cited 10 questions that address each of them. The sequence of the questions was scrambled to help avoid the tendency to try to game the instrument. Here’s how to score your responses.
SCORING RESPONSES
The following chart shows which questions are related to which dimension. For each ques‐tion/response, you’ll note a score of one through five. Note that some of the questions are re‐verse scored. In other words, they were worded so that “disagree” really means you “agree” with the dimension in question. Pay attention to this distinction as you score your answers.
Refer to your previous answers to complete the scoring sheets. Under each category, go to that question and determine your score by whether the question was scored positively, which is one through five, or negatively, which is five through one. Enter your score and tally your totals. By
34 Sidanius and Pratto, Social Dominance, p. 41.

Chapter 25/Workbook Page 73
tally we mean ADD the positive scores and SUBTRACT the negative scores.
SCORING SCHEME
SD D NS A SA
Positive Score 1 2 3 4 5
Negative or Reverse Score 5 4 3 2 1
Attitude Toward Information Score =
2. Information is power and should be protected. (+) +
4. It is important to communicate through formal channels. (+) +
7. Many employees would misuse information about our organization, so we need to protect it. (+)
+
23. All employees should have access to all company information. (‐) ‐
25. The information flow within an organization should be carefully managed. (+) +
28. Executives and managers should control the information in a company. (+) +
30. Employees with more access to company information make better decisions. (+)
+
36. When it comes to organizational information, employees should be on a “need‐to‐know” basis only. (+)
+
48. An employee’s job is to follow instructions. (+) +
57. People at the top understand best how to use information relevant to the or‐ganization. (+)
+
Attitude Toward Accountability Score =
3. People perform better when allowed to work independently. (‐) ‐
16. Each person in an organization is accountable to the next higher person in the organization. (+)
+
21. Employees can justify their actions if they were doing what the boss in‐structed. (+)
+
24. The boss is always accountable for the organization’s results. (+) +
35. Employees should not decide what to do—only how to do it. (+) +
40. Employees should be responsive to the boss’s interests but keep focused on what they think is best for the company. (‐)
‐

Chapter 25/Workbook Page 74
47. If you give employees too much responsibility, they won’t be able to handle it. (+)
+
49. Every employee should be accountable to one boss. (+) +
52. It is important to follow the chain of command. (+) +
59. When mistakes are made it is important to find out who made them and pu‐nish them. (+)
+
Tendency to Stratify Social Interactions Score =
8. Traditional management structures continue to serve us well. (+) +
11. When I meet new people, I ask them what they do for a living. (+) +
18. I pay close attention to status. (+) +
27. People naturally form vertical hierarchies. (+) +
32. It is important to know the rank of the person you’re talking with. (+) +
37. In a new situation or group, I try to find out where I fit into the pecking order. (+)
+
39. I try to find out whether I’m superior or subordinate to others. (+) +
43. Clothing and mannerisms give important clues to a person’s status. (+) +
54. I listen more carefully to people in authority. (+) +
60. I try to make sure that people know where they stand in a group or organiza‐tion. (+)
+
Focus on Personal and Positional Power Score =
6. It is important to climb the ladder. (+) +
14. Employees should obey the boss regardless of their personal feelings toward the person. (+)
+
17. An employee should try to do the right thing regardless of what the boss says. (‐)
‐
29. People low in an organization may often have great ideas. (‐) ‐
34. You should do what your boss asks regardless of what it is. (+) +
41. The formal leader is in charge. (+) +
46. Promotion is a hallmark of success in life. (+) +
50. A person’s title tells you a lot. (+) +
53. Success is winning the battle for the next promotion. (+) +
56. People at the top are more successful. (+) +
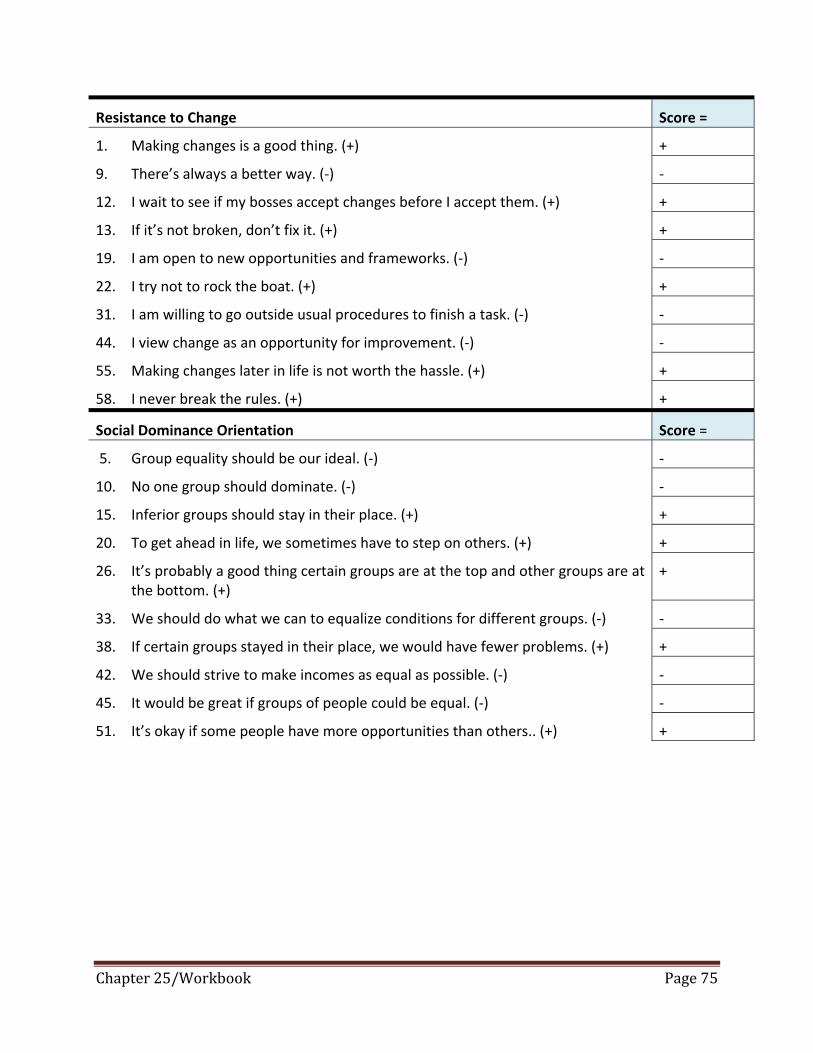
Chapter 25/Workbook Page 75
Resistance to Change Score =
1. Making changes is a good thing. (+) +
9. There’s always a better way. (‐) ‐
12. I wait to see if my bosses accept changes before I accept them. (+) +
13. If it’s not broken, don’t fix it. (+) +
19. I am open to new opportunities and frameworks. (‐) ‐
22. I try not to rock the boat. (+) +
31. I am willing to go outside usual procedures to finish a task. (‐) ‐
44. I view change as an opportunity for improvement. (‐) ‐
55. Making changes later in life is not worth the hassle. (+) +
58. I never break the rules. (+) +
Social Dominance Orientation Score =
5. Group equality should be our ideal. (‐) ‐
10. No one group should dominate. (‐) ‐
15. Inferior groups should stay in their place. (+) +
20. To get ahead in life, we sometimes have to step on others. (+) +
26. It’s probably a good thing certain groups are at the top and other groups are at the bottom. (+)
+
33. We should do what we can to equalize conditions for different groups. (‐) ‐
38. If certain groups stayed in their place, we would have fewer problems. (+) +
42. We should strive to make incomes as equal as possible. (‐) ‐
45. It would be great if groups of people could be equal. (‐) ‐
51. It’s okay if some people have more opportunities than others.. (+) +

Chapter 25/Workbook Page 76
Now that you’ve scored your answers, sum them in the table that follows.
Score
Attitude Toward Information (ATI)
Attitude Toward Accountability (ATA)
Tendency to Stratify Social Interactions (TTS)
Focus on Personal and Positional Power (PPP)
Resistance to Change (RC)
Social Dominance Orientation (SDO)
Total OH
INTERPRETING YOUR SCORE
Self‐assessment scores only mean something in a context (i.e., when compared to a population with data on the range of their scores, the maximum and minimums, etc.).
TO BE ADDED: Because this instrument is new, we only have preliminary data with which to compare your data. The following table represents the data available and the sample from which it was taken. You can compare your data with the sample data and begin to draw some tentative conclusions and think about how, if at all, you wish to continue exploring the impact of your OH on your effectiveness in organizations.
ATI ATA TTS PPP RC SDO OH
Maximum = 44 38 50 38 26 20 216
Minimum = 4 ‐2 10 ‐2 ‐14 ‐20 ‐24
Average =
Std Dev =
N =
IMPLICATIONS
Orientation to hierarchy affects the way we look at the world. If we have a strong OH, we are likely looking for and creating hierarchies in our social interactions, especially in busi‐ness. If we have a low OH, we are more likely to be open to the input of a variety of people. Further, we suspect that a person with a high OH will likely resist changes in organizational structure and, in particular, those that lead to flatter, more accountable, and more expertise‐based systems. People with a high OH are more likely to ignore advice and data from those lower in an organization and to focus on those in authority as better sources of information and judgment. People with a high OH are likely to listen more intently to those in authority and less

Chapter 25/Workbook Page 77
to those without status. In an organizational environment that is becoming increasingly nonhie‐rarchical, a strong OH may hinder a manager’s effectiveness—particularly one’s willingness to initiate and respond to changes; an awareness of one’s OH may be the first step toward beha‐vioral changes that enhance leadership skills.

Chapter 25/Workbook Page 78
ORIENTATION TO HIERARCHY DATA SHEET If you’re willing, please recreate your OH scores here along with some demographic information and then mail directly to Jim Clawson, Box 6550, Charlottesville, VA 22901; or e‐mail to [email protected] or preferably, enter your data online at http://faculty.darden.virginia.edu/clawsonj/.
Thank you for your contribution to this research and to this database.
How many people work in your organization?
What is your gender?
What is your age?
What was your college major?
How long have you been with your current company?
0–5 years
6–10 years
11–15 years
16–20 years
More than 21 years
What department best describes your work?
Accounting Sales Human Resources
Finance Operations International
Marketing Legal Other
What is your position in the company?
Senior Middle First Line Other
Management Management Supervisor
Score
Attitude Toward Information (ATI)
Attitude Toward Accountability (ATA)
Tendency to Stratify Social Interactions (TTS)
Focus on Personal and Positional Power (PPP)
Resistance to Change (RC)
Social Dominance Orientation (SDO)
Total OH

Chapter 25/Workbook Page 79
SYSTEMS AND PROCESSES IN MY ORGANIZATION THAT NEED REDESIGNING
After reading the chapter on leading organizations, think about the systems and processes in your organization that aren’t working well. List them and begin thinking about how you’d rede‐sign them if given the chance. The well‐known GE Workout process included five steps: a) de‐scribe the current system, b) describe the results (‐) produced by the current system, c) de‐scribe the “new” system, d) describe the intended benefits, and e) describe what it would take to make the changes.
Dysfunctional Systems A Better Design Would Be …

Chapter 25/Workbook Page 80
MY PERSONAL MODEL OF CHANGE In the space below, draw your personal model of how change occurs. You may or may not wish to draw from the models presented in Chapter 24.

Chapter 25/Workbook Page 81
WHAT DO I WANT TO DO NEXT?
Given your work with this book in a course or an executive education program, what few things do you wish to do next with regard to developing your Level Three leadership skills?
1.
2.
3.
4.
5.
6.
7.
8.

Chapter 25/Workbook Page 82
YOUR CENTRAL POINT
What's the most important thing you learned from the book about becoming a more in‐fluential leader to yourself, to your work group, and to your organization? If you focus on too many goals, you may not reach any of them. If you pick one and stick to it, you may make some real progress. What would that thing be?