Embed Size (px)
Citation preview
ARRB CONFERENCE - OCTOBER 2006
SELF-EXPLAINING AND FORGIVING ROADS
– SPEED MANAGEMENT IN RURAL AREAS
Lene Herrstedt, Director, Civil Engineer Ph.D., Trafitec, Denmark
ABSTRACT
The vision of “The self explaining and forgiving road” is a new way of thinking in planning and designing road infrastructure. Design of roads must focus on simplicity and clearness instead of complexity and ambiguity. Whatever we do about design - including use of information technology - with the aim to help the road users to manage traffic situations in a safe manner – road users will make mistakes and accidents will occur. The higher speed the more serious will the consequences be from making mistakes in traffic.
A major part of the road safety problem in Denmark is related to rural roads. More than 2/3 of the fatalities and 46 % of all casualties in Danish traffic are on rural roads and high speed is a fundamental factor. This is the background for the project concerning development of speed management methods for use in rural areas initiated by the Danish Road Directorate.
Ideas have been collected from national and European traffic experts and practitioners and a Catalogue of Ideas for speed management measures for use in rural areas has been worked out. In parallel a dialogue between traffic psychologists and traffic engineers has been mobilised with the purpose to discuss and describe the general principles for speed behaviour.
Some of the ideas from the Catalogue have been selected for implementation. Evaluation results and experiences will be used for developing new road design standards for rural areas.
INTRODUCTION
A major part of the road safety problem in Denmark is on rural roads. More than 2/3 of the road fatalities and 46 % of casualties in Danish traffic are on rural roads.
High speed is a frequent factor in causing accidents and high speeds leads to more serious injuries (Vejdirektoratet 2003 and 1998, Havarikommissionen 2002 and 2003, Elvik et al 1997). The published results from the permanent traffic counting stations on rural roads analysed by Danish Road Directorate (2004) show, that the mean speed on Danish rural roads, with speed limit 80 km/h, was 84 km/h in 2002. The speed limits were exceeded by 61% of cars and vans and 14 % exceeded the limit by more than 20 km/h. Speed adaptation is central for increasing road safety.
This is the background for the project concerning development of speed management methods for use in rural areas initiated by the Danish Road Directorate.
THE VISION
Road safety is based upon a balanced interaction between the road users, the vehicles and the infrastructure. A safe infrastructure depend on a road user adapted design of the whole road environment including: geometric design, markings, signs, lightning, equipment, plantings, road
surface and information technology, management of traffic and speed, traffic laws and rules for the use of infrastructure.
“The self explaining and forgiving road” should be the vision for the safe road infrastructure in the future. The aim should be to create a simple and unambiguous, clear and understandable, readable and recognisable traffic situation – easy to handle for the road users – without too many distractions and information overload – and leaving no doubt about the reasonable speed level, the give way situation, location and movement of other road users around. The aim is simplicity and clearness in stead of complexity and ambiguity! (Herrstedt 2001).
Whatever we do about design - including use of information technology - with the aim to help the road users to manage traffic situations in a safe manner – road users will make mistakes and accidents will occur. But mistakes in traffic should not mean “sentenced to death”! The vision of “The self explaining and forgiving road” is a new way of thinking in planning and designing road infrastructure.
From research and development we already have a lot of knowledge to start implementing the first generation of “The forgiving road” based upon a systematic implementation of road safety measures to minimise the consequences: implementation of brake-away-systems, remove dangerous obstacles along the roads, balance the distance to objects along the road to the level of speed, installation of crash cushions at strategic locations, supply road shoulders with moderate slope angles to avoid cars to roll over in run-off accidents, installation of road barriers, use of warning systems to wake up the driver etc. And the most important of all: speed management! The higher speed the more serious will the consequences be from mistakes in traffic!
Speed management techniques for urban areas have been developed, evaluated and implemented during more than three decades in Denmark. Tools and concepts are very well described and tested. Recommendations have been included in the Danish Guidelines for Urban Areas for several years already. Handbooks for planning and implementation process are available. This is one of the main reasons for the very positive development in road safety for urban areas in Denmark during the last ten years.
A challenge for the future is the question on how we manage speed on rural roads and arterial urban roads.
A vision for the future is a change from a system based upon general fixed speed limits to a system based on differentiated and dynamic limits adapted to the current traffic situation. This must be done by combining road design, road equipment and use of new technology.
DEVELOPMENT OF SPEED ADAPTATION TOOLS
A Catalogue of Ideas (Danish Road Directorate 2003) of speed adaptation tools for use in rural areas has been worked out. Ideas have been collected from national and European traffic experts and practitioners. Progress in this field depends on a fruitful dialogue and co-operation between engineers and traffic psychologists. In parallel with collecting ideas for potential speed management tools - a dialogue between traffic psychologists from the Swedish National Road and Transport Research Institute and Institute of Transport Economics (TÖI) in Norway and traffic engineers in Denmark - researchers and practitioners - has been mobilised with the purpose to discuss and describe the general principles for speed behaviour. A summarising paper describing general principles for speed behaviour has been worked out (Herrstedt 2003) The paper will be extended during the work by adding new gained experiences.
Speed behaviour – general principles
Road users often have a spontaneous and unconscious perception of information from surroundings. Lines create visual perspectives. Objects placed close appear as bigger objects
compared to objects placed in longer distances – even though it is not the case. Road users rely mostly on visual information. The visual design of road environment is therefore very important.
The perception of speed depends on the movement related to the surroundings. Two drivers approaching an intersection at right angles might perceive each other as standing still. Speed is perceived as higher in relation to objects very close compared to objects far away. When moving forward in traffic the optical focus will be standing still while all other objects in the view field will be seen moving in an optical expansion from this focus point and the size of objects will visually increase. The higher speed the faster the optical expansion process will be (F. Sagberg 2003). This is known from traffic situations – ex. when the car driving in front is slowing down. Studies have shown a general tendency of underestimating own speed among drivers (F. Sagberg 2003). Choice of speed depend on many factors ex. perceived danger, mental load and overload, physical discomfort because of vibration and noise, habits and unconscious speed adaptation (speed generalisation). The visual perception of the traffic environment is a very strong factor.
Mental overload may lead to speed reduction as compensation. Monotony and underestimation of drivers – ex. when driving on a monotone boring road – turn on “the autopilot” and may lead to increased speed to break the monotonous situation and turn off “the autopilot” again.
Humans are supplied with a natural curiosity. We continuously observe the close surroundings but mostly this search of information is unconscious. When we face a non recognisable situation and we need to adapt a new environment or new situation our consciousness is turned on. A varied and stimulating road design keep the driver attention alive. Those principles can actively be used in road design by aiming at developing series of road sections with limited sights. New road sections will be opened up to the driver when leaving one section and enter the next. Every time a new section is opened up it stimulates the curiosity of the driver. Driver attention must continuously be aroused. An example to illustrate the principles described could be the implementation of a roundabout. A new road section open up a new road environment after passing the roundabout.
General principles for human factors related to speed perception should be actively utilized in road design. The designer should aim for creating a varied road environment with a balanced demand of mental load and a comfortable rhythm for the drivers.
THE CATALOGUE OF IDEAS FOR RURAL ROADS
Some of the tools described are new “ideas” while others are known – more or less - but not necessarily evaluated. Some of the ideas from the Catalogue have been selected for implementation and evaluation in pilot studies and more pilot studies are expected to be initiated during the following years.
The Ideas include different designs for speed zones in rural areas and road sections based upon “2+1” and “2-1”, marking of curves and transition zones, physical and electronic measures for spot wise speed reduction on road sections, speed reducing designs at intersections, different kinds of technical measures as ex. VMS, reflectors/lamps and three dimensional visual markings and ITS technology for speed adaptation.
Some examples of the most non-traditional ideas include:
- Visual flicker and visual narrowing of road lanes created by use of forgiving obstacles
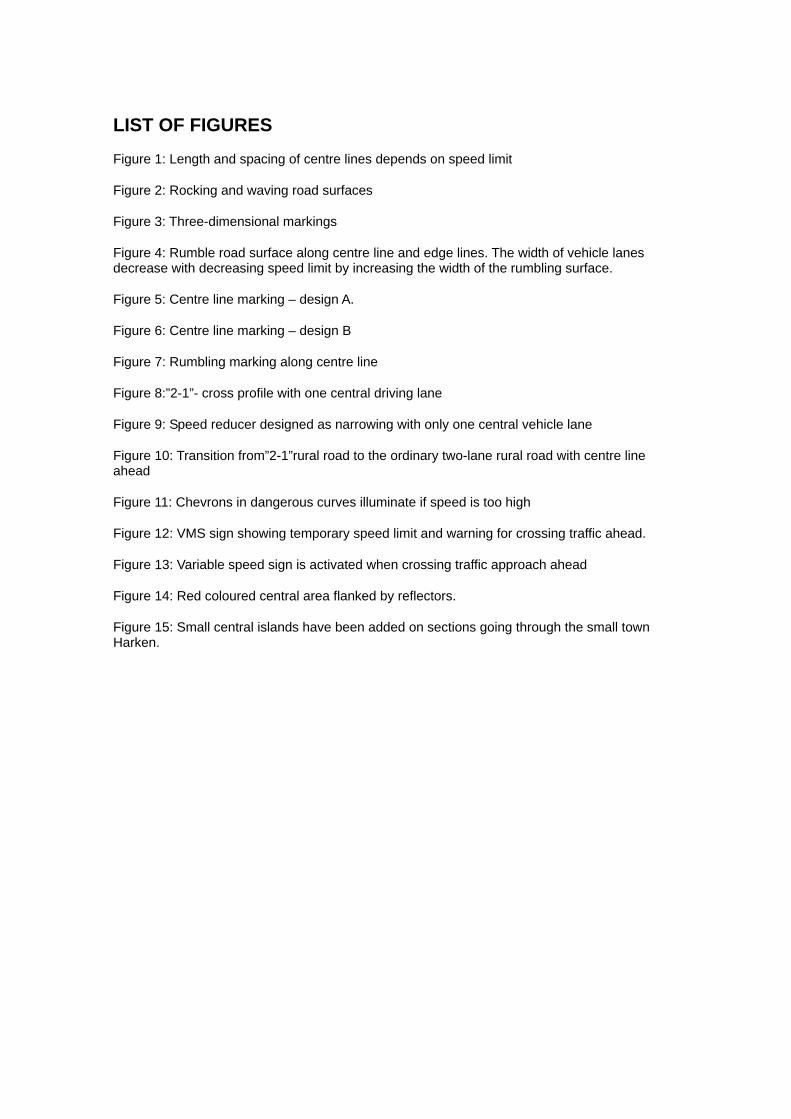
- Reduced lengths and spacing of centre lines are used when speed limit is low. (see Figure 1). The purpose is to influence speed behaviour by changing the frequency of lines meeting the drivers´ visual perspective. The suggested combinations of lengths and spacing of edge lines depending on speed limits are as follow:
80 km/h: 5m – 10m – 5m – 10m – 5m - -
70 km/h: 4m – 8m – 4m – 8m – 4m - -
60 km/h: 3m – 6m – 3m – 6m – 3m - -
50 km/h: 2.5m – 5m – 2.5m – 5m – 2.5m - -
The same principles are used for edge lines as described in chapter 6.
- Rocking and waving road surface on selected road sections (see Figure 2). The purpose is to arouse the attention of drivers by temporary decreasing the high level of driving comfort - especially in new cars.
- Markings painted to appear three dimensional are based on the idea that a “visual level of difference” probably effect drivers´ choice of speed in the same way as a “physical level of difference” (see Figure 3).
- Rumbling road surface along edge lines and centre lines (see Figure 4). Suggested width of vehicle lane depend on speed limit as follow:
40km/h 2.50m
50km/h 2.75m
60km/h 3.00m
70km/h 3.25m
The width of vehicle lane is decreased by increasing the width of rumbling surface. On road sections where speed limits decrease from one level to another the width of rumbling road surface is changed gradually forming a funnel.
- Different new combinations of measures for speed impact
EXAMPLES OF IMPLEMENTED IDEAS FOR TEST
Some of the ideas described in the catalogue have been implemented in pilot projects to be tested and evaluated. Some of the examples presented in the following have been implemented and evaluated and the results are summarised. Other examples have been implemented and only preliminary results are available yet.
Markings along centre lines – with and without rumbling
Markings along centre lines without rumbling
Markings along the centre line of a regional rural road (County of South Jutland) were established in late autumn 2003. ADT is 10.000 vehicles and 9-14 % heavy vehicles. Two different designs have been implemented for testing. Design A (see Figure 5) have been implemented on a 2.3km test section and Design B (see Figure 6) have been implemented on another 2.5km test section.
The width of the marked central area is 1m. The distance between the green transverse strips is 0.60m. The length of the white longitudinal central lines is 5m and the spacing is 10m. It is allowed for cars to drive across the central marking and overtaking is still permitted. The marking is supposed to affect the driver visually but it is also audible when cars are crossing over. The purpose has been to reduce the number of head-on collisions by use of a low cost measure.
The first evaluation activities have been carried out by the county. Speed registrations show that mean speed and 85%-fractiles for speed are almost unchanged with a decrease on 1-2 km/h. More than 80 % of the interviewed give the correct answer that it is permitted to take over on the test section and cross the central marking while 13 % think that it is not permitted. About 20 % of the interviewed say that they do not overtake until they have passed the test section. Observations on-site seem to show a smaller frequency of overtaking on the test sections compared to the adjacent road sections. 85 % of the interviewed road users express satisfaction with the new markings. Among the interviewed having a priority most of them prefer design A. If the new markings along the centre lines have the intended effect on head-on collisions is not known yet.
The test period runs until October 2007. An accident analyse is planned to be carried out during 2006/2007.
Rumbling Markings along centre lines
Rumbling markings were established along centre lines on a rural test route (see Figure 7) in autumn 2004. The ADT is 12.000 and the signed speed limit is 70 km/h on one part and 90 km/h on another part. The width of road varies between 7 – 8m.
The main safety problem was a high number of Head-on collisions and Single accidents with 7 killed and 30 injured during a 5 year before period in those two accident categories. During the first year after implementation no head-on collisions and only one single accidents are registered and no injuries at all. In 2007/2008 when a three year after period will be available an accident analysis will be carried out.
The preliminary evaluation carried out by the County show that speed level has remained unchanged. Noise measurements show a significantly increase in noise maximum level for the close surroundings on 3-5 dB(A) when cars cross over the rumbling marking. The noise level in the car rise by 7 – 15 dB(A).
Introduction of “2 – 1” cross section profile
During winter 2003/2004 a 6km long section of a two-lane municipality rural road was redesigned by introduction of a new “2-1”(two minus one) cross section profile (see Figure 8).
The new “2-1”- profile have only one central driving lane – 3.5m width – marked by 0.30m wide intermittent edge lines leaving an area of 0,85m width in both sides for cyclists and for cars to use in meeting situations. The length and spacing of the intermittent edge lines are longer the higher speed limit:
60km/h sections 2m – 2m – 2m – 2m –
50km/h sections 1m – 1m – 1m – 1m –
40km/h sections ½ m - ½ m - ½ m - ½ m –
Road width before varied between 5.0m – 6.5m. The road is a bit curvy. ADT is 2500 vehicles with 8-10 % trucks/busses. The new-profiled road is divided in three road sections with signed speed limits on 40km/h, 50km/h and 60km/h.
The new “2-1”- profile is supplemented by 12 speed reducers - designed as narrowing (16m long) edged by side islands (see Figure 9). On a few spots where sight distance is too short for the “2-1”-solution the profile has remained as a two lane rural road (see Figure 10).
Registration of road user behaviour is carried out during autumn 2004. The evaluations include studies of:
• Speed
• Driver behaviour in meeting situations on road sections with signed speed limits of 40, 50 and 60km/h.
• Driver behaviour in meeting situations at speed reducers
• Driver behaviour in transition zone between “2-1”-profile to ordinary two-lane cross profile marked by centre lines.
• Driver behaviour at intersections
• Citizens and road users opinions - interviews
The evaluation results (Lund & Herrstedt 2005) show:
- Speed limits are still exceeded and mean speeds are still too high compared to the signed speed limits. Mean speed is 60 km/h to 65 km/h and 85%fractiles are 69 km/h to 76 km/h on sections with signed speed limit 50 km/h after implementation of the new profile. Mean speed is 53 km/h to 57 km/h and 85%fractiles are 63 km/h to 68 km/h on the section with signed speed limit 40 km/h after the implementation. Mean speed is 69 km/h to 70 km/h and 85%fractiles are 78 km/h to 81 km/h on the section with signed speed limit 60 km/h after implementation of the new profile.
- The drivers seem to behave as intended in meeting situations on road sections: drivers give way by changing the lateral position to the right and in some cases the right wheels are crossing the intermittent edge line as intended.
- Mostly the meeting situations at speed reducers are handled without problems. The drivers seem to interact and adapt speed when approaching a narrowing letting the first arrival pass first. Problems are observed though in 5-10 % of the observed situations. It is not always quite clear to the drivers who should be the first to pass the narrowing. In some cases both drivers stop and wait for each other to pass. In other cases one of the drivers continue without slowing down “forcing” the other driver to give way. Accidents have occurred. The conclusion is already quite clear: It is necessary to add a sign to the narrowing to make it clear for all drivers who should go first.
- No conflicts have been observed in the transition zones where road profile changes from “2-1” to the ordinary two-lane cross profile. Drivers seem to follow the road markings as intended.
- At intersections drivers still stop at the stop line as intended. The apprehension for drivers not to stop before reaching the intermittent edge line on the crossing road seems to be unfounded.
The evaluation results summarised above will be supplemented by an accident analysis during 2007.
Electronic devices on rural roads
Regional routes have been provided with a minor IT-system based on traffic detection connected to variable message signs at curves and intersections.
Curves
Speed detection has been connected to illumination of a warning sign located about 150 meters before entering the dangerous horizontal curves. If the drivers do not manage to slow down right
in time before entering the curves the chevron signs along the curves will illuminate as an extra warning to the drivers (see Figure 11). Experiences so far are mixed.
Intersections
Variable Speed Signs - showing temporary reduced speed limits on the main road in the intersection area - have been installed on different regional routes (see Figure 12). The text information means “crossing traffic”.
When approaching road users are present on the side roads the signed speed limit on the main road is temporary reduced from 70 km/h to 60 km/h (see Figure 13) and on other locations from 80 km/h down to 70 km/h.
This kind of information has a high degree of reliability. Drivers are informed why speed is reduced and the speed limit will only be reduced temporary when crossing traffic is present which means there is an obvious and clear visible reason to do so.
The reliability of information is very important to gain the road users accept and understanding.
Experiences so far are positive. Pre-evaluation results show about 4 – 5 km/h reduction on mean speed. Final evaluations inclusive accident analysis is expected to be available during 2006/2007.
Physical dividers along centre lines on rural roads
The main safety problem on two-lane rural roads concern “head-on” - collisions and single accidents. This was the reason for implementing physical dividers along the centre lines at a test route (County of Northern Jutland) in 2004. Different designs of dividers were described and considered before the final design was chosen for implementation.
The existing road width on 11 m was redesigned by introducing a red coloured central area (1-2 m width) along a 3.8 km long rural regional road. Small central islands have been added on sections going through a small town and the central area is flanked by reflectors on selected sections (see Figure 14 and Figure 15). The signed speed has been reduced from 70 km/h to 50 km/h and overtaking is now prohibited.
Evaluation
The evaluation results show (Lahrmann 2005) that speed has been significantly reduced. Speed profiles registered by use of car-following show a general reduction on 10-15 km/h all along the test route. The variation of speed has been reduced too – the very high speeds have disappeared.
Overtaking has been restricted and It is not allowed to cross the marked central area. A limited number of overtaking manoeuvres can still be observed though – ex. when cars overtake mopeds or slow going tractors. Most of the relative few overtaking manoeuvres observed are legal.
An accident analysis need at least three years after period and is therefor expected to be carried out in 2007/2008.
THE FUTURE – CONCLUSION REMARKS
With the aim to develop tools for speed adaptation in rural areas the implemented ideas from the catalogue mentioned above will be evaluated and more pilot studies for testing new ideas and new combinations of known elements are expected to be carried out during the next years.
The results and experiences from the different test studies will lead to a new set up of recommendations and development of a new Danish guideline for speed management on rural roads in the future.
REFERENCES
Danish Road Directorate. Hastighedstilpasning I åbent land – Idé katalog. Copenhagen. December 2003. http://www.vejregler.dk/pls/vrdad/vr_frame.f_index
Elvik, R.; Mysen, A. B.; Vaa, T.: Trafiksikkerhetshåndbok. TÖI.1997.
Havarikommissionen for Vejtrafikulykker: Rapport 1, 2002. og Rapport 2, 2003.
Herrstedt, L.: Trafikanters Hastighedsadfærd – grundlæggende principper. Appendix til Ide katalog. Januar 2003. http://www.vejregler.dk/pls/vrdad/vr_frame.f_index
Herrstedt, L.: Making our Roads Safer – A Vision for the Future Safe Infrastructure. 1st Annual European Energy and Transport Conference. Barcelona. October 2001
Herrstedt, L.; Andersson, P.: Erfaringer med hastighedsdæmpning i danske kommuner. Vejdirektoratet. 2004. http://www.vejregler.dk/pls/vrdad/vr_frame.f_index
Lahrmann, H.: Midteradskillelse på landevej – Evaluering af demonstrationsprojekt. Nordjyllands Amt 2005.
Lund, B.C. & Herrstedt, L.: Evaluering af Gurrevej – Adfærdsundersøgelse. Vejdirektoratet. Arbejdsnotat 2005.
Safberg, F.: Påvirkning av bilførere gjennom utforming av vegsystemet. Transportøkonomisk Institut (TÖI) – Report 648. Oslo. 2003.
Vejdirektoratet: Hastighed og Ulykker. November 2003. http://www.vejsektoren.dk/wimpdoc.asp?page=document&objno=6215
Vejdirektoratet: Uheld på veje I åbent land. Rapport 174.1998.
Vejdirektoratet: Hastigheder 1999 – 2002. Rapport 284.2004
AUTHORS BIOGRAPHY
Lene Herrstedt is a Civil Engineer and Ph.D. from the Technical University of Denmark. Lene Herrstedt has many years of experiences within research and development on road safety and traffic management including road design and road user behaviour, speed management and vulnerable road users. Lene Herrstedt has been active in different international research projects and international networks including European Research Programmes, World Road Association, ETSC, OECD, COST etc. She has been involved in the development of road guidelines, road safety policies, action plans and research programmes. Lene Herrstedt is the author of a long list of publications and presentations of papers at international seminars. Today Lene Herrstedt is the Director of Trafitec (www.trafitec.dk) a private company working with research, information and innovative consulting on road safety and traffic management. email address: [email protected]
LIST OF FIGURES
Figure 1: Length and spacing of centre lines depends on speed limit
Figure 2: Rocking and waving road surfaces
Figure 3: Three-dimensional markings
Figure 4: Rumble road surface along centre line and edge lines. The width of vehicle lanes decrease with decreasing speed limit by increasing the width of the rumbling surface.
Figure 5: Centre line marking – design A.
Figure 6: Centre line marking – design B
Figure 7: Rumbling marking along centre line
Figure 8:”2-1”- cross profile with one central driving lane
Figure 9: Speed reducer designed as narrowing with only one central vehicle lane
Figure 10: Transition from”2-1”rural road to the ordinary two-lane rural road with centre line ahead
Figure 11: Chevrons in dangerous curves illuminate if speed is too high
Figure 12: VMS sign showing temporary speed limit and warning for crossing traffic ahead.
Figure 13: Variable speed sign is activated when crossing traffic approach ahead
Figure 14: Red coloured central area flanked by reflectors.
Figure 15: Small central islands have been added on sections going through the small town Harken.
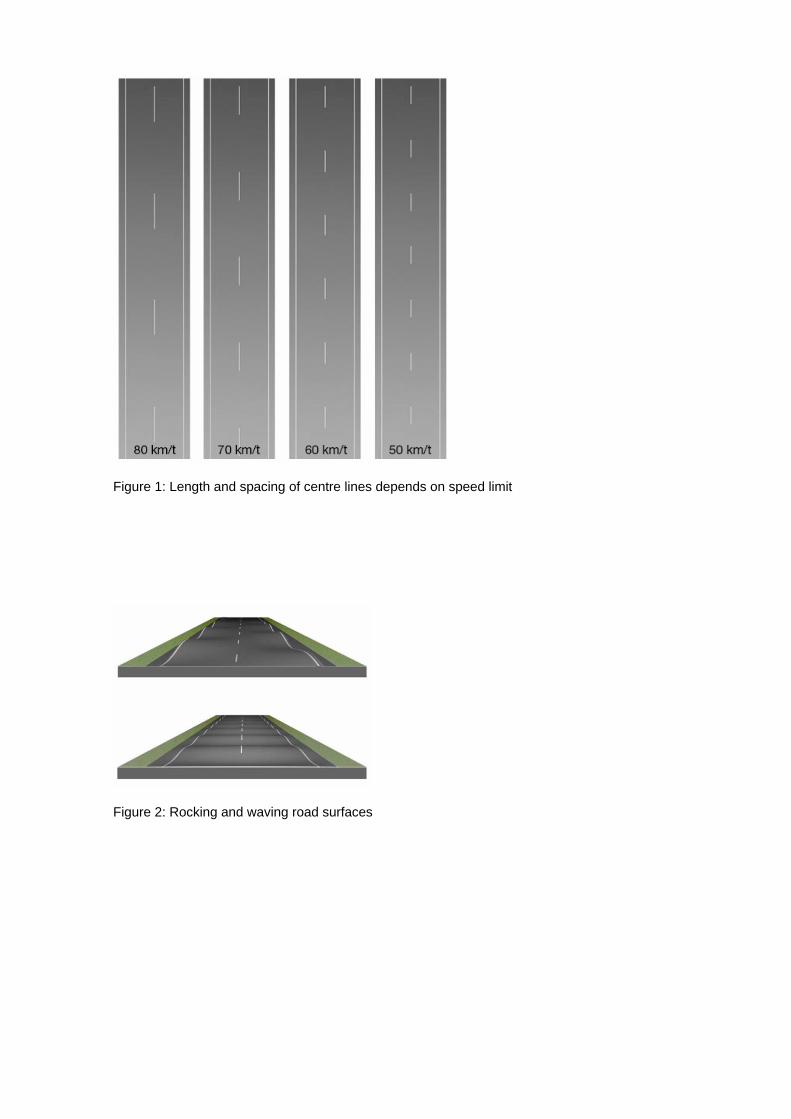
Figure 1: Length and spacing of centre lines depends on speed limit
Figure 2: Rocking and waving road surfaces
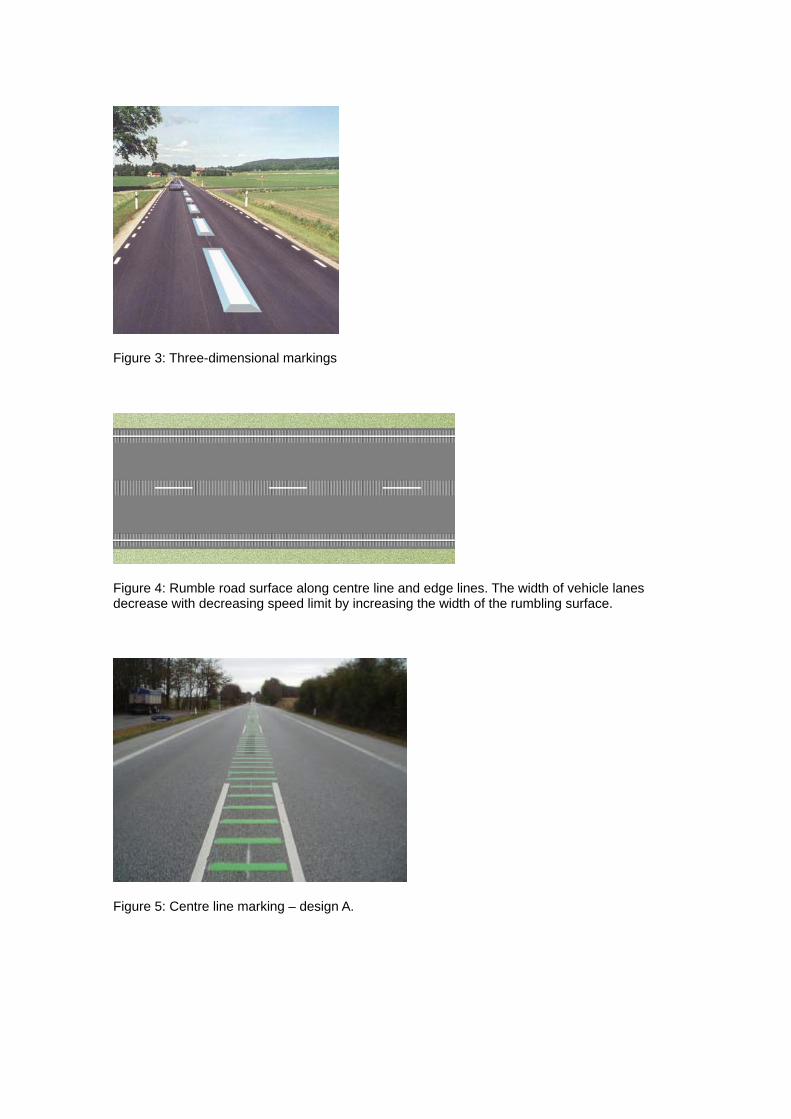
Figure 3: Three-dimensional markings
Figure 4: Rumble road surface along centre line and edge lines. The width of vehicle lanes decrease with decreasing speed limit by increasing the width of the rumbling surface.
Figure 5: Centre line marking – design A.
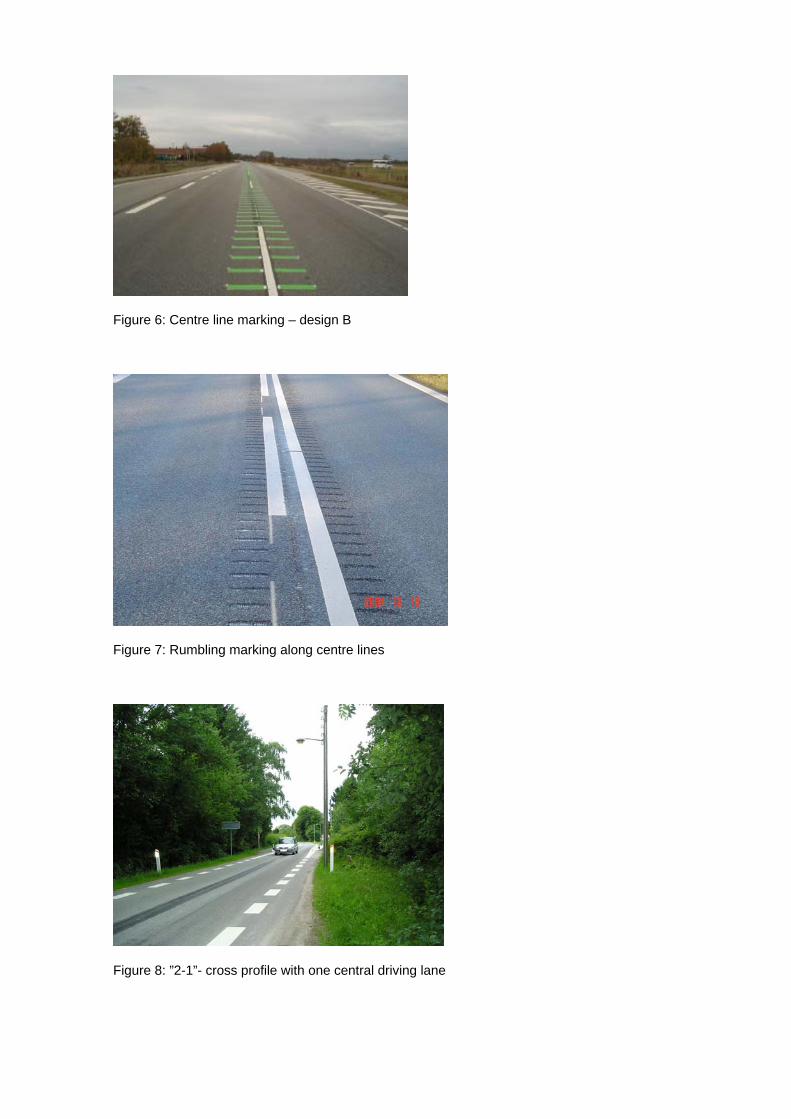
Figure 6: Centre line marking – design B
Figure 7: Rumbling marking along centre lines
Figure 8: ”2-1”- cross profile with one central driving lane
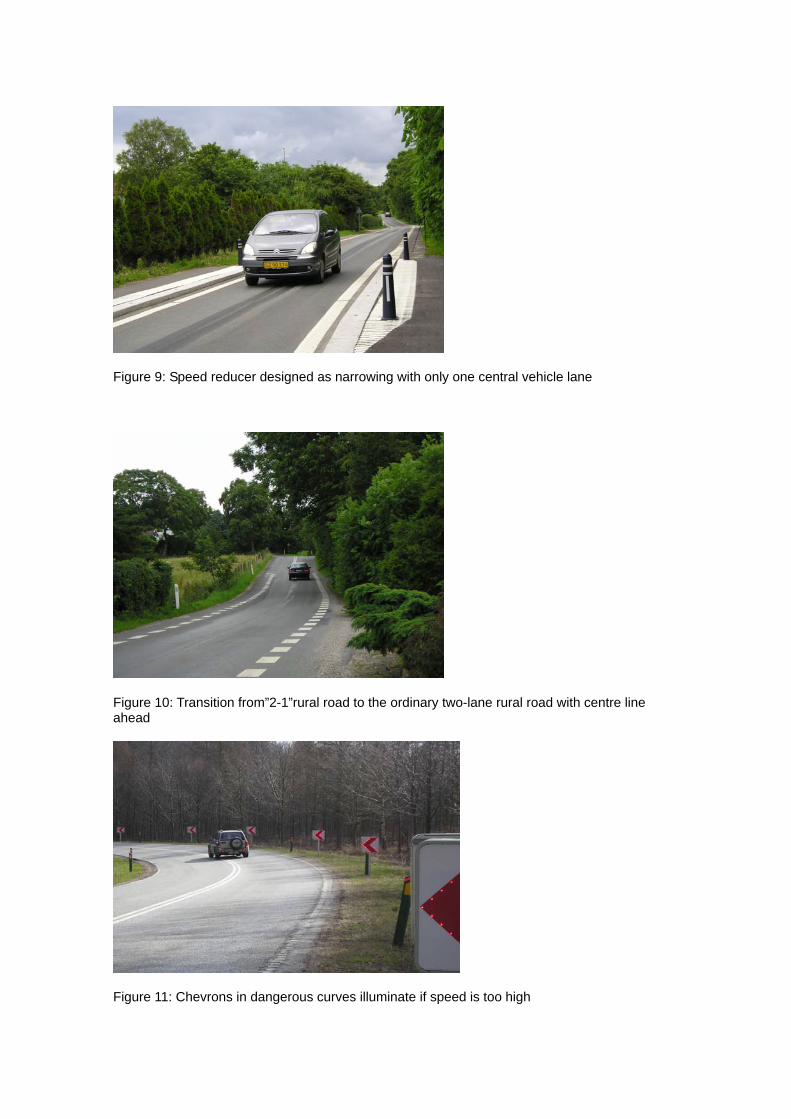
Figure 9: Speed reducer designed as narrowing with only one central vehicle lane
Figure 10: Transition from”2-1”rural road to the ordinary two-lane rural road with centre line ahead
Figure 11: Chevrons in dangerous curves illuminate if speed is too high
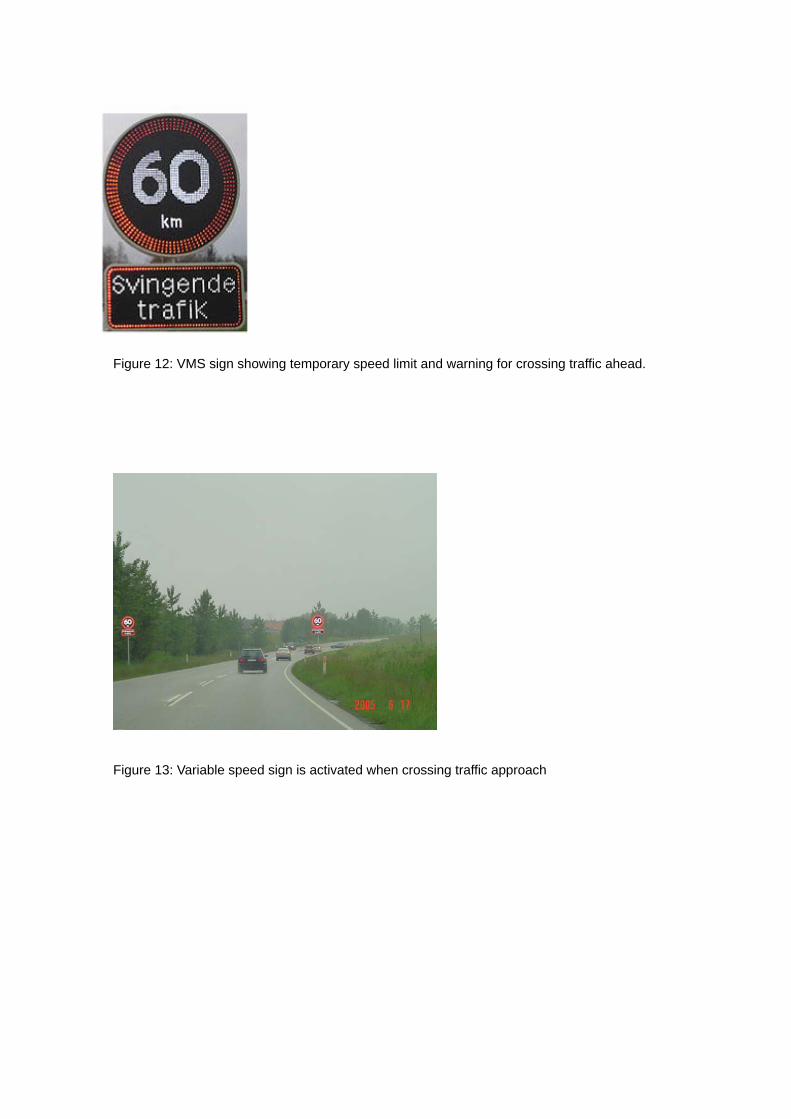
Figure 12: VMS sign showing temporary speed limit and warning for crossing traffic ahead.
igure 13: Variable speed sign is activated when crossing traffic approach
F
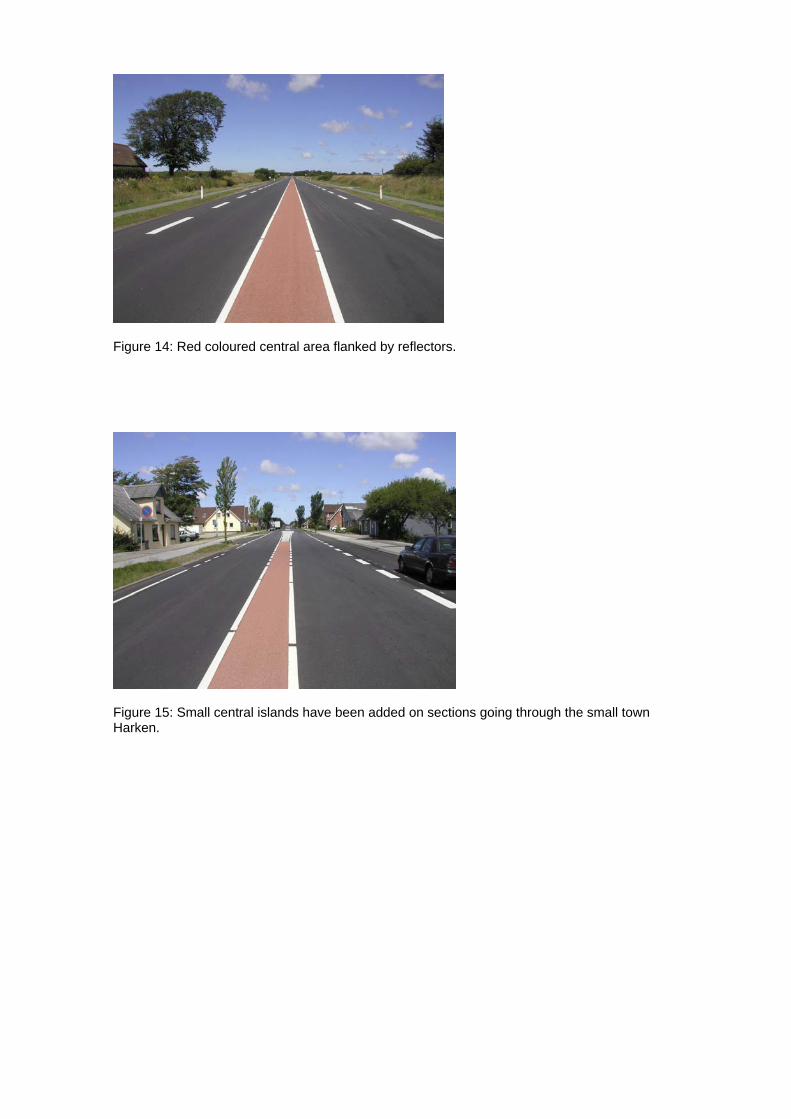
Figure 14: Red coloured central area flanked by reflectors.
Figure 15: Small central islands have been added on sections going through the small town Harken.