Embed Size (px)
Citation preview

Self-Directed LifeA FLEXIBLE LIFE INSURANCE POLICY
SEMI-ANNUAL REPORTJune 30, 2016
1"
1V SLIC K.eps
No background behind Service Mark With White Background
7/8"
3/4"
5/8"
1/2"
Funded by T. Rowe Price Fixed Income Series, Inc., T. Rowe Price Equity Series, Inc., T. Rowe Price International Series, Inc., and Janus Aspen Series
32-301A
TABLE OF CONTENTS
Janus Aspen Forty Portfolio Semiannual Report ......................................................................... 3 Janus Aspen Balanced Portfolio Semiannual Report ................................................................ 47 Janus Aspen Janus Portfolio Semiannual Report .................................................................... 103 Janus Aspen Enterprise Portfolio Semiannual Report ............................................................. 151 Janus Aspen Global Research Portfolio Semiannual Report ................................................... 199 T. Rowe Price Government Money Portfolio Semiannual Report ............................................ 247 T. Rowe Price Limited-Term Bond Portfolio Semiannual Report ............................................. 267 T. Rowe Price Personal Strategy Balanced Portfolio Semiannual Report ................................ 315 T. Rowe Price Equity Income Portfolio Semiannual Report ..................................................... 371 T. Rowe Price International Stock Portfolio Semiannual Report .............................................. 403
SEMIANNUAL REPORT June 30, 2016
Janus Aspen Forty Portfolio
Janus Aspen Series
HIGHLIGHTS
• Portfolio management perspective • Investment strategy behind your portfolio • Portfolio performance, characteristics
and holdings

Table of Contents
Janus Aspen Forty Portfolio Management Commentary and Schedule of Investments ............................1 Notes to Schedule of Investments and Other Information........................ 10 Statement of Assets and Liabilities ............................................................................. 11 Statement of Operations ...................................................................................................... 12 Statements of Changes in Net Assets...................................................................... 13 Financial Highlights .................................................................................................................. 14 Notes to Financial Statements ........................................................................................ 15 Additional Information............................................................................................................. 24 Useful Information About Your Portfolio Report ............................................... 36 Shareholder Meeting ............................................................................................................... 39
Janus Aspen Forty Portfolio (unaudited)
Janus Aspen Series 1
PORTFOLIO SNAPSHOT We believe that constructing a concentrated portfolio of quality growth companies will allow us to outperform our benchmark and peers over time. We define quality as companies that enjoy sustainable “moats” around their businesses, potentially allowing companies to grow faster, with higher returns, than their competitors. We believe the market often underestimates these companies’ sustainable competitive advantage periods.
Doug Rao
co-portfolio manager Nick Schommer
co-portfolio manager
PERFORMANCE OVERVIEW For the six-month period ended June 30, 2016, the Portfolio’s Institutional Shares and Service Shares returned -1.49% and -1.63%, respectively, versus a return of 1.36% for the Portfolio’s primary benchmark, the Russell 1000 Growth Index. The Portfolio’s secondary benchmark, the S&P 500 Index, returned 3.84% for the period.
INVESTMENT ENVIRONMENT The building pressure in U.S. and global equities in late 2015 led to a broad-based sell-off in early in the year. A chief concern was the fear of slower-than-expected growth in China, the world’s second-largest economy. The negative sentiment was also reflected in weakness in energy markets, with the U.S. benchmark for crude oil dipping to levels not seen in over a decade. However, markets regained confidence near mid-February, with both stocks and crude retracing earlier losses.
U.S. stocks traded narrowly for much of the second half of the period as investors were able to glean enough positive news from economic data to keep stocks buoyant. The continuation of accommodative global central bank policy was also additive. Expectations of future interest rate hikes by the Federal Reserve in the near term were diminished with the May employment rate that fell well short of expectations. Markets were impacted late in June by the UK’s surprise decision to leave the European Union. Stocks fell immediately after the news before recovering through the end of the month, while the dollar rose and safe-haven government bonds saw yields drop.
PERFORMANCE DISCUSSION The Portfolio underperformed its primary benchmark, the Russell 1000 Growth Index, and its secondary benchmark, the S&P 500 Index, during the period. As part of our investment strategy, we seek companies that have clear, sustainable competitive moats around their businesses that should help them grow market share
within their respective industries over time. Important competitive advantages could include a strong brand, network effects from a product or service that would be hard for a competitor to replicate, a lower cost structure than competitors in the industry, a distribution advantage or patent protection over valuable intellectual property. We think emphasizing such sustainable competitive advantages can be a meaningful driver of outperformance over time because the market often underestimates the duration of growth for these companies and the long-term potential return to shareholders.
Norwegian Cruise Lines was the leading detractor during the period. The stock traded down as geopolitical concerns in Europe weighed on the willingness of North American tourists to book cruises to the region. Over the long term, however, we remain encouraged by Norwegian’s potential. We appreciate the company’s position in the market, and believe industry dynamics are setting up an environment for improving returns on invested capital for cruise lines. Increased cruise demand from China and to new routes such as Cuba also offer growth potential.
Another leading detractor, Regeneron Pharmaceuticals, was impacted by the broad downturn in biotech stocks during the first quarter of 2016. Slower-than-expected adoption of new drugs the company recently launched was also a headwind. Moreover, the company recently communicated that it is planning for the coming year to be an investment year, which weighed on estimates.
Alphabet Inc. (formerly known as Google) also weighed on performance. The stock underperformed due, in part, to a greater portion of internet searches going through mobile devices, which led to higher-than-expected traffic acquisition costs. There are also concerns that the company’s smaller pipeline for new features may impact its ability to maintain the high level of growth it’s had over the last five to six quarters. However, we believe the company is well positioned to consolidate advertising
Janus Aspen Forty Portfolio (unaudited)
2 JUNE 30, 2016
spending as advertising becomes increasingly connected and personalized, and as it transitions from offline channels such as print and television to more measurable online channels such as mobile and online video. We believe the network effects around Alphabet’s advertising business and Android ecosystem will continue to grow, further deepening the company’s competitive moat and enabling it to better understand users’ context and intent and connect those users with suppliers of products and services.
While some stocks negatively impacted performance, we are pleased with the performance of a number of our positions. Medical device maker Boston Scientific was the leading contributor to performance during the period. During the second half of the period, the company reported stronger-than-expected earnings per share, and the pace of organic sales growth was the highest reported in over a decade. Results were especially strong in the company’s interventional cardiology unit, as well as in urology and neuromodulation. Margin performance was also impressive. At the American College of Cardiology conference, strong data for transcatheter aortic valve replacement (TAVR) devices in intermediate risk patients led many to raise their estimates of the long term market potential. Boston Scientific is the number three player in the TAVR market and stands to benefit from wider acceptance of these devices.
Construction aggregate company Vulcan Materials was another leading contributor. The company performed well during the period as residential and nonresidential aggregate markets continued to recover. Improvements in highway infrastructure spending also aided the stock’s performance. We believe the macroeconomic environment is favorable for continued performance by Vulcan, which we believe enjoys strong competitive advantages around its business model and quarries.
Amazon also contributed during the period. The company benefited as its first quarter results showed increased retail profitability. Continued strong growth in Amazon Web Services (AWS), its cloud business, was also additive. We believe Amazon is a good example of the types of competitively advantaged companies we tend to seek in our portfolio. Amazon has already rewritten the rules for retail shopping and we believe it will continue to gain consumers’ wallet share as more shopping moves from physical stores to online and mobile purchases.
OUTLOOK Moving into the second half of 2016, markets are still faced with a slow-growing global economy and geopolitical pressures that are, to some degree, a reaction to slow global growth. Given the outcome of the June referendum in the UK, we expect increased geopolitical uncertainty in Europe, as well as moderately lower growth in Europe and globally as the UK navigates its exit from the European Union.
While there are concerns about the global economy, we think it underscores the importance of finding those select companies with truly sustainable competitive advantages that can take market share and continue to grow earnings, even without the backdrop of a strong global economy. Such companies are more appreciated in a world where growth is harder to come by, as they can create their own path to creating value.
Thank you for your investment in Janus Aspen Forty Portfolio.
Janus Aspen Forty Portfolio (unaudited) Portfolio At A Glance June 30, 2016
Janus Aspen Series 3
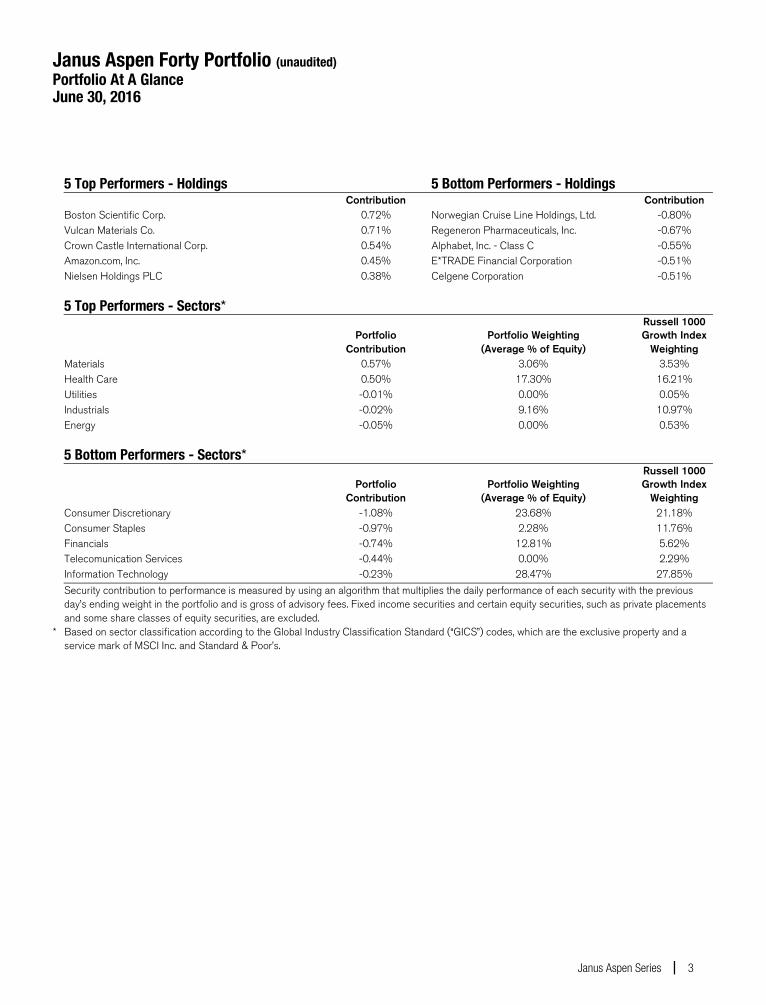
5 Top Performers - Holdings 5 Bottom Performers - Holdings Contribution Contribution Boston Scientific Corp. 0.72% Norwegian Cruise Line Holdings, Ltd. -0.80% Vulcan Materials Co. 0.71% Regeneron Pharmaceuticals, Inc. -0.67% Crown Castle International Corp. 0.54% Alphabet, Inc. - Class C -0.55% Amazon.com, Inc. 0.45% E*TRADE Financial Corporation -0.51% Nielsen Holdings PLC 0.38% Celgene Corporation -0.51%
5 Top Performers - Sectors*
Portfolio Portfolio Weighting Russell 1000 Growth Index
Contribution (Average % of Equity) Weighting Materials 0.57% 3.06% 3.53% Health Care 0.50% 17.30% 16.21% Utilities -0.01% 0.00% 0.05% Industrials -0.02% 9.16% 10.97% Energy -0.05% 0.00% 0.53% 5 Bottom Performers - Sectors*
Portfolio Portfolio Weighting Russell 1000 Growth Index
Contribution (Average % of Equity) Weighting Consumer Discretionary -1.08% 23.68% 21.18% Consumer Staples -0.97% 2.28% 11.76% Financials -0.74% 12.81% 5.62% Telecomunication Services -0.44% 0.00% 2.29% Information Technology -0.23% 28.47% 27.85%
Security contribution to performance is measured by using an algorithm that multiplies the daily performance of each security with the previous day’s ending weight in the portfolio and is gross of advisory fees. Fixed income securities and certain equity securities, such as private placements and some share classes of equity securities, are excluded.
* Based on sector classification according to the Global Industry Classification Standard (“GICS”) codes, which are the exclusive property and a service mark of MSCI Inc. and Standard & Poor’s.

Janus Aspen Forty Portfolio (unaudited) Portfolio At A Glance June 30, 2016
4 JUNE 30, 2016
5 Largest Equity Holdings - (% of Net Assets) General Electric Co.
Industrial Conglomerates 5.3% Alphabet, Inc. - Class C
Internet Software & Services 5.1% Lowe's Cos., Inc.
Specialty Retail 5.1% Amazon.com, Inc.
Internet & Catalog Retail 4.9% Zoetis, Inc.
Pharmaceuticals 4.6% 25.0%
Asset Allocation - (% of Net Assets) Common Stocks 96.7% Investment Companies 6.6% Other (3.3)% 100.0%
Top Country Allocations - Long Positions - (% of Investment Securities) As of June 30, 2016
1.4%
1.2%
1.0%
96.4%
0% 20% 40% 60% 80% 100%
United States
Netherlands
Canada
China
As of December 31, 2015
2.2%
1.8%
1.5%
94.5%
0% 20% 40% 60% 80% 100%
United States
Canada
Netherlands
China
Janus Aspen Forty Portfolio (unaudited) Performance
Janus Aspen Series 5
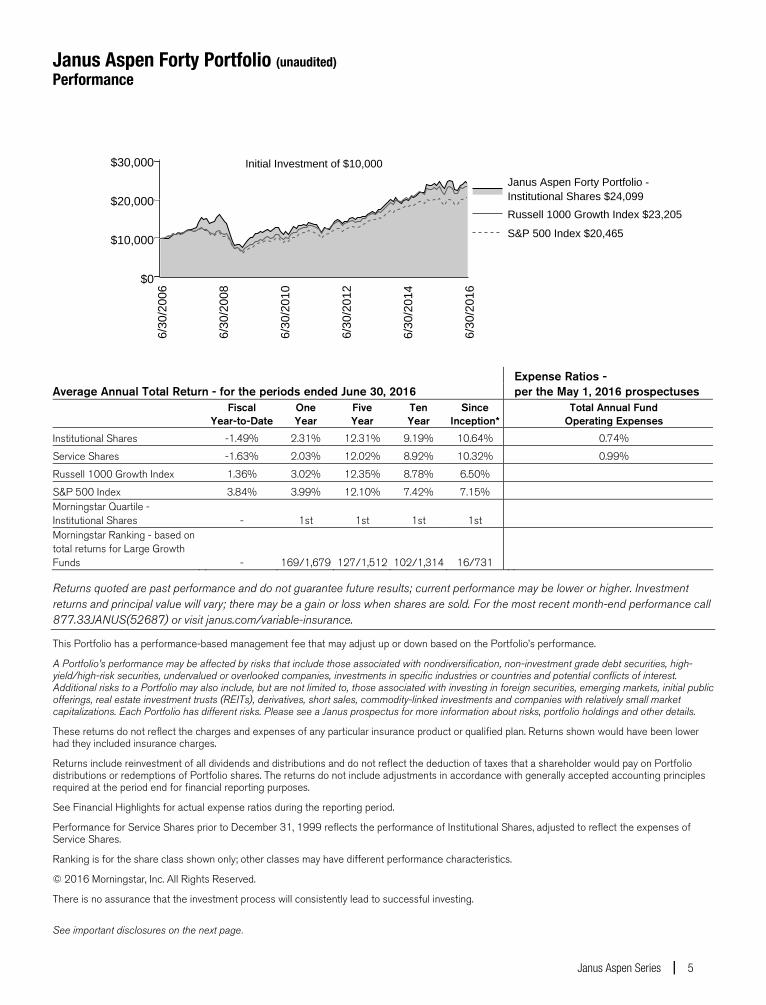
Expense Ratios - Average Annual Total Return - for the periods ended June 30, 2016 per the May 1, 2016 prospectuses
Fiscal
Year-to-Date One Year
Five Year
Ten Year
Since Inception*
Total Annual Fund Operating Expenses
Institutional Shares -1.49% 2.31% 12.31% 9.19% 10.64% 0.74%
Service Shares -1.63% 2.03% 12.02% 8.92% 10.32% 0.99%
Russell 1000 Growth Index 1.36% 3.02% 12.35% 8.78% 6.50%
S&P 500 Index 3.84% 3.99% 12.10% 7.42% 7.15% Morningstar Quartile - Institutional Shares - 1st 1st 1st 1st Morningstar Ranking - based on total returns for Large Growth Funds - 169/1,679 127/1,512 102/1,314 16/731
Returns quoted are past performance and do not guarantee future results; current performance may be lower or higher. Investment returns and principal value will vary; there may be a gain or loss when shares are sold. For the most recent month-end performance call 877.33JANUS(52687) or visit janus.com/variable-insurance.
This Portfolio has a performance-based management fee that may adjust up or down based on the Portfolio’s performance.
A Portfolio’s performance may be affected by risks that include those associated with nondiversification, non-investment grade debt securities, high-yield/high-risk securities, undervalued or overlooked companies, investments in specific industries or countries and potential conflicts of interest. Additional risks to a Portfolio may also include, but are not limited to, those associated with investing in foreign securities, emerging markets, initial public offerings, real estate investment trusts (REITs), derivatives, short sales, commodity-linked investments and companies with relatively small market capitalizations. Each Portfolio has different risks. Please see a Janus prospectus for more information about risks, portfolio holdings and other details.
These returns do not reflect the charges and expenses of any particular insurance product or qualified plan. Returns shown would have been lower had they included insurance charges.
Returns include reinvestment of all dividends and distributions and do not reflect the deduction of taxes that a shareholder would pay on Portfolio distributions or redemptions of Portfolio shares. The returns do not include adjustments in accordance with generally accepted accounting principles required at the period end for financial reporting purposes.
See Financial Highlights for actual expense ratios during the reporting period.
Performance for Service Shares prior to December 31, 1999 reflects the performance of Institutional Shares, adjusted to reflect the expenses of Service Shares.
Ranking is for the share class shown only; other classes may have different performance characteristics.
© 2016 Morningstar, Inc. All Rights Reserved.
There is no assurance that the investment process will consistently lead to successful investing.
See important disclosures on the next page.

Janus Aspen Forty Portfolio (unaudited) Performance
6 JUNE 30, 2016
See Notes to Schedule of Investments and Other Information for index definitions.
A Portfolio's holdings may differ significantly from the securities held in an index. An index is unmanaged and not available for direct investment; therefore, its performance does not reflect the expenses associated with the active management of an actual portfolio.
See “Useful Information About Your Portfolio Report.”
Effective January 12, 2016, Douglas Rao and Nick Schommer are Co-Portfolio Managers of the Portfolio. *The Portfolio’s inception date – May 1, 1997
Janus Aspen Forty Portfolio (unaudited) Expense Examples
Janus Aspen Series 7
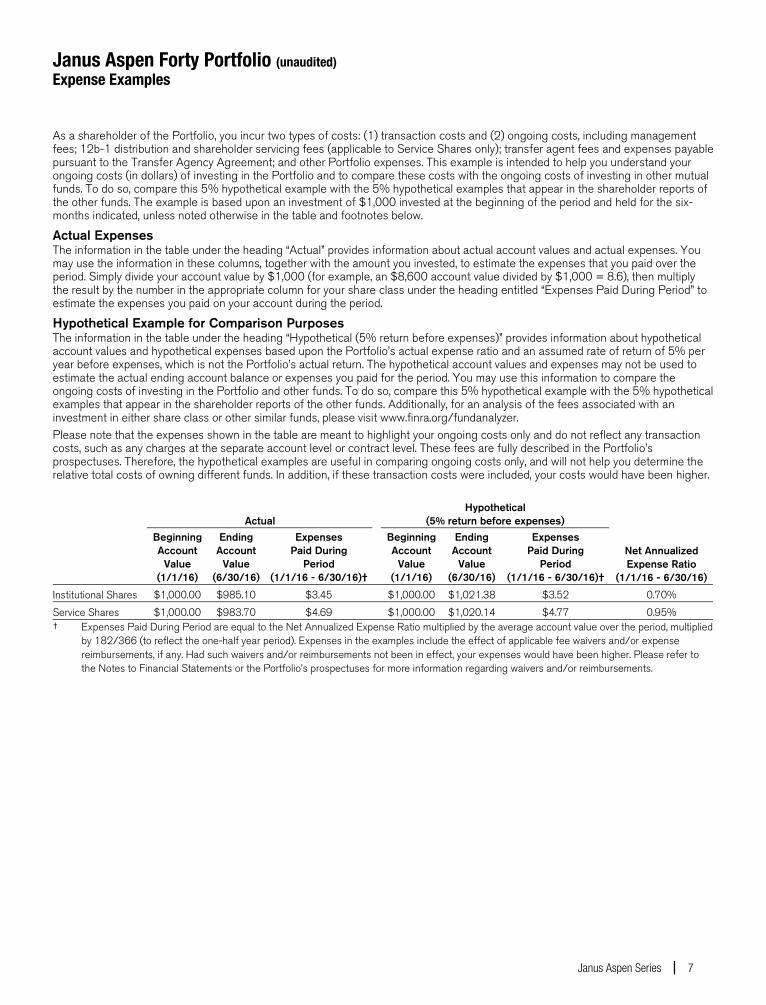
As a shareholder of the Portfolio, you incur two types of costs: (1) transaction costs and (2) ongoing costs, including management fees; 12b-1 distribution and shareholder servicing fees (applicable to Service Shares only); transfer agent fees and expenses payable pursuant to the Transfer Agency Agreement; and other Portfolio expenses. This example is intended to help you understand your ongoing costs (in dollars) of investing in the Portfolio and to compare these costs with the ongoing costs of investing in other mutual funds. To do so, compare this 5% hypothetical example with the 5% hypothetical examples that appear in the shareholder reports of the other funds. The example is based upon an investment of $1,000 invested at the beginning of the period and held for the six-months indicated, unless noted otherwise in the table and footnotes below.
Actual Expenses The information in the table under the heading “Actual” provides information about actual account values and actual expenses. You may use the information in these columns, together with the amount you invested, to estimate the expenses that you paid over the period. Simply divide your account value by $1,000 (for example, an $8,600 account value divided by $1,000 = 8.6), then multiply the result by the number in the appropriate column for your share class under the heading entitled “Expenses Paid During Period” to estimate the expenses you paid on your account during the period.
Hypothetical Example for Comparison Purposes The information in the table under the heading “Hypothetical (5% return before expenses)” provides information about hypothetical account values and hypothetical expenses based upon the Portfolio’s actual expense ratio and an assumed rate of return of 5% per year before expenses, which is not the Portfolio’s actual return. The hypothetical account values and expenses may not be used to estimate the actual ending account balance or expenses you paid for the period. You may use this information to compare the ongoing costs of investing in the Portfolio and other funds. To do so, compare this 5% hypothetical example with the 5% hypothetical examples that appear in the shareholder reports of the other funds. Additionally, for an analysis of the fees associated with an investment in either share class or other similar funds, please visit www.finra.org/fundanalyzer. Please note that the expenses shown in the table are meant to highlight your ongoing costs only and do not reflect any transaction costs, such as any charges at the separate account level or contract level. These fees are fully described in the Portfolio’s prospectuses. Therefore, the hypothetical examples are useful in comparing ongoing costs only, and will not help you determine the relative total costs of owning different funds. In addition, if these transaction costs were included, your costs would have been higher.
Actual Hypothetical
(5% return before expenses)
Beginning Account
Value (1/1/16)
Ending Account
Value (6/30/16)
Expenses Paid During
Period (1/1/16 - 6/30/16)†
BeginningAccount
Value (1/1/16)
Ending Account
Value (6/30/16)
Expenses Paid During
Period (1/1/16 - 6/30/16)†
Net Annualized Expense Ratio
(1/1/16 - 6/30/16)
Institutional Shares $1,000.00 $985.10 $3.45 $1,000.00 $1,021.38 $3.52 0.70%
Service Shares $1,000.00 $983.70 $4.69 $1,000.00 $1,020.14 $4.77 0.95% † Expenses Paid During Period are equal to the Net Annualized Expense Ratio multiplied by the average account value over the period, multiplied
by 182/366 (to reflect the one-half year period). Expenses in the examples include the effect of applicable fee waivers and/or expense reimbursements, if any. Had such waivers and/or reimbursements not been in effect, your expenses would have been higher. Please refer to the Notes to Financial Statements or the Portfolio’s prospectuses for more information regarding waivers and/or reimbursements.
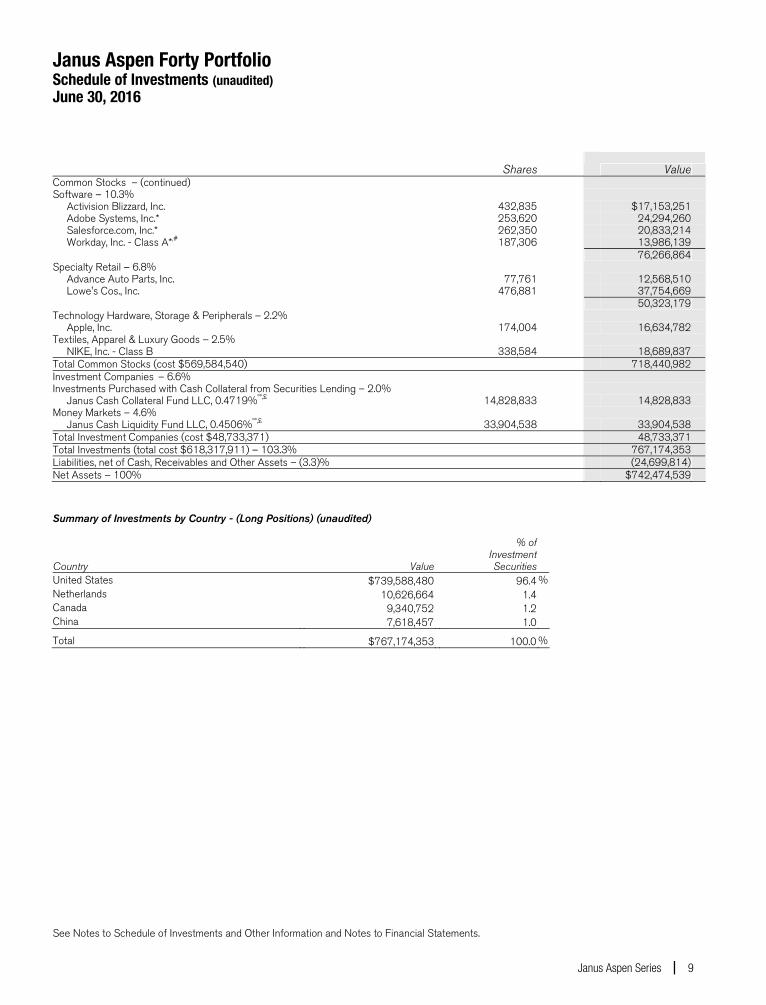
Janus Aspen Forty Portfolio Schedule of Investments (unaudited) June 30, 2016
See Notes to Schedule of Investments and Other Information and Notes to Financial Statements.
8 JUNE 30, 2016
Shares
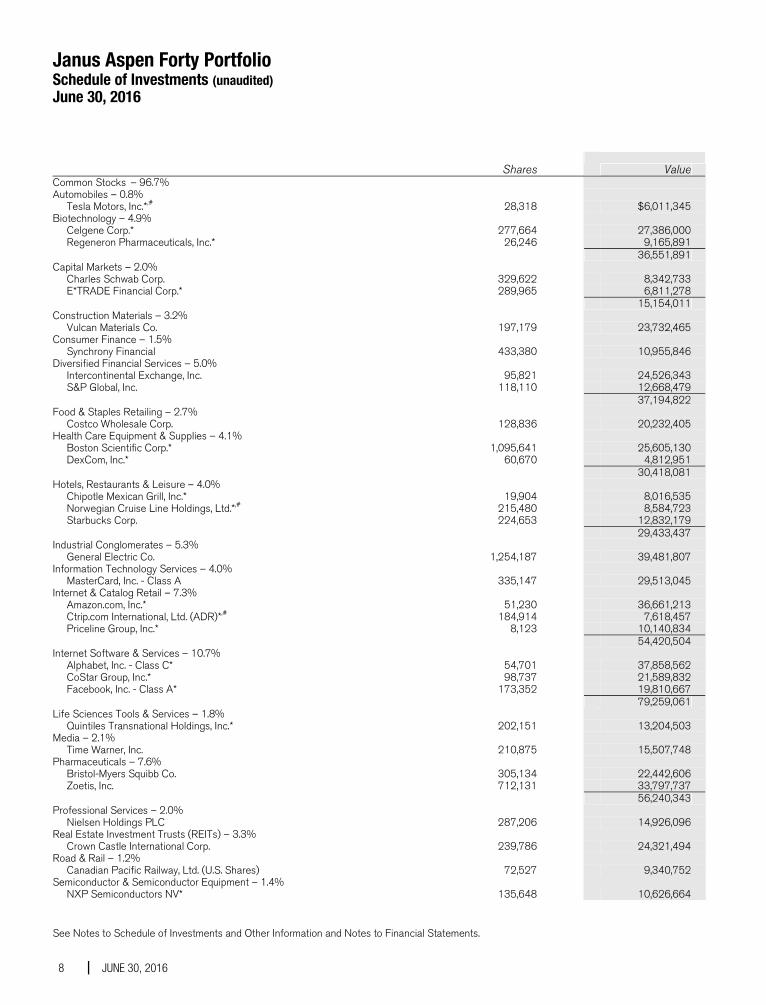
Value Common Stocks – 96.7% Automobiles – 0.8% Tesla Motors, Inc.*,# 28,318 $6,011,345Biotechnology – 4.9% Celgene Corp.* 277,664 27,386,000 Regeneron Pharmaceuticals, Inc.* 26,246 9,165,891 36,551,891Capital Markets – 2.0% Charles Schwab Corp. 329,622 8,342,733 E*TRADE Financial Corp.* 289,965 6,811,278 15,154,011Construction Materials – 3.2% Vulcan Materials Co. 197,179 23,732,465Consumer Finance – 1.5% Synchrony Financial 433,380 10,955,846Diversified Financial Services – 5.0% Intercontinental Exchange, Inc. 95,821 24,526,343 S&P Global, Inc. 118,110 12,668,479 37,194,822Food & Staples Retailing – 2.7% Costco Wholesale Corp. 128,836 20,232,405Health Care Equipment & Supplies – 4.1% Boston Scientific Corp.* 1,095,641 25,605,130 DexCom, Inc.* 60,670 4,812,951 30,418,081Hotels, Restaurants & Leisure – 4.0% Chipotle Mexican Grill, Inc.* 19,904 8,016,535 Norwegian Cruise Line Holdings, Ltd.*,# 215,480 8,584,723 Starbucks Corp. 224,653 12,832,179 29,433,437Industrial Conglomerates – 5.3% General Electric Co. 1,254,187 39,481,807Information Technology Services – 4.0% MasterCard, Inc. - Class A 335,147 29,513,045Internet & Catalog Retail – 7.3% Amazon.com, Inc.* 51,230 36,661,213 Ctrip.com International, Ltd. (ADR)*,# 184,914 7,618,457 Priceline Group, Inc.* 8,123 10,140,834 54,420,504Internet Software & Services – 10.7% Alphabet, Inc. - Class C* 54,701 37,858,562 CoStar Group, Inc.* 98,737 21,589,832 Facebook, Inc. - Class A* 173,352 19,810,667 79,259,061Life Sciences Tools & Services – 1.8% Quintiles Transnational Holdings, Inc.* 202,151 13,204,503Media – 2.1% Time Warner, Inc. 210,875 15,507,748Pharmaceuticals – 7.6% Bristol-Myers Squibb Co. 305,134 22,442,606 Zoetis, Inc. 712,131 33,797,737 56,240,343Professional Services – 2.0% Nielsen Holdings PLC 287,206 14,926,096Real Estate Investment Trusts (REITs) – 3.3% Crown Castle International Corp. 239,786 24,321,494Road & Rail – 1.2% Canadian Pacific Railway, Ltd. (U.S. Shares) 72,527 9,340,752Semiconductor & Semiconductor Equipment – 1.4% NXP Semiconductors NV* 135,648 10,626,664
Janus Aspen Forty Portfolio Schedule of Investments (unaudited) June 30, 2016
See Notes to Schedule of Investments and Other Information and Notes to Financial Statements.
Janus Aspen Series 9
Shares
Value Common Stocks – (continued) Software – 10.3% Activision Blizzard, Inc. 432,835 $17,153,251 Adobe Systems, Inc.* 253,620 24,294,260 Salesforce.com, Inc.* 262,350 20,833,214 Workday, Inc. - Class A*,# 187,306 13,986,139 76,266,864Specialty Retail – 6.8% Advance Auto Parts, Inc. 77,761 12,568,510 Lowe's Cos., Inc. 476,881 37,754,669 50,323,179Technology Hardware, Storage & Peripherals – 2.2% Apple, Inc. 174,004 16,634,782Textiles, Apparel & Luxury Goods – 2.5% NIKE, Inc. - Class B 338,584 18,689,837Total Common Stocks (cost $569,584,540) 718,440,982Investment Companies – 6.6% Investments Purchased with Cash Collateral from Securities Lending – 2.0% Janus Cash Collateral Fund LLC, 0.4719%ºº,£ 14,828,833 14,828,833Money Markets – 4.6% Janus Cash Liquidity Fund LLC, 0.4506%ºº,£ 33,904,538 33,904,538Total Investment Companies (cost $48,733,371) 48,733,371Total Investments (total cost $618,317,911) – 103.3% 767,174,353Liabilities, net of Cash, Receivables and Other Assets – (3.3)% (24,699,814)Net Assets – 100% $742,474,539 Summary of Investments by Country - (Long Positions) (unaudited) % of Investment Country Value Securities United States $739,588,480 96.4 % Netherlands 10,626,664 1.4 Canada 9,340,752 1.2 China 7,618,457 1.0
Total $767,174,353 100.0 %
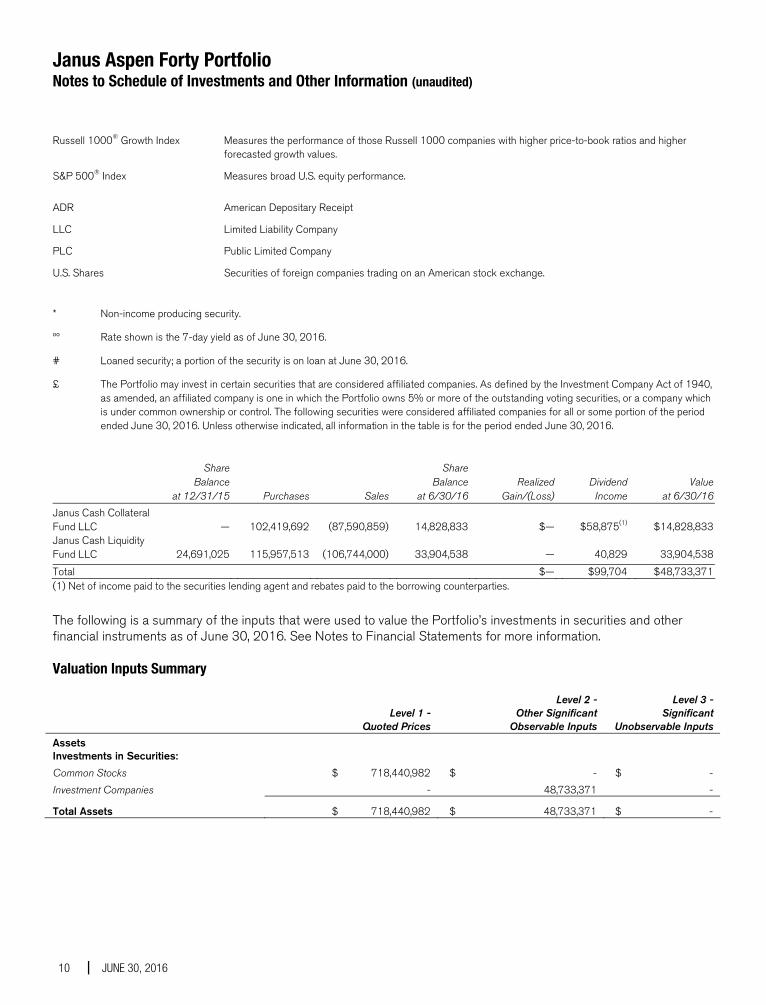
Janus Aspen Forty Portfolio Notes to Schedule of Investments and Other Information (unaudited)
10 JUNE 30, 2016
Russell 1000® Growth Index Measures the performance of those Russell 1000 companies with higher price-to-book ratios and higher forecasted growth values.
S&P 500® Index Measures broad U.S. equity performance.
ADR American Depositary Receipt
LLC Limited Liability Company
PLC Public Limited Company
U.S. Shares Securities of foreign companies trading on an American stock exchange.
* Non-income producing security.
ºº Rate shown is the 7-day yield as of June 30, 2016.
# Loaned security; a portion of the security is on loan at June 30, 2016.
£ The Portfolio may invest in certain securities that are considered affiliated companies. As defined by the Investment Company Act of 1940, as amended, an affiliated company is one in which the Portfolio owns 5% or more of the outstanding voting securities, or a company which is under common ownership or control. The following securities were considered affiliated companies for all or some portion of the period ended June 30, 2016. Unless otherwise indicated, all information in the table is for the period ended June 30, 2016.
Share Share Balance Balance Realized Dividend Value at 12/31/15 Purchases Sales at 6/30/16 Gain/(Loss) Income at 6/30/16Janus Cash Collateral Fund LLC
— 102,419,692 (87,590,859) 14,828,833 $— $58,875(1) $14,828,833
Janus Cash Liquidity Fund LLC
24,691,025 115,957,513 (106,744,000) 33,904,538 — 40,829 33,904,538
Total $— $99,704 $48,733,371(1) Net of income paid to the securities lending agent and rebates paid to the borrowing counterparties. The following is a summary of the inputs that were used to value the Portfolio’s investments in securities and other financial instruments as of June 30, 2016. See Notes to Financial Statements for more information.
Valuation Inputs Summary
Level 1 -
Quoted Prices
Level 2 - Other Significant
Observable Inputs
Level 3 - Significant
Unobservable Inputs Assets Investments in Securities: Common Stocks $ 718,440,982 $ - $ - Investment Companies - 48,733,371 -
Total Assets $ 718,440,982 $ 48,733,371 $ -
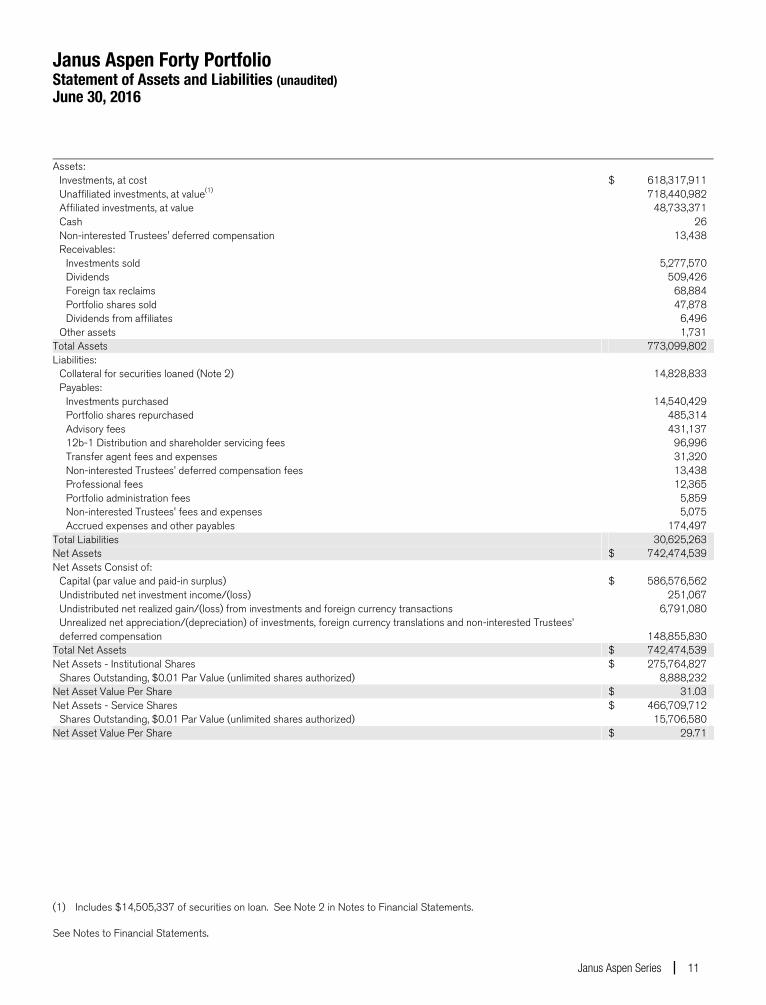
Janus Aspen Forty Portfolio Statement of Assets and Liabilities (unaudited) June 30, 2016
See Notes to Financial Statements.
Janus Aspen Series 11
Assets: Investments, at cost $ 618,317,911 Unaffiliated investments, at value(1) 718,440,982 Affiliated investments, at value 48,733,371 Cash 26 Non-interested Trustees' deferred compensation 13,438 Receivables: Investments sold 5,277,570 Dividends 509,426 Foreign tax reclaims 68,884 Portfolio shares sold 47,878 Dividends from affiliates 6,496 Other assets 1,731Total Assets 773,099,802 Liabilities: Collateral for securities loaned (Note 2) 14,828,833 Payables: — Investments purchased 14,540,429 Portfolio shares repurchased 485,314 Advisory fees 431,137 12b-1 Distribution and shareholder servicing fees 96,996 Transfer agent fees and expenses 31,320 Non-interested Trustees' deferred compensation fees 13,438 Professional fees 12,365 Portfolio administration fees 5,859 Non-interested Trustees' fees and expenses 5,075 Accrued expenses and other payables 174,497Total Liabilities 30,625,263 Net Assets $ 742,474,539 Net Assets Consist of: Capital (par value and paid-in surplus) $ 586,576,562 Undistributed net investment income/(loss) 251,067 Undistributed net realized gain/(loss) from investments and foreign currency transactions 6,791,080
Unrealized net appreciation/(depreciation) of investments, foreign currency translations and non-interested Trustees’ deferred compensation 148,855,830
Total Net Assets $ 742,474,539 Net Assets - Institutional Shares $ 275,764,827 Shares Outstanding, $0.01 Par Value (unlimited shares authorized) 8,888,232Net Asset Value Per Share $ 31.03 Net Assets - Service Shares $ 466,709,712 Shares Outstanding, $0.01 Par Value (unlimited shares authorized) 15,706,580Net Asset Value Per Share $ 29.71
(1) Includes $14,505,337 of securities on loan. See Note 2 in Notes to Financial Statements.
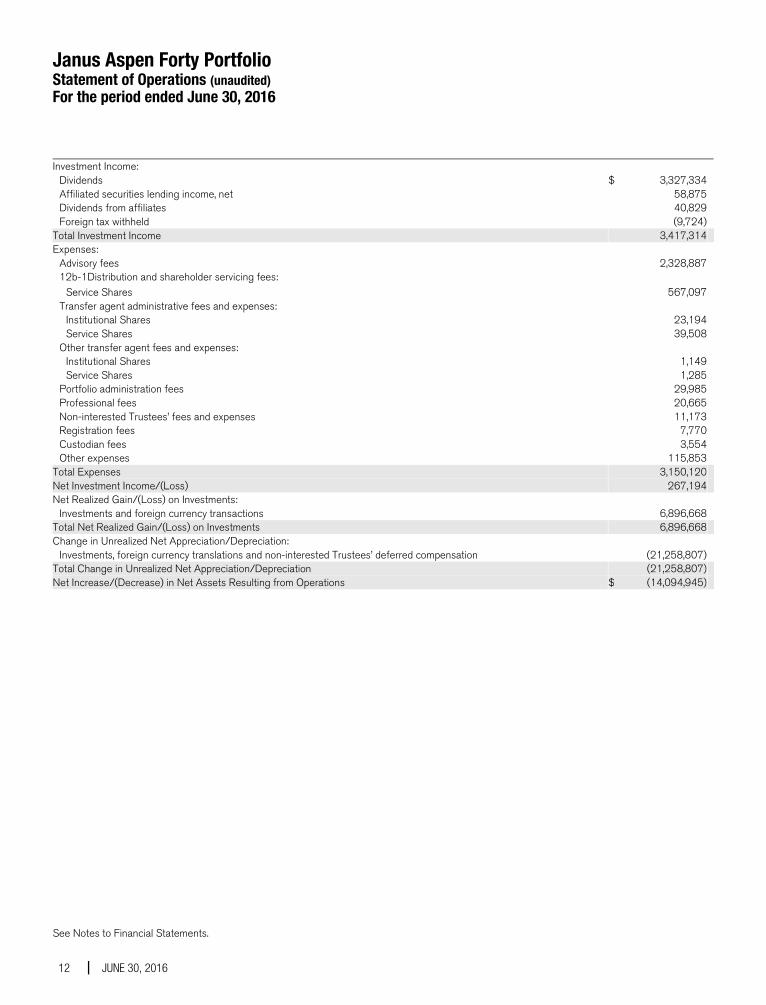
Janus Aspen Forty Portfolio Statement of Operations (unaudited) For the period ended June 30, 2016
See Notes to Financial Statements.
12 JUNE 30, 2016
Investment Income: Dividends $ 3,327,334 Affiliated securities lending income, net 58,875 Dividends from affiliates 40,829 Foreign tax withheld (9,724)Total Investment Income 3,417,314 Expenses: Advisory fees 2,328,887 12b-1Distribution and shareholder servicing fees: Service Shares 567,097 Transfer agent administrative fees and expenses: Institutional Shares 23,194 Service Shares 39,508 Other transfer agent fees and expenses: Institutional Shares 1,149 Service Shares 1,285 Portfolio administration fees 29,985 Professional fees 20,665 Non-interested Trustees’ fees and expenses 11,173 Registration fees 7,770 Custodian fees 3,554 Other expenses 115,853Total Expenses 3,150,120 Net Investment Income/(Loss) 267,194 Net Realized Gain/(Loss) on Investments: Investments and foreign currency transactions 6,896,668Total Net Realized Gain/(Loss) on Investments 6,896,668 Change in Unrealized Net Appreciation/Depreciation: Investments, foreign currency translations and non-interested Trustees’ deferred compensation (21,258,807)Total Change in Unrealized Net Appreciation/Depreciation (21,258,807) Net Increase/(Decrease) in Net Assets Resulting from Operations $ (14,094,945)
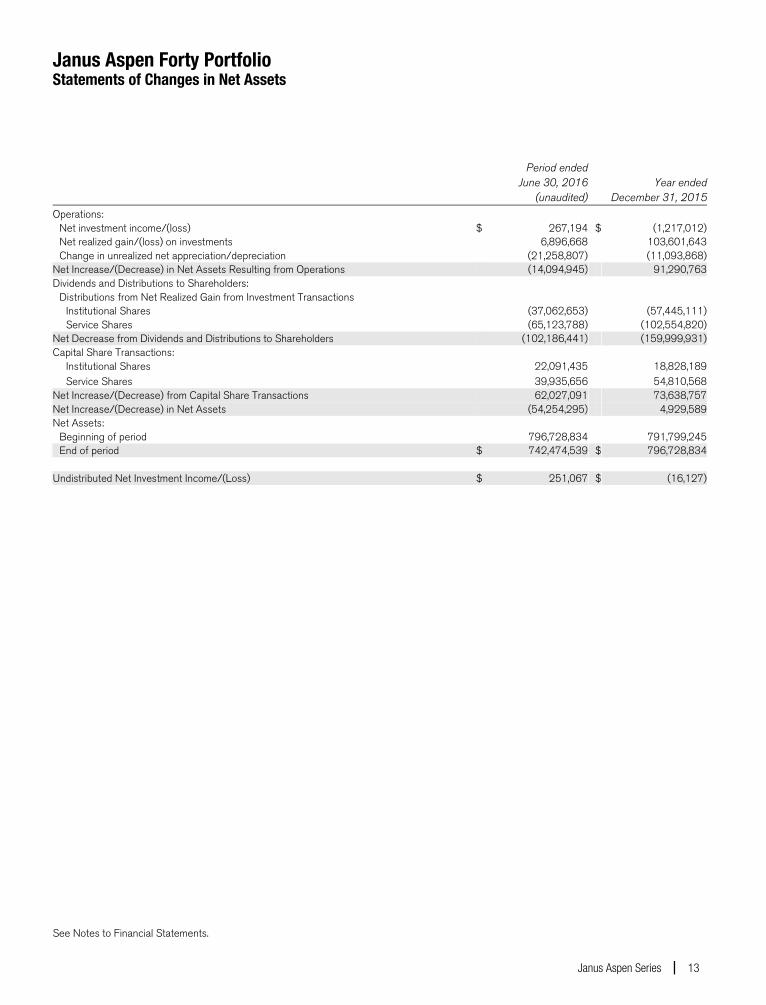
Janus Aspen Forty Portfolio Statements of Changes in Net Assets
See Notes to Financial Statements.
Janus Aspen Series 13
Period ended June 30, 2016
(unaudited) Year ended
December 31, 2015
Operations: Net investment income/(loss) $ 267,194 $ (1,217,012) Net realized gain/(loss) on investments 6,896,668 103,601,643 Change in unrealized net appreciation/depreciation (21,258,807) (11,093,868)Net Increase/(Decrease) in Net Assets Resulting from Operations (14,094,945) 91,290,763Dividends and Distributions to Shareholders: Distributions from Net Realized Gain from Investment Transactions Institutional Shares (37,062,653) (57,445,111) Service Shares (65,123,788) (102,554,820)Net Decrease from Dividends and Distributions to Shareholders (102,186,441) (159,999,931)Capital Share Transactions: Institutional Shares 22,091,435 18,828,189 Service Shares 39,935,656 54,810,568Net Increase/(Decrease) from Capital Share Transactions 62,027,091 73,638,757Net Increase/(Decrease) in Net Assets (54,254,295) 4,929,589Net Assets: Beginning of period 796,728,834 791,799,245 End of period $ 742,474,539 $ 796,728,834 Undistributed Net Investment Income/(Loss) $ 251,067 $ (16,127)
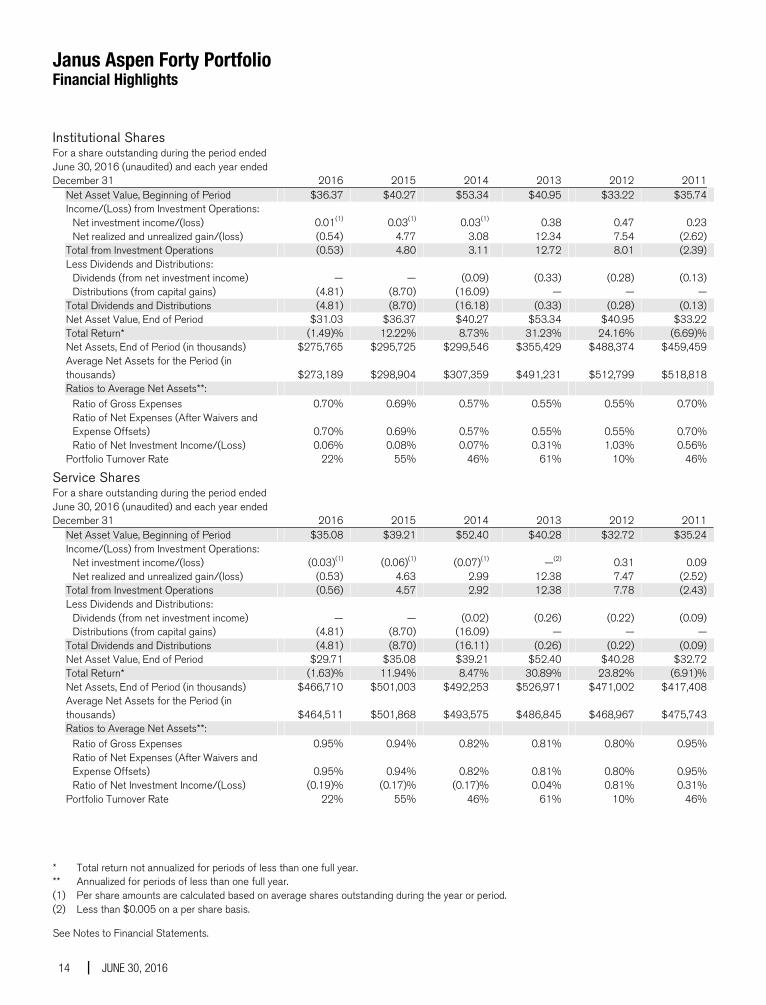
Janus Aspen Forty Portfolio Financial Highlights
See Notes to Financial Statements.
14 JUNE 30, 2016
Institutional Shares For a share outstanding during the period ended June 30, 2016 (unaudited) and each year ended December 31 2016 2015 2014 2013 2012 2011 Net Asset Value, Beginning of Period $36.37 $40.27 $53.34 $40.95 $33.22 $35.74 Income/(Loss) from Investment Operations: Net investment income/(loss) 0.01(1) 0.03(1) 0.03(1) 0.38 0.47 0.23 Net realized and unrealized gain/(loss) (0.54) 4.77 3.08 12.34 7.54 (2.62) Total from Investment Operations (0.53) 4.80 3.11 12.72 8.01 (2.39) Less Dividends and Distributions: Dividends (from net investment income) — — (0.09) (0.33) (0.28) (0.13) Distributions (from capital gains) (4.81) (8.70) (16.09) — — — Total Dividends and Distributions (4.81) (8.70) (16.18) (0.33) (0.28) (0.13) Net Asset Value, End of Period $31.03 $36.37 $40.27 $53.34 $40.95 $33.22 Total Return* (1.49)% 12.22% 8.73% 31.23% 24.16% (6.69)% Net Assets, End of Period (in thousands) $275,765 $295,725 $299,546 $355,429 $488,374 $459,459
Average Net Assets for the Period (in thousands) $273,189 $298,904 $307,359 $491,231 $512,799 $518,818
Ratios to Average Net Assets**: Ratio of Gross Expenses 0.70% 0.69% 0.57% 0.55% 0.55% 0.70%
Ratio of Net Expenses (After Waivers and Expense Offsets) 0.70% 0.69% 0.57% 0.55% 0.55% 0.70%
Ratio of Net Investment Income/(Loss) 0.06% 0.08% 0.07% 0.31% 1.03% 0.56% Portfolio Turnover Rate 22% 55% 46% 61% 10% 46% 1
Service Shares For a share outstanding during the period ended June 30, 2016 (unaudited) and each year ended December 31 2016 2015 2014 2013 2012 2011 Net Asset Value, Beginning of Period $35.08 $39.21 $52.40 $40.28 $32.72 $35.24 Income/(Loss) from Investment Operations: Net investment income/(loss) (0.03)(1) (0.06)(1) (0.07)(1) —(2) 0.31 0.09 Net realized and unrealized gain/(loss) (0.53) 4.63 2.99 12.38 7.47 (2.52) Total from Investment Operations (0.56) 4.57 2.92 12.38 7.78 (2.43) Less Dividends and Distributions: Dividends (from net investment income) — — (0.02) (0.26) (0.22) (0.09) Distributions (from capital gains) (4.81) (8.70) (16.09) — — — Total Dividends and Distributions (4.81) (8.70) (16.11) (0.26) (0.22) (0.09) Net Asset Value, End of Period $29.71 $35.08 $39.21 $52.40 $40.28 $32.72 Total Return* (1.63)% 11.94% 8.47% 30.89% 23.82% (6.91)% Net Assets, End of Period (in thousands) $466,710 $501,003 $492,253 $526,971 $471,002 $417,408
Average Net Assets for the Period (in thousands) $464,511 $501,868 $493,575 $486,845 $468,967 $475,743
Ratios to Average Net Assets**: Ratio of Gross Expenses 0.95% 0.94% 0.82% 0.81% 0.80% 0.95%
Ratio of Net Expenses (After Waivers and Expense Offsets) 0.95% 0.94% 0.82% 0.81% 0.80% 0.95%
Ratio of Net Investment Income/(Loss) (0.19)% (0.17)% (0.17)% 0.04% 0.81% 0.31% Portfolio Turnover Rate 22% 55% 46% 61% 10% 46%
* Total return not annualized for periods of less than one full year.** Annualized for periods of less than one full year. (1) Per share amounts are calculated based on average shares outstanding during the year or period. (2) Less than $0.005 on a per share basis.
Janus Aspen Forty Portfolio Notes to Financial Statements (unaudited)
Janus Aspen Series 15
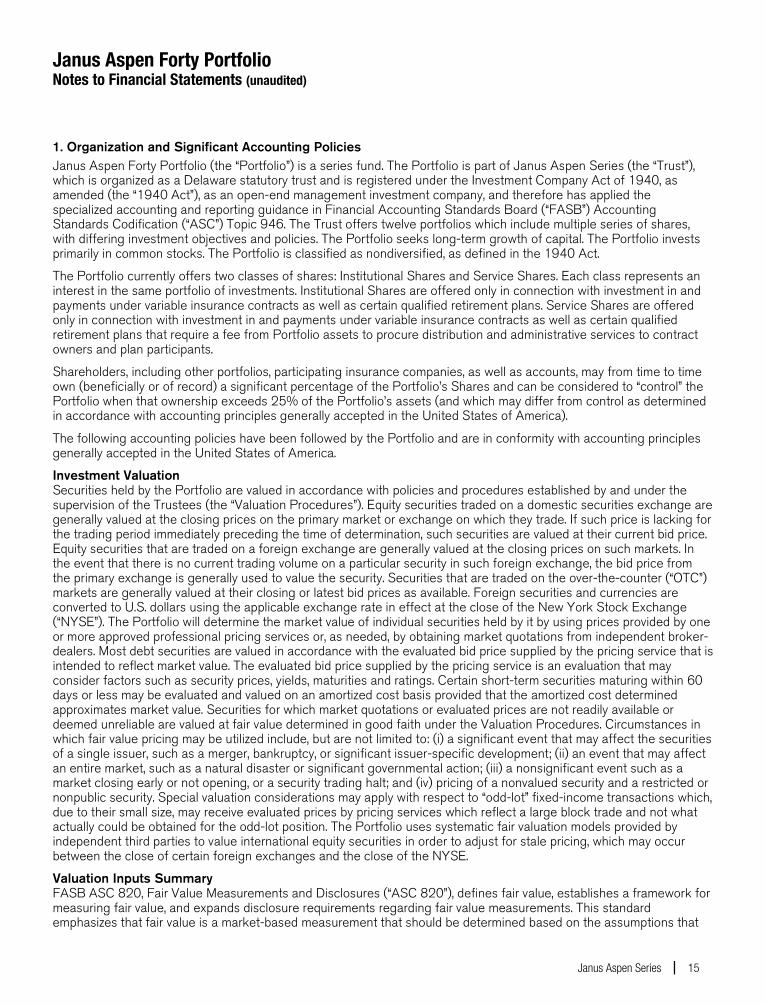
1. Organization and Significant Accounting Policies Janus Aspen Forty Portfolio (the “Portfolio”) is a series fund. The Portfolio is part of Janus Aspen Series (the “Trust”), which is organized as a Delaware statutory trust and is registered under the Investment Company Act of 1940, as amended (the “1940 Act”), as an open-end management investment company, and therefore has applied the specialized accounting and reporting guidance in Financial Accounting Standards Board (“FASB”) Accounting Standards Codification (“ASC”) Topic 946. The Trust offers twelve portfolios which include multiple series of shares, with differing investment objectives and policies. The Portfolio seeks long-term growth of capital. The Portfolio invests primarily in common stocks. The Portfolio is classified as nondiversified, as defined in the 1940 Act.
The Portfolio currently offers two classes of shares: Institutional Shares and Service Shares. Each class represents an interest in the same portfolio of investments. Institutional Shares are offered only in connection with investment in and payments under variable insurance contracts as well as certain qualified retirement plans. Service Shares are offered only in connection with investment in and payments under variable insurance contracts as well as certain qualified retirement plans that require a fee from Portfolio assets to procure distribution and administrative services to contract owners and plan participants.
Shareholders, including other portfolios, participating insurance companies, as well as accounts, may from time to time own (beneficially or of record) a significant percentage of the Portfolio’s Shares and can be considered to “control” the Portfolio when that ownership exceeds 25% of the Portfolio’s assets (and which may differ from control as determined in accordance with accounting principles generally accepted in the United States of America).
The following accounting policies have been followed by the Portfolio and are in conformity with accounting principles generally accepted in the United States of America.
Investment Valuation Securities held by the Portfolio are valued in accordance with policies and procedures established by and under the supervision of the Trustees (the “Valuation Procedures”). Equity securities traded on a domestic securities exchange are generally valued at the closing prices on the primary market or exchange on which they trade. If such price is lacking for the trading period immediately preceding the time of determination, such securities are valued at their current bid price. Equity securities that are traded on a foreign exchange are generally valued at the closing prices on such markets. In the event that there is no current trading volume on a particular security in such foreign exchange, the bid price from the primary exchange is generally used to value the security. Securities that are traded on the over-the-counter (“OTC”) markets are generally valued at their closing or latest bid prices as available. Foreign securities and currencies are converted to U.S. dollars using the applicable exchange rate in effect at the close of the New York Stock Exchange (“NYSE”). The Portfolio will determine the market value of individual securities held by it by using prices provided by one or more approved professional pricing services or, as needed, by obtaining market quotations from independent broker-dealers. Most debt securities are valued in accordance with the evaluated bid price supplied by the pricing service that is intended to reflect market value. The evaluated bid price supplied by the pricing service is an evaluation that may consider factors such as security prices, yields, maturities and ratings. Certain short-term securities maturing within 60 days or less may be evaluated and valued on an amortized cost basis provided that the amortized cost determined approximates market value. Securities for which market quotations or evaluated prices are not readily available or deemed unreliable are valued at fair value determined in good faith under the Valuation Procedures. Circumstances in which fair value pricing may be utilized include, but are not limited to: (i) a significant event that may affect the securities of a single issuer, such as a merger, bankruptcy, or significant issuer-specific development; (ii) an event that may affect an entire market, such as a natural disaster or significant governmental action; (iii) a nonsignificant event such as a market closing early or not opening, or a security trading halt; and (iv) pricing of a nonvalued security and a restricted or nonpublic security. Special valuation considerations may apply with respect to “odd-lot” fixed-income transactions which, due to their small size, may receive evaluated prices by pricing services which reflect a large block trade and not what actually could be obtained for the odd-lot position. The Portfolio uses systematic fair valuation models provided by independent third parties to value international equity securities in order to adjust for stale pricing, which may occur between the close of certain foreign exchanges and the close of the NYSE.
Valuation Inputs Summary FASB ASC 820, Fair Value Measurements and Disclosures (“ASC 820”), defines fair value, establishes a framework for measuring fair value, and expands disclosure requirements regarding fair value measurements. This standard emphasizes that fair value is a market-based measurement that should be determined based on the assumptions that
Janus Aspen Forty Portfolio Notes to Financial Statements (unaudited)
16 JUNE 30, 2016
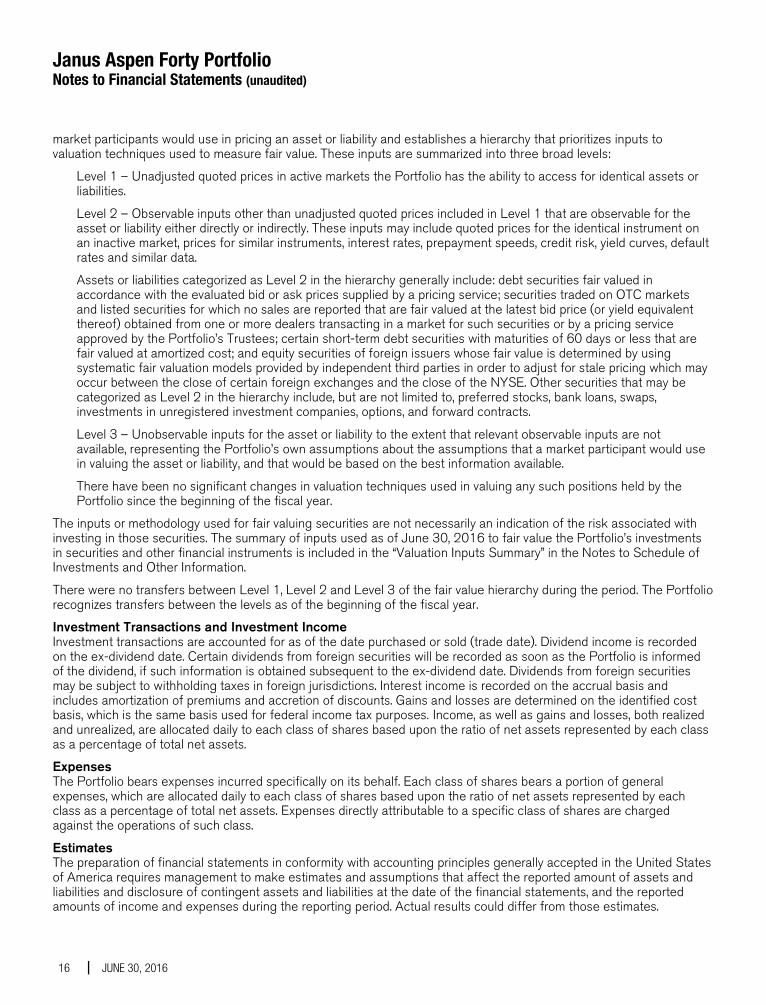
market participants would use in pricing an asset or liability and establishes a hierarchy that prioritizes inputs to valuation techniques used to measure fair value. These inputs are summarized into three broad levels:
Level 1 – Unadjusted quoted prices in active markets the Portfolio has the ability to access for identical assets or liabilities.
Level 2 – Observable inputs other than unadjusted quoted prices included in Level 1 that are observable for the asset or liability either directly or indirectly. These inputs may include quoted prices for the identical instrument on an inactive market, prices for similar instruments, interest rates, prepayment speeds, credit risk, yield curves, default rates and similar data.
Assets or liabilities categorized as Level 2 in the hierarchy generally include: debt securities fair valued in accordance with the evaluated bid or ask prices supplied by a pricing service; securities traded on OTC markets and listed securities for which no sales are reported that are fair valued at the latest bid price (or yield equivalent thereof) obtained from one or more dealers transacting in a market for such securities or by a pricing service approved by the Portfolio’s Trustees; certain short-term debt securities with maturities of 60 days or less that are fair valued at amortized cost; and equity securities of foreign issuers whose fair value is determined by using systematic fair valuation models provided by independent third parties in order to adjust for stale pricing which may occur between the close of certain foreign exchanges and the close of the NYSE. Other securities that may be categorized as Level 2 in the hierarchy include, but are not limited to, preferred stocks, bank loans, swaps, investments in unregistered investment companies, options, and forward contracts.
Level 3 – Unobservable inputs for the asset or liability to the extent that relevant observable inputs are not available, representing the Portfolio’s own assumptions about the assumptions that a market participant would use in valuing the asset or liability, and that would be based on the best information available.
There have been no significant changes in valuation techniques used in valuing any such positions held by the Portfolio since the beginning of the fiscal year.
The inputs or methodology used for fair valuing securities are not necessarily an indication of the risk associated with investing in those securities. The summary of inputs used as of June 30, 2016 to fair value the Portfolio’s investments in securities and other financial instruments is included in the “Valuation Inputs Summary” in the Notes to Schedule of Investments and Other Information.
There were no transfers between Level 1, Level 2 and Level 3 of the fair value hierarchy during the period. The Portfolio recognizes transfers between the levels as of the beginning of the fiscal year.
Investment Transactions and Investment Income Investment transactions are accounted for as of the date purchased or sold (trade date). Dividend income is recorded on the ex-dividend date. Certain dividends from foreign securities will be recorded as soon as the Portfolio is informed of the dividend, if such information is obtained subsequent to the ex-dividend date. Dividends from foreign securities may be subject to withholding taxes in foreign jurisdictions. Interest income is recorded on the accrual basis and includes amortization of premiums and accretion of discounts. Gains and losses are determined on the identified cost basis, which is the same basis used for federal income tax purposes. Income, as well as gains and losses, both realized and unrealized, are allocated daily to each class of shares based upon the ratio of net assets represented by each class as a percentage of total net assets.
Expenses The Portfolio bears expenses incurred specifically on its behalf. Each class of shares bears a portion of general expenses, which are allocated daily to each class of shares based upon the ratio of net assets represented by each class as a percentage of total net assets. Expenses directly attributable to a specific class of shares are charged against the operations of such class.
Estimates The preparation of financial statements in conformity with accounting principles generally accepted in the United States of America requires management to make estimates and assumptions that affect the reported amount of assets and liabilities and disclosure of contingent assets and liabilities at the date of the financial statements, and the reported amounts of income and expenses during the reporting period. Actual results could differ from those estimates.
Janus Aspen Forty Portfolio Notes to Financial Statements (unaudited)
Janus Aspen Series 17
Indemnifications In the normal course of business, the Portfolio may enter into contracts that contain provisions for indemnification of other parties against certain potential liabilities. The Portfolio’s maximum exposure under these arrangements is unknown, and would involve future claims that may be made against the Portfolio that have not yet occurred. Currently, the risk of material loss from such claims is considered remote.
Foreign Currency Translations The Portfolio does not isolate that portion of the results of operations resulting from the effect of changes in foreign exchange rates on investments from the fluctuations arising from changes in market prices of securities held at the date of the financial statements. Net unrealized appreciation or depreciation of investments and foreign currency translations arise from changes in the value of assets and liabilities, including investments in securities held at the date of the financial statements, resulting from changes in the exchange rates and changes in market prices of securities held.
Currency gains and losses are also calculated on payables and receivables that are denominated in foreign currencies. The payables and receivables are generally related to foreign security transactions and income translations.
Foreign currency-denominated assets and forward currency contracts may involve more risks than domestic transactions, including currency risk, counterparty risk, political and economic risk, regulatory risk and equity risk. Risks may arise from unanticipated movements in the value of foreign currencies relative to the U.S. dollar.
Dividends and Distributions The Portfolio may make semiannual distributions of substantially all of its investment income and an annual distribution of its net realized capital gains (if any).
The Portfolio may make certain investments in real estate investment trusts (“REITs”) which pay dividends to their shareholders based upon funds available from operations. It is quite common for these dividends to exceed the REITs’ taxable earnings and profits, resulting in the excess portion of such dividends being designated as a return of capital. If the Portfolio distributes such amounts, such distributions could constitute a return of capital to shareholders for federal income tax purposes.
Federal Income Taxes The Portfolio intends to continue to qualify as a regulated investment company and distribute all of its taxable income in accordance with the requirements of Subchapter M of the Internal Revenue Code. Management has analyzed the Portfolio’s tax positions taken for all open federal income tax years, generally a three-year period, and has concluded that no provision for federal income tax is required in the Portfolio’s financial statements. The Portfolio is not aware of any tax positions for which it is reasonably possible that the total amounts of unrecognized tax benefits will significantly change in the next twelve months.
2. Other Investments and Strategies
Additional Investment Risk The financial crisis in both the U.S. and global economies over the past several years has resulted, and may continue to result, in a significant decline in the value and liquidity of many securities of issuers worldwide in the equity and fixed-income/credit markets. In response to the crisis, the United States and certain foreign governments, along with the U.S. Federal Reserve and certain foreign central banks, took steps to support the financial markets. The withdrawal of this support, a failure of measures put in place to respond to the crisis, or investor perception that such efforts were not sufficient could each negatively affect financial markets generally, and the value and liquidity of specific securities. In addition, policy and legislative changes in the United States and in other countries continue to impact many aspects of financial regulation. The effect of these changes on the markets, and the practical implications for market participants, including the Portfolio, may not be fully known for some time. As a result, it may also be unusually difficult to identify both investment risks and opportunities, which could limit or preclude the Portfolio’s ability to achieve its investment objective. Therefore, it is important to understand that the value of your investment may fall, sometimes sharply, and you could lose money.
The enactment of the Dodd-Frank Wall Street Reform and Consumer Protection Act (the “Dodd-Frank Act”) provided for widespread regulation of financial institutions, consumer financial products and services, broker-dealers, OTC derivatives, investment advisers, credit rating agencies, and mortgage lending, which expanded federal oversight in the financial sector, including the investment management industry. Many provisions of the Dodd-Frank Act remain pending
Janus Aspen Forty Portfolio Notes to Financial Statements (unaudited)
18 JUNE 30, 2016
and will be implemented through future rulemaking. Therefore, the ultimate impact of the Dodd-Frank Act and the regulations under the Dodd-Frank Act on the Portfolio and the investment management industry as a whole, is not yet certain.
A number of countries in the European Union (“EU”) have experienced, and may continue to experience, severe economic and financial difficulties. In particular, many EU nations are susceptible to economic risks associated with high levels of debt, notably due to investments in sovereign debt of countries such as Greece, Italy, Spain, Portugal, and Ireland. Many non-governmental issuers, and even certain governments, have defaulted on, or been forced to restructure, their debts. Many other issuers have faced difficulties obtaining credit or refinancing existing obligations. Financial institutions have in many cases required government or central bank support, have needed to raise capital, and/or have been impaired in their ability to extend credit. As a result, financial markets in the EU experienced extreme volatility and declines in asset values and liquidity. Responses to these financial problems by European governments, central banks, and others, including austerity measures and reforms, may not work, may result in social unrest, and may limit future growth and economic recovery or have other unintended consequences. Further defaults or restructurings by governments and others of their debt could have additional adverse effects on economies, financial markets, and asset valuations around the world. Greece, Ireland, and Portugal have already received one or more "bailouts" from other Eurozone member states, and it is unclear how much additional funding they will require or if additional Eurozone member states will require bailouts in the future. The risk of investing in securities in the European markets may also be heightened due to the referendum in which the United Kingdom voted to exit the EU (known as “Brexit”). One or more other countries may also abandon the euro and/or withdraw from the EU, placing its currency and banking system in jeopardy.
Certain areas of the world have historically been prone to and economically sensitive to environmental events such as, but not limited to, hurricanes, earthquakes, typhoons, flooding, tidal waves, tsunamis, erupting volcanoes, wildfires or droughts, tornadoes, mudslides, or other weather-related phenomena. Such disasters, and the resulting physical or economic damage, could have a severe and negative impact on the Portfolio’s investment portfolio and, in the longer term, could impair the ability of issuers in which the Portfolio invests to conduct their businesses as they would under normal conditions. Adverse weather conditions may also have a particularly significant negative effect on issuers in the agricultural sector and on insurance companies that insure against the impact of natural disasters.
Counterparties Portfolio transactions involving a counterparty are subject to the risk that the counterparty or a third party will not fulfill its obligation to the Portfolio (“counterparty risk”). Counterparty risk may arise because of the counterparty’s financial condition (i.e., financial difficulties, bankruptcy, or insolvency), market activities and developments, or other reasons, whether foreseen or not. A counterparty’s inability to fulfill its obligation may result in significant financial loss to the Portfolio. The Portfolio may be unable to recover its investment from the counterparty or may obtain a limited recovery, and/or recovery may be delayed. The extent of the Portfolio’s exposure to counterparty risk with respect to financial assets and liabilities approximates its carrying value. See the "Offsetting Assets and Liabilities" section of this Note for further details.
The Portfolio may be exposed to counterparty risk through participation in various programs, including, but not limited to, lending its securities to third parties, cash sweep arrangements whereby the Portfolio’s cash balance is invested in one or more types of cash management vehicles, as well as investments in, but not limited to, repurchase agreements, debt securities, and derivatives, including various types of swaps, futures and options. The Portfolio intends to enter into financial transactions with counterparties that Janus Capital believes to be creditworthy at the time of the transaction. There is always the risk that Janus Capital’s analysis of a counterparty’s creditworthiness is incorrect or may change due to market conditions. To the extent that the Portfolio focuses its transactions with a limited number of counterparties, it will have greater exposure to the risks associated with one or more counterparties.
Offsetting Assets and Liabilities The Portfolio presents gross and net information about transactions that are either offset in the financial statements or subject to an enforceable master netting arrangement or similar agreement with a designated counterparty, regardless of whether the transactions are actually offset in the Statement of Assets and Liabilities.
In order to better define its contractual rights and to secure rights that will help the Portfolio mitigate its counterparty risk, the Portfolio has entered into an International Swaps and Derivatives Association, Inc. Master Agreement (“ISDA Master Agreement”) or similar agreement with its derivative contract counterparties. An ISDA Master Agreement is a
Janus Aspen Forty Portfolio Notes to Financial Statements (unaudited)
Janus Aspen Series 19
bilateral agreement between the Portfolio and a counterparty that governs OTC derivatives and forward foreign currency exchange contracts and typically contains, among other things, collateral posting terms and netting provisions in the event of a default and/or termination event. Under an ISDA Master Agreement, in the event of a default and/or termination event, the Portfolio may offset with each counterparty certain derivative financial instruments’ payables and/or receivables with collateral held and/or posted and create one single net payment. For financial reporting purposes, the Portfolio does not offset certain derivative financial instruments’ payables and receivables and related collateral on the Statement of Assets and Liabilities.
The following table presents gross amounts of recognized assets and/or liabilities and the net amounts after deducting collateral that has been pledged by counterparties or has been pledged to counterparties (if applicable). For corresponding information grouped by type of instrument, see the Portfolio's Schedule of Investments.
Offsetting of Financial Assets and Derivative Assets Gross Amounts of Recognized Offsetting Asset Collateral Counterparty Assets or Liability(a) Pledged(b) Net AmountDeutsche Bank AG $ 14,505,337 $ — $ (14,505,337) $ —(a) Represents the amount of assets or liabilities that could be offset with the same counterparty under master netting or similar agreements that
management elects not to offset on the Statement of Assets and Liabilities.
(b) Collateral pledged is limited to the net outstanding amount due to/from an individual counterparty. The actual collateral amounts pledged may exceed these amounts and may fluctuate in value.
Deutsche Bank AG acts as securities lending agent and a limited purpose custodian or subcustodian to receive and disburse cash balances and cash collateral, hold short-term investments, hold collateral, and perform other custodian functions. Securities on loan will be continuously secured by collateral which may consist of cash, U.S. Government securities, domestic and foreign short-term debt instruments, letters of credit, time deposits, repurchase agreements, money market mutual funds or other money market accounts, or such other collateral as permitted by the SEC. The value of the collateral must be at least 102% of the market value of the loaned securities that are denominated in U.S. dollars and 105% of the market value of the loaned securities that are not denominated in U.S. dollars. Upon receipt of cash collateral, Janus Capital intends to invest the cash collateral in a cash management vehicle for which Janus Capital serves as investment adviser, Janus Cash Collateral Fund LLC. Loaned securities and related collateral are marked-to-market each business day based upon the market value of the loaned securities at the close of business, employing the most recent available pricing information. Collateral levels are then adjusted based on this mark-to-market evaluation.
Real Estate Investing The Portfolio may invest in equity and debt securities of real estate-related companies. Such companies may include those in the real estate industry or real estate-related industries. These securities may include common stocks, corporate bonds, preferred stocks, and other equity securities, including, but not limited to, mortgage-backed securities, real estate-backed securities, securities of REITs and similar REIT-like entities. A REIT is a trust that invests in real estate-related projects, such as properties, mortgage loans, and construction loans. REITs are generally categorized as equity, mortgage, or hybrid REITs. A REIT may be listed on an exchange or traded OTC.
Securities Lending Under procedures adopted by the Trustees, the Portfolio may seek to earn additional income by lending securities to qualified parties. Deutsche Bank AG acts as securities lending agent and a limited purpose custodian or subcustodian to receive and disburse cash balances and cash collateral, hold short-term investments, hold collateral, and perform other custodian functions. The Portfolio may lend portfolio securities in an amount equal to up to 1/3 of its total assets as determined at the time of the loan origination. There is the risk of delay in recovering a loaned security or the risk of loss in collateral rights if the borrower fails financially. In addition, Janus Capital makes efforts to balance the benefits and risks from granting such loans. All loans will be continuously secured by collateral which may consist of cash, U.S. Government securities, domestic and foreign short-term debt instruments, letters of credit, time deposits, repurchase agreements, money market mutual funds or other money market accounts, or such other collateral as permitted by the
Janus Aspen Forty Portfolio Notes to Financial Statements (unaudited)
20 JUNE 30, 2016
SEC. If the Portfolio is unable to recover a security on loan, the Portfolio may use the collateral to purchase replacement securities in the market. There is a risk that the value of the collateral could decrease below the cost of the replacement security by the time the replacement investment is made, resulting in a loss to the Portfolio.
Upon receipt of cash collateral, Janus Capital may invest it in affiliated or non-affiliated cash management vehicles, whether registered or unregistered entities, as permitted by the 1940 Act and rules promulgated thereunder. Janus Capital currently intends to invest the cash collateral in a cash management vehicle for which Janus Capital serves as investment adviser, Janus Cash Collateral Fund LLC. An investment in Janus Cash Collateral Fund LLC is generally subject to the same risks that shareholders experience when investing in similarly structured vehicles, such as the potential for significant fluctuations in assets as a result of the purchase and redemption activity of the securities lending program, a decline in the value of the collateral, and possible liquidity issues. Such risks may delay the return of the cash collateral and cause the Portfolio to violate its agreement to return the cash collateral to a borrower in a timely manner. As adviser to the Portfolio and Janus Cash Collateral Fund LLC, Janus Capital has an inherent conflict of interest as a result of its fiduciary duties to both the Portfolio and Janus Cash Collateral Fund LLC. Additionally, Janus Capital receives an investment advisory fee of 0.05% for managing Janus Cash Collateral Fund LLC, but it may not receive a fee for managing certain other affiliated cash management vehicles in which the Portfolio may invest, and therefore may have an incentive to allocate preferred investment opportunities to investment vehicles for which it is receiving a fee.
The value of the collateral must be at least 102% of the market value of the loaned securities that are denominated in U.S. dollars and 105% of the market value of the loaned securities that are not denominated in U.S. dollars. Loaned securities and related collateral are marked-to-market each business day based upon the market value of the loaned securities at the close of business, employing the most recent available pricing information. Collateral levels are then adjusted based on this mark-to-market evaluation.
The cash collateral invested by Janus Capital is disclosed in the Schedule of Investments. Income earned from the investment of the cash collateral, net of rebates paid to, or fees paid by, borrowers and less the fees paid to the lending agent are included as “Affiliated securities lending income, net” on the Statement of Operations. As of June 30, 2016, securities lending transactions accounted for as secured borrowings with an overnight and continuous contractual maturity are $14,505,337. Gross amounts of recognized liabilities for securities lending (collateral received) as of June 30, 2016 is $14,828,833, resulting in the net amount due to the counterparty of $323,496.
3. Investment Advisory Agreements and Other Transactions with Affiliates The Portfolio pays Janus Capital an investment advisory fee which is calculated daily and paid monthly. The Portfolio’s base fee rate prior to any performance adjustment (expressed as an annual rate) is 0.64%.
The investment advisory fee rate is determined by calculating a base fee and applying a performance adjustment. The base fee rate is the same as the contractual investment advisory fee rate. The performance adjustment either increases or decreases the base fee depending on how well the Portfolio has performed relative to its benchmark index. The Portfolio's benchmark index used in the calculation is the Russell 1000® Growth Index.
The calculation of the performance adjustment applies as follows:
Investment Advisory Fee = Base Fee Rate +/- Performance Adjustment
The investment advisory fee rate paid to Janus Capital by the Portfolio consists of two components: (1) a base fee calculated by applying the contractual fixed rate of the advisory fee to the Portfolio’s average daily net assets during the previous month (“Base Fee Rate”), plus or minus (2) a performance-fee adjustment (“Performance Adjustment”) calculated by applying a variable rate of up to 0.15% (positive or negative) to the Portfolio’s average daily net assets during the applicable performance measurement period, which is generally the previous 36 months.
The Portfolio’s prospectuses and statement(s) of additional information contain additional information about performance-based fees. The amount shown as advisory fees on the Statement of Operations reflects the Base Fee Rate plus/minus any Performance Adjustment. For the period ended June 30, 2016, the performance adjusted investment advisory fee rate before any waivers and/or reimbursements of expenses is 0.65%.
Janus Services LLC (“Janus Services”), a wholly-owned subsidiary of Janus Capital, is the Portfolio’s transfer agent. Effective May 1, 2016, Janus Services receives an administrative services fee at an annual rate of 0.05% of the average daily net assets of the Portfolio for arranging for the provision by participating insurance companies and
Janus Aspen Forty Portfolio Notes to Financial Statements (unaudited)
Janus Aspen Series 21
qualified plan service providers of administrative services, including recordkeeping, subaccounting, order processing, or other shareholder services provided on behalf of contract holders or plan participants investing in the Portfolio. Other shareholder services may include the provision of order confirmations, periodic account statements, forwarding prospectuses, shareholder reports, and other materials to existing investors, and answering inquiries regarding accounts. Janus Services expects to use this entire fee to compensate insurance companies and qualified plan service providers for providing these services to their customers who invest in the Portfolio. Any unused portion will be reimbursed to the applicable share class at least annually.
In addition, Janus Services provides or arranges for the provision of certain other internal administrative, recordkeeping, and shareholder relations services for the Portfolio. Janus Services is not compensated for these internal services related to the shares, except for out-of-pocket costs. These amounts are disclosed as “Other transfer agent fees and expenses” on the Statement of Operations.
Under a distribution and shareholder servicing plan (the “Plan”) adopted in accordance with Rule 12b-1 under the 1940 Act, the Service Shares may pay the Trust’s distributor, Janus Distributors LLC (“Janus Distributors”), a wholly-owned subsidiary of Janus Capital, a fee for the sale and distribution and/or shareholder servicing of the Service Shares at an annual rate of up to 0.25% of the average daily net assets of the Service Shares. Under the terms of the Plan, the Trust is authorized to make payments to Janus Distributors for remittance to insurance companies and qualified plan service providers as compensation for distribution and/or shareholder services performed by such entities. These amounts are disclosed as “12b-1 Distribution and shareholder servicing fees” on the Statement of Operations. Payments under the Plan are not tied exclusively to actual 12b-1 distribution and servicing fees, and the payments may exceed 12b-1 distribution and servicing fees actually incurred. If any of the Portfolio’s actual 12b-1 distribution and servicing fees incurred during a calendar year are less than the payments made during a calendar year, the Portfolio will be refunded the difference. Refunds, if any, are included in “12b-1 Distribution fees and shareholder servicing fees” in the Statement of Operations.
Janus Capital furnishes certain administration, compliance, and accounting services for the Portfolio and is reimbursed by the Portfolio for certain of its costs in providing those services (to the extent Janus Capital seeks reimbursement and such costs are not otherwise waived). In addition, employees of Janus Capital and/or its affiliates may serve as officers of the Trust. The Portfolio also pays for salaries, fees, and expenses of certain Janus Capital employees and Portfolio officers, with respect to certain specified administration functions they perform on behalf of the Portfolio. The Portfolio pays these costs based on out-of-pocket expenses incurred by Janus Capital, and these costs are separate and apart from advisory fees and other expenses paid in connection with the investment advisory services Janus Capital provides to the Portfolio. These amounts are disclosed as “Portfolio administration fees” on the Statement of Operations. Some expenses related to compensation payable to the Portfolio's Chief Compliance Officer and compliance staff are shared with the Portfolio. Total compensation of $28,304 was paid to the Chief Compliance Officer and certain compliance staff by the Trust during the period ended June 30, 2016. The Portfolio's portion is reported as part of “Other expenses” on the Statement of Operations.
The Board of Trustees has adopted a deferred compensation plan (the “Deferred Plan”) for independent Trustees to elect to defer receipt of all or a portion of the annual compensation they are entitled to receive from the Portfolio. All deferred fees are credited to an account established in the name of the Trustees. The amounts credited to the account then increase or decrease, as the case may be, in accordance with the performance of one or more of the Janus funds that are selected by the Trustees. The account balance continues to fluctuate in accordance with the performance of the selected fund or funds until final payment of all amounts are credited to the account. The fluctuation of the account balance is recorded by the Portfolio as unrealized appreciation/(depreciation) and is included as of June 30, 2016 on the Statement of Assets and Liabilities in the asset, “Non-interested Trustees’ deferred compensation,” and liability, “Non-interested Trustees’ deferred compensation fees.” Additionally, the recorded unrealized appreciation/(depreciation) is included in “Unrealized net appreciation/(depreciation) of investments, foreign currency translations and non-interested Trustees’ deferred compensation” on the Statement of Assets and Liabilities. Deferred compensation expenses for the period ended June 30, 2016 are included in “Non-interested Trustees’ fees and expenses” on the Statement of Operations. Trustees are allowed to change their designation of mutual funds from time to time. Amounts will be deferred until distributed in accordance with the Deferred Plan. Deferred fees of $20,150 were paid by the Trust to a Trustee under the Deferred Plan during the period ended June 30, 2016.
Pursuant to the provisions of the 1940 Act and related rules, the Portfolio may participate in an affiliated or nonaffiliated cash sweep program. In the cash sweep program, uninvested cash balances of the Portfolio may be used
Janus Aspen Forty Portfolio Notes to Financial Statements (unaudited)
22 JUNE 30, 2016
to purchase shares of affiliated or nonaffiliated money market funds or cash management pooled investment vehicles. The Portfolio is eligible to participate in the cash sweep program (the “Investing Funds”). As adviser, Janus Capital has an inherent conflict of interest because of its fiduciary duties to the affiliated money market funds or cash management pooled investment vehicles and the Investing Funds. Janus Cash Liquidity Fund LLC is an affiliated unregistered cash management pooled investment vehicle that invests primarily in highly-rated short-term fixed-income securities. Janus Cash Liquidity Fund LLC currently maintains a NAV of $1.00 per share and distributes income daily in a manner consistent with a registered product compliant with Rule 2a-7 under the 1940 Act. There are no restrictions on the Portfolio's ability to withdraw investments from Janus Cash Liquidity Fund LLC at will, and there are no unfunded capital commitments due from the Portfolio to Janus Cash Liquidity Fund LLC. The units of Janus Cash Liquidity Fund LLC are not charged any management fee, sales charge or service fee.
Any purchases and sales, realized gains/losses and recorded dividends from affiliated investments during the period ended June 30, 2016 can be found in a table located in the Notes to Schedule of Investments and Other Information.
The Portfolio is permitted to purchase or sell securities (“cross-trade”) between itself and other funds or accounts managed by Janus Capital Management LLC in accordance with Rule 17a-7 under the Investment Company Act of 1940 (“Rule 17a-7”), when the transaction is consistent with the investment objectives and policies of the Portfolio and in accordance with the Internal Cross Trade Procedures adopted by the Trust’s Board of Trustees. These procedures have been designed to ensure that any cross-trade of securities by the Portfolio from or to another fund or account that is or could be considered an affiliate of the Portfolio under certain limited circumstances by virtue of having a common investment adviser, common Officer, or common Trustee complies with Rule 17a-7. Under these procedures, each cross-trade is effected at the current market price to save costs where allowed. During the period ended June 30, 2016, the Portfolio engaged in cross trades amounting to $570,095 in purchases and $1,835,025 in sales, resulting in a net realized loss of $15,382. The net realized loss is included in “Investments and foreign currency transactions” within the “Net Realized and Unrealized Gain/(Loss) on Investments” section of the Portfolio’s Statement of Operations.
4. Federal Income Tax Income and capital gains distributions are determined in accordance with income tax regulations that may differ from accounting principles generally accepted in the United States of America. These differences are due to differing treatments for items such as net short-term gains, deferral of wash sale losses, foreign currency transactions, net investment losses, and capital loss carryovers.
The Portfolio has elected to treat gains and losses on forward foreign currency contracts as capital gains and losses, if applicable. Other foreign currency gains and losses on debt instruments are treated as ordinary income for federal income tax purposes pursuant to Section 988 of the Internal Revenue Code.
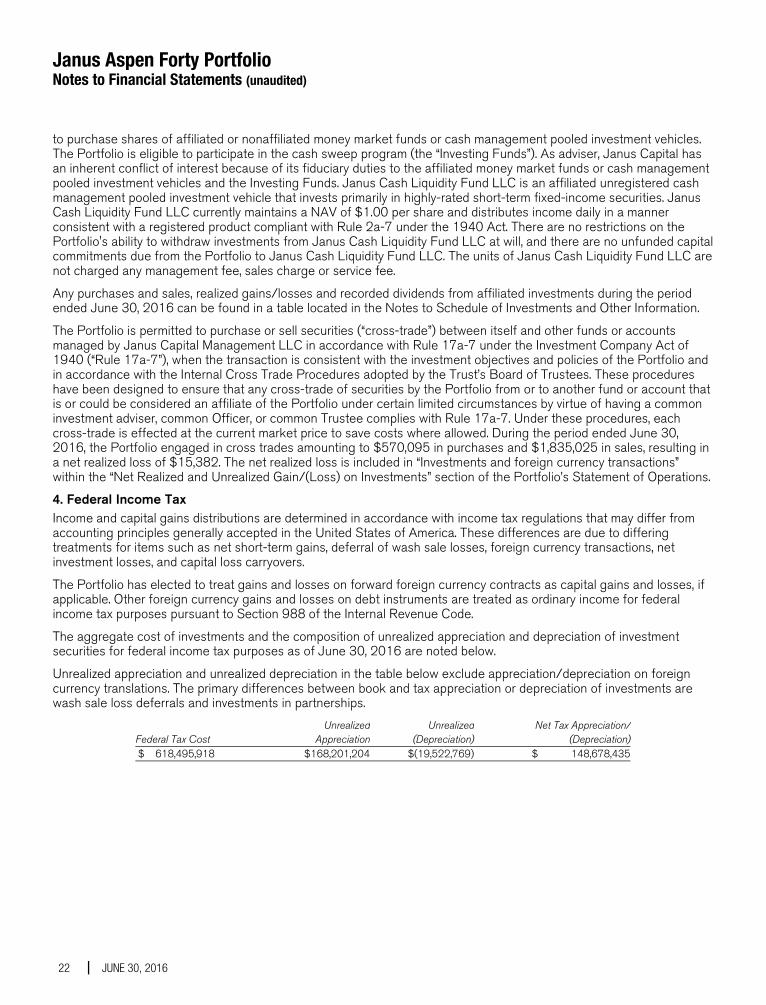
The aggregate cost of investments and the composition of unrealized appreciation and depreciation of investment securities for federal income tax purposes as of June 30, 2016 are noted below.
Unrealized appreciation and unrealized depreciation in the table below exclude appreciation/depreciation on foreign currency translations. The primary differences between book and tax appreciation or depreciation of investments are wash sale loss deferrals and investments in partnerships.
Federal Tax Cost Unrealized
AppreciationUnrealized
(Depreciation)Net Tax Appreciation/
(Depreciation) $ 618,495,918 $168,201,204 $(19,522,769) $ 148,678,435
Janus Aspen Forty Portfolio Notes to Financial Statements (unaudited)
Janus Aspen Series 23
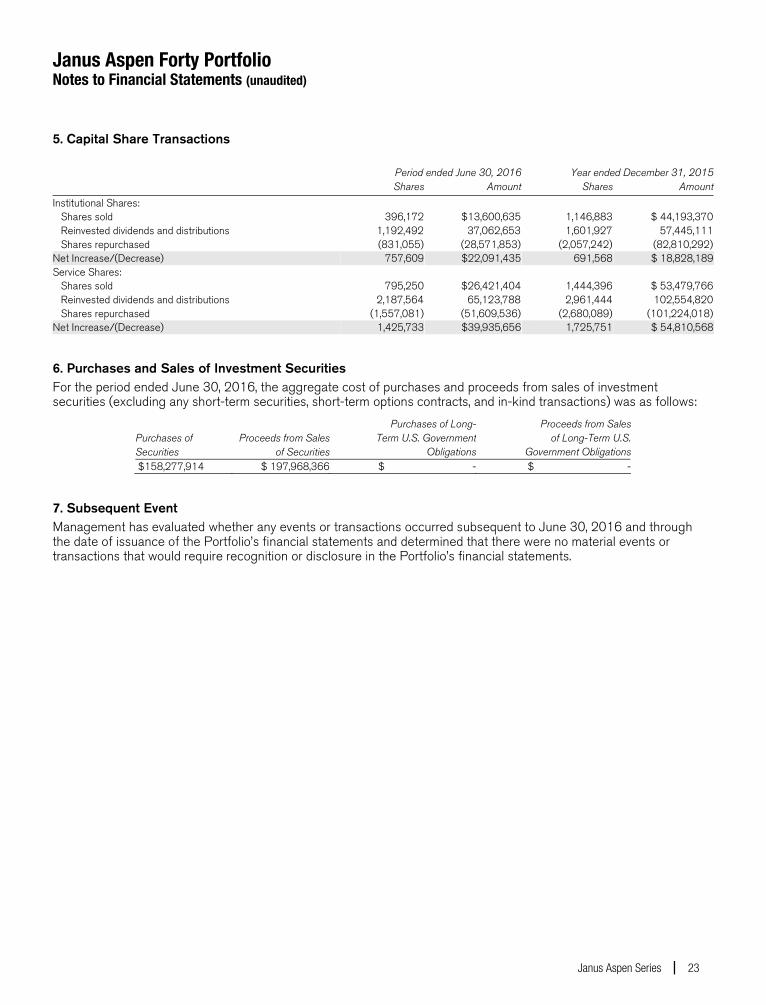
5. Capital Share Transactions Period ended June 30, 2016 Year ended December 31, 2015 Shares Amount Shares Amount
Institutional Shares: Shares sold 396,172 $13,600,635 1,146,883 $ 44,193,370 Reinvested dividends and distributions 1,192,492 37,062,653 1,601,927 57,445,111 Shares repurchased (831,055) (28,571,853) (2,057,242) (82,810,292)Net Increase/(Decrease) 757,609 $22,091,435 691,568 $ 18,828,189 Service Shares: Shares sold 795,250 $26,421,404 1,444,396 $ 53,479,766 Reinvested dividends and distributions 2,187,564 65,123,788 2,961,444 102,554,820 Shares repurchased (1,557,081) (51,609,536) (2,680,089) (101,224,018)Net Increase/(Decrease) 1,425,733 $39,935,656 1,725,751 $ 54,810,568
6. Purchases and Sales of Investment Securities For the period ended June 30, 2016, the aggregate cost of purchases and proceeds from sales of investment securities (excluding any short-term securities, short-term options contracts, and in-kind transactions) was as follows:
Purchases of Securities
Proceeds from Salesof Securities
Purchases of Long-Term U.S. Government
Obligations
Proceeds from Sales of Long-Term U.S.
Government Obligations $158,277,914 $ 197,968,366 $ - $ -
7. Subsequent Event Management has evaluated whether any events or transactions occurred subsequent to June 30, 2016 and through the date of issuance of the Portfolio’s financial statements and determined that there were no material events or transactions that would require recognition or disclosure in the Portfolio’s financial statements.

Janus Aspen Forty Portfolio Additional Information (unaudited)
24 JUNE 30, 2016
Proxy Voting Policies and Voting Record A description of the policies and procedures that the Portfolio uses to determine how to vote proxies relating to its portfolio securities is available without charge: (i) upon request, by calling 1-800-525-0020 (toll free); (ii) on the Portfolio’s website at janus.com/proxyvoting; and (iii) on the SEC’s website at http://www.sec.gov. Additionally, information regarding the Portfolio’s proxy voting record for the most recent twelve-month period ended June 30 is also available, free of charge, through janus.com/proxyvoting and from the SEC’s website at http://www.sec.gov.
Quarterly Portfolio Holdings The Portfolio files its complete portfolio holdings (schedule of investments) with the SEC for the first and third quarters of each fiscal year on Form N-Q within 60 days of the end of such fiscal quarter. The Portfolio’s Form N-Q: (i) is available on the SEC’s website at http://www.sec.gov; (ii) may be reviewed and copied at the SEC’s Public Reference Room in Washington, D.C. (information on the Public Reference Room may be obtained by calling 1-800-SEC-0330); and (iii) is available without charge, upon request, by calling Janus at 1-800-525-0020 (toll free).
APPROVAL OF ADVISORY AGREEMENTS DURING THE PERIOD The Trustees of Janus Investment Fund and Janus Aspen Series, each of whom serves as an “independent” Trustee (the “Trustees”), oversee the management of each Fund of Janus Investment Fund and each Portfolio of Janus Aspen Series (each, a “Fund” and collectively, the “Funds”), and as required by law, determine annually whether to continue the investment advisory agreement for each Fund and the subadvisory agreements for the 16 Funds that utilize subadvisers.
In connection with their most recent consideration of those agreements for each Fund, the Trustees received and reviewed information provided by Janus Capital and the respective subadvisers in response to requests of the Trustees and their independent legal counsel. They also received and reviewed information and analysis provided by, and in response to requests of, their independent fee consultant. Throughout their consideration of the agreements, the Trustees were advised by their independent legal counsel. The Trustees met with management to consider the agreements, and also met separately in executive session with their independent legal counsel and their independent fee consultant.
At a meeting held on December 9, 2015, based on the Trustees’ evaluation of the information provided by Janus Capital, the subadvisers, and the independent fee consultant, as well as other information, the Trustees determined that the overall arrangements between each Fund and Janus Capital and each subadviser, as applicable, were fair and reasonable in light of the nature, extent and quality of the services provided by Janus Capital, its affiliates and the subadvisers, the fees charged for those services, and other matters that the Trustees considered relevant in the exercise of their business judgment. At that meeting, the Trustees unanimously approved the continuation of the investment advisory agreement for each Fund, and the subadvisory agreement for each subadvised Fund, for the period from either January 1 or February 1, 2016 through January 1 or February 1, 2017, respectively, subject to earlier termination as provided for in each agreement.
In considering the continuation of those agreements, the Trustees reviewed and analyzed various factors that they determined were relevant, including the factors described below, none of which by itself was considered dispositive. However, the material factors and conclusions that formed the basis for the Trustees’ determination to approve the continuation of the agreements are discussed separately below. Also included is a summary of the independent fee consultant’s conclusions and opinions that arose during, and were included as part of, the Trustees’ consideration of the agreements. “Management fees,” as used herein, reflect actual annual advisory fees and any administration fees (excluding out of pocket costs), net of any waivers.
Nature, Extent and Quality of Services The Trustees reviewed the nature, extent and quality of the services provided by Janus Capital and the subadvisers to the Funds, taking into account the investment objective, strategies and policies of each Fund, and the knowledge the Trustees gained from their regular meetings with management on at least a quarterly basis and their ongoing review of information related to the Funds. In addition, the Trustees reviewed the resources and key personnel of Janus Capital and each subadviser, particularly noting those employees who provide investment and risk management services to the Funds. The Trustees also considered other services provided to the Funds by Janus Capital or the subadvisers, such as managing the execution of portfolio transactions and the selection of broker-dealers for those transactions. The Trustees considered Janus Capital’s role as administrator to the Funds, noting that Janus Capital does not receive a fee
Janus Aspen Forty Portfolio Additional Information (unaudited)
Janus Aspen Series 25
for its services but is reimbursed for its out-of-pocket costs. The Trustees considered the role of Janus Capital in monitoring adherence to the Funds’ investment restrictions, providing support services for the Trustees and Trustee committees, and overseeing communications with shareholders and the activities of other service providers, including monitoring compliance with various policies and procedures of the Funds and with applicable securities laws and regulations.
In this regard, the independent fee consultant noted that Janus Capital provides a number of different services for the Funds and Fund shareholders, ranging from investment management services to various other servicing functions, and that, in its opinion, Janus Capital is a capable provider of those services. The independent fee consultant also provided its belief that Janus Capital has developed a number of institutional competitive advantages that should enable it to provide superior investment and service performance over the long term.
The Trustees concluded that the nature, extent and quality of the services provided by Janus Capital or the subadviser to each Fund were appropriate and consistent with the terms of the respective advisory and subadvisory agreements, and that, taking into account steps taken to address those Funds whose performance lagged that of their peers for certain periods, the Funds were likely to benefit from the continued provision of those services. They also concluded that Janus Capital and each subadviser had sufficient personnel, with the appropriate education and experience, to serve the Funds effectively and had demonstrated its ability to attract well-qualified personnel.
Performance of the Funds The Trustees considered the performance results of each Fund over various time periods. They noted that they considered Fund performance data throughout the year, including periodic meetings with each Fund’s portfolio manager(s), and also reviewed information comparing each Fund’s performance with the performance of comparable funds and peer groups identified by Broadridge Financial Solutions, Inc. (“Broadridge”), an independent data provider, and with the Fund’s benchmark index. In this regard, the independent fee consultant found that the overall Funds’ performance has been strong: for the 36 months ended September 30, 2015, approximately 70% of the Funds were in the top two Broadridge quartiles of performance, and for the 12 months ended September 30, 2015, approximately 61% of the Funds were in the top two Broadridge quartiles of performance.
The Trustees considered the performance of each Fund, noting that performance may vary by share class, and noted the following:
Fixed-Income Funds and Money Market Funds • For Janus Flexible Bond Fund, the Trustees noted that the Fund’s performance was in the third Broadridge
quartile for the 36 months ended May 31, 2015 and the third Broadridge quartile for the 12 months ended May 31, 2015. The Trustees noted the reasons for the Fund’s underperformance and the steps Janus Capital had taken or was taking to improve performance.
• For Janus Global Bond Fund, the Trustees noted that the Fund’s performance was in the second Broadridge quartile for the 36 months ended May 31, 2015 and the second Broadridge quartile for the 12 months ended May 31, 2015.
• For Janus Global Unconstrained Bond Fund, the Trustees noted that the Fund’s performance was in the bottom Broadridge quartile for the 12 months ended May 31, 2015. The Trustees noted the reasons for the Fund’s underperformance, the steps Janus Capital had taken or was taking to improve performance, and its limited performance history.
• For Janus High-Yield Fund, the Trustees noted that the Fund’s performance was in the third Broadridge quartile for the 36 months ended May 31, 2015 and the third Broadridge quartile for the 12 months ended May 31, 2015. The Trustees noted the reasons for the Fund’s underperformance and the steps Janus Capital had taken or was taking to improve performance.
• For Janus Multi-Sector Income Fund, the Trustees noted that the Fund’s performance was in the first Broadridge quartile for the 12 months ended May 31, 2015.
• For Janus Real Return Fund, the Trustees noted that the Fund’s performance was in the first Broadridge quartile for the 36 months ended May 31, 2015 and the first Broadridge quartile for the 12 months ended May 31, 2015.
Janus Aspen Forty Portfolio Additional Information (unaudited)
26 JUNE 30, 2016
• For Janus Short-Term Bond Fund, the Trustees noted that the Fund’s performance was in the second Broadridge quartile for the 36 months ended May 31, 2015 and the third Broadridge quartile for the 12 months ended May 31, 2015.
• For Janus Government Money Market Fund, the Trustees noted that the Fund’s performance was in the third Broadridge quartile for the 36 months ended May 31, 2015 and the third Broadridge quartile for the 12 months ended May 31, 2015. The Trustees noted the reasons for the Fund’s underperformance.
• For Janus Money Market Fund, the Trustees noted that the Fund’s performance was in the third Broadridge quartile for the 36 months ended May 31, 2015 and the bottom Broadridge quartile for the 12 months ended May 31, 2015. The Trustees noted the reasons for the Fund’s underperformance.
Asset Allocation Funds • For Janus Global Allocation Fund – Conservative, the Trustees noted that the Fund’s performance was in the
first Broadridge quartile for the 36 months ended May 31, 2015 and the third Broadridge quartile for the 12 months ended May 31, 2015.
• For Janus Global Allocation Fund – Growth, the Trustees noted that the Fund’s performance was in the third Broadridge quartile for the 36 months ended May 31, 2015 and the bottom Broadridge quartile for the 12 months ended May 31, 2015. The Trustees noted the reasons for the Fund’s underperformance and the steps Janus Capital had taken or was taking to improve performance.
• For Janus Global Allocation Fund – Moderate, the Trustees noted that the Fund’s performance was in the second Broadridge quartile for the 36 months ended May 31, 2015 and the third Broadridge quartile for the 12 months ended May 31, 2015.
Alternative Fund • For Janus Diversified Alternatives Fund, the Trustees noted that the Fund’s performance was in the second
Broadridge quartile for the 12 months ended May 31, 2015.
Value Funds • For Perkins International Value Fund, the Trustees noted that the Fund’s performance was in the second
Broadridge quartile for the 12 months ended May 31, 2015.
• For Perkins Global Value Fund, the Trustees noted that the Fund’s performance was in the third Broadridge quartile for the 36 months ended May 31, 2015 and the third Broadridge quartile for the 12 months ended May 31, 2015. The Trustees noted the reasons for the Fund’s underperformance, noting that the Fund has a performance fee structure that results in lower management fees during periods of underperformance, and the steps Janus Capital and Perkins had taken or were taking to improve performance.
• For Perkins Large Cap Value Fund, the Trustees noted that the Fund’s performance was in the bottom Broadridge quartile for the 36 months ended May 31, 2015 and the bottom Broadridge quartile for the 12 months ended May 31, 2015. The Trustees noted the reasons for the Fund’s underperformance, noting that the Fund has a performance fee structure that results in lower management fees during periods of underperformance, and the steps Janus Capital and Perkins had taken or were taking to improve performance.
• For Perkins Mid Cap Value Fund, the Trustees noted that the Fund’s performance was in the bottom Broadridge quartile for the 36 months ended May 31, 2015 and the bottom Broadridge quartile for the 12 months ended May 31, 2015. The Trustees noted the reasons for the Fund’s underperformance, noting that the Fund has a performance fee structure that results in lower management fees during periods of underperformance, and the steps Janus Capital and Perkins had taken or were taking to improve performance.
• For Perkins Select Value Fund, the Trustees noted that the Fund’s performance was in the bottom Broadridge quartile for the 36 months ended May 31, 2015 and the second Broadridge quartile for the 12 months ended May 31, 2015. The Trustees noted the reasons for the Fund’s underperformance, noting that the Fund has a performance fee structure that results in lower management fees during periods of underperformance, the steps Janus Capital and Perkins had taken or were taking to improve performance, and that the performance trend was improving.

Janus Aspen Forty Portfolio Additional Information (unaudited)
Janus Aspen Series 27
• For Perkins Small Cap Value Fund, the Trustees noted that the Fund’s performance was in the bottom Broadridge quartile for the 36 months ended May 31, 2015 and the second Broadridge quartile for the 12 months ended May 31, 2015. The Trustees noted the reasons for the Fund’s underperformance, noting that the Fund has a performance fee structure that results in lower management fees during periods of underperformance, the steps Janus Capital and Perkins had taken or were taking to improve performance, and that the performance trend was improving.
• For Perkins Value Plus Income Fund, the Trustees noted that the Fund’s performance was in the second Broadridge quartile for the 36 months ended May 31, 2015 and the second Broadridge quartile for the 12 months ended May 31, 2015.
Mathematical Funds • For INTECH Emerging Markets Managed Volatility Fund, the Trustees noted that, due to limited performance
for the Fund, performance history was not a material factor.
• For INTECH Global Income Managed Volatility Fund, the Trustees noted that the Fund’s performance was in the first Broadridge quartile for the 36 months ended May 31, 2015 and the third Broadridge quartile for the 12 months ended May 31, 2015.
• For INTECH International Managed Volatility Fund, the Trustees noted that the Fund’s performance was in the bottom Broadridge quartile for the 36 months ended May 31, 2015 and the bottom Broadridge quartile for the 12 months ended May 31, 2015. The Trustees noted the reasons for the Fund’s underperformance and the steps Janus Capital and INTECH had taken or were taking to improve performance.
• For INTECH U.S. Core Fund, the Trustees noted that the Fund’s performance was in the second Broadridge quartile for the 36 months ended May 31, 2015 and the second Broadridge quartile for the 12 months ended May 31, 2015.
• For INTECH U.S. Managed Volatility Fund, the Trustees noted that the Fund’s performance was in the second Broadridge quartile for the 36 months ended May 31, 2015 and the third Broadridge quartile for the 12 months ended May 31, 2015.
Growth and Core Funds • For Janus Balanced Fund, the Trustees noted that the Fund’s performance was in the first Broadridge quartile
for the 36 months ended May 31, 2015 and the first Broadridge quartile for the 12 months ended May 31, 2015.
• For Janus Contrarian Fund, the Trustees noted that the Fund’s performance was in the first Broadridge quartile for the 36 months ended May 31, 2015 and the bottom Broadridge quartile for the 12 months ended May 31, 2015.
• For Janus Enterprise Fund, the Trustees noted that the Fund’s performance was in the second Broadridge quartile for the 36 months ended May 31, 2015 and the first Broadridge quartile for the 12 months ended May 31, 2015.
• For Janus Forty Fund, the Trustees noted that the Fund’s performance was in the second Broadridge quartile for the 36 months ended May 31, 2015 and the first Broadridge quartile for the 12 months ended May 31, 2015.
• For Janus Fund, the Trustees noted that the Fund’s performance was in the second Broadridge quartile for the 36 months ended May 31, 2015 and the first Broadridge quartile for the 12 months ended May 31, 2015.
• For Janus Growth and Income Fund, the Trustees noted that the Fund’s performance was in the third Broadridge quartile for the 36 months ended May 31, 2015 and in the third Broadridge quartile for the 12 months ended May 31, 2015. The Trustees noted the reasons for the Fund’s underperformance and the steps Janus Capital had taken or was taking to improve performance.
• For Janus Research Fund, the Trustees noted that the Fund’s performance was in the first Broadridge quartile for the 36 months ended May 31, 2015 and the first Broadridge quartile for the 12 months ended May 31, 2015.
Janus Aspen Forty Portfolio Additional Information (unaudited)
28 JUNE 30, 2016
• For Janus Triton Fund, the Trustees noted that the Fund’s performance was in the second Broadridge quartile for the 36 months ended May 31, 2015 and the first Broadridge quartile for the 12 months ended May 31, 2015.
• For Janus Twenty Fund, the Trustees noted that the Fund’s performance was in the third Broadridge quartile for the 36 months ended May 31, 2015 and the bottom Broadridge quartile for the 12 months ended May 31, 2015. The Trustees noted the reasons for the Fund’s underperformance, noting that the Fund has a performance fee structure that results in lower management fees during periods of underperformance, and the steps Janus Capital had taken or was taking to improve performance.
• For Janus Venture Fund, the Trustees noted that the Fund’s performance was in the first Broadridge quartile for the 36 months ended May 31, 2015 and the first Broadridge quartile for the 12 months ended May 31, 2015.
Global and International Funds • For Janus Asia Equity Fund, the Trustees noted that the Fund’s performance was in the third Broadridge
quartile for the 36 months ended May 31, 2015 and the first Broadridge quartile for the 12 months ended May 31, 2015. The Trustees noted the reasons for the Fund’s underperformance, noting that the Fund has a performance fee structure that results in lower management fees during periods of underperformance, the steps Janus Capital had taken or was taking to improve performance, and that the performance trend was improving.
• For Janus Emerging Markets Fund, the Trustees noted that the Fund’s performance was in the second Broadridge quartile for the 36 months ended May 31, 2015 and the first Broadridge quartile for the 12 months ended May 31, 2015.
• For Janus Global Life Sciences Fund, the Trustees noted that the Fund’s performance was in the first Broadridge quartile for the 36 months ended May 31, 2015 and the first Broadridge quartile for the 12 months ended May 31, 2015.
• For Janus Global Real Estate Fund, the Trustees noted that the Fund’s performance was in the first Broadridge quartile for the 36 months ended May 31, 2015 and the first Broadridge quartile for the 12 months ended May 31, 2015.
• For Janus Global Research Fund, the Trustees noted that the Fund’s performance was in the second Broadridge quartile for the 36 months ended May 31, 2015 and the first Broadridge quartile for the 12 months ended May 31, 2015.
• For Janus Global Select Fund, the Trustees noted that the Fund’s performance was in the second Broadridge quartile for the 36 months ended May 31, 2015 and the first Broadridge quartile for the 12 months ended May 31, 2015.
• For Janus Global Technology Fund, the Trustees noted that the Fund’s performance was in the third Broadridge quartile for the 36 months ended May 31, 2015 and the third Broadridge quartile for the 12 months ended May 31, 2015. The Trustees noted the reasons for the Fund’s underperformance and the steps Janus Capital had taken or was taking to improve performance.
• For Janus International Equity Fund, the Trustees noted that the Fund’s performance was in the second Broadridge quartile for the 36 months ended May 31, 2015 and the second Broadridge quartile for the 12 months ended May 31, 2015.
• For Janus Overseas Fund, the Trustees noted that the Fund’s performance was in the bottom Broadridge quartile for the 36 months ended May 31, 2015 and the bottom Broadridge quartile for the 12 months ended May 31, 2015. The Trustees noted the reasons for the Fund’s underperformance, noting that the Fund has a performance fee structure that results in lower management fees during periods of underperformance, and the steps Janus Capital had taken or was taking to improve performance.
Janus Aspen Forty Portfolio Additional Information (unaudited)
Janus Aspen Series 29
Janus Aspen Series • For Janus Aspen Balanced Portfolio, the Trustees noted that the Fund’s performance was in the first
Broadridge quartile for the 36 months ended May 31, 2015 and the first Broadridge quartile for the 12 months ended May 31, 2015.
• For Janus Aspen Enterprise Portfolio, the Trustees noted that the Fund’s performance was in the second Broadridge quartile for the 36 months ended May 31, 2015 and the first Broadridge quartile for the 12 months ended May 31, 2015.
• For Janus Aspen Flexible Bond Portfolio, the Trustees noted that the Fund’s performance was in the second Broadridge quartile for the 36 months ended May 31, 2015 and the second Broadridge quartile for the 12 months ended May 31, 2015.
• For Janus Aspen Forty Portfolio, the Trustees noted that the Fund’s performance was in the second Broadridge quartile for the 36 months ended May 31, 2015 and the first Broadridge quartile for the 12 months ended May 31, 2015.
• For Janus Aspen Global Allocation Portfolio – Moderate, the Trustees noted that the Fund’s performance was in the first Broadridge quartile for the 36 months ended May 31, 2015 and the bottom Broadridge quartile for the 12 months ended May 31, 2015.
• For Janus Aspen Global Research Portfolio, the Trustees noted that the Fund’s performance was in the first Broadridge quartile for the 36 months ended May 31, 2015 and the second Broadridge quartile for the 12 months ended May 31, 2015.
• For Janus Aspen Global Technology Portfolio, the Trustees noted that the Fund’s performance was in the second Broadridge quartile for the 36 months ended May 31, 2015 and the third Broadridge quartile for the 12 months ended May 31, 2015.
• For Janus Aspen Global Unconstrained Bond Portfolio, the Trustees noted that, due to limited performance for the Fund, performance history was not a material factor.
• For Janus Aspen INTECH U.S. Low Volatility Portfolio, the Trustees noted that the Fund’s performance was in the first Broadridge quartile for the 12 months ended May 31, 2015.
• For Janus Aspen Janus Portfolio, the Trustees noted that the Fund’s performance was in the second Broadridge quartile for the 36 months ended May 31, 2015 and the first Broadridge quartile for the 12 months ended May 31, 2015.
• For Janus Aspen Overseas Portfolio, the Trustees noted that the Fund’s performance was in the bottom Broadridge quartile for the 36 months ended May 31, 2015 and the bottom Broadridge quartile for the 12 months ended May 31, 2015. The Trustees noted the reasons for the Fund’s underperformance, noting that the Fund has a performance fee structure that results in lower management fees during periods of underperformance, and the steps Janus Capital had taken or was taking to improve performance.
• For Janus Aspen Perkins Mid Cap Value Portfolio, the Trustees noted that the Fund’s performance was in the bottom Broadridge quartile for the 36 months ended May 31, 2015 and the bottom Broadridge quartile for the 12 months ended May 31, 2015. The Trustees noted the reasons for the Fund’s underperformance, noting that the Fund has a performance fee structure that results in lower management fees during periods of underperformance, and the steps Janus Capital and Perkins had taken or were taking to improve performance.
In consideration of each Fund’s performance, the Trustees concluded that, taking into account the factors relevant to performance, as well as other considerations, including steps taken to improve performance, the Fund’s performance warranted continuation of the Fund’s investment advisory and subadvisory agreement(s).
Costs of Services Provided The Trustees examined information regarding the fees and expenses of each Fund in comparison to similar information for other comparable funds as provided by Broadridge, an independent data provider. They also reviewed an analysis of that information provided by their independent fee consultant and noted that the rate of management (investment advisory and any administration, but excluding out-of-pocket costs) fees for many of the Funds, after applicable waivers,
Janus Aspen Forty Portfolio Additional Information (unaudited)
30 JUNE 30, 2016
was below the mean management fee rate of the respective peer group of funds selected by an independent data provider. The Trustees also examined information regarding the subadvisory fees charged for subadvisory services, as applicable, noting that all such fees were paid by Janus Capital out of its management fees collected from such Fund.
The independent fee consultant provided its belief that the management fees charged by Janus Capital to each of the Funds under the current investment advisory and administration agreements are reasonable in relation to the services provided by Janus Capital. The independent fee consultant found: (1) the total expenses and management fees of the Funds to be reasonable relative to other mutual funds; (2) total expenses, on average, were 14% below the mean total expenses of their respective Broadridge Expense Group peers and 24% below the mean total expenses for their Broadridge Expense Universes; (3) management fees for the Funds, on average, were 15% below the mean management fees for their Expense Groups and 19% below the mean for their Expense Universes; and (4) Fund expenses at the functional level for each asset and share class category were reasonable. The Trustees also considered the total expenses for each share class of each Fund compared to the mean total expenses for its Broadridge Expense Group peers and to mean total expenses for its Broadridge Expense Universe.
The independent fee consultant concluded that, based on its strategic review of expenses at the complex, category and individual fund level, Fund expenses were found to be reasonable relative to both Expense Group and Expense Universe benchmarks. Further, for certain Funds, the independent fee consultant also performed a systematic “focus list” analysis of expenses in the context of the performance or service delivered to each set of investors in each share class in each selected Fund. Based on this analysis, the independent fee consultant found that the combination of service quality/performance and expenses on these individual Funds and share classes were reasonable in light of performance trends, performance histories, and existence of performance fees, breakpoints, and expense waivers on such Funds.
The Trustees considered the methodology used by Janus Capital and each subadviser in determining compensation payable to portfolio managers, the competitive environment for investment management talent, and the competitive market for mutual funds in different distribution channels.
The Trustees also reviewed management fees charged by Janus Capital and each subadviser to comparable separate account clients and to comparable non-affiliated funds subadvised by Janus Capital or by a subadviser (for which Janus Capital or the subadviser provides only or primarily portfolio management services). Although in most instances subadvisory and separate account fee rates for various investment strategies were lower than management fee rates for Funds having a similar strategy, the Trustees considered that Janus Capital noted that, under the terms of the management agreements with the Funds, Janus Capital performs significant additional services for the Funds that it does not provide to those other clients, including administration services, oversight of the Funds’ other service providers, trustee support, regulatory compliance and numerous other services, and that, in serving the Funds, Janus Capital assumes many legal risks and other costs that it does not assume in servicing its other clients. Moreover, they noted that the independent fee consultant found that: (1) the management fees Janus Capital charges to the Funds are reasonable in relation to the management fees Janus Capital charges to its institutional and subadvised accounts; (2) these institutional and subadvised accounts have different service and infrastructure needs; (3) the average spread between management fees charged to the Funds and those charged to Janus Capital’s institutional accounts is reasonable relative to the average spreads seen in the industry; and (4) by one estimation methodology, the fee margins implied by Janus Capital’s subadvised fees when compared to its mutual fund fees are reasonable relative to the estimated fee margins in the industry and relative to estimated fee margins of fund managers using Janus Capital as a subadviser.
The Trustees considered the fees for each Fund for its fiscal year ended in 2014, and noted the following with regard to each Fund’s total expenses, net of applicable fee waivers (the Fund’s “total expenses”):
Fixed-Income Funds and Money Market Funds • For Janus Flexible Bond Fund, the Trustees noted that, although the Fund’s total expenses exceeded the peer
group mean for certain share classes, overall the Fund’s total expenses were reasonable. The Trustees also noted that Janus Capital has contractually agreed to limit the Fund’s expenses, although this limit did not apply because the Fund’s total expenses were already below the applicable fee limit.
Janus Aspen Forty Portfolio Additional Information (unaudited)
Janus Aspen Series 31
• For Janus Global Bond Fund, the Trustees noted that although the Fund’s total expenses exceeded the peer group mean for certain share classes, overall the Fund’s total expenses were reasonable. The Trustees also noted that Janus Capital has contractually agreed to limit the Fund’s expenses.
• For Janus Global Unconstrained Bond Fund, the Trustees noted that although the Fund’s total expenses exceeded the peer group mean for certain share classes, overall the Fund’s total expenses were reasonable. The Trustees also noted that Janus Capital has contractually agreed to limit the Fund’s expenses.
• For Janus High-Yield Fund, the Trustees noted that, although the Fund’s total expenses exceeded the peer group mean for certain share classes, overall the Fund’s total expenses were reasonable. The Trustees also noted that Janus Capital has contractually agreed to limit the Fund’s expenses, although this limit did not apply because the Fund’s total expenses were already below the applicable fee limit.
• For Janus Multi-Sector Income Fund, the Trustees noted that, although the Fund’s total expenses exceeded the peer group mean for certain share classes, overall the Fund’s total expenses were reasonable. The Trustees also noted that Janus has contractually agreed to limit the Fund’s expenses.
• For Janus Real Return Fund, the Trustees noted that, although the Fund’s total expenses exceeded the peer group mean for all share classes, overall the Fund’s total expenses were reasonable. The Trustees also noted that Janus Capital has contractually agreed to limit the Fund’s expenses.
• For Janus Short-Term Bond Fund, the Trustees noted that, although the Fund’s total expenses exceeded the peer group mean for all share classes, overall the Fund’s total expenses were reasonable. The Trustees also noted that Janus Capital has contractually agreed to limit the Fund’s expenses.
• For Janus Government Money Market Fund, the Trustees noted that the Fund’s total expenses exceeded the peer group mean for both share classes. The Trustees considered that management fees for this Fund are higher than the peer group mean due to the Fund’s management fee including other costs, such as custody and transfer agent services, while many funds in the peer group pay these expenses separately from their management fee. In addition, the Trustees considered that Janus Capital voluntarily waives one-half of its advisory fee and other expenses in order to maintain a positive yield.
• For Janus Money Market Fund, the Trustees noted that the Fund’s total expenses were below the peer group mean for both share classes. In addition, the Trustees considered that Janus Capital voluntarily waives one-half of its advisory fee and other expenses in order to maintain a positive yield.
Asset Allocation Funds • For Janus Global Allocation Fund – Conservative, the Trustees noted that the Fund’s total expenses were
below the peer group mean for all share classes.
• For Janus Global Allocation Fund – Growth, the Trustees noted that the Fund’s total expenses were below the peer group mean for all share classes.
• For Janus Global Allocation Fund – Moderate, the Trustees noted that, although the Fund’s total expenses exceeded the peer group mean for certain share classes, overall the Fund’s total expenses were reasonable. The Trustees also noted that Janus Capital has contractually agreed to limit the Fund’s expenses.
Alternative Fund • For Janus Diversified Alternatives Fund, the Trustees noted that, although the Fund’s total expenses exceeded
the peer group mean for one share class, overall the Fund’s total expenses were reasonable. The Trustees also noted that Janus Capital has contractually agreed to limit the Fund’s expenses.
Value Funds • For Perkins International Value Fund, the Trustees noted that, although the Fund’s total expenses exceeded
the peer group mean for certain share classes, overall the Fund’s total expenses were reasonable. The Trustees also noted that Janus Capital has contractually agreed to limit the Fund’s expenses.
• For Perkins Global Value Fund, the Trustees noted that, although the Fund’s total expenses exceeded the peer group mean for one share class, overall the Fund’s total expenses were reasonable.
Janus Aspen Forty Portfolio Additional Information (unaudited)
32 JUNE 30, 2016
• For Perkins Large Cap Value Fund, the Trustees noted that, although the Fund’s total expenses exceeded the peer group mean for certain share classes, overall the Fund’s total expenses were reasonable. The Trustees also noted that Janus Capital has contractually agreed to limit the Fund’s expenses.
• For Perkins Mid Cap Value Fund, the Trustees noted that, although the Fund’s total expenses exceeded the peer group mean for one share class, overall the Fund’s total expenses were reasonable. The Trustees also noted that Janus Capital has contractually agreed to limit the Fund’s expenses, although this limit did not apply because the Fund’s total expenses were already below the applicable fee limit.
• For Perkins Select Value Fund, the Trustees noted that, although the Fund’s total expenses exceeded the peer group mean for one share class, overall the Fund’s total expenses were reasonable. The Trustees also noted that Janus Capital has contractually agreed to limit the Fund’s expenses.
• For Perkins Small Cap Value Fund, the Trustees noted that the Fund’s total expenses were below the peer group mean for all share classes.
• For Perkins Value Plus Income Fund, the Trustees noted that although the Fund’s total expenses exceeded the peer group mean for one share class, overall the Fund’s total expenses were reasonable. The Trustees also noted that Janus Capital had contractually agreed to limit the Fund’s expenses.
Mathematical Funds • For INTECH Emerging Markets Managed Volatility Fund, the Trustees noted that although the Fund’s total
expenses exceeded the peer group mean for certain share classes, overall the Fund’s total expenses were reasonable. The Trustees also noted that Janus Capital has contractually agreed to limit the Fund’s expenses.
• For INTECH Global Income Managed Volatility Fund, the Trustees noted that the Fund’s total expenses were below the peer group mean for all share classes.
• For INTECH International Managed Volatility Fund, the Trustees noted that although the Fund’s total expenses exceeded the peer group mean for one share class, overall the Fund’s total expenses were reasonable. The Trustees also noted that Janus Capital had contractually agreed to limit the Fund’s expenses, although this limit did not apply because the Fund’s total expenses were already below the applicable fee limit.
• For INTECH U.S. Core Fund, the Trustees noted that although the Fund’s total expenses exceeded the peer group mean for one share class, overall the Fund’s total expenses were reasonable. The Trustees also noted that Janus Capital has contractually agreed to limit the Fund’s expenses, although this limit did not apply because the Fund’s total expenses were already below the applicable fee limit.
• For INTECH U.S. Managed Volatility Fund, the Trustees noted that the Fund’s total expenses exceeded the peer group mean for one share class. The Trustees also noted that Janus Capital had contractually agreed to limit the Fund’s expenses.
Growth and Core Funds • For Janus Balanced Fund, the Trustees noted that, although the Fund’s total expenses exceeded the peer
group mean for one share class, overall the Fund’s total expenses were reasonable. The Trustees also noted that Janus Capital has contractually agreed to limit the Fund’s expenses, although this limit did not apply because the Fund’s total expenses were already below the applicable fee limit.
• For Janus Contrarian Fund, the Trustees noted that, although the Fund’s total expenses exceeded the peer group mean for certain share classes, overall the Fund’s total expenses were reasonable. The Trustees also noted that Janus Capital has contractually agreed to limit the Fund’s expenses, although this limit did not apply because the Fund’s total expenses were already below the applicable fee limit.
• For Janus Enterprise Fund, the Trustees noted that, although the Fund’s total expenses exceeded the peer group mean for certain share classes, overall the Fund’s total expenses were reasonable. The Trustees also noted that Janus Capital has contractually agreed to limit the Fund’s expenses, although this limit did not apply because the Fund’s total expenses were already below the applicable fee limit.
• For Janus Forty Fund, the Trustees noted that the Fund’s total expenses were below the peer group mean for all share classes.
Janus Aspen Forty Portfolio Additional Information (unaudited)
Janus Aspen Series 33
• For Janus Fund, the Trustees noted that the Fund’s total expenses were below the peer group mean for all share classes.
• For Janus Growth and Income Fund, the Trustees noted that, although the Fund’s total expenses exceeded the peer group mean for certain share classes, overall the Fund’s total expenses were reasonable. The Trustees also noted that Janus Capital has contractually agreed to limit the Fund’s expenses, although this limit did not apply because the Fund’s total expenses were already below the applicable fee limit.
• For Janus Research Fund, the Trustees noted that the Fund’s total expenses were below the peer group mean for all share classes.
• For Janus Triton Fund, the Trustees noted that, although the Fund’s total expenses exceeded the peer group mean for one share class, overall the Fund’s total expenses were reasonable. The Trustees also noted that Janus Capital has contractually agreed to limit the Fund’s expenses, although this limit did not apply because the Fund’s total expenses were already below the applicable fee limit.
• For Janus Twenty Fund, the Trustees noted that the Fund’s total expenses were below the peer group mean for all share classes.
• For Janus Venture Fund, the Trustees noted that, although the Fund’s total expenses exceeded the peer group mean for one share class, overall the Fund’s total expenses were reasonable. The Trustees also noted that Janus Capital has contractually agreed to limit the Fund’s expenses, although this limit did not apply because the Fund’s total expenses were already below the applicable fee limit.
Global and International Funds • For Janus Asia Equity Fund, the Trustees noted that the Fund’s total expenses were below the peer group
mean for all share classes.
• For Janus Emerging Markets Fund, the Trustees noted that, although the Fund’s total expenses exceeded the peer group mean for certain share classes, overall the Fund’s total expenses were reasonable. The Trustees also noted that Janus Capital has contractually agreed to limit the Fund’s expenses.
• For Janus Global Life Sciences Fund, the Trustees noted that the Fund’s total expenses were below the peer group mean for all share classes.
• For Janus Global Real Estate Fund, the Trustees noted that, although the Fund’s total expenses exceeded the peer group mean for one share class, overall the Fund’s total expenses were reasonable. The Trustees also noted that Janus Capital has contractually agreed to limit the Fund’s expenses.
• For Janus Global Research Fund, the Trustees noted that the Fund’s total expenses were below the peer group mean for all share classes.
• For Janus Global Select Fund, the Trustees noted that the Fund’s total expenses were below the peer group mean for all share classes.
• For Janus Global Technology Fund, the Trustees noted that the Fund’s total expenses were below the peer group mean for all share classes.
• For Janus International Equity Fund, the Trustees noted that, although the Fund’s total expenses exceeded the peer group mean for one share class, overall the Fund’s total expenses were reasonable. The Trustees also noted that Janus Capital has contractually agreed to limit the Fund’s expenses, although this limit did not apply because the Fund’s total expenses were already below the applicable fee limit.
• For Janus Overseas Fund, the Trustees noted that the Fund’s total expenses were below the peer group mean for all share classes.
Janus Aspen Series • For Janus Aspen Balanced Portfolio, the Trustees noted that the Fund’s total expenses were below the peer
group mean for both share classes.
Janus Aspen Forty Portfolio Additional Information (unaudited)
34 JUNE 30, 2016
• For Janus Aspen Enterprise Portfolio, the Trustees noted that the Fund’s total expenses were below the peer group mean for both share classes.
• For Janus Aspen Flexible Bond Portfolio, the Trustees noted that, although the Fund’s total expenses exceeded the peer group mean for one share class, overall the Fund’s total expenses were reasonable. The Trustees also noted that Janus Capital had contractually agreed to limit the Fund’s expenses.
• For Janus Aspen Forty Portfolio, the Trustees noted that the Fund’s total expenses were below the peer group mean for both share classes.
• For Janus Aspen Global Allocation Portfolio - Moderate, the Trustees noted that, although the Fund’s total expenses exceeded the peer group mean for both share classes, overall the Fund’s total expenses were reasonable. The Trustees also noted that Janus Capital has contractually agreed to limit the Fund’s expenses.
• For Janus Aspen Global Research Portfolio, the Trustees noted that the Fund’s total expenses were below the peer group mean for both share classes.
• For Janus Aspen Global Technology Portfolio, the Trustees noted that the Fund’s total expenses were below the peer group mean for both share classes.
• For Janus Aspen Global Unconstrained Bond Portfolio, the Trustees noted that, although the Fund’s total expenses exceeded the peer group mean for both share classes, overall the Fund’s total expenses were reasonable. The Trustees also noted that Janus Capital had contractually agreed to limit the Fund’s expenses.
• For Janus Aspen INTECH U.S. Low Volatility Portfolio, the Trustees noted that the Fund’s total expenses were below the peer group mean for its sole share class.
• For Janus Aspen Janus Portfolio, the Trustees noted that the Fund’s total expenses were below the peer group mean for both share classes.
• For Janus Aspen Overseas Portfolio, the Trustees noted that the Fund’s total expenses were below the peer group mean for both share classes.
• For Janus Aspen Perkins Mid Cap Value Portfolio, the Trustees noted that the Fund’s total expenses were below the peer group mean for both share classes.
The Trustees reviewed information on the profitability to Janus Capital and its affiliates of their relationships with each Fund, as well as an explanation of the methodology utilized by Janus Capital when allocating various expenses of Janus Capital and its affiliates with respect to contractual relationships with the Funds and other clients. The Trustees also reviewed the financial statements and corporate structure of Janus Capital’s parent company. In their review, the Trustees considered whether Janus Capital and each subadviser receive adequate incentives and resources to manage the Funds effectively. The Trustees recognized that profitability comparisons among fund managers are difficult because very little comparative information is publicly available, and the profitability of any fund manager is affected by numerous factors, including the organizational structure of the particular fund manager, the types of funds and other accounts it manages, possible other lines of business, the methodology for allocating expenses, and the fund manager’s capital structure and cost of capital. However, taking into account those factors and the analysis provided by the Trustees’ independent fee consultant, and based on the information available, the Trustees concluded that Janus Capital’s profitability with respect to each Fund in relation to the services rendered was reasonable.
The independent fee consultant found that, while assessing the reasonableness of expenses in light of Janus Capital’s profits is dependent on comparisons with other publicly-traded mutual fund advisers, and that these comparisons are limited in accuracy by differences in complex size, business mix, institutional account orientation, and other factors, after accepting these limitations, the level of profit earned by Janus Capital from managing the Funds is reasonable.
The Trustees concluded that the management fees payable by each Fund to Janus Capital and its affiliates, as well as the fees paid by Janus Capital to the subadvisers of subadvised Funds, were reasonable in relation to the nature, extent, and quality of the services provided, taking into account the fees charged by other advisers for managing comparable mutual funds with similar strategies, the fees Janus Capital and the subadvisers charge to other clients, and, as applicable, the impact of fund performance on management fees payable by the Funds. The Trustees also concluded that each Fund’s total expenses were reasonable, taking into account the size of the Fund, the quality of services
Janus Aspen Forty Portfolio Additional Information (unaudited)
Janus Aspen Series 35
provided by Janus Capital and any subadviser, the investment performance of the Fund, and any expense limitations agreed to or provided by Janus Capital.
Economies of Scale The Trustees considered information about the potential for Janus Capital to realize economies of scale as the assets of the Funds increase. They noted that their independent fee consultant provided an analysis of economies of scale, which included discussion of analysis from prior years. They also noted that, although many Funds pay advisory fees at a base fixed rate as a percentage of net assets, without any breakpoints, their independent fee consultant concluded that 85% of these Funds have contractual management fees (gross of waivers) below their Broadridge expense group averages and, overall, 80% of the Funds are below their respective expense group averages for contractual management fees. They also noted that for those Funds whose expenses are being reduced by the contractual expense limitations of Janus Capital, Janus Capital is subsidizing the Funds because they have not reached adequate scale. Moreover, as the assets of some of the Funds have declined in the past few years, certain Funds have benefited from having advisory fee rates that have remained constant rather than increasing as assets declined. In addition, performance fee structures have been implemented for various Funds that have caused the effective rate of advisory fees payable by such a Fund to vary depending on the investment performance of the Fund relative to its benchmark index over the measurement period; and a few Funds have fee schedules with breakpoints and reduced fee rates above certain asset levels. The Trustees also noted that the Funds share directly in economies of scale through the lower charges of third-party service providers that are based in part on the combined scale of all of the Funds. Based on all of the information they reviewed, including research and analysis conducted by the Trustees’ independent fee consultant, the Trustees concluded that the current fee structure of each Fund was reasonable and that the current rates of fees do reflect a sharing between Janus Capital and the Fund of any economies of scale that may be present at the current asset level of the Fund.
The independent fee consultant concluded that, given the limitations of various analytical approaches to economies of scale considered in prior years, and their conflicting results, its analyses could not confirm or deny the existence of economies of scale in the Janus complex. Further, the independent fee consultant provided its belief that Fund investors are well-served by the fee levels and performance fee structures in place on the Funds in light of any economies of scale that may be present at Janus Capital.
Other Benefits to Janus Capital The Trustees also considered benefits that accrue to Janus Capital and its affiliates and subadvisers to the Funds from their relationships with the Funds. They recognized that two affiliates of Janus Capital separately serve the Funds as transfer agent and distributor, respectively, and the transfer agent receives compensation directly from the non-money market funds for services provided. The Trustees also considered Janus Capital’s past and proposed use of commissions paid by the Funds on portfolio brokerage transactions to obtain proprietary and third-party research products and services benefiting the Fund and/or other clients of Janus Capital and/or Janus Capital, and/or a subadviser to a Fund. The Trustees concluded that Janus Capital’s and the subadvisers’ use of these types of client commission arrangements to obtain proprietary and third-party research products and services was consistent with regulatory requirements and guidelines and was likely to benefit each Fund. The Trustees also concluded that, other than the services provided by Janus Capital and its affiliates and subadvisers pursuant to the agreements and the fees to be paid by each Fund therefor, the Funds and Janus Capital and the subadvisers may potentially benefit from their relationship with each other in other ways. They concluded that Janus Capital and/or the subadvisers benefits from the receipt of research products and services acquired through commissions paid on portfolio transactions of the Funds and that the Funds benefit from Janus Capital’s and/or the subadvisers’ receipt of those products and services as well as research products and services acquired through commissions paid by other clients of Janus Capital and/or other clients of the subadvisers. They further concluded that the success of any Fund could attract other business to Janus Capital, the subadvisers or other Janus funds, and that the success of Janus Capital and the subadvisers could enhance Janus Capital’s and the subadvisers’ ability to serve the Funds.
Janus Aspen Forty Portfolio Useful Information About Your Portfolio Report (unaudited)
36 JUNE 30, 2016
Management Commentary The Management Commentary in this report includes valuable insight as well as statistical information to help you understand how your Portfolio’s performance and characteristics stack up against those of comparable indices.
If the Portfolio invests in foreign securities, this report may include information about country exposure. Country exposure is based primarily on the country of risk. A company may be allocated to a country based on other factors such as location of the company’s principal office, the location of the principal trading market for the company’s securities, or the country where a majority of the company’s revenues are derived.
Please keep in mind that the opinions expressed in the Management Commentary are just that: opinions. They are a reflection based on best judgment at the time this report was compiled, which was June 30, 2016. As the investing environment changes, so could opinions. These views are unique and are not necessarily shared by fellow employees or by Janus in general.
Performance Overviews Performance overview graphs compare the performance of a hypothetical $10,000 investment in the Portfolio with one or more widely used market indices. When comparing the performance of the Portfolio with an index, keep in mind that market indices are not available for investment and do not reflect deduction of expenses.
Average annual total returns are quoted for a Portfolio with more than one year of performance history. Average annual total return is calculated by taking the growth or decline in value of an investment over a period of time, including reinvestment of dividends and distributions, then calculating the annual compounded percentage rate that would have produced the same result had the rate of growth been constant throughout the period. Average annual total return does not reflect the deduction of taxes that a shareholder would pay on Portfolio distributions or redemptions of Portfolio shares.
Cumulative total returns are quoted for a Portfolio with less than one year of performance history. Cumulative total return is the growth or decline in value of an investment over time, independent of the period of time involved. Cumulative total return does not reflect the deduction of taxes that a shareholder would pay on Portfolio distributions or redemptions of Portfolio shares.
Pursuant to federal securities rules, expense ratios shown in the performance chart reflect subsidized (if applicable) and unsubsidized ratios. The total annual fund operating expenses ratio is gross of any fee waivers, reflecting the Portfolio’s unsubsidized expense ratio. The net annual fund operating expenses ratio (if applicable) includes contractual waivers of Janus Capital and reflects the Portfolio’s subsidized expense ratio. Ratios may be higher or lower than those shown in the “Financial Highlights” in this report.
Schedule of Investments Following the performance overview section is the Portfolio’s Schedule of Investments. This schedule reports the types of securities held in the Portfolio on the last day of the reporting period. Securities are usually listed by type (common stock, corporate bonds, U.S. Government obligations, etc.) and by industry classification (banking, communications, insurance, etc.). Holdings are subject to change without notice.
The value of each security is quoted as of the last day of the reporting period. The value of securities denominated in foreign currencies is converted into U.S. dollars.
If the Portfolio invests in foreign securities, it will also provide a summary of investments by country. This summary reports the Portfolio exposure to different countries by providing the percentage of securities invested in each country. The country of each security represents the country of risk. The Portfolio’s Schedule of Investments relies upon the industry group and country classifications published by Barclays and/or MSCI Inc.
Tables listing details of individual forward currency contracts, futures, written options, swaptions, and swaps follow the Portfolio’s Schedule of Investments (if applicable).
Statement of Assets and Liabilities This statement is often referred to as the “balance sheet.” It lists the assets and liabilities of the Portfolio on the last day of the reporting period.

Janus Aspen Forty Portfolio Useful Information About Your Portfolio Report (unaudited)
Janus Aspen Series 37
The Portfolio’s assets are calculated by adding the value of the securities owned, the receivable for securities sold but not yet settled, the receivable for dividends declared but not yet received on securities owned, and the receivable for Portfolio shares sold to investors but not yet settled. The Portfolio’s liabilities include payables for securities purchased but not yet settled, Portfolio shares redeemed but not yet paid, and expenses owed but not yet paid. Additionally, there may be other assets and liabilities such as unrealized gain or loss on forward currency contracts.
The section entitled “Net Assets Consist of” breaks down the components of the Portfolio’s net assets. Because the Portfolio must distribute substantially all earnings, you will notice that a significant portion of net assets is shareholder capital.
The last section of this statement reports the net asset value (“NAV”) per share on the last day of the reporting period. The NAV is calculated by dividing the Portfolio’s net assets for each share class (assets minus liabilities) by the number of shares outstanding.
Statement of Operations This statement details the Portfolio’s income, expenses, realized gains and losses on securities and currency transactions, and changes in unrealized appreciation or depreciation of Portfolio holdings.
The first section in this statement, entitled “Investment Income,” reports the dividends earned from securities and interest earned from interest-bearing securities in the Portfolio.
The next section reports the expenses incurred by the Portfolio, including the advisory fee paid to the investment adviser, transfer agent fees and expenses, and printing and postage for mailing statements, financial reports and prospectuses. Expense offsets and expense reimbursements, if any, are also shown.
The last section lists the amounts of realized gains or losses from investment and foreign currency transactions, and changes in unrealized appreciation or depreciation of investments and foreign currency-denominated assets and liabilities. The Portfolio will realize a gain (or loss) when it sells its position in a particular security. A change in unrealized gain (or loss) refers to the change in net appreciation or depreciation of the Portfolio during the reporting period. “Net Realized and Unrealized Gain/(Loss) on Investments” is affected both by changes in the market value of Portfolio holdings and by gains (or losses) realized during the reporting period.
Statements of Changes in Net Assets These statements report the increase or decrease in the Portfolio’s net assets during the reporting period. Changes in the Portfolio’s net assets are attributable to investment operations, dividends and distributions to investors, and capital share transactions. This is important to investors because it shows exactly what caused the Portfolio’s net asset size to change during the period.
The first section summarizes the information from the Statement of Operations regarding changes in net assets due to the Portfolio’s investment operations. The Portfolio’s net assets may also change as a result of dividend and capital gains distributions to investors. If investors receive their dividends and/or distributions in cash, money is taken out of the Portfolio to pay the dividend and/or distribution. If investors reinvest their dividends and/or distributions, the Portfolio’s net assets will not be affected. If you compare the Portfolio’s “Net Decrease from Dividends and Distributions” to “Reinvested Dividends and Distributions,” you will notice that dividends and distributions have little effect on the Portfolio’s net assets. This is because the majority of the Portfolio’s investors reinvest their dividends and/or distributions.
The reinvestment of dividends and distributions is included under “Capital Share Transactions.” “Capital Shares” refers to the money investors contribute to the Portfolio through purchases or withdrawals via redemptions. The Portfolio’s net assets will increase and decrease in value as investors purchase and redeem shares from the Portfolio.
Financial Highlights This schedule provides a per-share breakdown of the components that affect the Portfolio’s NAV for current and past reporting periods as well as total return, asset size, ratios, and portfolio turnover rate.
The first line in the table reflects the NAV per share at the beginning of the reporting period. The next line reports the net investment income/(loss) per share. Following is the per share total of net gains/(losses), realized and unrealized. Per share dividends and distributions to investors are then subtracted to arrive at the NAV per share at the end of the

Janus Aspen Forty Portfolio Useful Information About Your Portfolio Report (unaudited)
38 JUNE 30, 2016
period. The next line reflects the total return for the period. Also included are ratios of expenses and net investment income to average net assets.
The Portfolio’s expenses may be reduced through expense offsets and expense reimbursements. The ratios shown reflect expenses before and after any such offsets and reimbursements.
The ratio of net investment income/(loss) summarizes the income earned less expenses, divided by the average net assets of the Portfolio during the reporting period. Do not confuse this ratio with the Portfolio’s yield. The net investment income ratio is not a true measure of the Portfolio’s yield because it does not take into account the dividends distributed to the Portfolio’s investors.
The next figure is the portfolio turnover rate, which measures the buying and selling activity in the Portfolio. Portfolio turnover is affected by market conditions, changes in the asset size of the Portfolio, fluctuating volume of shareholder purchase and redemption orders, the nature of the Portfolio’s investments, and the investment style and/or outlook of the portfolio manager(s) and/or investment personnel. A 100% rate implies that an amount equal to the value of the entire portfolio was replaced once during the fiscal year; a 50% rate means that an amount equal to the value of half the portfolio is traded in a year; and a 200% rate means that an amount equal to the value of the entire portfolio is traded every six months.
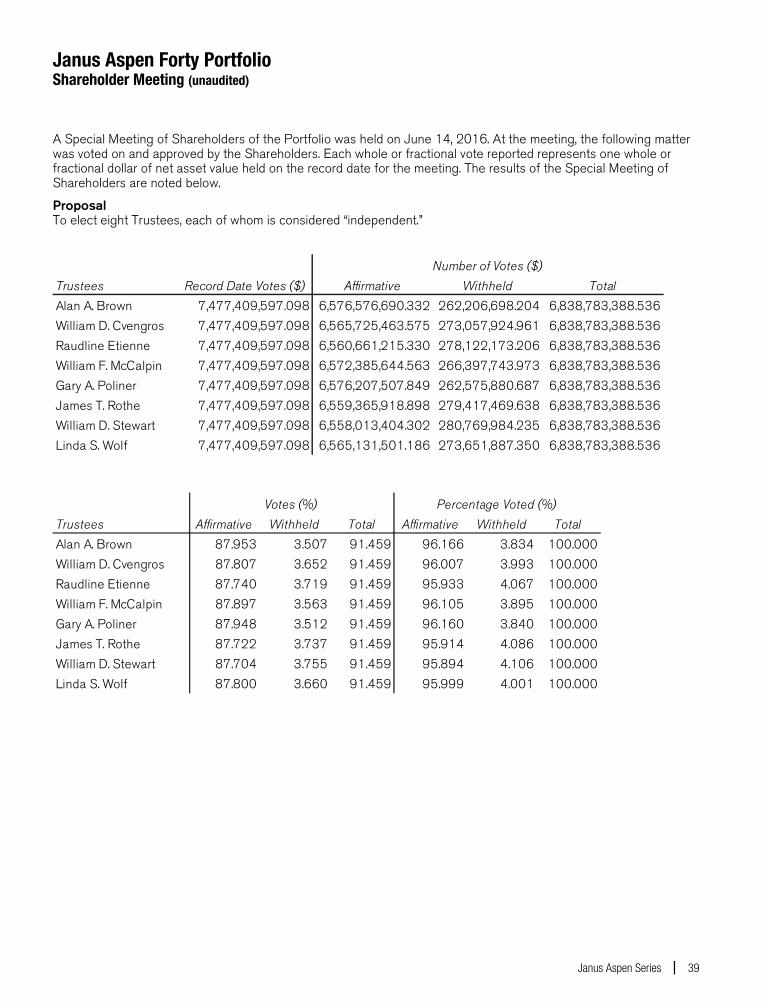
Janus Aspen Forty Portfolio Shareholder Meeting (unaudited)
Janus Aspen Series 39
A Special Meeting of Shareholders of the Portfolio was held on June 14, 2016. At the meeting, the following matter was voted on and approved by the Shareholders. Each whole or fractional vote reported represents one whole or fractional dollar of net asset value held on the record date for the meeting. The results of the Special Meeting of Shareholders are noted below.
Proposal To elect eight Trustees, each of whom is considered “independent.”
Trustees Record Date Votes ($) Affirmative Withheld TotalAlan A. Brown 7,477,409,597.098 6,576,576,690.332 262,206,698.204 6,838,783,388.536William D. Cvengros 7,477,409,597.098 6,565,725,463.575 273,057,924.961 6,838,783,388.536Raudline Etienne 7,477,409,597.098 6,560,661,215.330 278,122,173.206 6,838,783,388.536William F. McCalpin 7,477,409,597.098 6,572,385,644.563 266,397,743.973 6,838,783,388.536Gary A. Poliner 7,477,409,597.098 6,576,207,507.849 262,575,880.687 6,838,783,388.536James T. Rothe 7,477,409,597.098 6,559,365,918.898 279,417,469.638 6,838,783,388.536William D. Stewart 7,477,409,597.098 6,558,013,404.302 280,769,984.235 6,838,783,388.536Linda S. Wolf 7,477,409,597.098 6,565,131,501.186 273,651,887.350 6,838,783,388.536
Number of Votes ($)
Trustees Affirmative Withheld Total Affirmative Withheld TotalAlan A. Brown 87.953 3.507 91.459 96.166 3.834 100.000William D. Cvengros 87.807 3.652 91.459 96.007 3.993 100.000Raudline Etienne 87.740 3.719 91.459 95.933 4.067 100.000William F. McCalpin 87.897 3.563 91.459 96.105 3.895 100.000Gary A. Poliner 87.948 3.512 91.459 96.160 3.840 100.000James T. Rothe 87.722 3.737 91.459 95.914 4.086 100.000William D. Stewart 87.704 3.755 91.459 95.894 4.106 100.000Linda S. Wolf 87.800 3.660 91.459 95.999 4.001 100.000
Votes (%) Percentage Voted (%)

Janus Aspen Forty Portfolio Notes
40 JUNE 30, 2016
NotesPage1

Janus Aspen Forty Portfolio Notes
Janus Aspen Series 41
NotesPage2

Janus provides access to a wide range of investment disciplines. Alternative Janus alternative funds seek to deliver strong risk-adjusted returns over a full market cycle with lower correlation to equity markets than traditional investments.
Asset Allocation Janus’ asset allocation funds utilize our fundamental, bottom-up research to balance risk over the long term. From fund options that meet investors’ risk tolerance and objectives to a method that incorporates non-traditional investment choices to seek non-correlated sources of risk and return, Janus’ asset allocation funds aim to allocate risk more effectively.
Fixed Income Janus fixed income funds attempt to provide less risk relative to equities while seeking to deliver a competitive total return through high current income and appreciation. Janus money market funds seek capital preservation and liquidity with current income as a secondary objective.
Global & International Janus global and international funds seek to leverage Janus’ research capabilities by taking advantage of inefficiencies in foreign markets, where accurate information and analytical insight are often at a premium.
Growth & Core Janus growth funds focus on companies believed to be the leaders in their respective industries, with solid management teams, expanding market share, margins and efficiencies. Janus core funds seek investments in more stable and predictable companies. Our core funds look for a strategic combination of steady growth and, for certain funds, some degree of income.
Mathematical Our mathematical funds seek to outperform their respective indices while maintaining a risk profile equal to or lower than the index itself. Managed by INTECH® (a Janus subsidiary), these funds use a mathematical process in an attempt to build a more “efficient” portfolio than the index.
Value Our value funds, managed by Perkins® (a Janus subsidiary), seek to identify companies with favorable reward to risk characteristics by conducting rigorous downside analysis before determining upside potential.
For more information about our funds, contact your investment professional or go to janus.com/variable-insurance.
Please consider the charges, risks, expenses and investment objectives carefully before investing. For a prospectus or, if available, a summary prospectus containing this and other information, please call Janus at 877.33JANUS (52687) or download the file from janus.com/variable-insurance. Read it carefully before you invest or send money. Janus, INTECH and Perkins are registered trademarks of Janus International Holding LLC. © Janus International Holding LLC.
Funds distributed by Janus Distributors LLC
Investment products offered are: NOT FDIC-INSURED MAY LOSE VALUE NO BANK GUARANTEE
C-0816-3718 109-24-81115 08-16

SEMIANNUAL REPORT June 30, 2016
Janus Aspen Balanced Portfolio
Janus Aspen Series
HIGHLIGHTS
• Portfolio management perspective • Investment strategy behind your portfolio • Portfolio performance, characteristics
and holdings
Table of Contents
Janus Aspen Balanced Portfolio Management Commentary and Schedule of Investments ............................1 Notes to Schedule of Investments and Other Information........................ 21 Statement of Assets and Liabilities ............................................................................. 23 Statement of Operations ...................................................................................................... 24 Statements of Changes in Net Assets...................................................................... 25 Financial Highlights .................................................................................................................. 26 Notes to Financial Statements ........................................................................................ 27 Additional Information............................................................................................................. 38 Useful Information About Your Portfolio Report ............................................... 50 Shareholder Meeting ............................................................................................................... 53
Janus Aspen Balanced Portfolio (unaudited)
Janus Aspen Series 1
PORTFOLIO SNAPSHOT We believe a dynamic approach to asset allocation that leverages our bottom-up, fundamental equity and fixed income research will allow us to outperform our peers over time. Our integrated equity and fixed income research team seeks an optimal balance of asset class opportunities across market cycles.
Jeremiah Buckley co-portfolio manager
Marc Pinto
co-portfolio manager
Mayur Saigal
co-portfolio manager Darrell Watters
co-portfolio manager
PERFORMANCE SUMMARY Janus Aspen Balanced Portfolio’s Institutional Shares and Service Shares returned -0.43% and -0.57%, respectively, for the six-month period ended June 30, 2016. That compares with 3.84% for the Portfolio’s primary benchmark, the S&P 500 Index, and 5.31% for the Portfolio’s secondary benchmark, the Barclays U.S. Aggregate Bond Index. The Balanced Index, an internally calculated benchmark composed of a 55% weighting in the S&P 500 Index and a 45% weighting in the Barclays U.S. Aggregate Bond Index, returned 4.60%.
INVESTMENT ENVIRONMENT The year began with concerns over sluggish economic growth and the possibility of recession weighing heavily on global markets. Slower-than-expected growth in China, the implications of negative interest rates and weakness in commodities-related sectors also dragged markets down through early February. In a sharp reversal, risk assets rallied and crude oil prices reset within a higher trading band for much of the remaining period. By early April, a more optimistic outlook was in favor. Late in June, however, market participants met with two surprises.
First, June’s probable interest rate hike by the Federal Reserve (Fed) was derailed by a weak employment report from May. Questions about the health of the U.S. economy resurfaced, and the Fed lowered its projection for future interest rate hikes. June’s second surprise came from Europe, when voters in the UK opted to leave the European Union (EU). Risk assets tumbled immediately after the unexpected news, the dollar rose and yields on safe-haven government bonds fell. In the final days of the period, however, credit spreads and U.S. equities recaptured much of their post-Brexit slide.
The U.S. Treasury curve flattened over the last six months, as yields fell significantly across most tenors. The combination of Brexit concerns, slowing global growth and negative interest rate policies abroad triggered a rotation into U.S. Treasurys. The yield on the 10-year note
fell to 1.47% at the end of June, from 2.27% at the end of 2015. Both high-yield and investment-grade corporate credit spreads compressed during the period.
PERFORMANCE DISCUSSION The equity allocation of the Portfolio ended the period roughly in line with where it started at approximately 60% compared to 61%. The fixed income portion was approximately 39% at the end of June compared to 36%. Our positioning reflects our view that on a risk-adjusted basis, equities continue to present more attractive opportunities relative to fixed income.
The Portfolio’s equity sleeve underperformed its benchmark, the S&P 500 Index. Value equities outperformed growth over the previous six months, which created a headwind for our growth tilt. On a sector basis, our health care exposure weighed on relative performance. Negative sentiment surrounded the health care sector early in the year, due in large part to political rhetoric about controlling drug prices. Additionally, questionable accounting and drug pricing tactics at a well-known specialty pharmaceutical company spurred a sell-off in specialty pharmaceutical and biotech stocks in the first half of the period. Security selection in financials also detracted on a relative basis; some of our exposure was negatively impacted by the large decline in rates during the period. Contributing to relative performance was our security selection in consumer staples.
On an individual basis, Allergan was our largest detractor. Stock for the specialty pharmaceutical company struggled with the sector early in the period and traded down when the proposed merger between Allergan and Pfizer fell apart. We believe the sale of the company’s generics business to Teva Pharmaceuticals will take place and think the move will strengthen Allergan’s balance sheet and increase capital return potential. We also like the company’s product mix, much of which is not subject to government reimbursement.
Janus Aspen Balanced Portfolio (unaudited)
2 JUNE 30, 2016
Regeneron Pharmaceuticals was another detractor. In addition to the general headwinds impacting biotech companies, slower than expected sales for one of its drugs controlling cholesterol weighed on the stock, as did news that the company lost a court case with a competitor over patent infringement for a drug. We exited our position during the period.
Norwegian Cruise Line also detracted from results. The stock fell as geopolitical and macroeconomic concerns dampened expectations on demand for future discretionary spending, such as cruising. Strengthening oil prices also contributed to negative sentiment around future margins, although we believe the fuel environment is still very favorable. We remain encouraged by Norwegian’s newer fleet and innovative portfolio of on-board offerings which we believe should increase customer spending over time. Additionally, our outlook for the cruise industry remains positive. Increasing global demand in a number of markets has improved the overall supply/demand relationship, helping to enhance the industry’s outlook for higher returns on capital.
While the aforementioned stocks detracted from performance, we were pleased by the results of other companies in the portfolio. Dollar Tree was the top individual contributor. The stock was up after the company reported strong earnings and continued to show progress in integrating Family Dollar. We continue to be encouraged by the opportunity for Dollar Tree’s management team to improve margins for the former Family Dollar franchise. Additionally, we believe dollar stores offering consumers low price points remain well positioned in a relatively weak economic environment.
Altria Group also performed well. Volume growth for the tobacco company has continued to hold up relatively well for the industry, and the company has maintained pricing discipline and been able to grow profits. We like the holding within this portfolio for the high level of free cash flow returned to shareholders.
The Hershey Company was another leading contributor to performance. The stock advanced late in the period on news that Mondelez International, a confectionery, food, and beverage conglomerate, had sent Hershey a takeover bid during the month. Although Hershey rejected the bid, we believe that this action highlights the value of its brand and position in the U.S. market.
The Portfolio’s fixed income sleeve underperformed its benchmark, the Barclays U.S. Aggregate Bond Index, largely due to its exposure to corporate credits.
Positioning in investment-grade corporate credit weighed on relative results; underperformance was largely driven by shorter duration yield curve positioning, given the significant rally in longer term securities. Our out-of-index allocation to high-yield corporate credit also weighed on relative results. Our high-yield security selection, which we consider to be more defensive in nature, did not keep up with the lower quality rally since credit spreads peaked near mid-February.
On a credit sector basis, security selection in banking was a relative detractor. Macro-economic challenges, including slower gross domestic product (GDP) growth globally and shifting monetary policy, weighed on the banking sector in several regions, as evidenced by the early 2016 sell-off in banking-related securities. Banking credits managed to retrace some of their losses by June’s end; however, Royal Bank of Scotland, an individual detractor from relative performance, faced additional challenges – mainly in the form of the UK’s vote to leave the EU. While we are mindful of the uncertainties around the future of the UK and the EU, we continue to like the company’s improving asset quality, capital building and plans for restructuring. Albeit the key points of our thesis will likely take longer to play out in the face of slower GDP growth and generally weaker capital markets.
The midstream energy and electric utilities sectors also detracted from relative performance. Our more defensive security selection in midstream energy weighed on results; we seek quality companies with best-in-class assets and management teams committed to balance sheet strength that we believe can prosper in varying crude oil price environments. Investor demand for U.S.-based defensive business models boosted electric utilities during the period, and our underweight allocation detracted. The dip in rates gave further support to utilities as the longer term nature of the sector’s debt benefited from the decline.
Relative credit sector contributors included security selection and an overweight allocation in independent energy. Holdings in oil field services and building materials also contributed on a relative basis. Given recent dislocations in the energy sector, we added energy exposure where we were able to identify strong risk-adjusted return potential in what we believe to be low-risk energy issuers with solid balance sheets. Energy performed well on the back of higher crude oil prices later in the period, and our positioning in independent energy and oil field services aided results.
Janus Aspen Balanced Portfolio (unaudited)
Janus Aspen Series 3
ConocoPhillips was one of our top relative contributors. We believe the multinational energy corporation can succeed in a lower for longer oil price environment with its diversified production mix and broad geographic footprint. We like the company’s high-quality exploration and production assets and strong management team.
On an asset class basis, our shorter duration positioning in commercial mortgage-backed securities (CMBS) was a drag on relative performance, as was our cash position. Cash is not used as a strategy within the Portfolio but is a residual of our fundamental, bottom-up investment process. Our positioning in longer dated Treasurys, which we utilize to hedge our corporate credit exposure, benefited from curve flattening and aided relative performance. The prepayment resistant nature of our U.S. mortgage-backed securities (MBS) also proved beneficial in a falling rate environment. We focus on higher quality specified pools with higher coupons and less negative convexity than the positions in the index, making them less vulnerable to declining rates.
Please see the Derivative Instruments section in the “Notes to Financial Statements” for a discussion of derivatives used by the Portfolio.
OUTLOOK We believe global growth will be under pressure following the UK’s unexpected decision to split from the EU; the short-term outlook for Europe and the UK looks particularly challenged. The vote has also increased the likelihood of additional central bank stimulus from the Bank of England and the European Central Bank, in our view. The Fed, which just a few months ago was signaling the possibility of a summer rate hike, likely won’t raise rates again in 2016. Moreover, we anticipate continued volatility in the market given the upcoming U.S. election.
Although the U.S. economy has shown some recent signs of weakness – most notably the much weaker-than-expected May nonfarm payrolls number – the U.S. consumer appears to have remained resilient. Therefore, we are positioning the equity sleeve to capitalize on this strength and to avoid the more economically sensitive sectors. In general, we are looking for defensive areas with decent demand and the ability to grow regardless of global macro events. Our outlook for the energy sector remains cautious, given the persistent oversupply and the likelihood of a stronger dollar in the wake of the Brexit vote. Given the consistent growth in health care, we intend to maintain our modest overweight allocation to the sector. Overall, we favor innovative companies with
products and services that enable them to take market share regardless of overall macroeconomic trends.
Within the fixed income sleeve, we believe that domestic opportunities continue to look more favorable than those abroad. U.S. yields may be low, but they are comparatively higher than most developed countries – and positive, whereas a large percentage of the world’s sovereign debt now has negative yields. This dynamic has resulted in strong global demand for U.S credit; however, we believe that caution in credit is warranted. Asset values in the U.S. are stretched, in our opinion, and we anticipate some weakness in second quarter revenue and earnings growth which will make current valuations more difficult to justify. Aggressive re-leveraging of corporate balance sheets, 2015’s record M&A activity and multiple large leveraged buyout announcements this year suggest we remain in the late innings of the credit cycle. It is feasible that further stimulus from the world’s major central banks – to help markets cope with Brexit – may support credit in the short term; however, we are mindful that markets can go only so far on accommodative monetary policy and little in the way of accelerated fundamentals.
We foresee range bound spreads in the latter half of 2016. Volatility will likely remain elevated, and break-evens are tight, making security avoidance, in our opinion, all the more important in the months to come. Our Treasury positioning is concentrated further out on the curve to hedge our credit exposure, while in corporate credit we continue to favor shorter- to intermediate-term issuance in which we believe we have a clearer insight on the issuers’ fundamentals and ability to pay down debt. Our defensive posture in the fixed income sleeve remains intact, as we seek to deliver on our central tenets of capital preservation and strong risk-adjusted returns.
Thank you for your investment in Janus Aspen Balanced Portfolio.
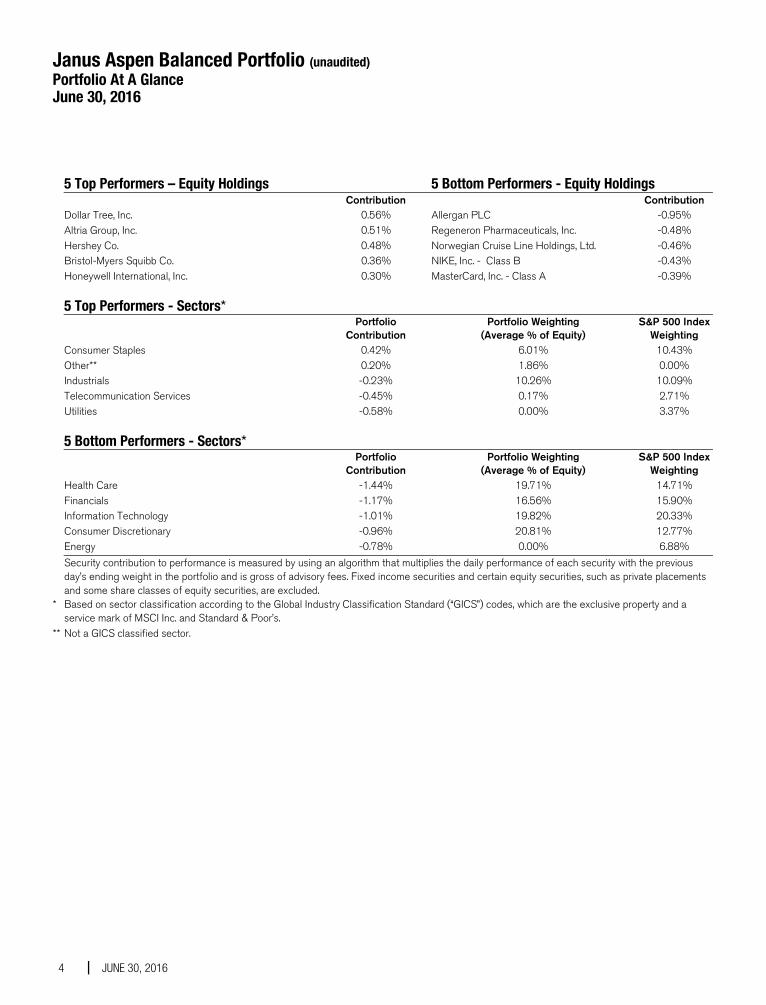
Janus Aspen Balanced Portfolio (unaudited) Portfolio At A Glance June 30, 2016
4 JUNE 30, 2016
5 Top Performers – Equity Holdings 5 Bottom Performers - Equity Holdings Contribution Contribution Dollar Tree, Inc. 0.56% Allergan PLC -0.95% Altria Group, Inc. 0.51% Regeneron Pharmaceuticals, Inc. -0.48% Hershey Co. 0.48% Norwegian Cruise Line Holdings, Ltd. -0.46% Bristol-Myers Squibb Co. 0.36% NIKE, Inc. - Class B -0.43% Honeywell International, Inc. 0.30% MasterCard, Inc. - Class A -0.39%
5 Top Performers - Sectors*
Portfolio
Contribution Portfolio Weighting
(Average % of Equity) S&P 500 Index
Weighting Consumer Staples 0.42% 6.01% 10.43% Other** 0.20% 1.86% 0.00% Industrials -0.23% 10.26% 10.09% Telecommunication Services -0.45% 0.17% 2.71% Utilities -0.58% 0.00% 3.37%
5 Bottom Performers - Sectors*
Portfolio
Contribution Portfolio Weighting
(Average % of Equity) S&P 500 Index
Weighting Health Care -1.44% 19.71% 14.71% Financials -1.17% 16.56% 15.90% Information Technology -1.01% 19.82% 20.33% Consumer Discretionary -0.96% 20.81% 12.77% Energy -0.78% 0.00% 6.88%
Security contribution to performance is measured by using an algorithm that multiplies the daily performance of each security with the previous day’s ending weight in the portfolio and is gross of advisory fees. Fixed income securities and certain equity securities, such as private placements and some share classes of equity securities, are excluded.
* Based on sector classification according to the Global Industry Classification Standard (“GICS”) codes, which are the exclusive property and a service mark of MSCI Inc. and Standard & Poor’s.
** Not a GICS classified sector.
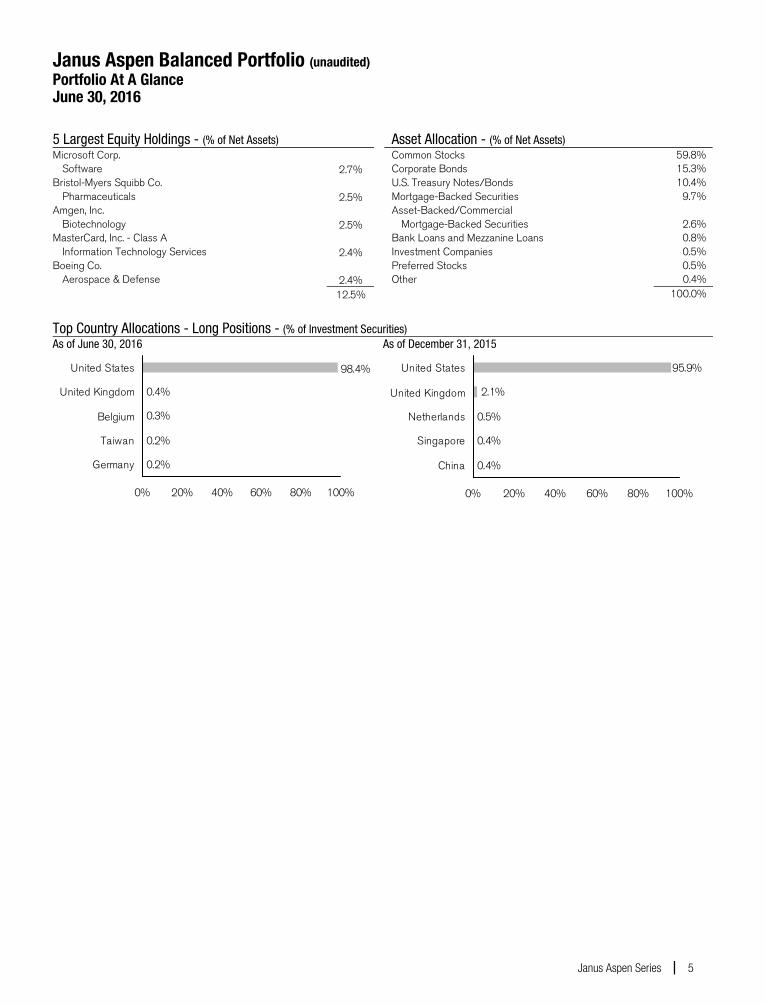
Janus Aspen Balanced Portfolio (unaudited) Portfolio At A Glance June 30, 2016
Janus Aspen Series 5
5 Largest Equity Holdings - (% of Net Assets) Microsoft Corp.
Software 2.7% Bristol-Myers Squibb Co.
Pharmaceuticals 2.5% Amgen, Inc.
Biotechnology 2.5% MasterCard, Inc. - Class A
Information Technology Services 2.4% Boeing Co.
Aerospace & Defense 2.4% 12.5%
Asset Allocation - (% of Net Assets) Common Stocks 59.8% Corporate Bonds 15.3% U.S. Treasury Notes/Bonds 10.4% Mortgage-Backed Securities 9.7% Asset-Backed/Commercial
Mortgage-Backed Securities
2.6% Bank Loans and Mezzanine Loans 0.8% Investment Companies 0.5% Preferred Stocks 0.5% Other 0.4% 100.0%
Top Country Allocations - Long Positions - (% of Investment Securities) As of June 30, 2016
0.4%
0.3%
0.2%
0.2%
98.4%
0% 20% 40% 60% 80% 100%
United States
United Kingdom
Belgium
Taiwan
Germany
As of December 31, 2015
2.1%
0.5%
0.4%
0.4%
95.9%
0% 20% 40% 60% 80% 100%
United States
United Kingdom
Netherlands
Singapore
China
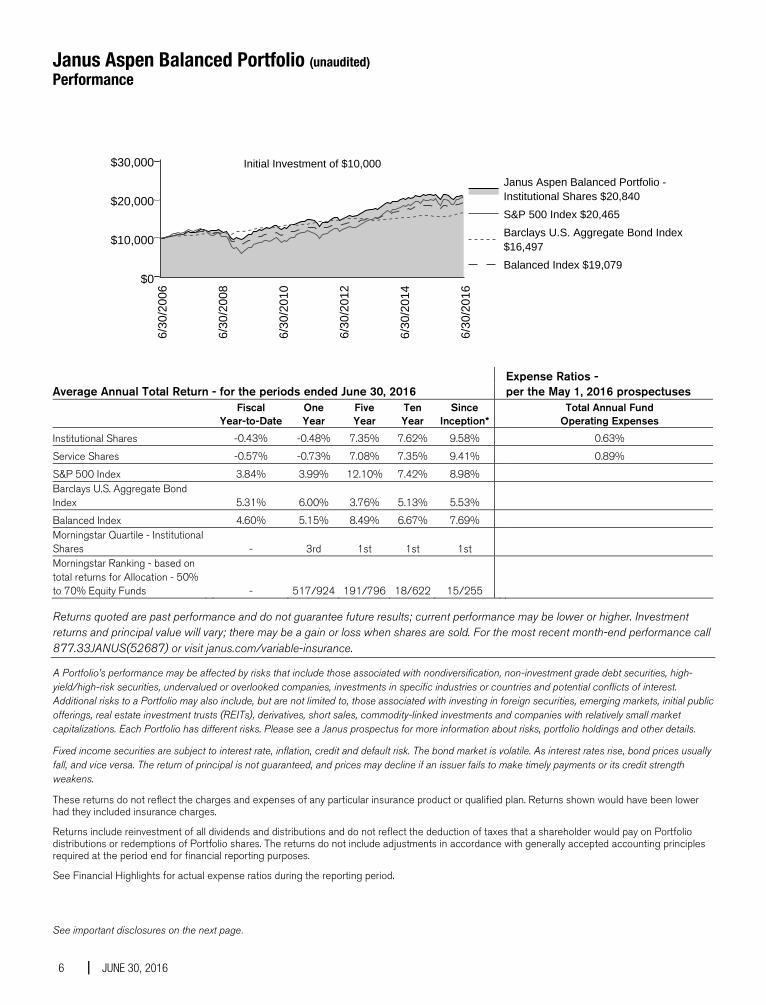
Janus Aspen Balanced Portfolio (unaudited) Performance
6 JUNE 30, 2016
Expense Ratios - Average Annual Total Return - for the periods ended June 30, 2016 per the May 1, 2016 prospectuses
Fiscal
Year-to-Date One Year
Five Year
Ten Year
Since Inception*
Total Annual Fund Operating Expenses
Institutional Shares -0.43% -0.48% 7.35% 7.62% 9.58% 0.63%
Service Shares -0.57% -0.73% 7.08% 7.35% 9.41% 0.89%
S&P 500 Index 3.84% 3.99% 12.10% 7.42% 8.98% Barclays U.S. Aggregate Bond Index 5.31% 6.00% 3.76% 5.13% 5.53%
Balanced Index 4.60% 5.15% 8.49% 6.67% 7.69% Morningstar Quartile - Institutional Shares - 3rd 1st 1st 1st Morningstar Ranking - based on total returns for Allocation - 50% to 70% Equity Funds - 517/924 191/796 18/622 15/255
Returns quoted are past performance and do not guarantee future results; current performance may be lower or higher. Investment returns and principal value will vary; there may be a gain or loss when shares are sold. For the most recent month-end performance call 877.33JANUS(52687) or visit janus.com/variable-insurance.
A Portfolio’s performance may be affected by risks that include those associated with nondiversification, non-investment grade debt securities, high-yield/high-risk securities, undervalued or overlooked companies, investments in specific industries or countries and potential conflicts of interest. Additional risks to a Portfolio may also include, but are not limited to, those associated with investing in foreign securities, emerging markets, initial public offerings, real estate investment trusts (REITs), derivatives, short sales, commodity-linked investments and companies with relatively small market capitalizations. Each Portfolio has different risks. Please see a Janus prospectus for more information about risks, portfolio holdings and other details.
Fixed income securities are subject to interest rate, inflation, credit and default risk. The bond market is volatile. As interest rates rise, bond prices usually fall, and vice versa. The return of principal is not guaranteed, and prices may decline if an issuer fails to make timely payments or its credit strength weakens.
These returns do not reflect the charges and expenses of any particular insurance product or qualified plan. Returns shown would have been lower had they included insurance charges.
Returns include reinvestment of all dividends and distributions and do not reflect the deduction of taxes that a shareholder would pay on Portfolio distributions or redemptions of Portfolio shares. The returns do not include adjustments in accordance with generally accepted accounting principles required at the period end for financial reporting purposes.
See Financial Highlights for actual expense ratios during the reporting period.
See important disclosures on the next page.
Janus Aspen Balanced Portfolio (unaudited) Performance
Janus Aspen Series 7
Performance for Service Shares prior to December 31, 1999 reflects the performance of Institutional Shares, adjusted to reflect the expenses of Service Shares.
Ranking is for the share class shown only; other classes may have different performance characteristics.
© 2016 Morningstar, Inc. All Rights Reserved.
There is no assurance that the investment process will consistently lead to successful investing.
See Notes to Schedule of Investments and Other Information for index definitions.
A Portfolio's holdings may differ significantly from the securities held in an index. An index is unmanaged and not available for direct investment; therefore, its performance does not reflect the expenses associated with the active management of an actual portfolio.
See “Useful Information About Your Portfolio Report.”
Effective April 1, 2016, Jeremiah Buckley, Marc Pinto, Mayur Saigal and Darrell Watters are Co-Portfolio Managers of the Portfolio.
*The Portfolio’s inception date – September 13, 1993
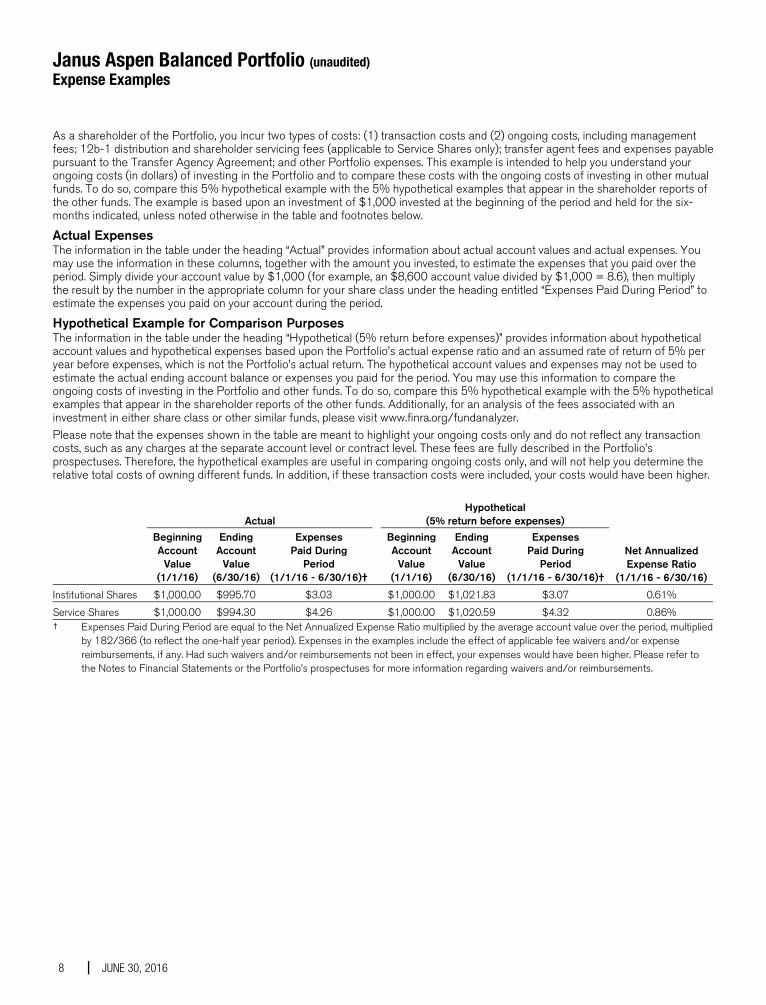
Janus Aspen Balanced Portfolio (unaudited) Expense Examples
8 JUNE 30, 2016
As a shareholder of the Portfolio, you incur two types of costs: (1) transaction costs and (2) ongoing costs, including management fees; 12b-1 distribution and shareholder servicing fees (applicable to Service Shares only); transfer agent fees and expenses payable pursuant to the Transfer Agency Agreement; and other Portfolio expenses. This example is intended to help you understand your ongoing costs (in dollars) of investing in the Portfolio and to compare these costs with the ongoing costs of investing in other mutual funds. To do so, compare this 5% hypothetical example with the 5% hypothetical examples that appear in the shareholder reports of the other funds. The example is based upon an investment of $1,000 invested at the beginning of the period and held for the six-months indicated, unless noted otherwise in the table and footnotes below.
Actual Expenses The information in the table under the heading “Actual” provides information about actual account values and actual expenses. You may use the information in these columns, together with the amount you invested, to estimate the expenses that you paid over the period. Simply divide your account value by $1,000 (for example, an $8,600 account value divided by $1,000 = 8.6), then multiply the result by the number in the appropriate column for your share class under the heading entitled “Expenses Paid During Period” to estimate the expenses you paid on your account during the period.
Hypothetical Example for Comparison Purposes The information in the table under the heading “Hypothetical (5% return before expenses)” provides information about hypothetical account values and hypothetical expenses based upon the Portfolio’s actual expense ratio and an assumed rate of return of 5% per year before expenses, which is not the Portfolio’s actual return. The hypothetical account values and expenses may not be used to estimate the actual ending account balance or expenses you paid for the period. You may use this information to compare the ongoing costs of investing in the Portfolio and other funds. To do so, compare this 5% hypothetical example with the 5% hypothetical examples that appear in the shareholder reports of the other funds. Additionally, for an analysis of the fees associated with an investment in either share class or other similar funds, please visit www.finra.org/fundanalyzer. Please note that the expenses shown in the table are meant to highlight your ongoing costs only and do not reflect any transaction costs, such as any charges at the separate account level or contract level. These fees are fully described in the Portfolio’s prospectuses. Therefore, the hypothetical examples are useful in comparing ongoing costs only, and will not help you determine the relative total costs of owning different funds. In addition, if these transaction costs were included, your costs would have been higher.
Actual Hypothetical
(5% return before expenses)
Beginning Account
Value (1/1/16)
Ending Account
Value (6/30/16)
Expenses Paid During
Period (1/1/16 - 6/30/16)†
BeginningAccount
Value (1/1/16)
Ending Account
Value (6/30/16)
Expenses Paid During
Period (1/1/16 - 6/30/16)†
Net Annualized Expense Ratio
(1/1/16 - 6/30/16)
Institutional Shares $1,000.00 $995.70 $3.03 $1,000.00 $1,021.83 $3.07 0.61%
Service Shares $1,000.00 $994.30 $4.26 $1,000.00 $1,020.59 $4.32 0.86% † Expenses Paid During Period are equal to the Net Annualized Expense Ratio multiplied by the average account value over the period, multiplied
by 182/366 (to reflect the one-half year period). Expenses in the examples include the effect of applicable fee waivers and/or expense reimbursements, if any. Had such waivers and/or reimbursements not been in effect, your expenses would have been higher. Please refer to the Notes to Financial Statements or the Portfolio’s prospectuses for more information regarding waivers and/or reimbursements.
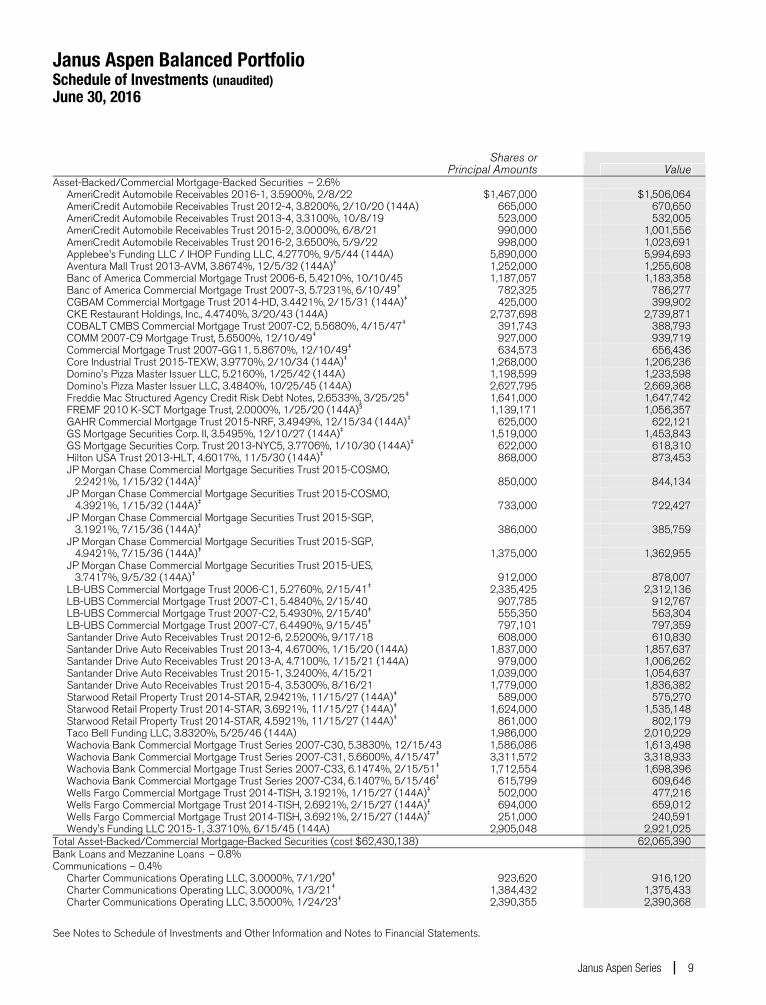
Janus Aspen Balanced Portfolio Schedule of Investments (unaudited) June 30, 2016
See Notes to Schedule of Investments and Other Information and Notes to Financial Statements.
Janus Aspen Series 9
Shares orPrincipal Amounts
Value
Asset-Backed/Commercial Mortgage-Backed Securities – 2.6% AmeriCredit Automobile Receivables 2016-1, 3.5900%, 2/8/22 $1,467,000 $1,506,064 AmeriCredit Automobile Receivables Trust 2012-4, 3.8200%, 2/10/20 (144A) 665,000 670,650 AmeriCredit Automobile Receivables Trust 2013-4, 3.3100%, 10/8/19 523,000 532,005 AmeriCredit Automobile Receivables Trust 2015-2, 3.0000%, 6/8/21 990,000 1,001,556 AmeriCredit Automobile Receivables Trust 2016-2, 3.6500%, 5/9/22 998,000 1,023,691 Applebee's Funding LLC / IHOP Funding LLC, 4.2770%, 9/5/44 (144A) 5,890,000 5,994,693 Aventura Mall Trust 2013-AVM, 3.8674%, 12/5/32 (144A)‡ 1,252,000 1,255,608 Banc of America Commercial Mortgage Trust 2006-6, 5.4210%, 10/10/45 1,187,057 1,183,358 Banc of America Commercial Mortgage Trust 2007-3, 5.7231%, 6/10/49‡ 782,325 786,277 CGBAM Commercial Mortgage Trust 2014-HD, 3.4421%, 2/15/31 (144A)‡ 425,000 399,902 CKE Restaurant Holdings, Inc., 4.4740%, 3/20/43 (144A) 2,737,698 2,739,871 COBALT CMBS Commercial Mortgage Trust 2007-C2, 5.5680%, 4/15/47‡ 391,743 388,793 COMM 2007-C9 Mortgage Trust, 5.6500%, 12/10/49‡ 927,000 939,719 Commercial Mortgage Trust 2007-GG11, 5.8670%, 12/10/49‡ 634,573 656,436 Core Industrial Trust 2015-TEXW, 3.9770%, 2/10/34 (144A)‡ 1,268,000 1,206,236 Domino's Pizza Master Issuer LLC, 5.2160%, 1/25/42 (144A) 1,198,599 1,233,598 Domino's Pizza Master Issuer LLC, 3.4840%, 10/25/45 (144A) 2,627,795 2,669,368 Freddie Mac Structured Agency Credit Risk Debt Notes, 2.6533%, 3/25/25‡ 1,641,000 1,647,742 FREMF 2010 K-SCT Mortgage Trust, 2.0000%, 1/25/20 (144A)§ 1,139,171 1,056,357 GAHR Commercial Mortgage Trust 2015-NRF, 3.4949%, 12/15/34 (144A)‡ 625,000 622,121 GS Mortgage Securities Corp. II, 3.5495%, 12/10/27 (144A)‡ 1,519,000 1,453,843 GS Mortgage Securities Corp. Trust 2013-NYC5, 3.7706%, 1/10/30 (144A)‡ 622,000 618,310 Hilton USA Trust 2013-HLT, 4.6017%, 11/5/30 (144A)‡ 868,000 873,453 JP Morgan Chase Commercial Mortgage Securities Trust 2015-COSMO, 2.2421%, 1/15/32 (144A)‡ 850,000 844,134 JP Morgan Chase Commercial Mortgage Securities Trust 2015-COSMO, 4.3921%, 1/15/32 (144A)‡ 733,000 722,427 JP Morgan Chase Commercial Mortgage Securities Trust 2015-SGP, 3.1921%, 7/15/36 (144A)‡ 386,000 385,759 JP Morgan Chase Commercial Mortgage Securities Trust 2015-SGP, 4.9421%, 7/15/36 (144A)‡ 1,375,000 1,362,955 JP Morgan Chase Commercial Mortgage Securities Trust 2015-UES, 3.7417%, 9/5/32 (144A)‡ 912,000 878,007 LB-UBS Commercial Mortgage Trust 2006-C1, 5.2760%, 2/15/41‡ 2,335,425 2,312,136 LB-UBS Commercial Mortgage Trust 2007-C1, 5.4840%, 2/15/40 907,785 912,767 LB-UBS Commercial Mortgage Trust 2007-C2, 5.4930%, 2/15/40‡ 555,350 563,304 LB-UBS Commercial Mortgage Trust 2007-C7, 6.4490%, 9/15/45‡ 797,101 797,359 Santander Drive Auto Receivables Trust 2012-6, 2.5200%, 9/17/18 608,000 610,830 Santander Drive Auto Receivables Trust 2013-4, 4.6700%, 1/15/20 (144A) 1,837,000 1,857,637 Santander Drive Auto Receivables Trust 2013-A, 4.7100%, 1/15/21 (144A) 979,000 1,006,262 Santander Drive Auto Receivables Trust 2015-1, 3.2400%, 4/15/21 1,039,000 1,054,637 Santander Drive Auto Receivables Trust 2015-4, 3.5300%, 8/16/21 1,779,000 1,836,382 Starwood Retail Property Trust 2014-STAR, 2.9421%, 11/15/27 (144A)‡ 589,000 575,270 Starwood Retail Property Trust 2014-STAR, 3.6921%, 11/15/27 (144A)‡ 1,624,000 1,535,148 Starwood Retail Property Trust 2014-STAR, 4.5921%, 11/15/27 (144A)‡ 861,000 802,179 Taco Bell Funding LLC, 3.8320%, 5/25/46 (144A) 1,986,000 2,010,229 Wachovia Bank Commercial Mortgage Trust Series 2007-C30, 5.3830%, 12/15/43 1,586,086 1,613,498 Wachovia Bank Commercial Mortgage Trust Series 2007-C31, 5.6600%, 4/15/47‡ 3,311,572 3,318,933 Wachovia Bank Commercial Mortgage Trust Series 2007-C33, 6.1474%, 2/15/51‡ 1,712,554 1,698,396 Wachovia Bank Commercial Mortgage Trust Series 2007-C34, 6.1407%, 5/15/46‡ 615,799 609,646 Wells Fargo Commercial Mortgage Trust 2014-TISH, 3.1921%, 1/15/27 (144A)‡ 502,000 477,216 Wells Fargo Commercial Mortgage Trust 2014-TISH, 2.6921%, 2/15/27 (144A)‡ 694,000 659,012 Wells Fargo Commercial Mortgage Trust 2014-TISH, 3.6921%, 2/15/27 (144A)‡ 251,000 240,591 Wendy's Funding LLC 2015-1, 3.3710%, 6/15/45 (144A) 2,905,048 2,921,025Total Asset-Backed/Commercial Mortgage-Backed Securities (cost $62,430,138) 62,065,390Bank Loans and Mezzanine Loans – 0.8% Communications – 0.4% Charter Communications Operating LLC, 3.0000%, 7/1/20‡ 923,620 916,120 Charter Communications Operating LLC, 3.0000%, 1/3/21‡ 1,384,432 1,375,433 Charter Communications Operating LLC, 3.5000%, 1/24/23‡ 2,390,355 2,390,368
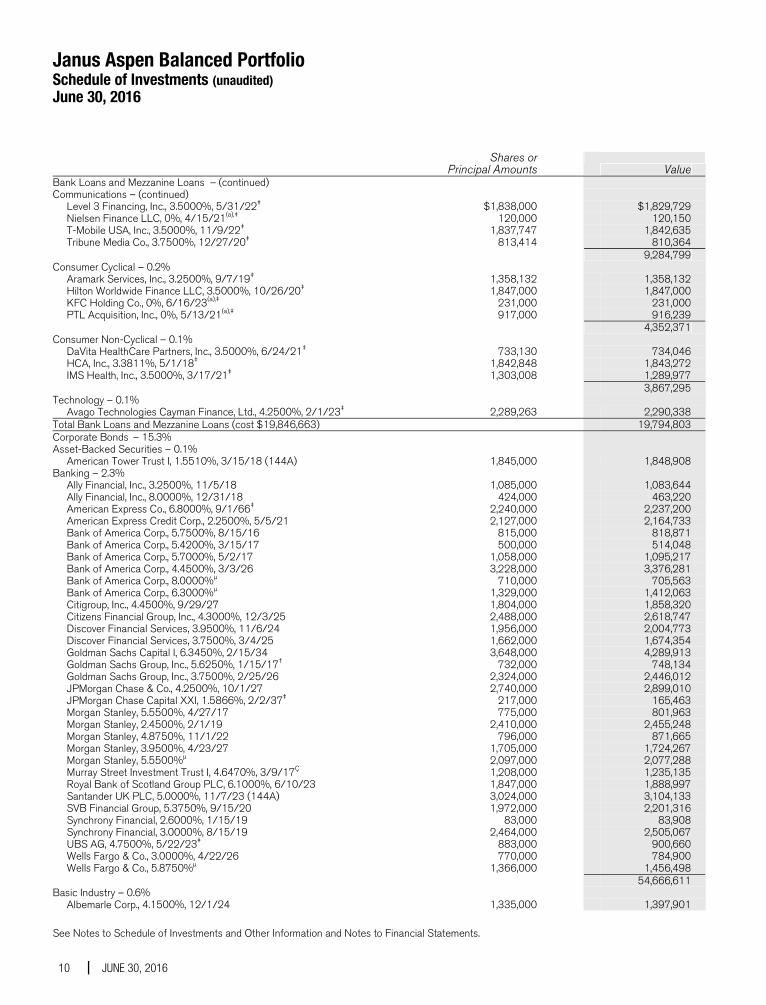
Janus Aspen Balanced Portfolio Schedule of Investments (unaudited) June 30, 2016
See Notes to Schedule of Investments and Other Information and Notes to Financial Statements.
10 JUNE 30, 2016
Shares orPrincipal Amounts
Value
Bank Loans and Mezzanine Loans – (continued) Communications – (continued) Level 3 Financing, Inc., 3.5000%, 5/31/22‡ $1,838,000 $1,829,729 Nielsen Finance LLC, 0%, 4/15/21(a),‡ 120,000 120,150 T-Mobile USA, Inc., 3.5000%, 11/9/22‡ 1,837,747 1,842,635 Tribune Media Co., 3.7500%, 12/27/20‡ 813,414 810,364 9,284,799Consumer Cyclical – 0.2% Aramark Services, Inc., 3.2500%, 9/7/19‡ 1,358,132 1,358,132 Hilton Worldwide Finance LLC, 3.5000%, 10/26/20‡ 1,847,000 1,847,000 KFC Holding Co., 0%, 6/16/23(a),‡ 231,000 231,000 PTL Acquisition, Inc., 0%, 5/13/21(a),‡ 917,000 916,239 4,352,371Consumer Non-Cyclical – 0.1% DaVita HealthCare Partners, Inc., 3.5000%, 6/24/21‡ 733,130 734,046 HCA, Inc., 3.3811%, 5/1/18‡ 1,842,848 1,843,272 IMS Health, Inc., 3.5000%, 3/17/21‡ 1,303,008 1,289,977 3,867,295Technology – 0.1% Avago Technologies Cayman Finance, Ltd., 4.2500%, 2/1/23‡ 2,289,263 2,290,338Total Bank Loans and Mezzanine Loans (cost $19,846,663) 19,794,803Corporate Bonds – 15.3% Asset-Backed Securities – 0.1% American Tower Trust I, 1.5510%, 3/15/18 (144A) 1,845,000 1,848,908Banking – 2.3% Ally Financial, Inc., 3.2500%, 11/5/18 1,085,000 1,083,644 Ally Financial, Inc., 8.0000%, 12/31/18 424,000 463,220 American Express Co., 6.8000%, 9/1/66‡ 2,240,000 2,237,200 American Express Credit Corp., 2.2500%, 5/5/21 2,127,000 2,164,733 Bank of America Corp., 5.7500%, 8/15/16 815,000 818,871 Bank of America Corp., 5.4200%, 3/15/17 500,000 514,048 Bank of America Corp., 5.7000%, 5/2/17 1,058,000 1,095,217 Bank of America Corp., 4.4500%, 3/3/26 3,228,000 3,376,281 Bank of America Corp., 8.0000%μ 710,000 705,563 Bank of America Corp., 6.3000%μ 1,329,000 1,412,063 Citigroup, Inc., 4.4500%, 9/29/27 1,804,000 1,858,320 Citizens Financial Group, Inc., 4.3000%, 12/3/25 2,488,000 2,618,747 Discover Financial Services, 3.9500%, 11/6/24 1,956,000 2,004,773 Discover Financial Services, 3.7500%, 3/4/25 1,662,000 1,674,354 Goldman Sachs Capital I, 6.3450%, 2/15/34 3,648,000 4,289,913 Goldman Sachs Group, Inc., 5.6250%, 1/15/17† 732,000 748,134 Goldman Sachs Group, Inc., 3.7500%, 2/25/26 2,324,000 2,446,012 JPMorgan Chase & Co., 4.2500%, 10/1/27 2,740,000 2,899,010 JPMorgan Chase Capital XXI, 1.5866%, 2/2/37‡ 217,000 165,463 Morgan Stanley, 5.5500%, 4/27/17 775,000 801,963 Morgan Stanley, 2.4500%, 2/1/19 2,410,000 2,455,248 Morgan Stanley, 4.8750%, 11/1/22 796,000 871,665 Morgan Stanley, 3.9500%, 4/23/27 1,705,000 1,724,267 Morgan Stanley, 5.5500%μ 2,097,000 2,077,288 Murray Street Investment Trust I, 4.6470%, 3/9/17Ç 1,208,000 1,235,135 Royal Bank of Scotland Group PLC, 6.1000%, 6/10/23 1,847,000 1,888,997 Santander UK PLC, 5.0000%, 11/7/23 (144A) 3,024,000 3,104,133 SVB Financial Group, 5.3750%, 9/15/20 1,972,000 2,201,316 Synchrony Financial, 2.6000%, 1/15/19 83,000 83,908 Synchrony Financial, 3.0000%, 8/15/19 2,464,000 2,505,067 UBS AG, 4.7500%, 5/22/23‡ 883,000 900,660 Wells Fargo & Co., 3.0000%, 4/22/26 770,000 784,900 Wells Fargo & Co., 5.8750%μ 1,366,000 1,456,498 54,666,611Basic Industry – 0.6% Albemarle Corp., 4.1500%, 12/1/24 1,335,000 1,397,901
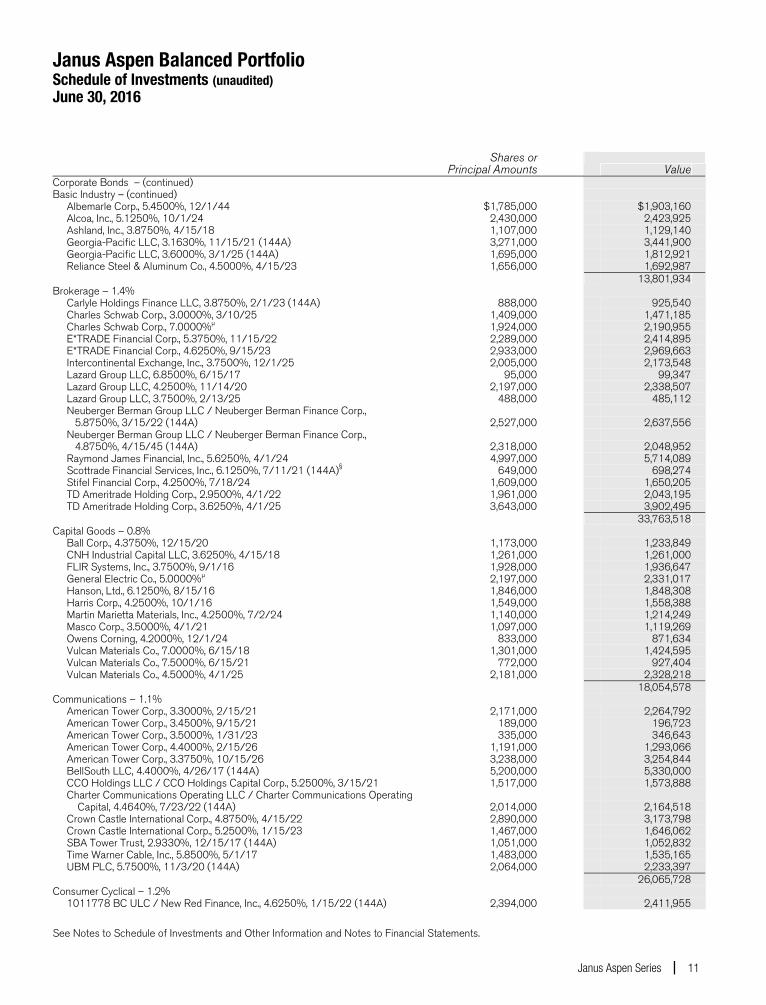
Janus Aspen Balanced Portfolio Schedule of Investments (unaudited) June 30, 2016
See Notes to Schedule of Investments and Other Information and Notes to Financial Statements.
Janus Aspen Series 11
Shares orPrincipal Amounts
Value
Corporate Bonds – (continued) Basic Industry – (continued) Albemarle Corp., 5.4500%, 12/1/44 $1,785,000 $1,903,160 Alcoa, Inc., 5.1250%, 10/1/24 2,430,000 2,423,925 Ashland, Inc., 3.8750%, 4/15/18 1,107,000 1,129,140 Georgia-Pacific LLC, 3.1630%, 11/15/21 (144A) 3,271,000 3,441,900 Georgia-Pacific LLC, 3.6000%, 3/1/25 (144A) 1,695,000 1,812,921 Reliance Steel & Aluminum Co., 4.5000%, 4/15/23 1,656,000 1,692,987 13,801,934Brokerage – 1.4% Carlyle Holdings Finance LLC, 3.8750%, 2/1/23 (144A) 888,000 925,540 Charles Schwab Corp., 3.0000%, 3/10/25 1,409,000 1,471,185 Charles Schwab Corp., 7.0000%μ 1,924,000 2,190,955 E*TRADE Financial Corp., 5.3750%, 11/15/22 2,289,000 2,414,895 E*TRADE Financial Corp., 4.6250%, 9/15/23 2,933,000 2,969,663 Intercontinental Exchange, Inc., 3.7500%, 12/1/25 2,005,000 2,173,548 Lazard Group LLC, 6.8500%, 6/15/17 95,000 99,347 Lazard Group LLC, 4.2500%, 11/14/20 2,197,000 2,338,507 Lazard Group LLC, 3.7500%, 2/13/25 488,000 485,112 Neuberger Berman Group LLC / Neuberger Berman Finance Corp., 5.8750%, 3/15/22 (144A) 2,527,000 2,637,556 Neuberger Berman Group LLC / Neuberger Berman Finance Corp., 4.8750%, 4/15/45 (144A) 2,318,000 2,048,952 Raymond James Financial, Inc., 5.6250%, 4/1/24 4,997,000 5,714,089 Scottrade Financial Services, Inc., 6.1250%, 7/11/21 (144A)§ 649,000 698,274 Stifel Financial Corp., 4.2500%, 7/18/24 1,609,000 1,650,205 TD Ameritrade Holding Corp., 2.9500%, 4/1/22 1,961,000 2,043,195 TD Ameritrade Holding Corp., 3.6250%, 4/1/25 3,643,000 3,902,495 33,763,518Capital Goods – 0.8% Ball Corp., 4.3750%, 12/15/20 1,173,000 1,233,849 CNH Industrial Capital LLC, 3.6250%, 4/15/18 1,261,000 1,261,000 FLIR Systems, Inc., 3.7500%, 9/1/16 1,928,000 1,936,647 General Electric Co., 5.0000%μ 2,197,000 2,331,017 Hanson, Ltd., 6.1250%, 8/15/16 1,846,000 1,848,308 Harris Corp., 4.2500%, 10/1/16 1,549,000 1,558,388 Martin Marietta Materials, Inc., 4.2500%, 7/2/24 1,140,000 1,214,249 Masco Corp., 3.5000%, 4/1/21 1,097,000 1,119,269 Owens Corning, 4.2000%, 12/1/24 833,000 871,634 Vulcan Materials Co., 7.0000%, 6/15/18 1,301,000 1,424,595 Vulcan Materials Co., 7.5000%, 6/15/21 772,000 927,404 Vulcan Materials Co., 4.5000%, 4/1/25 2,181,000 2,328,218 18,054,578Communications – 1.1% American Tower Corp., 3.3000%, 2/15/21 2,171,000 2,264,792 American Tower Corp., 3.4500%, 9/15/21 189,000 196,723 American Tower Corp., 3.5000%, 1/31/23 335,000 346,643 American Tower Corp., 4.4000%, 2/15/26 1,191,000 1,293,066 American Tower Corp., 3.3750%, 10/15/26 3,238,000 3,254,844 BellSouth LLC, 4.4000%, 4/26/17 (144A) 5,200,000 5,330,000 CCO Holdings LLC / CCO Holdings Capital Corp., 5.2500%, 3/15/21 1,517,000 1,573,888 Charter Communications Operating LLC / Charter Communications Operating Capital, 4.4640%, 7/23/22 (144A) 2,014,000 2,164,518 Crown Castle International Corp., 4.8750%, 4/15/22 2,890,000 3,173,798 Crown Castle International Corp., 5.2500%, 1/15/23 1,467,000 1,646,062 SBA Tower Trust, 2.9330%, 12/15/17 (144A) 1,051,000 1,052,832 Time Warner Cable, Inc., 5.8500%, 5/1/17 1,483,000 1,535,165 UBM PLC, 5.7500%, 11/3/20 (144A) 2,064,000 2,233,397 26,065,728Consumer Cyclical – 1.2% 1011778 BC ULC / New Red Finance, Inc., 4.6250%, 1/15/22 (144A) 2,394,000 2,411,955
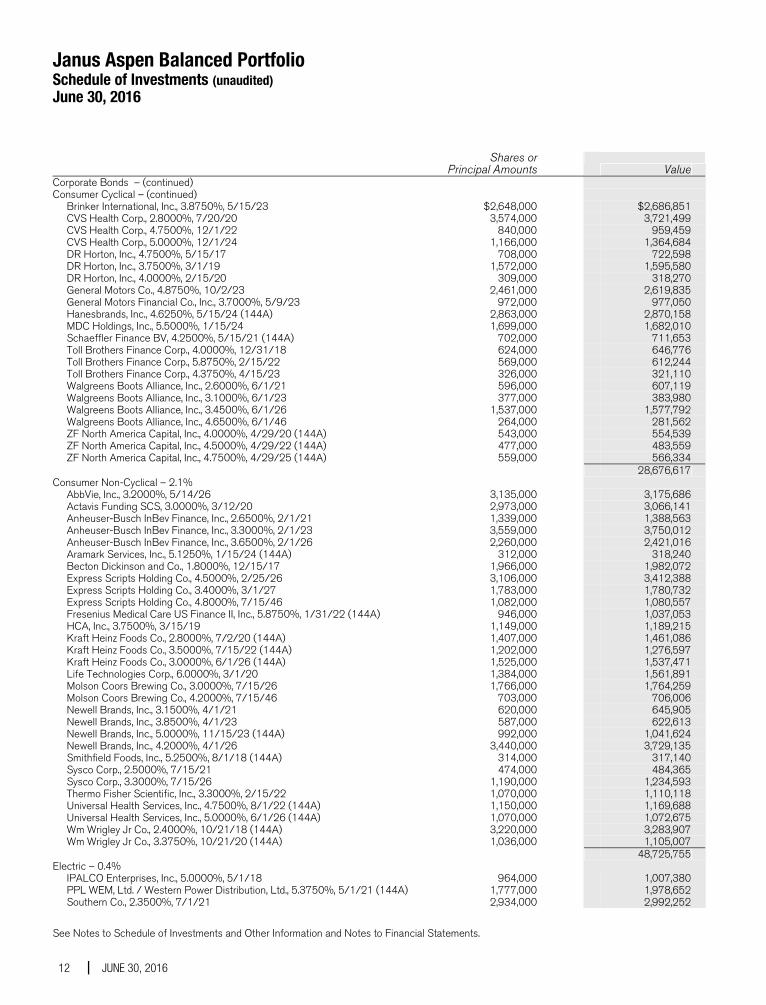
Janus Aspen Balanced Portfolio Schedule of Investments (unaudited) June 30, 2016
See Notes to Schedule of Investments and Other Information and Notes to Financial Statements.
12 JUNE 30, 2016
Shares orPrincipal Amounts
Value
Corporate Bonds – (continued) Consumer Cyclical – (continued) Brinker International, Inc., 3.8750%, 5/15/23 $2,648,000 $2,686,851 CVS Health Corp., 2.8000%, 7/20/20 3,574,000 3,721,499 CVS Health Corp., 4.7500%, 12/1/22 840,000 959,459 CVS Health Corp., 5.0000%, 12/1/24 1,166,000 1,364,684 DR Horton, Inc., 4.7500%, 5/15/17 708,000 722,598 DR Horton, Inc., 3.7500%, 3/1/19 1,572,000 1,595,580 DR Horton, Inc., 4.0000%, 2/15/20 309,000 318,270 General Motors Co., 4.8750%, 10/2/23 2,461,000 2,619,835 General Motors Financial Co., Inc., 3.7000%, 5/9/23 972,000 977,050 Hanesbrands, Inc., 4.6250%, 5/15/24 (144A) 2,863,000 2,870,158 MDC Holdings, Inc., 5.5000%, 1/15/24 1,699,000 1,682,010 Schaeffler Finance BV, 4.2500%, 5/15/21 (144A) 702,000 711,653 Toll Brothers Finance Corp., 4.0000%, 12/31/18 624,000 646,776 Toll Brothers Finance Corp., 5.8750%, 2/15/22 569,000 612,244 Toll Brothers Finance Corp., 4.3750%, 4/15/23 326,000 321,110 Walgreens Boots Alliance, Inc., 2.6000%, 6/1/21 596,000 607,119 Walgreens Boots Alliance, Inc., 3.1000%, 6/1/23 377,000 383,980 Walgreens Boots Alliance, Inc., 3.4500%, 6/1/26 1,537,000 1,577,792 Walgreens Boots Alliance, Inc., 4.6500%, 6/1/46 264,000 281,562 ZF North America Capital, Inc., 4.0000%, 4/29/20 (144A) 543,000 554,539 ZF North America Capital, Inc., 4.5000%, 4/29/22 (144A) 477,000 483,559 ZF North America Capital, Inc., 4.7500%, 4/29/25 (144A) 559,000 566,334 28,676,617Consumer Non-Cyclical – 2.1% AbbVie, Inc., 3.2000%, 5/14/26 3,135,000 3,175,686 Actavis Funding SCS, 3.0000%, 3/12/20 2,973,000 3,066,141 Anheuser-Busch InBev Finance, Inc., 2.6500%, 2/1/21 1,339,000 1,388,563 Anheuser-Busch InBev Finance, Inc., 3.3000%, 2/1/23 3,559,000 3,750,012 Anheuser-Busch InBev Finance, Inc., 3.6500%, 2/1/26 2,260,000 2,421,016 Aramark Services, Inc., 5.1250%, 1/15/24 (144A) 312,000 318,240 Becton Dickinson and Co., 1.8000%, 12/15/17 1,966,000 1,982,072 Express Scripts Holding Co., 4.5000%, 2/25/26 3,106,000 3,412,388 Express Scripts Holding Co., 3.4000%, 3/1/27 1,783,000 1,780,732 Express Scripts Holding Co., 4.8000%, 7/15/46 1,082,000 1,080,557 Fresenius Medical Care US Finance II, Inc., 5.8750%, 1/31/22 (144A) 946,000 1,037,053 HCA, Inc., 3.7500%, 3/15/19 1,149,000 1,189,215 Kraft Heinz Foods Co., 2.8000%, 7/2/20 (144A) 1,407,000 1,461,086 Kraft Heinz Foods Co., 3.5000%, 7/15/22 (144A) 1,202,000 1,276,597 Kraft Heinz Foods Co., 3.0000%, 6/1/26 (144A) 1,525,000 1,537,471 Life Technologies Corp., 6.0000%, 3/1/20 1,384,000 1,561,891 Molson Coors Brewing Co., 3.0000%, 7/15/26 1,766,000 1,764,259 Molson Coors Brewing Co., 4.2000%, 7/15/46 703,000 706,006 Newell Brands, Inc., 3.1500%, 4/1/21 620,000 645,905 Newell Brands, Inc., 3.8500%, 4/1/23 587,000 622,613 Newell Brands, Inc., 5.0000%, 11/15/23 (144A) 992,000 1,041,624 Newell Brands, Inc., 4.2000%, 4/1/26 3,440,000 3,729,135 Smithfield Foods, Inc., 5.2500%, 8/1/18 (144A) 314,000 317,140 Sysco Corp., 2.5000%, 7/15/21 474,000 484,365 Sysco Corp., 3.3000%, 7/15/26 1,190,000 1,234,593 Thermo Fisher Scientific, Inc., 3.3000%, 2/15/22 1,070,000 1,110,118 Universal Health Services, Inc., 4.7500%, 8/1/22 (144A) 1,150,000 1,169,688 Universal Health Services, Inc., 5.0000%, 6/1/26 (144A) 1,070,000 1,072,675 Wm Wrigley Jr Co., 2.4000%, 10/21/18 (144A) 3,220,000 3,283,907 Wm Wrigley Jr Co., 3.3750%, 10/21/20 (144A) 1,036,000 1,105,007 48,725,755Electric – 0.4% IPALCO Enterprises, Inc., 5.0000%, 5/1/18 964,000 1,007,380 PPL WEM, Ltd. / Western Power Distribution, Ltd., 5.3750%, 5/1/21 (144A) 1,777,000 1,978,652 Southern Co., 2.3500%, 7/1/21 2,934,000 2,992,252
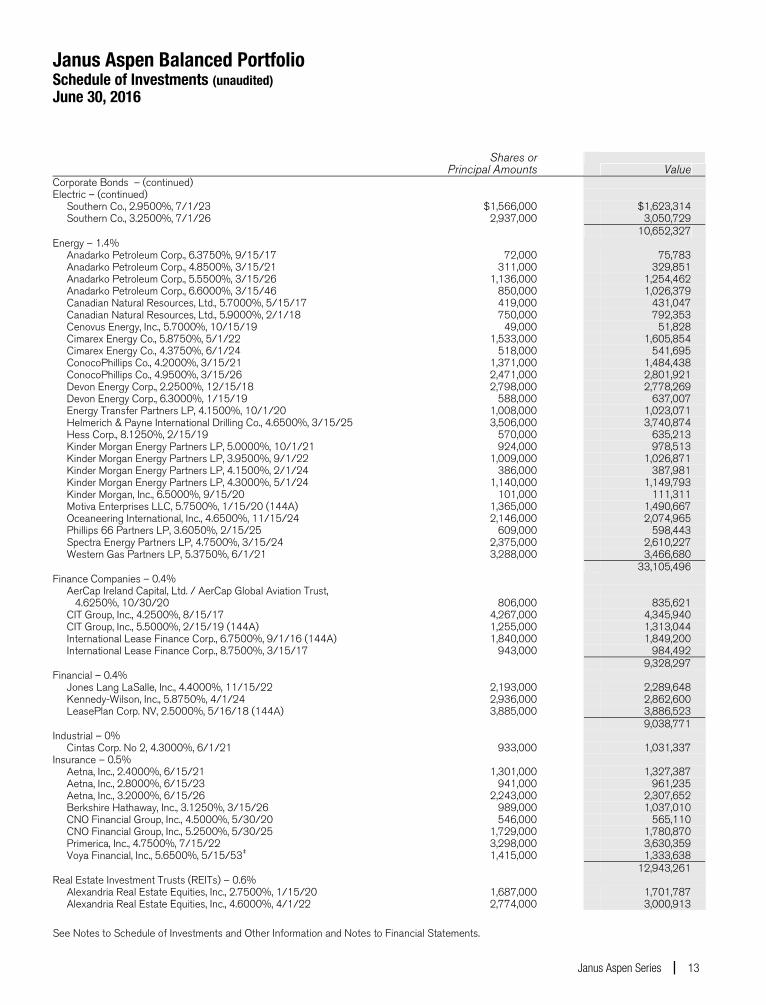
Janus Aspen Balanced Portfolio Schedule of Investments (unaudited) June 30, 2016
See Notes to Schedule of Investments and Other Information and Notes to Financial Statements.
Janus Aspen Series 13
Shares orPrincipal Amounts
Value
Corporate Bonds – (continued) Electric – (continued) Southern Co., 2.9500%, 7/1/23 $1,566,000 $1,623,314 Southern Co., 3.2500%, 7/1/26 2,937,000 3,050,729 10,652,327Energy – 1.4% Anadarko Petroleum Corp., 6.3750%, 9/15/17 72,000 75,783 Anadarko Petroleum Corp., 4.8500%, 3/15/21 311,000 329,851 Anadarko Petroleum Corp., 5.5500%, 3/15/26 1,136,000 1,254,462 Anadarko Petroleum Corp., 6.6000%, 3/15/46 850,000 1,026,379 Canadian Natural Resources, Ltd., 5.7000%, 5/15/17 419,000 431,047 Canadian Natural Resources, Ltd., 5.9000%, 2/1/18 750,000 792,353 Cenovus Energy, Inc., 5.7000%, 10/15/19 49,000 51,828 Cimarex Energy Co., 5.8750%, 5/1/22 1,533,000 1,605,854 Cimarex Energy Co., 4.3750%, 6/1/24 518,000 541,695 ConocoPhillips Co., 4.2000%, 3/15/21 1,371,000 1,484,438 ConocoPhillips Co., 4.9500%, 3/15/26 2,471,000 2,801,921 Devon Energy Corp., 2.2500%, 12/15/18 2,798,000 2,778,269 Devon Energy Corp., 6.3000%, 1/15/19 588,000 637,007 Energy Transfer Partners LP, 4.1500%, 10/1/20 1,008,000 1,023,071 Helmerich & Payne International Drilling Co., 4.6500%, 3/15/25 3,506,000 3,740,874 Hess Corp., 8.1250%, 2/15/19 570,000 635,213 Kinder Morgan Energy Partners LP, 5.0000%, 10/1/21 924,000 978,513 Kinder Morgan Energy Partners LP, 3.9500%, 9/1/22 1,009,000 1,026,871 Kinder Morgan Energy Partners LP, 4.1500%, 2/1/24 386,000 387,981 Kinder Morgan Energy Partners LP, 4.3000%, 5/1/24 1,140,000 1,149,793 Kinder Morgan, Inc., 6.5000%, 9/15/20 101,000 111,311 Motiva Enterprises LLC, 5.7500%, 1/15/20 (144A) 1,365,000 1,490,667 Oceaneering International, Inc., 4.6500%, 11/15/24 2,146,000 2,074,965 Phillips 66 Partners LP, 3.6050%, 2/15/25 609,000 598,443 Spectra Energy Partners LP, 4.7500%, 3/15/24 2,375,000 2,610,227 Western Gas Partners LP, 5.3750%, 6/1/21 3,288,000 3,466,680 33,105,496Finance Companies – 0.4% AerCap Ireland Capital, Ltd. / AerCap Global Aviation Trust, 4.6250%, 10/30/20 806,000 835,621 CIT Group, Inc., 4.2500%, 8/15/17 4,267,000 4,345,940 CIT Group, Inc., 5.5000%, 2/15/19 (144A) 1,255,000 1,313,044 International Lease Finance Corp., 6.7500%, 9/1/16 (144A) 1,840,000 1,849,200 International Lease Finance Corp., 8.7500%, 3/15/17 943,000 984,492 9,328,297Financial – 0.4% Jones Lang LaSalle, Inc., 4.4000%, 11/15/22 2,193,000 2,289,648 Kennedy-Wilson, Inc., 5.8750%, 4/1/24 2,936,000 2,862,600 LeasePlan Corp. NV, 2.5000%, 5/16/18 (144A) 3,885,000 3,886,523 9,038,771Industrial – 0% Cintas Corp. No 2, 4.3000%, 6/1/21 933,000 1,031,337Insurance – 0.5% Aetna, Inc., 2.4000%, 6/15/21 1,301,000 1,327,387 Aetna, Inc., 2.8000%, 6/15/23 941,000 961,235 Aetna, Inc., 3.2000%, 6/15/26 2,243,000 2,307,652 Berkshire Hathaway, Inc., 3.1250%, 3/15/26 989,000 1,037,010 CNO Financial Group, Inc., 4.5000%, 5/30/20 546,000 565,110 CNO Financial Group, Inc., 5.2500%, 5/30/25 1,729,000 1,780,870 Primerica, Inc., 4.7500%, 7/15/22 3,298,000 3,630,359 Voya Financial, Inc., 5.6500%, 5/15/53‡ 1,415,000 1,333,638 12,943,261Real Estate Investment Trusts (REITs) – 0.6% Alexandria Real Estate Equities, Inc., 2.7500%, 1/15/20 1,687,000 1,701,787 Alexandria Real Estate Equities, Inc., 4.6000%, 4/1/22 2,774,000 3,000,913
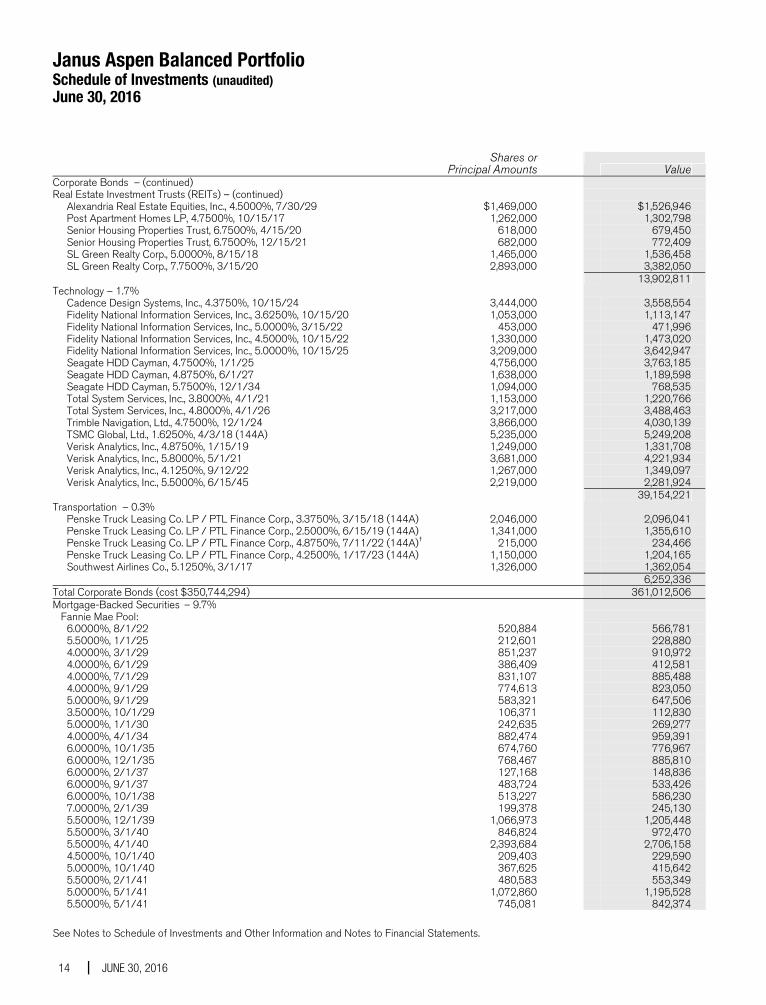
Janus Aspen Balanced Portfolio Schedule of Investments (unaudited) June 30, 2016
See Notes to Schedule of Investments and Other Information and Notes to Financial Statements.
14 JUNE 30, 2016
Shares orPrincipal Amounts
Value
Corporate Bonds – (continued) Real Estate Investment Trusts (REITs) – (continued) Alexandria Real Estate Equities, Inc., 4.5000%, 7/30/29 $1,469,000 $1,526,946 Post Apartment Homes LP, 4.7500%, 10/15/17 1,262,000 1,302,798 Senior Housing Properties Trust, 6.7500%, 4/15/20 618,000 679,450 Senior Housing Properties Trust, 6.7500%, 12/15/21 682,000 772,409 SL Green Realty Corp., 5.0000%, 8/15/18 1,465,000 1,536,458 SL Green Realty Corp., 7.7500%, 3/15/20 2,893,000 3,382,050 13,902,811Technology – 1.7% Cadence Design Systems, Inc., 4.3750%, 10/15/24 3,444,000 3,558,554 Fidelity National Information Services, Inc., 3.6250%, 10/15/20 1,053,000 1,113,147 Fidelity National Information Services, Inc., 5.0000%, 3/15/22 453,000 471,996 Fidelity National Information Services, Inc., 4.5000%, 10/15/22 1,330,000 1,473,020 Fidelity National Information Services, Inc., 5.0000%, 10/15/25 3,209,000 3,642,947 Seagate HDD Cayman, 4.7500%, 1/1/25 4,756,000 3,763,185 Seagate HDD Cayman, 4.8750%, 6/1/27 1,638,000 1,189,598 Seagate HDD Cayman, 5.7500%, 12/1/34 1,094,000 768,535 Total System Services, Inc., 3.8000%, 4/1/21 1,153,000 1,220,766 Total System Services, Inc., 4.8000%, 4/1/26 3,217,000 3,488,463 Trimble Navigation, Ltd., 4.7500%, 12/1/24 3,866,000 4,030,139 TSMC Global, Ltd., 1.6250%, 4/3/18 (144A) 5,235,000 5,249,208 Verisk Analytics, Inc., 4.8750%, 1/15/19 1,249,000 1,331,708 Verisk Analytics, Inc., 5.8000%, 5/1/21 3,681,000 4,221,934 Verisk Analytics, Inc., 4.1250%, 9/12/22 1,267,000 1,349,097 Verisk Analytics, Inc., 5.5000%, 6/15/45 2,219,000 2,281,924 39,154,221Transportation – 0.3% Penske Truck Leasing Co. LP / PTL Finance Corp., 3.3750%, 3/15/18 (144A) 2,046,000 2,096,041 Penske Truck Leasing Co. LP / PTL Finance Corp., 2.5000%, 6/15/19 (144A) 1,341,000 1,355,610 Penske Truck Leasing Co. LP / PTL Finance Corp., 4.8750%, 7/11/22 (144A)† 215,000 234,466 Penske Truck Leasing Co. LP / PTL Finance Corp., 4.2500%, 1/17/23 (144A) 1,150,000 1,204,165 Southwest Airlines Co., 5.1250%, 3/1/17 1,326,000 1,362,054 6,252,336Total Corporate Bonds (cost $350,744,294) 361,012,506Mortgage-Backed Securities – 9.7% Fannie Mae Pool: 6.0000%, 8/1/22 520,884 566,781 5.5000%, 1/1/25 212,601 228,880 4.0000%, 3/1/29 851,237 910,972 4.0000%, 6/1/29 386,409 412,581 4.0000%, 7/1/29 831,107 885,488 4.0000%, 9/1/29 774,613 823,050 5.0000%, 9/1/29 583,321 647,506 3.5000%, 10/1/29 106,371 112,830 5.0000%, 1/1/30 242,635 269,277 4.0000%, 4/1/34 882,474 959,391 6.0000%, 10/1/35 674,760 776,967 6.0000%, 12/1/35 768,467 885,810 6.0000%, 2/1/37 127,168 148,836 6.0000%, 9/1/37 483,724 533,426 6.0000%, 10/1/38 513,227 586,230 7.0000%, 2/1/39 199,378 245,130 5.5000%, 12/1/39 1,066,973 1,205,448 5.5000%, 3/1/40 846,824 972,470 5.5000%, 4/1/40 2,393,684 2,706,158 4.5000%, 10/1/40 209,403 229,590 5.0000%, 10/1/40 367,625 415,642 5.5000%, 2/1/41 480,583 553,349 5.0000%, 5/1/41 1,072,860 1,195,528 5.5000%, 5/1/41 745,081 842,374
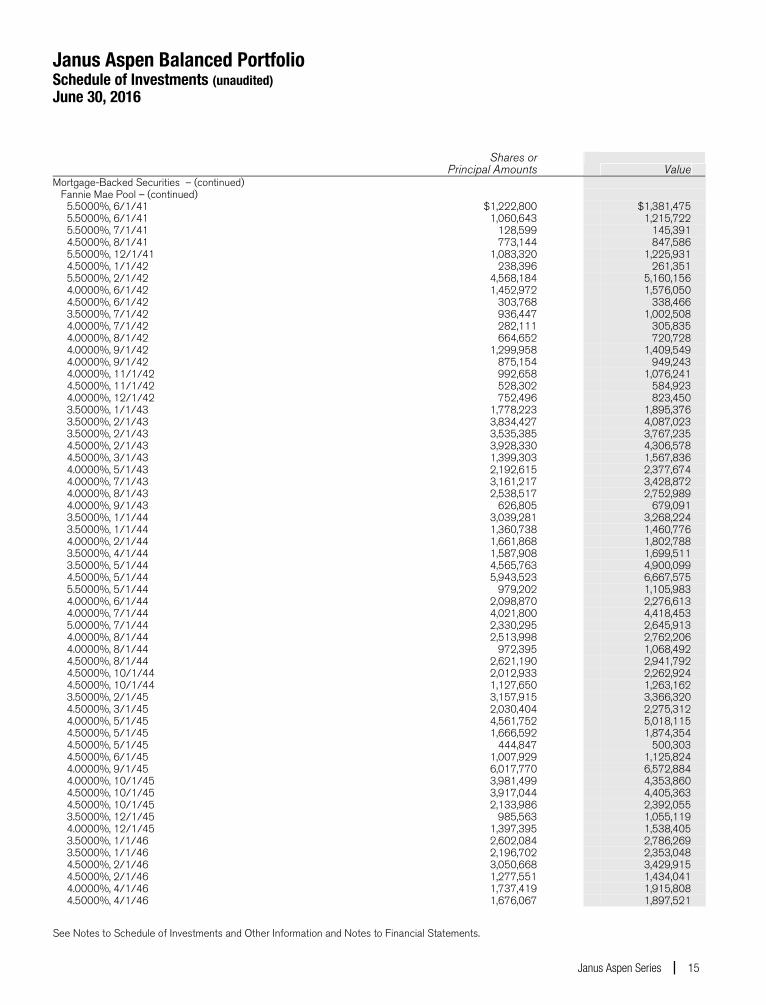
Janus Aspen Balanced Portfolio Schedule of Investments (unaudited) June 30, 2016
See Notes to Schedule of Investments and Other Information and Notes to Financial Statements.
Janus Aspen Series 15
Shares orPrincipal Amounts
Value
Mortgage-Backed Securities – (continued) Fannie Mae Pool – (continued) 5.5000%, 6/1/41 $1,222,800 $1,381,475 5.5000%, 6/1/41 1,060,643 1,215,722 5.5000%, 7/1/41 128,599 145,391 4.5000%, 8/1/41 773,144 847,586 5.5000%, 12/1/41 1,083,320 1,225,931 4.5000%, 1/1/42 238,396 261,351 5.5000%, 2/1/42 4,568,184 5,160,156 4.0000%, 6/1/42 1,452,972 1,576,050 4.5000%, 6/1/42 303,768 338,466 3.5000%, 7/1/42 936,447 1,002,508 4.0000%, 7/1/42 282,111 305,835 4.0000%, 8/1/42 664,652 720,728 4.0000%, 9/1/42 1,299,958 1,409,549 4.0000%, 9/1/42 875,154 949,243 4.0000%, 11/1/42 992,658 1,076,241 4.5000%, 11/1/42 528,302 584,923 4.0000%, 12/1/42 752,496 823,450 3.5000%, 1/1/43 1,778,223 1,895,376 3.5000%, 2/1/43 3,834,427 4,087,023 3.5000%, 2/1/43 3,535,385 3,767,235 4.5000%, 2/1/43 3,928,330 4,306,578 4.5000%, 3/1/43 1,399,303 1,567,836 4.0000%, 5/1/43 2,192,615 2,377,674 4.0000%, 7/1/43 3,161,217 3,428,872 4.0000%, 8/1/43 2,538,517 2,752,989 4.0000%, 9/1/43 626,805 679,091 3.5000%, 1/1/44 3,039,281 3,268,224 3.5000%, 1/1/44 1,360,738 1,460,776 4.0000%, 2/1/44 1,661,868 1,802,788 3.5000%, 4/1/44 1,587,908 1,699,511 3.5000%, 5/1/44 4,565,763 4,900,099 4.5000%, 5/1/44 5,943,523 6,667,575 5.5000%, 5/1/44 979,202 1,105,983 4.0000%, 6/1/44 2,098,870 2,276,613 4.0000%, 7/1/44 4,021,800 4,418,453 5.0000%, 7/1/44 2,330,295 2,645,913 4.0000%, 8/1/44 2,513,998 2,762,206 4.0000%, 8/1/44 972,395 1,068,492 4.5000%, 8/1/44 2,621,190 2,941,792 4.5000%, 10/1/44 2,012,933 2,262,924 4.5000%, 10/1/44 1,127,650 1,263,162 3.5000%, 2/1/45 3,157,915 3,366,320 4.5000%, 3/1/45 2,030,404 2,275,312 4.0000%, 5/1/45 4,561,752 5,018,115 4.5000%, 5/1/45 1,666,592 1,874,354 4.5000%, 5/1/45 444,847 500,303 4.5000%, 6/1/45 1,007,929 1,125,824 4.0000%, 9/1/45 6,017,770 6,572,884 4.0000%, 10/1/45 3,981,499 4,353,860 4.5000%, 10/1/45 3,917,044 4,405,363 4.5000%, 10/1/45 2,133,986 2,392,055 3.5000%, 12/1/45 985,563 1,055,119 4.0000%, 12/1/45 1,397,395 1,538,405 3.5000%, 1/1/46 2,602,084 2,786,269 3.5000%, 1/1/46 2,196,702 2,353,048 4.5000%, 2/1/46 3,050,668 3,429,915 4.5000%, 2/1/46 1,277,551 1,434,041 4.0000%, 4/1/46 1,737,419 1,915,808 4.5000%, 4/1/46 1,676,067 1,897,521
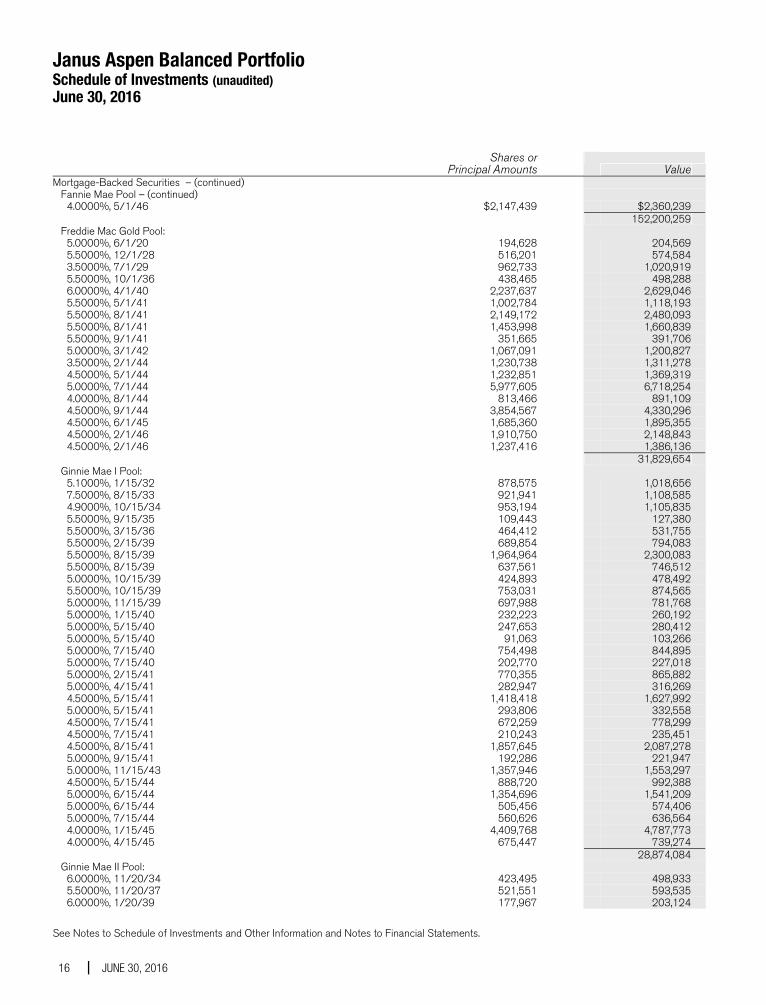
Janus Aspen Balanced Portfolio Schedule of Investments (unaudited) June 30, 2016
See Notes to Schedule of Investments and Other Information and Notes to Financial Statements.
16 JUNE 30, 2016
Shares orPrincipal Amounts
Value
Mortgage-Backed Securities – (continued) Fannie Mae Pool – (continued) 4.0000%, 5/1/46 $2,147,439 $2,360,239 152,200,259 Freddie Mac Gold Pool: 5.0000%, 6/1/20 194,628 204,569 5.5000%, 12/1/28 516,201 574,584 3.5000%, 7/1/29 962,733 1,020,919 5.5000%, 10/1/36 438,465 498,288 6.0000%, 4/1/40 2,237,637 2,629,046 5.5000%, 5/1/41 1,002,784 1,118,193 5.5000%, 8/1/41 2,149,172 2,480,093 5.5000%, 8/1/41 1,453,998 1,660,839 5.5000%, 9/1/41 351,665 391,706 5.0000%, 3/1/42 1,067,091 1,200,827 3.5000%, 2/1/44 1,230,738 1,311,278 4.5000%, 5/1/44 1,232,851 1,369,319 5.0000%, 7/1/44 5,977,605 6,718,254 4.0000%, 8/1/44 813,466 891,109 4.5000%, 9/1/44 3,854,567 4,330,296 4.5000%, 6/1/45 1,685,360 1,895,355 4.5000%, 2/1/46 1,910,750 2,148,843 4.5000%, 2/1/46 1,237,416 1,386,136 31,829,654 Ginnie Mae I Pool: 5.1000%, 1/15/32 878,575 1,018,656 7.5000%, 8/15/33 921,941 1,108,585 4.9000%, 10/15/34 953,194 1,105,835 5.5000%, 9/15/35 109,443 127,380 5.5000%, 3/15/36 464,412 531,755 5.5000%, 2/15/39 689,854 794,083 5.5000%, 8/15/39 1,964,964 2,300,083 5.5000%, 8/15/39 637,561 746,512 5.0000%, 10/15/39 424,893 478,492 5.5000%, 10/15/39 753,031 874,565 5.0000%, 11/15/39 697,988 781,768 5.0000%, 1/15/40 232,223 260,192 5.0000%, 5/15/40 247,653 280,412 5.0000%, 5/15/40 91,063 103,266 5.0000%, 7/15/40 754,498 844,895 5.0000%, 7/15/40 202,770 227,018 5.0000%, 2/15/41 770,355 865,882 5.0000%, 4/15/41 282,947 316,269 4.5000%, 5/15/41 1,418,418 1,627,992 5.0000%, 5/15/41 293,806 332,558 4.5000%, 7/15/41 672,259 778,299 4.5000%, 7/15/41 210,243 235,451 4.5000%, 8/15/41 1,857,645 2,087,278 5.0000%, 9/15/41 192,286 221,947 5.0000%, 11/15/43 1,357,946 1,553,297 4.5000%, 5/15/44 888,720 992,388 5.0000%, 6/15/44 1,354,696 1,541,209 5.0000%, 6/15/44 505,456 574,406 5.0000%, 7/15/44 560,626 636,564 4.0000%, 1/15/45 4,409,768 4,787,773 4.0000%, 4/15/45 675,447 739,274 28,874,084 Ginnie Mae II Pool: 6.0000%, 11/20/34 423,495 498,933 5.5000%, 11/20/37 521,551 593,535 6.0000%, 1/20/39 177,967 203,124
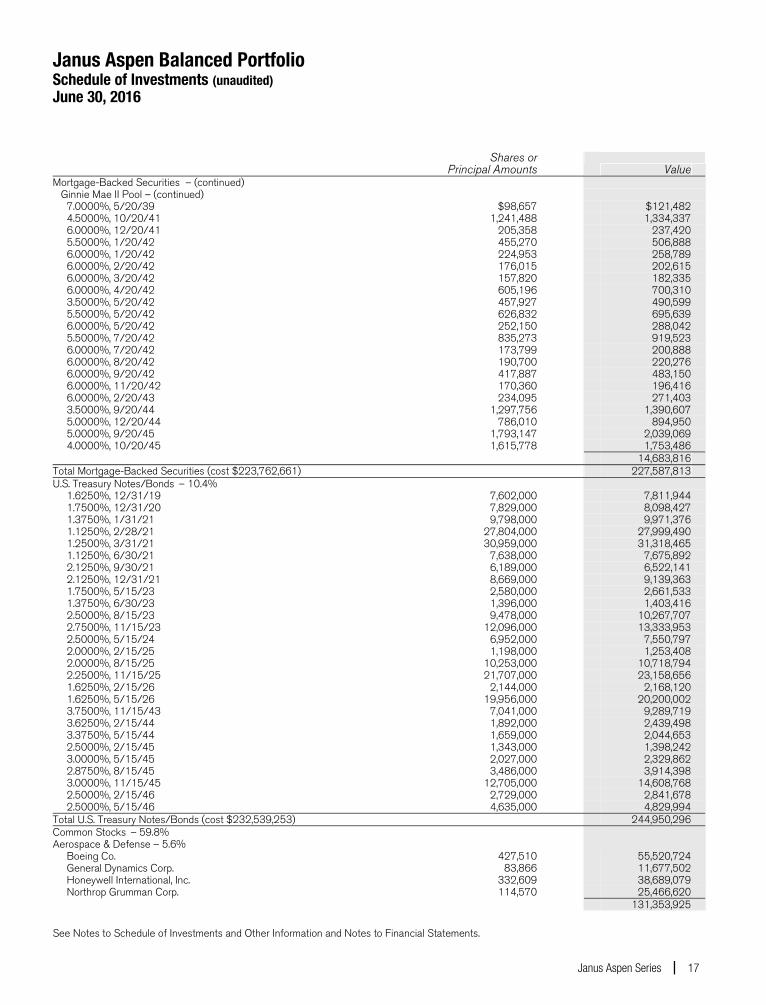
Janus Aspen Balanced Portfolio Schedule of Investments (unaudited) June 30, 2016
See Notes to Schedule of Investments and Other Information and Notes to Financial Statements.
Janus Aspen Series 17
Shares orPrincipal Amounts
Value
Mortgage-Backed Securities – (continued) Ginnie Mae II Pool – (continued) 7.0000%, 5/20/39 $98,657 $121,482 4.5000%, 10/20/41 1,241,488 1,334,337 6.0000%, 12/20/41 205,358 237,420 5.5000%, 1/20/42 455,270 506,888 6.0000%, 1/20/42 224,953 258,789 6.0000%, 2/20/42 176,015 202,615 6.0000%, 3/20/42 157,820 182,335 6.0000%, 4/20/42 605,196 700,310 3.5000%, 5/20/42 457,927 490,599 5.5000%, 5/20/42 626,832 695,639 6.0000%, 5/20/42 252,150 288,042 5.5000%, 7/20/42 835,273 919,523 6.0000%, 7/20/42 173,799 200,888 6.0000%, 8/20/42 190,700 220,276 6.0000%, 9/20/42 417,887 483,150 6.0000%, 11/20/42 170,360 196,416 6.0000%, 2/20/43 234,095 271,403 3.5000%, 9/20/44 1,297,756 1,390,607 5.0000%, 12/20/44 786,010 894,950 5.0000%, 9/20/45 1,793,147 2,039,069 4.0000%, 10/20/45 1,615,778 1,753,486 14,683,816Total Mortgage-Backed Securities (cost $223,762,661) 227,587,813U.S. Treasury Notes/Bonds – 10.4% 1.6250%, 12/31/19 7,602,000 7,811,944 1.7500%, 12/31/20 7,829,000 8,098,427 1.3750%, 1/31/21 9,798,000 9,971,376 1.1250%, 2/28/21 27,804,000 27,999,490 1.2500%, 3/31/21 30,959,000 31,318,465 1.1250%, 6/30/21 7,638,000 7,675,892 2.1250%, 9/30/21 6,189,000 6,522,141 2.1250%, 12/31/21 8,669,000 9,139,363 1.7500%, 5/15/23 2,580,000 2,661,533 1.3750%, 6/30/23 1,396,000 1,403,416 2.5000%, 8/15/23 9,478,000 10,267,707 2.7500%, 11/15/23 12,096,000 13,333,953 2.5000%, 5/15/24 6,952,000 7,550,797 2.0000%, 2/15/25 1,198,000 1,253,408 2.0000%, 8/15/25 10,253,000 10,718,794 2.2500%, 11/15/25 21,707,000 23,158,656 1.6250%, 2/15/26 2,144,000 2,168,120 1.6250%, 5/15/26 19,956,000 20,200,002 3.7500%, 11/15/43 7,041,000 9,289,719 3.6250%, 2/15/44 1,892,000 2,439,498 3.3750%, 5/15/44 1,659,000 2,044,653 2.5000%, 2/15/45 1,343,000 1,398,242 3.0000%, 5/15/45 2,027,000 2,329,862 2.8750%, 8/15/45 3,486,000 3,914,398 3.0000%, 11/15/45 12,705,000 14,608,768 2.5000%, 2/15/46 2,729,000 2,841,678 2.5000%, 5/15/46 4,635,000 4,829,994Total U.S. Treasury Notes/Bonds (cost $232,539,253) 244,950,296Common Stocks – 59.8% Aerospace & Defense – 5.6% Boeing Co. 427,510 55,520,724 General Dynamics Corp. 83,866 11,677,502 Honeywell International, Inc. 332,609 38,689,079 Northrop Grumman Corp. 114,570 25,466,620 131,353,925
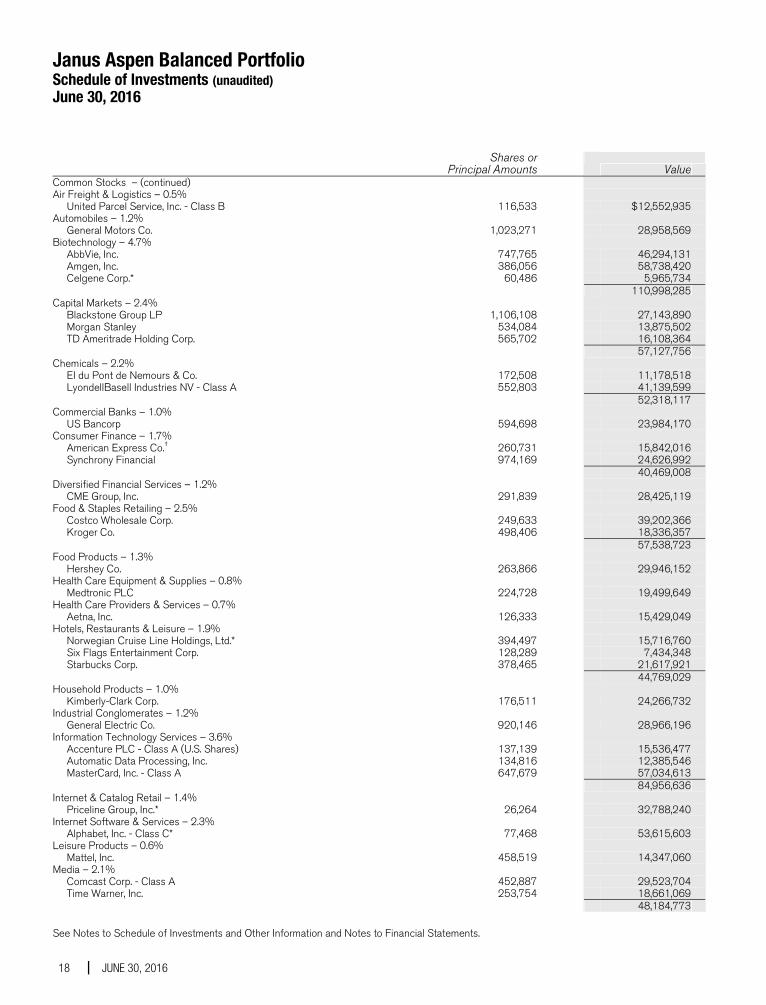
Janus Aspen Balanced Portfolio Schedule of Investments (unaudited) June 30, 2016
See Notes to Schedule of Investments and Other Information and Notes to Financial Statements.
18 JUNE 30, 2016
Shares orPrincipal Amounts
Value
Common Stocks – (continued) Air Freight & Logistics – 0.5% United Parcel Service, Inc. - Class B 116,533 $12,552,935Automobiles – 1.2% General Motors Co. 1,023,271 28,958,569Biotechnology – 4.7% AbbVie, Inc. 747,765 46,294,131 Amgen, Inc. 386,056 58,738,420 Celgene Corp.* 60,486 5,965,734 110,998,285Capital Markets – 2.4% Blackstone Group LP 1,106,108 27,143,890 Morgan Stanley 534,084 13,875,502 TD Ameritrade Holding Corp. 565,702 16,108,364 57,127,756Chemicals – 2.2% EI du Pont de Nemours & Co. 172,508 11,178,518 LyondellBasell Industries NV - Class A 552,803 41,139,599 52,318,117Commercial Banks – 1.0% US Bancorp 594,698 23,984,170Consumer Finance – 1.7% American Express Co.† 260,731 15,842,016 Synchrony Financial 974,169 24,626,992 40,469,008Diversified Financial Services – 1.2% CME Group, Inc. 291,839 28,425,119Food & Staples Retailing – 2.5% Costco Wholesale Corp. 249,633 39,202,366 Kroger Co. 498,406 18,336,357 57,538,723Food Products – 1.3% Hershey Co. 263,866 29,946,152Health Care Equipment & Supplies – 0.8% Medtronic PLC 224,728 19,499,649Health Care Providers & Services – 0.7% Aetna, Inc. 126,333 15,429,049Hotels, Restaurants & Leisure – 1.9% Norwegian Cruise Line Holdings, Ltd.* 394,497 15,716,760 Six Flags Entertainment Corp. 128,289 7,434,348 Starbucks Corp. 378,465 21,617,921 44,769,029Household Products – 1.0% Kimberly-Clark Corp. 176,511 24,266,732Industrial Conglomerates – 1.2% General Electric Co. 920,146 28,966,196Information Technology Services – 3.6% Accenture PLC - Class A (U.S. Shares) 137,139 15,536,477 Automatic Data Processing, Inc. 134,816 12,385,546 MasterCard, Inc. - Class A 647,679 57,034,613 84,956,636Internet & Catalog Retail – 1.4% Priceline Group, Inc.* 26,264 32,788,240Internet Software & Services – 2.3% Alphabet, Inc. - Class C* 77,468 53,615,603Leisure Products – 0.6% Mattel, Inc. 458,519 14,347,060Media – 2.1% Comcast Corp. - Class A 452,887 29,523,704 Time Warner, Inc. 253,754 18,661,069 48,184,773
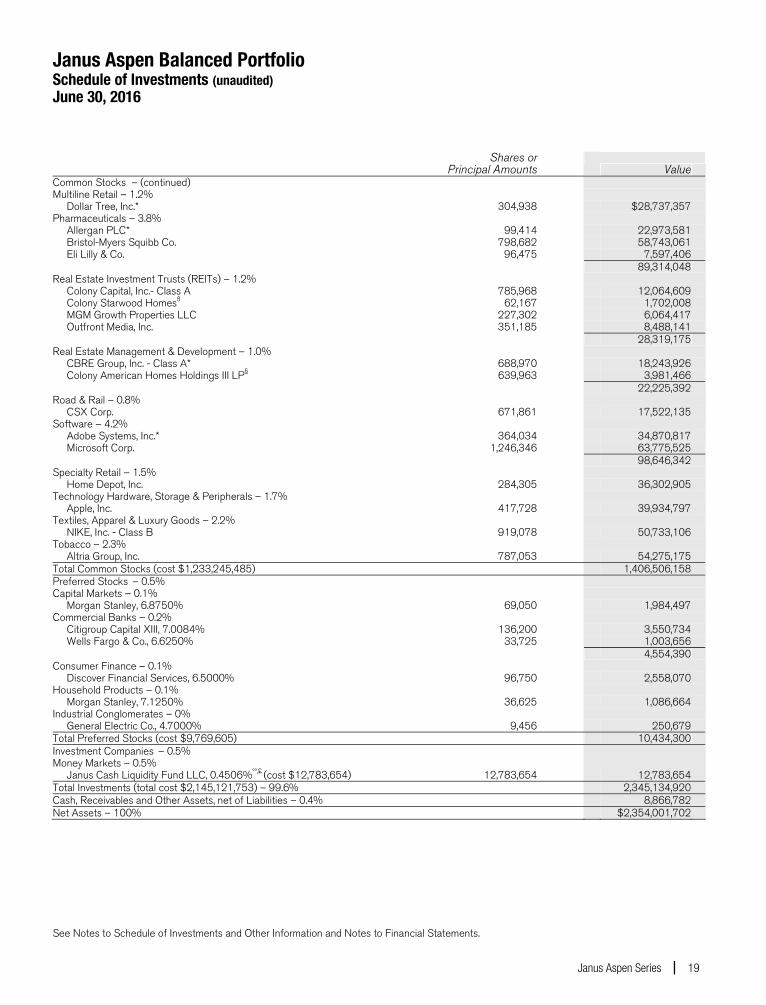
Janus Aspen Balanced Portfolio Schedule of Investments (unaudited) June 30, 2016
See Notes to Schedule of Investments and Other Information and Notes to Financial Statements.
Janus Aspen Series 19
Shares orPrincipal Amounts
Value
Common Stocks – (continued) Multiline Retail – 1.2% Dollar Tree, Inc.* 304,938 $28,737,357Pharmaceuticals – 3.8% Allergan PLC* 99,414 22,973,581 Bristol-Myers Squibb Co. 798,682 58,743,061 Eli Lilly & Co. 96,475 7,597,406 89,314,048Real Estate Investment Trusts (REITs) – 1.2% Colony Capital, Inc.- Class A 785,968 12,064,609 Colony Starwood Homesß 62,167 1,702,008 MGM Growth Properties LLC 227,302 6,064,417 Outfront Media, Inc. 351,185 8,488,141 28,319,175Real Estate Management & Development – 1.0% CBRE Group, Inc. - Class A* 688,970 18,243,926 Colony American Homes Holdings III LP§ 639,963 3,981,466 22,225,392Road & Rail – 0.8% CSX Corp. 671,861 17,522,135Software – 4.2% Adobe Systems, Inc.* 364,034 34,870,817 Microsoft Corp. 1,246,346 63,775,525 98,646,342Specialty Retail – 1.5% Home Depot, Inc. 284,305 36,302,905Technology Hardware, Storage & Peripherals – 1.7% Apple, Inc. 417,728 39,934,797Textiles, Apparel & Luxury Goods – 2.2% NIKE, Inc. - Class B 919,078 50,733,106Tobacco – 2.3% Altria Group, Inc. 787,053 54,275,175Total Common Stocks (cost $1,233,245,485) 1,406,506,158Preferred Stocks – 0.5% Capital Markets – 0.1% Morgan Stanley, 6.8750% 69,050 1,984,497Commercial Banks – 0.2% Citigroup Capital XIII, 7.0084% 136,200 3,550,734 Wells Fargo & Co., 6.6250% 33,725 1,003,656 4,554,390Consumer Finance – 0.1% Discover Financial Services, 6.5000% 96,750 2,558,070Household Products – 0.1% Morgan Stanley, 7.1250% 36,625 1,086,664Industrial Conglomerates – 0% General Electric Co., 4.7000% 9,456 250,679Total Preferred Stocks (cost $9,769,605) 10,434,300Investment Companies – 0.5% Money Markets – 0.5% Janus Cash Liquidity Fund LLC, 0.4506%ºº,£ (cost $12,783,654) 12,783,654 12,783,654Total Investments (total cost $2,145,121,753) – 99.6% 2,345,134,920Cash, Receivables and Other Assets, net of Liabilities – 0.4% 8,866,782Net Assets – 100% $2,354,001,702
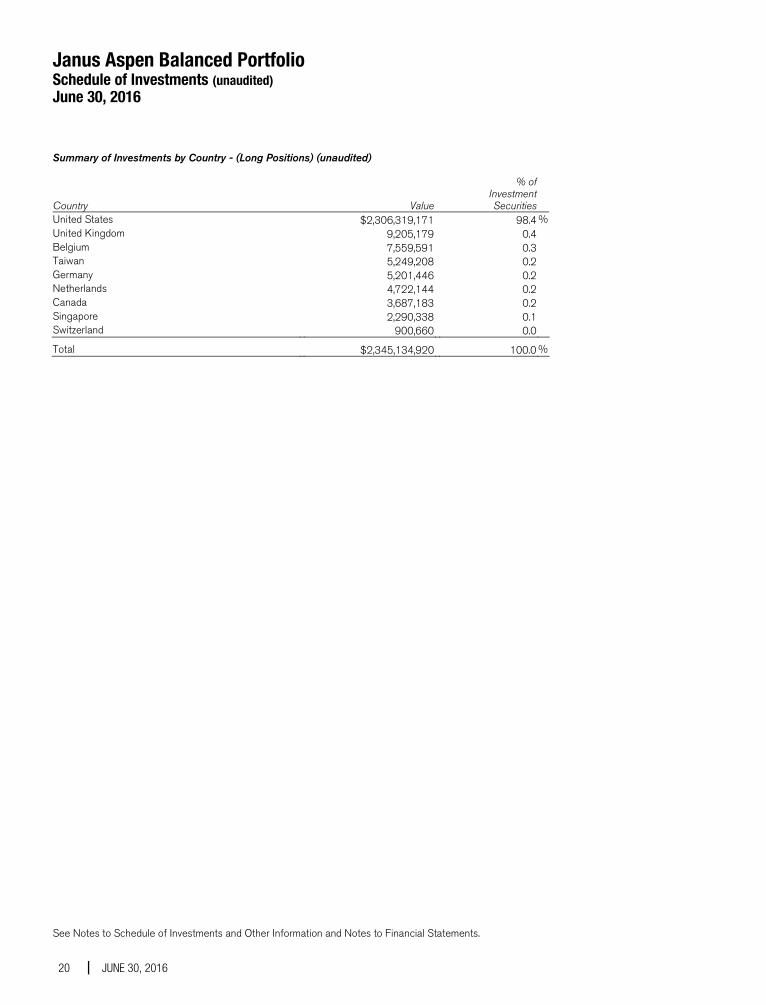
Janus Aspen Balanced Portfolio Schedule of Investments (unaudited) June 30, 2016
See Notes to Schedule of Investments and Other Information and Notes to Financial Statements.
20 JUNE 30, 2016
Summary of Investments by Country - (Long Positions) (unaudited) % of Investment Country Value Securities United States $2,306,319,171 98.4 % United Kingdom 9,205,179 0.4 Belgium 7,559,591 0.3 Taiwan 5,249,208 0.2 Germany 5,201,446 0.2 Netherlands 4,722,144 0.2 Canada 3,687,183 0.2 Singapore 2,290,338 0.1 Switzerland 900,660 0.0
Total $2,345,134,920 100.0 %

Janus Aspen Balanced Portfolio Notes to Schedule of Investments and Other Information (unaudited)
Janus Aspen Series 21
Balanced Index An internally-calculated, hypothetical combination of total returns from the S&P 500® Index (55%) and the Barclays U.S. Aggregate Bond Index (45%).
Barclays U.S. Aggregate Bond Index
A broad-based measure of the investment grade, U.S. dollar-denominated, fixed-rate taxable bond market.
S&P 500® Index Measures broad U.S. equity performance.
LLC Limited Liability Company
LP Limited Partnership
PLC Public Limited Company
ULC Unlimited Liability Company
U.S. Shares Securities of foreign companies trading on an American stock exchange.
144A Securities sold under Rule 144A of the Securities Act of 1933, as amended, are subject to legal and/or contractual restrictions on resale
and may not be publicly sold without registration under the 1933 Act. These securities have been determined to be liquid under guidelines established by the Board of Trustees. The total value of 144A securities as of the period ended June 30, 2016 is $106,247,054, which represents 4.5% of net assets.
* Non-income producing security.
(a) All or a portion of this position has not settled, or is not funded. Upon settlement or funding date, interest rates for unsettled or unfunded amounts will be determined. Interest and dividends will not be accrued until time of settlement or funding.
† A portion of this security has been segregated to cover margin or segregation requirements on open futures contracts, forward currency contracts, options contracts, short sales, swap agreements, and/or securities with extended settlement dates, the value of which, as of June 30, 2016, is $8,541,683.
‡ The interest rate on floating rate notes is based on an index or market interest rates and is subject to change. Rate in the security description is as of June 30, 2016.
ß Security is illiquid.
ºº Rate shown is the 7-day yield as of June 30, 2016.
μ This variable rate security is a perpetual bond. Perpetual bonds have no contractual maturity date, are not redeemable, and pay an indefinite stream of interest. The coupon rate shown represents the current interest rate.
Ç Step bond. The coupon rate will increase or decrease periodically based upon a predetermined schedule. The rate shown reflects the current rate.
£ The Portfolio may invest in certain securities that are considered affiliated companies. As defined by the Investment Company Act of 1940, as amended, an affiliated company is one in which the Portfolio owns 5% or more of the outstanding voting securities, or a company which is under common ownership or control. The following securities were considered affiliated companies for all or some portion of the period ended June 30, 2016. Unless otherwise indicated, all information in the table is for the period ended June 30, 2016.
Share Share Balance Balance Realized Dividend Value at 12/31/15 Purchases Sales at 6/30/16 Gain/(Loss) Income at 6/30/16Janus Cash Liquidity Fund LLC
66,697,739 377,589,704 (431,503,789) 12,783,654 $— $57,887 $12,783,654
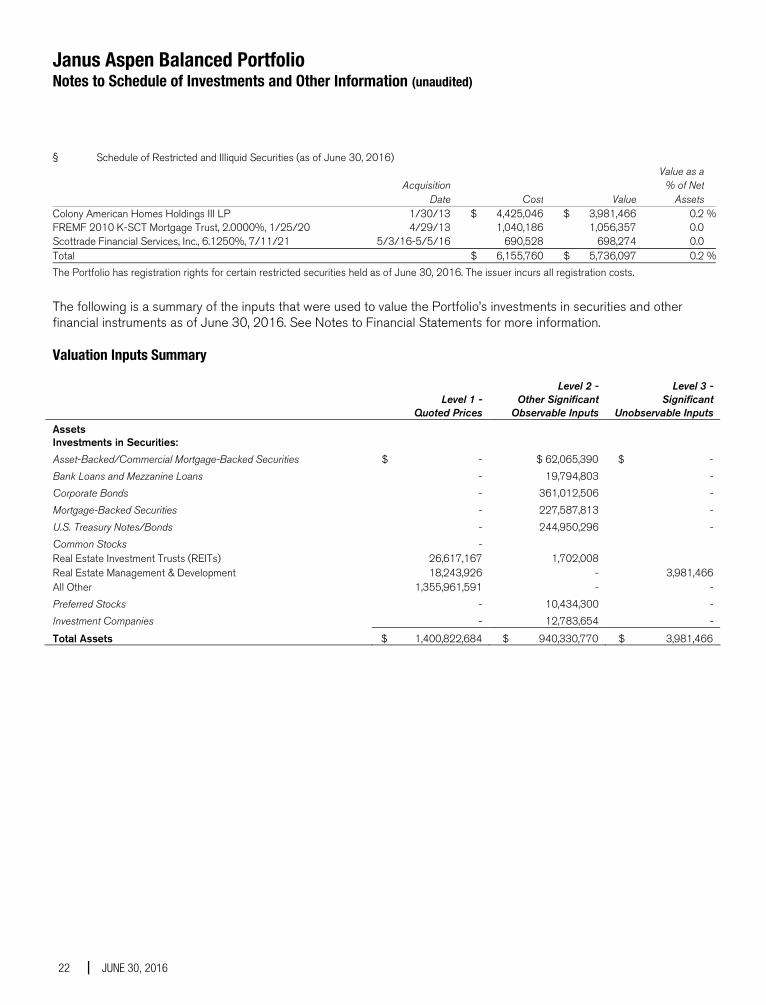
Janus Aspen Balanced Portfolio Notes to Schedule of Investments and Other Information (unaudited)
22 JUNE 30, 2016
§ Schedule of Restricted and Illiquid Securities (as of June 30, 2016) Value as a Acquisition % of Net
Date Cost Value AssetsColony American Homes Holdings III LP 1/30/13 $ 4,425,046 $ 3,981,466 0.2 %FREMF 2010 K-SCT Mortgage Trust, 2.0000%, 1/25/20 4/29/13 1,040,186 1,056,357 0.0Scottrade Financial Services, Inc., 6.1250%, 7/11/21 5/3/16-5/5/16 690,528 698,274 0.0Total $ 6,155,760 $ 5,736,097 0.2 %The Portfolio has registration rights for certain restricted securities held as of June 30, 2016. The issuer incurs all registration costs.
The following is a summary of the inputs that were used to value the Portfolio’s investments in securities and other financial instruments as of June 30, 2016. See Notes to Financial Statements for more information.
Valuation Inputs Summary
Level 1 -
Quoted Prices
Level 2 - Other Significant
Observable Inputs
Level 3 - Significant
Unobservable Inputs Assets Investments in Securities: Asset-Backed/Commercial Mortgage-Backed Securities $ - $ 62,065,390 $ - Bank Loans and Mezzanine Loans - 19,794,803 - Corporate Bonds - 361,012,506 - Mortgage-Backed Securities - 227,587,813 - U.S. Treasury Notes/Bonds - 244,950,296 - Common Stocks - Real Estate Investment Trusts (REITs) 26,617,167 1,702,008 Real Estate Management & Development 18,243,926 - 3,981,466 All Other 1,355,961,591 - - Preferred Stocks - 10,434,300 - Investment Companies - 12,783,654 -
Total Assets $ 1,400,822,684 $ 940,330,770 $ 3,981,466
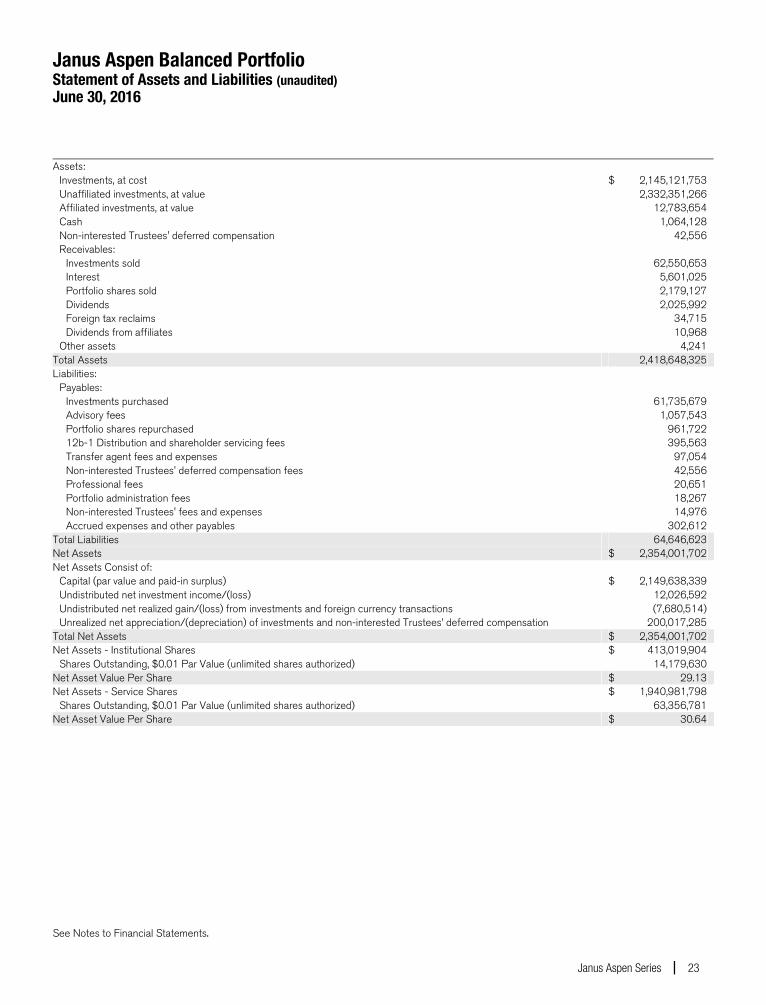
Janus Aspen Balanced Portfolio Statement of Assets and Liabilities (unaudited) June 30, 2016
See Notes to Financial Statements.
Janus Aspen Series 23
Assets: Investments, at cost $ 2,145,121,753 Unaffiliated investments, at value 2,332,351,266 Affiliated investments, at value 12,783,654 Cash 1,064,128 Non-interested Trustees' deferred compensation 42,556 Receivables: Investments sold 62,550,653 Interest 5,601,025 Portfolio shares sold 2,179,127 Dividends 2,025,992 Foreign tax reclaims 34,715 Dividends from affiliates 10,968 Other assets 4,241Total Assets 2,418,648,325 Liabilities: Payables: — Investments purchased 61,735,679 Advisory fees 1,057,543 Portfolio shares repurchased 961,722 12b-1 Distribution and shareholder servicing fees 395,563 Transfer agent fees and expenses 97,054 Non-interested Trustees' deferred compensation fees 42,556 Professional fees 20,651 Portfolio administration fees 18,267 Non-interested Trustees' fees and expenses 14,976 Accrued expenses and other payables 302,612Total Liabilities 64,646,623 Net Assets $ 2,354,001,702 Net Assets Consist of: Capital (par value and paid-in surplus) $ 2,149,638,339 Undistributed net investment income/(loss) 12,026,592 Undistributed net realized gain/(loss) from investments and foreign currency transactions (7,680,514) Unrealized net appreciation/(depreciation) of investments and non-interested Trustees’ deferred compensation 200,017,285Total Net Assets $ 2,354,001,702 Net Assets - Institutional Shares $ 413,019,904 Shares Outstanding, $0.01 Par Value (unlimited shares authorized) 14,179,630Net Asset Value Per Share $ 29.13 Net Assets - Service Shares $ 1,940,981,798 Shares Outstanding, $0.01 Par Value (unlimited shares authorized) 63,356,781Net Asset Value Per Share $ 30.64
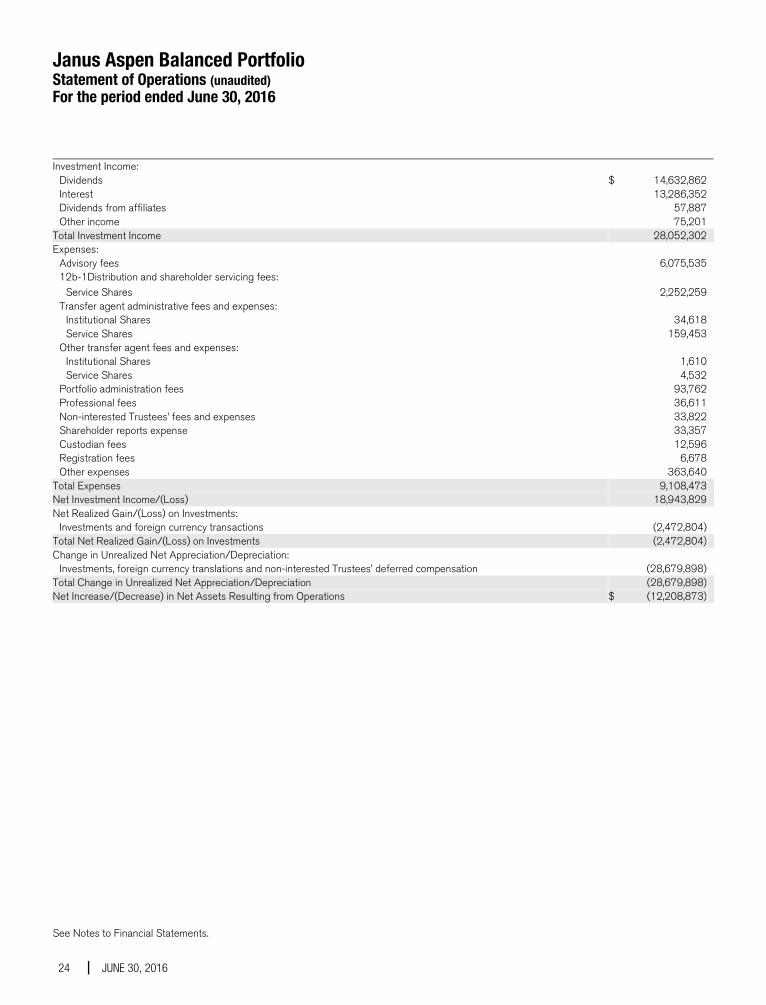
Janus Aspen Balanced Portfolio Statement of Operations (unaudited) For the period ended June 30, 2016
See Notes to Financial Statements.
24 JUNE 30, 2016
Investment Income: Dividends $ 14,632,862 Interest 13,286,352 Dividends from affiliates 57,887 Other income 75,201Total Investment Income 28,052,302 Expenses: Advisory fees 6,075,535 12b-1Distribution and shareholder servicing fees: Service Shares 2,252,259 Transfer agent administrative fees and expenses: Institutional Shares 34,618 Service Shares 159,453 Other transfer agent fees and expenses: Institutional Shares 1,610 Service Shares 4,532 Portfolio administration fees 93,762 Professional fees 36,611 Non-interested Trustees’ fees and expenses 33,822 Shareholder reports expense 33,357 Custodian fees 12,596 Registration fees 6,678 Other expenses 363,640Total Expenses 9,108,473 Net Investment Income/(Loss) 18,943,829 Net Realized Gain/(Loss) on Investments: Investments and foreign currency transactions (2,472,804)Total Net Realized Gain/(Loss) on Investments (2,472,804) Change in Unrealized Net Appreciation/Depreciation: Investments, foreign currency translations and non-interested Trustees’ deferred compensation (28,679,898)Total Change in Unrealized Net Appreciation/Depreciation (28,679,898) Net Increase/(Decrease) in Net Assets Resulting from Operations $ (12,208,873)
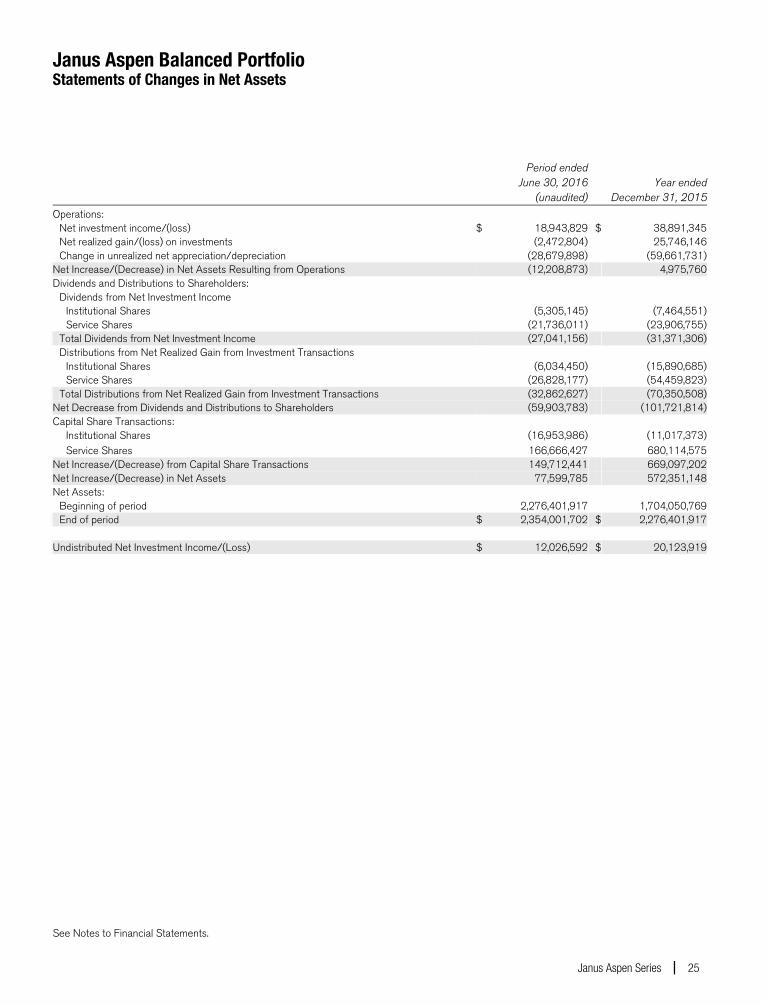
Janus Aspen Balanced Portfolio Statements of Changes in Net Assets
See Notes to Financial Statements.
Janus Aspen Series 25
Period ended June 30, 2016
(unaudited) Year ended
December 31, 2015
Operations: Net investment income/(loss) $ 18,943,829 $ 38,891,345 Net realized gain/(loss) on investments (2,472,804) 25,746,146 Change in unrealized net appreciation/depreciation (28,679,898) (59,661,731)Net Increase/(Decrease) in Net Assets Resulting from Operations (12,208,873) 4,975,760Dividends and Distributions to Shareholders: Dividends from Net Investment Income Institutional Shares (5,305,145) (7,464,551) Service Shares (21,736,011) (23,906,755) Total Dividends from Net Investment Income (27,041,156) (31,371,306) Distributions from Net Realized Gain from Investment Transactions Institutional Shares (6,034,450) (15,890,685) Service Shares (26,828,177) (54,459,823) Total Distributions from Net Realized Gain from Investment Transactions (32,862,627) (70,350,508)Net Decrease from Dividends and Distributions to Shareholders (59,903,783) (101,721,814)Capital Share Transactions: Institutional Shares (16,953,986) (11,017,373) Service Shares 166,666,427 680,114,575Net Increase/(Decrease) from Capital Share Transactions 149,712,441 669,097,202Net Increase/(Decrease) in Net Assets 77,599,785 572,351,148Net Assets: Beginning of period 2,276,401,917 1,704,050,769 End of period $ 2,354,001,702 $ 2,276,401,917 Undistributed Net Investment Income/(Loss) $ 12,026,592 $ 20,123,919

Janus Aspen Balanced Portfolio Financial Highlights
See Notes to Financial Statements.
26 JUNE 30, 2016
Institutional Shares For a share outstanding during the period ended June 30, 2016 (unaudited) and each year ended December 31 2016 2015 2014 2013 2012 2011 Net Asset Value, Beginning of Period $30.08 $31.43 $30.26 $27.17 $26.62 $28.30 Income/(Loss) from Investment Operations: Net investment income/(loss) 0.28(1) 0.63(1) 0.62(1) 0.56 1.14 0.73 Net realized and unrealized gain/(loss) (0.41) (0.41) 1.92 4.67 2.30 (0.22) Total from Investment Operations (0.13) 0.22 2.54 5.23 3.44 0.51 Less Dividends and Distributions: Dividends (from net investment income) (0.38) (0.50) (0.55) (0.45) (0.80) (0.69) Distributions (from capital gains) (0.44) (1.07) (0.82) (1.69) (2.09) (1.50) Total Dividends and Distributions (0.82) (1.57) (1.37) (2.14) (2.89) (2.19) Net Asset Value, End of Period $29.13 $30.08 $31.43 $30.26 $27.17 $26.62 Total Return* (0.43)% 0.62% 8.54% 20.11% 13.66% 1.60% Net Assets, End of Period (in thousands) $413,020 $444,472 $475,807 $475,100 $435,689 $843,446
Average Net Assets for the Period (in thousands) $417,083 $467,346 $472,445 $455,356 $509,335 $906,725
Ratios to Average Net Assets**: Ratio of Gross Expenses 0.61% 0.58% 0.58% 0.58% 0.60% 0.57%
Ratio of Net Expenses (After Waivers and Expense Offsets) 0.61% 0.58% 0.58% 0.58% 0.60% 0.57%
Ratio of Net Investment Income/(Loss) 1.88% 2.03% 2.01% 1.87% 2.23% 2.50% Portfolio Turnover Rate 43% 73% 87% 76% 77% 108% 1
Service Shares For a share outstanding during the period ended June 30, 2016 (unaudited) and each year ended December 31 2016 2015 2014 2013 2012 2011 Net Asset Value, Beginning of Period $31.61 $32.97 $31.72 $28.42 $27.74 $29.42 Income/(Loss) from Investment Operations: Net investment income/(loss) 0.25(1) 0.58(1) 0.57(1) 0.58 0.57 0.66 Net realized and unrealized gain/(loss) (0.43) (0.42) 2.00 4.82 2.94 (0.20) Total from Investment Operations (0.18) 0.16 2.57 5.40 3.51 0.46 Less Dividends and Distributions: Dividends (from net investment income) (0.35) (0.45) (0.50) (0.41) (0.74) (0.64) Distributions (from capital gains) (0.44) (1.07) (0.82) (1.69) (2.09) (1.50) Total Dividends and Distributions (0.79) (1.52) (1.32) (2.10) (2.83) (2.14) Net Asset Value, End of Period $30.64 $31.61 $32.97 $31.72 $28.42 $27.74 Total Return* (0.57)% 0.41% 8.24% 19.80% 13.37% 1.35% Net Assets, End of Period (in thousands) $1,940,982 $1,831,930 $1,228,244 $863,259 $494,722 $763,208
Average Net Assets for the Period (in thousands) $1,842,063 $1,645,283 $1,013,680 $596,154 $533,254 $770,420
Ratios to Average Net Assets**: Ratio of Gross Expenses 0.86% 0.84% 0.84% 0.84% 0.85% 0.82%
Ratio of Net Expenses (After Waivers and Expense Offsets) 0.86% 0.84% 0.84% 0.84% 0.85% 0.82%
Ratio of Net Investment Income/(Loss) 1.64% 1.79% 1.77% 1.62% 2.00% 2.25% Portfolio Turnover Rate 43% 73% 87% 76% 77% 108%
* Total return not annualized for periods of less than one full year.** Annualized for periods of less than one full year. (1) Per share amounts are calculated based on average shares outstanding during the year or period.
Janus Aspen Balanced Portfolio Notes to Financial Statements (unaudited)
Janus Aspen Series 27
1. Organization and Significant Accounting Policies Janus Aspen Balanced Portfolio (the “Portfolio”) is a series fund. The Portfolio is part of Janus Aspen Series (the “Trust”), which is organized as a Delaware statutory trust and is registered under the Investment Company Act of 1940, as amended (the “1940 Act”), as an open-end management investment company, and therefore has applied the specialized accounting and reporting guidance in Financial Accounting Standards Board (“FASB”) Accounting Standards Codification (“ASC”) Topic 946. The Trust offers twelve portfolios which include multiple series of shares, with differing investment objectives and policies. The Portfolio seeks long-term capital growth, consistent with preservation of capital and balanced by current income. The Portfolio is classified as diversified, as defined in the 1940 Act.
The Portfolio currently offers two classes of shares: Institutional Shares and Service Shares. Each class represents an interest in the same portfolio of investments. Institutional Shares are offered only in connection with investment in and payments under variable insurance contracts as well as certain qualified retirement plans. Service Shares are offered only in connection with investment in and payments under variable insurance contracts as well as certain qualified retirement plans that require a fee from Portfolio assets to procure distribution and administrative services to contract owners and plan participants.
Shareholders, including other portfolios, participating insurance companies, as well as accounts, may from time to time own (beneficially or of record) a significant percentage of the Portfolio’s Shares and can be considered to “control” the Portfolio when that ownership exceeds 25% of the Portfolio’s assets (and which may differ from control as determined in accordance with accounting principles generally accepted in the United States of America).
The following accounting policies have been followed by the Portfolio and are in conformity with accounting principles generally accepted in the United States of America.
Investment Valuation Securities held by the Portfolio are valued in accordance with policies and procedures established by and under the supervision of the Trustees (the “Valuation Procedures”). Equity securities traded on a domestic securities exchange are generally valued at the closing prices on the primary market or exchange on which they trade. If such price is lacking for the trading period immediately preceding the time of determination, such securities are valued at their current bid price. Equity securities that are traded on a foreign exchange are generally valued at the closing prices on such markets. In the event that there is no current trading volume on a particular security in such foreign exchange, the bid price from the primary exchange is generally used to value the security. Securities that are traded on the over-the-counter (“OTC”) markets are generally valued at their closing or latest bid prices as available. Foreign securities and currencies are converted to U.S. dollars using the applicable exchange rate in effect at the close of the New York Stock Exchange (“NYSE”). The Portfolio will determine the market value of individual securities held by it by using prices provided by one or more approved professional pricing services or, as needed, by obtaining market quotations from independent broker-dealers. Most debt securities are valued in accordance with the evaluated bid price supplied by the pricing service that is intended to reflect market value. The evaluated bid price supplied by the pricing service is an evaluation that may consider factors such as security prices, yields, maturities and ratings. Certain short-term securities maturing within 60 days or less may be evaluated and valued on an amortized cost basis provided that the amortized cost determined approximates market value. Securities for which market quotations or evaluated prices are not readily available or deemed unreliable are valued at fair value determined in good faith under the Valuation Procedures. Circumstances in which fair value pricing may be utilized include, but are not limited to: (i) a significant event that may affect the securities of a single issuer, such as a merger, bankruptcy, or significant issuer-specific development; (ii) an event that may affect an entire market, such as a natural disaster or significant governmental action; (iii) a nonsignificant event such as a market closing early or not opening, or a security trading halt; and (iv) pricing of a nonvalued security and a restricted or nonpublic security. Special valuation considerations may apply with respect to “odd-lot” fixed-income transactions which, due to their small size, may receive evaluated prices by pricing services which reflect a large block trade and not what actually could be obtained for the odd-lot position. The Portfolio uses systematic fair valuation models provided by independent third parties to value international equity securities in order to adjust for stale pricing, which may occur between the close of certain foreign exchanges and the close of the NYSE.
Valuation Inputs Summary FASB ASC 820, Fair Value Measurements and Disclosures (“ASC 820”), defines fair value, establishes a framework for measuring fair value, and expands disclosure requirements regarding fair value measurements. This standard
Janus Aspen Balanced Portfolio Notes to Financial Statements (unaudited)
28 JUNE 30, 2016
emphasizes that fair value is a market-based measurement that should be determined based on the assumptions that market participants would use in pricing an asset or liability and establishes a hierarchy that prioritizes inputs to valuation techniques used to measure fair value. These inputs are summarized into three broad levels:
Level 1 – Unadjusted quoted prices in active markets the Portfolio has the ability to access for identical assets or liabilities.
Level 2 – Observable inputs other than unadjusted quoted prices included in Level 1 that are observable for the asset or liability either directly or indirectly. These inputs may include quoted prices for the identical instrument on an inactive market, prices for similar instruments, interest rates, prepayment speeds, credit risk, yield curves, default rates and similar data.
Assets or liabilities categorized as Level 2 in the hierarchy generally include: debt securities fair valued in accordance with the evaluated bid or ask prices supplied by a pricing service; securities traded on OTC markets and listed securities for which no sales are reported that are fair valued at the latest bid price (or yield equivalent thereof) obtained from one or more dealers transacting in a market for such securities or by a pricing service approved by the Portfolio’s Trustees; certain short-term debt securities with maturities of 60 days or less that are fair valued at amortized cost; and equity securities of foreign issuers whose fair value is determined by using systematic fair valuation models provided by independent third parties in order to adjust for stale pricing which may occur between the close of certain foreign exchanges and the close of the NYSE. Other securities that may be categorized as Level 2 in the hierarchy include, but are not limited to, preferred stocks, bank loans, swaps, investments in unregistered investment companies, options, and forward contracts.
Level 3 – Unobservable inputs for the asset or liability to the extent that relevant observable inputs are not available, representing the Portfolio’s own assumptions about the assumptions that a market participant would use in valuing the asset or liability, and that would be based on the best information available.
There have been no significant changes in valuation techniques used in valuing any such positions held by the Portfolio since the beginning of the fiscal year.
The inputs or methodology used for fair valuing securities are not necessarily an indication of the risk associated with investing in those securities. The summary of inputs used as of June 30, 2016 to fair value the Portfolio’s investments in securities and other financial instruments is included in the “Valuation Inputs Summary” in the Notes to Schedule of Investments and Other Information.
The Portfolio did not hold a significant amount of Level 3 securities as of June 30, 2016.
There were no transfers between Level 1, Level 2 and Level 3 of the fair value hierarchy during the period. The Portfolio recognizes transfers between the levels as of the beginning of the fiscal year.
Investment Transactions and Investment Income Investment transactions are accounted for as of the date purchased or sold (trade date). Dividend income is recorded on the ex-dividend date. Certain dividends from foreign securities will be recorded as soon as the Portfolio is informed of the dividend, if such information is obtained subsequent to the ex-dividend date. Dividends from foreign securities may be subject to withholding taxes in foreign jurisdictions. Interest income is recorded on the accrual basis and includes amortization of premiums and accretion of discounts. Gains and losses are determined on the identified cost basis, which is the same basis used for federal income tax purposes. Income, as well as gains and losses, both realized and unrealized, are allocated daily to each class of shares based upon the ratio of net assets represented by each class as a percentage of total net assets.
Expenses The Portfolio bears expenses incurred specifically on its behalf. Each class of shares bears a portion of general expenses, which are allocated daily to each class of shares based upon the ratio of net assets represented by each class as a percentage of total net assets. Expenses directly attributable to a specific class of shares are charged against the operations of such class.
Estimates The preparation of financial statements in conformity with accounting principles generally accepted in the United States of America requires management to make estimates and assumptions that affect the reported amount of assets and
Janus Aspen Balanced Portfolio Notes to Financial Statements (unaudited)
Janus Aspen Series 29
liabilities and disclosure of contingent assets and liabilities at the date of the financial statements, and the reported amounts of income and expenses during the reporting period. Actual results could differ from those estimates.
Indemnifications In the normal course of business, the Portfolio may enter into contracts that contain provisions for indemnification of other parties against certain potential liabilities. The Portfolio’s maximum exposure under these arrangements is unknown, and would involve future claims that may be made against the Portfolio that have not yet occurred. Currently, the risk of material loss from such claims is considered remote.
Foreign Currency Translations The Portfolio does not isolate that portion of the results of operations resulting from the effect of changes in foreign exchange rates on investments from the fluctuations arising from changes in market prices of securities held at the date of the financial statements. Net unrealized appreciation or depreciation of investments and foreign currency translations arise from changes in the value of assets and liabilities, including investments in securities held at the date of the financial statements, resulting from changes in the exchange rates and changes in market prices of securities held.
Currency gains and losses are also calculated on payables and receivables that are denominated in foreign currencies. The payables and receivables are generally related to foreign security transactions and income translations.
Foreign currency-denominated assets and forward currency contracts may involve more risks than domestic transactions, including currency risk, counterparty risk, political and economic risk, regulatory risk and equity risk. Risks may arise from unanticipated movements in the value of foreign currencies relative to the U.S. dollar.
Dividends and Distributions The Portfolio may make semiannual distributions of substantially all of its investment income and an annual distribution of its net realized capital gains (if any).
The Portfolio may make certain investments in real estate investment trusts (“REITs”) which pay dividends to their shareholders based upon funds available from operations. It is quite common for these dividends to exceed the REITs’ taxable earnings and profits, resulting in the excess portion of such dividends being designated as a return of capital. If the Portfolio distributes such amounts, such distributions could constitute a return of capital to shareholders for federal income tax purposes.
Federal Income Taxes The Portfolio intends to continue to qualify as a regulated investment company and distribute all of its taxable income in accordance with the requirements of Subchapter M of the Internal Revenue Code. Management has analyzed the Portfolio’s tax positions taken for all open federal income tax years, generally a three-year period, and has concluded that no provision for federal income tax is required in the Portfolio’s financial statements. The Portfolio is not aware of any tax positions for which it is reasonably possible that the total amounts of unrecognized tax benefits will significantly change in the next twelve months.
2. Derivative Instruments The Portfolio may invest in various types of derivatives, which may at times result in significant derivative exposure. A derivative is a financial instrument whose performance is derived from the performance of another asset. The Portfolio may invest in derivative instruments including, but not limited to: futures contracts, put options, call options, options on future contracts, options on foreign currencies, options on recovery locks, options on security and commodity indices, swaps, forward contracts, structured investments, and other equity-linked derivatives. Each derivative instrument that was held by the Portfolio during the period ended June 30, 2016 is discussed in further detail below. A summary of derivative activity by the Portfolio is reflected in the tables at the end of this section.
The Portfolio may use derivative instruments for hedging purposes (to offset risks associated with an investment, currency exposure, or market conditions), to adjust currency exposure relative to a benchmark index, or for speculative purposes (to earn income and seek to enhance returns). When the Portfolio invests in a derivative for speculative purposes, the Portfolio will be fully exposed to the risks of loss of that derivative, which may sometimes be greater than the derivative’s cost. The Portfolio may not use any derivative to gain exposure to an asset or class of assets that it would be prohibited by its investment restrictions from purchasing directly. The Portfolio’s ability to use derivative instruments may also be limited by tax considerations.
Janus Aspen Balanced Portfolio Notes to Financial Statements (unaudited)
30 JUNE 30, 2016
Investments in derivatives in general are subject to market risks that may cause their prices to fluctuate over time. Investments in derivatives may not directly correlate with the price movements of the underlying instrument. As a result, the use of derivatives may expose the Portfolio to additional risks that it would not be subject to if it invested directly in the securities underlying those derivatives. The use of derivatives may result in larger losses or smaller gains than otherwise would be the case. Derivatives can be volatile and may involve significant risks.
In pursuit of its investment objective, the Portfolio may seek to use derivatives to increase or decrease exposure to the following market risk factors:
• Commodity Risk – the risk related to the change in value of commodities or commodity-linked investments due to changes in the overall market movements, volatility of the underlying benchmark, changes in interest rates, or other factors affecting a particular industry of commodity such as drought, floods, weather, livestock disease, embargoes, tariffs, and international economic, political, and regulatory developments.
• Counterparty Risk – the risk that the counterparty (the party on the other side of the transaction) on a derivative transaction will be unable to honor its financial obligation to the Portfolio.
• Credit Risk – the risk an issuer will be unable to make principal and interest payments when due, or will default on its obligations.
• Currency Risk – the risk that changes in the exchange rate between currencies will adversely affect the value (in U.S. dollar terms) of an investment.
• Equity Risk – the risk related to the change in value of equity securities as they relate to increases or decreases in the general market.
• Index Risk – if the derivative is linked to the performance of an index, it will be subject to the risks associated with changes in that index. If the index changes, the Portfolio could receive lower interest payments or experience a reduction in the value of the derivative to below what the Portfolio paid. Certain indexed securities, including inverse securities (which move in an opposite direction to the index), may create leverage, to the extent that they increase or decrease in value at a rate that is a multiple of the changes in the applicable index.
• Interest Rate Risk – the risk that the value of fixed-income securities will generally decline as prevailing interest rates rise, which may cause the Portfolio’s NAV to likewise decrease.
• Leverage Risk – the risk associated with certain types of leveraged investments or trading strategies pursuant to which relatively small market movements may result in large changes in the value of an investment. The Portfolio creates leverage by investing in instruments, including derivatives, where the investment loss can exceed the original amount invested. Certain investments or trading strategies, such as short sales, that involve leverage can result in losses that greatly exceed the amount originally invested.
• Liquidity Risk – the risk that certain securities may be difficult or impossible to sell at the time that the seller would like or at the price that the seller believes the security is currently worth.
Derivatives may generally be traded OTC or on an exchange. Derivatives traded OTC are agreements that are individually negotiated between parties and can be tailored to meet a purchaser’s needs. OTC derivatives are not guaranteed by a clearing agency and may be subject to increased credit risk.
In an effort to mitigate credit risk associated with derivatives traded OTC, the Portfolio may enter into collateral agreements with certain counterparties whereby, subject to certain minimum exposure requirements, the Portfolio may require the counterparty to post collateral if the Portfolio has a net aggregate unrealized gain on all OTC derivative contracts with a particular counterparty. There is no guarantee that counterparty exposure is reduced and these arrangements are dependent on Janus Capital’s ability to establish and maintain appropriate systems and trading.
Forward Foreign Currency Exchange Contracts A forward foreign currency exchange contract (“forward currency contract”) is an obligation to buy or sell a specified currency at a future date at a negotiated rate (which may be U.S. dollars or a foreign currency). The Portfolio may enter into forward currency contracts for hedging purposes, including, but not limited to, reducing exposure to changes in foreign currency exchange rates on foreign portfolio holdings and locking in the U.S. dollar cost of firm purchase and sale commitments for securities denominated in or exposed to foreign currencies. The Portfolio may also invest in
Janus Aspen Balanced Portfolio Notes to Financial Statements (unaudited)
Janus Aspen Series 31
forward currency contracts for nonhedging purposes such as seeking to enhance returns. The Portfolio is subject to currency risk and counterparty risk in the normal course of pursuing its investment objective through its investments in forward currency contracts.
Forward currency contracts are valued by converting the foreign value to U.S. dollars by using the current spot U.S. dollar exchange rate and/or forward rate for that currency. Exchange and forward rates as of the close of the NYSE shall be used to value the forward currency contracts. The unrealized appreciation/(depreciation) for forward currency contracts is reported in the Statement of Assets and Liabilities as a receivable or payable and in the Statement of Operations for the change in unrealized net appreciation/depreciation (if applicable). The gain or loss arising from the difference between the U.S. dollar cost of the original contract and the value of the foreign currency in U.S. dollars upon closing a forward currency contract is reported on the Statement of Operations (if applicable).
During the period, the Portfolio entered into forward currency contracts with the obligation to sell foreign currencies in the future at an agreed upon rate in order to decrease exposure to currency risk associated with foreign currency denominated securities held by the Portfolio.
During the period ended June 30, 2016, the average ending monthly currency value amounts on sold forward currency contracts is $8,553,067. There were no forward currency contracts held at June 30, 2016.
The following tables provide information about the effect of derivatives and hedging activities on the Portfolio’s Statement of Operations for the period ended June 30, 2016.
The effect of Derivative Instruments (not accounted for as hedging instruments) on the Statement of Operations for the period ended June 30, 2016
Amount of Realized Gain/(Loss) Recognized on Derivatives
Derivative Currency
ContractsInvestments and foreign currency transactions $ 510,766
Amount of Change in Unrealized Appreciation/Depreciation Recognized on Derivatives
Derivative Currency
ContractsInvestments, foreign currency translations and non-interested Trustees' deferred compensation $ (289,719)
Please see the Portfolio’s Statement of Operations for the Portfolio’s “Net Realized and Unrealized Gain/(Loss) on Investments.”
3. Other Investments and Strategies
Additional Investment Risk The Portfolio may be invested in lower-rated debt securities that have a higher risk of default or loss of value since these securities may be sensitive to economic changes, political changes, or adverse developments specific to the issuer.
The financial crisis in both the U.S. and global economies over the past several years has resulted, and may continue to result, in a significant decline in the value and liquidity of many securities of issuers worldwide in the equity and fixed-income/credit markets. In response to the crisis, the United States and certain foreign governments, along with the U.S. Federal Reserve and certain foreign central banks, took steps to support the financial markets. The withdrawal of this support, a failure of measures put in place to respond to the crisis, or investor perception that such efforts were not sufficient could each negatively affect financial markets generally, and the value and liquidity of specific securities. In addition, policy and legislative changes in the United States and in other countries continue to impact many aspects of financial regulation. The effect of these changes on the markets, and the practical implications for market participants, including the Portfolio, may not be fully known for some time. As a result, it may also be unusually difficult to identify both investment risks and opportunities, which could limit or preclude the Portfolio’s ability to achieve its investment
Janus Aspen Balanced Portfolio Notes to Financial Statements (unaudited)
32 JUNE 30, 2016
objective. Therefore, it is important to understand that the value of your investment may fall, sometimes sharply, and you could lose money.
The enactment of the Dodd-Frank Wall Street Reform and Consumer Protection Act (the “Dodd-Frank Act”) provided for widespread regulation of financial institutions, consumer financial products and services, broker-dealers, OTC derivatives, investment advisers, credit rating agencies, and mortgage lending, which expanded federal oversight in the financial sector, including the investment management industry. Many provisions of the Dodd-Frank Act remain pending and will be implemented through future rulemaking. Therefore, the ultimate impact of the Dodd-Frank Act and the regulations under the Dodd-Frank Act on the Portfolio and the investment management industry as a whole, is not yet certain.
A number of countries in the European Union (“EU”) have experienced, and may continue to experience, severe economic and financial difficulties. In particular, many EU nations are susceptible to economic risks associated with high levels of debt, notably due to investments in sovereign debt of countries such as Greece, Italy, Spain, Portugal, and Ireland. Many non-governmental issuers, and even certain governments, have defaulted on, or been forced to restructure, their debts. Many other issuers have faced difficulties obtaining credit or refinancing existing obligations. Financial institutions have in many cases required government or central bank support, have needed to raise capital, and/or have been impaired in their ability to extend credit. As a result, financial markets in the EU experienced extreme volatility and declines in asset values and liquidity. Responses to these financial problems by European governments, central banks, and others, including austerity measures and reforms, may not work, may result in social unrest, and may limit future growth and economic recovery or have other unintended consequences. Further defaults or restructurings by governments and others of their debt could have additional adverse effects on economies, financial markets, and asset valuations around the world. Greece, Ireland, and Portugal have already received one or more "bailouts" from other Eurozone member states, and it is unclear how much additional funding they will require or if additional Eurozone member states will require bailouts in the future. The risk of investing in securities in the European markets may also be heightened due to the referendum in which the United Kingdom voted to exit the EU (known as “Brexit”). One or more other countries may also abandon the euro and/or withdraw from the EU, placing its currency and banking system in jeopardy.
Certain areas of the world have historically been prone to and economically sensitive to environmental events such as, but not limited to, hurricanes, earthquakes, typhoons, flooding, tidal waves, tsunamis, erupting volcanoes, wildfires or droughts, tornadoes, mudslides, or other weather-related phenomena. Such disasters, and the resulting physical or economic damage, could have a severe and negative impact on the Portfolio’s investment portfolio and, in the longer term, could impair the ability of issuers in which the Portfolio invests to conduct their businesses as they would under normal conditions. Adverse weather conditions may also have a particularly significant negative effect on issuers in the agricultural sector and on insurance companies that insure against the impact of natural disasters.
Counterparties Portfolio transactions involving a counterparty are subject to the risk that the counterparty or a third party will not fulfill its obligation to the Portfolio (“counterparty risk”). Counterparty risk may arise because of the counterparty’s financial condition (i.e., financial difficulties, bankruptcy, or insolvency), market activities and developments, or other reasons, whether foreseen or not. A counterparty’s inability to fulfill its obligation may result in significant financial loss to the Portfolio. The Portfolio may be unable to recover its investment from the counterparty or may obtain a limited recovery, and/or recovery may be delayed. The extent of the Portfolio’s exposure to counterparty risk with respect to financial assets and liabilities approximates its carrying value.
The Portfolio may be exposed to counterparty risk through participation in various programs, including, but not limited to, lending its securities to third parties, cash sweep arrangements whereby the Portfolio’s cash balance is invested in one or more types of cash management vehicles, as well as investments in, but not limited to, repurchase agreements, debt securities, and derivatives, including various types of swaps, futures and options. The Portfolio intends to enter into financial transactions with counterparties that Janus Capital believes to be creditworthy at the time of the transaction. There is always the risk that Janus Capital’s analysis of a counterparty’s creditworthiness is incorrect or may change due to market conditions. To the extent that the Portfolio focuses its transactions with a limited number of counterparties, it will have greater exposure to the risks associated with one or more counterparties.
Janus Aspen Balanced Portfolio Notes to Financial Statements (unaudited)
Janus Aspen Series 33
Loans The Portfolio may invest in various commercial loans, including bank loans, bridge loans, debtor-in-possession (“DIP”) loans, mezzanine loans, and other fixed and floating rate loans. These loans may be acquired through loan participations and assignments or on a when-issued basis. Commercial loans will comprise no more than 20% of the Portfolio’s total assets. Below are descriptions of the types of loans held by the Portfolio as of June 30, 2016.
• Bank Loans - Bank loans are obligations of companies or other entities entered into in connection with recapitalizations, acquisitions, and refinancings. The Portfolio’s investments in bank loans are generally acquired as a participation interest in, or assignment of, loans originated by a lender or other financial institution. These investments may include institutionally-traded floating and fixed-rate debt securities.
• Floating Rate Loans – Floating rate loans are debt securities that have floating interest rates, that adjust periodically, and are tied to a benchmark lending rate, such as London Interbank Offered Rate (“LIBOR”). In other cases, the lending rate could be tied to the prime rate offered by one or more major U.S. banks or the rate paid on large certificates of deposit traded in the secondary markets. If the benchmark lending rate changes, the rate payable to lenders under the loan will change at the next scheduled adjustment date specified in the loan agreement. Floating rate loans are typically issued to companies (‘‘borrowers’’) in connection with recapitalizations, acquisitions, and refinancings. Floating rate loan investments are generally below investment grade. Senior floating rate loans are secured by specific collateral of a borrower and are senior in the borrower’s capital structure. The senior position in the borrower’s capital structure generally gives holders of senior loans a claim on certain of the borrower’s assets that is senior to subordinated debt and preferred and common stock in the case of a borrower’s default. Floating rate loan investments may involve foreign borrowers, and investments may be denominated in foreign currencies. Floating rate loans often involve borrowers whose financial condition is troubled or uncertain and companies that are highly leveraged. The Portfolio may invest in obligations of borrowers who are in bankruptcy proceedings. While the Portfolio generally expects to invest in fully funded term loans, certain of the loans in which the Portfolio may invest include revolving loans, bridge loans, and delayed draw term loans.
Purchasers of floating rate loans may pay and/or receive certain fees. The Portfolio may receive fees such as covenant waiver fees or prepayment penalty fees. The Portfolio may pay fees such as facility fees. Such fees may affect the Portfolio’s return.
• Mezzanine Loans - Mezzanine loans are secured by the stock of the company that owns the assets. Mezzanine loans are a hybrid of debt and equity financing that is typically used to fund the expansion of existing companies. A mezzanine loan is composed of debt capital that gives the lender the right to convert to an ownership or equity interest in the company if the loan is not paid back in time and in full. Mezzanine loans typically are the most subordinated debt obligation in an issuer’s capital structure.
Mortgage- and Asset-Backed Securities Mortgage- and asset-backed securities represent interests in “pools” of commercial or residential mortgages or other assets, including consumer loans or receivables. The Portfolio may purchase fixed or variable rate commercial or residential mortgage-backed securities issued by the Government National Mortgage Association (“Ginnie Mae”), the Federal National Mortgage Association (“Fannie Mae”), the Federal Home Loan Mortgage Corporation (“Freddie Mac”), or other governmental or government-related entities. Ginnie Mae’s guarantees are backed by the full faith and credit of the U.S. Government, which means that the U.S. Government guarantees that the interest and principal will be paid when due. Fannie Mae and Freddie Mac securities are not backed by the full faith and credit of the U.S. Government. In September 2008, the Federal Housing Finance Agency (“FHFA”), an agency of the U.S. Government, placed Fannie Mae and Freddie Mac under conservatorship. Since that time, Fannie Mae and Freddie Mac have received capital support through U.S. Treasury preferred stock purchases, and Treasury and Federal Reserve purchases of their mortgage-backed securities. The FHFA and the U.S. Treasury have imposed strict limits on the size of these entities’ mortgage portfolios. The FHFA has the power to cancel any contract entered into by Fannie Mae and Freddie Mac prior to FHFA’s appointment as conservator or receiver, including the guarantee obligations of Fannie Mae and Freddie Mac.
The Portfolio may also purchase other mortgage- and asset-backed securities through single- and multi-seller conduits, collateralized debt obligations, structured investment vehicles, and other similar securities. Asset-backed securities may be backed by various consumer obligations, including automobile loans, equipment leases, credit card receivables, or other collateral. In the event the underlying loans are not paid, the securities’ issuer could be forced to sell the assets
Janus Aspen Balanced Portfolio Notes to Financial Statements (unaudited)
34 JUNE 30, 2016
and recognize losses on such assets, which could impact the Portfolio’s yield and your return. Unlike traditional debt instruments, payments on these securities include both interest and a partial payment of principal. Mortgage and asset-backed securities are subject to both extension risk, where borrowers pay off their debt obligations more slowly in times of rising interest rates, and prepayment risk, where borrowers pay off their debt obligations sooner than expected in times of declining interest rates. These risks may reduce the Portfolio’s returns. In addition, investments in mortgage- and asset backed securities, including those comprised of subprime mortgages, may be subject to a higher degree of credit risk, valuation risk, and liquidity risk than various other types of fixed-income securities. Additionally, although mortgage-backed securities are generally supported by some form of government or private guarantee and/or insurance, there is no assurance that guarantors or insurers will meet their obligations.
Real Estate Investing The Portfolio may invest in equity and debt securities of real estate-related companies. Such companies may include those in the real estate industry or real estate-related industries. These securities may include common stocks, corporate bonds, preferred stocks, and other equity securities, including, but not limited to, mortgage-backed securities, real estate-backed securities, securities of REITs and similar REIT-like entities. A REIT is a trust that invests in real estate-related projects, such as properties, mortgage loans, and construction loans. REITs are generally categorized as equity, mortgage, or hybrid REITs. A REIT may be listed on an exchange or traded OTC.
Restricted Security Transactions Restricted securities held by the Portfolio may not be sold except in exempt transactions or in a public offering registered under the Securities Act of 1933, as amended. The risk of investing in such securities is generally greater than the risk of investing in the securities of widely held, publicly traded companies. Lack of a secondary market and resale restrictions may result in the inability of the Portfolio to sell a security at a fair price and may substantially delay the sale of the security. In addition, these securities may exhibit greater price volatility than securities for which secondary markets exist.
Sovereign Debt The Portfolio may invest in U.S. and foreign government debt securities (“sovereign debt”). Investments in U.S. sovereign debt are considered low risk. However, investments in non-U.S. sovereign debt can involve a high degree of risk, including the risk that the governmental entity that controls the repayment of sovereign debt may not be willing or able to repay the principal and/or to pay the interest on its sovereign debt in a timely manner. A sovereign debtor’s willingness or ability to satisfy its debt obligation may be affected by various factors, including its cash flow situation, the extent of its foreign currency reserves, the availability of foreign exchange when a payment is due, the relative size of its debt position in relation to its economy as a whole, the sovereign debtor’s policy toward international lenders, and local political constraints to which the governmental entity may be subject. Sovereign debtors may also be dependent on expected disbursements from foreign governments, multilateral agencies, and other entities. The failure of a sovereign debtor to implement economic reforms, achieve specified levels of economic performance, or repay principal or interest when due may result in the cancellation of third party commitments to lend funds to the sovereign debtor, which may further impair such debtor’s ability or willingness to timely service its debts. The Portfolio may be requested to participate in the rescheduling of such sovereign debt and to extend further loans to governmental entities, which may adversely affect the Portfolio’s holdings. In the event of default, there may be limited or no legal remedies for collecting sovereign debt and there may be no bankruptcy proceedings through which the Portfolio may collect all or part of the sovereign debt that a governmental entity has not repaid.
When-Issued and Delayed Delivery Securities The Portfolio may purchase or sell securities on a when-issued or delayed delivery basis. When-issued and delayed delivery securities in which the Portfolio may invest include U.S. Treasury Securities, municipal bonds, bank loans, and other similar instruments. The price of the underlying securities and date when the securities will be delivered and paid for are fixed at the time the transaction is negotiated. Losses may arise due to changes in the market value of the securities or from the inability of counterparties to meet the terms of the contract. In connection with such purchases, the Portfolio may hold liquid assets as collateral with the Portfolio’s custodian sufficient to cover the purchase price.
4. Investment Advisory Agreements and Other Transactions with Affiliates The Portfolio pays Janus Capital an investment advisory fee which is calculated daily and paid monthly. The Portfolio’s contractual investment advisory fee rate (expressed as an annual rate) is 0.55% of its average daily net assets.
Janus Aspen Balanced Portfolio Notes to Financial Statements (unaudited)
Janus Aspen Series 35
Janus Services LLC (“Janus Services”), a wholly-owned subsidiary of Janus Capital, is the Portfolio’s transfer agent. Effective May 1, 2016, Janus Services receives an administrative services fee at an annual rate of 0.05% of the average daily net assets of the Portfolio for arranging for the provision by participating insurance companies and qualified plan service providers of administrative services, including recordkeeping, subaccounting, order processing, or other shareholder services provided on behalf of contract holders or plan participants investing in the Portfolio. Other shareholder services may include the provision of order confirmations, periodic account statements, forwarding prospectuses, shareholder reports, and other materials to existing investors, and answering inquiries regarding accounts. Janus Services expects to use this entire fee to compensate insurance companies and qualified plan service providers for providing these services to their customers who invest in the Portfolio. Any unused portion will be reimbursed to the applicable share class at least annually.
In addition, Janus Services provides or arranges for the provision of certain other internal administrative, recordkeeping, and shareholder relations services for the Portfolio. Janus Services is not compensated for these internal services related to the shares, except for out-of-pocket costs. These amounts are disclosed as “Other transfer agent fees and expenses” on the Statement of Operations.
Under a distribution and shareholder servicing plan (the “Plan”) adopted in accordance with Rule 12b-1 under the 1940 Act, the Service Shares may pay the Trust’s distributor, Janus Distributors LLC (“Janus Distributors”), a wholly-owned subsidiary of Janus Capital, a fee for the sale and distribution and/or shareholder servicing of the Service Shares at an annual rate of up to 0.25% of the average daily net assets of the Service Shares. Under the terms of the Plan, the Trust is authorized to make payments to Janus Distributors for remittance to insurance companies and qualified plan service providers as compensation for distribution and/or shareholder services performed by such entities. These amounts are disclosed as “12b-1 Distribution and shareholder servicing fees” on the Statement of Operations. Payments under the Plan are not tied exclusively to actual 12b-1 distribution and servicing fees, and the payments may exceed 12b-1 distribution and servicing fees actually incurred. If any of the Portfolio’s actual 12b-1 distribution and servicing fees incurred during a calendar year are less than the payments made during a calendar year, the Portfolio will be refunded the difference. Refunds, if any, are included in “12b-1 Distribution fees and shareholder servicing fees” in the Statement of Operations.
Janus Capital furnishes certain administration, compliance, and accounting services for the Portfolio and is reimbursed by the Portfolio for certain of its costs in providing those services (to the extent Janus Capital seeks reimbursement and such costs are not otherwise waived). In addition, employees of Janus Capital and/or its affiliates may serve as officers of the Trust. The Portfolio also pays for salaries, fees, and expenses of certain Janus Capital employees and Portfolio officers, with respect to certain specified administration functions they perform on behalf of the Portfolio. The Portfolio pays these costs based on out-of-pocket expenses incurred by Janus Capital, and these costs are separate and apart from advisory fees and other expenses paid in connection with the investment advisory services Janus Capital provides to the Portfolio. These amounts are disclosed as “Portfolio administration fees” on the Statement of Operations. Some expenses related to compensation payable to the Portfolio's Chief Compliance Officer and compliance staff are shared with the Portfolio. Total compensation of $28,304 was paid to the Chief Compliance Officer and certain compliance staff by the Trust during the period ended June 30, 2016. The Portfolio's portion is reported as part of “Other expenses” on the Statement of Operations.
The Board of Trustees has adopted a deferred compensation plan (the “Deferred Plan”) for independent Trustees to elect to defer receipt of all or a portion of the annual compensation they are entitled to receive from the Portfolio. All deferred fees are credited to an account established in the name of the Trustees. The amounts credited to the account then increase or decrease, as the case may be, in accordance with the performance of one or more of the Janus funds that are selected by the Trustees. The account balance continues to fluctuate in accordance with the performance of the selected fund or funds until final payment of all amounts are credited to the account. The fluctuation of the account balance is recorded by the Portfolio as unrealized appreciation/(depreciation) and is included as of June 30, 2016 on the Statement of Assets and Liabilities in the asset, “Non-interested Trustees’ deferred compensation,” and liability, “Non-interested Trustees’ deferred compensation fees.” Additionally, the recorded unrealized appreciation/(depreciation) is included in “Unrealized net appreciation/(depreciation) of investments, foreign currency translations and non-interested Trustees’ deferred compensation” on the Statement of Assets and Liabilities. Deferred compensation expenses for the period ended June 30, 2016 are included in “Non-interested Trustees’ fees and expenses” on the Statement of Operations. Trustees are allowed to change their designation of mutual funds from time
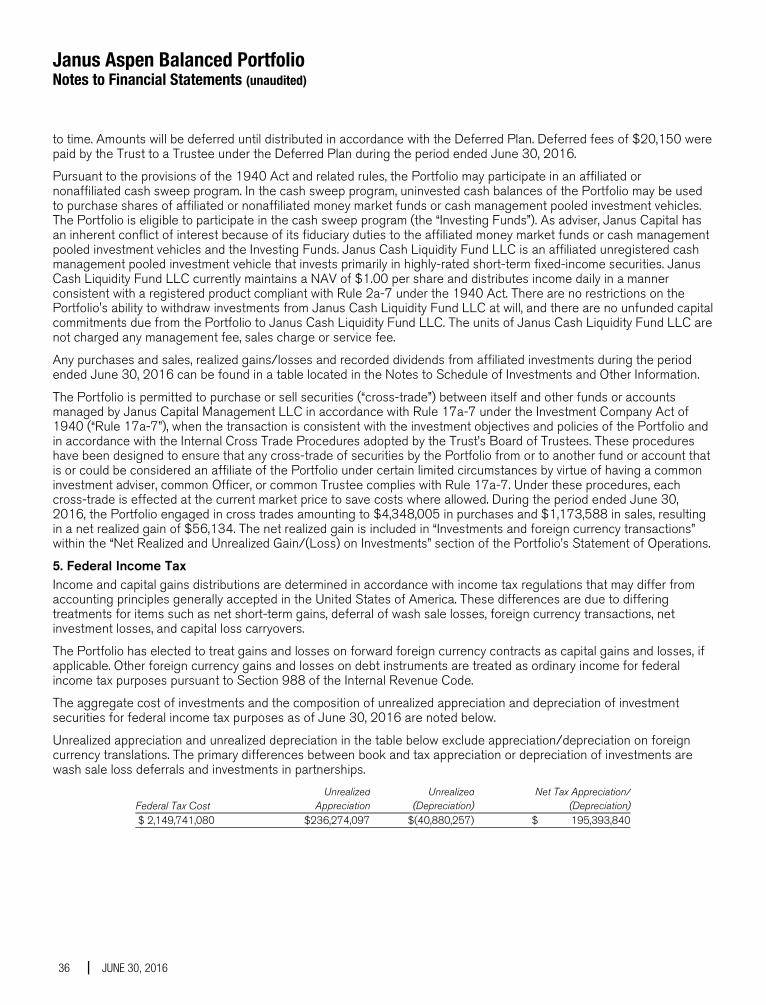
Janus Aspen Balanced Portfolio Notes to Financial Statements (unaudited)
36 JUNE 30, 2016
to time. Amounts will be deferred until distributed in accordance with the Deferred Plan. Deferred fees of $20,150 were paid by the Trust to a Trustee under the Deferred Plan during the period ended June 30, 2016.
Pursuant to the provisions of the 1940 Act and related rules, the Portfolio may participate in an affiliated or nonaffiliated cash sweep program. In the cash sweep program, uninvested cash balances of the Portfolio may be used to purchase shares of affiliated or nonaffiliated money market funds or cash management pooled investment vehicles. The Portfolio is eligible to participate in the cash sweep program (the “Investing Funds”). As adviser, Janus Capital has an inherent conflict of interest because of its fiduciary duties to the affiliated money market funds or cash management pooled investment vehicles and the Investing Funds. Janus Cash Liquidity Fund LLC is an affiliated unregistered cash management pooled investment vehicle that invests primarily in highly-rated short-term fixed-income securities. Janus Cash Liquidity Fund LLC currently maintains a NAV of $1.00 per share and distributes income daily in a manner consistent with a registered product compliant with Rule 2a-7 under the 1940 Act. There are no restrictions on the Portfolio's ability to withdraw investments from Janus Cash Liquidity Fund LLC at will, and there are no unfunded capital commitments due from the Portfolio to Janus Cash Liquidity Fund LLC. The units of Janus Cash Liquidity Fund LLC are not charged any management fee, sales charge or service fee.
Any purchases and sales, realized gains/losses and recorded dividends from affiliated investments during the period ended June 30, 2016 can be found in a table located in the Notes to Schedule of Investments and Other Information.
The Portfolio is permitted to purchase or sell securities (“cross-trade”) between itself and other funds or accounts managed by Janus Capital Management LLC in accordance with Rule 17a-7 under the Investment Company Act of 1940 (“Rule 17a-7”), when the transaction is consistent with the investment objectives and policies of the Portfolio and in accordance with the Internal Cross Trade Procedures adopted by the Trust’s Board of Trustees. These procedures have been designed to ensure that any cross-trade of securities by the Portfolio from or to another fund or account that is or could be considered an affiliate of the Portfolio under certain limited circumstances by virtue of having a common investment adviser, common Officer, or common Trustee complies with Rule 17a-7. Under these procedures, each cross-trade is effected at the current market price to save costs where allowed. During the period ended June 30, 2016, the Portfolio engaged in cross trades amounting to $4,348,005 in purchases and $1,173,588 in sales, resulting in a net realized gain of $56,134. The net realized gain is included in “Investments and foreign currency transactions” within the “Net Realized and Unrealized Gain/(Loss) on Investments” section of the Portfolio’s Statement of Operations.
5. Federal Income Tax Income and capital gains distributions are determined in accordance with income tax regulations that may differ from accounting principles generally accepted in the United States of America. These differences are due to differing treatments for items such as net short-term gains, deferral of wash sale losses, foreign currency transactions, net investment losses, and capital loss carryovers.
The Portfolio has elected to treat gains and losses on forward foreign currency contracts as capital gains and losses, if applicable. Other foreign currency gains and losses on debt instruments are treated as ordinary income for federal income tax purposes pursuant to Section 988 of the Internal Revenue Code.
The aggregate cost of investments and the composition of unrealized appreciation and depreciation of investment securities for federal income tax purposes as of June 30, 2016 are noted below.
Unrealized appreciation and unrealized depreciation in the table below exclude appreciation/depreciation on foreign currency translations. The primary differences between book and tax appreciation or depreciation of investments are wash sale loss deferrals and investments in partnerships.
Federal Tax Cost Unrealized
AppreciationUnrealized
(Depreciation)Net Tax Appreciation/
(Depreciation) $ 2,149,741,080 $236,274,097 $(40,880,257) $ 195,393,840
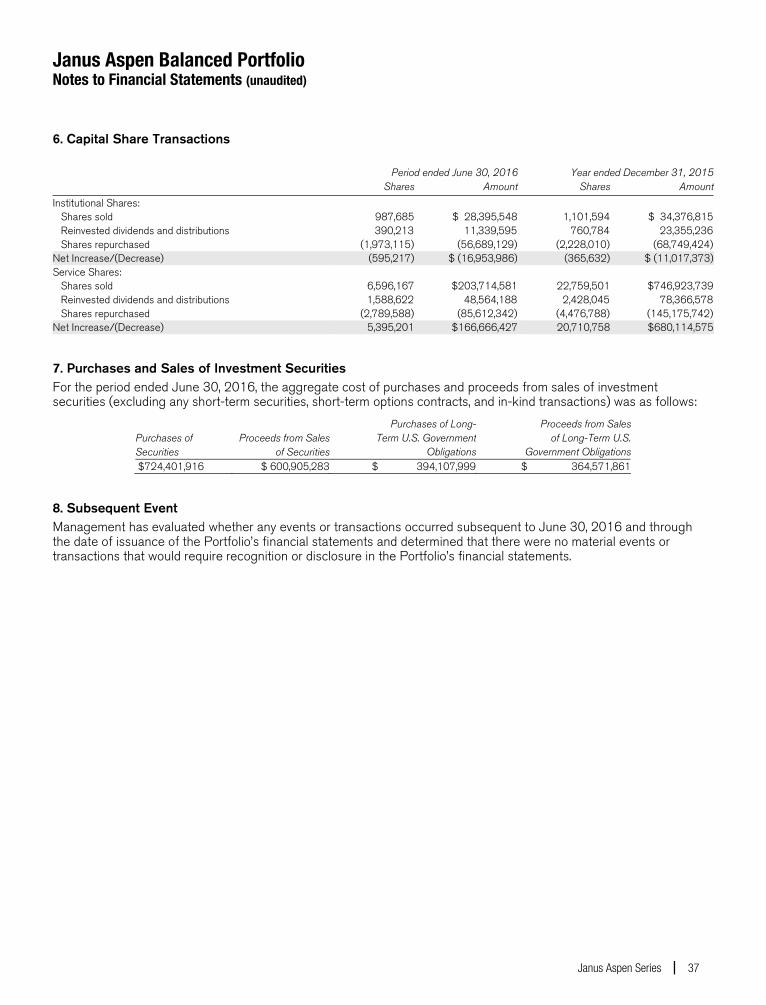
Janus Aspen Balanced Portfolio Notes to Financial Statements (unaudited)
Janus Aspen Series 37
6. Capital Share Transactions Period ended June 30, 2016 Year ended December 31, 2015 Shares Amount Shares Amount
Institutional Shares: Shares sold 987,685 $ 28,395,548 1,101,594 $ 34,376,815 Reinvested dividends and distributions 390,213 11,339,595 760,784 23,355,236 Shares repurchased (1,973,115) (56,689,129) (2,228,010) (68,749,424)Net Increase/(Decrease) (595,217) $ (16,953,986) (365,632) $ (11,017,373)Service Shares: Shares sold 6,596,167 $203,714,581 22,759,501 $746,923,739 Reinvested dividends and distributions 1,588,622 48,564,188 2,428,045 78,366,578 Shares repurchased (2,789,588) (85,612,342) (4,476,788) (145,175,742)Net Increase/(Decrease) 5,395,201 $166,666,427 20,710,758 $680,114,575
7. Purchases and Sales of Investment Securities For the period ended June 30, 2016, the aggregate cost of purchases and proceeds from sales of investment securities (excluding any short-term securities, short-term options contracts, and in-kind transactions) was as follows:
Purchases of Securities
Proceeds from Salesof Securities
Purchases of Long-Term U.S. Government
Obligations
Proceeds from Sales of Long-Term U.S.
Government Obligations $724,401,916 $ 600,905,283 $ 394,107,999 $ 364,571,861
8. Subsequent Event Management has evaluated whether any events or transactions occurred subsequent to June 30, 2016 and through the date of issuance of the Portfolio’s financial statements and determined that there were no material events or transactions that would require recognition or disclosure in the Portfolio’s financial statements.
Janus Aspen Balanced Portfolio Additional Information (unaudited)
38 JUNE 30, 2016
Proxy Voting Policies and Voting Record A description of the policies and procedures that the Portfolio uses to determine how to vote proxies relating to its portfolio securities is available without charge: (i) upon request, by calling 1-800-525-0020 (toll free); (ii) on the Portfolio’s website at janus.com/proxyvoting; and (iii) on the SEC’s website at http://www.sec.gov. Additionally, information regarding the Portfolio’s proxy voting record for the most recent twelve-month period ended June 30 is also available, free of charge, through janus.com/proxyvoting and from the SEC’s website at http://www.sec.gov.
Quarterly Portfolio Holdings The Portfolio files its complete portfolio holdings (schedule of investments) with the SEC for the first and third quarters of each fiscal year on Form N-Q within 60 days of the end of such fiscal quarter. The Portfolio’s Form N-Q: (i) is available on the SEC’s website at http://www.sec.gov; (ii) may be reviewed and copied at the SEC’s Public Reference Room in Washington, D.C. (information on the Public Reference Room may be obtained by calling 1-800-SEC-0330); and (iii) is available without charge, upon request, by calling Janus at 1-800-525-0020 (toll free).
APPROVAL OF ADVISORY AGREEMENTS DURING THE PERIOD The Trustees of Janus Investment Fund and Janus Aspen Series, each of whom serves as an “independent” Trustee (the “Trustees”), oversee the management of each Fund of Janus Investment Fund and each Portfolio of Janus Aspen Series (each, a “Fund” and collectively, the “Funds”), and as required by law, determine annually whether to continue the investment advisory agreement for each Fund and the subadvisory agreements for the 16 Funds that utilize subadvisers.
In connection with their most recent consideration of those agreements for each Fund, the Trustees received and reviewed information provided by Janus Capital and the respective subadvisers in response to requests of the Trustees and their independent legal counsel. They also received and reviewed information and analysis provided by, and in response to requests of, their independent fee consultant. Throughout their consideration of the agreements, the Trustees were advised by their independent legal counsel. The Trustees met with management to consider the agreements, and also met separately in executive session with their independent legal counsel and their independent fee consultant.
At a meeting held on December 9, 2015, based on the Trustees’ evaluation of the information provided by Janus Capital, the subadvisers, and the independent fee consultant, as well as other information, the Trustees determined that the overall arrangements between each Fund and Janus Capital and each subadviser, as applicable, were fair and reasonable in light of the nature, extent and quality of the services provided by Janus Capital, its affiliates and the subadvisers, the fees charged for those services, and other matters that the Trustees considered relevant in the exercise of their business judgment. At that meeting, the Trustees unanimously approved the continuation of the investment advisory agreement for each Fund, and the subadvisory agreement for each subadvised Fund, for the period from either January 1 or February 1, 2016 through January 1 or February 1, 2017, respectively, subject to earlier termination as provided for in each agreement.
In considering the continuation of those agreements, the Trustees reviewed and analyzed various factors that they determined were relevant, including the factors described below, none of which by itself was considered dispositive. However, the material factors and conclusions that formed the basis for the Trustees’ determination to approve the continuation of the agreements are discussed separately below. Also included is a summary of the independent fee consultant’s conclusions and opinions that arose during, and were included as part of, the Trustees’ consideration of the agreements. “Management fees,” as used herein, reflect actual annual advisory fees and any administration fees (excluding out of pocket costs), net of any waivers.
Nature, Extent and Quality of Services The Trustees reviewed the nature, extent and quality of the services provided by Janus Capital and the subadvisers to the Funds, taking into account the investment objective, strategies and policies of each Fund, and the knowledge the Trustees gained from their regular meetings with management on at least a quarterly basis and their ongoing review of information related to the Funds. In addition, the Trustees reviewed the resources and key personnel of Janus Capital and each subadviser, particularly noting those employees who provide investment and risk management services to the Funds. The Trustees also considered other services provided to the Funds by Janus Capital or the subadvisers, such as managing the execution of portfolio transactions and the selection of broker-dealers for those transactions. The Trustees considered Janus Capital’s role as administrator to the Funds, noting that Janus Capital does not receive a fee
Janus Aspen Balanced Portfolio Additional Information (unaudited)
Janus Aspen Series 39
for its services but is reimbursed for its out-of-pocket costs. The Trustees considered the role of Janus Capital in monitoring adherence to the Funds’ investment restrictions, providing support services for the Trustees and Trustee committees, and overseeing communications with shareholders and the activities of other service providers, including monitoring compliance with various policies and procedures of the Funds and with applicable securities laws and regulations.
In this regard, the independent fee consultant noted that Janus Capital provides a number of different services for the Funds and Fund shareholders, ranging from investment management services to various other servicing functions, and that, in its opinion, Janus Capital is a capable provider of those services. The independent fee consultant also provided its belief that Janus Capital has developed a number of institutional competitive advantages that should enable it to provide superior investment and service performance over the long term.
The Trustees concluded that the nature, extent and quality of the services provided by Janus Capital or the subadviser to each Fund were appropriate and consistent with the terms of the respective advisory and subadvisory agreements, and that, taking into account steps taken to address those Funds whose performance lagged that of their peers for certain periods, the Funds were likely to benefit from the continued provision of those services. They also concluded that Janus Capital and each subadviser had sufficient personnel, with the appropriate education and experience, to serve the Funds effectively and had demonstrated its ability to attract well-qualified personnel.
Performance of the Funds The Trustees considered the performance results of each Fund over various time periods. They noted that they considered Fund performance data throughout the year, including periodic meetings with each Fund’s portfolio manager(s), and also reviewed information comparing each Fund’s performance with the performance of comparable funds and peer groups identified by Broadridge Financial Solutions, Inc. (“Broadridge”), an independent data provider, and with the Fund’s benchmark index. In this regard, the independent fee consultant found that the overall Funds’ performance has been strong: for the 36 months ended September 30, 2015, approximately 70% of the Funds were in the top two Broadridge quartiles of performance, and for the 12 months ended September 30, 2015, approximately 61% of the Funds were in the top two Broadridge quartiles of performance.
The Trustees considered the performance of each Fund, noting that performance may vary by share class, and noted the following:
Fixed-Income Funds and Money Market Funds • For Janus Flexible Bond Fund, the Trustees noted that the Fund’s performance was in the third Broadridge
quartile for the 36 months ended May 31, 2015 and the third Broadridge quartile for the 12 months ended May 31, 2015. The Trustees noted the reasons for the Fund’s underperformance and the steps Janus Capital had taken or was taking to improve performance.
• For Janus Global Bond Fund, the Trustees noted that the Fund’s performance was in the second Broadridge quartile for the 36 months ended May 31, 2015 and the second Broadridge quartile for the 12 months ended May 31, 2015.
• For Janus Global Unconstrained Bond Fund, the Trustees noted that the Fund’s performance was in the bottom Broadridge quartile for the 12 months ended May 31, 2015. The Trustees noted the reasons for the Fund’s underperformance, the steps Janus Capital had taken or was taking to improve performance, and its limited performance history.
• For Janus High-Yield Fund, the Trustees noted that the Fund’s performance was in the third Broadridge quartile for the 36 months ended May 31, 2015 and the third Broadridge quartile for the 12 months ended May 31, 2015. The Trustees noted the reasons for the Fund’s underperformance and the steps Janus Capital had taken or was taking to improve performance.
• For Janus Multi-Sector Income Fund, the Trustees noted that the Fund’s performance was in the first Broadridge quartile for the 12 months ended May 31, 2015.
• For Janus Real Return Fund, the Trustees noted that the Fund’s performance was in the first Broadridge quartile for the 36 months ended May 31, 2015 and the first Broadridge quartile for the 12 months ended May 31, 2015.
Janus Aspen Balanced Portfolio Additional Information (unaudited)
40 JUNE 30, 2016
• For Janus Short-Term Bond Fund, the Trustees noted that the Fund’s performance was in the second Broadridge quartile for the 36 months ended May 31, 2015 and the third Broadridge quartile for the 12 months ended May 31, 2015.
• For Janus Government Money Market Fund, the Trustees noted that the Fund’s performance was in the third Broadridge quartile for the 36 months ended May 31, 2015 and the third Broadridge quartile for the 12 months ended May 31, 2015. The Trustees noted the reasons for the Fund’s underperformance.
• For Janus Money Market Fund, the Trustees noted that the Fund’s performance was in the third Broadridge quartile for the 36 months ended May 31, 2015 and the bottom Broadridge quartile for the 12 months ended May 31, 2015. The Trustees noted the reasons for the Fund’s underperformance.
Asset Allocation Funds • For Janus Global Allocation Fund – Conservative, the Trustees noted that the Fund’s performance was in the
first Broadridge quartile for the 36 months ended May 31, 2015 and the third Broadridge quartile for the 12 months ended May 31, 2015.
• For Janus Global Allocation Fund – Growth, the Trustees noted that the Fund’s performance was in the third Broadridge quartile for the 36 months ended May 31, 2015 and the bottom Broadridge quartile for the 12 months ended May 31, 2015. The Trustees noted the reasons for the Fund’s underperformance and the steps Janus Capital had taken or was taking to improve performance.
• For Janus Global Allocation Fund – Moderate, the Trustees noted that the Fund’s performance was in the second Broadridge quartile for the 36 months ended May 31, 2015 and the third Broadridge quartile for the 12 months ended May 31, 2015.
Alternative Fund • For Janus Diversified Alternatives Fund, the Trustees noted that the Fund’s performance was in the second
Broadridge quartile for the 12 months ended May 31, 2015.
Value Funds • For Perkins International Value Fund, the Trustees noted that the Fund’s performance was in the second
Broadridge quartile for the 12 months ended May 31, 2015.
• For Perkins Global Value Fund, the Trustees noted that the Fund’s performance was in the third Broadridge quartile for the 36 months ended May 31, 2015 and the third Broadridge quartile for the 12 months ended May 31, 2015. The Trustees noted the reasons for the Fund’s underperformance, noting that the Fund has a performance fee structure that results in lower management fees during periods of underperformance, and the steps Janus Capital and Perkins had taken or were taking to improve performance.
• For Perkins Large Cap Value Fund, the Trustees noted that the Fund’s performance was in the bottom Broadridge quartile for the 36 months ended May 31, 2015 and the bottom Broadridge quartile for the 12 months ended May 31, 2015. The Trustees noted the reasons for the Fund’s underperformance, noting that the Fund has a performance fee structure that results in lower management fees during periods of underperformance, and the steps Janus Capital and Perkins had taken or were taking to improve performance.
• For Perkins Mid Cap Value Fund, the Trustees noted that the Fund’s performance was in the bottom Broadridge quartile for the 36 months ended May 31, 2015 and the bottom Broadridge quartile for the 12 months ended May 31, 2015. The Trustees noted the reasons for the Fund’s underperformance, noting that the Fund has a performance fee structure that results in lower management fees during periods of underperformance, and the steps Janus Capital and Perkins had taken or were taking to improve performance.
• For Perkins Select Value Fund, the Trustees noted that the Fund’s performance was in the bottom Broadridge quartile for the 36 months ended May 31, 2015 and the second Broadridge quartile for the 12 months ended May 31, 2015. The Trustees noted the reasons for the Fund’s underperformance, noting that the Fund has a performance fee structure that results in lower management fees during periods of underperformance, the steps Janus Capital and Perkins had taken or were taking to improve performance, and that the performance trend was improving.
Janus Aspen Balanced Portfolio Additional Information (unaudited)
Janus Aspen Series 41
• For Perkins Small Cap Value Fund, the Trustees noted that the Fund’s performance was in the bottom Broadridge quartile for the 36 months ended May 31, 2015 and the second Broadridge quartile for the 12 months ended May 31, 2015. The Trustees noted the reasons for the Fund’s underperformance, noting that the Fund has a performance fee structure that results in lower management fees during periods of underperformance, the steps Janus Capital and Perkins had taken or were taking to improve performance, and that the performance trend was improving.
• For Perkins Value Plus Income Fund, the Trustees noted that the Fund’s performance was in the second Broadridge quartile for the 36 months ended May 31, 2015 and the second Broadridge quartile for the 12 months ended May 31, 2015.
Mathematical Funds • For INTECH Emerging Markets Managed Volatility Fund, the Trustees noted that, due to limited performance
for the Fund, performance history was not a material factor.
• For INTECH Global Income Managed Volatility Fund, the Trustees noted that the Fund’s performance was in the first Broadridge quartile for the 36 months ended May 31, 2015 and the third Broadridge quartile for the 12 months ended May 31, 2015.
• For INTECH International Managed Volatility Fund, the Trustees noted that the Fund’s performance was in the bottom Broadridge quartile for the 36 months ended May 31, 2015 and the bottom Broadridge quartile for the 12 months ended May 31, 2015. The Trustees noted the reasons for the Fund’s underperformance and the steps Janus Capital and INTECH had taken or were taking to improve performance.
• For INTECH U.S. Core Fund, the Trustees noted that the Fund’s performance was in the second Broadridge quartile for the 36 months ended May 31, 2015 and the second Broadridge quartile for the 12 months ended May 31, 2015.
• For INTECH U.S. Managed Volatility Fund, the Trustees noted that the Fund’s performance was in the second Broadridge quartile for the 36 months ended May 31, 2015 and the third Broadridge quartile for the 12 months ended May 31, 2015.
Growth and Core Funds • For Janus Balanced Fund, the Trustees noted that the Fund’s performance was in the first Broadridge quartile
for the 36 months ended May 31, 2015 and the first Broadridge quartile for the 12 months ended May 31, 2015.
• For Janus Contrarian Fund, the Trustees noted that the Fund’s performance was in the first Broadridge quartile for the 36 months ended May 31, 2015 and the bottom Broadridge quartile for the 12 months ended May 31, 2015.
• For Janus Enterprise Fund, the Trustees noted that the Fund’s performance was in the second Broadridge quartile for the 36 months ended May 31, 2015 and the first Broadridge quartile for the 12 months ended May 31, 2015.
• For Janus Forty Fund, the Trustees noted that the Fund’s performance was in the second Broadridge quartile for the 36 months ended May 31, 2015 and the first Broadridge quartile for the 12 months ended May 31, 2015.
• For Janus Fund, the Trustees noted that the Fund’s performance was in the second Broadridge quartile for the 36 months ended May 31, 2015 and the first Broadridge quartile for the 12 months ended May 31, 2015.
• For Janus Growth and Income Fund, the Trustees noted that the Fund’s performance was in the third Broadridge quartile for the 36 months ended May 31, 2015 and in the third Broadridge quartile for the 12 months ended May 31, 2015. The Trustees noted the reasons for the Fund’s underperformance and the steps Janus Capital had taken or was taking to improve performance.
• For Janus Research Fund, the Trustees noted that the Fund’s performance was in the first Broadridge quartile for the 36 months ended May 31, 2015 and the first Broadridge quartile for the 12 months ended May 31, 2015.
Janus Aspen Balanced Portfolio Additional Information (unaudited)
42 JUNE 30, 2016
• For Janus Triton Fund, the Trustees noted that the Fund’s performance was in the second Broadridge quartile for the 36 months ended May 31, 2015 and the first Broadridge quartile for the 12 months ended May 31, 2015.
• For Janus Twenty Fund, the Trustees noted that the Fund’s performance was in the third Broadridge quartile for the 36 months ended May 31, 2015 and the bottom Broadridge quartile for the 12 months ended May 31, 2015. The Trustees noted the reasons for the Fund’s underperformance, noting that the Fund has a performance fee structure that results in lower management fees during periods of underperformance, and the steps Janus Capital had taken or was taking to improve performance.
• For Janus Venture Fund, the Trustees noted that the Fund’s performance was in the first Broadridge quartile for the 36 months ended May 31, 2015 and the first Broadridge quartile for the 12 months ended May 31, 2015.
Global and International Funds • For Janus Asia Equity Fund, the Trustees noted that the Fund’s performance was in the third Broadridge
quartile for the 36 months ended May 31, 2015 and the first Broadridge quartile for the 12 months ended May 31, 2015. The Trustees noted the reasons for the Fund’s underperformance, noting that the Fund has a performance fee structure that results in lower management fees during periods of underperformance, the steps Janus Capital had taken or was taking to improve performance, and that the performance trend was improving.
• For Janus Emerging Markets Fund, the Trustees noted that the Fund’s performance was in the second Broadridge quartile for the 36 months ended May 31, 2015 and the first Broadridge quartile for the 12 months ended May 31, 2015.
• For Janus Global Life Sciences Fund, the Trustees noted that the Fund’s performance was in the first Broadridge quartile for the 36 months ended May 31, 2015 and the first Broadridge quartile for the 12 months ended May 31, 2015.
• For Janus Global Real Estate Fund, the Trustees noted that the Fund’s performance was in the first Broadridge quartile for the 36 months ended May 31, 2015 and the first Broadridge quartile for the 12 months ended May 31, 2015.
• For Janus Global Research Fund, the Trustees noted that the Fund’s performance was in the second Broadridge quartile for the 36 months ended May 31, 2015 and the first Broadridge quartile for the 12 months ended May 31, 2015.
• For Janus Global Select Fund, the Trustees noted that the Fund’s performance was in the second Broadridge quartile for the 36 months ended May 31, 2015 and the first Broadridge quartile for the 12 months ended May 31, 2015.
• For Janus Global Technology Fund, the Trustees noted that the Fund’s performance was in the third Broadridge quartile for the 36 months ended May 31, 2015 and the third Broadridge quartile for the 12 months ended May 31, 2015. The Trustees noted the reasons for the Fund’s underperformance and the steps Janus Capital had taken or was taking to improve performance.
• For Janus International Equity Fund, the Trustees noted that the Fund’s performance was in the second Broadridge quartile for the 36 months ended May 31, 2015 and the second Broadridge quartile for the 12 months ended May 31, 2015.
• For Janus Overseas Fund, the Trustees noted that the Fund’s performance was in the bottom Broadridge quartile for the 36 months ended May 31, 2015 and the bottom Broadridge quartile for the 12 months ended May 31, 2015. The Trustees noted the reasons for the Fund’s underperformance, noting that the Fund has a performance fee structure that results in lower management fees during periods of underperformance, and the steps Janus Capital had taken or was taking to improve performance.
Janus Aspen Balanced Portfolio Additional Information (unaudited)
Janus Aspen Series 43
Janus Aspen Series • For Janus Aspen Balanced Portfolio, the Trustees noted that the Fund’s performance was in the first
Broadridge quartile for the 36 months ended May 31, 2015 and the first Broadridge quartile for the 12 months ended May 31, 2015.
• For Janus Aspen Enterprise Portfolio, the Trustees noted that the Fund’s performance was in the second Broadridge quartile for the 36 months ended May 31, 2015 and the first Broadridge quartile for the 12 months ended May 31, 2015.
• For Janus Aspen Flexible Bond Portfolio, the Trustees noted that the Fund’s performance was in the second Broadridge quartile for the 36 months ended May 31, 2015 and the second Broadridge quartile for the 12 months ended May 31, 2015.
• For Janus Aspen Forty Portfolio, the Trustees noted that the Fund’s performance was in the second Broadridge quartile for the 36 months ended May 31, 2015 and the first Broadridge quartile for the 12 months ended May 31, 2015.
• For Janus Aspen Global Allocation Portfolio – Moderate, the Trustees noted that the Fund’s performance was in the first Broadridge quartile for the 36 months ended May 31, 2015 and the bottom Broadridge quartile for the 12 months ended May 31, 2015.
• For Janus Aspen Global Research Portfolio, the Trustees noted that the Fund’s performance was in the first Broadridge quartile for the 36 months ended May 31, 2015 and the second Broadridge quartile for the 12 months ended May 31, 2015.
• For Janus Aspen Global Technology Portfolio, the Trustees noted that the Fund’s performance was in the second Broadridge quartile for the 36 months ended May 31, 2015 and the third Broadridge quartile for the 12 months ended May 31, 2015.
• For Janus Aspen Global Unconstrained Bond Portfolio, the Trustees noted that, due to limited performance for the Fund, performance history was not a material factor.
• For Janus Aspen INTECH U.S. Low Volatility Portfolio, the Trustees noted that the Fund’s performance was in the first Broadridge quartile for the 12 months ended May 31, 2015.
• For Janus Aspen Janus Portfolio, the Trustees noted that the Fund’s performance was in the second Broadridge quartile for the 36 months ended May 31, 2015 and the first Broadridge quartile for the 12 months ended May 31, 2015.
• For Janus Aspen Overseas Portfolio, the Trustees noted that the Fund’s performance was in the bottom Broadridge quartile for the 36 months ended May 31, 2015 and the bottom Broadridge quartile for the 12 months ended May 31, 2015. The Trustees noted the reasons for the Fund’s underperformance, noting that the Fund has a performance fee structure that results in lower management fees during periods of underperformance, and the steps Janus Capital had taken or was taking to improve performance.
• For Janus Aspen Perkins Mid Cap Value Portfolio, the Trustees noted that the Fund’s performance was in the bottom Broadridge quartile for the 36 months ended May 31, 2015 and the bottom Broadridge quartile for the 12 months ended May 31, 2015. The Trustees noted the reasons for the Fund’s underperformance, noting that the Fund has a performance fee structure that results in lower management fees during periods of underperformance, and the steps Janus Capital and Perkins had taken or were taking to improve performance.
In consideration of each Fund’s performance, the Trustees concluded that, taking into account the factors relevant to performance, as well as other considerations, including steps taken to improve performance, the Fund’s performance warranted continuation of the Fund’s investment advisory and subadvisory agreement(s).
Costs of Services Provided The Trustees examined information regarding the fees and expenses of each Fund in comparison to similar information for other comparable funds as provided by Broadridge, an independent data provider. They also reviewed an analysis of that information provided by their independent fee consultant and noted that the rate of management (investment advisory and any administration, but excluding out-of-pocket costs) fees for many of the Funds, after applicable waivers,
Janus Aspen Balanced Portfolio Additional Information (unaudited)
44 JUNE 30, 2016
was below the mean management fee rate of the respective peer group of funds selected by an independent data provider. The Trustees also examined information regarding the subadvisory fees charged for subadvisory services, as applicable, noting that all such fees were paid by Janus Capital out of its management fees collected from such Fund.
The independent fee consultant provided its belief that the management fees charged by Janus Capital to each of the Funds under the current investment advisory and administration agreements are reasonable in relation to the services provided by Janus Capital. The independent fee consultant found: (1) the total expenses and management fees of the Funds to be reasonable relative to other mutual funds; (2) total expenses, on average, were 14% below the mean total expenses of their respective Broadridge Expense Group peers and 24% below the mean total expenses for their Broadridge Expense Universes; (3) management fees for the Funds, on average, were 15% below the mean management fees for their Expense Groups and 19% below the mean for their Expense Universes; and (4) Fund expenses at the functional level for each asset and share class category were reasonable. The Trustees also considered the total expenses for each share class of each Fund compared to the mean total expenses for its Broadridge Expense Group peers and to mean total expenses for its Broadridge Expense Universe.
The independent fee consultant concluded that, based on its strategic review of expenses at the complex, category and individual fund level, Fund expenses were found to be reasonable relative to both Expense Group and Expense Universe benchmarks. Further, for certain Funds, the independent fee consultant also performed a systematic “focus list” analysis of expenses in the context of the performance or service delivered to each set of investors in each share class in each selected Fund. Based on this analysis, the independent fee consultant found that the combination of service quality/performance and expenses on these individual Funds and share classes were reasonable in light of performance trends, performance histories, and existence of performance fees, breakpoints, and expense waivers on such Funds.
The Trustees considered the methodology used by Janus Capital and each subadviser in determining compensation payable to portfolio managers, the competitive environment for investment management talent, and the competitive market for mutual funds in different distribution channels.
The Trustees also reviewed management fees charged by Janus Capital and each subadviser to comparable separate account clients and to comparable non-affiliated funds subadvised by Janus Capital or by a subadviser (for which Janus Capital or the subadviser provides only or primarily portfolio management services). Although in most instances subadvisory and separate account fee rates for various investment strategies were lower than management fee rates for Funds having a similar strategy, the Trustees considered that Janus Capital noted that, under the terms of the management agreements with the Funds, Janus Capital performs significant additional services for the Funds that it does not provide to those other clients, including administration services, oversight of the Funds’ other service providers, trustee support, regulatory compliance and numerous other services, and that, in serving the Funds, Janus Capital assumes many legal risks and other costs that it does not assume in servicing its other clients. Moreover, they noted that the independent fee consultant found that: (1) the management fees Janus Capital charges to the Funds are reasonable in relation to the management fees Janus Capital charges to its institutional and subadvised accounts; (2) these institutional and subadvised accounts have different service and infrastructure needs; (3) the average spread between management fees charged to the Funds and those charged to Janus Capital’s institutional accounts is reasonable relative to the average spreads seen in the industry; and (4) by one estimation methodology, the fee margins implied by Janus Capital’s subadvised fees when compared to its mutual fund fees are reasonable relative to the estimated fee margins in the industry and relative to estimated fee margins of fund managers using Janus Capital as a subadviser.
The Trustees considered the fees for each Fund for its fiscal year ended in 2014, and noted the following with regard to each Fund’s total expenses, net of applicable fee waivers (the Fund’s “total expenses”):
Fixed-Income Funds and Money Market Funds • For Janus Flexible Bond Fund, the Trustees noted that, although the Fund’s total expenses exceeded the peer
group mean for certain share classes, overall the Fund’s total expenses were reasonable. The Trustees also noted that Janus Capital has contractually agreed to limit the Fund’s expenses, although this limit did not apply because the Fund’s total expenses were already below the applicable fee limit.

Janus Aspen Balanced Portfolio Additional Information (unaudited)
Janus Aspen Series 45
• For Janus Global Bond Fund, the Trustees noted that although the Fund’s total expenses exceeded the peer group mean for certain share classes, overall the Fund’s total expenses were reasonable. The Trustees also noted that Janus Capital has contractually agreed to limit the Fund’s expenses.
• For Janus Global Unconstrained Bond Fund, the Trustees noted that although the Fund’s total expenses exceeded the peer group mean for certain share classes, overall the Fund’s total expenses were reasonable. The Trustees also noted that Janus Capital has contractually agreed to limit the Fund’s expenses.
• For Janus High-Yield Fund, the Trustees noted that, although the Fund’s total expenses exceeded the peer group mean for certain share classes, overall the Fund’s total expenses were reasonable. The Trustees also noted that Janus Capital has contractually agreed to limit the Fund’s expenses, although this limit did not apply because the Fund’s total expenses were already below the applicable fee limit.
• For Janus Multi-Sector Income Fund, the Trustees noted that, although the Fund’s total expenses exceeded the peer group mean for certain share classes, overall the Fund’s total expenses were reasonable. The Trustees also noted that Janus has contractually agreed to limit the Fund’s expenses.
• For Janus Real Return Fund, the Trustees noted that, although the Fund’s total expenses exceeded the peer group mean for all share classes, overall the Fund’s total expenses were reasonable. The Trustees also noted that Janus Capital has contractually agreed to limit the Fund’s expenses.
• For Janus Short-Term Bond Fund, the Trustees noted that, although the Fund’s total expenses exceeded the peer group mean for all share classes, overall the Fund’s total expenses were reasonable. The Trustees also noted that Janus Capital has contractually agreed to limit the Fund’s expenses.
• For Janus Government Money Market Fund, the Trustees noted that the Fund’s total expenses exceeded the peer group mean for both share classes. The Trustees considered that management fees for this Fund are higher than the peer group mean due to the Fund’s management fee including other costs, such as custody and transfer agent services, while many funds in the peer group pay these expenses separately from their management fee. In addition, the Trustees considered that Janus Capital voluntarily waives one-half of its advisory fee and other expenses in order to maintain a positive yield.
• For Janus Money Market Fund, the Trustees noted that the Fund’s total expenses were below the peer group mean for both share classes. In addition, the Trustees considered that Janus Capital voluntarily waives one-half of its advisory fee and other expenses in order to maintain a positive yield.
Asset Allocation Funds • For Janus Global Allocation Fund – Conservative, the Trustees noted that the Fund’s total expenses were
below the peer group mean for all share classes.
• For Janus Global Allocation Fund – Growth, the Trustees noted that the Fund’s total expenses were below the peer group mean for all share classes.
• For Janus Global Allocation Fund – Moderate, the Trustees noted that, although the Fund’s total expenses exceeded the peer group mean for certain share classes, overall the Fund’s total expenses were reasonable. The Trustees also noted that Janus Capital has contractually agreed to limit the Fund’s expenses.
Alternative Fund • For Janus Diversified Alternatives Fund, the Trustees noted that, although the Fund’s total expenses exceeded
the peer group mean for one share class, overall the Fund’s total expenses were reasonable. The Trustees also noted that Janus Capital has contractually agreed to limit the Fund’s expenses.
Value Funds • For Perkins International Value Fund, the Trustees noted that, although the Fund’s total expenses exceeded
the peer group mean for certain share classes, overall the Fund’s total expenses were reasonable. The Trustees also noted that Janus Capital has contractually agreed to limit the Fund’s expenses.
• For Perkins Global Value Fund, the Trustees noted that, although the Fund’s total expenses exceeded the peer group mean for one share class, overall the Fund’s total expenses were reasonable.

Janus Aspen Balanced Portfolio Additional Information (unaudited)
46 JUNE 30, 2016
• For Perkins Large Cap Value Fund, the Trustees noted that, although the Fund’s total expenses exceeded the peer group mean for certain share classes, overall the Fund’s total expenses were reasonable. The Trustees also noted that Janus Capital has contractually agreed to limit the Fund’s expenses.
• For Perkins Mid Cap Value Fund, the Trustees noted that, although the Fund’s total expenses exceeded the peer group mean for one share class, overall the Fund’s total expenses were reasonable. The Trustees also noted that Janus Capital has contractually agreed to limit the Fund’s expenses, although this limit did not apply because the Fund’s total expenses were already below the applicable fee limit.
• For Perkins Select Value Fund, the Trustees noted that, although the Fund’s total expenses exceeded the peer group mean for one share class, overall the Fund’s total expenses were reasonable. The Trustees also noted that Janus Capital has contractually agreed to limit the Fund’s expenses.
• For Perkins Small Cap Value Fund, the Trustees noted that the Fund’s total expenses were below the peer group mean for all share classes.
• For Perkins Value Plus Income Fund, the Trustees noted that although the Fund’s total expenses exceeded the peer group mean for one share class, overall the Fund’s total expenses were reasonable. The Trustees also noted that Janus Capital had contractually agreed to limit the Fund’s expenses.
Mathematical Funds • For INTECH Emerging Markets Managed Volatility Fund, the Trustees noted that although the Fund’s total
expenses exceeded the peer group mean for certain share classes, overall the Fund’s total expenses were reasonable. The Trustees also noted that Janus Capital has contractually agreed to limit the Fund’s expenses.
• For INTECH Global Income Managed Volatility Fund, the Trustees noted that the Fund’s total expenses were below the peer group mean for all share classes.
• For INTECH International Managed Volatility Fund, the Trustees noted that although the Fund’s total expenses exceeded the peer group mean for one share class, overall the Fund’s total expenses were reasonable. The Trustees also noted that Janus Capital had contractually agreed to limit the Fund’s expenses, although this limit did not apply because the Fund’s total expenses were already below the applicable fee limit.
• For INTECH U.S. Core Fund, the Trustees noted that although the Fund’s total expenses exceeded the peer group mean for one share class, overall the Fund’s total expenses were reasonable. The Trustees also noted that Janus Capital has contractually agreed to limit the Fund’s expenses, although this limit did not apply because the Fund’s total expenses were already below the applicable fee limit.
• For INTECH U.S. Managed Volatility Fund, the Trustees noted that the Fund’s total expenses exceeded the peer group mean for one share class. The Trustees also noted that Janus Capital had contractually agreed to limit the Fund’s expenses.
Growth and Core Funds • For Janus Balanced Fund, the Trustees noted that, although the Fund’s total expenses exceeded the peer
group mean for one share class, overall the Fund’s total expenses were reasonable. The Trustees also noted that Janus Capital has contractually agreed to limit the Fund’s expenses, although this limit did not apply because the Fund’s total expenses were already below the applicable fee limit.
• For Janus Contrarian Fund, the Trustees noted that, although the Fund’s total expenses exceeded the peer group mean for certain share classes, overall the Fund’s total expenses were reasonable. The Trustees also noted that Janus Capital has contractually agreed to limit the Fund’s expenses, although this limit did not apply because the Fund’s total expenses were already below the applicable fee limit.
• For Janus Enterprise Fund, the Trustees noted that, although the Fund’s total expenses exceeded the peer group mean for certain share classes, overall the Fund’s total expenses were reasonable. The Trustees also noted that Janus Capital has contractually agreed to limit the Fund’s expenses, although this limit did not apply because the Fund’s total expenses were already below the applicable fee limit.
• For Janus Forty Fund, the Trustees noted that the Fund’s total expenses were below the peer group mean for all share classes.

Janus Aspen Balanced Portfolio Additional Information (unaudited)
Janus Aspen Series 47
• For Janus Fund, the Trustees noted that the Fund’s total expenses were below the peer group mean for all share classes.
• For Janus Growth and Income Fund, the Trustees noted that, although the Fund’s total expenses exceeded the peer group mean for certain share classes, overall the Fund’s total expenses were reasonable. The Trustees also noted that Janus Capital has contractually agreed to limit the Fund’s expenses, although this limit did not apply because the Fund’s total expenses were already below the applicable fee limit.
• For Janus Research Fund, the Trustees noted that the Fund’s total expenses were below the peer group mean for all share classes.
• For Janus Triton Fund, the Trustees noted that, although the Fund’s total expenses exceeded the peer group mean for one share class, overall the Fund’s total expenses were reasonable. The Trustees also noted that Janus Capital has contractually agreed to limit the Fund’s expenses, although this limit did not apply because the Fund’s total expenses were already below the applicable fee limit.
• For Janus Twenty Fund, the Trustees noted that the Fund’s total expenses were below the peer group mean for all share classes.
• For Janus Venture Fund, the Trustees noted that, although the Fund’s total expenses exceeded the peer group mean for one share class, overall the Fund’s total expenses were reasonable. The Trustees also noted that Janus Capital has contractually agreed to limit the Fund’s expenses, although this limit did not apply because the Fund’s total expenses were already below the applicable fee limit.
Global and International Funds • For Janus Asia Equity Fund, the Trustees noted that the Fund’s total expenses were below the peer group
mean for all share classes.
• For Janus Emerging Markets Fund, the Trustees noted that, although the Fund’s total expenses exceeded the peer group mean for certain share classes, overall the Fund’s total expenses were reasonable. The Trustees also noted that Janus Capital has contractually agreed to limit the Fund’s expenses.
• For Janus Global Life Sciences Fund, the Trustees noted that the Fund’s total expenses were below the peer group mean for all share classes.
• For Janus Global Real Estate Fund, the Trustees noted that, although the Fund’s total expenses exceeded the peer group mean for one share class, overall the Fund’s total expenses were reasonable. The Trustees also noted that Janus Capital has contractually agreed to limit the Fund’s expenses.
• For Janus Global Research Fund, the Trustees noted that the Fund’s total expenses were below the peer group mean for all share classes.
• For Janus Global Select Fund, the Trustees noted that the Fund’s total expenses were below the peer group mean for all share classes.
• For Janus Global Technology Fund, the Trustees noted that the Fund’s total expenses were below the peer group mean for all share classes.
• For Janus International Equity Fund, the Trustees noted that, although the Fund’s total expenses exceeded the peer group mean for one share class, overall the Fund’s total expenses were reasonable. The Trustees also noted that Janus Capital has contractually agreed to limit the Fund’s expenses, although this limit did not apply because the Fund’s total expenses were already below the applicable fee limit.
• For Janus Overseas Fund, the Trustees noted that the Fund’s total expenses were below the peer group mean for all share classes.
Janus Aspen Series • For Janus Aspen Balanced Portfolio, the Trustees noted that the Fund’s total expenses were below the peer
group mean for both share classes.
Janus Aspen Balanced Portfolio Additional Information (unaudited)
48 JUNE 30, 2016
• For Janus Aspen Enterprise Portfolio, the Trustees noted that the Fund’s total expenses were below the peer group mean for both share classes.
• For Janus Aspen Flexible Bond Portfolio, the Trustees noted that, although the Fund’s total expenses exceeded the peer group mean for one share class, overall the Fund’s total expenses were reasonable. The Trustees also noted that Janus Capital had contractually agreed to limit the Fund’s expenses.
• For Janus Aspen Forty Portfolio, the Trustees noted that the Fund’s total expenses were below the peer group mean for both share classes.
• For Janus Aspen Global Allocation Portfolio - Moderate, the Trustees noted that, although the Fund’s total expenses exceeded the peer group mean for both share classes, overall the Fund’s total expenses were reasonable. The Trustees also noted that Janus Capital has contractually agreed to limit the Fund’s expenses.
• For Janus Aspen Global Research Portfolio, the Trustees noted that the Fund’s total expenses were below the peer group mean for both share classes.
• For Janus Aspen Global Technology Portfolio, the Trustees noted that the Fund’s total expenses were below the peer group mean for both share classes.
• For Janus Aspen Global Unconstrained Bond Portfolio, the Trustees noted that, although the Fund’s total expenses exceeded the peer group mean for both share classes, overall the Fund’s total expenses were reasonable. The Trustees also noted that Janus Capital had contractually agreed to limit the Fund’s expenses.
• For Janus Aspen INTECH U.S. Low Volatility Portfolio, the Trustees noted that the Fund’s total expenses were below the peer group mean for its sole share class.
• For Janus Aspen Janus Portfolio, the Trustees noted that the Fund’s total expenses were below the peer group mean for both share classes.
• For Janus Aspen Overseas Portfolio, the Trustees noted that the Fund’s total expenses were below the peer group mean for both share classes.
• For Janus Aspen Perkins Mid Cap Value Portfolio, the Trustees noted that the Fund’s total expenses were below the peer group mean for both share classes.
The Trustees reviewed information on the profitability to Janus Capital and its affiliates of their relationships with each Fund, as well as an explanation of the methodology utilized by Janus Capital when allocating various expenses of Janus Capital and its affiliates with respect to contractual relationships with the Funds and other clients. The Trustees also reviewed the financial statements and corporate structure of Janus Capital’s parent company. In their review, the Trustees considered whether Janus Capital and each subadviser receive adequate incentives and resources to manage the Funds effectively. The Trustees recognized that profitability comparisons among fund managers are difficult because very little comparative information is publicly available, and the profitability of any fund manager is affected by numerous factors, including the organizational structure of the particular fund manager, the types of funds and other accounts it manages, possible other lines of business, the methodology for allocating expenses, and the fund manager’s capital structure and cost of capital. However, taking into account those factors and the analysis provided by the Trustees’ independent fee consultant, and based on the information available, the Trustees concluded that Janus Capital’s profitability with respect to each Fund in relation to the services rendered was reasonable.
The independent fee consultant found that, while assessing the reasonableness of expenses in light of Janus Capital’s profits is dependent on comparisons with other publicly-traded mutual fund advisers, and that these comparisons are limited in accuracy by differences in complex size, business mix, institutional account orientation, and other factors, after accepting these limitations, the level of profit earned by Janus Capital from managing the Funds is reasonable.
The Trustees concluded that the management fees payable by each Fund to Janus Capital and its affiliates, as well as the fees paid by Janus Capital to the subadvisers of subadvised Funds, were reasonable in relation to the nature, extent, and quality of the services provided, taking into account the fees charged by other advisers for managing comparable mutual funds with similar strategies, the fees Janus Capital and the subadvisers charge to other clients, and, as applicable, the impact of fund performance on management fees payable by the Funds. The Trustees also concluded that each Fund’s total expenses were reasonable, taking into account the size of the Fund, the quality of services
Janus Aspen Balanced Portfolio Additional Information (unaudited)
Janus Aspen Series 49
provided by Janus Capital and any subadviser, the investment performance of the Fund, and any expense limitations agreed to or provided by Janus Capital.
Economies of Scale The Trustees considered information about the potential for Janus Capital to realize economies of scale as the assets of the Funds increase. They noted that their independent fee consultant provided an analysis of economies of scale, which included discussion of analysis from prior years. They also noted that, although many Funds pay advisory fees at a base fixed rate as a percentage of net assets, without any breakpoints, their independent fee consultant concluded that 85% of these Funds have contractual management fees (gross of waivers) below their Broadridge expense group averages and, overall, 80% of the Funds are below their respective expense group averages for contractual management fees. They also noted that for those Funds whose expenses are being reduced by the contractual expense limitations of Janus Capital, Janus Capital is subsidizing the Funds because they have not reached adequate scale. Moreover, as the assets of some of the Funds have declined in the past few years, certain Funds have benefited from having advisory fee rates that have remained constant rather than increasing as assets declined. In addition, performance fee structures have been implemented for various Funds that have caused the effective rate of advisory fees payable by such a Fund to vary depending on the investment performance of the Fund relative to its benchmark index over the measurement period; and a few Funds have fee schedules with breakpoints and reduced fee rates above certain asset levels. The Trustees also noted that the Funds share directly in economies of scale through the lower charges of third-party service providers that are based in part on the combined scale of all of the Funds. Based on all of the information they reviewed, including research and analysis conducted by the Trustees’ independent fee consultant, the Trustees concluded that the current fee structure of each Fund was reasonable and that the current rates of fees do reflect a sharing between Janus Capital and the Fund of any economies of scale that may be present at the current asset level of the Fund.
The independent fee consultant concluded that, given the limitations of various analytical approaches to economies of scale considered in prior years, and their conflicting results, its analyses could not confirm or deny the existence of economies of scale in the Janus complex. Further, the independent fee consultant provided its belief that Fund investors are well-served by the fee levels and performance fee structures in place on the Funds in light of any economies of scale that may be present at Janus Capital.
Other Benefits to Janus Capital The Trustees also considered benefits that accrue to Janus Capital and its affiliates and subadvisers to the Funds from their relationships with the Funds. They recognized that two affiliates of Janus Capital separately serve the Funds as transfer agent and distributor, respectively, and the transfer agent receives compensation directly from the non-money market funds for services provided. The Trustees also considered Janus Capital’s past and proposed use of commissions paid by the Funds on portfolio brokerage transactions to obtain proprietary and third-party research products and services benefiting the Fund and/or other clients of Janus Capital and/or Janus Capital, and/or a subadviser to a Fund. The Trustees concluded that Janus Capital’s and the subadvisers’ use of these types of client commission arrangements to obtain proprietary and third-party research products and services was consistent with regulatory requirements and guidelines and was likely to benefit each Fund. The Trustees also concluded that, other than the services provided by Janus Capital and its affiliates and subadvisers pursuant to the agreements and the fees to be paid by each Fund therefor, the Funds and Janus Capital and the subadvisers may potentially benefit from their relationship with each other in other ways. They concluded that Janus Capital and/or the subadvisers benefits from the receipt of research products and services acquired through commissions paid on portfolio transactions of the Funds and that the Funds benefit from Janus Capital’s and/or the subadvisers’ receipt of those products and services as well as research products and services acquired through commissions paid by other clients of Janus Capital and/or other clients of the subadvisers. They further concluded that the success of any Fund could attract other business to Janus Capital, the subadvisers or other Janus funds, and that the success of Janus Capital and the subadvisers could enhance Janus Capital’s and the subadvisers’ ability to serve the Funds.
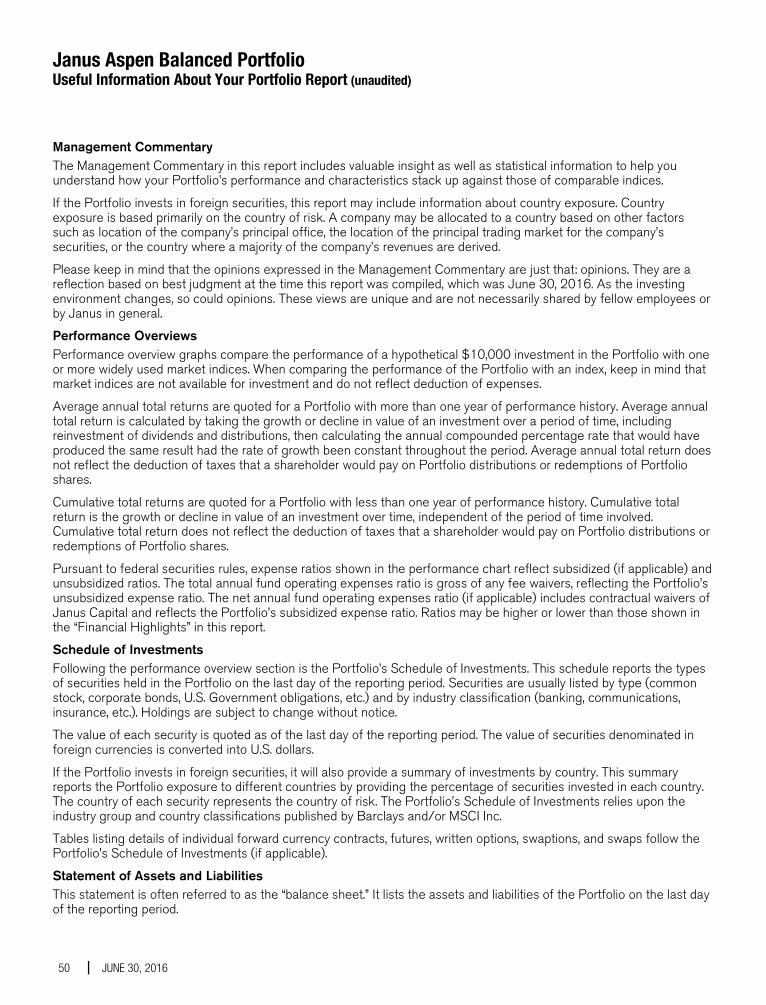
Janus Aspen Balanced Portfolio Useful Information About Your Portfolio Report (unaudited)
50 JUNE 30, 2016
Management Commentary The Management Commentary in this report includes valuable insight as well as statistical information to help you understand how your Portfolio’s performance and characteristics stack up against those of comparable indices.
If the Portfolio invests in foreign securities, this report may include information about country exposure. Country exposure is based primarily on the country of risk. A company may be allocated to a country based on other factors such as location of the company’s principal office, the location of the principal trading market for the company’s securities, or the country where a majority of the company’s revenues are derived.
Please keep in mind that the opinions expressed in the Management Commentary are just that: opinions. They are a reflection based on best judgment at the time this report was compiled, which was June 30, 2016. As the investing environment changes, so could opinions. These views are unique and are not necessarily shared by fellow employees or by Janus in general.
Performance Overviews Performance overview graphs compare the performance of a hypothetical $10,000 investment in the Portfolio with one or more widely used market indices. When comparing the performance of the Portfolio with an index, keep in mind that market indices are not available for investment and do not reflect deduction of expenses.
Average annual total returns are quoted for a Portfolio with more than one year of performance history. Average annual total return is calculated by taking the growth or decline in value of an investment over a period of time, including reinvestment of dividends and distributions, then calculating the annual compounded percentage rate that would have produced the same result had the rate of growth been constant throughout the period. Average annual total return does not reflect the deduction of taxes that a shareholder would pay on Portfolio distributions or redemptions of Portfolio shares.
Cumulative total returns are quoted for a Portfolio with less than one year of performance history. Cumulative total return is the growth or decline in value of an investment over time, independent of the period of time involved. Cumulative total return does not reflect the deduction of taxes that a shareholder would pay on Portfolio distributions or redemptions of Portfolio shares.
Pursuant to federal securities rules, expense ratios shown in the performance chart reflect subsidized (if applicable) and unsubsidized ratios. The total annual fund operating expenses ratio is gross of any fee waivers, reflecting the Portfolio’s unsubsidized expense ratio. The net annual fund operating expenses ratio (if applicable) includes contractual waivers of Janus Capital and reflects the Portfolio’s subsidized expense ratio. Ratios may be higher or lower than those shown in the “Financial Highlights” in this report.
Schedule of Investments Following the performance overview section is the Portfolio’s Schedule of Investments. This schedule reports the types of securities held in the Portfolio on the last day of the reporting period. Securities are usually listed by type (common stock, corporate bonds, U.S. Government obligations, etc.) and by industry classification (banking, communications, insurance, etc.). Holdings are subject to change without notice.
The value of each security is quoted as of the last day of the reporting period. The value of securities denominated in foreign currencies is converted into U.S. dollars.
If the Portfolio invests in foreign securities, it will also provide a summary of investments by country. This summary reports the Portfolio exposure to different countries by providing the percentage of securities invested in each country. The country of each security represents the country of risk. The Portfolio’s Schedule of Investments relies upon the industry group and country classifications published by Barclays and/or MSCI Inc.
Tables listing details of individual forward currency contracts, futures, written options, swaptions, and swaps follow the Portfolio’s Schedule of Investments (if applicable).
Statement of Assets and Liabilities This statement is often referred to as the “balance sheet.” It lists the assets and liabilities of the Portfolio on the last day of the reporting period.
Janus Aspen Balanced Portfolio Useful Information About Your Portfolio Report (unaudited)
Janus Aspen Series 51
The Portfolio’s assets are calculated by adding the value of the securities owned, the receivable for securities sold but not yet settled, the receivable for dividends declared but not yet received on securities owned, and the receivable for Portfolio shares sold to investors but not yet settled. The Portfolio’s liabilities include payables for securities purchased but not yet settled, Portfolio shares redeemed but not yet paid, and expenses owed but not yet paid. Additionally, there may be other assets and liabilities such as unrealized gain or loss on forward currency contracts.
The section entitled “Net Assets Consist of” breaks down the components of the Portfolio’s net assets. Because the Portfolio must distribute substantially all earnings, you will notice that a significant portion of net assets is shareholder capital.
The last section of this statement reports the net asset value (“NAV”) per share on the last day of the reporting period. The NAV is calculated by dividing the Portfolio’s net assets for each share class (assets minus liabilities) by the number of shares outstanding.
Statement of Operations This statement details the Portfolio’s income, expenses, realized gains and losses on securities and currency transactions, and changes in unrealized appreciation or depreciation of Portfolio holdings.
The first section in this statement, entitled “Investment Income,” reports the dividends earned from securities and interest earned from interest-bearing securities in the Portfolio.
The next section reports the expenses incurred by the Portfolio, including the advisory fee paid to the investment adviser, transfer agent fees and expenses, and printing and postage for mailing statements, financial reports and prospectuses. Expense offsets and expense reimbursements, if any, are also shown.
The last section lists the amounts of realized gains or losses from investment and foreign currency transactions, and changes in unrealized appreciation or depreciation of investments and foreign currency-denominated assets and liabilities. The Portfolio will realize a gain (or loss) when it sells its position in a particular security. A change in unrealized gain (or loss) refers to the change in net appreciation or depreciation of the Portfolio during the reporting period. “Net Realized and Unrealized Gain/(Loss) on Investments” is affected both by changes in the market value of Portfolio holdings and by gains (or losses) realized during the reporting period.
Statements of Changes in Net Assets These statements report the increase or decrease in the Portfolio’s net assets during the reporting period. Changes in the Portfolio’s net assets are attributable to investment operations, dividends and distributions to investors, and capital share transactions. This is important to investors because it shows exactly what caused the Portfolio’s net asset size to change during the period.
The first section summarizes the information from the Statement of Operations regarding changes in net assets due to the Portfolio’s investment operations. The Portfolio’s net assets may also change as a result of dividend and capital gains distributions to investors. If investors receive their dividends and/or distributions in cash, money is taken out of the Portfolio to pay the dividend and/or distribution. If investors reinvest their dividends and/or distributions, the Portfolio’s net assets will not be affected. If you compare the Portfolio’s “Net Decrease from Dividends and Distributions” to “Reinvested Dividends and Distributions,” you will notice that dividends and distributions have little effect on the Portfolio’s net assets. This is because the majority of the Portfolio’s investors reinvest their dividends and/or distributions.
The reinvestment of dividends and distributions is included under “Capital Share Transactions.” “Capital Shares” refers to the money investors contribute to the Portfolio through purchases or withdrawals via redemptions. The Portfolio’s net assets will increase and decrease in value as investors purchase and redeem shares from the Portfolio.
Financial Highlights This schedule provides a per-share breakdown of the components that affect the Portfolio’s NAV for current and past reporting periods as well as total return, asset size, ratios, and portfolio turnover rate.
The first line in the table reflects the NAV per share at the beginning of the reporting period. The next line reports the net investment income/(loss) per share. Following is the per share total of net gains/(losses), realized and unrealized. Per share dividends and distributions to investors are then subtracted to arrive at the NAV per share at the end of the

Janus Aspen Balanced Portfolio Useful Information About Your Portfolio Report (unaudited)
52 JUNE 30, 2016
period. The next line reflects the total return for the period. Also included are ratios of expenses and net investment income to average net assets.
The Portfolio’s expenses may be reduced through expense offsets and expense reimbursements. The ratios shown reflect expenses before and after any such offsets and reimbursements.
The ratio of net investment income/(loss) summarizes the income earned less expenses, divided by the average net assets of the Portfolio during the reporting period. Do not confuse this ratio with the Portfolio’s yield. The net investment income ratio is not a true measure of the Portfolio’s yield because it does not take into account the dividends distributed to the Portfolio’s investors.
The next figure is the portfolio turnover rate, which measures the buying and selling activity in the Portfolio. Portfolio turnover is affected by market conditions, changes in the asset size of the Portfolio, fluctuating volume of shareholder purchase and redemption orders, the nature of the Portfolio’s investments, and the investment style and/or outlook of the portfolio manager(s) and/or investment personnel. A 100% rate implies that an amount equal to the value of the entire portfolio was replaced once during the fiscal year; a 50% rate means that an amount equal to the value of half the portfolio is traded in a year; and a 200% rate means that an amount equal to the value of the entire portfolio is traded every six months.
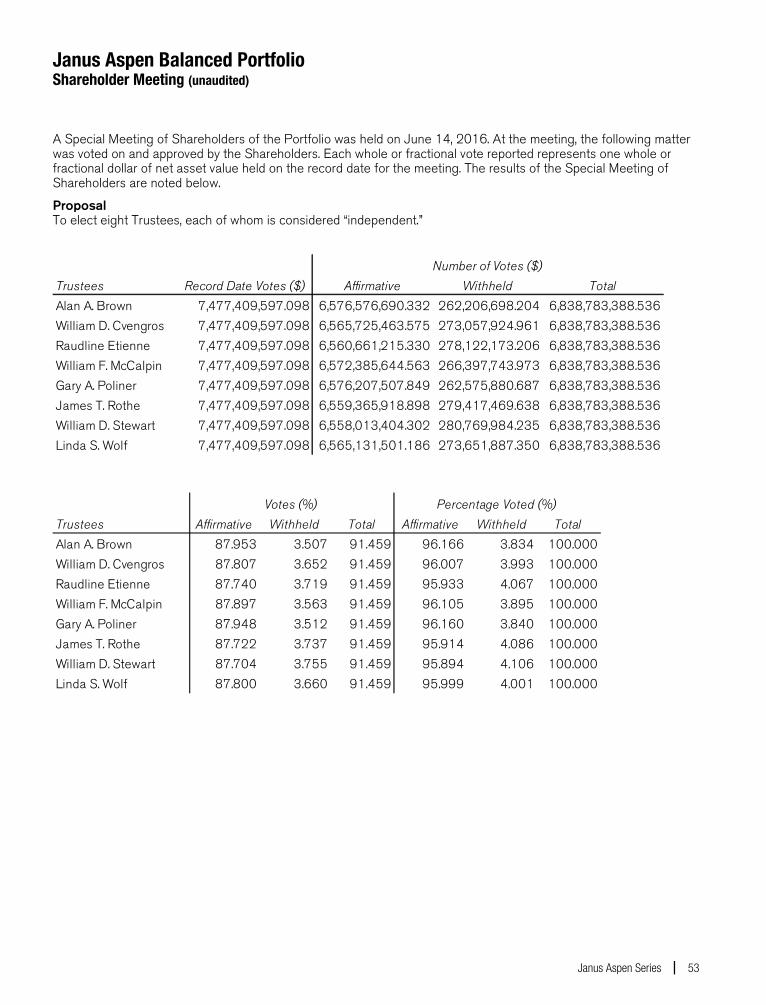
Janus Aspen Balanced Portfolio Shareholder Meeting (unaudited)
Janus Aspen Series 53
A Special Meeting of Shareholders of the Portfolio was held on June 14, 2016. At the meeting, the following matter was voted on and approved by the Shareholders. Each whole or fractional vote reported represents one whole or fractional dollar of net asset value held on the record date for the meeting. The results of the Special Meeting of Shareholders are noted below.
Proposal To elect eight Trustees, each of whom is considered “independent.”
Trustees Record Date Votes ($) Affirmative Withheld TotalAlan A. Brown 7,477,409,597.098 6,576,576,690.332 262,206,698.204 6,838,783,388.536William D. Cvengros 7,477,409,597.098 6,565,725,463.575 273,057,924.961 6,838,783,388.536Raudline Etienne 7,477,409,597.098 6,560,661,215.330 278,122,173.206 6,838,783,388.536William F. McCalpin 7,477,409,597.098 6,572,385,644.563 266,397,743.973 6,838,783,388.536Gary A. Poliner 7,477,409,597.098 6,576,207,507.849 262,575,880.687 6,838,783,388.536James T. Rothe 7,477,409,597.098 6,559,365,918.898 279,417,469.638 6,838,783,388.536William D. Stewart 7,477,409,597.098 6,558,013,404.302 280,769,984.235 6,838,783,388.536Linda S. Wolf 7,477,409,597.098 6,565,131,501.186 273,651,887.350 6,838,783,388.536
Number of Votes ($)
Trustees Affirmative Withheld Total Affirmative Withheld TotalAlan A. Brown 87.953 3.507 91.459 96.166 3.834 100.000William D. Cvengros 87.807 3.652 91.459 96.007 3.993 100.000Raudline Etienne 87.740 3.719 91.459 95.933 4.067 100.000William F. McCalpin 87.897 3.563 91.459 96.105 3.895 100.000Gary A. Poliner 87.948 3.512 91.459 96.160 3.840 100.000James T. Rothe 87.722 3.737 91.459 95.914 4.086 100.000William D. Stewart 87.704 3.755 91.459 95.894 4.106 100.000Linda S. Wolf 87.800 3.660 91.459 95.999 4.001 100.000
Votes (%) Percentage Voted (%)

Janus provides access to a wide range of investment disciplines. Alternative Janus alternative funds seek to deliver strong risk-adjusted returns over a full market cycle with lower correlation to equity markets than traditional investments.
Asset Allocation Janus’ asset allocation funds utilize our fundamental, bottom-up research to balance risk over the long term. From fund options that meet investors’ risk tolerance and objectives to a method that incorporates non-traditional investment choices to seek non-correlated sources of risk and return, Janus’ asset allocation funds aim to allocate risk more effectively.
Fixed Income Janus fixed income funds attempt to provide less risk relative to equities while seeking to deliver a competitive total return through high current income and appreciation. Janus money market funds seek capital preservation and liquidity with current income as a secondary objective.
Global & International Janus global and international funds seek to leverage Janus’ research capabilities by taking advantage of inefficiencies in foreign markets, where accurate information and analytical insight are often at a premium.
Growth & Core Janus growth funds focus on companies believed to be the leaders in their respective industries, with solid management teams, expanding market share, margins and efficiencies. Janus core funds seek investments in more stable and predictable companies. Our core funds look for a strategic combination of steady growth and, for certain funds, some degree of income.
Mathematical Our mathematical funds seek to outperform their respective indices while maintaining a risk profile equal to or lower than the index itself. Managed by INTECH® (a Janus subsidiary), these funds use a mathematical process in an attempt to build a more “efficient” portfolio than the index.
Value Our value funds, managed by Perkins® (a Janus subsidiary), seek to identify companies with favorable reward to risk characteristics by conducting rigorous downside analysis before determining upside potential.
For more information about our funds, contact your investment professional or go to janus.com/variable-insurance.
Please consider the charges, risks, expenses and investment objectives carefully before investing. For a prospectus or, if available, a summary prospectus containing this and other information, please call Janus at 877.33JANUS (52687) or download the file from janus.com/variable-insurance. Read it carefully before you invest or send money. Janus, INTECH and Perkins are registered trademarks of Janus International Holding LLC. © Janus International Holding LLC.
Funds distributed by Janus Distributors LLC
Investment products offered are: NOT FDIC-INSURED MAY LOSE VALUE NO BANK GUARANTEE
C-0816-3714 109-24-81113 08-16
SEMIANNUAL REPORT June 30, 2016
Janus Aspen Janus Portfolio
Janus Aspen Series
HIGHLIGHTS
• Portfolio management perspective • Investment strategy behind your portfolio • Portfolio performance, characteristics
and holdings
Table of Contents
Janus Aspen Janus Portfolio Management Commentary and Schedule of Investments ............................1 Notes to Schedule of Investments and Other Information........................ 12 Statement of Assets and Liabilities ............................................................................. 14 Statement of Operations ...................................................................................................... 15 Statements of Changes in Net Assets...................................................................... 16 Financial Highlights .................................................................................................................. 17 Notes to Financial Statements ........................................................................................ 18 Additional Information............................................................................................................. 28 Useful Information About Your Portfolio Report ............................................... 40 Shareholder Meeting ............................................................................................................... 43
Janus Aspen Janus Portfolio (unaudited)
Janus Aspen Series 1
PORTFOLIO SNAPSHOT We believe buying high-quality growth franchises with sustainable, projected above-average earnings growth for the next five-plus years and market leadership positions driven by a clearly articulated strategy should allow us to outperform our benchmark and peers over the long term. We perform in-depth, fundamental research to build a diversified, moderately positioned portfolio aiming to deliver peer- and index-beating returns while managing for risk and volatility.
Jean Barnard
co-portfolio manager Barney Wilson
co-portfolio manager
PERFORMANCE OVERVIEW For the six-month period ended June 30, 2016, Janus Aspen Janus Portfolio’s Institutional Shares and Service Shares returned -1.75% and -1.86%, respectively. Meanwhile, the Portfolio’s primary benchmark, the Russell 1000 Growth Index, returned 1.36% and its secondary benchmark, the S&P 500 Index, returned 3.84%. Another benchmark we use to measure performance, the Core Growth Index, returned 2.59%. The Core Growth Index is an internally-calculated benchmark combining returns from the Russell 1000 Growth Index (50%) and S&P 500 Index (50%).
INVESTMENT ENVIRONMENT After recovering from a winter correction, U.S. stocks traded narrowly for much of the period. Steady retail sales along with a key manufacturing survey’s return to expansion territory helped push markets higher. Stocks were jolted late in the period by the UK electorate’s surprise decision to leave the European Union. The market sold off sharply as capital flowed into safe-haven securities. In the final days of the period, however, U.S. shares recaptured much of their post-Brexit slide.
On a sector basis, energy performed well on the back of higher crude oil prices. Defensive sectors also generated positive returns, while cyclical sectors lagged. After having declined sharply on late-period Brexit news, financials recovered lost ground in June’s final trading sessions.
PERFORMANCE DISCUSSION Our investment process seeks to identify companies with clearly definable, sustainable long-term growth drivers. These companies often have high barriers to entry and notable competitive advantages in attractive, growing industries. They also have strong management teams with clear visions for the futures of their companies. We believe a collection of companies with these competitive
advantages should lead to compounded growth in excess of the market over longer time horizons.
The Portfolio underperformed both its primary benchmark, the Russell 1000 Growth Index, and also its secondary benchmarks, the S&P 500 Index and the Core Growth Index. Three stocks that contributed negative performance for the Portfolio during the period were Allergan, Norwegian Cruise Line Holdings and Endo International. Early in the second quarter, Allergan’s merger with Pfizer was called off after the U.S. Treasury Department issued last-minute constraints on so-called tax inversions, which diminished the viability of the transaction. Despite this setback, we continue to favor Allergan as a standalone enterprise with solid growth prospects, a high-quality pipeline, and a management team that has acted in the interests of shareholders. Furthermore, Allergan stands to benefit from the pending sale of its generic business to Teva Pharmaceutical, which should provide about $36 billion in capital for possible acquisitions and share buybacks.
Our investment in Norwegian Cruise Line Holdings suffered from fears that geopolitical events might cause a decline in demand for leisure travel in the eastern Mediterranean region. Uncertainty surrounding the spread of the Zika virus and its impact on global travel also weighed on the company’s stock. Our outlook for Norwegian Cruise Line remains positive based on the company’s ability to expand its market share in the leisure travel industry, and management’s focus on generating higher returns on invested capital.
Specialty pharmaceutical firm Endo International reported first quarter earnings that were in line with estimates, though management lowered its guidance significantly. The subdued outlook was largely due to a weak environment for generics; the loss of exclusivity for Voltaren, an anti-inflammatory nonsteroidal gel; and muted
Janus Aspen Janus Portfolio (unaudited)
2 JUNE 30, 2016
initial sales growth for Belbuca, a chronic pain medication. Endo was also impacted by negative sentiment surrounding the industry as a whole. Questionable accounting and drug pricing tactics at one of the largest and most well-known specialty pharmaceutical companies, which we do not own, cast a shadow over all companies in the industry, and this impacted Endo’s shares. We eliminated our position in Endo during the period.
Three stocks that contributed positive performance for the Portfolio during the period were Boston Scientific, Comcast and Facebook. Boston Scientific is, in our view, a well-managed, innovative medical technology company. During the period, the company delivered its strongest quarter of organic revenue growth in more than a decade, driven by sales in its cardiovascular and medical surgery product divisions. Additionally, Boston Scientific received FDA approval of its Watchman heart valve device, which offers an innovative alternative to long-term blood thinner therapy. We remain positive on the stock as we expect continued attractive organic revenue growth and improving margins over the next several years.
The Portfolio’s shares in broadcasting and cable TV giant Comcast benefited from what we view as best-in-class operational execution for the industry. Investments in better products and improved customer service are resulting in market share gains for the company. During the first quarter, a strong advertising environment and better than expected subscriber growth helped lift Comcast’s stock. We continue to like the company and believe its strong broadband capabilities and leading product innovation leave it more insulated from the risk of substitute video services than most other pay television providers. The company has a strong balance sheet with a growing free-cash-flow profile.
Our stock in Facebook appreciated due largely to solid earnings growth, driven by an increasing shift toward digital advertising and the company’s ability to take market share due to its high share of usage on mobile devices and new advertising format launches. Facebook also experienced success in video advertising on its Facebook platform, and user growth in Instagram. We remain believers in the company’s ability to maintain a high rate of growth in the months ahead.
Please see the Derivative Instruments section in the “Notes to Financial Statements” for a discussion of derivatives used by the Portfolio.
OUTLOOK While the equity markets were choppy during the first half of 2016, we continue to see significant potential in the market for large cap growth stocks – a category that includes high quality companies in growth areas such as cloud computing, software as a service, pharmaceuticals and financial technology and analytics. Going forward, we plan to stick to our process of identifying companies that are winning in the product marketplace, and that are well positioned to deliver better than average growth with stable or increasing returns on capital.
Thank you for your investment in Janus Aspen Janus Portfolio.
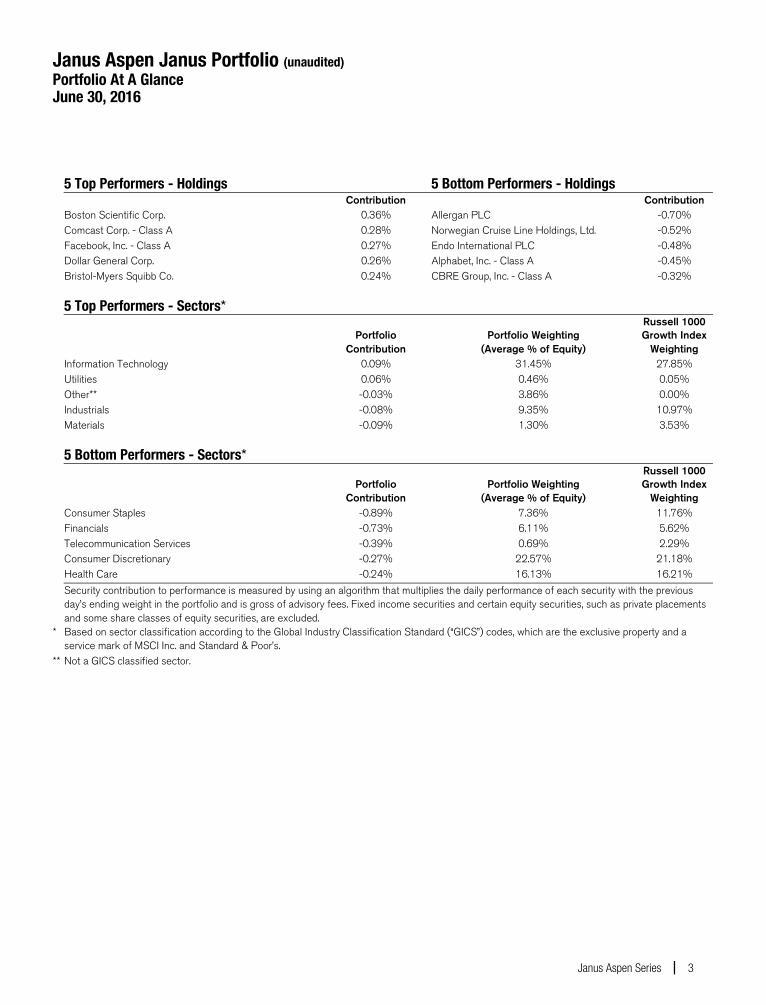
Janus Aspen Janus Portfolio (unaudited) Portfolio At A Glance June 30, 2016
Janus Aspen Series 3
5 Top Performers - Holdings 5 Bottom Performers - Holdings Contribution Contribution Boston Scientific Corp. 0.36% Allergan PLC -0.70% Comcast Corp. - Class A 0.28% Norwegian Cruise Line Holdings, Ltd. -0.52% Facebook, Inc. - Class A 0.27% Endo International PLC -0.48% Dollar General Corp. 0.26% Alphabet, Inc. - Class A -0.45% Bristol-Myers Squibb Co. 0.24% CBRE Group, Inc. - Class A -0.32%
5 Top Performers - Sectors*
Portfolio Portfolio Weighting Russell 1000 Growth Index
Contribution (Average % of Equity) Weighting Information Technology 0.09% 31.45% 27.85% Utilities 0.06% 0.46% 0.05% Other** -0.03% 3.86% 0.00% Industrials -0.08% 9.35% 10.97% Materials -0.09% 1.30% 3.53% 5 Bottom Performers - Sectors*
Portfolio Portfolio Weighting Russell 1000 Growth Index
Contribution (Average % of Equity) Weighting Consumer Staples -0.89% 7.36% 11.76% Financials -0.73% 6.11% 5.62% Telecommunication Services -0.39% 0.69% 2.29% Consumer Discretionary -0.27% 22.57% 21.18% Health Care -0.24% 16.13% 16.21%
Security contribution to performance is measured by using an algorithm that multiplies the daily performance of each security with the previous day’s ending weight in the portfolio and is gross of advisory fees. Fixed income securities and certain equity securities, such as private placements and some share classes of equity securities, are excluded.
* Based on sector classification according to the Global Industry Classification Standard (“GICS”) codes, which are the exclusive property and a service mark of MSCI Inc. and Standard & Poor’s.
** Not a GICS classified sector.
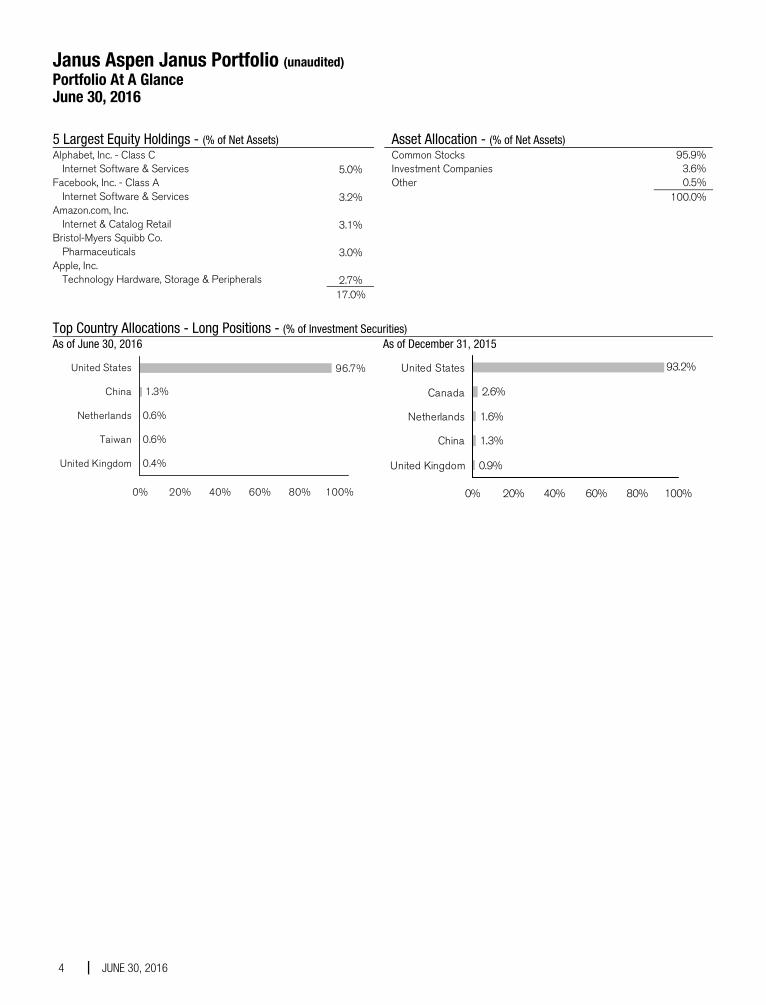
Janus Aspen Janus Portfolio (unaudited) Portfolio At A Glance June 30, 2016
4 JUNE 30, 2016
5 Largest Equity Holdings - (% of Net Assets) Alphabet, Inc. - Class C
Internet Software & Services 5.0% Facebook, Inc. - Class A
Internet Software & Services 3.2% Amazon.com, Inc.
Internet & Catalog Retail 3.1% Bristol-Myers Squibb Co.
Pharmaceuticals 3.0% Apple, Inc.
Technology Hardware, Storage & Peripherals 2.7% 17.0%
Asset Allocation - (% of Net Assets) Common Stocks 95.9% Investment Companies 3.6% Other 0.5% 100.0%
Top Country Allocations - Long Positions - (% of Investment Securities) As of June 30, 2016
1.3%
0.6%
0.6%
0.4%
96.7%
0% 20% 40% 60% 80% 100%
United States
China
Netherlands
Taiwan
United Kingdom
As of December 31, 2015
2.6%
1.6%
1.3%
0.9%
93.2%
0% 20% 40% 60% 80% 100%
United States
Canada
Netherlands
China
United Kingdom
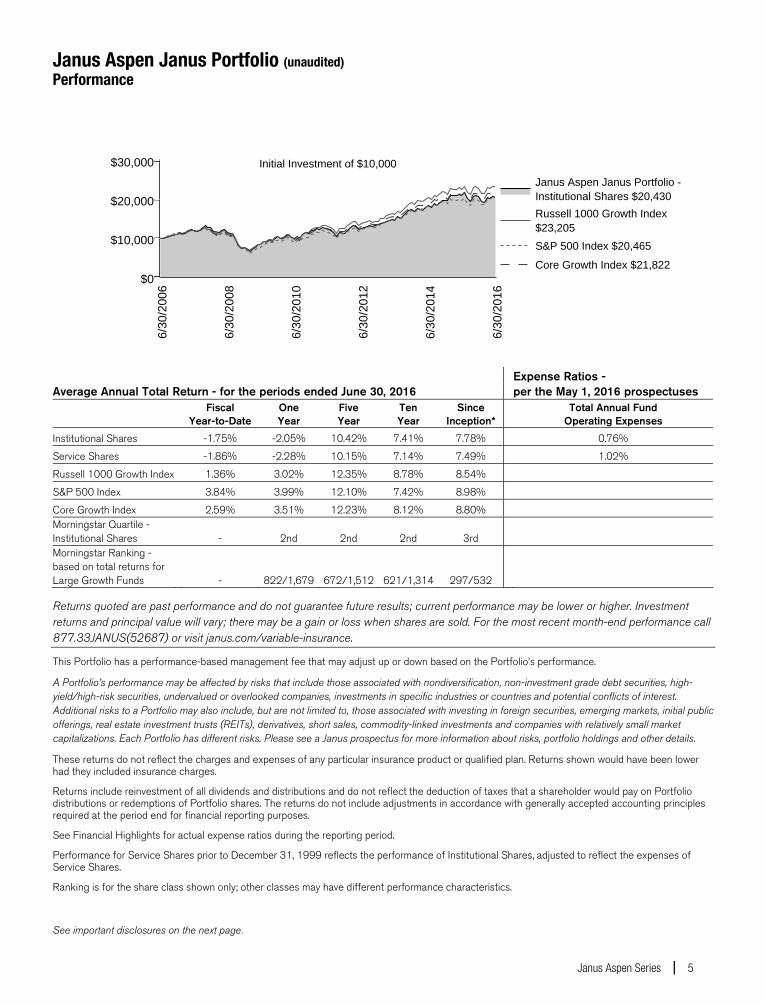
Janus Aspen Janus Portfolio (unaudited) Performance
Janus Aspen Series 5
Expense Ratios - Average Annual Total Return - for the periods ended June 30, 2016 per the May 1, 2016 prospectuses
Fiscal
Year-to-Date One Year
Five Year
Ten Year
Since Inception*
Total Annual Fund Operating Expenses
Institutional Shares -1.75% -2.05% 10.42% 7.41% 7.78% 0.76%
Service Shares -1.86% -2.28% 10.15% 7.14% 7.49% 1.02%
Russell 1000 Growth Index 1.36% 3.02% 12.35% 8.78% 8.54%
S&P 500 Index 3.84% 3.99% 12.10% 7.42% 8.98%
Core Growth Index 2.59% 3.51% 12.23% 8.12% 8.80% Morningstar Quartile - Institutional Shares - 2nd 2nd 2nd 3rd Morningstar Ranking - based on total returns for Large Growth Funds - 822/1,679 672/1,512 621/1,314 297/532
Returns quoted are past performance and do not guarantee future results; current performance may be lower or higher. Investment returns and principal value will vary; there may be a gain or loss when shares are sold. For the most recent month-end performance call 877.33JANUS(52687) or visit janus.com/variable-insurance.
This Portfolio has a performance-based management fee that may adjust up or down based on the Portfolio’s performance.
A Portfolio’s performance may be affected by risks that include those associated with nondiversification, non-investment grade debt securities, high-yield/high-risk securities, undervalued or overlooked companies, investments in specific industries or countries and potential conflicts of interest. Additional risks to a Portfolio may also include, but are not limited to, those associated with investing in foreign securities, emerging markets, initial public offerings, real estate investment trusts (REITs), derivatives, short sales, commodity-linked investments and companies with relatively small market capitalizations. Each Portfolio has different risks. Please see a Janus prospectus for more information about risks, portfolio holdings and other details.
These returns do not reflect the charges and expenses of any particular insurance product or qualified plan. Returns shown would have been lower had they included insurance charges.
Returns include reinvestment of all dividends and distributions and do not reflect the deduction of taxes that a shareholder would pay on Portfolio distributions or redemptions of Portfolio shares. The returns do not include adjustments in accordance with generally accepted accounting principles required at the period end for financial reporting purposes.
See Financial Highlights for actual expense ratios during the reporting period.
Performance for Service Shares prior to December 31, 1999 reflects the performance of Institutional Shares, adjusted to reflect the expenses of Service Shares.
Ranking is for the share class shown only; other classes may have different performance characteristics.
See important disclosures on the next page.

Janus Aspen Janus Portfolio (unaudited) Performance
6 JUNE 30, 2016
© 2016 Morningstar, Inc. All Rights Reserved.
There is no assurance that the investment process will consistently lead to successful investing.
See Notes to Schedule of Investments and Other Information for index definitions.
A Portfolio's holdings may differ significantly from the securities held in an index. An index is unmanaged and not available for direct investment; therefore, its performance does not reflect the expenses associated with the active management of an actual portfolio.
See “Useful Information About Your Portfolio Report.”
Effective January 12, 2016, Barney Wilson and Jean Barnard are Co-Portfolio Managers of the Portfolio.
*The Portfolio’s inception date – September 13, 1993
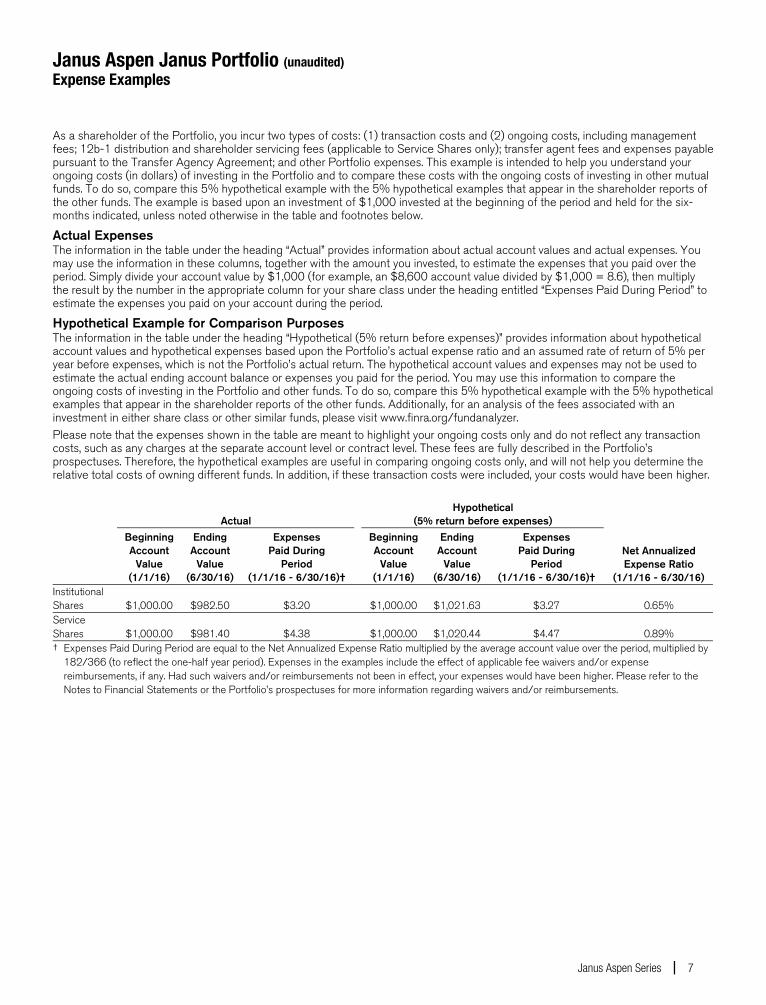
Janus Aspen Janus Portfolio (unaudited) Expense Examples
Janus Aspen Series 7
As a shareholder of the Portfolio, you incur two types of costs: (1) transaction costs and (2) ongoing costs, including management fees; 12b-1 distribution and shareholder servicing fees (applicable to Service Shares only); transfer agent fees and expenses payable pursuant to the Transfer Agency Agreement; and other Portfolio expenses. This example is intended to help you understand your ongoing costs (in dollars) of investing in the Portfolio and to compare these costs with the ongoing costs of investing in other mutual funds. To do so, compare this 5% hypothetical example with the 5% hypothetical examples that appear in the shareholder reports of the other funds. The example is based upon an investment of $1,000 invested at the beginning of the period and held for the six-months indicated, unless noted otherwise in the table and footnotes below.
Actual Expenses The information in the table under the heading “Actual” provides information about actual account values and actual expenses. You may use the information in these columns, together with the amount you invested, to estimate the expenses that you paid over the period. Simply divide your account value by $1,000 (for example, an $8,600 account value divided by $1,000 = 8.6), then multiply the result by the number in the appropriate column for your share class under the heading entitled “Expenses Paid During Period” to estimate the expenses you paid on your account during the period.
Hypothetical Example for Comparison Purposes The information in the table under the heading “Hypothetical (5% return before expenses)” provides information about hypothetical account values and hypothetical expenses based upon the Portfolio’s actual expense ratio and an assumed rate of return of 5% per year before expenses, which is not the Portfolio’s actual return. The hypothetical account values and expenses may not be used to estimate the actual ending account balance or expenses you paid for the period. You may use this information to compare the ongoing costs of investing in the Portfolio and other funds. To do so, compare this 5% hypothetical example with the 5% hypothetical examples that appear in the shareholder reports of the other funds. Additionally, for an analysis of the fees associated with an investment in either share class or other similar funds, please visit www.finra.org/fundanalyzer. Please note that the expenses shown in the table are meant to highlight your ongoing costs only and do not reflect any transaction costs, such as any charges at the separate account level or contract level. These fees are fully described in the Portfolio’s prospectuses. Therefore, the hypothetical examples are useful in comparing ongoing costs only, and will not help you determine the relative total costs of owning different funds. In addition, if these transaction costs were included, your costs would have been higher.
Actual Hypothetical
(5% return before expenses)
Beginning Account
Value (1/1/16)
Ending Account
Value (6/30/16)
Expenses Paid During
Period (1/1/16 - 6/30/16)†
BeginningAccount
Value (1/1/16)
Ending Account
Value (6/30/16)
Expenses Paid During
Period (1/1/16 - 6/30/16)†
Net Annualized Expense Ratio
(1/1/16 - 6/30/16) Institutional Shares $1,000.00 $982.50 $3.20 $1,000.00 $1,021.63 $3.27 0.65% Service Shares $1,000.00 $981.40 $4.38 $1,000.00 $1,020.44 $4.47 0.89% † Expenses Paid During Period are equal to the Net Annualized Expense Ratio multiplied by the average account value over the period, multiplied by
182/366 (to reflect the one-half year period). Expenses in the examples include the effect of applicable fee waivers and/or expense reimbursements, if any. Had such waivers and/or reimbursements not been in effect, your expenses would have been higher. Please refer to the Notes to Financial Statements or the Portfolio’s prospectuses for more information regarding waivers and/or reimbursements.
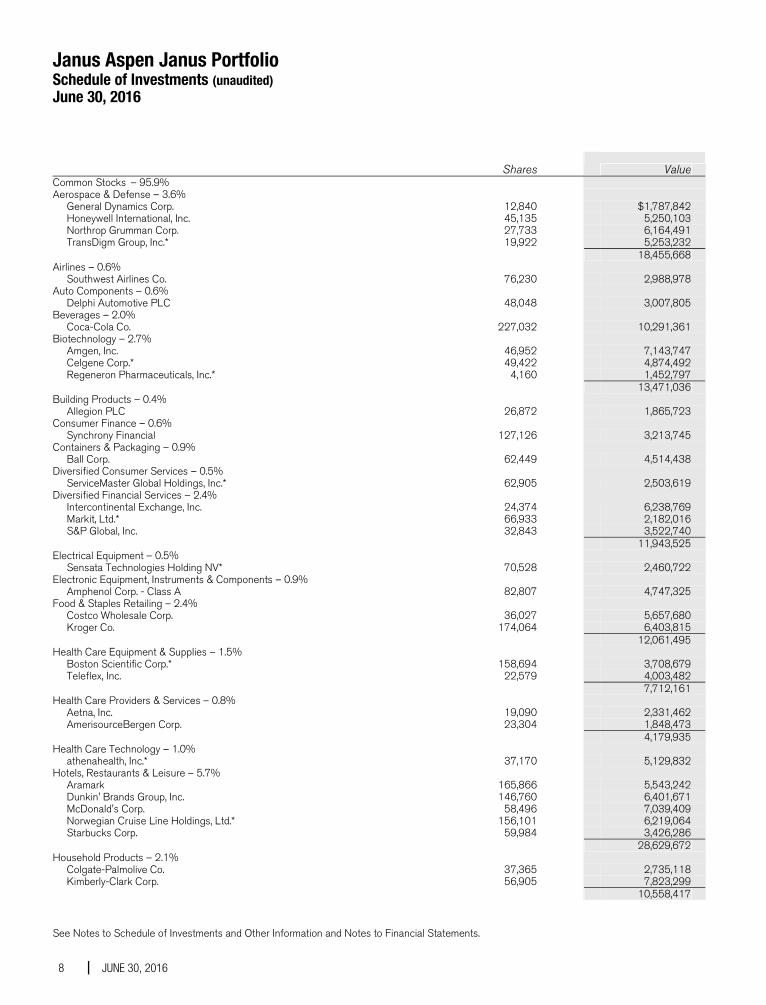
Janus Aspen Janus Portfolio Schedule of Investments (unaudited) June 30, 2016
See Notes to Schedule of Investments and Other Information and Notes to Financial Statements.
8 JUNE 30, 2016
Shares
Value Common Stocks – 95.9% Aerospace & Defense – 3.6% General Dynamics Corp. 12,840 $1,787,842 Honeywell International, Inc. 45,135 5,250,103 Northrop Grumman Corp. 27,733 6,164,491 TransDigm Group, Inc.* 19,922 5,253,232 18,455,668Airlines – 0.6% Southwest Airlines Co. 76,230 2,988,978Auto Components – 0.6% Delphi Automotive PLC 48,048 3,007,805Beverages – 2.0% Coca-Cola Co. 227,032 10,291,361Biotechnology – 2.7% Amgen, Inc. 46,952 7,143,747 Celgene Corp.* 49,422 4,874,492 Regeneron Pharmaceuticals, Inc.* 4,160 1,452,797 13,471,036Building Products – 0.4% Allegion PLC 26,872 1,865,723Consumer Finance – 0.6% Synchrony Financial 127,126 3,213,745Containers & Packaging – 0.9% Ball Corp. 62,449 4,514,438Diversified Consumer Services – 0.5% ServiceMaster Global Holdings, Inc.* 62,905 2,503,619Diversified Financial Services – 2.4% Intercontinental Exchange, Inc. 24,374 6,238,769 Markit, Ltd.* 66,933 2,182,016 S&P Global, Inc. 32,843 3,522,740 11,943,525Electrical Equipment – 0.5% Sensata Technologies Holding NV* 70,528 2,460,722Electronic Equipment, Instruments & Components – 0.9% Amphenol Corp. - Class A 82,807 4,747,325Food & Staples Retailing – 2.4% Costco Wholesale Corp. 36,027 5,657,680 Kroger Co. 174,064 6,403,815 12,061,495Health Care Equipment & Supplies – 1.5% Boston Scientific Corp.* 158,694 3,708,679 Teleflex, Inc. 22,579 4,003,482 7,712,161Health Care Providers & Services – 0.8% Aetna, Inc. 19,090 2,331,462 AmerisourceBergen Corp. 23,304 1,848,473 4,179,935Health Care Technology – 1.0% athenahealth, Inc.* 37,170 5,129,832Hotels, Restaurants & Leisure – 5.7% Aramark 165,866 5,543,242 Dunkin' Brands Group, Inc. 146,760 6,401,671 McDonald's Corp. 58,496 7,039,409 Norwegian Cruise Line Holdings, Ltd.* 156,101 6,219,064 Starbucks Corp. 59,984 3,426,286 28,629,672Household Products – 2.1% Colgate-Palmolive Co. 37,365 2,735,118 Kimberly-Clark Corp. 56,905 7,823,299 10,558,417
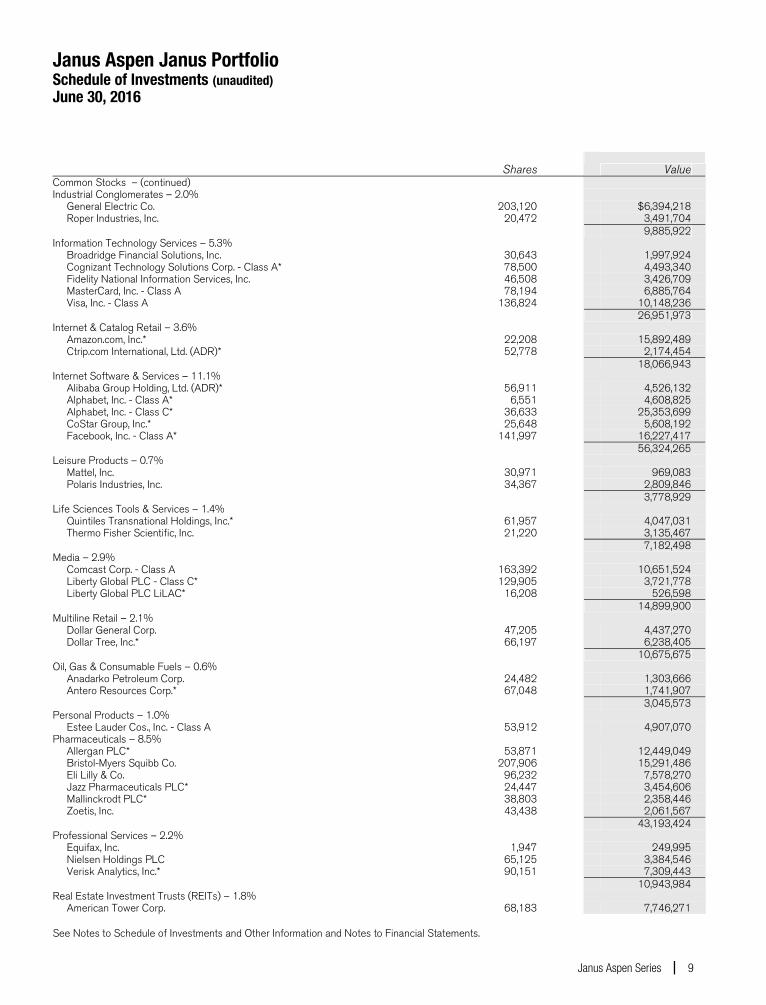
Janus Aspen Janus Portfolio Schedule of Investments (unaudited) June 30, 2016
See Notes to Schedule of Investments and Other Information and Notes to Financial Statements.
Janus Aspen Series 9
Shares
Value Common Stocks – (continued) Industrial Conglomerates – 2.0% General Electric Co. 203,120 $6,394,218 Roper Industries, Inc. 20,472 3,491,704 9,885,922Information Technology Services – 5.3% Broadridge Financial Solutions, Inc. 30,643 1,997,924 Cognizant Technology Solutions Corp. - Class A* 78,500 4,493,340 Fidelity National Information Services, Inc. 46,508 3,426,709 MasterCard, Inc. - Class A 78,194 6,885,764 Visa, Inc. - Class A 136,824 10,148,236 26,951,973Internet & Catalog Retail – 3.6% Amazon.com, Inc.* 22,208 15,892,489 Ctrip.com International, Ltd. (ADR)* 52,778 2,174,454 18,066,943Internet Software & Services – 11.1% Alibaba Group Holding, Ltd. (ADR)* 56,911 4,526,132 Alphabet, Inc. - Class A* 6,551 4,608,825 Alphabet, Inc. - Class C* 36,633 25,353,699 CoStar Group, Inc.* 25,648 5,608,192 Facebook, Inc. - Class A* 141,997 16,227,417 56,324,265Leisure Products – 0.7% Mattel, Inc. 30,971 969,083 Polaris Industries, Inc. 34,367 2,809,846 3,778,929Life Sciences Tools & Services – 1.4% Quintiles Transnational Holdings, Inc.* 61,957 4,047,031 Thermo Fisher Scientific, Inc. 21,220 3,135,467 7,182,498Media – 2.9% Comcast Corp. - Class A 163,392 10,651,524 Liberty Global PLC - Class C* 129,905 3,721,778 Liberty Global PLC LiLAC* 16,208 526,598 14,899,900Multiline Retail – 2.1% Dollar General Corp. 47,205 4,437,270 Dollar Tree, Inc.* 66,197 6,238,405 10,675,675Oil, Gas & Consumable Fuels – 0.6% Anadarko Petroleum Corp. 24,482 1,303,666 Antero Resources Corp.* 67,048 1,741,907 3,045,573Personal Products – 1.0% Estee Lauder Cos., Inc. - Class A 53,912 4,907,070Pharmaceuticals – 8.5% Allergan PLC* 53,871 12,449,049 Bristol-Myers Squibb Co. 207,906 15,291,486 Eli Lilly & Co. 96,232 7,578,270 Jazz Pharmaceuticals PLC* 24,447 3,454,606 Mallinckrodt PLC* 38,803 2,358,446 Zoetis, Inc. 43,438 2,061,567 43,193,424Professional Services – 2.2% Equifax, Inc. 1,947 249,995 Nielsen Holdings PLC 65,125 3,384,546 Verisk Analytics, Inc.* 90,151 7,309,443 10,943,984Real Estate Investment Trusts (REITs) – 1.8% American Tower Corp. 68,183 7,746,271
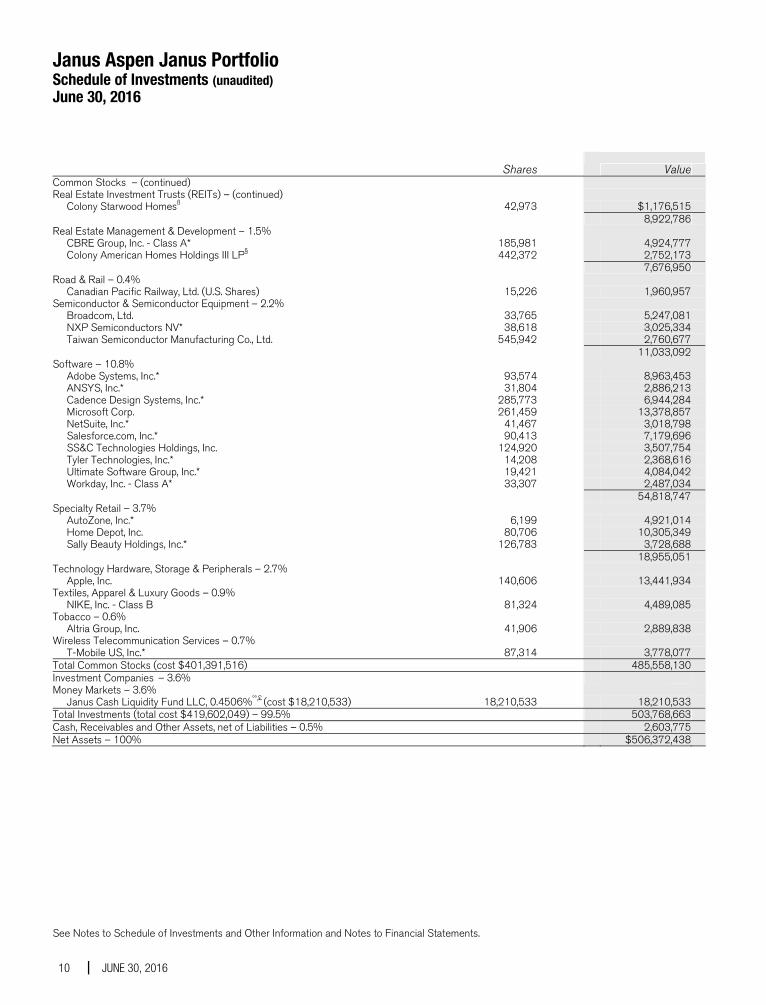
Janus Aspen Janus Portfolio Schedule of Investments (unaudited) June 30, 2016
See Notes to Schedule of Investments and Other Information and Notes to Financial Statements.
10 JUNE 30, 2016
Shares
Value Common Stocks – (continued) Real Estate Investment Trusts (REITs) – (continued) Colony Starwood Homesß 42,973 $1,176,515 8,922,786Real Estate Management & Development – 1.5% CBRE Group, Inc. - Class A* 185,981 4,924,777 Colony American Homes Holdings III LP§ 442,372 2,752,173 7,676,950Road & Rail – 0.4% Canadian Pacific Railway, Ltd. (U.S. Shares) 15,226 1,960,957Semiconductor & Semiconductor Equipment – 2.2% Broadcom, Ltd. 33,765 5,247,081 NXP Semiconductors NV* 38,618 3,025,334 Taiwan Semiconductor Manufacturing Co., Ltd. 545,942 2,760,677 11,033,092Software – 10.8% Adobe Systems, Inc.* 93,574 8,963,453 ANSYS, Inc.* 31,804 2,886,213 Cadence Design Systems, Inc.* 285,773 6,944,284 Microsoft Corp. 261,459 13,378,857 NetSuite, Inc.* 41,467 3,018,798 Salesforce.com, Inc.* 90,413 7,179,696 SS&C Technologies Holdings, Inc. 124,920 3,507,754 Tyler Technologies, Inc.* 14,208 2,368,616 Ultimate Software Group, Inc.* 19,421 4,084,042 Workday, Inc. - Class A* 33,307 2,487,034 54,818,747Specialty Retail – 3.7% AutoZone, Inc.* 6,199 4,921,014 Home Depot, Inc. 80,706 10,305,349 Sally Beauty Holdings, Inc.* 126,783 3,728,688 18,955,051Technology Hardware, Storage & Peripherals – 2.7% Apple, Inc. 140,606 13,441,934Textiles, Apparel & Luxury Goods – 0.9% NIKE, Inc. - Class B 81,324 4,489,085Tobacco – 0.6% Altria Group, Inc. 41,906 2,889,838Wireless Telecommunication Services – 0.7% T-Mobile US, Inc.* 87,314 3,778,077Total Common Stocks (cost $401,391,516) 485,558,130Investment Companies – 3.6% Money Markets – 3.6% Janus Cash Liquidity Fund LLC, 0.4506%ºº,£ (cost $18,210,533) 18,210,533 18,210,533Total Investments (total cost $419,602,049) – 99.5% 503,768,663Cash, Receivables and Other Assets, net of Liabilities – 0.5% 2,603,775Net Assets – 100% $506,372,438
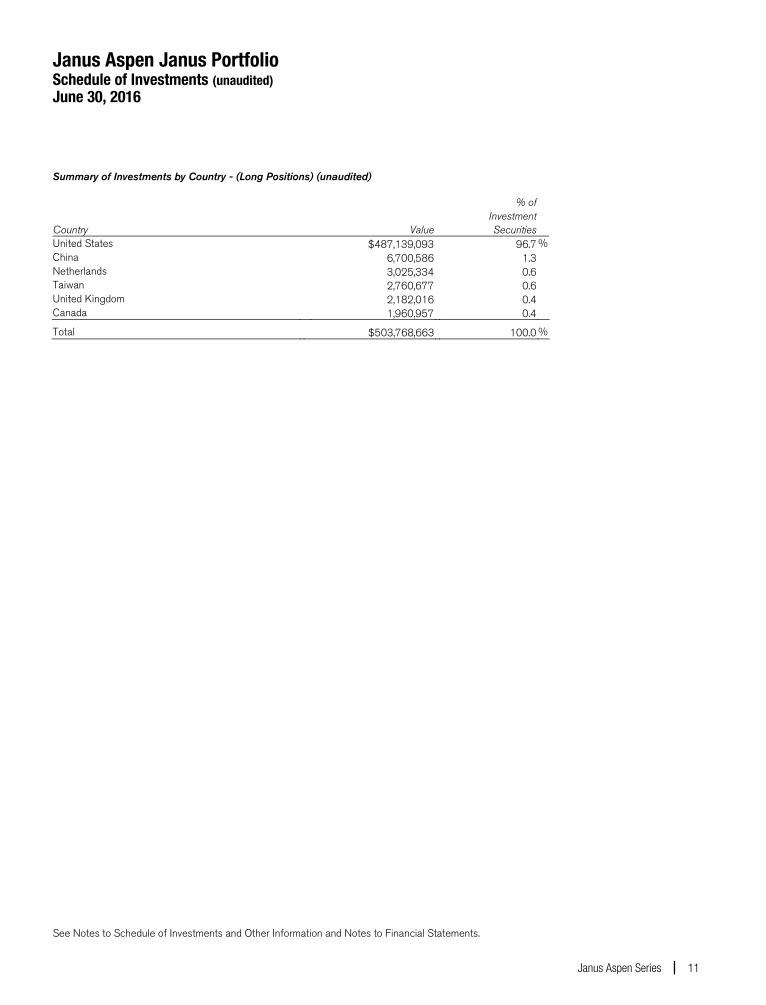
Janus Aspen Janus Portfolio Schedule of Investments (unaudited) June 30, 2016
See Notes to Schedule of Investments and Other Information and Notes to Financial Statements.
Janus Aspen Series 11
Summary of Investments by Country - (Long Positions) (unaudited) % of Investment Country Value Securities United States $487,139,093 96.7 % China 6,700,586 1.3 Netherlands 3,025,334 0.6 Taiwan 2,760,677 0.6 United Kingdom 2,182,016 0.4 Canada 1,960,957 0.4
Total $503,768,663 100.0 %
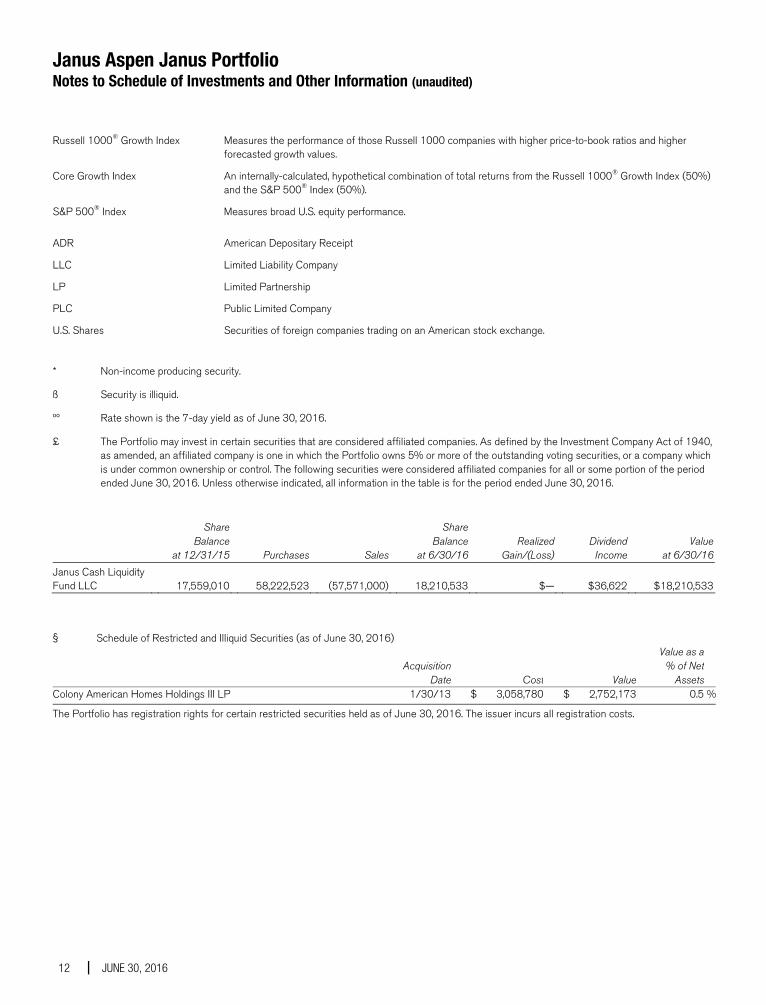
Janus Aspen Janus Portfolio Notes to Schedule of Investments and Other Information (unaudited)
12 JUNE 30, 2016
Russell 1000® Growth Index Measures the performance of those Russell 1000 companies with higher price-to-book ratios and higher forecasted growth values.
Core Growth Index An internally-calculated, hypothetical combination of total returns from the Russell 1000® Growth Index (50%) and the S&P 500® Index (50%).
S&P 500® Index Measures broad U.S. equity performance.
ADR American Depositary Receipt
LLC Limited Liability Company
LP Limited Partnership
PLC Public Limited Company
U.S. Shares Securities of foreign companies trading on an American stock exchange.
* Non-income producing security.
ß Security is illiquid.
ºº Rate shown is the 7-day yield as of June 30, 2016.
£ The Portfolio may invest in certain securities that are considered affiliated companies. As defined by the Investment Company Act of 1940, as amended, an affiliated company is one in which the Portfolio owns 5% or more of the outstanding voting securities, or a company which is under common ownership or control. The following securities were considered affiliated companies for all or some portion of the period ended June 30, 2016. Unless otherwise indicated, all information in the table is for the period ended June 30, 2016.
Share Share Balance Balance Realized Dividend Value at 12/31/15 Purchases Sales at 6/30/16 Gain/(Loss) Income at 6/30/16Janus Cash Liquidity Fund LLC
17,559,010 58,222,523 (57,571,000) 18,210,533 $— $36,622 $18,210,533
§ Schedule of Restricted and Illiquid Securities (as of June 30, 2016) Value as a Acquisition % of Net
Date Cost Value AssetsColony American Homes Holdings III LP 1/30/13 $ 3,058,780 $ 2,752,173 0.5 %
The Portfolio has registration rights for certain restricted securities held as of June 30, 2016. The issuer incurs all registration costs.
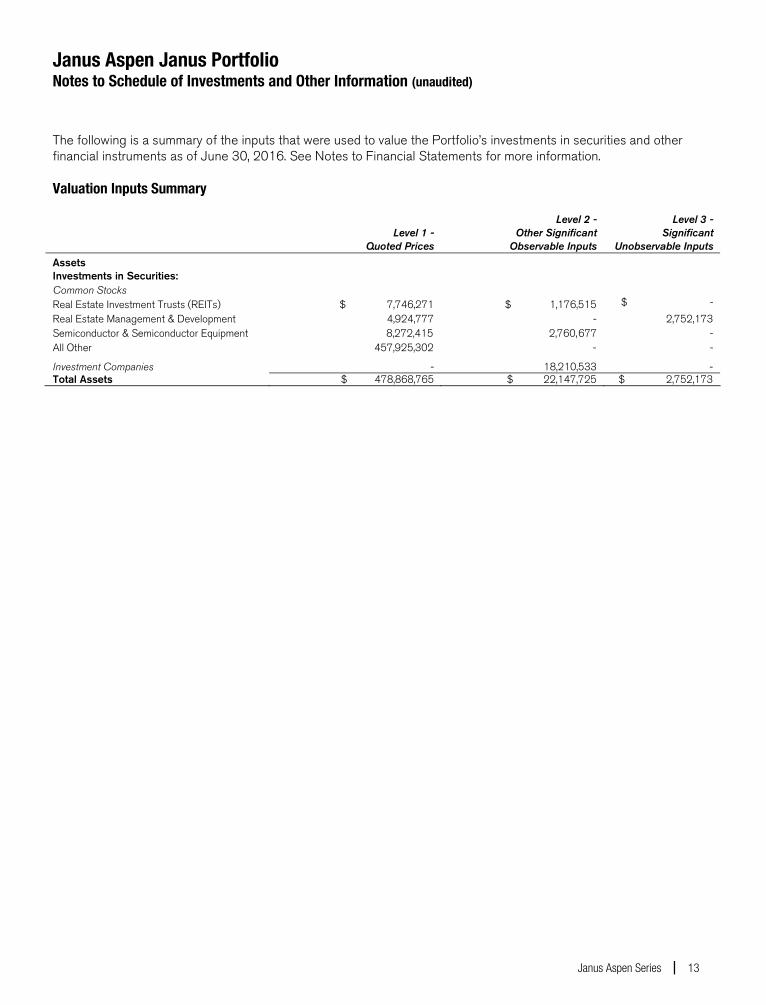
Janus Aspen Janus Portfolio Notes to Schedule of Investments and Other Information (unaudited)
Janus Aspen Series 13
The following is a summary of the inputs that were used to value the Portfolio’s investments in securities and other financial instruments as of June 30, 2016. See Notes to Financial Statements for more information.
Valuation Inputs Summary
Level 1 -
Quoted Prices
Level 2 - Other Significant
Observable Inputs
Level 3 - Significant
Unobservable Inputs Assets Investments in Securities: Common Stocks Real Estate Investment Trusts (REITs) $ 7,746,271 $ 1,176,515 $ -Real Estate Management & Development 4,924,777 - 2,752,173 Semiconductor & Semiconductor Equipment 8,272,415 2,760,677 - All Other 457,925,302 - -
Investment Companies - 18,210,533 - Total Assets $ 478,868,765 $ 22,147,725 $ 2,752,173
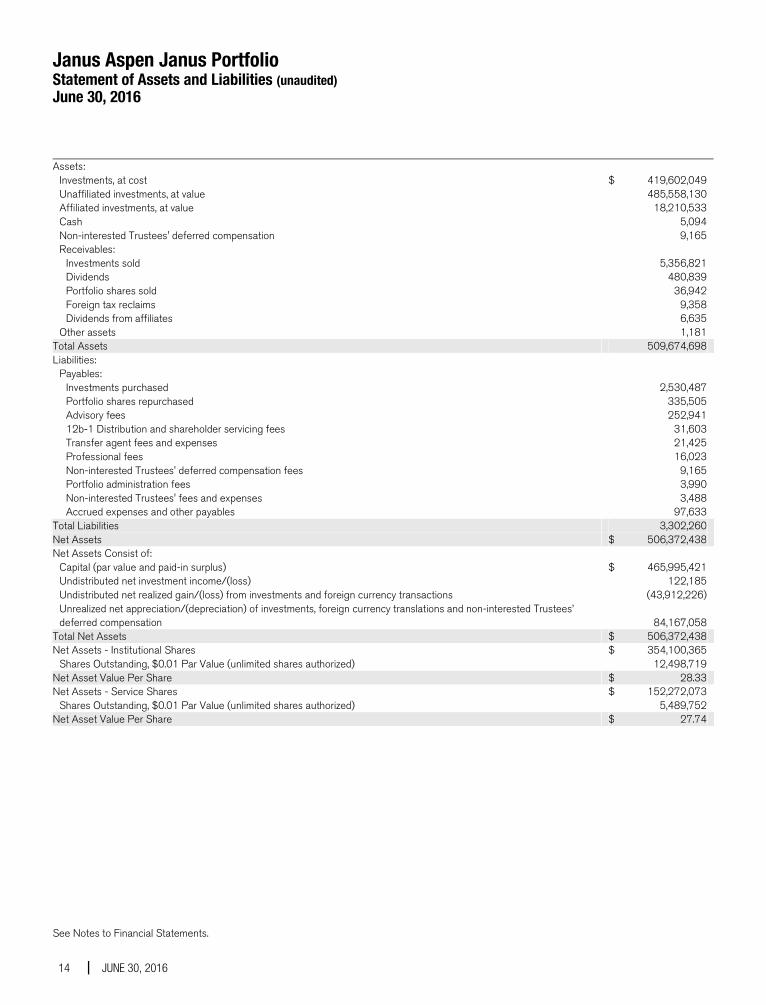
Janus Aspen Janus Portfolio Statement of Assets and Liabilities (unaudited) June 30, 2016
See Notes to Financial Statements.
14 JUNE 30, 2016
Assets: Investments, at cost $ 419,602,049 Unaffiliated investments, at value 485,558,130 Affiliated investments, at value 18,210,533 Cash 5,094 Non-interested Trustees' deferred compensation 9,165 Receivables: Investments sold 5,356,821 Dividends 480,839 Portfolio shares sold 36,942 Foreign tax reclaims 9,358 Dividends from affiliates 6,635 Other assets 1,181Total Assets 509,674,698 Liabilities: Payables: — Investments purchased 2,530,487 Portfolio shares repurchased 335,505 Advisory fees 252,941 12b-1 Distribution and shareholder servicing fees 31,603 Transfer agent fees and expenses 21,425 Professional fees 16,023 Non-interested Trustees' deferred compensation fees 9,165 Portfolio administration fees 3,990 Non-interested Trustees' fees and expenses 3,488 Accrued expenses and other payables 97,633Total Liabilities 3,302,260 Net Assets $ 506,372,438 Net Assets Consist of: Capital (par value and paid-in surplus) $ 465,995,421 Undistributed net investment income/(loss) 122,185 Undistributed net realized gain/(loss) from investments and foreign currency transactions (43,912,226)
Unrealized net appreciation/(depreciation) of investments, foreign currency translations and non-interested Trustees’ deferred compensation 84,167,058
Total Net Assets $ 506,372,438 Net Assets - Institutional Shares $ 354,100,365 Shares Outstanding, $0.01 Par Value (unlimited shares authorized) 12,498,719Net Asset Value Per Share $ 28.33 Net Assets - Service Shares $ 152,272,073 Shares Outstanding, $0.01 Par Value (unlimited shares authorized) 5,489,752Net Asset Value Per Share $ 27.74
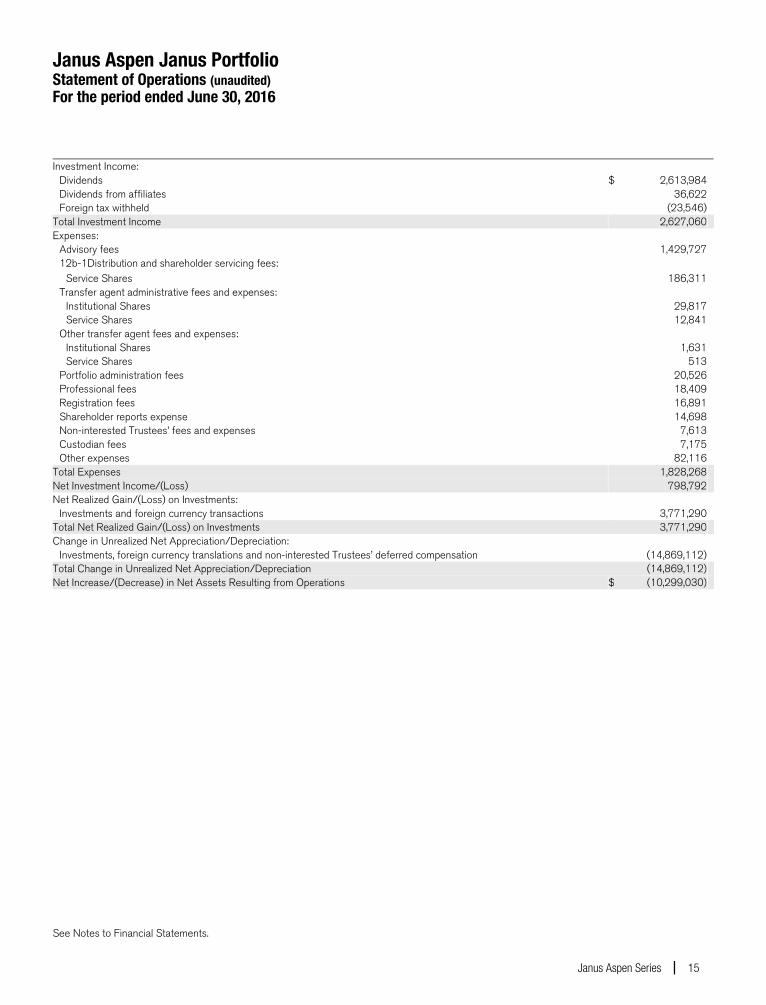
Janus Aspen Janus Portfolio Statement of Operations (unaudited) For the period ended June 30, 2016
See Notes to Financial Statements.
Janus Aspen Series 15
Investment Income: Dividends $ 2,613,984 Dividends from affiliates 36,622 Foreign tax withheld (23,546)Total Investment Income 2,627,060 Expenses: Advisory fees 1,429,727 12b-1Distribution and shareholder servicing fees: Service Shares 186,311 Transfer agent administrative fees and expenses: Institutional Shares 29,817 Service Shares 12,841 Other transfer agent fees and expenses: Institutional Shares 1,631 Service Shares 513 Portfolio administration fees 20,526 Professional fees 18,409 Registration fees 16,891 Shareholder reports expense 14,698 Non-interested Trustees’ fees and expenses 7,613 Custodian fees 7,175 Other expenses 82,116Total Expenses 1,828,268 Net Investment Income/(Loss) 798,792 Net Realized Gain/(Loss) on Investments: Investments and foreign currency transactions 3,771,290Total Net Realized Gain/(Loss) on Investments 3,771,290 Change in Unrealized Net Appreciation/Depreciation: Investments, foreign currency translations and non-interested Trustees’ deferred compensation (14,869,112)Total Change in Unrealized Net Appreciation/Depreciation (14,869,112) Net Increase/(Decrease) in Net Assets Resulting from Operations $ (10,299,030)
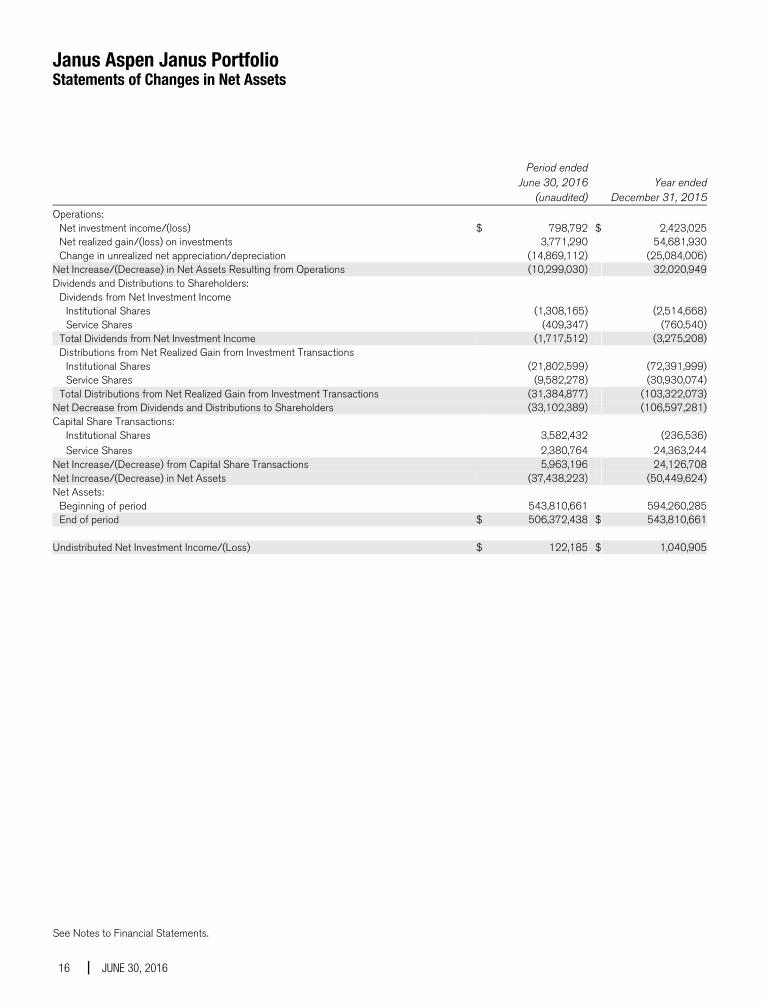
Janus Aspen Janus Portfolio Statements of Changes in Net Assets
See Notes to Financial Statements.
16 JUNE 30, 2016
Period ended June 30, 2016
(unaudited) Year ended
December 31, 2015
Operations: Net investment income/(loss) $ 798,792 $ 2,423,025 Net realized gain/(loss) on investments 3,771,290 54,681,930 Change in unrealized net appreciation/depreciation (14,869,112) (25,084,006)Net Increase/(Decrease) in Net Assets Resulting from Operations (10,299,030) 32,020,949Dividends and Distributions to Shareholders: Dividends from Net Investment Income Institutional Shares (1,308,165) (2,514,668) Service Shares (409,347) (760,540) Total Dividends from Net Investment Income (1,717,512) (3,275,208) Distributions from Net Realized Gain from Investment Transactions Institutional Shares (21,802,599) (72,391,999) Service Shares (9,582,278) (30,930,074) Total Distributions from Net Realized Gain from Investment Transactions (31,384,877) (103,322,073)Net Decrease from Dividends and Distributions to Shareholders (33,102,389) (106,597,281)Capital Share Transactions: Institutional Shares 3,582,432 (236,536) Service Shares 2,380,764 24,363,244Net Increase/(Decrease) from Capital Share Transactions 5,963,196 24,126,708Net Increase/(Decrease) in Net Assets (37,438,223) (50,449,624)Net Assets: Beginning of period 543,810,661 594,260,285 End of period $ 506,372,438 $ 543,810,661 Undistributed Net Investment Income/(Loss) $ 122,185 $ 1,040,905
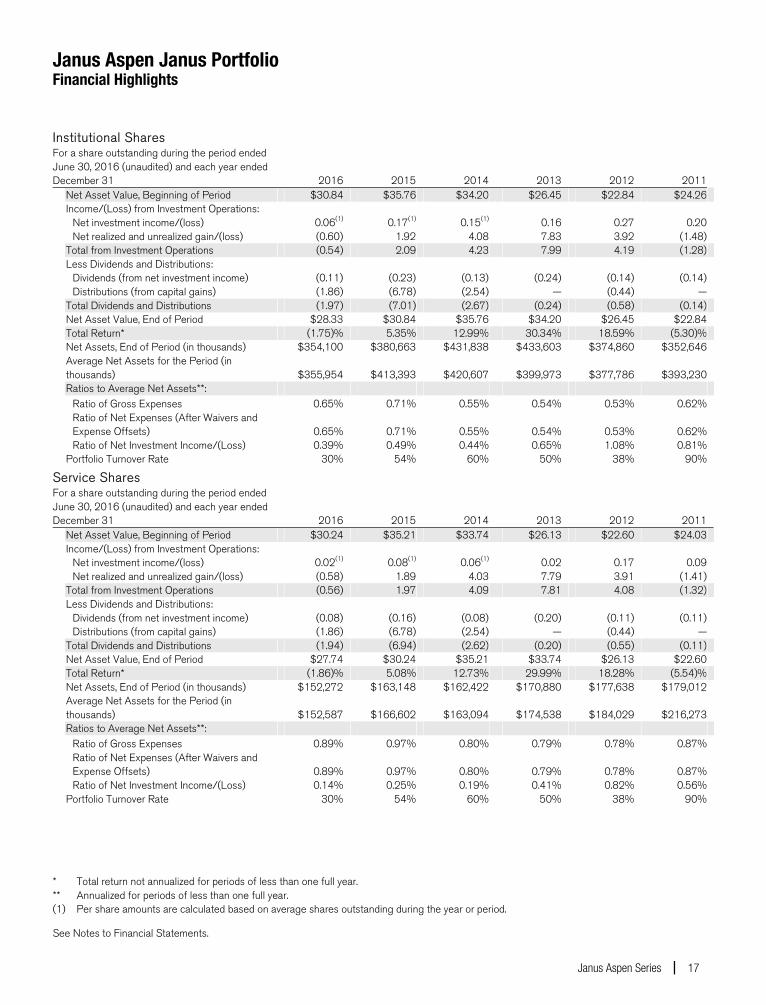
Janus Aspen Janus Portfolio Financial Highlights
See Notes to Financial Statements.
Janus Aspen Series 17
Institutional Shares For a share outstanding during the period ended June 30, 2016 (unaudited) and each year ended December 31 2016 2015 2014 2013 2012 2011 Net Asset Value, Beginning of Period $30.84 $35.76 $34.20 $26.45 $22.84 $24.26 Income/(Loss) from Investment Operations: Net investment income/(loss) 0.06(1) 0.17(1) 0.15(1) 0.16 0.27 0.20 Net realized and unrealized gain/(loss) (0.60) 1.92 4.08 7.83 3.92 (1.48) Total from Investment Operations (0.54) 2.09 4.23 7.99 4.19 (1.28) Less Dividends and Distributions: Dividends (from net investment income) (0.11) (0.23) (0.13) (0.24) (0.14) (0.14) Distributions (from capital gains) (1.86) (6.78) (2.54) — (0.44) — Total Dividends and Distributions (1.97) (7.01) (2.67) (0.24) (0.58) (0.14) Net Asset Value, End of Period $28.33 $30.84 $35.76 $34.20 $26.45 $22.84 Total Return* (1.75)% 5.35% 12.99% 30.34% 18.59% (5.30)% Net Assets, End of Period (in thousands) $354,100 $380,663 $431,838 $433,603 $374,860 $352,646
Average Net Assets for the Period (in thousands) $355,954 $413,393 $420,607 $399,973 $377,786 $393,230
Ratios to Average Net Assets**: Ratio of Gross Expenses 0.65% 0.71% 0.55% 0.54% 0.53% 0.62%
Ratio of Net Expenses (After Waivers and Expense Offsets) 0.65% 0.71% 0.55% 0.54% 0.53% 0.62%
Ratio of Net Investment Income/(Loss) 0.39% 0.49% 0.44% 0.65% 1.08% 0.81% Portfolio Turnover Rate 30% 54% 60% 50% 38% 90% 1
Service Shares For a share outstanding during the period ended June 30, 2016 (unaudited) and each year ended December 31 2016 2015 2014 2013 2012 2011 Net Asset Value, Beginning of Period $30.24 $35.21 $33.74 $26.13 $22.60 $24.03 Income/(Loss) from Investment Operations: Net investment income/(loss) 0.02(1) 0.08(1) 0.06(1) 0.02 0.17 0.09 Net realized and unrealized gain/(loss) (0.58) 1.89 4.03 7.79 3.91 (1.41) Total from Investment Operations (0.56) 1.97 4.09 7.81 4.08 (1.32) Less Dividends and Distributions: Dividends (from net investment income) (0.08) (0.16) (0.08) (0.20) (0.11) (0.11) Distributions (from capital gains) (1.86) (6.78) (2.54) — (0.44) — Total Dividends and Distributions (1.94) (6.94) (2.62) (0.20) (0.55) (0.11) Net Asset Value, End of Period $27.74 $30.24 $35.21 $33.74 $26.13 $22.60 Total Return* (1.86)% 5.08% 12.73% 29.99% 18.28% (5.54)% Net Assets, End of Period (in thousands) $152,272 $163,148 $162,422 $170,880 $177,638 $179,012
Average Net Assets for the Period (in thousands) $152,587 $166,602 $163,094 $174,538 $184,029 $216,273
Ratios to Average Net Assets**: Ratio of Gross Expenses 0.89% 0.97% 0.80% 0.79% 0.78% 0.87%
Ratio of Net Expenses (After Waivers and Expense Offsets) 0.89% 0.97% 0.80% 0.79% 0.78% 0.87%
Ratio of Net Investment Income/(Loss) 0.14% 0.25% 0.19% 0.41% 0.82% 0.56% Portfolio Turnover Rate 30% 54% 60% 50% 38% 90%
* Total return not annualized for periods of less than one full year.** Annualized for periods of less than one full year. (1) Per share amounts are calculated based on average shares outstanding during the year or period.
Janus Aspen Janus Portfolio Notes to Financial Statements (unaudited)
18 JUNE 30, 2016
1. Organization and Significant Accounting Policies Janus Aspen Janus Portfolio (the “Portfolio”) is a series fund. The Portfolio is part of Janus Aspen Series (the “Trust”), which is organized as a Delaware statutory trust and is registered under the Investment Company Act of 1940, as amended (the “1940 Act”), as an open-end management investment company, and therefore has applied the specialized accounting and reporting guidance in Financial Accounting Standards Board (“FASB”) Accounting Standards Codification (“ASC”) Topic 946. The Trust offers twelve portfolios which include multiple series of shares, with differing investment objectives and policies. The Portfolio seeks long-term growth of capital. The Portfolio is classified as diversified, as defined in the 1940 Act.
The Portfolio currently offers two classes of shares: Institutional Shares and Service Shares. Each class represents an interest in the same portfolio of investments. Institutional Shares are offered only in connection with investment in and payments under variable insurance contracts as well as certain qualified retirement plans. Service Shares are offered only in connection with investment in and payments under variable insurance contracts as well as certain qualified retirement plans that require a fee from Portfolio assets to procure distribution and administrative services to contract owners and plan participants.
Shareholders, including other portfolios, participating insurance companies, as well as accounts, may from time to time own (beneficially or of record) a significant percentage of the Portfolio’s Shares and can be considered to “control” the Portfolio when that ownership exceeds 25% of the Portfolio’s assets (and which may differ from control as determined in accordance with accounting principles generally accepted in the United States of America).
The following accounting policies have been followed by the Portfolio and are in conformity with accounting principles generally accepted in the United States of America.
Investment Valuation Securities held by the Portfolio are valued in accordance with policies and procedures established by and under the supervision of the Trustees (the “Valuation Procedures”). Equity securities traded on a domestic securities exchange are generally valued at the closing prices on the primary market or exchange on which they trade. If such price is lacking for the trading period immediately preceding the time of determination, such securities are valued at their current bid price. Equity securities that are traded on a foreign exchange are generally valued at the closing prices on such markets. In the event that there is no current trading volume on a particular security in such foreign exchange, the bid price from the primary exchange is generally used to value the security. Securities that are traded on the over-the-counter (“OTC”) markets are generally valued at their closing or latest bid prices as available. Foreign securities and currencies are converted to U.S. dollars using the applicable exchange rate in effect at the close of the New York Stock Exchange (“NYSE”). The Portfolio will determine the market value of individual securities held by it by using prices provided by one or more approved professional pricing services or, as needed, by obtaining market quotations from independent broker-dealers. Most debt securities are valued in accordance with the evaluated bid price supplied by the pricing service that is intended to reflect market value. The evaluated bid price supplied by the pricing service is an evaluation that may consider factors such as security prices, yields, maturities and ratings. Certain short-term securities maturing within 60 days or less may be evaluated and valued on an amortized cost basis provided that the amortized cost determined approximates market value. Securities for which market quotations or evaluated prices are not readily available or deemed unreliable are valued at fair value determined in good faith under the Valuation Procedures. Circumstances in which fair value pricing may be utilized include, but are not limited to: (i) a significant event that may affect the securities of a single issuer, such as a merger, bankruptcy, or significant issuer-specific development; (ii) an event that may affect an entire market, such as a natural disaster or significant governmental action; (iii) a nonsignificant event such as a market closing early or not opening, or a security trading halt; and (iv) pricing of a nonvalued security and a restricted or nonpublic security. Special valuation considerations may apply with respect to “odd-lot” fixed-income transactions which, due to their small size, may receive evaluated prices by pricing services which reflect a large block trade and not what actually could be obtained for the odd-lot position. The Portfolio uses systematic fair valuation models provided by independent third parties to value international equity securities in order to adjust for stale pricing, which may occur between the close of certain foreign exchanges and the close of the NYSE.
Valuation Inputs Summary FASB ASC 820, Fair Value Measurements and Disclosures (“ASC 820”), defines fair value, establishes a framework for measuring fair value, and expands disclosure requirements regarding fair value measurements. This standard emphasizes that fair value is a market-based measurement that should be determined based on the assumptions that
Janus Aspen Janus Portfolio Notes to Financial Statements (unaudited)
Janus Aspen Series 19
market participants would use in pricing an asset or liability and establishes a hierarchy that prioritizes inputs to valuation techniques used to measure fair value. These inputs are summarized into three broad levels:
Level 1 – Unadjusted quoted prices in active markets the Portfolio has the ability to access for identical assets or liabilities.
Level 2 – Observable inputs other than unadjusted quoted prices included in Level 1 that are observable for the asset or liability either directly or indirectly. These inputs may include quoted prices for the identical instrument on an inactive market, prices for similar instruments, interest rates, prepayment speeds, credit risk, yield curves, default rates and similar data.
Assets or liabilities categorized as Level 2 in the hierarchy generally include: debt securities fair valued in accordance with the evaluated bid or ask prices supplied by a pricing service; securities traded on OTC markets and listed securities for which no sales are reported that are fair valued at the latest bid price (or yield equivalent thereof) obtained from one or more dealers transacting in a market for such securities or by a pricing service approved by the Portfolio’s Trustees; certain short-term debt securities with maturities of 60 days or less that are fair valued at amortized cost; and equity securities of foreign issuers whose fair value is determined by using systematic fair valuation models provided by independent third parties in order to adjust for stale pricing which may occur between the close of certain foreign exchanges and the close of the NYSE. Other securities that may be categorized as Level 2 in the hierarchy include, but are not limited to, preferred stocks, bank loans, swaps, investments in unregistered investment companies, options, and forward contracts.
Level 3 – Unobservable inputs for the asset or liability to the extent that relevant observable inputs are not available, representing the Portfolio’s own assumptions about the assumptions that a market participant would use in valuing the asset or liability, and that would be based on the best information available.
There have been no significant changes in valuation techniques used in valuing any such positions held by the Portfolio since the beginning of the fiscal year.
The inputs or methodology used for fair valuing securities are not necessarily an indication of the risk associated with investing in those securities. The summary of inputs used as of June 30, 2016 to fair value the Portfolio’s investments in securities and other financial instruments is included in the “Valuation Inputs Summary” in the Notes to Schedule of Investments and Other Information.
The Portfolio did not hold a significant amount of Level 3 securities as of June 30, 2016.
The Portfolio recognizes transfers between the levels as of the beginning of the fiscal year. The following describes the amounts of transfers between Level 1, Level 2 and Level 3 of the fair value hierarchy during the period.
Financial assets of $2,377,202 were transferred out of Level 1 to Level 2 since certain foreign equity prices were applied a fair valuation adjustment factor at the end of the prior fiscal year and no factor was applied at the end of the current period.
Investment Transactions and Investment Income Investment transactions are accounted for as of the date purchased or sold (trade date). Dividend income is recorded on the ex-dividend date. Certain dividends from foreign securities will be recorded as soon as the Portfolio is informed of the dividend, if such information is obtained subsequent to the ex-dividend date. Dividends from foreign securities may be subject to withholding taxes in foreign jurisdictions. Interest income is recorded on the accrual basis and includes amortization of premiums and accretion of discounts. Gains and losses are determined on the identified cost basis, which is the same basis used for federal income tax purposes. Income, as well as gains and losses, both realized and unrealized, are allocated daily to each class of shares based upon the ratio of net assets represented by each class as a percentage of total net assets.
Expenses The Portfolio bears expenses incurred specifically on its behalf. Each class of shares bears a portion of general expenses, which are allocated daily to each class of shares based upon the ratio of net assets represented by each class as a percentage of total net assets. Expenses directly attributable to a specific class of shares are charged against the operations of such class.
Janus Aspen Janus Portfolio Notes to Financial Statements (unaudited)
20 JUNE 30, 2016
Estimates The preparation of financial statements in conformity with accounting principles generally accepted in the United States of America requires management to make estimates and assumptions that affect the reported amount of assets and liabilities and disclosure of contingent assets and liabilities at the date of the financial statements, and the reported amounts of income and expenses during the reporting period. Actual results could differ from those estimates.
Indemnifications In the normal course of business, the Portfolio may enter into contracts that contain provisions for indemnification of other parties against certain potential liabilities. The Portfolio’s maximum exposure under these arrangements is unknown, and would involve future claims that may be made against the Portfolio that have not yet occurred. Currently, the risk of material loss from such claims is considered remote.
Foreign Currency Translations The Portfolio does not isolate that portion of the results of operations resulting from the effect of changes in foreign exchange rates on investments from the fluctuations arising from changes in market prices of securities held at the date of the financial statements. Net unrealized appreciation or depreciation of investments and foreign currency translations arise from changes in the value of assets and liabilities, including investments in securities held at the date of the financial statements, resulting from changes in the exchange rates and changes in market prices of securities held.
Currency gains and losses are also calculated on payables and receivables that are denominated in foreign currencies. The payables and receivables are generally related to foreign security transactions and income translations.
Foreign currency-denominated assets and forward currency contracts may involve more risks than domestic transactions, including currency risk, counterparty risk, political and economic risk, regulatory risk and equity risk. Risks may arise from unanticipated movements in the value of foreign currencies relative to the U.S. dollar.
Dividends and Distributions The Portfolio may make semiannual distributions of substantially all of its investment income and an annual distribution of its net realized capital gains (if any).
The Portfolio may make certain investments in real estate investment trusts (“REITs”) which pay dividends to their shareholders based upon funds available from operations. It is quite common for these dividends to exceed the REITs’ taxable earnings and profits, resulting in the excess portion of such dividends being designated as a return of capital. If the Portfolio distributes such amounts, such distributions could constitute a return of capital to shareholders for federal income tax purposes.
Federal Income Taxes The Portfolio intends to continue to qualify as a regulated investment company and distribute all of its taxable income in accordance with the requirements of Subchapter M of the Internal Revenue Code. Management has analyzed the Portfolio’s tax positions taken for all open federal income tax years, generally a three-year period, and has concluded that no provision for federal income tax is required in the Portfolio’s financial statements. The Portfolio is not aware of any tax positions for which it is reasonably possible that the total amounts of unrecognized tax benefits will significantly change in the next twelve months.
2. Derivative Instruments The Portfolio may invest in various types of derivatives, which may at times result in significant derivative exposure. A derivative is a financial instrument whose performance is derived from the performance of another asset. The Portfolio may invest in derivative instruments including, but not limited to: futures contracts, put options, call options, options on future contracts, options on foreign currencies, options on recovery locks, options on security and commodity indices, swaps, forward contracts, structured investments, and other equity-linked derivatives. Each derivative instrument that was held by the Portfolio during the period ended June 30, 2016 is discussed in further detail below. A summary of derivative activity by the Portfolio is reflected in the tables at the end of this section.
The Portfolio may use derivative instruments for hedging purposes (to offset risks associated with an investment, currency exposure, or market conditions), to adjust currency exposure relative to a benchmark index, or for speculative purposes (to earn income and seek to enhance returns). When the Portfolio invests in a derivative for speculative purposes, the Portfolio will be fully exposed to the risks of loss of that derivative, which may sometimes be greater than
Janus Aspen Janus Portfolio Notes to Financial Statements (unaudited)
Janus Aspen Series 21
the derivative’s cost. The Portfolio may not use any derivative to gain exposure to an asset or class of assets that it would be prohibited by its investment restrictions from purchasing directly. The Portfolio’s ability to use derivative instruments may also be limited by tax considerations.
Investments in derivatives in general are subject to market risks that may cause their prices to fluctuate over time. Investments in derivatives may not directly correlate with the price movements of the underlying instrument. As a result, the use of derivatives may expose the Portfolio to additional risks that it would not be subject to if it invested directly in the securities underlying those derivatives. The use of derivatives may result in larger losses or smaller gains than otherwise would be the case. Derivatives can be volatile and may involve significant risks.
In pursuit of its investment objective, the Portfolio may seek to use derivatives to increase or decrease exposure to the following market risk factors:
• Commodity Risk – the risk related to the change in value of commodities or commodity-linked investments due to changes in the overall market movements, volatility of the underlying benchmark, changes in interest rates, or other factors affecting a particular industry of commodity such as drought, floods, weather, livestock disease, embargoes, tariffs, and international economic, political, and regulatory developments.
• Counterparty Risk – the risk that the counterparty (the party on the other side of the transaction) on a derivative transaction will be unable to honor its financial obligation to the Portfolio.
• Credit Risk – the risk an issuer will be unable to make principal and interest payments when due, or will default on its obligations.
• Currency Risk – the risk that changes in the exchange rate between currencies will adversely affect the value (in U.S. dollar terms) of an investment.
• Equity Risk – the risk related to the change in value of equity securities as they relate to increases or decreases in the general market.
• Index Risk – if the derivative is linked to the performance of an index, it will be subject to the risks associated with changes in that index. If the index changes, the Portfolio could receive lower interest payments or experience a reduction in the value of the derivative to below what the Portfolio paid. Certain indexed securities, including inverse securities (which move in an opposite direction to the index), may create leverage, to the extent that they increase or decrease in value at a rate that is a multiple of the changes in the applicable index.
• Interest Rate Risk – the risk that the value of fixed-income securities will generally decline as prevailing interest rates rise, which may cause the Portfolio’s NAV to likewise decrease.
• Leverage Risk – the risk associated with certain types of leveraged investments or trading strategies pursuant to which relatively small market movements may result in large changes in the value of an investment. The Portfolio creates leverage by investing in instruments, including derivatives, where the investment loss can exceed the original amount invested. Certain investments or trading strategies, such as short sales, that involve leverage can result in losses that greatly exceed the amount originally invested.
• Liquidity Risk – the risk that certain securities may be difficult or impossible to sell at the time that the seller would like or at the price that the seller believes the security is currently worth.
Derivatives may generally be traded OTC or on an exchange. Derivatives traded OTC are agreements that are individually negotiated between parties and can be tailored to meet a purchaser’s needs. OTC derivatives are not guaranteed by a clearing agency and may be subject to increased credit risk.
In an effort to mitigate credit risk associated with derivatives traded OTC, the Portfolio may enter into collateral agreements with certain counterparties whereby, subject to certain minimum exposure requirements, the Portfolio may require the counterparty to post collateral if the Portfolio has a net aggregate unrealized gain on all OTC derivative contracts with a particular counterparty. There is no guarantee that counterparty exposure is reduced and these arrangements are dependent on Janus Capital’s ability to establish and maintain appropriate systems and trading.
Options Contracts An options contract provides the purchaser with the right, but not the obligation, to buy (call option) or sell (put option) a financial instrument at an agreed upon price on or before a specified date. The purchaser pays a premium to the seller
Janus Aspen Janus Portfolio Notes to Financial Statements (unaudited)
22 JUNE 30, 2016
for this right. The seller has the corresponding obligation to sell or buy a financial instrument if the purchaser (owner) "exercises" the option. When an option is exercised, the proceeds on sales for a written call option, the purchase cost for a written put option, or the cost of the security for a purchased put or call option are adjusted by the amount of premium received or paid. Upon expiration, or closing of the option transaction, a realized gain or loss is reported on the Statement of Operations (if applicable). The difference between the premium paid/received and the market value of the option is recorded as unrealized appreciation or depreciation. The net change in unrealized appreciation or depreciation is reported on the Statement of Operations (if applicable). Option contracts are typically valued using an approved vendor’s option valuation model. To the extent reliable market quotations are available, option contracts are valued using market quotations. In cases when an approved vendor cannot provide coverage for an option and there is no reliable market quotation, a broker quotation or an internal valuation using the Black-Scholes model, the Cox-Rubenstein Binomial Option Pricing Model, or other appropriate option pricing model is used. Certain options contracts are marked-to-market daily, and the daily variation margin is recorded as a receivable or payable on the Statement of Assets and Liabilities as “Variation margin receivable” or “Variation margin payable” (if applicable).
The Portfolio may use options contracts to hedge against changes in interest rates, the values of equities, or foreign currencies. The Portfolio generally invests in options to hedge against adverse movements in the value of portfolio holdings. The use of such instruments may involve certain additional risks as a result of unanticipated movements in the market. A lack of correlation between the value of an instrument underlying an option and the asset being hedged, or unexpected adverse price movements, could render the Portfolio’s hedging strategy unsuccessful. In addition, there can be no assurance that a liquid secondary market will exist for any option purchased or sold. The Portfolio may be subject to counterparty risk, interest rate risk, liquidity risk, equity risk, commodity risk, and currency risk in the normal course of pursuing its investment objective through its investments in options contracts.
Options traded on an exchange are regulated and the terms of the options are standardized. Options traded OTC expose the Portfolio to counterparty risk in the event that the counterparty does not perform. This risk is mitigated by having a netting arrangement between the Portfolio and the counterparty and by having the counterparty post collateral to cover the Portfolio’s exposure to the counterparty. The Portfolio may purchase put options to hedge against a decline in the value of its portfolio. By using put options in this way, the Portfolio will reduce any profit it might otherwise have realized in the underlying security by the amount of the premium paid for the put option and by transaction costs. The Portfolio may purchase call options to hedge against an increase in the price of securities that it may buy in the future. The premium paid for the call option plus any transaction costs will reduce the benefit, if any, realized by the Portfolio upon exercise of the option, and, unless the price of the underlying security rises sufficiently, the option may expire worthless to the Portfolio. The risk in buying options is that the Portfolio pays a premium whether or not the options are exercised. Options purchased are reported in the Schedule of Investments (if applicable).
During the period, the Portfolio purchased put options on various equity securities and ETFs for the purpose of decreasing exposure to individual equity risk.
During the period ended June 30, 2016, the average ending monthly market value amounts on purchased put options is $66,526. There were no purchased options held at June 30, 2016.
The following table provides information about the effect of derivatives and hedging activities on the Portfolio’s Statement of Operations for the period ended June 30, 2016.
The effect of Derivative Instruments (not accounted for as hedging instruments) on the Statement of Operations for the period ended June 30, 2016
Amount of Realized Gain/(Loss) Recognized on Derivatives
Derivative Equity
ContractsInvestments and foreign currency transactions $ (742,076)*
* Amounts relate to purchased options. Please see the Portfolio’s Statement of Operations for the Portfolio’s “Net Realized and Unrealized Gain/(Loss) on Investments.”
Janus Aspen Janus Portfolio Notes to Financial Statements (unaudited)
Janus Aspen Series 23
3. Other Investments and Strategies
Additional Investment Risk The financial crisis in both the U.S. and global economies over the past several years has resulted, and may continue to result, in a significant decline in the value and liquidity of many securities of issuers worldwide in the equity and fixed-income/credit markets. In response to the crisis, the United States and certain foreign governments, along with the U.S. Federal Reserve and certain foreign central banks, took steps to support the financial markets. The withdrawal of this support, a failure of measures put in place to respond to the crisis, or investor perception that such efforts were not sufficient could each negatively affect financial markets generally, and the value and liquidity of specific securities. In addition, policy and legislative changes in the United States and in other countries continue to impact many aspects of financial regulation. The effect of these changes on the markets, and the practical implications for market participants, including the Portfolio, may not be fully known for some time. As a result, it may also be unusually difficult to identify both investment risks and opportunities, which could limit or preclude the Portfolio’s ability to achieve its investment objective. Therefore, it is important to understand that the value of your investment may fall, sometimes sharply, and you could lose money.
The enactment of the Dodd-Frank Wall Street Reform and Consumer Protection Act (the “Dodd-Frank Act”) provided for widespread regulation of financial institutions, consumer financial products and services, broker-dealers, OTC derivatives, investment advisers, credit rating agencies, and mortgage lending, which expanded federal oversight in the financial sector, including the investment management industry. Many provisions of the Dodd-Frank Act remain pending and will be implemented through future rulemaking. Therefore, the ultimate impact of the Dodd-Frank Act and the regulations under the Dodd-Frank Act on the Portfolio and the investment management industry as a whole, is not yet certain.
A number of countries in the European Union (“EU”) have experienced, and may continue to experience, severe economic and financial difficulties. In particular, many EU nations are susceptible to economic risks associated with high levels of debt, notably due to investments in sovereign debt of countries such as Greece, Italy, Spain, Portugal, and Ireland. Many non-governmental issuers, and even certain governments, have defaulted on, or been forced to restructure, their debts. Many other issuers have faced difficulties obtaining credit or refinancing existing obligations. Financial institutions have in many cases required government or central bank support, have needed to raise capital, and/or have been impaired in their ability to extend credit. As a result, financial markets in the EU experienced extreme volatility and declines in asset values and liquidity. Responses to these financial problems by European governments, central banks, and others, including austerity measures and reforms, may not work, may result in social unrest, and may limit future growth and economic recovery or have other unintended consequences. Further defaults or restructurings by governments and others of their debt could have additional adverse effects on economies, financial markets, and asset valuations around the world. Greece, Ireland, and Portugal have already received one or more "bailouts" from other Eurozone member states, and it is unclear how much additional funding they will require or if additional Eurozone member states will require bailouts in the future. The risk of investing in securities in the European markets may also be heightened due to the referendum in which the United Kingdom voted to exit the EU (known as “Brexit”). One or more other countries may also abandon the euro and/or withdraw from the EU, placing its currency and banking system in jeopardy.
Certain areas of the world have historically been prone to and economically sensitive to environmental events such as, but not limited to, hurricanes, earthquakes, typhoons, flooding, tidal waves, tsunamis, erupting volcanoes, wildfires or droughts, tornadoes, mudslides, or other weather-related phenomena. Such disasters, and the resulting physical or economic damage, could have a severe and negative impact on the Portfolio’s investment portfolio and, in the longer term, could impair the ability of issuers in which the Portfolio invests to conduct their businesses as they would under normal conditions. Adverse weather conditions may also have a particularly significant negative effect on issuers in the agricultural sector and on insurance companies that insure against the impact of natural disasters.
Counterparties Portfolio transactions involving a counterparty are subject to the risk that the counterparty or a third party will not fulfill its obligation to the Portfolio (“counterparty risk”). Counterparty risk may arise because of the counterparty’s financial condition (i.e., financial difficulties, bankruptcy, or insolvency), market activities and developments, or other reasons, whether foreseen or not. A counterparty’s inability to fulfill its obligation may result in significant financial loss to the Portfolio. The Portfolio may be unable to recover its investment from the counterparty or may obtain a limited recovery, and/or recovery may be delayed. The extent of the Portfolio’s exposure to counterparty risk with respect to financial
Janus Aspen Janus Portfolio Notes to Financial Statements (unaudited)
24 JUNE 30, 2016
assets and liabilities approximates its carrying value. See the "Offsetting Assets and Liabilities" section of this Note for further details.
The Portfolio may be exposed to counterparty risk through participation in various programs, including, but not limited to, lending its securities to third parties, cash sweep arrangements whereby the Portfolio’s cash balance is invested in one or more types of cash management vehicles, as well as investments in, but not limited to, repurchase agreements, debt securities, and derivatives, including various types of swaps, futures and options. The Portfolio intends to enter into financial transactions with counterparties that Janus Capital believes to be creditworthy at the time of the transaction. There is always the risk that Janus Capital’s analysis of a counterparty’s creditworthiness is incorrect or may change due to market conditions. To the extent that the Portfolio focuses its transactions with a limited number of counterparties, it will have greater exposure to the risks associated with one or more counterparties.
Real Estate Investing The Portfolio may invest in equity and debt securities of real estate-related companies. Such companies may include those in the real estate industry or real estate-related industries. These securities may include common stocks, corporate bonds, preferred stocks, and other equity securities, including, but not limited to, mortgage-backed securities, real estate-backed securities, securities of REITs and similar REIT-like entities. A REIT is a trust that invests in real estate-related projects, such as properties, mortgage loans, and construction loans. REITs are generally categorized as equity, mortgage, or hybrid REITs. A REIT may be listed on an exchange or traded OTC.
Restricted Security Transactions Restricted securities held by the Portfolio may not be sold except in exempt transactions or in a public offering registered under the Securities Act of 1933, as amended. The risk of investing in such securities is generally greater than the risk of investing in the securities of widely held, publicly traded companies. Lack of a secondary market and resale restrictions may result in the inability of the Portfolio to sell a security at a fair price and may substantially delay the sale of the security. In addition, these securities may exhibit greater price volatility than securities for which secondary markets exist.
4. Investment Advisory Agreements and Other Transactions with Affiliates The Portfolio pays Janus Capital an investment advisory fee which is calculated daily and paid monthly. The Portfolio’s “base” fee rate prior to any performance adjustment (expressed as an annual rate) is 0.64%.
The investment advisory fee rate is determined by calculating a base fee and applying a performance adjustment. The base fee rate is the same as the contractual investment advisory fee rate. The performance adjustment either increases or decreases the base fee depending on how well the Portfolio has performed relative to its benchmark index. The Portfolio's benchmark index used in the calculation is the Core Growth Index.
The calculation of the performance adjustment applies as follows:
Investment Advisory Fee = Base Fee Rate +/- Performance Adjustment
The investment advisory fee rate paid to Janus Capital by the Portfolio consists of two components: (1) a base fee calculated by applying the contractual fixed rate of the advisory fee to the Portfolio’s average daily net assets during the previous month (“Base Fee Rate”), plus or minus (2) a performance-fee adjustment (“Performance Adjustment”) calculated by applying a variable rate of up to 0.15% (positive or negative) to the Portfolio’s average daily net assets during the applicable performance measurement period, which is generally the previous 36 months.
The Portfolio’s prospectuses and statement(s) of additional information contain additional information about performance-based fees. The amount shown as advisory fees on the Statement of Operations reflects the Base Fee Rate plus/minus any Performance Adjustment. For the period ended June 30, 2016, the performance adjusted investment advisory fee rate before any waivers and/or reimbursements of expenses is 0.58%.
Janus Services LLC (“Janus Services”), a wholly-owned subsidiary of Janus Capital, is the Portfolio’s transfer agent. Effective May 1, 2016, Janus Services receives an administrative services fee at an annual rate of 0.05% of the average daily net assets of the Portfolio for arranging for the provision by participating insurance companies and qualified plan service providers of administrative services, including recordkeeping, subaccounting, order processing, or other shareholder services provided on behalf of contract holders or plan participants investing in the Portfolio. Other shareholder services may include the provision of order confirmations, periodic account statements, forwarding prospectuses, shareholder reports, and other materials to existing investors, and answering inquiries regarding
Janus Aspen Janus Portfolio Notes to Financial Statements (unaudited)
Janus Aspen Series 25
accounts. Janus Services expects to use this entire fee to compensate insurance companies and qualified plan service providers for providing these services to their customers who invest in the Portfolio. Any unused portion will be reimbursed to the applicable share class at least annually.
In addition, Janus Services provides or arranges for the provision of certain other internal administrative, recordkeeping, and shareholder relations services for the Portfolio. Janus Services is not compensated for these internal services related to the shares, except for out-of-pocket costs. These amounts are disclosed as “Other transfer agent fees and expenses” on the Statement of Operations.
Under a distribution and shareholder servicing plan (the “Plan”) adopted in accordance with Rule 12b-1 under the 1940 Act, the Service Shares may pay the Trust’s distributor, Janus Distributors LLC (“Janus Distributors”), a wholly-owned subsidiary of Janus Capital, a fee for the sale and distribution and/or shareholder servicing of the Service Shares at an annual rate of up to 0.25% of the average daily net assets of the Service Shares. Under the terms of the Plan, the Trust is authorized to make payments to Janus Distributors for remittance to insurance companies and qualified plan service providers as compensation for distribution and/or shareholder services performed by such entities. These amounts are disclosed as “12b-1 Distribution and shareholder servicing fees” on the Statement of Operations. Payments under the Plan are not tied exclusively to actual 12b-1 distribution and servicing fees, and the payments may exceed 12b-1 distribution and servicing fees actually incurred. If any of the Portfolio’s actual 12b-1 distribution and servicing fees incurred during a calendar year are less than the payments made during a calendar year, the Portfolio will be refunded the difference. Refunds, if any, are included in “12b-1 Distribution fees and shareholder servicing fees” in the Statement of Operations.
Janus Capital furnishes certain administration, compliance, and accounting services for the Portfolio and is reimbursed by the Portfolio for certain of its costs in providing those services (to the extent Janus Capital seeks reimbursement and such costs are not otherwise waived). In addition, employees of Janus Capital and/or its affiliates may serve as officers of the Trust. The Portfolio also pays for salaries, fees, and expenses of certain Janus Capital employees and Portfolio officers, with respect to certain specified administration functions they perform on behalf of the Portfolio. The Portfolio pays these costs based on out-of-pocket expenses incurred by Janus Capital, and these costs are separate and apart from advisory fees and other expenses paid in connection with the investment advisory services Janus Capital provides to the Portfolio. These amounts are disclosed as “Portfolio administration fees” on the Statement of Operations. Some expenses related to compensation payable to the Portfolio's Chief Compliance Officer and compliance staff are shared with the Portfolio. Total compensation of $28,304 was paid to the Chief Compliance Officer and certain compliance staff by the Trust during the period ended June 30, 2016. The Portfolio's portion is reported as part of “Other expenses” on the Statement of Operations.
The Board of Trustees has adopted a deferred compensation plan (the “Deferred Plan”) for independent Trustees to elect to defer receipt of all or a portion of the annual compensation they are entitled to receive from the Portfolio. All deferred fees are credited to an account established in the name of the Trustees. The amounts credited to the account then increase or decrease, as the case may be, in accordance with the performance of one or more of the Janus funds that are selected by the Trustees. The account balance continues to fluctuate in accordance with the performance of the selected fund or funds until final payment of all amounts are credited to the account. The fluctuation of the account balance is recorded by the Portfolio as unrealized appreciation/(depreciation) and is included as of June 30, 2016 on the Statement of Assets and Liabilities in the asset, “Non-interested Trustees’ deferred compensation,” and liability, “Non-interested Trustees’ deferred compensation fees.” Additionally, the recorded unrealized appreciation/(depreciation) is included in “Unrealized net appreciation/(depreciation) of investments, foreign currency translations and non-interested Trustees’ deferred compensation” on the Statement of Assets and Liabilities. Deferred compensation expenses for the period ended June 30, 2016 are included in “Non-interested Trustees’ fees and expenses” on the Statement of Operations. Trustees are allowed to change their designation of mutual funds from time to time. Amounts will be deferred until distributed in accordance with the Deferred Plan. Deferred fees of $20,150 were paid by the Trust to a Trustee under the Deferred Plan during the period ended June 30, 2016.
Pursuant to the provisions of the 1940 Act and related rules, the Portfolio may participate in an affiliated or nonaffiliated cash sweep program. In the cash sweep program, uninvested cash balances of the Portfolio may be used to purchase shares of affiliated or nonaffiliated money market funds or cash management pooled investment vehicles. The Portfolio is eligible to participate in the cash sweep program (the “Investing Funds”). As adviser, Janus Capital has an inherent conflict of interest because of its fiduciary duties to the affiliated money market funds or cash management pooled investment vehicles and the Investing Funds. Janus Cash Liquidity Fund LLC is an affiliated unregistered cash
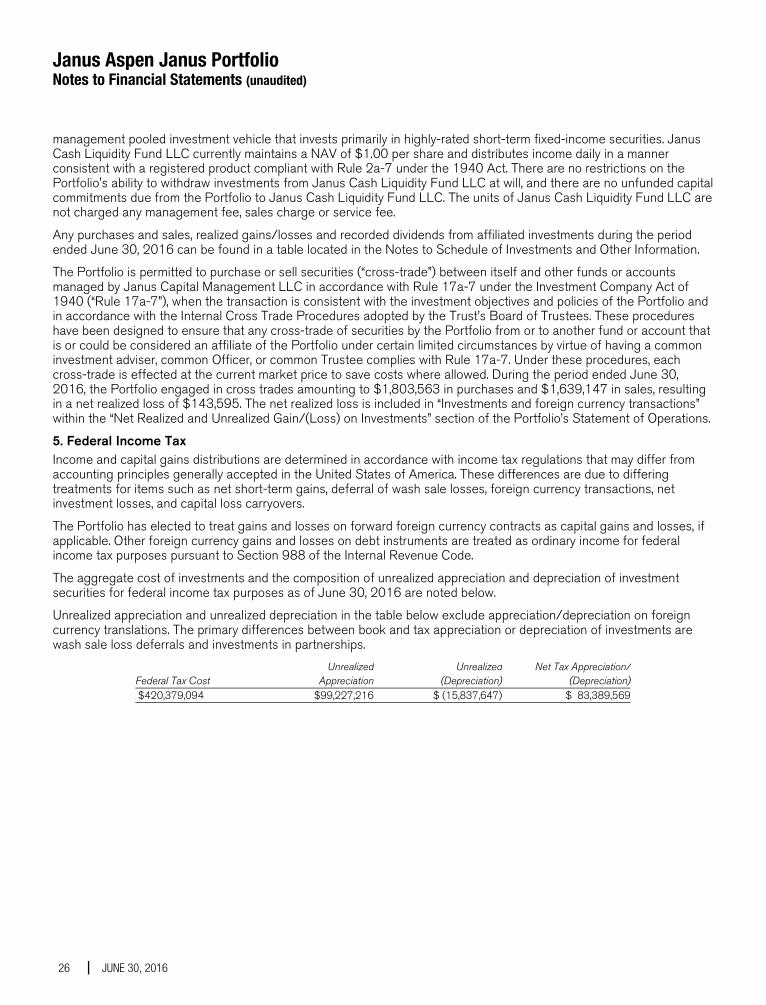
Janus Aspen Janus Portfolio Notes to Financial Statements (unaudited)
26 JUNE 30, 2016
management pooled investment vehicle that invests primarily in highly-rated short-term fixed-income securities. Janus Cash Liquidity Fund LLC currently maintains a NAV of $1.00 per share and distributes income daily in a manner consistent with a registered product compliant with Rule 2a-7 under the 1940 Act. There are no restrictions on the Portfolio's ability to withdraw investments from Janus Cash Liquidity Fund LLC at will, and there are no unfunded capital commitments due from the Portfolio to Janus Cash Liquidity Fund LLC. The units of Janus Cash Liquidity Fund LLC are not charged any management fee, sales charge or service fee.
Any purchases and sales, realized gains/losses and recorded dividends from affiliated investments during the period ended June 30, 2016 can be found in a table located in the Notes to Schedule of Investments and Other Information.
The Portfolio is permitted to purchase or sell securities (“cross-trade”) between itself and other funds or accounts managed by Janus Capital Management LLC in accordance with Rule 17a-7 under the Investment Company Act of 1940 (“Rule 17a-7”), when the transaction is consistent with the investment objectives and policies of the Portfolio and in accordance with the Internal Cross Trade Procedures adopted by the Trust’s Board of Trustees. These procedures have been designed to ensure that any cross-trade of securities by the Portfolio from or to another fund or account that is or could be considered an affiliate of the Portfolio under certain limited circumstances by virtue of having a common investment adviser, common Officer, or common Trustee complies with Rule 17a-7. Under these procedures, each cross-trade is effected at the current market price to save costs where allowed. During the period ended June 30, 2016, the Portfolio engaged in cross trades amounting to $1,803,563 in purchases and $1,639,147 in sales, resulting in a net realized loss of $143,595. The net realized loss is included in “Investments and foreign currency transactions” within the “Net Realized and Unrealized Gain/(Loss) on Investments” section of the Portfolio’s Statement of Operations.
5. Federal Income Tax Income and capital gains distributions are determined in accordance with income tax regulations that may differ from accounting principles generally accepted in the United States of America. These differences are due to differing treatments for items such as net short-term gains, deferral of wash sale losses, foreign currency transactions, net investment losses, and capital loss carryovers.
The Portfolio has elected to treat gains and losses on forward foreign currency contracts as capital gains and losses, if applicable. Other foreign currency gains and losses on debt instruments are treated as ordinary income for federal income tax purposes pursuant to Section 988 of the Internal Revenue Code.
The aggregate cost of investments and the composition of unrealized appreciation and depreciation of investment securities for federal income tax purposes as of June 30, 2016 are noted below.
Unrealized appreciation and unrealized depreciation in the table below exclude appreciation/depreciation on foreign currency translations. The primary differences between book and tax appreciation or depreciation of investments are wash sale loss deferrals and investments in partnerships.
Federal Tax Cost Unrealized
AppreciationUnrealized
(Depreciation)Net Tax Appreciation/
(Depreciation) $420,379,094 $99,227,216 $ (15,837,647) $ 83,389,569
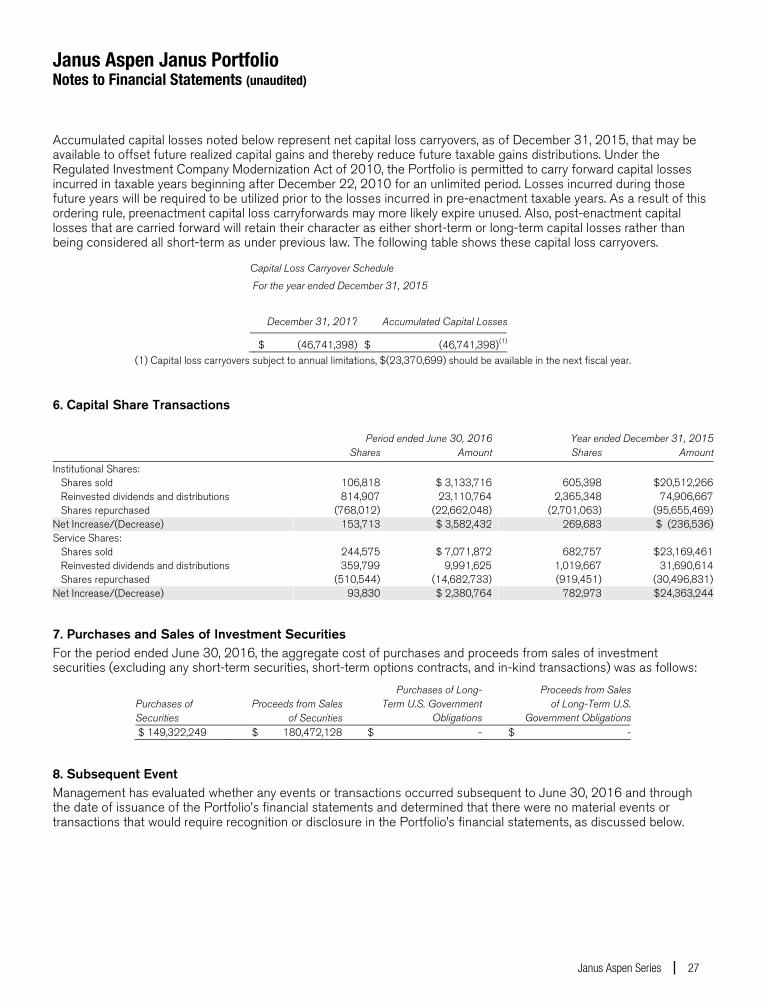
Janus Aspen Janus Portfolio Notes to Financial Statements (unaudited)
Janus Aspen Series 27
Accumulated capital losses noted below represent net capital loss carryovers, as of December 31, 2015, that may be available to offset future realized capital gains and thereby reduce future taxable gains distributions. Under the Regulated Investment Company Modernization Act of 2010, the Portfolio is permitted to carry forward capital losses incurred in taxable years beginning after December 22, 2010 for an unlimited period. Losses incurred during those future years will be required to be utilized prior to the losses incurred in pre-enactment taxable years. As a result of this ordering rule, preenactment capital loss carryforwards may more likely expire unused. Also, post-enactment capital losses that are carried forward will retain their character as either short-term or long-term capital losses rather than being considered all short-term as under previous law. The following table shows these capital loss carryovers.
Capital Loss Carryover Schedule
For the year ended December 31, 2015
December 31, 2017 Accumulated Capital Losses
$ (46,741,398) $ (46,741,398)(1) (1) Capital loss carryovers subject to annual limitations, $(23,370,699) should be available in the next fiscal year.
6. Capital Share Transactions Period ended June 30, 2016 Year ended December 31, 2015 Shares Amount Shares Amount
Institutional Shares: Shares sold 106,818 $ 3,133,716 605,398 $20,512,266 Reinvested dividends and distributions 814,907 23,110,764 2,365,348 74,906,667 Shares repurchased (768,012) (22,662,048) (2,701,063) (95,655,469)Net Increase/(Decrease) 153,713 $ 3,582,432 269,683 $ (236,536)Service Shares: Shares sold 244,575 $ 7,071,872 682,757 $23,169,461 Reinvested dividends and distributions 359,799 9,991,625 1,019,667 31,690,614 Shares repurchased (510,544) (14,682,733) (919,451) (30,496,831)Net Increase/(Decrease) 93,830 $ 2,380,764 782,973 $24,363,244
7. Purchases and Sales of Investment Securities For the period ended June 30, 2016, the aggregate cost of purchases and proceeds from sales of investment securities (excluding any short-term securities, short-term options contracts, and in-kind transactions) was as follows:
Purchases of Securities
Proceeds from Salesof Securities
Purchases of Long-Term U.S. Government
Obligations
Proceeds from Sales of Long-Term U.S.
Government Obligations $ 149,322,249 $ 180,472,128 $ - $ -
8. Subsequent Event Management has evaluated whether any events or transactions occurred subsequent to June 30, 2016 and through the date of issuance of the Portfolio’s financial statements and determined that there were no material events or transactions that would require recognition or disclosure in the Portfolio’s financial statements, as discussed below.
Janus Aspen Janus Portfolio Additional Information (unaudited)
28 JUNE 30, 2016
Proxy Voting Policies and Voting Record A description of the policies and procedures that the Portfolio uses to determine how to vote proxies relating to its portfolio securities is available without charge: (i) upon request, by calling 1-800-525-0020 (toll free); (ii) on the Portfolio’s website at janus.com/proxyvoting; and (iii) on the SEC’s website at http://www.sec.gov. Additionally, information regarding the Portfolio’s proxy voting record for the most recent twelve-month period ended June 30 is also available, free of charge, through janus.com/proxyvoting and from the SEC’s website at http://www.sec.gov.
Quarterly Portfolio Holdings The Portfolio files its complete portfolio holdings (schedule of investments) with the SEC for the first and third quarters of each fiscal year on Form N-Q within 60 days of the end of such fiscal quarter. The Portfolio’s Form N-Q: (i) is available on the SEC’s website at http://www.sec.gov; (ii) may be reviewed and copied at the SEC’s Public Reference Room in Washington, D.C. (information on the Public Reference Room may be obtained by calling 1-800-SEC-0330); and (iii) is available without charge, upon request, by calling Janus at 1-800-525-0020 (toll free).
APPROVAL OF ADVISORY AGREEMENTS DURING THE PERIOD The Trustees of Janus Investment Fund and Janus Aspen Series, each of whom serves as an “independent” Trustee (the “Trustees”), oversee the management of each Fund of Janus Investment Fund and each Portfolio of Janus Aspen Series (each, a “Fund” and collectively, the “Funds”), and as required by law, determine annually whether to continue the investment advisory agreement for each Fund and the subadvisory agreements for the 16 Funds that utilize subadvisers.
In connection with their most recent consideration of those agreements for each Fund, the Trustees received and reviewed information provided by Janus Capital and the respective subadvisers in response to requests of the Trustees and their independent legal counsel. They also received and reviewed information and analysis provided by, and in response to requests of, their independent fee consultant. Throughout their consideration of the agreements, the Trustees were advised by their independent legal counsel. The Trustees met with management to consider the agreements, and also met separately in executive session with their independent legal counsel and their independent fee consultant.
At a meeting held on December 9, 2015, based on the Trustees’ evaluation of the information provided by Janus Capital, the subadvisers, and the independent fee consultant, as well as other information, the Trustees determined that the overall arrangements between each Fund and Janus Capital and each subadviser, as applicable, were fair and reasonable in light of the nature, extent and quality of the services provided by Janus Capital, its affiliates and the subadvisers, the fees charged for those services, and other matters that the Trustees considered relevant in the exercise of their business judgment. At that meeting, the Trustees unanimously approved the continuation of the investment advisory agreement for each Fund, and the subadvisory agreement for each subadvised Fund, for the period from either January 1 or February 1, 2016 through January 1 or February 1, 2017, respectively, subject to earlier termination as provided for in each agreement.
In considering the continuation of those agreements, the Trustees reviewed and analyzed various factors that they determined were relevant, including the factors described below, none of which by itself was considered dispositive. However, the material factors and conclusions that formed the basis for the Trustees’ determination to approve the continuation of the agreements are discussed separately below. Also included is a summary of the independent fee consultant’s conclusions and opinions that arose during, and were included as part of, the Trustees’ consideration of the agreements. “Management fees,” as used herein, reflect actual annual advisory fees and any administration fees (excluding out of pocket costs), net of any waivers.
Nature, Extent and Quality of Services The Trustees reviewed the nature, extent and quality of the services provided by Janus Capital and the subadvisers to the Funds, taking into account the investment objective, strategies and policies of each Fund, and the knowledge the Trustees gained from their regular meetings with management on at least a quarterly basis and their ongoing review of information related to the Funds. In addition, the Trustees reviewed the resources and key personnel of Janus Capital and each subadviser, particularly noting those employees who provide investment and risk management services to the Funds. The Trustees also considered other services provided to the Funds by Janus Capital or the subadvisers, such as managing the execution of portfolio transactions and the selection of broker-dealers for those transactions. The Trustees considered Janus Capital’s role as administrator to the Funds, noting that Janus Capital does not receive a fee

Janus Aspen Janus Portfolio Additional Information (unaudited)
Janus Aspen Series 29
for its services but is reimbursed for its out-of-pocket costs. The Trustees considered the role of Janus Capital in monitoring adherence to the Funds’ investment restrictions, providing support services for the Trustees and Trustee committees, and overseeing communications with shareholders and the activities of other service providers, including monitoring compliance with various policies and procedures of the Funds and with applicable securities laws and regulations.
In this regard, the independent fee consultant noted that Janus Capital provides a number of different services for the Funds and Fund shareholders, ranging from investment management services to various other servicing functions, and that, in its opinion, Janus Capital is a capable provider of those services. The independent fee consultant also provided its belief that Janus Capital has developed a number of institutional competitive advantages that should enable it to provide superior investment and service performance over the long term.
The Trustees concluded that the nature, extent and quality of the services provided by Janus Capital or the subadviser to each Fund were appropriate and consistent with the terms of the respective advisory and subadvisory agreements, and that, taking into account steps taken to address those Funds whose performance lagged that of their peers for certain periods, the Funds were likely to benefit from the continued provision of those services. They also concluded that Janus Capital and each subadviser had sufficient personnel, with the appropriate education and experience, to serve the Funds effectively and had demonstrated its ability to attract well-qualified personnel.
Performance of the Funds The Trustees considered the performance results of each Fund over various time periods. They noted that they considered Fund performance data throughout the year, including periodic meetings with each Fund’s portfolio manager(s), and also reviewed information comparing each Fund’s performance with the performance of comparable funds and peer groups identified by Broadridge Financial Solutions, Inc. (“Broadridge”), an independent data provider, and with the Fund’s benchmark index. In this regard, the independent fee consultant found that the overall Funds’ performance has been strong: for the 36 months ended September 30, 2015, approximately 70% of the Funds were in the top two Broadridge quartiles of performance, and for the 12 months ended September 30, 2015, approximately 61% of the Funds were in the top two Broadridge quartiles of performance.
The Trustees considered the performance of each Fund, noting that performance may vary by share class, and noted the following:
Fixed-Income Funds and Money Market Funds • For Janus Flexible Bond Fund, the Trustees noted that the Fund’s performance was in the third Broadridge
quartile for the 36 months ended May 31, 2015 and the third Broadridge quartile for the 12 months ended May 31, 2015. The Trustees noted the reasons for the Fund’s underperformance and the steps Janus Capital had taken or was taking to improve performance.
• For Janus Global Bond Fund, the Trustees noted that the Fund’s performance was in the second Broadridge quartile for the 36 months ended May 31, 2015 and the second Broadridge quartile for the 12 months ended May 31, 2015.
• For Janus Global Unconstrained Bond Fund, the Trustees noted that the Fund’s performance was in the bottom Broadridge quartile for the 12 months ended May 31, 2015. The Trustees noted the reasons for the Fund’s underperformance, the steps Janus Capital had taken or was taking to improve performance, and its limited performance history.
• For Janus High-Yield Fund, the Trustees noted that the Fund’s performance was in the third Broadridge quartile for the 36 months ended May 31, 2015 and the third Broadridge quartile for the 12 months ended May 31, 2015. The Trustees noted the reasons for the Fund’s underperformance and the steps Janus Capital had taken or was taking to improve performance.
• For Janus Multi-Sector Income Fund, the Trustees noted that the Fund’s performance was in the first Broadridge quartile for the 12 months ended May 31, 2015.
• For Janus Real Return Fund, the Trustees noted that the Fund’s performance was in the first Broadridge quartile for the 36 months ended May 31, 2015 and the first Broadridge quartile for the 12 months ended May 31, 2015.
Janus Aspen Janus Portfolio Additional Information (unaudited)
30 JUNE 30, 2016
• For Janus Short-Term Bond Fund, the Trustees noted that the Fund’s performance was in the second Broadridge quartile for the 36 months ended May 31, 2015 and the third Broadridge quartile for the 12 months ended May 31, 2015.
• For Janus Government Money Market Fund, the Trustees noted that the Fund’s performance was in the third Broadridge quartile for the 36 months ended May 31, 2015 and the third Broadridge quartile for the 12 months ended May 31, 2015. The Trustees noted the reasons for the Fund’s underperformance.
• For Janus Money Market Fund, the Trustees noted that the Fund’s performance was in the third Broadridge quartile for the 36 months ended May 31, 2015 and the bottom Broadridge quartile for the 12 months ended May 31, 2015. The Trustees noted the reasons for the Fund’s underperformance.
Asset Allocation Funds • For Janus Global Allocation Fund – Conservative, the Trustees noted that the Fund’s performance was in the
first Broadridge quartile for the 36 months ended May 31, 2015 and the third Broadridge quartile for the 12 months ended May 31, 2015.
• For Janus Global Allocation Fund – Growth, the Trustees noted that the Fund’s performance was in the third Broadridge quartile for the 36 months ended May 31, 2015 and the bottom Broadridge quartile for the 12 months ended May 31, 2015. The Trustees noted the reasons for the Fund’s underperformance and the steps Janus Capital had taken or was taking to improve performance.
• For Janus Global Allocation Fund – Moderate, the Trustees noted that the Fund’s performance was in the second Broadridge quartile for the 36 months ended May 31, 2015 and the third Broadridge quartile for the 12 months ended May 31, 2015.
Alternative Fund • For Janus Diversified Alternatives Fund, the Trustees noted that the Fund’s performance was in the second
Broadridge quartile for the 12 months ended May 31, 2015.
Value Funds • For Perkins International Value Fund, the Trustees noted that the Fund’s performance was in the second
Broadridge quartile for the 12 months ended May 31, 2015.
• For Perkins Global Value Fund, the Trustees noted that the Fund’s performance was in the third Broadridge quartile for the 36 months ended May 31, 2015 and the third Broadridge quartile for the 12 months ended May 31, 2015. The Trustees noted the reasons for the Fund’s underperformance, noting that the Fund has a performance fee structure that results in lower management fees during periods of underperformance, and the steps Janus Capital and Perkins had taken or were taking to improve performance.
• For Perkins Large Cap Value Fund, the Trustees noted that the Fund’s performance was in the bottom Broadridge quartile for the 36 months ended May 31, 2015 and the bottom Broadridge quartile for the 12 months ended May 31, 2015. The Trustees noted the reasons for the Fund’s underperformance, noting that the Fund has a performance fee structure that results in lower management fees during periods of underperformance, and the steps Janus Capital and Perkins had taken or were taking to improve performance.
• For Perkins Mid Cap Value Fund, the Trustees noted that the Fund’s performance was in the bottom Broadridge quartile for the 36 months ended May 31, 2015 and the bottom Broadridge quartile for the 12 months ended May 31, 2015. The Trustees noted the reasons for the Fund’s underperformance, noting that the Fund has a performance fee structure that results in lower management fees during periods of underperformance, and the steps Janus Capital and Perkins had taken or were taking to improve performance.
• For Perkins Select Value Fund, the Trustees noted that the Fund’s performance was in the bottom Broadridge quartile for the 36 months ended May 31, 2015 and the second Broadridge quartile for the 12 months ended May 31, 2015. The Trustees noted the reasons for the Fund’s underperformance, noting that the Fund has a performance fee structure that results in lower management fees during periods of underperformance, the steps Janus Capital and Perkins had taken or were taking to improve performance, and that the performance trend was improving.
Janus Aspen Janus Portfolio Additional Information (unaudited)
Janus Aspen Series 31
• For Perkins Small Cap Value Fund, the Trustees noted that the Fund’s performance was in the bottom Broadridge quartile for the 36 months ended May 31, 2015 and the second Broadridge quartile for the 12 months ended May 31, 2015. The Trustees noted the reasons for the Fund’s underperformance, noting that the Fund has a performance fee structure that results in lower management fees during periods of underperformance, the steps Janus Capital and Perkins had taken or were taking to improve performance, and that the performance trend was improving.
• For Perkins Value Plus Income Fund, the Trustees noted that the Fund’s performance was in the second Broadridge quartile for the 36 months ended May 31, 2015 and the second Broadridge quartile for the 12 months ended May 31, 2015.
Mathematical Funds • For INTECH Emerging Markets Managed Volatility Fund, the Trustees noted that, due to limited performance
for the Fund, performance history was not a material factor.
• For INTECH Global Income Managed Volatility Fund, the Trustees noted that the Fund’s performance was in the first Broadridge quartile for the 36 months ended May 31, 2015 and the third Broadridge quartile for the 12 months ended May 31, 2015.
• For INTECH International Managed Volatility Fund, the Trustees noted that the Fund’s performance was in the bottom Broadridge quartile for the 36 months ended May 31, 2015 and the bottom Broadridge quartile for the 12 months ended May 31, 2015. The Trustees noted the reasons for the Fund’s underperformance and the steps Janus Capital and INTECH had taken or were taking to improve performance.
• For INTECH U.S. Core Fund, the Trustees noted that the Fund’s performance was in the second Broadridge quartile for the 36 months ended May 31, 2015 and the second Broadridge quartile for the 12 months ended May 31, 2015.
• For INTECH U.S. Managed Volatility Fund, the Trustees noted that the Fund’s performance was in the second Broadridge quartile for the 36 months ended May 31, 2015 and the third Broadridge quartile for the 12 months ended May 31, 2015.
Growth and Core Funds • For Janus Balanced Fund, the Trustees noted that the Fund’s performance was in the first Broadridge quartile
for the 36 months ended May 31, 2015 and the first Broadridge quartile for the 12 months ended May 31, 2015.
• For Janus Contrarian Fund, the Trustees noted that the Fund’s performance was in the first Broadridge quartile for the 36 months ended May 31, 2015 and the bottom Broadridge quartile for the 12 months ended May 31, 2015.
• For Janus Enterprise Fund, the Trustees noted that the Fund’s performance was in the second Broadridge quartile for the 36 months ended May 31, 2015 and the first Broadridge quartile for the 12 months ended May 31, 2015.
• For Janus Forty Fund, the Trustees noted that the Fund’s performance was in the second Broadridge quartile for the 36 months ended May 31, 2015 and the first Broadridge quartile for the 12 months ended May 31, 2015.
• For Janus Fund, the Trustees noted that the Fund’s performance was in the second Broadridge quartile for the 36 months ended May 31, 2015 and the first Broadridge quartile for the 12 months ended May 31, 2015.
• For Janus Growth and Income Fund, the Trustees noted that the Fund’s performance was in the third Broadridge quartile for the 36 months ended May 31, 2015 and in the third Broadridge quartile for the 12 months ended May 31, 2015. The Trustees noted the reasons for the Fund’s underperformance and the steps Janus Capital had taken or was taking to improve performance.
• For Janus Research Fund, the Trustees noted that the Fund’s performance was in the first Broadridge quartile for the 36 months ended May 31, 2015 and the first Broadridge quartile for the 12 months ended May 31, 2015.
Janus Aspen Janus Portfolio Additional Information (unaudited)
32 JUNE 30, 2016
• For Janus Triton Fund, the Trustees noted that the Fund’s performance was in the second Broadridge quartile for the 36 months ended May 31, 2015 and the first Broadridge quartile for the 12 months ended May 31, 2015.
• For Janus Twenty Fund, the Trustees noted that the Fund’s performance was in the third Broadridge quartile for the 36 months ended May 31, 2015 and the bottom Broadridge quartile for the 12 months ended May 31, 2015. The Trustees noted the reasons for the Fund’s underperformance, noting that the Fund has a performance fee structure that results in lower management fees during periods of underperformance, and the steps Janus Capital had taken or was taking to improve performance.
• For Janus Venture Fund, the Trustees noted that the Fund’s performance was in the first Broadridge quartile for the 36 months ended May 31, 2015 and the first Broadridge quartile for the 12 months ended May 31, 2015.
Global and International Funds • For Janus Asia Equity Fund, the Trustees noted that the Fund’s performance was in the third Broadridge
quartile for the 36 months ended May 31, 2015 and the first Broadridge quartile for the 12 months ended May 31, 2015. The Trustees noted the reasons for the Fund’s underperformance, noting that the Fund has a performance fee structure that results in lower management fees during periods of underperformance, the steps Janus Capital had taken or was taking to improve performance, and that the performance trend was improving.
• For Janus Emerging Markets Fund, the Trustees noted that the Fund’s performance was in the second Broadridge quartile for the 36 months ended May 31, 2015 and the first Broadridge quartile for the 12 months ended May 31, 2015.
• For Janus Global Life Sciences Fund, the Trustees noted that the Fund’s performance was in the first Broadridge quartile for the 36 months ended May 31, 2015 and the first Broadridge quartile for the 12 months ended May 31, 2015.
• For Janus Global Real Estate Fund, the Trustees noted that the Fund’s performance was in the first Broadridge quartile for the 36 months ended May 31, 2015 and the first Broadridge quartile for the 12 months ended May 31, 2015.
• For Janus Global Research Fund, the Trustees noted that the Fund’s performance was in the second Broadridge quartile for the 36 months ended May 31, 2015 and the first Broadridge quartile for the 12 months ended May 31, 2015.
• For Janus Global Select Fund, the Trustees noted that the Fund’s performance was in the second Broadridge quartile for the 36 months ended May 31, 2015 and the first Broadridge quartile for the 12 months ended May 31, 2015.
• For Janus Global Technology Fund, the Trustees noted that the Fund’s performance was in the third Broadridge quartile for the 36 months ended May 31, 2015 and the third Broadridge quartile for the 12 months ended May 31, 2015. The Trustees noted the reasons for the Fund’s underperformance and the steps Janus Capital had taken or was taking to improve performance.
• For Janus International Equity Fund, the Trustees noted that the Fund’s performance was in the second Broadridge quartile for the 36 months ended May 31, 2015 and the second Broadridge quartile for the 12 months ended May 31, 2015.
• For Janus Overseas Fund, the Trustees noted that the Fund’s performance was in the bottom Broadridge quartile for the 36 months ended May 31, 2015 and the bottom Broadridge quartile for the 12 months ended May 31, 2015. The Trustees noted the reasons for the Fund’s underperformance, noting that the Fund has a performance fee structure that results in lower management fees during periods of underperformance, and the steps Janus Capital had taken or was taking to improve performance.

Janus Aspen Janus Portfolio Additional Information (unaudited)
Janus Aspen Series 33
Janus Aspen Series • For Janus Aspen Balanced Portfolio, the Trustees noted that the Fund’s performance was in the first
Broadridge quartile for the 36 months ended May 31, 2015 and the first Broadridge quartile for the 12 months ended May 31, 2015.
• For Janus Aspen Enterprise Portfolio, the Trustees noted that the Fund’s performance was in the second Broadridge quartile for the 36 months ended May 31, 2015 and the first Broadridge quartile for the 12 months ended May 31, 2015.
• For Janus Aspen Flexible Bond Portfolio, the Trustees noted that the Fund’s performance was in the second Broadridge quartile for the 36 months ended May 31, 2015 and the second Broadridge quartile for the 12 months ended May 31, 2015.
• For Janus Aspen Forty Portfolio, the Trustees noted that the Fund’s performance was in the second Broadridge quartile for the 36 months ended May 31, 2015 and the first Broadridge quartile for the 12 months ended May 31, 2015.
• For Janus Aspen Global Allocation Portfolio – Moderate, the Trustees noted that the Fund’s performance was in the first Broadridge quartile for the 36 months ended May 31, 2015 and the bottom Broadridge quartile for the 12 months ended May 31, 2015.
• For Janus Aspen Global Research Portfolio, the Trustees noted that the Fund’s performance was in the first Broadridge quartile for the 36 months ended May 31, 2015 and the second Broadridge quartile for the 12 months ended May 31, 2015.
• For Janus Aspen Global Technology Portfolio, the Trustees noted that the Fund’s performance was in the second Broadridge quartile for the 36 months ended May 31, 2015 and the third Broadridge quartile for the 12 months ended May 31, 2015.
• For Janus Aspen Global Unconstrained Bond Portfolio, the Trustees noted that, due to limited performance for the Fund, performance history was not a material factor.
• For Janus Aspen INTECH U.S. Low Volatility Portfolio, the Trustees noted that the Fund’s performance was in the first Broadridge quartile for the 12 months ended May 31, 2015.
• For Janus Aspen Janus Portfolio, the Trustees noted that the Fund’s performance was in the second Broadridge quartile for the 36 months ended May 31, 2015 and the first Broadridge quartile for the 12 months ended May 31, 2015.
• For Janus Aspen Overseas Portfolio, the Trustees noted that the Fund’s performance was in the bottom Broadridge quartile for the 36 months ended May 31, 2015 and the bottom Broadridge quartile for the 12 months ended May 31, 2015. The Trustees noted the reasons for the Fund’s underperformance, noting that the Fund has a performance fee structure that results in lower management fees during periods of underperformance, and the steps Janus Capital had taken or was taking to improve performance.
• For Janus Aspen Perkins Mid Cap Value Portfolio, the Trustees noted that the Fund’s performance was in the bottom Broadridge quartile for the 36 months ended May 31, 2015 and the bottom Broadridge quartile for the 12 months ended May 31, 2015. The Trustees noted the reasons for the Fund’s underperformance, noting that the Fund has a performance fee structure that results in lower management fees during periods of underperformance, and the steps Janus Capital and Perkins had taken or were taking to improve performance.
In consideration of each Fund’s performance, the Trustees concluded that, taking into account the factors relevant to performance, as well as other considerations, including steps taken to improve performance, the Fund’s performance warranted continuation of the Fund’s investment advisory and subadvisory agreement(s).
Costs of Services Provided The Trustees examined information regarding the fees and expenses of each Fund in comparison to similar information for other comparable funds as provided by Broadridge, an independent data provider. They also reviewed an analysis of that information provided by their independent fee consultant and noted that the rate of management (investment advisory and any administration, but excluding out-of-pocket costs) fees for many of the Funds, after applicable waivers,
Janus Aspen Janus Portfolio Additional Information (unaudited)
34 JUNE 30, 2016
was below the mean management fee rate of the respective peer group of funds selected by an independent data provider. The Trustees also examined information regarding the subadvisory fees charged for subadvisory services, as applicable, noting that all such fees were paid by Janus Capital out of its management fees collected from such Fund.
The independent fee consultant provided its belief that the management fees charged by Janus Capital to each of the Funds under the current investment advisory and administration agreements are reasonable in relation to the services provided by Janus Capital. The independent fee consultant found: (1) the total expenses and management fees of the Funds to be reasonable relative to other mutual funds; (2) total expenses, on average, were 14% below the mean total expenses of their respective Broadridge Expense Group peers and 24% below the mean total expenses for their Broadridge Expense Universes; (3) management fees for the Funds, on average, were 15% below the mean management fees for their Expense Groups and 19% below the mean for their Expense Universes; and (4) Fund expenses at the functional level for each asset and share class category were reasonable. The Trustees also considered the total expenses for each share class of each Fund compared to the mean total expenses for its Broadridge Expense Group peers and to mean total expenses for its Broadridge Expense Universe.
The independent fee consultant concluded that, based on its strategic review of expenses at the complex, category and individual fund level, Fund expenses were found to be reasonable relative to both Expense Group and Expense Universe benchmarks. Further, for certain Funds, the independent fee consultant also performed a systematic “focus list” analysis of expenses in the context of the performance or service delivered to each set of investors in each share class in each selected Fund. Based on this analysis, the independent fee consultant found that the combination of service quality/performance and expenses on these individual Funds and share classes were reasonable in light of performance trends, performance histories, and existence of performance fees, breakpoints, and expense waivers on such Funds.
The Trustees considered the methodology used by Janus Capital and each subadviser in determining compensation payable to portfolio managers, the competitive environment for investment management talent, and the competitive market for mutual funds in different distribution channels.
The Trustees also reviewed management fees charged by Janus Capital and each subadviser to comparable separate account clients and to comparable non-affiliated funds subadvised by Janus Capital or by a subadviser (for which Janus Capital or the subadviser provides only or primarily portfolio management services). Although in most instances subadvisory and separate account fee rates for various investment strategies were lower than management fee rates for Funds having a similar strategy, the Trustees considered that Janus Capital noted that, under the terms of the management agreements with the Funds, Janus Capital performs significant additional services for the Funds that it does not provide to those other clients, including administration services, oversight of the Funds’ other service providers, trustee support, regulatory compliance and numerous other services, and that, in serving the Funds, Janus Capital assumes many legal risks and other costs that it does not assume in servicing its other clients. Moreover, they noted that the independent fee consultant found that: (1) the management fees Janus Capital charges to the Funds are reasonable in relation to the management fees Janus Capital charges to its institutional and subadvised accounts; (2) these institutional and subadvised accounts have different service and infrastructure needs; (3) the average spread between management fees charged to the Funds and those charged to Janus Capital’s institutional accounts is reasonable relative to the average spreads seen in the industry; and (4) by one estimation methodology, the fee margins implied by Janus Capital’s subadvised fees when compared to its mutual fund fees are reasonable relative to the estimated fee margins in the industry and relative to estimated fee margins of fund managers using Janus Capital as a subadviser.
The Trustees considered the fees for each Fund for its fiscal year ended in 2014, and noted the following with regard to each Fund’s total expenses, net of applicable fee waivers (the Fund’s “total expenses”):
Fixed-Income Funds and Money Market Funds • For Janus Flexible Bond Fund, the Trustees noted that, although the Fund’s total expenses exceeded the peer
group mean for certain share classes, overall the Fund’s total expenses were reasonable. The Trustees also noted that Janus Capital has contractually agreed to limit the Fund’s expenses, although this limit did not apply because the Fund’s total expenses were already below the applicable fee limit.

Janus Aspen Janus Portfolio Additional Information (unaudited)
Janus Aspen Series 35
• For Janus Global Bond Fund, the Trustees noted that although the Fund’s total expenses exceeded the peer group mean for certain share classes, overall the Fund’s total expenses were reasonable. The Trustees also noted that Janus Capital has contractually agreed to limit the Fund’s expenses.
• For Janus Global Unconstrained Bond Fund, the Trustees noted that although the Fund’s total expenses exceeded the peer group mean for certain share classes, overall the Fund’s total expenses were reasonable. The Trustees also noted that Janus Capital has contractually agreed to limit the Fund’s expenses.
• For Janus High-Yield Fund, the Trustees noted that, although the Fund’s total expenses exceeded the peer group mean for certain share classes, overall the Fund’s total expenses were reasonable. The Trustees also noted that Janus Capital has contractually agreed to limit the Fund’s expenses, although this limit did not apply because the Fund’s total expenses were already below the applicable fee limit.
• For Janus Multi-Sector Income Fund, the Trustees noted that, although the Fund’s total expenses exceeded the peer group mean for certain share classes, overall the Fund’s total expenses were reasonable. The Trustees also noted that Janus has contractually agreed to limit the Fund’s expenses.
• For Janus Real Return Fund, the Trustees noted that, although the Fund’s total expenses exceeded the peer group mean for all share classes, overall the Fund’s total expenses were reasonable. The Trustees also noted that Janus Capital has contractually agreed to limit the Fund’s expenses.
• For Janus Short-Term Bond Fund, the Trustees noted that, although the Fund’s total expenses exceeded the peer group mean for all share classes, overall the Fund’s total expenses were reasonable. The Trustees also noted that Janus Capital has contractually agreed to limit the Fund’s expenses.
• For Janus Government Money Market Fund, the Trustees noted that the Fund’s total expenses exceeded the peer group mean for both share classes. The Trustees considered that management fees for this Fund are higher than the peer group mean due to the Fund’s management fee including other costs, such as custody and transfer agent services, while many funds in the peer group pay these expenses separately from their management fee. In addition, the Trustees considered that Janus Capital voluntarily waives one-half of its advisory fee and other expenses in order to maintain a positive yield.
• For Janus Money Market Fund, the Trustees noted that the Fund’s total expenses were below the peer group mean for both share classes. In addition, the Trustees considered that Janus Capital voluntarily waives one-half of its advisory fee and other expenses in order to maintain a positive yield.
Asset Allocation Funds • For Janus Global Allocation Fund – Conservative, the Trustees noted that the Fund’s total expenses were
below the peer group mean for all share classes.
• For Janus Global Allocation Fund – Growth, the Trustees noted that the Fund’s total expenses were below the peer group mean for all share classes.
• For Janus Global Allocation Fund – Moderate, the Trustees noted that, although the Fund’s total expenses exceeded the peer group mean for certain share classes, overall the Fund’s total expenses were reasonable. The Trustees also noted that Janus Capital has contractually agreed to limit the Fund’s expenses.
Alternative Fund • For Janus Diversified Alternatives Fund, the Trustees noted that, although the Fund’s total expenses exceeded
the peer group mean for one share class, overall the Fund’s total expenses were reasonable. The Trustees also noted that Janus Capital has contractually agreed to limit the Fund’s expenses.
Value Funds • For Perkins International Value Fund, the Trustees noted that, although the Fund’s total expenses exceeded
the peer group mean for certain share classes, overall the Fund’s total expenses were reasonable. The Trustees also noted that Janus Capital has contractually agreed to limit the Fund’s expenses.
• For Perkins Global Value Fund, the Trustees noted that, although the Fund’s total expenses exceeded the peer group mean for one share class, overall the Fund’s total expenses were reasonable.
Janus Aspen Janus Portfolio Additional Information (unaudited)
36 JUNE 30, 2016
• For Perkins Large Cap Value Fund, the Trustees noted that, although the Fund’s total expenses exceeded the peer group mean for certain share classes, overall the Fund’s total expenses were reasonable. The Trustees also noted that Janus Capital has contractually agreed to limit the Fund’s expenses.
• For Perkins Mid Cap Value Fund, the Trustees noted that, although the Fund’s total expenses exceeded the peer group mean for one share class, overall the Fund’s total expenses were reasonable. The Trustees also noted that Janus Capital has contractually agreed to limit the Fund’s expenses, although this limit did not apply because the Fund’s total expenses were already below the applicable fee limit.
• For Perkins Select Value Fund, the Trustees noted that, although the Fund’s total expenses exceeded the peer group mean for one share class, overall the Fund’s total expenses were reasonable. The Trustees also noted that Janus Capital has contractually agreed to limit the Fund’s expenses.
• For Perkins Small Cap Value Fund, the Trustees noted that the Fund’s total expenses were below the peer group mean for all share classes.
• For Perkins Value Plus Income Fund, the Trustees noted that although the Fund’s total expenses exceeded the peer group mean for one share class, overall the Fund’s total expenses were reasonable. The Trustees also noted that Janus Capital had contractually agreed to limit the Fund’s expenses.
Mathematical Funds • For INTECH Emerging Markets Managed Volatility Fund, the Trustees noted that although the Fund’s total
expenses exceeded the peer group mean for certain share classes, overall the Fund’s total expenses were reasonable. The Trustees also noted that Janus Capital has contractually agreed to limit the Fund’s expenses.
• For INTECH Global Income Managed Volatility Fund, the Trustees noted that the Fund’s total expenses were below the peer group mean for all share classes.
• For INTECH International Managed Volatility Fund, the Trustees noted that although the Fund’s total expenses exceeded the peer group mean for one share class, overall the Fund’s total expenses were reasonable. The Trustees also noted that Janus Capital had contractually agreed to limit the Fund’s expenses, although this limit did not apply because the Fund’s total expenses were already below the applicable fee limit.
• For INTECH U.S. Core Fund, the Trustees noted that although the Fund’s total expenses exceeded the peer group mean for one share class, overall the Fund’s total expenses were reasonable. The Trustees also noted that Janus Capital has contractually agreed to limit the Fund’s expenses, although this limit did not apply because the Fund’s total expenses were already below the applicable fee limit.
• For INTECH U.S. Managed Volatility Fund, the Trustees noted that the Fund’s total expenses exceeded the peer group mean for one share class. The Trustees also noted that Janus Capital had contractually agreed to limit the Fund’s expenses.
Growth and Core Funds • For Janus Balanced Fund, the Trustees noted that, although the Fund’s total expenses exceeded the peer
group mean for one share class, overall the Fund’s total expenses were reasonable. The Trustees also noted that Janus Capital has contractually agreed to limit the Fund’s expenses, although this limit did not apply because the Fund’s total expenses were already below the applicable fee limit.
• For Janus Contrarian Fund, the Trustees noted that, although the Fund’s total expenses exceeded the peer group mean for certain share classes, overall the Fund’s total expenses were reasonable. The Trustees also noted that Janus Capital has contractually agreed to limit the Fund’s expenses, although this limit did not apply because the Fund’s total expenses were already below the applicable fee limit.
• For Janus Enterprise Fund, the Trustees noted that, although the Fund’s total expenses exceeded the peer group mean for certain share classes, overall the Fund’s total expenses were reasonable. The Trustees also noted that Janus Capital has contractually agreed to limit the Fund’s expenses, although this limit did not apply because the Fund’s total expenses were already below the applicable fee limit.
• For Janus Forty Fund, the Trustees noted that the Fund’s total expenses were below the peer group mean for all share classes.

Janus Aspen Janus Portfolio Additional Information (unaudited)
Janus Aspen Series 37
• For Janus Fund, the Trustees noted that the Fund’s total expenses were below the peer group mean for all share classes.
• For Janus Growth and Income Fund, the Trustees noted that, although the Fund’s total expenses exceeded the peer group mean for certain share classes, overall the Fund’s total expenses were reasonable. The Trustees also noted that Janus Capital has contractually agreed to limit the Fund’s expenses, although this limit did not apply because the Fund’s total expenses were already below the applicable fee limit.
• For Janus Research Fund, the Trustees noted that the Fund’s total expenses were below the peer group mean for all share classes.
• For Janus Triton Fund, the Trustees noted that, although the Fund’s total expenses exceeded the peer group mean for one share class, overall the Fund’s total expenses were reasonable. The Trustees also noted that Janus Capital has contractually agreed to limit the Fund’s expenses, although this limit did not apply because the Fund’s total expenses were already below the applicable fee limit.
• For Janus Twenty Fund, the Trustees noted that the Fund’s total expenses were below the peer group mean for all share classes.
• For Janus Venture Fund, the Trustees noted that, although the Fund’s total expenses exceeded the peer group mean for one share class, overall the Fund’s total expenses were reasonable. The Trustees also noted that Janus Capital has contractually agreed to limit the Fund’s expenses, although this limit did not apply because the Fund’s total expenses were already below the applicable fee limit.
Global and International Funds • For Janus Asia Equity Fund, the Trustees noted that the Fund’s total expenses were below the peer group
mean for all share classes.
• For Janus Emerging Markets Fund, the Trustees noted that, although the Fund’s total expenses exceeded the peer group mean for certain share classes, overall the Fund’s total expenses were reasonable. The Trustees also noted that Janus Capital has contractually agreed to limit the Fund’s expenses.
• For Janus Global Life Sciences Fund, the Trustees noted that the Fund’s total expenses were below the peer group mean for all share classes.
• For Janus Global Real Estate Fund, the Trustees noted that, although the Fund’s total expenses exceeded the peer group mean for one share class, overall the Fund’s total expenses were reasonable. The Trustees also noted that Janus Capital has contractually agreed to limit the Fund’s expenses.
• For Janus Global Research Fund, the Trustees noted that the Fund’s total expenses were below the peer group mean for all share classes.
• For Janus Global Select Fund, the Trustees noted that the Fund’s total expenses were below the peer group mean for all share classes.
• For Janus Global Technology Fund, the Trustees noted that the Fund’s total expenses were below the peer group mean for all share classes.
• For Janus International Equity Fund, the Trustees noted that, although the Fund’s total expenses exceeded the peer group mean for one share class, overall the Fund’s total expenses were reasonable. The Trustees also noted that Janus Capital has contractually agreed to limit the Fund’s expenses, although this limit did not apply because the Fund’s total expenses were already below the applicable fee limit.
• For Janus Overseas Fund, the Trustees noted that the Fund’s total expenses were below the peer group mean for all share classes.
Janus Aspen Series • For Janus Aspen Balanced Portfolio, the Trustees noted that the Fund’s total expenses were below the peer
group mean for both share classes.

Janus Aspen Janus Portfolio Additional Information (unaudited)
38 JUNE 30, 2016
• For Janus Aspen Enterprise Portfolio, the Trustees noted that the Fund’s total expenses were below the peer group mean for both share classes.
• For Janus Aspen Flexible Bond Portfolio, the Trustees noted that, although the Fund’s total expenses exceeded the peer group mean for one share class, overall the Fund’s total expenses were reasonable. The Trustees also noted that Janus Capital had contractually agreed to limit the Fund’s expenses.
• For Janus Aspen Forty Portfolio, the Trustees noted that the Fund’s total expenses were below the peer group mean for both share classes.
• For Janus Aspen Global Allocation Portfolio - Moderate, the Trustees noted that, although the Fund’s total expenses exceeded the peer group mean for both share classes, overall the Fund’s total expenses were reasonable. The Trustees also noted that Janus Capital has contractually agreed to limit the Fund’s expenses.
• For Janus Aspen Global Research Portfolio, the Trustees noted that the Fund’s total expenses were below the peer group mean for both share classes.
• For Janus Aspen Global Technology Portfolio, the Trustees noted that the Fund’s total expenses were below the peer group mean for both share classes.
• For Janus Aspen Global Unconstrained Bond Portfolio, the Trustees noted that, although the Fund’s total expenses exceeded the peer group mean for both share classes, overall the Fund’s total expenses were reasonable. The Trustees also noted that Janus Capital had contractually agreed to limit the Fund’s expenses.
• For Janus Aspen INTECH U.S. Low Volatility Portfolio, the Trustees noted that the Fund’s total expenses were below the peer group mean for its sole share class.
• For Janus Aspen Janus Portfolio, the Trustees noted that the Fund’s total expenses were below the peer group mean for both share classes.
• For Janus Aspen Overseas Portfolio, the Trustees noted that the Fund’s total expenses were below the peer group mean for both share classes.
• For Janus Aspen Perkins Mid Cap Value Portfolio, the Trustees noted that the Fund’s total expenses were below the peer group mean for both share classes.
The Trustees reviewed information on the profitability to Janus Capital and its affiliates of their relationships with each Fund, as well as an explanation of the methodology utilized by Janus Capital when allocating various expenses of Janus Capital and its affiliates with respect to contractual relationships with the Funds and other clients. The Trustees also reviewed the financial statements and corporate structure of Janus Capital’s parent company. In their review, the Trustees considered whether Janus Capital and each subadviser receive adequate incentives and resources to manage the Funds effectively. The Trustees recognized that profitability comparisons among fund managers are difficult because very little comparative information is publicly available, and the profitability of any fund manager is affected by numerous factors, including the organizational structure of the particular fund manager, the types of funds and other accounts it manages, possible other lines of business, the methodology for allocating expenses, and the fund manager’s capital structure and cost of capital. However, taking into account those factors and the analysis provided by the Trustees’ independent fee consultant, and based on the information available, the Trustees concluded that Janus Capital’s profitability with respect to each Fund in relation to the services rendered was reasonable.
The independent fee consultant found that, while assessing the reasonableness of expenses in light of Janus Capital’s profits is dependent on comparisons with other publicly-traded mutual fund advisers, and that these comparisons are limited in accuracy by differences in complex size, business mix, institutional account orientation, and other factors, after accepting these limitations, the level of profit earned by Janus Capital from managing the Funds is reasonable.
The Trustees concluded that the management fees payable by each Fund to Janus Capital and its affiliates, as well as the fees paid by Janus Capital to the subadvisers of subadvised Funds, were reasonable in relation to the nature, extent, and quality of the services provided, taking into account the fees charged by other advisers for managing comparable mutual funds with similar strategies, the fees Janus Capital and the subadvisers charge to other clients, and, as applicable, the impact of fund performance on management fees payable by the Funds. The Trustees also concluded that each Fund’s total expenses were reasonable, taking into account the size of the Fund, the quality of services
Janus Aspen Janus Portfolio Additional Information (unaudited)
Janus Aspen Series 39
provided by Janus Capital and any subadviser, the investment performance of the Fund, and any expense limitations agreed to or provided by Janus Capital.
Economies of Scale The Trustees considered information about the potential for Janus Capital to realize economies of scale as the assets of the Funds increase. They noted that their independent fee consultant provided an analysis of economies of scale, which included discussion of analysis from prior years. They also noted that, although many Funds pay advisory fees at a base fixed rate as a percentage of net assets, without any breakpoints, their independent fee consultant concluded that 85% of these Funds have contractual management fees (gross of waivers) below their Broadridge expense group averages and, overall, 80% of the Funds are below their respective expense group averages for contractual management fees. They also noted that for those Funds whose expenses are being reduced by the contractual expense limitations of Janus Capital, Janus Capital is subsidizing the Funds because they have not reached adequate scale. Moreover, as the assets of some of the Funds have declined in the past few years, certain Funds have benefited from having advisory fee rates that have remained constant rather than increasing as assets declined. In addition, performance fee structures have been implemented for various Funds that have caused the effective rate of advisory fees payable by such a Fund to vary depending on the investment performance of the Fund relative to its benchmark index over the measurement period; and a few Funds have fee schedules with breakpoints and reduced fee rates above certain asset levels. The Trustees also noted that the Funds share directly in economies of scale through the lower charges of third-party service providers that are based in part on the combined scale of all of the Funds. Based on all of the information they reviewed, including research and analysis conducted by the Trustees’ independent fee consultant, the Trustees concluded that the current fee structure of each Fund was reasonable and that the current rates of fees do reflect a sharing between Janus Capital and the Fund of any economies of scale that may be present at the current asset level of the Fund.
The independent fee consultant concluded that, given the limitations of various analytical approaches to economies of scale considered in prior years, and their conflicting results, its analyses could not confirm or deny the existence of economies of scale in the Janus complex. Further, the independent fee consultant provided its belief that Fund investors are well-served by the fee levels and performance fee structures in place on the Funds in light of any economies of scale that may be present at Janus Capital.
Other Benefits to Janus Capital The Trustees also considered benefits that accrue to Janus Capital and its affiliates and subadvisers to the Funds from their relationships with the Funds. They recognized that two affiliates of Janus Capital separately serve the Funds as transfer agent and distributor, respectively, and the transfer agent receives compensation directly from the non-money market funds for services provided. The Trustees also considered Janus Capital’s past and proposed use of commissions paid by the Funds on portfolio brokerage transactions to obtain proprietary and third-party research products and services benefiting the Fund and/or other clients of Janus Capital and/or Janus Capital, and/or a subadviser to a Fund. The Trustees concluded that Janus Capital’s and the subadvisers’ use of these types of client commission arrangements to obtain proprietary and third-party research products and services was consistent with regulatory requirements and guidelines and was likely to benefit each Fund. The Trustees also concluded that, other than the services provided by Janus Capital and its affiliates and subadvisers pursuant to the agreements and the fees to be paid by each Fund therefor, the Funds and Janus Capital and the subadvisers may potentially benefit from their relationship with each other in other ways. They concluded that Janus Capital and/or the subadvisers benefits from the receipt of research products and services acquired through commissions paid on portfolio transactions of the Funds and that the Funds benefit from Janus Capital’s and/or the subadvisers’ receipt of those products and services as well as research products and services acquired through commissions paid by other clients of Janus Capital and/or other clients of the subadvisers. They further concluded that the success of any Fund could attract other business to Janus Capital, the subadvisers or other Janus funds, and that the success of Janus Capital and the subadvisers could enhance Janus Capital’s and the subadvisers’ ability to serve the Funds.

Janus Aspen Janus Portfolio Useful Information About Your Portfolio Report (unaudited)
40 JUNE 30, 2016
Management Commentary The Management Commentary in this report includes valuable insight as well as statistical information to help you understand how your Portfolio’s performance and characteristics stack up against those of comparable indices.
If the Portfolio invests in foreign securities, this report may include information about country exposure. Country exposure is based primarily on the country of risk. A company may be allocated to a country based on other factors such as location of the company’s principal office, the location of the principal trading market for the company’s securities, or the country where a majority of the company’s revenues are derived.
Please keep in mind that the opinions expressed in the Management Commentary are just that: opinions. They are a reflection based on best judgment at the time this report was compiled, which was June 30, 2016. As the investing environment changes, so could opinions. These views are unique and are not necessarily shared by fellow employees or by Janus in general.
Performance Overviews Performance overview graphs compare the performance of a hypothetical $10,000 investment in the Portfolio with one or more widely used market indices. When comparing the performance of the Portfolio with an index, keep in mind that market indices are not available for investment and do not reflect deduction of expenses.
Average annual total returns are quoted for a Portfolio with more than one year of performance history. Average annual total return is calculated by taking the growth or decline in value of an investment over a period of time, including reinvestment of dividends and distributions, then calculating the annual compounded percentage rate that would have produced the same result had the rate of growth been constant throughout the period. Average annual total return does not reflect the deduction of taxes that a shareholder would pay on Portfolio distributions or redemptions of Portfolio shares.
Cumulative total returns are quoted for a Portfolio with less than one year of performance history. Cumulative total return is the growth or decline in value of an investment over time, independent of the period of time involved. Cumulative total return does not reflect the deduction of taxes that a shareholder would pay on Portfolio distributions or redemptions of Portfolio shares.
Pursuant to federal securities rules, expense ratios shown in the performance chart reflect subsidized (if applicable) and unsubsidized ratios. The total annual fund operating expenses ratio is gross of any fee waivers, reflecting the Portfolio’s unsubsidized expense ratio. The net annual fund operating expenses ratio (if applicable) includes contractual waivers of Janus Capital and reflects the Portfolio’s subsidized expense ratio. Ratios may be higher or lower than those shown in the “Financial Highlights” in this report.
Schedule of Investments Following the performance overview section is the Portfolio’s Schedule of Investments. This schedule reports the types of securities held in the Portfolio on the last day of the reporting period. Securities are usually listed by type (common stock, corporate bonds, U.S. Government obligations, etc.) and by industry classification (banking, communications, insurance, etc.). Holdings are subject to change without notice.
The value of each security is quoted as of the last day of the reporting period. The value of securities denominated in foreign currencies is converted into U.S. dollars.
If the Portfolio invests in foreign securities, it will also provide a summary of investments by country. This summary reports the Portfolio exposure to different countries by providing the percentage of securities invested in each country. The country of each security represents the country of risk. The Portfolio’s Schedule of Investments relies upon the industry group and country classifications published by Barclays and/or MSCI Inc.
Tables listing details of individual forward currency contracts, futures, written options, swaptions, and swaps follow the Portfolio’s Schedule of Investments (if applicable).
Statement of Assets and Liabilities This statement is often referred to as the “balance sheet.” It lists the assets and liabilities of the Portfolio on the last day of the reporting period.
Janus Aspen Janus Portfolio Useful Information About Your Portfolio Report (unaudited)
Janus Aspen Series 41
The Portfolio’s assets are calculated by adding the value of the securities owned, the receivable for securities sold but not yet settled, the receivable for dividends declared but not yet received on securities owned, and the receivable for Portfolio shares sold to investors but not yet settled. The Portfolio’s liabilities include payables for securities purchased but not yet settled, Portfolio shares redeemed but not yet paid, and expenses owed but not yet paid. Additionally, there may be other assets and liabilities such as unrealized gain or loss on forward currency contracts.
The section entitled “Net Assets Consist of” breaks down the components of the Portfolio’s net assets. Because the Portfolio must distribute substantially all earnings, you will notice that a significant portion of net assets is shareholder capital.
The last section of this statement reports the net asset value (“NAV”) per share on the last day of the reporting period. The NAV is calculated by dividing the Portfolio’s net assets for each share class (assets minus liabilities) by the number of shares outstanding.
Statement of Operations This statement details the Portfolio’s income, expenses, realized gains and losses on securities and currency transactions, and changes in unrealized appreciation or depreciation of Portfolio holdings.
The first section in this statement, entitled “Investment Income,” reports the dividends earned from securities and interest earned from interest-bearing securities in the Portfolio.
The next section reports the expenses incurred by the Portfolio, including the advisory fee paid to the investment adviser, transfer agent fees and expenses, and printing and postage for mailing statements, financial reports and prospectuses. Expense offsets and expense reimbursements, if any, are also shown.
The last section lists the amounts of realized gains or losses from investment and foreign currency transactions, and changes in unrealized appreciation or depreciation of investments and foreign currency-denominated assets and liabilities. The Portfolio will realize a gain (or loss) when it sells its position in a particular security. A change in unrealized gain (or loss) refers to the change in net appreciation or depreciation of the Portfolio during the reporting period. “Net Realized and Unrealized Gain/(Loss) on Investments” is affected both by changes in the market value of Portfolio holdings and by gains (or losses) realized during the reporting period.
Statements of Changes in Net Assets These statements report the increase or decrease in the Portfolio’s net assets during the reporting period. Changes in the Portfolio’s net assets are attributable to investment operations, dividends and distributions to investors, and capital share transactions. This is important to investors because it shows exactly what caused the Portfolio’s net asset size to change during the period.
The first section summarizes the information from the Statement of Operations regarding changes in net assets due to the Portfolio’s investment operations. The Portfolio’s net assets may also change as a result of dividend and capital gains distributions to investors. If investors receive their dividends and/or distributions in cash, money is taken out of the Portfolio to pay the dividend and/or distribution. If investors reinvest their dividends and/or distributions, the Portfolio’s net assets will not be affected. If you compare the Portfolio’s “Net Decrease from Dividends and Distributions” to “Reinvested Dividends and Distributions,” you will notice that dividends and distributions have little effect on the Portfolio’s net assets. This is because the majority of the Portfolio’s investors reinvest their dividends and/or distributions.
The reinvestment of dividends and distributions is included under “Capital Share Transactions.” “Capital Shares” refers to the money investors contribute to the Portfolio through purchases or withdrawals via redemptions. The Portfolio’s net assets will increase and decrease in value as investors purchase and redeem shares from the Portfolio.
Financial Highlights This schedule provides a per-share breakdown of the components that affect the Portfolio’s NAV for current and past reporting periods as well as total return, asset size, ratios, and portfolio turnover rate.
The first line in the table reflects the NAV per share at the beginning of the reporting period. The next line reports the net investment income/(loss) per share. Following is the per share total of net gains/(losses), realized and unrealized. Per share dividends and distributions to investors are then subtracted to arrive at the NAV per share at the end of the

Janus Aspen Janus Portfolio Useful Information About Your Portfolio Report (unaudited)
42 JUNE 30, 2016
period. The next line reflects the total return for the period. Also included are ratios of expenses and net investment income to average net assets.
The Portfolio’s expenses may be reduced through expense offsets and expense reimbursements. The ratios shown reflect expenses before and after any such offsets and reimbursements.
The ratio of net investment income/(loss) summarizes the income earned less expenses, divided by the average net assets of the Portfolio during the reporting period. Do not confuse this ratio with the Portfolio’s yield. The net investment income ratio is not a true measure of the Portfolio’s yield because it does not take into account the dividends distributed to the Portfolio’s investors.
The next figure is the portfolio turnover rate, which measures the buying and selling activity in the Portfolio. Portfolio turnover is affected by market conditions, changes in the asset size of the Portfolio, fluctuating volume of shareholder purchase and redemption orders, the nature of the Portfolio’s investments, and the investment style and/or outlook of the portfolio manager(s) and/or investment personnel. A 100% rate implies that an amount equal to the value of the entire portfolio was replaced once during the fiscal year; a 50% rate means that an amount equal to the value of half the portfolio is traded in a year; and a 200% rate means that an amount equal to the value of the entire portfolio is traded every six months.
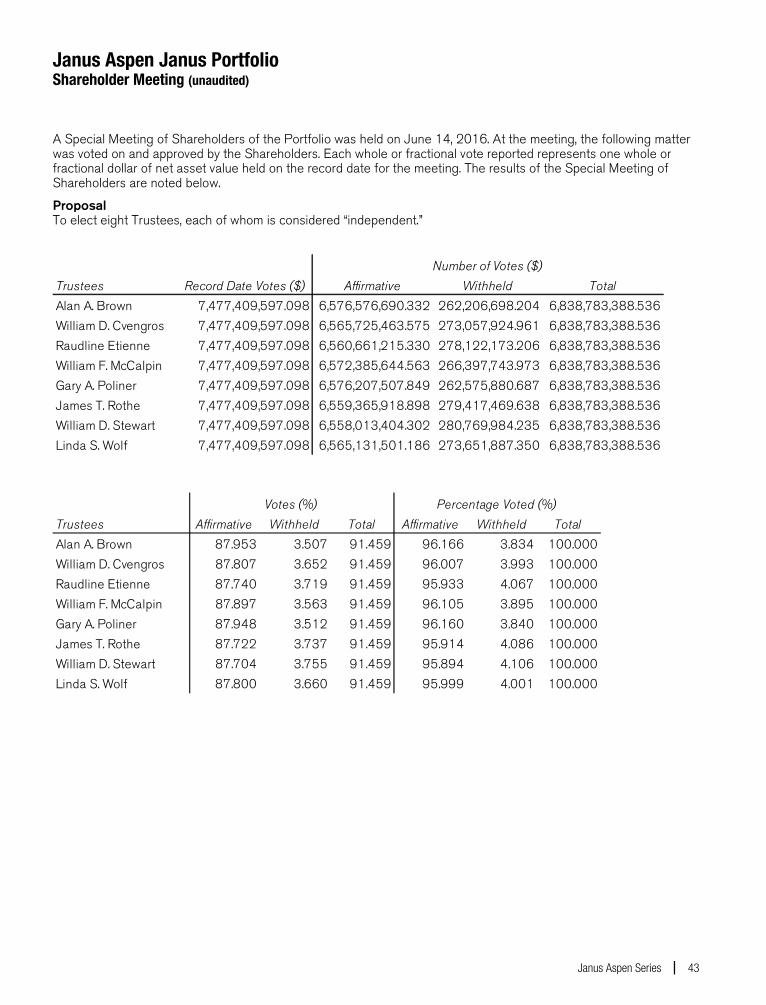
Janus Aspen Janus Portfolio Shareholder Meeting (unaudited)
Janus Aspen Series 43
A Special Meeting of Shareholders of the Portfolio was held on June 14, 2016. At the meeting, the following matter was voted on and approved by the Shareholders. Each whole or fractional vote reported represents one whole or fractional dollar of net asset value held on the record date for the meeting. The results of the Special Meeting of Shareholders are noted below.
Proposal To elect eight Trustees, each of whom is considered “independent.”
Trustees Record Date Votes ($) Affirmative Withheld TotalAlan A. Brown 7,477,409,597.098 6,576,576,690.332 262,206,698.204 6,838,783,388.536William D. Cvengros 7,477,409,597.098 6,565,725,463.575 273,057,924.961 6,838,783,388.536Raudline Etienne 7,477,409,597.098 6,560,661,215.330 278,122,173.206 6,838,783,388.536William F. McCalpin 7,477,409,597.098 6,572,385,644.563 266,397,743.973 6,838,783,388.536Gary A. Poliner 7,477,409,597.098 6,576,207,507.849 262,575,880.687 6,838,783,388.536James T. Rothe 7,477,409,597.098 6,559,365,918.898 279,417,469.638 6,838,783,388.536William D. Stewart 7,477,409,597.098 6,558,013,404.302 280,769,984.235 6,838,783,388.536Linda S. Wolf 7,477,409,597.098 6,565,131,501.186 273,651,887.350 6,838,783,388.536
Number of Votes ($)
Trustees Affirmative Withheld Total Affirmative Withheld TotalAlan A. Brown 87.953 3.507 91.459 96.166 3.834 100.000William D. Cvengros 87.807 3.652 91.459 96.007 3.993 100.000Raudline Etienne 87.740 3.719 91.459 95.933 4.067 100.000William F. McCalpin 87.897 3.563 91.459 96.105 3.895 100.000Gary A. Poliner 87.948 3.512 91.459 96.160 3.840 100.000James T. Rothe 87.722 3.737 91.459 95.914 4.086 100.000William D. Stewart 87.704 3.755 91.459 95.894 4.106 100.000Linda S. Wolf 87.800 3.660 91.459 95.999 4.001 100.000
Votes (%) Percentage Voted (%)

Janus Aspen Janus Portfolio Notes
44 JUNE 30, 2016
NotesPage1

Janus Aspen Janus Portfolio Notes
Janus Aspen Series 45
NotesPage2
Janus provides access to a wide range of investment disciplines. Alternative Janus alternative funds seek to deliver strong risk-adjusted returns over a full market cycle with lower correlation to equity markets than traditional investments.
Asset Allocation Janus’ asset allocation funds utilize our fundamental, bottom-up research to balance risk over the long term. From fund options that meet investors’ risk tolerance and objectives to a method that incorporates non-traditional investment choices to seek non-correlated sources of risk and return, Janus’ asset allocation funds aim to allocate risk more effectively.
Fixed Income Janus fixed income funds attempt to provide less risk relative to equities while seeking to deliver a competitive total return through high current income and appreciation. Janus money market funds seek capital preservation and liquidity with current income as a secondary objective.
Global & International Janus global and international funds seek to leverage Janus’ research capabilities by taking advantage of inefficiencies in foreign markets, where accurate information and analytical insight are often at a premium.
Growth & Core Janus growth funds focus on companies believed to be the leaders in their respective industries, with solid management teams, expanding market share, margins and efficiencies. Janus core funds seek investments in more stable and predictable companies. Our core funds look for a strategic combination of steady growth and, for certain funds, some degree of income.
Mathematical Our mathematical funds seek to outperform their respective indices while maintaining a risk profile equal to or lower than the index itself. Managed by INTECH® (a Janus subsidiary), these funds use a mathematical process in an attempt to build a more “efficient” portfolio than the index.
Value Our value funds, managed by Perkins® (a Janus subsidiary), seek to identify companies with favorable reward to risk characteristics by conducting rigorous downside analysis before determining upside potential.
For more information about our funds, contact your investment professional or go to janus.com/variable-insurance.
Please consider the charges, risks, expenses and investment objectives carefully before investing. For a prospectus or, if available, a summary prospectus containing this and other information, please call Janus at 877.33JANUS (52687) or download the file from janus.com/variable-insurance. Read it carefully before you invest or send money. Janus, INTECH and Perkins are registered trademarks of Janus International Holding LLC. © Janus International Holding LLC.
Funds distributed by Janus Distributors LLC
Investment products offered are: NOT FDIC-INSURED MAY LOSE VALUE NO BANK GUARANTEE
C-0816-3724 109-24-81111 08-16
SEMIANNUAL REPORT June 30, 2016
Janus Aspen Enterprise Portfolio
Janus Aspen Series
HIGHLIGHTS
• Portfolio management perspective • Investment strategy behind your portfolio • Portfolio performance, characteristics
and holdings
Table of Contents
Janus Aspen Enterprise Portfolio Management Commentary and Schedule of Investments ............................1 Notes to Schedule of Investments and Other Information........................ 12 Statement of Assets and Liabilities ............................................................................. 14 Statement of Operations ...................................................................................................... 15 Statements of Changes in Net Assets...................................................................... 16 Financial Highlights .................................................................................................................. 17 Notes to Financial Statements ........................................................................................ 18 Additional Information............................................................................................................. 29 Useful Information About Your Portfolio Report ............................................... 41 Shareholder Meeting ............................................................................................................... 44
Janus Aspen Enterprise Portfolio (unaudited)
Janus Aspen Series 1
PORTFOLIO SNAPSHOT We believe that investing in companies with sustainable growth and high return on invested capital, can drive consistent returns and allow us to outperform our benchmark and peers over time with moderate risk. We seek to identify mid cap companies with high quality management teams that wisely allocate capital to fund and drive growth over time.
Brian Demain portfolio manager
PERFORMANCE OVERVIEW During the six-months ended June 30, 2016, Janus Aspen Enterprise Portfolio’s Institutional Shares and Service Shares returned 5.55% and 5.44%, respectively. Meanwhile, the Portfolio’s benchmark, the Russell Midcap Growth Index, returned 2.15%.
INVESTMENT ENVIRONMENT After recovering from a winter correction, U.S. stocks traded narrowly for much of the period. Steady retail sales along with a key manufacturing survey’s return to expansion territory helped push markets higher. Stocks were jolted late in the period by the UK electorate’s surprise decision to leave the European Union. The market sold off sharply as capital flowed into safe-haven securities. In the final days of the period, however, U.S. shares recaptured much of their post-Brexit slide.
On a sector basis, energy performed well on the back of higher crude oil prices. Defensive sectors also generated positive returns, while cyclical sectors lagged. After having declined sharply on late-period Brexit news, financials recovered lost ground in June’s final trading sessions.
PERFORMANCE DISCUSSION Our Portfolio tends to emphasize companies that we believe have more predictable business models, recurring revenue streams and strong competitive positioning that enables them to take market share and experience sustainable, long-term growth. We believe this focus should help the Portfolio outperform when markets are down and drive relative outperformance over full market cycles.
The Portfolio outperformed its benchmark, the Russell Midcap Growth Index. Heading into the period, we were underweight consumer discretionary due to our cautious view on U.S. retail stocks. Our concerns came to fruition as several major retailers announced weaker than expected earnings. Stocks in consumer staples fared better than cyclical sectors as investors sought safe-
havens following the Brexit vote. While our underweight in consumer staples detracted somewhat from returns, many of the stocks we own exhibit the same defensive characteristics as consumer staples companies, but with the potential for better top-line growth.
Our investment in Ritchie Bros. Auctioneers was a strong contributor to the performance of the Portfolio. The company conducts worldwide public auctions of heavy industrial equipment used in construction, transportation and agriculture. A few years ago, Ritchie Bros. brought in a new CEO who has restructured incentives for its sales force. The company has grown in profitability by adding services that have enabled it to expand its commissions on auctioned items. We remain constructive on the stock as we expect the company to continue to grow its gross auction proceeds at a healthy pace. We also like the fact that Ritchie Bros. can generate business in both up and down markets: In up markets, companies need to buy heavy equipment in order to expand; in down markets, companies need to sell equipment that’s not being used. For this reason, the company’s business cycle is less linked to that of the overall economy.
Crown Castle International Corp. was a top contributor to the Portfolio. The company provides infrastructure for broadcasting and mobile telephony, including wireless cellphone towers. Crown Castle has grown significantly following the explosion in demand from cellphone users for data. During the period, Crown Castle’s shares were helped by the company's expansion of small-cell solutions, which will enable it to increase its network capacity.
Boston Scientific was another strong performer for the Portfolio. We are excited about the company's new management, which has led Boston Scientific to its strongest quarter of organic revenue growth in more than a decade, driven largely by sales in the company’s cardiovascular and medical surgery product divisions. During the period, Boston Scientific reported stronger than expected earnings, and also received FDA approval
Janus Aspen Enterprise Portfolio (unaudited)
2 JUNE 30, 2016
of its Watchman heart valve device, which offers an innovative alternative to long-term blood thinner therapy. We remain positive on the stock as we expect continued earnings growth and improving margins over the next several years.
The Portfolio's top detractor was LPL Financial, which provides an integrated platform of brokerage and investment advisory services to independent financial advisors and financial advisors at financial institutions. The stock fell early this year after the company reported weaker than expected earnings. LPL’s share price also suffered due to compliance difficulties and fines associated with its out-of-date operational technology systems, as well as from regulatory concerns related to certain parts of its business model. We continue to like the stock as we think increased regulatory oversight of the financial advisory industry plays in the company’s favor.
Also detracting from returns was our investment in Sensata Technologies, a producer of sensors and controls used in automotive, appliance, aircraft and industrial manufacturing. Sensata’s share price fell in the first quarter due to a slowdown in auto sales. In addition, Sensata had lower than expected earnings, driven by weakness in its sensor and control business, which is closely linked to consumer electronics. We expect moderate growth to continue at Sensata, fueled in part by the long-term trend of increasing sensor content in automobiles and other industrial applications. The company has demonstrated its ability to grow through full market cycles, and we believe it is poised to continue that record. For these reasons, and because of its compelling valuation, we continue to hold our shares.
Our investment in SS&C Technologies Inc. was our third-largest detractor. The company, which is a third party administrator for asset managers, announced weaker than expected organic revenue growth during the period. SS&C has suffered on concerns about the viability of the hedge fund industry, which represents its largest customer segment. Hedge funds have struggled to justify their fees in an environment in which performance has been generally lackluster. Though the problems facing the company’s hedge fund clients are significant, we remain confident in SS&C’s ability to take market share and acquire smaller players as the segment consolidates and matures.
Please see the Derivative Instruments section in the “Notes to Financial Statements” for a discussion of derivatives used by the Portfolio.
OUTLOOK Given the rising tide of populism and quickly changing dynamics in the broader business environment, we have become more cautious in our outlook. We will continue to focus on identifying companies with sustainable growth prospects, competitive advantages, good management teams and reasonable valuations. As the business environment has become more challenging, we have increased our focus on companies that balance the needs of their different constituencies. Rather than investing in companies that are being run only for shareholders at the expense of employees and customers, we’re seeking sustainable businesses that balance the needs of all three constituencies. These firms are likely to be more stable, and are less likely to face labor disputes, regulatory strife and customer backlashes. Our view is that, in a difficult environment, companies with strong competitive positions that adhere to our valuation discipline should be better able to weather market volatility.
Thank you for your investment in Janus Aspen Enterprise Portfolio.
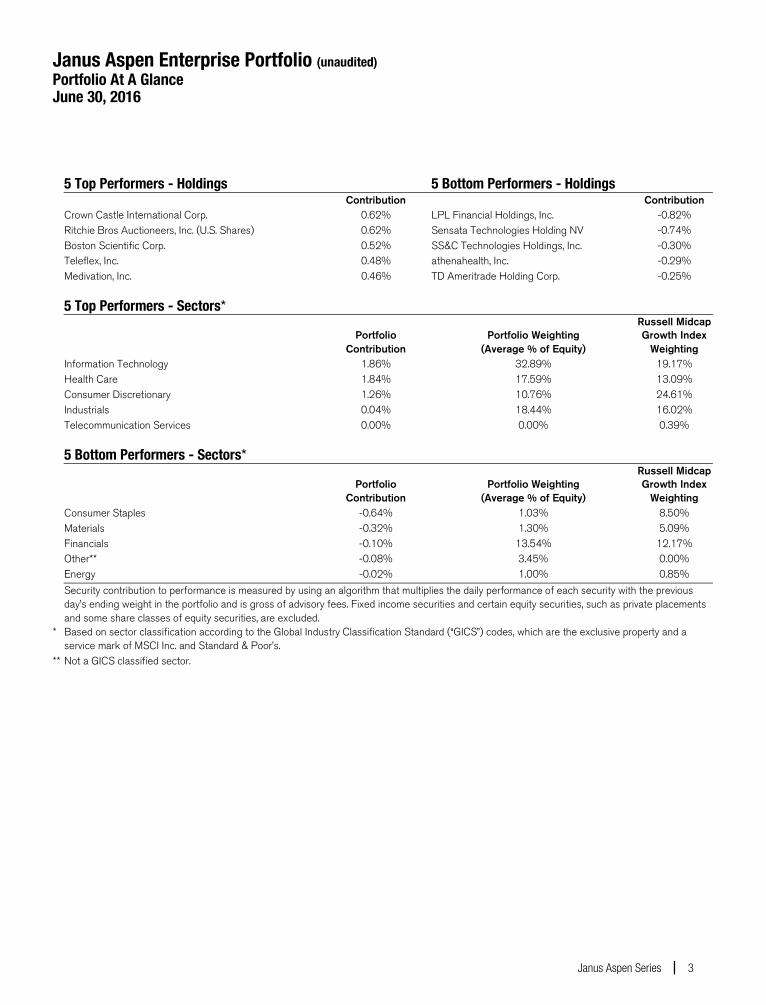
Janus Aspen Enterprise Portfolio (unaudited) Portfolio At A Glance June 30, 2016
Janus Aspen Series 3
5 Top Performers - Holdings 5 Bottom Performers - Holdings Contribution Contribution Crown Castle International Corp. 0.62% LPL Financial Holdings, Inc. -0.82% Ritchie Bros Auctioneers, Inc. (U.S. Shares) 0.62% Sensata Technologies Holding NV -0.74% Boston Scientific Corp. 0.52% SS&C Technologies Holdings, Inc. -0.30% Teleflex, Inc. 0.48% athenahealth, Inc. -0.29% Medivation, Inc. 0.46% TD Ameritrade Holding Corp. -0.25%
5 Top Performers - Sectors*
Portfolio Portfolio Weighting Russell Midcap Growth Index
Contribution (Average % of Equity) Weighting Information Technology 1.86% 32.89% 19.17% Health Care 1.84% 17.59% 13.09% Consumer Discretionary 1.26% 10.76% 24.61% Industrials 0.04% 18.44% 16.02% Telecommunication Services 0.00% 0.00% 0.39% 5 Bottom Performers - Sectors*
Portfolio Portfolio Weighting Russell Midcap Growth Index
Contribution (Average % of Equity) Weighting Consumer Staples -0.64% 1.03% 8.50% Materials -0.32% 1.30% 5.09% Financials -0.10% 13.54% 12.17% Other** -0.08% 3.45% 0.00% Energy -0.02% 1.00% 0.85%
Security contribution to performance is measured by using an algorithm that multiplies the daily performance of each security with the previous day’s ending weight in the portfolio and is gross of advisory fees. Fixed income securities and certain equity securities, such as private placements and some share classes of equity securities, are excluded.
* Based on sector classification according to the Global Industry Classification Standard (“GICS”) codes, which are the exclusive property and a service mark of MSCI Inc. and Standard & Poor’s.
** Not a GICS classified sector.
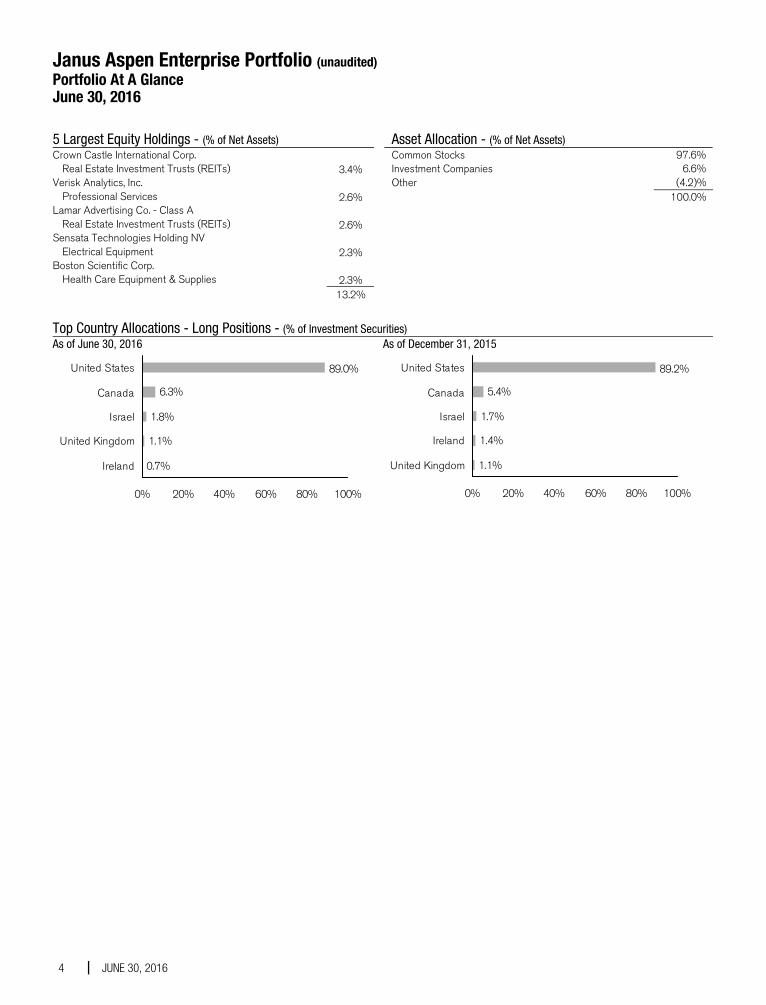
Janus Aspen Enterprise Portfolio (unaudited) Portfolio At A Glance June 30, 2016
4 JUNE 30, 2016
5 Largest Equity Holdings - (% of Net Assets) Crown Castle International Corp.
Real Estate Investment Trusts (REITs) 3.4% Verisk Analytics, Inc.
Professional Services 2.6% Lamar Advertising Co. - Class A
Real Estate Investment Trusts (REITs) 2.6% Sensata Technologies Holding NV
Electrical Equipment 2.3% Boston Scientific Corp.
Health Care Equipment & Supplies 2.3% 13.2%
Asset Allocation - (% of Net Assets) Common Stocks 97.6% Investment Companies 6.6% Other (4.2)% 100.0%
Top Country Allocations - Long Positions - (% of Investment Securities) As of June 30, 2016
6.3%
1.8%
1.1%
0.7%
89.0%
0% 20% 40% 60% 80% 100%
United States
Canada
Israel
United Kingdom
Ireland
As of December 31, 2015
5.4%
1.7%
1.4%
1.1%
89.2%
0% 20% 40% 60% 80% 100%
United States
Canada
Israel
Ireland
United Kingdom
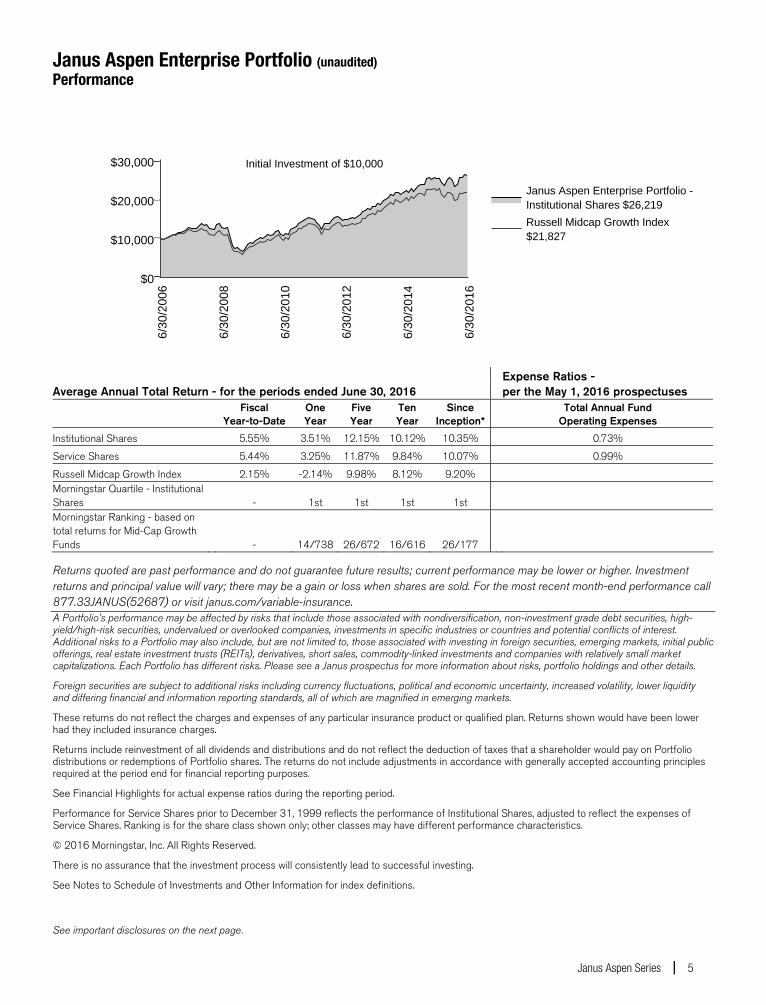
Janus Aspen Enterprise Portfolio (unaudited) Performance
Janus Aspen Series 5
Expense Ratios - Average Annual Total Return - for the periods ended June 30, 2016 per the May 1, 2016 prospectuses
Fiscal
Year-to-Date One Year
Five Year
Ten Year
Since Inception*
Total Annual Fund Operating Expenses
Institutional Shares 5.55% 3.51% 12.15% 10.12% 10.35% 0.73%
Service Shares 5.44% 3.25% 11.87% 9.84% 10.07% 0.99%
Russell Midcap Growth Index 2.15% -2.14% 9.98% 8.12% 9.20% Morningstar Quartile - Institutional Shares - 1st 1st 1st 1st Morningstar Ranking - based on total returns for Mid-Cap Growth Funds - 14/738 26/672 16/616 26/177
Returns quoted are past performance and do not guarantee future results; current performance may be lower or higher. Investment returns and principal value will vary; there may be a gain or loss when shares are sold. For the most recent month-end performance call 877.33JANUS(52687) or visit janus.com/variable-insurance. A Portfolio's performance may be affected by risks that include those associated with nondiversification, non-investment grade debt securities, high-yield/high-risk securities, undervalued or overlooked companies, investments in specific industries or countries and potential conflicts of interest. Additional risks to a Portfolio may also include, but are not limited to, those associated with investing in foreign securities, emerging markets, initial public offerings, real estate investment trusts (REITs), derivatives, short sales, commodity-linked investments and companies with relatively small market capitalizations. Each Portfolio has different risks. Please see a Janus prospectus for more information about risks, portfolio holdings and other details.
Foreign securities are subject to additional risks including currency fluctuations, political and economic uncertainty, increased volatility, lower liquidity and differing financial and information reporting standards, all of which are magnified in emerging markets.
These returns do not reflect the charges and expenses of any particular insurance product or qualified plan. Returns shown would have been lower had they included insurance charges.
Returns include reinvestment of all dividends and distributions and do not reflect the deduction of taxes that a shareholder would pay on Portfolio distributions or redemptions of Portfolio shares. The returns do not include adjustments in accordance with generally accepted accounting principles required at the period end for financial reporting purposes.
See Financial Highlights for actual expense ratios during the reporting period.
Performance for Service Shares prior to December 31, 1999 reflects the performance of Institutional Shares, adjusted to reflect the expenses of Service Shares. Ranking is for the share class shown only; other classes may have different performance characteristics.
© 2016 Morningstar, Inc. All Rights Reserved.
There is no assurance that the investment process will consistently lead to successful investing.
See Notes to Schedule of Investments and Other Information for index definitions.
See important disclosures on the next page.

Janus Aspen Enterprise Portfolio (unaudited) Performance
6 JUNE 30, 2016
A Portfolio's holdings may differ significantly from the securities held in an index. An index is unmanaged and not available for direct investment; therefore, its performance does not reflect the expenses associated with the active management of an actual portfolio.
See “Useful Information About Your Portfolio Report.” * The Portfolio’s inception date – September 13, 1993
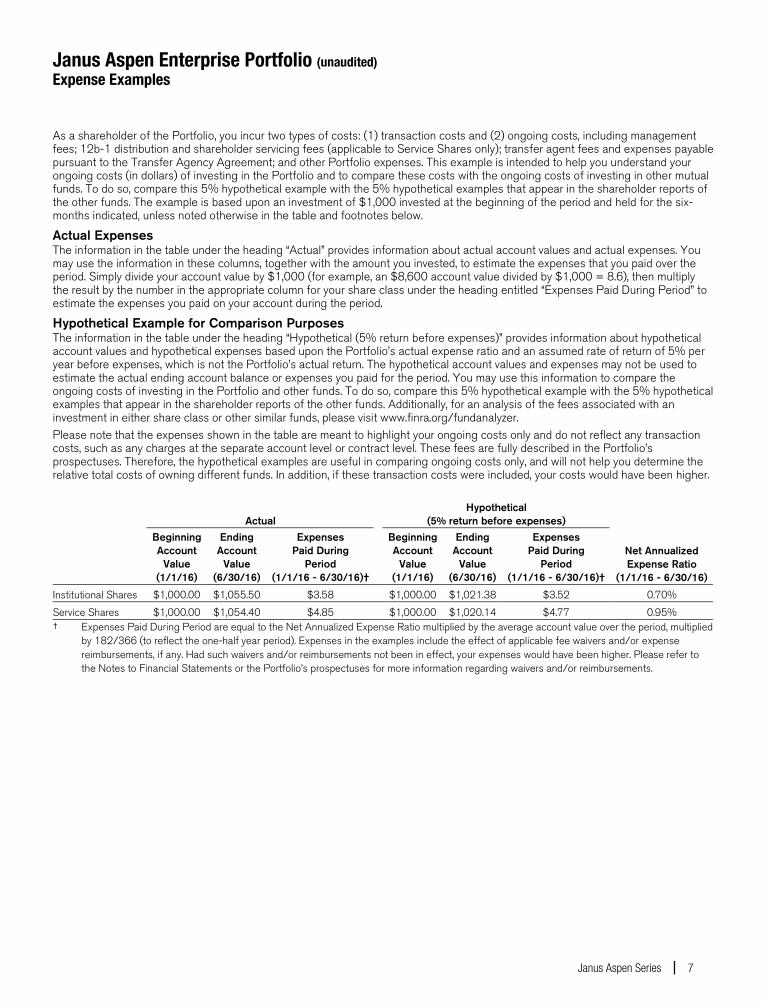
Janus Aspen Enterprise Portfolio (unaudited) Expense Examples
Janus Aspen Series 7
As a shareholder of the Portfolio, you incur two types of costs: (1) transaction costs and (2) ongoing costs, including management fees; 12b-1 distribution and shareholder servicing fees (applicable to Service Shares only); transfer agent fees and expenses payable pursuant to the Transfer Agency Agreement; and other Portfolio expenses. This example is intended to help you understand your ongoing costs (in dollars) of investing in the Portfolio and to compare these costs with the ongoing costs of investing in other mutual funds. To do so, compare this 5% hypothetical example with the 5% hypothetical examples that appear in the shareholder reports of the other funds. The example is based upon an investment of $1,000 invested at the beginning of the period and held for the six-months indicated, unless noted otherwise in the table and footnotes below.
Actual Expenses The information in the table under the heading “Actual” provides information about actual account values and actual expenses. You may use the information in these columns, together with the amount you invested, to estimate the expenses that you paid over the period. Simply divide your account value by $1,000 (for example, an $8,600 account value divided by $1,000 = 8.6), then multiply the result by the number in the appropriate column for your share class under the heading entitled “Expenses Paid During Period” to estimate the expenses you paid on your account during the period.
Hypothetical Example for Comparison Purposes The information in the table under the heading “Hypothetical (5% return before expenses)” provides information about hypothetical account values and hypothetical expenses based upon the Portfolio’s actual expense ratio and an assumed rate of return of 5% per year before expenses, which is not the Portfolio’s actual return. The hypothetical account values and expenses may not be used to estimate the actual ending account balance or expenses you paid for the period. You may use this information to compare the ongoing costs of investing in the Portfolio and other funds. To do so, compare this 5% hypothetical example with the 5% hypothetical examples that appear in the shareholder reports of the other funds. Additionally, for an analysis of the fees associated with an investment in either share class or other similar funds, please visit www.finra.org/fundanalyzer. Please note that the expenses shown in the table are meant to highlight your ongoing costs only and do not reflect any transaction costs, such as any charges at the separate account level or contract level. These fees are fully described in the Portfolio’s prospectuses. Therefore, the hypothetical examples are useful in comparing ongoing costs only, and will not help you determine the relative total costs of owning different funds. In addition, if these transaction costs were included, your costs would have been higher.
Actual Hypothetical
(5% return before expenses)
Beginning Account
Value (1/1/16)
Ending Account
Value (6/30/16)
Expenses Paid During
Period (1/1/16 - 6/30/16)†
BeginningAccount
Value (1/1/16)
Ending Account
Value (6/30/16)
Expenses Paid During
Period (1/1/16 - 6/30/16)†
Net Annualized Expense Ratio
(1/1/16 - 6/30/16)
Institutional Shares $1,000.00 $1,055.50 $3.58 $1,000.00 $1,021.38 $3.52 0.70%
Service Shares $1,000.00 $1,054.40 $4.85 $1,000.00 $1,020.14 $4.77 0.95% † Expenses Paid During Period are equal to the Net Annualized Expense Ratio multiplied by the average account value over the period, multiplied
by 182/366 (to reflect the one-half year period). Expenses in the examples include the effect of applicable fee waivers and/or expense reimbursements, if any. Had such waivers and/or reimbursements not been in effect, your expenses would have been higher. Please refer to the Notes to Financial Statements or the Portfolio’s prospectuses for more information regarding waivers and/or reimbursements.
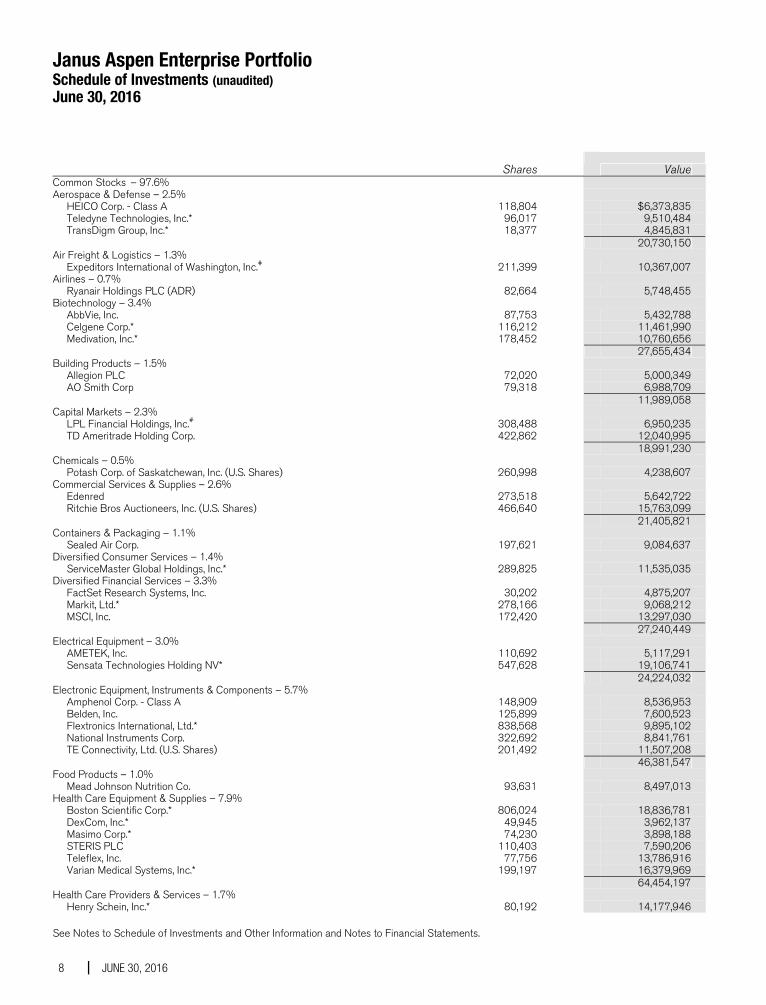
Janus Aspen Enterprise Portfolio Schedule of Investments (unaudited) June 30, 2016
See Notes to Schedule of Investments and Other Information and Notes to Financial Statements.
8 JUNE 30, 2016
Shares
Value Common Stocks – 97.6% Aerospace & Defense – 2.5% HEICO Corp. - Class A 118,804 $6,373,835 Teledyne Technologies, Inc.* 96,017 9,510,484 TransDigm Group, Inc.* 18,377 4,845,831 20,730,150Air Freight & Logistics – 1.3% Expeditors International of Washington, Inc.# 211,399 10,367,007Airlines – 0.7% Ryanair Holdings PLC (ADR) 82,664 5,748,455Biotechnology – 3.4% AbbVie, Inc. 87,753 5,432,788 Celgene Corp.* 116,212 11,461,990 Medivation, Inc.* 178,452 10,760,656 27,655,434Building Products – 1.5% Allegion PLC 72,020 5,000,349 AO Smith Corp 79,318 6,988,709 11,989,058Capital Markets – 2.3% LPL Financial Holdings, Inc.# 308,488 6,950,235 TD Ameritrade Holding Corp. 422,862 12,040,995 18,991,230Chemicals – 0.5% Potash Corp. of Saskatchewan, Inc. (U.S. Shares) 260,998 4,238,607Commercial Services & Supplies – 2.6% Edenred 273,518 5,642,722 Ritchie Bros Auctioneers, Inc. (U.S. Shares) 466,640 15,763,099 21,405,821Containers & Packaging – 1.1% Sealed Air Corp. 197,621 9,084,637Diversified Consumer Services – 1.4% ServiceMaster Global Holdings, Inc.* 289,825 11,535,035Diversified Financial Services – 3.3% FactSet Research Systems, Inc. 30,202 4,875,207 Markit, Ltd.* 278,166 9,068,212 MSCI, Inc. 172,420 13,297,030 27,240,449Electrical Equipment – 3.0% AMETEK, Inc. 110,692 5,117,291 Sensata Technologies Holding NV* 547,628 19,106,741 24,224,032Electronic Equipment, Instruments & Components – 5.7% Amphenol Corp. - Class A 148,909 8,536,953 Belden, Inc. 125,899 7,600,523 Flextronics International, Ltd.* 838,568 9,895,102 National Instruments Corp. 322,692 8,841,761 TE Connectivity, Ltd. (U.S. Shares) 201,492 11,507,208 46,381,547Food Products – 1.0% Mead Johnson Nutrition Co. 93,631 8,497,013Health Care Equipment & Supplies – 7.9% Boston Scientific Corp.* 806,024 18,836,781 DexCom, Inc.* 49,945 3,962,137 Masimo Corp.* 74,230 3,898,188 STERIS PLC 110,403 7,590,206 Teleflex, Inc. 77,756 13,786,916 Varian Medical Systems, Inc.* 199,197 16,379,969 64,454,197Health Care Providers & Services – 1.7% Henry Schein, Inc.* 80,192 14,177,946
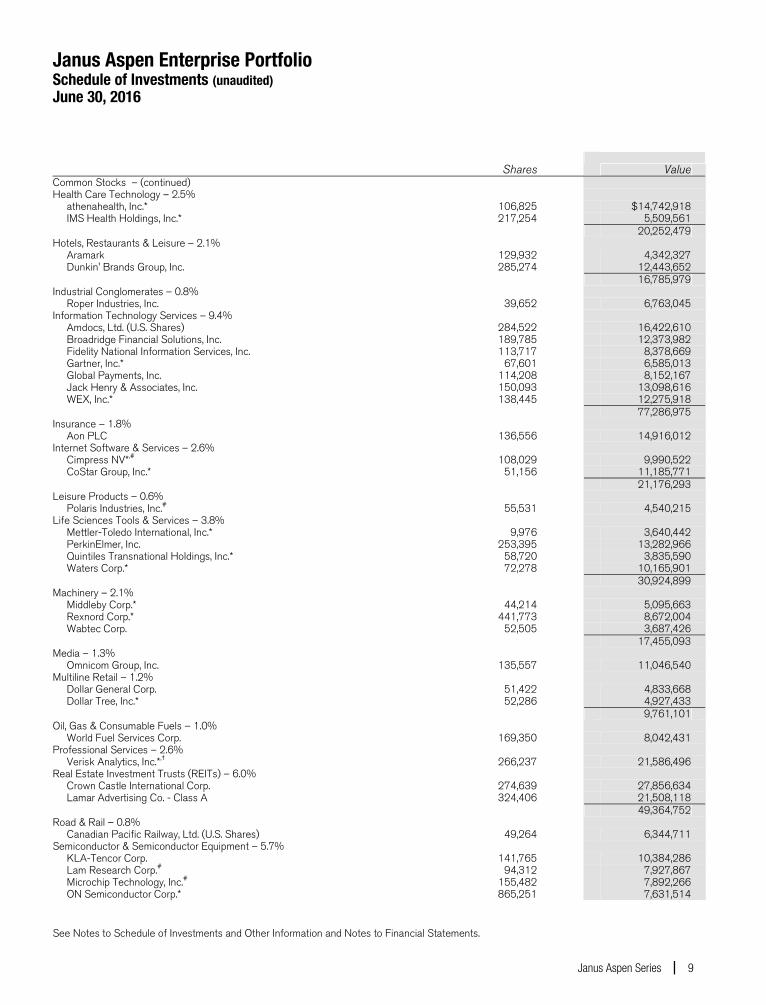
Janus Aspen Enterprise Portfolio Schedule of Investments (unaudited) June 30, 2016
See Notes to Schedule of Investments and Other Information and Notes to Financial Statements.
Janus Aspen Series 9
Shares
Value Common Stocks – (continued) Health Care Technology – 2.5% athenahealth, Inc.* 106,825 $14,742,918 IMS Health Holdings, Inc.* 217,254 5,509,561 20,252,479Hotels, Restaurants & Leisure – 2.1% Aramark 129,932 4,342,327 Dunkin' Brands Group, Inc. 285,274 12,443,652 16,785,979Industrial Conglomerates – 0.8% Roper Industries, Inc. 39,652 6,763,045Information Technology Services – 9.4% Amdocs, Ltd. (U.S. Shares) 284,522 16,422,610 Broadridge Financial Solutions, Inc. 189,785 12,373,982 Fidelity National Information Services, Inc. 113,717 8,378,669 Gartner, Inc.* 67,601 6,585,013 Global Payments, Inc. 114,208 8,152,167 Jack Henry & Associates, Inc. 150,093 13,098,616 WEX, Inc.* 138,445 12,275,918 77,286,975Insurance – 1.8% Aon PLC 136,556 14,916,012Internet Software & Services – 2.6% Cimpress NV*,# 108,029 9,990,522 CoStar Group, Inc.* 51,156 11,185,771 21,176,293Leisure Products – 0.6% Polaris Industries, Inc.# 55,531 4,540,215Life Sciences Tools & Services – 3.8% Mettler-Toledo International, Inc.* 9,976 3,640,442 PerkinElmer, Inc. 253,395 13,282,966 Quintiles Transnational Holdings, Inc.* 58,720 3,835,590 Waters Corp.* 72,278 10,165,901 30,924,899Machinery – 2.1% Middleby Corp.* 44,214 5,095,663 Rexnord Corp.* 441,773 8,672,004 Wabtec Corp. 52,505 3,687,426 17,455,093Media – 1.3% Omnicom Group, Inc. 135,557 11,046,540Multiline Retail – 1.2% Dollar General Corp. 51,422 4,833,668 Dollar Tree, Inc.* 52,286 4,927,433 9,761,101Oil, Gas & Consumable Fuels – 1.0% World Fuel Services Corp. 169,350 8,042,431Professional Services – 2.6% Verisk Analytics, Inc.*,† 266,237 21,586,496Real Estate Investment Trusts (REITs) – 6.0% Crown Castle International Corp. 274,639 27,856,634 Lamar Advertising Co. - Class A 324,406 21,508,118 49,364,752Road & Rail – 0.8% Canadian Pacific Railway, Ltd. (U.S. Shares) 49,264 6,344,711Semiconductor & Semiconductor Equipment – 5.7% KLA-Tencor Corp. 141,765 10,384,286 Lam Research Corp.# 94,312 7,927,867 Microchip Technology, Inc.# 155,482 7,892,266 ON Semiconductor Corp.* 865,251 7,631,514
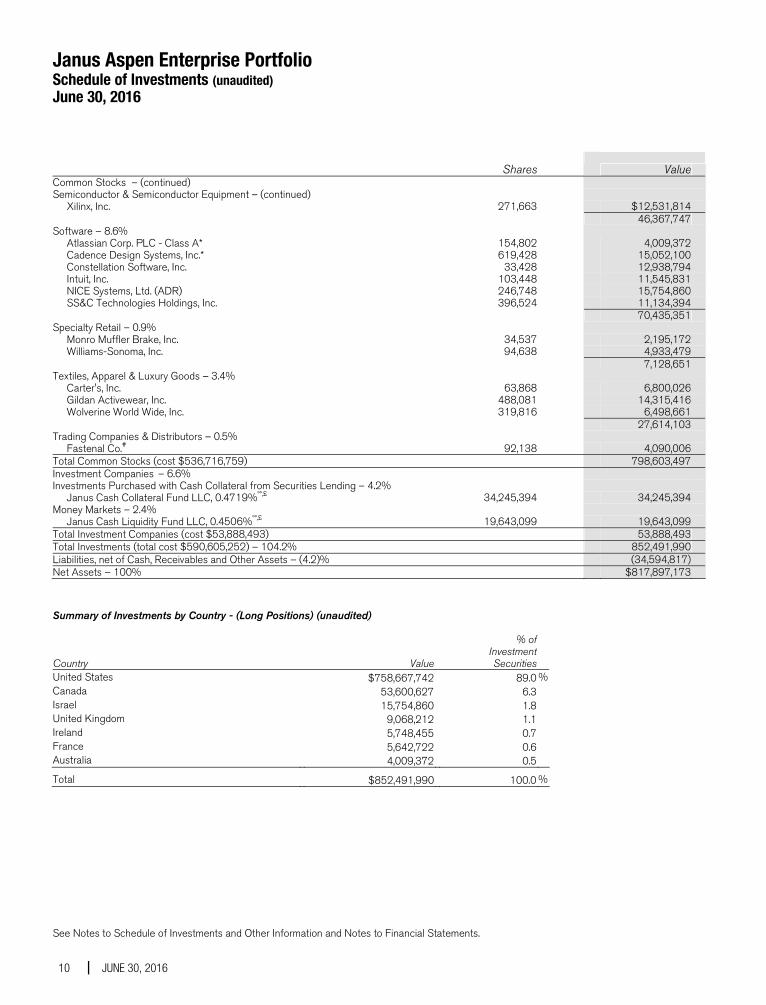
Janus Aspen Enterprise Portfolio Schedule of Investments (unaudited) June 30, 2016
See Notes to Schedule of Investments and Other Information and Notes to Financial Statements.
10 JUNE 30, 2016
Shares
Value Common Stocks – (continued) Semiconductor & Semiconductor Equipment – (continued) Xilinx, Inc. 271,663 $12,531,814 46,367,747Software – 8.6% Atlassian Corp. PLC - Class A* 154,802 4,009,372 Cadence Design Systems, Inc.* 619,428 15,052,100 Constellation Software, Inc. 33,428 12,938,794 Intuit, Inc. 103,448 11,545,831 NICE Systems, Ltd. (ADR) 246,748 15,754,860 SS&C Technologies Holdings, Inc. 396,524 11,134,394 70,435,351Specialty Retail – 0.9% Monro Muffler Brake, Inc. 34,537 2,195,172 Williams-Sonoma, Inc. 94,638 4,933,479 7,128,651Textiles, Apparel & Luxury Goods – 3.4% Carter's, Inc. 63,868 6,800,026 Gildan Activewear, Inc. 488,081 14,315,416 Wolverine World Wide, Inc. 319,816 6,498,661 27,614,103Trading Companies & Distributors – 0.5% Fastenal Co.# 92,138 4,090,006Total Common Stocks (cost $536,716,759) 798,603,497Investment Companies – 6.6% Investments Purchased with Cash Collateral from Securities Lending – 4.2% Janus Cash Collateral Fund LLC, 0.4719%ºº,£ 34,245,394 34,245,394Money Markets – 2.4% Janus Cash Liquidity Fund LLC, 0.4506%ºº,£ 19,643,099 19,643,099Total Investment Companies (cost $53,888,493) 53,888,493Total Investments (total cost $590,605,252) – 104.2% 852,491,990Liabilities, net of Cash, Receivables and Other Assets – (4.2)% (34,594,817)Net Assets – 100% $817,897,173 Summary of Investments by Country - (Long Positions) (unaudited) % of Investment Country Value Securities United States $758,667,742 89.0 % Canada 53,600,627 6.3 Israel 15,754,860 1.8 United Kingdom 9,068,212 1.1 Ireland 5,748,455 0.7 France 5,642,722 0.6 Australia 4,009,372 0.5
Total $852,491,990 100.0 %
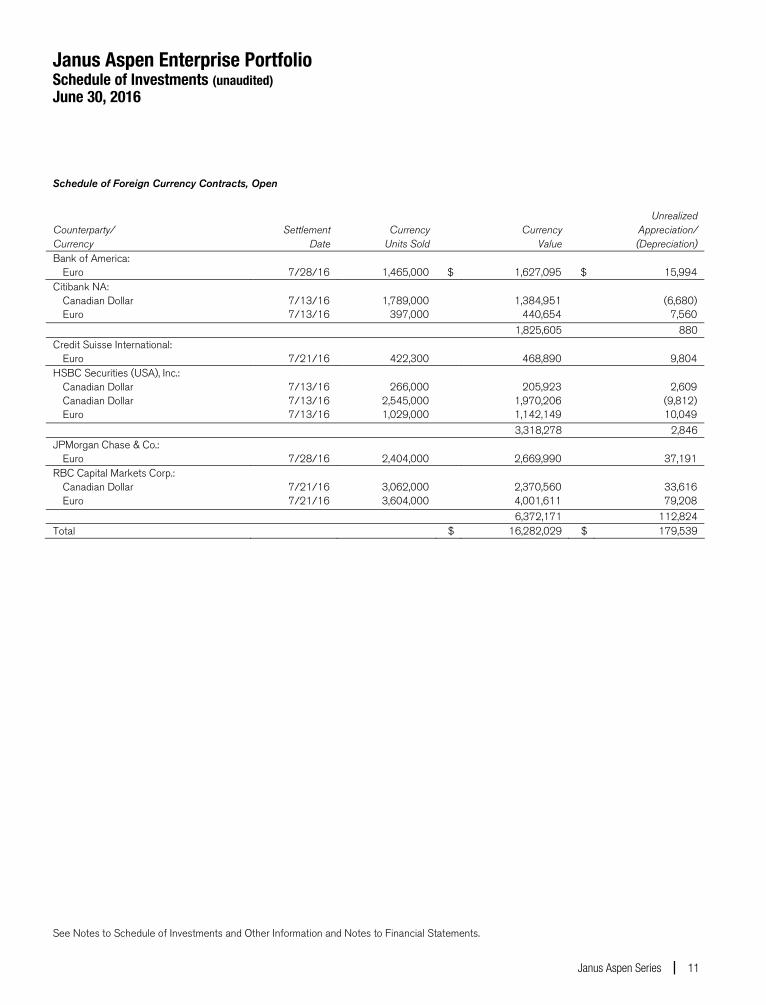
Janus Aspen Enterprise Portfolio Schedule of Investments (unaudited) June 30, 2016
See Notes to Schedule of Investments and Other Information and Notes to Financial Statements.
Janus Aspen Series 11
Schedule of Foreign Currency Contracts, Open
Counterparty/ Currency
Settlement Date
Currency Units Sold
Currency Value
Unrealized Appreciation/ (Depreciation)
Bank of America: Euro 7/28/16 1,465,000 $ 1,627,095 $ 15,994
Citibank NA: Canadian Dollar 7/13/16 1,789,000 1,384,951 (6,680) Euro 7/13/16 397,000 440,654 7,560
1,825,605 880 Credit Suisse International:
Euro 7/21/16 422,300 468,890 9,804 HSBC Securities (USA), Inc.:
Canadian Dollar 7/13/16 266,000 205,923 2,609 Canadian Dollar 7/13/16 2,545,000 1,970,206 (9,812) Euro 7/13/16 1,029,000 1,142,149 10,049
3,318,278 2,846 JPMorgan Chase & Co.:
Euro 7/28/16 2,404,000 2,669,990 37,191 RBC Capital Markets Corp.:
Canadian Dollar 7/21/16 3,062,000 2,370,560 33,616 Euro 7/21/16 3,604,000 4,001,611 79,208
6,372,171 112,824 Total $ 16,282,029 $ 179,539
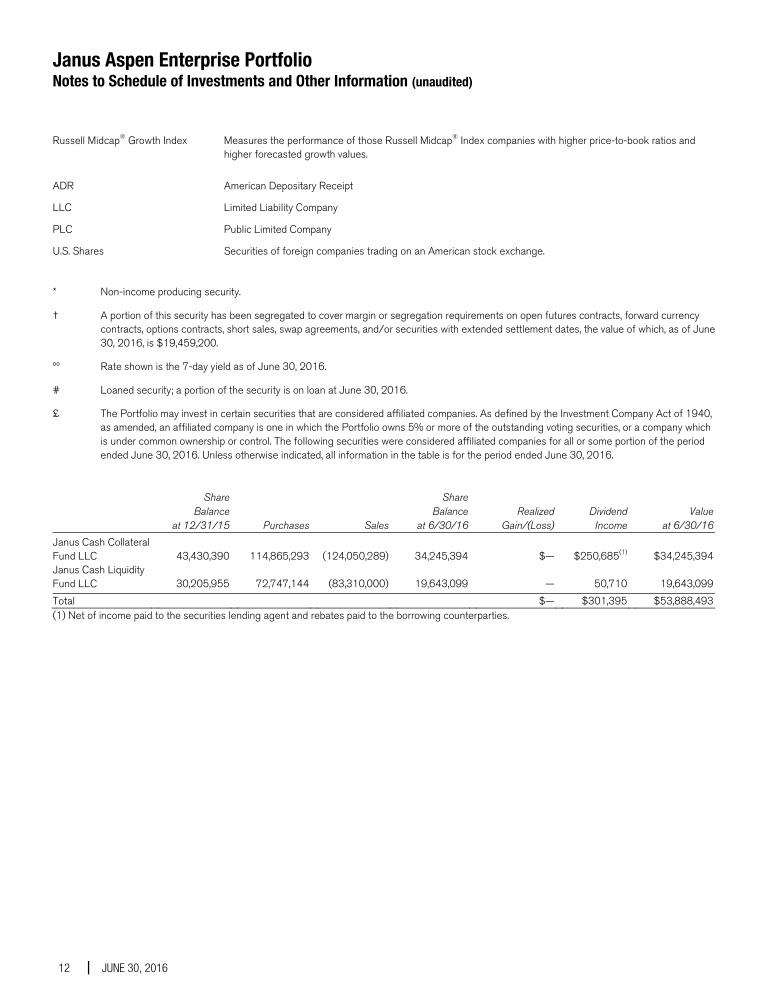
Janus Aspen Enterprise Portfolio Notes to Schedule of Investments and Other Information (unaudited)
12 JUNE 30, 2016
Russell Midcap® Growth Index Measures the performance of those Russell Midcap® Index companies with higher price-to-book ratios and higher forecasted growth values.
ADR American Depositary Receipt
LLC Limited Liability Company
PLC Public Limited Company
U.S. Shares Securities of foreign companies trading on an American stock exchange.
* Non-income producing security.
† A portion of this security has been segregated to cover margin or segregation requirements on open futures contracts, forward currency contracts, options contracts, short sales, swap agreements, and/or securities with extended settlement dates, the value of which, as of June 30, 2016, is $19,459,200.
ºº Rate shown is the 7-day yield as of June 30, 2016.
# Loaned security; a portion of the security is on loan at June 30, 2016.
£ The Portfolio may invest in certain securities that are considered affiliated companies. As defined by the Investment Company Act of 1940, as amended, an affiliated company is one in which the Portfolio owns 5% or more of the outstanding voting securities, or a company which is under common ownership or control. The following securities were considered affiliated companies for all or some portion of the period ended June 30, 2016. Unless otherwise indicated, all information in the table is for the period ended June 30, 2016.
Share Share Balance Balance Realized Dividend Value at 12/31/15 Purchases Sales at 6/30/16 Gain/(Loss) Income at 6/30/16Janus Cash Collateral Fund LLC
43,430,390 114,865,293 (124,050,289) 34,245,394 $— $250,685(1) $34,245,394
Janus Cash Liquidity Fund LLC
30,205,955 72,747,144 (83,310,000) 19,643,099 — 50,710 19,643,099
Total $— $301,395 $53,888,493(1) Net of income paid to the securities lending agent and rebates paid to the borrowing counterparties.
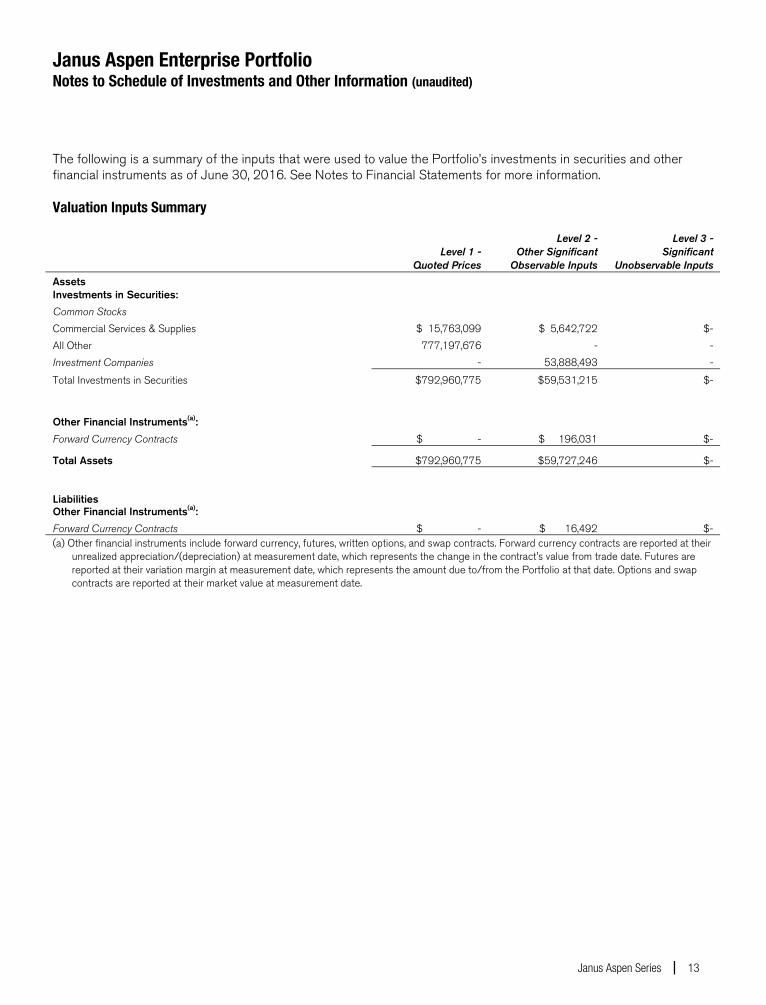
Janus Aspen Enterprise Portfolio Notes to Schedule of Investments and Other Information (unaudited)
Janus Aspen Series 13
The following is a summary of the inputs that were used to value the Portfolio’s investments in securities and other financial instruments as of June 30, 2016. See Notes to Financial Statements for more information.
Valuation Inputs Summary
Level 1 -
Quoted Prices
Level 2 - Other Significant
Observable Inputs
Level 3 - Significant
Unobservable Inputs Assets Investments in Securities: Common Stocks Commercial Services & Supplies $ 15,763,099 $ 5,642,722 $- All Other 777,197,676 - - Investment Companies - 53,888,493 -
Total Investments in Securities $792,960,775 $59,531,215 $-
Other Financial Instruments(a): Forward Currency Contracts $ - $ 196,031 $-
Total Assets $792,960,775 $59,727,246 $-
Liabilities Other Financial Instruments(a): Forward Currency Contracts $ - $ 16,492 $- (a) Other financial instruments include forward currency, futures, written options, and swap contracts. Forward currency contracts are reported at their
unrealized appreciation/(depreciation) at measurement date, which represents the change in the contract's value from trade date. Futures are reported at their variation margin at measurement date, which represents the amount due to/from the Portfolio at that date. Options and swap contracts are reported at their market value at measurement date.
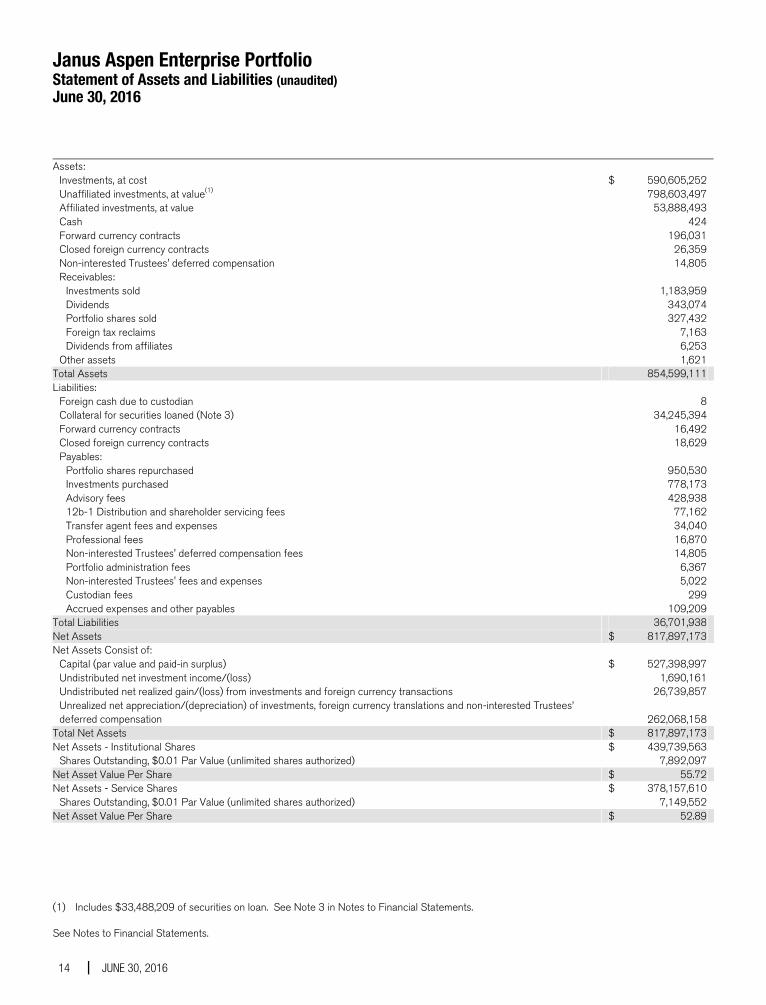
Janus Aspen Enterprise Portfolio Statement of Assets and Liabilities (unaudited) June 30, 2016
See Notes to Financial Statements.
14 JUNE 30, 2016
Assets: Investments, at cost $ 590,605,252 Unaffiliated investments, at value(1) 798,603,497 Affiliated investments, at value 53,888,493 Cash 424 Forward currency contracts 196,031 Closed foreign currency contracts 26,359 Non-interested Trustees' deferred compensation 14,805 Receivables: Investments sold 1,183,959 Dividends 343,074 Portfolio shares sold 327,432 Foreign tax reclaims 7,163 Dividends from affiliates 6,253 Other assets 1,621Total Assets 854,599,111 Liabilities: Foreign cash due to custodian 8 Collateral for securities loaned (Note 3) 34,245,394 Forward currency contracts 16,492 Closed foreign currency contracts 18,629 Payables: — Portfolio shares repurchased 950,530 Investments purchased 778,173 Advisory fees 428,938 12b-1 Distribution and shareholder servicing fees 77,162 Transfer agent fees and expenses 34,040 Professional fees 16,870 Non-interested Trustees' deferred compensation fees 14,805 Portfolio administration fees 6,367 Non-interested Trustees' fees and expenses 5,022 Custodian fees 299 Accrued expenses and other payables 109,209Total Liabilities 36,701,938 Net Assets $ 817,897,173 Net Assets Consist of: Capital (par value and paid-in surplus) $ 527,398,997 Undistributed net investment income/(loss) 1,690,161 Undistributed net realized gain/(loss) from investments and foreign currency transactions 26,739,857
Unrealized net appreciation/(depreciation) of investments, foreign currency translations and non-interested Trustees’ deferred compensation 262,068,158
Total Net Assets $ 817,897,173 Net Assets - Institutional Shares $ 439,739,563 Shares Outstanding, $0.01 Par Value (unlimited shares authorized) 7,892,097Net Asset Value Per Share $ 55.72 Net Assets - Service Shares $ 378,157,610 Shares Outstanding, $0.01 Par Value (unlimited shares authorized) 7,149,552Net Asset Value Per Share $ 52.89
(1) Includes $33,488,209 of securities on loan. See Note 3 in Notes to Financial Statements.
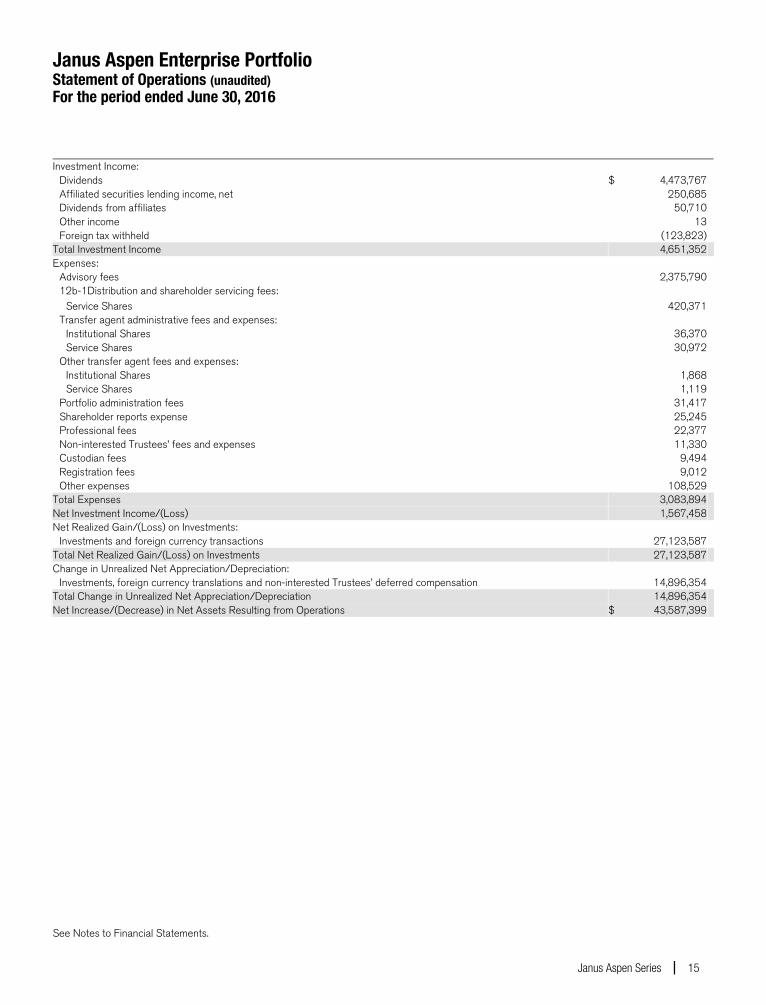
Janus Aspen Enterprise Portfolio Statement of Operations (unaudited) For the period ended June 30, 2016
See Notes to Financial Statements.
Janus Aspen Series 15
Investment Income: Dividends $ 4,473,767 Affiliated securities lending income, net 250,685 Dividends from affiliates 50,710 Other income 13 Foreign tax withheld (123,823)Total Investment Income 4,651,352 Expenses: Advisory fees 2,375,790 12b-1Distribution and shareholder servicing fees: Service Shares 420,371 Transfer agent administrative fees and expenses: Institutional Shares 36,370 Service Shares 30,972 Other transfer agent fees and expenses: Institutional Shares 1,868 Service Shares 1,119 Portfolio administration fees 31,417 Shareholder reports expense 25,245 Professional fees 22,377 Non-interested Trustees’ fees and expenses 11,330 Custodian fees 9,494 Registration fees 9,012 Other expenses 108,529Total Expenses 3,083,894 Net Investment Income/(Loss) 1,567,458 Net Realized Gain/(Loss) on Investments: Investments and foreign currency transactions 27,123,587Total Net Realized Gain/(Loss) on Investments 27,123,587 Change in Unrealized Net Appreciation/Depreciation: Investments, foreign currency translations and non-interested Trustees’ deferred compensation 14,896,354Total Change in Unrealized Net Appreciation/Depreciation 14,896,354 Net Increase/(Decrease) in Net Assets Resulting from Operations $ 43,587,399
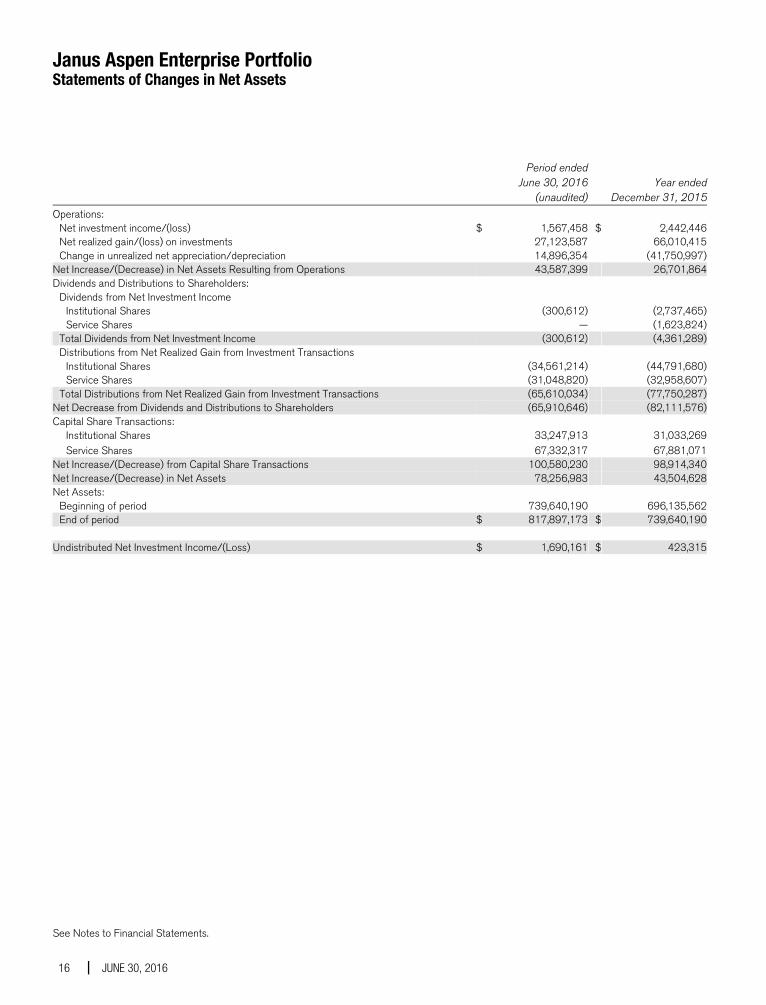
Janus Aspen Enterprise Portfolio Statements of Changes in Net Assets
See Notes to Financial Statements.
16 JUNE 30, 2016
Period ended June 30, 2016
(unaudited) Year ended
December 31, 2015
Operations: Net investment income/(loss) $ 1,567,458 $ 2,442,446 Net realized gain/(loss) on investments 27,123,587 66,010,415 Change in unrealized net appreciation/depreciation 14,896,354 (41,750,997)Net Increase/(Decrease) in Net Assets Resulting from Operations 43,587,399 26,701,864Dividends and Distributions to Shareholders: Dividends from Net Investment Income Institutional Shares (300,612) (2,737,465) Service Shares — (1,623,824) Total Dividends from Net Investment Income (300,612) (4,361,289) Distributions from Net Realized Gain from Investment Transactions Institutional Shares (34,561,214) (44,791,680) Service Shares (31,048,820) (32,958,607) Total Distributions from Net Realized Gain from Investment Transactions (65,610,034) (77,750,287)Net Decrease from Dividends and Distributions to Shareholders (65,910,646) (82,111,576)Capital Share Transactions: Institutional Shares 33,247,913 31,033,269 Service Shares 67,332,317 67,881,071Net Increase/(Decrease) from Capital Share Transactions 100,580,230 98,914,340Net Increase/(Decrease) in Net Assets 78,256,983 43,504,628Net Assets: Beginning of period 739,640,190 696,135,562 End of period $ 817,897,173 $ 739,640,190 Undistributed Net Investment Income/(Loss) $ 1,690,161 $ 423,315
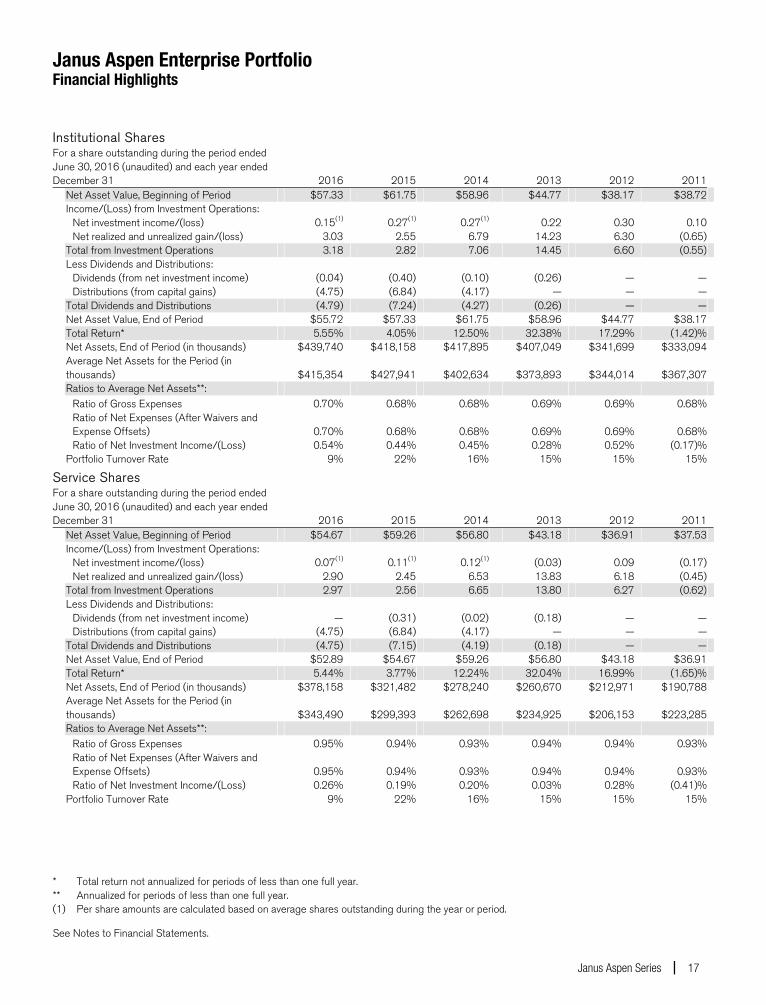
Janus Aspen Enterprise Portfolio Financial Highlights
See Notes to Financial Statements.
Janus Aspen Series 17
Institutional Shares For a share outstanding during the period ended June 30, 2016 (unaudited) and each year ended December 31 2016 2015 2014 2013 2012 2011 Net Asset Value, Beginning of Period $57.33 $61.75 $58.96 $44.77 $38.17 $38.72 Income/(Loss) from Investment Operations: Net investment income/(loss) 0.15(1) 0.27(1) 0.27(1) 0.22 0.30 0.10 Net realized and unrealized gain/(loss) 3.03 2.55 6.79 14.23 6.30 (0.65) Total from Investment Operations 3.18 2.82 7.06 14.45 6.60 (0.55) Less Dividends and Distributions: Dividends (from net investment income) (0.04) (0.40) (0.10) (0.26) — — Distributions (from capital gains) (4.75) (6.84) (4.17) — — — Total Dividends and Distributions (4.79) (7.24) (4.27) (0.26) — — Net Asset Value, End of Period $55.72 $57.33 $61.75 $58.96 $44.77 $38.17 Total Return* 5.55% 4.05% 12.50% 32.38% 17.29% (1.42)% Net Assets, End of Period (in thousands) $439,740 $418,158 $417,895 $407,049 $341,699 $333,094
Average Net Assets for the Period (in thousands) $415,354 $427,941 $402,634 $373,893 $344,014 $367,307
Ratios to Average Net Assets**: Ratio of Gross Expenses 0.70% 0.68% 0.68% 0.69% 0.69% 0.68%
Ratio of Net Expenses (After Waivers and Expense Offsets) 0.70% 0.68% 0.68% 0.69% 0.69% 0.68%
Ratio of Net Investment Income/(Loss) 0.54% 0.44% 0.45% 0.28% 0.52% (0.17)% Portfolio Turnover Rate 9% 22% 16% 15% 15% 15% 1
Service Shares For a share outstanding during the period ended June 30, 2016 (unaudited) and each year ended December 31 2016 2015 2014 2013 2012 2011 Net Asset Value, Beginning of Period $54.67 $59.26 $56.80 $43.18 $36.91 $37.53 Income/(Loss) from Investment Operations: Net investment income/(loss) 0.07(1) 0.11(1) 0.12(1) (0.03) 0.09 (0.17) Net realized and unrealized gain/(loss) 2.90 2.45 6.53 13.83 6.18 (0.45) Total from Investment Operations 2.97 2.56 6.65 13.80 6.27 (0.62) Less Dividends and Distributions: Dividends (from net investment income) — (0.31) (0.02) (0.18) — — Distributions (from capital gains) (4.75) (6.84) (4.17) — — — Total Dividends and Distributions (4.75) (7.15) (4.19) (0.18) — — Net Asset Value, End of Period $52.89 $54.67 $59.26 $56.80 $43.18 $36.91 Total Return* 5.44% 3.77% 12.24% 32.04% 16.99% (1.65)% Net Assets, End of Period (in thousands) $378,158 $321,482 $278,240 $260,670 $212,971 $190,788
Average Net Assets for the Period (in thousands) $343,490 $299,393 $262,698 $234,925 $206,153 $223,285
Ratios to Average Net Assets**: Ratio of Gross Expenses 0.95% 0.94% 0.93% 0.94% 0.94% 0.93%
Ratio of Net Expenses (After Waivers and Expense Offsets) 0.95% 0.94% 0.93% 0.94% 0.94% 0.93%
Ratio of Net Investment Income/(Loss) 0.26% 0.19% 0.20% 0.03% 0.28% (0.41)% Portfolio Turnover Rate 9% 22% 16% 15% 15% 15%
* Total return not annualized for periods of less than one full year.** Annualized for periods of less than one full year. (1) Per share amounts are calculated based on average shares outstanding during the year or period.
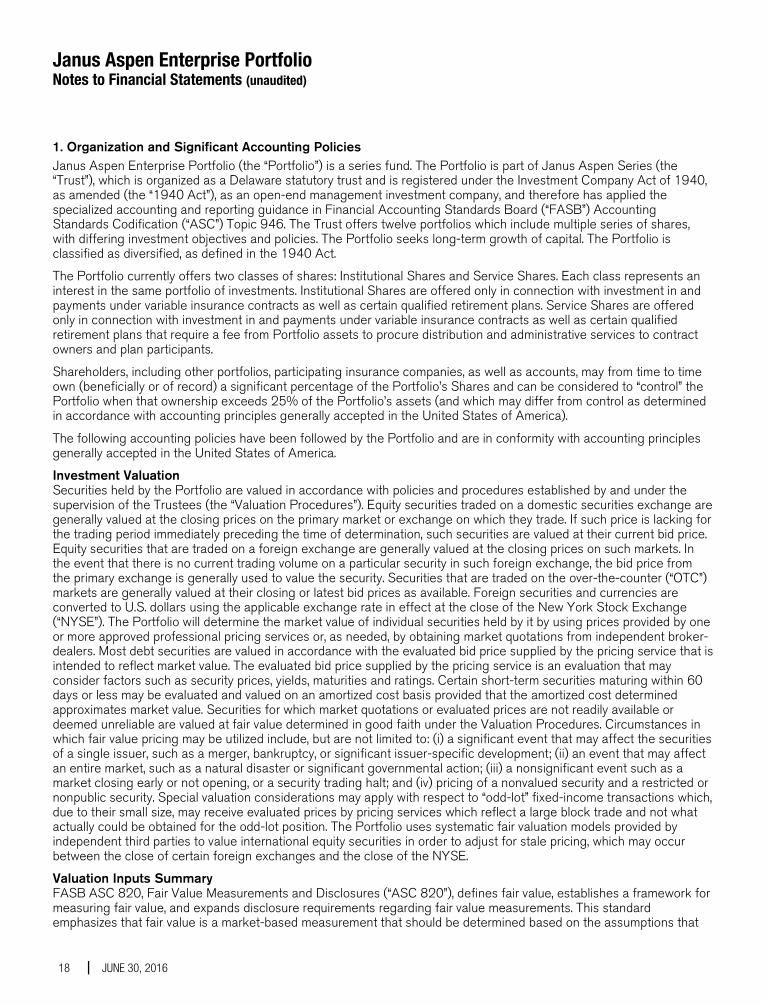
Janus Aspen Enterprise Portfolio Notes to Financial Statements (unaudited)
18 JUNE 30, 2016
1. Organization and Significant Accounting Policies Janus Aspen Enterprise Portfolio (the “Portfolio”) is a series fund. The Portfolio is part of Janus Aspen Series (the “Trust”), which is organized as a Delaware statutory trust and is registered under the Investment Company Act of 1940, as amended (the “1940 Act”), as an open-end management investment company, and therefore has applied the specialized accounting and reporting guidance in Financial Accounting Standards Board (“FASB”) Accounting Standards Codification (“ASC”) Topic 946. The Trust offers twelve portfolios which include multiple series of shares, with differing investment objectives and policies. The Portfolio seeks long-term growth of capital. The Portfolio is classified as diversified, as defined in the 1940 Act.
The Portfolio currently offers two classes of shares: Institutional Shares and Service Shares. Each class represents an interest in the same portfolio of investments. Institutional Shares are offered only in connection with investment in and payments under variable insurance contracts as well as certain qualified retirement plans. Service Shares are offered only in connection with investment in and payments under variable insurance contracts as well as certain qualified retirement plans that require a fee from Portfolio assets to procure distribution and administrative services to contract owners and plan participants.
Shareholders, including other portfolios, participating insurance companies, as well as accounts, may from time to time own (beneficially or of record) a significant percentage of the Portfolio’s Shares and can be considered to “control” the Portfolio when that ownership exceeds 25% of the Portfolio’s assets (and which may differ from control as determined in accordance with accounting principles generally accepted in the United States of America).
The following accounting policies have been followed by the Portfolio and are in conformity with accounting principles generally accepted in the United States of America.
Investment Valuation Securities held by the Portfolio are valued in accordance with policies and procedures established by and under the supervision of the Trustees (the “Valuation Procedures”). Equity securities traded on a domestic securities exchange are generally valued at the closing prices on the primary market or exchange on which they trade. If such price is lacking for the trading period immediately preceding the time of determination, such securities are valued at their current bid price. Equity securities that are traded on a foreign exchange are generally valued at the closing prices on such markets. In the event that there is no current trading volume on a particular security in such foreign exchange, the bid price from the primary exchange is generally used to value the security. Securities that are traded on the over-the-counter (“OTC”) markets are generally valued at their closing or latest bid prices as available. Foreign securities and currencies are converted to U.S. dollars using the applicable exchange rate in effect at the close of the New York Stock Exchange (“NYSE”). The Portfolio will determine the market value of individual securities held by it by using prices provided by one or more approved professional pricing services or, as needed, by obtaining market quotations from independent broker-dealers. Most debt securities are valued in accordance with the evaluated bid price supplied by the pricing service that is intended to reflect market value. The evaluated bid price supplied by the pricing service is an evaluation that may consider factors such as security prices, yields, maturities and ratings. Certain short-term securities maturing within 60 days or less may be evaluated and valued on an amortized cost basis provided that the amortized cost determined approximates market value. Securities for which market quotations or evaluated prices are not readily available or deemed unreliable are valued at fair value determined in good faith under the Valuation Procedures. Circumstances in which fair value pricing may be utilized include, but are not limited to: (i) a significant event that may affect the securities of a single issuer, such as a merger, bankruptcy, or significant issuer-specific development; (ii) an event that may affect an entire market, such as a natural disaster or significant governmental action; (iii) a nonsignificant event such as a market closing early or not opening, or a security trading halt; and (iv) pricing of a nonvalued security and a restricted or nonpublic security. Special valuation considerations may apply with respect to “odd-lot” fixed-income transactions which, due to their small size, may receive evaluated prices by pricing services which reflect a large block trade and not what actually could be obtained for the odd-lot position. The Portfolio uses systematic fair valuation models provided by independent third parties to value international equity securities in order to adjust for stale pricing, which may occur between the close of certain foreign exchanges and the close of the NYSE.
Valuation Inputs Summary FASB ASC 820, Fair Value Measurements and Disclosures (“ASC 820”), defines fair value, establishes a framework for measuring fair value, and expands disclosure requirements regarding fair value measurements. This standard emphasizes that fair value is a market-based measurement that should be determined based on the assumptions that
Janus Aspen Enterprise Portfolio Notes to Financial Statements (unaudited)
Janus Aspen Series 19
market participants would use in pricing an asset or liability and establishes a hierarchy that prioritizes inputs to valuation techniques used to measure fair value. These inputs are summarized into three broad levels:
Level 1 – Unadjusted quoted prices in active markets the Portfolio has the ability to access for identical assets or liabilities.
Level 2 – Observable inputs other than unadjusted quoted prices included in Level 1 that are observable for the asset or liability either directly or indirectly. These inputs may include quoted prices for the identical instrument on an inactive market, prices for similar instruments, interest rates, prepayment speeds, credit risk, yield curves, default rates and similar data.
Assets or liabilities categorized as Level 2 in the hierarchy generally include: debt securities fair valued in accordance with the evaluated bid or ask prices supplied by a pricing service; securities traded on OTC markets and listed securities for which no sales are reported that are fair valued at the latest bid price (or yield equivalent thereof) obtained from one or more dealers transacting in a market for such securities or by a pricing service approved by the Portfolio’s Trustees; certain short-term debt securities with maturities of 60 days or less that are fair valued at amortized cost; and equity securities of foreign issuers whose fair value is determined by using systematic fair valuation models provided by independent third parties in order to adjust for stale pricing which may occur between the close of certain foreign exchanges and the close of the NYSE. Other securities that may be categorized as Level 2 in the hierarchy include, but are not limited to, preferred stocks, bank loans, swaps, investments in unregistered investment companies, options, and forward contracts.
Level 3 – Unobservable inputs for the asset or liability to the extent that relevant observable inputs are not available, representing the Portfolio’s own assumptions about the assumptions that a market participant would use in valuing the asset or liability, and that would be based on the best information available.
There have been no significant changes in valuation techniques used in valuing any such positions held by the Portfolio since the beginning of the fiscal year.
The inputs or methodology used for fair valuing securities are not necessarily an indication of the risk associated with investing in those securities. The summary of inputs used as of June 30, 2016 to fair value the Portfolio’s investments in securities and other financial instruments is included in the “Valuation Inputs Summary” in the Notes to Schedule of Investments and Other Information.
The Portfolio recognizes transfers between the levels as of the beginning of the fiscal year. The following describes the amounts of transfers between Level 1, Level 2 and Level 3 of the fair value hierarchy during the period.
Financial assets of $5,066,776 were transferred out of Level 1 to Level 2 since certain foreign equity prices were applied a fair valuation adjustment factor at the end of the current period and no factor was applied at the end of the prior fiscal year.
Investment Transactions and Investment Income Investment transactions are accounted for as of the date purchased or sold (trade date). Dividend income is recorded on the ex-dividend date. Certain dividends from foreign securities will be recorded as soon as the Portfolio is informed of the dividend, if such information is obtained subsequent to the ex-dividend date. Dividends from foreign securities may be subject to withholding taxes in foreign jurisdictions. Interest income is recorded on the accrual basis and includes amortization of premiums and accretion of discounts. Gains and losses are determined on the identified cost basis, which is the same basis used for federal income tax purposes. Income, as well as gains and losses, both realized and unrealized, are allocated daily to each class of shares based upon the ratio of net assets represented by each class as a percentage of total net assets.
Expenses The Portfolio bears expenses incurred specifically on its behalf. Each class of shares bears a portion of general expenses, which are allocated daily to each class of shares based upon the ratio of net assets represented by each class as a percentage of total net assets. Expenses directly attributable to a specific class of shares are charged against the operations of such class.
Estimates The preparation of financial statements in conformity with accounting principles generally accepted in the United States of America requires management to make estimates and assumptions that affect the reported amount of assets and
Janus Aspen Enterprise Portfolio Notes to Financial Statements (unaudited)
20 JUNE 30, 2016
liabilities and disclosure of contingent assets and liabilities at the date of the financial statements, and the reported amounts of income and expenses during the reporting period. Actual results could differ from those estimates.
Indemnifications In the normal course of business, the Portfolio may enter into contracts that contain provisions for indemnification of other parties against certain potential liabilities. The Portfolio’s maximum exposure under these arrangements is unknown, and would involve future claims that may be made against the Portfolio that have not yet occurred. Currently, the risk of material loss from such claims is considered remote.
Foreign Currency Translations The Portfolio does not isolate that portion of the results of operations resulting from the effect of changes in foreign exchange rates on investments from the fluctuations arising from changes in market prices of securities held at the date of the financial statements. Net unrealized appreciation or depreciation of investments and foreign currency translations arise from changes in the value of assets and liabilities, including investments in securities held at the date of the financial statements, resulting from changes in the exchange rates and changes in market prices of securities held.
Currency gains and losses are also calculated on payables and receivables that are denominated in foreign currencies. The payables and receivables are generally related to foreign security transactions and income translations.
Foreign currency-denominated assets and forward currency contracts may involve more risks than domestic transactions, including currency risk, counterparty risk, political and economic risk, regulatory risk and equity risk. Risks may arise from unanticipated movements in the value of foreign currencies relative to the U.S. dollar.
Dividends and Distributions The Portfolio may make semiannual distributions of substantially all of its investment income and an annual distribution of its net realized capital gains (if any).
The Portfolio may make certain investments in real estate investment trusts (“REITs”) which pay dividends to their shareholders based upon funds available from operations. It is quite common for these dividends to exceed the REITs’ taxable earnings and profits, resulting in the excess portion of such dividends being designated as a return of capital. If the Portfolio distributes such amounts, such distributions could constitute a return of capital to shareholders for federal income tax purposes.
Federal Income Taxes The Portfolio intends to continue to qualify as a regulated investment company and distribute all of its taxable income in accordance with the requirements of Subchapter M of the Internal Revenue Code. Management has analyzed the Portfolio’s tax positions taken for all open federal income tax years, generally a three-year period, and has concluded that no provision for federal income tax is required in the Portfolio’s financial statements. The Portfolio is not aware of any tax positions for which it is reasonably possible that the total amounts of unrecognized tax benefits will significantly change in the next twelve months.
2. Derivative Instruments The Portfolio may invest in various types of derivatives, which may at times result in significant derivative exposure. A derivative is a financial instrument whose performance is derived from the performance of another asset. The Portfolio may invest in derivative instruments including, but not limited to: futures contracts, put options, call options, options on future contracts, options on foreign currencies, options on recovery locks, options on security and commodity indices, swaps, forward contracts, structured investments, and other equity-linked derivatives. Each derivative instrument that was held by the Portfolio during the period ended June 30, 2016 is discussed in further detail below. A summary of derivative activity by the Fund is reflected in the tables at the end of this section.
The Portfolio may use derivative instruments for hedging purposes (to offset risks associated with an investment, currency exposure, or market conditions), to adjust currency exposure relative to a benchmark index, or for speculative purposes (to earn income and seek to enhance returns). When the Portfolio invests in a derivative for speculative purposes, the Portfolio will be fully exposed to the risks of loss of that derivative, which may sometimes be greater than the derivative’s cost. The Portfolio may not use any derivative to gain exposure to an asset or class of assets that it would be prohibited by its investment restrictions from purchasing directly. The Portfolio’s ability to use derivative instruments may also be limited by tax considerations.
Janus Aspen Enterprise Portfolio Notes to Financial Statements (unaudited)
Janus Aspen Series 21
Investments in derivatives in general are subject to market risks that may cause their prices to fluctuate over time. Investments in derivatives may not directly correlate with the price movements of the underlying instrument. As a result, the use of derivatives may expose the Portfolio to additional risks that it would not be subject to if it invested directly in the securities underlying those derivatives. The use of derivatives may result in larger losses or smaller gains than otherwise would be the case. Derivatives can be volatile and may involve significant risks.
In pursuit of its investment objective, the Portfolio may seek to use derivatives to increase or decrease exposure to the following market risk factors:
• Commodity Risk – the risk related to the change in value of commodities or commodity-linked investments due to changes in the overall market movements, volatility of the underlying benchmark, changes in interest rates, or other factors affecting a particular industry of commodity such as drought, floods, weather, livestock disease, embargoes, tariffs, and international economic, political, and regulatory developments.
• Counterparty Risk – the risk that the counterparty (the party on the other side of the transaction) on a derivative transaction will be unable to honor its financial obligation to the Portfolio.
• Credit Risk – the risk an issuer will be unable to make principal and interest payments when due, or will default on its obligations.
• Currency Risk – the risk that changes in the exchange rate between currencies will adversely affect the value (in U.S. dollar terms) of an investment.
• Equity Risk – the risk related to the change in value of equity securities as they relate to increases or decreases in the general market.
• Index Risk – if the derivative is linked to the performance of an index, it will be subject to the risks associated with changes in that index. If the index changes, the Portfolio could receive lower interest payments or experience a reduction in the value of the derivative to below what the Portfolio paid. Certain indexed securities, including inverse securities (which move in an opposite direction to the index), may create leverage, to the extent that they increase or decrease in value at a rate that is a multiple of the changes in the applicable index.
• Interest Rate Risk – the risk that the value of fixed-income securities will generally decline as prevailing interest rates rise, which may cause the Portfolio’s NAV to likewise decrease.
• Leverage Risk – the risk associated with certain types of leveraged investments or trading strategies pursuant to which relatively small market movements may result in large changes in the value of an investment. The Portfolio creates leverage by investing in instruments, including derivatives, where the investment loss can exceed the original amount invested. Certain investments or trading strategies, such as short sales, that involve leverage can result in losses that greatly exceed the amount originally invested.
• Liquidity Risk – the risk that certain securities may be difficult or impossible to sell at the time that the seller would like or at the price that the seller believes the security is currently worth.
Derivatives may generally be traded OTC or on an exchange. Derivatives traded OTC are agreements that are individually negotiated between parties and can be tailored to meet a purchaser’s needs. OTC derivatives are not guaranteed by a clearing agency and may be subject to increased credit risk.
In an effort to mitigate credit risk associated with derivatives traded OTC, the Portfolio may enter into collateral agreements with certain counterparties whereby, subject to certain minimum exposure requirements, the Portfolio may require the counterparty to post collateral if the Portfolio has a net aggregate unrealized gain on all OTC derivative contracts with a particular counterparty. There is no guarantee that counterparty exposure is reduced and these arrangements are dependent on Janus Capital’s ability to establish and maintain appropriate systems and trading.
Forward Foreign Currency Exchange Contracts A forward foreign currency exchange contract (“forward currency contract”) is an obligation to buy or sell a specified currency at a future date at a negotiated rate (which may be U.S. dollars or a foreign currency). The Portfolio may enter into forward currency contracts for hedging purposes, including, but not limited to, reducing exposure to changes in foreign currency exchange rates on foreign portfolio holdings and locking in the U.S. dollar cost of firm purchase and sale commitments for securities denominated in or exposed to foreign currencies. The Portfolio may also invest in
Janus Aspen Enterprise Portfolio Notes to Financial Statements (unaudited)
22 JUNE 30, 2016
forward currency contracts for nonhedging purposes such as seeking to enhance returns. The Portfolio is subject to currency risk and counterparty risk in the normal course of pursuing its investment objective through its investments in forward currency contracts.
Forward currency contracts are valued by converting the foreign value to U.S. dollars by using the current spot U.S. dollar exchange rate and/or forward rate for that currency. Exchange and forward rates as of the close of the NYSE shall be used to value the forward currency contracts.
The unrealized appreciation/(depreciation) for forward currency contracts is reported in the Statement of Assets and Liabilities as a receivable or payable and in the Statement of Operations for the change in unrealized net appreciation/depreciation (if applicable). The gain or loss arising from the difference between the U.S. dollar cost of the original contract and the value of the foreign currency in U.S. dollars upon closing a forward currency contract is reported on the Statement of Operations (if applicable).
During the period, the Portfolio entered into forward currency contracts with the obligation to sell foreign currencies in the future at an agreed upon rate in order to decrease exposure to currency risk associated with foreign currency denominated securities held by the Portfolio.
During the period ended June 30, 2016, the average ending monthly currency value amounts on sold forward currency contracts is $18,385,002.
The following table, grouped by derivative type, provides information about the fair value and location of derivatives within the Statement of Assets and Liabilities as of June 30, 2016.
Fair Value of Derivative Instruments (not accounted for as hedging instruments) as of June 30, 2016
Currency
Contracts
Asset Derivatives: Forward currency contracts $ 196,031
Liability Derivatives: Forward currency contracts $ 16,492
The following tables provide information about the effect of derivatives and hedging activities on the Portfolio’s Statement of Operations for the period ended June 30, 2016.
The effect of Derivative Instruments (not accounted for as hedging instruments) on the Statement of Operations for the period ended June 30, 2016
Amount of Realized Gain/(Loss) Recognized on Derivatives
Derivative Currency
Contracts
Investments and foreign currency transactions $ (610,138)
Amount of Change in Unrealized Appreciation/Depreciation Recognized on Derivatives
Derivative Currency
ContractsInvestments, foreign currency translations and non-interested Trustees' deferred compensation $ (3,802)
Janus Aspen Enterprise Portfolio Notes to Financial Statements (unaudited)
Janus Aspen Series 23
Please see the Portfolio’s Statement of Operations for the Portfolio’s “Net Realized and Unrealized Gain/(Loss) on Investments.”
3. Other Investments and Strategies
Additional Investment Risk The financial crisis in both the U.S. and global economies over the past several years has resulted, and may continue to result, in a significant decline in the value and liquidity of many securities of issuers worldwide in the equity and fixed-income/credit markets. In response to the crisis, the United States and certain foreign governments, along with the U.S. Federal Reserve and certain foreign central banks, took steps to support the financial markets. The withdrawal of this support, a failure of measures put in place to respond to the crisis, or investor perception that such efforts were not sufficient could each negatively affect financial markets generally, and the value and liquidity of specific securities. In addition, policy and legislative changes in the United States and in other countries continue to impact many aspects of financial regulation. The effect of these changes on the markets, and the practical implications for market participants, including the Portfolio, may not be fully known for some time. As a result, it may also be unusually difficult to identify both investment risks and opportunities, which could limit or preclude the Portfolio’s ability to achieve its investment objective. Therefore, it is important to understand that the value of your investment may fall, sometimes sharply, and you could lose money.
The enactment of the Dodd-Frank Wall Street Reform and Consumer Protection Act (the “Dodd-Frank Act”) provided for widespread regulation of financial institutions, consumer financial products and services, broker-dealers, OTC derivatives, investment advisers, credit rating agencies, and mortgage lending, which expanded federal oversight in the financial sector, including the investment management industry. Many provisions of the Dodd-Frank Act remain pending and will be implemented through future rulemaking. Therefore, the ultimate impact of the Dodd-Frank Act and the regulations under the Dodd-Frank Act on the Portfolio and the investment management industry as a whole, is not yet certain.
A number of countries in the European Union (“EU”) have experienced, and may continue to experience, severe economic and financial difficulties. In particular, many EU nations are susceptible to economic risks associated with high levels of debt, notably due to investments in sovereign debt of countries such as Greece, Italy, Spain, Portugal, and Ireland. Many non-governmental issuers, and even certain governments, have defaulted on, or been forced to restructure, their debts. Many other issuers have faced difficulties obtaining credit or refinancing existing obligations. Financial institutions have in many cases required government or central bank support, have needed to raise capital, and/or have been impaired in their ability to extend credit. As a result, financial markets in the EU experienced extreme volatility and declines in asset values and liquidity. Responses to these financial problems by European governments, central banks, and others, including austerity measures and reforms, may not work, may result in social unrest, and may limit future growth and economic recovery or have other unintended consequences. Further defaults or restructurings by governments and others of their debt could have additional adverse effects on economies, financial markets, and asset valuations around the world. Greece, Ireland, and Portugal have already received one or more "bailouts" from other Eurozone member states, and it is unclear how much additional funding they will require or if additional Eurozone member states will require bailouts in the future. The risk of investing in securities in the European markets may also be heightened due to the referendum in which the United Kingdom voted to exit the EU (known as “Brexit”). One or more other countries may also abandon the euro and/or withdraw from the EU, placing its currency and banking system in jeopardy.
Certain areas of the world have historically been prone to and economically sensitive to environmental events such as, but not limited to, hurricanes, earthquakes, typhoons, flooding, tidal waves, tsunamis, erupting volcanoes, wildfires or droughts, tornadoes, mudslides, or other weather-related phenomena. Such disasters, and the resulting physical or economic damage, could have a severe and negative impact on the Portfolio’s investment portfolio and, in the longer term, could impair the ability of issuers in which the Portfolio invests to conduct their businesses as they would under normal conditions. Adverse weather conditions may also have a particularly significant negative effect on issuers in the agricultural sector and on insurance companies that insure against the impact of natural disasters.
Counterparties Portfolio transactions involving a counterparty are subject to the risk that the counterparty or a third party will not fulfill its obligation to the Portfolio (“counterparty risk”). Counterparty risk may arise because of the counterparty’s financial
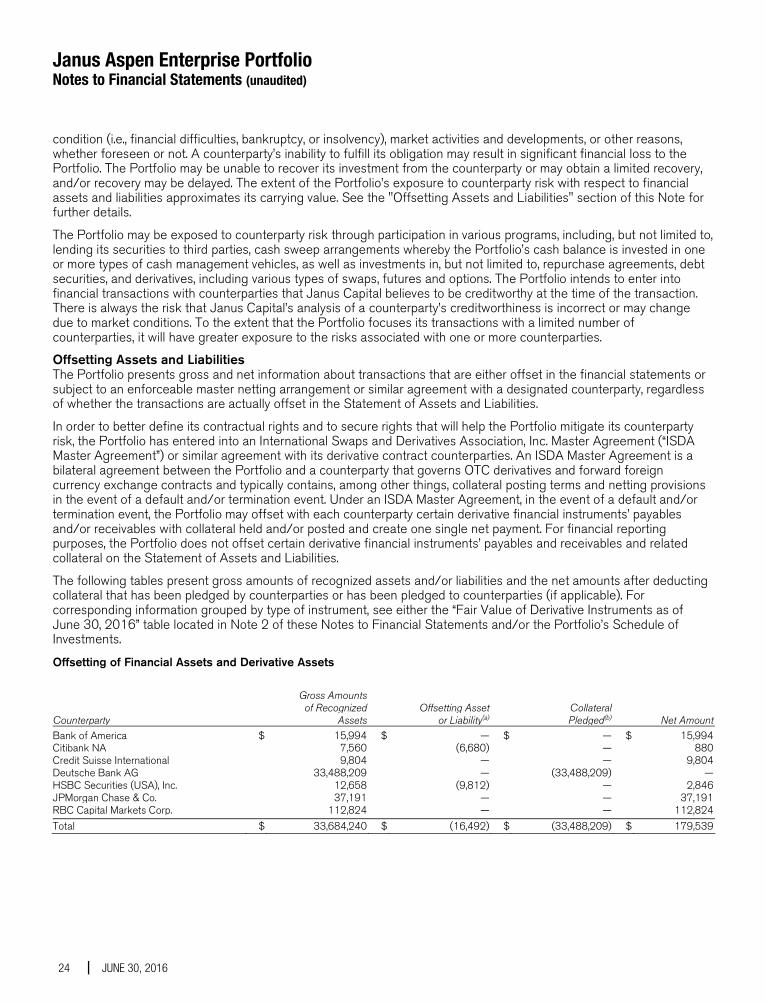
Janus Aspen Enterprise Portfolio Notes to Financial Statements (unaudited)
24 JUNE 30, 2016
condition (i.e., financial difficulties, bankruptcy, or insolvency), market activities and developments, or other reasons, whether foreseen or not. A counterparty’s inability to fulfill its obligation may result in significant financial loss to the Portfolio. The Portfolio may be unable to recover its investment from the counterparty or may obtain a limited recovery, and/or recovery may be delayed. The extent of the Portfolio’s exposure to counterparty risk with respect to financial assets and liabilities approximates its carrying value. See the "Offsetting Assets and Liabilities" section of this Note for further details.
The Portfolio may be exposed to counterparty risk through participation in various programs, including, but not limited to, lending its securities to third parties, cash sweep arrangements whereby the Portfolio’s cash balance is invested in one or more types of cash management vehicles, as well as investments in, but not limited to, repurchase agreements, debt securities, and derivatives, including various types of swaps, futures and options. The Portfolio intends to enter into financial transactions with counterparties that Janus Capital believes to be creditworthy at the time of the transaction. There is always the risk that Janus Capital’s analysis of a counterparty’s creditworthiness is incorrect or may change due to market conditions. To the extent that the Portfolio focuses its transactions with a limited number of counterparties, it will have greater exposure to the risks associated with one or more counterparties.
Offsetting Assets and Liabilities The Portfolio presents gross and net information about transactions that are either offset in the financial statements or subject to an enforceable master netting arrangement or similar agreement with a designated counterparty, regardless of whether the transactions are actually offset in the Statement of Assets and Liabilities.
In order to better define its contractual rights and to secure rights that will help the Portfolio mitigate its counterparty risk, the Portfolio has entered into an International Swaps and Derivatives Association, Inc. Master Agreement (“ISDA Master Agreement”) or similar agreement with its derivative contract counterparties. An ISDA Master Agreement is a bilateral agreement between the Portfolio and a counterparty that governs OTC derivatives and forward foreign currency exchange contracts and typically contains, among other things, collateral posting terms and netting provisions in the event of a default and/or termination event. Under an ISDA Master Agreement, in the event of a default and/or termination event, the Portfolio may offset with each counterparty certain derivative financial instruments’ payables and/or receivables with collateral held and/or posted and create one single net payment. For financial reporting purposes, the Portfolio does not offset certain derivative financial instruments’ payables and receivables and related collateral on the Statement of Assets and Liabilities.
The following tables present gross amounts of recognized assets and/or liabilities and the net amounts after deducting collateral that has been pledged by counterparties or has been pledged to counterparties (if applicable). For corresponding information grouped by type of instrument, see either the “Fair Value of Derivative Instruments as of June 30, 2016” table located in Note 2 of these Notes to Financial Statements and/or the Portfolio’s Schedule of Investments.
Offsetting of Financial Assets and Derivative Assets Gross Amounts of Recognized Offsetting Asset Collateral Counterparty Assets or Liability(a) Pledged(b) Net AmountBank of America $ 15,994 $ — $ — $ 15,994Citibank NA 7,560 (6,680) — 880Credit Suisse International 9,804 — — 9,804Deutsche Bank AG 33,488,209 — (33,488,209) —HSBC Securities (USA), Inc. 12,658 (9,812) — 2,846JPMorgan Chase & Co. 37,191 — — 37,191RBC Capital Markets Corp. 112,824 — — 112,824Total $ 33,684,240 $ (16,492) $ (33,488,209) $ 179,539
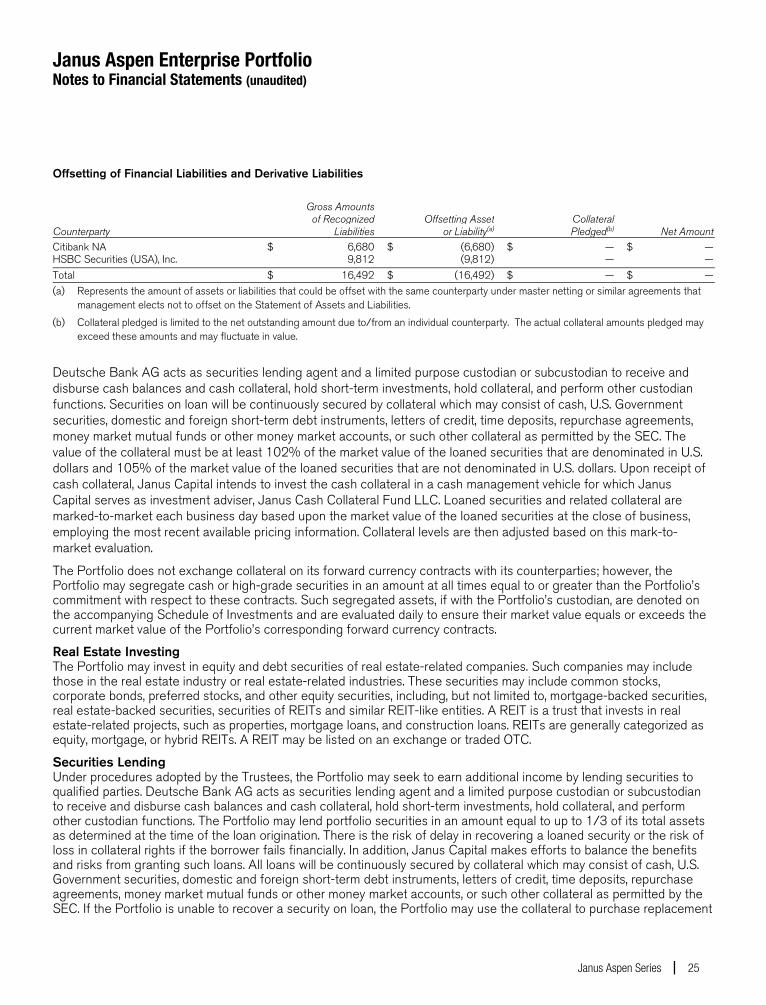
Janus Aspen Enterprise Portfolio Notes to Financial Statements (unaudited)
Janus Aspen Series 25
Offsetting of Financial Liabilities and Derivative Liabilities Gross Amounts of Recognized Offsetting Asset Collateral Counterparty Liabilities or Liability(a) Pledged(b) Net AmountCitibank NA $ 6,680 $ (6,680) $ — $ —HSBC Securities (USA), Inc. 9,812 (9,812) — —Total $ 16,492 $ (16,492) $ — $ —(a) Represents the amount of assets or liabilities that could be offset with the same counterparty under master netting or similar agreements that
management elects not to offset on the Statement of Assets and Liabilities.
(b) Collateral pledged is limited to the net outstanding amount due to/from an individual counterparty. The actual collateral amounts pledged may exceed these amounts and may fluctuate in value.
Deutsche Bank AG acts as securities lending agent and a limited purpose custodian or subcustodian to receive and disburse cash balances and cash collateral, hold short-term investments, hold collateral, and perform other custodian functions. Securities on loan will be continuously secured by collateral which may consist of cash, U.S. Government securities, domestic and foreign short-term debt instruments, letters of credit, time deposits, repurchase agreements, money market mutual funds or other money market accounts, or such other collateral as permitted by the SEC. The value of the collateral must be at least 102% of the market value of the loaned securities that are denominated in U.S. dollars and 105% of the market value of the loaned securities that are not denominated in U.S. dollars. Upon receipt of cash collateral, Janus Capital intends to invest the cash collateral in a cash management vehicle for which Janus Capital serves as investment adviser, Janus Cash Collateral Fund LLC. Loaned securities and related collateral are marked-to-market each business day based upon the market value of the loaned securities at the close of business, employing the most recent available pricing information. Collateral levels are then adjusted based on this mark-to-market evaluation.
The Portfolio does not exchange collateral on its forward currency contracts with its counterparties; however, the Portfolio may segregate cash or high-grade securities in an amount at all times equal to or greater than the Portfolio’s commitment with respect to these contracts. Such segregated assets, if with the Portfolio’s custodian, are denoted on the accompanying Schedule of Investments and are evaluated daily to ensure their market value equals or exceeds the current market value of the Portfolio’s corresponding forward currency contracts.
Real Estate Investing The Portfolio may invest in equity and debt securities of real estate-related companies. Such companies may include those in the real estate industry or real estate-related industries. These securities may include common stocks, corporate bonds, preferred stocks, and other equity securities, including, but not limited to, mortgage-backed securities, real estate-backed securities, securities of REITs and similar REIT-like entities. A REIT is a trust that invests in real estate-related projects, such as properties, mortgage loans, and construction loans. REITs are generally categorized as equity, mortgage, or hybrid REITs. A REIT may be listed on an exchange or traded OTC.
Securities Lending Under procedures adopted by the Trustees, the Portfolio may seek to earn additional income by lending securities to qualified parties. Deutsche Bank AG acts as securities lending agent and a limited purpose custodian or subcustodian to receive and disburse cash balances and cash collateral, hold short-term investments, hold collateral, and perform other custodian functions. The Portfolio may lend portfolio securities in an amount equal to up to 1/3 of its total assets as determined at the time of the loan origination. There is the risk of delay in recovering a loaned security or the risk of loss in collateral rights if the borrower fails financially. In addition, Janus Capital makes efforts to balance the benefits and risks from granting such loans. All loans will be continuously secured by collateral which may consist of cash, U.S. Government securities, domestic and foreign short-term debt instruments, letters of credit, time deposits, repurchase agreements, money market mutual funds or other money market accounts, or such other collateral as permitted by the SEC. If the Portfolio is unable to recover a security on loan, the Portfolio may use the collateral to purchase replacement
Janus Aspen Enterprise Portfolio Notes to Financial Statements (unaudited)
26 JUNE 30, 2016
securities in the market. There is a risk that the value of the collateral could decrease below the cost of the replacement security by the time the replacement investment is made, resulting in a loss to the Portfolio.
Upon receipt of cash collateral, Janus Capital may invest it in affiliated or non-affiliated cash management vehicles, whether registered or unregistered entities, as permitted by the 1940 Act and rules promulgated thereunder. Janus Capital currently intends to invest the cash collateral in a cash management vehicle for which Janus Capital serves as investment adviser, Janus Cash Collateral Fund LLC. An investment in Janus Cash Collateral Fund LLC is generally subject to the same risks that shareholders experience when investing in similarly structured vehicles, such as the potential for significant fluctuations in assets as a result of the purchase and redemption activity of the securities lending program, a decline in the value of the collateral, and possible liquidity issues. Such risks may delay the return of the cash collateral and cause the Portfolio to violate its agreement to return the cash collateral to a borrower in a timely manner. As adviser to the Portfolio and Janus Cash Collateral Fund LLC, Janus Capital has an inherent conflict of interest as a result of its fiduciary duties to both the Portfolio and Janus Cash Collateral Fund LLC. Additionally, Janus Capital receives an investment advisory fee of 0.05% for managing Janus Cash Collateral Fund LLC, but it may not receive a fee for managing certain other affiliated cash management vehicles in which the Portfolio may invest, and therefore may have an incentive to allocate preferred investment opportunities to investment vehicles for which it is receiving a fee.
The value of the collateral must be at least 102% of the market value of the loaned securities that are denominated in U.S. dollars and 105% of the market value of the loaned securities that are not denominated in U.S. dollars. Loaned securities and related collateral are marked-to-market each business day based upon the market value of the loaned securities at the close of business, employing the most recent available pricing information. Collateral levels are then adjusted based on this mark-to-market evaluation.
The cash collateral invested by Janus Capital is disclosed in the Schedule of Investments. Income earned from the investment of the cash collateral, net of rebates paid to, or fees paid by, borrowers and less the fees paid to the lending agent are included as “Affiliated securities lending income, net” on the Statement of Operations. As of June 30, 2016, securities lending transactions accounted for as secured borrowings with an overnight and continuous contractual maturity are $33,488,209 for equity securities. Gross amounts of recognized liabilities for securities lending (collateral received) as of June 30, 2016 is $34,245,394, resulting in the net amount due to the counterparty of $757,185.
4. Investment Advisory Agreements and Other Transactions with Affiliates The Portfolio pays Janus Capital an investment advisory fee which is calculated daily and paid monthly. The Portfolio’s contractual investment advisory fee rate (expressed as an annual rate) is 0.64% of its average daily net assets.
Janus Services LLC (“Janus Services”), a wholly-owned subsidiary of Janus Capital, is the Portfolio’s transfer agent. Effective May 1, 2016, Janus Services receives an administrative services fee at an annual rate of 0.05% of the average daily net assets of the Portfolio for arranging for the provision by participating insurance companies and qualified plan service providers of administrative services, including recordkeeping, subaccounting, order processing, or other shareholder services provided on behalf of contract holders or plan participants investing in the Portfolio. Other shareholder services may include the provision of order confirmations, periodic account statements, forwarding prospectuses, shareholder reports, and other materials to existing investors, and answering inquiries regarding accounts. Janus Services expects to use this entire fee to compensate insurance companies and qualified plan service providers for providing these services to their customers who invest in the Portfolio. Any unused portion will be reimbursed to the applicable share class at least annually.
In addition, Janus Services provides or arranges for the provision of certain other internal administrative, recordkeeping, and shareholder relations services for the Portfolio. Janus Services is not compensated for these internal services related to the shares, except for out-of-pocket costs. These amounts are disclosed as “Other transfer agent fees and expenses” on the Statement of Operations.
Under a distribution and shareholder servicing plan (the “Plan”) adopted in accordance with Rule 12b-1 under the 1940 Act, the Service Shares may pay the Trust’s distributor, Janus Distributors LLC (“Janus Distributors”), a wholly-owned subsidiary of Janus Capital, a fee for the sale and distribution and/or shareholder servicing of the Service Shares at an annual rate of up to 0.25% of the average daily net assets of the Service Shares. Under the terms of the Plan, the Trust is authorized to make payments to Janus Distributors for remittance to insurance companies and qualified plan service providers as compensation for distribution and/or shareholder services performed by such entities. These amounts are
Janus Aspen Enterprise Portfolio Notes to Financial Statements (unaudited)
Janus Aspen Series 27
disclosed as “12b-1 Distribution and shareholder servicing fees” on the Statement of Operations. Payments under the Plan are not tied exclusively to actual 12b-1 distribution and servicing fees, and the payments may exceed 12b-1 distribution and servicing fees actually incurred. If any of the Portfolio’s actual 12b-1 distribution and servicing fees incurred during a calendar year are less than the payments made during a calendar year, the Portfolio will be refunded the difference. Refunds, if any, are included in “12b-1 Distribution fees and shareholder servicing fees” in the Statement of Operations.
Janus Capital furnishes certain administration, compliance, and accounting services for the Portfolio and is reimbursed by the Portfolio for certain of its costs in providing those services (to the extent Janus Capital seeks reimbursement and such costs are not otherwise waived). In addition, employees of Janus Capital and/or its affiliates may serve as officers of the Trust. The Portfolio also pays for salaries, fees, and expenses of certain Janus Capital employees and Portfolio officers, with respect to certain specified administration functions they perform on behalf of the Portfolio. The Portfolio pays these costs based on out-of-pocket expenses incurred by Janus Capital, and these costs are separate and apart from advisory fees and other expenses paid in connection with the investment advisory services Janus Capital provides to the Portfolio. These amounts are disclosed as “Portfolio administration fees” on the Statement of Operations. Some expenses related to compensation payable to the Portfolio's Chief Compliance Officer and compliance staff are shared with the Portfolio. Total compensation of $28,304 was paid to the Chief Compliance Officer and certain compliance staff by the Trust during the period ended June 30, 2016. The Portfolio's portion is reported as part of “Other expenses” on the Statement of Operations.
The Board of Trustees has adopted a deferred compensation plan (the “Deferred Plan”) for independent Trustees to elect to defer receipt of all or a portion of the annual compensation they are entitled to receive from the Portfolio. All deferred fees are credited to an account established in the name of the Trustees. The amounts credited to the account then increase or decrease, as the case may be, in accordance with the performance of one or more of the Janus funds that are selected by the Trustees. The account balance continues to fluctuate in accordance with the performance of the selected fund or funds until final payment of all amounts are credited to the account. The fluctuation of the account balance is recorded by the Portfolio as unrealized appreciation/(depreciation) and is included as of June 30, 2016 on the Statement of Assets and Liabilities in the asset, “Non-interested Trustees’ deferred compensation,” and liability, “Non-interested Trustees’ deferred compensation fees.” Additionally, the recorded unrealized appreciation/(depreciation) is included in “Unrealized net appreciation/(depreciation) of investments, foreign currency translations and non-interested Trustees’ deferred compensation” on the Statement of Assets and Liabilities. Deferred compensation expenses for the period ended June 30, 2016 are included in “Non-interested Trustees’ fees and expenses” on the Statement of Operations. Trustees are allowed to change their designation of mutual funds from time to time. Amounts will be deferred until distributed in accordance with the Deferred Plan. Deferred fees of $20,150 were paid by the Trust to a Trustee under the Deferred Plan during the period ended June 30, 2016.
Pursuant to the provisions of the 1940 Act and related rules, the Portfolio may participate in an affiliated or nonaffiliated cash sweep program. In the cash sweep program, uninvested cash balances of the Portfolio may be used to purchase shares of affiliated or nonaffiliated money market funds or cash management pooled investment vehicles. The Portfolio is eligible to participate in the cash sweep program (the “Investing Funds”). As adviser, Janus Capital has an inherent conflict of interest because of its fiduciary duties to the affiliated money market funds or cash management pooled investment vehicles and the Investing Funds. Janus Cash Liquidity Fund LLC is an affiliated unregistered cash management pooled investment vehicle that invests primarily in highly-rated short-term fixed-income securities. Janus Cash Liquidity Fund LLC currently maintains a NAV of $1.00 per share and distributes income daily in a manner consistent with a registered product compliant with Rule 2a-7 under the 1940 Act. There are no restrictions on the Portfolio's ability to withdraw investments from Janus Cash Liquidity Fund LLC at will, and there are no unfunded capital commitments due from the Portfolio to Janus Cash Liquidity Fund LLC. The units of Janus Cash Liquidity Fund LLC are not charged any management fee, sales charge or service fee.
Any purchases and sales, realized gains/losses and recorded dividends from affiliated investments during the period ended June 30, 2016 can be found in a table located in the Notes to Schedule of Investments and Other Information.
5. Federal Income Tax Income and capital gains distributions are determined in accordance with income tax regulations that may differ from accounting principles generally accepted in the United States of America. These differences are due to differing treatments for items such as net short-term gains, deferral of wash sale losses, foreign currency transactions, net investment losses, and capital loss carryovers.
Janus Aspen Enterprise Portfolio Notes to Financial Statements (unaudited)
28 JUNE 30, 2016
The Portfolio has elected to treat gains and losses on forward foreign currency contracts as capital gains and losses, if applicable. Other foreign currency gains and losses on debt instruments are treated as ordinary income for federal income tax purposes pursuant to Section 988 of the Internal Revenue Code.
The aggregate cost of investments and the composition of unrealized appreciation and depreciation of investment securities for federal income tax purposes as of June 30, 2016 are noted below.
Unrealized appreciation and unrealized depreciation in the table below exclude appreciation/depreciation on foreign currency translations. The primary differences between book and tax appreciation or depreciation of investments are wash sale loss deferrals and investments in partnerships.
Federal Tax Cost Unrealized
AppreciationUnrealized
(Depreciation)Net Tax Appreciation/
(Depreciation) $ 590,667,736 $280,280,394 $(18,456,140) $ 261,824,254
6. Capital Share Transactions Period ended June 30, 2016 Year ended December 31, 2015 Shares Amount Shares Amount
Institutional Shares: Shares sold 504,545 $28,525,306 814,112 $49,077,557 Reinvested dividends and distributions 626,448 34,861,826 789,910 47,529,145 Shares repurchased (533,122) (30,139,219) (1,076,851) (65,573,433)Net Increase/(Decrease) 597,871 $33,247,913 527,171 $31,033,269 Service Shares: Shares sold 1,187,601 $63,486,897 1,538,508 $89,152,188 Reinvested dividends and distributions 587,823 31,048,820 602,094 34,582,431 Shares repurchased (505,823) (27,203,400) (955,872) (55,853,548)Net Increase/(Decrease) 1,269,601 $67,332,317 1,184,730 $67,881,071
7. Purchases and Sales of Investment Securities For the period ended June 30, 2016, the aggregate cost of purchases and proceeds from sales of investment securities (excluding any short-term securities, short-term options contracts, and in-kind transactions) was as follows:
Purchases of Securities
Proceeds from Salesof Securities
Purchases of Long-Term U.S. Government
Obligations
Proceeds from Sales of Long-Term U.S.
Government Obligations $109,447,784 $ 66,163,813 $ - $ -
8. Subsequent Event Management has evaluated whether any events or transactions occurred subsequent to June 30, 2016 and through the date of issuance of the Portfolio’s financial statements and determined that there were material events or transactions that would require recognition or disclosure in the Portfolio’s financial statements, as discussed below.
Janus Aspen Enterprise Portfolio Additional Information (unaudited)
Janus Aspen Series 29
Proxy Voting Policies and Voting Record A description of the policies and procedures that the Portfolio uses to determine how to vote proxies relating to its portfolio securities is available without charge: (i) upon request, by calling 1-800-525-0020 (toll free); (ii) on the Portfolio’s website at janus.com/proxyvoting; and (iii) on the SEC’s website at http://www.sec.gov. Additionally, information regarding the Portfolio’s proxy voting record for the most recent twelve-month period ended June 30 is also available, free of charge, through janus.com/proxyvoting and from the SEC’s website at http://www.sec.gov.
Quarterly Portfolio Holdings The Portfolio files its complete portfolio holdings (schedule of investments) with the SEC for the first and third quarters of each fiscal year on Form N-Q within 60 days of the end of such fiscal quarter. The Portfolio’s Form N-Q: (i) is available on the SEC’s website at http://www.sec.gov; (ii) may be reviewed and copied at the SEC’s Public Reference Room in Washington, D.C. (information on the Public Reference Room may be obtained by calling 1-800-SEC-0330); and (iii) is available without charge, upon request, by calling Janus at 1-800-525-0020 (toll free).
APPROVAL OF ADVISORY AGREEMENTS DURING THE PERIOD The Trustees of Janus Investment Fund and Janus Aspen Series, each of whom serves as an “independent” Trustee (the “Trustees”), oversee the management of each Fund of Janus Investment Fund and each Portfolio of Janus Aspen Series (each, a “Fund” and collectively, the “Funds”), and as required by law, determine annually whether to continue the investment advisory agreement for each Fund and the subadvisory agreements for the 16 Funds that utilize subadvisers.
In connection with their most recent consideration of those agreements for each Fund, the Trustees received and reviewed information provided by Janus Capital and the respective subadvisers in response to requests of the Trustees and their independent legal counsel. They also received and reviewed information and analysis provided by, and in response to requests of, their independent fee consultant. Throughout their consideration of the agreements, the Trustees were advised by their independent legal counsel. The Trustees met with management to consider the agreements, and also met separately in executive session with their independent legal counsel and their independent fee consultant.
At a meeting held on December 9, 2015, based on the Trustees’ evaluation of the information provided by Janus Capital, the subadvisers, and the independent fee consultant, as well as other information, the Trustees determined that the overall arrangements between each Fund and Janus Capital and each subadviser, as applicable, were fair and reasonable in light of the nature, extent and quality of the services provided by Janus Capital, its affiliates and the subadvisers, the fees charged for those services, and other matters that the Trustees considered relevant in the exercise of their business judgment. At that meeting, the Trustees unanimously approved the continuation of the investment advisory agreement for each Fund, and the subadvisory agreement for each subadvised Fund, for the period from either January 1 or February 1, 2016 through January 1 or February 1, 2017, respectively, subject to earlier termination as provided for in each agreement.
In considering the continuation of those agreements, the Trustees reviewed and analyzed various factors that they determined were relevant, including the factors described below, none of which by itself was considered dispositive. However, the material factors and conclusions that formed the basis for the Trustees’ determination to approve the continuation of the agreements are discussed separately below. Also included is a summary of the independent fee consultant’s conclusions and opinions that arose during, and were included as part of, the Trustees’ consideration of the agreements. “Management fees,” as used herein, reflect actual annual advisory fees and any administration fees (excluding out of pocket costs), net of any waivers.
Nature, Extent and Quality of Services The Trustees reviewed the nature, extent and quality of the services provided by Janus Capital and the subadvisers to the Funds, taking into account the investment objective, strategies and policies of each Fund, and the knowledge the Trustees gained from their regular meetings with management on at least a quarterly basis and their ongoing review of information related to the Funds. In addition, the Trustees reviewed the resources and key personnel of Janus Capital and each subadviser, particularly noting those employees who provide investment and risk management services to the Funds. The Trustees also considered other services provided to the Funds by Janus Capital or the subadvisers, such as managing the execution of portfolio transactions and the selection of broker-dealers for those transactions. The Trustees considered Janus Capital’s role as administrator to the Funds, noting that Janus Capital does not receive a fee
Janus Aspen Enterprise Portfolio Additional Information (unaudited)
30 JUNE 30, 2016
for its services but is reimbursed for its out-of-pocket costs. The Trustees considered the role of Janus Capital in monitoring adherence to the Funds’ investment restrictions, providing support services for the Trustees and Trustee committees, and overseeing communications with shareholders and the activities of other service providers, including monitoring compliance with various policies and procedures of the Funds and with applicable securities laws and regulations.
In this regard, the independent fee consultant noted that Janus Capital provides a number of different services for the Funds and Fund shareholders, ranging from investment management services to various other servicing functions, and that, in its opinion, Janus Capital is a capable provider of those services. The independent fee consultant also provided its belief that Janus Capital has developed a number of institutional competitive advantages that should enable it to provide superior investment and service performance over the long term.
The Trustees concluded that the nature, extent and quality of the services provided by Janus Capital or the subadviser to each Fund were appropriate and consistent with the terms of the respective advisory and subadvisory agreements, and that, taking into account steps taken to address those Funds whose performance lagged that of their peers for certain periods, the Funds were likely to benefit from the continued provision of those services. They also concluded that Janus Capital and each subadviser had sufficient personnel, with the appropriate education and experience, to serve the Funds effectively and had demonstrated its ability to attract well-qualified personnel.
Performance of the Funds The Trustees considered the performance results of each Fund over various time periods. They noted that they considered Fund performance data throughout the year, including periodic meetings with each Fund’s portfolio manager(s), and also reviewed information comparing each Fund’s performance with the performance of comparable funds and peer groups identified by Broadridge Financial Solutions, Inc. (“Broadridge”), an independent data provider, and with the Fund’s benchmark index. In this regard, the independent fee consultant found that the overall Funds’ performance has been strong: for the 36 months ended September 30, 2015, approximately 70% of the Funds were in the top two Broadridge quartiles of performance, and for the 12 months ended September 30, 2015, approximately 61% of the Funds were in the top two Broadridge quartiles of performance.
The Trustees considered the performance of each Fund, noting that performance may vary by share class, and noted the following:
Fixed-Income Funds and Money Market Funds • For Janus Flexible Bond Fund, the Trustees noted that the Fund’s performance was in the third Broadridge
quartile for the 36 months ended May 31, 2015 and the third Broadridge quartile for the 12 months ended May 31, 2015. The Trustees noted the reasons for the Fund’s underperformance and the steps Janus Capital had taken or was taking to improve performance.
• For Janus Global Bond Fund, the Trustees noted that the Fund’s performance was in the second Broadridge quartile for the 36 months ended May 31, 2015 and the second Broadridge quartile for the 12 months ended May 31, 2015.
• For Janus Global Unconstrained Bond Fund, the Trustees noted that the Fund’s performance was in the bottom Broadridge quartile for the 12 months ended May 31, 2015. The Trustees noted the reasons for the Fund’s underperformance, the steps Janus Capital had taken or was taking to improve performance, and its limited performance history.
• For Janus High-Yield Fund, the Trustees noted that the Fund’s performance was in the third Broadridge quartile for the 36 months ended May 31, 2015 and the third Broadridge quartile for the 12 months ended May 31, 2015. The Trustees noted the reasons for the Fund’s underperformance and the steps Janus Capital had taken or was taking to improve performance.
• For Janus Multi-Sector Income Fund, the Trustees noted that the Fund’s performance was in the first Broadridge quartile for the 12 months ended May 31, 2015.
• For Janus Real Return Fund, the Trustees noted that the Fund’s performance was in the first Broadridge quartile for the 36 months ended May 31, 2015 and the first Broadridge quartile for the 12 months ended May 31, 2015.
Janus Aspen Enterprise Portfolio Additional Information (unaudited)
Janus Aspen Series 31
• For Janus Short-Term Bond Fund, the Trustees noted that the Fund’s performance was in the second Broadridge quartile for the 36 months ended May 31, 2015 and the third Broadridge quartile for the 12 months ended May 31, 2015.
• For Janus Government Money Market Fund, the Trustees noted that the Fund’s performance was in the third Broadridge quartile for the 36 months ended May 31, 2015 and the third Broadridge quartile for the 12 months ended May 31, 2015. The Trustees noted the reasons for the Fund’s underperformance.
• For Janus Money Market Fund, the Trustees noted that the Fund’s performance was in the third Broadridge quartile for the 36 months ended May 31, 2015 and the bottom Broadridge quartile for the 12 months ended May 31, 2015. The Trustees noted the reasons for the Fund’s underperformance.
Asset Allocation Funds • For Janus Global Allocation Fund – Conservative, the Trustees noted that the Fund’s performance was in the
first Broadridge quartile for the 36 months ended May 31, 2015 and the third Broadridge quartile for the 12 months ended May 31, 2015.
• For Janus Global Allocation Fund – Growth, the Trustees noted that the Fund’s performance was in the third Broadridge quartile for the 36 months ended May 31, 2015 and the bottom Broadridge quartile for the 12 months ended May 31, 2015. The Trustees noted the reasons for the Fund’s underperformance and the steps Janus Capital had taken or was taking to improve performance.
• For Janus Global Allocation Fund – Moderate, the Trustees noted that the Fund’s performance was in the second Broadridge quartile for the 36 months ended May 31, 2015 and the third Broadridge quartile for the 12 months ended May 31, 2015.
Alternative Fund • For Janus Diversified Alternatives Fund, the Trustees noted that the Fund’s performance was in the second
Broadridge quartile for the 12 months ended May 31, 2015.
Value Funds • For Perkins International Value Fund, the Trustees noted that the Fund’s performance was in the second
Broadridge quartile for the 12 months ended May 31, 2015.
• For Perkins Global Value Fund, the Trustees noted that the Fund’s performance was in the third Broadridge quartile for the 36 months ended May 31, 2015 and the third Broadridge quartile for the 12 months ended May 31, 2015. The Trustees noted the reasons for the Fund’s underperformance, noting that the Fund has a performance fee structure that results in lower management fees during periods of underperformance, and the steps Janus Capital and Perkins had taken or were taking to improve performance.
• For Perkins Large Cap Value Fund, the Trustees noted that the Fund’s performance was in the bottom Broadridge quartile for the 36 months ended May 31, 2015 and the bottom Broadridge quartile for the 12 months ended May 31, 2015. The Trustees noted the reasons for the Fund’s underperformance, noting that the Fund has a performance fee structure that results in lower management fees during periods of underperformance, and the steps Janus Capital and Perkins had taken or were taking to improve performance.
• For Perkins Mid Cap Value Fund, the Trustees noted that the Fund’s performance was in the bottom Broadridge quartile for the 36 months ended May 31, 2015 and the bottom Broadridge quartile for the 12 months ended May 31, 2015. The Trustees noted the reasons for the Fund’s underperformance, noting that the Fund has a performance fee structure that results in lower management fees during periods of underperformance, and the steps Janus Capital and Perkins had taken or were taking to improve performance.
• For Perkins Select Value Fund, the Trustees noted that the Fund’s performance was in the bottom Broadridge quartile for the 36 months ended May 31, 2015 and the second Broadridge quartile for the 12 months ended May 31, 2015. The Trustees noted the reasons for the Fund’s underperformance, noting that the Fund has a performance fee structure that results in lower management fees during periods of underperformance, the steps Janus Capital and Perkins had taken or were taking to improve performance, and that the performance trend was improving.
Janus Aspen Enterprise Portfolio Additional Information (unaudited)
32 JUNE 30, 2016
• For Perkins Small Cap Value Fund, the Trustees noted that the Fund’s performance was in the bottom Broadridge quartile for the 36 months ended May 31, 2015 and the second Broadridge quartile for the 12 months ended May 31, 2015. The Trustees noted the reasons for the Fund’s underperformance, noting that the Fund has a performance fee structure that results in lower management fees during periods of underperformance, the steps Janus Capital and Perkins had taken or were taking to improve performance, and that the performance trend was improving.
• For Perkins Value Plus Income Fund, the Trustees noted that the Fund’s performance was in the second Broadridge quartile for the 36 months ended May 31, 2015 and the second Broadridge quartile for the 12 months ended May 31, 2015.
Mathematical Funds • For INTECH Emerging Markets Managed Volatility Fund, the Trustees noted that, due to limited performance
for the Fund, performance history was not a material factor.
• For INTECH Global Income Managed Volatility Fund, the Trustees noted that the Fund’s performance was in the first Broadridge quartile for the 36 months ended May 31, 2015 and the third Broadridge quartile for the 12 months ended May 31, 2015.
• For INTECH International Managed Volatility Fund, the Trustees noted that the Fund’s performance was in the bottom Broadridge quartile for the 36 months ended May 31, 2015 and the bottom Broadridge quartile for the 12 months ended May 31, 2015. The Trustees noted the reasons for the Fund’s underperformance and the steps Janus Capital and INTECH had taken or were taking to improve performance.
• For INTECH U.S. Core Fund, the Trustees noted that the Fund’s performance was in the second Broadridge quartile for the 36 months ended May 31, 2015 and the second Broadridge quartile for the 12 months ended May 31, 2015.
• For INTECH U.S. Managed Volatility Fund, the Trustees noted that the Fund’s performance was in the second Broadridge quartile for the 36 months ended May 31, 2015 and the third Broadridge quartile for the 12 months ended May 31, 2015.
Growth and Core Funds • For Janus Balanced Fund, the Trustees noted that the Fund’s performance was in the first Broadridge quartile
for the 36 months ended May 31, 2015 and the first Broadridge quartile for the 12 months ended May 31, 2015.
• For Janus Contrarian Fund, the Trustees noted that the Fund’s performance was in the first Broadridge quartile for the 36 months ended May 31, 2015 and the bottom Broadridge quartile for the 12 months ended May 31, 2015.
• For Janus Enterprise Fund, the Trustees noted that the Fund’s performance was in the second Broadridge quartile for the 36 months ended May 31, 2015 and the first Broadridge quartile for the 12 months ended May 31, 2015.
• For Janus Forty Fund, the Trustees noted that the Fund’s performance was in the second Broadridge quartile for the 36 months ended May 31, 2015 and the first Broadridge quartile for the 12 months ended May 31, 2015.
• For Janus Fund, the Trustees noted that the Fund’s performance was in the second Broadridge quartile for the 36 months ended May 31, 2015 and the first Broadridge quartile for the 12 months ended May 31, 2015.
• For Janus Growth and Income Fund, the Trustees noted that the Fund’s performance was in the third Broadridge quartile for the 36 months ended May 31, 2015 and in the third Broadridge quartile for the 12 months ended May 31, 2015. The Trustees noted the reasons for the Fund’s underperformance and the steps Janus Capital had taken or was taking to improve performance.
• For Janus Research Fund, the Trustees noted that the Fund’s performance was in the first Broadridge quartile for the 36 months ended May 31, 2015 and the first Broadridge quartile for the 12 months ended May 31, 2015.
Janus Aspen Enterprise Portfolio Additional Information (unaudited)
Janus Aspen Series 33
• For Janus Triton Fund, the Trustees noted that the Fund’s performance was in the second Broadridge quartile for the 36 months ended May 31, 2015 and the first Broadridge quartile for the 12 months ended May 31, 2015.
• For Janus Twenty Fund, the Trustees noted that the Fund’s performance was in the third Broadridge quartile for the 36 months ended May 31, 2015 and the bottom Broadridge quartile for the 12 months ended May 31, 2015. The Trustees noted the reasons for the Fund’s underperformance, noting that the Fund has a performance fee structure that results in lower management fees during periods of underperformance, and the steps Janus Capital had taken or was taking to improve performance.
• For Janus Venture Fund, the Trustees noted that the Fund’s performance was in the first Broadridge quartile for the 36 months ended May 31, 2015 and the first Broadridge quartile for the 12 months ended May 31, 2015.
Global and International Funds • For Janus Asia Equity Fund, the Trustees noted that the Fund’s performance was in the third Broadridge
quartile for the 36 months ended May 31, 2015 and the first Broadridge quartile for the 12 months ended May 31, 2015. The Trustees noted the reasons for the Fund’s underperformance, noting that the Fund has a performance fee structure that results in lower management fees during periods of underperformance, the steps Janus Capital had taken or was taking to improve performance, and that the performance trend was improving.
• For Janus Emerging Markets Fund, the Trustees noted that the Fund’s performance was in the second Broadridge quartile for the 36 months ended May 31, 2015 and the first Broadridge quartile for the 12 months ended May 31, 2015.
• For Janus Global Life Sciences Fund, the Trustees noted that the Fund’s performance was in the first Broadridge quartile for the 36 months ended May 31, 2015 and the first Broadridge quartile for the 12 months ended May 31, 2015.
• For Janus Global Real Estate Fund, the Trustees noted that the Fund’s performance was in the first Broadridge quartile for the 36 months ended May 31, 2015 and the first Broadridge quartile for the 12 months ended May 31, 2015.
• For Janus Global Research Fund, the Trustees noted that the Fund’s performance was in the second Broadridge quartile for the 36 months ended May 31, 2015 and the first Broadridge quartile for the 12 months ended May 31, 2015.
• For Janus Global Select Fund, the Trustees noted that the Fund’s performance was in the second Broadridge quartile for the 36 months ended May 31, 2015 and the first Broadridge quartile for the 12 months ended May 31, 2015.
• For Janus Global Technology Fund, the Trustees noted that the Fund’s performance was in the third Broadridge quartile for the 36 months ended May 31, 2015 and the third Broadridge quartile for the 12 months ended May 31, 2015. The Trustees noted the reasons for the Fund’s underperformance and the steps Janus Capital had taken or was taking to improve performance.
• For Janus International Equity Fund, the Trustees noted that the Fund’s performance was in the second Broadridge quartile for the 36 months ended May 31, 2015 and the second Broadridge quartile for the 12 months ended May 31, 2015.
• For Janus Overseas Fund, the Trustees noted that the Fund’s performance was in the bottom Broadridge quartile for the 36 months ended May 31, 2015 and the bottom Broadridge quartile for the 12 months ended May 31, 2015. The Trustees noted the reasons for the Fund’s underperformance, noting that the Fund has a performance fee structure that results in lower management fees during periods of underperformance, and the steps Janus Capital had taken or was taking to improve performance.
Janus Aspen Enterprise Portfolio Additional Information (unaudited)
34 JUNE 30, 2016
Janus Aspen Series • For Janus Aspen Balanced Portfolio, the Trustees noted that the Fund’s performance was in the first
Broadridge quartile for the 36 months ended May 31, 2015 and the first Broadridge quartile for the 12 months ended May 31, 2015.
• For Janus Aspen Enterprise Portfolio, the Trustees noted that the Fund’s performance was in the second Broadridge quartile for the 36 months ended May 31, 2015 and the first Broadridge quartile for the 12 months ended May 31, 2015.
• For Janus Aspen Flexible Bond Portfolio, the Trustees noted that the Fund’s performance was in the second Broadridge quartile for the 36 months ended May 31, 2015 and the second Broadridge quartile for the 12 months ended May 31, 2015.
• For Janus Aspen Forty Portfolio, the Trustees noted that the Fund’s performance was in the second Broadridge quartile for the 36 months ended May 31, 2015 and the first Broadridge quartile for the 12 months ended May 31, 2015.
• For Janus Aspen Global Allocation Portfolio – Moderate, the Trustees noted that the Fund’s performance was in the first Broadridge quartile for the 36 months ended May 31, 2015 and the bottom Broadridge quartile for the 12 months ended May 31, 2015.
• For Janus Aspen Global Research Portfolio, the Trustees noted that the Fund’s performance was in the first Broadridge quartile for the 36 months ended May 31, 2015 and the second Broadridge quartile for the 12 months ended May 31, 2015.
• For Janus Aspen Global Technology Portfolio, the Trustees noted that the Fund’s performance was in the second Broadridge quartile for the 36 months ended May 31, 2015 and the third Broadridge quartile for the 12 months ended May 31, 2015.
• For Janus Aspen Global Unconstrained Bond Portfolio, the Trustees noted that, due to limited performance for the Fund, performance history was not a material factor.
• For Janus Aspen INTECH U.S. Low Volatility Portfolio, the Trustees noted that the Fund’s performance was in the first Broadridge quartile for the 12 months ended May 31, 2015.
• For Janus Aspen Janus Portfolio, the Trustees noted that the Fund’s performance was in the second Broadridge quartile for the 36 months ended May 31, 2015 and the first Broadridge quartile for the 12 months ended May 31, 2015.
• For Janus Aspen Overseas Portfolio, the Trustees noted that the Fund’s performance was in the bottom Broadridge quartile for the 36 months ended May 31, 2015 and the bottom Broadridge quartile for the 12 months ended May 31, 2015. The Trustees noted the reasons for the Fund’s underperformance, noting that the Fund has a performance fee structure that results in lower management fees during periods of underperformance, and the steps Janus Capital had taken or was taking to improve performance.
• For Janus Aspen Perkins Mid Cap Value Portfolio, the Trustees noted that the Fund’s performance was in the bottom Broadridge quartile for the 36 months ended May 31, 2015 and the bottom Broadridge quartile for the 12 months ended May 31, 2015. The Trustees noted the reasons for the Fund’s underperformance, noting that the Fund has a performance fee structure that results in lower management fees during periods of underperformance, and the steps Janus Capital and Perkins had taken or were taking to improve performance.
In consideration of each Fund’s performance, the Trustees concluded that, taking into account the factors relevant to performance, as well as other considerations, including steps taken to improve performance, the Fund’s performance warranted continuation of the Fund’s investment advisory and subadvisory agreement(s).
Costs of Services Provided The Trustees examined information regarding the fees and expenses of each Fund in comparison to similar information for other comparable funds as provided by Broadridge, an independent data provider. They also reviewed an analysis of that information provided by their independent fee consultant and noted that the rate of management (investment advisory and any administration, but excluding out-of-pocket costs) fees for many of the Funds, after applicable waivers,
Janus Aspen Enterprise Portfolio Additional Information (unaudited)
Janus Aspen Series 35
was below the mean management fee rate of the respective peer group of funds selected by an independent data provider. The Trustees also examined information regarding the subadvisory fees charged for subadvisory services, as applicable, noting that all such fees were paid by Janus Capital out of its management fees collected from such Fund.
The independent fee consultant provided its belief that the management fees charged by Janus Capital to each of the Funds under the current investment advisory and administration agreements are reasonable in relation to the services provided by Janus Capital. The independent fee consultant found: (1) the total expenses and management fees of the Funds to be reasonable relative to other mutual funds; (2) total expenses, on average, were 14% below the mean total expenses of their respective Broadridge Expense Group peers and 24% below the mean total expenses for their Broadridge Expense Universes; (3) management fees for the Funds, on average, were 15% below the mean management fees for their Expense Groups and 19% below the mean for their Expense Universes; and (4) Fund expenses at the functional level for each asset and share class category were reasonable. The Trustees also considered the total expenses for each share class of each Fund compared to the mean total expenses for its Broadridge Expense Group peers and to mean total expenses for its Broadridge Expense Universe.
The independent fee consultant concluded that, based on its strategic review of expenses at the complex, category and individual fund level, Fund expenses were found to be reasonable relative to both Expense Group and Expense Universe benchmarks. Further, for certain Funds, the independent fee consultant also performed a systematic “focus list” analysis of expenses in the context of the performance or service delivered to each set of investors in each share class in each selected Fund. Based on this analysis, the independent fee consultant found that the combination of service quality/performance and expenses on these individual Funds and share classes were reasonable in light of performance trends, performance histories, and existence of performance fees, breakpoints, and expense waivers on such Funds.
The Trustees considered the methodology used by Janus Capital and each subadviser in determining compensation payable to portfolio managers, the competitive environment for investment management talent, and the competitive market for mutual funds in different distribution channels.
The Trustees also reviewed management fees charged by Janus Capital and each subadviser to comparable separate account clients and to comparable non-affiliated funds subadvised by Janus Capital or by a subadviser (for which Janus Capital or the subadviser provides only or primarily portfolio management services). Although in most instances subadvisory and separate account fee rates for various investment strategies were lower than management fee rates for Funds having a similar strategy, the Trustees considered that Janus Capital noted that, under the terms of the management agreements with the Funds, Janus Capital performs significant additional services for the Funds that it does not provide to those other clients, including administration services, oversight of the Funds’ other service providers, trustee support, regulatory compliance and numerous other services, and that, in serving the Funds, Janus Capital assumes many legal risks and other costs that it does not assume in servicing its other clients. Moreover, they noted that the independent fee consultant found that: (1) the management fees Janus Capital charges to the Funds are reasonable in relation to the management fees Janus Capital charges to its institutional and subadvised accounts; (2) these institutional and subadvised accounts have different service and infrastructure needs; (3) the average spread between management fees charged to the Funds and those charged to Janus Capital’s institutional accounts is reasonable relative to the average spreads seen in the industry; and (4) by one estimation methodology, the fee margins implied by Janus Capital’s subadvised fees when compared to its mutual fund fees are reasonable relative to the estimated fee margins in the industry and relative to estimated fee margins of fund managers using Janus Capital as a subadviser.
The Trustees considered the fees for each Fund for its fiscal year ended in 2014, and noted the following with regard to each Fund’s total expenses, net of applicable fee waivers (the Fund’s “total expenses”):
Fixed-Income Funds and Money Market Funds • For Janus Flexible Bond Fund, the Trustees noted that, although the Fund’s total expenses exceeded the peer
group mean for certain share classes, overall the Fund’s total expenses were reasonable. The Trustees also noted that Janus Capital has contractually agreed to limit the Fund’s expenses, although this limit did not apply because the Fund’s total expenses were already below the applicable fee limit.
Janus Aspen Enterprise Portfolio Additional Information (unaudited)
36 JUNE 30, 2016
• For Janus Global Bond Fund, the Trustees noted that although the Fund’s total expenses exceeded the peer group mean for certain share classes, overall the Fund’s total expenses were reasonable. The Trustees also noted that Janus Capital has contractually agreed to limit the Fund’s expenses.
• For Janus Global Unconstrained Bond Fund, the Trustees noted that although the Fund’s total expenses exceeded the peer group mean for certain share classes, overall the Fund’s total expenses were reasonable. The Trustees also noted that Janus Capital has contractually agreed to limit the Fund’s expenses.
• For Janus High-Yield Fund, the Trustees noted that, although the Fund’s total expenses exceeded the peer group mean for certain share classes, overall the Fund’s total expenses were reasonable. The Trustees also noted that Janus Capital has contractually agreed to limit the Fund’s expenses, although this limit did not apply because the Fund’s total expenses were already below the applicable fee limit.
• For Janus Multi-Sector Income Fund, the Trustees noted that, although the Fund’s total expenses exceeded the peer group mean for certain share classes, overall the Fund’s total expenses were reasonable. The Trustees also noted that Janus has contractually agreed to limit the Fund’s expenses.
• For Janus Real Return Fund, the Trustees noted that, although the Fund’s total expenses exceeded the peer group mean for all share classes, overall the Fund’s total expenses were reasonable. The Trustees also noted that Janus Capital has contractually agreed to limit the Fund’s expenses.
• For Janus Short-Term Bond Fund, the Trustees noted that, although the Fund’s total expenses exceeded the peer group mean for all share classes, overall the Fund’s total expenses were reasonable. The Trustees also noted that Janus Capital has contractually agreed to limit the Fund’s expenses.
• For Janus Government Money Market Fund, the Trustees noted that the Fund’s total expenses exceeded the peer group mean for both share classes. The Trustees considered that management fees for this Fund are higher than the peer group mean due to the Fund’s management fee including other costs, such as custody and transfer agent services, while many funds in the peer group pay these expenses separately from their management fee. In addition, the Trustees considered that Janus Capital voluntarily waives one-half of its advisory fee and other expenses in order to maintain a positive yield.
• For Janus Money Market Fund, the Trustees noted that the Fund’s total expenses were below the peer group mean for both share classes. In addition, the Trustees considered that Janus Capital voluntarily waives one-half of its advisory fee and other expenses in order to maintain a positive yield.
Asset Allocation Funds • For Janus Global Allocation Fund – Conservative, the Trustees noted that the Fund’s total expenses were
below the peer group mean for all share classes.
• For Janus Global Allocation Fund – Growth, the Trustees noted that the Fund’s total expenses were below the peer group mean for all share classes.
• For Janus Global Allocation Fund – Moderate, the Trustees noted that, although the Fund’s total expenses exceeded the peer group mean for certain share classes, overall the Fund’s total expenses were reasonable. The Trustees also noted that Janus Capital has contractually agreed to limit the Fund’s expenses.
Alternative Fund • For Janus Diversified Alternatives Fund, the Trustees noted that, although the Fund’s total expenses exceeded
the peer group mean for one share class, overall the Fund’s total expenses were reasonable. The Trustees also noted that Janus Capital has contractually agreed to limit the Fund’s expenses.
Value Funds • For Perkins International Value Fund, the Trustees noted that, although the Fund’s total expenses exceeded
the peer group mean for certain share classes, overall the Fund’s total expenses were reasonable. The Trustees also noted that Janus Capital has contractually agreed to limit the Fund’s expenses.
• For Perkins Global Value Fund, the Trustees noted that, although the Fund’s total expenses exceeded the peer group mean for one share class, overall the Fund’s total expenses were reasonable.
Janus Aspen Enterprise Portfolio Additional Information (unaudited)
Janus Aspen Series 37
• For Perkins Large Cap Value Fund, the Trustees noted that, although the Fund’s total expenses exceeded the peer group mean for certain share classes, overall the Fund’s total expenses were reasonable. The Trustees also noted that Janus Capital has contractually agreed to limit the Fund’s expenses.
• For Perkins Mid Cap Value Fund, the Trustees noted that, although the Fund’s total expenses exceeded the peer group mean for one share class, overall the Fund’s total expenses were reasonable. The Trustees also noted that Janus Capital has contractually agreed to limit the Fund’s expenses, although this limit did not apply because the Fund’s total expenses were already below the applicable fee limit.
• For Perkins Select Value Fund, the Trustees noted that, although the Fund’s total expenses exceeded the peer group mean for one share class, overall the Fund’s total expenses were reasonable. The Trustees also noted that Janus Capital has contractually agreed to limit the Fund’s expenses.
• For Perkins Small Cap Value Fund, the Trustees noted that the Fund’s total expenses were below the peer group mean for all share classes.
• For Perkins Value Plus Income Fund, the Trustees noted that although the Fund’s total expenses exceeded the peer group mean for one share class, overall the Fund’s total expenses were reasonable. The Trustees also noted that Janus Capital had contractually agreed to limit the Fund’s expenses.
Mathematical Funds • For INTECH Emerging Markets Managed Volatility Fund, the Trustees noted that although the Fund’s total
expenses exceeded the peer group mean for certain share classes, overall the Fund’s total expenses were reasonable. The Trustees also noted that Janus Capital has contractually agreed to limit the Fund’s expenses.
• For INTECH Global Income Managed Volatility Fund, the Trustees noted that the Fund’s total expenses were below the peer group mean for all share classes.
• For INTECH International Managed Volatility Fund, the Trustees noted that although the Fund’s total expenses exceeded the peer group mean for one share class, overall the Fund’s total expenses were reasonable. The Trustees also noted that Janus Capital had contractually agreed to limit the Fund’s expenses, although this limit did not apply because the Fund’s total expenses were already below the applicable fee limit.
• For INTECH U.S. Core Fund, the Trustees noted that although the Fund’s total expenses exceeded the peer group mean for one share class, overall the Fund’s total expenses were reasonable. The Trustees also noted that Janus Capital has contractually agreed to limit the Fund’s expenses, although this limit did not apply because the Fund’s total expenses were already below the applicable fee limit.
• For INTECH U.S. Managed Volatility Fund, the Trustees noted that the Fund’s total expenses exceeded the peer group mean for one share class. The Trustees also noted that Janus Capital had contractually agreed to limit the Fund’s expenses.
Growth and Core Funds • For Janus Balanced Fund, the Trustees noted that, although the Fund’s total expenses exceeded the peer
group mean for one share class, overall the Fund’s total expenses were reasonable. The Trustees also noted that Janus Capital has contractually agreed to limit the Fund’s expenses, although this limit did not apply because the Fund’s total expenses were already below the applicable fee limit.
• For Janus Contrarian Fund, the Trustees noted that, although the Fund’s total expenses exceeded the peer group mean for certain share classes, overall the Fund’s total expenses were reasonable. The Trustees also noted that Janus Capital has contractually agreed to limit the Fund’s expenses, although this limit did not apply because the Fund’s total expenses were already below the applicable fee limit.
• For Janus Enterprise Fund, the Trustees noted that, although the Fund’s total expenses exceeded the peer group mean for certain share classes, overall the Fund’s total expenses were reasonable. The Trustees also noted that Janus Capital has contractually agreed to limit the Fund’s expenses, although this limit did not apply because the Fund’s total expenses were already below the applicable fee limit.
• For Janus Forty Fund, the Trustees noted that the Fund’s total expenses were below the peer group mean for all share classes.

Janus Aspen Enterprise Portfolio Additional Information (unaudited)
38 JUNE 30, 2016
• For Janus Fund, the Trustees noted that the Fund’s total expenses were below the peer group mean for all share classes.
• For Janus Growth and Income Fund, the Trustees noted that, although the Fund’s total expenses exceeded the peer group mean for certain share classes, overall the Fund’s total expenses were reasonable. The Trustees also noted that Janus Capital has contractually agreed to limit the Fund’s expenses, although this limit did not apply because the Fund’s total expenses were already below the applicable fee limit.
• For Janus Research Fund, the Trustees noted that the Fund’s total expenses were below the peer group mean for all share classes.
• For Janus Triton Fund, the Trustees noted that, although the Fund’s total expenses exceeded the peer group mean for one share class, overall the Fund’s total expenses were reasonable. The Trustees also noted that Janus Capital has contractually agreed to limit the Fund’s expenses, although this limit did not apply because the Fund’s total expenses were already below the applicable fee limit.
• For Janus Twenty Fund, the Trustees noted that the Fund’s total expenses were below the peer group mean for all share classes.
• For Janus Venture Fund, the Trustees noted that, although the Fund’s total expenses exceeded the peer group mean for one share class, overall the Fund’s total expenses were reasonable. The Trustees also noted that Janus Capital has contractually agreed to limit the Fund’s expenses, although this limit did not apply because the Fund’s total expenses were already below the applicable fee limit.
Global and International Funds • For Janus Asia Equity Fund, the Trustees noted that the Fund’s total expenses were below the peer group
mean for all share classes.
• For Janus Emerging Markets Fund, the Trustees noted that, although the Fund’s total expenses exceeded the peer group mean for certain share classes, overall the Fund’s total expenses were reasonable. The Trustees also noted that Janus Capital has contractually agreed to limit the Fund’s expenses.
• For Janus Global Life Sciences Fund, the Trustees noted that the Fund’s total expenses were below the peer group mean for all share classes.
• For Janus Global Real Estate Fund, the Trustees noted that, although the Fund’s total expenses exceeded the peer group mean for one share class, overall the Fund’s total expenses were reasonable. The Trustees also noted that Janus Capital has contractually agreed to limit the Fund’s expenses.
• For Janus Global Research Fund, the Trustees noted that the Fund’s total expenses were below the peer group mean for all share classes.
• For Janus Global Select Fund, the Trustees noted that the Fund’s total expenses were below the peer group mean for all share classes.
• For Janus Global Technology Fund, the Trustees noted that the Fund’s total expenses were below the peer group mean for all share classes.
• For Janus International Equity Fund, the Trustees noted that, although the Fund’s total expenses exceeded the peer group mean for one share class, overall the Fund’s total expenses were reasonable. The Trustees also noted that Janus Capital has contractually agreed to limit the Fund’s expenses, although this limit did not apply because the Fund’s total expenses were already below the applicable fee limit.
• For Janus Overseas Fund, the Trustees noted that the Fund’s total expenses were below the peer group mean for all share classes.
Janus Aspen Series • For Janus Aspen Balanced Portfolio, the Trustees noted that the Fund’s total expenses were below the peer
group mean for both share classes.
Janus Aspen Enterprise Portfolio Additional Information (unaudited)
Janus Aspen Series 39
• For Janus Aspen Enterprise Portfolio, the Trustees noted that the Fund’s total expenses were below the peer group mean for both share classes.
• For Janus Aspen Flexible Bond Portfolio, the Trustees noted that, although the Fund’s total expenses exceeded the peer group mean for one share class, overall the Fund’s total expenses were reasonable. The Trustees also noted that Janus Capital had contractually agreed to limit the Fund’s expenses.
• For Janus Aspen Forty Portfolio, the Trustees noted that the Fund’s total expenses were below the peer group mean for both share classes.
• For Janus Aspen Global Allocation Portfolio - Moderate, the Trustees noted that, although the Fund’s total expenses exceeded the peer group mean for both share classes, overall the Fund’s total expenses were reasonable. The Trustees also noted that Janus Capital has contractually agreed to limit the Fund’s expenses.
• For Janus Aspen Global Research Portfolio, the Trustees noted that the Fund’s total expenses were below the peer group mean for both share classes.
• For Janus Aspen Global Technology Portfolio, the Trustees noted that the Fund’s total expenses were below the peer group mean for both share classes.
• For Janus Aspen Global Unconstrained Bond Portfolio, the Trustees noted that, although the Fund’s total expenses exceeded the peer group mean for both share classes, overall the Fund’s total expenses were reasonable. The Trustees also noted that Janus Capital had contractually agreed to limit the Fund’s expenses.
• For Janus Aspen INTECH U.S. Low Volatility Portfolio, the Trustees noted that the Fund’s total expenses were below the peer group mean for its sole share class.
• For Janus Aspen Janus Portfolio, the Trustees noted that the Fund’s total expenses were below the peer group mean for both share classes.
• For Janus Aspen Overseas Portfolio, the Trustees noted that the Fund’s total expenses were below the peer group mean for both share classes.
• For Janus Aspen Perkins Mid Cap Value Portfolio, the Trustees noted that the Fund’s total expenses were below the peer group mean for both share classes.
The Trustees reviewed information on the profitability to Janus Capital and its affiliates of their relationships with each Fund, as well as an explanation of the methodology utilized by Janus Capital when allocating various expenses of Janus Capital and its affiliates with respect to contractual relationships with the Funds and other clients. The Trustees also reviewed the financial statements and corporate structure of Janus Capital’s parent company. In their review, the Trustees considered whether Janus Capital and each subadviser receive adequate incentives and resources to manage the Funds effectively. The Trustees recognized that profitability comparisons among fund managers are difficult because very little comparative information is publicly available, and the profitability of any fund manager is affected by numerous factors, including the organizational structure of the particular fund manager, the types of funds and other accounts it manages, possible other lines of business, the methodology for allocating expenses, and the fund manager’s capital structure and cost of capital. However, taking into account those factors and the analysis provided by the Trustees’ independent fee consultant, and based on the information available, the Trustees concluded that Janus Capital’s profitability with respect to each Fund in relation to the services rendered was reasonable.
The independent fee consultant found that, while assessing the reasonableness of expenses in light of Janus Capital’s profits is dependent on comparisons with other publicly-traded mutual fund advisers, and that these comparisons are limited in accuracy by differences in complex size, business mix, institutional account orientation, and other factors, after accepting these limitations, the level of profit earned by Janus Capital from managing the Funds is reasonable.
The Trustees concluded that the management fees payable by each Fund to Janus Capital and its affiliates, as well as the fees paid by Janus Capital to the subadvisers of subadvised Funds, were reasonable in relation to the nature, extent, and quality of the services provided, taking into account the fees charged by other advisers for managing comparable mutual funds with similar strategies, the fees Janus Capital and the subadvisers charge to other clients, and, as applicable, the impact of fund performance on management fees payable by the Funds. The Trustees also concluded that each Fund’s total expenses were reasonable, taking into account the size of the Fund, the quality of services
Janus Aspen Enterprise Portfolio Additional Information (unaudited)
40 JUNE 30, 2016
provided by Janus Capital and any subadviser, the investment performance of the Fund, and any expense limitations agreed to or provided by Janus Capital.
Economies of Scale The Trustees considered information about the potential for Janus Capital to realize economies of scale as the assets of the Funds increase. They noted that their independent fee consultant provided an analysis of economies of scale, which included discussion of analysis from prior years. They also noted that, although many Funds pay advisory fees at a base fixed rate as a percentage of net assets, without any breakpoints, their independent fee consultant concluded that 85% of these Funds have contractual management fees (gross of waivers) below their Broadridge expense group averages and, overall, 80% of the Funds are below their respective expense group averages for contractual management fees. They also noted that for those Funds whose expenses are being reduced by the contractual expense limitations of Janus Capital, Janus Capital is subsidizing the Funds because they have not reached adequate scale. Moreover, as the assets of some of the Funds have declined in the past few years, certain Funds have benefited from having advisory fee rates that have remained constant rather than increasing as assets declined. In addition, performance fee structures have been implemented for various Funds that have caused the effective rate of advisory fees payable by such a Fund to vary depending on the investment performance of the Fund relative to its benchmark index over the measurement period; and a few Funds have fee schedules with breakpoints and reduced fee rates above certain asset levels. The Trustees also noted that the Funds share directly in economies of scale through the lower charges of third-party service providers that are based in part on the combined scale of all of the Funds. Based on all of the information they reviewed, including research and analysis conducted by the Trustees’ independent fee consultant, the Trustees concluded that the current fee structure of each Fund was reasonable and that the current rates of fees do reflect a sharing between Janus Capital and the Fund of any economies of scale that may be present at the current asset level of the Fund.
The independent fee consultant concluded that, given the limitations of various analytical approaches to economies of scale considered in prior years, and their conflicting results, its analyses could not confirm or deny the existence of economies of scale in the Janus complex. Further, the independent fee consultant provided its belief that Fund investors are well-served by the fee levels and performance fee structures in place on the Funds in light of any economies of scale that may be present at Janus Capital.
Other Benefits to Janus Capital The Trustees also considered benefits that accrue to Janus Capital and its affiliates and subadvisers to the Funds from their relationships with the Funds. They recognized that two affiliates of Janus Capital separately serve the Funds as transfer agent and distributor, respectively, and the transfer agent receives compensation directly from the non-money market funds for services provided. The Trustees also considered Janus Capital’s past and proposed use of commissions paid by the Funds on portfolio brokerage transactions to obtain proprietary and third-party research products and services benefiting the Fund and/or other clients of Janus Capital and/or Janus Capital, and/or a subadviser to a Fund. The Trustees concluded that Janus Capital’s and the subadvisers’ use of these types of client commission arrangements to obtain proprietary and third-party research products and services was consistent with regulatory requirements and guidelines and was likely to benefit each Fund. The Trustees also concluded that, other than the services provided by Janus Capital and its affiliates and subadvisers pursuant to the agreements and the fees to be paid by each Fund therefor, the Funds and Janus Capital and the subadvisers may potentially benefit from their relationship with each other in other ways. They concluded that Janus Capital and/or the subadvisers benefits from the receipt of research products and services acquired through commissions paid on portfolio transactions of the Funds and that the Funds benefit from Janus Capital’s and/or the subadvisers’ receipt of those products and services as well as research products and services acquired through commissions paid by other clients of Janus Capital and/or other clients of the subadvisers. They further concluded that the success of any Fund could attract other business to Janus Capital, the subadvisers or other Janus funds, and that the success of Janus Capital and the subadvisers could enhance Janus Capital’s and the subadvisers’ ability to serve the Funds.
Janus Aspen Enterprise Portfolio Useful Information About Your Portfolio Report (unaudited)
Janus Aspen Series 41
Management Commentary The Management Commentary in this report includes valuable insight as well as statistical information to help you understand how your Portfolio’s performance and characteristics stack up against those of comparable indices.
If the Portfolio invests in foreign securities, this report may include information about country exposure. Country exposure is based primarily on the country of risk. A company may be allocated to a country based on other factors such as location of the company’s principal office, the location of the principal trading market for the company’s securities, or the country where a majority of the company’s revenues are derived.
Please keep in mind that the opinions expressed in the Management Commentary are just that: opinions. They are a reflection based on best judgment at the time this report was compiled, which was June 30, 2016. As the investing environment changes, so could opinions. These views are unique and are not necessarily shared by fellow employees or by Janus in general.
Performance Overviews Performance overview graphs compare the performance of a hypothetical $10,000 investment in the Portfolio with one or more widely used market indices. When comparing the performance of the Portfolio with an index, keep in mind that market indices are not available for investment and do not reflect deduction of expenses.
Average annual total returns are quoted for a Portfolio with more than one year of performance history. Average annual total return is calculated by taking the growth or decline in value of an investment over a period of time, including reinvestment of dividends and distributions, then calculating the annual compounded percentage rate that would have produced the same result had the rate of growth been constant throughout the period. Average annual total return does not reflect the deduction of taxes that a shareholder would pay on Portfolio distributions or redemptions of Portfolio shares.
Cumulative total returns are quoted for a Portfolio with less than one year of performance history. Cumulative total return is the growth or decline in value of an investment over time, independent of the period of time involved. Cumulative total return does not reflect the deduction of taxes that a shareholder would pay on Portfolio distributions or redemptions of Portfolio shares.
Pursuant to federal securities rules, expense ratios shown in the performance chart reflect subsidized (if applicable) and unsubsidized ratios. The total annual fund operating expenses ratio is gross of any fee waivers, reflecting the Portfolio’s unsubsidized expense ratio. The net annual fund operating expenses ratio (if applicable) includes contractual waivers of Janus Capital and reflects the Portfolio’s subsidized expense ratio. Ratios may be higher or lower than those shown in the “Financial Highlights” in this report.
Schedule of Investments Following the performance overview section is the Portfolio’s Schedule of Investments. This schedule reports the types of securities held in the Portfolio on the last day of the reporting period. Securities are usually listed by type (common stock, corporate bonds, U.S. Government obligations, etc.) and by industry classification (banking, communications, insurance, etc.). Holdings are subject to change without notice.
The value of each security is quoted as of the last day of the reporting period. The value of securities denominated in foreign currencies is converted into U.S. dollars.
If the Portfolio invests in foreign securities, it will also provide a summary of investments by country. This summary reports the Portfolio exposure to different countries by providing the percentage of securities invested in each country. The country of each security represents the country of risk. The Portfolio’s Schedule of Investments relies upon the industry group and country classifications published by Barclays and/or MSCI Inc.
Tables listing details of individual forward currency contracts, futures, written options, swaptions, and swaps follow the Portfolio’s Schedule of Investments (if applicable).
Statement of Assets and Liabilities This statement is often referred to as the “balance sheet.” It lists the assets and liabilities of the Portfolio on the last day of the reporting period.
Janus Aspen Enterprise Portfolio Useful Information About Your Portfolio Report (unaudited)
42 JUNE 30, 2016
The Portfolio’s assets are calculated by adding the value of the securities owned, the receivable for securities sold but not yet settled, the receivable for dividends declared but not yet received on securities owned, and the receivable for Portfolio shares sold to investors but not yet settled. The Portfolio’s liabilities include payables for securities purchased but not yet settled, Portfolio shares redeemed but not yet paid, and expenses owed but not yet paid. Additionally, there may be other assets and liabilities such as unrealized gain or loss on forward currency contracts.
The section entitled “Net Assets Consist of” breaks down the components of the Portfolio’s net assets. Because the Portfolio must distribute substantially all earnings, you will notice that a significant portion of net assets is shareholder capital.
The last section of this statement reports the net asset value (“NAV”) per share on the last day of the reporting period. The NAV is calculated by dividing the Portfolio’s net assets for each share class (assets minus liabilities) by the number of shares outstanding.
Statement of Operations This statement details the Portfolio’s income, expenses, realized gains and losses on securities and currency transactions, and changes in unrealized appreciation or depreciation of Portfolio holdings.
The first section in this statement, entitled “Investment Income,” reports the dividends earned from securities and interest earned from interest-bearing securities in the Portfolio.
The next section reports the expenses incurred by the Portfolio, including the advisory fee paid to the investment adviser, transfer agent fees and expenses, and printing and postage for mailing statements, financial reports and prospectuses. Expense offsets and expense reimbursements, if any, are also shown.
The last section lists the amounts of realized gains or losses from investment and foreign currency transactions, and changes in unrealized appreciation or depreciation of investments and foreign currency-denominated assets and liabilities. The Portfolio will realize a gain (or loss) when it sells its position in a particular security. A change in unrealized gain (or loss) refers to the change in net appreciation or depreciation of the Portfolio during the reporting period. “Net Realized and Unrealized Gain/(Loss) on Investments” is affected both by changes in the market value of Portfolio holdings and by gains (or losses) realized during the reporting period.
Statements of Changes in Net Assets These statements report the increase or decrease in the Portfolio’s net assets during the reporting period. Changes in the Portfolio’s net assets are attributable to investment operations, dividends and distributions to investors, and capital share transactions. This is important to investors because it shows exactly what caused the Portfolio’s net asset size to change during the period.
The first section summarizes the information from the Statement of Operations regarding changes in net assets due to the Portfolio’s investment operations. The Portfolio’s net assets may also change as a result of dividend and capital gains distributions to investors. If investors receive their dividends and/or distributions in cash, money is taken out of the Portfolio to pay the dividend and/or distribution. If investors reinvest their dividends and/or distributions, the Portfolio’s net assets will not be affected. If you compare the Portfolio’s “Net Decrease from Dividends and Distributions” to “Reinvested Dividends and Distributions,” you will notice that dividends and distributions have little effect on the Portfolio’s net assets. This is because the majority of the Portfolio’s investors reinvest their dividends and/or distributions.
The reinvestment of dividends and distributions is included under “Capital Share Transactions.” “Capital Shares” refers to the money investors contribute to the Portfolio through purchases or withdrawals via redemptions. The Portfolio’s net assets will increase and decrease in value as investors purchase and redeem shares from the Portfolio.
Financial Highlights This schedule provides a per-share breakdown of the components that affect the Portfolio’s NAV for current and past reporting periods as well as total return, asset size, ratios, and portfolio turnover rate.
The first line in the table reflects the NAV per share at the beginning of the reporting period. The next line reports the net investment income/(loss) per share. Following is the per share total of net gains/(losses), realized and unrealized. Per share dividends and distributions to investors are then subtracted to arrive at the NAV per share at the end of the
Janus Aspen Enterprise Portfolio Useful Information About Your Portfolio Report (unaudited)
Janus Aspen Series 43
period. The next line reflects the total return for the period. Also included are ratios of expenses and net investment income to average net assets.
The Portfolio’s expenses may be reduced through expense offsets and expense reimbursements. The ratios shown reflect expenses before and after any such offsets and reimbursements.
The ratio of net investment income/(loss) summarizes the income earned less expenses, divided by the average net assets of the Portfolio during the reporting period. Do not confuse this ratio with the Portfolio’s yield. The net investment income ratio is not a true measure of the Portfolio’s yield because it does not take into account the dividends distributed to the Portfolio’s investors.
The next figure is the portfolio turnover rate, which measures the buying and selling activity in the Portfolio. Portfolio turnover is affected by market conditions, changes in the asset size of the Portfolio, fluctuating volume of shareholder purchase and redemption orders, the nature of the Portfolio’s investments, and the investment style and/or outlook of the portfolio manager(s) and/or investment personnel. A 100% rate implies that an amount equal to the value of the entire portfolio was replaced once during the fiscal year; a 50% rate means that an amount equal to the value of half the portfolio is traded in a year; and a 200% rate means that an amount equal to the value of the entire portfolio is traded every six months.
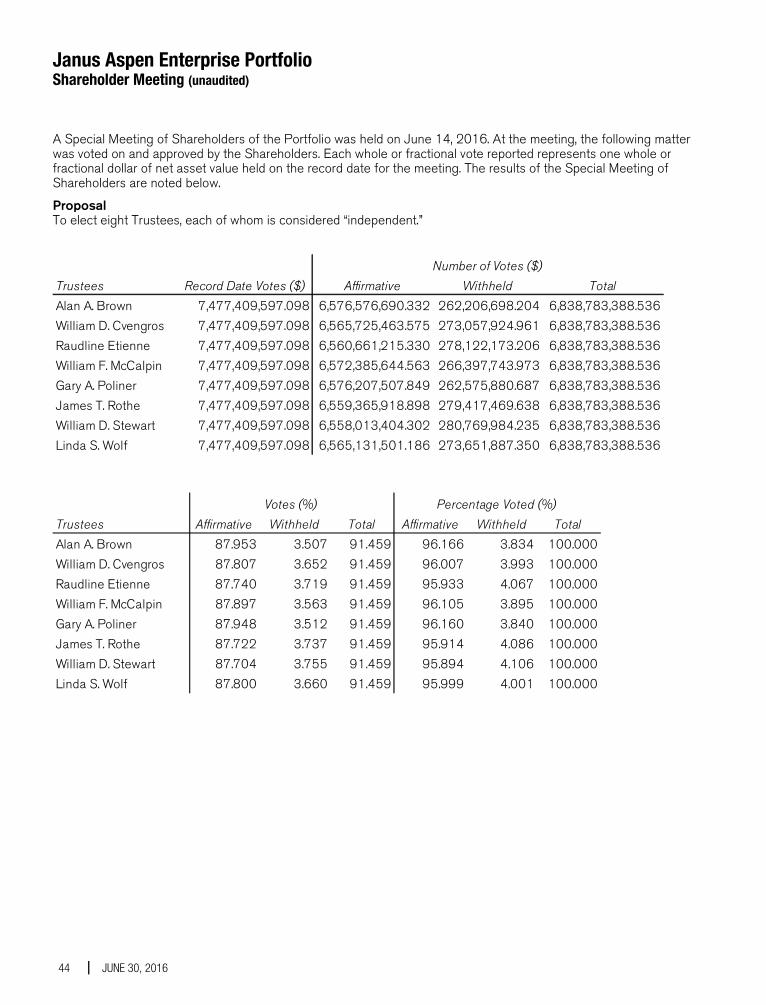
Janus Aspen Enterprise Portfolio Shareholder Meeting (unaudited)
44 JUNE 30, 2016
A Special Meeting of Shareholders of the Portfolio was held on June 14, 2016. At the meeting, the following matter was voted on and approved by the Shareholders. Each whole or fractional vote reported represents one whole or fractional dollar of net asset value held on the record date for the meeting. The results of the Special Meeting of Shareholders are noted below.
Proposal To elect eight Trustees, each of whom is considered “independent.”
Trustees Record Date Votes ($) Affirmative Withheld TotalAlan A. Brown 7,477,409,597.098 6,576,576,690.332 262,206,698.204 6,838,783,388.536William D. Cvengros 7,477,409,597.098 6,565,725,463.575 273,057,924.961 6,838,783,388.536Raudline Etienne 7,477,409,597.098 6,560,661,215.330 278,122,173.206 6,838,783,388.536William F. McCalpin 7,477,409,597.098 6,572,385,644.563 266,397,743.973 6,838,783,388.536Gary A. Poliner 7,477,409,597.098 6,576,207,507.849 262,575,880.687 6,838,783,388.536James T. Rothe 7,477,409,597.098 6,559,365,918.898 279,417,469.638 6,838,783,388.536William D. Stewart 7,477,409,597.098 6,558,013,404.302 280,769,984.235 6,838,783,388.536Linda S. Wolf 7,477,409,597.098 6,565,131,501.186 273,651,887.350 6,838,783,388.536
Number of Votes ($)
Trustees Affirmative Withheld Total Affirmative Withheld TotalAlan A. Brown 87.953 3.507 91.459 96.166 3.834 100.000William D. Cvengros 87.807 3.652 91.459 96.007 3.993 100.000Raudline Etienne 87.740 3.719 91.459 95.933 4.067 100.000William F. McCalpin 87.897 3.563 91.459 96.105 3.895 100.000Gary A. Poliner 87.948 3.512 91.459 96.160 3.840 100.000James T. Rothe 87.722 3.737 91.459 95.914 4.086 100.000William D. Stewart 87.704 3.755 91.459 95.894 4.106 100.000Linda S. Wolf 87.800 3.660 91.459 95.999 4.001 100.000
Votes (%) Percentage Voted (%)

Janus Aspen Enterprise Portfolio Notes
Janus Aspen Series 45
NotesPage1

Janus provides access to a wide range of investment disciplines. Alternative Janus alternative funds seek to deliver strong risk-adjusted returns over a full market cycle with lower correlation to equity markets than traditional investments.
Asset Allocation Janus’ asset allocation funds utilize our fundamental, bottom-up research to balance risk over the long term. From fund options that meet investors’ risk tolerance and objectives to a method that incorporates non-traditional investment choices to seek non-correlated sources of risk and return, Janus’ asset allocation funds aim to allocate risk more effectively.
Fixed Income Janus fixed income funds attempt to provide less risk relative to equities while seeking to deliver a competitive total return through high current income and appreciation. Janus money market funds seek capital preservation and liquidity with current income as a secondary objective.
Global & International Janus global and international funds seek to leverage Janus’ research capabilities by taking advantage of inefficiencies in foreign markets, where accurate information and analytical insight are often at a premium.
Growth & Core Janus growth funds focus on companies believed to be the leaders in their respective industries, with solid management teams, expanding market share, margins and efficiencies. Janus core funds seek investments in more stable and predictable companies. Our core funds look for a strategic combination of steady growth and, for certain funds, some degree of income.
Mathematical Our mathematical funds seek to outperform their respective indices while maintaining a risk profile equal to or lower than the index itself. Managed by INTECH® (a Janus subsidiary), these funds use a mathematical process in an attempt to build a more “efficient” portfolio than the index.
Value Our value funds, managed by Perkins® (a Janus subsidiary), seek to identify companies with favorable reward to risk characteristics by conducting rigorous downside analysis before determining upside potential.
For more information about our funds, contact your investment professional or go to janus.com/variable-insurance.
Please consider the charges, risks, expenses and investment objectives carefully before investing. For a prospectus or, if available, a summary prospectus containing this and other information, please call Janus at 877.33JANUS (52687) or download the file from janus.com/variable-insurance. Read it carefully before you invest or send money. Janus, INTECH and Perkins are registered trademarks of Janus International Holding LLC. © Janus International Holding LLC.
Funds distributed by Janus Distributors LLC
Investment products offered are: NOT FDIC-INSURED MAY LOSE VALUE NO BANK GUARANTEE
C-0816-3725 109-24-81116 08-16
SEMIANNUAL REPORT June 30, 2016
Janus Aspen Global Research Portfolio
Janus Aspen Series
HIGHLIGHTS
• Portfolio management perspective • Investment strategy behind your portfolio • Portfolio performance, characteristics
and holdings
Table of Contents
Janus Aspen Global Research Portfolio Management Commentary and Schedule of Investments ............................1 Notes to Schedule of Investments and Other Information........................ 14 Statement of Assets and Liabilities ............................................................................. 16 Statement of Operations ...................................................................................................... 17 Statements of Changes in Net Assets...................................................................... 18 Financial Highlights .................................................................................................................. 19 Notes to Financial Statements ........................................................................................ 20 Additional Information............................................................................................................. 28 Useful Information About Your Portfolio Report ............................................... 40 Shareholder Meeting ............................................................................................................... 43
Janus Aspen Global Research Portfolio (unaudited)
Janus Aspen Series 1
PORTFOLIO SNAPSHOT We are bottom-up, fundamental investors. We believe a deep, independent research process and high- conviction investing will deliver exceptional results.
Team-Based Approach Led by Carmel Wellso, Director of Research
PERFORMANCE SUMMARY Janus Aspen Global Research Portfolio’s Institutional Shares and Service Shares returned -2.18% and -2.31%, respectively, over the six-month period ended June 30, 2016, while its primary benchmark, the MSCI World Index, and its secondary benchmark, the MSCI All Country World Index, returned 0.66% and 1.23%, respectively.
MARKET ENVIRONMENT The building pressure in global equities in late 2015 erupted into a broad-based sell-off in January and February. Once again, a chief concern was the fear of slower-than-expected growth in China, the world’s second-largest economy. The negative sentiment was also reflected in energy market weakness. Later in the quarter, markets regained confidence, with both stocks and crude retracing earlier losses. Investors also found rationale for bullishness in the actions of central banks. The European Central Bank (ECB) extended the size and scope of its quantitative easing program and the Federal Reserve (Fed) lowered its projected forecast for interest rate hikes.
Global stocks traded narrowly for much of the April-June period. Concerns about global growth remained, but investors gleaned enough positive news from economic data to keep stocks buoyant. Expectations of an interest rate hike in the near term by the Fed, however, were quashed by the weak May employment report. This sent the value of the dollar downward, a move that provided additional support to U.S. equities and global – especially emerging market – currencies. Markets were jolted in late June by the UK electorate’s surprise decision to leave the European Union (EU). Global stocks tumbled and the dollar surged, as capital flowed into safe-haven government bonds, thereby driving yields lower. Yet over the period’s final few sessions, many stock indices were able to return to pre-Brexit levels.
PERFORMANCE DISCUSSION Our seven global sector teams employ a bottom-up, fundamental approach to identify what we consider the best global opportunities. Our analysts take a long-term view of companies with a focus on value creation and duration of growth, which lead to high returns on invested capital. The Portfolio directly captures the insights of our teams through their highest-conviction ideas. In building a diversified portfolio, we seek to minimize macroeconomic risks while generating superior performance over longer periods.
On a sector basis, the Portfolio’s consumer and financial holdings detracted most from relative results. The lone sector to contribute to relative performance was technology, with stock selection being the driving force.
NGK Spark Plug of Japan weighed on performance, caught up in a confluence of aggravating factors. A large portion of the company’s operations are in Japan, thus making it highly sensitive to fluctuations in the Japanese yen. Given the period’s dramatic strengthening of the yen, the potential foreign currency impact on NGK became a significant headwind. Operationally, the company continues to wrestle with turning around its ceramic package business. While it recently exited its plastic packaging division, the ceramics unit, upon which management has a more favorable view, has yet to signal a turnaround. Lastly, in anticipation of increased demand for spark plugs, the company has invested in expanding capacity and chose to aggressively depreciate the expenditure. These accelerated expenses come at a poor time as they magnify the pressure on earnings caused by the strong yen. Longer term, we still view NGK favorably, not only for the expected growth in demand for its core products, but also in anticipation that a new management team with a proven track record can turn around the ceramics business.
Endo International was a detractor. Endo and other specialty pharmaceutical companies have suffered from a
Janus Aspen Global Research Portfolio (unaudited)
2 JUNE 30, 2016
massive change in industry sentiment due to Valeant’s problems. Endo was also impacted by a few of its own company-specific issues, including concern it overpaid for a couple of drugs it acquired and slower sales for Xiaflex, a drug used to treat adults with Dupuytren’s contracture. While the company stands to benefit from a new product that launched in early 2016 (Belbuca, a Schedule-3 opioid), we chose to exit our position in Endo during the period.
While the energy sector recovered over the period on the back of improving crude oil prices, master limited partnerships (MLP), including portfolio holding MPLX, did not fully participate in the rally. MPLX ultimately detracted from performance due to company specific issues. Management announced that it cut its forecast for 2016 distribution growth by roughly half. As a consequence, the stock sold off considerably, with many investors harboring doubts about management credibility when providing long-term growth guidance. The company possesses a portfolio of attractive assets, but MLPs can be greatly impacted by management decisions regarding distribution growth and capital expenditure. By the end of the period we exited the holding.
Medical device maker Boston Scientific reported strong results. Performance was especially strong in the company’s interventional cardiology unit, as well as in urology and neuromodulation. Margin performance was also impressive. At a recent American College of Cardiology conference, strong data for transcatheter aortic valve replacement (TAVR) devices in intermediate risk patients led many to raise their estimates of the long-term market potential. Boston Scientific is the number three player in the TAVR market and stands to benefit from wider acceptance of these devices. More broadly, medical equipment makers benefited from the move away from specialty pharmaceutical, which has occurred over the first half of the year.
We have long favored quarterly contributor Keyence, a Japan-based factory automation company. Keyence continues to register strong organic growth rates as evidenced by the recently reported 10% top-line growth, which exceeded market expectations. Even in a period when factory automation has proven resilient, Keyence continues to be among the leaders in the field. We view the company’s success as the result of its unique business model, which is centered on value-added consulting services provided by a skilled sales team. By partnering with clients to develop custom solutions to meet their specific needs, Keyence is able to command
solid pricing for its services while still delivering value. The result for Keyence has been impressive profit margins and delivering a high return on invested capital.
Shares in confectioner Hershey rose dramatically during the period’s final week on the news of an unsolicited bid by rival Mondelez. The potential deal represents another step in consolidation of the global food and beverage industry. Mondelez – the maker of Cadbury chocolate and Oreo cookies – is seeking to further leverage scale to drive margin expansion in an effort to combat slowing revenue growth in key emerging markets where it has a strong presence. Hershey, on the other hand, generates most of its sales within the U.S., and its brands could benefit from access to Mondelez’ global distribution network. Investors cheered the possibility of a tie-up as the deal may offer fertile ground for extracting more margin-enhancing synergies that have been the hallmark of many recent deals, although approval from the Hershey Trust remains an open question.
OUTLOOK Once again, summer comes with volatility out of Europe. The 43-year marriage between the UK and its continental neighbors moves to a messy and long divorce negotiation – with a lot of assets at stake.
On the day the Brexit results were announced, global equities shed a remarkable – and a record – $2.1 trillion in value, only to climb back in the final days of June. The fall and subsequent bounce likely presage a volatile summer for stocks and many other asset classes. Beyond the uncertainty in the UK and on the continent, as the currencies and stock markets weaken, Brexit has implications for China and Japan, and for U.S. companies sensitive to a stronger dollar. We see an environment where portfolios that have lower exposure to volatility and a lower beta should hold up on a relative basis. In the last year, more volatile stocks have been exceptionally poor contributors for active investors.
Brexit is another sign that populism is taking hold of the electorate, many of whom suffered in the global financial crisis and feel that they haven’t fully participated in the recovery. Mildly improving economies and healthier sovereign balance sheets are slim comfort to many who are struggling to regain a pre-crisis standard of living.
Against the economic backdrop, along with the migrant crisis and specter of terrorism, which are unfairly linked, we may see additional political turmoil leading market disruption. It is easier to leave the EU than to leave the

Janus Aspen Global Research Portfolio (unaudited)
Janus Aspen Series 3
euro, but the rise of populist parties in Europe suggests we may see calls for both in the coming months. Many key European elections happen over the next year.
Step back from the politics, however, and the picture improves. Consumer confidence and activity is generally holding up. Companies once again have flush balance sheets. While they are cautious on expansion capital expenditures, companies are using the cash to buy shares or pay dividends. Several of the key issues from earlier this year seem less vexing. Oil has recovered and China seems to be on a more certain path. Federal Reserve policy remains tough to foresee, however, but should be data dependent. A rate hike, therefore, might be a strong signal of economic strength and therefore positive for equity markets.
For active investors, the key is to try to hold the line during this period of volatility. We do not think that it is a time to try to run to defensive stocks or to broaden a portfolio so much that it solely mimics an index. It is too difficult to predict when markets calm and fundamentals matter more. The last several years have been conducive for passive investing. A defensive market can penalize active investors, especially those with a growth bent or who own smaller than average companies. When markets calms, active investing can recover.
Certain sectors can hold up better. The outlooks for technology and health care have not changed much with the Brexit vote. The shift to the cloud and the challenge to legacy tech companies carry on and provide attractive investment opportunities. The innovation of medicine and the demographic shifts we have often discussed remain. Both sectors are cheaper following the turmoil but no less attractive. Other sectors face a tougher row. Financials, which fell stunningly following Brexit, face the difficult problems of challenging economic conditions, corporate uncertainty about borrowing, negative interest rates and shrinking margins. UK banks also must endure an uncertain regulatory environment. Industrials could struggle with a strong U.S. dollar and weak global markets.
The road of crisis seems a little too well traveled lately. Whether Brexit is like Cyprus – a noisy event with few long-term implications – or like Lehman – which sparked a global panic with ripples still touching us today – remains to be seen. Our leaning is toward the former but it doesn't mean the summer won't be tough for equities. Active equity could struggle more in the near term because it is typically is less exposed to large cap, to yield
and to defensiveness overall than most indices. Longer term, the importance of growth and innovation should matter more in a sluggish global economy. Our focus on these companies is not changing.
If the summer of our discontent is made glorious, therefore, it will be because investors focus on better fundamentals and ignore the political uncertainty. We recognize the fragility of the economic recovery and the stretched policies of central banks, but our base case remains positive on equities. In previous periods of market pique, defensive environments gave way to stronger equity markets that favor active managers with a tolerance for volatility, growth and higher than average multiples. Our vote (and our money) goes there.
Thank you for your investment in Janus Aspen Global Research Portfolio.
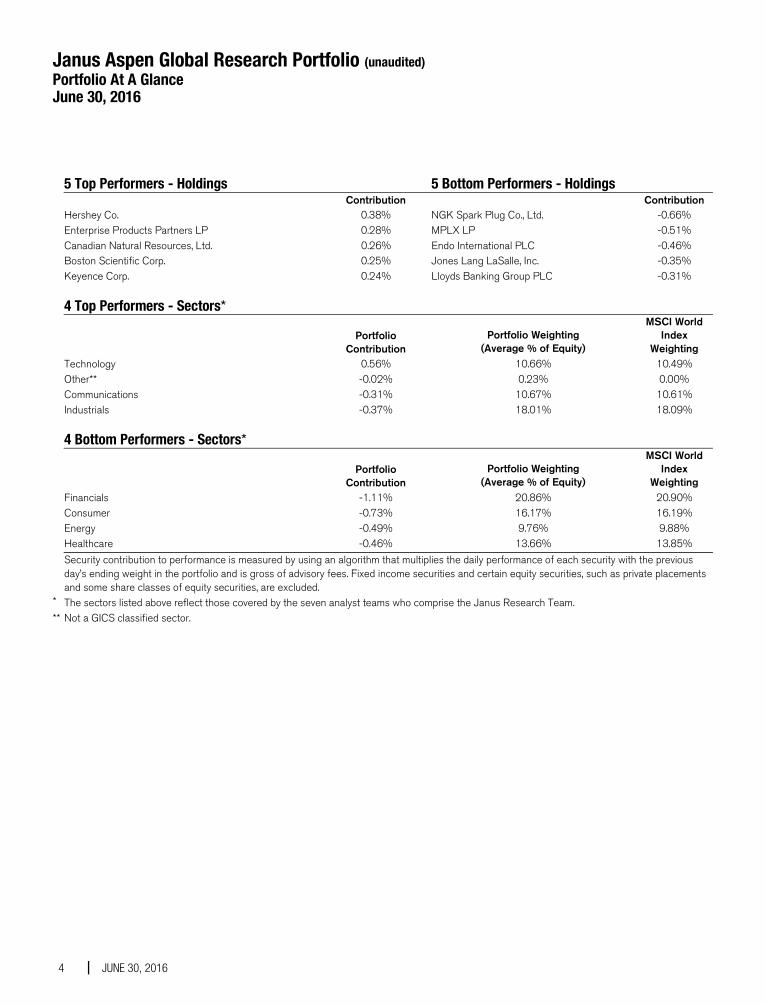
Janus Aspen Global Research Portfolio (unaudited) Portfolio At A Glance June 30, 2016
4 JUNE 30, 2016
5 Top Performers - Holdings 5 Bottom Performers - Holdings Contribution Contribution Hershey Co. 0.38% NGK Spark Plug Co., Ltd. -0.66% Enterprise Products Partners LP 0.28% MPLX LP -0.51% Canadian Natural Resources, Ltd. 0.26% Endo International PLC -0.46% Boston Scientific Corp. 0.25% Jones Lang LaSalle, Inc. -0.35% Keyence Corp. 0.24% Lloyds Banking Group PLC -0.31%
4 Top Performers - Sectors*
Portfolio
Contribution Portfolio Weighting
(Average % of Equity)
MSCI World Index
Weighting Technology 0.56% 10.66% 10.49% Other** -0.02% 0.23% 0.00% Communications -0.31% 10.67% 10.61% Industrials -0.37% 18.01% 18.09% 4 Bottom Performers - Sectors*
Portfolio
Contribution Portfolio Weighting
(Average % of Equity)
MSCI World Index
Weighting Financials -1.11% 20.86% 20.90% Consumer -0.73% 16.17% 16.19% Energy -0.49% 9.76% 9.88% Healthcare -0.46% 13.66% 13.85%
Security contribution to performance is measured by using an algorithm that multiplies the daily performance of each security with the previous day’s ending weight in the portfolio and is gross of advisory fees. Fixed income securities and certain equity securities, such as private placements and some share classes of equity securities, are excluded.
* The sectors listed above reflect those covered by the seven analyst teams who comprise the Janus Research Team. ** Not a GICS classified sector.
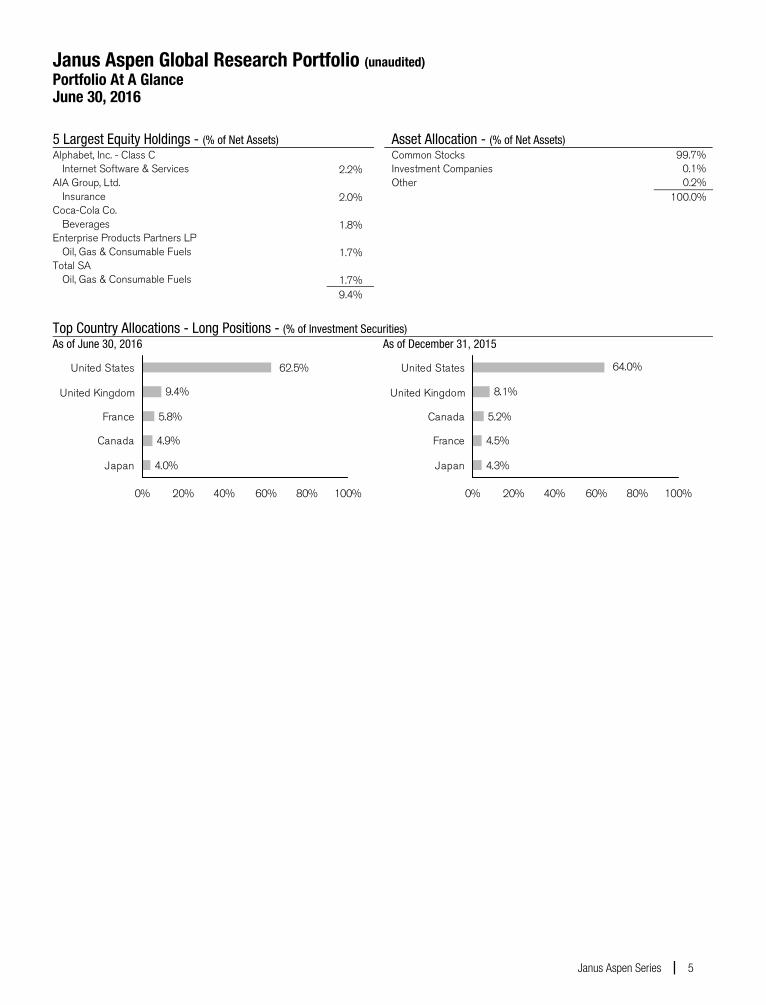
Janus Aspen Global Research Portfolio (unaudited) Portfolio At A Glance June 30, 2016
Janus Aspen Series 5
5 Largest Equity Holdings - (% of Net Assets) Alphabet, Inc. - Class C
Internet Software & Services 2.2% AIA Group, Ltd.
Insurance 2.0% Coca-Cola Co.
Beverages 1.8% Enterprise Products Partners LP
Oil, Gas & Consumable Fuels 1.7% Total SA
Oil, Gas & Consumable Fuels 1.7% 9.4%
Asset Allocation - (% of Net Assets) Common Stocks 99.7% Investment Companies 0.1% Other 0.2% 100.0%
Top Country Allocations - Long Positions - (% of Investment Securities) As of June 30, 2016
9.4%
5.8%
4.9%
4.0%
62.5%
0% 20% 40% 60% 80% 100%
United States
United Kingdom
France
Canada
Japan
As of December 31, 2015
8.1%
5.2%
4.5%
4.3%
64.0%
0% 20% 40% 60% 80% 100%
United States
United Kingdom
Canada
France
Japan
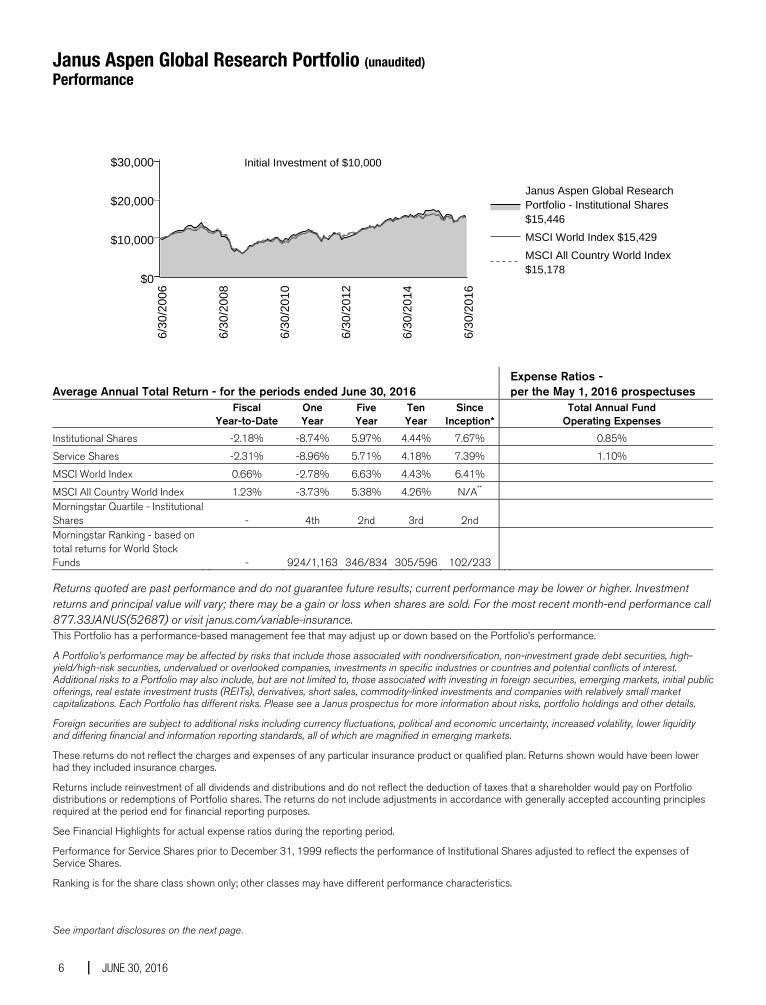
Janus Aspen Global Research Portfolio (unaudited) Performance
6 JUNE 30, 2016
Expense Ratios - Average Annual Total Return - for the periods ended June 30, 2016 per the May 1, 2016 prospectuses
Fiscal
Year-to-Date One Year
Five Year
Ten Year
Since Inception*
Total Annual Fund Operating Expenses
Institutional Shares -2.18% -8.74% 5.97% 4.44% 7.67% 0.85%
Service Shares -2.31% -8.96% 5.71% 4.18% 7.39% 1.10%
MSCI World Index 0.66% -2.78% 6.63% 4.43% 6.41%
MSCI All Country World Index 1.23% -3.73% 5.38% 4.26% N/A** Morningstar Quartile - Institutional Shares - 4th 2nd 3rd 2nd Morningstar Ranking - based on total returns for World Stock Funds - 924/1,163 346/834 305/596 102/233
Returns quoted are past performance and do not guarantee future results; current performance may be lower or higher. Investment returns and principal value will vary; there may be a gain or loss when shares are sold. For the most recent month-end performance call 877.33JANUS(52687) or visit janus.com/variable-insurance. This Portfolio has a performance-based management fee that may adjust up or down based on the Portfolio’s performance.
A Portfolio’s performance may be affected by risks that include those associated with nondiversification, non-investment grade debt securities, high-yield/high-risk securities, undervalued or overlooked companies, investments in specific industries or countries and potential conflicts of interest. Additional risks to a Portfolio may also include, but are not limited to, those associated with investing in foreign securities, emerging markets, initial public offerings, real estate investment trusts (REITs), derivatives, short sales, commodity-linked investments and companies with relatively small market capitalizations. Each Portfolio has different risks. Please see a Janus prospectus for more information about risks, portfolio holdings and other details.
Foreign securities are subject to additional risks including currency fluctuations, political and economic uncertainty, increased volatility, lower liquidity and differing financial and information reporting standards, all of which are magnified in emerging markets.
These returns do not reflect the charges and expenses of any particular insurance product or qualified plan. Returns shown would have been lower had they included insurance charges.
Returns include reinvestment of all dividends and distributions and do not reflect the deduction of taxes that a shareholder would pay on Portfolio distributions or redemptions of Portfolio shares. The returns do not include adjustments in accordance with generally accepted accounting principles required at the period end for financial reporting purposes.
See Financial Highlights for actual expense ratios during the reporting period.
Performance for Service Shares prior to December 31, 1999 reflects the performance of Institutional Shares adjusted to reflect the expenses of Service Shares.
Ranking is for the share class shown only; other classes may have different performance characteristics.
See important disclosures on the next page.

Janus Aspen Global Research Portfolio (unaudited) Performance
Janus Aspen Series 7
© 2016 Morningstar, Inc. All Rights Reserved.
There is no assurance that the investment process will consistently lead to successful investing.
See Notes to Schedule of Investments and Other Information for index definitions.
A Portfolio's holdings may differ significantly from the securities held in an index. An index is unmanaged and not available for direct investment; therefore, its performance does not reflect the expenses associated with the active management of an actual portfolio.
See “Useful Information About Your Portfolio Report.” *The Portfolio’s inception date – September 13, 1993
**Since inception return is not shown for the index because the index’s inception date differs significantly from the Portfolio’s inception date.
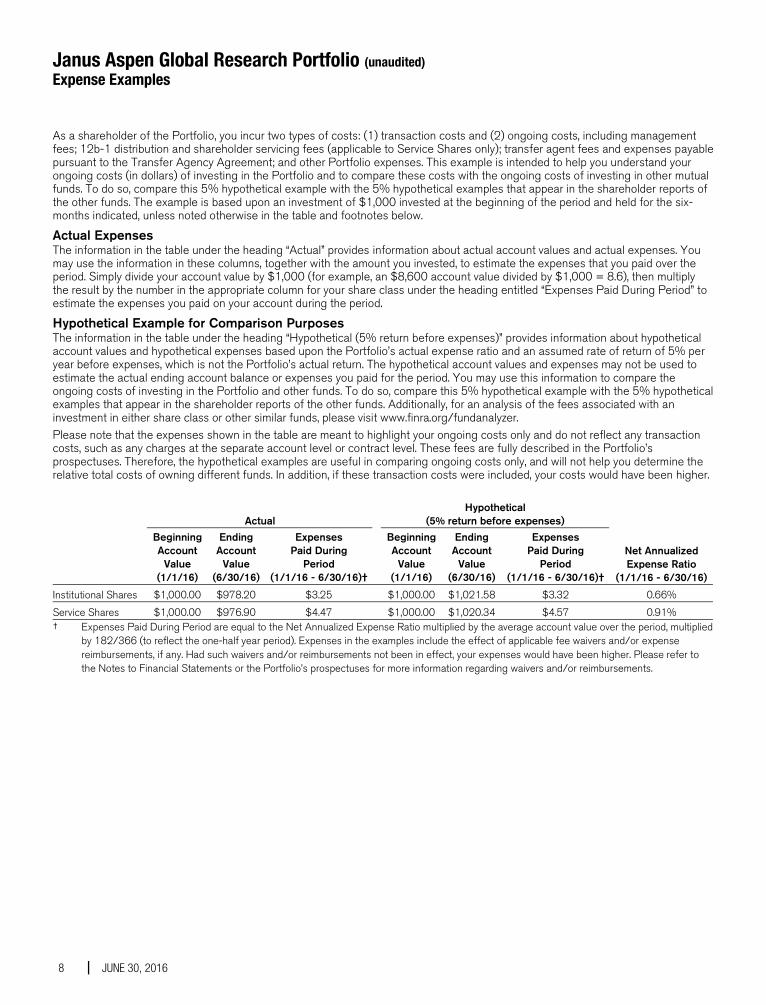
Janus Aspen Global Research Portfolio (unaudited) Expense Examples
8 JUNE 30, 2016
As a shareholder of the Portfolio, you incur two types of costs: (1) transaction costs and (2) ongoing costs, including management fees; 12b-1 distribution and shareholder servicing fees (applicable to Service Shares only); transfer agent fees and expenses payable pursuant to the Transfer Agency Agreement; and other Portfolio expenses. This example is intended to help you understand your ongoing costs (in dollars) of investing in the Portfolio and to compare these costs with the ongoing costs of investing in other mutual funds. To do so, compare this 5% hypothetical example with the 5% hypothetical examples that appear in the shareholder reports of the other funds. The example is based upon an investment of $1,000 invested at the beginning of the period and held for the six-months indicated, unless noted otherwise in the table and footnotes below.
Actual Expenses The information in the table under the heading “Actual” provides information about actual account values and actual expenses. You may use the information in these columns, together with the amount you invested, to estimate the expenses that you paid over the period. Simply divide your account value by $1,000 (for example, an $8,600 account value divided by $1,000 = 8.6), then multiply the result by the number in the appropriate column for your share class under the heading entitled “Expenses Paid During Period” to estimate the expenses you paid on your account during the period.
Hypothetical Example for Comparison Purposes The information in the table under the heading “Hypothetical (5% return before expenses)” provides information about hypothetical account values and hypothetical expenses based upon the Portfolio’s actual expense ratio and an assumed rate of return of 5% per year before expenses, which is not the Portfolio’s actual return. The hypothetical account values and expenses may not be used to estimate the actual ending account balance or expenses you paid for the period. You may use this information to compare the ongoing costs of investing in the Portfolio and other funds. To do so, compare this 5% hypothetical example with the 5% hypothetical examples that appear in the shareholder reports of the other funds. Additionally, for an analysis of the fees associated with an investment in either share class or other similar funds, please visit www.finra.org/fundanalyzer. Please note that the expenses shown in the table are meant to highlight your ongoing costs only and do not reflect any transaction costs, such as any charges at the separate account level or contract level. These fees are fully described in the Portfolio’s prospectuses. Therefore, the hypothetical examples are useful in comparing ongoing costs only, and will not help you determine the relative total costs of owning different funds. In addition, if these transaction costs were included, your costs would have been higher.
Actual Hypothetical
(5% return before expenses)
Beginning Account
Value (1/1/16)
Ending Account
Value (6/30/16)
Expenses Paid During
Period (1/1/16 - 6/30/16)†
BeginningAccount
Value (1/1/16)
Ending Account
Value (6/30/16)
Expenses Paid During
Period (1/1/16 - 6/30/16)†
Net Annualized Expense Ratio
(1/1/16 - 6/30/16)
Institutional Shares $1,000.00 $978.20 $3.25 $1,000.00 $1,021.58 $3.32 0.66%
Service Shares $1,000.00 $976.90 $4.47 $1,000.00 $1,020.34 $4.57 0.91% † Expenses Paid During Period are equal to the Net Annualized Expense Ratio multiplied by the average account value over the period, multiplied
by 182/366 (to reflect the one-half year period). Expenses in the examples include the effect of applicable fee waivers and/or expense reimbursements, if any. Had such waivers and/or reimbursements not been in effect, your expenses would have been higher. Please refer to the Notes to Financial Statements or the Portfolio’s prospectuses for more information regarding waivers and/or reimbursements.
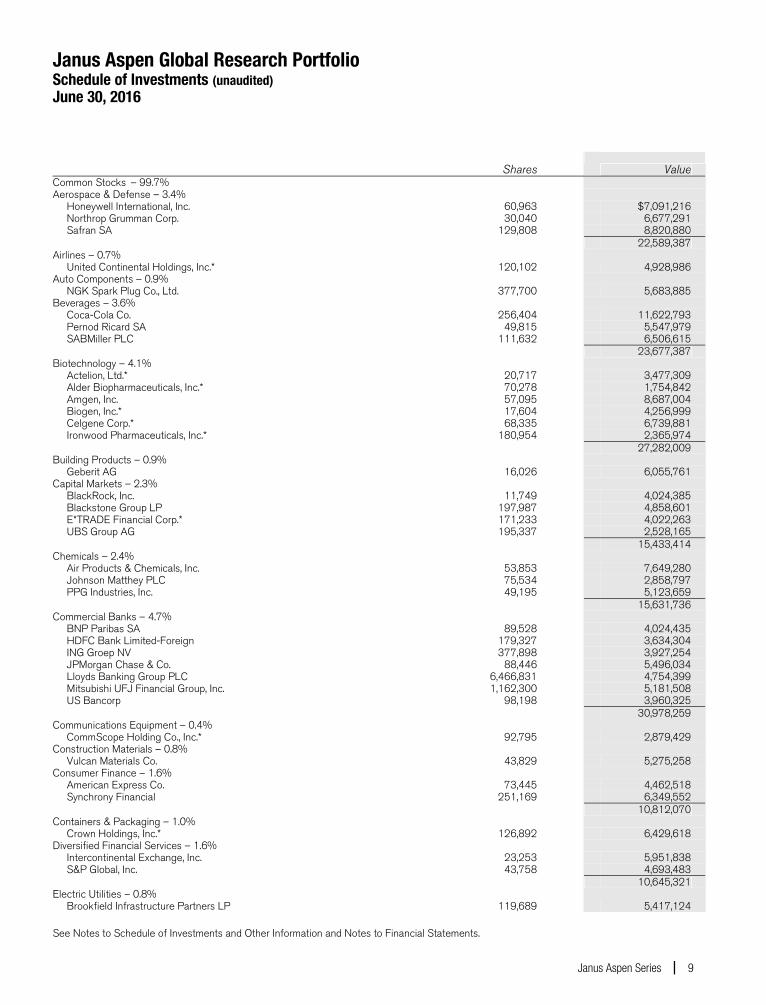
Janus Aspen Global Research Portfolio Schedule of Investments (unaudited) June 30, 2016
See Notes to Schedule of Investments and Other Information and Notes to Financial Statements.
Janus Aspen Series 9
Shares
Value Common Stocks – 99.7% Aerospace & Defense – 3.4% Honeywell International, Inc. 60,963 $7,091,216 Northrop Grumman Corp. 30,040 6,677,291 Safran SA 129,808 8,820,880 22,589,387Airlines – 0.7% United Continental Holdings, Inc.* 120,102 4,928,986Auto Components – 0.9% NGK Spark Plug Co., Ltd. 377,700 5,683,885Beverages – 3.6% Coca-Cola Co. 256,404 11,622,793 Pernod Ricard SA 49,815 5,547,979 SABMiller PLC 111,632 6,506,615 23,677,387Biotechnology – 4.1% Actelion, Ltd.* 20,717 3,477,309 Alder Biopharmaceuticals, Inc.* 70,278 1,754,842 Amgen, Inc. 57,095 8,687,004 Biogen, Inc.* 17,604 4,256,999 Celgene Corp.* 68,335 6,739,881 Ironwood Pharmaceuticals, Inc.* 180,954 2,365,974 27,282,009Building Products – 0.9% Geberit AG 16,026 6,055,761Capital Markets – 2.3% BlackRock, Inc. 11,749 4,024,385 Blackstone Group LP 197,987 4,858,601 E*TRADE Financial Corp.* 171,233 4,022,263 UBS Group AG 195,337 2,528,165 15,433,414Chemicals – 2.4% Air Products & Chemicals, Inc. 53,853 7,649,280 Johnson Matthey PLC 75,534 2,858,797 PPG Industries, Inc. 49,195 5,123,659 15,631,736Commercial Banks – 4.7% BNP Paribas SA 89,528 4,024,435 HDFC Bank Limited-Foreign 179,327 3,634,304 ING Groep NV 377,898 3,927,254 JPMorgan Chase & Co. 88,446 5,496,034 Lloyds Banking Group PLC 6,466,831 4,754,399 Mitsubishi UFJ Financial Group, Inc. 1,162,300 5,181,508 US Bancorp 98,198 3,960,325 30,978,259Communications Equipment – 0.4% CommScope Holding Co., Inc.* 92,795 2,879,429Construction Materials – 0.8% Vulcan Materials Co. 43,829 5,275,258Consumer Finance – 1.6% American Express Co. 73,445 4,462,518 Synchrony Financial 251,169 6,349,552 10,812,070Containers & Packaging – 1.0% Crown Holdings, Inc.* 126,892 6,429,618Diversified Financial Services – 1.6% Intercontinental Exchange, Inc. 23,253 5,951,838 S&P Global, Inc. 43,758 4,693,483 10,645,321Electric Utilities – 0.8% Brookfield Infrastructure Partners LP 119,689 5,417,124
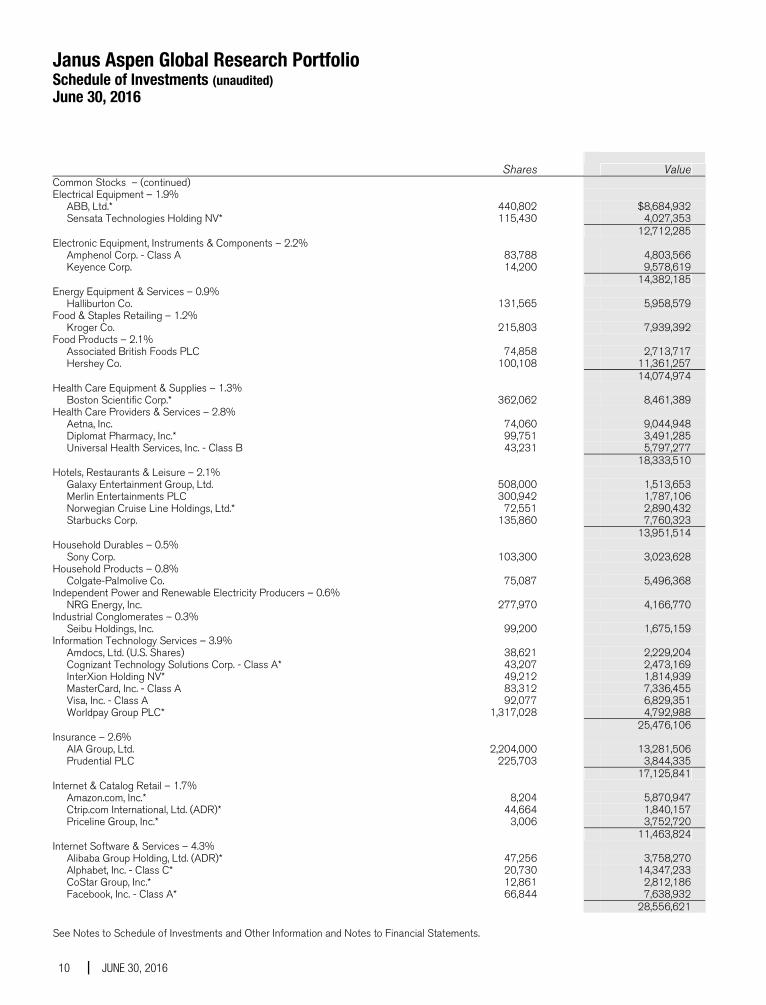
Janus Aspen Global Research Portfolio Schedule of Investments (unaudited) June 30, 2016
See Notes to Schedule of Investments and Other Information and Notes to Financial Statements.
10 JUNE 30, 2016
Shares
Value Common Stocks – (continued) Electrical Equipment – 1.9% ABB, Ltd.* 440,802 $8,684,932 Sensata Technologies Holding NV* 115,430 4,027,353 12,712,285Electronic Equipment, Instruments & Components – 2.2% Amphenol Corp. - Class A 83,788 4,803,566 Keyence Corp. 14,200 9,578,619 14,382,185Energy Equipment & Services – 0.9% Halliburton Co. 131,565 5,958,579Food & Staples Retailing – 1.2% Kroger Co. 215,803 7,939,392Food Products – 2.1% Associated British Foods PLC 74,858 2,713,717 Hershey Co. 100,108 11,361,257 14,074,974Health Care Equipment & Supplies – 1.3% Boston Scientific Corp.* 362,062 8,461,389Health Care Providers & Services – 2.8% Aetna, Inc. 74,060 9,044,948 Diplomat Pharmacy, Inc.* 99,751 3,491,285 Universal Health Services, Inc. - Class B 43,231 5,797,277 18,333,510Hotels, Restaurants & Leisure – 2.1% Galaxy Entertainment Group, Ltd. 508,000 1,513,653 Merlin Entertainments PLC 300,942 1,787,106 Norwegian Cruise Line Holdings, Ltd.* 72,551 2,890,432 Starbucks Corp. 135,860 7,760,323 13,951,514Household Durables – 0.5% Sony Corp. 103,300 3,023,628Household Products – 0.8% Colgate-Palmolive Co. 75,087 5,496,368Independent Power and Renewable Electricity Producers – 0.6% NRG Energy, Inc. 277,970 4,166,770Industrial Conglomerates – 0.3% Seibu Holdings, Inc. 99,200 1,675,159Information Technology Services – 3.9% Amdocs, Ltd. (U.S. Shares) 38,621 2,229,204 Cognizant Technology Solutions Corp. - Class A* 43,207 2,473,169 InterXion Holding NV* 49,212 1,814,939 MasterCard, Inc. - Class A 83,312 7,336,455 Visa, Inc. - Class A 92,077 6,829,351 Worldpay Group PLC* 1,317,028 4,792,988 25,476,106Insurance – 2.6% AIA Group, Ltd. 2,204,000 13,281,506 Prudential PLC 225,703 3,844,335 17,125,841Internet & Catalog Retail – 1.7% Amazon.com, Inc.* 8,204 5,870,947 Ctrip.com International, Ltd. (ADR)* 44,664 1,840,157 Priceline Group, Inc.* 3,006 3,752,720 11,463,824Internet Software & Services – 4.3% Alibaba Group Holding, Ltd. (ADR)* 47,256 3,758,270 Alphabet, Inc. - Class C* 20,730 14,347,233 CoStar Group, Inc.* 12,861 2,812,186 Facebook, Inc. - Class A* 66,844 7,638,932 28,556,621
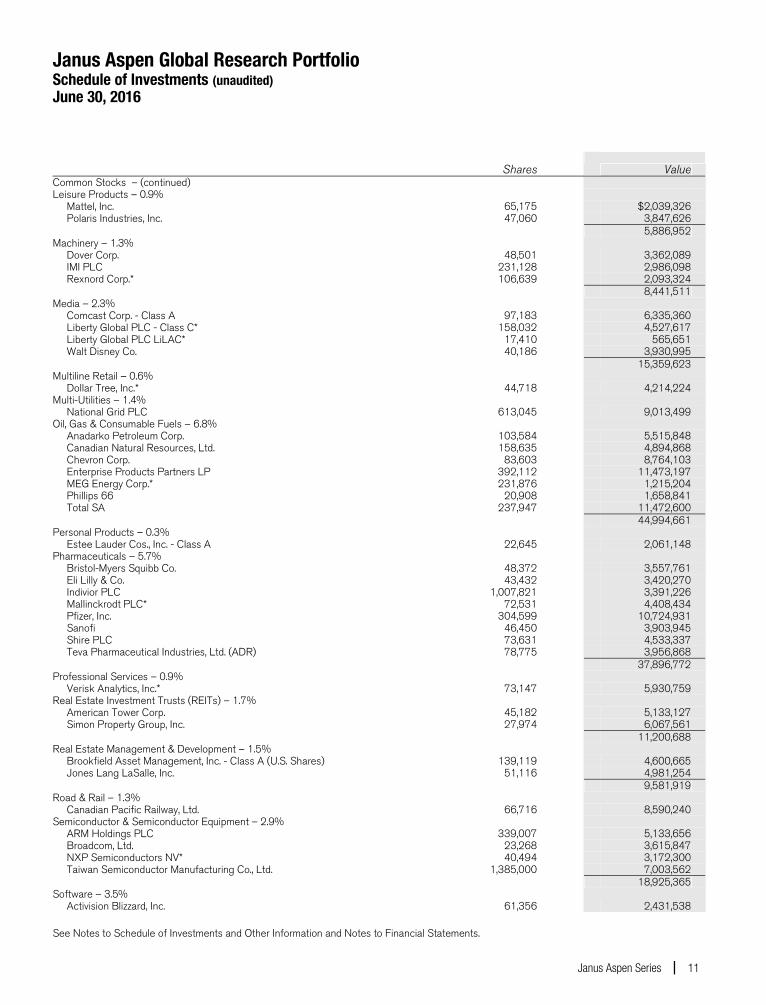
Janus Aspen Global Research Portfolio Schedule of Investments (unaudited) June 30, 2016
See Notes to Schedule of Investments and Other Information and Notes to Financial Statements.
Janus Aspen Series 11
Shares
Value Common Stocks – (continued) Leisure Products – 0.9% Mattel, Inc. 65,175 $2,039,326 Polaris Industries, Inc. 47,060 3,847,626 5,886,952Machinery – 1.3% Dover Corp. 48,501 3,362,089 IMI PLC 231,128 2,986,098 Rexnord Corp.* 106,639 2,093,324 8,441,511Media – 2.3% Comcast Corp. - Class A 97,183 6,335,360 Liberty Global PLC - Class C* 158,032 4,527,617 Liberty Global PLC LiLAC* 17,410 565,651 Walt Disney Co. 40,186 3,930,995 15,359,623Multiline Retail – 0.6% Dollar Tree, Inc.* 44,718 4,214,224Multi-Utilities – 1.4% National Grid PLC 613,045 9,013,499Oil, Gas & Consumable Fuels – 6.8% Anadarko Petroleum Corp. 103,584 5,515,848 Canadian Natural Resources, Ltd. 158,635 4,894,868 Chevron Corp. 83,603 8,764,103 Enterprise Products Partners LP 392,112 11,473,197 MEG Energy Corp.* 231,876 1,215,204 Phillips 66 20,908 1,658,841 Total SA 237,947 11,472,600 44,994,661Personal Products – 0.3% Estee Lauder Cos., Inc. - Class A 22,645 2,061,148Pharmaceuticals – 5.7% Bristol-Myers Squibb Co. 48,372 3,557,761 Eli Lilly & Co. 43,432 3,420,270 Indivior PLC 1,007,821 3,391,226 Mallinckrodt PLC* 72,531 4,408,434 Pfizer, Inc. 304,599 10,724,931 Sanofi 46,450 3,903,945 Shire PLC 73,631 4,533,337 Teva Pharmaceutical Industries, Ltd. (ADR) 78,775 3,956,868 37,896,772Professional Services – 0.9% Verisk Analytics, Inc.* 73,147 5,930,759Real Estate Investment Trusts (REITs) – 1.7% American Tower Corp. 45,182 5,133,127 Simon Property Group, Inc. 27,974 6,067,561 11,200,688Real Estate Management & Development – 1.5% Brookfield Asset Management, Inc. - Class A (U.S. Shares) 139,119 4,600,665 Jones Lang LaSalle, Inc. 51,116 4,981,254 9,581,919Road & Rail – 1.3% Canadian Pacific Railway, Ltd. 66,716 8,590,240Semiconductor & Semiconductor Equipment – 2.9% ARM Holdings PLC 339,007 5,133,656 Broadcom, Ltd. 23,268 3,615,847 NXP Semiconductors NV* 40,494 3,172,300 Taiwan Semiconductor Manufacturing Co., Ltd. 1,385,000 7,003,562 18,925,365Software – 3.5% Activision Blizzard, Inc. 61,356 2,431,538
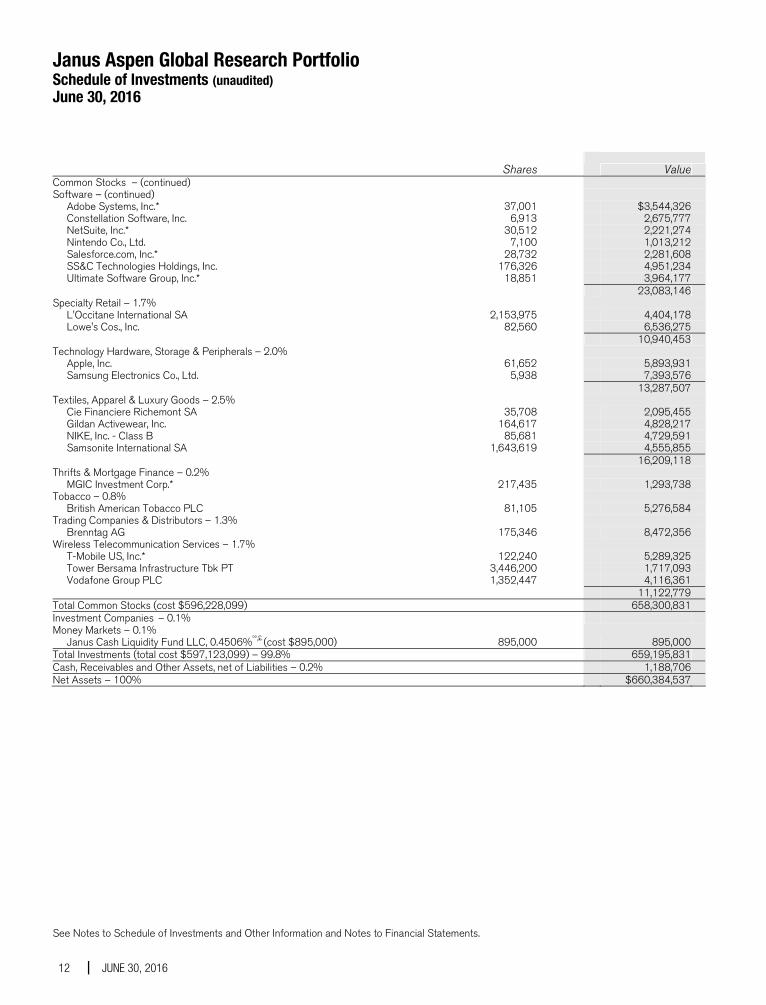
Janus Aspen Global Research Portfolio Schedule of Investments (unaudited) June 30, 2016
See Notes to Schedule of Investments and Other Information and Notes to Financial Statements.
12 JUNE 30, 2016
Shares
Value Common Stocks – (continued) Software – (continued) Adobe Systems, Inc.* 37,001 $3,544,326 Constellation Software, Inc. 6,913 2,675,777 NetSuite, Inc.* 30,512 2,221,274 Nintendo Co., Ltd. 7,100 1,013,212 Salesforce.com, Inc.* 28,732 2,281,608 SS&C Technologies Holdings, Inc. 176,326 4,951,234 Ultimate Software Group, Inc.* 18,851 3,964,177 23,083,146Specialty Retail – 1.7% L'Occitane International SA 2,153,975 4,404,178 Lowe's Cos., Inc. 82,560 6,536,275 10,940,453Technology Hardware, Storage & Peripherals – 2.0% Apple, Inc. 61,652 5,893,931 Samsung Electronics Co., Ltd. 5,938 7,393,576 13,287,507Textiles, Apparel & Luxury Goods – 2.5% Cie Financiere Richemont SA 35,708 2,095,455 Gildan Activewear, Inc. 164,617 4,828,217 NIKE, Inc. - Class B 85,681 4,729,591 Samsonite International SA 1,643,619 4,555,855 16,209,118Thrifts & Mortgage Finance – 0.2% MGIC Investment Corp.* 217,435 1,293,738Tobacco – 0.8% British American Tobacco PLC 81,105 5,276,584Trading Companies & Distributors – 1.3% Brenntag AG 175,346 8,472,356Wireless Telecommunication Services – 1.7% T-Mobile US, Inc.* 122,240 5,289,325 Tower Bersama Infrastructure Tbk PT 3,446,200 1,717,093 Vodafone Group PLC 1,352,447 4,116,361 11,122,779Total Common Stocks (cost $596,228,099) 658,300,831Investment Companies – 0.1% Money Markets – 0.1% Janus Cash Liquidity Fund LLC, 0.4506%ºº,£ (cost $895,000) 895,000 895,000Total Investments (total cost $597,123,099) – 99.8% 659,195,831Cash, Receivables and Other Assets, net of Liabilities – 0.2% 1,188,706Net Assets – 100% $660,384,537
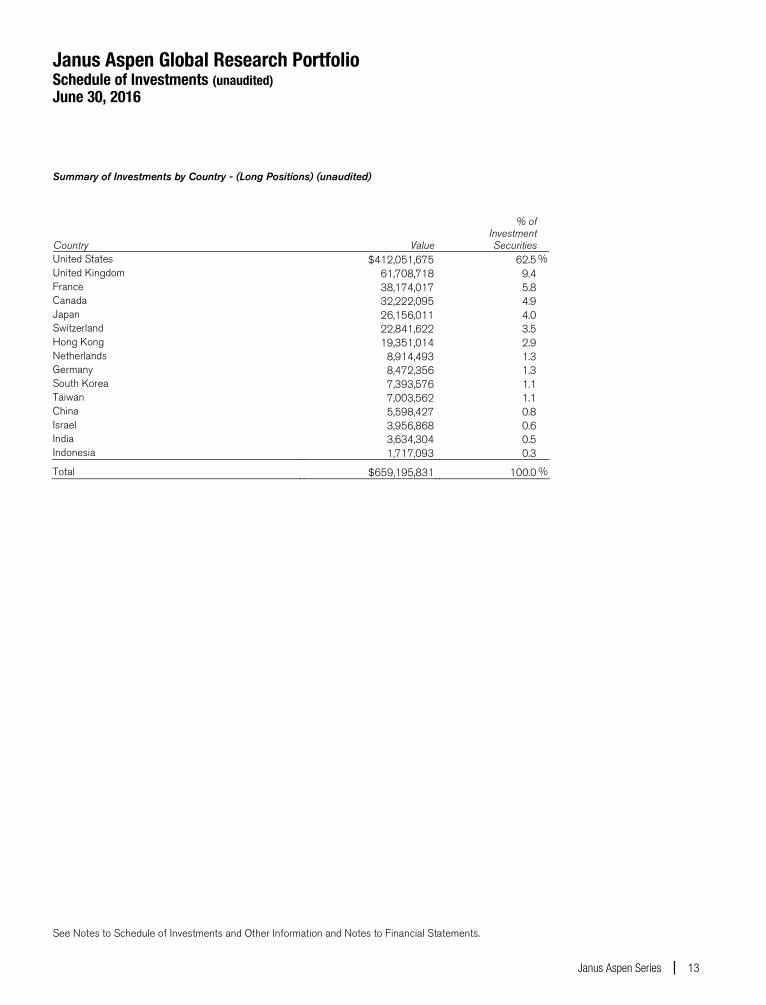
Janus Aspen Global Research Portfolio Schedule of Investments (unaudited) June 30, 2016
See Notes to Schedule of Investments and Other Information and Notes to Financial Statements.
Janus Aspen Series 13
Summary of Investments by Country - (Long Positions) (unaudited)
Country Value
% ofInvestmentSecurities
United States $412,051,675 62.5 % United Kingdom 61,708,718 9.4 France 38,174,017 5.8 Canada 32,222,095 4.9 Japan 26,156,011 4.0 Switzerland 22,841,622 3.5 Hong Kong 19,351,014 2.9 Netherlands 8,914,493 1.3 Germany 8,472,356 1.3 South Korea 7,393,576 1.1 Taiwan 7,003,562 1.1 China 5,598,427 0.8 Israel 3,956,868 0.6 India 3,634,304 0.5 Indonesia 1,717,093 0.3
Total $659,195,831 100.0 %
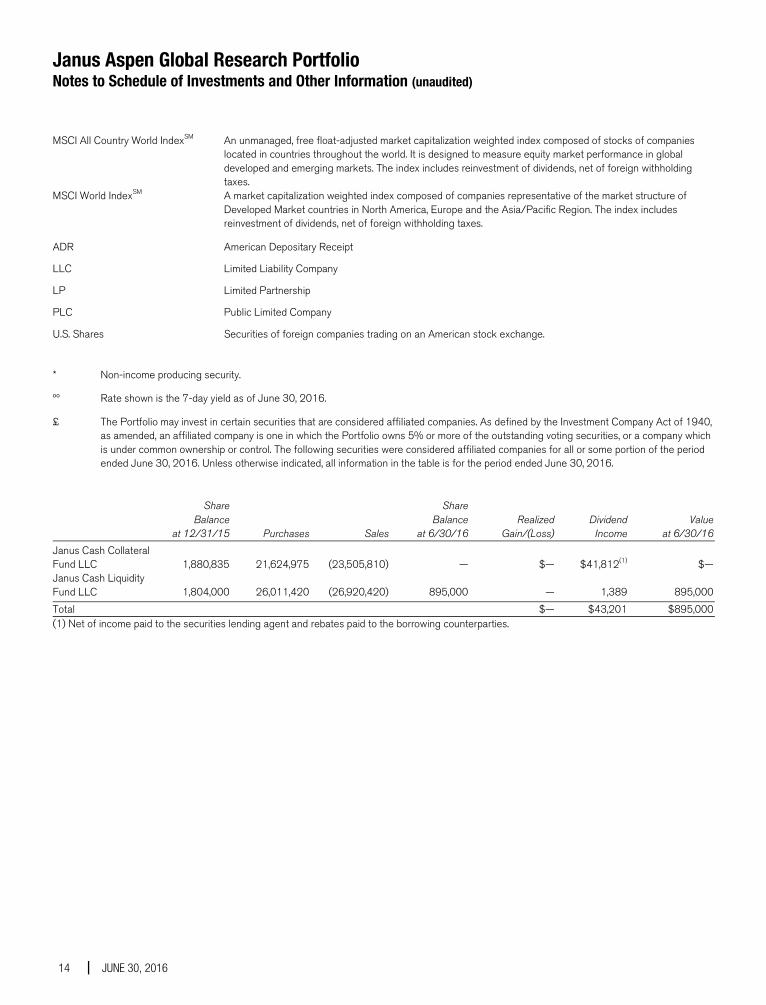
Janus Aspen Global Research Portfolio Notes to Schedule of Investments and Other Information (unaudited)
14 JUNE 30, 2016
MSCI All Country World IndexSM An unmanaged, free float-adjusted market capitalization weighted index composed of stocks of companies located in countries throughout the world. It is designed to measure equity market performance in global developed and emerging markets. The index includes reinvestment of dividends, net of foreign withholding taxes.
MSCI World IndexSM A market capitalization weighted index composed of companies representative of the market structure of Developed Market countries in North America, Europe and the Asia/Pacific Region. The index includes reinvestment of dividends, net of foreign withholding taxes.
ADR American Depositary Receipt
LLC Limited Liability Company
LP Limited Partnership
PLC Public Limited Company
U.S. Shares Securities of foreign companies trading on an American stock exchange.
* Non-income producing security.
ºº Rate shown is the 7-day yield as of June 30, 2016.
£ The Portfolio may invest in certain securities that are considered affiliated companies. As defined by the Investment Company Act of 1940, as amended, an affiliated company is one in which the Portfolio owns 5% or more of the outstanding voting securities, or a company which is under common ownership or control. The following securities were considered affiliated companies for all or some portion of the period ended June 30, 2016. Unless otherwise indicated, all information in the table is for the period ended June 30, 2016.
Share Share Balance Balance Realized Dividend Value at 12/31/15 Purchases Sales at 6/30/16 Gain/(Loss) Income at 6/30/16Janus Cash Collateral Fund LLC
1,880,835 21,624,975 (23,505,810) — $— $41,812(1) $—
Janus Cash Liquidity Fund LLC
1,804,000 26,011,420 (26,920,420) 895,000 — 1,389 895,000
Total $— $43,201 $895,000(1) Net of income paid to the securities lending agent and rebates paid to the borrowing counterparties.
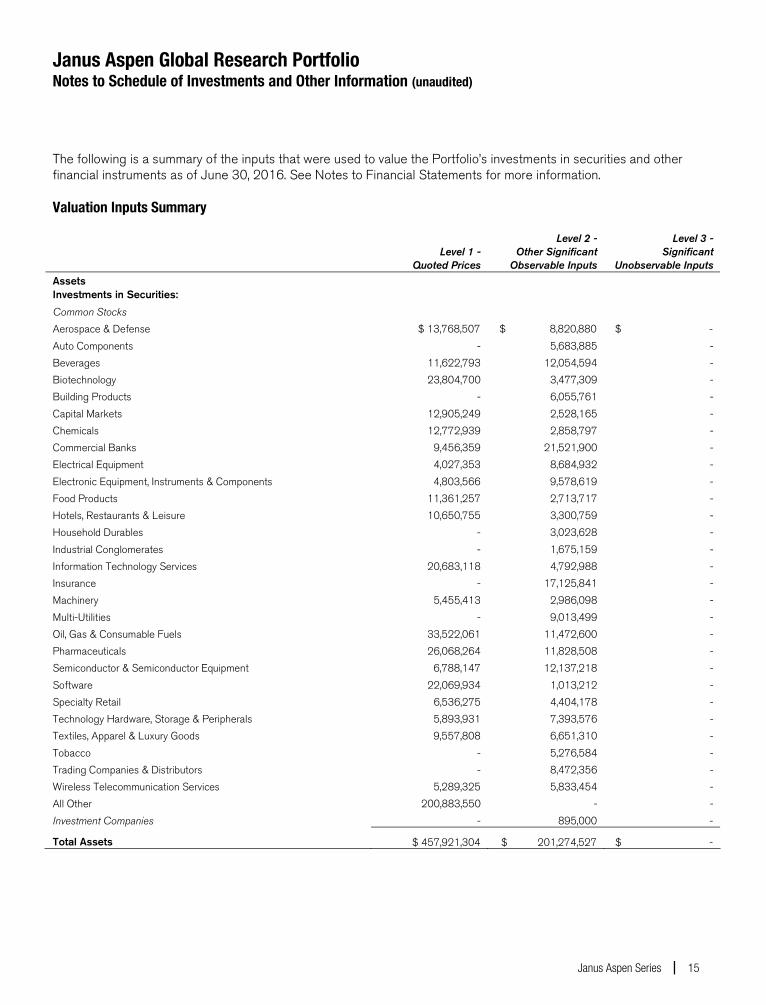
Janus Aspen Global Research Portfolio Notes to Schedule of Investments and Other Information (unaudited)
Janus Aspen Series 15
The following is a summary of the inputs that were used to value the Portfolio’s investments in securities and other financial instruments as of June 30, 2016. See Notes to Financial Statements for more information.
Valuation Inputs Summary
Level 1 -
Quoted Prices
Level 2 - Other Significant
Observable Inputs
Level 3 - Significant
Unobservable Inputs Assets Investments in Securities: Common Stocks Aerospace & Defense $ 13,768,507 $ 8,820,880 $ - Auto Components - 5,683,885 - Beverages 11,622,793 12,054,594 - Biotechnology 23,804,700 3,477,309 - Building Products - 6,055,761 - Capital Markets 12,905,249 2,528,165 - Chemicals 12,772,939 2,858,797 - Commercial Banks 9,456,359 21,521,900 - Electrical Equipment 4,027,353 8,684,932 - Electronic Equipment, Instruments & Components 4,803,566 9,578,619 - Food Products 11,361,257 2,713,717 - Hotels, Restaurants & Leisure 10,650,755 3,300,759 - Household Durables - 3,023,628 - Industrial Conglomerates - 1,675,159 - Information Technology Services 20,683,118 4,792,988 - Insurance - 17,125,841 - Machinery 5,455,413 2,986,098 - Multi-Utilities - 9,013,499 - Oil, Gas & Consumable Fuels 33,522,061 11,472,600 - Pharmaceuticals 26,068,264 11,828,508 - Semiconductor & Semiconductor Equipment 6,788,147 12,137,218 - Software 22,069,934 1,013,212 - Specialty Retail 6,536,275 4,404,178 - Technology Hardware, Storage & Peripherals 5,893,931 7,393,576 - Textiles, Apparel & Luxury Goods 9,557,808 6,651,310 - Tobacco - 5,276,584 - Trading Companies & Distributors - 8,472,356 - Wireless Telecommunication Services 5,289,325 5,833,454 - All Other 200,883,550 - - Investment Companies - 895,000 -
Total Assets $ 457,921,304 $ 201,274,527 $ -
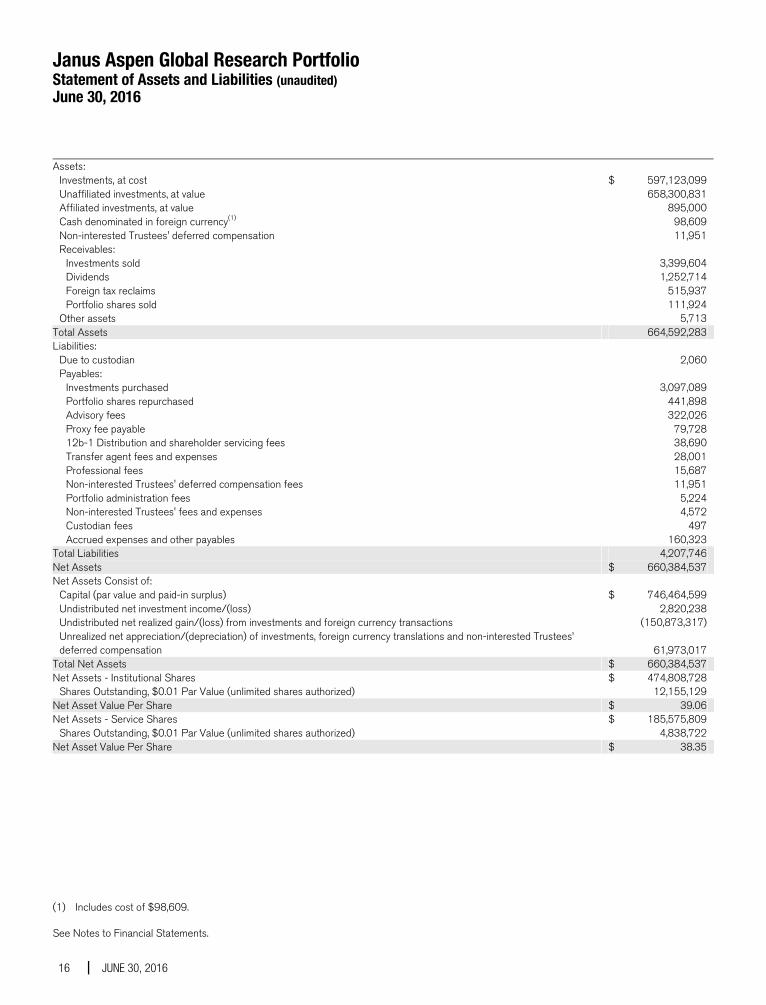
Janus Aspen Global Research Portfolio Statement of Assets and Liabilities (unaudited) June 30, 2016
See Notes to Financial Statements.
16 JUNE 30, 2016
Assets: Investments, at cost $ 597,123,099 Unaffiliated investments, at value 658,300,831 Affiliated investments, at value 895,000 Cash denominated in foreign currency(1) 98,609 Non-interested Trustees' deferred compensation 11,951 Receivables: Investments sold 3,399,604 Dividends 1,252,714 Foreign tax reclaims 515,937 Portfolio shares sold 111,924 Other assets 5,713Total Assets 664,592,283 Liabilities: Due to custodian 2,060 Payables: — Investments purchased 3,097,089 Portfolio shares repurchased 441,898 Advisory fees 322,026 Proxy fee payable 79,728 12b-1 Distribution and shareholder servicing fees 38,690 Transfer agent fees and expenses 28,001 Professional fees 15,687 Non-interested Trustees' deferred compensation fees 11,951 Portfolio administration fees 5,224 Non-interested Trustees' fees and expenses 4,572 Custodian fees 497 Accrued expenses and other payables 160,323Total Liabilities 4,207,746 Net Assets $ 660,384,537 Net Assets Consist of: Capital (par value and paid-in surplus) $ 746,464,599 Undistributed net investment income/(loss) 2,820,238 Undistributed net realized gain/(loss) from investments and foreign currency transactions (150,873,317)
Unrealized net appreciation/(depreciation) of investments, foreign currency translations and non-interested Trustees’ deferred compensation 61,973,017
Total Net Assets $ 660,384,537 Net Assets - Institutional Shares $ 474,808,728 Shares Outstanding, $0.01 Par Value (unlimited shares authorized) 12,155,129Net Asset Value Per Share $ 39.06 Net Assets - Service Shares $ 185,575,809 Shares Outstanding, $0.01 Par Value (unlimited shares authorized) 4,838,722Net Asset Value Per Share $ 38.35
(1) Includes cost of $98,609.
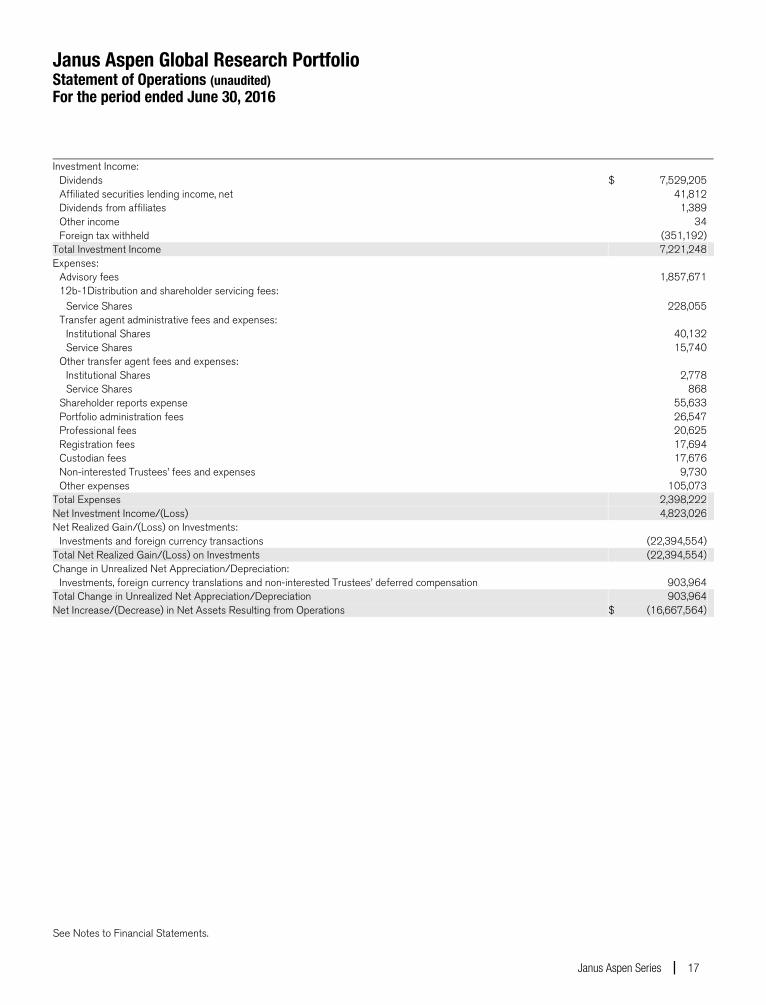
Janus Aspen Global Research Portfolio Statement of Operations (unaudited) For the period ended June 30, 2016
See Notes to Financial Statements.
Janus Aspen Series 17
Investment Income: Dividends $ 7,529,205 Affiliated securities lending income, net 41,812 Dividends from affiliates 1,389 Other income 34 Foreign tax withheld (351,192)Total Investment Income 7,221,248 Expenses: Advisory fees 1,857,671 12b-1Distribution and shareholder servicing fees: Service Shares 228,055 Transfer agent administrative fees and expenses: Institutional Shares 40,132 Service Shares 15,740 Other transfer agent fees and expenses: Institutional Shares 2,778 Service Shares 868 Shareholder reports expense 55,633 Portfolio administration fees 26,547 Professional fees 20,625 Registration fees 17,694 Custodian fees 17,676 Non-interested Trustees’ fees and expenses 9,730 Other expenses 105,073Total Expenses 2,398,222 Net Investment Income/(Loss) 4,823,026 Net Realized Gain/(Loss) on Investments: Investments and foreign currency transactions (22,394,554)Total Net Realized Gain/(Loss) on Investments (22,394,554) Change in Unrealized Net Appreciation/Depreciation: Investments, foreign currency translations and non-interested Trustees’ deferred compensation 903,964Total Change in Unrealized Net Appreciation/Depreciation 903,964 Net Increase/(Decrease) in Net Assets Resulting from Operations $ (16,667,564)
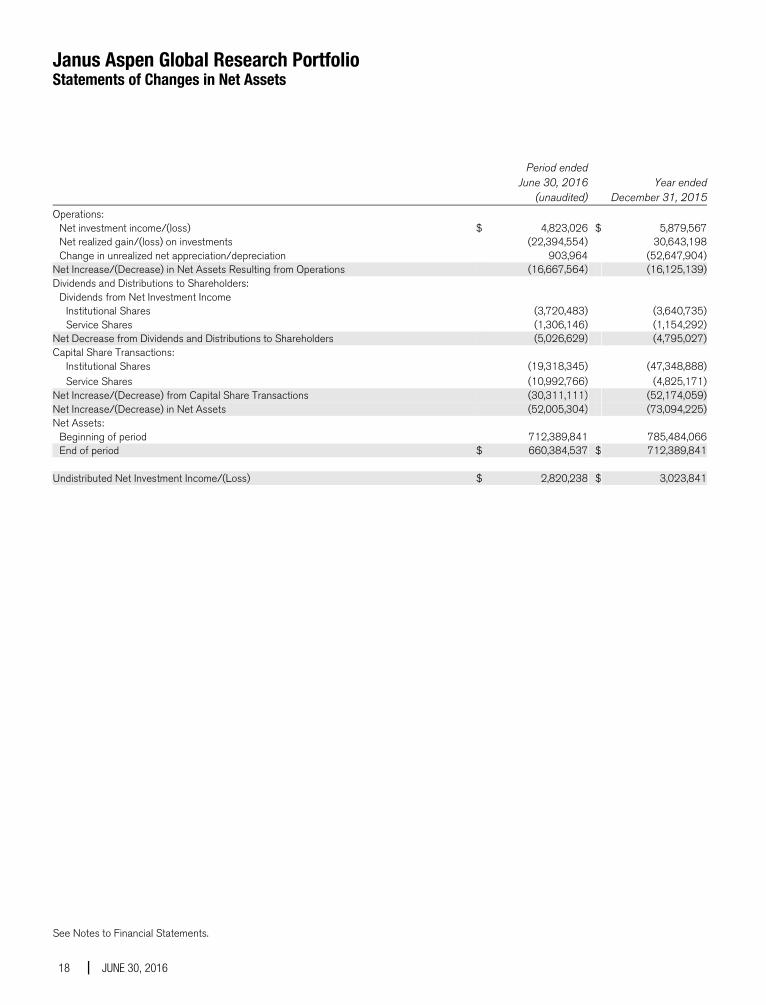
Janus Aspen Global Research Portfolio Statements of Changes in Net Assets
See Notes to Financial Statements.
18 JUNE 30, 2016
Period ended June 30, 2016
(unaudited) Year ended
December 31, 2015
Operations: Net investment income/(loss) $ 4,823,026 $ 5,879,567 Net realized gain/(loss) on investments (22,394,554) 30,643,198 Change in unrealized net appreciation/depreciation 903,964 (52,647,904)Net Increase/(Decrease) in Net Assets Resulting from Operations (16,667,564) (16,125,139)Dividends and Distributions to Shareholders: Dividends from Net Investment Income Institutional Shares (3,720,483) (3,640,735) Service Shares (1,306,146) (1,154,292)Net Decrease from Dividends and Distributions to Shareholders (5,026,629) (4,795,027)Capital Share Transactions: Institutional Shares (19,318,345) (47,348,888) Service Shares (10,992,766) (4,825,171)Net Increase/(Decrease) from Capital Share Transactions (30,311,111) (52,174,059)Net Increase/(Decrease) in Net Assets (52,005,304) (73,094,225)Net Assets: Beginning of period 712,389,841 785,484,066 End of period $ 660,384,537 $ 712,389,841 Undistributed Net Investment Income/(Loss) $ 2,820,238 $ 3,023,841
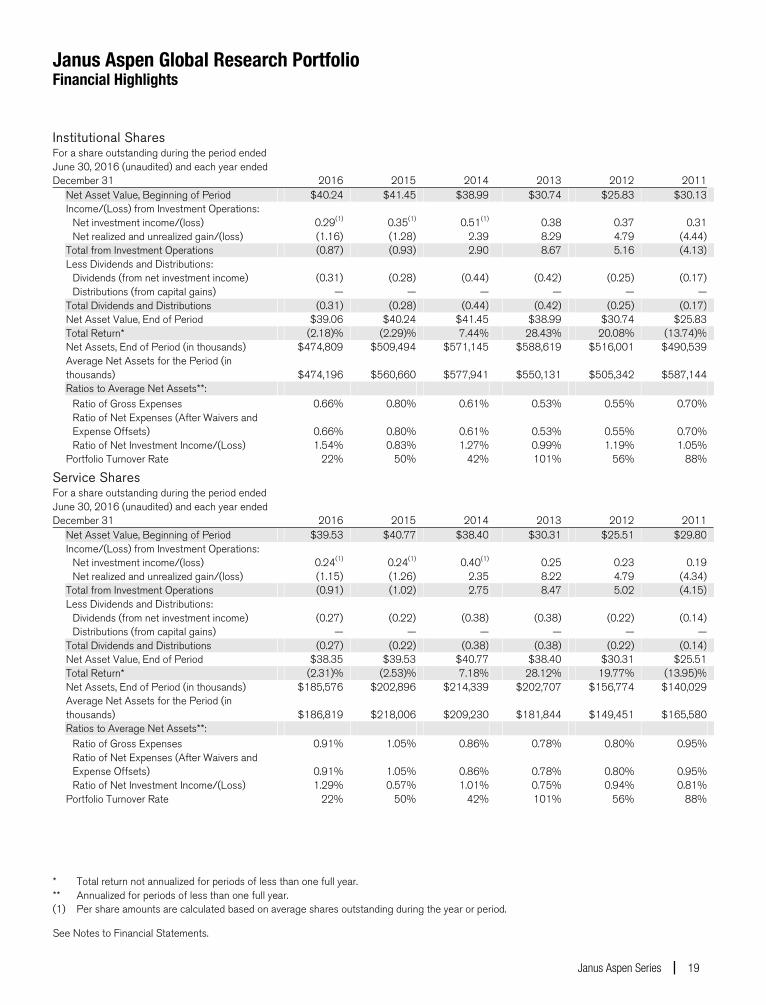
Janus Aspen Global Research Portfolio Financial Highlights
See Notes to Financial Statements.
Janus Aspen Series 19
Institutional Shares For a share outstanding during the period ended June 30, 2016 (unaudited) and each year ended December 31 2016 2015 2014 2013 2012 2011 Net Asset Value, Beginning of Period $40.24 $41.45 $38.99 $30.74 $25.83 $30.13 Income/(Loss) from Investment Operations: Net investment income/(loss) 0.29(1) 0.35(1) 0.51(1) 0.38 0.37 0.31 Net realized and unrealized gain/(loss) (1.16) (1.28) 2.39 8.29 4.79 (4.44) Total from Investment Operations (0.87) (0.93) 2.90 8.67 5.16 (4.13) Less Dividends and Distributions: Dividends (from net investment income) (0.31) (0.28) (0.44) (0.42) (0.25) (0.17) Distributions (from capital gains) — — — — — — Total Dividends and Distributions (0.31) (0.28) (0.44) (0.42) (0.25) (0.17) Net Asset Value, End of Period $39.06 $40.24 $41.45 $38.99 $30.74 $25.83 Total Return* (2.18)% (2.29)% 7.44% 28.43% 20.08% (13.74)% Net Assets, End of Period (in thousands) $474,809 $509,494 $571,145 $588,619 $516,001 $490,539
Average Net Assets for the Period (in thousands) $474,196 $560,660 $577,941 $550,131 $505,342 $587,144
Ratios to Average Net Assets**: Ratio of Gross Expenses 0.66% 0.80% 0.61% 0.53% 0.55% 0.70%
Ratio of Net Expenses (After Waivers and Expense Offsets) 0.66% 0.80% 0.61% 0.53% 0.55% 0.70%
Ratio of Net Investment Income/(Loss) 1.54% 0.83% 1.27% 0.99% 1.19% 1.05% Portfolio Turnover Rate 22% 50% 42% 101% 56% 88% 1
Service Shares For a share outstanding during the period ended June 30, 2016 (unaudited) and each year ended December 31 2016 2015 2014 2013 2012 2011 Net Asset Value, Beginning of Period $39.53 $40.77 $38.40 $30.31 $25.51 $29.80 Income/(Loss) from Investment Operations: Net investment income/(loss) 0.24(1) 0.24(1) 0.40(1) 0.25 0.23 0.19 Net realized and unrealized gain/(loss) (1.15) (1.26) 2.35 8.22 4.79 (4.34) Total from Investment Operations (0.91) (1.02) 2.75 8.47 5.02 (4.15) Less Dividends and Distributions: Dividends (from net investment income) (0.27) (0.22) (0.38) (0.38) (0.22) (0.14) Distributions (from capital gains) — — — — — — Total Dividends and Distributions (0.27) (0.22) (0.38) (0.38) (0.22) (0.14) Net Asset Value, End of Period $38.35 $39.53 $40.77 $38.40 $30.31 $25.51 Total Return* (2.31)% (2.53)% 7.18% 28.12% 19.77% (13.95)% Net Assets, End of Period (in thousands) $185,576 $202,896 $214,339 $202,707 $156,774 $140,029
Average Net Assets for the Period (in thousands) $186,819 $218,006 $209,230 $181,844 $149,451 $165,580
Ratios to Average Net Assets**: Ratio of Gross Expenses 0.91% 1.05% 0.86% 0.78% 0.80% 0.95%
Ratio of Net Expenses (After Waivers and Expense Offsets) 0.91% 1.05% 0.86% 0.78% 0.80% 0.95%
Ratio of Net Investment Income/(Loss) 1.29% 0.57% 1.01% 0.75% 0.94% 0.81% Portfolio Turnover Rate 22% 50% 42% 101% 56% 88%
* Total return not annualized for periods of less than one full year.** Annualized for periods of less than one full year. (1) Per share amounts are calculated based on average shares outstanding during the year or period.
Janus Aspen Global Research Portfolio Notes to Financial Statements (unaudited)
20 JUNE 30, 2016
1. Organization and Significant Accounting Policies Janus Aspen Global Research Portfolio (the “Portfolio”) is a series fund. The Portfolio is part of Janus Aspen Series (the “Trust”), which is organized as a Delaware statutory trust and is registered under the Investment Company Act of 1940, as amended (the “1940 Act”), as an open-end management investment company, and therefore has applied the specialized accounting and reporting guidance in Financial Accounting Standards Board (“FASB”) Accounting Standards Codification (“ASC”) Topic 946. The Trust offers twelve portfolios which include multiple series of shares, with differing investment objectives and policies. The Portfolio seeks long-term growth of capital. The Portfolio is classified as diversified, as defined in the 1940 Act.
The Portfolio currently offers two classes of shares: Institutional Shares and Service Shares. Each class represents an interest in the same portfolio of investments. Institutional Shares are offered only in connection with investment in and payments under variable insurance contracts as well as certain qualified retirement plans. Service Shares are offered only in connection with investment in and payments under variable insurance contracts as well as certain qualified retirement plans that require a fee from Portfolio assets to procure distribution and administrative services to contract owners and plan participants.
Shareholders, including other portfolios, participating insurance companies, as well as accounts, may from time to time own (beneficially or of record) a significant percentage of the Portfolio’s Shares and can be considered to “control” the Portfolio when that ownership exceeds 25% of the Portfolio’s assets (and which may differ from control as determined in accordance with accounting principles generally accepted in the United States of America).
The following accounting policies have been followed by the Portfolio and are in conformity with accounting principles generally accepted in the United States of America.
Investment Valuation Securities held by the Portfolio are valued in accordance with policies and procedures established by and under the supervision of the Trustees (the “Valuation Procedures”). Equity securities traded on a domestic securities exchange are generally valued at the closing prices on the primary market or exchange on which they trade. If such price is lacking for the trading period immediately preceding the time of determination, such securities are valued at their current bid price. Equity securities that are traded on a foreign exchange are generally valued at the closing prices on such markets. In the event that there is no current trading volume on a particular security in such foreign exchange, the bid price from the primary exchange is generally used to value the security. Securities that are traded on the over-the-counter (“OTC”) markets are generally valued at their closing or latest bid prices as available. Foreign securities and currencies are converted to U.S. dollars using the applicable exchange rate in effect at the close of the New York Stock Exchange (“NYSE”). The Portfolio will determine the market value of individual securities held by it by using prices provided by one or more approved professional pricing services or, as needed, by obtaining market quotations from independent broker-dealers. Most debt securities are valued in accordance with the evaluated bid price supplied by the pricing service that is intended to reflect market value. The evaluated bid price supplied by the pricing service is an evaluation that may consider factors such as security prices, yields, maturities and ratings. Certain short-term securities maturing within 60 days or less may be evaluated and valued on an amortized cost basis provided that the amortized cost determined approximates market value. Securities for which market quotations or evaluated prices are not readily available or deemed unreliable are valued at fair value determined in good faith under the Valuation Procedures. Circumstances in which fair value pricing may be utilized include, but are not limited to: (i) a significant event that may affect the securities of a single issuer, such as a merger, bankruptcy, or significant issuer-specific development; (ii) an event that may affect an entire market, such as a natural disaster or significant governmental action; (iii) a nonsignificant event such as a market closing early or not opening, or a security trading halt; and (iv) pricing of a nonvalued security and a restricted or nonpublic security. Special valuation considerations may apply with respect to “odd-lot” fixed-income transactions which, due to their small size, may receive evaluated prices by pricing services which reflect a large block trade and not what actually could be obtained for the odd-lot position. The Portfolio uses systematic fair valuation models provided by independent third parties to value international equity securities in order to adjust for stale pricing, which may occur between the close of certain foreign exchanges and the close of the NYSE.
Valuation Inputs Summary FASB ASC 820, Fair Value Measurements and Disclosures (“ASC 820”), defines fair value, establishes a framework for measuring fair value, and expands disclosure requirements regarding fair value measurements. This standard emphasizes that fair value is a market-based measurement that should be determined based on the assumptions that
Janus Aspen Global Research Portfolio Notes to Financial Statements (unaudited)
Janus Aspen Series 21
market participants would use in pricing an asset or liability and establishes a hierarchy that prioritizes inputs to valuation techniques used to measure fair value. These inputs are summarized into three broad levels:
Level 1 – Unadjusted quoted prices in active markets the Portfolio has the ability to access for identical assets or liabilities.
Level 2 – Observable inputs other than unadjusted quoted prices included in Level 1 that are observable for the asset or liability either directly or indirectly. These inputs may include quoted prices for the identical instrument on an inactive market, prices for similar instruments, interest rates, prepayment speeds, credit risk, yield curves, default rates and similar data.
Assets or liabilities categorized as Level 2 in the hierarchy generally include: debt securities fair valued in accordance with the evaluated bid or ask prices supplied by a pricing service; securities traded on OTC markets and listed securities for which no sales are reported that are fair valued at the latest bid price (or yield equivalent thereof) obtained from one or more dealers transacting in a market for such securities or by a pricing service approved by the Portfolio’s Trustees; certain short-term debt securities with maturities of 60 days or less that are fair valued at amortized cost; and equity securities of foreign issuers whose fair value is determined by using systematic fair valuation models provided by independent third parties in order to adjust for stale pricing which may occur between the close of certain foreign exchanges and the close of the NYSE. Other securities that may be categorized as Level 2 in the hierarchy include, but are not limited to, preferred stocks, bank loans, swaps, investments in unregistered investment companies, options, and forward contracts.
Level 3 – Unobservable inputs for the asset or liability to the extent that relevant observable inputs are not available, representing the Portfolio’s own assumptions about the assumptions that a market participant would use in valuing the asset or liability, and that would be based on the best information available.
There have been no significant changes in valuation techniques used in valuing any such positions held by the Portfolio since the beginning of the fiscal year.
The inputs or methodology used for fair valuing securities are not necessarily an indication of the risk associated with investing in those securities. The summary of inputs used as of June 30, 2016 to fair value the Portfolio’s investments in securities and other financial instruments is included in the “Valuation Inputs Summary” in the Notes to Schedule of Investments and Other Information.
The Portfolio recognizes transfers between the levels as of the beginning of the fiscal year. The following describes the amounts of transfers between Level 1, Level 2 and Level 3 of the fair value hierarchy during the period.
Financial assets of $183,686,277 were transferred out of Level 1 to Level 2 since certain foreign equity prices were applied a fair valuation adjustment factor at the end of the current period and no factor was applied at the end of the prior fiscal year.
Investment Transactions and Investment Income Investment transactions are accounted for as of the date purchased or sold (trade date). Dividend income is recorded on the ex-dividend date. Certain dividends from foreign securities will be recorded as soon as the Portfolio is informed of the dividend, if such information is obtained subsequent to the ex-dividend date. Dividends from foreign securities may be subject to withholding taxes in foreign jurisdictions. Interest income is recorded on the accrual basis and includes amortization of premiums and accretion of discounts. Gains and losses are determined on the identified cost basis, which is the same basis used for federal income tax purposes. Income, as well as gains and losses, both realized and unrealized, are allocated daily to each class of shares based upon the ratio of net assets represented by each class as a percentage of total net assets.
Expenses The Portfolio bears expenses incurred specifically on its behalf. Each class of shares bears a portion of general expenses, which are allocated daily to each class of shares based upon the ratio of net assets represented by each class as a percentage of total net assets. Expenses directly attributable to a specific class of shares are charged against the operations of such class.
Estimates The preparation of financial statements in conformity with accounting principles generally accepted in the United States of America requires management to make estimates and assumptions that affect the reported amount of assets and
Janus Aspen Global Research Portfolio Notes to Financial Statements (unaudited)
22 JUNE 30, 2016
liabilities and disclosure of contingent assets and liabilities at the date of the financial statements, and the reported amounts of income and expenses during the reporting period. Actual results could differ from those estimates.
Indemnifications In the normal course of business, the Portfolio may enter into contracts that contain provisions for indemnification of other parties against certain potential liabilities. The Portfolio’s maximum exposure under these arrangements is unknown, and would involve future claims that may be made against the Portfolio that have not yet occurred. Currently, the risk of material loss from such claims is considered remote.
Foreign Currency Translations The Portfolio does not isolate that portion of the results of operations resulting from the effect of changes in foreign exchange rates on investments from the fluctuations arising from changes in market prices of securities held at the date of the financial statements. Net unrealized appreciation or depreciation of investments and foreign currency translations arise from changes in the value of assets and liabilities, including investments in securities held at the date of the financial statements, resulting from changes in the exchange rates and changes in market prices of securities held.
Currency gains and losses are also calculated on payables and receivables that are denominated in foreign currencies. The payables and receivables are generally related to foreign security transactions and income translations.
Foreign currency-denominated assets and forward currency contracts may involve more risks than domestic transactions, including currency risk, counterparty risk, political and economic risk, regulatory risk and equity risk. Risks may arise from unanticipated movements in the value of foreign currencies relative to the U.S. dollar.
Dividends and Distributions The Portfolio may make semiannual distributions of substantially all of its investment income and an annual distribution of its net realized capital gains (if any).
The Portfolio may make certain investments in real estate investment trusts (“REITs”) which pay dividends to their shareholders based upon funds available from operations. It is quite common for these dividends to exceed the REITs’ taxable earnings and profits, resulting in the excess portion of such dividends being designated as a return of capital. If the Portfolio distributes such amounts, such distributions could constitute a return of capital to shareholders for federal income tax purposes.
Federal Income Taxes The Portfolio intends to continue to qualify as a regulated investment company and distribute all of its taxable income in accordance with the requirements of Subchapter M of the Internal Revenue Code. Management has analyzed the Portfolio’s tax positions taken for all open federal income tax years, generally a three-year period, and has concluded that no provision for federal income tax is required in the Portfolio’s financial statements. The Portfolio is not aware of any tax positions for which it is reasonably possible that the total amounts of unrecognized tax benefits will significantly change in the next twelve months.
2. Other Investments and Strategies
Additional Investment Risk The financial crisis in both the U.S. and global economies over the past several years has resulted, and may continue to result, in a significant decline in the value and liquidity of many securities of issuers worldwide in the equity and fixed-income/credit markets. In response to the crisis, the United States and certain foreign governments, along with the U.S. Federal Reserve and certain foreign central banks, took steps to support the financial markets. The withdrawal of this support, a failure of measures put in place to respond to the crisis, or investor perception that such efforts were not sufficient could each negatively affect financial markets generally, and the value and liquidity of specific securities. In addition, policy and legislative changes in the United States and in other countries continue to impact many aspects of financial regulation. The effect of these changes on the markets, and the practical implications for market participants, including the Portfolio, may not be fully known for some time. As a result, it may also be unusually difficult to identify both investment risks and opportunities, which could limit or preclude the Portfolio’s ability to achieve its investment objective. Therefore, it is important to understand that the value of your investment may fall, sometimes sharply, and you could lose money.
Janus Aspen Global Research Portfolio Notes to Financial Statements (unaudited)
Janus Aspen Series 23
The enactment of the Dodd-Frank Wall Street Reform and Consumer Protection Act (the “Dodd-Frank Act”) provided for widespread regulation of financial institutions, consumer financial products and services, broker-dealers, OTC derivatives, investment advisers, credit rating agencies, and mortgage lending, which expanded federal oversight in the financial sector, including the investment management industry. Many provisions of the Dodd-Frank Act remain pending and will be implemented through future rulemaking. Therefore, the ultimate impact of the Dodd-Frank Act and the regulations under the Dodd-Frank Act on the Portfolio and the investment management industry as a whole, is not yet certain.
A number of countries in the European Union (“EU”) have experienced, and may continue to experience, severe economic and financial difficulties. In particular, many EU nations are susceptible to economic risks associated with high levels of debt, notably due to investments in sovereign debt of countries such as Greece, Italy, Spain, Portugal, and Ireland. Many non-governmental issuers, and even certain governments, have defaulted on, or been forced to restructure, their debts. Many other issuers have faced difficulties obtaining credit or refinancing existing obligations. Financial institutions have in many cases required government or central bank support, have needed to raise capital, and/or have been impaired in their ability to extend credit. As a result, financial markets in the EU experienced extreme volatility and declines in asset values and liquidity. Responses to these financial problems by European governments, central banks, and others, including austerity measures and reforms, may not work, may result in social unrest, and may limit future growth and economic recovery or have other unintended consequences. Further defaults or restructurings by governments and others of their debt could have additional adverse effects on economies, financial markets, and asset valuations around the world. Greece, Ireland, and Portugal have already received one or more "bailouts" from other Eurozone member states, and it is unclear how much additional funding they will require or if additional Eurozone member states will require bailouts in the future. The risk of investing in securities in the European markets may also be heightened due to the referendum in which the United Kingdom voted to exit the EU (known as “Brexit”). One or more other countries may also abandon the euro and/or withdraw from the EU, placing its currency and banking system in jeopardy.
Certain areas of the world have historically been prone to and economically sensitive to environmental events such as, but not limited to, hurricanes, earthquakes, typhoons, flooding, tidal waves, tsunamis, erupting volcanoes, wildfires or droughts, tornadoes, mudslides, or other weather-related phenomena. Such disasters, and the resulting physical or economic damage, could have a severe and negative impact on the Portfolio’s investment portfolio and, in the longer term, could impair the ability of issuers in which the Portfolio invests to conduct their businesses as they would under normal conditions. Adverse weather conditions may also have a particularly significant negative effect on issuers in the agricultural sector and on insurance companies that insure against the impact of natural disasters.
Counterparties Portfolio transactions involving a counterparty are subject to the risk that the counterparty or a third party will not fulfill its obligation to the Portfolio (“counterparty risk”). Counterparty risk may arise because of the counterparty’s financial condition (i.e., financial difficulties, bankruptcy, or insolvency), market activities and developments, or other reasons, whether foreseen or not. A counterparty’s inability to fulfill its obligation may result in significant financial loss to the Portfolio. The Portfolio may be unable to recover its investment from the counterparty or may obtain a limited recovery, and/or recovery may be delayed. The extent of the Portfolio’s exposure to counterparty risk with respect to financial assets and liabilities approximates its carrying value. See the "Offsetting Assets and Liabilities" section of this Note for further details.
The Portfolio may be exposed to counterparty risk through participation in various programs, including, but not limited to, lending its securities to third parties, cash sweep arrangements whereby the Portfolio’s cash balance is invested in one or more types of cash management vehicles, as well as investments in, but not limited to, repurchase agreements, debt securities, and derivatives, including various types of swaps, futures and options. The Portfolio intends to enter into financial transactions with counterparties that Janus Capital believes to be creditworthy at the time of the transaction. There is always the risk that Janus Capital’s analysis of a counterparty’s creditworthiness is incorrect or may change due to market conditions. To the extent that the Portfolio focuses its transactions with a limited number of counterparties, it will have greater exposure to the risks associated with one or more counterparties.
Real Estate Investing The Portfolio may invest in equity and debt securities of real estate-related companies. Such companies may include those in the real estate industry or real estate-related industries. These securities may include common stocks, corporate bonds, preferred stocks, and other equity securities, including, but not limited to, mortgage-backed securities,
Janus Aspen Global Research Portfolio Notes to Financial Statements (unaudited)
24 JUNE 30, 2016
real estate-backed securities, securities of REITs and similar REIT-like entities. A REIT is a trust that invests in real estate-related projects, such as properties, mortgage loans, and construction loans. REITs are generally categorized as equity, mortgage, or hybrid REITs. A REIT may be listed on an exchange or traded OTC.
Securities Lending Under procedures adopted by the Trustees, the Portfolio may seek to earn additional income by lending securities to qualified parties. Deutsche Bank AG acts as securities lending agent and a limited purpose custodian or subcustodian to receive and disburse cash balances and cash collateral, hold short-term investments, hold collateral, and perform other custodian functions. The Portfolio may lend portfolio securities in an amount equal to up to 1/3 of its total assets as determined at the time of the loan origination. There is the risk of delay in recovering a loaned security or the risk of loss in collateral rights if the borrower fails financially. In addition, Janus Capital makes efforts to balance the benefits and risks from granting such loans. All loans will be continuously secured by collateral which may consist of cash, U.S. Government securities, domestic and foreign short-term debt instruments, letters of credit, time deposits, repurchase agreements, money market mutual funds or other money market accounts, or such other collateral as permitted by the SEC. If the Portfolio is unable to recover a security on loan, the Portfolio may use the collateral to purchase replacement securities in the market. There is a risk that the value of the collateral could decrease below the cost of the replacement security by the time the replacement investment is made, resulting in a loss to the Portfolio.
Upon receipt of cash collateral, Janus Capital may invest it in affiliated or non-affiliated cash management vehicles, whether registered or unregistered entities, as permitted by the 1940 Act and rules promulgated thereunder. Janus Capital currently intends to invest the cash collateral in a cash management vehicle for which Janus Capital serves as investment adviser, Janus Cash Collateral Fund LLC. An investment in Janus Cash Collateral Fund LLC is generally subject to the same risks that shareholders experience when investing in similarly structured vehicles, such as the potential for significant fluctuations in assets as a result of the purchase and redemption activity of the securities lending program, a decline in the value of the collateral, and possible liquidity issues. Such risks may delay the return of the cash collateral and cause the Portfolio to violate its agreement to return the cash collateral to a borrower in a timely manner. As adviser to the Portfolio and Janus Cash Collateral Fund LLC, Janus Capital has an inherent conflict of interest as a result of its fiduciary duties to both the Portfolio and Janus Cash Collateral Fund LLC. Additionally, Janus Capital receives an investment advisory fee of 0.05% for managing Janus Cash Collateral Fund LLC, but it may not receive a fee for managing certain other affiliated cash management vehicles in which the Portfolio may invest, and therefore may have an incentive to allocate preferred investment opportunities to investment vehicles for which it is receiving a fee.
The value of the collateral must be at least 102% of the market value of the loaned securities that are denominated in U.S. dollars and 105% of the market value of the loaned securities that are not denominated in U.S. dollars. Loaned securities and related collateral are marked-to-market each business day based upon the market value of the loaned securities at the close of business, employing the most recent available pricing information. Collateral levels are then adjusted based on this mark-to-market evaluation.
The cash collateral invested by Janus Capital is disclosed in the Schedule of Investments. Income earned from the investment of the cash collateral, net of rebates paid to, or fees paid by, borrowers and less the fees paid to the lending agent are included as “Affiliated securities lending income, net” on the Statement of Operations.There were no securities on loan as of June 30, 2016.
3. Investment Advisory Agreements and Other Transactions with Affiliates The Portfolio pays Janus Capital an investment advisory fee which is calculated daily and paid monthly. The Portfolio’s "base" fee rate prior to any performance adjustment (expressed as an annual rate) is 0.60%.
The investment advisory fee rate is determined by calculating a base fee and applying a performance adjustment. The base fee rate is the same as the contractual investment advisory fee rate. The performance adjustment either increases or decreases the base fee depending on how well the Portfolio has performed relative to its benchmark index. The Portfolio's benchmark index used in the calculation is the MSCI World IndexSM.
The calculation of the performance adjustment applies as follows:
Investment Advisory Fee = Base Fee Rate +/- Performance Adjustment
Janus Aspen Global Research Portfolio Notes to Financial Statements (unaudited)
Janus Aspen Series 25
The investment advisory fee rate paid to Janus Capital by the Portfolio consists of two components: (1) a base fee calculated by applying the contractual fixed rate of the advisory fee to the Portfolio’s average daily net assets during the previous month (“Base Fee Rate”), plus or minus (2) a performance-fee adjustment (“Performance Adjustment”) calculated by applying a variable rate of up to 0.15% (positive or negative) to the Portfolio’s average daily net assets during the applicable performance measurement period, which is generally the previous 36 months.
The Portfolio’s prospectuses and statement(s) of additional information contain additional information about performance-based fees. The amount shown as advisory fees on the Statement of Operations reflects the Base Fee Rate plus/minus any Performance Adjustment. For the period ended June 30, 2016, the performance adjusted investment advisory fee rate before any waivers and/or reimbursements of expenses is 0.57%.
Janus Services LLC (“Janus Services”), a wholly-owned subsidiary of Janus Capital, is the Portfolio’s transfer agent. Effective May 1, 2016, Janus Services receives an administrative services fee at an annual rate of 0.05% of the average daily net assets of the Portfolio for arranging for the provision by participating insurance companies and qualified plan service providers of administrative services, including recordkeeping, subaccounting, order processing, or other shareholder services provided on behalf of contract holders or plan participants investing in the Portfolio. Other shareholder services may include the provision of order confirmations, periodic account statements, forwarding prospectuses, shareholder reports, and other materials to existing investors, and answering inquiries regarding accounts. Janus Services expects to use this entire fee to compensate insurance companies and qualified plan service providers for providing these services to their customers who invest in the Portfolio. Any unused portion will be reimbursed to the applicable share class at least annually.
In addition, Janus Services provides or arranges for the provision of certain other internal administrative, recordkeeping, and shareholder relations services for the Portfolio. Janus Services is not compensated for these internal services related to the shares, except for out-of-pocket costs. These amounts are disclosed as “Other transfer agent fees and expenses” on the Statement of Operations.
Under a distribution and shareholder servicing plan (the “Plan”) adopted in accordance with Rule 12b-1 under the 1940 Act, the Service Shares may pay the Trust’s distributor, Janus Distributors LLC (“Janus Distributors”), a wholly-owned subsidiary of Janus Capital, a fee for the sale and distribution and/or shareholder servicing of the Service Shares at an annual rate of up to 0.25% of the average daily net assets of the Service Shares. Under the terms of the Plan, the Trust is authorized to make payments to Janus Distributors for remittance to insurance companies and qualified plan service providers as compensation for distribution and/or shareholder services performed by such entities. These amounts are disclosed as “12b-1 Distribution and shareholder servicing fees” on the Statement of Operations. Payments under the Plan are not tied exclusively to actual 12b-1 distribution and servicing fees, and the payments may exceed 12b-1 distribution and servicing fees actually incurred. If any of the Portfolio’s actual 12b-1 distribution and servicing fees incurred during a calendar year are less than the payments made during a calendar year, the Portfolio will be refunded the difference. Refunds, if any, are included in “12b-1 Distribution fees and shareholder servicing fees” in the Statement of Operations.
Janus Capital furnishes certain administration, compliance, and accounting services for the Portfolio and is reimbursed by the Portfolio for certain of its costs in providing those services (to the extent Janus Capital seeks reimbursement and such costs are not otherwise waived). In addition, employees of Janus Capital and/or its affiliates may serve as officers of the Trust. The Portfolio also pays for salaries, fees, and expenses of certain Janus Capital employees and Portfolio officers, with respect to certain specified administration functions they perform on behalf of the Portfolio. The Portfolio pays these costs based on out-of-pocket expenses incurred by Janus Capital, and these costs are separate and apart from advisory fees and other expenses paid in connection with the investment advisory services Janus Capital provides to the Portfolio. These amounts are disclosed as “Portfolio administration fees” on the Statement of Operations. Some expenses related to compensation payable to the Portfolio's Chief Compliance Officer and compliance staff are shared with the Portfolio. Total compensation of $28,304 was paid to the Chief Compliance Officer and certain compliance staff by the Trust during the period ended June 30, 2016. The Portfolio's portion is reported as part of “Other expenses” on the Statement of Operations.
The Board of Trustees has adopted a deferred compensation plan (the “Deferred Plan”) for independent Trustees to elect to defer receipt of all or a portion of the annual compensation they are entitled to receive from the Portfolio. All deferred fees are credited to an account established in the name of the Trustees. The amounts credited to the account then increase or decrease, as the case may be, in accordance with the performance of one or more of the Janus funds
Janus Aspen Global Research Portfolio Notes to Financial Statements (unaudited)
26 JUNE 30, 2016
that are selected by the Trustees. The account balance continues to fluctuate in accordance with the performance of the selected fund or funds until final payment of all amounts are credited to the account. The fluctuation of the account balance is recorded by the Portfolio as unrealized appreciation/(depreciation) and is included as of June 30, 2016 on the Statement of Assets and Liabilities in the asset, “Non-interested Trustees’ deferred compensation,” and liability, “Non-interested Trustees’ deferred compensation fees.” Additionally, the recorded unrealized appreciation/(depreciation) is included in “Unrealized net appreciation/(depreciation) of investments, foreign currency translations and non-interested Trustees’ deferred compensation” on the Statement of Assets and Liabilities. Deferred compensation expenses for the period ended June 30, 2016 are included in “Non-interested Trustees’ fees and expenses” on the Statement of Operations. Trustees are allowed to change their designation of mutual funds from time to time. Amounts will be deferred until distributed in accordance with the Deferred Plan. Deferred fees of $20,150 were paid by the Trust to a Trustee under the Deferred Plan during the period ended June 30, 2016.
Pursuant to the provisions of the 1940 Act and related rules, the Portfolio may participate in an affiliated or nonaffiliated cash sweep program. In the cash sweep program, uninvested cash balances of the Portfolio may be used to purchase shares of affiliated or nonaffiliated money market funds or cash management pooled investment vehicles. The Portfolio is eligible to participate in the cash sweep program (the “Investing Funds”). As adviser, Janus Capital has an inherent conflict of interest because of its fiduciary duties to the affiliated money market funds or cash management pooled investment vehicles and the Investing Funds. Janus Cash Liquidity Fund LLC is an affiliated unregistered cash management pooled investment vehicle that invests primarily in highly-rated short-term fixed-income securities. Janus Cash Liquidity Fund LLC currently maintains a NAV of $1.00 per share and distributes income daily in a manner consistent with a registered product compliant with Rule 2a-7 under the 1940 Act. There are no restrictions on the Portfolio's ability to withdraw investments from Janus Cash Liquidity Fund LLC at will, and there are no unfunded capital commitments due from the Portfolio to Janus Cash Liquidity Fund LLC. The units of Janus Cash Liquidity Fund LLC are not charged any management fee, sales charge or service fee.
Any purchases and sales, realized gains/losses and recorded dividends from affiliated investments during the period ended June 30, 2016 can be found in a table located in the Notes to Schedule of Investments and Other Information.
The Portfolio is permitted to purchase or sell securities (“cross-trade”) between itself and other funds or accounts managed by Janus Capital Management LLC in accordance with Rule 17a-7 under the Investment Company Act of 1940 (“Rule 17a-7”), when the transaction is consistent with the investment objectives and policies of the Portfolio and in accordance with the Internal Cross Trade Procedures adopted by the Trust’s Board of Trustees. These procedures have been designed to ensure that any cross-trade of securities by the Portfolio from or to another fund or account that is or could be considered an affiliate of the Portfolio under certain limited circumstances by virtue of having a common investment adviser, common Officer, or common Trustee complies with Rule 17a-7. Under these procedures, each cross-trade is effected at the current market price to save costs where allowed. During the period ended June 30, 2016, the Portfolio engaged in cross trades amounting to $78,788 in purchases and $767,791 in sales, resulting in a net realized gain of $5,899. The net realized gain is included in “Investments and foreign currency transactions” within the “Net Realized and Unrealized Gain/(Loss) on Investments” section of the Portfolio’s Statement of Operations.
4. Federal Income Tax Income and capital gains distributions are determined in accordance with income tax regulations that may differ from accounting principles generally accepted in the United States of America. These differences are due to differing treatments for items such as net short-term gains, deferral of wash sale losses, foreign currency transactions, net investment losses, and capital loss carryovers.
The Portfolio has elected to treat gains and losses on forward foreign currency contracts as capital gains and losses, if applicable. Other foreign currency gains and losses on debt instruments are treated as ordinary income for federal income tax purposes pursuant to Section 988 of the Internal Revenue Code.
The aggregate cost of investments and the composition of unrealized appreciation and depreciation of investment securities for federal income tax purposes as of June 30, 2016 are noted below.
Unrealized appreciation and unrealized depreciation in the table below exclude appreciation/depreciation on foreign currency translations. The primary differences between book and tax appreciation or depreciation of investments are wash sale loss deferrals, investments in partnerships and investments in passive foreign investment companies.
Janus Aspen Global Research Portfolio Notes to Financial Statements (unaudited)
Janus Aspen Series 27
Federal Tax Cost Unrealized
AppreciationUnrealized
(Depreciation)Net Tax Appreciation/
(Depreciation) $ 596,889,162 $108,260,801 $(45,954,132) $ 62,306,669
Accumulated capital losses noted below represent net capital loss carryovers, as of December 31, 2015, that may be available to offset future realized capital gains and thereby reduce future taxable gains distributions. Under the Regulated Investment Company Modernization Act of 2010, the Portfolio is permitted to carry forward capital losses incurred in taxable years beginning after December 22, 2010 for an unlimited period. Losses incurred during those future years will be required to be utilized prior to the losses incurred in pre-enactment taxable years. As a result of this ordering rule, preenactment capital loss carryforwards may more likely expire unused. Also, post-enactment capital losses that are carried forward will retain their character as either short-term or long-term capital losses rather than being considered all short-term as under previous law.The following table shows these capital loss carryovers.
Capital Loss Carryover Schedule For the year ended December 31, 2015
December 31, 2017 Accumulated Capital Losses
$ (127,994,150) $ (127,994,150)
5. Capital Share Transactions Period ended June 30, 2016 Year ended December 31, 2015 Shares Amount Shares Amount
Institutional Shares: Shares sold 114,214 $ 4,357,509 345,913 $ 14,870,432 Reinvested dividends and distributions 94,189 3,720,483 84,766 3,640,735 Shares repurchased (714,248) (27,396,337) (1,548,262) (65,860,055)Net Increase/(Decrease) (505,845) $(19,318,345) (1,117,583) $(47,348,888)Service Shares: Shares sold 179,980 $ 6,756,091 758,532 $ 32,048,121 Reinvested dividends and distributions 33,672 1,306,146 27,329 1,154,292 Shares repurchased (508,118) (19,055,003) (910,448) (38,027,584)Net Increase/(Decrease) (294,466) $(10,992,766) (124,587) $ (4,825,171)
6. Purchases and Sales of Investment Securities For the period ended June 30, 2016, the aggregate cost of purchases and proceeds from sales of investment securities (excluding any short-term securities, short-term options contracts, and in-kind transactions) was as follows:
Purchases of Securities
Proceeds from Salesof Securities
Purchases of Long-Term U.S. Government
Obligations
Proceeds from Sales of Long-Term U.S.
Government Obligations $147,957,987 $ 177,667,202 $ - $ -
7. Subsequent Event Management has evaluated whether any events or transactions occurred subsequent to June 30, 2016 and through the date of issuance of the Portfolio’s financial statements and determined that there were no material events or transactions that would require recognition or disclosure in the Portfolio’s financial statements.
Janus Aspen Global Research Portfolio Additional Information (unaudited)
28 JUNE 30, 2016
Proxy Voting Policies and Voting Record A description of the policies and procedures that the Portfolio uses to determine how to vote proxies relating to its portfolio securities is available without charge: (i) upon request, by calling 1-800-525-0020 (toll free); (ii) on the Portfolio’s website at janus.com/proxyvoting; and (iii) on the SEC’s website at http://www.sec.gov. Additionally, information regarding the Portfolio’s proxy voting record for the most recent twelve-month period ended June 30 is also available, free of charge, through janus.com/proxyvoting and from the SEC’s website at http://www.sec.gov.
Quarterly Portfolio Holdings The Portfolio files its complete portfolio holdings (schedule of investments) with the SEC for the first and third quarters of each fiscal year on Form N-Q within 60 days of the end of such fiscal quarter. The Portfolio’s Form N-Q: (i) is available on the SEC’s website at http://www.sec.gov; (ii) may be reviewed and copied at the SEC’s Public Reference Room in Washington, D.C. (information on the Public Reference Room may be obtained by calling 1-800-SEC-0330); and (iii) is available without charge, upon request, by calling Janus at 1-800-525-0020 (toll free).
APPROVAL OF ADVISORY AGREEMENTS DURING THE PERIOD The Trustees of Janus Investment Fund and Janus Aspen Series, each of whom serves as an “independent” Trustee (the “Trustees”), oversee the management of each Fund of Janus Investment Fund and each Portfolio of Janus Aspen Series (each, a “Fund” and collectively, the “Funds”), and as required by law, determine annually whether to continue the investment advisory agreement for each Fund and the subadvisory agreements for the 16 Funds that utilize subadvisers.
In connection with their most recent consideration of those agreements for each Fund, the Trustees received and reviewed information provided by Janus Capital and the respective subadvisers in response to requests of the Trustees and their independent legal counsel. They also received and reviewed information and analysis provided by, and in response to requests of, their independent fee consultant. Throughout their consideration of the agreements, the Trustees were advised by their independent legal counsel. The Trustees met with management to consider the agreements, and also met separately in executive session with their independent legal counsel and their independent fee consultant.
At a meeting held on December 9, 2015, based on the Trustees’ evaluation of the information provided by Janus Capital, the subadvisers, and the independent fee consultant, as well as other information, the Trustees determined that the overall arrangements between each Fund and Janus Capital and each subadviser, as applicable, were fair and reasonable in light of the nature, extent and quality of the services provided by Janus Capital, its affiliates and the subadvisers, the fees charged for those services, and other matters that the Trustees considered relevant in the exercise of their business judgment. At that meeting, the Trustees unanimously approved the continuation of the investment advisory agreement for each Fund, and the subadvisory agreement for each subadvised Fund, for the period from either January 1 or February 1, 2016 through January 1 or February 1, 2017, respectively, subject to earlier termination as provided for in each agreement.
In considering the continuation of those agreements, the Trustees reviewed and analyzed various factors that they determined were relevant, including the factors described below, none of which by itself was considered dispositive. However, the material factors and conclusions that formed the basis for the Trustees’ determination to approve the continuation of the agreements are discussed separately below. Also included is a summary of the independent fee consultant’s conclusions and opinions that arose during, and were included as part of, the Trustees’ consideration of the agreements. “Management fees,” as used herein, reflect actual annual advisory fees and any administration fees (excluding out of pocket costs), net of any waivers.
Nature, Extent and Quality of Services The Trustees reviewed the nature, extent and quality of the services provided by Janus Capital and the subadvisers to the Funds, taking into account the investment objective, strategies and policies of each Fund, and the knowledge the Trustees gained from their regular meetings with management on at least a quarterly basis and their ongoing review of information related to the Funds. In addition, the Trustees reviewed the resources and key personnel of Janus Capital and each subadviser, particularly noting those employees who provide investment and risk management services to the Funds. The Trustees also considered other services provided to the Funds by Janus Capital or the subadvisers, such as managing the execution of portfolio transactions and the selection of broker-dealers for those transactions. The Trustees considered Janus Capital’s role as administrator to the Funds, noting that Janus Capital does not receive a fee
Janus Aspen Global Research Portfolio Additional Information (unaudited)
Janus Aspen Series 29
for its services but is reimbursed for its out-of-pocket costs. The Trustees considered the role of Janus Capital in monitoring adherence to the Funds’ investment restrictions, providing support services for the Trustees and Trustee committees, and overseeing communications with shareholders and the activities of other service providers, including monitoring compliance with various policies and procedures of the Funds and with applicable securities laws and regulations.
In this regard, the independent fee consultant noted that Janus Capital provides a number of different services for the Funds and Fund shareholders, ranging from investment management services to various other servicing functions, and that, in its opinion, Janus Capital is a capable provider of those services. The independent fee consultant also provided its belief that Janus Capital has developed a number of institutional competitive advantages that should enable it to provide superior investment and service performance over the long term.
The Trustees concluded that the nature, extent and quality of the services provided by Janus Capital or the subadviser to each Fund were appropriate and consistent with the terms of the respective advisory and subadvisory agreements, and that, taking into account steps taken to address those Funds whose performance lagged that of their peers for certain periods, the Funds were likely to benefit from the continued provision of those services. They also concluded that Janus Capital and each subadviser had sufficient personnel, with the appropriate education and experience, to serve the Funds effectively and had demonstrated its ability to attract well-qualified personnel.
Performance of the Funds The Trustees considered the performance results of each Fund over various time periods. They noted that they considered Fund performance data throughout the year, including periodic meetings with each Fund’s portfolio manager(s), and also reviewed information comparing each Fund’s performance with the performance of comparable funds and peer groups identified by Broadridge Financial Solutions, Inc. (“Broadridge”), an independent data provider, and with the Fund’s benchmark index. In this regard, the independent fee consultant found that the overall Funds’ performance has been strong: for the 36 months ended September 30, 2015, approximately 70% of the Funds were in the top two Broadridge quartiles of performance, and for the 12 months ended September 30, 2015, approximately 61% of the Funds were in the top two Broadridge quartiles of performance.
The Trustees considered the performance of each Fund, noting that performance may vary by share class, and noted the following:
Fixed-Income Funds and Money Market Funds • For Janus Flexible Bond Fund, the Trustees noted that the Fund’s performance was in the third Broadridge
quartile for the 36 months ended May 31, 2015 and the third Broadridge quartile for the 12 months ended May 31, 2015. The Trustees noted the reasons for the Fund’s underperformance and the steps Janus Capital had taken or was taking to improve performance.
• For Janus Global Bond Fund, the Trustees noted that the Fund’s performance was in the second Broadridge quartile for the 36 months ended May 31, 2015 and the second Broadridge quartile for the 12 months ended May 31, 2015.
• For Janus Global Unconstrained Bond Fund, the Trustees noted that the Fund’s performance was in the bottom Broadridge quartile for the 12 months ended May 31, 2015. The Trustees noted the reasons for the Fund’s underperformance, the steps Janus Capital had taken or was taking to improve performance, and its limited performance history.
• For Janus High-Yield Fund, the Trustees noted that the Fund’s performance was in the third Broadridge quartile for the 36 months ended May 31, 2015 and the third Broadridge quartile for the 12 months ended May 31, 2015. The Trustees noted the reasons for the Fund’s underperformance and the steps Janus Capital had taken or was taking to improve performance.
• For Janus Multi-Sector Income Fund, the Trustees noted that the Fund’s performance was in the first Broadridge quartile for the 12 months ended May 31, 2015.
• For Janus Real Return Fund, the Trustees noted that the Fund’s performance was in the first Broadridge quartile for the 36 months ended May 31, 2015 and the first Broadridge quartile for the 12 months ended May 31, 2015.
Janus Aspen Global Research Portfolio Additional Information (unaudited)
30 JUNE 30, 2016
• For Janus Short-Term Bond Fund, the Trustees noted that the Fund’s performance was in the second Broadridge quartile for the 36 months ended May 31, 2015 and the third Broadridge quartile for the 12 months ended May 31, 2015.
• For Janus Government Money Market Fund, the Trustees noted that the Fund’s performance was in the third Broadridge quartile for the 36 months ended May 31, 2015 and the third Broadridge quartile for the 12 months ended May 31, 2015. The Trustees noted the reasons for the Fund’s underperformance.
• For Janus Money Market Fund, the Trustees noted that the Fund’s performance was in the third Broadridge quartile for the 36 months ended May 31, 2015 and the bottom Broadridge quartile for the 12 months ended May 31, 2015. The Trustees noted the reasons for the Fund’s underperformance.
Asset Allocation Funds • For Janus Global Allocation Fund – Conservative, the Trustees noted that the Fund’s performance was in the
first Broadridge quartile for the 36 months ended May 31, 2015 and the third Broadridge quartile for the 12 months ended May 31, 2015.
• For Janus Global Allocation Fund – Growth, the Trustees noted that the Fund’s performance was in the third Broadridge quartile for the 36 months ended May 31, 2015 and the bottom Broadridge quartile for the 12 months ended May 31, 2015. The Trustees noted the reasons for the Fund’s underperformance and the steps Janus Capital had taken or was taking to improve performance.
• For Janus Global Allocation Fund – Moderate, the Trustees noted that the Fund’s performance was in the second Broadridge quartile for the 36 months ended May 31, 2015 and the third Broadridge quartile for the 12 months ended May 31, 2015.
Alternative Fund • For Janus Diversified Alternatives Fund, the Trustees noted that the Fund’s performance was in the second
Broadridge quartile for the 12 months ended May 31, 2015.
Value Funds • For Perkins International Value Fund, the Trustees noted that the Fund’s performance was in the second
Broadridge quartile for the 12 months ended May 31, 2015.
• For Perkins Global Value Fund, the Trustees noted that the Fund’s performance was in the third Broadridge quartile for the 36 months ended May 31, 2015 and the third Broadridge quartile for the 12 months ended May 31, 2015. The Trustees noted the reasons for the Fund’s underperformance, noting that the Fund has a performance fee structure that results in lower management fees during periods of underperformance, and the steps Janus Capital and Perkins had taken or were taking to improve performance.
• For Perkins Large Cap Value Fund, the Trustees noted that the Fund’s performance was in the bottom Broadridge quartile for the 36 months ended May 31, 2015 and the bottom Broadridge quartile for the 12 months ended May 31, 2015. The Trustees noted the reasons for the Fund’s underperformance, noting that the Fund has a performance fee structure that results in lower management fees during periods of underperformance, and the steps Janus Capital and Perkins had taken or were taking to improve performance.
• For Perkins Mid Cap Value Fund, the Trustees noted that the Fund’s performance was in the bottom Broadridge quartile for the 36 months ended May 31, 2015 and the bottom Broadridge quartile for the 12 months ended May 31, 2015. The Trustees noted the reasons for the Fund’s underperformance, noting that the Fund has a performance fee structure that results in lower management fees during periods of underperformance, and the steps Janus Capital and Perkins had taken or were taking to improve performance.
• For Perkins Select Value Fund, the Trustees noted that the Fund’s performance was in the bottom Broadridge quartile for the 36 months ended May 31, 2015 and the second Broadridge quartile for the 12 months ended May 31, 2015. The Trustees noted the reasons for the Fund’s underperformance, noting that the Fund has a performance fee structure that results in lower management fees during periods of underperformance, the steps Janus Capital and Perkins had taken or were taking to improve performance, and that the performance trend was improving.
Janus Aspen Global Research Portfolio Additional Information (unaudited)
Janus Aspen Series 31
• For Perkins Small Cap Value Fund, the Trustees noted that the Fund’s performance was in the bottom Broadridge quartile for the 36 months ended May 31, 2015 and the second Broadridge quartile for the 12 months ended May 31, 2015. The Trustees noted the reasons for the Fund’s underperformance, noting that the Fund has a performance fee structure that results in lower management fees during periods of underperformance, the steps Janus Capital and Perkins had taken or were taking to improve performance, and that the performance trend was improving.
• For Perkins Value Plus Income Fund, the Trustees noted that the Fund’s performance was in the second Broadridge quartile for the 36 months ended May 31, 2015 and the second Broadridge quartile for the 12 months ended May 31, 2015.
Mathematical Funds • For INTECH Emerging Markets Managed Volatility Fund, the Trustees noted that, due to limited performance
for the Fund, performance history was not a material factor.
• For INTECH Global Income Managed Volatility Fund, the Trustees noted that the Fund’s performance was in the first Broadridge quartile for the 36 months ended May 31, 2015 and the third Broadridge quartile for the 12 months ended May 31, 2015.
• For INTECH International Managed Volatility Fund, the Trustees noted that the Fund’s performance was in the bottom Broadridge quartile for the 36 months ended May 31, 2015 and the bottom Broadridge quartile for the 12 months ended May 31, 2015. The Trustees noted the reasons for the Fund’s underperformance and the steps Janus Capital and INTECH had taken or were taking to improve performance.
• For INTECH U.S. Core Fund, the Trustees noted that the Fund’s performance was in the second Broadridge quartile for the 36 months ended May 31, 2015 and the second Broadridge quartile for the 12 months ended May 31, 2015.
• For INTECH U.S. Managed Volatility Fund, the Trustees noted that the Fund’s performance was in the second Broadridge quartile for the 36 months ended May 31, 2015 and the third Broadridge quartile for the 12 months ended May 31, 2015.
Growth and Core Funds • For Janus Balanced Fund, the Trustees noted that the Fund’s performance was in the first Broadridge quartile
for the 36 months ended May 31, 2015 and the first Broadridge quartile for the 12 months ended May 31, 2015.
• For Janus Contrarian Fund, the Trustees noted that the Fund’s performance was in the first Broadridge quartile for the 36 months ended May 31, 2015 and the bottom Broadridge quartile for the 12 months ended May 31, 2015.
• For Janus Enterprise Fund, the Trustees noted that the Fund’s performance was in the second Broadridge quartile for the 36 months ended May 31, 2015 and the first Broadridge quartile for the 12 months ended May 31, 2015.
• For Janus Forty Fund, the Trustees noted that the Fund’s performance was in the second Broadridge quartile for the 36 months ended May 31, 2015 and the first Broadridge quartile for the 12 months ended May 31, 2015.
• For Janus Fund, the Trustees noted that the Fund’s performance was in the second Broadridge quartile for the 36 months ended May 31, 2015 and the first Broadridge quartile for the 12 months ended May 31, 2015.
• For Janus Growth and Income Fund, the Trustees noted that the Fund’s performance was in the third Broadridge quartile for the 36 months ended May 31, 2015 and in the third Broadridge quartile for the 12 months ended May 31, 2015. The Trustees noted the reasons for the Fund’s underperformance and the steps Janus Capital had taken or was taking to improve performance.
• For Janus Research Fund, the Trustees noted that the Fund’s performance was in the first Broadridge quartile for the 36 months ended May 31, 2015 and the first Broadridge quartile for the 12 months ended May 31, 2015.
Janus Aspen Global Research Portfolio Additional Information (unaudited)
32 JUNE 30, 2016
• For Janus Triton Fund, the Trustees noted that the Fund’s performance was in the second Broadridge quartile for the 36 months ended May 31, 2015 and the first Broadridge quartile for the 12 months ended May 31, 2015.
• For Janus Twenty Fund, the Trustees noted that the Fund’s performance was in the third Broadridge quartile for the 36 months ended May 31, 2015 and the bottom Broadridge quartile for the 12 months ended May 31, 2015. The Trustees noted the reasons for the Fund’s underperformance, noting that the Fund has a performance fee structure that results in lower management fees during periods of underperformance, and the steps Janus Capital had taken or was taking to improve performance.
• For Janus Venture Fund, the Trustees noted that the Fund’s performance was in the first Broadridge quartile for the 36 months ended May 31, 2015 and the first Broadridge quartile for the 12 months ended May 31, 2015.
Global and International Funds • For Janus Asia Equity Fund, the Trustees noted that the Fund’s performance was in the third Broadridge
quartile for the 36 months ended May 31, 2015 and the first Broadridge quartile for the 12 months ended May 31, 2015. The Trustees noted the reasons for the Fund’s underperformance, noting that the Fund has a performance fee structure that results in lower management fees during periods of underperformance, the steps Janus Capital had taken or was taking to improve performance, and that the performance trend was improving.
• For Janus Emerging Markets Fund, the Trustees noted that the Fund’s performance was in the second Broadridge quartile for the 36 months ended May 31, 2015 and the first Broadridge quartile for the 12 months ended May 31, 2015.
• For Janus Global Life Sciences Fund, the Trustees noted that the Fund’s performance was in the first Broadridge quartile for the 36 months ended May 31, 2015 and the first Broadridge quartile for the 12 months ended May 31, 2015.
• For Janus Global Real Estate Fund, the Trustees noted that the Fund’s performance was in the first Broadridge quartile for the 36 months ended May 31, 2015 and the first Broadridge quartile for the 12 months ended May 31, 2015.
• For Janus Global Research Fund, the Trustees noted that the Fund’s performance was in the second Broadridge quartile for the 36 months ended May 31, 2015 and the first Broadridge quartile for the 12 months ended May 31, 2015.
• For Janus Global Select Fund, the Trustees noted that the Fund’s performance was in the second Broadridge quartile for the 36 months ended May 31, 2015 and the first Broadridge quartile for the 12 months ended May 31, 2015.
• For Janus Global Technology Fund, the Trustees noted that the Fund’s performance was in the third Broadridge quartile for the 36 months ended May 31, 2015 and the third Broadridge quartile for the 12 months ended May 31, 2015. The Trustees noted the reasons for the Fund’s underperformance and the steps Janus Capital had taken or was taking to improve performance.
• For Janus International Equity Fund, the Trustees noted that the Fund’s performance was in the second Broadridge quartile for the 36 months ended May 31, 2015 and the second Broadridge quartile for the 12 months ended May 31, 2015.
• For Janus Overseas Fund, the Trustees noted that the Fund’s performance was in the bottom Broadridge quartile for the 36 months ended May 31, 2015 and the bottom Broadridge quartile for the 12 months ended May 31, 2015. The Trustees noted the reasons for the Fund’s underperformance, noting that the Fund has a performance fee structure that results in lower management fees during periods of underperformance, and the steps Janus Capital had taken or was taking to improve performance.
Janus Aspen Global Research Portfolio Additional Information (unaudited)
Janus Aspen Series 33
Janus Aspen Series • For Janus Aspen Balanced Portfolio, the Trustees noted that the Fund’s performance was in the first
Broadridge quartile for the 36 months ended May 31, 2015 and the first Broadridge quartile for the 12 months ended May 31, 2015.
• For Janus Aspen Enterprise Portfolio, the Trustees noted that the Fund’s performance was in the second Broadridge quartile for the 36 months ended May 31, 2015 and the first Broadridge quartile for the 12 months ended May 31, 2015.
• For Janus Aspen Flexible Bond Portfolio, the Trustees noted that the Fund’s performance was in the second Broadridge quartile for the 36 months ended May 31, 2015 and the second Broadridge quartile for the 12 months ended May 31, 2015.
• For Janus Aspen Forty Portfolio, the Trustees noted that the Fund’s performance was in the second Broadridge quartile for the 36 months ended May 31, 2015 and the first Broadridge quartile for the 12 months ended May 31, 2015.
• For Janus Aspen Global Allocation Portfolio – Moderate, the Trustees noted that the Fund’s performance was in the first Broadridge quartile for the 36 months ended May 31, 2015 and the bottom Broadridge quartile for the 12 months ended May 31, 2015.
• For Janus Aspen Global Research Portfolio, the Trustees noted that the Fund’s performance was in the first Broadridge quartile for the 36 months ended May 31, 2015 and the second Broadridge quartile for the 12 months ended May 31, 2015.
• For Janus Aspen Global Technology Portfolio, the Trustees noted that the Fund’s performance was in the second Broadridge quartile for the 36 months ended May 31, 2015 and the third Broadridge quartile for the 12 months ended May 31, 2015.
• For Janus Aspen Global Unconstrained Bond Portfolio, the Trustees noted that, due to limited performance for the Fund, performance history was not a material factor.
• For Janus Aspen INTECH U.S. Low Volatility Portfolio, the Trustees noted that the Fund’s performance was in the first Broadridge quartile for the 12 months ended May 31, 2015.
• For Janus Aspen Janus Portfolio, the Trustees noted that the Fund’s performance was in the second Broadridge quartile for the 36 months ended May 31, 2015 and the first Broadridge quartile for the 12 months ended May 31, 2015.
• For Janus Aspen Overseas Portfolio, the Trustees noted that the Fund’s performance was in the bottom Broadridge quartile for the 36 months ended May 31, 2015 and the bottom Broadridge quartile for the 12 months ended May 31, 2015. The Trustees noted the reasons for the Fund’s underperformance, noting that the Fund has a performance fee structure that results in lower management fees during periods of underperformance, and the steps Janus Capital had taken or was taking to improve performance.
• For Janus Aspen Perkins Mid Cap Value Portfolio, the Trustees noted that the Fund’s performance was in the bottom Broadridge quartile for the 36 months ended May 31, 2015 and the bottom Broadridge quartile for the 12 months ended May 31, 2015. The Trustees noted the reasons for the Fund’s underperformance, noting that the Fund has a performance fee structure that results in lower management fees during periods of underperformance, and the steps Janus Capital and Perkins had taken or were taking to improve performance.
In consideration of each Fund’s performance, the Trustees concluded that, taking into account the factors relevant to performance, as well as other considerations, including steps taken to improve performance, the Fund’s performance warranted continuation of the Fund’s investment advisory and subadvisory agreement(s).
Costs of Services Provided The Trustees examined information regarding the fees and expenses of each Fund in comparison to similar information for other comparable funds as provided by Broadridge, an independent data provider. They also reviewed an analysis of that information provided by their independent fee consultant and noted that the rate of management (investment advisory and any administration, but excluding out-of-pocket costs) fees for many of the Funds, after applicable waivers,
Janus Aspen Global Research Portfolio Additional Information (unaudited)
34 JUNE 30, 2016
was below the mean management fee rate of the respective peer group of funds selected by an independent data provider. The Trustees also examined information regarding the subadvisory fees charged for subadvisory services, as applicable, noting that all such fees were paid by Janus Capital out of its management fees collected from such Fund.
The independent fee consultant provided its belief that the management fees charged by Janus Capital to each of the Funds under the current investment advisory and administration agreements are reasonable in relation to the services provided by Janus Capital. The independent fee consultant found: (1) the total expenses and management fees of the Funds to be reasonable relative to other mutual funds; (2) total expenses, on average, were 14% below the mean total expenses of their respective Broadridge Expense Group peers and 24% below the mean total expenses for their Broadridge Expense Universes; (3) management fees for the Funds, on average, were 15% below the mean management fees for their Expense Groups and 19% below the mean for their Expense Universes; and (4) Fund expenses at the functional level for each asset and share class category were reasonable. The Trustees also considered the total expenses for each share class of each Fund compared to the mean total expenses for its Broadridge Expense Group peers and to mean total expenses for its Broadridge Expense Universe.
The independent fee consultant concluded that, based on its strategic review of expenses at the complex, category and individual fund level, Fund expenses were found to be reasonable relative to both Expense Group and Expense Universe benchmarks. Further, for certain Funds, the independent fee consultant also performed a systematic “focus list” analysis of expenses in the context of the performance or service delivered to each set of investors in each share class in each selected Fund. Based on this analysis, the independent fee consultant found that the combination of service quality/performance and expenses on these individual Funds and share classes were reasonable in light of performance trends, performance histories, and existence of performance fees, breakpoints, and expense waivers on such Funds.
The Trustees considered the methodology used by Janus Capital and each subadviser in determining compensation payable to portfolio managers, the competitive environment for investment management talent, and the competitive market for mutual funds in different distribution channels.
The Trustees also reviewed management fees charged by Janus Capital and each subadviser to comparable separate account clients and to comparable non-affiliated funds subadvised by Janus Capital or by a subadviser (for which Janus Capital or the subadviser provides only or primarily portfolio management services). Although in most instances subadvisory and separate account fee rates for various investment strategies were lower than management fee rates for Funds having a similar strategy, the Trustees considered that Janus Capital noted that, under the terms of the management agreements with the Funds, Janus Capital performs significant additional services for the Funds that it does not provide to those other clients, including administration services, oversight of the Funds’ other service providers, trustee support, regulatory compliance and numerous other services, and that, in serving the Funds, Janus Capital assumes many legal risks and other costs that it does not assume in servicing its other clients. Moreover, they noted that the independent fee consultant found that: (1) the management fees Janus Capital charges to the Funds are reasonable in relation to the management fees Janus Capital charges to its institutional and subadvised accounts; (2) these institutional and subadvised accounts have different service and infrastructure needs; (3) the average spread between management fees charged to the Funds and those charged to Janus Capital’s institutional accounts is reasonable relative to the average spreads seen in the industry; and (4) by one estimation methodology, the fee margins implied by Janus Capital’s subadvised fees when compared to its mutual fund fees are reasonable relative to the estimated fee margins in the industry and relative to estimated fee margins of fund managers using Janus Capital as a subadviser.
The Trustees considered the fees for each Fund for its fiscal year ended in 2014, and noted the following with regard to each Fund’s total expenses, net of applicable fee waivers (the Fund’s “total expenses”):
Fixed-Income Funds and Money Market Funds • For Janus Flexible Bond Fund, the Trustees noted that, although the Fund’s total expenses exceeded the peer
group mean for certain share classes, overall the Fund’s total expenses were reasonable. The Trustees also noted that Janus Capital has contractually agreed to limit the Fund’s expenses, although this limit did not apply because the Fund’s total expenses were already below the applicable fee limit.

Janus Aspen Global Research Portfolio Additional Information (unaudited)
Janus Aspen Series 35
• For Janus Global Bond Fund, the Trustees noted that although the Fund’s total expenses exceeded the peer group mean for certain share classes, overall the Fund’s total expenses were reasonable. The Trustees also noted that Janus Capital has contractually agreed to limit the Fund’s expenses.
• For Janus Global Unconstrained Bond Fund, the Trustees noted that although the Fund’s total expenses exceeded the peer group mean for certain share classes, overall the Fund’s total expenses were reasonable. The Trustees also noted that Janus Capital has contractually agreed to limit the Fund’s expenses.
• For Janus High-Yield Fund, the Trustees noted that, although the Fund’s total expenses exceeded the peer group mean for certain share classes, overall the Fund’s total expenses were reasonable. The Trustees also noted that Janus Capital has contractually agreed to limit the Fund’s expenses, although this limit did not apply because the Fund’s total expenses were already below the applicable fee limit.
• For Janus Multi-Sector Income Fund, the Trustees noted that, although the Fund’s total expenses exceeded the peer group mean for certain share classes, overall the Fund’s total expenses were reasonable. The Trustees also noted that Janus has contractually agreed to limit the Fund’s expenses.
• For Janus Real Return Fund, the Trustees noted that, although the Fund’s total expenses exceeded the peer group mean for all share classes, overall the Fund’s total expenses were reasonable. The Trustees also noted that Janus Capital has contractually agreed to limit the Fund’s expenses.
• For Janus Short-Term Bond Fund, the Trustees noted that, although the Fund’s total expenses exceeded the peer group mean for all share classes, overall the Fund’s total expenses were reasonable. The Trustees also noted that Janus Capital has contractually agreed to limit the Fund’s expenses.
• For Janus Government Money Market Fund, the Trustees noted that the Fund’s total expenses exceeded the peer group mean for both share classes. The Trustees considered that management fees for this Fund are higher than the peer group mean due to the Fund’s management fee including other costs, such as custody and transfer agent services, while many funds in the peer group pay these expenses separately from their management fee. In addition, the Trustees considered that Janus Capital voluntarily waives one-half of its advisory fee and other expenses in order to maintain a positive yield.
• For Janus Money Market Fund, the Trustees noted that the Fund’s total expenses were below the peer group mean for both share classes. In addition, the Trustees considered that Janus Capital voluntarily waives one-half of its advisory fee and other expenses in order to maintain a positive yield.
Asset Allocation Funds • For Janus Global Allocation Fund – Conservative, the Trustees noted that the Fund’s total expenses were
below the peer group mean for all share classes.
• For Janus Global Allocation Fund – Growth, the Trustees noted that the Fund’s total expenses were below the peer group mean for all share classes.
• For Janus Global Allocation Fund – Moderate, the Trustees noted that, although the Fund’s total expenses exceeded the peer group mean for certain share classes, overall the Fund’s total expenses were reasonable. The Trustees also noted that Janus Capital has contractually agreed to limit the Fund’s expenses.
Alternative Fund • For Janus Diversified Alternatives Fund, the Trustees noted that, although the Fund’s total expenses exceeded
the peer group mean for one share class, overall the Fund’s total expenses were reasonable. The Trustees also noted that Janus Capital has contractually agreed to limit the Fund’s expenses.
Value Funds • For Perkins International Value Fund, the Trustees noted that, although the Fund’s total expenses exceeded
the peer group mean for certain share classes, overall the Fund’s total expenses were reasonable. The Trustees also noted that Janus Capital has contractually agreed to limit the Fund’s expenses.
• For Perkins Global Value Fund, the Trustees noted that, although the Fund’s total expenses exceeded the peer group mean for one share class, overall the Fund’s total expenses were reasonable.
Janus Aspen Global Research Portfolio Additional Information (unaudited)
36 JUNE 30, 2016
• For Perkins Large Cap Value Fund, the Trustees noted that, although the Fund’s total expenses exceeded the peer group mean for certain share classes, overall the Fund’s total expenses were reasonable. The Trustees also noted that Janus Capital has contractually agreed to limit the Fund’s expenses.
• For Perkins Mid Cap Value Fund, the Trustees noted that, although the Fund’s total expenses exceeded the peer group mean for one share class, overall the Fund’s total expenses were reasonable. The Trustees also noted that Janus Capital has contractually agreed to limit the Fund’s expenses, although this limit did not apply because the Fund’s total expenses were already below the applicable fee limit.
• For Perkins Select Value Fund, the Trustees noted that, although the Fund’s total expenses exceeded the peer group mean for one share class, overall the Fund’s total expenses were reasonable. The Trustees also noted that Janus Capital has contractually agreed to limit the Fund’s expenses.
• For Perkins Small Cap Value Fund, the Trustees noted that the Fund’s total expenses were below the peer group mean for all share classes.
• For Perkins Value Plus Income Fund, the Trustees noted that although the Fund’s total expenses exceeded the peer group mean for one share class, overall the Fund’s total expenses were reasonable. The Trustees also noted that Janus Capital had contractually agreed to limit the Fund’s expenses.
Mathematical Funds • For INTECH Emerging Markets Managed Volatility Fund, the Trustees noted that although the Fund’s total
expenses exceeded the peer group mean for certain share classes, overall the Fund’s total expenses were reasonable. The Trustees also noted that Janus Capital has contractually agreed to limit the Fund’s expenses.
• For INTECH Global Income Managed Volatility Fund, the Trustees noted that the Fund’s total expenses were below the peer group mean for all share classes.
• For INTECH International Managed Volatility Fund, the Trustees noted that although the Fund’s total expenses exceeded the peer group mean for one share class, overall the Fund’s total expenses were reasonable. The Trustees also noted that Janus Capital had contractually agreed to limit the Fund’s expenses, although this limit did not apply because the Fund’s total expenses were already below the applicable fee limit.
• For INTECH U.S. Core Fund, the Trustees noted that although the Fund’s total expenses exceeded the peer group mean for one share class, overall the Fund’s total expenses were reasonable. The Trustees also noted that Janus Capital has contractually agreed to limit the Fund’s expenses, although this limit did not apply because the Fund’s total expenses were already below the applicable fee limit.
• For INTECH U.S. Managed Volatility Fund, the Trustees noted that the Fund’s total expenses exceeded the peer group mean for one share class. The Trustees also noted that Janus Capital had contractually agreed to limit the Fund’s expenses.
Growth and Core Funds • For Janus Balanced Fund, the Trustees noted that, although the Fund’s total expenses exceeded the peer
group mean for one share class, overall the Fund’s total expenses were reasonable. The Trustees also noted that Janus Capital has contractually agreed to limit the Fund’s expenses, although this limit did not apply because the Fund’s total expenses were already below the applicable fee limit.
• For Janus Contrarian Fund, the Trustees noted that, although the Fund’s total expenses exceeded the peer group mean for certain share classes, overall the Fund’s total expenses were reasonable. The Trustees also noted that Janus Capital has contractually agreed to limit the Fund’s expenses, although this limit did not apply because the Fund’s total expenses were already below the applicable fee limit.
• For Janus Enterprise Fund, the Trustees noted that, although the Fund’s total expenses exceeded the peer group mean for certain share classes, overall the Fund’s total expenses were reasonable. The Trustees also noted that Janus Capital has contractually agreed to limit the Fund’s expenses, although this limit did not apply because the Fund’s total expenses were already below the applicable fee limit.
• For Janus Forty Fund, the Trustees noted that the Fund’s total expenses were below the peer group mean for all share classes.

Janus Aspen Global Research Portfolio Additional Information (unaudited)
Janus Aspen Series 37
• For Janus Fund, the Trustees noted that the Fund’s total expenses were below the peer group mean for all share classes.
• For Janus Growth and Income Fund, the Trustees noted that, although the Fund’s total expenses exceeded the peer group mean for certain share classes, overall the Fund’s total expenses were reasonable. The Trustees also noted that Janus Capital has contractually agreed to limit the Fund’s expenses, although this limit did not apply because the Fund’s total expenses were already below the applicable fee limit.
• For Janus Research Fund, the Trustees noted that the Fund’s total expenses were below the peer group mean for all share classes.
• For Janus Triton Fund, the Trustees noted that, although the Fund’s total expenses exceeded the peer group mean for one share class, overall the Fund’s total expenses were reasonable. The Trustees also noted that Janus Capital has contractually agreed to limit the Fund’s expenses, although this limit did not apply because the Fund’s total expenses were already below the applicable fee limit.
• For Janus Twenty Fund, the Trustees noted that the Fund’s total expenses were below the peer group mean for all share classes.
• For Janus Venture Fund, the Trustees noted that, although the Fund’s total expenses exceeded the peer group mean for one share class, overall the Fund’s total expenses were reasonable. The Trustees also noted that Janus Capital has contractually agreed to limit the Fund’s expenses, although this limit did not apply because the Fund’s total expenses were already below the applicable fee limit.
Global and International Funds • For Janus Asia Equity Fund, the Trustees noted that the Fund’s total expenses were below the peer group
mean for all share classes.
• For Janus Emerging Markets Fund, the Trustees noted that, although the Fund’s total expenses exceeded the peer group mean for certain share classes, overall the Fund’s total expenses were reasonable. The Trustees also noted that Janus Capital has contractually agreed to limit the Fund’s expenses.
• For Janus Global Life Sciences Fund, the Trustees noted that the Fund’s total expenses were below the peer group mean for all share classes.
• For Janus Global Real Estate Fund, the Trustees noted that, although the Fund’s total expenses exceeded the peer group mean for one share class, overall the Fund’s total expenses were reasonable. The Trustees also noted that Janus Capital has contractually agreed to limit the Fund’s expenses.
• For Janus Global Research Fund, the Trustees noted that the Fund’s total expenses were below the peer group mean for all share classes.
• For Janus Global Select Fund, the Trustees noted that the Fund’s total expenses were below the peer group mean for all share classes.
• For Janus Global Technology Fund, the Trustees noted that the Fund’s total expenses were below the peer group mean for all share classes.
• For Janus International Equity Fund, the Trustees noted that, although the Fund’s total expenses exceeded the peer group mean for one share class, overall the Fund’s total expenses were reasonable. The Trustees also noted that Janus Capital has contractually agreed to limit the Fund’s expenses, although this limit did not apply because the Fund’s total expenses were already below the applicable fee limit.
• For Janus Overseas Fund, the Trustees noted that the Fund’s total expenses were below the peer group mean for all share classes.
Janus Aspen Series • For Janus Aspen Balanced Portfolio, the Trustees noted that the Fund’s total expenses were below the peer
group mean for both share classes.
Janus Aspen Global Research Portfolio Additional Information (unaudited)
38 JUNE 30, 2016
• For Janus Aspen Enterprise Portfolio, the Trustees noted that the Fund’s total expenses were below the peer group mean for both share classes.
• For Janus Aspen Flexible Bond Portfolio, the Trustees noted that, although the Fund’s total expenses exceeded the peer group mean for one share class, overall the Fund’s total expenses were reasonable. The Trustees also noted that Janus Capital had contractually agreed to limit the Fund’s expenses.
• For Janus Aspen Forty Portfolio, the Trustees noted that the Fund’s total expenses were below the peer group mean for both share classes.
• For Janus Aspen Global Allocation Portfolio - Moderate, the Trustees noted that, although the Fund’s total expenses exceeded the peer group mean for both share classes, overall the Fund’s total expenses were reasonable. The Trustees also noted that Janus Capital has contractually agreed to limit the Fund’s expenses.
• For Janus Aspen Global Research Portfolio, the Trustees noted that the Fund’s total expenses were below the peer group mean for both share classes.
• For Janus Aspen Global Technology Portfolio, the Trustees noted that the Fund’s total expenses were below the peer group mean for both share classes.
• For Janus Aspen Global Unconstrained Bond Portfolio, the Trustees noted that, although the Fund’s total expenses exceeded the peer group mean for both share classes, overall the Fund’s total expenses were reasonable. The Trustees also noted that Janus Capital had contractually agreed to limit the Fund’s expenses.
• For Janus Aspen INTECH U.S. Low Volatility Portfolio, the Trustees noted that the Fund’s total expenses were below the peer group mean for its sole share class.
• For Janus Aspen Janus Portfolio, the Trustees noted that the Fund’s total expenses were below the peer group mean for both share classes.
• For Janus Aspen Overseas Portfolio, the Trustees noted that the Fund’s total expenses were below the peer group mean for both share classes.
• For Janus Aspen Perkins Mid Cap Value Portfolio, the Trustees noted that the Fund’s total expenses were below the peer group mean for both share classes.
The Trustees reviewed information on the profitability to Janus Capital and its affiliates of their relationships with each Fund, as well as an explanation of the methodology utilized by Janus Capital when allocating various expenses of Janus Capital and its affiliates with respect to contractual relationships with the Funds and other clients. The Trustees also reviewed the financial statements and corporate structure of Janus Capital’s parent company. In their review, the Trustees considered whether Janus Capital and each subadviser receive adequate incentives and resources to manage the Funds effectively. The Trustees recognized that profitability comparisons among fund managers are difficult because very little comparative information is publicly available, and the profitability of any fund manager is affected by numerous factors, including the organizational structure of the particular fund manager, the types of funds and other accounts it manages, possible other lines of business, the methodology for allocating expenses, and the fund manager’s capital structure and cost of capital. However, taking into account those factors and the analysis provided by the Trustees’ independent fee consultant, and based on the information available, the Trustees concluded that Janus Capital’s profitability with respect to each Fund in relation to the services rendered was reasonable.
The independent fee consultant found that, while assessing the reasonableness of expenses in light of Janus Capital’s profits is dependent on comparisons with other publicly-traded mutual fund advisers, and that these comparisons are limited in accuracy by differences in complex size, business mix, institutional account orientation, and other factors, after accepting these limitations, the level of profit earned by Janus Capital from managing the Funds is reasonable.
The Trustees concluded that the management fees payable by each Fund to Janus Capital and its affiliates, as well as the fees paid by Janus Capital to the subadvisers of subadvised Funds, were reasonable in relation to the nature, extent, and quality of the services provided, taking into account the fees charged by other advisers for managing comparable mutual funds with similar strategies, the fees Janus Capital and the subadvisers charge to other clients, and, as applicable, the impact of fund performance on management fees payable by the Funds. The Trustees also concluded that each Fund’s total expenses were reasonable, taking into account the size of the Fund, the quality of services
Janus Aspen Global Research Portfolio Additional Information (unaudited)
Janus Aspen Series 39
provided by Janus Capital and any subadviser, the investment performance of the Fund, and any expense limitations agreed to or provided by Janus Capital.
Economies of Scale The Trustees considered information about the potential for Janus Capital to realize economies of scale as the assets of the Funds increase. They noted that their independent fee consultant provided an analysis of economies of scale, which included discussion of analysis from prior years. They also noted that, although many Funds pay advisory fees at a base fixed rate as a percentage of net assets, without any breakpoints, their independent fee consultant concluded that 85% of these Funds have contractual management fees (gross of waivers) below their Broadridge expense group averages and, overall, 80% of the Funds are below their respective expense group averages for contractual management fees. They also noted that for those Funds whose expenses are being reduced by the contractual expense limitations of Janus Capital, Janus Capital is subsidizing the Funds because they have not reached adequate scale. Moreover, as the assets of some of the Funds have declined in the past few years, certain Funds have benefited from having advisory fee rates that have remained constant rather than increasing as assets declined. In addition, performance fee structures have been implemented for various Funds that have caused the effective rate of advisory fees payable by such a Fund to vary depending on the investment performance of the Fund relative to its benchmark index over the measurement period; and a few Funds have fee schedules with breakpoints and reduced fee rates above certain asset levels. The Trustees also noted that the Funds share directly in economies of scale through the lower charges of third-party service providers that are based in part on the combined scale of all of the Funds. Based on all of the information they reviewed, including research and analysis conducted by the Trustees’ independent fee consultant, the Trustees concluded that the current fee structure of each Fund was reasonable and that the current rates of fees do reflect a sharing between Janus Capital and the Fund of any economies of scale that may be present at the current asset level of the Fund.
The independent fee consultant concluded that, given the limitations of various analytical approaches to economies of scale considered in prior years, and their conflicting results, its analyses could not confirm or deny the existence of economies of scale in the Janus complex. Further, the independent fee consultant provided its belief that Fund investors are well-served by the fee levels and performance fee structures in place on the Funds in light of any economies of scale that may be present at Janus Capital.
Other Benefits to Janus Capital The Trustees also considered benefits that accrue to Janus Capital and its affiliates and subadvisers to the Funds from their relationships with the Funds. They recognized that two affiliates of Janus Capital separately serve the Funds as transfer agent and distributor, respectively, and the transfer agent receives compensation directly from the non-money market funds for services provided. The Trustees also considered Janus Capital’s past and proposed use of commissions paid by the Funds on portfolio brokerage transactions to obtain proprietary and third-party research products and services benefiting the Fund and/or other clients of Janus Capital and/or Janus Capital, and/or a subadviser to a Fund. The Trustees concluded that Janus Capital’s and the subadvisers’ use of these types of client commission arrangements to obtain proprietary and third-party research products and services was consistent with regulatory requirements and guidelines and was likely to benefit each Fund. The Trustees also concluded that, other than the services provided by Janus Capital and its affiliates and subadvisers pursuant to the agreements and the fees to be paid by each Fund therefor, the Funds and Janus Capital and the subadvisers may potentially benefit from their relationship with each other in other ways. They concluded that Janus Capital and/or the subadvisers benefits from the receipt of research products and services acquired through commissions paid on portfolio transactions of the Funds and that the Funds benefit from Janus Capital’s and/or the subadvisers’ receipt of those products and services as well as research products and services acquired through commissions paid by other clients of Janus Capital and/or other clients of the subadvisers. They further concluded that the success of any Fund could attract other business to Janus Capital, the subadvisers or other Janus funds, and that the success of Janus Capital and the subadvisers could enhance Janus Capital’s and the subadvisers’ ability to serve the Funds.
Janus Aspen Global Research Portfolio Useful Information About Your Portfolio Report (unaudited)
40 JUNE 30, 2016
Management Commentary The Management Commentary in this report includes valuable insight as well as statistical information to help you understand how your Portfolio’s performance and characteristics stack up against those of comparable indices.
If the Portfolio invests in foreign securities, this report may include information about country exposure. Country exposure is based primarily on the country of risk. A company may be allocated to a country based on other factors such as location of the company’s principal office, the location of the principal trading market for the company’s securities, or the country where a majority of the company’s revenues are derived.
Please keep in mind that the opinions expressed in the Management Commentary are just that: opinions. They are a reflection based on best judgment at the time this report was compiled, which was June 30, 2016. As the investing environment changes, so could opinions. These views are unique and are not necessarily shared by fellow employees or by Janus in general.
Performance Overviews Performance overview graphs compare the performance of a hypothetical $10,000 investment in the Portfolio with one or more widely used market indices. When comparing the performance of the Portfolio with an index, keep in mind that market indices are not available for investment and do not reflect deduction of expenses.
Average annual total returns are quoted for a Portfolio with more than one year of performance history. Average annual total return is calculated by taking the growth or decline in value of an investment over a period of time, including reinvestment of dividends and distributions, then calculating the annual compounded percentage rate that would have produced the same result had the rate of growth been constant throughout the period. Average annual total return does not reflect the deduction of taxes that a shareholder would pay on Portfolio distributions or redemptions of Portfolio shares.
Cumulative total returns are quoted for a Portfolio with less than one year of performance history. Cumulative total return is the growth or decline in value of an investment over time, independent of the period of time involved. Cumulative total return does not reflect the deduction of taxes that a shareholder would pay on Portfolio distributions or redemptions of Portfolio shares.
Pursuant to federal securities rules, expense ratios shown in the performance chart reflect subsidized (if applicable) and unsubsidized ratios. The total annual fund operating expenses ratio is gross of any fee waivers, reflecting the Portfolio’s unsubsidized expense ratio. The net annual fund operating expenses ratio (if applicable) includes contractual waivers of Janus Capital and reflects the Portfolio’s subsidized expense ratio. Ratios may be higher or lower than those shown in the “Financial Highlights” in this report.
Schedule of Investments Following the performance overview section is the Portfolio’s Schedule of Investments. This schedule reports the types of securities held in the Portfolio on the last day of the reporting period. Securities are usually listed by type (common stock, corporate bonds, U.S. Government obligations, etc.) and by industry classification (banking, communications, insurance, etc.). Holdings are subject to change without notice.
The value of each security is quoted as of the last day of the reporting period. The value of securities denominated in foreign currencies is converted into U.S. dollars.
If the Portfolio invests in foreign securities, it will also provide a summary of investments by country. This summary reports the Portfolio exposure to different countries by providing the percentage of securities invested in each country. The country of each security represents the country of risk. The Portfolio’s Schedule of Investments relies upon the industry group and country classifications published by Barclays and/or MSCI Inc.
Tables listing details of individual forward currency contracts, futures, written options, swaptions, and swaps follow the Portfolio’s Schedule of Investments (if applicable).
Statement of Assets and Liabilities This statement is often referred to as the “balance sheet.” It lists the assets and liabilities of the Portfolio on the last day of the reporting period.
Janus Aspen Global Research Portfolio Useful Information About Your Portfolio Report (unaudited)
Janus Aspen Series 41
The Portfolio’s assets are calculated by adding the value of the securities owned, the receivable for securities sold but not yet settled, the receivable for dividends declared but not yet received on securities owned, and the receivable for Portfolio shares sold to investors but not yet settled. The Portfolio’s liabilities include payables for securities purchased but not yet settled, Portfolio shares redeemed but not yet paid, and expenses owed but not yet paid. Additionally, there may be other assets and liabilities such as unrealized gain or loss on forward currency contracts.
The section entitled “Net Assets Consist of” breaks down the components of the Portfolio’s net assets. Because the Portfolio must distribute substantially all earnings, you will notice that a significant portion of net assets is shareholder capital.
The last section of this statement reports the net asset value (“NAV”) per share on the last day of the reporting period. The NAV is calculated by dividing the Portfolio’s net assets for each share class (assets minus liabilities) by the number of shares outstanding.
Statement of Operations This statement details the Portfolio’s income, expenses, realized gains and losses on securities and currency transactions, and changes in unrealized appreciation or depreciation of Portfolio holdings.
The first section in this statement, entitled “Investment Income,” reports the dividends earned from securities and interest earned from interest-bearing securities in the Portfolio.
The next section reports the expenses incurred by the Portfolio, including the advisory fee paid to the investment adviser, transfer agent fees and expenses, and printing and postage for mailing statements, financial reports and prospectuses. Expense offsets and expense reimbursements, if any, are also shown.
The last section lists the amounts of realized gains or losses from investment and foreign currency transactions, and changes in unrealized appreciation or depreciation of investments and foreign currency-denominated assets and liabilities. The Portfolio will realize a gain (or loss) when it sells its position in a particular security. A change in unrealized gain (or loss) refers to the change in net appreciation or depreciation of the Portfolio during the reporting period. “Net Realized and Unrealized Gain/(Loss) on Investments” is affected both by changes in the market value of Portfolio holdings and by gains (or losses) realized during the reporting period.
Statements of Changes in Net Assets These statements report the increase or decrease in the Portfolio’s net assets during the reporting period. Changes in the Portfolio’s net assets are attributable to investment operations, dividends and distributions to investors, and capital share transactions. This is important to investors because it shows exactly what caused the Portfolio’s net asset size to change during the period.
The first section summarizes the information from the Statement of Operations regarding changes in net assets due to the Portfolio’s investment operations. The Portfolio’s net assets may also change as a result of dividend and capital gains distributions to investors. If investors receive their dividends and/or distributions in cash, money is taken out of the Portfolio to pay the dividend and/or distribution. If investors reinvest their dividends and/or distributions, the Portfolio’s net assets will not be affected. If you compare the Portfolio’s “Net Decrease from Dividends and Distributions” to “Reinvested Dividends and Distributions,” you will notice that dividends and distributions have little effect on the Portfolio’s net assets. This is because the majority of the Portfolio’s investors reinvest their dividends and/or distributions.
The reinvestment of dividends and distributions is included under “Capital Share Transactions.” “Capital Shares” refers to the money investors contribute to the Portfolio through purchases or withdrawals via redemptions. The Portfolio’s net assets will increase and decrease in value as investors purchase and redeem shares from the Portfolio.
Financial Highlights This schedule provides a per-share breakdown of the components that affect the Portfolio’s NAV for current and past reporting periods as well as total return, asset size, ratios, and portfolio turnover rate.
The first line in the table reflects the NAV per share at the beginning of the reporting period. The next line reports the net investment income/(loss) per share. Following is the per share total of net gains/(losses), realized and unrealized. Per share dividends and distributions to investors are then subtracted to arrive at the NAV per share at the end of the

Janus Aspen Global Research Portfolio Useful Information About Your Portfolio Report (unaudited)
42 JUNE 30, 2016
period. The next line reflects the total return for the period. Also included are ratios of expenses and net investment income to average net assets.
The Portfolio’s expenses may be reduced through expense offsets and expense reimbursements. The ratios shown reflect expenses before and after any such offsets and reimbursements.
The ratio of net investment income/(loss) summarizes the income earned less expenses, divided by the average net assets of the Portfolio during the reporting period. Do not confuse this ratio with the Portfolio’s yield. The net investment income ratio is not a true measure of the Portfolio’s yield because it does not take into account the dividends distributed to the Portfolio’s investors.
The next figure is the portfolio turnover rate, which measures the buying and selling activity in the Portfolio. Portfolio turnover is affected by market conditions, changes in the asset size of the Portfolio, fluctuating volume of shareholder purchase and redemption orders, the nature of the Portfolio’s investments, and the investment style and/or outlook of the portfolio manager(s) and/or investment personnel. A 100% rate implies that an amount equal to the value of the entire portfolio was replaced once during the fiscal year; a 50% rate means that an amount equal to the value of half the portfolio is traded in a year; and a 200% rate means that an amount equal to the value of the entire portfolio is traded every six months.
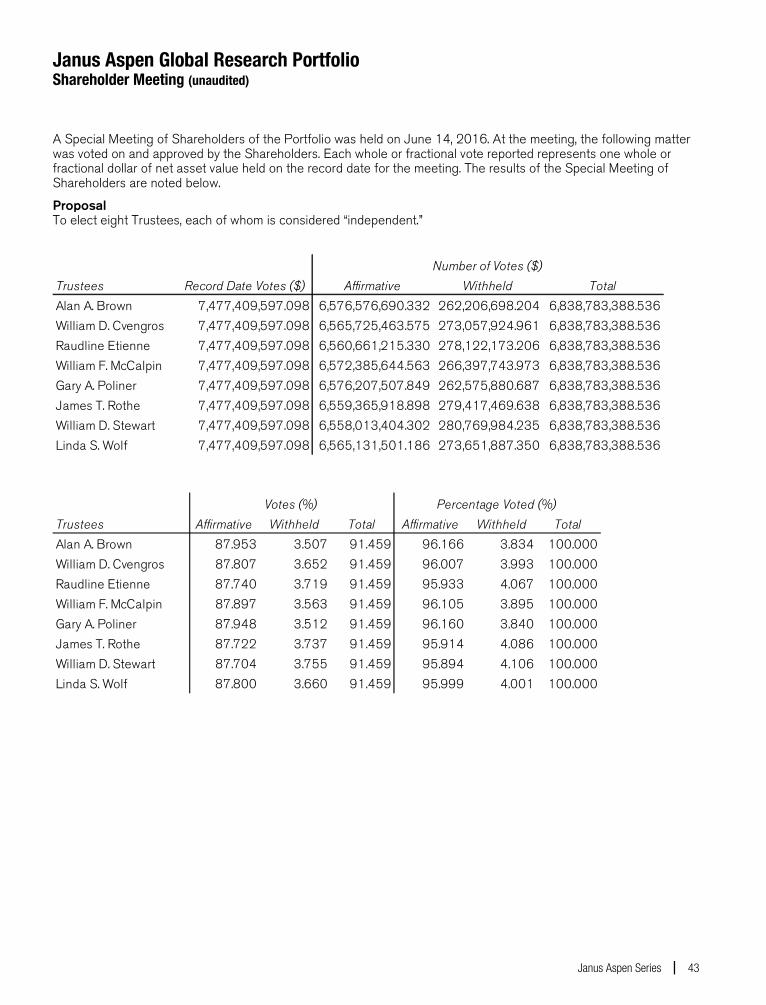
Janus Aspen Global Research Portfolio Shareholder Meeting (unaudited)
Janus Aspen Series 43
A Special Meeting of Shareholders of the Portfolio was held on June 14, 2016. At the meeting, the following matter was voted on and approved by the Shareholders. Each whole or fractional vote reported represents one whole or fractional dollar of net asset value held on the record date for the meeting. The results of the Special Meeting of Shareholders are noted below.
Proposal To elect eight Trustees, each of whom is considered “independent.”
Trustees Record Date Votes ($) Affirmative Withheld TotalAlan A. Brown 7,477,409,597.098 6,576,576,690.332 262,206,698.204 6,838,783,388.536William D. Cvengros 7,477,409,597.098 6,565,725,463.575 273,057,924.961 6,838,783,388.536Raudline Etienne 7,477,409,597.098 6,560,661,215.330 278,122,173.206 6,838,783,388.536William F. McCalpin 7,477,409,597.098 6,572,385,644.563 266,397,743.973 6,838,783,388.536Gary A. Poliner 7,477,409,597.098 6,576,207,507.849 262,575,880.687 6,838,783,388.536James T. Rothe 7,477,409,597.098 6,559,365,918.898 279,417,469.638 6,838,783,388.536William D. Stewart 7,477,409,597.098 6,558,013,404.302 280,769,984.235 6,838,783,388.536Linda S. Wolf 7,477,409,597.098 6,565,131,501.186 273,651,887.350 6,838,783,388.536
Number of Votes ($)
Trustees Affirmative Withheld Total Affirmative Withheld TotalAlan A. Brown 87.953 3.507 91.459 96.166 3.834 100.000William D. Cvengros 87.807 3.652 91.459 96.007 3.993 100.000Raudline Etienne 87.740 3.719 91.459 95.933 4.067 100.000William F. McCalpin 87.897 3.563 91.459 96.105 3.895 100.000Gary A. Poliner 87.948 3.512 91.459 96.160 3.840 100.000James T. Rothe 87.722 3.737 91.459 95.914 4.086 100.000William D. Stewart 87.704 3.755 91.459 95.894 4.106 100.000Linda S. Wolf 87.800 3.660 91.459 95.999 4.001 100.000
Votes (%) Percentage Voted (%)

Janus Aspen Global Research Portfolio Notes
44 JUNE 30, 2016
NotesPage1

Janus Aspen Global Research Portfolio Notes
Janus Aspen Series 45
NotesPage2

Janus provides access to a wide range of investment disciplines. Alternative Janus alternative funds seek to deliver strong risk-adjusted returns over a full market cycle with lower correlation to equity markets than traditional investments.
Asset Allocation Janus’ asset allocation funds utilize our fundamental, bottom-up research to balance risk over the long term. From fund options that meet investors’ risk tolerance and objectives to a method that incorporates non-traditional investment choices to seek non-correlated sources of risk and return, Janus’ asset allocation funds aim to allocate risk more effectively.
Fixed Income Janus fixed income funds attempt to provide less risk relative to equities while seeking to deliver a competitive total return through high current income and appreciation. Janus money market funds seek capital preservation and liquidity with current income as a secondary objective.
Global & International Janus global and international funds seek to leverage Janus’ research capabilities by taking advantage of inefficiencies in foreign markets, where accurate information and analytical insight are often at a premium.
Growth & Core Janus growth funds focus on companies believed to be the leaders in their respective industries, with solid management teams, expanding market share, margins and efficiencies. Janus core funds seek investments in more stable and predictable companies. Our core funds look for a strategic combination of steady growth and, for certain funds, some degree of income.
Mathematical Our mathematical funds seek to outperform their respective indices while maintaining a risk profile equal to or lower than the index itself. Managed by INTECH® (a Janus subsidiary), these funds use a mathematical process in an attempt to build a more “efficient” portfolio than the index.
Value Our value funds, managed by Perkins® (a Janus subsidiary), seek to identify companies with favorable reward to risk characteristics by conducting rigorous downside analysis before determining upside potential.
For more information about our funds, contact your investment professional or go to janus.com/variable-insurance.
Please consider the charges, risks, expenses and investment objectives carefully before investing. For a prospectus or, if available, a summary prospectus containing this and other information, please call Janus at 877.33JANUS (52687) or download the file from janus.com/variable-insurance. Read it carefully before you invest or send money. Janus, INTECH and Perkins are registered trademarks of Janus International Holding LLC. © Janus International Holding LLC.
Funds distributed by Janus Distributors LLC
Investment products offered are: NOT FDIC-INSURED MAY LOSE VALUE NO BANK GUARANTEE
C-0816-3727 109-24-81112 08-16
Proof #6
Government Money Portfolio(Formerly Prime Reserve Portfolio)
June 30, 2016
Semiannual Report
This report is authorized for distribution only to those who have received a copy of the portfolio’s prospectus.
T. Rowe Price Investment Services, Inc., Distributor.

Proof #6
T. Rowe Price Government Money Portfolio
Highlights
•Moneymarketyieldsremainedlowinthefirsthalfof2016.TheFederalReserveraisedshort-terminterestratesinDecember2015buthasdelayedsubsequentrateincreases.
•TheGovernmentMoneyPortfolioreturned0.00%inthefirsthalfof2016,whereastheportfolio’sLipperbenchmarkhada slight positive return.
•Asdebtpositionsmatured,wemovedtheportfoliofromits“prime”mandatetowarditsgovernmentmandate,whichbecameeffectiveMay1,2016.
•WhilethetimingoftheFed’snextmoveisstillunclear,wecontinuetobelievethatFedratehikeswillbegradual.
The views and opinions in this report were current as of June 30, 2016. They are not guarantees of performance or investment results and should not be taken as investment advice. Investment decisions reflect a variety of factors, and the managers reserve the right to change their views about individual stocks, sectors, and the markets at any time. As a result, the views expressed should not be relied upon as a forecast of the fund’s future investment intent. The report is certified under the Sarbanes-Oxley Act, which requires mutual funds and other public companies to affirm that, to the best of their knowledge, the information in their financial reports is fairly and accurately stated in all material respects.
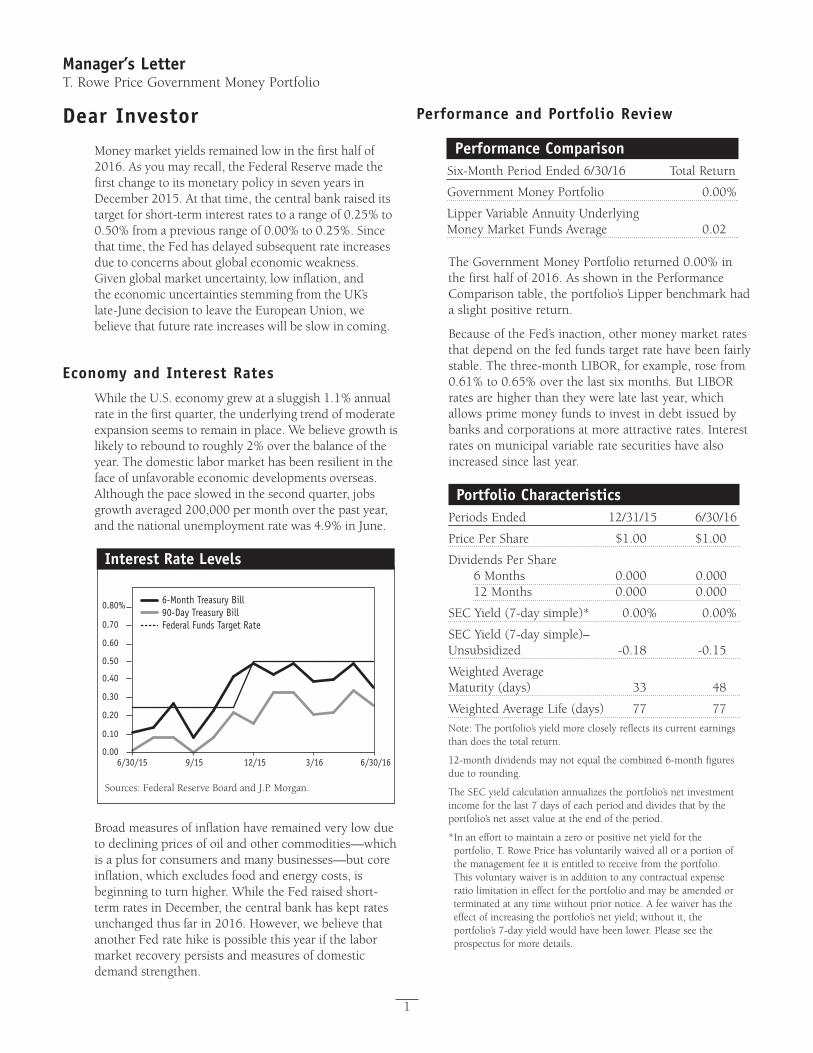
Proof #6
1
Manager’s LetterT. Rowe Price Government Money Portfolio
Dear InvestorMoneymarketyieldsremainedlowinthefirsthalfof2016.Asyoumayrecall,theFederalReservemadethefirst change to its monetary policy in seven years in December2015.Atthattime,thecentralbankraiseditstargetforshort-terminterestratestoarangeof0.25%to0.50%fromapreviousrangeof0.00%to0.25%.Sincethattime,theFedhasdelayedsubsequentrateincreasesduetoconcernsaboutglobaleconomicweakness.Givenglobalmarketuncertainty,lowinflation,andthe economic uncertainties stemming from the UK’s late-JunedecisiontoleavetheEuropeanUnion,webelieve that future rate increases will be slow in coming.
Economy and Interest RatesWhiletheU.S.economygrewatasluggish1.1%annualrateinthefirstquarter,theunderlyingtrendofmoderateexpansionseemstoremaininplace.Webelievegrowthislikelytoreboundtoroughly2%overthebalanceoftheyear.Thedomesticlabormarkethasbeenresilientintheface of unfavorable economic developments overseas. Althoughthepaceslowedinthesecondquarter,jobsgrowthaveraged200,000permonthoverthepastyear,andthenationalunemploymentratewas4.9%inJune.
Interest Rate Levels
Sources: Federal Reserve Board and J.P. Morgan.
6-Month Treasury Bill90-Day Treasury BillFederal Funds Target Rate
0.80%
0.70
0.60
0.50
0.40
0.30
0.20
0.10
0.006/30/15 9/15 12/15 3/16 6/30/16
Broad measures of inflation have remained very low due to declining prices of oil and other commodities—which is a plus for consumers and many businesses—but core inflation,whichexcludesfoodandenergycosts,isbeginningtoturnhigher.WhiletheFedraisedshort-termratesinDecember,thecentralbankhaskeptratesunchangedthusfarin2016.However,webelievethatanotherFedratehikeispossiblethisyearifthelabormarketrecoverypersistsandmeasuresofdomesticdemand strengthen.
Performance and Portfolio Review
Performance ComparisonSix-MonthPeriodEnded6/30/16 TotalReturn
GovernmentMoneyPortfolio 0.00%
LipperVariableAnnuityUnderlying MoneyMarketFundsAverage 0.02
TheGovernmentMoneyPortfolioreturned0.00%inthefirsthalfof2016.AsshowninthePerformanceComparisontable,theportfolio’sLipperbenchmarkhada slight positive return.
BecauseoftheFed’sinaction,othermoneymarketratesthat depend on the fed funds target rate have been fairly stable.Thethree-monthLIBOR,forexample,rosefrom0.61%to0.65%overthelastsixmonths.ButLIBORrates are higher than they were late last year, which allows prime money funds to invest in debt issued by banksandcorporationsatmoreattractiverates.Interestrates on municipal variable rate securities have also increased since last year.
Portfolio CharacteristicsPeriodsEnded 12/31/15 6/30/16
PricePerShare $1.00 $1.00
Dividends Per Share6Months 0.000 0.00012Months 0.000 0.000
SECYield(7-daysimple)* 0.00% 0.00%
SECYield(7-daysimple)– Unsubsidized -0.18 -0.15
WeightedAverage Maturity(days) 33 48
WeightedAverageLife(days) 77 77
Note: The portfolio’s yield more closely reflects its current earnings than does the total return.
12-monthdividendsmaynotequalthecombined6-monthfiguresdue to rounding.
TheSECyieldcalculationannualizestheportfolio’snetinvestmentincomeforthelast7daysofeachperiodanddividesthatbytheportfolio’s net asset value at the end of the period.
*Inanefforttomaintainazeroorpositivenetyieldfortheportfolio, T. Rowe Price has voluntarily waived all or a portion of the management fee it is entitled to receive from the portfolio. Thisvoluntarywaiverisinadditiontoanycontractualexpenseratio limitation in effect for the portfolio and may be amended or terminatedatanytimewithoutpriornotice.Afeewaiverhastheeffect of increasing the portfolio’s net yield; without it, the portfolio’s7-dayyieldwouldhavebeenlower.Pleaseseetheprospectus for more details.
Proof #6
2
Three-monthTreasurybillyieldsrosefrom0.16%to0.26%overthelastsixmonths,evenwiththepersistentdemandforshort-term,high-qualityassetsspurredbynewmoneyfundregulations.One-yearTreasurybillyieldsbegantheperiodat0.64%andoscillatedinthe0.40%to0.70%rangebeforeendingtheperiodat0.46%.Theoverwhelmingdemandfor,andsmallersupplyof,thesehigh-qualityinvestmentshaskepttheTreasury yield curve very flat.
Security DiversificationOtherU.S.Government&Agencies 73%
U.S.TreasuryBills 18
U.S.TreasuryNotes 12
OtherAssetsLessLiabilities -3
Total 100%
Basedonnetassetsasof6/30/16.
Asyouknow,thePrimeReservePortfoliohaschangedits investment mandate to that of a government money marketfund,withanewname—GovernmentMoneyPortfolio—toreflectthis.Effectively,thislimitsthefund’s investments to U.S. Treasuries and other U.S. government debt, as well as repurchase agreements backedbysimilarcollateral.Asdebtpositionsmatured,we moved the portfolio toward its new government mandate,whichbecameeffectiveMay1,2016.Thismandatechange,madeinresponsetoSECrulechanges,allows the portfolio to retain the attractive features our investorshaveenjoyed,suchasafocusonliquidityandstabilityofprincipal.Ourhopeisthatthismandatechangewillnotdisruptexistingshareholders.
Short-Term Quality Diversification PercentofNetAssets 12/31/15 6/30/16
FirstTier 100.0% 100.0%
Total 100.0% 100.0%
Sources:Moody’sInvestorsService,Standard&Poor’s,andFitch.Tier1securitieseitherreceivethehighestshort-termcreditratings(withinwhichtheremaybesubcategoriesorgradations)byatleast2qualifiedratingagencies(unlessonlyratedby1ratingagency)oraredeemedbyT.RowePricetobetheequivalentofTier1.ATier2securityisanyothereligiblemoneymarketfundinvestmentthatdoesnotmeettheTier1criteria.T.RowePricedoesnotevaluatethese ratings but simply assigns them to the appropriate credit qualitycategoryasdeterminedbytheratingagency.Unratedsecurities, if any, have been determined by T. Rowe Price to be the equivalentofaneligiblemoneymarketinvestment.Securitiesthathavenotreceivedanyratingfromaratingagencytotaled0.00%ofthe portfolio at the end of the reporting period.
OutlookWhilethetimingoftheFed’snextmoveisstillunclear,wecontinuetobelievethatFedratehikeswillbegradual.TheFed,byitsownadmission,iscognizantoftheglobalmarkets’abilitytoimpacttheU.S.economy,soFedofficialsarekeepingawatchfuleyeonglobalforcesastheymaketheirdecisions.Therefore,wearemaintaining a weighted average maturity that is near thatofouraveragecompetitortotakeadvantageofhigher rates when they come.
Asalways,wethankyouforinvestingwithT. Rowe Price.
Respectfully submitted,
JosephK.LynaghChairman of the portfolio’s Investment Advisory Committee
July14,2016
The committee chairman has day-to-day responsibility for managing the portfolio and works with committee members in developing and executing the portfolio’s investment program.
Proof #6
3
T. Rowe Price Government Money Portfolio
Risks of Investing in Government Money Market FundsYou could lose money by investing in the Fund. Although the Fund seeks to preserve the value of your investment at $1.00 per share, it cannot guarantee it will do so. An investment in the Fund is not insured or guaranteed by the Federal Deposit Insurance Corporation or any other government agency. The Fund’s sponsor has no legal obligation to provide financial support to the Fund, and you should not expect that the sponsor will provide financial support to the Fund at any time.
GlossaryFed funds target rate: The interest rate charged on overnight loans of reserves by one financial institution to anotherintheUnitedStates.TheFederalReservesetsatarget federal funds rate to affect the direction of interest rates.
LIBOR: TheLondonInterbankOfferedRate,whichisabenchmarkforshort-termtaxablerates.
Lipper averages: The averages of available mutual fund performance returns for specified time periods in categoriesdefinedbyLipperInc.
Repurchase agreement (repo): Aformofshort-termborrowingusingcollateralinwhichabankorbroker-dealersellsgovernmentsecuritiestoanotherparty,suchastheFederalReserve,andcommitstobuythembackatafixedpriceonafuturedate,usuallywithinaweek.
Glossary (continued)SEC yield (7-day simple): Amethodofcalculatingamoney fund’s yield by annualizing the fund’s net investment income for the last seven days of each period divided by the fund’s net asset value at the end of the period.Yieldwillvaryandisnotguaranteed.
Weighted average life: Ameasureofafund’screditqualityrisk.Ingeneral,thelongertheaveragelife,thegreaterthefund’screditqualityrisk.Theaveragelifeisthedollar-weightedaveragematurityofaportfolio’sindividualsecuritieswithouttakingintoaccountinterestratereadjustmentdates.Moneyfundsmustmaintainaweightedaveragelifeoflessthan120days.
Weighted average maturity: Ameasureofafund’sinterest rate sensitivity. In general, the longer the average maturity, the greater the fund’s sensitivity to interest rate changes.Theweightedaveragematuritymaytakeintoaccounttheinterestratereadjustmentdatesforcertainsecurities.Moneyfundsmustmaintainaweightedaveragematurityoflessthan60days.
Yield curve:Agraphicdepictionoftherelationshipbetween yields and maturity dates for a set of similar securities.Asecuritywithalongermaturityusuallyhasahigheryield.Ifashort-termsecurityoffersahigheryield,thenthecurveissaidtobe“inverted.”Ifshort-andlong-termbondsareofferingequivalentyields,thenthecurveissaidtobe“flat.”

Proof #6
Performance and ExpensesT. Rowe Price Government Money Portfolio
4
Growth of $10,000Thischartshowsthevalueofahypothetical$10,000investmentintheportfoliooverthepast10fiscalyearperiodsorsinceinception(forportfolioslacking10-yearrecords).Theresultiscomparedwithbenchmarks,whichmayincludeabroad-basedmarketindexandapeergroupaverageorindex.Marketindexesdonotincludeexpenses,which are deducted from portfolio returns as well as mutualfundaveragesandindexes.
Government Money Portfolio
Government Money PortfolioLipper Variable AnnuityUnderlying Money MarketFunds Average
As of6/30/16________$11,092$11,014
10,000
10,400
10,800
11,200
11,600
$12,000
6/166/156/146/136/126/116/106/096/086/076/06
Average Annual Compound Total Return
Periods Ended 6/30/16 1 Year 5 Years 10 Years
Government Money Portfolio 0.01% 0.00% 1.04%
Current performance may be higher or lower than the quoted past per-formance, which cannot guarantee future results. Investment return will vary. For the most recent month-end performance, please contact a T. Rowe Price representative at 1-800-469-6587 (financial advisors, or customers who have an advisor, should call 1-800-638-8790). Total returns do not include charges imposed by your insurance company’s separate account. If these had been included, performance would have been lower.
This table shows how the portfolio would have performed each year if its actual (or cumulative) returns for the periods shown had been earned at a constant rate. Average annual total return figures include reinvested dividends. When assessing performance, investors should consider both short- and long-term returns.
Fund Expense ExampleAs a mutual fund shareholder, you may incur two types of costs: (1) transaction costs, such as redemption fees or sales loads, and (2) ongoing costs, including management fees, distribution and service (12b-1) fees, and other fund expenses. The following example is intended to help you understand your ongoing costs (in dollars) of investing in the fund and to compare these costs with the ongoing costs of investing in other mutual funds. The example is based on an investment of $1,000 invested at the beginning of the most recent six-month period and held for the entire period.
Actual ExpensesThe first line of the following table (Actual) provides information about actual account values and actual expenses. You may use the information on this line, together with your account balance, to estimate the expenses that you paid over the period. Simply divide your account value by $1,000 (for example, an $8,600 account value divided by $1,000 = 8.6), then multiply the result by the number on the first line under the heading “Expenses Paid During Period” to estimate the expenses you paid on your account during this period.
Hypothetical Example for Comparison PurposesThe information on the second line of the table (Hypothetical) is based on hypothetical account values and expenses derived from the fund’s actual expense ratio and an assumed 5% per year rate of return before expenses (not the fund’s actual return). You may compare the ongoing costs of investing in the fund with other funds by contrasting this 5% hypothetical example and the 5% hypothetical examples that appear in the shareholder reports of the other funds. The hypothetical account values and expenses may not be used to estimate the actual ending account balance or expenses you paid for the period.
You should also be aware that the expenses shown in the table highlight only your ongoing costs and do not reflect any transaction costs, such as redemption fees or sales loads. Therefore, the second line of the table is useful in comparing ongoing costs only and will not help you determine the relative total costs of owning different funds. To the extent a fund charges transaction costs, however, the total cost of owning that fund is higher.
Government Money Portfolio Expenses Beginning Ending Paid During Account Account Period* Value Value 1/1/16 to 1/1/16 6/30/16 6/30/16
Actual $1,000.00 $1,000.00 $1.89
Hypothetical (assumes 5% return before expenses) 1,000.00 1,022.97 1.91
* Expenses are equal to the portfolio’s annualized expense ratio for the 6-month period (0.38%), multiplied by the average account value over the period, multiplied by the number of days in the most recent fiscal half year (182), and divided by the days in the year (366) to reflect the half-year period.
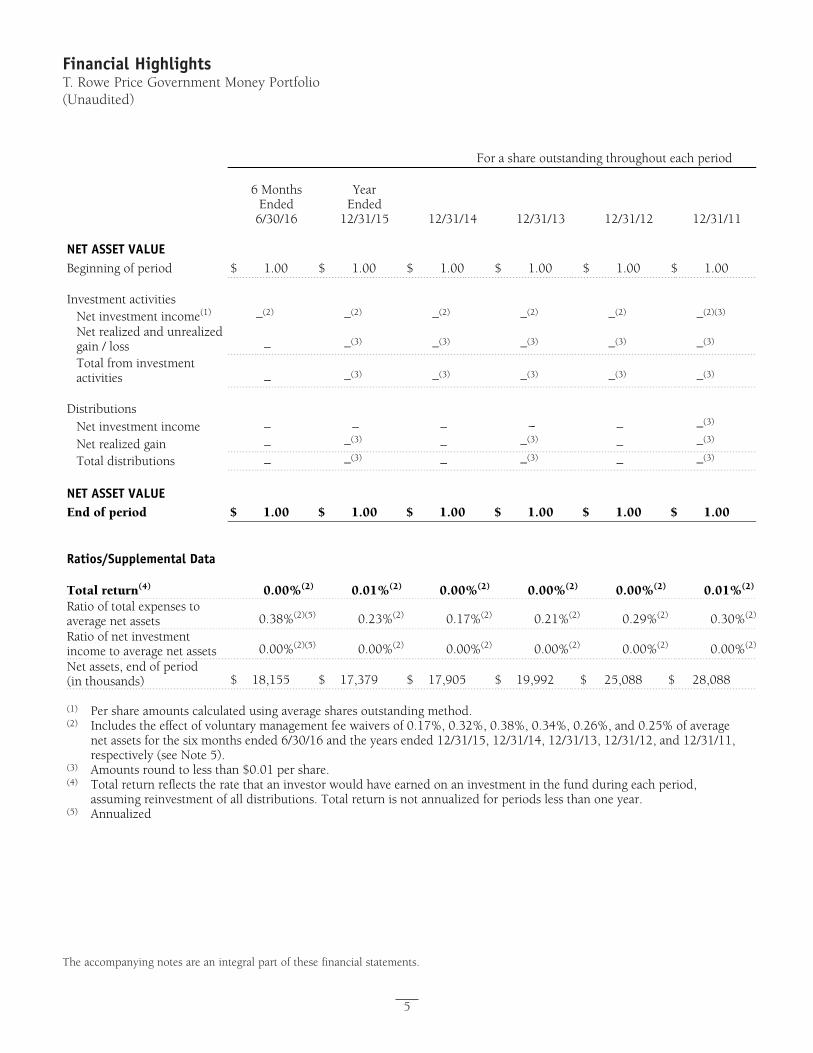
Proof #6
5
Financial HighlightsT. Rowe Price Government Money Portfolio(Unaudited)
The accompanying notes are an integral part of these financial statements.
For a share outstanding throughout each period
6 Months Ended
6/30/16
Year Ended
12/31/15
12/31/14 12/31/13 12/31/12 12/31/11
NET ASSET VALUE
Beginning of period $ 1.00 $ 1.00 $ 1.00 $ 1.00 $ 1.00 $ 1.00 Investment activities
Net investment income(1) –(2) –(2) –(2) –(2) –(2) –(2)(3)
Net realized and unrealized gain / loss – –(3) –(3) –(3) –(3) –(3)
Total from investment activities – –(3) –(3) –(3) –(3) –(3)
Distributions
Net investment income – – – --- – –(3)
Net realized gain – –(3) – –(3) – –(3)
Total distributions – –(3) – –(3) – –(3)
NET ASSET VALUE
End of period $ 1.00 $ 1.00 $ 1.00 $ 1.00 $ 1.00 $ 1.00 Ratios/Supplemental Data
Total return(4) 0.00%(2) 0.01%(2) 0.00%(2) 0.00%(2) 0.00%(2) 0.01%(2)
Ratio of total expenses to average net assets 0.38%(2)(5) 0.23%(2) 0.17%(2) 0.21%(2) 0.29%(2) 0.30%(2)
Ratio of net investment income to average net assets 0.00%(2)(5) 0.00%(2) 0.00%(2) 0.00%(2) 0.00%(2) 0.00%(2)
Net assets, end of period (in thousands) $ 18,155 $ 17,379 $ 17,905 $ 19,992 $ 25,088 $ 28,088
(1) Per share amounts calculated using average shares outstanding method.(2) Includes the effect of voluntary management fee waivers of 0.17%, 0.32%, 0.38%, 0.34%, 0.26%, and 0.25% of average
net assets for the six months ended 6/30/16 and the years ended 12/31/15, 12/31/14, 12/31/13, 12/31/12, and 12/31/11, respectively (see Note 5).
(3) Amounts round to less than $0.01 per share.(4) Total return reflects the rate that an investor would have earned on an investment in the fund during each period,
assuming reinvestment of all distributions. Total return is not annualized for periods less than one year. (5) Annualized
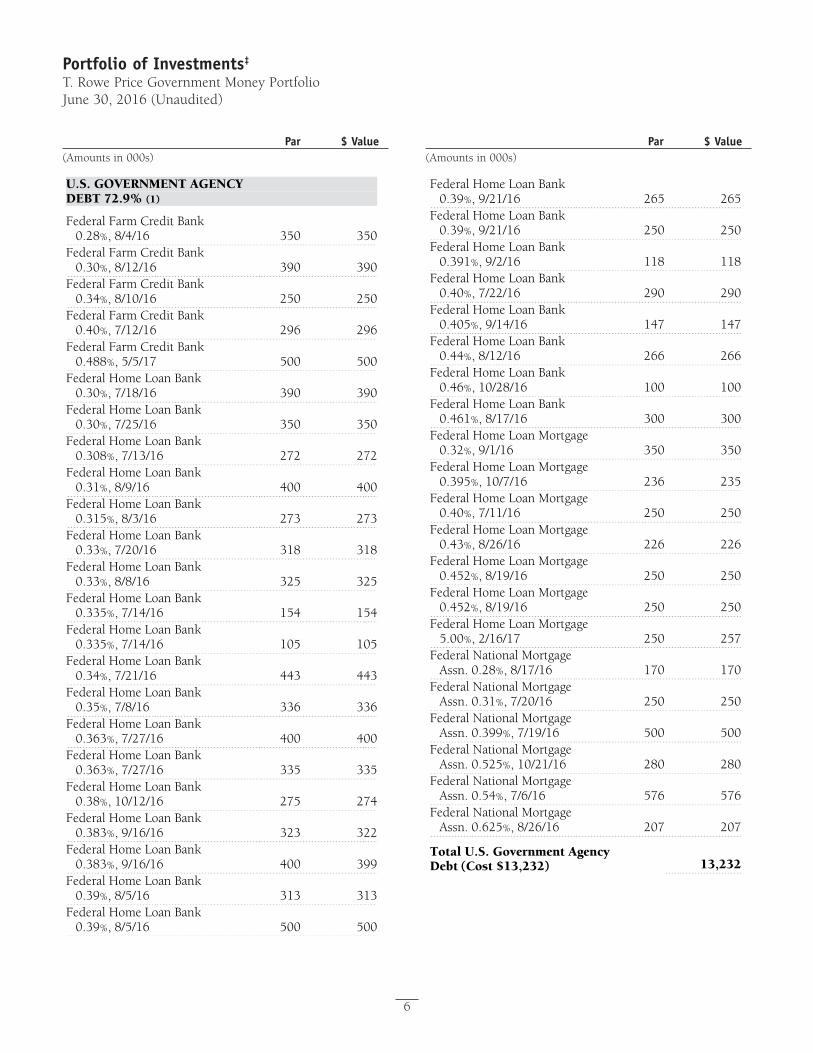
Proof #6
Portfolio of Investments‡
T. Rowe Price Government Money PortfolioJune 30, 2016 (Unaudited)
Par $ Value(Amounts in 000s)
Par $ Value(Amounts in 000s)
6
U.S. GOVERNMENT AGENCY DEBT 72.9% (1)
Federal Farm Credit Bank 0.28%, 8/4/16 350 350
Federal Farm Credit Bank 0.30%, 8/12/16 390 390
Federal Farm Credit Bank 0.34%, 8/10/16 250 250
Federal Farm Credit Bank 0.40%, 7/12/16 296 296
Federal Farm Credit Bank 0.488%, 5/5/17 500 500
Federal Home Loan Bank 0.30%, 7/18/16 390 390
Federal Home Loan Bank 0.30%, 7/25/16 350 350
Federal Home Loan Bank 0.308%, 7/13/16 272 272
Federal Home Loan Bank 0.31%, 8/9/16 400 400
Federal Home Loan Bank 0.315%, 8/3/16 273 273
Federal Home Loan Bank 0.33%, 7/20/16 318 318
Federal Home Loan Bank 0.33%, 8/8/16 325 325
Federal Home Loan Bank 0.335%, 7/14/16 154 154
Federal Home Loan Bank 0.335%, 7/14/16 105 105
Federal Home Loan Bank 0.34%, 7/21/16 443 443
Federal Home Loan Bank 0.35%, 7/8/16 336 336
Federal Home Loan Bank 0.363%, 7/27/16 400 400
Federal Home Loan Bank 0.363%, 7/27/16 335 335
Federal Home Loan Bank 0.38%, 10/12/16 275 274
Federal Home Loan Bank 0.383%, 9/16/16 323 322
Federal Home Loan Bank 0.383%, 9/16/16 400 399
Federal Home Loan Bank 0.39%, 8/5/16 313 313
Federal Home Loan Bank 0.39%, 8/5/16 500 500
Federal Home Loan Bank0.39%, 9/21/16 265 265
Federal Home Loan Bank0.39%, 9/21/16 250 250
Federal Home Loan Bank0.391%, 9/2/16 118 118
Federal Home Loan Bank0.40%, 7/22/16 290 290
Federal Home Loan Bank0.405%, 9/14/16 147 147
Federal Home Loan Bank0.44%, 8/12/16 266 266
Federal Home Loan Bank0.46%, 10/28/16 100 100
Federal Home Loan Bank0.461%, 8/17/16 300 300
Federal Home Loan Mortgage 0.32%, 9/1/16 350 350
Federal Home Loan Mortgage 0.395%, 10/7/16 236 235
Federal Home Loan Mortgage 0.40%, 7/11/16 250 250
Federal Home Loan Mortgage 0.43%, 8/26/16 226 226
Federal Home Loan Mortgage 0.452%, 8/19/16 250 250
Federal Home Loan Mortgage 0.452%, 8/19/16 250 250
Federal Home Loan Mortgage 5.00%, 2/16/17 250 257
Federal National Mortgage Assn. 0.28%, 8/17/16 170 170
Federal National Mortgage Assn. 0.31%, 7/20/16 250 250
Federal National Mortgage Assn. 0.399%, 7/19/16 500 500
Federal National Mortgage Assn. 0.525%, 10/21/16 280 280
Federal National Mortgage Assn. 0.54%, 7/6/16 576 576
Federal National Mortgage Assn. 0.625%, 8/26/16 207 207
Total U.S. Government Agency Debt (Cost $13,232) 13,232
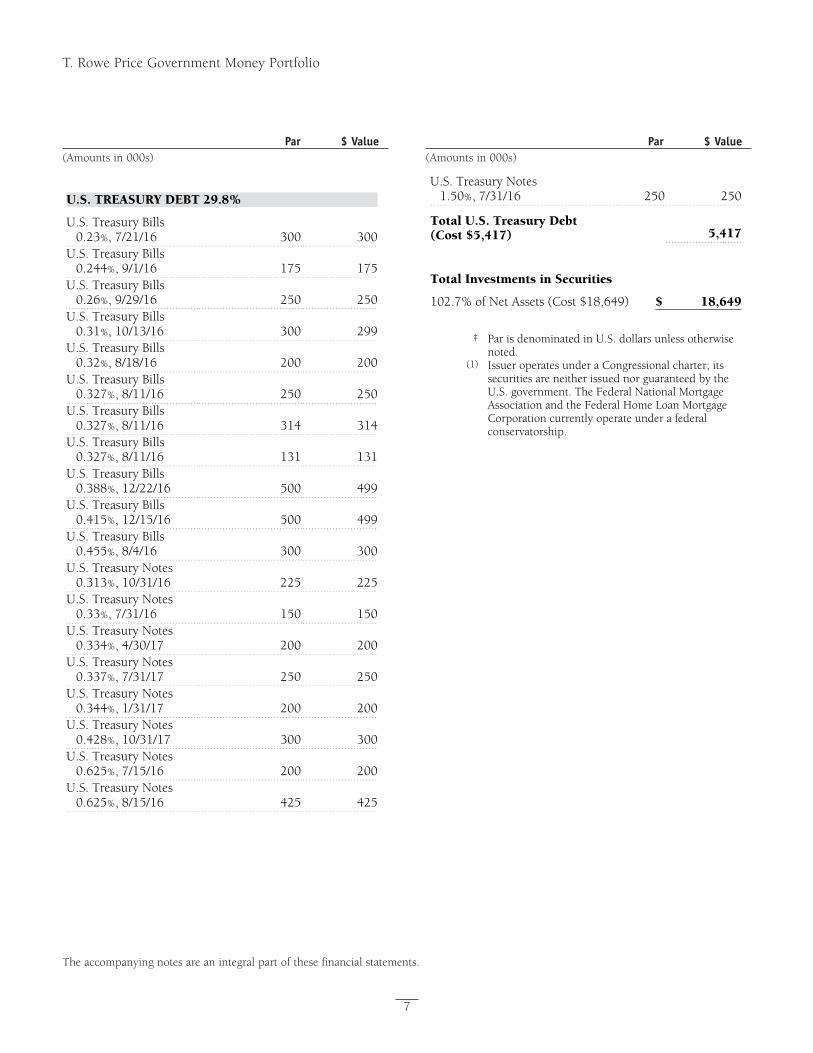
Proof #6
T. Rowe Price Government Money Portfolio
Par $ Value(Amounts in 000s)
Par $ Value(Amounts in 000s)
7
The accompanying notes are an integral part of these financial statements.
U.S. TREASURY DEBT 29.8%
U.S. Treasury Bills 0.23%, 7/21/16 300 300
U.S. Treasury Bills 0.244%, 9/1/16 175 175
U.S. Treasury Bills 0.26%, 9/29/16 250 250
U.S. Treasury Bills 0.31%, 10/13/16 300 299
U.S. Treasury Bills 0.32%, 8/18/16 200 200
U.S. Treasury Bills 0.327%, 8/11/16 250 250
U.S. Treasury Bills 0.327%, 8/11/16 314 314
U.S. Treasury Bills 0.327%, 8/11/16 131 131
U.S. Treasury Bills 0.388%, 12/22/16 500 499
U.S. Treasury Bills 0.415%, 12/15/16 500 499
U.S. Treasury Bills 0.455%, 8/4/16 300 300
U.S. Treasury Notes 0.313%, 10/31/16 225 225
U.S. Treasury Notes 0.33%, 7/31/16 150 150
U.S. Treasury Notes 0.334%, 4/30/17 200 200
U.S. Treasury Notes 0.337%, 7/31/17 250 250
U.S. Treasury Notes 0.344%, 1/31/17 200 200
U.S. Treasury Notes 0.428%, 10/31/17 300 300
U.S. Treasury Notes 0.625%, 7/15/16 200 200
U.S. Treasury Notes 0.625%, 8/15/16 425 425
U.S. Treasury Notes1.50%, 7/31/16 250 250
Total U.S. Treasury Debt (Cost $5,417) 5,417
Total Investments in Securities
102.7% of Net Assets (Cost $18,649) $ 18,649
‡
Par is denominated in U.S. dollars unless otherwise noted.
(1)
Issuer operates under a Congressional charter; its securities are neither issued nor guaranteed by the U.S. government. The Federal National Mortgage Association and the Federal Home Loan Mortgage Corporation currently operate under a federal conservatorship.
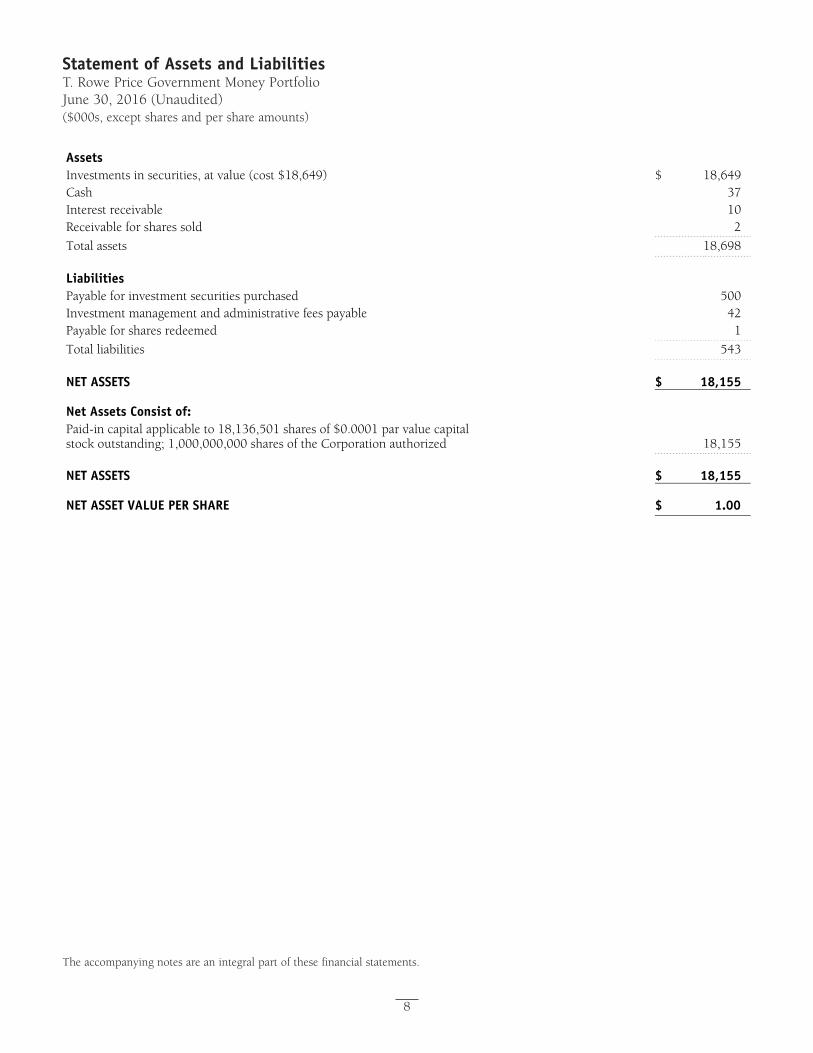
Proof #6
8
Statement of Assets and LiabilitiesT. Rowe Price Government Money PortfolioJune 30, 2016 (Unaudited)($000s, except shares and per share amounts)
The accompanying notes are an integral part of these financial statements.
Assets Investments in securities, at value (cost $18,649) $ 18,649 Cash 37 Interest receivable 10 Receivable for shares sold 2
Total assets 18,698 Liabilities Payable for investment securities purchased 500 Investment management and administrative fees payable 42 Payable for shares redeemed 1
Total liabilities 543 NET ASSETS $ 18,155 Net Assets Consist of: Paid-in capital applicable to 18,136,501 shares of $0.0001 par value capital stock outstanding; 1,000,000,000 shares of the Corporation authorized 18,155 NET ASSETS $ 18,155 NET ASSET VALUE PER SHARE $ 1.00
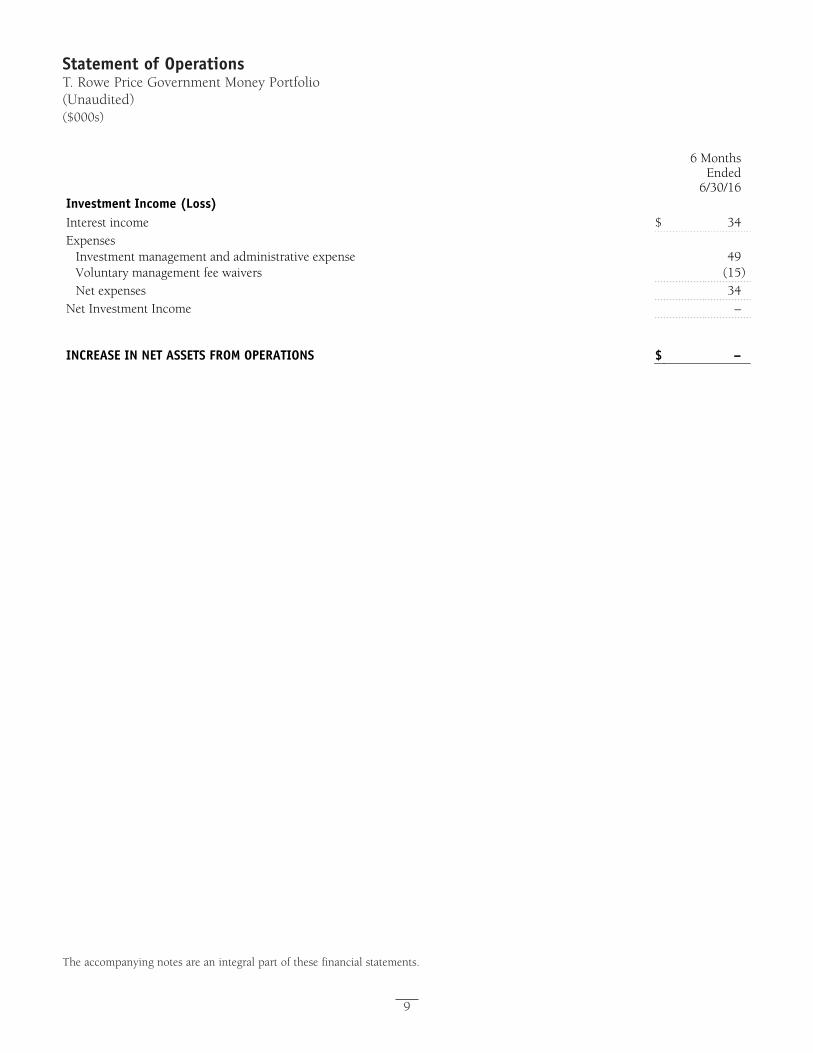
Proof #6
9
Statement of OperationsT. Rowe Price Government Money Portfolio(Unaudited)($000s)
The accompanying notes are an integral part of these financial statements.
6 Months Ended
6/30/16Investment Income (Loss) Interest income $ 34 Expenses
Investment management and administrative expense 49Voluntary management fee waivers (15)Net expenses 34
Net Investment Income – INCREASE IN NET ASSETS FROM OPERATIONS $ –
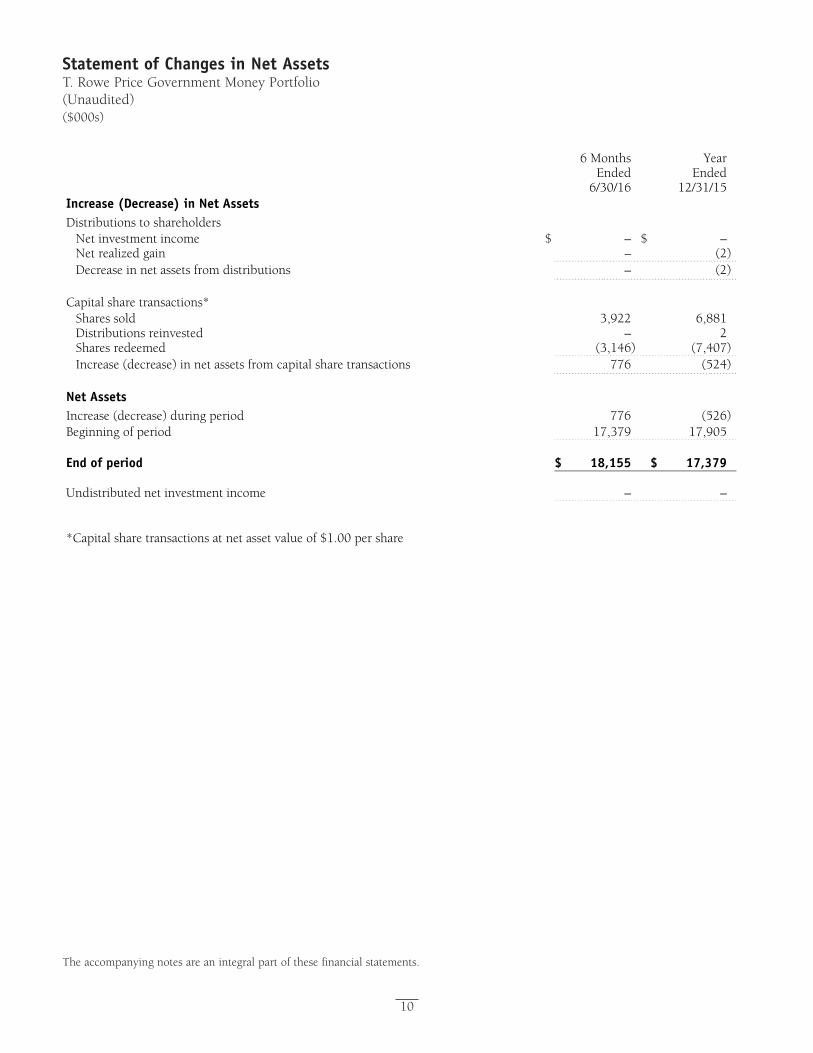
Proof #6
10
Statement of Changes in Net AssetsT. Rowe Price Government Money Portfolio(Unaudited)($000s)
The accompanying notes are an integral part of these financial statements.
6 Months Ended
6/30/16
Year Ended
12/31/15Increase (Decrease) in Net Assets Distributions to shareholders
Net investment income $ – $ –Net realized gain – (2)Decrease in net assets from distributions – (2)
Capital share transactions*
Shares sold 3,922 6,881Distributions reinvested – 2Shares redeemed (3,146) (7,407)Increase (decrease) in net assets from capital share transactions 776 (524)
Net Assets Increase (decrease) during period 776 (526) Beginning of period 17,379 17,905 End of period $ 18,155 $ 17,379 Undistributed net investment income – – *Capital share transactions at net asset value of $1.00 per share
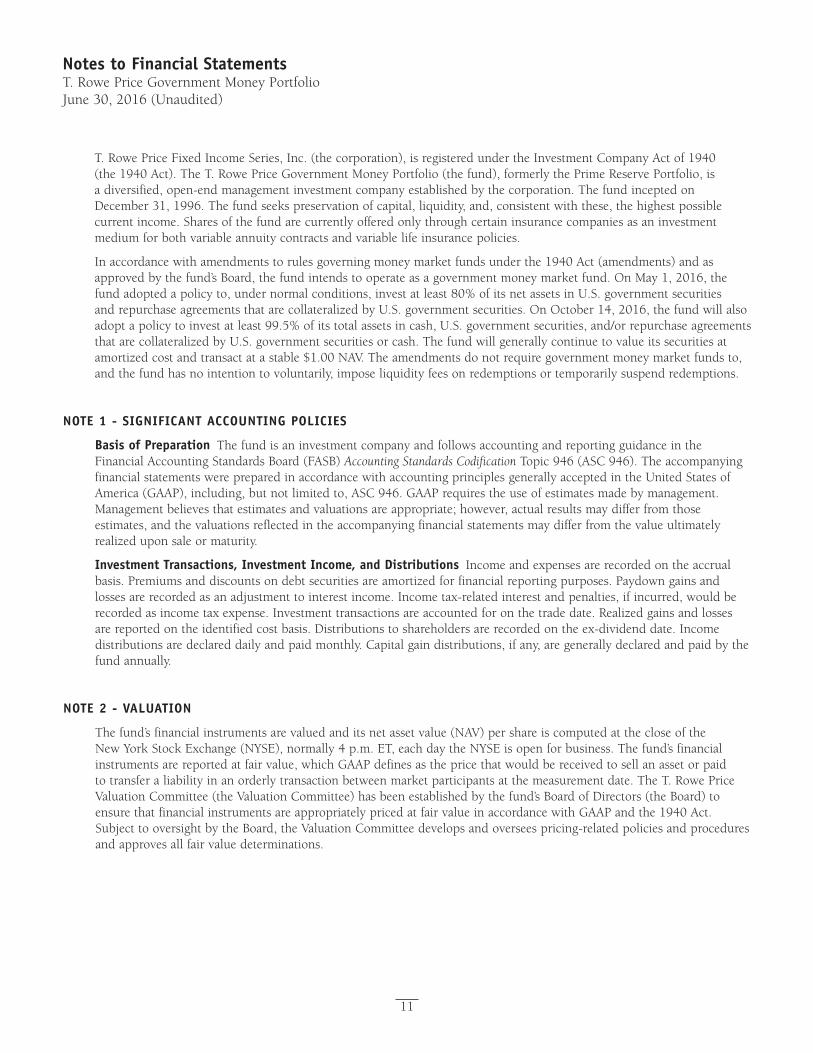
Proof #6
11
Notes to Financial StatementsT. Rowe Price Government Money PortfolioJune 30, 2016 (Unaudited)
T.RowePriceFixedIncomeSeries,Inc.(thecorporation),isregisteredundertheInvestmentCompanyActof1940(the1940Act).TheT.RowePriceGovernmentMoneyPortfolio(thefund),formerlythePrimeReservePortfolio,isadiversified,open-endmanagementinvestmentcompanyestablishedbythecorporation.ThefundinceptedonDecember31,1996.Thefundseekspreservationofcapital,liquidity,and,consistentwiththese,thehighestpossiblecurrent income. Shares of the fund are currently offered only through certain insurance companies as an investment medium for both variable annuity contracts and variable life insurance policies.
Inaccordancewithamendmentstorulesgoverningmoneymarketfundsunderthe1940Act(amendments)andasapprovedbythefund’sBoard,thefundintendstooperateasagovernmentmoneymarketfund. OnMay1,2016,thefundadoptedapolicyto,undernormalconditions,investatleast80%ofitsnetassetsinU.S.governmentsecuritiesandrepurchaseagreementsthatarecollateralizedbyU.S.governmentsecurities. OnOctober14,2016,thefundwillalsoadoptapolicytoinvestatleast99.5%ofitstotalassetsincash,U.S.governmentsecurities,and/orrepurchaseagreementsthat are collateralized by U.S. government securities or cash. The fund will generally continue to value its securities at amortizedcostandtransactatastable$1.00NAV.Theamendmentsdonotrequiregovernmentmoneymarketfundsto,andthefundhasnointentiontovoluntarily,imposeliquidityfeesonredemptionsortemporarilysuspend redemptions.
NOTE 1 - SIGNIFICANT ACCOUNTING POLICIES
Basis of Preparation The fund is an investment company and follows accounting and reporting guidance in the FinancialAccountingStandardsBoard(FASB)Accounting Standards CodificationTopic946(ASC946).Theaccompanyingfinancial statements were prepared in accordance with accounting principles generally accepted in the United States of America(GAAP),including,butnotlimitedto,ASC946.GAAPrequirestheuseofestimatesmadebymanagement.Managementbelievesthatestimatesandvaluationsareappropriate;however,actualresultsmaydifferfromthoseestimates, and the valuations reflected in the accompanying financial statements may differ from the value ultimately realized upon sale or maturity.
Investment Transactions, Investment Income, and Distributions Incomeandexpensesarerecordedontheaccrualbasis. Premiums and discounts on debt securities are amortized for financial reporting purposes. Paydown gains and lossesarerecordedasanadjustmenttointerestincome.Incometax-relatedinterestandpenalties,ifincurred,wouldberecordedasincometaxexpense.Investmenttransactionsareaccountedforonthetradedate.Realizedgainsandlossesarereportedontheidentifiedcostbasis.Distributionstoshareholdersarerecordedontheex-dividenddate.Incomedistributions are declared daily and paid monthly. Capital gain distributions, if any, are generally declared and paid by the fund annually.
NOTE 2 - VALUATION
Thefund’sfinancialinstrumentsarevaluedanditsnetassetvalue(NAV)pershareiscomputedatthecloseoftheNewYorkStockExchange(NYSE),normally4p.m.ET,eachdaytheNYSEisopenforbusiness.Thefund’sfinancialinstrumentsarereportedatfairvalue,whichGAAPdefinesasthepricethatwouldbereceivedtosellanassetorpaidtotransferaliabilityinanorderlytransactionbetweenmarketparticipantsatthemeasurementdate.TheT.RowePriceValuationCommittee(theValuationCommittee)hasbeenestablishedbythefund’sBoardofDirectors(theBoard)toensurethatfinancialinstrumentsareappropriatelypricedatfairvalueinaccordancewithGAAPandthe1940Act.SubjecttooversightbytheBoard,theValuationCommitteedevelopsandoverseespricing-relatedpoliciesandproceduresand approves all fair value determinations.
Proof #6
12
T. Rowe Price Government Money Portfolio
Variousvaluationtechniquesandinputsareusedtodeterminethefairvalueoffinancialinstruments.GAAPestablishesthe following fair value hierarchy that categorizes the inputs used to measure fair value:
Level1–quotedprices(unadjusted)inactivemarketsforidenticalfinancialinstrumentsthatthefundcanaccessatthereporting date
Level2–inputsotherthanLevel1quotedpricesthatareobservable,eitherdirectlyorindirectly(including,butnotlimitedto,quotedpricesforsimilarfinancialinstrumentsinactivemarkets,quotedpricesforidenticalorsimilarfinancialinstrumentsininactivemarkets,interestratesandyieldcurves,impliedvolatilities,andcreditspreads)
Level3–unobservableinputs
Observableinputsaredevelopedusingmarketdata,suchaspubliclyavailableinformationaboutactualeventsortransactions,andreflecttheassumptionsmarketparticipantswouldusetopricethefinancialinstrument.Unobservableinputsarethoseforwhichmarketdataarenotavailableandaredevelopedusingthebestinformationavailableabouttheassumptionsthatmarketparticipantswouldusetopricethefinancialinstrument.GAAPrequiresvaluationtechniquestomaximizetheuseofrelevantobservableinputsandminimizetheuseofunobservableinputs.Inputlevelsarenotnecessarilyanindicationoftheriskorliquidityassociatedwithfinancialinstrumentsatthatlevelbutratherthedegreeofjudgmentusedindeterminingthosevalues.Forexample,securitiesheldbyamoneymarketfundaregenerallyhighqualityandliquid;however,theyarereflectedasLevel2becausetheinputsusedtodeterminefairvaluearenotquotedpricesinanactivemarket.
InaccordancewithRule2a-7underthe1940Act,thefundvaluesitssecuritiesatamortizedcost,whichapproximatesfair value. Securities for which amortized cost is deemed not to reflect fair value are stated at fair value as determined in goodfaithbytheValuationCommittee.OnJune30,2016,allofthefund’sfinancialinstrumentswereclassifiedasLevel2in the fair value hierarchy.
NOTE 3 - FEDERAL INCOME TAXES
NoprovisionforfederalincometaxesisrequiredsincethefundintendstocontinuetoqualifyasaregulatedinvestmentcompanyunderSubchapterMoftheInternalRevenueCodeanddistributetoshareholdersallofitstaxableincomeandgains.Distributionsdeterminedinaccordancewithfederalincometaxregulationsmaydifferinamountorcharacterfromnetinvestmentincomeandrealizedgainsforfinancialreportingpurposes.Financialreportingrecordsareadjustedforpermanentbook/taxdifferencestoreflecttaxcharacterbutarenotadjustedfortemporarydifferences.Theamountandcharacteroftax-basisdistributionsandcompositionofnetassetsarefinalizedatfiscalyear-end;accordingly,tax-basisbalances have not been determined as of the date of this report.
AtJune30,2016,thecostofinvestmentsforfederalincometaxpurposeswas$18,649,000.
NOTE 4 - RELATED PARTY TRANSACTIONS
ThefundismanagedbyT.RowePriceAssociates,Inc.(PriceAssociates),awhollyownedsubsidiaryofT.RowePriceGroup,Inc.(PriceGroup).TheinvestmentmanagementandadministrativeagreementbetweenthefundandPriceAssociatesprovidesforanall-inclusiveannualfeeequalto0.55%ofthefund’saveragedailynetassets.Thefeeiscomputeddailyandpaidmonthly.Theall-inclusivefeecoversinvestmentmanagement,shareholderservicing,transferagency,accounting,andcustodyservicesprovidedtothefund,aswellasfunddirectors’feesandexpenses.Interest,taxes,brokeragecommissions,andextraordinaryexpensesarepaiddirectlybythefund.

Proof #6
13
T. Rowe Price Government Money Portfolio
PriceAssociatesmayvoluntarilywaivealloraportionofitsmanagementfeeandreimburseoperatingexpensestotheextentnecessaryforthefundtomaintainazeroorpositivenetyield(voluntarywaiver).Anyamountswaived/paidbyPriceAssociatesunderthisvoluntaryagreementarenotsubjecttorepaymentbythefund.PriceAssociatesmayamendorterminatethisvoluntaryarrangementatanytimewithoutpriornotice.ForthesixmonthsendedJune30,2016,expenseswaived/repaidtotaled$15,000.
The fund may participate in securities purchase and sale transactions with other funds or accounts advised by Price Associates(crosstrades),inaccordancewithproceduresadoptedbythefund’sBoardandSecuritiesandExchangeCommissionrules,whichrequire,amongotherthings,thatsuchpurchaseandsalecrosstradesbeeffectedattheinde-pendentcurrentmarketpriceofthesecurity.DuringthesixmonthsendedJune30,2016,thefundhadnopurchasesorsalescrosstradeswithotherfundsoraccountsadvisedbyPriceAssociates.

Proof #6
14
T.RowePriceGovernmentMoneyPortfolio
Information on Proxy Voting Policies, Procedures, and Records
AdescriptionofthepoliciesandproceduresusedbyT.RowePricefundsandportfoliostodeterminehowtovoteproxiesrelatingtoportfoliosecuritiesisavailableineachfund’sStatementofAdditionalInformation.Youmayrequestthisdocumentbycalling1-800-225-5132orbyaccessingtheSEC’swebsite,sec.gov.
Thedescriptionofourproxyvotingpoliciesandproceduresisalsoavailableonourcorporatewebsite.Toaccessit,pleasevisitthefollowingWebpage
https://www3.troweprice.com/usis/corporate/en/utility/policies.html
andscrolldowntothesectionnearthebottomofthepagethatsays,“ProxyVotingPolicies.”ClickontheProxyVotingPolicieslinkintheshadedbox.
Eachfund’smostrecentannualproxyvotingrecordisavailableonourwebsiteandthroughtheSEC’swebsite.Toaccessitthrough T. Rowe Price, visit the website location shown above, and scroll down to the section near the bottom of the page thatsays,“ProxyVotingRecords.”ClickontheProxyVotingRecordslinkintheshadedbox.
How to Obtain Quarterly Portfolio Holdings
ThefundfilesacompletescheduleofportfolioholdingswiththeSecuritiesandExchangeCommissionforthefirstandthirdquartersofeachfiscalyearonFormN-Q.Thefund’sFormN-QisavailableelectronicallyontheSEC’swebsite(sec.gov);hardcopiesmaybereviewedandcopiedattheSEC’sPublicReferenceRoom,100FSt.N.E.,Washington,DC20549.FormoreinformationonthePublicReferenceRoom,call1-800-SEC-0330.
Proof #6
15
Approval of Investment Management Agreement
OnMarch11,2016,thefund’sBoardofDirectors(Board),includingamajorityofthefund’sindependentdirectors,approvedthecontinuationoftheinvestmentmanagementagreement(AdvisoryContract)betweenthefundanditsinvestmentadvisor,T.RowePriceAssociates,Inc.(Advisor).Inconnectionwithitsdeliberations,theBoardrequested,andtheAdvisorprovided,suchinformationastheBoard(withadvicefromindependentlegalcounsel)deemedreasonablynecessary.TheBoardconsideredavarietyoffactorsinconnectionwithitsreviewoftheAdvisoryContract,alsotakingintoaccountinformationprovidedbytheAdvisorduringthecourseoftheyear,asdiscussedbelow:
Services Provided by the AdvisorTheBoardconsideredthenature,quality,andextentoftheservicesprovidedtothefundbytheAdvisor.Theseservicesincluded, but were not limited to, directing the fund’s investments in accordance with its investment program and the overall management of the fund’s portfolio, as well as a variety of related activities such as financial, investment operations, and administrative services; compliance; maintaining the fund’s records and registrations; and shareholder communications.TheBoardalsoreviewedthebackgroundandexperienceoftheAdvisor’sseniormanagementteamandinvestmentpersonnelinvolvedinthemanagementofthefund,aswellastheAdvisor’scompliancerecord.TheBoardconcludedthatitwassatisfiedwiththenature,quality,andextentoftheservicesprovidedbytheAdvisor.
Investment Performance of the FundTheBoardreviewedthefund’sthree-month,one-year,andyear-by-yearreturns,aswellasthefund’saverageannualizedtotalreturnsoverthe3-,5-,and10-yearperiods,andcomparedthesereturnswithawidevarietyofpreviouslyagreed-uponcomparableperformancemeasuresandmarketdata,includingthosesuppliedbyLipperandMorningstar,whichareindependent providers of mutual fund data.
OnthebasisofthisevaluationandtheBoard’songoingreviewofinvestmentresultsandfactoringintherelativemarketconditions during certain of the performance periods, the Board concluded that the fund’s performance was satisfactory.
Costs, Benefits, Profits, and Economies of ScaleTheBoardrevieweddetailedinformationregardingtherevenuesreceivedbytheAdvisorundertheAdvisoryContractandotherbenefitsthattheAdvisor(anditsaffiliates)mayhaverealizedfromitsrelationshipwiththefund,includinganyresearchreceivedunder“softdollar”agreementsandcommission-sharingarrangementswithbroker-dealers.TheBoardconsideredthattheAdvisormayreceivesomebenefitfromsoft-dollararrangementspursuanttowhichresearchisreceivedfrombroker-dealersthatexecutetheapplicablefund’sportfoliotransactions.TheBoardreceivedinformationontheestimatedcostsincurredandprofitsrealizedbytheAdvisorfrommanagingT.RowePricemutualfunds.WhiletheBoarddidnotreviewinformationregardingprofitsrealizedfrommanagingthefundinparticular–becausethefundhadeither not achieved sufficient portfolio asset size or not recognized sufficient revenues to produce meaningful profit margin percentages–theBoardconcludedthattheAdvisor’sprofitswerereasonableinlightoftheservicesprovidedtotheT. Rowe Price funds.
TheBoardalsoconsideredwhetherthefundbenefitsunderthefeelevelssetforthintheAdvisoryContractfromanyeconomiesofscalerealizedbytheAdvisor.TheBoardnotedthat,undertheAdvisoryContract,thefundpaystheAdvisorasinglefee,orall-inclusivemanagementfee,whichisbasedonthefund’saveragedailynetassets.Theall-inclusivemanagementfeeincludesinvestmentmanagementservicesandprovidesfortheAdvisortopayallofthefund’sordinary,recurringoperatingexpensesexceptforinterest,taxes,portfoliotransactionfees,andanynonrecurringextraordinaryexpensesthatmayarise.TheBoardalsonotedthatanarrangementisinplacewherebytheAdvisormayvoluntarilywaive all or a portion of the management fee it is entitled to receive from the fund or pay all or a portion of the fund’s operatingexpensesinordertomaintainazeroorpositivenetyieldforthefund.TheBoardconcludedthat,basedontheprofitabilitydataitreviewedandconsistentwiththisall-inclusivemanagementfeestructure,theAdvisoryContractprovided for a reasonable sharing of any benefits from economies of scale with the fund.
T.RowePriceGovernmentMoneyPortfolio
Proof #6
16
Approval of Investment Management Agreement (continued)
FeesTheBoardwasprovidedwithinformationregardingindustrytrendsinmanagementfeesandexpenses,andtheBoardreviewedthefund’smanagementfeerateandtotalexpenseratioincomparisonwithfeesandexpensesofothercomparablefundsbasedoninformationanddatasuppliedbyLipper.Forthesepurposes,theBoardassumedthatthefund’smanage-mentfeeratewasequaltotheall-inclusivemanagementfeeratelessthefund’sactualoperatingexpenses,andthetotalexpenseratiowasequaltotheall-inclusivemanagementfeerate.Afterincludingreductionsresultingfromthevoluntaryfee waiver arrangement, the information provided to the Board indicated that the fund’s management fee rate was below themedianforcomparablefundsandthefund’stotalexpenseratiowasabovethemedianforcomparablefunds.
The Board also reviewed the fee schedules for institutional accounts and private accounts with similar mandates that areadvisedorsubadvisedbytheAdvisoranditsaffiliates.ManagementprovidedtheBoardwithinformationabouttheAdvisor’sresponsibilitiesandservicesprovidedtosubadvisoryandotherinstitutionalaccountclients,includinginformationabouthowtherequirementsandeconomicsoftheinstitutionalbusinessarefundamentallydifferentfromthoseofthemutualfundbusiness.TheBoardconsideredinformationshowingthattheAdvisor’smutualfundbusinessisgenerallymorecomplexfromabusinessandcomplianceperspectivethanitsinstitutionalaccountbusinessandconsideredvariousrelevantfactors,suchasthebroaderscopeofoperationsandoversight,moreextensiveshareholdercommunicationinfrastructure,greaterassetflows,heightenedbusinessrisks,anddifferencesinapplicablelawsandregulationsassociatedwiththeAdvisor’sproprietarymutualfundbusiness.Inassessingthereasonablenessofthefund’smanagementfeerate,theBoardconsideredthedifferencesinthenatureoftheservicesrequiredfortheAdvisortomanageits mutual fund business versus managing a discrete pool of assets as a subadvisor to another institution’s mutual fund or foraninstitutionalaccountandthattheAdvisorgenerallyperformssignificantadditionalservicesandassumesgreaterriskin managing the fund and other T. Rowe Price mutual funds than it does for institutional account clients.
Onthebasisoftheinformationprovidedandthefactorsconsidered,theBoardconcludedthatthefeespaidbythefundundertheAdvisoryContractarereasonable.
Approval of the Advisory ContractAsnoted,theBoardapprovedthecontinuationoftheAdvisoryContract.Nosinglefactorwasconsideredinisolationor to be determinative to the decision. Rather, the Board concluded, in light of a weighting and balancing of all factors considered, that it was in the best interests of the fund and its shareholders for the Board to approve the continuation of theAdvisoryContract(includingthefeestobechargedforservicesthereunder).Theindependentdirectorswereadvisedthroughout the process by independent legal counsel.
T.RowePriceGovernmentMoneyPortfolio

Proof #6
This page intentionally left blank.

Proof #6
2016-US-24574 E306-051 8/16
100EastPrattStreet Baltimore,MD21202

Proof #6
Limited-Term Bond Portfolio
June 30, 2016
Semiannual Report
This report is authorized for distribution only to those who have received a copy of the portfolio’s prospectus.
T. Rowe Price Investment Services, Inc., Distributor.

Proof #6
T. Rowe Price Limited-Term Bond Portfolio
Highlights
• Short-termsecuritiesproducedmodestlypositivereturnsduringthesix-monthperiodendedJune30,2016.
•TheLimited-TermBondPortfolioperformedapproximatelyinlinewiththeBarclays1–3YearU.S.Government/CreditBondIndexduringtheperiodbutunderperformedtheLipperpeergroupaverage.
•Ourlargestexposurecontinuedtobeincorporatebonds,andwecontinuetoslowlyincreaseourpositioninhigher-quality,higher-liquidityasset-backedsecurities.
•WebelievethattheFedwillmoveslowlyintighteningmonetarypolicy.
The views and opinions in this report were current as of June 30, 2016. They are not guarantees of performance or investment results and should not be taken as investment advice. Investment decisions reflect a variety of factors, and the managers reserve the right to change their views about individual stocks, sectors, and the markets at any time. As a result, the views expressed should not be relied upon as a forecast of the fund’s future investment intent. The report is certified under the Sarbanes-Oxley Act, which requires mutual funds and other public companies to affirm that, to the best of their knowledge, the information in their financial reports is fairly and accurately stated in all material respects.
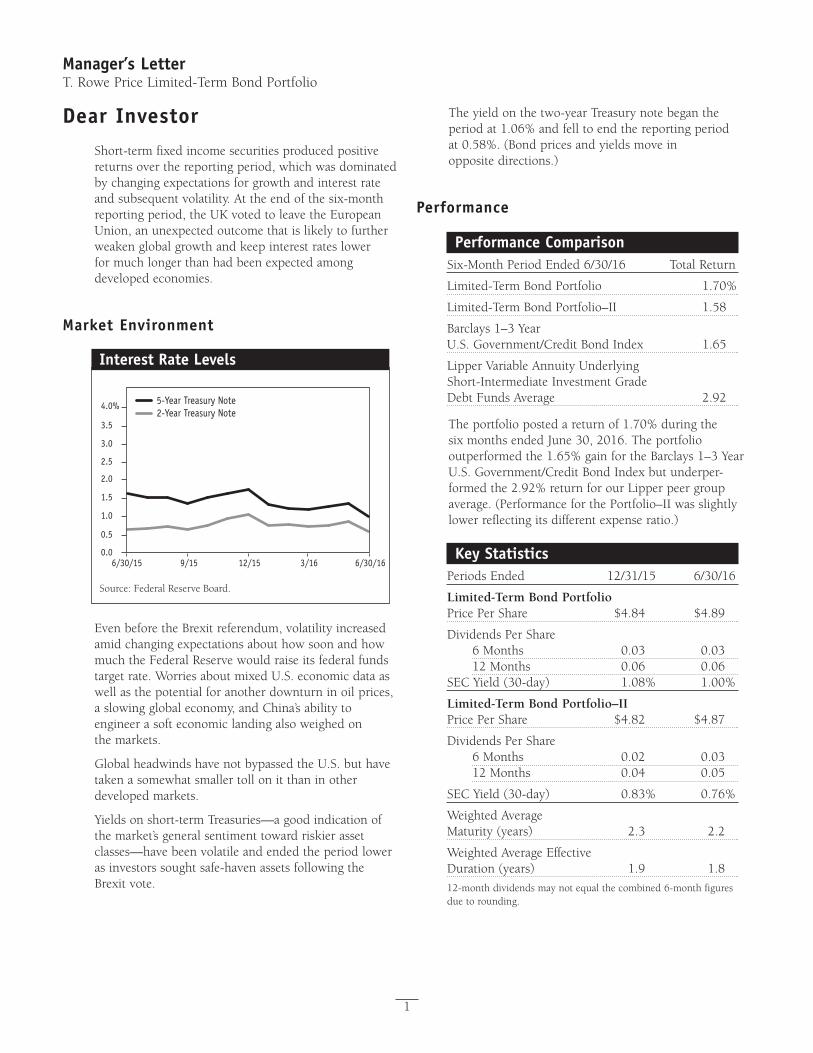
Proof #6
1
Manager’s LetterT. Rowe Price Limited-Term Bond Portfolio
Dear InvestorShort-termfixedincomesecuritiesproducedpositivereturnsoverthereportingperiod,whichwasdominatedbychangingexpectationsforgrowthandinterestrateandsubsequentvolatility.Attheendofthesix-monthreportingperiod,theUKvotedtoleavetheEuropeanUnion,anunexpectedoutcomethatislikelytofurtherweakenglobalgrowthandkeepinterestrateslowerformuchlongerthanhadbeenexpectedamongdeveloped economies.
Market Environment
Interest Rate Levels
Source: Federal Reserve Board.
5-Year Treasury Note2-Year Treasury Note
4.0%
3.5
3.0
2.5
2.0
1.5
1.0
0.5
0.06/30/15 9/15 12/15 3/16 6/30/16
EvenbeforetheBrexitreferendum,volatilityincreasedamidchangingexpectationsabouthowsoonandhowmuchtheFederalReservewouldraiseitsfederalfundstargetrate.WorriesaboutmixedU.S.economicdataaswell as the potential for another downturn in oil prices, aslowingglobaleconomy,andChina’sabilitytoengineerasofteconomiclandingalsoweighedonthemarkets.
GlobalheadwindshavenotbypassedtheU.S.buthavetakenasomewhatsmallertollonitthaninotherdevelopedmarkets.
Yieldsonshort-termTreasuries—agoodindicationofthemarket’sgeneralsentimenttowardriskierassetclasses—havebeenvolatileandendedtheperiodlowerasinvestorssoughtsafe-havenassetsfollowingtheBrexitvote.
Theyieldonthetwo-yearTreasurynotebegantheperiodat1.06%andfelltoendthereportingperiodat0.58%.(Bondpricesandyieldsmoveinopposite directions.)
Performance
Performance ComparisonSix-MonthPeriodEnded6/30/16 TotalReturn
Limited-TermBondPortfolio 1.70%
Limited-TermBondPortfolio–II 1.58
Barclays1–3YearU.S.Government/CreditBondIndex 1.65
LipperVariableAnnuityUnderlyingShort-IntermediateInvestmentGradeDebtFundsAverage 2.92
Theportfoliopostedareturnof1.70%duringthesixmonthsendedJune30,2016.Theportfoliooutperformedthe1.65%gainfortheBarclays1–3YearU.S.Government/CreditBondIndexbutunderper-formedthe2.92%returnforourLipperpeergroupaverage.(PerformanceforthePortfolio–IIwasslightlylowerreflectingitsdifferentexpenseratio.)
Key StatisticsPeriodsEnded 12/31/15 6/30/16
Limited-Term Bond PortfolioPricePerShare $4.84 $4.89
Dividends Per Share6Months 0.03 0.0312Months 0.06 0.06
SECYield(30-day) 1.08% 1.00%
Limited-Term Bond Portfolio–IIPricePerShare $4.82 $4.87
Dividends Per Share6Months 0.02 0.0312Months 0.04 0.05
SECYield(30-day) 0.83% 0.76%
WeightedAverage Maturity(years) 2.3 2.2
WeightedAverageEffective Duration(years) 1.9 1.8
12-monthdividendsmaynotequalthecombined6-monthfiguresduetorounding.
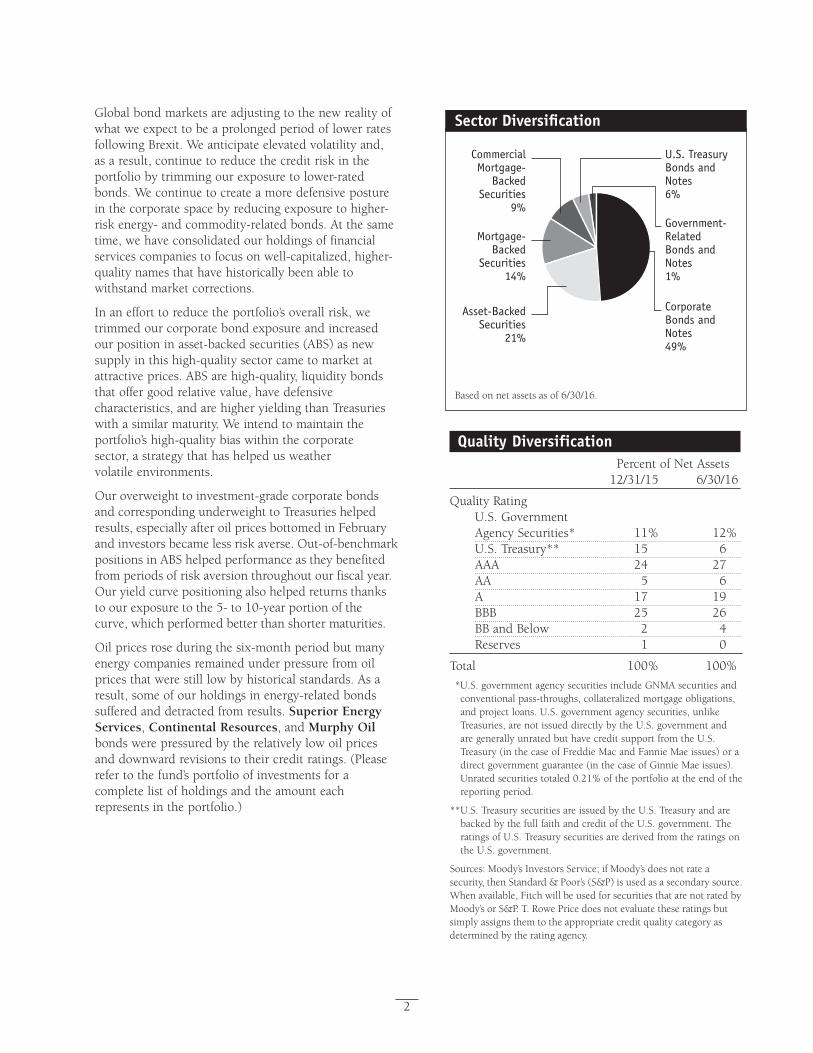
Proof #6
2
GlobalbondmarketsareadjustingtothenewrealityofwhatweexpecttobeaprolongedperiodoflowerratesfollowingBrexit.Weanticipateelevatedvolatilityand,asaresult,continuetoreducethecreditriskintheportfoliobytrimmingourexposuretolower-ratedbonds.Wecontinuetocreateamoredefensivepostureinthecorporatespacebyreducingexposuretohigher-riskenergy-andcommodity-relatedbonds.Atthesametime,wehaveconsolidatedourholdingsoffinancialservicescompaniestofocusonwell-capitalized,higher-qualitynamesthathavehistoricallybeenabletowithstandmarketcorrections.
Inanefforttoreducetheportfolio’soverallrisk,wetrimmedourcorporatebondexposureandincreasedourpositioninasset-backedsecurities(ABS)asnewsupplyinthishigh-qualitysectorcametomarketatattractiveprices.ABSarehigh-quality,liquiditybondsthatoffergoodrelativevalue,havedefensivecharacteristics,andarehigheryieldingthanTreasurieswithasimilarmaturity.Weintendtomaintaintheportfolio’shigh-qualitybiaswithinthecorporatesector,astrategythathashelpedusweathervolatile environments.
Ouroverweighttoinvestment-gradecorporatebondsandcorrespondingunderweighttoTreasurieshelpedresults,especiallyafteroilpricesbottomedinFebruaryandinvestorsbecamelessriskaverse.Out-of-benchmarkpositionsinABShelpedperformanceastheybenefitedfromperiodsofriskaversionthroughoutourfiscalyear.Ouryieldcurvepositioningalsohelpedreturnsthankstoourexposuretothe5-to10-yearportionofthecurve, which performed better than shorter maturities.
Oilpricesroseduringthesix-monthperiodbutmanyenergycompaniesremainedunderpressurefromoilpricesthatwerestilllowbyhistoricalstandards.Asaresult,someofourholdingsinenergy-relatedbondssuffered and detracted from results. Superior Energy Services, Continental Resources, and Murphy Oil bonds were pressured by the relatively low oil prices anddownwardrevisionstotheircreditratings.(Pleaserefer to the fund’s portfolio of investments for a completelistofholdingsandtheamounteachrepresents in the portfolio.)
Sector Diversi�cation
Based on net assets as of 6/30/16.
Corporate Bonds and Notes 49%
CommercialMortgage-
BackedSecurities
9%
Mortgage-Backed
Securities14%
Asset-BackedSecurities
21%
U.S. Treasury Bonds and Notes6%
Government-Related Bonds and Notes1%
Quality Diversification PercentofNetAssets 12/31/15 6/30/16
QualityRatingU.S.Government AgencySecurities* 11% 12%U.S.Treasury** 15 6AAA 24 27AA 5 6A 17 19BBB 25 26BBandBelow 2 4Reserves 1 0
Total 100% 100%
*U.S.governmentagencysecuritiesincludeGNMAsecuritiesandconventionalpass-throughs,collateralizedmortgageobligations,andprojectloans.U.S.governmentagencysecurities,unlikeTreasuries,arenotissueddirectlybytheU.S.governmentandaregenerallyunratedbuthavecreditsupportfromtheU.S.Treasury(inthecaseofFreddieMacandFannieMaeissues)oradirectgovernmentguarantee(inthecaseofGinnieMaeissues).Unratedsecuritiestotaled0.21%oftheportfolioattheendofthereportingperiod.
**U.S.TreasurysecuritiesareissuedbytheU.S.TreasuryandarebackedbythefullfaithandcreditoftheU.S.government.TheratingsofU.S.TreasurysecuritiesarederivedfromtheratingsontheU.S.government.
Sources:Moody’sInvestorsService;ifMoody’sdoesnotrateasecurity,thenStandard&Poor’s(S&P)isusedasasecondarysource.Whenavailable,FitchwillbeusedforsecuritiesthatarenotratedbyMoody’sorS&P.T.RowePricedoesnotevaluatetheseratingsbutsimplyassignsthemtotheappropriatecreditqualitycategoryasdeterminedbytheratingagency.
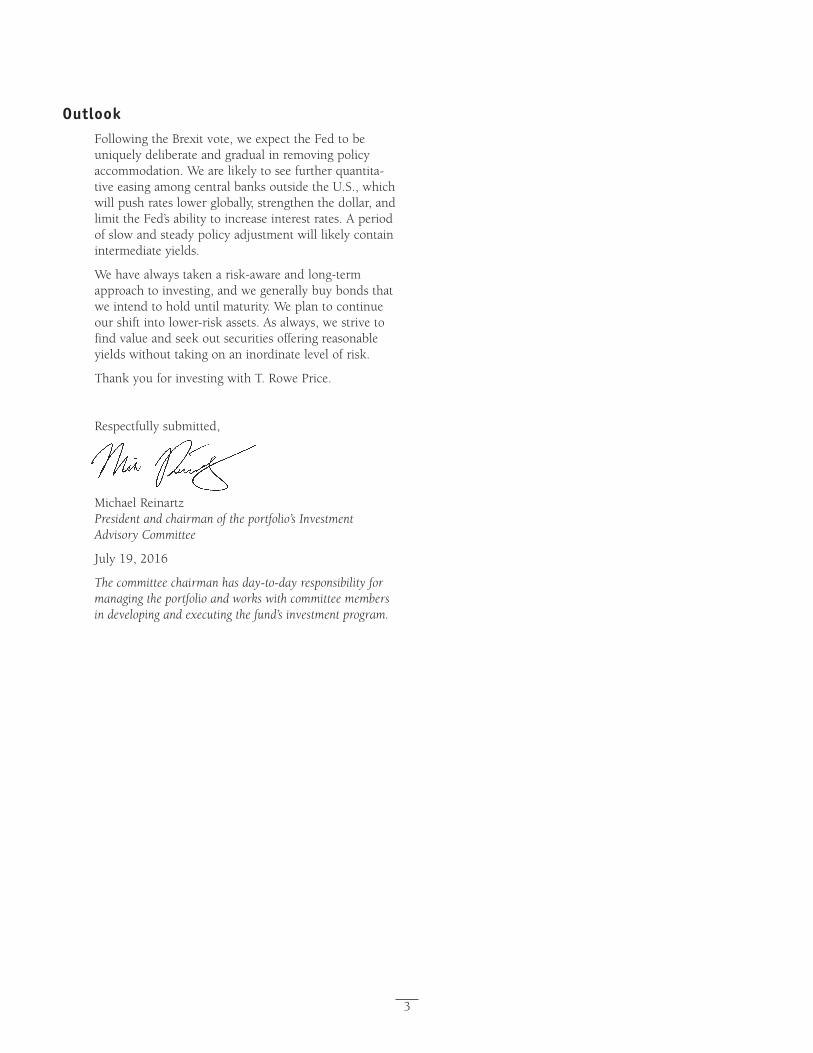
Proof #6
3
Outlook FollowingtheBrexitvote,weexpecttheFedtobeuniquelydeliberateandgradualinremovingpolicyaccommodation.Wearelikelytoseefurtherquantita-tiveeasingamongcentralbanksoutsidetheU.S.,whichwillpushrateslowerglobally,strengthenthedollar,andlimittheFed’sabilitytoincreaseinterestrates.Aperiodofslowandsteadypolicyadjustmentwilllikelycontainintermediate yields.
Wehavealwaystakenarisk-awareandlong-termapproachtoinvesting,andwegenerallybuybondsthatweintendtoholduntilmaturity.Weplantocontinueourshiftintolower-riskassets.Asalways,westrivetofindvalueandseekoutsecuritiesofferingreasonableyieldswithouttakingonaninordinatelevelofrisk.
ThankyouforinvestingwithT.RowePrice.
Respectfully submitted,
MichaelReinartzPresident and chairman of the portfolio’s Investment Advisory Committee
July19,2016
The committee chairman has day-to-day responsibility for managing the portfolio and works with committee members in developing and executing the fund’s investment program.

Proof #6
4
T. Rowe Price Limited-Term Bond Portfolio
Risks of Fixed Income InvestingBondsaresubjecttointerestraterisk(thedeclineinbond prices that usually accompanies a rise in interest rates)andcreditrisk(thechancethatanyfundholdingcouldhaveitscreditratingdowngradedorthatabondissuerwilldefaultbyfailingtomaketimelypaymentsofinterestorprincipal),potentiallyreducingthefund’sincomelevelandshareprice.Mortgage-backedsecuritiesaresubjecttoprepaymentrisk,particularlyiffallingratesleadtoheavyrefinancingactivity,andextensionrisk,which is an increase in interest rates that causes a fund’s averagematuritytolengthenunexpectedlyduetoadropinmortgageprepayments.Thiscouldincreasethefund’ssensitivitytorisinginterestratesanditspotentialforprice declines.
GlossaryBarclays 1–3 Year U.S. Government/Credit Bond Index: AtotalreturnindexthatincorporatesallbondsintheTreasuryBondIndexandtheAgencyBondIndex,aswellasU.S.corporateandsomeforeigndebenturesand secured notes, with maturities of one to three years.
Duration:Ameasureofabondfund’ssensitivitytochangesininterestrates.Forexample,afundwithdurationoftwoyearswouldfallabout2%inpriceinresponsetoaone-percentage-pointriseininterestrates,and vice versa.
Fed funds rate: Theinterestratechargedonovernightloans of reserves by one financial institution to another intheUnitedStates.TheFederalReservesetsatargetfederal funds rate to affect the direction of interest rates.
Lipper averages: Theaveragesofavailablemutualfundperformance returns for specified time periods in categoriesdefinedbyLipperInc.
SEC yield (30-day): Amethodofcalculatingafund’syield that assumes all portfolio securities are held until maturity.Yieldwillvaryandisnotguaranteed.
Glossary (continued)Weighted average maturity: Ameasureofafund’sinterestratesensitivity.Ingeneral,thelongertheaveragematurity,thegreaterthefund’ssensitivitytointerestratechanges.Theweightedaveragematuritymaytakeintoaccounttheinterestratereadjustmentdatesforcertain securities.
Yield curve: Agraphdepictingtherelationshipbetweenyields and maturity dates for a set of similar securities. Thesecurvesareinconstantflux.Oneofthekeyactivitiesinmanaginganyfixedincomeportfolioistostudy the trends reflected by yield curves.
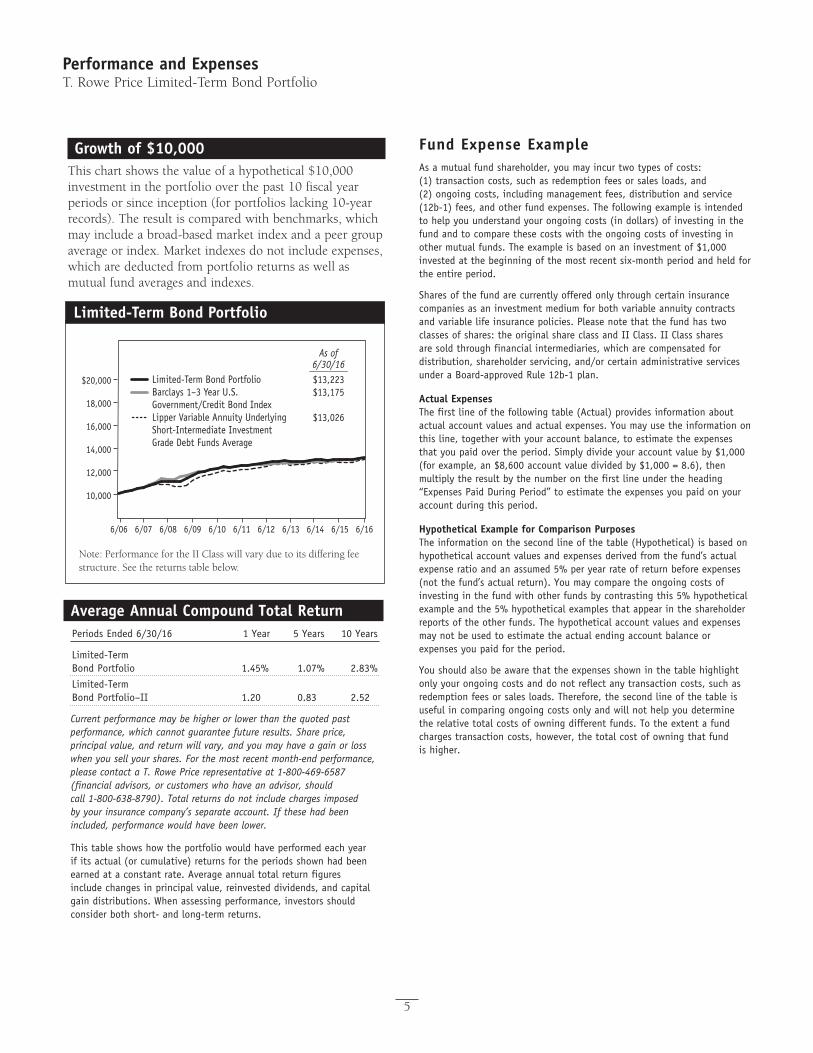
Proof #6
Performance and ExpensesT. Rowe Price Limited-Term Bond Portfolio
5
Growth of $10,000Thischartshowsthevalueofahypothetical$10,000investmentintheportfoliooverthepast10fiscalyearperiodsorsinceinception(forportfolioslacking10-yearrecords).Theresultiscomparedwithbenchmarks,whichmayincludeabroad-basedmarketindexandapeergroupaverageorindex.Marketindexesdonotincludeexpenses,which are deducted from portfolio returns as well as mutualfundaveragesandindexes.
Limited-Term Bond Portfolio
Note: Performance for the II Class will vary due to its differing fee structure. See the returns table below.
Limited-Term Bond PortfolioBarclays 1–3 Year U.S. Government/Credit Bond IndexLipper Variable Annuity Underlying Short-Intermediate Investment Grade Debt Funds Average
As of6/30/16________$13,223$13,175
$13,026
10,000
12,000
14,000
16,000
18,000
$20,000
6/166/156/146/136/126/116/106/096/086/076/06
Average Annual Compound Total ReturnPeriods Ended 6/30/16 1 Year 5 Years 10 Years
Limited-Term Bond Portfolio 1.45% 1.07% 2.83%
Limited-Term Bond Portfolio–II 1.20 0.83 2.52
Current performance may be higher or lower than the quoted past performance, which cannot guarantee future results. Share price, principal value, and return will vary, and you may have a gain or loss when you sell your shares. For the most recent month-end performance, please contact a T. Rowe Price representative at 1-800-469-6587 (financial advisors, or customers who have an advisor, should call 1-800-638-8790). Total returns do not include charges imposed by your insurance company’s separate account. If these had been included, performance would have been lower.
This table shows how the portfolio would have performed each year if its actual (or cumulative) returns for the periods shown had been earned at a constant rate. Average annual total return figures include changes in principal value, reinvested dividends, and capital gain distributions. When assessing performance, investors should consider both short- and long-term returns.
Fund Expense ExampleAs a mutual fund shareholder, you may incur two types of costs: (1) transaction costs, such as redemption fees or sales loads, and (2) ongoing costs, including management fees, distribution and service (12b-1) fees, and other fund expenses. The following example is intended to help you understand your ongoing costs (in dollars) of investing in the fund and to compare these costs with the ongoing costs of investing in other mutual funds. The example is based on an investment of $1,000 invested at the beginning of the most recent six-month period and held for the entire period.
Shares of the fund are currently offered only through certain insurance companies as an investment medium for both variable annuity contracts and variable life insurance policies. Please note that the fund has two classes of shares: the original share class and II Class. II Class shares are sold through financial intermediaries, which are compensated for distribution, shareholder servicing, and/or certain administrative services under a Board-approved Rule 12b-1 plan.
Actual ExpensesThe first line of the following table (Actual) provides information about actual account values and actual expenses. You may use the information on this line, together with your account balance, to estimate the expenses that you paid over the period. Simply divide your account value by $1,000 (for example, an $8,600 account value divided by $1,000 = 8.6), then multiply the result by the number on the first line under the heading “Expenses Paid During Period” to estimate the expenses you paid on your account during this period.
Hypothetical Example for Comparison PurposesThe information on the second line of the table (Hypothetical) is based on hypothetical account values and expenses derived from the fund’s actual expense ratio and an assumed 5% per year rate of return before expenses (not the fund’s actual return). You may compare the ongoing costs of investing in the fund with other funds by contrasting this 5% hypothetical example and the 5% hypothetical examples that appear in the shareholder reports of the other funds. The hypothetical account values and expenses may not be used to estimate the actual ending account balance or expenses you paid for the period.
You should also be aware that the expenses shown in the table highlight only your ongoing costs and do not reflect any transaction costs, such as redemption fees or sales loads. Therefore, the second line of the table is useful in comparing ongoing costs only and will not help you determine the relative total costs of owning different funds. To the extent a fund charges transaction costs, however, the total cost of owning that fund is higher.

Proof #6
6
T. Rowe Price Limited-Term Bond Portfolio
Fund Expense Example (continued)
Limited-Term Bond Portfolio Expenses Beginning Ending Paid During Account Account Period* Value Value 1/1/16 to 1/1/16 6/30/16 6/30/16
Limited-Term Bond PortfolioActual $1,000.00 $1,017.00 $3.51
Hypothetical (assumes 5% return before expenses) 1,000.00 1,021.38 3.52
Limited-Term Bond Portfolio–IIActual 1,000.00 1,015.80 4.76
Hypothetical (assumes 5% return before expenses) 1,000.00 1,020.14 4.77
* Expenses are equal to the fund’s annualized expense ratio for the 6-month period, multiplied by the average account value over the period, multiplied by the number of days in the most recent fiscal half year (182), and divided by the days in the year (366) to reflect the half-year period. The annualized expense ratio of the Limited-Term Bond Portfolio was 0.70%, and the Limited-Term Bond Portfolio–II was 0.95%.
Proof #6
7
Financial HighlightsT. Rowe Price Limited-Term Bond Portfolio(Unaudited)
The accompanying notes are an integral part of these financial statements.
Limited-Term Bond Class
For a share outstanding throughout each period
6 Months Ended
6/30/16
YearEnded
12/31/15 12/31/14 12/31/13 12/31/12 12/31/11
NET ASSET VALUE
Beginning of period $ 4.84 $ 4.88 $ 4.91 $ 4.98 $ 4.97 $ 5.05 Investment activities
Net investment income(1) 0.03 0.04 0.05 0.06 0.08 0.11
Net realized and unrealized gain / loss 0.05 (0.02) (0.02) (0.05) 0.04 (0.03)
Total from investment activities 0.08 0.02 0.03 0.01 0.12 0.08
Distributions
Net investment income (0.03) (0.06) (0.06) (0.08) (0.10) (0.12)Net realized gain – – – –(2) (0.01) (0.04)
Total distributions (0.03) (0.06) (0.06) (0.08) (0.11) (0.16) NET ASSET VALUE
End of period $ 4.89 $ 4.84 $ 4.88 $ 4.91 $ 4.98 $ 4.97 Ratios/Supplemental Data
Total return(3) 1.70% 0.31% 0.64% 0.13% 2.47% 1.60%
Ratio of total expenses to average net assets 0.70%(4) 0.70% 0.70% 0.70% 0.70% 0.70%
Ratio of net investment income to average net assets 1.07%(4) 0.82% 1.00% 1.12% 1.63% 2.14%
Portfolio turnover rate 35.8% 89.2% 117.0% 52.4% 64.3% 89.2%Net assets, end of period (in thousands) $ 402,969 $ 420,125 $ 261,935 $ 168,117 $ 156,343 $ 167,800
(1) Per share amounts calculated using average shares outstanding method.(2) Amounts round to less than $0.01 per share.(3) Total return reflects the rate that an investor would have earned on an investment in the fund during each period, assuming
reinvestment of all distributions. Total return is not annualized for periods less than one year. (4) Annualized
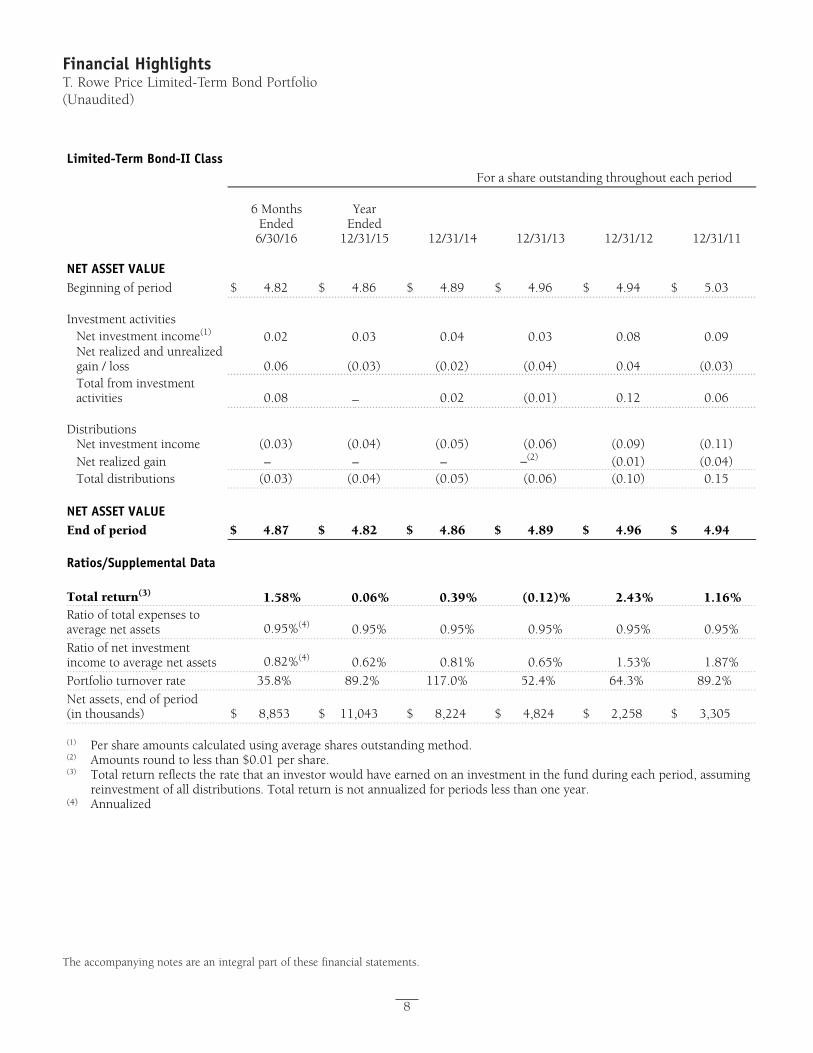
Proof #6
8
Financial HighlightsT. Rowe Price Limited-Term Bond Portfolio(Unaudited)
The accompanying notes are an integral part of these financial statements.
Limited-Term Bond-II Class
For a share outstanding throughout each period
6 Months Ended
6/30/16
YearEnded
12/31/15 12/31/14 12/31/13 12/31/12 12/31/11
NET ASSET VALUE
Beginning of period $ 4.82 $ 4.86 $ 4.89 $ 4.96 $ 4.94 $ 5.03 Investment activities
Net investment income(1) 0.02 0.03 0.04 0.03 0.08 0.09
Net realized and unrealized gain / loss 0.06 (0.03) (0.02) (0.04) 0.04 (0.03)
Total from investment activities 0.08 – 0.02 (0.01) 0.12 0.06
Distributions
Net investment income (0.03) (0.04) (0.05) (0.06) (0.09) (0.11)Net realized gain – – – –(2) (0.01) (0.04)
Total distributions (0.03) (0.04) (0.05) (0.06) (0.10) 0.15 NET ASSET VALUE
End of period $ 4.87 $ 4.82 $ 4.86 $ 4.89 $ 4.96 $ 4.94 Ratios/Supplemental Data
Total return(3) 1.58% 0.06% 0.39% (0.12)% 2.43% 1.16%
Ratio of total expenses to average net assets 0.95%(4) 0.95% 0.95% 0.95% 0.95% 0.95%
Ratio of net investment income to average net assets 0.82%(4) 0.62% 0.81% 0.65% 1.53% 1.87%
Portfolio turnover rate 35.8% 89.2% 117.0% 52.4% 64.3% 89.2%
Net assets, end of period (in thousands) $ 8,853 $ 11,043 $ 8,224 $ 4,824 $ 2,258 $ 3,305
(1) Per share amounts calculated using average shares outstanding method.(2) Amounts round to less than $0.01 per share.(3) Total return reflects the rate that an investor would have earned on an investment in the fund during each period, assuming
reinvestment of all distributions. Total return is not annualized for periods less than one year. (4) Annualized
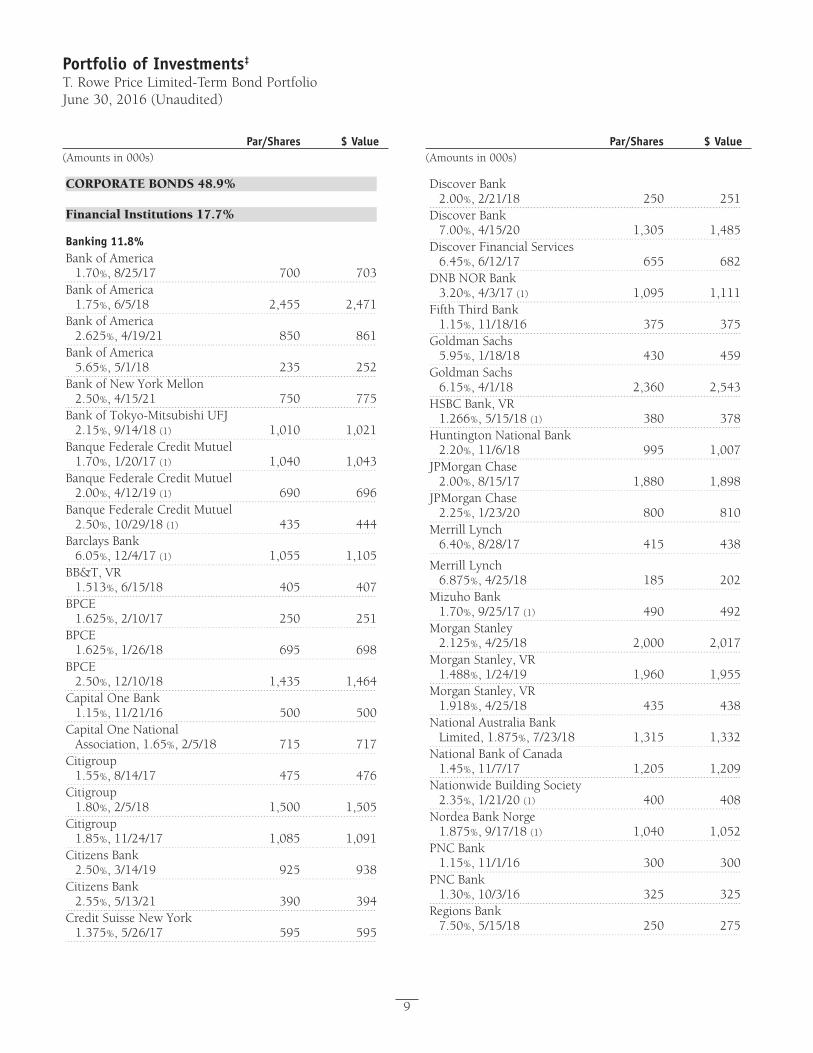
Proof #6
Portfolio of Investments‡
T. Rowe Price Limited-Term Bond PortfolioJune 30, 2016 (Unaudited)
Par/Shares $ Value(Amounts in 000s)
Par/Shares $ Value(Amounts in 000s)
9
CORPORATE BONDS 48.9%
Financial Institutions 17.7%
Banking 11.8% Bank of America
1.70%, 8/25/17 700 703Bank of America
1.75%, 6/5/18 2,455 2,471Bank of America
2.625%, 4/19/21 850 861Bank of America
5.65%, 5/1/18 235 252Bank of New York Mellon
2.50%, 4/15/21 750 775Bank of Tokyo-Mitsubishi UFJ
2.15%, 9/14/18 (1) 1,010 1,021Banque Federale Credit Mutuel
1.70%, 1/20/17 (1) 1,040 1,043Banque Federale Credit Mutuel
2.00%, 4/12/19 (1) 690 696Banque Federale Credit Mutuel
2.50%, 10/29/18 (1) 435 444Barclays Bank
6.05%, 12/4/17 (1) 1,055 1,105BB&T, VR
1.513%, 6/15/18 405 407BPCE
1.625%, 2/10/17 250 251BPCE
1.625%, 1/26/18 695 698BPCE
2.50%, 12/10/18 1,435 1,464Capital One Bank
1.15%, 11/21/16 500 500Capital One National
Association, 1.65%, 2/5/18 715 717Citigroup
1.55%, 8/14/17 475 476Citigroup
1.80%, 2/5/18 1,500 1,505Citigroup
1.85%, 11/24/17 1,085 1,091Citizens Bank
2.50%, 3/14/19 925 938Citizens Bank
2.55%, 5/13/21 390 394Credit Suisse New York
1.375%, 5/26/17 595 595
Discover Bank2.00%, 2/21/18 250 251
Discover Bank7.00%, 4/15/20 1,305 1,485
Discover Financial Services 6.45%, 6/12/17 655 682
DNB NOR Bank3.20%, 4/3/17 (1) 1,095 1,111
Fifth Third Bank1.15%, 11/18/16 375 375
Goldman Sachs5.95%, 1/18/18 430 459
Goldman Sachs6.15%, 4/1/18 2,360 2,543
HSBC Bank, VR1.266%, 5/15/18 (1) 380 378
Huntington National Bank 2.20%, 11/6/18 995 1,007
JPMorgan Chase2.00%, 8/15/17 1,880 1,898
JPMorgan Chase2.25%, 1/23/20 800 810
Merrill Lynch6.40%, 8/28/17 415 438
Merrill Lynch 6.875%, 4/25/18 185 202
Mizuho Bank1.70%, 9/25/17 (1) 490 492
Morgan Stanley2.125%, 4/25/18 2,000 2,017
Morgan Stanley, VR1.488%, 1/24/19 1,960 1,955
Morgan Stanley, VR1.918%, 4/25/18 435 438
National Australia Bank Limited, 1.875%, 7/23/18 1,315 1,332
National Bank of Canada1.45%, 11/7/17 1,205 1,209
Nationwide Building Society 2.35%, 1/21/20 (1) 400 408
Nordea Bank Norge1.875%, 9/17/18 (1) 1,040 1,052
PNC Bank1.15%, 11/1/16 300 300
PNC Bank1.30%, 10/3/16 325 325
Regions Bank7.50%, 5/15/18 250 275
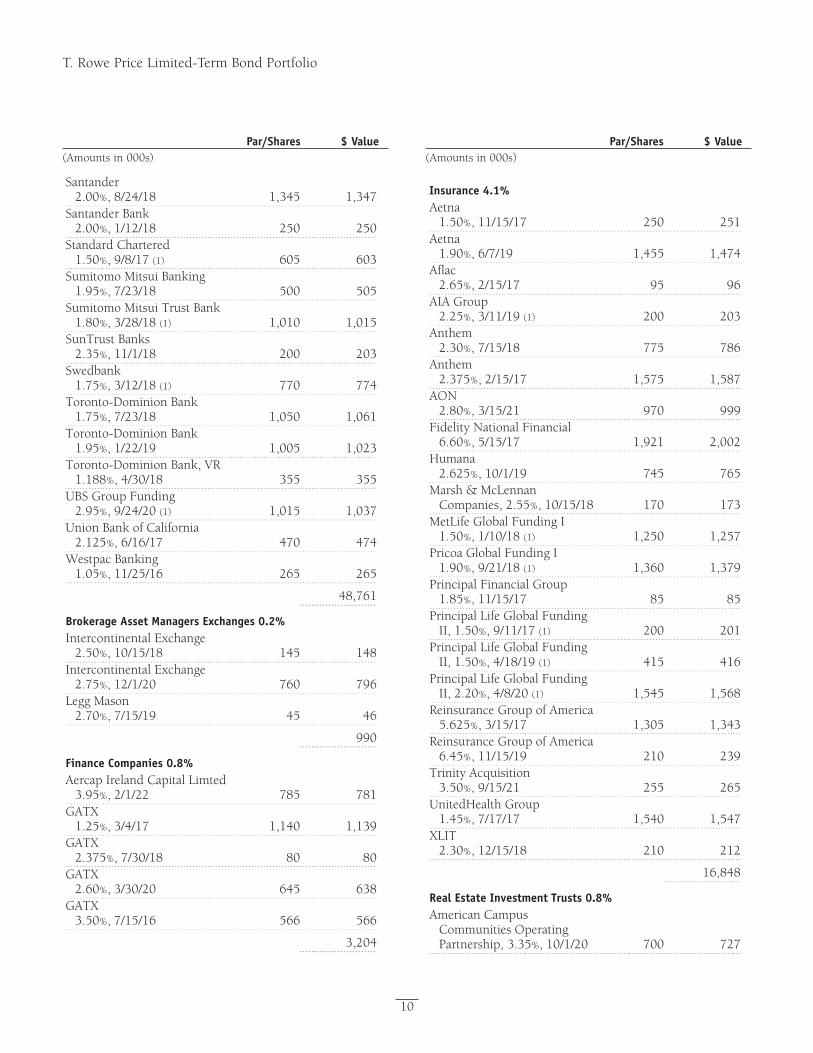
Proof #6
T. Rowe Price Limited-Term Bond Portfolio
Par/Shares $ Value(Amounts in 000s)
Par/Shares $ Value(Amounts in 000s)
10
Santander 2.00%, 8/24/18 1,345 1,347
Santander Bank 2.00%, 1/12/18 250 250
Standard Chartered 1.50%, 9/8/17 (1) 605 603
Sumitomo Mitsui Banking 1.95%, 7/23/18 500 505
Sumitomo Mitsui Trust Bank 1.80%, 3/28/18 (1) 1,010 1,015
SunTrust Banks 2.35%, 11/1/18 200 203
Swedbank 1.75%, 3/12/18 (1) 770 774
Toronto-Dominion Bank 1.75%, 7/23/18 1,050 1,061
Toronto-Dominion Bank 1.95%, 1/22/19 1,005 1,023
Toronto-Dominion Bank, VR 1.188%, 4/30/18 355 355
UBS Group Funding 2.95%, 9/24/20 (1) 1,015 1,037
Union Bank of California 2.125%, 6/16/17 470 474
Westpac Banking 1.05%, 11/25/16 265 265
48,761
Brokerage Asset Managers Exchanges 0.2% Intercontinental Exchange
2.50%, 10/15/18 145 148Intercontinental Exchange
2.75%, 12/1/20 760 796Legg Mason
2.70%, 7/15/19 45 46
990
Finance Companies 0.8% Aercap Ireland Capital Limted
3.95%, 2/1/22 785 781GATX
1.25%, 3/4/17 1,140 1,139GATX
2.375%, 7/30/18 80 80GATX
2.60%, 3/30/20 645 638GATX
3.50%, 7/15/16 566 566
3,204
Insurance 4.1% Aetna
1.50%, 11/15/17 250 251Aetna
1.90%, 6/7/19 1,455 1,474Aflac
2.65%, 2/15/17 95 96AIA Group
2.25%, 3/11/19 (1) 200 203Anthem
2.30%, 7/15/18 775 786Anthem
2.375%, 2/15/17 1,575 1,587AON
2.80%, 3/15/21 970 999Fidelity National Financial
6.60%, 5/15/17 1,921 2,002Humana
2.625%, 10/1/19 745 765Marsh & McLennan
Companies, 2.55%, 10/15/18 170 173MetLife Global Funding I
1.50%, 1/10/18 (1) 1,250 1,257Pricoa Global Funding I
1.90%, 9/21/18 (1) 1,360 1,379Principal Financial Group
1.85%, 11/15/17 85 85Principal Life Global Funding
II, 1.50%, 9/11/17 (1) 200 201Principal Life Global Funding
II, 1.50%, 4/18/19 (1) 415 416Principal Life Global Funding
II, 2.20%, 4/8/20 (1) 1,545 1,568Reinsurance Group of America
5.625%, 3/15/17 1,305 1,343Reinsurance Group of America
6.45%, 11/15/19 210 239Trinity Acquisition
3.50%, 9/15/21 255 265UnitedHealth Group
1.45%, 7/17/17 1,540 1,547XLIT
2.30%, 12/15/18 210 212
16,848
Real Estate Investment Trusts 0.8% American Campus
Communities Operating Partnership, 3.35%, 10/1/20 700 727
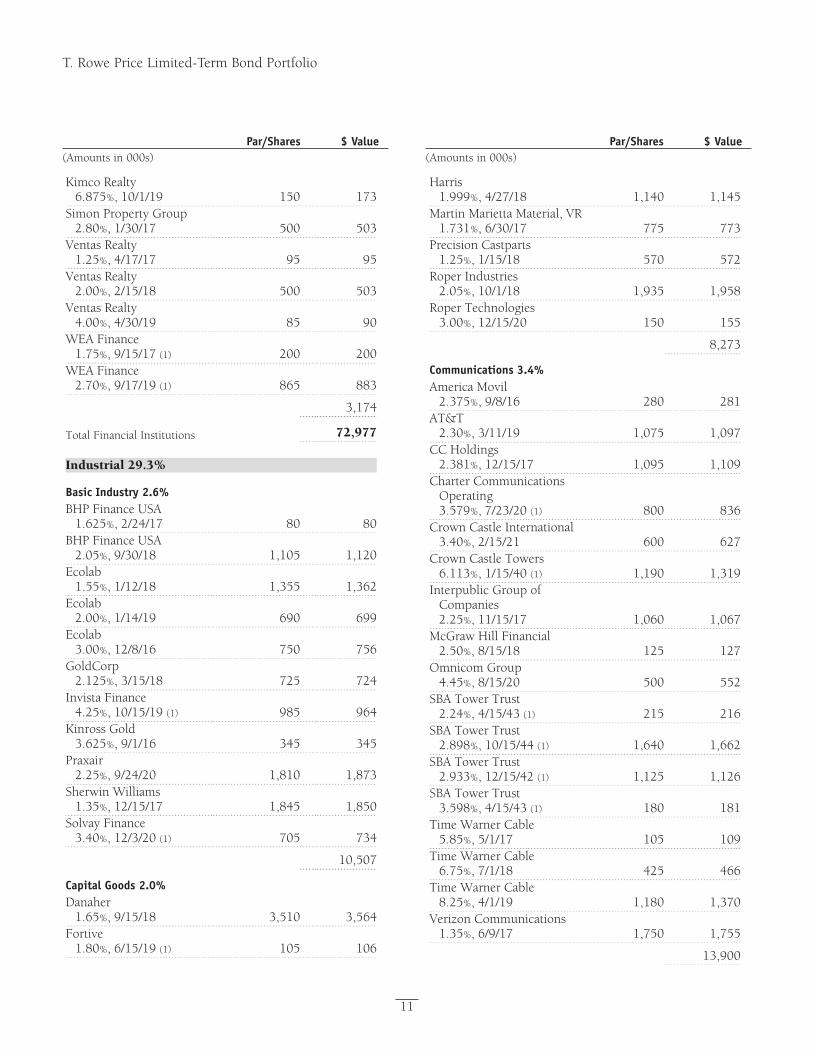
Proof #6
T. Rowe Price Limited-Term Bond Portfolio
Par/Shares $ Value(Amounts in 000s)
Par/Shares $ Value(Amounts in 000s)
11
Kimco Realty 6.875%, 10/1/19 150 173
Simon Property Group 2.80%, 1/30/17 500 503
Ventas Realty 1.25%, 4/17/17 95 95
Ventas Realty 2.00%, 2/15/18 500 503
Ventas Realty 4.00%, 4/30/19 85 90
WEA Finance 1.75%, 9/15/17 (1) 200 200
WEA Finance 2.70%, 9/17/19 (1) 865 883
3,174
Total Financial Institutions 72,977
Industrial 29.3%
Basic Industry 2.6% BHP Finance USA
1.625%, 2/24/17 80 80BHP Finance USA
2.05%, 9/30/18 1,105 1,120Ecolab
1.55%, 1/12/18 1,355 1,362Ecolab
2.00%, 1/14/19 690 699Ecolab
3.00%, 12/8/16 750 756GoldCorp
2.125%, 3/15/18 725 724Invista Finance
4.25%, 10/15/19 (1) 985 964Kinross Gold
3.625%, 9/1/16 345 345Praxair
2.25%, 9/24/20 1,810 1,873Sherwin Williams
1.35%, 12/15/17 1,845 1,850Solvay Finance
3.40%, 12/3/20 (1) 705 734
10,507
Capital Goods 2.0% Danaher
1.65%, 9/15/18 3,510 3,564Fortive
1.80%, 6/15/19 (1) 105 106
Harris1.999%, 4/27/18 1,140 1,145
Martin Marietta Material, VR 1.731%, 6/30/17 775 773
Precision Castparts1.25%, 1/15/18 570 572
Roper Industries2.05%, 10/1/18 1,935 1,958
Roper Technologies3.00%, 12/15/20 150 155
8,273
Communications 3.4% America Movil
2.375%, 9/8/16 280 281AT&T
2.30%, 3/11/19 1,075 1,097CC Holdings
2.381%, 12/15/17 1,095 1,109Charter Communications
Operating 3.579%, 7/23/20 (1) 800 836
Crown Castle International 3.40%, 2/15/21 600 627
Crown Castle Towers6.113%, 1/15/40 (1) 1,190 1,319
Interpublic Group of Companies 2.25%, 11/15/17 1,060 1,067
McGraw Hill Financial2.50%, 8/15/18 125 127
Omnicom Group4.45%, 8/15/20 500 552
SBA Tower Trust2.24%, 4/15/43 (1) 215 216
SBA Tower Trust2.898%, 10/15/44 (1) 1,640 1,662
SBA Tower Trust2.933%, 12/15/42 (1) 1,125 1,126
SBA Tower Trust3.598%, 4/15/43 (1) 180 181
Time Warner Cable5.85%, 5/1/17 105 109
Time Warner Cable6.75%, 7/1/18 425 466
Time Warner Cable8.25%, 4/1/19 1,180 1,370
Verizon Communications1.35%, 6/9/17 1,750 1,755
13,900
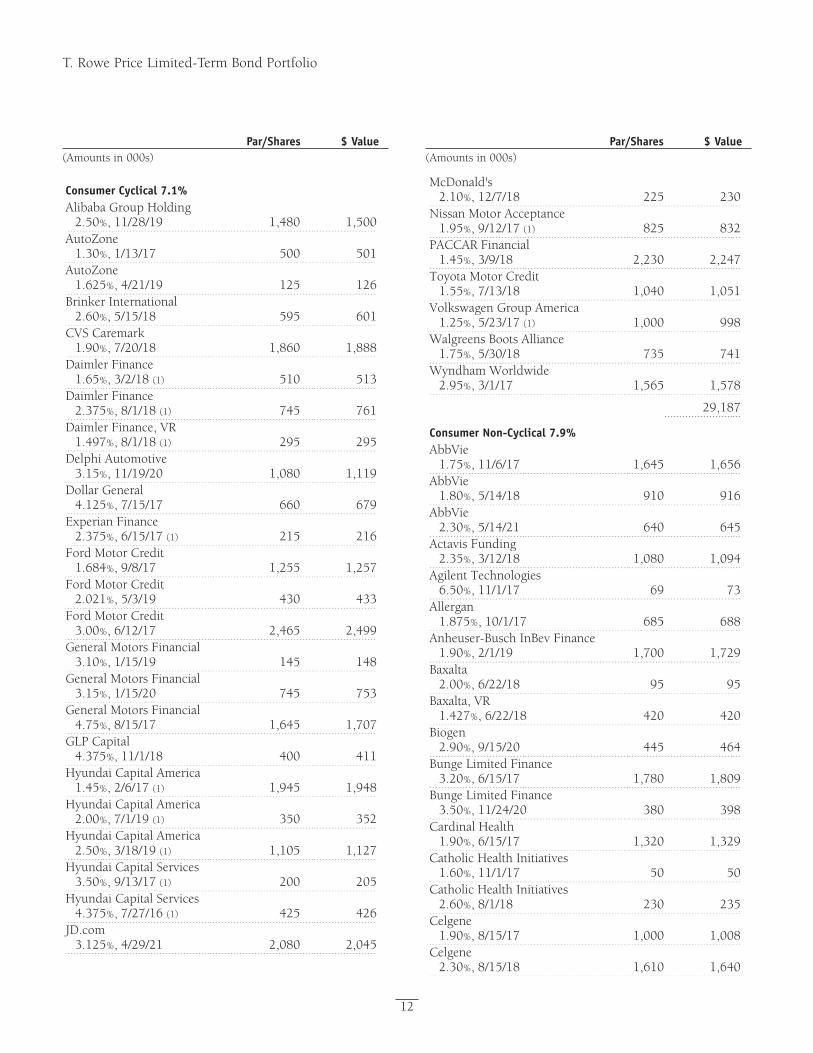
Proof #6
T. Rowe Price Limited-Term Bond Portfolio
Par/Shares $ Value(Amounts in 000s)
Par/Shares $ Value(Amounts in 000s)
12
Consumer Cyclical 7.1% Alibaba Group Holding
2.50%, 11/28/19 1,480 1,500AutoZone
1.30%, 1/13/17 500 501AutoZone
1.625%, 4/21/19 125 126Brinker International
2.60%, 5/15/18 595 601CVS Caremark
1.90%, 7/20/18 1,860 1,888Daimler Finance
1.65%, 3/2/18 (1) 510 513Daimler Finance
2.375%, 8/1/18 (1) 745 761Daimler Finance, VR
1.497%, 8/1/18 (1) 295 295Delphi Automotive
3.15%, 11/19/20 1,080 1,119Dollar General
4.125%, 7/15/17 660 679Experian Finance
2.375%, 6/15/17 (1) 215 216Ford Motor Credit
1.684%, 9/8/17 1,255 1,257Ford Motor Credit
2.021%, 5/3/19 430 433Ford Motor Credit
3.00%, 6/12/17 2,465 2,499General Motors Financial
3.10%, 1/15/19 145 148General Motors Financial
3.15%, 1/15/20 745 753General Motors Financial
4.75%, 8/15/17 1,645 1,707GLP Capital
4.375%, 11/1/18 400 411Hyundai Capital America
1.45%, 2/6/17 (1) 1,945 1,948Hyundai Capital America
2.00%, 7/1/19 (1) 350 352Hyundai Capital America
2.50%, 3/18/19 (1) 1,105 1,127Hyundai Capital Services
3.50%, 9/13/17 (1) 200 205Hyundai Capital Services
4.375%, 7/27/16 (1) 425 426JD.com
3.125%, 4/29/21 2,080 2,045
McDonald's2.10%, 12/7/18 225 230
Nissan Motor Acceptance1.95%, 9/12/17 (1) 825 832
PACCAR Financial1.45%, 3/9/18 2,230 2,247
Toyota Motor Credit1.55%, 7/13/18 1,040 1,051
Volkswagen Group America 1.25%, 5/23/17 (1) 1,000 998
Walgreens Boots Alliance1.75%, 5/30/18 735 741
Wyndham Worldwide2.95%, 3/1/17 1,565 1,578
29,187
Consumer Non-Cyclical 7.9% AbbVie
1.75%, 11/6/17 1,645 1,656AbbVie
1.80%, 5/14/18 910 916AbbVie
2.30%, 5/14/21 640 645Actavis Funding
2.35%, 3/12/18 1,080 1,094Agilent Technologies
6.50%, 11/1/17 69 73Allergan
1.875%, 10/1/17 685 688Anheuser-Busch InBev Finance
1.90%, 2/1/19 1,700 1,729Baxalta
2.00%, 6/22/18 95 95Baxalta, VR
1.427%, 6/22/18 420 420Biogen
2.90%, 9/15/20 445 464Bunge Limited Finance
3.20%, 6/15/17 1,780 1,809Bunge Limited Finance
3.50%, 11/24/20 380 398Cardinal Health
1.90%, 6/15/17 1,320 1,329Catholic Health Initiatives
1.60%, 11/1/17 50 50Catholic Health Initiatives
2.60%, 8/1/18 230 235Celgene
1.90%, 8/15/17 1,000 1,008Celgene
2.30%, 8/15/18 1,610 1,640
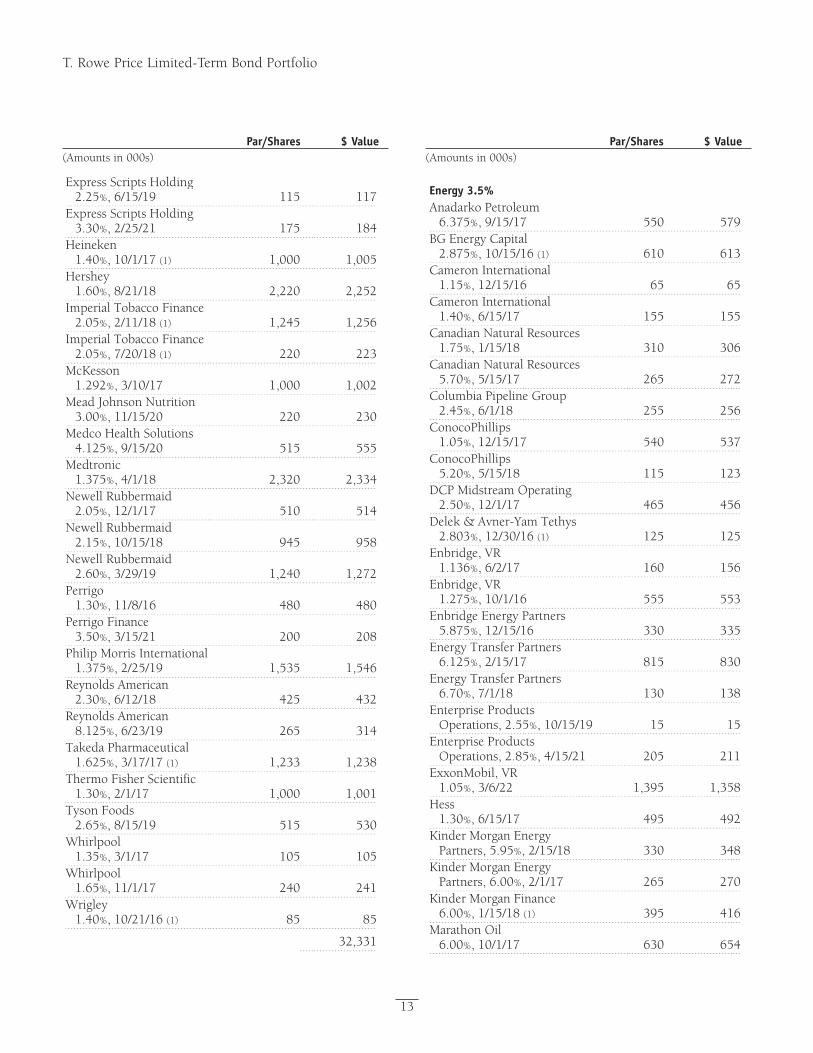
Proof #6
T. Rowe Price Limited-Term Bond Portfolio
Par/Shares $ Value(Amounts in 000s)
Par/Shares $ Value(Amounts in 000s)
13
Express Scripts Holding 2.25%, 6/15/19 115 117
Express Scripts Holding 3.30%, 2/25/21 175 184
Heineken 1.40%, 10/1/17 (1) 1,000 1,005
Hershey 1.60%, 8/21/18 2,220 2,252
Imperial Tobacco Finance 2.05%, 2/11/18 (1) 1,245 1,256
Imperial Tobacco Finance 2.05%, 7/20/18 (1) 220 223
McKesson 1.292%, 3/10/17 1,000 1,002
Mead Johnson Nutrition 3.00%, 11/15/20 220 230
Medco Health Solutions 4.125%, 9/15/20 515 555
Medtronic 1.375%, 4/1/18 2,320 2,334
Newell Rubbermaid 2.05%, 12/1/17 510 514
Newell Rubbermaid 2.15%, 10/15/18 945 958
Newell Rubbermaid 2.60%, 3/29/19 1,240 1,272
Perrigo 1.30%, 11/8/16 480 480
Perrigo Finance 3.50%, 3/15/21 200 208
Philip Morris International 1.375%, 2/25/19 1,535 1,546
Reynolds American 2.30%, 6/12/18 425 432
Reynolds American 8.125%, 6/23/19 265 314
Takeda Pharmaceutical 1.625%, 3/17/17 (1) 1,233 1,238
Thermo Fisher Scientific 1.30%, 2/1/17 1,000 1,001
Tyson Foods 2.65%, 8/15/19 515 530
Whirlpool 1.35%, 3/1/17 105 105
Whirlpool 1.65%, 11/1/17 240 241
Wrigley 1.40%, 10/21/16 (1) 85 85
32,331
Energy 3.5% Anadarko Petroleum
6.375%, 9/15/17 550 579BG Energy Capital
2.875%, 10/15/16 (1) 610 613Cameron International
1.15%, 12/15/16 65 65Cameron International
1.40%, 6/15/17 155 155Canadian Natural Resources
1.75%, 1/15/18 310 306Canadian Natural Resources
5.70%, 5/15/17 265 272Columbia Pipeline Group
2.45%, 6/1/18 255 256ConocoPhillips
1.05%, 12/15/17 540 537ConocoPhillips
5.20%, 5/15/18 115 123DCP Midstream Operating
2.50%, 12/1/17 465 456Delek & Avner-Yam Tethys
2.803%, 12/30/16 (1) 125 125Enbridge, VR
1.136%, 6/2/17 160 156Enbridge, VR
1.275%, 10/1/16 555 553Enbridge Energy Partners
5.875%, 12/15/16 330 335Energy Transfer Partners
6.125%, 2/15/17 815 830Energy Transfer Partners
6.70%, 7/1/18 130 138Enterprise Products
Operations, 2.55%, 10/15/19 15 15Enterprise Products
Operations, 2.85%, 4/15/21 205 211ExxonMobil, VR
1.05%, 3/6/22 1,395 1,358Hess
1.30%, 6/15/17 495 492Kinder Morgan Energy
Partners, 5.95%, 2/15/18 330 348Kinder Morgan Energy
Partners, 6.00%, 2/1/17 265 270Kinder Morgan Finance
6.00%, 1/15/18 (1) 395 416Marathon Oil
6.00%, 10/1/17 630 654
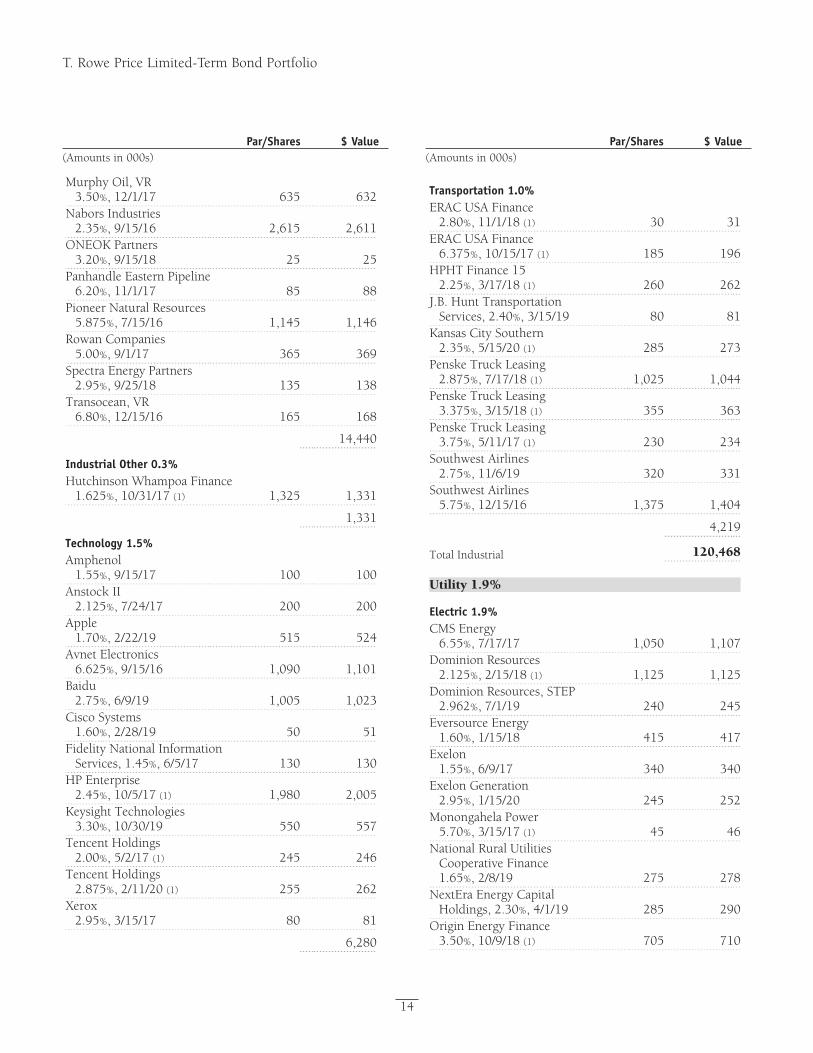
Proof #6
T. Rowe Price Limited-Term Bond Portfolio
Par/Shares $ Value(Amounts in 000s)
Par/Shares $ Value(Amounts in 000s)
14
Murphy Oil, VR 3.50%, 12/1/17 635 632
Nabors Industries 2.35%, 9/15/16 2,615 2,611
ONEOK Partners 3.20%, 9/15/18 25 25
Panhandle Eastern Pipeline 6.20%, 11/1/17 85 88
Pioneer Natural Resources 5.875%, 7/15/16 1,145 1,146
Rowan Companies 5.00%, 9/1/17 365 369
Spectra Energy Partners 2.95%, 9/25/18 135 138
Transocean, VR 6.80%, 12/15/16 165 168
14,440
Industrial Other 0.3% Hutchinson Whampoa Finance
1.625%, 10/31/17 (1) 1,325 1,331
1,331
Technology 1.5% Amphenol
1.55%, 9/15/17 100 100Anstock II
2.125%, 7/24/17 200 200Apple
1.70%, 2/22/19 515 524Avnet Electronics
6.625%, 9/15/16 1,090 1,101Baidu
2.75%, 6/9/19 1,005 1,023Cisco Systems
1.60%, 2/28/19 50 51Fidelity National Information
Services, 1.45%, 6/5/17 130 130HP Enterprise
2.45%, 10/5/17 (1) 1,980 2,005Keysight Technologies
3.30%, 10/30/19 550 557Tencent Holdings
2.00%, 5/2/17 (1) 245 246Tencent Holdings
2.875%, 2/11/20 (1) 255 262Xerox
2.95%, 3/15/17 80 81
6,280
Transportation 1.0% ERAC USA Finance
2.80%, 11/1/18 (1) 30 31ERAC USA Finance
6.375%, 10/15/17 (1) 185 196HPHT Finance 15
2.25%, 3/17/18 (1) 260 262J.B. Hunt Transportation
Services, 2.40%, 3/15/19 80 81Kansas City Southern
2.35%, 5/15/20 (1) 285 273Penske Truck Leasing
2.875%, 7/17/18 (1) 1,025 1,044Penske Truck Leasing
3.375%, 3/15/18 (1) 355 363Penske Truck Leasing
3.75%, 5/11/17 (1) 230 234Southwest Airlines
2.75%, 11/6/19 320 331Southwest Airlines
5.75%, 12/15/16 1,375 1,404
4,219
Total Industrial 120,468
Utility 1.9%
Electric 1.9% CMS Energy
6.55%, 7/17/17 1,050 1,107Dominion Resources
2.125%, 2/15/18 (1) 1,125 1,125Dominion Resources, STEP
2.962%, 7/1/19 240 245Eversource Energy
1.60%, 1/15/18 415 417Exelon
1.55%, 6/9/17 340 340Exelon Generation
2.95%, 1/15/20 245 252Monongahela Power
5.70%, 3/15/17 (1) 45 46National Rural Utilities
Cooperative Finance 1.65%, 2/8/19 275 278
NextEra Energy Capital Holdings, 2.30%, 4/1/19 285 290
Origin Energy Finance3.50%, 10/9/18 (1) 705 710
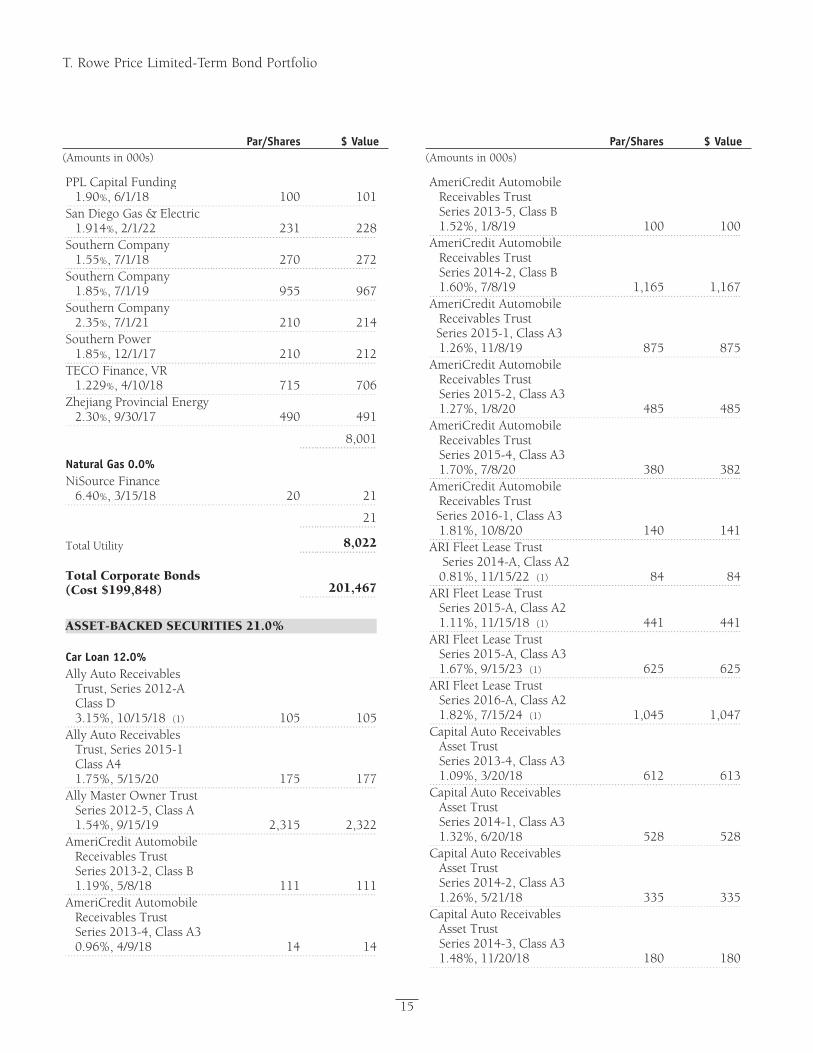
Proof #6
T. Rowe Price Limited-Term Bond Portfolio
Par/Shares $ Value(Amounts in 000s)
Par/Shares $ Value(Amounts in 000s)
15
PPL Capital Funding 1.90%, 6/1/18 100 101
San Diego Gas & Electric 1.914%, 2/1/22 231 228
Southern Company 1.55%, 7/1/18 270 272
Southern Company 1.85%, 7/1/19 955 967
Southern Company 2.35%, 7/1/21 210 214
Southern Power 1.85%, 12/1/17 210 212
TECO Finance, VR 1.229%, 4/10/18 715 706
Zhejiang Provincial Energy 2.30%, 9/30/17 490 491
8,001
Natural Gas 0.0% NiSource Finance
6.40%, 3/15/18 20 21
21
Total Utility 8,022
Total Corporate Bonds (Cost $199,848) 201,467
ASSET-BACKED SECURITIES 21.0%
Car Loan 12.0% Ally Auto Receivables
Trust, Series 2012-A Class D 3.15%, 10/15/18 (1) 105 105
Ally Auto Receivables Trust, Series 2015-1 Class A4 1.75%, 5/15/20 175 177
Ally Master Owner Trust Series 2012-5, Class A 1.54%, 9/15/19 2,315 2,322
AmeriCredit Automobile Receivables Trust Series 2013-2, Class B 1.19%, 5/8/18 111 111
AmeriCredit Automobile Receivables Trust Series 2013-4, Class A3 0.96%, 4/9/18 14 14
AmeriCredit Automobile Receivables Trust Series 2013-5, Class B 1.52%, 1/8/19 100 100
AmeriCredit Automobile Receivables Trust Series 2014-2, Class B 1.60%, 7/8/19 1,165 1,167
AmeriCredit Automobile Receivables Trust
Series 2015-1, Class A3 1.26%, 11/8/19 875 875
AmeriCredit Automobile Receivables Trust Series 2015-2, Class A3 1.27%, 1/8/20 485 485
AmeriCredit Automobile Receivables Trust Series 2015-4, Class A3 1.70%, 7/8/20 380 382
AmeriCredit Automobile Receivables Trust
Series 2016-1, Class A3 1.81%, 10/8/20 140 141
ARI Fleet Lease Trust Series 2014-A, Class A2 0.81%, 11/15/22 (1) 84 84
ARI Fleet Lease TrustSeries 2015-A, Class A21.11%, 11/15/18 (1) 441 441
ARI Fleet Lease TrustSeries 2015-A, Class A31.67%, 9/15/23 (1) 625 625
ARI Fleet Lease TrustSeries 2016-A, Class A21.82%, 7/15/24 (1) 1,045 1,047
Capital Auto Receivables Asset Trust Series 2013-4, Class A3 1.09%, 3/20/18 612 613
Capital Auto ReceivablesAsset Trust Series 2014-1, Class A3 1.32%, 6/20/18 528 528
Capital Auto Receivables Asset Trust Series 2014-2, Class A3 1.26%, 5/21/18 335 335
Capital Auto Receivables Asset Trust Series 2014-3, Class A3 1.48%, 11/20/18 180 180
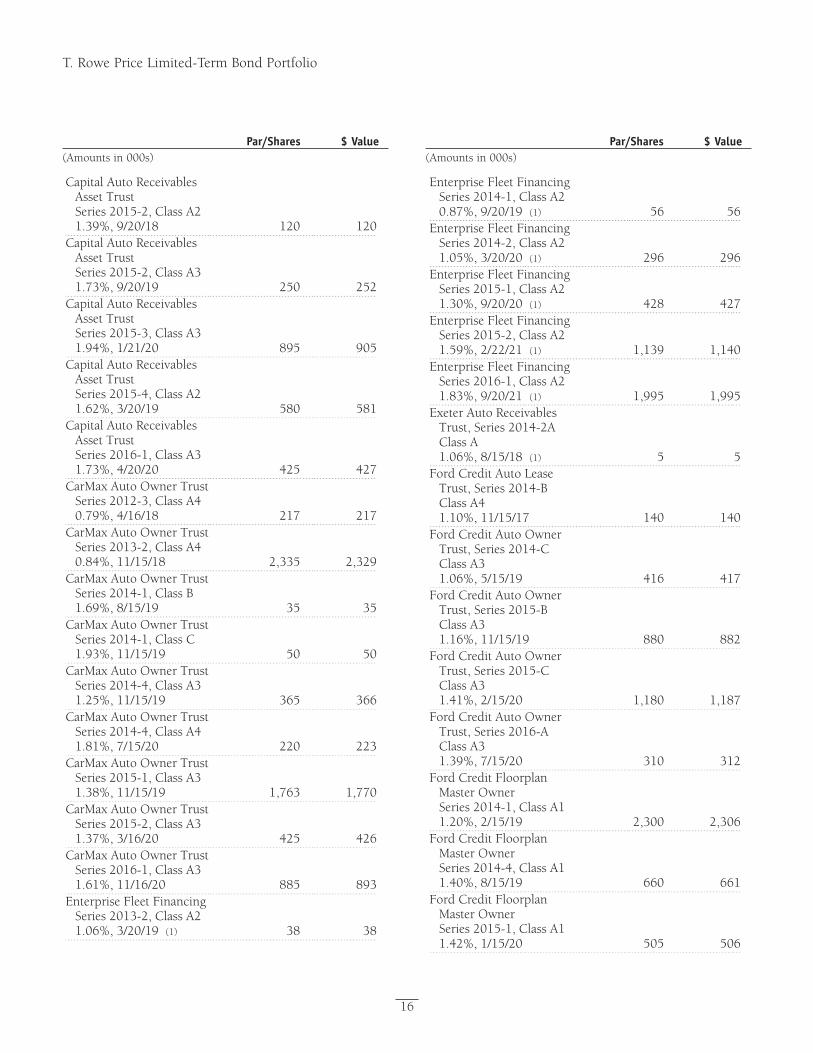
Proof #6
T. Rowe Price Limited-Term Bond Portfolio
Par/Shares $ Value(Amounts in 000s)
Par/Shares $ Value(Amounts in 000s)
16
Capital Auto Receivables Asset Trust Series 2015-2, Class A2 1.39%, 9/20/18 120 120
Capital Auto Receivables Asset Trust Series 2015-2, Class A3 1.73%, 9/20/19 250 252
Capital Auto Receivables Asset Trust Series 2015-3, Class A3 1.94%, 1/21/20 895 905
Capital Auto Receivables Asset Trust Series 2015-4, Class A2 1.62%, 3/20/19 580 581
Capital Auto Receivables Asset Trust Series 2016-1, Class A3 1.73%, 4/20/20 425 427
CarMax Auto Owner Trust Series 2012-3, Class A4 0.79%, 4/16/18 217 217
CarMax Auto Owner Trust Series 2013-2, Class A4 0.84%, 11/15/18 2,335 2,329
CarMax Auto Owner Trust Series 2014-1, Class B 1.69%, 8/15/19 35 35
CarMax Auto Owner Trust Series 2014-1, Class C 1.93%, 11/15/19 50 50
CarMax Auto Owner Trust Series 2014-4, Class A3 1.25%, 11/15/19 365 366
CarMax Auto Owner Trust Series 2014-4, Class A4 1.81%, 7/15/20 220 223
CarMax Auto Owner Trust Series 2015-1, Class A3 1.38%, 11/15/19 1,763 1,770
CarMax Auto Owner Trust Series 2015-2, Class A3 1.37%, 3/16/20 425 426
CarMax Auto Owner Trust Series 2016-1, Class A3 1.61%, 11/16/20 885 893
Enterprise Fleet Financing Series 2013-2, Class A2 1.06%, 3/20/19 (1) 38 38
Enterprise Fleet Financing Series 2014-1, Class A2 0.87%, 9/20/19 (1) 56 56
Enterprise Fleet Financing Series 2014-2, Class A2 1.05%, 3/20/20 (1) 296 296
Enterprise Fleet Financing Series 2015-1, Class A2 1.30%, 9/20/20 (1) 428 427
Enterprise Fleet Financing Series 2015-2, Class A2 1.59%, 2/22/21 (1) 1,139 1,140
Enterprise Fleet Financing Series 2016-1, Class A2 1.83%, 9/20/21 (1) 1,995 1,995
Exeter Auto Receivables Trust, Series 2014-2A Class A 1.06%, 8/15/18 (1) 5 5
Ford Credit Auto Lease Trust, Series 2014-B Class A4 1.10%, 11/15/17 140 140
Ford Credit Auto Owner Trust, Series 2014-C Class A3 1.06%, 5/15/19 416 417
Ford Credit Auto Owner Trust, Series 2015-B Class A3 1.16%, 11/15/19 880 882
Ford Credit Auto Owner Trust, Series 2015-C Class A3 1.41%, 2/15/20 1,180 1,187
Ford Credit Auto Owner Trust, Series 2016-A Class A3 1.39%, 7/15/20 310 312
Ford Credit Floorplan Master Owner Series 2014-1, Class A1 1.20%, 2/15/19 2,300 2,306
Ford Credit Floorplan Master Owner Series 2014-4, Class A1 1.40%, 8/15/19 660 661
Ford Credit Floorplan Master Owner Series 2015-1, Class A1 1.42%, 1/15/20 505 506
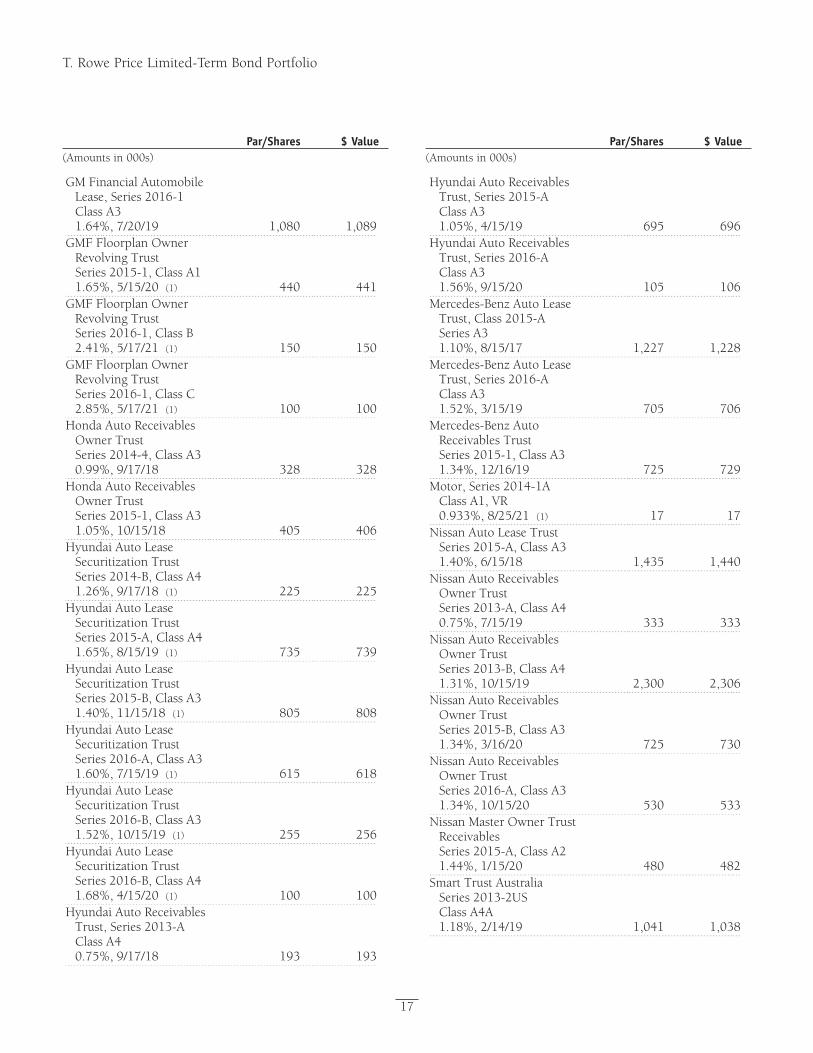
Proof #6
T. Rowe Price Limited-Term Bond Portfolio
Par/Shares $ Value(Amounts in 000s)
Par/Shares $ Value(Amounts in 000s)
17
GM Financial Automobile Lease, Series 2016-1 Class A3 1.64%, 7/20/19 1,080 1,089
GMF Floorplan Owner Revolving Trust Series 2015-1, Class A1 1.65%, 5/15/20 (1) 440 441
GMF Floorplan Owner Revolving Trust Series 2016-1, Class B 2.41%, 5/17/21 (1) 150 150
GMF Floorplan Owner Revolving Trust Series 2016-1, Class C 2.85%, 5/17/21 (1) 100 100
Honda Auto Receivables Owner Trust Series 2014-4, Class A3 0.99%, 9/17/18 328 328
Honda Auto Receivables Owner Trust Series 2015-1, Class A3 1.05%, 10/15/18 405 406
Hyundai Auto Lease Securitization Trust Series 2014-B, Class A4 1.26%, 9/17/18 (1) 225 225
Hyundai Auto Lease Securitization Trust Series 2015-A, Class A4 1.65%, 8/15/19 (1) 735 739
Hyundai Auto Lease Securitization Trust Series 2015-B, Class A3 1.40%, 11/15/18 (1) 805 808
Hyundai Auto Lease Securitization Trust Series 2016-A, Class A3 1.60%, 7/15/19 (1) 615 618
Hyundai Auto Lease Securitization Trust Series 2016-B, Class A3 1.52%, 10/15/19 (1) 255 256
Hyundai Auto Lease Securitization Trust Series 2016-B, Class A4 1.68%, 4/15/20 (1) 100 100
Hyundai Auto Receivables Trust, Series 2013-A Class A4 0.75%, 9/17/18 193 193
Hyundai Auto Receivables Trust, Series 2015-A Class A3 1.05%, 4/15/19 695 696
Hyundai Auto Receivables Trust, Series 2016-A Class A3 1.56%, 9/15/20 105 106
Mercedes-Benz Auto Lease Trust, Class 2015-A Series A3 1.10%, 8/15/17 1,227 1,228
Mercedes-Benz Auto Lease Trust, Series 2016-A Class A3 1.52%, 3/15/19 705 706
Mercedes-Benz Auto Receivables Trust Series 2015-1, Class A3 1.34%, 12/16/19 725 729
Motor, Series 2014-1A Class A1, VR 0.933%, 8/25/21 (1) 17 17
Nissan Auto Lease Trust Series 2015-A, Class A31.40%, 6/15/18 1,435 1,440
Nissan Auto Receivables Owner Trust Series 2013-A, Class A40.75%, 7/15/19 333 333
Nissan Auto Receivables Owner Trust Series 2013-B, Class A4 1.31%, 10/15/19 2,300 2,306
Nissan Auto Receivables Owner Trust Series 2015-B, Class A3 1.34%, 3/16/20 725 730
Nissan Auto Receivables Owner Trust Series 2016-A, Class A31.34%, 10/15/20 530 533
Nissan Master Owner Trust Receivables Series 2015-A, Class A21.44%, 1/15/20 480 482
Smart Trust AustraliaSeries 2013-2US Class A4A 1.18%, 2/14/19 1,041 1,038
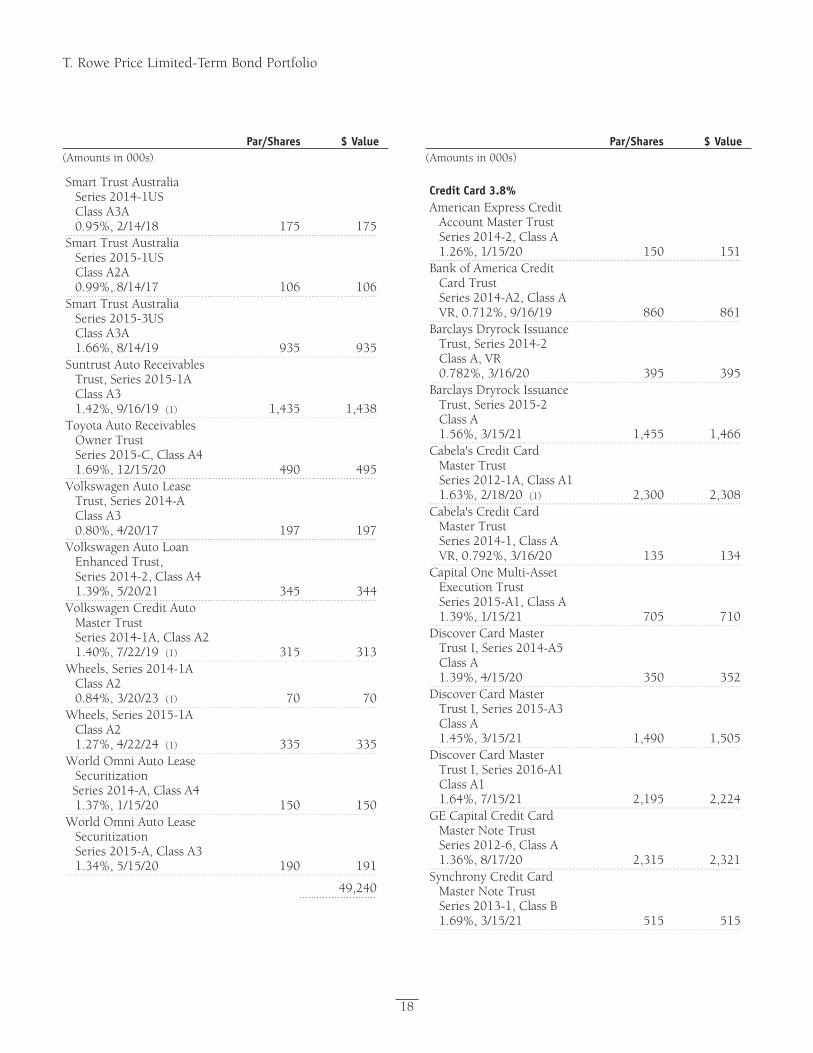
Proof #6
T. Rowe Price Limited-Term Bond Portfolio
Par/Shares $ Value(Amounts in 000s)
Par/Shares $ Value(Amounts in 000s)
18
Smart Trust Australia Series 2014-1US Class A3A 0.95%, 2/14/18 175 175
Smart Trust Australia Series 2015-1US Class A2A 0.99%, 8/14/17 106 106
Smart Trust Australia Series 2015-3US Class A3A 1.66%, 8/14/19 935 935
Suntrust Auto Receivables Trust, Series 2015-1A Class A3 1.42%, 9/16/19 (1) 1,435 1,438
Toyota Auto Receivables Owner Trust Series 2015-C, Class A4 1.69%, 12/15/20 490 495
Volkswagen Auto Lease Trust, Series 2014-A Class A3 0.80%, 4/20/17 197 197
Volkswagen Auto Loan Enhanced Trust, Series 2014-2, Class A4 1.39%, 5/20/21 345 344
Volkswagen Credit Auto Master Trust Series 2014-1A, Class A2 1.40%, 7/22/19 (1) 315 313
Wheels, Series 2014-1A Class A2 0.84%, 3/20/23 (1) 70 70
Wheels, Series 2015-1A Class A2 1.27%, 4/22/24 (1) 335 335
World Omni Auto Lease Securitization
Series 2014-A, Class A4 1.37%, 1/15/20 150 150
World Omni Auto Lease Securitization Series 2015-A, Class A3 1.34%, 5/15/20 190 191
49,240
Credit Card 3.8% American Express Credit
Account Master Trust Series 2014-2, Class A 1.26%, 1/15/20 150 151
Bank of America Credit Card Trust Series 2014-A2, Class A VR, 0.712%, 9/16/19 860 861
Barclays Dryrock Issuance Trust, Series 2014-2 Class A, VR 0.782%, 3/16/20 395 395
Barclays Dryrock Issuance Trust, Series 2015-2 Class A 1.56%, 3/15/21 1,455 1,466
Cabela's Credit Card Master Trust Series 2012-1A, Class A1 1.63%, 2/18/20 (1) 2,300 2,308
Cabela's Credit Card Master Trust Series 2014-1, Class A VR, 0.792%, 3/16/20 135 134
Capital One Multi-Asset Execution Trust Series 2015-A1, Class A1.39%, 1/15/21 705 710
Discover Card Master Trust I, Series 2014-A5 Class A 1.39%, 4/15/20 350 352
Discover Card Master Trust I, Series 2015-A3 Class A 1.45%, 3/15/21 1,490 1,505
Discover Card Master Trust I, Series 2016-A1 Class A1 1.64%, 7/15/21 2,195 2,224
GE Capital Credit Card Master Note Trust Series 2012-6, Class A 1.36%, 8/17/20 2,315 2,321
Synchrony Credit Card Master Note Trust Series 2013-1, Class B 1.69%, 3/15/21 515 515
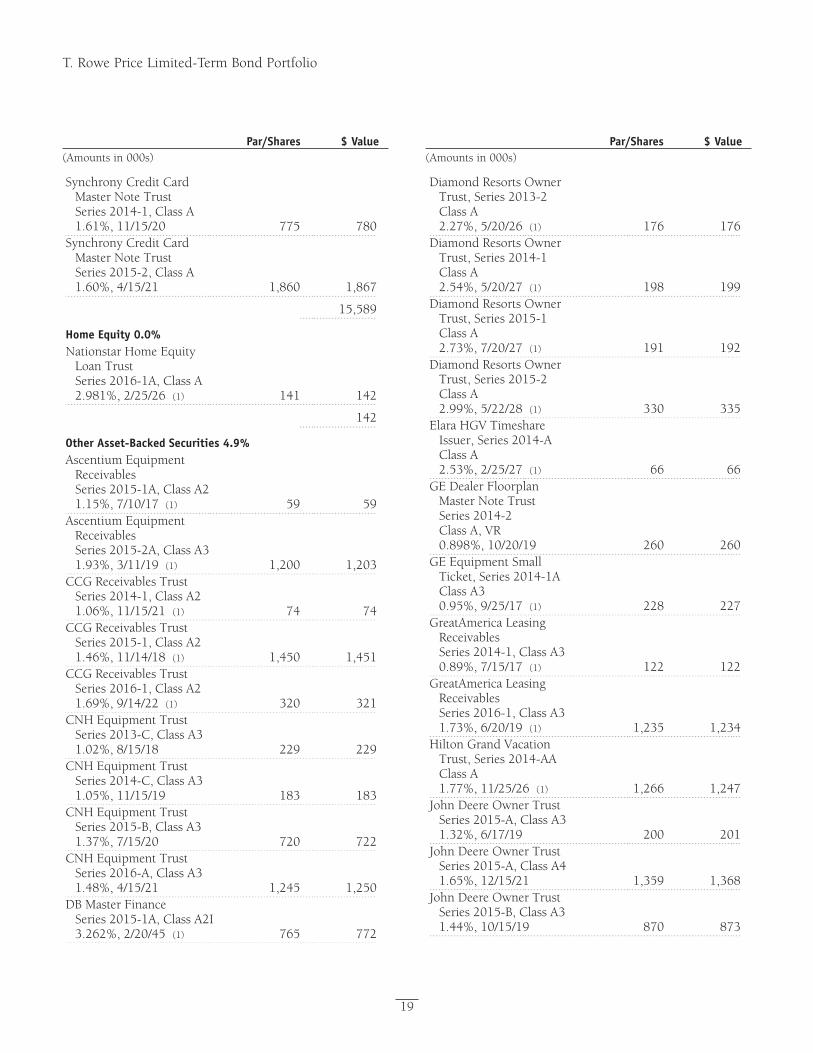
Proof #6
T. Rowe Price Limited-Term Bond Portfolio
Par/Shares $ Value(Amounts in 000s)
Par/Shares $ Value(Amounts in 000s)
19
Synchrony Credit Card Master Note Trust Series 2014-1, Class A 1.61%, 11/15/20 775 780
Synchrony Credit Card Master Note Trust Series 2015-2, Class A 1.60%, 4/15/21 1,860 1,867
15,589
Home Equity 0.0% Nationstar Home Equity
Loan Trust Series 2016-1A, Class A 2.981%, 2/25/26 (1) 141 142
142
Other Asset-Backed Securities 4.9% Ascentium Equipment
Receivables Series 2015-1A, Class A2 1.15%, 7/10/17 (1) 59 59
Ascentium Equipment Receivables Series 2015-2A, Class A3 1.93%, 3/11/19 (1) 1,200 1,203
CCG Receivables Trust Series 2014-1, Class A2 1.06%, 11/15/21 (1) 74 74
CCG Receivables Trust Series 2015-1, Class A2 1.46%, 11/14/18 (1) 1,450 1,451
CCG Receivables Trust Series 2016-1, Class A2 1.69%, 9/14/22 (1) 320 321
CNH Equipment Trust Series 2013-C, Class A3 1.02%, 8/15/18 229 229
CNH Equipment Trust Series 2014-C, Class A3 1.05%, 11/15/19 183 183
CNH Equipment Trust Series 2015-B, Class A3 1.37%, 7/15/20 720 722
CNH Equipment Trust Series 2016-A, Class A3 1.48%, 4/15/21 1,245 1,250
DB Master Finance Series 2015-1A, Class A2I 3.262%, 2/20/45 (1) 765 772
Diamond Resorts Owner Trust, Series 2013-2 Class A 2.27%, 5/20/26 (1) 176 176
Diamond Resorts Owner Trust, Series 2014-1 Class A 2.54%, 5/20/27 (1) 198 199
Diamond Resorts Owner Trust, Series 2015-1 Class A 2.73%, 7/20/27 (1) 191 192
Diamond Resorts Owner Trust, Series 2015-2 Class A 2.99%, 5/22/28 (1) 330 335
Elara HGV Timeshare Issuer, Series 2014-A Class A 2.53%, 2/25/27 (1) 66 66
GE Dealer Floorplan Master Note Trust Series 2014-2 Class A, VR 0.898%, 10/20/19 260 260
GE Equipment Small Ticket, Series 2014-1A Class A3 0.95%, 9/25/17 (1) 228 227
GreatAmerica Leasing Receivables Series 2014-1, Class A3 0.89%, 7/15/17 (1) 122 122
GreatAmerica Leasing Receivables Series 2016-1, Class A3 1.73%, 6/20/19 (1) 1,235 1,234
Hilton Grand Vacation Trust, Series 2014-AA Class A 1.77%, 11/25/26 (1) 1,266 1,247
John Deere Owner Trust Series 2015-A, Class A31.32%, 6/17/19 200 201
John Deere Owner Trust Series 2015-A, Class A41.65%, 12/15/21 1,359 1,368
John Deere Owner Trust Series 2015-B, Class A3 1.44%, 10/15/19 870 873
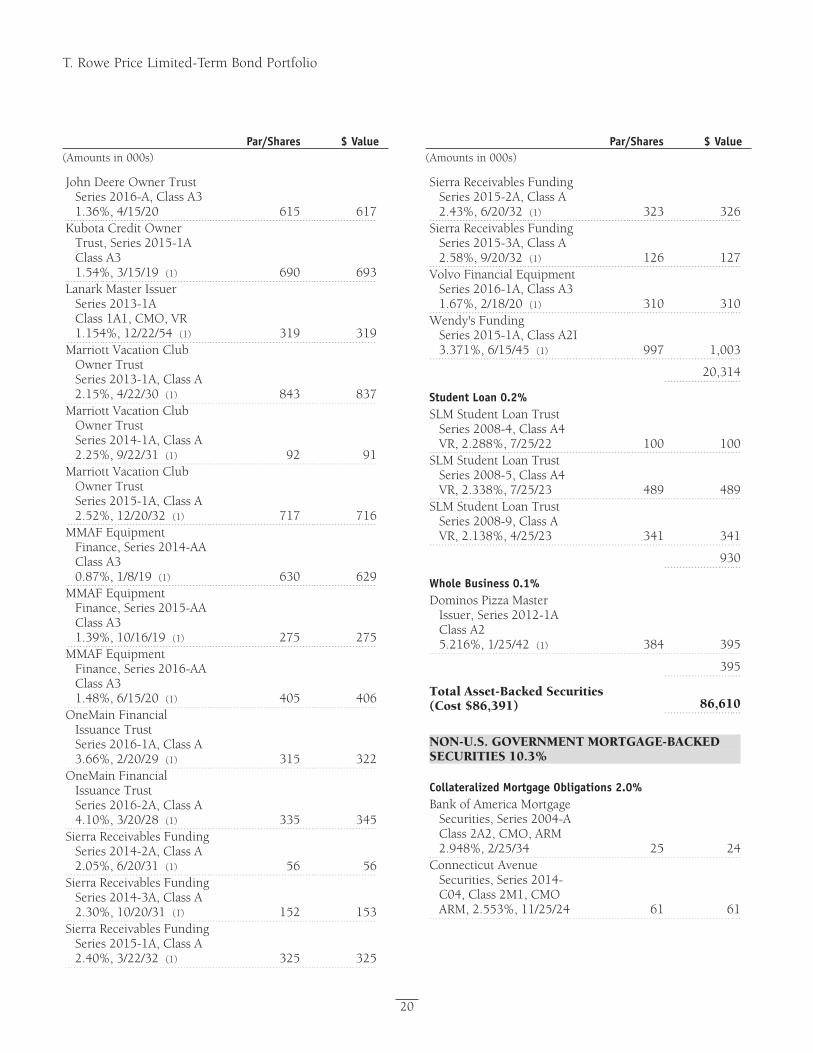
Proof #6
T. Rowe Price Limited-Term Bond Portfolio
Par/Shares $ Value(Amounts in 000s)
Par/Shares $ Value(Amounts in 000s)
20
John Deere Owner Trust Series 2016-A, Class A3 1.36%, 4/15/20 615 617
Kubota Credit Owner Trust, Series 2015-1A Class A3 1.54%, 3/15/19 (1) 690 693
Lanark Master Issuer Series 2013-1A Class 1A1, CMO, VR 1.154%, 12/22/54 (1) 319 319
Marriott Vacation Club Owner Trust Series 2013-1A, Class A 2.15%, 4/22/30 (1) 843 837
Marriott Vacation Club Owner Trust Series 2014-1A, Class A 2.25%, 9/22/31 (1) 92 91
Marriott Vacation Club Owner Trust Series 2015-1A, Class A 2.52%, 12/20/32 (1) 717 716
MMAF Equipment Finance, Series 2014-AA Class A3 0.87%, 1/8/19 (1) 630 629
MMAF Equipment Finance, Series 2015-AA Class A3 1.39%, 10/16/19 (1) 275 275
MMAF Equipment Finance, Series 2016-AA Class A3 1.48%, 6/15/20 (1) 405 406
OneMain Financial Issuance Trust Series 2016-1A, Class A 3.66%, 2/20/29 (1) 315 322
OneMain Financial Issuance Trust Series 2016-2A, Class A 4.10%, 3/20/28 (1) 335 345
Sierra Receivables Funding Series 2014-2A, Class A 2.05%, 6/20/31 (1) 56 56
Sierra Receivables Funding Series 2014-3A, Class A 2.30%, 10/20/31 (1) 152 153
Sierra Receivables Funding Series 2015-1A, Class A 2.40%, 3/22/32 (1) 325 325
Sierra Receivables Funding Series 2015-2A, Class A2.43%, 6/20/32 (1) 323 326
Sierra Receivables Funding Series 2015-3A, Class A2.58%, 9/20/32 (1) 126 127
Volvo Financial Equipment Series 2016-1A, Class A3 1.67%, 2/18/20 (1) 310 310
Wendy's FundingSeries 2015-1A, Class A2I 3.371%, 6/15/45 (1) 997 1,003
20,314
Student Loan 0.2% SLM Student Loan Trust
Series 2008-4, Class A4 VR, 2.288%, 7/25/22 100 100
SLM Student Loan Trust Series 2008-5, Class A4 VR, 2.338%, 7/25/23 489 489
SLM Student Loan Trust Series 2008-9, Class A VR, 2.138%, 4/25/23 341 341
930
Whole Business 0.1% Dominos Pizza Master
Issuer, Series 2012-1A Class A2 5.216%, 1/25/42 (1) 384 395
395
Total Asset-Backed Securities (Cost $86,391) 86,610
NON-U.S. GOVERNMENT MORTGAGE-BACKED SECURITIES 10.3%
Collateralized Mortgage Obligations 2.0% Bank of America Mortgage
Securities, Series 2004-A Class 2A2, CMO, ARM 2.948%, 2/25/34 25 24
Connecticut Avenue Securities, Series 2014-C04, Class 2M1, CMO ARM, 2.553%, 11/25/24 61 61
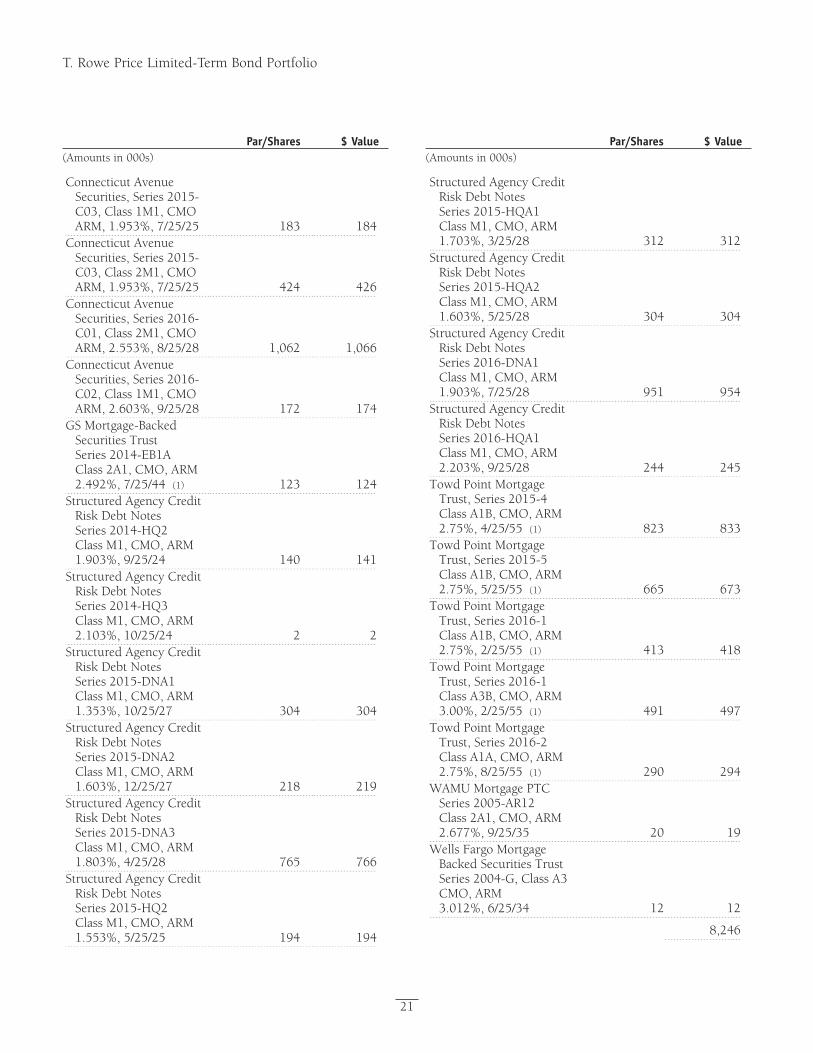
Proof #6
T. Rowe Price Limited-Term Bond Portfolio
Par/Shares $ Value(Amounts in 000s)
Par/Shares $ Value(Amounts in 000s)
21
Connecticut Avenue Securities, Series 2015-C03, Class 1M1, CMO ARM, 1.953%, 7/25/25 183 184
Connecticut Avenue Securities, Series 2015-C03, Class 2M1, CMO ARM, 1.953%, 7/25/25 424 426
Connecticut Avenue Securities, Series 2016-C01, Class 2M1, CMO ARM, 2.553%, 8/25/28 1,062 1,066
Connecticut Avenue Securities, Series 2016-C02, Class 1M1, CMO ARM, 2.603%, 9/25/28 172 174
GS Mortgage-Backed Securities Trust Series 2014-EB1A Class 2A1, CMO, ARM 2.492%, 7/25/44 (1) 123 124
Structured Agency Credit Risk Debt Notes Series 2014-HQ2 Class M1, CMO, ARM 1.903%, 9/25/24 140 141
Structured Agency Credit Risk Debt Notes Series 2014-HQ3 Class M1, CMO, ARM 2.103%, 10/25/24 2 2
Structured Agency Credit Risk Debt Notes Series 2015-DNA1 Class M1, CMO, ARM 1.353%, 10/25/27 304 304
Structured Agency Credit Risk Debt Notes Series 2015-DNA2 Class M1, CMO, ARM 1.603%, 12/25/27 218 219
Structured Agency Credit Risk Debt Notes Series 2015-DNA3 Class M1, CMO, ARM 1.803%, 4/25/28 765 766
Structured Agency Credit Risk Debt Notes Series 2015-HQ2 Class M1, CMO, ARM 1.553%, 5/25/25 194 194
Structured Agency Credit Risk Debt Notes Series 2015-HQA1 Class M1, CMO, ARM 1.703%, 3/25/28 312 312
Structured Agency Credit Risk Debt Notes Series 2015-HQA2 Class M1, CMO, ARM 1.603%, 5/25/28 304 304
Structured Agency Credit Risk Debt Notes Series 2016-DNA1 Class M1, CMO, ARM 1.903%, 7/25/28 951 954
Structured Agency Credit Risk Debt Notes Series 2016-HQA1 Class M1, CMO, ARM 2.203%, 9/25/28 244 245
Towd Point Mortgage Trust, Series 2015-4 Class A1B, CMO, ARM 2.75%, 4/25/55 (1) 823 833
Towd Point Mortgage Trust, Series 2015-5 Class A1B, CMO, ARM 2.75%, 5/25/55 (1) 665 673
Towd Point Mortgage Trust, Series 2016-1 Class A1B, CMO, ARM 2.75%, 2/25/55 (1) 413 418
Towd Point Mortgage Trust, Series 2016-1 Class A3B, CMO, ARM 3.00%, 2/25/55 (1) 491 497
Towd Point Mortgage Trust, Series 2016-2 Class A1A, CMO, ARM 2.75%, 8/25/55 (1) 290 294
WAMU Mortgage PTC Series 2005-AR12 Class 2A1, CMO, ARM 2.677%, 9/25/35 20 19
Wells Fargo Mortgage Backed Securities Trust Series 2004-G, Class A3 CMO, ARM 3.012%, 6/25/34 12 12
8,246
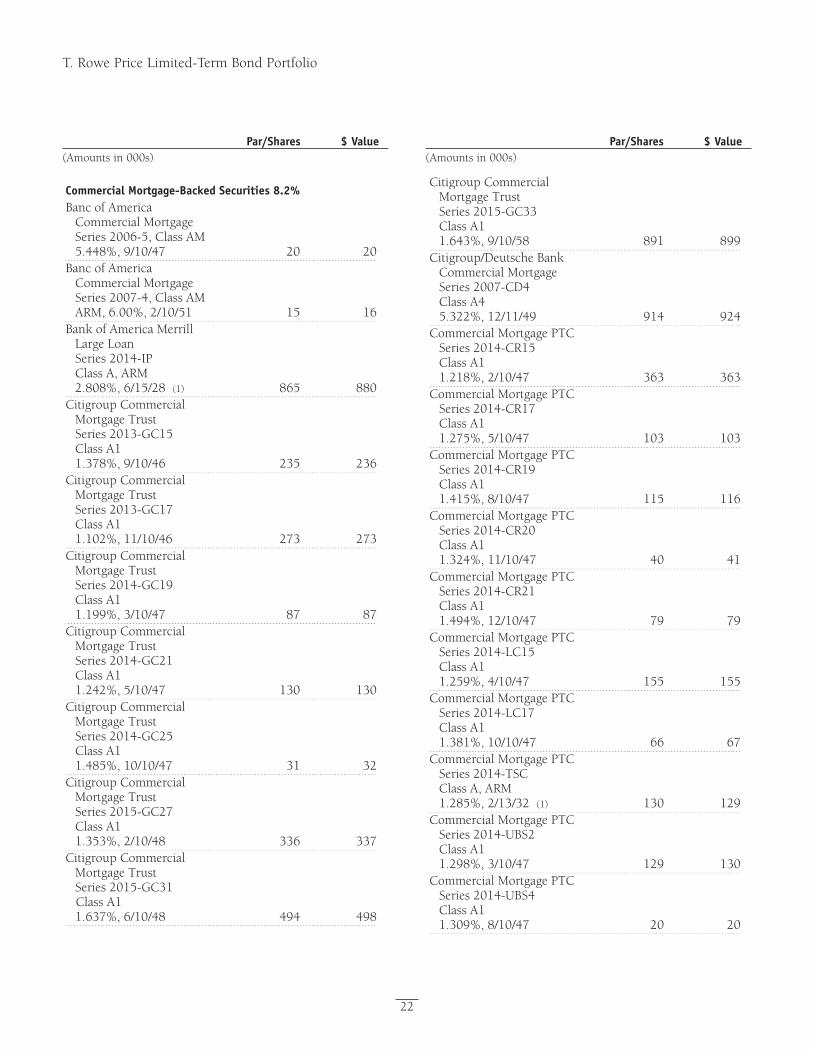
Proof #6
T. Rowe Price Limited-Term Bond Portfolio
Par/Shares $ Value(Amounts in 000s)
Par/Shares $ Value(Amounts in 000s)
22
Commercial Mortgage-Backed Securities 8.2% Banc of America
Commercial Mortgage Series 2006-5, Class AM 5.448%, 9/10/47 20 20
Banc of America Commercial Mortgage Series 2007-4, Class AM ARM, 6.00%, 2/10/51 15 16
Bank of America Merrill Large Loan Series 2014-IP Class A, ARM 2.808%, 6/15/28 (1) 865 880
Citigroup Commercial Mortgage Trust Series 2013-GC15 Class A1 1.378%, 9/10/46 235 236
Citigroup Commercial Mortgage Trust Series 2013-GC17 Class A1 1.102%, 11/10/46 273 273
Citigroup Commercial Mortgage Trust Series 2014-GC19 Class A1 1.199%, 3/10/47 87 87
Citigroup Commercial Mortgage Trust Series 2014-GC21 Class A1 1.242%, 5/10/47 130 130
Citigroup Commercial Mortgage Trust Series 2014-GC25 Class A1 1.485%, 10/10/47 31 32
Citigroup Commercial Mortgage Trust Series 2015-GC27 Class A1 1.353%, 2/10/48 336 337
Citigroup Commercial Mortgage Trust Series 2015-GC31
Class A1 1.637%, 6/10/48 494 498
Citigroup Commercial Mortgage Trust Series 2015-GC33 Class A1 1.643%, 9/10/58 891 899
Citigroup/Deutsche Bank Commercial Mortgage Series 2007-CD4 Class A4 5.322%, 12/11/49 914 924
Commercial Mortgage PTC Series 2014-CR15 Class A1 1.218%, 2/10/47 363 363
Commercial Mortgage PTC Series 2014-CR17 Class A1 1.275%, 5/10/47 103 103
Commercial Mortgage PTC Series 2014-CR19 Class A1 1.415%, 8/10/47 115 116
Commercial Mortgage PTC Series 2014-CR20 Class A1 1.324%, 11/10/47 40 41
Commercial Mortgage PTC Series 2014-CR21 Class A1 1.494%, 12/10/47 79 79
Commercial Mortgage PTC Series 2014-LC15 Class A1 1.259%, 4/10/47 155 155
Commercial Mortgage PTC Series 2014-LC17 Class A1 1.381%, 10/10/47 66 67
Commercial Mortgage PTC Series 2014-TSC Class A, ARM 1.285%, 2/13/32 (1) 130 129
Commercial Mortgage PTC Series 2014-UBS2 Class A1 1.298%, 3/10/47 129 130
Commercial Mortgage PTC Series 2014-UBS4 Class A1 1.309%, 8/10/47 20 20
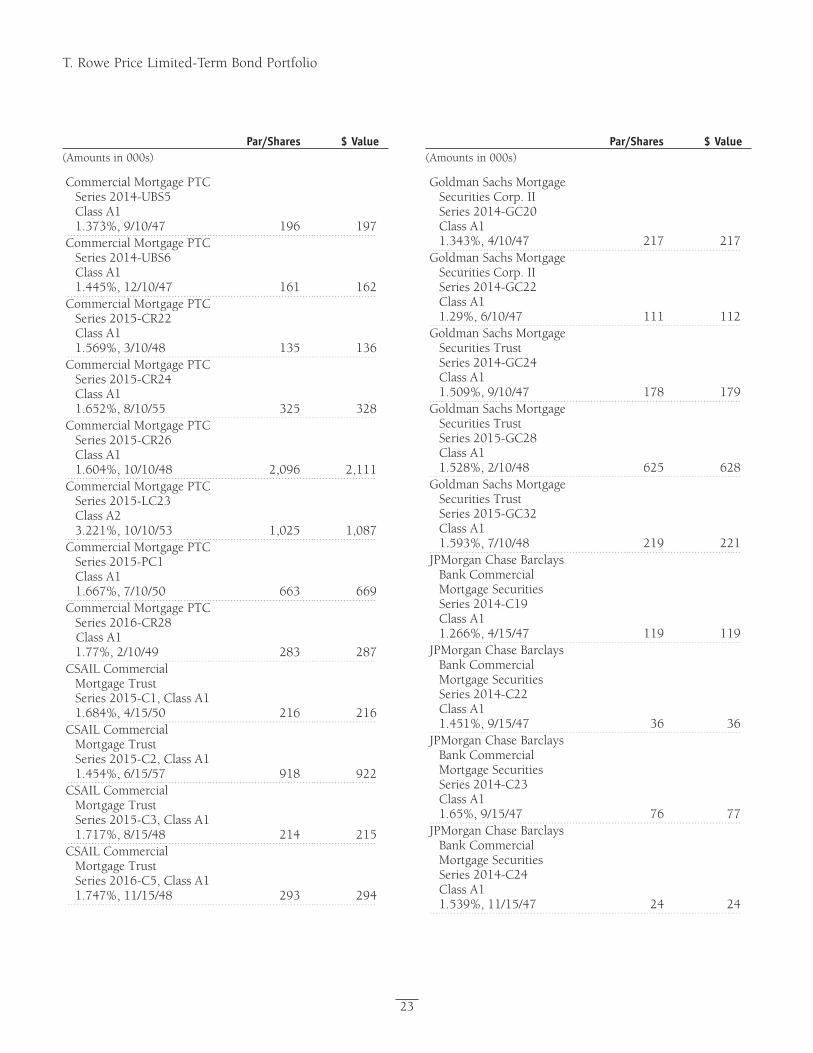
Proof #6
T. Rowe Price Limited-Term Bond Portfolio
Par/Shares $ Value(Amounts in 000s)
Par/Shares $ Value(Amounts in 000s)
23
Commercial Mortgage PTC Series 2014-UBS5 Class A1 1.373%, 9/10/47 196 197
Commercial Mortgage PTC Series 2014-UBS6 Class A1 1.445%, 12/10/47 161 162
Commercial Mortgage PTC Series 2015-CR22 Class A1 1.569%, 3/10/48 135 136
Commercial Mortgage PTC Series 2015-CR24 Class A1 1.652%, 8/10/55 325 328
Commercial Mortgage PTC Series 2015-CR26 Class A1 1.604%, 10/10/48 2,096 2,111
Commercial Mortgage PTC Series 2015-LC23 Class A2 3.221%, 10/10/53 1,025 1,087
Commercial Mortgage PTC Series 2015-PC1 Class A1 1.667%, 7/10/50 663 669
Commercial Mortgage PTC Series 2016-CR28
Class A1 1.77%, 2/10/49 283 287
CSAIL Commercial Mortgage Trust Series 2015-C1, Class A1 1.684%, 4/15/50 216 216
CSAIL Commercial Mortgage Trust Series 2015-C2, Class A1 1.454%, 6/15/57 918 922
CSAIL Commercial Mortgage Trust Series 2015-C3, Class A1 1.717%, 8/15/48 214 215
CSAIL Commercial Mortgage Trust Series 2016-C5, Class A1 1.747%, 11/15/48 293 294
Goldman Sachs Mortgage Securities Corp. II Series 2014-GC20 Class A1 1.343%, 4/10/47 217 217
Goldman Sachs Mortgage Securities Corp. II Series 2014-GC22 Class A1 1.29%, 6/10/47 111 112
Goldman Sachs Mortgage Securities Trust Series 2014-GC24 Class A1 1.509%, 9/10/47 178 179
Goldman Sachs Mortgage Securities Trust Series 2015-GC28 Class A1 1.528%, 2/10/48 625 628
Goldman Sachs Mortgage Securities Trust Series 2015-GC32 Class A1 1.593%, 7/10/48 219 221
JPMorgan Chase Barclays Bank Commercial Mortgage Securities Series 2014-C19 Class A1 1.266%, 4/15/47 119 119
JPMorgan Chase Barclays Bank Commercial Mortgage Securities Series 2014-C22 Class A1 1.451%, 9/15/47 36 36
JPMorgan Chase Barclays Bank Commercial Mortgage Securities Series 2014-C23 Class A1 1.65%, 9/15/47 76 77
JPMorgan Chase Barclays Bank Commercial Mortgage Securities Series 2014-C24 Class A1 1.539%, 11/15/47 24 24
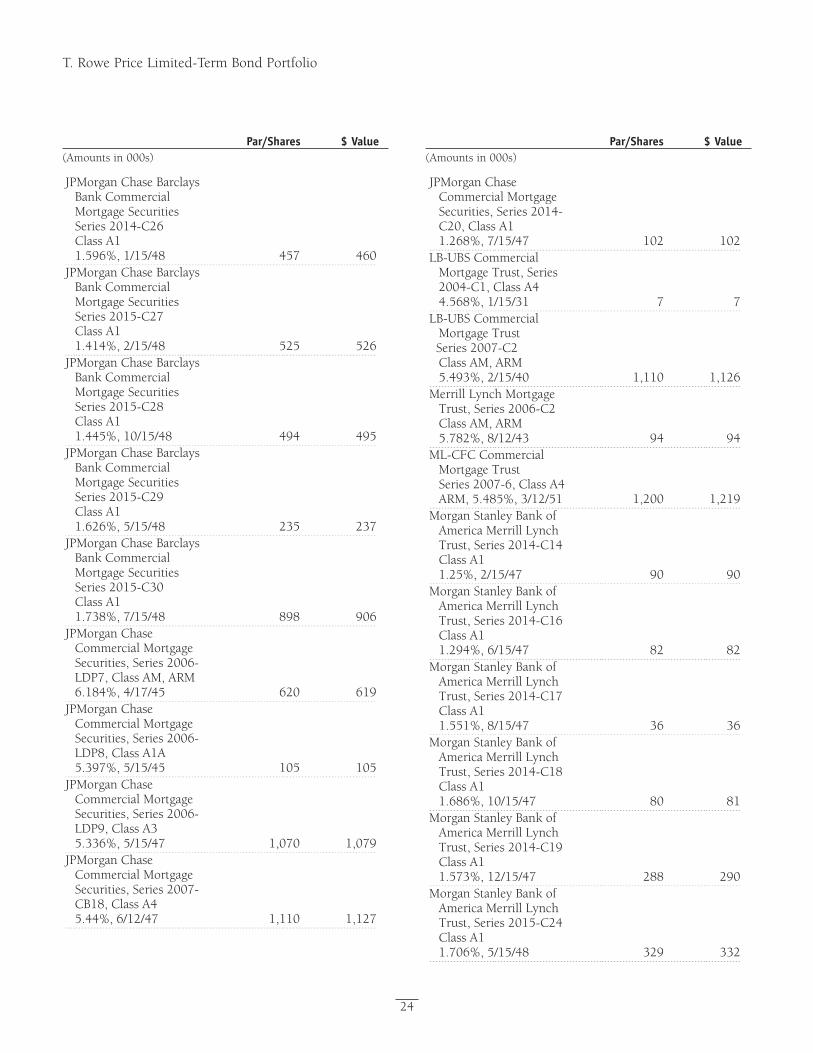
Proof #6
T. Rowe Price Limited-Term Bond Portfolio
Par/Shares $ Value(Amounts in 000s)
Par/Shares $ Value(Amounts in 000s)
24
JPMorgan Chase Barclays Bank Commercial Mortgage Securities Series 2014-C26 Class A1 1.596%, 1/15/48 457 460
JPMorgan Chase Barclays Bank Commercial Mortgage Securities Series 2015-C27 Class A1 1.414%, 2/15/48 525 526
JPMorgan Chase Barclays Bank Commercial Mortgage Securities Series 2015-C28 Class A1 1.445%, 10/15/48 494 495
JPMorgan Chase Barclays Bank Commercial Mortgage Securities Series 2015-C29 Class A1 1.626%, 5/15/48 235 237
JPMorgan Chase Barclays Bank Commercial Mortgage Securities Series 2015-C30 Class A1 1.738%, 7/15/48 898 906
JPMorgan Chase Commercial Mortgage Securities, Series 2006-LDP7, Class AM, ARM 6.184%, 4/17/45 620 619
JPMorgan Chase Commercial Mortgage Securities, Series 2006-LDP8, Class A1A 5.397%, 5/15/45 105 105
JPMorgan Chase Commercial Mortgage Securities, Series 2006-LDP9, Class A3 5.336%, 5/15/47 1,070 1,079
JPMorgan Chase Commercial Mortgage Securities, Series 2007-CB18, Class A4 5.44%, 6/12/47 1,110 1,127
JPMorgan Chase Commercial Mortgage Securities, Series 2014-C20, Class A1 1.268%, 7/15/47 102 102
LB-UBS Commercial Mortgage Trust, Series 2004-C1, Class A4 4.568%, 1/15/31 7 7
LB-UBS Commercial Mortgage Trust
Series 2007-C2 Class AM, ARM 5.493%, 2/15/40 1,110 1,126
Merrill Lynch Mortgage Trust, Series 2006-C2 Class AM, ARM 5.782%, 8/12/43 94 94
ML-CFC Commercial Mortgage Trust Series 2007-6, Class A4 ARM, 5.485%, 3/12/51 1,200 1,219
Morgan Stanley Bank of America Merrill Lynch Trust, Series 2014-C14 Class A1 1.25%, 2/15/47 90 90
Morgan Stanley Bank of America Merrill Lynch Trust, Series 2014-C16 Class A1 1.294%, 6/15/47 82 82
Morgan Stanley Bank of America Merrill Lynch Trust, Series 2014-C17 Class A1 1.551%, 8/15/47 36 36
Morgan Stanley Bank of America Merrill Lynch Trust, Series 2014-C18 Class A1 1.686%, 10/15/47 80 81
Morgan Stanley Bank of America Merrill Lynch Trust, Series 2014-C19 Class A1 1.573%, 12/15/47 288 290
Morgan Stanley Bank of America Merrill Lynch Trust, Series 2015-C24 Class A1 1.706%, 5/15/48 329 332
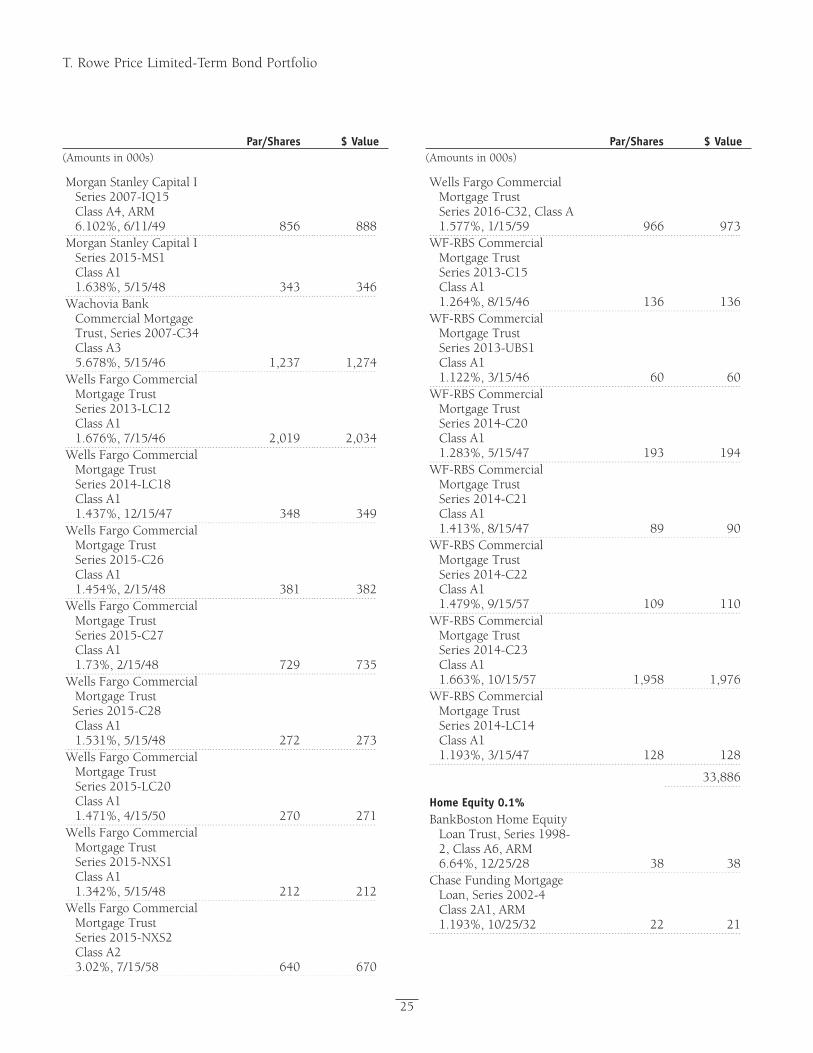
Proof #6
T. Rowe Price Limited-Term Bond Portfolio
Par/Shares $ Value(Amounts in 000s)
Par/Shares $ Value(Amounts in 000s)
25
Morgan Stanley Capital I Series 2007-IQ15 Class A4, ARM 6.102%, 6/11/49 856 888
Morgan Stanley Capital I Series 2015-MS1 Class A1 1.638%, 5/15/48 343 346
Wachovia Bank Commercial Mortgage Trust, Series 2007-C34 Class A3 5.678%, 5/15/46 1,237 1,274
Wells Fargo Commercial Mortgage Trust Series 2013-LC12 Class A1 1.676%, 7/15/46 2,019 2,034
Wells Fargo Commercial Mortgage Trust Series 2014-LC18 Class A1 1.437%, 12/15/47 348 349
Wells Fargo Commercial Mortgage Trust Series 2015-C26 Class A1 1.454%, 2/15/48 381 382
Wells Fargo Commercial Mortgage Trust Series 2015-C27 Class A1 1.73%, 2/15/48 729 735
Wells Fargo Commercial Mortgage Trust
Series 2015-C28 Class A1 1.531%, 5/15/48 272 273
Wells Fargo Commercial Mortgage Trust Series 2015-LC20 Class A1 1.471%, 4/15/50 270 271
Wells Fargo Commercial Mortgage Trust Series 2015-NXS1 Class A1 1.342%, 5/15/48 212 212
Wells Fargo Commercial Mortgage Trust Series 2015-NXS2 Class A2 3.02%, 7/15/58 640 670
Wells Fargo Commercial Mortgage Trust Series 2016-C32, Class A 1.577%, 1/15/59 966 973
WF-RBS Commercial Mortgage Trust Series 2013-C15 Class A1 1.264%, 8/15/46 136 136
WF-RBS Commercial Mortgage Trust Series 2013-UBS1 Class A1 1.122%, 3/15/46 60 60
WF-RBS Commercial Mortgage Trust Series 2014-C20 Class A1 1.283%, 5/15/47 193 194
WF-RBS Commercial Mortgage Trust Series 2014-C21 Class A1 1.413%, 8/15/47 89 90
WF-RBS Commercial Mortgage Trust Series 2014-C22 Class A1 1.479%, 9/15/57 109 110
WF-RBS Commercial Mortgage Trust Series 2014-C23 Class A1 1.663%, 10/15/57 1,958 1,976
WF-RBS Commercial Mortgage Trust Series 2014-LC14 Class A1 1.193%, 3/15/47 128 128
33,886
Home Equity 0.1% BankBoston Home Equity
Loan Trust, Series 1998-2, Class A6, ARM 6.64%, 12/25/28 38 38
Chase Funding Mortgage Loan, Series 2002-4 Class 2A1, ARM 1.193%, 10/25/32 22 21
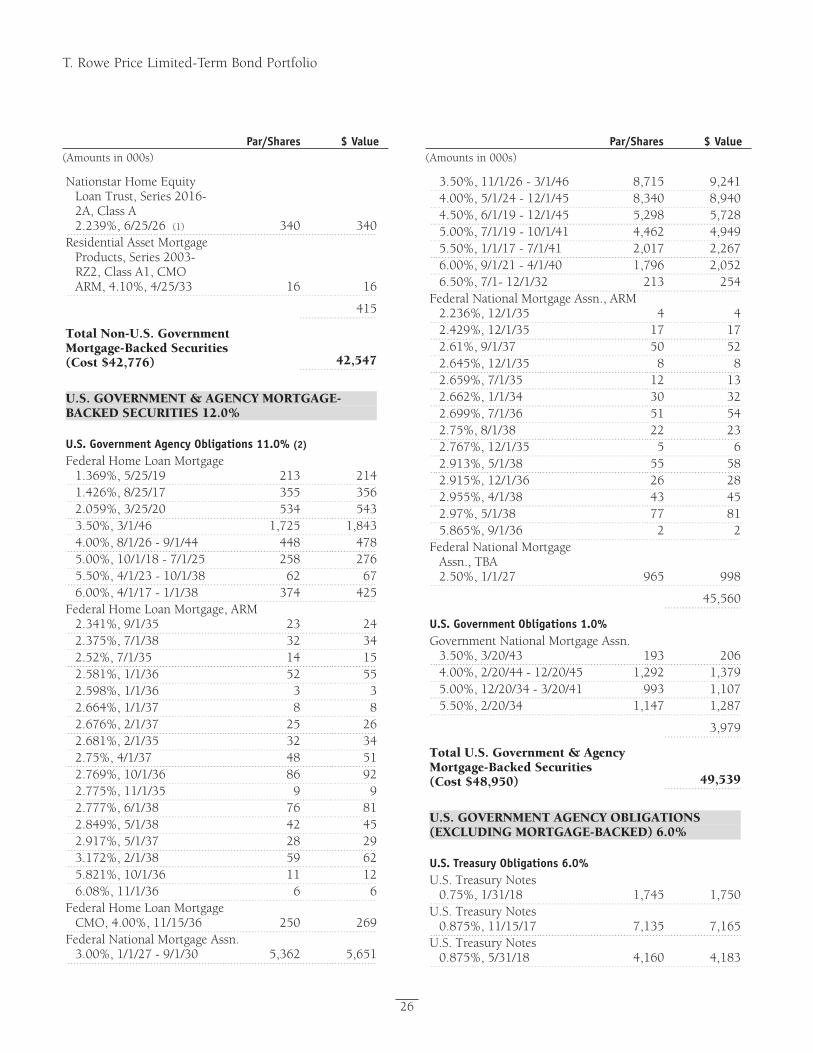
Proof #6
T. Rowe Price Limited-Term Bond Portfolio
Par/Shares $ Value(Amounts in 000s)
Par/Shares $ Value(Amounts in 000s)
26
Nationstar Home Equity Loan Trust, Series 2016-2A, Class A 2.239%, 6/25/26 (1) 340 340
Residential Asset Mortgage Products, Series 2003-RZ2, Class A1, CMO ARM, 4.10%, 4/25/33 16 16
415
Total Non-U.S. Government Mortgage-Backed Securities (Cost $42,776) 42,547
U.S. GOVERNMENT & AGENCY MORTGAGE-BACKED SECURITIES 12.0%
U.S. Government Agency Obligations 11.0% (2) Federal Home Loan Mortgage
1.369%, 5/25/19 213 214 1.426%, 8/25/17 355 356 2.059%, 3/25/20 534 543 3.50%, 3/1/46 1,725 1,843 4.00%, 8/1/26 - 9/1/44 448 478 5.00%, 10/1/18 - 7/1/25 258 276 5.50%, 4/1/23 - 10/1/38 62 67 6.00%, 4/1/17 - 1/1/38 374 425Federal Home Loan Mortgage, ARM
2.341%, 9/1/35 23 24 2.375%, 7/1/38 32 34 2.52%, 7/1/35 14 15 2.581%, 1/1/36 52 55 2.598%, 1/1/36 3 3 2.664%, 1/1/37 8 8 2.676%, 2/1/37 25 26 2.681%, 2/1/35 32 34 2.75%, 4/1/37 48 51 2.769%, 10/1/36 86 92 2.775%, 11/1/35 9 9 2.777%, 6/1/38 76 81 2.849%, 5/1/38 42 45 2.917%, 5/1/37 28 29 3.172%, 2/1/38 59 62 5.821%, 10/1/36 11 12 6.08%, 11/1/36 6 6Federal Home Loan Mortgage
CMO, 4.00%, 11/15/36 250 269Federal National Mortgage Assn. 3.00%, 1/1/27 - 9/1/30 5,362 5,651
3.50%, 11/1/26 - 3/1/46 8,715 9,241 4.00%, 5/1/24 - 12/1/45 8,340 8,940 4.50%, 6/1/19 - 12/1/45 5,298 5,728 5.00%, 7/1/19 - 10/1/41 4,462 4,949 5.50%, 1/1/17 - 7/1/41 2,017 2,267 6.00%, 9/1/21 - 4/1/40 1,796 2,052 6.50%, 7/1- 12/1/32 213 254Federal National Mortgage Assn., ARM
2.236%, 12/1/35 4 4 2.429%, 12/1/35 17 17 2.61%, 9/1/37 50 52 2.645%, 12/1/35 8 8 2.659%, 7/1/35 12 13 2.662%, 1/1/34 30 32 2.699%, 7/1/36 51 54 2.75%, 8/1/38 22 23 2.767%, 12/1/35 5 6 2.913%, 5/1/38 55 58 2.915%, 12/1/36 26 28 2.955%, 4/1/38 43 45 2.97%, 5/1/38 77 81 5.865%, 9/1/36 2 2Federal National Mortgage
Assn., TBA 2.50%, 1/1/27 965 998
45,560
U.S. Government Obligations 1.0% Government National Mortgage Assn. 3.50%, 3/20/43 193 206 4.00%, 2/20/44 - 12/20/45 1,292 1,379 5.00%, 12/20/34 - 3/20/41 993 1,107 5.50%, 2/20/34 1,147 1,287
3,979
Total U.S. Government & Agency Mortgage-Backed Securities (Cost $48,950) 49,539
U.S. GOVERNMENT AGENCY OBLIGATIONS (EXCLUDING MORTGAGE-BACKED) 6.0%
U.S. Treasury Obligations 6.0% U.S. Treasury Notes
0.75%, 1/31/18 1,745 1,750U.S. Treasury Notes
0.875%, 11/15/17 7,135 7,165U.S. Treasury Notes
0.875%, 5/31/18 4,160 4,183
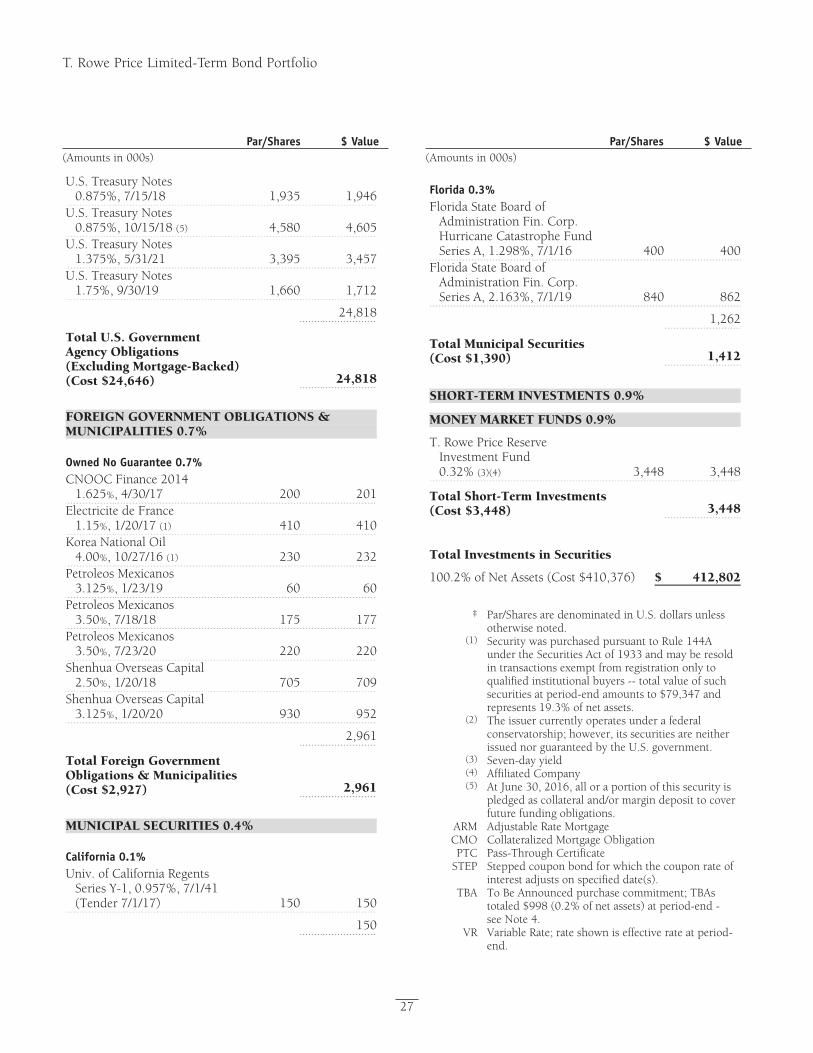
Proof #6
T. Rowe Price Limited-Term Bond Portfolio
Par/Shares $ Value(Amounts in 000s)
Par/Shares $ Value(Amounts in 000s)
27
U.S. Treasury Notes 0.875%, 7/15/18 1,935 1,946
U.S. Treasury Notes 0.875%, 10/15/18 (5) 4,580 4,605
U.S. Treasury Notes 1.375%, 5/31/21 3,395 3,457
U.S. Treasury Notes 1.75%, 9/30/19 1,660 1,712
24,818
Total U.S. Government Agency Obligations (Excluding Mortgage-Backed) (Cost $24,646) 24,818
FOREIGN GOVERNMENT OBLIGATIONS & MUNICIPALITIES 0.7%
Owned No Guarantee 0.7% CNOOC Finance 2014
1.625%, 4/30/17 200 201Electricite de France
1.15%, 1/20/17 (1) 410 410Korea National Oil
4.00%, 10/27/16 (1) 230 232Petroleos Mexicanos
3.125%, 1/23/19 60 60Petroleos Mexicanos
3.50%, 7/18/18 175 177Petroleos Mexicanos
3.50%, 7/23/20 220 220Shenhua Overseas Capital
2.50%, 1/20/18 705 709Shenhua Overseas Capital
3.125%, 1/20/20 930 952
2,961
Total Foreign Government Obligations & Municipalities (Cost $2,927) 2,961
MUNICIPAL SECURITIES 0.4%
California 0.1% Univ. of California Regents
Series Y-1, 0.957%, 7/1/41 (Tender 7/1/17) 150 150
150
Florida 0.3% Florida State Board of
Administration Fin. Corp. Hurricane Catastrophe Fund Series A, 1.298%, 7/1/16 400 400
Florida State Board of Administration Fin. Corp. Series A, 2.163%, 7/1/19 840 862
1,262
Total Municipal Securities (Cost $1,390) 1,412
SHORT-TERM INVESTMENTS 0.9%
MONEY MARKET FUNDS 0.9%
T. Rowe Price Reserve Investment Fund 0.32% (3)(4) 3,448 3,448
Total Short-Term Investments (Cost $3,448) 3,448
Total Investments in Securities
100.2% of Net Assets (Cost $410,376) $ 412,802
‡
Par/Shares are denominated in U.S. dollars unless otherwise noted.
(1)
Security was purchased pursuant to Rule 144A under the Securities Act of 1933 and may be resold in transactions exempt from registration only to qualified institutional buyers -- total value of such securities at period-end amounts to $79,347 and represents 19.3% of net assets.
(2)
The issuer currently operates under a federal conservatorship; however, its securities are neither issued nor guaranteed by the U.S. government.
(3) Seven-day yield(4) Affiliated Company (5)
At June 30, 2016, all or a portion of this security is pledged as collateral and/or margin deposit to cover future funding obligations.
ARM Adjustable Rate Mortgage CMO Collateralized Mortgage ObligationPTC Pass-Through Certificate
STEP
Stepped coupon bond for which the coupon rate of interest adjusts on specified date(s).
TBA
To Be Announced purchase commitment; TBAs totaled $998 (0.2% of net assets) at period-end - see Note 4.
VR
Variable Rate; rate shown is effective rate at period-end.
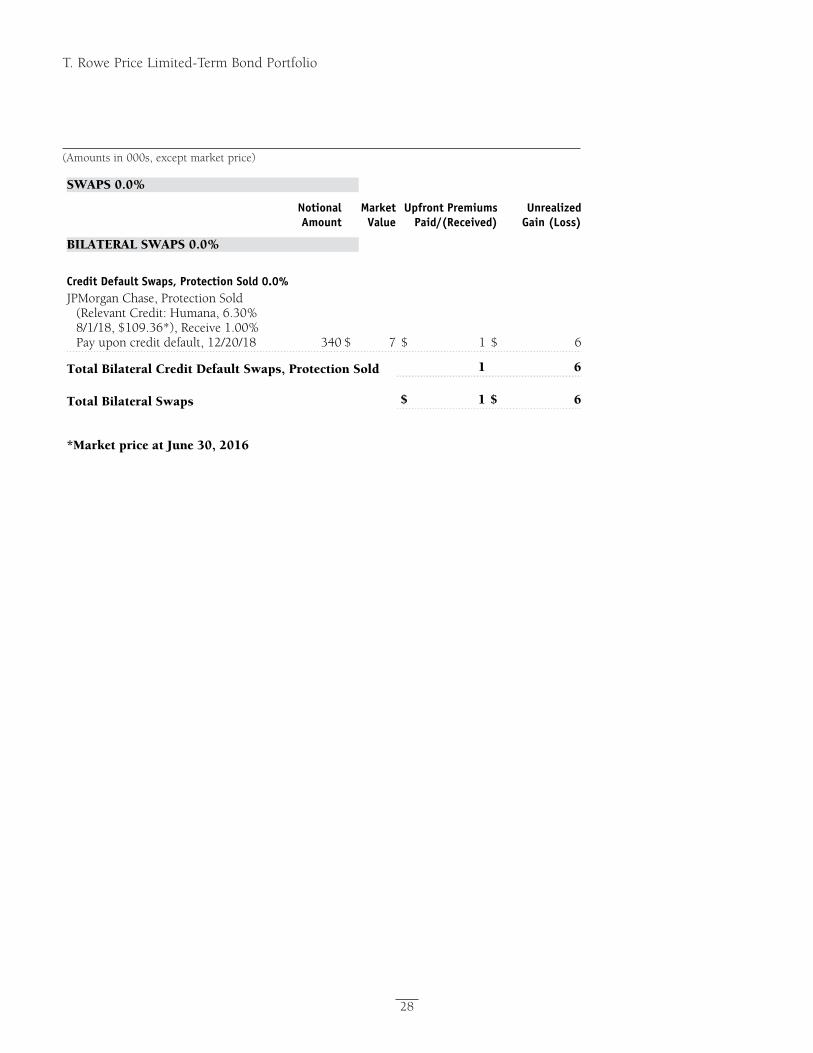
Proof #6
T. Rowe Price Limited-Term Bond Portfolio
28
SWAPS 0.0%
NotionalAmount
Market Value
Upfront Premiums Paid/(Received)
Unrealized Gain (Loss)
BILATERAL SWAPS 0.0%
Credit Default Swaps, Protection Sold 0.0% JPMorgan Chase, Protection Sold
(Relevant Credit: Humana, 6.30% 8/1/18, $109.36*), Receive 1.00% Pay upon credit default, 12/20/18 340 $ 7 $ 1 $ 6
Total Bilateral Credit Default Swaps, Protection Sold 1 6
Total Bilateral Swaps $ 1 $ 6
*Market price at June 30, 2016
(Amountsin000s,exceptmarketprice)
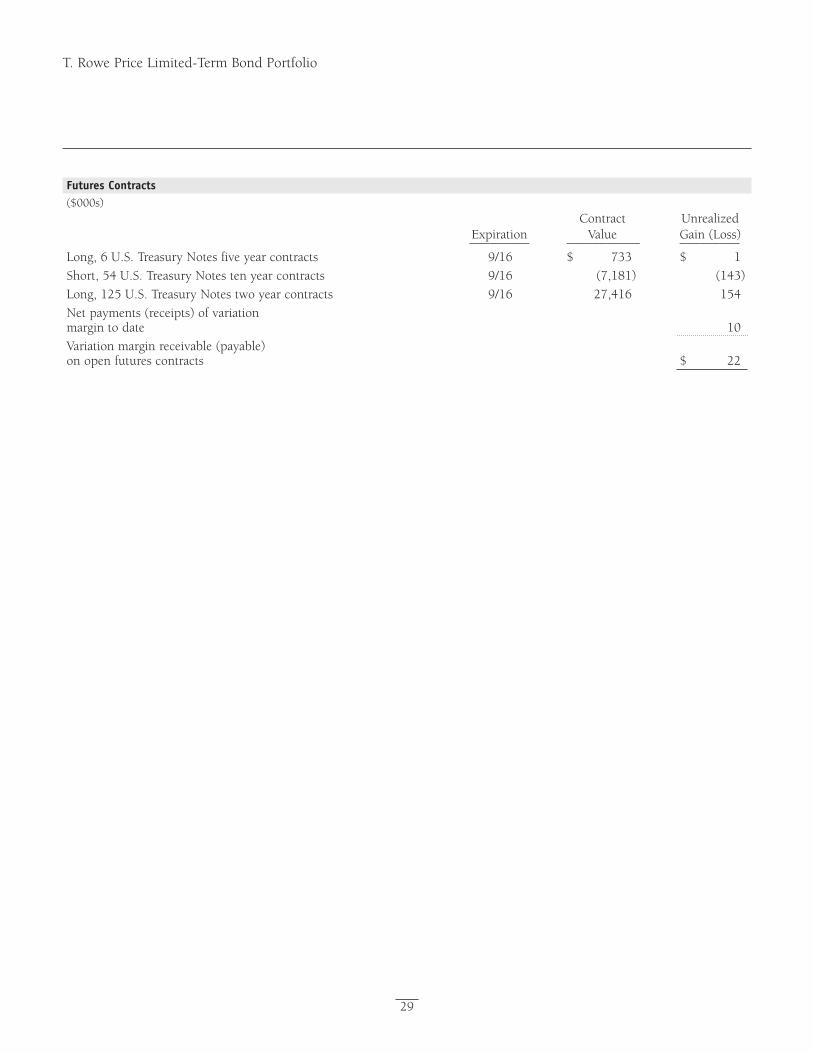
Proof #6
T. Rowe Price Limited-Term Bond Portfolio
29
Futures Contracts($000s) Contract Unrealized Expiration Value Gain(Loss) _________ ___________ _________
Long,6U.S.TreasuryNotesfiveyearcontracts 9/16 $ 733 $ 1
Short,54U.S.TreasuryNotestenyearcontracts 9/16 (7,181) (143)
Long,125U.S.TreasuryNotestwoyearcontracts 9/16 27,416 154
Netpayments(receipts)ofvariation margintodate 10
Variationmarginreceivable(payable) onopenfuturescontracts $ 22
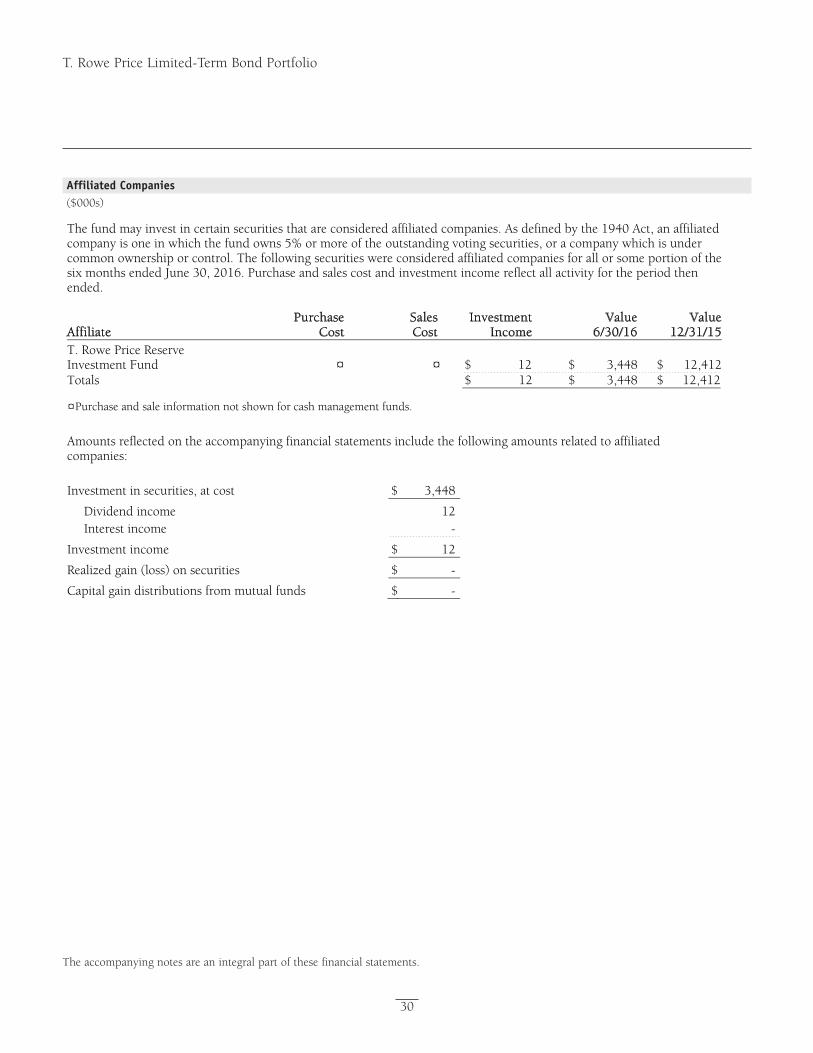
Proof #6
T. Rowe Price Limited-Term Bond Portfolio
30
The accompanying notes are an integral part of these financial statements.
The fund may invest in certain securities that are considered affiliated companies. As defined by the 1940 Act, an affiliated company is one in which the fund owns 5% or more of the outstanding voting securities, or a company which is under common ownership or control. The following securities were considered affiliated companies for all or some portion of the six months ended June 30, 2016. Purchase and sales cost and investment income reflect all activity for the period then ended. Affiliate
PurchaseCost
SalesCost
InvestmentIncome
Value6/30/16
Value12/31/15
T. Rowe Price Reserve Investment Fund ¤ ¤ $ 12 $ 3,448 $ 12,412Totals $ 12 $ 3,448 $ 12,412
¤ Purchase and sale information not shown for cash management funds.
Amounts reflected on the accompanying financial statements include the following amounts related to affiliated companies: Investment in securities, at cost $ 3,448
Dividend income 12 Interest income -
Investment income $ 12
Realized gain (loss) on securities $ -
Capital gain distributions from mutual funds $ -
Affiliated Companies($000s)
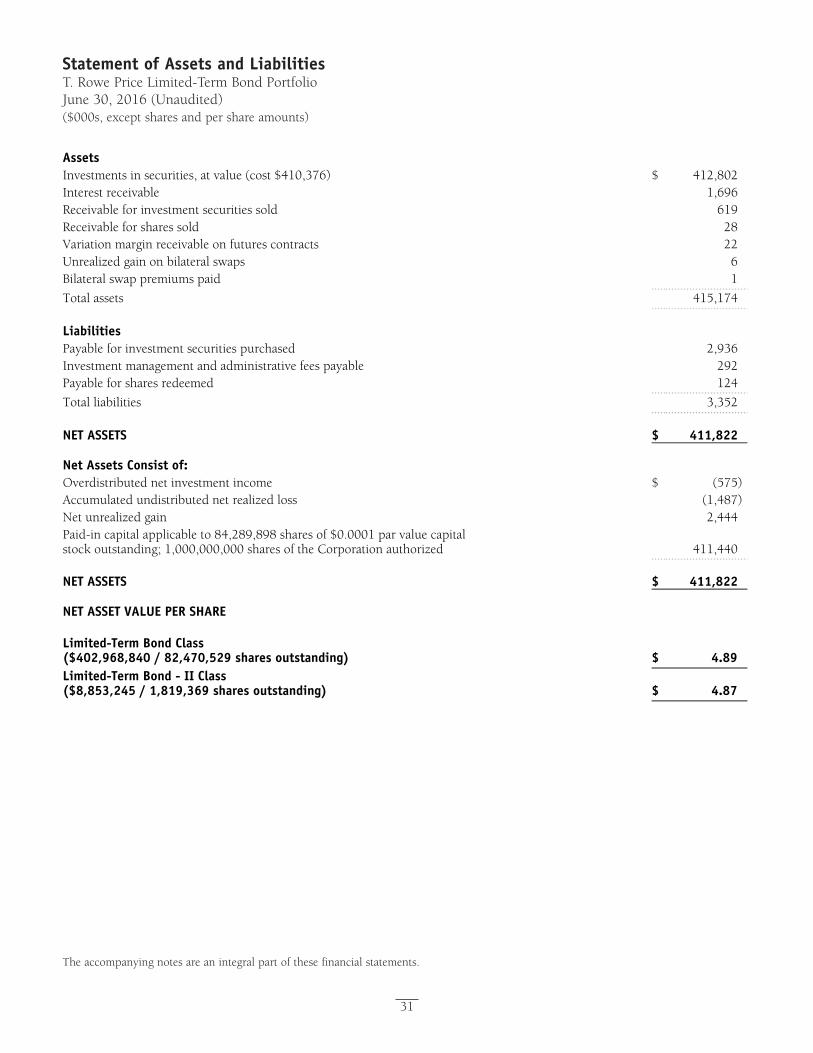
Proof #6
31
Statement of Assets and LiabilitiesT. Rowe Price Limited-Term Bond PortfolioJune 30, 2016 (Unaudited)($000s, except shares and per share amounts)
The accompanying notes are an integral part of these financial statements.
Assets Investments in securities, at value (cost $410,376) $ 412,802 Interest receivable 1,696 Receivable for investment securities sold 619 Receivable for shares sold 28 Variation margin receivable on futures contracts 22 Unrealized gain on bilateral swaps 6 Bilateral swap premiums paid 1
Total assets 415,174
Liabilities Payable for investment securities purchased 2,936 Investment management and administrative fees payable 292 Payable for shares redeemed 124
Total liabilities 3,352
NET ASSETS $ 411,822 Net Assets Consist of: Overdistributed net investment income $ (575) Accumulated undistributed net realized loss (1,487) Net unrealized gain 2,444 Paid-in capital applicable to 84,289,898 shares of $0.0001 par value capital stock outstanding; 1,000,000,000 shares of the Corporation authorized 411,440 NET ASSETS $ 411,822 NET ASSET VALUE PER SHARE Limited-Term Bond Class ($402,968,840 / 82,470,529 shares outstanding) $ 4.89 Limited-Term Bond - II Class ($8,853,245 / 1,819,369 shares outstanding) $ 4.87
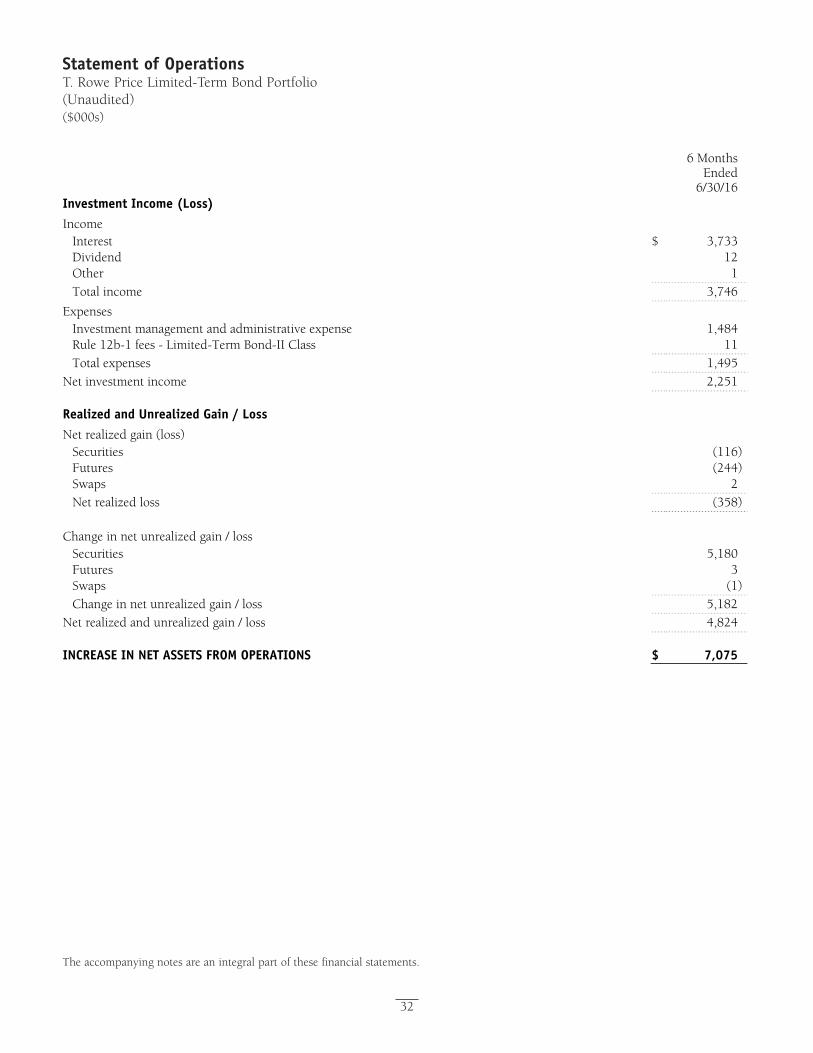
Proof #6
32
Statement of OperationsT. Rowe Price Limited-Term Bond Portfolio(Unaudited)($000s)
The accompanying notes are an integral part of these financial statements.
6 Months Ended
6/30/16Investment Income (Loss) Income
Interest $ 3,733Dividend 12Other 1Total income 3,746
Expenses Investment management and administrative expense 1,484Rule 12b-1 fees - Limited-Term Bond-II Class 11Total expenses 1,495
Net investment income 2,251 Realized and Unrealized Gain / Loss Net realized gain (loss)
Securities (116)Futures (244)Swaps 2Net realized loss (358)
Change in net unrealized gain / loss
Securities 5,180Futures 3Swaps (1)Change in net unrealized gain / loss 5,182
Net realized and unrealized gain / loss 4,824 INCREASE IN NET ASSETS FROM OPERATIONS $ 7,075
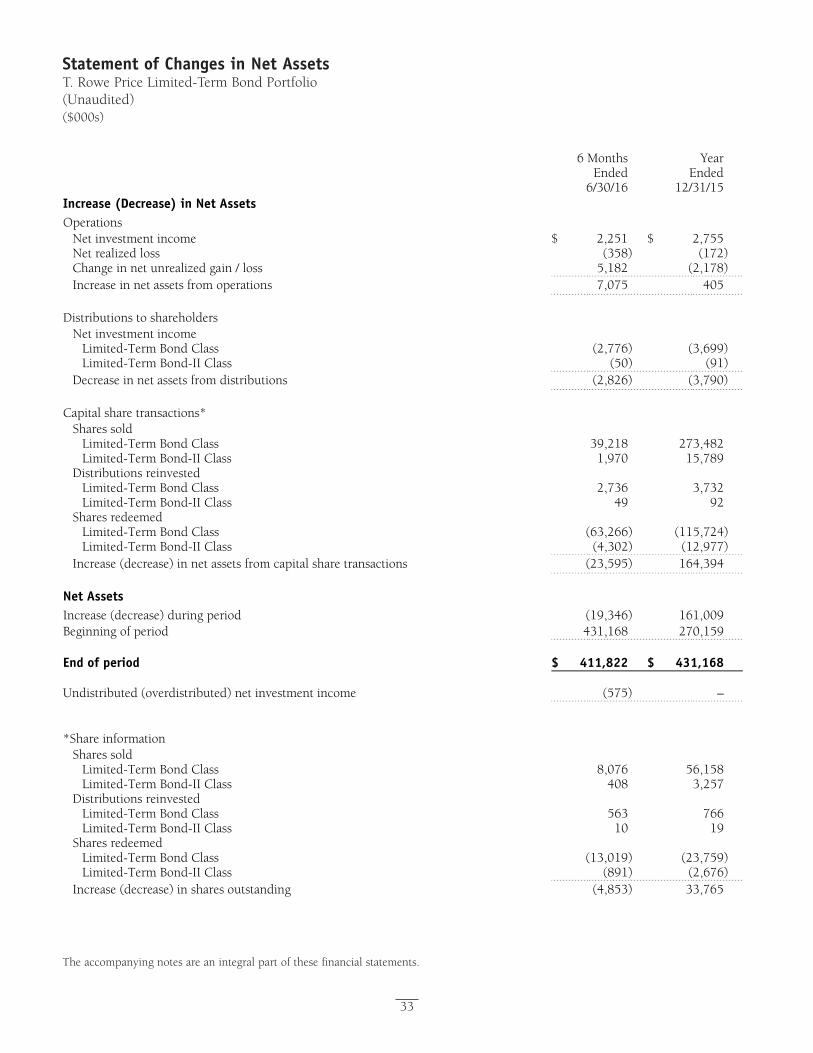
Proof #6
33
Statement of Changes in Net AssetsT. Rowe Price Limited-Term Bond Portfolio(Unaudited)($000s)
The accompanying notes are an integral part of these financial statements.
6 Months Ended
6/30/16
Year Ended
12/31/15Increase (Decrease) in Net Assets Operations
Net investment income $ 2,251 $ 2,755Net realized loss (358) (172)Change in net unrealized gain / loss 5,182 (2,178)Increase in net assets from operations 7,075 405
Distributions to shareholders
Net investment income Limited-Term Bond Class (2,776) (3,699)Limited-Term Bond-II Class (50) (91)
Decrease in net assets from distributions (2,826) (3,790) Capital share transactions*
Shares sold Limited-Term Bond Class 39,218 273,482Limited-Term Bond-II Class 1,970 15,789
Distributions reinvested Limited-Term Bond Class 2,736 3,732Limited-Term Bond-II Class 49 92
Shares redeemed Limited-Term Bond Class (63,266) (115,724)Limited-Term Bond-II Class (4,302) (12,977)
Increase (decrease) in net assets from capital share transactions (23,595) 164,394 Net Assets Increase (decrease) during period (19,346) 161,009 Beginning of period 431,168 270,159 End of period $ 411,822 $ 431,168 Undistributed (overdistributed) net investment income (575) – *Share information
Shares sold Limited-Term Bond Class 8,076 56,158Limited-Term Bond-II Class 408 3,257
Distributions reinvested Limited-Term Bond Class 563 766Limited-Term Bond-II Class 10 19
Shares redeemed Limited-Term Bond Class (13,019) (23,759)Limited-Term Bond-II Class (891) (2,676)
Increase (decrease) in shares outstanding (4,853) 33,765
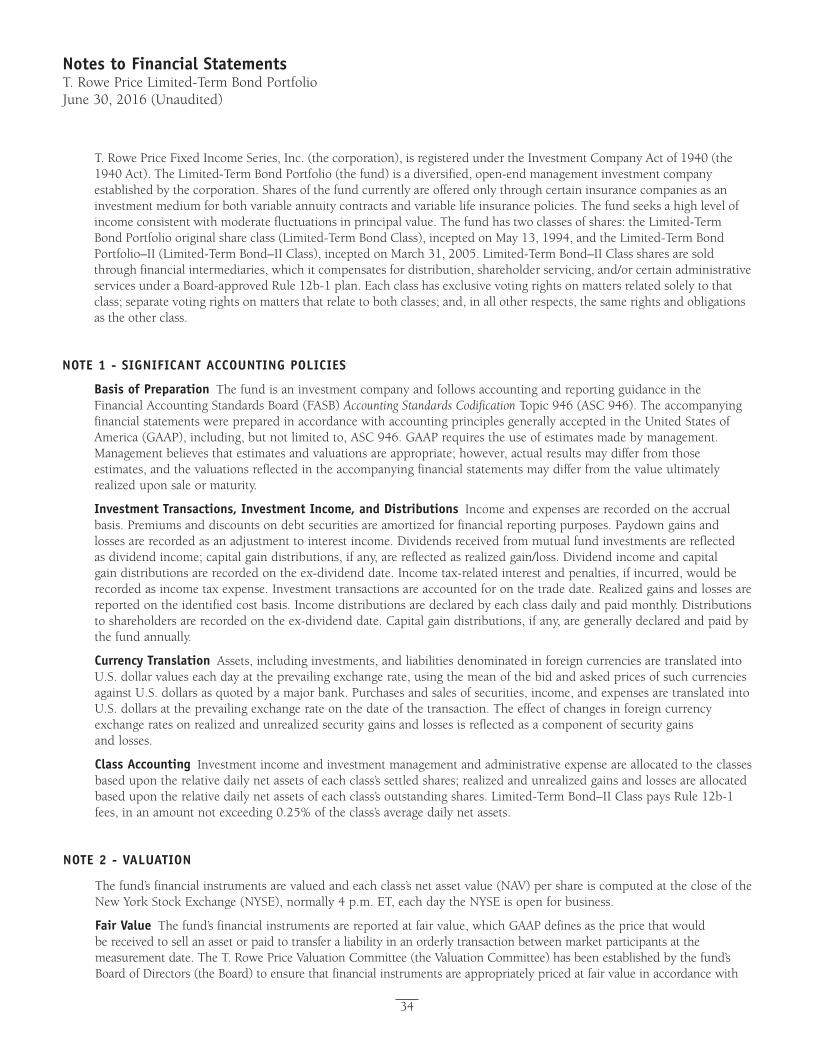
Proof #6
34
Notes to Financial StatementsT. Rowe Price Limited-Term Bond PortfolioJune 30, 2016 (Unaudited)
T.RowePriceFixedIncomeSeries,Inc.(thecorporation),isregisteredundertheInvestmentCompanyActof1940(the1940Act).TheLimited-TermBondPortfolio(thefund)isadiversified,open-endmanagementinvestmentcompanyestablishedbythecorporation.Sharesofthefundcurrentlyareofferedonlythroughcertaininsurancecompaniesasaninvestmentmediumforbothvariableannuitycontractsandvariablelifeinsurancepolicies.Thefundseeksahighlevelofincomeconsistentwithmoderatefluctuationsinprincipalvalue.Thefundhastwoclassesofshares:theLimited-TermBondPortfoliooriginalshareclass(Limited-TermBondClass),inceptedonMay13,1994,andtheLimited-TermBondPortfolio–II(Limited-TermBond–IIClass),inceptedonMarch31,2005.Limited-TermBond–IIClasssharesaresoldthroughfinancialintermediaries,whichitcompensatesfordistribution,shareholderservicing,and/orcertainadministrativeservicesunderaBoard-approvedRule12b-1plan.Eachclasshasexclusivevotingrightsonmattersrelatedsolelytothatclass;separatevotingrightsonmattersthatrelatetobothclasses;and,inallotherrespects,thesamerightsandobligationsas the other class.
NOTE 1 - SIGNIFICANT ACCOuNTING POLICIES
Basis of Preparation ThefundisaninvestmentcompanyandfollowsaccountingandreportingguidanceintheFinancialAccountingStandardsBoard(FASB)Accounting Standards CodificationTopic946(ASC946).TheaccompanyingfinancialstatementswerepreparedinaccordancewithaccountingprinciplesgenerallyacceptedintheUnitedStatesofAmerica(GAAP),including,butnotlimitedto,ASC946.GAAPrequirestheuseofestimatesmadebymanagement.Managementbelievesthatestimatesandvaluationsareappropriate;however,actualresultsmaydifferfromthoseestimates,andthevaluationsreflectedintheaccompanyingfinancialstatementsmaydifferfromthevalueultimatelyrealized upon sale or maturity.
Investment Transactions, Investment Income, and Distributions Incomeandexpensesarerecordedontheaccrualbasis.Premiumsanddiscountsondebtsecuritiesareamortizedforfinancialreportingpurposes.Paydowngainsandlossesarerecordedasanadjustmenttointerestincome.Dividendsreceivedfrommutualfundinvestmentsarereflectedasdividendincome;capitalgaindistributions,ifany,arereflectedasrealizedgain/loss.Dividendincomeandcapitalgaindistributionsarerecordedontheex-dividenddate.Incometax-relatedinterestandpenalties,ifincurred,wouldberecordedasincometaxexpense.Investmenttransactionsareaccountedforonthetradedate.Realizedgainsandlossesarereported on the identified cost basis. Income distributions are declared by each class daily and paid monthly. Distributions toshareholdersarerecordedontheex-dividenddate.Capitalgaindistributions,ifany,aregenerallydeclaredandpaidbythe fund annually.
Currency Translation Assets,includinginvestments,andliabilitiesdenominatedinforeigncurrenciesaretranslatedintoU.S.dollarvalueseachdayattheprevailingexchangerate,usingthemeanofthebidandaskedpricesofsuchcurrenciesagainstU.S.dollarsasquotedbyamajorbank.Purchasesandsalesofsecurities,income,andexpensesaretranslatedintoU.S.dollarsattheprevailingexchangerateonthedateofthetransaction.Theeffectofchangesinforeigncurrencyexchangeratesonrealizedandunrealizedsecuritygainsandlossesisreflectedasacomponentofsecuritygainsand losses.
Class Accounting Investmentincomeandinvestmentmanagementandadministrativeexpenseareallocatedtotheclassesbasedupontherelativedailynetassetsofeachclass’ssettledshares;realizedandunrealizedgainsandlossesareallocatedbasedupontherelativedailynetassetsofeachclass’soutstandingshares.Limited-TermBond–IIClasspaysRule12b-1fees,inanamountnotexceeding0.25%oftheclass’saveragedailynetassets.
NOTE 2 - VALuATION
Thefund’sfinancialinstrumentsarevaluedandeachclass’snetassetvalue(NAV)pershareiscomputedatthecloseoftheNewYorkStockExchange(NYSE),normally4p.m.ET,eachdaytheNYSEisopenforbusiness.
Fair Value Thefund’sfinancialinstrumentsarereportedatfairvalue,whichGAAPdefinesasthepricethatwouldbereceivedtosellanassetorpaidtotransferaliabilityinanorderlytransactionbetweenmarketparticipantsatthemeasurementdate.TheT.RowePriceValuationCommittee(theValuationCommittee)hasbeenestablishedbythefund’sBoardofDirectors(theBoard)toensurethatfinancialinstrumentsareappropriatelypricedatfairvalueinaccordancewith
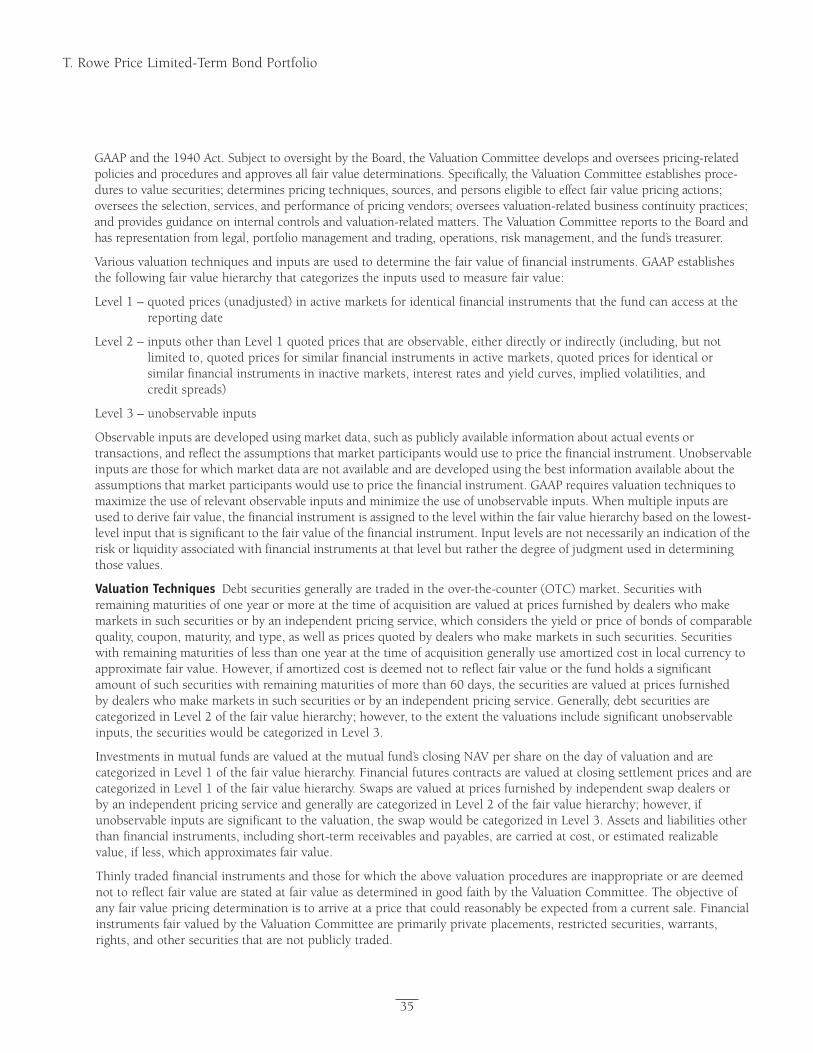
Proof #6
35
T. Rowe Price Limited-Term Bond Portfolio
GAAPandthe1940Act.SubjecttooversightbytheBoard,theValuationCommitteedevelopsandoverseespricing-relatedpoliciesandproceduresandapprovesallfairvaluedeterminations.Specifically,theValuationCommitteeestablishesproce-durestovaluesecurities;determinespricingtechniques,sources,andpersonseligibletoeffectfairvaluepricingactions;overseestheselection,services,andperformanceofpricingvendors;overseesvaluation-relatedbusinesscontinuitypractices;andprovidesguidanceoninternalcontrolsandvaluation-relatedmatters.TheValuationCommitteereportstotheBoardandhasrepresentationfromlegal,portfoliomanagementandtrading,operations,riskmanagement,andthefund’streasurer.
Variousvaluationtechniquesandinputsareusedtodeterminethefairvalueoffinancialinstruments.GAAPestablishesthefollowingfairvaluehierarchythatcategorizestheinputsusedtomeasurefairvalue:
Level1–quotedprices(unadjusted)inactivemarketsforidenticalfinancialinstrumentsthatthefundcanaccessatthereportingdate
Level2–inputsotherthanLevel1quotedpricesthatareobservable,eitherdirectlyorindirectly(including,butnotlimitedto,quotedpricesforsimilarfinancialinstrumentsinactivemarkets,quotedpricesforidenticalorsimilarfinancialinstrumentsininactivemarkets,interestratesandyieldcurves,impliedvolatilities,andcredit spreads)
Level3–unobservableinputs
Observableinputsaredevelopedusingmarketdata,suchaspubliclyavailableinformationaboutactualeventsortransactions,andreflecttheassumptionsthatmarketparticipantswouldusetopricethefinancialinstrument.Unobservableinputsarethoseforwhichmarketdataarenotavailableandaredevelopedusingthebestinformationavailableabouttheassumptionsthatmarketparticipantswouldusetopricethefinancialinstrument.GAAPrequiresvaluationtechniquestomaximizetheuseofrelevantobservableinputsandminimizetheuseofunobservableinputs.Whenmultipleinputsareusedtoderivefairvalue,thefinancialinstrumentisassignedtothelevelwithinthefairvaluehierarchybasedonthelowest-levelinputthatissignificanttothefairvalueofthefinancialinstrument.Inputlevelsarenotnecessarilyanindicationoftheriskorliquidityassociatedwithfinancialinstrumentsatthatlevelbutratherthedegreeofjudgmentusedindeterminingthose values.
Valuation Techniques Debtsecuritiesgenerallyaretradedintheover-the-counter(OTC)market.Securitieswithremainingmaturitiesofoneyearormoreatthetimeofacquisitionarevaluedatpricesfurnishedbydealerswhomakemarketsinsuchsecuritiesorbyanindependentpricingservice,whichconsiderstheyieldorpriceofbondsofcomparablequality,coupon,maturity,andtype,aswellaspricesquotedbydealerswhomakemarketsinsuchsecurities.Securitieswithremainingmaturitiesoflessthanoneyearatthetimeofacquisitiongenerallyuseamortizedcostinlocalcurrencytoapproximatefairvalue.However,ifamortizedcostisdeemednottoreflectfairvalueorthefundholdsasignificantamountofsuchsecuritieswithremainingmaturitiesofmorethan60days,thesecuritiesarevaluedatpricesfurnishedbydealerswhomakemarketsinsuchsecuritiesorbyanindependentpricingservice.Generally,debtsecuritiesarecategorizedinLevel2ofthefairvaluehierarchy;however,totheextentthevaluationsincludesignificantunobservableinputs,thesecuritieswouldbecategorizedinLevel3.
Investmentsinmutualfundsarevaluedatthemutualfund’sclosingNAVpershareonthedayofvaluationandarecategorizedinLevel1ofthefairvaluehierarchy.FinancialfuturescontractsarevaluedatclosingsettlementpricesandarecategorizedinLevel1ofthefairvaluehierarchy.SwapsarevaluedatpricesfurnishedbyindependentswapdealersorbyanindependentpricingserviceandgenerallyarecategorizedinLevel2ofthefairvaluehierarchy;however,ifunobservableinputsaresignificanttothevaluation,theswapwouldbecategorizedinLevel3.Assetsandliabilitiesotherthanfinancialinstruments,includingshort-termreceivablesandpayables,arecarriedatcost,orestimatedrealizablevalue,ifless,whichapproximatesfairvalue.
Thinly traded financial instruments and those for which the above valuation procedures are inappropriate or are deemed nottoreflectfairvaluearestatedatfairvalueasdeterminedingoodfaithbytheValuationCommittee.Theobjectiveofanyfairvaluepricingdeterminationistoarriveatapricethatcouldreasonablybeexpectedfromacurrentsale.FinancialinstrumentsfairvaluedbytheValuationCommitteeareprimarilyprivateplacements,restrictedsecurities,warrants,rights,andothersecuritiesthatarenotpubliclytraded.
Proof #6
36
T. Rowe Price Limited-Term Bond Portfolio
SubjecttooversightbytheBoard,theValuationCommitteeregularlymakesgoodfaithjudgmentstoestablishandadjustthefairvaluationsofcertainsecuritiesaseventsoccurandcircumstanceswarrant.Forinstance,indeterminingthefairvalueoftroubledorthinlytradeddebtinstruments,theValuationCommitteeconsidersavarietyoffactors,whichmayinclude,butarenotlimitedto,theissuer’sbusinessprospects,itsfinancialstandingandperformance,recentinvestmenttransactionsintheissuer,strategiceventsaffectingthecompany,marketliquidityfortheissuer,andgeneraleconomicconditionsandevents.Inconsultationwiththeinvestmentandpricingteams,theValuationCommitteewilldetermineanappropriatevaluationtechniquebasedonavailableinformation,whichmayincludebothobservableandunobservableinputs.TheValuationCommitteetypicallywillaffordgreatestweighttoactualpricesinarm’slengthtransactions,totheextenttheyrepresentorderlytransactionsbetweenmarketparticipants,transactioninformationcanbereliablyobtained,andpricesaredeemedrepresentativeoffairvalue.However,theValuationCommitteemayalsoconsiderothervaluationmethodssuchasadiscountorpremiumfrommarketvalueofasimilar,freelytradedsecurityofthesameissuer;discountedcashflows;yieldtomaturity;orsomecombination.Fairvaluedeterminationsarereviewedonaregularbasisandupdatedasinformationbecomesavailable,includingactualpurchaseandsaletransactionsoftheissue.Becauseanyfairvaluedeterminationinvolvesasignificantamountofjudgment,thereisadegreeofsubjectivityinherentinsuchpricingdecisions,andfairvaluepricesdeterminedbytheValuationCommitteecoulddifferfromthoseofothermarketparticipants.Dependingontherelativesignificanceofunobservableinputs,includingthevaluationtechnique(s)used,fairvaluedsecuritiesmaybecategorizedinLevel2or3ofthefairvaluehierarchy.
Valuation Inputs Thefollowingtablesummarizesthefund’sfinancialinstruments,basedontheinputsusedtodeterminetheirfairvaluesonJune30,2016:
Significant Significant Quoted Observable unobservable Prices Inputs Inputs AssetsInvestmentsinSecurities,except: $ – $ 409,354 $ – $ 409,354
Short-TermInvestments 3,448 – – 3,448
TotalSecurities 3,448 409,354 – 412,802
Swaps – 7 – 7
FuturesContracts 22 – – 22
Total $ 3,470 $ 409,361 $ – $ 412,831
($000s) Total ValueLevel 3Level 2Level 1
TherewerenomaterialtransfersbetweenLevels1and2duringthesixmonthsendedJune30,2016.
NOTE 3 - DERIVATIVE INSTRuMENTS
DuringthesixmonthsendedJune30,2016,thefundinvestedinderivativeinstruments.AsdefinedbyGAAP,aderiva-tiveisafinancialinstrumentwhosevalueisderivedfromanunderlyingsecurityprice,foreignexchangerate,interestrate,indexofpricesorrates,orothervariable;itrequireslittleornoinitialinvestmentandpermitsorrequiresnetsettlement.Thefundinvestsinderivativesonlyiftheexpectedrisksandrewardsareconsistentwithitsinvestmentobjectives,policies,andoverallriskprofile,asdescribedinitsprospectusandStatementofAdditionalInformation.Thefundmayusederivativesforavarietyofpurposes,suchasseekingtohedgeagainstdeclinesinprincipalvalue,increaseyield,investinanassetwithgreaterefficiencyandatalowercostthanispossiblethroughdirectinvestment,ortoadjustportfoliodurationandcreditexposure.Therisksassociatedwiththeuseofderivativesaredifferentfrom,andpotentiallymuchgreaterthan,therisksassociatedwithinvestingdirectlyintheinstrumentsonwhichthederivativesarebased.Thefundatalltimesmaintainssufficientcashreserves,liquidassets,orotherSEC-permittedassettypestocoveritssettlementobligationsunderopenderivativecontracts.
Proof #6
37
T. Rowe Price Limited-Term Bond Portfolio
Thefundvaluesitsderivativesatfairvalueandrecognizeschangesinfairvaluecurrentlyinitsresultsofoperations.Accordingly,thefunddoesnotfollowhedgeaccounting,evenforderivativesemployedaseconomichedges.Generally,thefundaccountsforitsderivativesonagrossbasis.Itdoesnotoffsetthefairvalueofderivativeliabilitiesagainstthefairvalueofderivativeassetsonitsfinancialstatements,nordoesitoffsetthefairvalueofderivativeinstrumentsagainsttherighttoreclaimorobligationtoreturncollateral.
Thefollowingtablesummarizesthefairvalueofthefund’sderivativeinstrumentsheldasofJune30,2016,andtherelatedlocationontheaccompanyingStatementofAssetsandLiabilities,presentedbyprimaryunderlyingriskexposure:
AssetsInterestratederivatives Futures* $ 155
Creditderivatives BilateralSwaps,andPremiums 7
Total $ 162
LiabilitiesInterestratederivatives Futures* $ 143
($000s)Fair Value
Location on Statement ofAssets and Liabilities
*Thefairvaluepresentedincludescumulativegain(loss)onopenfuturescontracts;however,thevaluereflectedontheaccompanyingStatementofAssetsandLiabilitiesisonlytheunsettledvariationmarginreceivable(payable)atthatdate.
Additionally,theamountofgainsandlossesonderivativeinstrumentsrecognizedinfundearningsduringthesixmonthsendedJune30,2016,andtherelatedlocationontheaccompanyingStatementofOperationsissummarizedinthefollowingtablebyprimaryunderlyingriskexposure:
Futures Swaps TotalRealized Gain (Loss)Interestratederivatives $ (244) $ – $ (244)
Creditderivatives – 2 2
Total $ (244) $ 2 $ (242)
Change in unrealized Gain (Loss)Interestratederivatives $ 3 $ – $ 3
Creditderivatives – (1) (1)
Total $ 3 $ (1) $ 2
Location of Gain (Loss) on Statement of Operations($000s)
Counterparty Risk and Collateral Thefundinvestsinderivativesinvariousmarkets,whichexposeittodifferinglevelsofcounterpartyrisk.Counterpartyriskonexchange-tradedandcentrallyclearedderivativecontracts,suchasfutures,exchange-tradedoptions,andcentrallyclearedswaps,isminimalbecausetheclearinghouseprovidesprotectionagainstcounterpartydefaults.Forfuturesandcentrallyclearedswaps,thefundisrequiredtodepositcollateralinanamountequaltoacertainpercentageofthecontractvalue(marginrequirement),andthemarginrequirementmustbemaintainedoverthelifeofthecontract.Eachclearingbroker,initssolediscretion,mayadjustthemarginrequirementsapplicabletothe fund.
Proof #6
38
T. Rowe Price Limited-Term Bond Portfolio
Derivatives,suchasbilateralswaps,forwardcurrencyexchangecontracts,andOTCoptions,thataretransactedandsettledirectlywithacounterparty(bilateralderivatives)exposethefundtogreatercounterpartyrisk.Tomitigatethisrisk,thefundhasenteredintomasternettingarrangements(MNAs)withcertaincounterpartiesthatpermitnetsettlementunderspecifiedconditionsand,forcertaincounterparties,alsoprovidecollateralagreements.MNAsmaybeintheformofInternationalSwapsandDerivativesAssociationmasteragreements(ISDAs)orforeignexchangeletteragreements(FXletters).
MNAsgoverntheabilitytooffsetamountsthefundowesacounterpartyagainstamountsthecounterpartyowesthefund(netsettlement).BothISDAsandFXlettersgenerallyallownetsettlementintheeventofcontractterminationandpermittermination by either party prior to maturity upon the occurrence of certain stated events, such as failure to pay or bankruptcy.Inaddition,ISDAsspecifyotherevents,theoccurrenceofwhichwouldallowoneofthepartiestoterminate.Forexample,adowngradeincreditratingofacounterpartywouldallowthefundtoterminatewhileadeclineinthefund’snetassetsofmorethanacertainpercentagewouldallowthecounterpartytoterminate.Upontermination,allbilateralderivativeswiththatcounterpartywouldbeliquidatedandanetamountsettled.ISDAstypicallyincludecollateralagreementswhereasFXlettersdonot.Collateralrequirementsaredeterminedbasedonthenetaggregateunrealizedgainorlossonallbilateralderivativeswitheachcounterparty,subjecttominimumtransferamountsthattypicallyrangefrom$100,000to$250,000.Anyadditionalcollateralrequiredduetochangesinsecurityvaluesistransferredthenextbusinessday.
CollateralmaybeintheformofcashordebtsecuritiesissuedbytheU.S.governmentorrelatedagencies.Cashandcurrenciespostedbythefundarereflectedascashdepositsintheaccompanyingfinancialstatementsandgenerallyarerestrictedfromwithdrawalbythefund;securitiespostedbythefundaresonotedintheaccompanyingPortfolioofInvestments;bothremaininthefund’sassets.Collateralpledgedbycounterpartiesisnotincludedinthefund’sassetsbecausethefunddoesnotobtaineffectivecontroloverthoseassets.Forbilateralderivatives,collateralpostedorreceivedbythefundisheldinasegregatedaccountbythefund’scustodian.AsofJune30,2016,nocollateralwaspledgedbyeitherthefundorcounterpartiesforbilateralderivatives.AsofJune30,2016,securitiesvaluedat$50,000hadbeenpostedbythefundforexchange-tradedand/orcentrallyclearedderivatives.
Futures Contracts Thefundissubjecttointerestrateriskinthenormalcourseofpursuingitsinvestmentobjectivesandusesfuturescontractstohelpmanagesuchrisk.Thefundmayenterintofuturescontractstomanageexposuretointerestrateandyieldcurvemovements,securityprices,foreigncurrencies,creditquality,andmortgageprepayments;asanefficientmeansofadjustingexposuretoallorpartofatargetmarket;toenhanceincome;asacashmanagementtool;ortoadjustportfoliodurationandcreditexposure.Afuturescontractprovidesforthefuturesalebyonepartyandpurchasebyanotherofaspecifiedamountofaspecificunderlyingfinancialinstrumentatanagreed-uponprice,date,time,andplace.Thefundcurrentlyinvestsonlyinexchange-tradedfutures,whichgenerallyarestandardizedastomaturitydate,underlyingfinancialinstrument,andothercontractterms.Paymentsaremadeorreceivedbythefundeachdaytosettledailyfluctuationsinthevalueofthecontract(variationmargin),whichreflectchangesinthevalueoftheunderlyingfinancialinstrument.Variationmarginisrecordedasunrealizedgainorlossuntilthecontractisclosed.Thevalueofafuturescontractincludedinnetassetsistheamountofunsettledvariationmargin;netvariationmarginreceivableisreflectedasanasset,andnetvariationmarginpayableisreflectedasaliabilityontheaccompanyingStatementofAssetsandLiabilities.Risksrelatedtotheuseoffuturescontractsincludepossibleilliquidityofthefuturesmarkets,contractpricesthatcanbehighlyvolatileandimperfectlycorrelatedtomovementsinhedgedsecurityvaluesand/orinterestrates,andpotentiallossesinexcessofthefund’sinitialinvestment.DuringthesixmonthsendedJune30,2016,thevolumeofthefund’sactivityinfutures,basedonunderlyingnotionalamounts,wasgenerallybetween2%and8%ofnetassets.
Swaps Thefundissubjecttocreditriskinthenormalcourseofpursuingitsinvestmentobjectivesandusesswapcontractstohelpmanagesuchrisk.Thefundmayuseswapsinanefforttomanageexposuretochangesininterestrates,inflationrates,andcreditquality;toadjustoverallexposuretocertainmarkets;toenhancetotalreturnorprotectthevalueofportfoliosecurities;toserveasacashmanagementtool;ortoadjustportfoliodurationandcreditexposure.Swapagreementscanbesettledeitherdirectlywiththecounterparty(bilateralswap)orthroughacentralclearinghouse(centrallyclearedswap).Fluctuationsinthefairvalueofacontractarereflectedinunrealizedgainorlossandarereclassifiedtorealizedgainorlossuponcontractterminationorcashsettlement.Netperiodicreceiptsorpaymentsrequiredbyacontractincreaseordecrease,respectively,thevalueofthecontractuntilthecontractualpaymentdate,atwhichtimesuchamountsarereclassifiedfromunrealizedtorealizedgainorloss.Forbilateralswaps,cashpaymentsare
Proof #6
39
T. Rowe Price Limited-Term Bond Portfolio
madeorreceivedbythefundonaperiodicbasisinaccordancewithcontractterms;unrealizedgainoncontractsandpremiums paid are reflected as assets and unrealized loss on contracts and premiums received are reflected as liabilities on theaccompanyingStatementofAssetsandLiabilities.Forcentrallyclearedswaps,paymentsaremadeorreceivedbythefundeachdaytosettlethedailyfluctuationinthevalueofthecontract(variationmargin).Accordingly,thevalueofacentrallyclearedswapincludedinnetassetsistheunsettledvariationmargin;netvariationmarginreceivableisreflectedasanassetandnetvariationmarginpayableisreflectedasaliabilityontheaccompanyingStatementofAssetsandLiabilities.
Creditdefaultswapsareagreementswhereoneparty(theprotectionbuyer)agreestomakeperiodicpaymentstoanotherparty(theprotectionseller)inexchangeforprotectionagainstspecifiedcreditevents,suchascertaindefaultsandbankruptciesrelatedtoanunderlyingcreditinstrument,orissuerorindexofsuchinstruments.Uponoccurrenceofaspecifiedcreditevent,theprotectionsellerisrequiredtopaythebuyerthedifferencebetweenthenotionalamountoftheswapandthevalueoftheunderlyingcredit,eitherintheformofanetcashsettlementorbypayingthegrossnotionalamountandacceptingdeliveryoftherelevantunderlyingcredit.Forcreditdefaultswapswheretheunderlyingcreditisanindex,aspecifiedcrediteventmayaffectallorindividualunderlyingsecuritiesincludedintheindexandwillbesettledbasedupontherelativeweightingoftheaffectedunderlyingsecurity(ies)withintheindex.Generally,thepaymentriskforthesellerofprotectionisinverselyrelatedtothecurrentmarketpriceorcreditratingoftheunderlyingcreditorthemarketvalueofthecontractrelativetothenotionalamount,whichareindicatorsofthemarkets’valuationofcreditquality.AsofJune30,2016,thenotionalamountofprotectionsoldbythefundtotaled$340,000(0.1%ofnetassets),whichreflectsthemaximumpotentialamountthefundcouldberequiredtopayundersuchcontracts.Risksrelatedtothe use of credit default swaps include the possible inability of the fund to accurately assess the current and future credit-worthinessofunderlyingissuers,thepossiblefailureofacounterpartytoperforminaccordancewiththetermsoftheswapagreements,potentialgovernmentregulationthatcouldadverselyaffectthefund’sswapinvestments,andpotentiallossesinexcessofthefund’sinitialinvestment.
DuringthesixmonthsendedJune30,2016,thevolumeofthefund’sactivityinswaps,basedonunderlyingnotionalamounts,wasgenerallylessthan1%ofnetassets.
NOTE 4 - OTHER INVESTMENT TRANSACTIONS
Consistentwithitsinvestmentobjective,thefundengagesinthefollowingpracticestomanageexposuretocertainrisksand/ortoenhanceperformance.Theinvestmentobjective,policies,program,andriskfactorsofthefundaredescribedmorefullyinthefund’sprospectusandStatementofAdditionalInformation.
Restricted Securities Thefundmayinvestinsecuritiesthataresubjecttolegalorcontractualrestrictionsonresale.Prompt sale of such securities at an acceptable price may be difficult and may involve substantial delays and additional costs.
TBA Purchase and Sale Commitments Thefundmayenterintoto-be-announced(TBA)purchaseorsalecommitments,pursuanttowhichitagreestopurchaseorsell,respectively,mortgage-backedsecuritiesforafixedunitprice,withpaymentanddeliveryatascheduledfuturedatebeyondthecustomarysettlementperiodforsuchsecurities.WithTBAtransactions,theparticularsecuritiestobedeliveredarenotidentifiedatthetradedate;however,deliveredsecuritiesmustmeetspecifiedterms,includingissuer,rate,andmortgageterm,andbewithinindustry-accepted“gooddelivery”standards.ThefundmayenterintoTBApurchasetransactionswiththeintentionoftakingpossessionoftheunderlyingsecurities,mayelecttoextendthesettlementby“rolling”thetransaction,and/ormayuseTBAstogaininterimexposuretounderlyingsecurities.Untilsettlement,thefundmaintainsliquidassetssufficienttosettleitsTBAcommitments.
Tomitigatecounterpartyrisk,thefundhasenteredintoagreementswithTBAcounterpartiesthatprovideforcollateralandtherighttooffsetamountsduetoorfromthosecounterpartiesunderspecifiedconditions.Subjecttominimumtransferamounts,collateralrequirementsaredeterminedandtransfersmadebasedonthenetaggregateunrealizedgainorlossonallTBAcommitmentswithaparticularcounterparty.Atanytime,thefund’sriskoflossfromaparticularcounter-partyrelatedtoitsTBAcommitmentsistheaggregateunrealizedgainonappreciatedTBAsinexcessofunrealizedlossondepreciatedTBAsandcollateralreceived,ifany,fromsuchcounterparty.AsofJune30,2016,nocollateralwaspledgedbythefundorcounterpartiesforTBAs.
Proof #6
40
T. Rowe Price Limited-Term Bond Portfolio
Mortgage-Backed Securities Thefundmayinvestinmortgage-backedsecurities(MBSorpass-throughcertificates)thatrepresentaninterestinapoolofspecificunderlyingmortgageloansandentitlethefundtotheperiodicpaymentsofprincipalandinterestfromthosemortgages.MBSmaybeissuedbygovernmentagenciesorcorporations,orprivateissuers.MostMBSissuedbygovernmentagenciesareguaranteed;however,thedegreeofprotectiondiffersbasedontheissuer.MBSaresensitivetochangesineconomicconditionsthataffecttherateofprepaymentsanddefaultsontheunderlyingmortgages;accordingly,thevalue,income,andrelatedcashflowsfromMBSmaybemorevolatilethanotherdebt instruments.
Other Purchasesandsalesofportfoliosecuritiesotherthanshort-termandU.S.governmentsecuritiesaggregated$74,735,000and$55,153,000,respectively,forthesixmonthsendedJune30,2016.PurchasesandsalesofU.S.governmentsecuritiesaggregated$75,212,000and$112,462,000,respectively,forthesixmonthsendedJune30,2016.
NOTE 5 - FEDERAL INCOME TAxES
NoprovisionforfederalincometaxesisrequiredsincethefundintendstocontinuetoqualifyasaregulatedinvestmentcompanyunderSubchapterMoftheInternalRevenueCodeanddistributetoshareholdersallofitstaxableincomeandgains.Distributionsdeterminedinaccordancewithfederalincometaxregulationsmaydifferinamountorcharacterfromnetinvestmentincomeandrealizedgainsforfinancialreportingpurposes.Financialreportingrecordsareadjustedforpermanentbook/taxdifferencestoreflecttaxcharacterbutarenotadjustedfortemporarydifferences.Theamountandcharacteroftax-basisdistributionsandcompositionofnetassetsarefinalizedatfiscalyear-end;accordingly,tax-basisbalances have not been determined as of the date of this report.
Thefundintendstoretainrealizedgainstotheextentofavailablecapitallosscarryforwards.Netrealizedcapitallossesmaybecarriedforwardindefinitelytooffsetfuturerealizedcapitalgains.AsofDecember31,2015,thefundhad$1,087,000ofavailablecapitallosscarryforwards.
AtJune30,2016,thecostofinvestmentsforfederalincometaxpurposeswas$410,402,000.Netunrealizedgainaggregated$2,418,000atperiod-end,ofwhich$3,410,000relatedtoappreciatedinvestmentsand$992,000relatedtodepreciated investments.
NOTE 6 - RELATED PARTy TRANSACTIONS
ThefundismanagedbyT.RowePriceAssociates,Inc.(PriceAssociates),awhollyownedsubsidiaryofT.RowePriceGroup,Inc.(PriceGroup).TheinvestmentmanagementandadministrativeagreementbetweenthefundandPriceAssociatesprovidesforanall-inclusiveannualfeeequalto0.70%ofthefund’saveragedailynetassets.Thefeeiscomputeddailyandpaidmonthly.Theall-inclusivefeecoversinvestmentmanagement,shareholderservicing,transferagency,accounting,andcustodyservicesprovidedtothefund,aswellasfunddirectors’feesandexpenses.Interest,taxes,brokeragecommissions,andextraordinaryexpensesarepaiddirectlybythefund.
ThefundmayinvestintheT.RowePriceReserveInvestmentFund,theT.RowePriceGovernmentReserveInvestmentFund,ortheT.RowePriceShort-TermReserveFund(collectively,thePriceReserveInvestmentFunds),open-endmanagementinvestmentcompaniesmanagedbyPriceAssociatesandconsideredaffiliatesofthefund.ThePriceReserveInvestmentFundsareofferedasshort-terminvestmentoptionstomutualfunds,trusts,andotheraccountsmanagedbyPriceAssociatesoritsaffiliatesandarenotavailablefordirectpurchasebymembersofthepublic.ThePriceReserveInvestmentFundspaynoinvestmentmanagementfees.
The fund may participate in securities purchase and sale transactions with other funds or accounts advised by Price Associates(crosstrades),inaccordancewithproceduresadoptedbythefund’sBoardandSecuritiesandExchangeCommissionrules,whichrequire,amongotherthings,thatsuchpurchaseandsalecrosstradesbeeffectedattheindependentcurrentmarketpriceofthesecurity.DuringthesixmonthsendedJune30,2016,thefundhadnopurchasesorsalescrosstradeswithotherfundsoraccountsadvisedbyPriceAssociates.

Proof #6
41
T. Rowe Price Limited-TermBondPortfolio
Information on Proxy Voting Policies, Procedures, and Records
AdescriptionofthepoliciesandproceduresusedbyT.RowePricefundsandportfoliostodeterminehowtovoteproxiesrelatingtoportfoliosecuritiesisavailableineachfund’sStatementofAdditionalInformation.Youmayrequestthisdocumentbycalling1-800-225-5132orbyaccessingtheSEC’swebsite,sec.gov.
Thedescriptionofourproxyvotingpoliciesandproceduresisalsoavailableonourcorporatewebsite.Toaccessit,pleasevisitthefollowingWebpage
https://www3.troweprice.com/usis/corporate/en/utility/policies.html
andscrolldowntothesectionnearthebottomofthepagethatsays,“ProxyVotingPolicies.”ClickontheProxyVotingPolicieslinkintheshadedbox.
Eachfund’smostrecentannualproxyvotingrecordisavailableonourwebsiteandthroughtheSEC’swebsite.ToaccessitthroughT.RowePrice,visitthewebsitelocationshownabove,andscrolldowntothesectionnearthebottomofthepagethatsays,“ProxyVotingRecords.”ClickontheProxyVotingRecordslinkintheshadedbox.
How to Obtain Quarterly Portfolio Holdings
ThefundfilesacompletescheduleofportfolioholdingswiththeSecuritiesandExchangeCommissionforthefirstandthirdquartersofeachfiscalyearonFormN-Q.Thefund’sFormN-QisavailableelectronicallyontheSEC’swebsite(sec.gov);hardcopiesmaybereviewedandcopiedattheSEC’sPublicReferenceRoom,100FSt.N.E.,Washington,DC20549.FormoreinformationonthePublicReferenceRoom,call1-800-SEC-0330.
Proof #6
42
Approval of Investment Management Agreement
OnMarch11,2016,thefund’sBoardofDirectors(Board),includingamajorityofthefund’sindependentdirectors,approvedthecontinuationoftheinvestmentmanagementagreement(AdvisoryContract)betweenthefundanditsinvestmentadvisor,T.RowePriceAssociates,Inc.(Advisor).Inconnectionwithitsdeliberations,theBoardrequested,andtheAdvisorprovided,suchinformationastheBoard(withadvicefromindependentlegalcounsel)deemedreasonablynecessary.TheBoardconsideredavarietyoffactorsinconnectionwithitsreviewoftheAdvisoryContract,alsotakingintoaccountinformationprovidedbytheAdvisorduringthecourseoftheyear,asdiscussedbelow:
Services Provided by the AdvisorTheBoardconsideredthenature,quality,andextentoftheservicesprovidedtothefundbytheAdvisor.Theseservicesincluded,butwerenotlimitedto,directingthefund’sinvestmentsinaccordancewithitsinvestmentprogramandtheoverallmanagementofthefund’sportfolio,aswellasavarietyofrelatedactivitiessuchasfinancial,investmentoperations,andadministrativeservices;compliance;maintainingthefund’srecordsandregistrations;andshareholdercommunications.TheBoardalsoreviewedthebackgroundandexperienceoftheAdvisor’sseniormanagementteamandinvestmentpersonnelinvolvedinthemanagementofthefund,aswellastheAdvisor’scompliancerecord.TheBoardconcludedthatitwassatisfiedwiththenature,quality,andextentoftheservicesprovidedbytheAdvisor.
Investment Performance of the Fund TheBoardreviewedthefund’sthree-month,one-year,andyear-by-yearreturns,aswellasthefund’saverageannualizedtotalreturnsoverthe3-,5-,and10-yearperiods,andcomparedthesereturnswithawidevarietyofcomparableperformancemeasuresandmarketdata,includingthosesuppliedbyLipperandMorningstar,whichareindependentproviders of mutual fund data.
OnthebasisofthisevaluationandtheBoard’songoingreviewofinvestmentresults,andfactoringintherelativemarketconditionsduringcertainoftheperformanceperiods,theBoardconcludedthatthefund’sperformancewassatisfactory.
Costs, Benefits, Profits, and Economies of ScaleTheBoardrevieweddetailedinformationregardingtherevenuesreceivedbytheAdvisorundertheAdvisoryContractandotherbenefitsthattheAdvisor(anditsaffiliates)mayhaverealizedfromitsrelationshipwiththefund,includinganyresearchreceivedunder“softdollar”agreementsandcommission-sharingarrangementswithbroker-dealers.TheBoardconsideredthattheAdvisormayreceivesomebenefitfromsoft-dollararrangementspursuanttowhichresearchisreceivedfrombroker-dealersthatexecutetheapplicablefund’sportfoliotransactions.TheBoardreceivedinformationontheestimatedcostsincurredandprofitsrealizedbytheAdvisorfrommanagingT.RowePricemutualfunds.TheBoardalsoreviewedestimatesoftheprofitsrealizedfrommanagingthefundinparticular,andtheBoardconcludedthattheAdvisor’sprofitswerereasonableinlightoftheservicesprovidedtothefund.
TheBoardalsoconsideredwhetherthefundbenefitsunderthefeelevelssetforthintheAdvisoryContractfromanyeconomiesofscalerealizedbytheAdvisor.TheBoardnotedthat,undertheAdvisoryContract,thefundpaystheAdvisorasinglefee,orall-inclusivemanagementfee,whichisbasedonthefund’saveragedailynetassets.Theall-inclusivemanagementfeeincludesinvestmentmanagementservicesandprovidesfortheAdvisortopayallofthefund’sordinary,recurringoperatingexpensesexceptforinterest,taxes,portfoliotransactionfees,andanynonrecurringextraordinaryexpensesthatmayarise.TheBoardconcludedthat,basedontheprofitabilitydataitreviewedandconsistentwiththisall-inclusivemanagementfeestructure,theAdvisoryContractprovidedforareasonablesharingofanybenefitsfromeconomies of scale with the fund.
FeesTheBoardwasprovidedwithinformationregardingindustrytrendsinmanagementfeesandexpenses,andtheBoardreviewedthefund’smanagementfeerateandtotalexpenseratio(fortheOriginalClassandIIClass)incomparisonwithfeesandexpensesofothercomparablefundsbasedoninformationanddatasuppliedbyLipper.Forthesepurposes,theBoardassumedthatthefund’smanagementfeeratewasequaltotheall-inclusivemanagementfeeratelessthefund’sactualoperatingexpenses,andthetotalexpenseratiowasequaltotheall-inclusivemanagementfeerate.TheinformationprovidedtotheBoardindicatedthatthefund’smanagementfeerateandtotalexpenseratio(forbothclasses)wereabovethe median for comparable funds.
T. Rowe Price Limited-TermBondPortfolio
Proof #6
43
Approval of Investment Management Agreement (continued)
TheBoardalsoreviewedthefeeschedulesforinstitutionalaccounts(includingsubadvisedmutualfunds)andprivateaccountswithsimilarmandatesthatareadvisedorsubadvisedbytheAdvisoranditsaffiliates.ManagementprovidedtheBoardwithinformationabouttheAdvisor’sresponsibilitiesandservicesprovidedtosubadvisoryandotherinstitutionalaccountclients,includinginformationabouthowtherequirementsandeconomicsoftheinstitutionalbusinessdifferfromthoseoftheAdvisor’sproprietarymutualfundbusiness.TheBoardconsideredinformationshowingthattheAdvisor’sproprietarymutualfundbusinessisgenerallymorecomplexfromabusinessandcomplianceperspectivethanitsinstitu-tionalaccountbusiness,andconsideredvariousotherrelevantfactors,includingthebroaderscopeofoperationsandoversight,moreextensiveshareholdercommunicationinfrastructure,greaterassetflows,heightenedbusinessrisks,anddifferencesinapplicablelawsandregulationsassociatedwiththeAdvisor’sproprietarymutualfundbusiness.Inassessingthereasonablenessofthefund’smanagementfeerate,theBoardconsideredthedifferencesinthenatureoftheservicesrequiredfortheAdvisortomanageitsproprietarymutualfundbusinessversusmanagingadiscretepoolofassetsasasubadvisortoanotherinstitution’smutualfundorforanotherinstitutionalaccountandthedegreetowhichtheAdvisorperformssignificantadditionalservicesandassumesgreaterriskinmanagingthefundandotherT.RowePricemutualfunds than it does for institutional account clients.
Onthebasisoftheinformationprovidedandthefactorsconsidered,theBoardconcludedthatthefeespaidbythefundundertheAdvisoryContractarereasonable.
Approval of the Advisory Contract Asnoted,theBoardapprovedthecontinuationoftheAdvisoryContract.Nosinglefactorwasconsideredinisolationortobedeterminativetothedecision.Rather,theBoardconcluded,inlightofaweightingandbalancingofallfactorsconsidered,thatitwasinthebestinterestsofthefundanditsshareholdersfortheBoardtoapprovethecontinuationoftheAdvisoryContract(includingthefeestobechargedforservicesthereunder).Theindependentdirectorswereadvisedthroughouttheprocessbyindependentlegalcounsel.
T. Rowe Price Limited-TermBondPortfolio

Proof #6
This page intentionally left blank.

Proof #6
This page intentionally left blank.

Proof #6
2016-US-24579 E303-051 8/16
100EastPrattStreet Baltimore,MD21202

Proof #4
Personal Strategy Balanced Portfolio
June 30, 2016
Semiannual Report
This report is authorized for distribution only to those who have received a copy of the portfolio’s prospectus.
T. Rowe Price Investment Services, Inc., Distributor.
Proof #4
T. Rowe Price Personal Strategy Balanced Portfolio
Highlights
•U.S.stocksendedarockyfirsthalfof2016slightlyhigher,asglobalmarketsshowedsignsofrecoveryfollowinganinitialsell-offaftertheUKvotedtoleavetheEuropeanUnion(commonlyreferredtoasBrexit).Emergingmarketsstocksroseasriskappetiterebounded,butdevelopedmarketsstocksoutsidetheU.S.retreated.
•U.S.investment-gradebondspostedasolidgainovertheperiod,whilehighyieldbondshaveralliedinmorerecentmonths.Non-U.S.dollar-denominateddebtsurgedasyieldsondevelopedworldsovereigndebtplungedafterBrexitonsafe-havendemandandtheeuroandyenstrengthenedagainsttheU.S.dollar.Emergingmarketsdebtperformedstrongly.
•ThePersonalStrategyBalancedPortfolioreturned2.47%forthesixmonthsendedJune30,2016,underperformingitscombinedindexportfolioandLipperpeergroupaverage.
•ThesurgeinmarketvolatilityassociatedwiththeBrexitvotehighlightstheimportanceofportfoliodiversification.Whileourglobalgrowthexpectationsforthenextseveralquartersaremodest,webelievethatthePersonalStrategyBalancedPortfolio’sbroadlydiversifiedholdingscanserveasballastforinvestorsintimesofmarketuncertainty.
The views and opinions in this report were current as of June 30, 2016. They are not guarantees of performance or investment results and should not be taken as investment advice. Investment decisions reflect a variety of factors, and the managers reserve the right to change their views about individual stocks, sectors, and the markets at any time. As a result, the views expressed should not be relied upon as a forecast of the fund’s future investment intent. The report is certified under the Sarbanes-Oxley Act, which requires mutual funds and other public companies to affirm that, to the best of their knowledge, the information in their financial reports is fairly and accurately stated in all material respects.
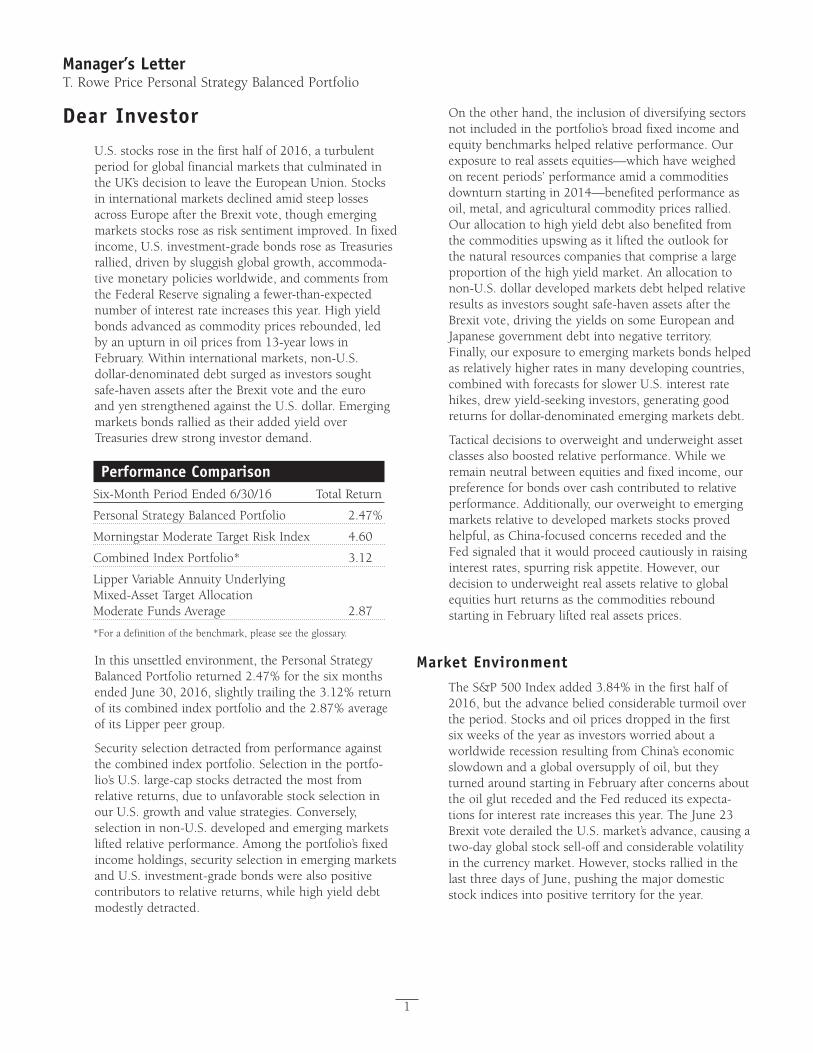
Proof #4
1
Manager’s LetterT. Rowe Price Personal Strategy Balanced Portfolio
Dear InvestorU.S.stocksroseinthefirsthalfof2016,aturbulentperiodforglobalfinancialmarketsthatculminatedintheUK’sdecisiontoleavetheEuropeanUnion.StocksininternationalmarketsdeclinedamidsteeplossesacrossEuropeaftertheBrexitvote,thoughemergingmarketsstocksroseasrisksentimentimproved.Infixedincome,U.S.investment-gradebondsroseasTreasuriesrallied,drivenbysluggishglobalgrowth,accommoda-tive monetary policies worldwide, and comments from theFederalReservesignalingafewer-than-expectednumberofinterestrateincreasesthisyear.Highyieldbonds advanced as commodity prices rebounded, led byanupturninoilpricesfrom13-yearlowsinFebruary.Withininternationalmarkets,non-U.S.dollar-denominateddebtsurgedasinvestorssoughtsafe-havenassetsaftertheBrexitvoteandtheeuroandyenstrengthenedagainsttheU.S.dollar.EmergingmarketsbondsralliedastheiraddedyieldoverTreasuriesdrewstronginvestordemand.
Performance ComparisonSix-MonthPeriodEnded6/30/16 TotalReturn
PersonalStrategyBalancedPortfolio 2.47%
MorningstarModerateTargetRiskIndex 4.60
CombinedIndexPortfolio* 3.12
LipperVariableAnnuityUnderlying Mixed-AssetTargetAllocation ModerateFundsAverage 2.87
*Foradefinitionofthebenchmark,pleaseseetheglossary.
Inthisunsettledenvironment,thePersonalStrategyBalancedPortfolioreturned2.47%forthesixmonthsendedJune30,2016,slightlytrailingthe3.12%returnofitscombinedindexportfolioandthe2.87%averageofitsLipperpeergroup.
Securityselectiondetractedfromperformanceagainstthecombinedindexportfolio.Selectionintheportfo-lio’sU.S.large-capstocksdetractedthemostfromrelativereturns,duetounfavorablestockselectioninourU.S.growthandvaluestrategies.Conversely,selectioninnon-U.S.developedandemergingmarketsliftedrelativeperformance.Amongtheportfolio’sfixedincomeholdings,securityselectioninemergingmarketsandU.S.investment-gradebondswerealsopositivecontributorstorelativereturns,whilehighyielddebtmodestly detracted.
Ontheotherhand,theinclusionofdiversifyingsectorsnotincludedintheportfolio’sbroadfixedincomeandequitybenchmarkshelpedrelativeperformance.Ourexposuretorealassetsequities—whichhaveweighedon recent periods’ performance amid a commodities downturnstartingin2014—benefitedperformanceasoil,metal,andagriculturalcommoditypricesrallied.Ourallocationtohighyielddebtalsobenefitedfromthecommoditiesupswingasitliftedtheoutlookforthenaturalresourcescompaniesthatcomprisealargeproportionofthehighyieldmarket.Anallocationtonon-U.S.dollardevelopedmarketsdebthelpedrelativeresultsasinvestorssoughtsafe-havenassetsaftertheBrexitvote,drivingtheyieldsonsomeEuropeanandJapanesegovernmentdebtintonegativeterritory.Finally,ourexposuretoemergingmarketsbondshelpedasrelativelyhigherratesinmanydevelopingcountries,combinedwithforecastsforslowerU.S.interestratehikes,drewyield-seekinginvestors,generatinggoodreturnsfordollar-denominatedemergingmarketsdebt.
Tacticaldecisionstooverweightandunderweightassetclassesalsoboostedrelativeperformance.Whileweremainneutralbetweenequitiesandfixedincome,ourpreference for bonds over cash contributed to relative performance.Additionally,ouroverweighttoemergingmarketsrelativetodevelopedmarketsstocksprovedhelpful, as China-focused concerns receded and the Fedsignaledthatitwouldproceedcautiouslyinraisinginterestrates,spurringriskappetite.However,ourdecisiontounderweightrealassetsrelativetoglobalequitieshurtreturnsasthecommoditiesreboundstartinginFebruaryliftedrealassetsprices.
Market EnvironmentTheS&P500Indexadded3.84%inthefirsthalfof2016,buttheadvancebeliedconsiderableturmoilovertheperiod.StocksandoilpricesdroppedinthefirstsixweeksoftheyearasinvestorsworriedaboutaworldwiderecessionresultingfromChina’seconomicslowdownandaglobaloversupplyofoil,buttheyturnedaroundstartinginFebruaryafterconcernsabouttheoilglutrecededandtheFedreduceditsexpecta-tionsforinterestrateincreasesthisyear.TheJune23BrexitvotederailedtheU.S.market’sadvance,causingatwo-dayglobalstocksell-offandconsiderablevolatilityinthecurrencymarket.However,stocksralliedinthelastthreedaysofJune,pushingthemajordomesticstockindicesintopositiveterritoryfortheyear.
Proof #4
2
Major Index ReturnsSix-MonthPeriodEnded6/30/16
S&P500Index 3.84%
MSCIAllCountryWorldIndexexUSA -0.67
MSCIEmergingMarketsIndex 6.60
BarclaysU.S.AggregateBondIndex 5.31
Citigroup3-MonthTreasuryBillIndex 0.12
CreditSuisseHighYieldIndex 9.30
Note:Unlikestocksandbonds,U.S.Treasuriesareguaranteedastothe timely payment of principal and interest.
StocksindevelopedEuropeanmarketsfellasunevenglobalgrowth,slowdownsinseveralemergingmarkets,andBrexit-induceduncertaintyweighedontheregion’soutlook.Annualeconomicgrowthintheeurozoneedgedup1.7%inthefirstquarter,thoughtheBrexitvote caused many private economists to reduce their Europeanandglobalgrowthforecastsfornextyear.EuropeanCentralBank(ECB)officialswarnedthatBrexitwouldhurttheeurozone’srecoverybutsignaledthatfreshstimulusmeasureswereunlikelyaftertheECBalreadyexpandeditsstimulusprograminMarch.Japanesestocksretreatedasthecountry’seconomystayedweakdespitemorethanthreeyearsofsustainedstimulus.Japan’seconomyreboundedinthisyear’sfirstquarteraftercontractinginthefinalquarterof2015,butthetenuousrecoveryledthegovernmenttodelayalong-plannedsalestaxincreaseuntil2019.
EmergingmarketsstocksadvancedasthecommoditiesrallybrightenedtheoutlookforcommodityexportersinthedevelopingworldandChinasteppedupeffortstocushionitseconomyfromaslowdown,thoughBrazilandRussiaremainedinrecession.Mostemergingmarketscurrenciesstrengthenedagainstthedollaroverthepastsixmonths,reversingearlierdeclinesthathadpushedcurrenciesinmanydevelopingcountriestorecord lows early this year.
Interest Rate Levels
Source: Federal Reserve Board.
10-Year Treasury Note5-Year Treasury Note90-Day Treasury Bill
3.5%
3.0
2.5
2.0
1.5
1.0
0.5
0.0
-0.56/30/15 9/15 12/15 3/16 6/30/16
U.S.investment-gradebondsrose.Intermediate-andlong-termbondpricesroseandinterestratestumbledastheFedrefrainedfromraisingshort-termratesduetomixedeconomicdata,globalriskstotheU.S.economy,andcontinuedlowinflation.Long-termTreasuriessurgedasinvestorsfledtosafetyaftertheBrexitdecision,pushingtheyieldonthebenchmark10-yearnotedowntoanear-recordlowattheendofJune.TreasuriesalsobenefitedfromstrongforeigndemandforU.S.governmentdebt,whichofferedrelativelyhigheryieldscomparedwiththenegative-yieldingsovereignbondsinmanydevelopedcountries.Highyieldbondsoutpacedinvestment-gradedebtas credit spreads narrowed and the rally in oil and other commodities lifted bonds issued by natural resources companies.
Non-U.S.dollarbondsindevelopedmarketsperformedstronglyasinvestorspiledintosafe-havendebtamidweakeningglobalgrowthexpectationsandtameinflation.BondyieldsinEuropeandJapanfellduetoexpansivemonetarypoliciesandnear-zeroinflationineachmarket.AttheendofJune,Brexit-induceduncer-tainty drove bond yields in many developed countries deeperintonegativeterritory.Theeuroappreciatedslightlyandtheyensurgedroughly17%againstthedollarovertheperiod,liftingreturnsforU.S.-basedinvestors.Dollar-denominatedemergingmarketsdebtalsogeneratedpositivereturnsastheirrelativelyhighyieldsandreducedexpectationsforFedratehikesattractedstronginvestordemand.
Proof #4
3
Portfolio Review and Positioning
TheinvestmentobjectiveofthePersonalStrategyBalancedPortfolioistogeneratethehighesttotalreturnconsistentwithanequalemphasisonbothincome and capital appreciation. The portfolio’s typicalassetmixis60%stocksand40%bonds,cash,andmoneymarketsecurities,althoughallocationscanvarybyasmuchas10percentagepointsaboveorbelowtheselevels.Attheendofourreportingperiod,theportfolio’stargetallocationtoequitiesandfixedincomewas60%and40%,respectively,whichisunchangedfromsixmonthsago.
Asset AllocationThePersonalStrategyBalancedPortfoliohastheabilitytooverweightorunderweightallocationstoassetclassesor sub-asset classes based on the views of the T. Rowe PriceAssetAllocationCommittee.Thecommitteemeetsmonthlytoevaluateeconomic,market,andearningstrends,amongotherfactors,andtolookforopportuni-tiesovera6-to18-monthinvestmenthorizon.Relativevalueisanimportantconsiderationinevaluatingwhichsegmentstooverweightorunderweight.Wetypicallyseektooverweightsegmentsofthemarketthatwebelieveareattractivelyvaluedandunderweightareasthat are more richly valued.
Severalyearsofstrongperformancehavereducedthenumberofcompellinginvestmentopportunities,withvaluations at or above fair value in many asset classes. Given current valuation levels as well as economic, market,andgeopoliticaluncertainties,wearepositionednearneutralacrossseveralmarketsegmentsalthoughwearestillfindingopportunitiesinselectareas.
AsofJune30,2016,weareneutralbetweenstocksandbonds.Corporateearningsgrowthhascontractedwhilestockmarketshavereboundedfromtwodownturnsinthepastsixmonths,leavingvaluationsabovetheirhistoricalaverages.Asforbonds,weexpectmodestreturnsgiventhatthecurrentlow-yieldenvironmentoffersaweakfoundationforfuturereturns,aswellasthe potential for capital losses should interest rates increase.Monetarypoliciesofglobalcentralbanksareexpectedtostayaccommodativeforsometime,whichshouldtemperdownsideriskstobonds.Additionally,webelievethatthepaceofU.S.interestrateincreaseswillbegradualduetosubduedeconomicgrowthandthatstrongdemandforU.S.bondsshouldhelprestrainariseinlong-termyields.
StocksSecurityselectioninU.S.large-capgrowthandvaluestocksdetractedsignificantlyfromrelativeperformance.Healthcarecompanieswerelargedetractorsasthesectorfacedarangeofconcerns,includingcriticismoverdrugpricingpractices,heightenedpoliticalscrutinyofcorporatetaxinversions,andprofittakingfollowingstrongperformancein2015.NotabledetractorsincludedAlexion Pharmaceuticals, Allergan, and Valeant Pharmaceuticals.Ontheotherhand,stocksthatcontributedtoperformanceincludedtechnologyleaders Amazon.com and Facebook, whose shares surgedtorecordlevelsonsurprisinglystrongearningsandforecasts.Utilitiesalsohelpedreturnsasinvestorssoughtoutstable,defensivecompaniesthatpayhighdividend yields. PG&E, AES, and CenterPoint Energy wereamongtheportfolio’sbiggestcontributors.(Pleaserefer to the portfolio of investments for a complete listofholdingsandtheamounteachrepresentsintheportfolio.)
Portfolio Overview Percent of NetAssets 6/30/16
Reserves 4.2%
Bonds 36.9%
Stocks 58.9%
LargestStockHoldingsAmazon.com 1.6%Alphabet 1.1Microsoft 0.9Facebook 0.8GE 0.7Danaher 0.7Priceline 0.7PhilipMorrisInternational 0.7JPMorganChase 0.6TysonFoods 0.6
Note:Theinformationshowndoesnotreflectanyexchange-tradedfunds(ETFs),cashreserves,orcollateralforsecuritieslendingthatmay be held in the portfolio.
WefavorinternationaloverU.S.stocksgivenvaluationsand an environment of supportive monetary policy, thoughwereducedourinternationalstockoverweightinJunetoreflectreducedglobalgrowthexpectationsanditsimpactonlowerearningsgrowth.TheBrexitvotewilllikelyweighoncorporateandconsumerspendinginEuropeaswellasitstradingpartnersand
Proof #4
4
has raised the prospect that other member countries willseektoexitthebloc.Furthermore,lowandnegativebondyieldsinmanycountriesafterBrexithavehighlightedconcernsaboutcreditgrowthandprofitabilityfordevelopedmarketsbanks.
Wefavoremergingoverdevelopedmarketsstocks,thoughwerecentlyparedouroverweightfollowingarallyinemergingmarketsassetsearlythisyear.Whileemergingmarketsstockvaluationsremainbelowlong-termhistoricalaveragesrelativetodevelopedmarkets,sluggishglobaltradeandongoingoversupplyincertaincommoditiesremainnear-termrisks.Additionally,ongoingweaknessformostcommoditieswilllikelyweighonresource-dependenteconomies,althoughservices and consumption-driven countries will benefit from lower prices.
Weincreasedourunderweightinrealassetsrelativetoglobalequitiesearlythisyearafterarallyinenergyandmetalsstocks,andweremainunderweightgivenourcautiousoutlookforenergyandcommodityprices.Asforrealestateinvestmenttrusts(REITs),webelievethatfundamentalsforREITsindevelopedmarketsremainmostlyfavorable.REITvaluationsarevulnerabletorisinginterestratesbutshouldperformwelliftheFedincreasesinterestratesatagradualpace.
WefavorU.S.large-capoversmall-capstocks,butwesteadilyreducedoursmall-capunderweightafterprotractedunderperformanceinsmall-capsbroughttheirrelativevaluationsclosertohistoricalaverages.Althoughrelativevaluationsarenowmoreattractive,heightenedmarketvolatilityandexpectationsforweakerearningsgrowthstillrepresentheadwindsforsmall-capstocks.WefavorU.S.growthovervaluestocks.Afterstartingtheyearneutralbetweenthetwo,weincreasedouroverweighttogrowthstocksatperiod-end based on more attractive valuations and our expectationsforaprotractedlow-growthenvironment.Growth sectors tend to depend less on the level of economicgrowthandhavehistoricallyoutperformedwhengrowthisscarce,whilevaluesectorssuchasenergyandfinancialstendtorelymoreonastrongereconomy,higherinterestrates,andcommoditydemand.
BondsOurallocationstodiversifyingsectorsthatarenotincludedintheportfolio’sbroadfixedincomebench-markshelpedrelativereturnsovertheperiod.Ourexposuretonon-U.S.dollarinternationaldevelopeddebtliftedrelativereturnsasyieldsfellinEuropeandJapanamidaggressivemonetarystimulusandnegative-ratepoliciesineachmarket.Ouremergingmarketsbondsallocationhelpedasrelativelyhigherratesin
manydevelopingcountriesattractedyield-seekinginvestors.Highyielddebtalsocontributedtorelativeperformance as the oil and commodities rally lifted the securitiesofenergyandnaturalresourcescompaniesthatcomprisealargeproportionofhighyieldissuers.
Wemadeanumberofadjustmentstoourhighyieldbondsallocation.Wemovedfromamodestunder-weightallocationlatelastyearasrisksinthehighyieldmarketincreased,takinganoverweightpositionascredit spreads widened to levels that have historically signaledafavorablelong-termbuyingopportunity.Werecentlyparedourhighyieldallocationbacktoneutralfollowingarallyinhighyieldfueledbyareboundincommoditypricesaffectingalargeproportionofhighyield bond issuers.
WearecurrentlyneutralbetweenemergingmarketsandU.S.investment-gradebonds.Wemovedtoamodestoverweightgivenvaluationopportunitiesasriskassetssold off earlier in the year; however, we trimmed our allocationbacktoneutralfollowingstrongperformance.Emergingmarketsbondsappearfairlyvaluedinthecurrentenvironment,thoughweakglobaltrade,lowcommodityprices,andcountry-specificrisksstillposeriskstotheassetclass.Finally,weareneutralbetweennondollarandU.S.investment-gradebondsgiventhatprospectsfortheU.S.dollarversusotherdevelopedmarketscurrenciesappearbalanced.Diminishedexpec-tationsfornear-termFedratehikesafterBrexitwilllikelyrestrainthedollar’sstrength,thoughtheU.S.’srelativelyhighratesshouldsupportthecurrency.
OutlookIncreasedglobaluncertaintyfollowingBrexithasweighedonourglobalgrowthexpectations,whichremainmodestforthenextseveralquarters.TheU.S.andotherdevelopedmarketeconomiesareexpandingatasubduedpace,whilemajoremergingeconomiesarestrugglingwithweakgrowth.Monetarypolicyaroundtheworldisshowingsignsofconvergence,withcentralbanksinEurope,theUK,andJapanexpectedtoexpandstimulusmeasuresgivenlowgrowthaswellastocontainpotentialBrexit-relatedrisks.Meanwhile,theFedisnotexpectedtostartnormalizinginterestratesuntilDecemberattheearliest.RiskstoouroutlookincludeheightenedinstabilitywithinEurope,unforeseenglobalmonetarypolicyactions,andgreatercurrencyvolatility.The rise of populism around the world, and its harmful impactontrade,isanotherrisktoglobalgrowththathasincreasedfollowingtheBrexitvote.

Proof #4
5
TheU.S.economyisgraduallyimprovingthankstosolidprivatesectordemand,animprovingjobmarket,andrisingwages.However,ouroutlookforoverseasdevelopedmarketsismorecautious.BrexithasincreasedthelikelihoodthatothercountrieswillchallengetheirinclusionintheEuropeanUnion,raisingthenear-termgrowthrisksfortheregion.EvenbeforeBrexit,Europewasstrugglingwithstructuralproblemssuchashighdebt,persistentlowinflation,andhighunemployment.GrowthremainsfragileinJapan,whichisstilltryingtoovercomeweakconsumptionanddeflationarypressuresdespitemorethanthreeyearsofAbenomics.Theyen’ssurgethisyearhascreatedanotherheadwindbyincreasingpressureonJapan’sexportsandmakingitharderfortheBankofJapantoreachits2%inflationtarget.
Ouremergingmarketsoutlookisalsomixedgiventhedisparityinfiscalconditionsacrossthedevelopingworld.RussiaandBrazilarebothinrecession,althoughthis year’s commodities rebound and low interest rates globallyshouldhelpsupporttheminthenearterm.Lookingahead,Chinawillcontinuetoexertanout-size influence on investor sentiment. Given China’s importancetotheworldeconomy,howitsgovernmentmanagesthecountry’sslowestgrowthin25yearswillhavesignificantrepercussionsoncommodityprices,trade,andthepaceofglobalgrowth.
Weanticipategreatervolatilityinglobalfinancialmarketsinthecomingmonthsfollowingtherecentuptickinpoliticaluncertaintyandoursubduedgrowthexpectations.Inthisuncertainenvironment,webelievethatthePersonalStrategyBalancedPortfolio’sbroad diversification combined with T. Rowe Price’s
longstandingstrengthsinfundamentalresearchshouldhelpusgeneratesolid,long-termreturnsforour shareholders.
ThankyouforinvestingwithT.RowePrice.
Respectfully submitted,
Charles ShriverPortfolio manager and chairman of the portfolio’s Investment Advisory Committee
July19,2016
The committee chairman has day-to-day responsibility for managing the portfolio and works with committee members in developing and executing the portfolio’s investment program.
Proof #4
6
T. Rowe Price Personal Strategy Balanced Portfolio
Risks of InvestingAswithallstockandbondmutualfunds,eachfund’ssharepricecanfallbecauseofweaknessinthestockorbondmarkets,aparticularindustry,orspecificholdings.Stockmarketscandeclineformanyreasons,includingadversepoliticaloreconomicdevelopments,changesininvestorpsychology,orheavyinstitutionalselling.Theprospects for an industry or company may deteriorate becauseofavarietyoffactors,includingdisappointingearningsorchangesinthecompetitiveenvironment.Inaddition,theinvestmentmanager’sassessmentofcompaniesheldinafundmayproveincorrect,resultinginlossesorpoorperformanceeveninrisingmarkets.
Bondsaresubjecttointerestraterisk,thedeclineinbond prices that usually accompanies a rise in interest rates,andcreditrisk,thechancethatanyfundholdingcouldhaveitscreditratingdowngradedorthatabondissuerwilldefault(failtomaketimelypaymentsofinterestorprincipal),potentiallyreducingthefund’sincomelevelandshareprice.Highyieldcorporatebondscouldhavegreaterpricedeclinesthanfundsthatinvestprimarilyinhigh-qualitybonds.Companiesissuinghighyieldbondsarenotasstrongfinanciallyasthosewithhighercreditratings,sothebondsareusuallyconsideredspeculative investments.
FundsthatinvestoverseasmaycarrymoreriskthanfundsthatinveststrictlyinU.S.assets.Riskscanresultfromvaryingstagesofeconomicandpoliticaldevelop-ment;differingregulatoryenvironments,tradingdays,andaccountingstandards;andhighertransactioncostsofnon-U.S.markets.Non-U.S.investmentsarealsosubjecttocurrencyrisk,oradeclineinthevalueofaforeigncurrencyversustheU.S.dollar,whichreducesthedollarvalue of securities denominated in that currency.
GlossaryBarclays U.S. Aggregate Bond Index:Anunmanagedindexthattracksinvestment-gradebonds,includingcorporate,government,andmortgage-backedsecurities.
Citigroup 3-Month Treasury Bill Index:Anunman-agedindexthattracksshort-termU.S.governmentdebt instruments.
Glossary (continued)Combined index portfolio:UnmanagedportfoliocomposedofthefollowingunderlyingindexesasofJune30,2016:
• Personal Strategy Balanced—60%stocks(42%Russell3000Index,18%MSCIAllCountryWorldIndexexUSA),30%bonds(BarclaysU.S.AggregateBondIndex),and10%moneymarketsecurities(Citigroup3-MonthTreasuryBillIndex).
Credit Suisse High Yield Index:Trackstheperformanceofdomesticnoninvestment-gradecorporatebonds.
Federal funds rate (or target rate): The interest rate chargedonovernightloansofreservesbyonefinancialinstitutiontoanotherintheUnitedStates.TheFederalReservesetsatargetfederalfundsratetoaffectthedirection of interest rates.
Lipper averages:Theaveragesofavailablemutualfund performance returns for specified time periods in categoriesdefinedbyLipperInc.
Morningstar Moderate Target Risk Index: Represents a portfolioofglobalequities(fixedat60%),bonds,andother asset classes.
MSCI All Country World Index ex USA:Anindexthatmeasuresequitymarketperformanceofdevelopedandemergingcountries,excludingtheU.S.
MSCI Emerging Markets Index:Acapitalization-weightedindexofstocksfromemergingmarketcountriesthat only includes securities that may be traded by foreigninvestors.
Russell 3000 Index:Anindexthattrackstheperfor-manceofthe3,000largestU.S.companies,representingapproximately98%oftheinvestableU.S.equitymarket.
S&P 500 Index:Anindexthattracksthestocksof500primarilylarge-capU.S.companies.
Note:MSCImakesnoexpressorimpliedwarrantiesorrepresentationsandshallhavenoliabilitywhatsoeverwithrespecttoanyMSCIdatacontainedherein.TheMSCIdatamaynotbefurtherredistributedorused as a basis for other indices or any securities or financial products. Thisreportisnotapproved,reviewed,orproducedbyMSCI.
Note: Russell Investment Group is the source and owner of the trade-marks,servicemarks,andcopyrightsrelatedtotheRussellindexes.Russell®isatrademarkofRussellInvestmentGroup.
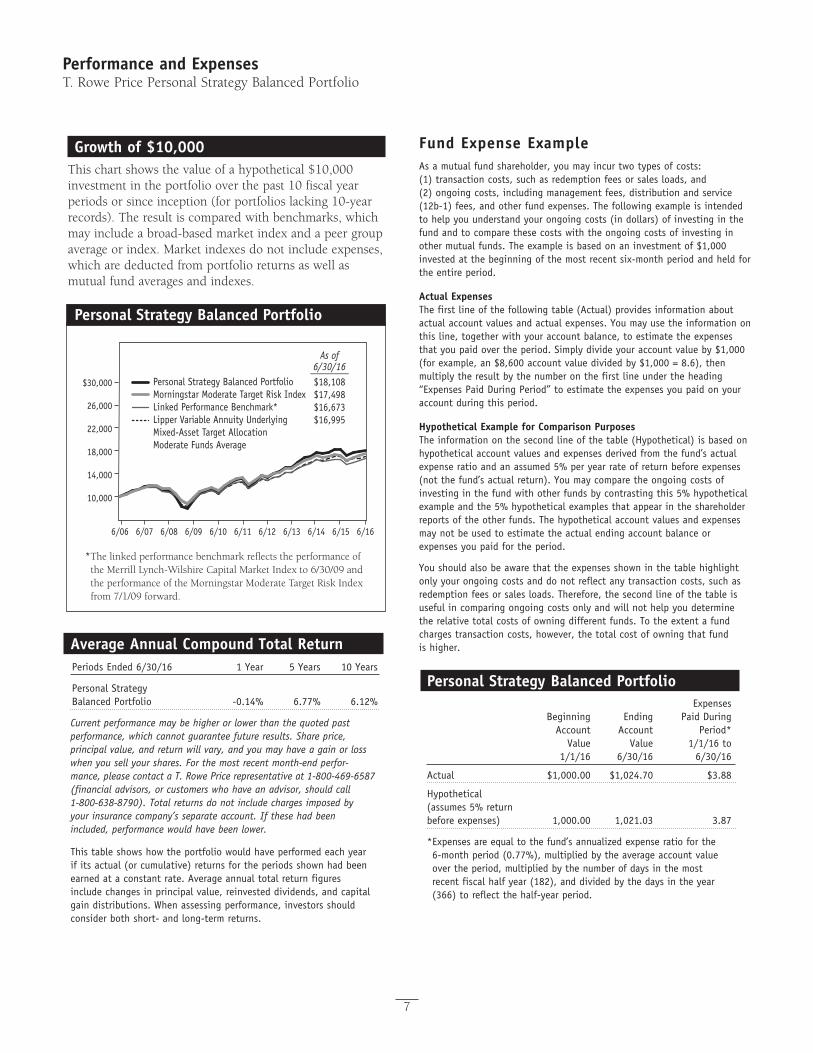
Proof #4
Performance and ExpensesT. Rowe Price Personal Strategy Balanced Portfolio
7
Growth of $10,000Thischartshowsthevalueofahypothetical$10,000investmentintheportfoliooverthepast10fiscalyearperiodsorsinceinception(forportfolioslacking10-yearrecords).Theresultiscomparedwithbenchmarks,whichmayincludeabroad-basedmarketindexandapeergroupaverageorindex.Marketindexesdonotincludeexpenses,which are deducted from portfolio returns as well as mutualfundaveragesandindexes.
Personal Strategy Balanced Portfolio
*The linked performance benchmark reflects the performance of the Merrill Lynch-Wilshire Capital Market Index to 6/30/09 and the performance of the Morningstar Moderate Target Risk Index from 7/1/09 forward.
Personal Strategy Balanced PortfolioMorningstar Moderate Target Risk IndexLinked Performance Benchmark*Lipper Variable Annuity Underlying Mixed-Asset Target Allocation Moderate Funds Average
As of6/30/16________$18,108$17,498$16,673$16,995
10,000
14,000
18,000
22,000
26,000
$30,000
6/166/156/146/136/126/116/106/096/086/076/06
Average Annual Compound Total ReturnPeriods Ended 6/30/16 1 Year 5 Years 10 Years
Personal Strategy Balanced Portfolio -0.14% 6.77% 6.12%
Current performance may be higher or lower than the quoted past performance, which cannot guarantee future results. Share price, principal value, and return will vary, and you may have a gain or loss when you sell your shares. For the most recent month-end perfor-mance, please contact a T. Rowe Price representative at 1-800-469-6587 (financial advisors, or customers who have an advisor, should call 1-800-638-8790). Total returns do not include charges imposed by your insurance company’s separate account. If these had been included, performance would have been lower.
This table shows how the portfolio would have performed each year if its actual (or cumulative) returns for the periods shown had been earned at a constant rate. Average annual total return figures include changes in principal value, reinvested dividends, and capital gain distributions. When assessing performance, investors should consider both short- and long-term returns.
Fund Expense ExampleAs a mutual fund shareholder, you may incur two types of costs: (1) transaction costs, such as redemption fees or sales loads, and (2) ongoing costs, including management fees, distribution and service (12b-1) fees, and other fund expenses. The following example is intended to help you understand your ongoing costs (in dollars) of investing in the fund and to compare these costs with the ongoing costs of investing in other mutual funds. The example is based on an investment of $1,000 invested at the beginning of the most recent six-month period and held for the entire period.
Actual ExpensesThe first line of the following table (Actual) provides information about actual account values and actual expenses. You may use the information on this line, together with your account balance, to estimate the expenses that you paid over the period. Simply divide your account value by $1,000 (for example, an $8,600 account value divided by $1,000 = 8.6), then multiply the result by the number on the first line under the heading “Expenses Paid During Period” to estimate the expenses you paid on your account during this period.
Hypothetical Example for Comparison PurposesThe information on the second line of the table (Hypothetical) is based on hypothetical account values and expenses derived from the fund’s actual expense ratio and an assumed 5% per year rate of return before expenses (not the fund’s actual return). You may compare the ongoing costs of investing in the fund with other funds by contrasting this 5% hypothetical example and the 5% hypothetical examples that appear in the shareholder reports of the other funds. The hypothetical account values and expenses may not be used to estimate the actual ending account balance or expenses you paid for the period.
You should also be aware that the expenses shown in the table highlight only your ongoing costs and do not reflect any transaction costs, such as redemption fees or sales loads. Therefore, the second line of the table is useful in comparing ongoing costs only and will not help you determine the relative total costs of owning different funds. To the extent a fund charges transaction costs, however, the total cost of owning that fund is higher.
Personal Strategy Balanced Portfolio Expenses Beginning Ending Paid During Account Account Period* Value Value 1/1/16 to 1/1/16 6/30/16 6/30/16
Actual $1,000.00 $1,024.70 $3.88
Hypothetical (assumes 5% return before expenses) 1,000.00 1,021.03 3.87
*Expenses are equal to the fund’s annualized expense ratio for the 6-month period (0.77%), multiplied by the average account value over the period, multiplied by the number of days in the most recent fiscal half year (182), and divided by the days in the year (366) to reflect the half-year period.
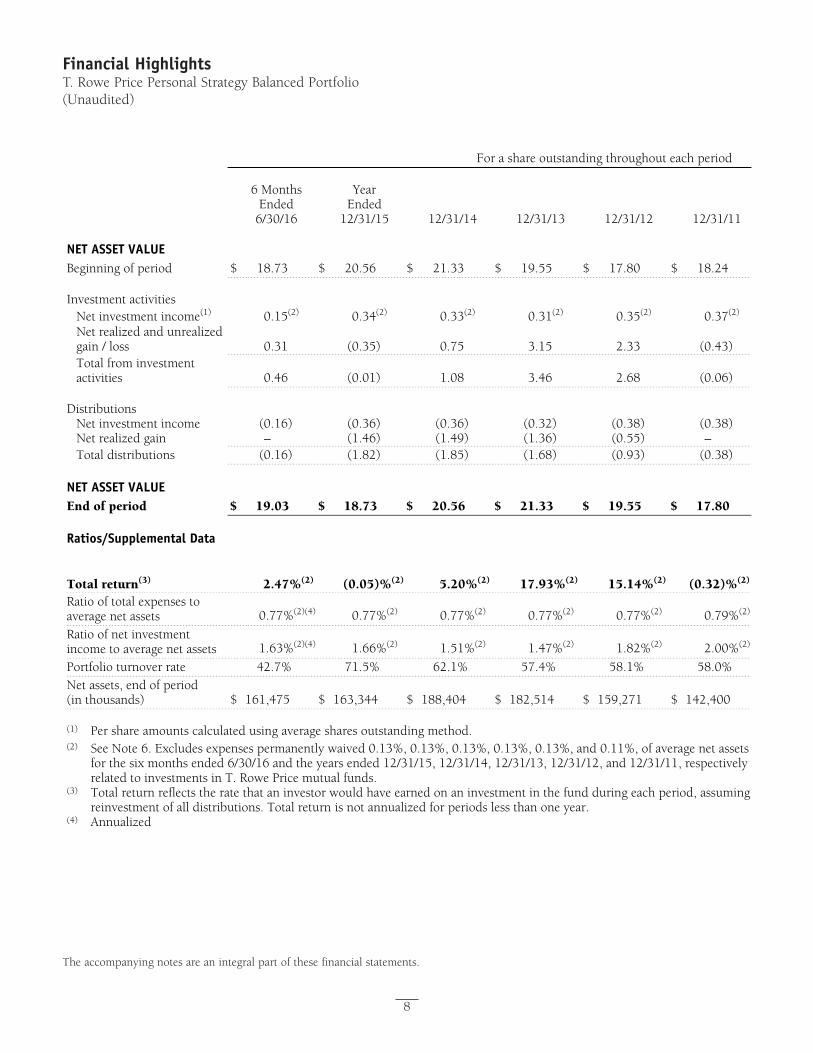
Proof #4
8
Financial HighlightsT. Rowe Price Personal Strategy Balanced Portfolio(Unaudited)
The accompanying notes are an integral part of these financial statements.
For a share outstanding throughout each period
6 Months Ended
6/30/16
Year Ended
12/31/15 12/31/14 12/31/13 12/31/12 12/31/11
NET ASSET VALUE
Beginning of period $ 18.73 $ 20.56 $ 21.33 $ 19.55 $ 17.80 $ 18.24 Investment activities
Net investment income(1) 0.15(2) 0.34(2) 0.33(2) 0.31(2) 0.35(2) 0.37(2)
Net realized and unrealized gain / loss 0.31 (0.35) 0.75 3.15 2.33 (0.43)
Total from investment activities 0.46 (0.01) 1.08 3.46 2.68 (0.06)
Distributions
Net investment income (0.16) (0.36) (0.36) (0.32) (0.38) (0.38)Net realized gain – (1.46) (1.49) (1.36) (0.55) –Total distributions (0.16) (1.82) (1.85) (1.68) (0.93) (0.38)
NET ASSET VALUE
End of period $ 19.03 $ 18.73 $ 20.56 $ 21.33 $ 19.55 $ 17.80 Ratios/Supplemental Data
Total return(3) 2.47%(2) (0.05)%(2) 5.20%(2) 17.93%(2) 15.14%(2) (0.32)%(2)
Ratio of total expenses to average net assets 0.77%(2)(4) 0.77%(2) 0.77%(2) 0.77%(2) 0.77%(2) 0.79%(2)
Ratio of net investment income to average net assets 1.63%(2)(4) 1.66%(2) 1.51%(2) 1.47%(2) 1.82%(2) 2.00%(2)
Portfolio turnover rate 42.7% 71.5% 62.1% 57.4% 58.1% 58.0%Net assets, end of period (in thousands) $ 161,475 $ 163,344 $ 188,404 $ 182,514 $ 159,271 $ 142,400
(1) Per share amounts calculated using average shares outstanding method.(2) See Note 6. Excludes expenses permanently waived 0.13%, 0.13%, 0.13%, 0.13%, 0.13%, and 0.11%, of average net assets
for the six months ended 6/30/16 and the years ended 12/31/15, 12/31/14, 12/31/13, 12/31/12, and 12/31/11, respectively related to investments in T. Rowe Price mutual funds.
(3) Total return reflects the rate that an investor would have earned on an investment in the fund during each period, assuming reinvestment of all distributions. Total return is not annualized for periods less than one year.
(4) Annualized
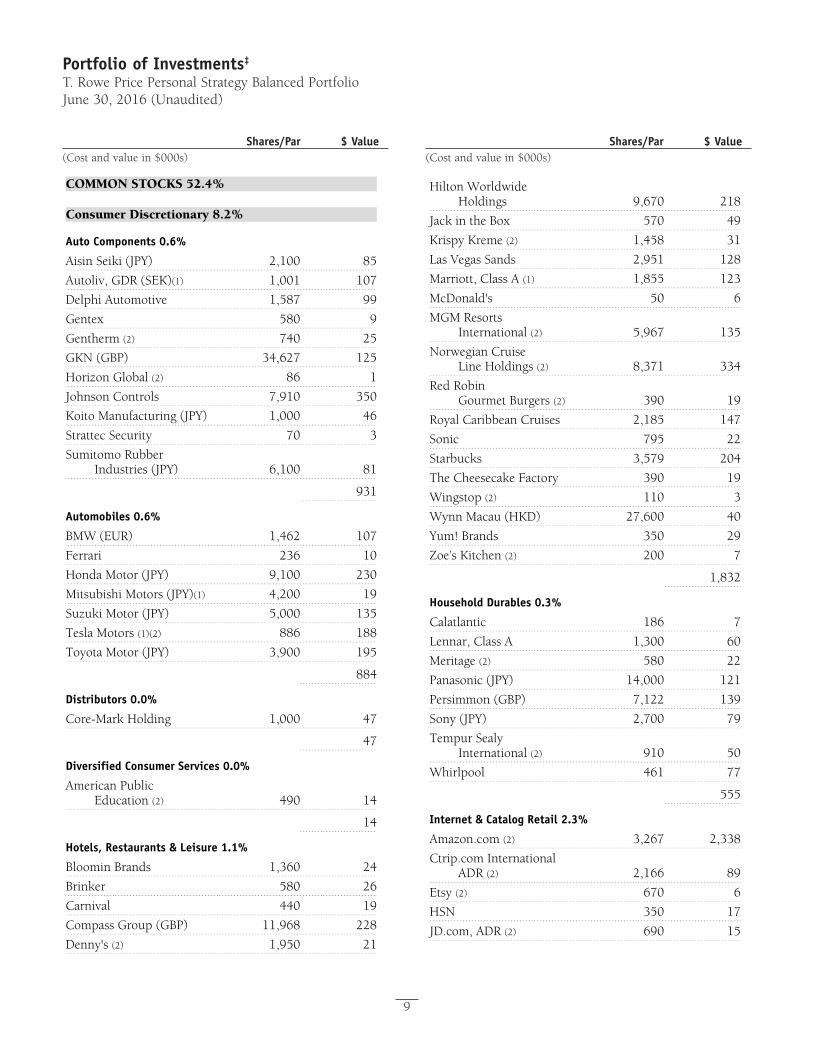
Proof #4
Portfolio of Investments‡
T. Rowe Price Personal Strategy Balanced PortfolioJune 30, 2016 (Unaudited)
Shares/Par $ Value(Cost and value in $000s)
Shares/Par $ Value(Cost and value in $000s)
9
COMMON STOCKS 52.4%
Consumer Discretionary 8.2%
Auto Components 0.6%
Aisin Seiki (JPY) 2,100 85
Autoliv, GDR (SEK)(1) 1,001 107
Delphi Automotive 1,587 99
Gentex 580 9
Gentherm (2) 740 25
GKN (GBP) 34,627 125
Horizon Global (2) 86 1
Johnson Controls 7,910 350
Koito Manufacturing (JPY) 1,000 46
Strattec Security 70 3
Sumitomo Rubber Industries (JPY) 6,100 81
931
Automobiles 0.6%
BMW (EUR) 1,462 107
Ferrari 236 10
Honda Motor (JPY) 9,100 230
Mitsubishi Motors (JPY)(1) 4,200 19
Suzuki Motor (JPY) 5,000 135
Tesla Motors (1)(2) 886 188
Toyota Motor (JPY) 3,900 195
884
Distributors 0.0%
Core-Mark Holding 1,000 47
47
Diversified Consumer Services 0.0%
American Public Education (2) 490 14
14
Hotels, Restaurants & Leisure 1.1%
Bloomin Brands 1,360 24
Brinker 580 26
Carnival 440 19
Compass Group (GBP) 11,968 228
Denny's (2) 1,950 21
Hilton Worldwide Holdings 9,670 218
Jack in the Box 570 49
Krispy Kreme (2) 1,458 31
Las Vegas Sands 2,951 128
Marriott, Class A (1) 1,855 123
McDonald's 50 6
MGM Resorts International (2) 5,967 135
Norwegian Cruise Line Holdings (2) 8,371 334
Red Robin Gourmet Burgers (2) 390 19
Royal Caribbean Cruises 2,185 147
Sonic 795 22
Starbucks 3,579 204
The Cheesecake Factory 390 19
Wingstop (2) 110 3
Wynn Macau (HKD) 27,600 40
Yum! Brands 350 29
Zoe’s Kitchen (2) 200 7
1,832
Household Durables 0.3%
Calatlantic 186 7
Lennar, Class A 1,300 60
Meritage (2) 580 22
Panasonic (JPY) 14,000 121
Persimmon (GBP) 7,122 139
Sony (JPY) 2,700 79
Tempur Sealy International (2) 910 50
Whirlpool 461 77
555
Internet & Catalog Retail 2.3%
Amazon.com (2) 3,267 2,338
Ctrip.com International ADR (2) 2,166 89
Etsy (2) 670 6
HSN 350 17
JD.com, ADR (2) 690 15
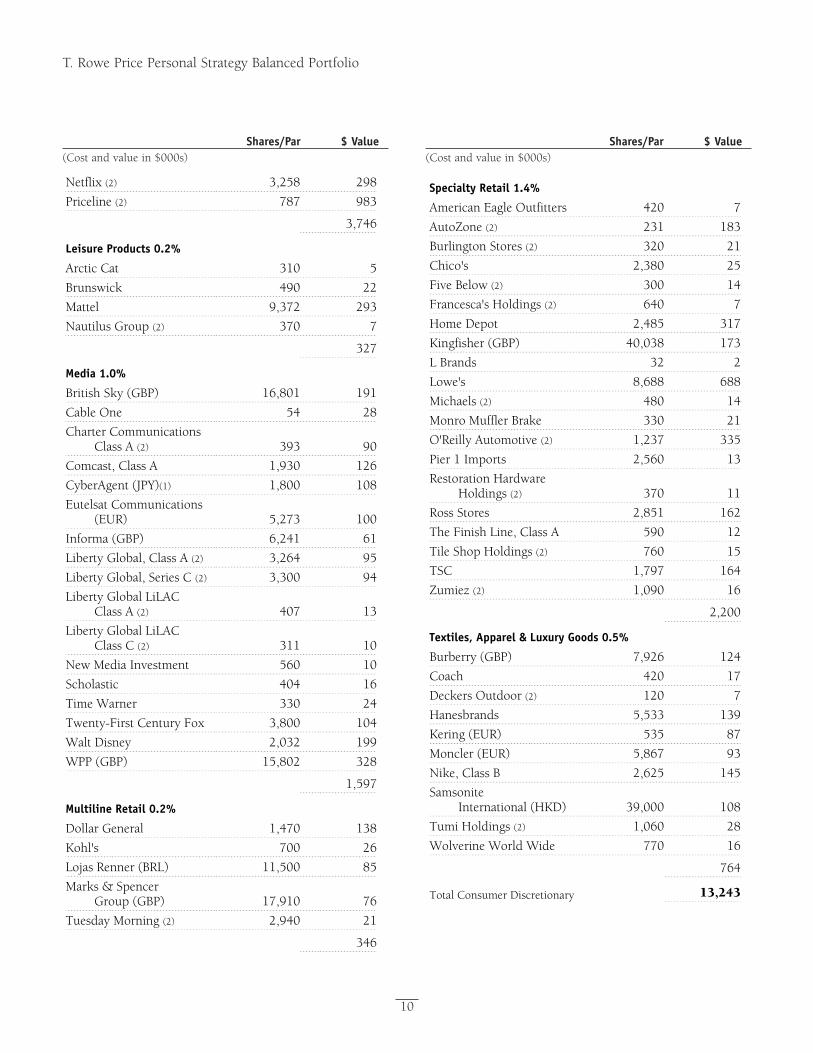
Proof #4
T. Rowe Price Personal Strategy Balanced Portfolio
Shares/Par $ Value(Cost and value in $000s)
Shares/Par $ Value(Cost and value in $000s)
10
Netflix (2) 3,258 298
Priceline (2) 787 983
3,746
Leisure Products 0.2%
Arctic Cat 310 5
Brunswick 490 22
Mattel 9,372 293
Nautilus Group (2) 370 7
327
Media 1.0%
British Sky (GBP) 16,801 191
Cable One 54 28
Charter Communications Class A (2) 393 90
Comcast, Class A 1,930 126
CyberAgent (JPY)(1) 1,800 108
Eutelsat Communications (EUR) 5,273 100
Informa (GBP) 6,241 61
Liberty Global, Class A (2) 3,264 95
Liberty Global, Series C (2) 3,300 94
Liberty Global LiLAC Class A (2) 407 13
Liberty Global LiLAC Class C (2) 311 10
New Media Investment 560 10
Scholastic 404 16
Time Warner 330 24
Twenty-First Century Fox 3,800 104
Walt Disney 2,032 199
WPP (GBP) 15,802 328
1,597
Multiline Retail 0.2%
Dollar General 1,470 138
Kohl's 700 26
Lojas Renner (BRL) 11,500 85
Marks & Spencer Group (GBP) 17,910 76
Tuesday Morning (2) 2,940 21
346
Specialty Retail 1.4%
American Eagle Outfitters 420 7
AutoZone (2) 231 183
Burlington Stores (2) 320 21
Chico's 2,380 25
Five Below (2) 300 14
Francesca's Holdings (2) 640 7
Home Depot 2,485 317
Kingfisher (GBP) 40,038 173
L Brands 32 2
Lowe's 8,688 688
Michaels (2) 480 14
Monro Muffler Brake 330 21
O'Reilly Automotive (2) 1,237 335
Pier 1 Imports 2,560 13
Restoration Hardware Holdings (2) 370 11
Ross Stores 2,851 162
The Finish Line, Class A 590 12
Tile Shop Holdings (2) 760 15
TSC 1,797 164
Zumiez (2) 1,090 16
2,200
Textiles, Apparel & Luxury Goods 0.5%
Burberry (GBP) 7,926 124
Coach 420 17
Deckers Outdoor (2) 120 7
Hanesbrands 5,533 139
Kering (EUR) 535 87
Moncler (EUR) 5,867 93
Nike, Class B 2,625 145
Samsonite International (HKD) 39,000 108
Tumi Holdings (2) 1,060 28
Wolverine World Wide 770 16
764
Total Consumer Discretionary 13,243
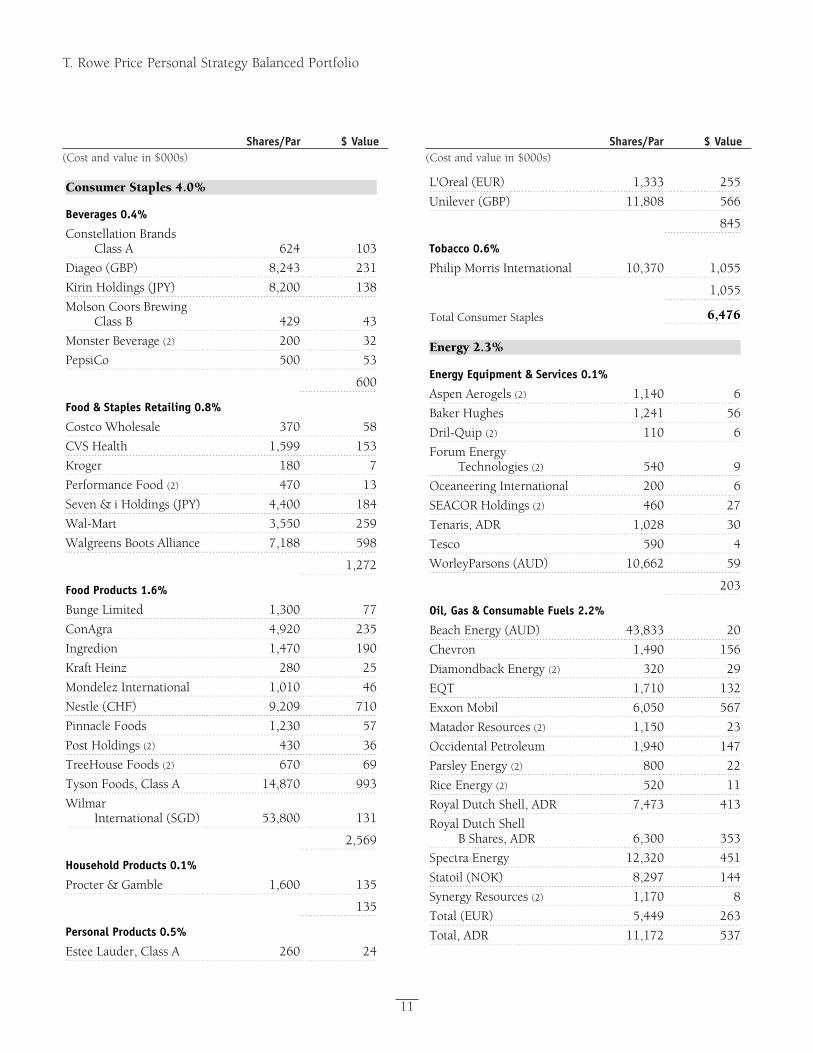
Proof #4
T. Rowe Price Personal Strategy Balanced Portfolio
Shares/Par $ Value(Cost and value in $000s)
Shares/Par $ Value(Cost and value in $000s)
11
Consumer Staples 4.0%
Beverages 0.4%
Constellation Brands Class A 624 103
Diageo (GBP) 8,243 231
Kirin Holdings (JPY) 8,200 138
Molson Coors Brewing Class B 429 43
Monster Beverage (2) 200 32
PepsiCo 500 53
600
Food & Staples Retailing 0.8%
Costco Wholesale 370 58
CVS Health 1,599 153
Kroger 180 7
Performance Food (2) 470 13
Seven & i Holdings (JPY) 4,400 184
Wal-Mart 3,550 259
Walgreens Boots Alliance 7,188 598
1,272
Food Products 1.6%
Bunge Limited 1,300 77
ConAgra 4,920 235
Ingredion 1,470 190
Kraft Heinz 280 25
Mondelez International 1,010 46
Nestle (CHF) 9,209 710
Pinnacle Foods 1,230 57
Post Holdings (2) 430 36
TreeHouse Foods (2) 670 69
Tyson Foods, Class A 14,870 993
Wilmar International (SGD) 53,800 131
2,569
Household Products 0.1%
Procter & Gamble 1,600 135
135
Personal Products 0.5%
Estee Lauder, Class A 260 24
L'Oreal (EUR) 1,333 255
Unilever (GBP) 11,808 566
845
Tobacco 0.6%
Philip Morris International 10,370 1,055
1,055
Total Consumer Staples 6,476
Energy 2.3%
Energy Equipment & Services 0.1%
Aspen Aerogels (2) 1,140 6
Baker Hughes 1,241 56
Dril-Quip (2) 110 6
Forum Energy Technologies (2) 540 9
Oceaneering International 200 6
SEACOR Holdings (2) 460 27
Tenaris, ADR 1,028 30
Tesco 590 4
WorleyParsons (AUD) 10,662 59
203
Oil, Gas & Consumable Fuels 2.2%
Beach Energy (AUD) 43,833 20
Chevron 1,490 156
Diamondback Energy (2) 320 29
EQT 1,710 132
Exxon Mobil 6,050 567
Matador Resources (2) 1,150 23
Occidental Petroleum 1,940 147
Parsley Energy (2) 800 22
Rice Energy (2) 520 11
Royal Dutch Shell, ADR 7,473 413
Royal Dutch Shell B Shares, ADR 6,300 353
Spectra Energy 12,320 451
Statoil (NOK) 8,297 144
Synergy Resources (2) 1,170 8
Total (EUR) 5,449 263
Total, ADR 11,172 537
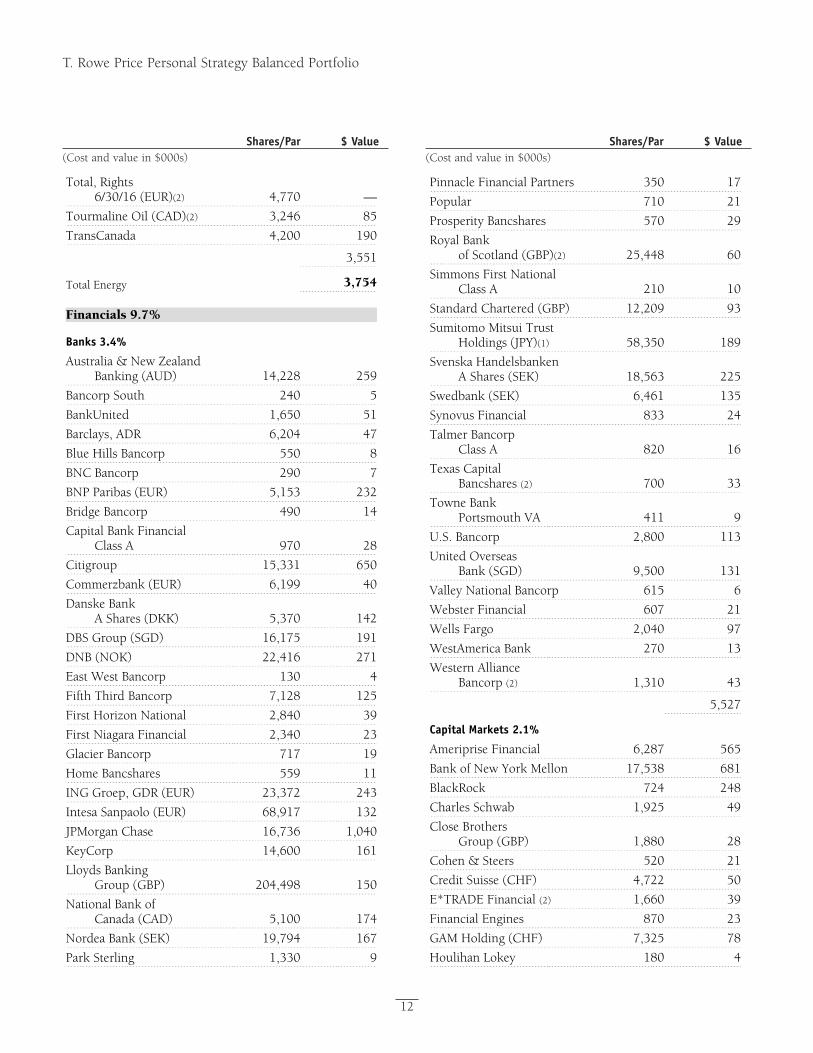
Proof #4
T. Rowe Price Personal Strategy Balanced Portfolio
Shares/Par $ Value(Cost and value in $000s)
Shares/Par $ Value(Cost and value in $000s)
12
Total, Rights 6/30/16 (EUR)(2) 4,770 —
Tourmaline Oil (CAD)(2) 3,246 85
TransCanada 4,200 190
3,551
Total Energy 3,754
Financials 9.7%
Banks 3.4%
Australia & New Zealand Banking (AUD) 14,228 259
Bancorp South 240 5
BankUnited 1,650 51
Barclays, ADR 6,204 47
Blue Hills Bancorp 550 8
BNC Bancorp 290 7
BNP Paribas (EUR) 5,153 232
Bridge Bancorp 490 14
Capital Bank Financial Class A 970 28
Citigroup 15,331 650
Commerzbank (EUR) 6,199 40
Danske Bank A Shares (DKK) 5,370 142
DBS Group (SGD) 16,175 191
DNB (NOK) 22,416 271
East West Bancorp 130 4
Fifth Third Bancorp 7,128 125
First Horizon National 2,840 39
First Niagara Financial 2,340 23
Glacier Bancorp 717 19
Home Bancshares 559 11
ING Groep, GDR (EUR) 23,372 243
Intesa Sanpaolo (EUR) 68,917 132
JPMorgan Chase 16,736 1,040
KeyCorp 14,600 161
Lloyds Banking Group (GBP) 204,498 150
National Bank of Canada (CAD) 5,100 174
Nordea Bank (SEK) 19,794 167
Park Sterling 1,330 9
Pinnacle Financial Partners 350 17
Popular 710 21
Prosperity Bancshares 570 29
Royal Bank of Scotland (GBP)(2) 25,448 60
Simmons First National Class A 210 10
Standard Chartered (GBP) 12,209 93
Sumitomo Mitsui Trust Holdings (JPY)(1) 58,350 189
Svenska Handelsbanken A Shares (SEK) 18,563 225
Swedbank (SEK) 6,461 135
Synovus Financial 833 24
Talmer Bancorp Class A 820 16
Texas Capital Bancshares (2) 700 33
Towne Bank Portsmouth VA 411 9
U.S. Bancorp 2,800 113
United Overseas Bank (SGD) 9,500 131
Valley National Bancorp 615 6
Webster Financial 607 21
Wells Fargo 2,040 97
WestAmerica Bank 270 13
Western Alliance Bancorp (2) 1,310 43
5,527
Capital Markets 2.1%
Ameriprise Financial 6,287 565
Bank of New York Mellon 17,538 681
BlackRock 724 248
Charles Schwab 1,925 49
Close Brothers Group (GBP) 1,880 28
Cohen & Steers 520 21
Credit Suisse (CHF) 4,722 50
E*TRADE Financial (2) 1,660 39
Financial Engines 870 23
GAM Holding (CHF) 7,325 78
Houlihan Lokey 180 4
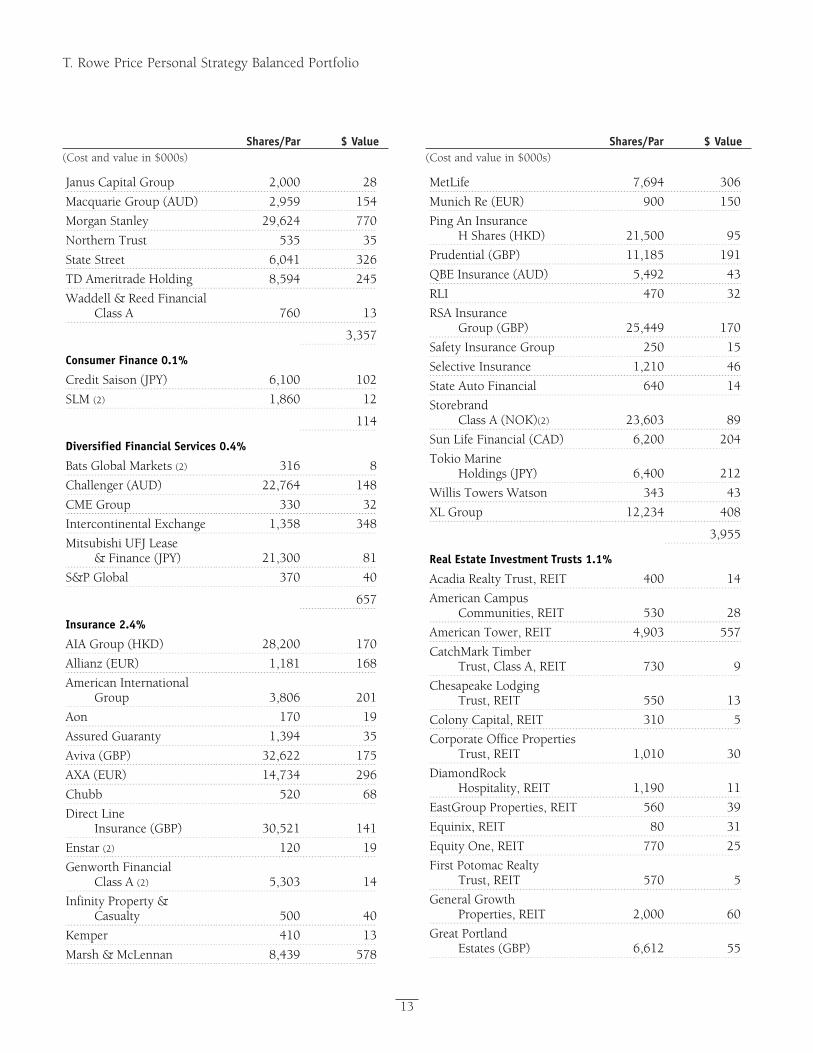
Proof #4
T. Rowe Price Personal Strategy Balanced Portfolio
Shares/Par $ Value(Cost and value in $000s)
Shares/Par $ Value(Cost and value in $000s)
13
Janus Capital Group 2,000 28
Macquarie Group (AUD) 2,959 154
Morgan Stanley 29,624 770
Northern Trust 535 35
State Street 6,041 326
TD Ameritrade Holding 8,594 245
Waddell & Reed Financial Class A 760 13
3,357
Consumer Finance 0.1%
Credit Saison (JPY) 6,100 102
SLM (2) 1,860 12
114
Diversified Financial Services 0.4%
Bats Global Markets (2) 316 8
Challenger (AUD) 22,764 148
CME Group 330 32
Intercontinental Exchange 1,358 348
Mitsubishi UFJ Lease & Finance (JPY) 21,300 81
S&P Global 370 40
657
Insurance 2.4%
AIA Group (HKD) 28,200 170
Allianz (EUR) 1,181 168
American International Group 3,806 201
Aon 170 19
Assured Guaranty 1,394 35
Aviva (GBP) 32,622 175
AXA (EUR) 14,734 296
Chubb 520 68
Direct Line Insurance (GBP) 30,521 141
Enstar (2) 120 19
Genworth Financial Class A (2) 5,303 14
Infinity Property & Casualty 500 40
Kemper 410 13
Marsh & McLennan 8,439 578
MetLife 7,694 306
Munich Re (EUR) 900 150
Ping An Insurance H Shares (HKD) 21,500 95
Prudential (GBP) 11,185 191
QBE Insurance (AUD) 5,492 43
RLI 470 32
RSA Insurance Group (GBP) 25,449 170
Safety Insurance Group 250 15
Selective Insurance 1,210 46
State Auto Financial 640 14
Storebrand Class A (NOK)(2) 23,603 89
Sun Life Financial (CAD) 6,200 204
Tokio Marine Holdings (JPY) 6,400 212
Willis Towers Watson 343 43
XL Group 12,234 408
3,955
Real Estate Investment Trusts 1.1%
Acadia Realty Trust, REIT 400 14
American Campus Communities, REIT 530 28
American Tower, REIT 4,903 557
CatchMark Timber Trust, Class A, REIT 730 9
Chesapeake Lodging Trust, REIT 550 13
Colony Capital, REIT 310 5
Corporate Office Properties Trust, REIT 1,010 30
DiamondRock Hospitality, REIT 1,190 11
EastGroup Properties, REIT 560 39
Equinix, REIT 80 31
Equity One, REIT 770 25
First Potomac Realty Trust, REIT 570 5
General Growth Properties, REIT 2,000 60
Great Portland Estates (GBP) 6,612 55
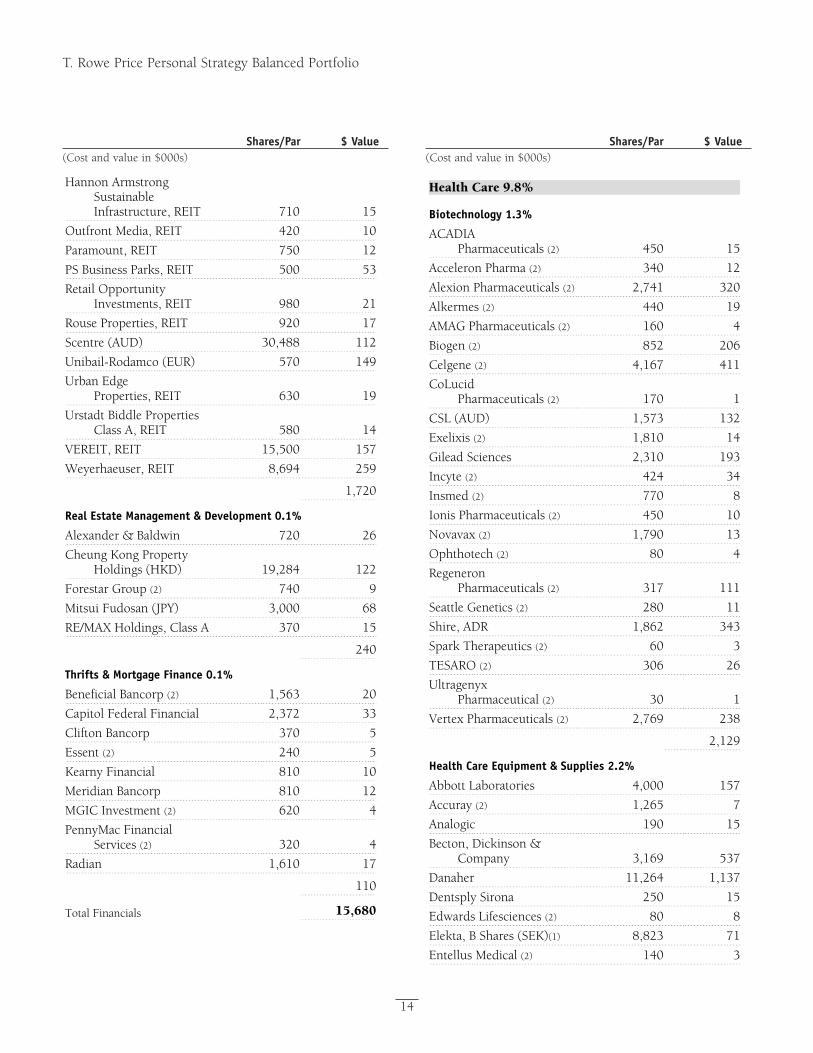
Proof #4
T. Rowe Price Personal Strategy Balanced Portfolio
Shares/Par $ Value(Cost and value in $000s)
Shares/Par $ Value(Cost and value in $000s)
14
Hannon Armstrong Sustainable Infrastructure, REIT 710 15
Outfront Media, REIT 420 10
Paramount, REIT 750 12
PS Business Parks, REIT 500 53
Retail Opportunity Investments, REIT 980 21
Rouse Properties, REIT 920 17
Scentre (AUD) 30,488 112
Unibail-Rodamco (EUR) 570 149
Urban Edge Properties, REIT 630 19
Urstadt Biddle Properties Class A, REIT 580 14
VEREIT, REIT 15,500 157
Weyerhaeuser, REIT 8,694 259
1,720
Real Estate Management & Development 0.1%
Alexander & Baldwin 720 26
Cheung Kong Property Holdings (HKD) 19,284 122
Forestar Group (2) 740 9
Mitsui Fudosan (JPY) 3,000 68
RE/MAX Holdings, Class A 370 15
240
Thrifts & Mortgage Finance 0.1%
Beneficial Bancorp (2) 1,563 20
Capitol Federal Financial 2,372 33
Clifton Bancorp 370 5
Essent (2) 240 5
Kearny Financial 810 10
Meridian Bancorp 810 12
MGIC Investment (2) 620 4
PennyMac Financial Services (2) 320 4
Radian 1,610 17
110
Total Financials 15,680
Health Care 9.8%
Biotechnology 1.3%
ACADIA Pharmaceuticals (2) 450 15
Acceleron Pharma (2) 340 12
Alexion Pharmaceuticals (2) 2,741 320
Alkermes (2) 440 19
AMAG Pharmaceuticals (2) 160 4
Biogen (2) 852 206
Celgene (2) 4,167 411
CoLucid Pharmaceuticals (2) 170 1
CSL (AUD) 1,573 132
Exelixis (2) 1,810 14
Gilead Sciences 2,310 193
Incyte (2) 424 34
Insmed (2) 770 8
Ionis Pharmaceuticals (2) 450 10
Novavax (2) 1,790 13
Ophthotech (2) 80 4
Regeneron Pharmaceuticals (2) 317 111
Seattle Genetics (2) 280 11
Shire, ADR 1,862 343
Spark Therapeutics (2) 60 3
TESARO (2) 306 26
Ultragenyx Pharmaceutical (2) 30 1
Vertex Pharmaceuticals (2) 2,769 238
2,129
Health Care Equipment & Supplies 2.2%
Abbott Laboratories 4,000 157
Accuray (2) 1,265 7
Analogic 190 15
Becton, Dickinson & Company 3,169 537
Danaher 11,264 1,137
Dentsply Sirona 250 15
Edwards Lifesciences (2) 80 8
Elekta, B Shares (SEK)(1) 8,823 71
Entellus Medical (2) 140 3
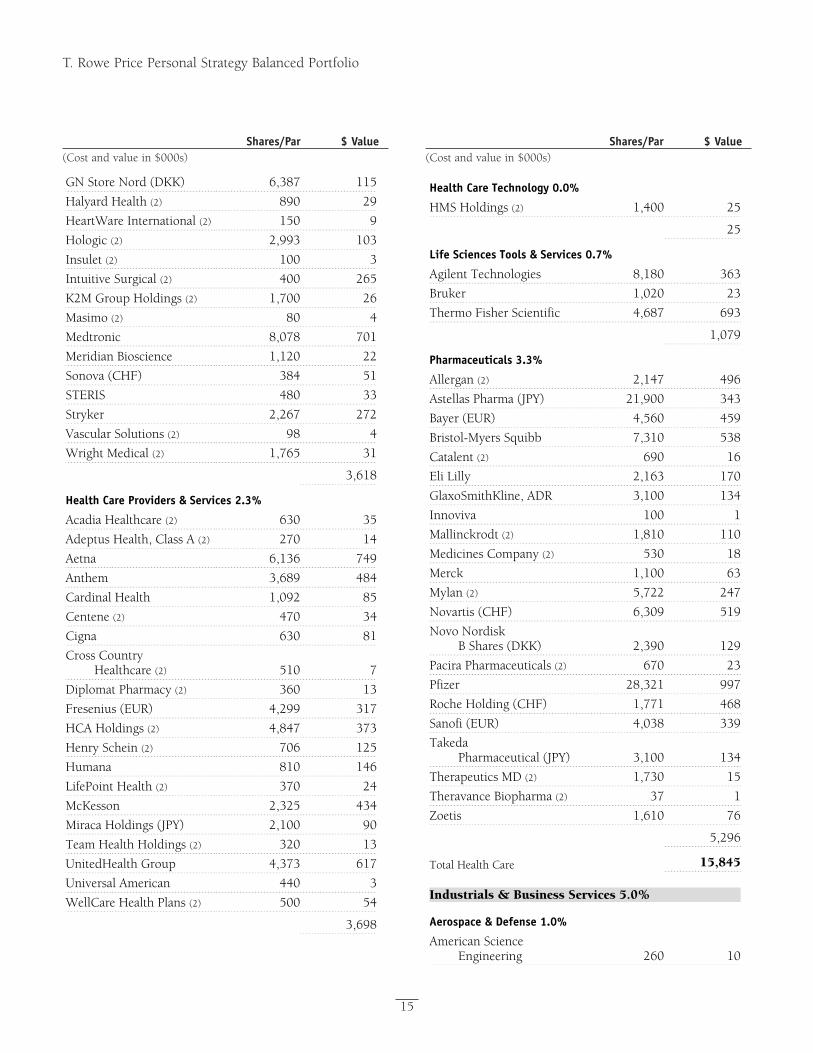
Proof #4
T. Rowe Price Personal Strategy Balanced Portfolio
Shares/Par $ Value(Cost and value in $000s)
Shares/Par $ Value(Cost and value in $000s)
15
GN Store Nord (DKK) 6,387 115
Halyard Health (2) 890 29
HeartWare International (2) 150 9
Hologic (2) 2,993 103
Insulet (2) 100 3
Intuitive Surgical (2) 400 265
K2M Group Holdings (2) 1,700 26
Masimo (2) 80 4
Medtronic 8,078 701
Meridian Bioscience 1,120 22
Sonova (CHF) 384 51
STERIS 480 33
Stryker 2,267 272
Vascular Solutions (2) 98 4
Wright Medical (2) 1,765 31
3,618
Health Care Providers & Services 2.3%
Acadia Healthcare (2) 630 35
Adeptus Health, Class A (2) 270 14
Aetna 6,136 749
Anthem 3,689 484
Cardinal Health 1,092 85
Centene (2) 470 34
Cigna 630 81
Cross Country Healthcare (2) 510 7
Diplomat Pharmacy (2) 360 13
Fresenius (EUR) 4,299 317
HCA Holdings (2) 4,847 373
Henry Schein (2) 706 125
Humana 810 146
LifePoint Health (2) 370 24
McKesson 2,325 434
Miraca Holdings (JPY) 2,100 90
Team Health Holdings (2) 320 13
UnitedHealth Group 4,373 617
Universal American 440 3
WellCare Health Plans (2) 500 54
3,698
Health Care Technology 0.0%
HMS Holdings (2) 1,400 25
25
Life Sciences Tools & Services 0.7%
Agilent Technologies 8,180 363
Bruker 1,020 23
Thermo Fisher Scientific 4,687 693
1,079
Pharmaceuticals 3.3%
Allergan (2) 2,147 496
Astellas Pharma (JPY) 21,900 343
Bayer (EUR) 4,560 459
Bristol-Myers Squibb 7,310 538
Catalent (2) 690 16
Eli Lilly 2,163 170
GlaxoSmithKline, ADR 3,100 134
Innoviva 100 1
Mallinckrodt (2) 1,810 110
Medicines Company (2) 530 18
Merck 1,100 63
Mylan (2) 5,722 247
Novartis (CHF) 6,309 519
Novo Nordisk B Shares (DKK) 2,390 129
Pacira Pharmaceuticals (2) 670 23
Pfizer 28,321 997
Roche Holding (CHF) 1,771 468
Sanofi (EUR) 4,038 339
Takeda Pharmaceutical (JPY) 3,100 134
Therapeutics MD (2) 1,730 15
Theravance Biopharma (2) 37 1
Zoetis 1,610 76
5,296
Total Health Care 15,845
Industrials & Business Services 5.0%
Aerospace & Defense 1.0%
American Science Engineering 260 10
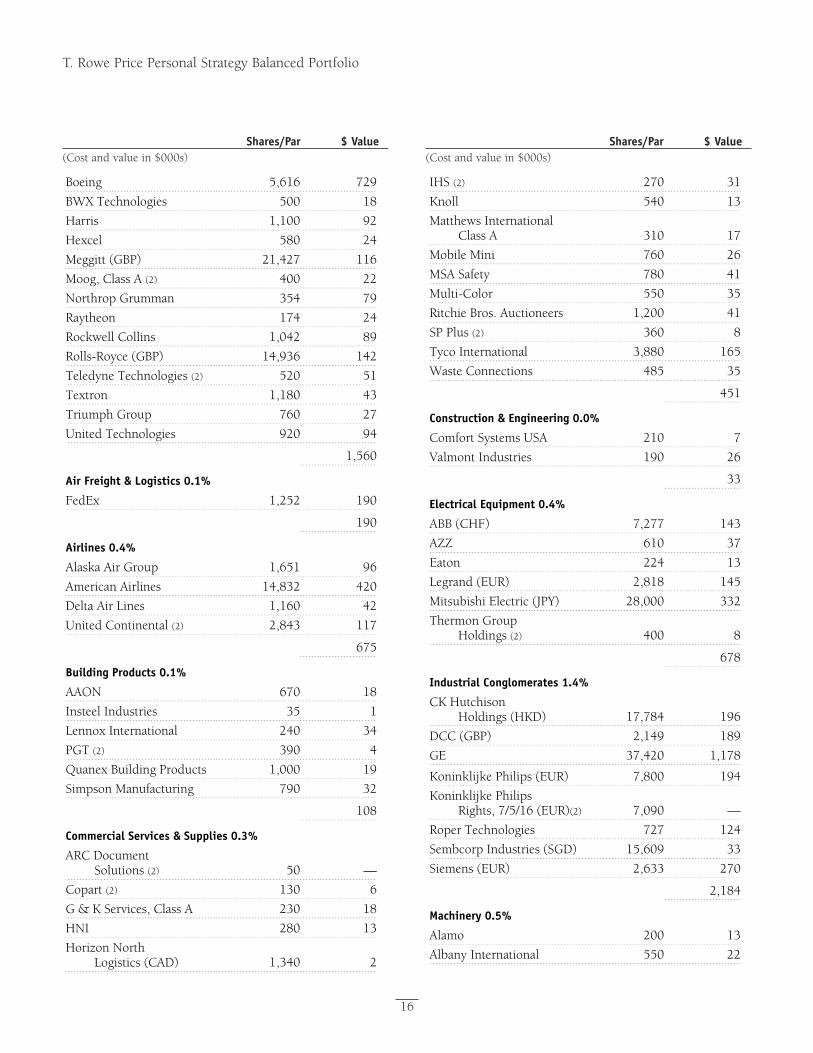
Proof #4
T. Rowe Price Personal Strategy Balanced Portfolio
Shares/Par $ Value(Cost and value in $000s)
Shares/Par $ Value(Cost and value in $000s)
16
Boeing 5,616 729
BWX Technologies 500 18
Harris 1,100 92
Hexcel 580 24
Meggitt (GBP) 21,427 116
Moog, Class A (2) 400 22
Northrop Grumman 354 79
Raytheon 174 24
Rockwell Collins 1,042 89
Rolls-Royce (GBP) 14,936 142
Teledyne Technologies (2) 520 51
Textron 1,180 43
Triumph Group 760 27
United Technologies 920 94
1,560
Air Freight & Logistics 0.1%
FedEx 1,252 190
190
Airlines 0.4%
Alaska Air Group 1,651 96
American Airlines 14,832 420
Delta Air Lines 1,160 42
United Continental (2) 2,843 117
675
Building Products 0.1%
AAON 670 18
Insteel Industries 35 1
Lennox International 240 34
PGT (2) 390 4
Quanex Building Products 1,000 19
Simpson Manufacturing 790 32
108
Commercial Services & Supplies 0.3%
ARC Document Solutions (2) 50 —
Copart (2) 130 6
G & K Services, Class A 230 18
HNI 280 13
Horizon North Logistics (CAD) 1,340 2
IHS (2) 270 31
Knoll 540 13
Matthews International Class A 310 17
Mobile Mini 760 26
MSA Safety 780 41
Multi-Color 550 35
Ritchie Bros. Auctioneers 1,200 41
SP Plus (2) 360 8
Tyco International 3,880 165
Waste Connections 485 35
451
Construction & Engineering 0.0%
Comfort Systems USA 210 7
Valmont Industries 190 26
33
Electrical Equipment 0.4%
ABB (CHF) 7,277 143
AZZ 610 37
Eaton 224 13
Legrand (EUR) 2,818 145
Mitsubishi Electric (JPY) 28,000 332
Thermon Group Holdings (2) 400 8
678
Industrial Conglomerates 1.4%
CK Hutchison Holdings (HKD) 17,784 196
DCC (GBP) 2,149 189
GE 37,420 1,178
Koninklijke Philips (EUR) 7,800 194
Koninklijke Philips Rights, 7/5/16 (EUR)(2) 7,090 —
Roper Technologies 727 124
Sembcorp Industries (SGD) 15,609 33
Siemens (EUR) 2,633 270
2,184
Machinery 0.5%
Alamo 200 13
Albany International 550 22
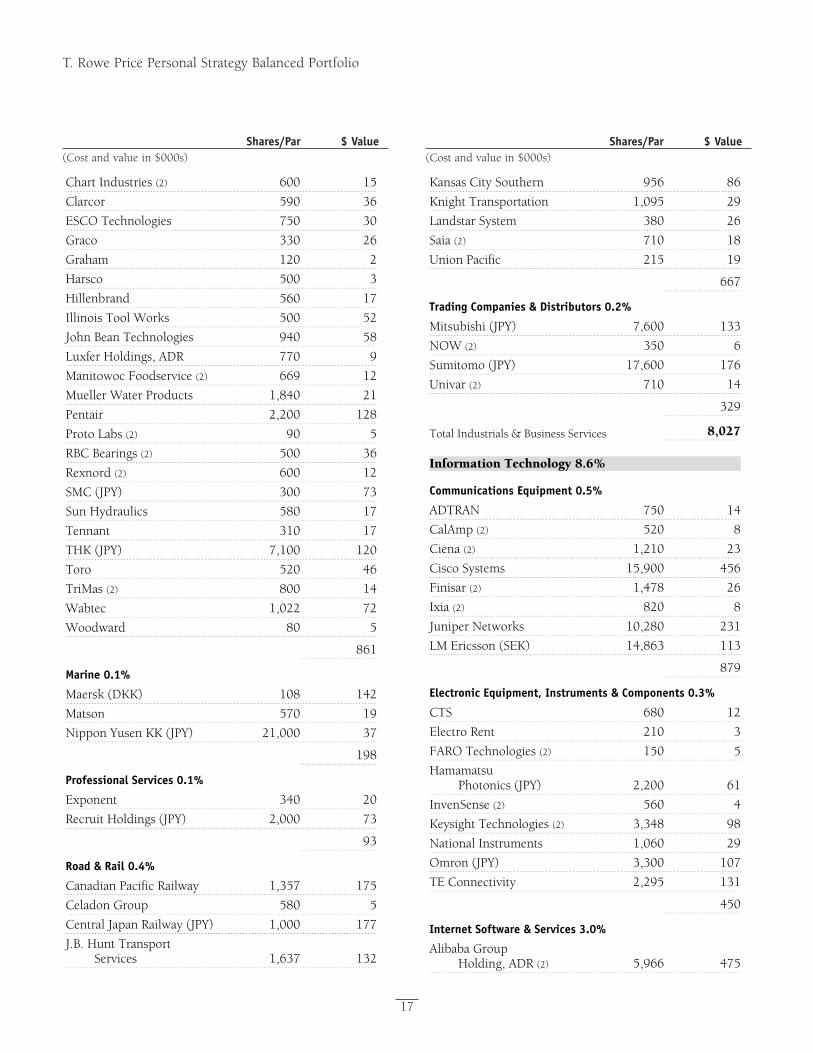
Proof #4
T. Rowe Price Personal Strategy Balanced Portfolio
Shares/Par $ Value(Cost and value in $000s)
Shares/Par $ Value(Cost and value in $000s)
17
Chart Industries (2) 600 15
Clarcor 590 36
ESCO Technologies 750 30
Graco 330 26
Graham 120 2
Harsco 500 3
Hillenbrand 560 17
Illinois Tool Works 500 52
John Bean Technologies 940 58
Luxfer Holdings, ADR 770 9
Manitowoc Foodservice (2) 669 12
Mueller Water Products 1,840 21
Pentair 2,200 128
Proto Labs (2) 90 5
RBC Bearings (2) 500 36
Rexnord (2) 600 12
SMC (JPY) 300 73
Sun Hydraulics 580 17
Tennant 310 17
THK (JPY) 7,100 120
Toro 520 46
TriMas (2) 800 14
Wabtec 1,022 72
Woodward 80 5
861
Marine 0.1%
Maersk (DKK) 108 142
Matson 570 19
Nippon Yusen KK (JPY) 21,000 37
198
Professional Services 0.1%
Exponent 340 20
Recruit Holdings (JPY) 2,000 73
93
Road & Rail 0.4%
Canadian Pacific Railway 1,357 175
Celadon Group 580 5
Central Japan Railway (JPY) 1,000 177
J.B. Hunt Transport Services 1,637 132
Kansas City Southern 956 86
Knight Transportation 1,095 29
Landstar System 380 26
Saia (2) 710 18
Union Pacific 215 19
667
Trading Companies & Distributors 0.2%
Mitsubishi (JPY) 7,600 133
NOW (2) 350 6
Sumitomo (JPY) 17,600 176
Univar (2) 710 14
329
Total Industrials & Business Services 8,027
Information Technology 8.6%
Communications Equipment 0.5%
ADTRAN 750 14
CalAmp (2) 520 8
Ciena (2) 1,210 23
Cisco Systems 15,900 456
Finisar (2) 1,478 26
Ixia (2) 820 8
Juniper Networks 10,280 231
LM Ericsson (SEK) 14,863 113
879
Electronic Equipment, Instruments & Components 0.3%
CTS 680 12
Electro Rent 210 3
FARO Technologies (2) 150 5
Hamamatsu Photonics (JPY) 2,200 61
InvenSense (2) 560 4
Keysight Technologies (2) 3,348 98
National Instruments 1,060 29
Omron (JPY) 3,300 107
TE Connectivity 2,295 131
450
Internet Software & Services 3.0%
Alibaba Group Holding, ADR (2) 5,966 475
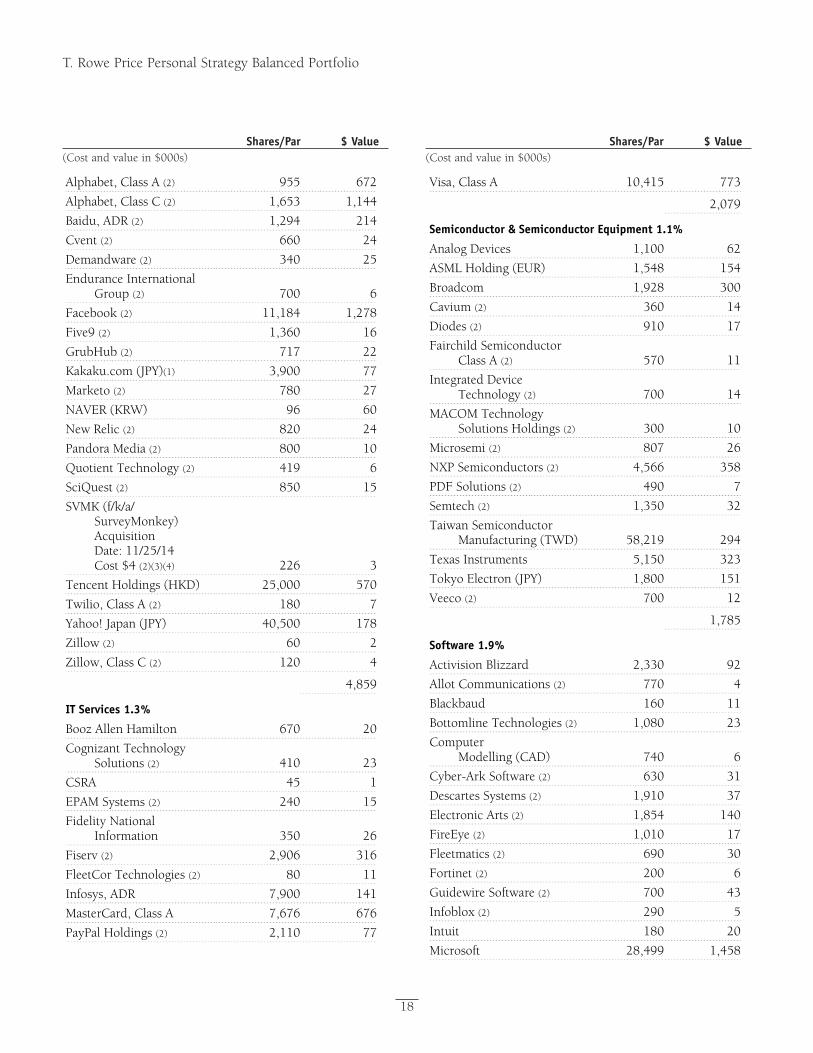
Proof #4
T. Rowe Price Personal Strategy Balanced Portfolio
Shares/Par $ Value(Cost and value in $000s)
Shares/Par $ Value(Cost and value in $000s)
18
Alphabet, Class A (2) 955 672
Alphabet, Class C (2) 1,653 1,144
Baidu, ADR (2) 1,294 214
Cvent (2) 660 24
Demandware (2) 340 25
Endurance International Group (2) 700 6
Facebook (2) 11,184 1,278
Five9 (2) 1,360 16
GrubHub (2) 717 22
Kakaku.com (JPY)(1) 3,900 77
Marketo (2) 780 27
NAVER (KRW) 96 60
New Relic (2) 820 24
Pandora Media (2) 800 10
Quotient Technology (2) 419 6
SciQuest (2) 850 15
SVMK (f/k/a/ SurveyMonkey) Acquisition Date: 11/25/14 Cost $4 (2)(3)(4) 226 3
Tencent Holdings (HKD) 25,000 570
Twilio, Class A (2) 180 7
Yahoo! Japan (JPY) 40,500 178
Zillow (2) 60 2
Zillow, Class C (2) 120 4
4,859
IT Services 1.3%
Booz Allen Hamilton 670 20
Cognizant Technology Solutions (2) 410 23
CSRA 45 1
EPAM Systems (2) 240 15
Fidelity National Information 350 26
Fiserv (2) 2,906 316
FleetCor Technologies (2) 80 11
Infosys, ADR 7,900 141
MasterCard, Class A 7,676 676
PayPal Holdings (2) 2,110 77
Visa, Class A 10,415 773
2,079
Semiconductor & Semiconductor Equipment 1.1%
Analog Devices 1,100 62
ASML Holding (EUR) 1,548 154
Broadcom 1,928 300
Cavium (2) 360 14
Diodes (2) 910 17
Fairchild Semiconductor Class A (2) 570 11
Integrated Device Technology (2) 700 14
MACOM Technology Solutions Holdings (2) 300 10
Microsemi (2) 807 26
NXP Semiconductors (2) 4,566 358
PDF Solutions (2) 490 7
Semtech (2) 1,350 32
Taiwan Semiconductor Manufacturing (TWD) 58,219 294
Texas Instruments 5,150 323
Tokyo Electron (JPY) 1,800 151
Veeco (2) 700 12
1,785
Software 1.9%
Activision Blizzard 2,330 92
Allot Communications (2) 770 4
Blackbaud 160 11
Bottomline Technologies (2) 1,080 23
Computer Modelling (CAD) 740 6
Cyber-Ark Software (2) 630 31
Descartes Systems (2) 1,910 37
Electronic Arts (2) 1,854 140
FireEye (2) 1,010 17
Fleetmatics (2) 690 30
Fortinet (2) 200 6
Guidewire Software (2) 700 43
Infoblox (2) 290 5
Intuit 180 20
Microsoft 28,499 1,458
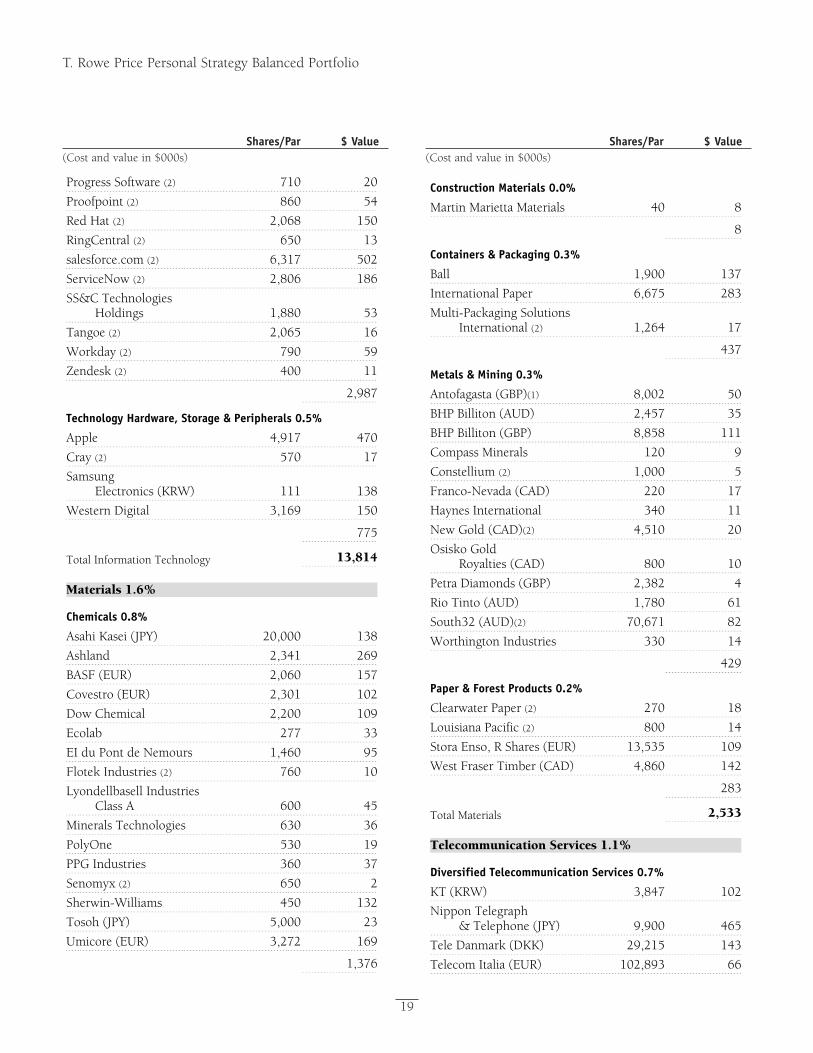
Proof #4
T. Rowe Price Personal Strategy Balanced Portfolio
Shares/Par $ Value(Cost and value in $000s)
Shares/Par $ Value(Cost and value in $000s)
19
Progress Software (2) 710 20
Proofpoint (2) 860 54
Red Hat (2) 2,068 150
RingCentral (2) 650 13
salesforce.com (2) 6,317 502
ServiceNow (2) 2,806 186
SS&C Technologies Holdings 1,880 53
Tangoe (2) 2,065 16
Workday (2) 790 59
Zendesk (2) 400 11
2,987
Technology Hardware, Storage & Peripherals 0.5%
Apple 4,917 470
Cray (2) 570 17
Samsung Electronics (KRW) 111 138
Western Digital 3,169 150
775
Total Information Technology 13,814
Materials 1.6%
Chemicals 0.8%
Asahi Kasei (JPY) 20,000 138
Ashland 2,341 269
BASF (EUR) 2,060 157
Covestro (EUR) 2,301 102
Dow Chemical 2,200 109
Ecolab 277 33
EI du Pont de Nemours 1,460 95
Flotek Industries (2) 760 10
Lyondellbasell Industries Class A 600 45
Minerals Technologies 630 36
PolyOne 530 19
PPG Industries 360 37
Senomyx (2) 650 2
Sherwin-Williams 450 132
Tosoh (JPY) 5,000 23
Umicore (EUR) 3,272 169
1,376
Construction Materials 0.0%
Martin Marietta Materials 40 8
8
Containers & Packaging 0.3%
Ball 1,900 137
International Paper 6,675 283
Multi-Packaging Solutions International (2) 1,264 17
437
Metals & Mining 0.3%
Antofagasta (GBP)(1) 8,002 50
BHP Billiton (AUD) 2,457 35
BHP Billiton (GBP) 8,858 111
Compass Minerals 120 9
Constellium (2) 1,000 5
Franco-Nevada (CAD) 220 17
Haynes International 340 11
New Gold (CAD)(2) 4,510 20
Osisko Gold Royalties (CAD) 800 10
Petra Diamonds (GBP) 2,382 4
Rio Tinto (AUD) 1,780 61
South32 (AUD)(2) 70,671 82
Worthington Industries 330 14
429
Paper & Forest Products 0.2%
Clearwater Paper (2) 270 18
Louisiana Pacific (2) 800 14
Stora Enso, R Shares (EUR) 13,535 109
West Fraser Timber (CAD) 4,860 142
283
Total Materials 2,533
Telecommunication Services 1.1%
Diversified Telecommunication Services 0.7%
KT (KRW) 3,847 102
Nippon Telegraph & Telephone (JPY) 9,900 465
Tele Danmark (DKK) 29,215 143
Telecom Italia (EUR) 102,893 66
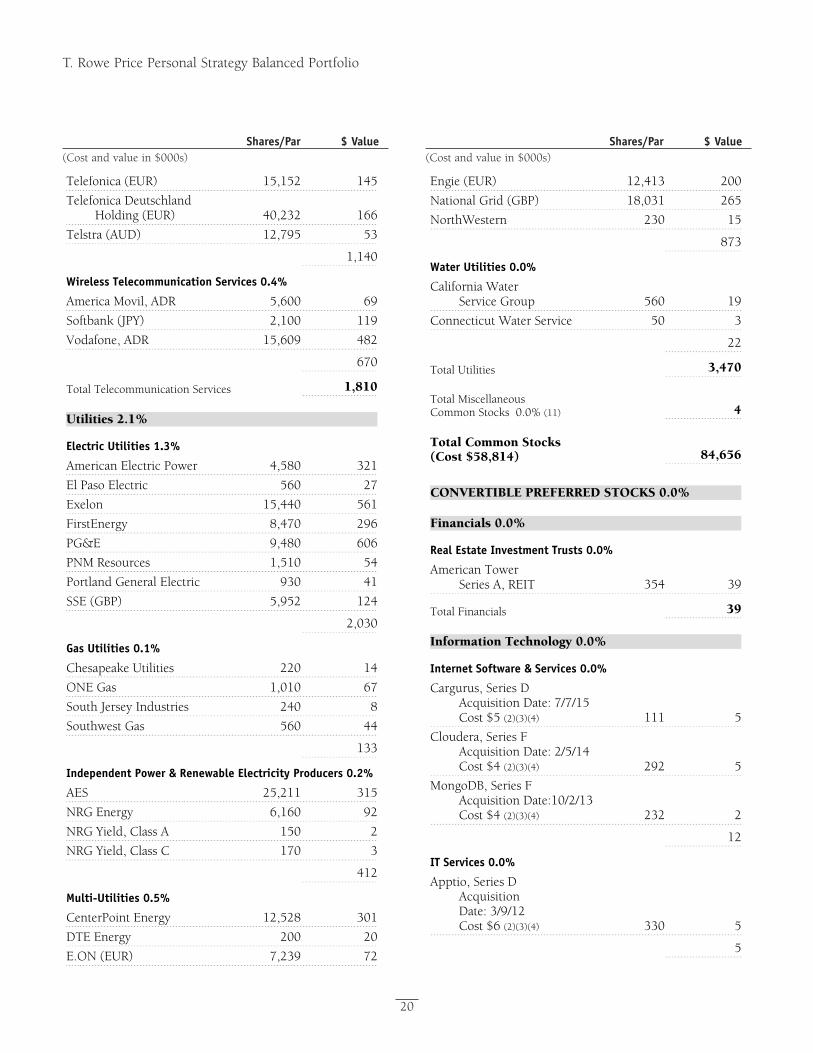
Proof #4
T. Rowe Price Personal Strategy Balanced Portfolio
Shares/Par $ Value(Cost and value in $000s)
Shares/Par $ Value(Cost and value in $000s)
20
Telefonica (EUR) 15,152 145
Telefonica Deutschland Holding (EUR) 40,232 166
Telstra (AUD) 12,795 53
1,140
Wireless Telecommunication Services 0.4%
America Movil, ADR 5,600 69
Softbank (JPY) 2,100 119
Vodafone, ADR 15,609 482
670
Total Telecommunication Services 1,810
Utilities 2.1%
Electric Utilities 1.3%
American Electric Power 4,580 321
El Paso Electric 560 27
Exelon 15,440 561
FirstEnergy 8,470 296
PG&E 9,480 606
PNM Resources 1,510 54
Portland General Electric 930 41
SSE (GBP) 5,952 124
2,030
Gas Utilities 0.1%
Chesapeake Utilities 220 14
ONE Gas 1,010 67
South Jersey Industries 240 8
Southwest Gas 560 44
133
Independent Power & Renewable Electricity Producers 0.2%
AES 25,211 315
NRG Energy 6,160 92
NRG Yield, Class A 150 2
NRG Yield, Class C 170 3
412
Multi-Utilities 0.5%
CenterPoint Energy 12,528 301
DTE Energy 200 20
E.ON (EUR) 7,239 72
Engie (EUR) 12,413 200
National Grid (GBP) 18,031 265
NorthWestern 230 15
873
Water Utilities 0.0%
California Water Service Group 560 19
Connecticut Water Service 50 3
22
Total Utilities 3,470
Total Miscellaneous Common Stocks 0.0% (11) 4
Total Common Stocks (Cost $58,814) 84,656
CONVERTIBLE PREFERRED STOCKS 0.0%
Financials 0.0%
Real Estate Investment Trusts 0.0%
American Tower Series A, REIT 354 39
Total Financials 39
Information Technology 0.0%
Internet Software & Services 0.0%
Cargurus, Series D Acquisition Date: 7/7/15 Cost $5 (2)(3)(4) 111 5
Cloudera, Series F Acquisition Date: 2/5/14 Cost $4 (2)(3)(4) 292 5
MongoDB, Series F Acquisition Date:10/2/13 Cost $4 (2)(3)(4) 232 2
12
IT Services 0.0%
Apptio, Series D Acquisition Date: 3/9/12 Cost $6 (2)(3)(4) 330 5
5
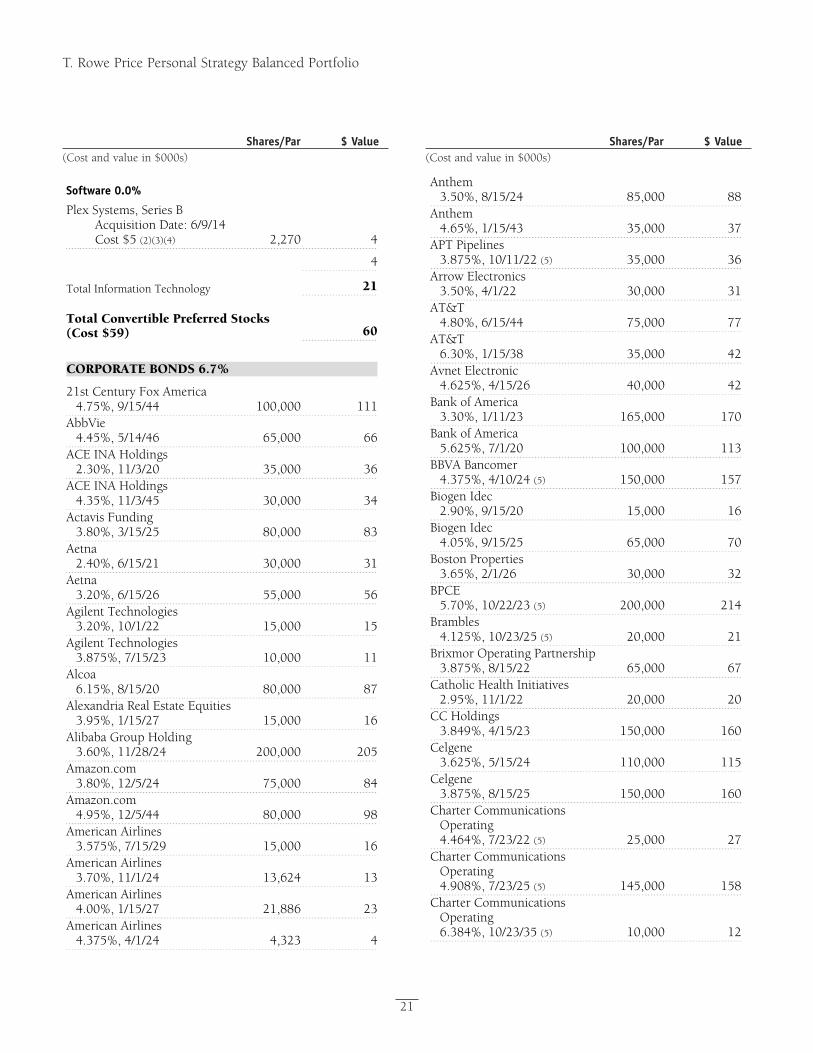
Proof #4
T. Rowe Price Personal Strategy Balanced Portfolio
Shares/Par $ Value(Cost and value in $000s)
Shares/Par $ Value(Cost and value in $000s)
21
Software 0.0%
Plex Systems, Series B Acquisition Date: 6/9/14 Cost $5 (2)(3)(4) 2,270 4
4
Total Information Technology 21
Total Convertible Preferred Stocks (Cost $59) 60
CORPORATE BONDS 6.7%
21st Century Fox America 4.75%, 9/15/44 100,000 111
AbbVie 4.45%, 5/14/46 65,000 66
ACE INA Holdings 2.30%, 11/3/20 35,000 36
ACE INA Holdings 4.35%, 11/3/45 30,000 34
Actavis Funding 3.80%, 3/15/25 80,000 83
Aetna 2.40%, 6/15/21 30,000 31
Aetna 3.20%, 6/15/26 55,000 56
Agilent Technologies 3.20%, 10/1/22 15,000 15
Agilent Technologies 3.875%, 7/15/23 10,000 11
Alcoa 6.15%, 8/15/20 80,000 87
Alexandria Real Estate Equities 3.95%, 1/15/27 15,000 16
Alibaba Group Holding 3.60%, 11/28/24 200,000 205
Amazon.com 3.80%, 12/5/24 75,000 84
Amazon.com 4.95%, 12/5/44 80,000 98
American Airlines 3.575%, 7/15/29 15,000 16
American Airlines 3.70%, 11/1/24 13,624 13
American Airlines 4.00%, 1/15/27 21,886 23
American Airlines 4.375%, 4/1/24 4,323 4
Anthem3.50%, 8/15/24 85,000 88
Anthem4.65%, 1/15/43 35,000 37
APT Pipelines3.875%, 10/11/22 (5) 35,000 36
Arrow Electronics3.50%, 4/1/22 30,000 31
AT&T4.80%, 6/15/44 75,000 77
AT&T6.30%, 1/15/38 35,000 42
Avnet Electronic4.625%, 4/15/26 40,000 42
Bank of America3.30%, 1/11/23 165,000 170
Bank of America5.625%, 7/1/20 100,000 113
BBVA Bancomer4.375%, 4/10/24 (5) 150,000 157
Biogen Idec2.90%, 9/15/20 15,000 16
Biogen Idec4.05%, 9/15/25 65,000 70
Boston Properties 3.65%, 2/1/26 30,000 32
BPCE5.70%, 10/22/23 (5) 200,000 214
Brambles4.125%, 10/23/25 (5) 20,000 21
Brixmor Operating Partnership 3.875%, 8/15/22 65,000 67
Catholic Health Initiatives2.95%, 11/1/22 20,000 20
CC Holdings3.849%, 4/15/23 150,000 160
Celgene3.625%, 5/15/24 110,000 115
Celgene3.875%, 8/15/25 150,000 160
Charter Communications Operating 4.464%, 7/23/22 (5) 25,000 27
Charter Communications Operating 4.908%, 7/23/25 (5) 145,000 158
Charter Communications Operating 6.384%, 10/23/35 (5) 10,000 12
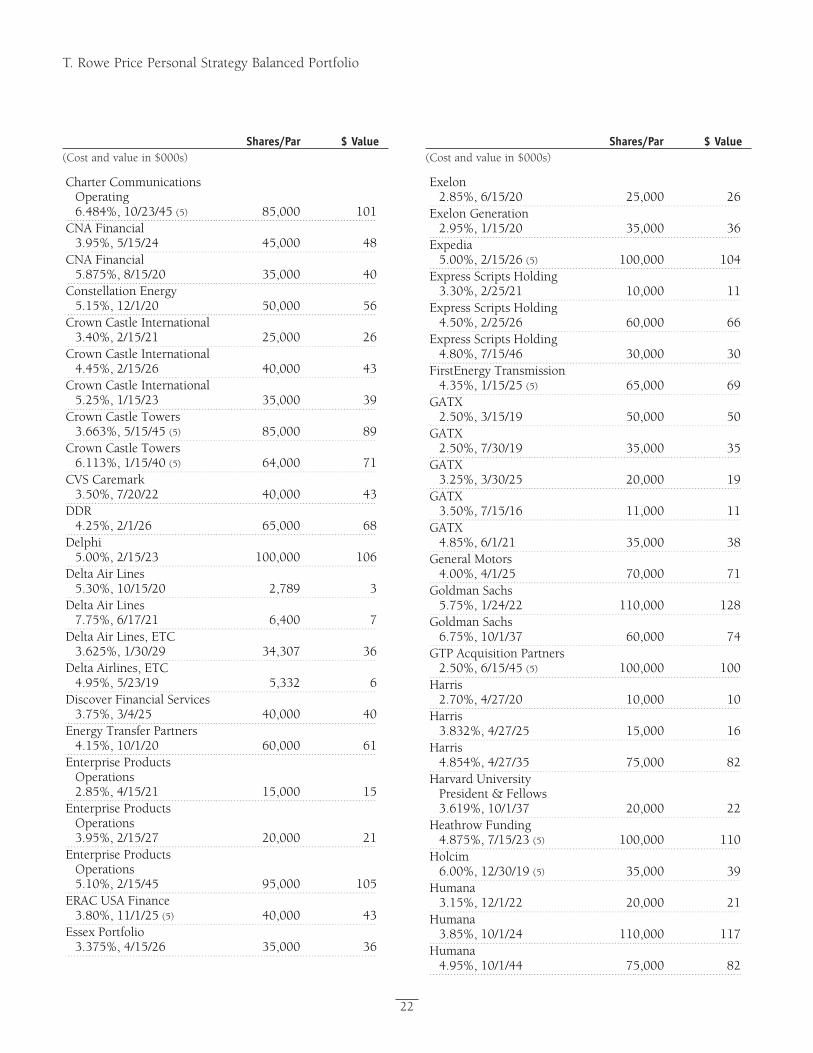
Proof #4
T. Rowe Price Personal Strategy Balanced Portfolio
Shares/Par $ Value(Cost and value in $000s)
Shares/Par $ Value(Cost and value in $000s)
22
Charter Communications Operating 6.484%, 10/23/45 (5) 85,000 101
CNA Financial 3.95%, 5/15/24 45,000 48
CNA Financial 5.875%, 8/15/20 35,000 40
Constellation Energy 5.15%, 12/1/20 50,000 56
Crown Castle International 3.40%, 2/15/21 25,000 26
Crown Castle International 4.45%, 2/15/26 40,000 43
Crown Castle International 5.25%, 1/15/23 35,000 39
Crown Castle Towers 3.663%, 5/15/45 (5) 85,000 89
Crown Castle Towers 6.113%, 1/15/40 (5) 64,000 71
CVS Caremark 3.50%, 7/20/22 40,000 43
DDR 4.25%, 2/1/26 65,000 68
Delphi 5.00%, 2/15/23 100,000 106
Delta Air Lines 5.30%, 10/15/20 2,789 3
Delta Air Lines 7.75%, 6/17/21 6,400 7
Delta Air Lines, ETC 3.625%, 1/30/29 34,307 36
Delta Airlines, ETC 4.95%, 5/23/19 5,332 6
Discover Financial Services 3.75%, 3/4/25 40,000 40
Energy Transfer Partners 4.15%, 10/1/20 60,000 61
Enterprise Products Operations 2.85%, 4/15/21 15,000 15
Enterprise Products Operations 3.95%, 2/15/27 20,000 21
Enterprise Products Operations 5.10%, 2/15/45 95,000 105
ERAC USA Finance 3.80%, 11/1/25 (5) 40,000 43
Essex Portfolio 3.375%, 4/15/26 35,000 36
Exelon2.85%, 6/15/20 25,000 26
Exelon Generation2.95%, 1/15/20 35,000 36
Expedia5.00%, 2/15/26 (5) 100,000 104
Express Scripts Holding3.30%, 2/25/21 10,000 11
Express Scripts Holding4.50%, 2/25/26 60,000 66
Express Scripts Holding4.80%, 7/15/46 30,000 30
FirstEnergy Transmission4.35%, 1/15/25 (5) 65,000 69
GATX2.50%, 3/15/19 50,000 50
GATX2.50%, 7/30/19 35,000 35
GATX3.25%, 3/30/25 20,000 19
GATX3.50%, 7/15/16 11,000 11
GATX4.85%, 6/1/21 35,000 38
General Motors4.00%, 4/1/25 70,000 71
Goldman Sachs5.75%, 1/24/22 110,000 128
Goldman Sachs6.75%, 10/1/37 60,000 74
GTP Acquisition Partners2.50%, 6/15/45 (5) 100,000 100
Harris2.70%, 4/27/20 10,000 10
Harris3.832%, 4/27/25 15,000 16
Harris4.854%, 4/27/35 75,000 82
Harvard University President & Fellows 3.619%, 10/1/37 20,000 22
Heathrow Funding4.875%, 7/15/23 (5) 100,000 110
Holcim6.00%, 12/30/19 (5) 35,000 39
Humana3.15%, 12/1/22 20,000 21
Humana3.85%, 10/1/24 110,000 117
Humana4.95%, 10/1/44 75,000 82
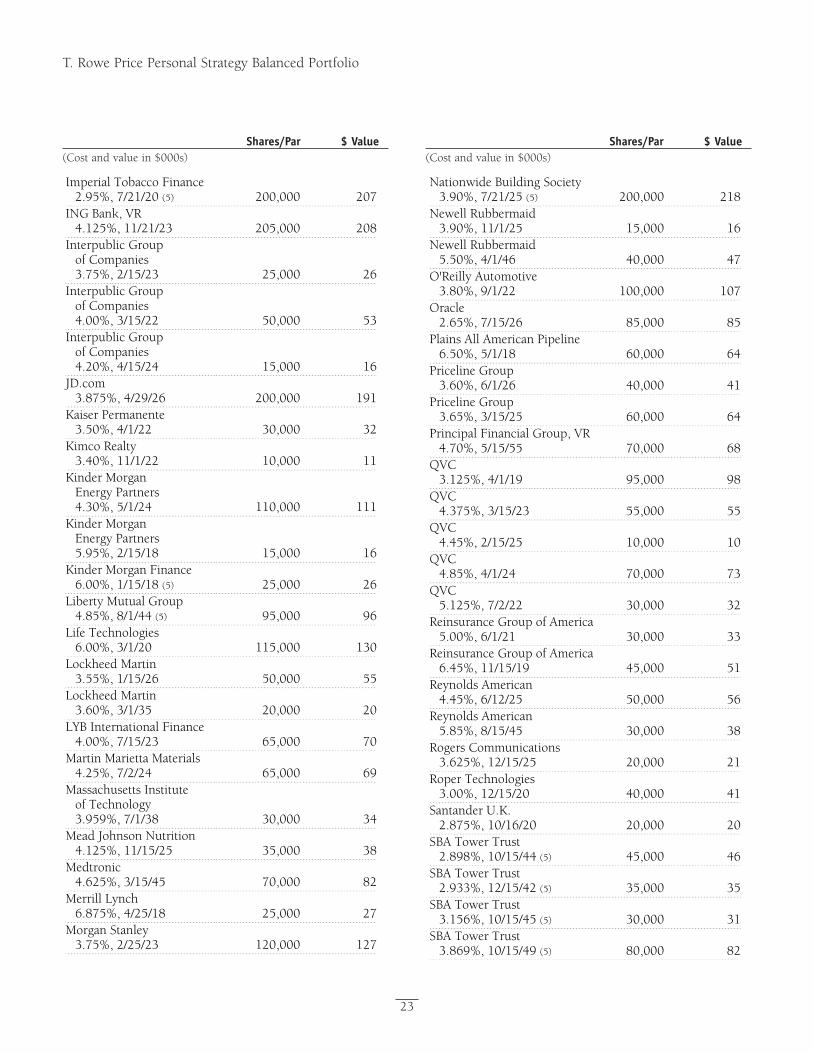
Proof #4
T. Rowe Price Personal Strategy Balanced Portfolio
Shares/Par $ Value(Cost and value in $000s)
Shares/Par $ Value(Cost and value in $000s)
23
Imperial Tobacco Finance 2.95%, 7/21/20 (5) 200,000 207
ING Bank, VR 4.125%, 11/21/23 205,000 208
Interpublic Group of Companies 3.75%, 2/15/23 25,000 26
Interpublic Group of Companies 4.00%, 3/15/22 50,000 53
Interpublic Group of Companies 4.20%, 4/15/24 15,000 16
JD.com 3.875%, 4/29/26 200,000 191
Kaiser Permanente 3.50%, 4/1/22 30,000 32
Kimco Realty 3.40%, 11/1/22 10,000 11
Kinder Morgan Energy Partners 4.30%, 5/1/24 110,000 111
Kinder Morgan Energy Partners 5.95%, 2/15/18 15,000 16
Kinder Morgan Finance 6.00%, 1/15/18 (5) 25,000 26
Liberty Mutual Group 4.85%, 8/1/44 (5) 95,000 96
Life Technologies 6.00%, 3/1/20 115,000 130
Lockheed Martin 3.55%, 1/15/26 50,000 55
Lockheed Martin 3.60%, 3/1/35 20,000 20
LYB International Finance 4.00%, 7/15/23 65,000 70
Martin Marietta Materials 4.25%, 7/2/24 65,000 69
Massachusetts Institute of Technology 3.959%, 7/1/38 30,000 34
Mead Johnson Nutrition 4.125%, 11/15/25 35,000 38
Medtronic 4.625%, 3/15/45 70,000 82
Merrill Lynch 6.875%, 4/25/18 25,000 27
Morgan Stanley 3.75%, 2/25/23 120,000 127
Nationwide Building Society 3.90%, 7/21/25 (5) 200,000 218
Newell Rubbermaid3.90%, 11/1/25 15,000 16
Newell Rubbermaid5.50%, 4/1/46 40,000 47
O'Reilly Automotive3.80%, 9/1/22 100,000 107
Oracle2.65%, 7/15/26 85,000 85
Plains All American Pipeline 6.50%, 5/1/18 60,000 64
Priceline Group3.60%, 6/1/26 40,000 41
Priceline Group3.65%, 3/15/25 60,000 64
Principal Financial Group, VR 4.70%, 5/15/55 70,000 68
QVC3.125%, 4/1/19 95,000 98
QVC4.375%, 3/15/23 55,000 55
QVC4.45%, 2/15/25 10,000 10
QVC4.85%, 4/1/24 70,000 73
QVC5.125%, 7/2/22 30,000 32
Reinsurance Group of America 5.00%, 6/1/21 30,000 33
Reinsurance Group of America 6.45%, 11/15/19 45,000 51
Reynolds American4.45%, 6/12/25 50,000 56
Reynolds American5.85%, 8/15/45 30,000 38
Rogers Communications3.625%, 12/15/25 20,000 21
Roper Technologies3.00%, 12/15/20 40,000 41
Santander U.K.2.875%, 10/16/20 20,000 20
SBA Tower Trust2.898%, 10/15/44 (5) 45,000 46
SBA Tower Trust2.933%, 12/15/42 (5) 35,000 35
SBA Tower Trust3.156%, 10/15/45 (5) 30,000 31
SBA Tower Trust 3.869%, 10/15/49 (5) 80,000 82
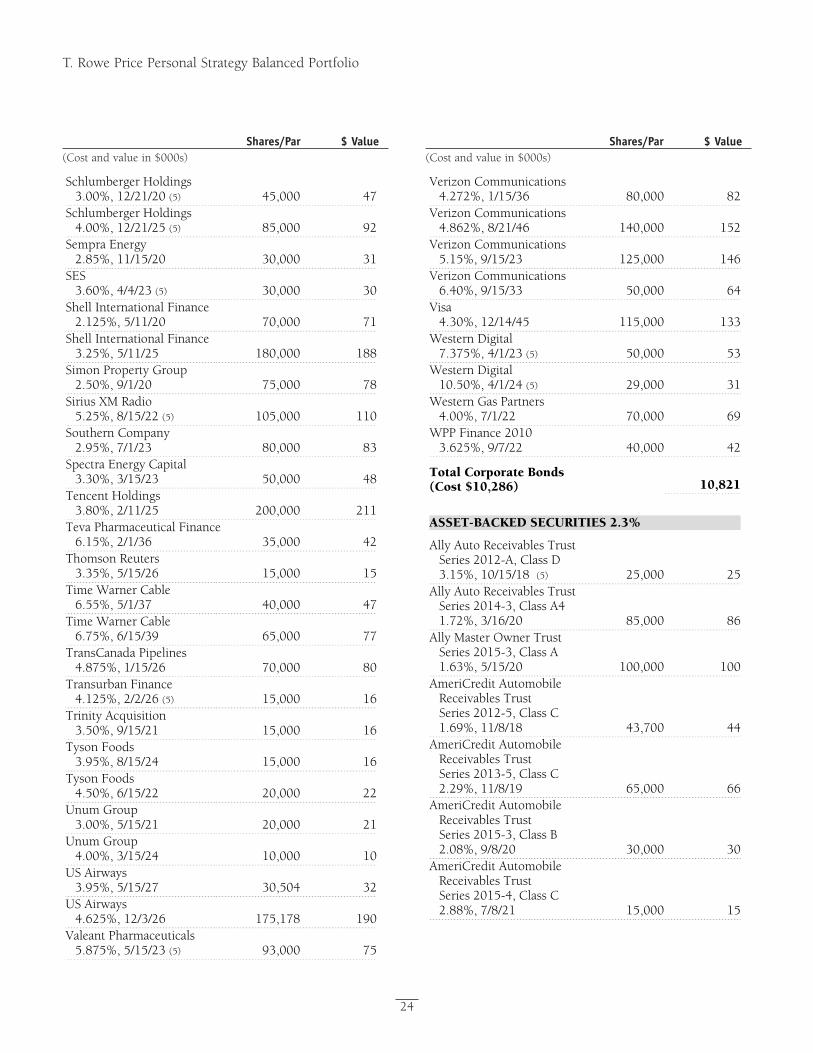
Proof #4
T. Rowe Price Personal Strategy Balanced Portfolio
Shares/Par $ Value(Cost and value in $000s)
Shares/Par $ Value(Cost and value in $000s)
24
Schlumberger Holdings 3.00%, 12/21/20 (5) 45,000 47
Schlumberger Holdings 4.00%, 12/21/25 (5) 85,000 92
Sempra Energy 2.85%, 11/15/20 30,000 31
SES 3.60%, 4/4/23 (5) 30,000 30
Shell International Finance 2.125%, 5/11/20 70,000 71
Shell International Finance 3.25%, 5/11/25 180,000 188
Simon Property Group 2.50%, 9/1/20 75,000 78
Sirius XM Radio 5.25%, 8/15/22 (5) 105,000 110
Southern Company 2.95%, 7/1/23 80,000 83
Spectra Energy Capital 3.30%, 3/15/23 50,000 48
Tencent Holdings 3.80%, 2/11/25 200,000 211
Teva Pharmaceutical Finance 6.15%, 2/1/36 35,000 42
Thomson Reuters 3.35%, 5/15/26 15,000 15
Time Warner Cable 6.55%, 5/1/37 40,000 47
Time Warner Cable 6.75%, 6/15/39 65,000 77
TransCanada Pipelines 4.875%, 1/15/26 70,000 80
Transurban Finance 4.125%, 2/2/26 (5) 15,000 16
Trinity Acquisition 3.50%, 9/15/21 15,000 16
Tyson Foods 3.95%, 8/15/24 15,000 16
Tyson Foods 4.50%, 6/15/22 20,000 22
Unum Group 3.00%, 5/15/21 20,000 21
Unum Group 4.00%, 3/15/24 10,000 10
US Airways 3.95%, 5/15/27 30,504 32
US Airways 4.625%, 12/3/26 175,178 190
Valeant Pharmaceuticals 5.875%, 5/15/23 (5) 93,000 75
Verizon Communications4.272%, 1/15/36 80,000 82
Verizon Communications4.862%, 8/21/46 140,000 152
Verizon Communications5.15%, 9/15/23 125,000 146
Verizon Communications6.40%, 9/15/33 50,000 64
Visa 4.30%, 12/14/45 115,000 133
Western Digital7.375%, 4/1/23 (5) 50,000 53
Western Digital10.50%, 4/1/24 (5) 29,000 31
Western Gas Partners4.00%, 7/1/22 70,000 69
WPP Finance 20103.625%, 9/7/22 40,000 42
Total Corporate Bonds (Cost $10,286) 10,821
ASSET-BACKED SECURITIES 2.3%
Ally Auto Receivables Trust Series 2012-A, Class D 3.15%, 10/15/18 (5) 25,000 25
Ally Auto Receivables Trust Series 2014-3, Class A4 1.72%, 3/16/20 85,000 86
Ally Master Owner TrustSeries 2015-3, Class A 1.63%, 5/15/20 100,000 100
AmeriCredit Automobile Receivables Trust Series 2012-5, Class C 1.69%, 11/8/18 43,700 44
AmeriCredit Automobile Receivables Trust Series 2013-5, Class C 2.29%, 11/8/19 65,000 66
AmeriCredit Automobile Receivables Trust Series 2015-3, Class B 2.08%, 9/8/20 30,000 30
AmeriCredit Automobile Receivables Trust Series 2015-4, Class C 2.88%, 7/8/21 15,000 15
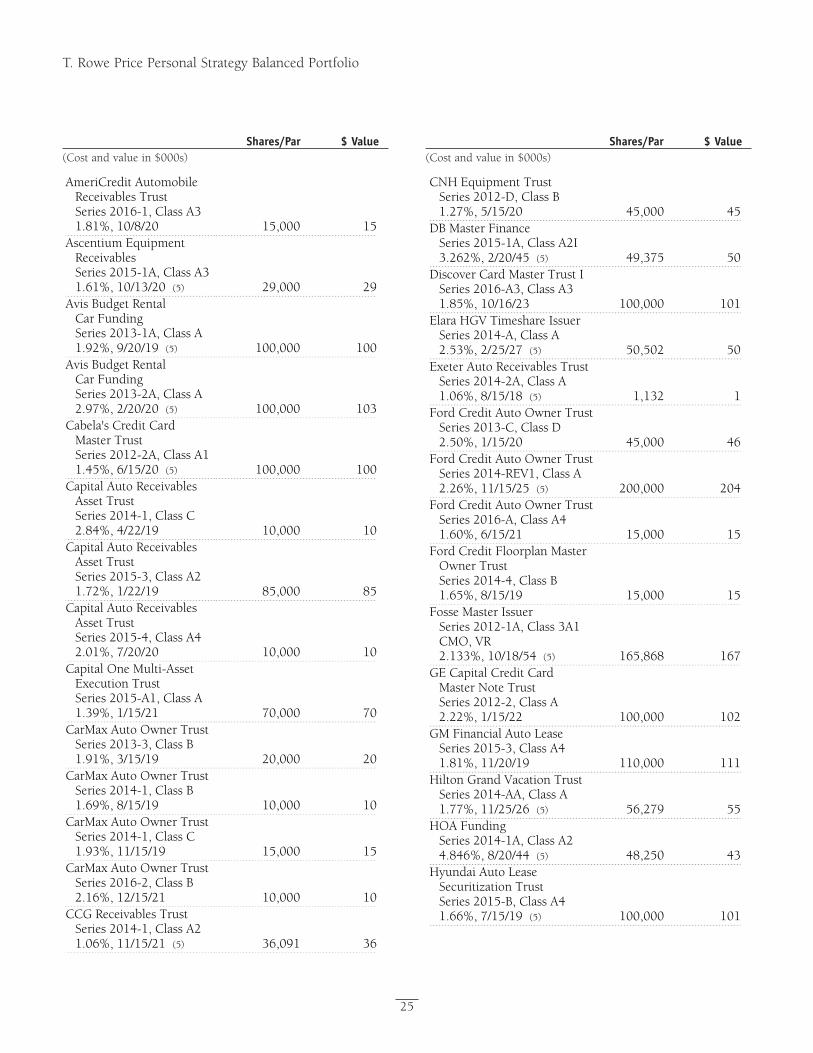
Proof #4
T. Rowe Price Personal Strategy Balanced Portfolio
Shares/Par $ Value(Cost and value in $000s)
Shares/Par $ Value(Cost and value in $000s)
25
AmeriCredit Automobile Receivables Trust Series 2016-1, Class A3 1.81%, 10/8/20 15,000 15
Ascentium Equipment Receivables Series 2015-1A, Class A3 1.61%, 10/13/20 (5) 29,000 29
Avis Budget Rental Car Funding Series 2013-1A, Class A 1.92%, 9/20/19 (5) 100,000 100
Avis Budget Rental Car Funding Series 2013-2A, Class A 2.97%, 2/20/20 (5) 100,000 103
Cabela's Credit Card Master Trust Series 2012-2A, Class A1 1.45%, 6/15/20 (5) 100,000 100
Capital Auto Receivables Asset Trust Series 2014-1, Class C 2.84%, 4/22/19 10,000 10
Capital Auto Receivables Asset Trust Series 2015-3, Class A2 1.72%, 1/22/19 85,000 85
Capital Auto Receivables Asset Trust Series 2015-4, Class A4 2.01%, 7/20/20 10,000 10
Capital One Multi-Asset Execution Trust Series 2015-A1, Class A 1.39%, 1/15/21 70,000 70
CarMax Auto Owner Trust Series 2013-3, Class B 1.91%, 3/15/19 20,000 20
CarMax Auto Owner Trust Series 2014-1, Class B 1.69%, 8/15/19 10,000 10
CarMax Auto Owner Trust Series 2014-1, Class C 1.93%, 11/15/19 15,000 15
CarMax Auto Owner Trust Series 2016-2, Class B 2.16%, 12/15/21 10,000 10
CCG Receivables Trust Series 2014-1, Class A2 1.06%, 11/15/21 (5) 36,091 36
CNH Equipment TrustSeries 2012-D, Class B 1.27%, 5/15/20 45,000 45
DB Master FinanceSeries 2015-1A, Class A2I 3.262%, 2/20/45 (5) 49,375 50
Discover Card Master Trust I Series 2016-A3, Class A3 1.85%, 10/16/23 100,000 101
Elara HGV Timeshare Issuer Series 2014-A, Class A 2.53%, 2/25/27 (5) 50,502 50
Exeter Auto Receivables Trust Series 2014-2A, Class A 1.06%, 8/15/18 (5) 1,132 1
Ford Credit Auto Owner Trust Series 2013-C, Class D 2.50%, 1/15/20 45,000 46
Ford Credit Auto Owner Trust Series 2014-REV1, Class A 2.26%, 11/15/25 (5) 200,000 204
Ford Credit Auto Owner Trust Series 2016-A, Class A4 1.60%, 6/15/21 15,000 15
Ford Credit Floorplan Master Owner Trust Series 2014-4, Class B 1.65%, 8/15/19 15,000 15
Fosse Master IssuerSeries 2012-1A, Class 3A1 CMO, VR 2.133%, 10/18/54 (5) 165,868 167
GE Capital Credit Card Master Note Trust Series 2012-2, Class A 2.22%, 1/15/22 100,000 102
GM Financial Auto LeaseSeries 2015-3, Class A4 1.81%, 11/20/19 110,000 111
Hilton Grand Vacation Trust Series 2014-AA, Class A 1.77%, 11/25/26 (5) 56,279 55
HOA FundingSeries 2014-1A, Class A2 4.846%, 8/20/44 (5) 48,250 43
Hyundai Auto Lease Securitization Trust Series 2015-B, Class A4 1.66%, 7/15/19 (5) 100,000 101
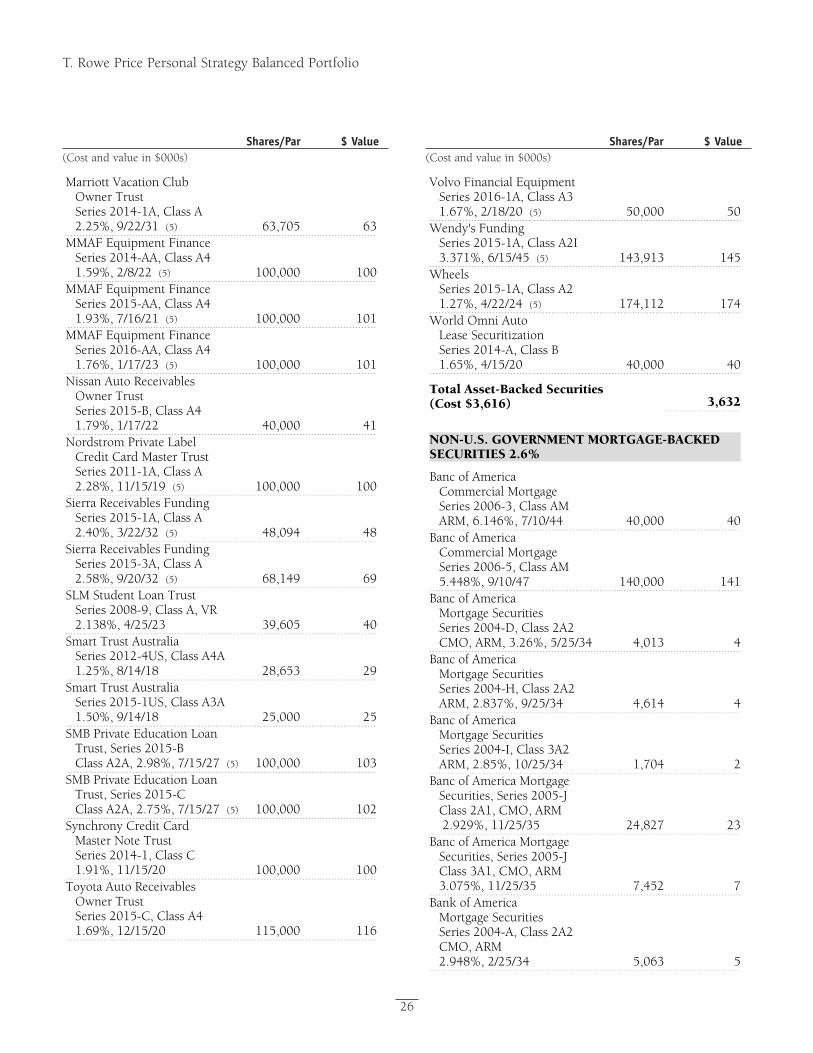
Proof #4
T. Rowe Price Personal Strategy Balanced Portfolio
Shares/Par $ Value(Cost and value in $000s)
Shares/Par $ Value(Cost and value in $000s)
26
Marriott Vacation Club Owner Trust Series 2014-1A, Class A 2.25%, 9/22/31 (5) 63,705 63
MMAF Equipment Finance Series 2014-AA, Class A4 1.59%, 2/8/22 (5) 100,000 100
MMAF Equipment Finance Series 2015-AA, Class A4 1.93%, 7/16/21 (5) 100,000 101
MMAF Equipment Finance Series 2016-AA, Class A4 1.76%, 1/17/23 (5) 100,000 101
Nissan Auto Receivables Owner Trust Series 2015-B, Class A4 1.79%, 1/17/22 40,000 41
Nordstrom Private Label Credit Card Master Trust Series 2011-1A, Class A 2.28%, 11/15/19 (5) 100,000 100
Sierra Receivables Funding Series 2015-1A, Class A 2.40%, 3/22/32 (5) 48,094 48
Sierra Receivables Funding Series 2015-3A, Class A 2.58%, 9/20/32 (5) 68,149 69
SLM Student Loan Trust Series 2008-9, Class A, VR 2.138%, 4/25/23 39,605 40
Smart Trust Australia Series 2012-4US, Class A4A 1.25%, 8/14/18 28,653 29
Smart Trust Australia Series 2015-1US, Class A3A 1.50%, 9/14/18 25,000 25
SMB Private Education Loan Trust, Series 2015-B Class A2A, 2.98%, 7/15/27 (5) 100,000 103
SMB Private Education Loan Trust, Series 2015-C Class A2A, 2.75%, 7/15/27 (5) 100,000 102
Synchrony Credit Card Master Note Trust Series 2014-1, Class C 1.91%, 11/15/20 100,000 100
Toyota Auto Receivables Owner Trust Series 2015-C, Class A4 1.69%, 12/15/20 115,000 116
Volvo Financial Equipment Series 2016-1A, Class A3 1.67%, 2/18/20 (5) 50,000 50
Wendy's FundingSeries 2015-1A, Class A2I 3.371%, 6/15/45 (5) 143,913 145
WheelsSeries 2015-1A, Class A2 1.27%, 4/22/24 (5) 174,112 174
World Omni Auto Lease Securitization Series 2014-A, Class B 1.65%, 4/15/20 40,000 40
Total Asset-Backed Securities (Cost $3,616) 3,632
NON-U.S. GOVERNMENT MORTGAGE-BACKED SECURITIES 2.6%
Banc of America Commercial Mortgage Series 2006-3, Class AM ARM, 6.146%, 7/10/44 40,000 40
Banc of America Commercial Mortgage Series 2006-5, Class AM 5.448%, 9/10/47 140,000 141
Banc of America Mortgage Securities Series 2004-D, Class 2A2 CMO, ARM, 3.26%, 5/25/34 4,013 4
Banc of America Mortgage Securities Series 2004-H, Class 2A2 ARM, 2.837%, 9/25/34 4,614 4
Banc of America Mortgage Securities Series 2004-I, Class 3A2 ARM, 2.85%, 10/25/34 1,704 2
Banc of America Mortgage Securities, Series 2005-J Class 2A1, CMO, ARM 2.929%, 11/25/35 24,827 23
Banc of America Mortgage Securities, Series 2005-J Class 3A1, CMO, ARM 3.075%, 11/25/35 7,452 7
Bank of America Mortgage Securities Series 2004-A, Class 2A2 CMO, ARM 2.948%, 2/25/34 5,063 5
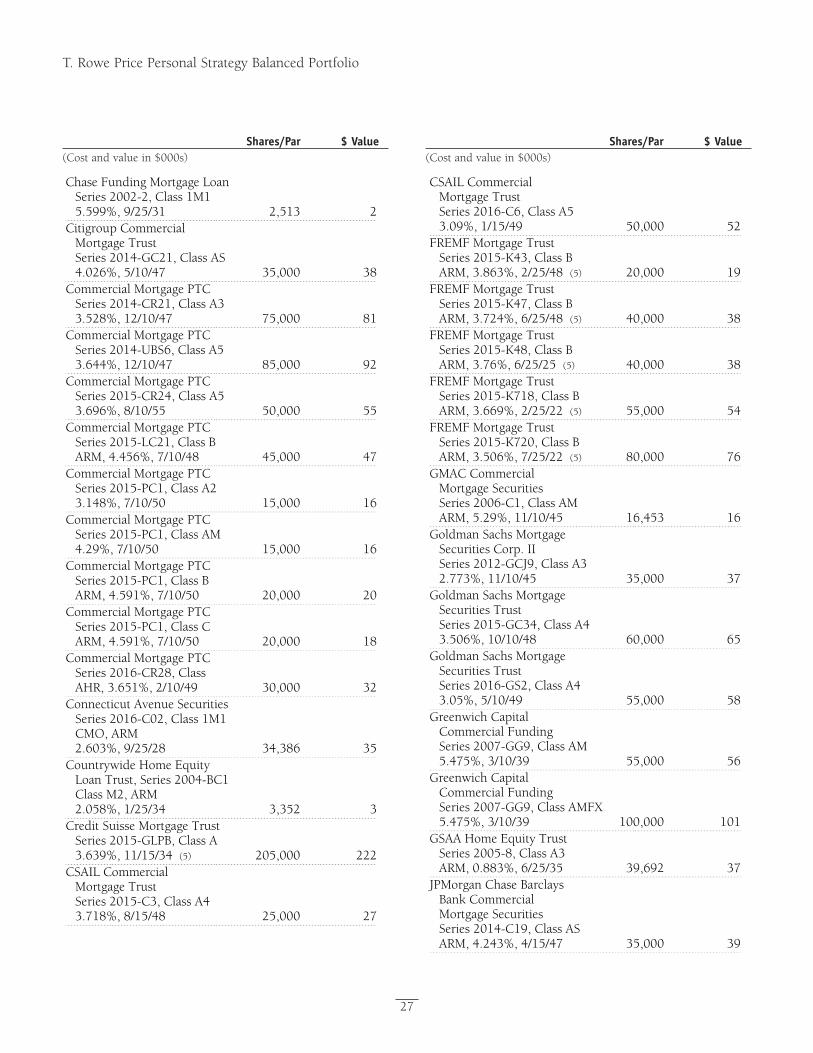
Proof #4
T. Rowe Price Personal Strategy Balanced Portfolio
Shares/Par $ Value(Cost and value in $000s)
Shares/Par $ Value(Cost and value in $000s)
27
Chase Funding Mortgage Loan Series 2002-2, Class 1M1 5.599%, 9/25/31 2,513 2
Citigroup Commercial Mortgage Trust Series 2014-GC21, Class AS 4.026%, 5/10/47 35,000 38
Commercial Mortgage PTC Series 2014-CR21, Class A3 3.528%, 12/10/47 75,000 81
Commercial Mortgage PTC Series 2014-UBS6, Class A5 3.644%, 12/10/47 85,000 92
Commercial Mortgage PTC Series 2015-CR24, Class A5 3.696%, 8/10/55 50,000 55
Commercial Mortgage PTC Series 2015-LC21, Class B ARM, 4.456%, 7/10/48 45,000 47
Commercial Mortgage PTC Series 2015-PC1, Class A2 3.148%, 7/10/50 15,000 16
Commercial Mortgage PTC Series 2015-PC1, Class AM 4.29%, 7/10/50 15,000 16
Commercial Mortgage PTC Series 2015-PC1, Class B ARM, 4.591%, 7/10/50 20,000 20
Commercial Mortgage PTC Series 2015-PC1, Class C ARM, 4.591%, 7/10/50 20,000 18
Commercial Mortgage PTC Series 2016-CR28, Class AHR, 3.651%, 2/10/49 30,000 32
Connecticut Avenue Securities Series 2016-C02, Class 1M1 CMO, ARM 2.603%, 9/25/28 34,386 35
Countrywide Home Equity Loan Trust, Series 2004-BC1 Class M2, ARM 2.058%, 1/25/34 3,352 3
Credit Suisse Mortgage Trust Series 2015-GLPB, Class A 3.639%, 11/15/34 (5) 205,000 222
CSAIL Commercial Mortgage Trust Series 2015-C3, Class A4 3.718%, 8/15/48 25,000 27
CSAIL Commercial Mortgage Trust Series 2016-C6, Class A5 3.09%, 1/15/49 50,000 52
FREMF Mortgage TrustSeries 2015-K43, Class B ARM, 3.863%, 2/25/48 (5) 20,000 19
FREMF Mortgage TrustSeries 2015-K47, Class B ARM, 3.724%, 6/25/48 (5) 40,000 38
FREMF Mortgage TrustSeries 2015-K48, Class B ARM, 3.76%, 6/25/25 (5) 40,000 38
FREMF Mortgage TrustSeries 2015-K718, Class B ARM, 3.669%, 2/25/22 (5) 55,000 54
FREMF Mortgage TrustSeries 2015-K720, Class B ARM, 3.506%, 7/25/22 (5) 80,000 76
GMAC Commercial Mortgage Securities Series 2006-C1, Class AM ARM, 5.29%, 11/10/45 16,453 16
Goldman Sachs Mortgage Securities Corp. II Series 2012-GCJ9, Class A3 2.773%, 11/10/45 35,000 37
Goldman Sachs Mortgage Securities Trust Series 2015-GC34, Class A4 3.506%, 10/10/48 60,000 65
Goldman Sachs Mortgage Securities Trust Series 2016-GS2, Class A4 3.05%, 5/10/49 55,000 58
Greenwich Capital Commercial Funding Series 2007-GG9, Class AM 5.475%, 3/10/39 55,000 56
Greenwich Capital Commercial Funding Series 2007-GG9, Class AMFX 5.475%, 3/10/39 100,000 101
GSAA Home Equity TrustSeries 2005-8, Class A3 ARM, 0.883%, 6/25/35 39,692 37
JPMorgan Chase Barclays Bank Commercial Mortgage Securities Series 2014-C19, Class AS ARM, 4.243%, 4/15/47 35,000 39
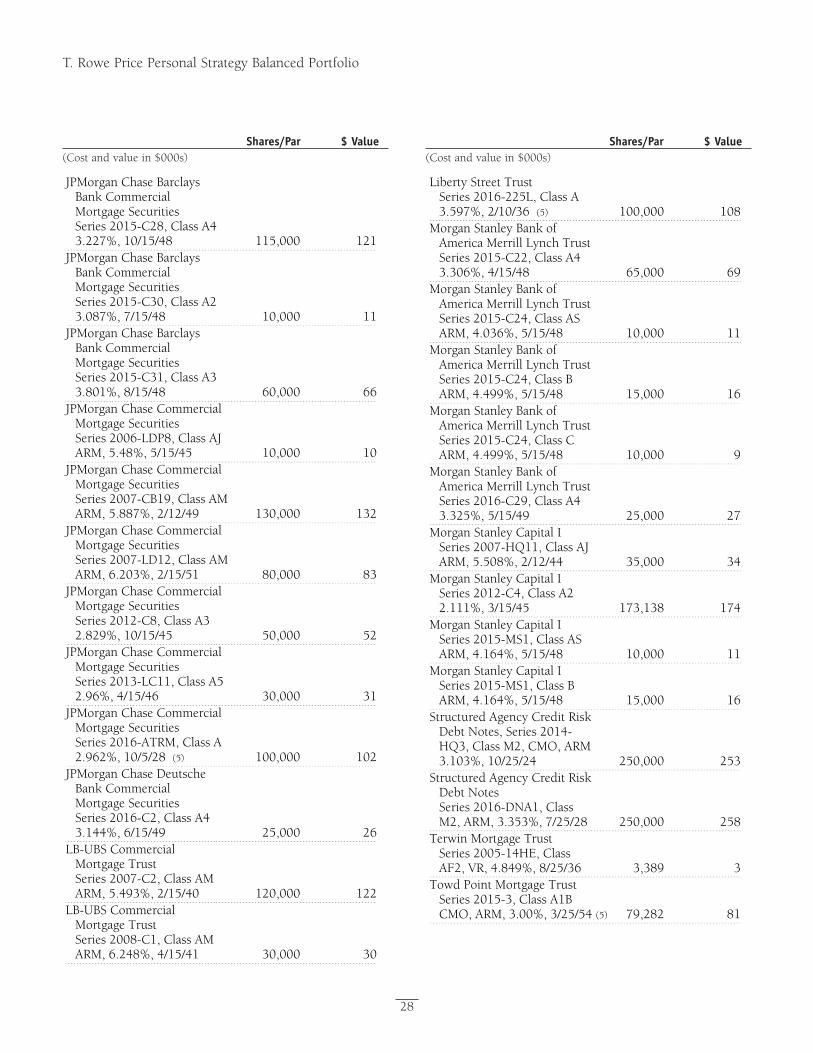
Proof #4
T. Rowe Price Personal Strategy Balanced Portfolio
Shares/Par $ Value(Cost and value in $000s)
Shares/Par $ Value(Cost and value in $000s)
28
JPMorgan Chase Barclays Bank Commercial Mortgage Securities Series 2015-C28, Class A4 3.227%, 10/15/48 115,000 121
JPMorgan Chase Barclays Bank Commercial Mortgage Securities Series 2015-C30, Class A2 3.087%, 7/15/48 10,000 11
JPMorgan Chase Barclays Bank Commercial Mortgage Securities Series 2015-C31, Class A3 3.801%, 8/15/48 60,000 66
JPMorgan Chase Commercial Mortgage Securities Series 2006-LDP8, Class AJ ARM, 5.48%, 5/15/45 10,000 10
JPMorgan Chase Commercial Mortgage Securities Series 2007-CB19, Class AM ARM, 5.887%, 2/12/49 130,000 132
JPMorgan Chase Commercial Mortgage Securities Series 2007-LD12, Class AM ARM, 6.203%, 2/15/51 80,000 83
JPMorgan Chase Commercial Mortgage Securities Series 2012-C8, Class A3 2.829%, 10/15/45 50,000 52
JPMorgan Chase Commercial Mortgage Securities Series 2013-LC11, Class A5 2.96%, 4/15/46 30,000 31
JPMorgan Chase Commercial Mortgage Securities Series 2016-ATRM, Class A 2.962%, 10/5/28 (5) 100,000 102
JPMorgan Chase Deutsche Bank Commercial Mortgage Securities Series 2016-C2, Class A4 3.144%, 6/15/49 25,000 26
LB-UBS Commercial Mortgage Trust Series 2007-C2, Class AM ARM, 5.493%, 2/15/40 120,000 122
LB-UBS Commercial Mortgage Trust Series 2008-C1, Class AM ARM, 6.248%, 4/15/41 30,000 30
Liberty Street TrustSeries 2016-225L, Class A 3.597%, 2/10/36 (5) 100,000 108
Morgan Stanley Bank of America Merrill Lynch Trust Series 2015-C22, Class A4 3.306%, 4/15/48 65,000 69
Morgan Stanley Bank of America Merrill Lynch Trust Series 2015-C24, Class AS ARM, 4.036%, 5/15/48 10,000 11
Morgan Stanley Bank of America Merrill Lynch Trust Series 2015-C24, Class B ARM, 4.499%, 5/15/48 15,000 16
Morgan Stanley Bank of America Merrill Lynch Trust Series 2015-C24, Class C ARM, 4.499%, 5/15/48 10,000 9
Morgan Stanley Bank of America Merrill Lynch Trust Series 2016-C29, Class A4 3.325%, 5/15/49 25,000 27
Morgan Stanley Capital ISeries 2007-HQ11, Class AJ ARM, 5.508%, 2/12/44 35,000 34
Morgan Stanley Capital ISeries 2012-C4, Class A2 2.111%, 3/15/45 173,138 174
Morgan Stanley Capital ISeries 2015-MS1, Class AS ARM, 4.164%, 5/15/48 10,000 11
Morgan Stanley Capital ISeries 2015-MS1, Class B ARM, 4.164%, 5/15/48 15,000 16
Structured Agency Credit Risk Debt Notes, Series 2014-HQ3, Class M2, CMO, ARM 3.103%, 10/25/24 250,000 253
Structured Agency Credit Risk Debt Notes Series 2016-DNA1, Class M2, ARM, 3.353%, 7/25/28 250,000 258
Terwin Mortgage TrustSeries 2005-14HE, Class AF2, VR, 4.849%, 8/25/36 3,389 3
Towd Point Mortgage Trust Series 2015-3, Class A1B CMO, ARM, 3.00%, 3/25/54 (5) 79,282 81
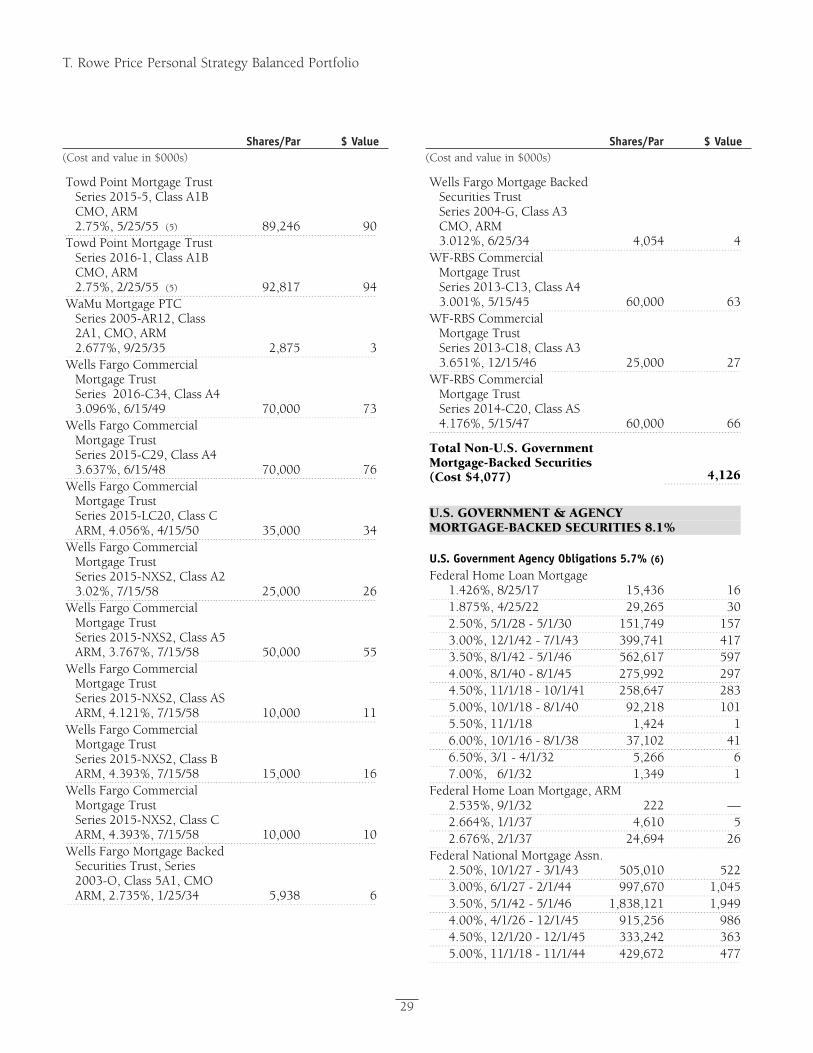
Proof #4
T. Rowe Price Personal Strategy Balanced Portfolio
Shares/Par $ Value(Cost and value in $000s)
Shares/Par $ Value(Cost and value in $000s)
29
Towd Point Mortgage Trust Series 2015-5, Class A1B CMO, ARM 2.75%, 5/25/55 (5) 89,246 90
Towd Point Mortgage Trust Series 2016-1, Class A1B CMO, ARM 2.75%, 2/25/55 (5) 92,817 94
WaMu Mortgage PTC Series 2005-AR12, Class 2A1, CMO, ARM 2.677%, 9/25/35 2,875 3
Wells Fargo Commercial Mortgage Trust Series 2016-C34, Class A4 3.096%, 6/15/49 70,000 73
Wells Fargo Commercial Mortgage Trust Series 2015-C29, Class A4 3.637%, 6/15/48 70,000 76
Wells Fargo Commercial Mortgage Trust Series 2015-LC20, Class C ARM, 4.056%, 4/15/50 35,000 34
Wells Fargo Commercial Mortgage Trust Series 2015-NXS2, Class A2 3.02%, 7/15/58 25,000 26
Wells Fargo Commercial Mortgage Trust Series 2015-NXS2, Class A5 ARM, 3.767%, 7/15/58 50,000 55
Wells Fargo Commercial Mortgage Trust Series 2015-NXS2, Class AS ARM, 4.121%, 7/15/58 10,000 11
Wells Fargo Commercial Mortgage Trust Series 2015-NXS2, Class B ARM, 4.393%, 7/15/58 15,000 16
Wells Fargo Commercial Mortgage Trust Series 2015-NXS2, Class C ARM, 4.393%, 7/15/58 10,000 10
Wells Fargo Mortgage Backed Securities Trust, Series 2003-O, Class 5A1, CMO ARM, 2.735%, 1/25/34 5,938 6
Wells Fargo Mortgage Backed Securities Trust Series 2004-G, Class A3 CMO, ARM 3.012%, 6/25/34 4,054 4
WF-RBS Commercial Mortgage Trust Series 2013-C13, Class A4 3.001%, 5/15/45 60,000 63
WF-RBS Commercial Mortgage Trust Series 2013-C18, Class A3 3.651%, 12/15/46 25,000 27
WF-RBS Commercial Mortgage Trust Series 2014-C20, Class AS 4.176%, 5/15/47 60,000 66
Total Non-U.S. Government Mortgage-Backed Securities (Cost $4,077) 4,126
U.S. GOVERNMENT & AGENCY MORTGAGE-BACKED SECURITIES 8.1%
U.S. Government Agency Obligations 5.7% (6) Federal Home Loan Mortgage
1.426%, 8/25/17 15,436 16 1.875%, 4/25/22 29,265 30 2.50%, 5/1/28 - 5/1/30 151,749 157 3.00%, 12/1/42 - 7/1/43 399,741 417 3.50%, 8/1/42 - 5/1/46 562,617 597 4.00%, 8/1/40 - 8/1/45 275,992 297 4.50%, 11/1/18 - 10/1/41 258,647 283 5.00%, 10/1/18 - 8/1/40 92,218 101 5.50%, 11/1/18 1,424 1 6.00%, 10/1/16 - 8/1/38 37,102 41 6.50%, 3/1 - 4/1/32 5,266 6 7.00%, 6/1/32 1,349 1Federal Home Loan Mortgage, ARM
2.535%, 9/1/32 222 — 2.664%, 1/1/37 4,610 5 2.676%, 2/1/37 24,694 26Federal National Mortgage Assn. 2.50%, 10/1/27 - 3/1/43 505,010 522 3.00%, 6/1/27 - 2/1/44 997,670 1,045 3.50%, 5/1/42 - 5/1/46 1,838,121 1,949 4.00%, 4/1/26 - 12/1/45 915,256 986 4.50%, 12/1/20 - 12/1/45 333,242 363 5.00%, 11/1/18 - 11/1/44 429,672 477
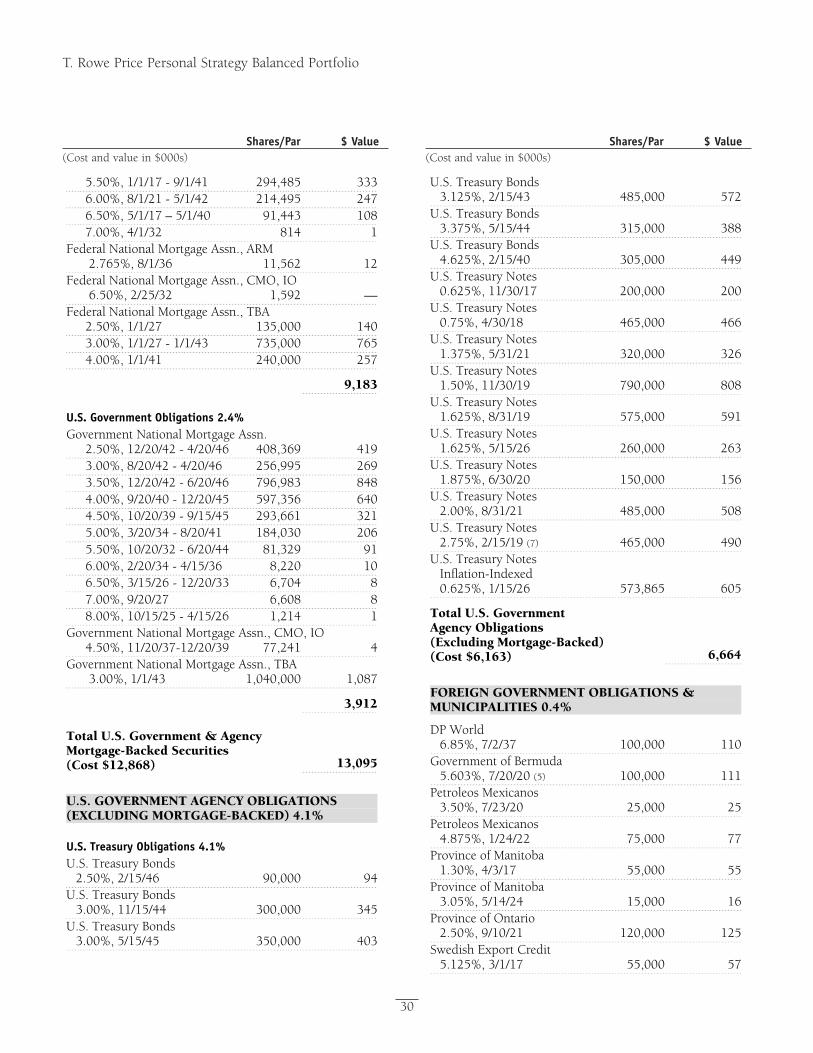
Proof #4
T. Rowe Price Personal Strategy Balanced Portfolio
Shares/Par $ Value(Cost and value in $000s)
Shares/Par $ Value(Cost and value in $000s)
30
5.50%, 1/1/17 - 9/1/41 294,485 333 6.00%, 8/1/21 - 5/1/42 214,495 247 6.50%, 5/1/17 – 5/1/40 91,443 108 7.00%, 4/1/32 814 1Federal National Mortgage Assn., ARM
2.765%, 8/1/36 11,562 12Federal National Mortgage Assn., CMO, IO
6.50%, 2/25/32 1,592 —Federal National Mortgage Assn., TBA
2.50%, 1/1/27 135,000 140 3.00%, 1/1/27 - 1/1/43 735,000 765 4.00%, 1/1/41 240,000 257
9,183
U.S. Government Obligations 2.4% Government National Mortgage Assn. 2.50%, 12/20/42 - 4/20/46 408,369 419 3.00%, 8/20/42 - 4/20/46 256,995 269 3.50%, 12/20/42 - 6/20/46 796,983 848 4.00%, 9/20/40 - 12/20/45 597,356 640 4.50%, 10/20/39 - 9/15/45 293,661 321 5.00%, 3/20/34 - 8/20/41 184,030 206 5.50%, 10/20/32 - 6/20/44 81,329 91 6.00%, 2/20/34 - 4/15/36 8,220 10 6.50%, 3/15/26 - 12/20/33 6,704 8 7.00%, 9/20/27 6,608 8 8.00%, 10/15/25 - 4/15/26 1,214 1Government National Mortgage Assn., CMO, IO 4.50%, 11/20/37-12/20/39 77,241 4Government National Mortgage Assn., TBA 3.00%, 1/1/43 1,040,000 1,087
3,912
Total U.S. Government & Agency Mortgage-Backed Securities (Cost $12,868) 13,095
U.S. GOVERNMENT AGENCY OBLIGATIONS (EXCLUDING MORTGAGE-BACKED) 4.1%
U.S. Treasury Obligations 4.1% U.S. Treasury Bonds
2.50%, 2/15/46 90,000 94U.S. Treasury Bonds
3.00%, 11/15/44 300,000 345U.S. Treasury Bonds
3.00%, 5/15/45 350,000 403
U.S. Treasury Bonds3.125%, 2/15/43 485,000 572
U.S. Treasury Bonds3.375%, 5/15/44 315,000 388
U.S. Treasury Bonds4.625%, 2/15/40 305,000 449
U.S. Treasury Notes0.625%, 11/30/17 200,000 200
U.S. Treasury Notes0.75%, 4/30/18 465,000 466
U.S. Treasury Notes1.375%, 5/31/21 320,000 326
U.S. Treasury Notes1.50%, 11/30/19 790,000 808
U.S. Treasury Notes1.625%, 8/31/19 575,000 591
U.S. Treasury Notes1.625%, 5/15/26 260,000 263
U.S. Treasury Notes1.875%, 6/30/20 150,000 156
U.S. Treasury Notes2.00%, 8/31/21 485,000 508
U.S. Treasury Notes2.75%, 2/15/19 (7) 465,000 490
U.S. Treasury Notes Inflation-Indexed 0.625%, 1/15/26 573,865 605
Total U.S. Government Agency Obligations (Excluding Mortgage-Backed) (Cost $6,163) 6,664
FOREIGN GOVERNMENT OBLIGATIONS & MUNICIPALITIES 0.4%
DP World6.85%, 7/2/37 100,000 110
Government of Bermuda5.603%, 7/20/20 (5) 100,000 111
Petroleos Mexicanos3.50%, 7/23/20 25,000 25
Petroleos Mexicanos4.875%, 1/24/22 75,000 77
Province of Manitoba1.30%, 4/3/17 55,000 55
Province of Manitoba3.05%, 5/14/24 15,000 16
Province of Ontario2.50%, 9/10/21 120,000 125
Swedish Export Credit5.125%, 3/1/17 55,000 57
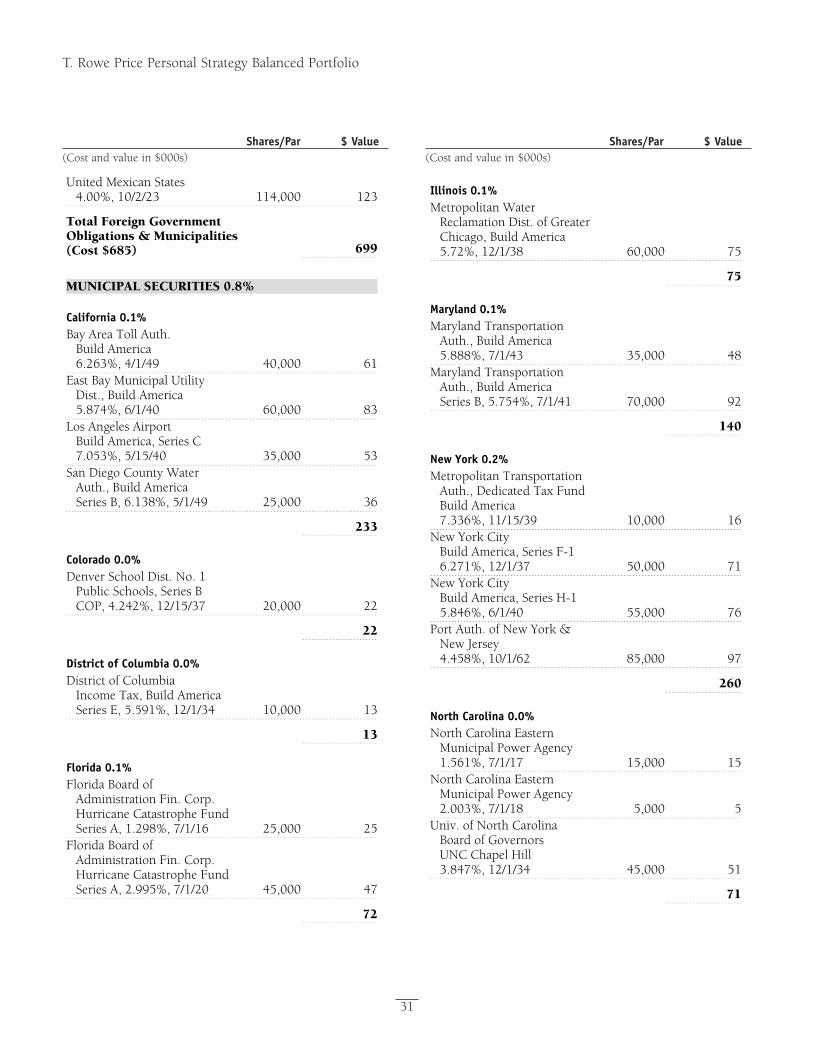
Proof #4
T. Rowe Price Personal Strategy Balanced Portfolio
Shares/Par $ Value(Cost and value in $000s)
Shares/Par $ Value(Cost and value in $000s)
31
United Mexican States 4.00%, 10/2/23 114,000 123
Total Foreign Government Obligations & Municipalities (Cost $685) 699
MUNICIPAL SECURITIES 0.8%
California 0.1% Bay Area Toll Auth.
Build America 6.263%, 4/1/49 40,000 61
East Bay Municipal Utility Dist., Build America 5.874%, 6/1/40 60,000 83
Los Angeles Airport Build America, Series C 7.053%, 5/15/40 35,000 53
San Diego County Water Auth., Build America Series B, 6.138%, 5/1/49 25,000 36
233
Colorado 0.0% Denver School Dist. No. 1
Public Schools, Series B COP, 4.242%, 12/15/37 20,000 22
22
District of Columbia 0.0% District of Columbia
Income Tax, Build America Series E, 5.591%, 12/1/34 10,000 13
13
Florida 0.1% Florida Board of
Administration Fin. Corp. Hurricane Catastrophe Fund Series A, 1.298%, 7/1/16 25,000 25
Florida Board of Administration Fin. Corp. Hurricane Catastrophe Fund Series A, 2.995%, 7/1/20 45,000 47
72
Illinois 0.1% Metropolitan Water
Reclamation Dist. of Greater Chicago, Build America 5.72%, 12/1/38 60,000 75
75
Maryland 0.1% Maryland Transportation
Auth., Build America 5.888%, 7/1/43 35,000 48
Maryland TransportationAuth., Build America Series B, 5.754%, 7/1/41 70,000 92
140
New York 0.2% Metropolitan Transportation
Auth., Dedicated Tax Fund Build America 7.336%, 11/15/39 10,000 16
New York CityBuild America, Series F-1 6.271%, 12/1/37 50,000 71
New York CityBuild America, Series H-1 5.846%, 6/1/40 55,000 76
Port Auth. of New York & New Jersey 4.458%, 10/1/62 85,000 97
260
North Carolina 0.0% North Carolina Eastern
Municipal Power Agency 1.561%, 7/1/17 15,000 15
North Carolina Eastern Municipal Power Agency 2.003%, 7/1/18 5,000 5
Univ. of North Carolina Board of Governors UNC Chapel Hill 3.847%, 12/1/34 45,000 51
71
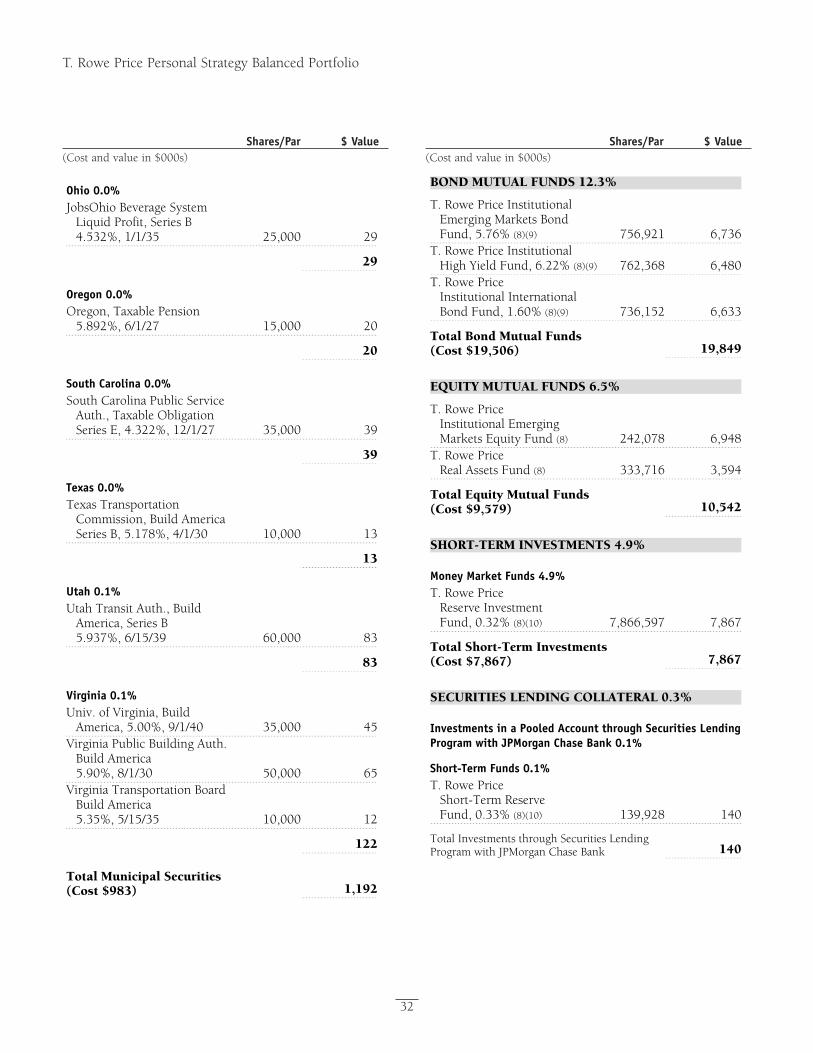
Proof #4
T. Rowe Price Personal Strategy Balanced Portfolio
Shares/Par $ Value(Cost and value in $000s)
Shares/Par $ Value(Cost and value in $000s)
32
Ohio 0.0% JobsOhio Beverage System
Liquid Profit, Series B 4.532%, 1/1/35 25,000 29
29
Oregon 0.0% Oregon, Taxable Pension
5.892%, 6/1/27 15,000 20
20
South Carolina 0.0% South Carolina Public Service
Auth., Taxable Obligation Series E, 4.322%, 12/1/27 35,000 39
39
Texas 0.0% Texas Transportation
Commission, Build America Series B, 5.178%, 4/1/30 10,000 13
13
Utah 0.1% Utah Transit Auth., Build
America, Series B 5.937%, 6/15/39 60,000 83
83
Virginia 0.1% Univ. of Virginia, Build
America, 5.00%, 9/1/40 35,000 45Virginia Public Building Auth.
Build America 5.90%, 8/1/30 50,000 65
Virginia Transportation Board Build America 5.35%, 5/15/35 10,000 12
122
Total Municipal Securities (Cost $983) 1,192
BOND MUTUAL FUNDS 12.3%
T. Rowe Price Institutional Emerging Markets Bond Fund, 5.76% (8)(9) 756,921 6,736
T. Rowe Price Institutional High Yield Fund, 6.22% (8)(9) 762,368 6,480
T. Rowe Price Institutional International Bond Fund, 1.60% (8)(9) 736,152 6,633
Total Bond Mutual Funds (Cost $19,506) 19,849
EQUITY MUTUAL FUNDS 6.5%
T. Rowe Price Institutional Emerging Markets Equity Fund (8) 242,078 6,948
T. Rowe Price Real Assets Fund (8) 333,716 3,594
Total Equity Mutual Funds (Cost $9,579) 10,542
SHORT-TERM INVESTMENTS 4.9%
Money Market Funds 4.9% T. Rowe Price
Reserve Investment Fund, 0.32% (8)(10) 7,866,597 7,867
Total Short-Term Investments (Cost $7,867) 7,867
SECURITIES LENDING COLLATERAL 0.3%
Investments in a Pooled Account through Securities Lending Program with JPMorgan Chase Bank 0.1%
Short-Term Funds 0.1% T. Rowe Price
Short-Term Reserve Fund, 0.33% (8)(10) 139,928 140
Total Investments through Securities Lending Program with JPMorgan Chase Bank 140
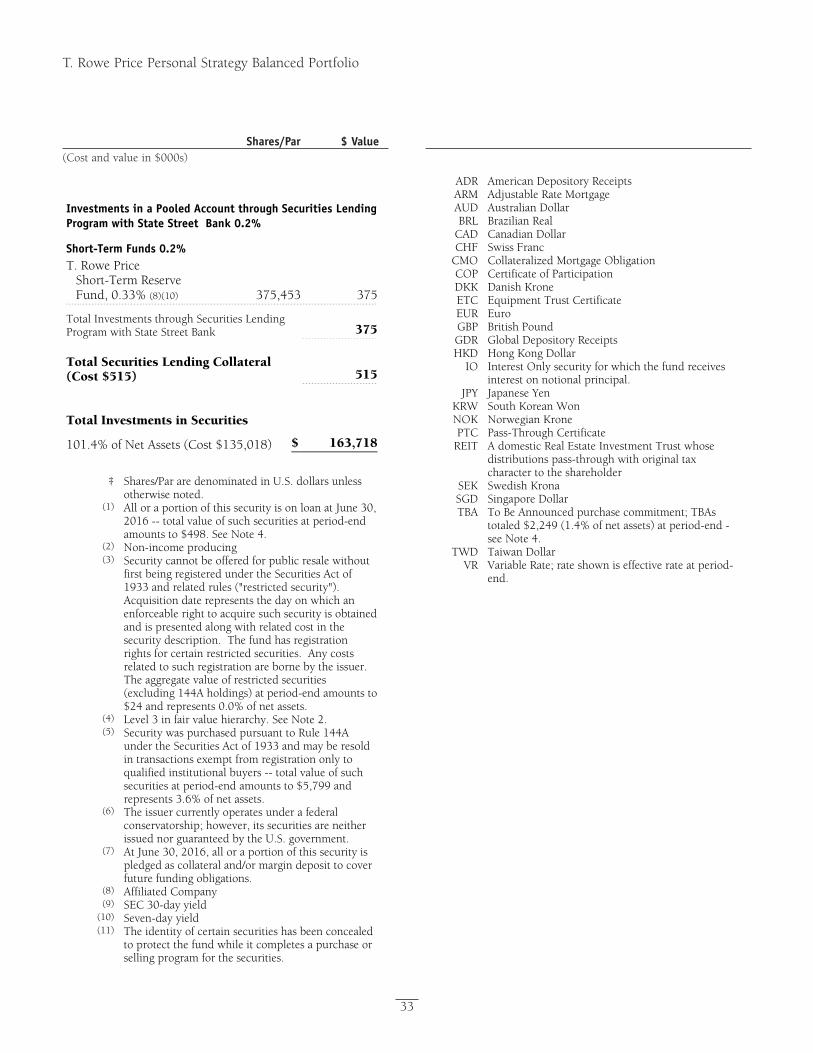
Proof #4
T. Rowe Price Personal Strategy Balanced Portfolio
Shares/Par $ Value(Cost and value in $000s)
33
Investments in a Pooled Account through Securities Lending Program with State Street Bank 0.2%
Short-Term Funds 0.2% T. Rowe Price
Short-Term Reserve Fund, 0.33% (8)(10) 375,453 375
Total Investments through Securities Lending Program with State Street Bank 375
Total Securities Lending Collateral (Cost $515) 515
Total Investments in Securities
101.4% of Net Assets (Cost $135,018) $ 163,718
‡
Shares/Par are denominated in U.S. dollars unless otherwise noted.
(1)
All or a portion of this security is on loan at June 30, 2016 -- total value of such securities at period-end amounts to $498. See Note 4.
(2) Non-income producing (3)
Security cannot be offered for public resale without first being registered under the Securities Act of 1933 and related rules ("restricted security"). Acquisition date represents the day on which an enforceable right to acquire such security is obtained and is presented along with related cost in the security description. The fund has registration rights for certain restricted securities. Any costs related to such registration are borne by the issuer. The aggregate value of restricted securities (excluding 144A holdings) at period-end amounts to $24 and represents 0.0% of net assets.
(4) Level 3 in fair value hierarchy. See Note 2.(5)
Security was purchased pursuant to Rule 144A under the Securities Act of 1933 and may be resold in transactions exempt from registration only to qualified institutional buyers -- total value of such securities at period-end amounts to $5,799 and represents 3.6% of net assets.
(6)
The issuer currently operates under a federal conservatorship; however, its securities are neither issued nor guaranteed by the U.S. government.
(7)
At June 30, 2016, all or a portion of this security is pledged as collateral and/or margin deposit to cover future funding obligations.
(8) Affiliated Company (9) SEC 30-day yield
(10) Seven-day yield (11)
The identity of certain securities has been concealed to protect the fund while it completes a purchase or selling program for the securities.
ADR American Depository Receipts ARM Adjustable Rate Mortgage AUD Australian DollarBRL Brazilian Real
CAD Canadian DollarCHF Swiss Franc
CMO Collateralized Mortgage ObligationCOP Certificate of Participation DKK Danish KroneETC Equipment Trust Certificate EUR EuroGBP British PoundGDR Global Depository Receipts HKD Hong Kong Dollar
IO
Interest Only security for which the fund receives interest on notional principal.
JPY Japanese YenKRW South Korean Won NOK Norwegian Krone PTC Pass-Through Certificate
REIT
A domestic Real Estate Investment Trust whose distributions pass-through with original tax character to the shareholder
SEK Swedish KronaSGD Singapore DollarTBA
To Be Announced purchase commitment; TBAs totaled $2,249 (1.4% of net assets) at period-end - see Note 4.
TWD Taiwan DollarVR
Variable Rate; rate shown is effective rate at period-end.
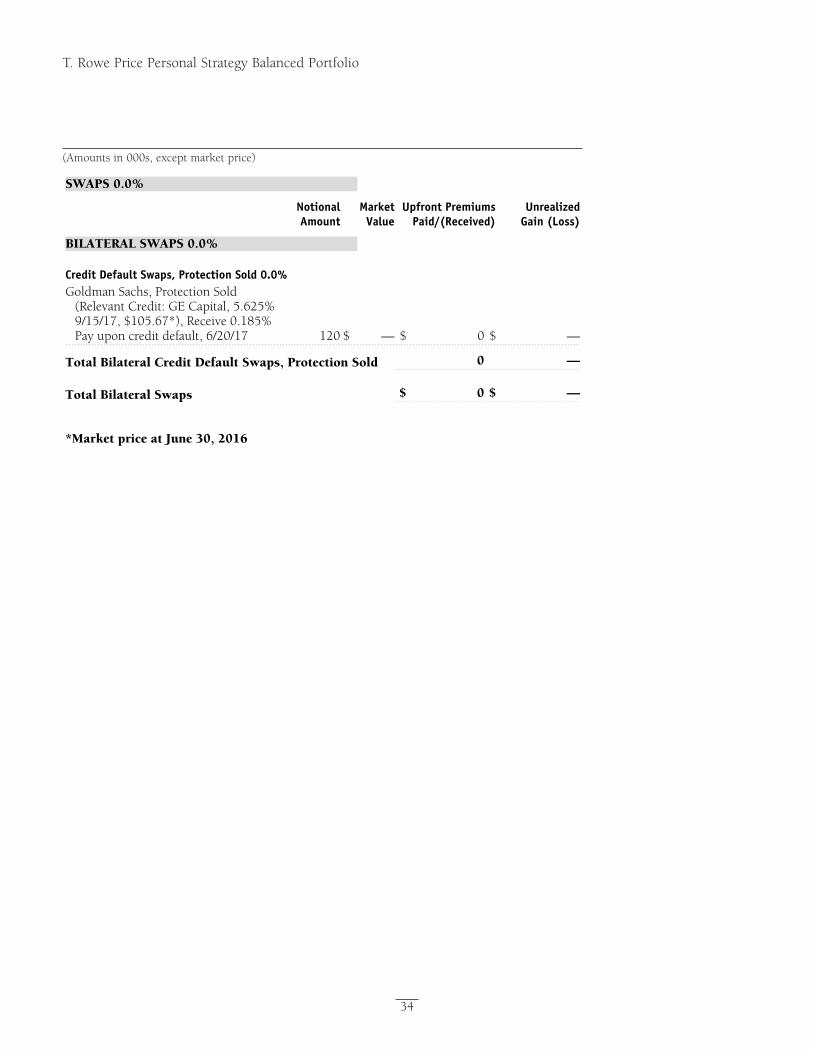
Proof #4
T. Rowe Price Personal Strategy Balanced Portfolio
34
(Amountsin000s,exceptmarketprice)
SWAPS 0.0%
NotionalAmount
Market Value
Upfront PremiumsPaid/(Received)
Unrealized Gain (Loss)
BILATERAL SWAPS 0.0%
Credit Default Swaps, Protection Sold 0.0% Goldman Sachs, Protection Sold
(Relevant Credit: GE Capital, 5.625% 9/15/17, $105.67*), Receive 0.185% Pay upon credit default, 6/20/17 120 $ — $ 0 $ —
Total Bilateral Credit Default Swaps, Protection Sold 0 —
Total Bilateral Swaps $ 0 $ —
*Market price at June 30, 2016
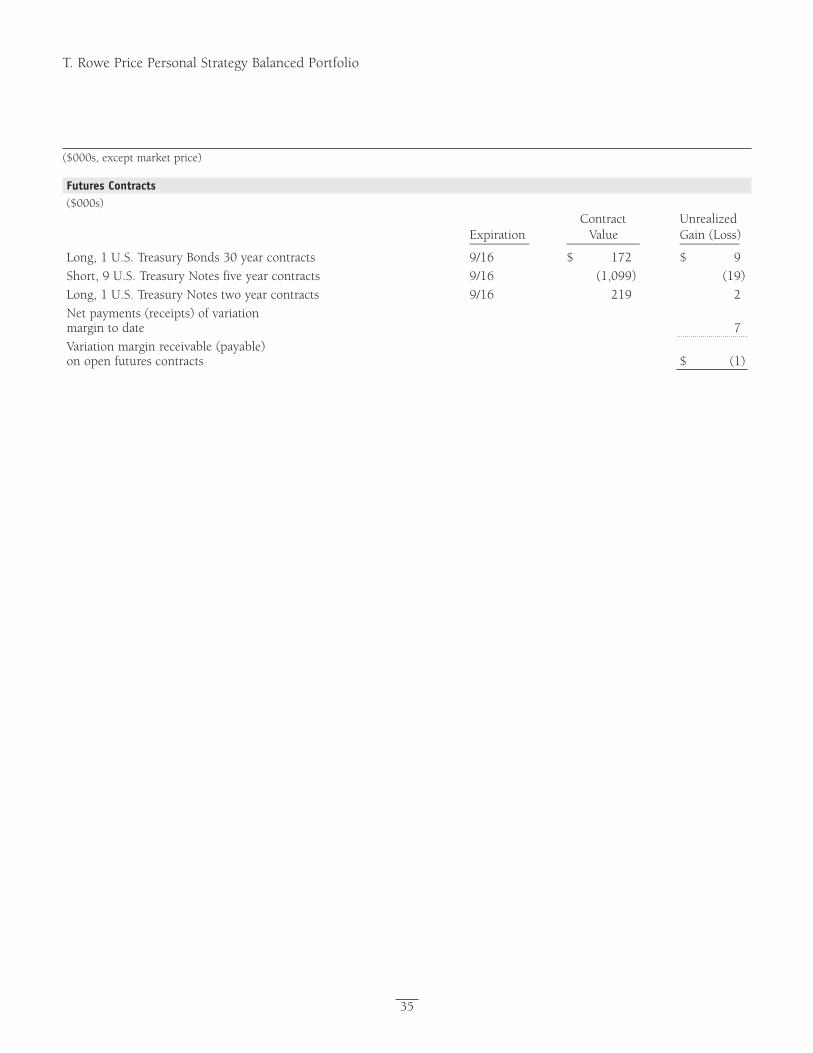
Proof #4
T. Rowe Price Personal Strategy Balanced Portfolio
($000s, except market price)
35
Futures Contracts($000s) Contract Unrealized Expiration Value Gain(Loss) _________ ___________ _________
Long,1U.S.TreasuryBonds30yearcontracts 9/16 $ 172 $ 9
Short,9U.S.TreasuryNotesfiveyearcontracts 9/16 (1,099) (19)
Long,1U.S.TreasuryNotestwoyearcontracts 9/16 219 2
Netpayments(receipts)ofvariation margintodate 7
Variationmarginreceivable(payable) onopenfuturescontracts $ (1)
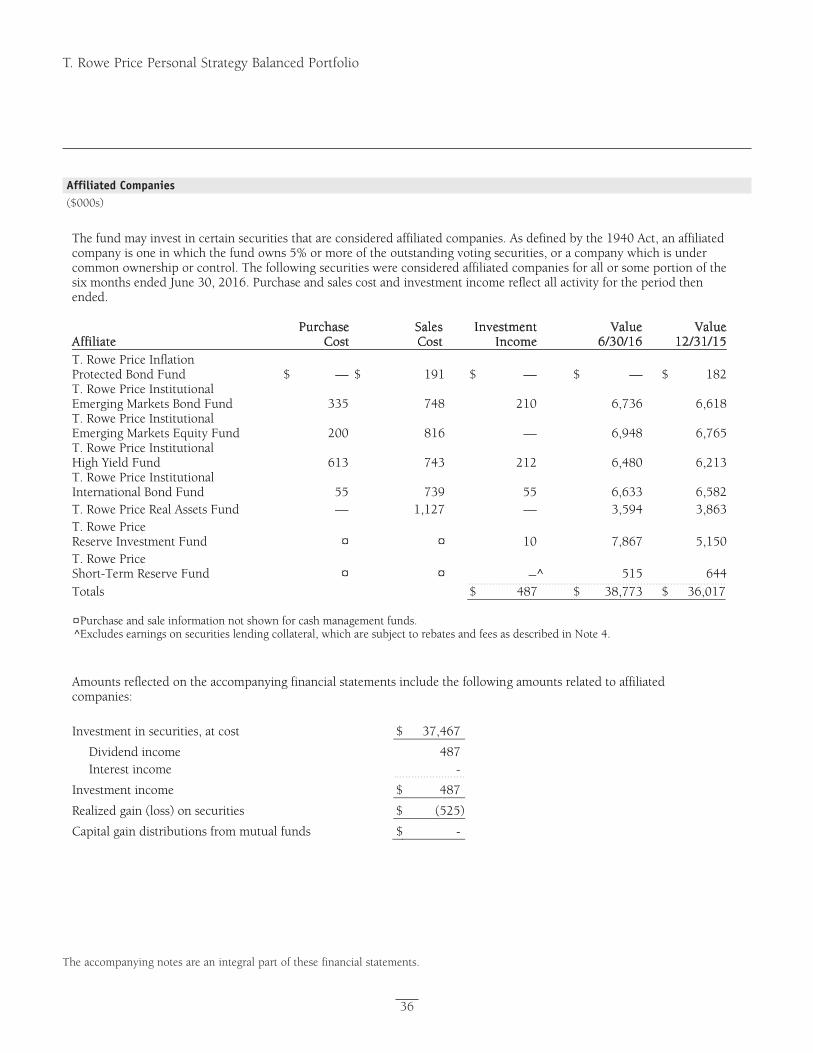
Proof #4
T. Rowe Price Personal Strategy Balanced Portfolio
36
The accompanying notes are an integral part of these financial statements.
The fund may invest in certain securities that are considered affiliated companies. As defined by the 1940 Act, an affiliated company is one in which the fund owns 5% or more of the outstanding voting securities, or a company which is under common ownership or control. The following securities were considered affiliated companies for all or some portion of the six months ended June 30, 2016. Purchase and sales cost and investment income reflect all activity for the period then ended. Affiliate
PurchaseCost
SalesCost
InvestmentIncome
Value6/30/16
Value12/31/15
T. Rowe Price Inflation Protected Bond Fund $ — $ 191 $ — $ — $ 182T. Rowe Price Institutional Emerging Markets Bond Fund 335 748 210 6,736 6,618T. Rowe Price Institutional Emerging Markets Equity Fund 200 816 — 6,948 6,765T. Rowe Price Institutional High Yield Fund 613 743 212 6,480 6,213T. Rowe Price Institutional International Bond Fund 55 739 55 6,633 6,582T. Rowe Price Real Assets Fund — 1,127 — 3,594 3,863T. Rowe Price Reserve Investment Fund ¤ ¤ 10 7,867 5,150T. Rowe Price Short-Term Reserve Fund ¤ ¤ —^ 515 644Totals $ 487 $ 38,773 $ 36,017
¤ Purchase and sale information not shown for cash management funds.^Excludes earnings on securities lending collateral, which are subject to rebates and fees as described in Note 4.
Amounts reflected on the accompanying financial statements include the following amounts related to affiliated companies: Investment in securities, at cost $ 37,467
Dividend income 487 Interest income -
Investment income $ 487
Realized gain (loss) on securities $ (525)
Capital gain distributions from mutual funds $ -
Affiliated Companies($000s)
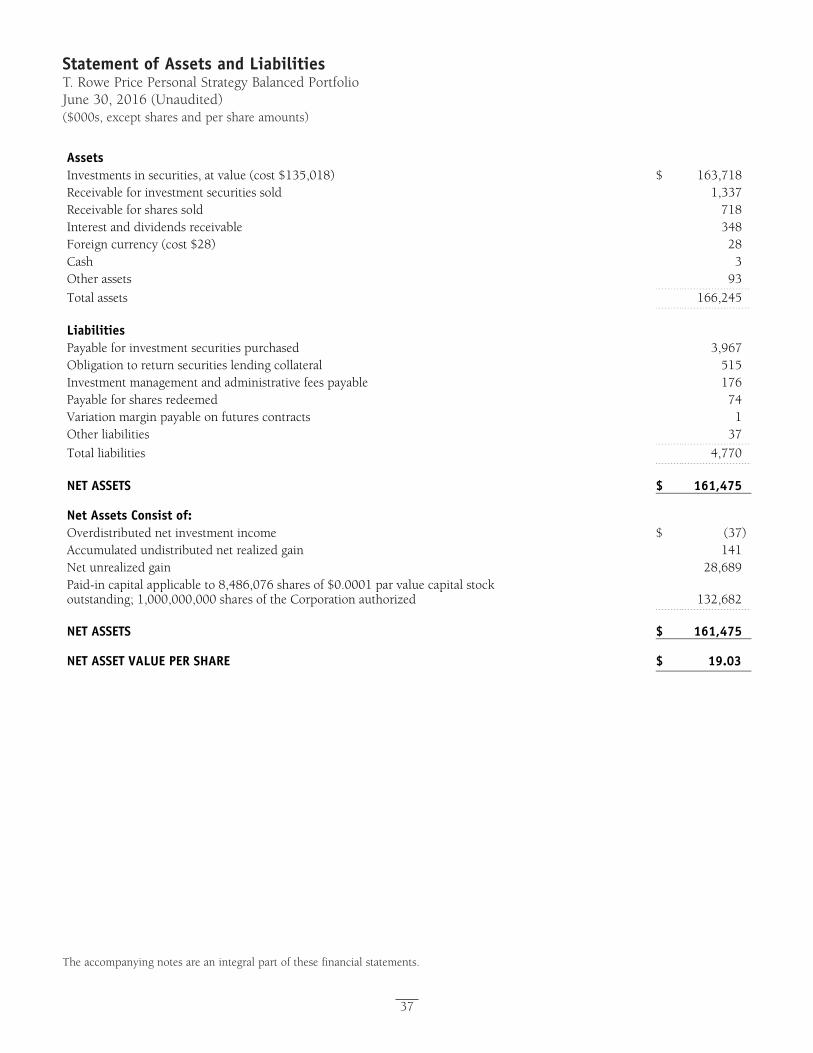
Proof #4
37
Statement of Assets and LiabilitiesT. Rowe Price Personal Strategy Balanced PortfolioJune 30, 2016 (Unaudited)($000s, except shares and per share amounts)
The accompanying notes are an integral part of these financial statements.
Assets Investments in securities, at value (cost $135,018) $ 163,718 Receivable for investment securities sold 1,337 Receivable for shares sold 718 Interest and dividends receivable 348 Foreign currency (cost $28) 28 Cash 3 Other assets 93
Total assets 166,245 Liabilities Payable for investment securities purchased 3,967 Obligation to return securities lending collateral 515 Investment management and administrative fees payable 176 Payable for shares redeemed 74 Variation margin payable on futures contracts 1 Other liabilities 37
Total liabilities 4,770 NET ASSETS $ 161,475 Net Assets Consist of: Overdistributed net investment income $ (37) Accumulated undistributed net realized gain 141 Net unrealized gain 28,689 Paid-in capital applicable to 8,486,076 shares of $0.0001 par value capital stock outstanding; 1,000,000,000 shares of the Corporation authorized 132,682 NET ASSETS $ 161,475 NET ASSET VALUE PER SHARE $ 19.03
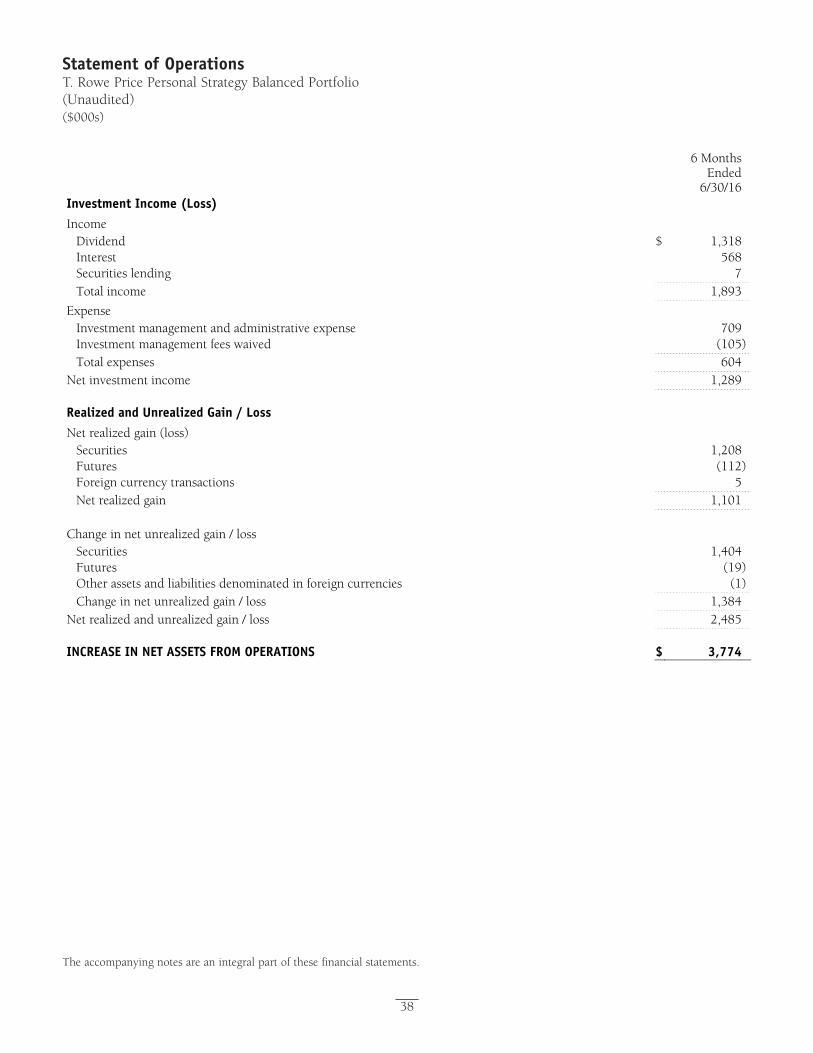
Proof #4
38
Statement of OperationsT. Rowe Price Personal Strategy Balanced Portfolio(Unaudited) ($000s)
The accompanying notes are an integral part of these financial statements.
6 Months Ended
6/30/16Investment Income (Loss) Income
Dividend $ 1,318Interest 568Securities lending 7Total income 1,893
Expense Investment management and administrative expense 709Investment management fees waived (105)Total expenses 604
Net investment income 1,289 Realized and Unrealized Gain / Loss Net realized gain (loss)
Securities 1,208Futures (112)Foreign currency transactions 5Net realized gain 1,101
Change in net unrealized gain / loss
Securities 1,404Futures (19)Other assets and liabilities denominated in foreign currencies (1)Change in net unrealized gain / loss 1,384
Net realized and unrealized gain / loss 2,485 INCREASE IN NET ASSETS FROM OPERATIONS $ 3,774
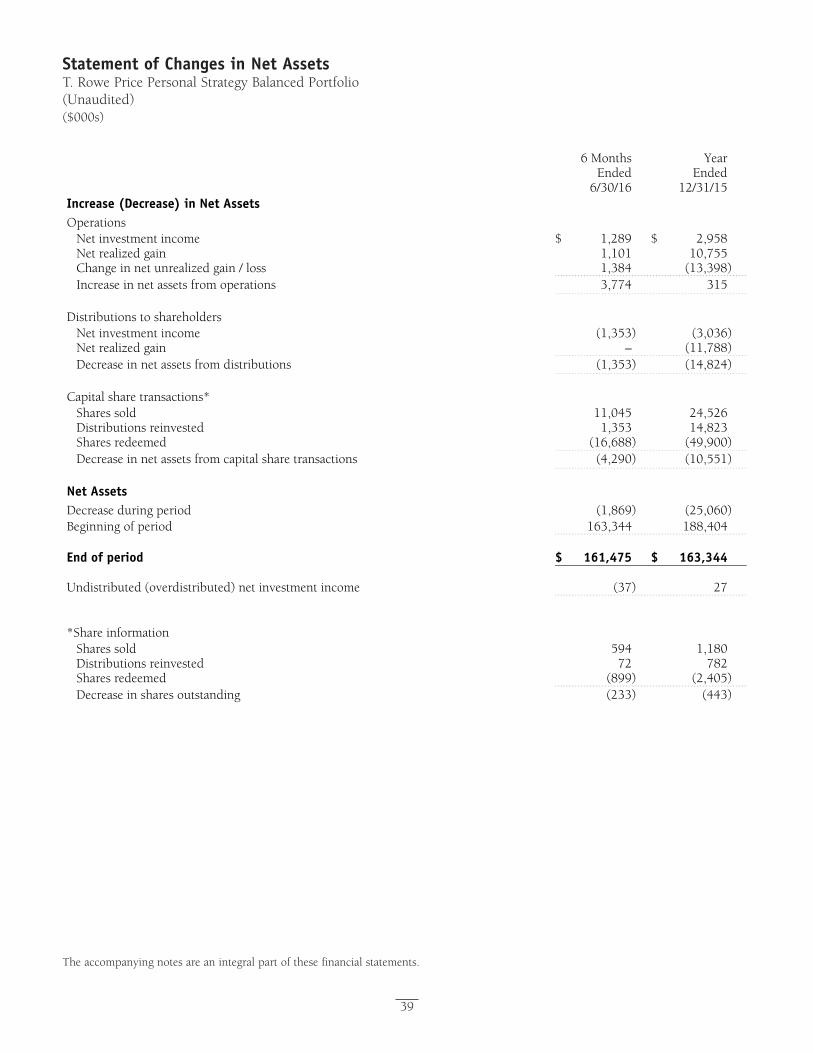
Proof #4
39
Statement of Changes in Net AssetsT. Rowe Price Personal Strategy Balanced Portfolio(Unaudited) ($000s)
The accompanying notes are an integral part of these financial statements.
6 Months Ended
6/30/16
Year Ended
12/31/15Increase (Decrease) in Net Assets Operations
Net investment income $ 1,289 $ 2,958Net realized gain 1,101 10,755Change in net unrealized gain / loss 1,384 (13,398)Increase in net assets from operations 3,774 315
Distributions to shareholders
Net investment income (1,353) (3,036)Net realized gain – (11,788)Decrease in net assets from distributions (1,353) (14,824)
Capital share transactions*
Shares sold 11,045 24,526Distributions reinvested 1,353 14,823Shares redeemed (16,688) (49,900)Decrease in net assets from capital share transactions (4,290) (10,551)
Net Assets Decrease during period (1,869) (25,060) Beginning of period 163,344 188,404 End of period $ 161,475 $ 163,344 Undistributed (overdistributed) net investment income (37) 27 *Share information
Shares sold 594 1,180Distributions reinvested 72 782Shares redeemed (899) (2,405)Decrease in shares outstanding (233) (443)
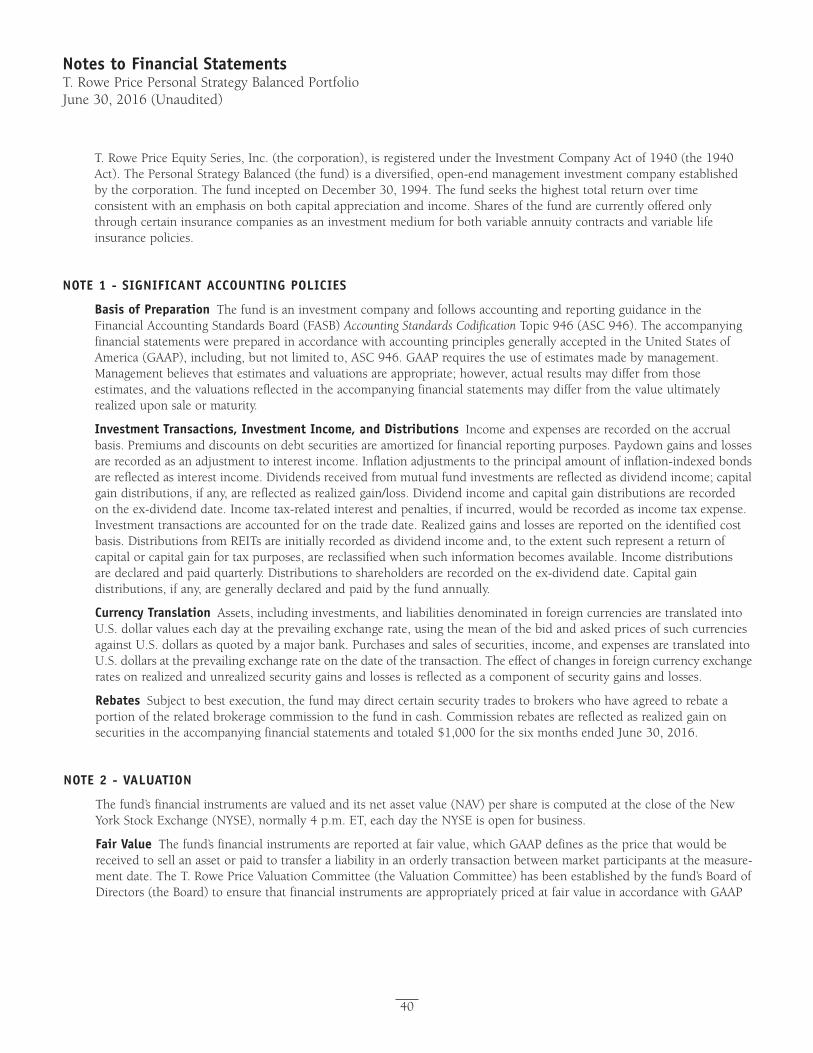
Proof #4
40
Notes to Financial StatementsT. Rowe Price Personal Strategy Balanced PortfolioJune 30, 2016 (Unaudited)
T.RowePriceEquitySeries,Inc.(thecorporation),isregisteredundertheInvestmentCompanyActof1940(the1940Act).ThePersonalStrategyBalanced(thefund)isadiversified,open-endmanagementinvestmentcompanyestablishedbythecorporation.ThefundinceptedonDecember30,1994.Thefundseeksthehighesttotalreturnovertimeconsistent with an emphasis on both capital appreciation and income. Shares of the fund are currently offered only throughcertaininsurancecompaniesasaninvestmentmediumforbothvariableannuitycontractsandvariablelifeinsurance policies.
NOTE 1 - SIGNIFICANT ACCOuNTING POlICIES
Basis of Preparation ThefundisaninvestmentcompanyandfollowsaccountingandreportingguidanceintheFinancialAccountingStandardsBoard(FASB)Accounting Standards CodificationTopic946(ASC946).TheaccompanyingfinancialstatementswerepreparedinaccordancewithaccountingprinciplesgenerallyacceptedintheUnitedStatesofAmerica(GAAP),including,butnotlimitedto,ASC946.GAAPrequirestheuseofestimatesmadebymanagement.Managementbelievesthatestimatesandvaluationsareappropriate;however,actualresultsmaydifferfromthoseestimates,andthevaluationsreflectedintheaccompanyingfinancialstatementsmaydifferfromthevalueultimatelyrealized upon sale or maturity.
Investment Transactions, Investment Income, and Distributions Incomeandexpensesarerecordedontheaccrualbasis.Premiumsanddiscountsondebtsecuritiesareamortizedforfinancialreportingpurposes.Paydowngainsandlossesarerecordedasanadjustmenttointerestincome.Inflationadjustmentstotheprincipalamountofinflation-indexedbondsare reflected as interest income. Dividends received from mutual fund investments are reflected as dividend income; capital gaindistributions,ifany,arereflectedasrealizedgain/loss.Dividendincomeandcapitalgaindistributionsarerecordedontheex-dividenddate.Incometax-relatedinterestandpenalties,ifincurred,wouldberecordedasincometaxexpense.Investmenttransactionsareaccountedforonthetradedate.Realizedgainsandlossesarereportedontheidentifiedcostbasis.DistributionsfromREITsareinitiallyrecordedasdividendincomeand,totheextentsuchrepresentareturnofcapitalorcapitalgainfortaxpurposes,arereclassifiedwhensuchinformationbecomesavailable.Incomedistributionsaredeclaredandpaidquarterly.Distributionstoshareholdersarerecordedontheex-dividenddate.Capitalgaindistributions,ifany,aregenerallydeclaredandpaidbythefundannually.
Currency Translation Assets,includinginvestments,andliabilitiesdenominatedinforeigncurrenciesaretranslatedintoU.S.dollarvalueseachdayattheprevailingexchangerate,usingthemeanofthebidandaskedpricesofsuchcurrenciesagainstU.S.dollarsasquotedbyamajorbank.Purchasesandsalesofsecurities,income,andexpensesaretranslatedintoU.S.dollarsattheprevailingexchangerateonthedateofthetransaction.Theeffectofchangesinforeigncurrencyexchangeratesonrealizedandunrealizedsecuritygainsandlossesisreflectedasacomponentofsecuritygainsandlosses.
Rebates Subjecttobestexecution,thefundmaydirectcertainsecuritytradestobrokerswhohaveagreedtorebateaportionoftherelatedbrokeragecommissiontothefundincash.Commissionrebatesarereflectedasrealizedgainonsecuritiesintheaccompanyingfinancialstatementsandtotaled$1,000forthesixmonthsendedJune30,2016.
NOTE 2 - VAluATION
Thefund’sfinancialinstrumentsarevaluedanditsnetassetvalue(NAV)pershareiscomputedatthecloseoftheNewYorkStockExchange(NYSE),normally4p.m.ET,eachdaytheNYSEisopenforbusiness.
Fair Value Thefund’sfinancialinstrumentsarereportedatfairvalue,whichGAAPdefinesasthepricethatwouldbereceivedtosellanassetorpaidtotransferaliabilityinanorderlytransactionbetweenmarketparticipantsatthemeasure-mentdate.TheT.RowePriceValuationCommittee(theValuationCommittee)hasbeenestablishedbythefund’sBoardofDirectors(theBoard)toensurethatfinancialinstrumentsareappropriatelypricedatfairvalueinaccordancewithGAAP
Proof #4
41
T. Rowe Price Personal Strategy Balanced Portfolio
andthe1940Act.SubjecttooversightbytheBoard,theValuationCommitteedevelopsandoverseespricing-relatedpoliciesandproceduresandapprovesallfairvaluedeterminations.Specifically,theValuationCommitteeestablishesprocedurestovaluesecurities;determinespricingtechniques,sources,andpersonseligibletoeffectfairvaluepricingactions;overseestheselection,services,andperformanceofpricingvendors;overseesvaluation-relatedbusinesscontinuitypractices;andprovidesguidanceoninternalcontrolsandvaluation-relatedmatters.TheValuationCommitteereportstotheBoardandhasrepresentationfromlegal,portfoliomanagementandtrading,operations,riskmanagement,andthefund’s treasurer.
Variousvaluationtechniquesandinputsareusedtodeterminethefairvalueoffinancialinstruments.GAAPestablishesthefollowingfairvaluehierarchythatcategorizestheinputsusedtomeasurefairvalue:
Level1–quotedprices(unadjusted)inactivemarketsforidenticalfinancialinstrumentsthatthefundcanaccessatthereportingdate
Level2–inputsotherthanLevel1quotedpricesthatareobservable,eitherdirectlyorindirectly(including,butnotlimitedto,quotedpricesforsimilarfinancialinstrumentsinactivemarkets,quotedpricesforidenticalorsimilarfinancialinstrumentsininactivemarkets,interestratesandyieldcurves,impliedvolatilities,andcreditspreads)
Level3–unobservableinputs
Observableinputsaredevelopedusingmarketdata,suchaspubliclyavailableinformationaboutactualeventsortransac-tions,andreflecttheassumptionsthatmarketparticipantswouldusetopricethefinancialinstrument.Unobservableinputsarethoseforwhichmarketdataarenotavailableandaredevelopedusingthebestinformationavailableabouttheassumptionsthatmarketparticipantswouldusetopricethefinancialinstrument.GAAPrequiresvaluationtechniquestomaximizetheuseofrelevantobservableinputsandminimizetheuseofunobservableinputs.Whenmultipleinputsareusedtoderivefairvalue,thefinancialinstrumentisassignedtothelevelwithinthefairvaluehierarchybasedonthelowest-levelinputthatissignificanttothefairvalueofthefinancialinstrument.Inputlevelsarenotnecessarilyanindicationoftheriskorliquidityassociatedwithfinancialinstrumentsatthatlevelbutratherthedegreeofjudgmentusedindeterminingthose values.
Valuation Techniques Equitysecuritieslistedorregularlytradedonasecuritiesexchangeorintheover-the-counter(OTC)marketarevaluedatthelastquotedsalepriceor,forcertainmarkets,theofficialclosingpriceatthetimethevaluationsaremade.OTCBulletinBoardsecuritiesarevaluedatthemeanoftheclosingbidandaskedprices.Asecuritythatislistedortradedonmorethanoneexchangeisvaluedatthequotationontheexchangedeterminedtobetheprimarymarketforsuchsecurity.Listedsecuritiesnottradedonaparticulardayarevaluedatthemeanoftheclosingbidandaskedpricesfordomesticsecuritiesandthelastquotedsaleorclosingpriceforinternationalsecurities.
Forvaluationpurposes,thelastquotedpricesofnon-U.S.equitysecuritiesmaybeadjustedtoreflectthefairvalueofsuchsecuritiesatthecloseoftheNYSE.IfthefunddeterminesthatdevelopmentsbetweenthecloseofaforeignmarketandthecloseoftheNYSEwill,initsjudgment,materiallyaffectthevalueofsomeorallofitsportfoliosecurities,thefundwilladjustthepreviousquotedpricestoreflectwhatitbelievestobethefairvalueofthesecuritiesasofthecloseoftheNYSE.Indecidingwhetheritisnecessarytoadjustquotedpricestoreflectfairvalue,thefundreviewsavarietyoffactors,includingdevelopmentsinforeignmarkets,theperformanceofU.S.securitiesmarkets,andtheperformanceofinstrumentstradinginU.S.marketsthatrepresentforeignsecuritiesandbasketsofforeignsecurities.Thefundmayalsofairvaluesecuritiesinothersituations,suchaswhenaparticularforeignmarketisclosedbutthefundisopen.Thefundusesoutsidepricingservicestoprovideitwithquotedpricesandinformationtoevaluateoradjustthoseprices.Thefundcannotpredicthowoftenitwillusequotedpricesandhowoftenitwilldetermineitnecessarytoadjustthosepricestoreflectfairvalue.Asameansofevaluatingitssecurityvaluationprocess,thefundroutinelycomparesquotedprices,thenextday’sopeningpricesinthesamemarkets,andadjustedprices.
Proof #4
42
T. Rowe Price Personal Strategy Balanced Portfolio
ActivelytradedequitysecuritieslistedonadomesticexchangegenerallyarecategorizedinLevel1ofthefairvaluehierarchy.Non-U.S.equitysecuritiesgenerallyarecategorizedinLevel2ofthefairvaluehierarchydespitetheavailabilityofquotedpricesbecause,asdescribedabove,thefundevaluatesanddetermineswhetherthosequotedpricesreflectfairvalueatthecloseoftheNYSEorrequireadjustment.OTCBulletinBoardsecurities,certainpreferredsecurities,andequitysecuritiestradedininactivemarketsgenerallyarecategorizedinLevel2ofthefairvaluehierarchy.
DebtsecuritiesgenerallyaretradedintheOTCmarket.Securitieswithremainingmaturitiesofoneyearormoreatthetimeofacquisitionarevaluedatpricesfurnishedbydealerswhomakemarketsinsuchsecuritiesorbyanindependentpricingservice,whichconsiderstheyieldorpriceofbondsofcomparablequality,coupon,maturity,andtype,aswellaspricesquotedbydealerswhomakemarketsinsuchsecurities.Generally,debtsecuritiesarecategorizedinLevel2ofthefair value hierarchy.
Investmentsinmutualfundsarevaluedatthemutualfund’sclosingNAVpershareonthedayofvaluationandarecategorizedinLevel1ofthefairvaluehierarchy.FinancialfuturescontractsarevaluedatclosingsettlementpricesandarecategorizedinLevel1ofthefairvaluehierarchy.SwapsarevaluedatpricesfurnishedbyindependentswapdealersorbyanindependentpricingserviceandgenerallyarecategorizedinLevel2ofthefairvaluehierarchy;however,ifunobservableinputsaresignificanttothevaluation,theswapwouldbecategorizedinLevel3.Assetsandliabilitiesotherthanfinancialinstruments,includingshort-termreceivablesandpayables,arecarriedatcost,orestimatedrealizablevalue,ifless,whichapproximatesfairvalue.
Thinly traded financial instruments and those for which the above valuation procedures are inappropriate or are deemed nottoreflectfairvaluearestatedatfairvalueasdeterminedingoodfaithbytheValuationCommittee.Theobjectiveofanyfairvaluepricingdeterminationistoarriveatapricethatcouldreasonablybeexpectedfromacurrentsale.FinancialinstrumentsfairvaluedbytheValuationCommitteeareprimarilyprivateplacements,restrictedsecurities,warrants,rights,andothersecuritiesthatarenotpubliclytraded.
SubjecttooversightbytheBoard,theValuationCommitteeregularlymakesgoodfaithjudgmentstoestablishandadjustthefairvaluationsofcertainsecuritiesaseventsoccurandcircumstanceswarrant.Forinstance,indeterminingthefairvalueofanequityinvestmentwithlimitedmarketactivity,suchasaprivateplacementorathinlytradedpubliccompanystock,theValuationCommitteeconsidersavarietyoffactors,whichmayinclude,butarenotlimitedto,theissuer’sbusinessprospects,itsfinancialstandingandperformance,recentinvestmenttransactionsintheissuer,newroundsoffinancing,negotiatedtransactionsofsignificantsizebetweenotherinvestorsinthecompany,relevantmarketvaluationsofpeercompanies,strategiceventsaffectingthecompany,marketliquidityfortheissuer,andgeneraleconomicconditionsandevents.Inconsultationwiththeinvestmentandpricingteams,theValuationCommitteewilldetermineanappropriatevaluationtechniquebasedonavailableinformation,whichmayincludebothobservableandunobservableinputs.TheValuationCommitteetypicallywillaffordgreatestweighttoactualpricesinarm’slengthtransactions,totheextenttheyrepresentorderlytransactionsbetweenmarketparticipants,transactioninformationcanbereliablyobtained,andpricesaredeemedrepresentativeoffairvalue.However,theValuationCommitteemayalsoconsiderothervaluationmethodssuchasmarket-basedvaluationmultiples;adiscountorpremiumfrommarketvalueofasimilar,freelytradedsecurityofthesameissuer;orsomecombination.Fairvaluedeterminationsarereviewedonaregularbasisandupdatedasinformationbecomesavailable,includingactualpurchaseandsaletransactionsoftheissue.Becauseanyfairvaluedeterminationinvolvesasignificantamountofjudgment,thereisadegreeofsubjectivityinherentinsuchpricingdecisions,andfairvaluepricesdeterminedbytheValuationCommitteecoulddifferfromthoseofothermarketparticipants.Dependingontherelativesignificanceofunobservableinputs,includingthevaluationtechnique(s)used,fairvaluedsecuritiesmaybecategorizedinLevel2or3ofthefairvaluehierarchy.
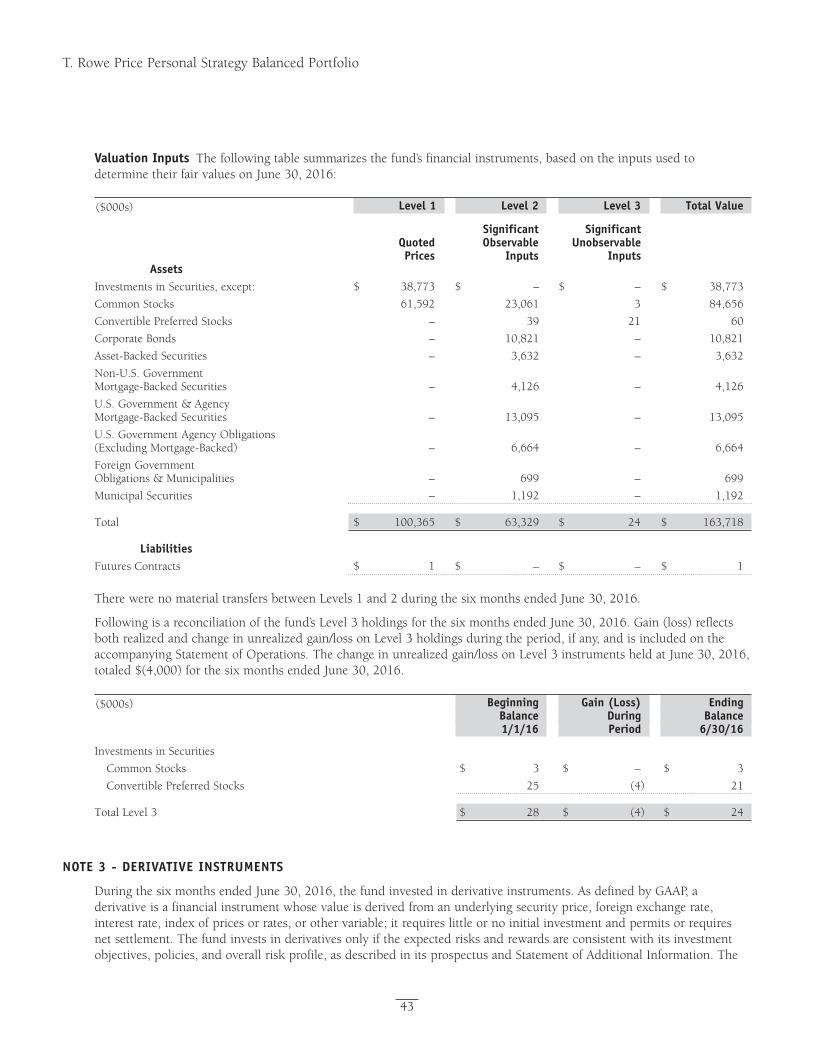
Proof #4
43
T. Rowe Price Personal Strategy Balanced Portfolio
Valuation Inputs Thefollowingtablesummarizesthefund’sfinancialinstruments,basedontheinputsusedtodeterminetheirfairvaluesonJune30,2016:
Significant Significant Quoted Observable unobservable Prices Inputs Inputs AssetsInvestmentsinSecurities,except: $ 38,773 $ – $ – $ 38,773
CommonStocks 61,592 23,061 3 84,656
ConvertiblePreferredStocks – 39 21 60
CorporateBonds – 10,821 – 10,821
Asset-BackedSecurities – 3,632 – 3,632
Non-U.S.Government Mortgage-BackedSecurities – 4,126 – 4,126
U.S.Government&Agency Mortgage-BackedSecurities – 13,095 – 13,095
U.S.GovernmentAgencyObligations (ExcludingMortgage-Backed) – 6,664 – 6,664
ForeignGovernment Obligations&Municipalities – 699 – 699
MunicipalSecurities – 1,192 – 1,192
Total $ 100,365 $ 63,329 $ 24 $ 163,718
liabilitiesFuturesContracts $ 1 $ – $ – $ 1
($000s) Total Valuelevel 3level 2level 1
TherewerenomaterialtransfersbetweenLevels1and2duringthesixmonthsendedJune30,2016.
Followingisareconciliationofthefund’sLevel3holdingsforthesixmonthsendedJune30,2016.Gain(loss)reflectsbothrealizedandchangeinunrealizedgain/lossonLevel3holdingsduringtheperiod,ifany,andisincludedontheaccompanyingStatementofOperations.Thechangeinunrealizedgain/lossonLevel3instrumentsheldatJune30,2016,totaled$(4,000)forthesixmonthsendedJune30,2016.
Investments in Securities
CommonStocks $ 3 $ – $ 3
ConvertiblePreferredStocks 25 (4) 21
TotalLevel3 $ 28 $ (4) $ 24
($000s) Ending Balance
6/30/16
Gain (loss)DuringPeriod
Beginning Balance1/1/16
NOTE 3 - DERIVATIVE INSTRuMENTS
DuringthesixmonthsendedJune30,2016,thefundinvestedinderivativeinstruments.AsdefinedbyGAAP,aderivativeisafinancialinstrumentwhosevalueisderivedfromanunderlyingsecurityprice,foreignexchangerate,interestrate,indexofpricesorrates,orothervariable;itrequireslittleornoinitialinvestmentandpermitsorrequiresnetsettlement.Thefundinvestsinderivativesonlyiftheexpectedrisksandrewardsareconsistentwithitsinvestmentobjectives,policies,andoverallriskprofile,asdescribedinitsprospectusandStatementofAdditionalInformation.The
Proof #4
44
T. Rowe Price Personal Strategy Balanced Portfolio
fundmayusederivativesforavarietyofpurposes,suchasseekingtohedgeagainstdeclinesinprincipalvalue,increaseyield,investinanassetwithgreaterefficiencyandatalowercostthanispossiblethroughdirectinvestment,ortoadjustcreditexposure.Therisksassociatedwiththeuseofderivativesaredifferentfrom,andpotentiallymuchgreaterthan,therisksassociatedwithinvestingdirectlyintheinstrumentsonwhichthederivativesarebased.Thefundatalltimesmaintainssufficientcashreserves,liquidassets,orotherSEC-permittedassettypestocoveritssettlementobligationsunder open derivative contracts.
Thefundvaluesitsderivativesatfairvalueandrecognizeschangesinfairvaluecurrentlyinitsresultsofoperations.Accordingly,thefunddoesnotfollowhedgeaccounting,evenforderivativesemployedaseconomichedges.Generally,thefundaccountsforitsderivativesonagrossbasis.Itdoesnotoffsetthefairvalueofderivativeliabilitiesagainstthefairvalueofderivativeassetsonitsfinancialstatements,nordoesitoffsetthefairvalueofderivativeinstrumentsagainsttherighttoreclaimorobligationtoreturncollateral.AsofJune30,2016,thefundheldinterestratefutureswithcumulativeunrealizedgainof$11,000andcumulativeunrealizedlossof$19,000;thevaluereflectedontheaccompanyingStatementofAssetsandLiabilitiesistherelatedunsettledvariationmargin.
Additionally,duringthesixmonthsendedJune30,2016,thefundrecognized$112,000ofrealizedlossonFuturesanda$(19,000)changeinunrealizedgain/lossonFuturesrelatedtoitsinvestmentsininterestratederivatives;suchamountsareincludedontheaccompanyingStatementofOperations.
Counterparty Risk and Collateral Thefundinvestsinderivativesinvariousmarkets,whichexposeittodifferinglevelsofcounterpartyrisk.Counterpartyriskonexchange-tradedandcentrallyclearedderivativecontracts,suchasfutures,exchange-tradedoptions,andcentrallyclearedswaps,isminimalbecausetheclearinghouseprovidesprotectionagainstcounterpartydefaults.Forfuturesandcentrallyclearedswaps,thefundisrequiredtodepositcollateralinanamountequaltoacertainpercentageofthecontractvalue(marginrequirement),andthemarginrequirementmustbemaintainedoverthelifeofthecontract.Eachclearingbroker,initssolediscretion,mayadjustthemarginrequirementsapplicabletothe fund.
Derivatives,suchasbilateralswaps,forwardcurrencyexchangecontracts,andOTCoptions,thataretransactedandsettledirectlywithacounterparty(bilateralderivatives)exposethefundtogreatercounterpartyrisk.Tomitigatethisrisk,thefundhasenteredintomasternettingarrangements(MNAs)withcertaincounterpartiesthatpermitnetsettlementunderspecifiedconditionsand,forcertaincounterparties,alsoprovidecollateralagreements.MNAsmaybeintheformofInternationalSwapsandDerivativesAssociationmasteragreements(ISDAs)orforeignexchangeletteragreements(FXletters).
MNAsgoverntheabilitytooffsetamountsthefundowesacounterpartyagainstamountsthecounterpartyowesthefund(netsettlement).BothISDAsandFXlettersgenerallyallownetsettlementintheeventofcontractterminationandpermittermination by either party prior to maturity upon the occurrence of certain stated events, such as failure to pay or bankruptcy.Inaddition,ISDAsspecifyotherevents,theoccurrenceofwhichwouldallowoneofthepartiestoterminate.Forexample,adowngradeincreditratingofacounterpartywouldallowthefundtoterminatewhileadeclineinthefund’snetassetsofmorethanacertainpercentagewouldallowthecounterpartytoterminate.Upontermination,allbilateralderivativeswiththatcounterpartywouldbeliquidatedandanetamountsettled.ISDAstypicallyincludecollateralagreementswhereasFXlettersdonot.Collateralrequirementsaredeterminedbasedonthenetaggregateunrealizedgainorlossonallbilateralderivativeswitheachcounterparty,subjecttominimumtransferamountsthattypicallyrangefrom$100,000to$250,000.Anyadditionalcollateralrequiredduetochangesinsecurityvaluesistransferredthenextbusinessday.
CollateralmaybeintheformofcashordebtsecuritiesissuedbytheU.S.governmentorrelatedagencies.Cashandcurrenciespostedbythefundarereflectedascashdepositsintheaccompanyingfinancialstatementsandgenerallyarerestrictedfromwithdrawalbythefund;securitiespostedbythefundaresonotedintheaccompanyingPortfolioofInvestments;bothremaininthefund’sassets.Collateralpledgedbycounterpartiesisnotincludedinthefund’sassetsbecause the fund does not obtain effective control over those assets. For bilateral derivatives, collateral posted or received bythefundisheldinasegregatedaccountbythefund’scustodian.AsofJune30,2016,nocollateralwaspledgedbyeitherthefundorcounterpartiesforbilateralderivatives.AsofJune30,2016,securitiesvaluedat$16,000hadbeenpostedbythefundforexchange-tradedand/orcentrallyclearedderivatives.
Proof #4
45
T. Rowe Price Personal Strategy Balanced Portfolio
Futures Contracts Thefundissubjecttointerestrateriskinthenormalcourseofpursuingitsinvestmentobjectivesandusesfuturescontractstohelpmanagesuchrisk.Thefundmayenterintofuturescontractstomanageexposuretointerestrates,securityprices,foreigncurrencies,andcreditquality;asanefficientmeansofadjustingexposuretoallorpartofatargetmarket;toenhanceincome;asacashmanagementtool;ortoadjustcreditexposure.Afuturescontractprovidesforthefuturesalebyonepartyandpurchasebyanotherofaspecifiedamountofaspecificunderlyingfinancialinstrumentatanagreed-uponprice,date,time,andplace.Thefundcurrentlyinvestsonlyinexchange-tradedfutures,whichgenerallyarestandardizedastomaturitydate,underlyingfinancialinstrument,andothercontractterms.Paymentsaremadeorreceivedbythefundeachdaytosettledailyfluctuationsinthevalueofthecontract(variationmargin),whichreflectchangesinthevalueoftheunderlyingfinancialinstrument.Variationmarginisrecordedasunrealizedgainorlossuntilthecontractisclosed.Thevalueofafuturescontractincludedinnetassetsistheamountofunsettledvariationmargin;netvariationmarginreceivableisreflectedasanasset,andnetvariationmarginpayableisreflectedasaliabilityontheaccompanyingStatementofAssetsandLiabilities.Risksrelatedtotheuseoffuturescontractsincludepossibleilliquidityofthefuturesmarkets,contractpricesthatcanbehighlyvolatileandimperfectlycorrelatedtomovementsinhedgedsecurityvaluesand/orinterestrates,andpotentiallossesinexcessofthefund’sinitialinvestment.DuringthesixmonthsendedJune30,2016,thevolumeofthefund’sactivityinfutures,basedonunderlyingnotionalamounts,wasgenerallybetween0%and3%ofnetassets.
Swaps Thefundissubjecttocreditriskinthenormalcourseofpursuingitsinvestmentobjectivesandusesswapcontractstohelpmanagesuchrisk.Thefundmayuseswapsinanefforttomanageexposuretochangesininterestrates,inflationrates,andcreditquality;toadjustoverallexposuretocertainmarkets;toenhancetotalreturnorprotectthevalueofportfoliosecurities;toserveasacashmanagementtool;ortoadjustcreditexposure.Swapagreementscanbesettledeitherdirectlywiththecounterparty(bilateralswap)orthroughacentralclearinghouse(centrallyclearedswap).Fluctuationsinthefairvalueofacontractarereflectedinunrealizedgainorlossandarereclassifiedtorealizedgainorlossuponcontractterminationorcashsettlement.Netperiodicreceiptsorpaymentsrequiredbyacontractincreaseordecrease, respectively, the value of the contract until the contractual payment date, at which time such amounts are reclassifiedfromunrealizedtorealizedgainorloss.Forbilateralswaps,cashpaymentsaremadeorreceivedbythefundonaperiodicbasisinaccordancewithcontractterms;unrealizedgainoncontractsandpremiumspaidarereflectedasassetsandunrealizedlossoncontractsandpremiumsreceivedarereflectedasliabilitiesontheaccompanyingStatementofAssetsandLiabilities.Forcentrallyclearedswaps,paymentsaremadeorreceivedbythefundeachdaytosettlethedailyfluctuationinthevalueofthecontract(variationmargin).Accordingly,thevalueofacentrallyclearedswapincludedinnetassetsistheunsettledvariationmargin;netvariationmarginreceivableisreflectedasanassetandnetvariationmarginpayableisreflectedasaliabilityontheaccompanyingStatementofAssetsandLiabilities.
Creditdefaultswapsareagreementswhereoneparty(theprotectionbuyer)agreestomakeperiodicpaymentstoanotherparty(theprotectionseller)inexchangeforprotectionagainstspecifiedcreditevents,suchascertaindefaultsandbankruptciesrelatedtoanunderlyingcreditinstrument,orissuerorindexofsuchinstruments.Uponoccurrenceofaspecifiedcreditevent,theprotectionsellerisrequiredtopaythebuyerthedifferencebetweenthenotionalamountoftheswapandthevalueoftheunderlyingcredit,eitherintheformofanetcashsettlementorbypayingthegrossnotionalamountandacceptingdeliveryoftherelevantunderlyingcredit.Forcreditdefaultswapswheretheunderlyingcreditisanindex,aspecifiedcrediteventmayaffectallorindividualunderlyingsecuritiesincludedintheindexandwillbesettledbasedupontherelativeweightingoftheaffectedunderlyingsecurity(ies)withintheindex.Generally,thepaymentriskforthesellerofprotectionisinverselyrelatedtothecurrentmarketpriceorcreditratingoftheunderlyingcreditorthemarketvalueofthecontractrelativetothenotionalamount,whichareindicatorsofthemarkets’valuationofcreditquality.AsofJune30,2016,thenotionalamountofprotectionsoldbythefundtotaled$120,000(0.1%ofnetassets),whichreflectsthemaximumpotentialamountthefundcouldberequiredtopayundersuchcontracts.Risksrelatedtothe use of credit default swaps include the possible inability of the fund to accurately assess the current and future creditworthinessofunderlyingissuers,thepossiblefailureofacounterpartytoperforminaccordancewiththetermsoftheswapagreements,potentialgovernmentregulationthatcouldadverselyaffectthefund’sswapinvestments,andpotentiallossesinexcessofthefund’sinitialinvestment.
DuringthesixmonthsendedJune30,2016,thevolumeofthefund’sactivityinswaps,basedonunderlyingnotionalamounts,wasgenerallylessthan1%ofnetassets.
Proof #4
46
T. Rowe Price Personal Strategy Balanced Portfolio
NOTE 4 - OTHER INVESTMENT TRANSACTIONS
Consistentwithitsinvestmentobjective,thefundengagesinthefollowingpracticestomanageexposuretocertainrisksand/ortoenhanceperformance.Theinvestmentobjective,policies,program,andriskfactorsofthefundaredescribedmorefullyinthefund’sprospectusandStatementofAdditionalInformation.
Emerging and Frontier Markets Thefundmayinvest,eitherdirectlyorthroughinvestmentsinT.RowePriceinstitutionalfunds,insecuritiesofcompanieslocatedin,issuedbygovernmentsof,ordenominatedinorlinkedtothecurrenciesofemergingandfrontiermarketcountries;atperiod-end,approximately10%ofthefund’snetassetswereinvestedinemergingmarketsand2%infrontiermarkets.Emergingmarkets,andtoagreaterextentfrontiermarkets,generallyhaveeconomicstructuresthatarelessdiverseandmature,andpoliticalsystemsthatarelessstable,thandevelopedcountries.Thesemarketsmaybesubjecttogreaterpolitical,economic,andsocialuncertaintyanddifferingregulatoryenvironmentsthatmaypotentiallyimpactthefund’sabilitytobuyorsellcertainsecuritiesorrepatriateproceedstoU.S.dollars.Suchsecuritiesareoftensubjecttogreaterpricevolatility,lessliquidity,andhigherratesofinflationthanU.S.securities.Investinginfrontiermarketsissignificantlyriskierthaninvestinginothercountries,includingemergingmarkets.
Restricted Securities Thefundmayinvestinsecuritiesthataresubjecttolegalorcontractualrestrictionsonresale.Prompt sale of such securities at an acceptable price may be difficult and may involve substantial delays and additional costs.
TBA Purchase and Sale Commitments Thefundmayenterintoto-be-announced(TBA)purchaseorsalecommitments,pursuanttowhichitagreestopurchaseorsell,respectively,mortgage-backedsecuritiesforafixedunitprice,withpaymentanddeliveryatascheduledfuturedatebeyondthecustomarysettlementperiodforsuchsecurities.WithTBAtransactions,the particular securities to be delivered are not identified at the trade date; however, delivered securities must meet specified terms,includingissuer,rate,andmortgageterm,andbewithinindustry-accepted“gooddelivery”standards.ThefundmayenterintoTBApurchasetransactionswiththeintentionoftakingpossessionoftheunderlyingsecurities,mayelecttoextendthesettlementby“rolling”thetransaction,and/ormayuseTBAstogaininterimexposuretounderlyingsecurities.Untilsettlement,thefundmaintainsliquidassetssufficienttosettleitsTBAcommitments.
Tomitigatecounterpartyrisk,thefundhasenteredintoagreementswithTBAcounterpartiesthatprovideforcollateralandtherighttooffsetamountsduetoorfromthosecounterpartiesunderspecifiedconditions.Subjecttominimumtransferamounts,collateralrequirementsaredeterminedandtransfersmadebasedonthenetaggregateunrealizedgainorlossonallTBAcommitmentswithaparticularcounterparty.Atanytime,thefund’sriskoflossfromaparticularcounterpartyrelatedtoitsTBAcommitmentsistheaggregateunrealizedgainonappreciatedTBAsinexcessofunrealizedlossondepreciatedTBAsandcollateralreceived,ifany,fromsuchcounterparty.AsofJune30,2016,nocollateralwaspledgedbythefundorcounterpartiesforTBAs.
Securities lending Thefundmaylenditssecuritiestoapprovedbrokerstoearnadditionalincome.Itssecuritieslendingactivitiesareadministeredbyalendingagentinaccordancewithasecuritieslendingagreement.Securityloansgenerallydo not have stated maturity dates, and the fund may recall a security at any time. The fund receives collateral in the form of cashorU.S.governmentsecurities,valuedat102%to105%ofthevalueofthesecuritiesonloan.Collateralismaintainedoverthelifeoftheloaninanamountnotlessthanthevalueofloanedsecurities;anyadditionalcollateralrequiredduetochangesinsecurityvaluesisdeliveredtothefundthenextbusinessday.Cashcollateralisinvestedbythelendingagent(s)inaccordancewithinvestmentguidelinesapprovedbyfundmanagement.Additionally,thelendingagentindemnifiesthefundagainstlossesresultingfromborrowerdefault.Althoughriskismitigatedbythecollateralandindemnification,thefundcouldexperienceadelayinrecoveringitssecuritiesandapossiblelossofincomeorvalueiftheborrowerfailstoreturnthesecurities,collateralinvestmentsdeclineinvalue,andthelendingagentfailstoperform.Securitieslendingrevenueconsistsofearningsoninvestedcollateralandborrowingfees,netofanyrebatestotheborrower,compensationtothelendingagent,andotheradministrativecosts.InaccordancewithGAAP,investmentsmadewithcashcollateralarereflectedintheaccompanyingfinancialstatements,butcollateralreceivedintheformofsecuritiesisnot.AtJune30,2016,thevalueofloanedsecuritieswas$498,000;thevalueofcashcollateralandrelatedinvestmentswas$515,000.
Proof #4
47
T. Rowe Price Personal Strategy Balanced Portfolio
Mortgage-Backed Securities Thefundmayinvestinmortgage-backedsecurities(MBSorpass-throughcertificates)thatrepresentaninterestinapoolofspecificunderlyingmortgageloansandentitlethefundtotheperiodicpaymentsofprincipalandinterestfromthosemortgages.MBSmaybeissuedbygovernmentagenciesorcorporations,orprivateissuers.MostMBSissuedbygovernmentagenciesareguaranteed;however,thedegreeofprotectiondiffersbasedontheissuer.ThefundalsomayinvestinstrippedMBS,createdwhenatraditionalMBSissplitintoaninterest-only(IO)andaprincipal-only(PO)strip.MBS,includingIOsandPOs,aresensitivetochangesineconomicconditionsthataffecttherateofprepaymentsanddefaultsontheunderlyingmortgages;accordingly,thevalue,income,andrelatedcashflowsfromMBSmaybemorevolatilethanotherdebtinstruments.IOsalsorisklossofinvestedprincipalfromfaster-than-anticipated prepayments.
Other Purchasesandsalesofportfoliosecuritiesotherthanshort-termandU.S.governmentsecuritiesaggregated$33,777,000and$40,799,000,respectively,forthesixmonthsendedJune30,2016.PurchasesandsalesofU.S.governmentsecuritiesaggregated$32,396,000and$31,549,000,respectively,forthesixmonthsendedJune30,2016.
NOTE 5 - FEDERAl INCOME TAxES
NoprovisionforfederalincometaxesisrequiredsincethefundintendstocontinuetoqualifyasaregulatedinvestmentcompanyunderSubchapterMoftheInternalRevenueCodeanddistributetoshareholdersallofitstaxableincomeandgains.Distributionsdeterminedinaccordancewithfederalincometaxregulationsmaydifferinamountorcharacterfromnetinvestmentincomeandrealizedgainsforfinancialreportingpurposes.Financialreportingrecordsareadjustedforpermanentbook/taxdifferencestoreflecttaxcharacterbutarenotadjustedfortemporarydifferences.Theamountandcharacteroftax-basisdistributionsandcompositionofnetassetsarefinalizedatfiscalyear-end;accordingly,tax-basisbalances have not been determined as of the date of this report.
Thefundintendstoretainrealizedgainstotheextentofavailablecapitallosscarryforwards.Netrealizedcapitallossesmaybecarriedforwardindefinitelytooffsetfuturerealizedcapitalgains.AsofDecember31,2015,thefundhad$61,000of available capital loss carryforwards.
AtJune30,2016,thecostofinvestmentsforfederalincometaxpurposeswas$137,092,000.Netunrealizedgainaggregated$26,614,000atperiod-end,ofwhich$31,598,000relatedtoappreciatedinvestmentsand$4,984,000relatedto depreciated investments.
NOTE 6 - RElATED PARTy TRANSACTIONS
ThefundismanagedbyT.RowePriceAssociates,Inc.(PriceAssociates),awhollyownedsubsidiaryofT.RowePriceGroup,Inc.(PriceGroup).TheinvestmentmanagementandadministrativeagreementbetweenthefundandPriceAssociatesprovidesforanall-inclusiveannualfeeequalto0.90%ofthefund’saveragedailynetassets.Thefeeiscomputeddailyandpaidmonthly.Theall-inclusivefeecoversinvestmentmanagement,shareholderservicing,transferagency,accounting,andcustodyservicesprovidedtothefund,aswellasfunddirectors’feesandexpenses.Interest,taxes,brokeragecommissions,andextraordinaryexpensesarepaiddirectlybythefund.
The fund may invest in the T. Rowe Price Reserve Investment Fund, the T. Rowe Price Government Reserve Investment Fund,ortheT.RowePriceShort-TermReserveFund(collectively,thePriceReserveInvestmentFunds),open-endmanagementinvestmentcompaniesmanagedbyPriceAssociatesandconsideredaffiliatesofthefund.ThePriceReserveInvestmentFundsareofferedasshort-terminvestmentoptionstomutualfunds,trusts,andotheraccountsmanagedbyPriceAssociatesoritsaffiliatesandarenotavailablefordirectpurchasebymembersofthepublic.ThePriceReserveInvestmentFundspaynoinvestmentmanagementfees.
Proof #4
48
T. Rowe Price Personal Strategy Balanced Portfolio
ThefundmayalsoinvestincertainotherT.RowePricefunds(PriceFunds)asameansofgainingefficientandcost-effectiveexposuretocertainmarkets.Thefunddoesnotinvestforthepurposeofexercisingmanagementorcontrol;however,investmentsbythefundmayrepresentasignificantportionofanunderlyingPriceFund’snetassets.EachunderlyingPriceFundisanopen-endmanagementinvestmentcompanymanagedbyPriceAssociatesandisconsideredanaffiliateofthefund.Toensurethatthefunddoesnotincurduplicatemanagementfees(paidbytheunderlyingPriceFund(s)andthefund),PriceAssociateshasagreedtopermanentlywaiveaportionofitsmanagementfeechargedtothefundinanamountsufficienttofullyoffsetthatportionofmanagementfeespaidbyeachunderlyingPriceFundrelatedtothefund’sinvestmenttherein.AnnualmanagementfeeratesandamountswaivedrelatedtoinvestmentsintheunderlyingPriceFund(s)forthesixmonthsendedJune30,2016,areasfollows:
($000s) Management Fee Waived
T.RowePriceInstitutionalEmergingMarketsBondFund 0.70% $ 23
T.RowePriceInstitutionalEmergingMarketsEquityFund 1.10% 37
T.RowePriceInstitutionalHighYieldFund 0.50% 16
T.RowePriceInstitutionalInternationalBondFund 0.55% 17
T.RowePriceRealAssetsFund 0.64% 12
Total $ 105
Effective ManagementFee Rate
The fund may participate in securities purchase and sale transactions with other funds or accounts advised by Price Associates(crosstrades),inaccordancewithproceduresadoptedbythefund’sBoardandSecuritiesandExchangeCommissionrules,whichrequire,amongotherthings,thatsuchpurchaseandsalecrosstradesbeeffectedattheindependentcurrentmarketpriceofthesecurity.DuringthesixmonthsendedJune30,2016,theaggregatevalueofpurchasesandsalescrosstradeswithotherfundsoraccountsadvisedbyPriceAssociateswaslessthan1%ofthefund’snetassetsasofJune30,2016.

Proof #4
49
T.RowePricePersonalStrategyBalancedPortfolio
Information on Proxy Voting Policies, Procedures, and Records
AdescriptionofthepoliciesandproceduresusedbyT.RowePricefundsandportfoliostodeterminehowtovoteproxiesrelatingtoportfoliosecuritiesisavailableineachfund’sStatementofAdditionalInformation.Youmayrequestthisdocumentbycalling1-800-225-5132orbyaccessingtheSEC’swebsite,sec.gov.
Thedescriptionofourproxyvotingpoliciesandproceduresisalsoavailableonourcorporatewebsite.Toaccessit,pleasevisitthefollowingWebpage
https://www3.troweprice.com/usis/corporate/en/utility/policies.html
andscrolldowntothesectionnearthebottomofthepagethatsays,“ProxyVotingPolicies.”ClickontheProxyVotingPolicieslinkintheshadedbox.
Eachfund’smostrecentannualproxyvotingrecordisavailableonourwebsiteandthroughtheSEC’swebsite.ToaccessitthroughT.RowePrice,visitthewebsitelocationshownabove,andscrolldowntothesectionnearthebottomofthepagethatsays,“ProxyVotingRecords.”ClickontheProxyVotingRecordslinkintheshadedbox.
How to Obtain Quarterly Portfolio Holdings
ThefundfilesacompletescheduleofportfolioholdingswiththeSecuritiesandExchangeCommissionforthefirstandthirdquartersofeachfiscalyearonFormN-Q.Thefund’sFormN-QisavailableelectronicallyontheSEC’swebsite(sec.gov);hardcopiesmaybereviewedandcopiedattheSEC’sPublicReferenceRoom,100FSt.N.E.,Washington,DC20549.FormoreinformationonthePublicReferenceRoom,call1-800-SEC-0330.
Proof #4
50
Approval of Investment Management Agreement
OnMarch11,2016,thefund’sBoardofDirectors(Board),includingamajorityofthefund’sindependentdirectors,approvedthecontinuationoftheinvestmentmanagementagreement(AdvisoryContract)betweenthefundanditsinvestmentadvisor,T.RowePriceAssociates,Inc.(Advisor).Inconnectionwithitsdeliberations,theBoardrequested,andtheAdvisorprovided,suchinformationastheBoard(withadvicefromindependentlegalcounsel)deemedreasonablynecessary.TheBoardconsideredavarietyoffactorsinconnectionwithitsreviewoftheAdvisoryContract,alsotakingintoaccountinformationprovidedbytheAdvisorduringthecourseoftheyear,asdiscussedbelow:
Services Provided by the AdvisorTheBoardconsideredthenature,quality,andextentoftheservicesprovidedtothefundbytheAdvisor.Theseservicesincluded,butwerenotlimitedto,directingthefund’sinvestmentsinaccordancewithitsinvestmentprogramandtheoverallmanagementofthefund’sportfolio,aswellasavarietyofrelatedactivitiessuchasfinancial,investmentoperations,andadministrativeservices;compliance;maintainingthefund’srecordsandregistrations;andshareholdercommunica-tions.TheBoardalsoreviewedthebackgroundandexperienceoftheAdvisor’sseniormanagementteamandinvestmentpersonnelinvolvedinthemanagementofthefund,aswellastheAdvisor’scompliancerecord.TheBoardconcludedthatitwassatisfiedwiththenature,quality,andextentoftheservicesprovidedbytheAdvisor.
Investment Performance of the FundTheBoardreviewedthefund’sthree-month,one-year,andyear-by-yearreturns,aswellasthefund’saverageannualizedtotalreturnsoverthe3-,5-,and10-yearperiods,andcomparedthesereturnswithawidevarietyofcomparableperfor-mancemeasuresandmarketdata,includingthosesuppliedbyLipperandMorningstar,whichareindependentprovidersof mutual fund data.
OnthebasisofthisevaluationandtheBoard’songoingreviewofinvestmentresults,andfactoringintherelativemarketconditionsduringcertainoftheperformanceperiods,theBoardconcludedthatthefund’sperformancewassatisfactory.
Costs, Benefits, Profits, and Economies of ScaleTheBoardrevieweddetailedinformationregardingtherevenuesreceivedbytheAdvisorundertheAdvisoryContractandotherbenefitsthattheAdvisor(anditsaffiliates)mayhaverealizedfromitsrelationshipwiththefund,includinganyresearchreceivedunder“softdollar”agreementsandcommission-sharingarrangementswithbroker-dealers.TheBoardconsideredthattheAdvisormayreceivesomebenefitfromsoft-dollararrangementspursuanttowhichresearchisreceivedfrombroker-dealersthatexecutetheapplicablefund’sportfoliotransactions.TheBoardreceivedinformationontheestimatedcostsincurredandprofitsrealizedbytheAdvisorfrommanagingT.RowePricemutualfunds.TheBoardalsoreviewedestimatesoftheprofitsrealizedfrommanagingthefundinparticular,andtheBoardconcludedthattheAdvisor’sprofitswerereasonableinlightoftheservicesprovidedtothefund.
TheBoardalsoconsideredwhetherthefundbenefitsunderthefeelevelssetforthintheAdvisoryContractfromanyeconomiesofscalerealizedbytheAdvisor.TheBoardnotedthat,undertheAdvisoryContract,thefundpaystheAdvisorasinglefee,orall-inclusivemanagementfee,whichisbasedonthefund’saveragedailynetassets.Theall-inclusivemanagementfeeincludesinvestmentmanagementservicesandprovidesfortheAdvisortopayallofthefund’sordinary,recurringoperatingexpensesexceptforinterest,taxes,portfoliotransactionfees,andanynonrecurringextraordinaryexpensesthatmayarise.TheBoardconcludedthat,basedontheprofitabilitydataitreviewedandconsistentwiththisall-inclusivemanagementfeestructure,theAdvisoryContractprovidedforareasonablesharingofanybenefitsfromeconomies of scale with the fund.
FeesTheBoardwasprovidedwithinformationregardingindustrytrendsinmanagementfeesandexpenses,andtheBoardreviewedthefund’smanagementfeerateandtotalexpenseratioincomparisonwithfeesandexpensesofothercomparablefundsbasedoninformationanddatasuppliedbyLipper.Forthesepurposes,theBoardassumedthatthefund’smanage-mentfeeratewasequaltotheall-inclusivemanagementfeeratelessthefund’sactualoperatingexpensesandthetotalexpenseratiowasequaltotheall-inclusivemanagementfeerate.Afterincludingreductionsofthemanagementfeethatresultedfromthefund’sinvestmentsinotherT.RowePricefunds,theinformationprovidedtotheBoardindicatedthatthefund’smanagementfeerateandtotalexpenseratiowereabovethemedianforcomparablefunds.
T.RowePricePersonalStrategyBalancedPortfolio

Proof #4
51
Approval of Investment Management Agreement (continued)
TheBoardalsoreviewedthefeeschedulesforinstitutionalaccounts(includingsubadvisedmutualfunds)andprivateaccountswithsimilarmandatesthatareadvisedorsubadvisedbytheAdvisoranditsaffiliates.ManagementprovidedtheBoardwithinformationabouttheAdvisor’sresponsibilitiesandservicesprovidedtosubadvisoryandotherinstitutionalaccountclients,includinginformationabouthowtherequirementsandeconomicsoftheinstitutionalbusinessdifferfromthoseoftheAdvisor’sproprietarymutualfundbusiness.TheBoardconsideredinformationshowingthattheAdvisor’sproprietarymutualfundbusinessisgenerallymorecomplexfromabusinessandcomplianceperspectivethanitsinstitutionalaccountbusinessandconsideredvariousotherrelevantfactors,includingthebroaderscopeofoperationsandoversight,moreextensiveshareholdercommunicationinfrastructure,greaterassetflows,heightenedbusinessrisks,anddifferencesinapplicablelawsandregulationsassociatedwiththeAdvisor’sproprietarymutualfundbusiness.Inassessingthereasonablenessofthefund’smanagementfeerate,theBoardconsideredthedifferencesinthenatureoftheservicesrequiredfortheAdvisortomanageitsproprietarymutualfundbusinessversusmanagingadiscretepoolofassetsasasubadvisortoanotherinstitution’smutualfundorforanotherinstitutionalaccount,andthedegreetowhichtheAdvisorperformssignificantadditionalservicesandassumesgreaterriskinmanagingthefundandotherT.RowePricemutual funds than it does for institutional account clients.
Onthebasisoftheinformationprovidedandthefactorsconsidered,theBoardconcludedthatthefeespaidbythefundundertheAdvisoryContractarereasonable.
Approval of the Advisory ContractAsnoted,theBoardapprovedthecontinuationoftheAdvisoryContract.Nosinglefactorwasconsideredinisolationortobedeterminativetothedecision.Rather,theBoardconcluded,inlightofaweightingandbalancingofallfactorsconsidered,thatitwasinthebestinterestsofthefundanditsshareholdersfortheBoardtoapprovethecontinuationoftheAdvisoryContract(includingthefeestobechargedforservicesthereunder).Theindependentdirectorswereadvisedthroughouttheprocessbyindependentlegalcounsel.
T.RowePricePersonalStrategyBalancedPortfolio

Proof #4
This page intentionally left blank.

Proof #4
This page intentionally left blank.

Proof #4
2016-US-24656 E304-051 8/16
100EastPrattStreet Baltimore,MD21202
Proof #6
Equity Income Portfolio
June 30, 2016
Semiannual Report
This report is authorized for distribution only to those who have received a copy of the portfolio’s prospectus.
T. Rowe Price Investment Services, Inc., Distributor.

Proof #6
T. Rowe Price Equity Income Portfolio
Highlights
•U.S.stocksendedarockyfirsthalfof2016slightlyhigher,butaglobalsell-offaftertheUKvotedtoleavetheEuropeanUnion(knownasBrexit)interruptedtheadvanceinJune.
•TheEquityIncomePortfoliopostedasolidgaininitsfiscalyear’sfirsthalf,outperformingthereturnoftheStandard&Poor’s500IndexanditsLipperpeergroup.
• Energystocksweretheportfolio’stopcontributors.Theportfoliobenefitedfromstrongstockselectionandanoverweighttothesector,whichralliedasoilpricesreboundedfrom13-yearlows.Financialsstocksdetractedthemostfromreturns.
• TheBrexitdecisionunleashedmanyuncertaintiesimpactingglobalbusiness,economics,andtrade.WhileBrexit-inducedvolatilitymayupendglobalstockandcurrencymarketsintheshortterm,itcreatesmoreopportunitiesforustobuyundervalued,higherdividend-yieldingstocksatattractiveprices.
The views and opinions in this report were current as of June 30, 2016. They are not guarantees of performance or investment results and should not be taken as investment advice. Investment decisions reflect a variety of factors, and the managers reserve the right to change their views about individual stocks, sectors, and the markets at any time. As a result, the views expressed should not be relied upon as a forecast of the fund’s future investment intent. The report is certified under the Sarbanes-Oxley Act, which requires mutual funds and other public companies to affirm that, to the best of their knowledge, the information in their financial reports is fairly and accurately stated in all material respects.
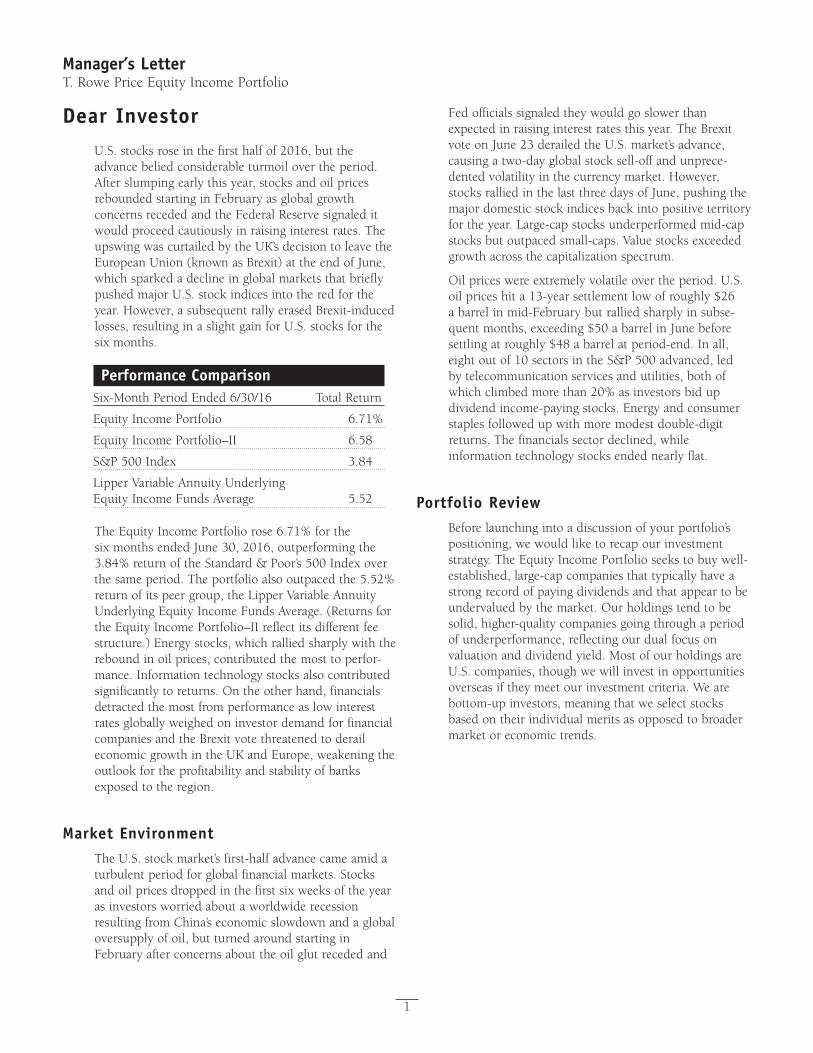
Proof #6
1
Manager’s LetterT. Rowe Price Equity Income Portfolio
Dear Investor U.S.stocksroseinthefirsthalfof2016,buttheadvance belied considerable turmoil over the period. Afterslumpingearlythisyear,stocksandoilpricesreboundedstartinginFebruaryasglobalgrowthconcernsrecededandtheFederalReservesignaleditwouldproceedcautiouslyinraisinginterestrates.TheupswingwascurtailedbytheUK’sdecisiontoleavetheEuropeanUnion(knownasBrexit)attheendofJune,whichsparkedadeclineinglobalmarketsthatbrieflypushedmajorU.S.stockindicesintotheredfortheyear.However,asubsequentrallyerasedBrexit-inducedlosses,resultinginaslightgainforU.S.stocksforthesixmonths.
Performance ComparisonSix-MonthPeriodEnded6/30/16 TotalReturn
EquityIncomePortfolio 6.71%
EquityIncomePortfolio–II 6.58
S&P500Index 3.84
LipperVariableAnnuityUnderlying EquityIncomeFundsAverage 5.52
TheEquityIncomePortfoliorose6.71%forthesixmonthsendedJune30,2016,outperformingthe3.84%returnoftheStandard&Poor’s500Indexoverthesameperiod.Theportfolioalsooutpacedthe5.52%returnofitspeergroup,theLipperVariableAnnuityUnderlyingEquityIncomeFundsAverage.(ReturnsfortheEquityIncomePortfolio–IIreflectitsdifferentfeestructure.)Energystocks,whichralliedsharplywiththerebound in oil prices, contributed the most to perfor-mance.Informationtechnologystocksalsocontributedsignificantlytoreturns.Ontheotherhand,financialsdetracted the most from performance as low interest ratesgloballyweighedoninvestordemandforfinancialcompaniesandtheBrexitvotethreatenedtoderaileconomicgrowthintheUKandEurope,weakeningtheoutlookfortheprofitabilityandstabilityofbanksexposedtotheregion.
Market EnvironmentTheU.S.stockmarket’sfirst-halfadvancecameamidaturbulentperiodforglobalfinancialmarkets.Stocksandoilpricesdroppedinthefirstsixweeksoftheyearas investors worried about a worldwide recession resultingfromChina’seconomicslowdownandaglobaloversupplyofoil,butturnedaroundstartinginFebruaryafterconcernsabouttheoilglutrecededand
Fedofficialssignaledtheywouldgoslowerthanexpectedinraisinginterestratesthisyear.TheBrexitvoteonJune23derailedtheU.S.market’sadvance,causingatwo-dayglobalstocksell-offandunprece-dentedvolatilityinthecurrencymarket.However,stocksralliedinthelastthreedaysofJune,pushingthemajordomesticstockindicesbackintopositiveterritoryfortheyear.Large-capstocksunderperformedmid-capstocksbutoutpacedsmall-caps.Valuestocksexceededgrowthacrossthecapitalizationspectrum.
Oilpriceswereextremelyvolatileovertheperiod.U.S.oilpriceshita13-yearsettlementlowofroughly$26abarrelinmid-Februarybutralliedsharplyinsubse-quentmonths,exceeding$50abarrelinJunebeforesettlingatroughly$48abarrelatperiod-end.Inall,eightoutof10sectorsintheS&P500advanced,ledby telecommunication services and utilities, both of whichclimbedmorethan20%asinvestorsbidupdividendincome-payingstocks.Energyandconsumerstaplesfollowedupwithmoremodestdouble-digitreturns. The financials sector declined, while informationtechnologystocksendednearlyflat.
Portfolio Review Beforelaunchingintoadiscussionofyourportfolio’spositioning,wewouldliketorecapourinvestmentstrategy.TheEquityIncomePortfolioseekstobuywell-established,large-capcompaniesthattypicallyhaveastrongrecordofpayingdividendsandthatappeartobeundervaluedbythemarket.Ourholdingstendtobesolid,higher-qualitycompaniesgoingthroughaperiodofunderperformance,reflectingourdualfocusonvaluationanddividendyield.MostofourholdingsareU.S.companies,thoughwewillinvestinopportunitiesoverseasiftheymeetourinvestmentcriteria.Wearebottom-upinvestors,meaningthatweselectstocksbased on their individual merits as opposed to broader marketoreconomictrends.
Proof #6
2
Sector Diversification Percent of Net Assets 12/31/15 6/30/16
Financials 25.3% 21.9%
Industrials and BusinessServices 14.1 14.6
Energy 10.8 12.1
HealthCare 9.6 9.4
InformationTechnology 10.5 8.9
ConsumerDiscretionary 10.0 8.7
Utilities 7.7 8.4
ConsumerStaples 3.8 5.0
Materials 4.5 4.9
TelecommunicationServices 3.1 2.9
OtherandReserves 0.6 3.2
Total 100.0% 100.0%
Historicalweightingsreflectcurrentindustry/sectorclassifications.
Energystockswerethebestperformersinthisyear’sfirsthalf,areversalfrom2015whenoilandnaturalgaspricescollapsedamidconcernsofexcesssupplyandslowingglobalgrowth.GlobaloilmajorsExxonMobil and Royal Dutch Shellandoilandgasexplorationandproduction companies Canadian Natural Resources and Apacherankedamongtheportfolio’stopcontributors.Allthesenamesgeneratedgainsexceeding20%asU.S.oilpricesreboundedfromFebruary’slowsandcrossedthe$50abarrelthresholdinJuneforthefirsttimeinnearlyayear.(Pleaserefertotheportfolioofinvestmentsforacompletelistofholdingsandtheamounteachrepresentsintheportfolio).
Whileenergystocksmaybepronetofurtherweaknessgivenhistoricallylowoilpricesandhighdebtlevelsacrosstheindustry,webelievethatourholdingshaveattributes that will allow them to hold up even if oil pricesremainunderpressure.Ourenergyholdingshavesolidbalancesheets,accesstolow-costsourcesofoilandnaturalgas,andlowercoststructures.ExxonMobilandRoyalDutchShellremaincoreholdingsfortheirstrongbalancesheetsandattractivedividendyields.WeinitiatedFrenchoilproducerTotal,whichwethinkhassomeofthebestoilandgasassetsandtradesatthemostattractivevaluationamongtheglobaloilmajors.Totalisnearingtheendofalargecapitalspendingcycleandstartingtogeneratecashfromrecentlycompletedprojects.Moreover,anewmanagementteamiscuttingcostsandfocusingongeneratingstrongreturnsoninvestedcapital.WetrimmedApachebecausewebelieveditsrisk/rewardprofilebecamelessfavorablefollowingtherallyinenergystocks.
Financial Profile Equity Income S&P500Asof6/30/16 Portfolio Index
Price/BookRatio 2.6X 3.7X
Price/EarningsRatio(Basedonnext12months’estimatedearnings)* 15.9X 18.4X
HistoricalBeta(Basedonmonthlyreturnsforfiveyears) 1.0 1.0
*Sourcefordata:IBES.Statisticsarebasedonthecompaniesintheportfolio and are not a projection of future portfolio performance.
Informationtechnologywasthelargestunderweightsectoratperiod-endbutliftedresultsthankstofavorablestockselection.Largecontributorsincludedsemicon-ductormanufacturingequipmentmakerApplied Materials,whichreportedsurprisinglystrongearningsandforecasts,andchipmakerTexas Instruments, whosesharesrosetoarecordthisspring.Wereducedourholdingsinboth,thoughAppliedMaterialsremainsasizableposition.OnenotableadditionwasApple, whichweinitiatedonweaknessearlierthisyear.Applehaslongbeensynonymouswithgrowth,butthecompany’sshareshaveslidsincemid-2015asiPhonesaleshavedropped,reinforcingtheviewthatitshigh-growthdaysareover.WebelievethatAppleisintheearlystagesoftransitioningfromaproduct-drivengrowthcompanyintoaservices-dependentvaluecompany.ThoughApplepotentiallyfacesabumpytransition as it shifts from hardware to services, the companygeneratestensofbillionsofdollarsincashevery year, much of which it could return to shareholders throughdividendsorsharebuybacks.Applealsohasnumerouswaystounlockvaluethroughmonetizingitslargeandloyalcustomerbase,whichweseeasavastlyunderappreciated asset.
Turningtodetractors,financialswasthebiggestdragonperformance.Mostoftheportfolio’slargestdeclinerswerebanksandinsurancecompanieswhosesharesslumpedthisyearamidanarrayofconcernsincludingnonperformingloanstoenergycompanies,difficulttradingconditionsinthefirstquarter,andlowinterestratesglobally.June’sBrexitvotedealtanotherblowtofinancials as investors worried that the decision would hurteconomicgrowthintheUKandEuropeandspurglobalcentralbankstofurthereasemonetarypolicy,which would push interest rates even lower worldwide and severely impact the profitability and stability of many companies in the sector. Bank of America, Royal Bank of Scotland, MetLife, Morgan Stanley, Citigroup, and State Street represented the heaviest
Proof #6
3
detractorsfortheperiod.Whilewemadeadjustmentstosomepositions—suchastrimmingBankofAmericaandaddingtoMorganStanley—wegenerallymaintainedasignificantweightinginfinancials.Lowinterestrateshavesqueezedprofitsatfinancialcompaniesinrecentyears,butwebelievethecurrentlow-rateenvironmentisunsustainableoverthelongterm.Onceinterestratesrevert to normalized levels, we believe our financials holdingswillgeneratestrongerearningsand,asaresult,deliverbetterstockperformance.
Outlook TheU.S.economycontinuedtostrengtheninthepastsixmonths,buttherisksforinvestorshavegrownfollowingtheBrexitvote.LastDecember,weexpressedconcernaboutastrongU.S.dollar,China’sslowdown,atepidU.S.recovery,andthecollapseincommodityprices. Despite this year’s commodities recovery, most of theserisksstilllinger,thoughBrexit-induceduncertaintyhassupersededtheseconcernsfornow.Manyprivateeconomistspromptlyreducedtheirnear-termgrowthforecastsfortheUKandtheeurozonefollowingtheBrexitvote.ButwebelievethatonlytimewilltellwhetherBrexitendsupbeingadisruptiveeventonthesamescaleasthe2007–2008globalfinancialcrisisoratempestinateapot.WeanticipatethattheU.S.stockmarketwilllurchbetweenthesetwoextremesasBrexit’slonger-termconsequencesbecomemoreapparent.TheUKeconomyhasmanycorrectivemechanismsthatshouldhelpstabilizeactivityduringtimesofcrisis,butwhetherthesemechanismscancontainBrexit-inducedfinancial and economic turmoil is still uncertain.
Weremainconcernedaboutthestrongdollar,whichfacesrenewedupwardpressureduetogreaterriskaversion.BecauseastrongdollarhurtstheprofitabilityofU.S.companiesdoingbusinessoverseas,itsapprecia-tionhasfueledconcernsaboutweakcorporateearnings.Forthesecondquarterof2016,analystscurrentlyexpectS&P500companiestoreportthefifthstraightquarteroflowerearningsandsixthstraightquarteroflowerrevenuefromayearearlier,accordingtoFactSet.Thoughanalystsstillprojectaslightincreaseinearningsandrevenueforthefullyear,astrongerdollarcouldthwartanexpectedearningsrecovery.
WecontinuetoexpectachoppyenvironmentforU.S.stocksfortherestof2016asinvestorsalternatelyfocusonthepositiveandnegativeforcesdrivingthemarket.Geopoliticalevents—whicharenearlyimpossibletopredict—willlikelyhaveanoutsizedimpactonfinancialmarketsinthecomingmonths.Whilewerealizethatvolatilitycanbeunnervingformanyinvestors, we would remind shareholders that volatility alsoyieldsstock-pickingopportunitiesforactive
managers.Ourfocuscontinuestobeoninvestingincompaniesbenefitingfromaconfluenceofcompellingvaluations,attractivefundamentals,andstrongdividend yields.
ThankyouforinvestingwithT.RowePrice.
Respectfully submitted,
JohnD.LinehanPresident of the portfolio and chairman of its Investment Advisory Committee
HeatherMcPhersonAssociate portfolio manager
July11,2016
The committee chairman has day-to-day responsibility for managing the portfolio and works with committee members in developing and executing the portfolio’s investment program.
Proof #6
4
T. Rowe Price Equity Income Portfolio
Risks of InvestingValueinvestorsseektoinvestincompanieswhosestockprices are low in relation to their real worth or future prospects.Byidentifyingcompanieswhosestocksarecurrently out of favor or misunderstood, value investors hopetorealizesignificantappreciationasotherinvestorsrecognizethestock’sintrinsicvalueandthepricerisesaccordingly.Thevalueapproachcarriestheriskthatthemarketwillnotrecognizeasecurity’sintrinsicvalueforalongtimeorthatastockjudgedtobeundervaluedmayactually be appropriately priced.
GlossaryDividend yield:Theannualdividendofastockdividedbythestock’sprice.
Earnings growth rate–current fiscal year:Measurestheannualizedpercentchangeinearningspersharefromthe prior fiscal year to the current fiscal year.
Lipper indexes:Fundbenchmarksthatconsistofasmallnumber(10to30)ofthelargestmutualfundsinaparticularcategoryastrackedbyLipperInc.
Price-to-earnings (P/E) ratio–current fiscal year: A valuationmeasurecalculatedbydividingthepriceofastockbyitsreportedearningspersharefromthelatestfiscal year. The ratio is a measure of how much investors arewillingtopayforthecompany’searnings.ThehighertheP/E,themoreinvestorsarepayingforthecompany’scurrentearnings.
Price-to-earnings (P/E) ratio–next fiscal year: A valuationmeasurecalculatedbydividingthepriceofastockbyitsestimatedearningsforthenextfiscalyear.Theratioisameasureofhowmuchinvestorsarewillingtopayforthecompany’sfutureearnings.ThehighertheP/E,themoreinvestorsarepayingforthecompany’sexpectedearningsgrowthinthenextfiscalyear.
Price-to-earnings (P/E) ratio–12 months forward: A valuationmeasurecalculatedbydividingthepriceofastockbytheanalysts’forecastofthenext12months’expectedearnings.Theratioisameasureofhowmuchinvestorsarewillingtopayforthecompany’sfutureearnings.ThehighertheP/E,themoreinvestorsarepayingforthecompany’searningsgrowthinthenext12months.
Glossary (continued)Projected earnings growth rate (IBES): A company’s expectedearningspersharegrowthrateforagiventimeperiod based on the forecast from the Institutional Brokers’EstimateSystem,whichiscommonlyreferredtoasIBES.
S&P 500 Index:Anunmanagedindexthattracksthestocksof500primarilylarge-capU.S.companies.
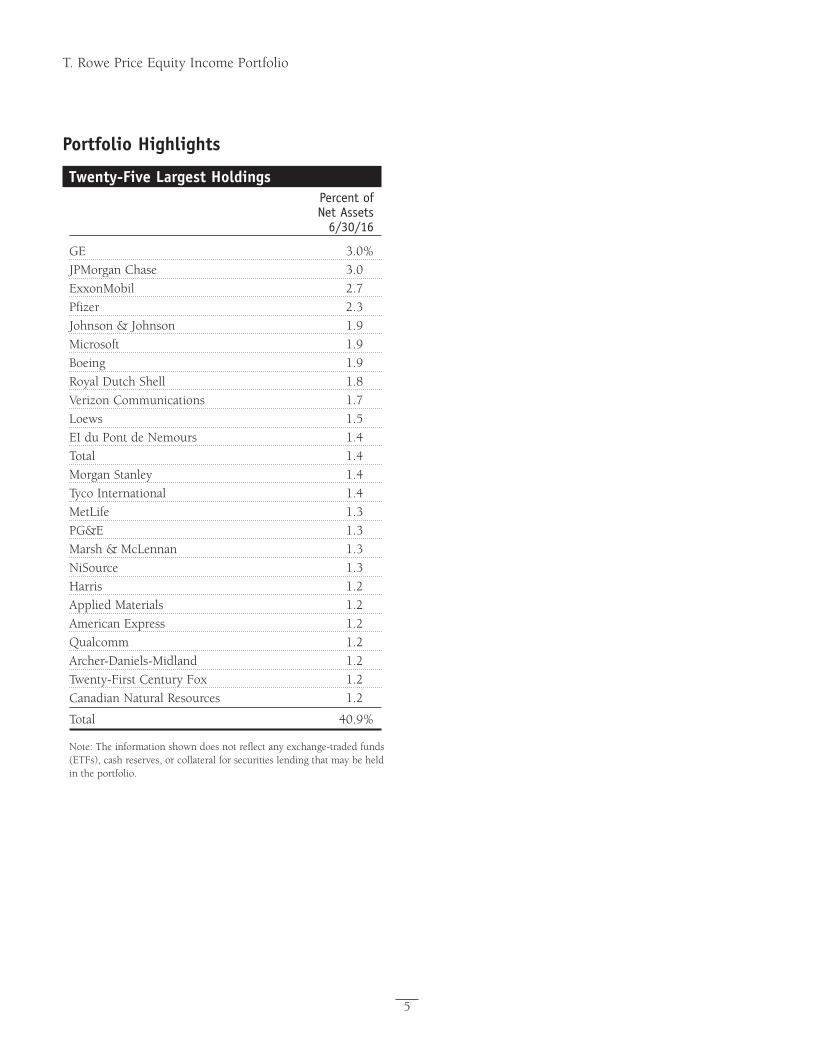
Proof #6
5
T. Rowe Price Equity Income Portfolio
Portfolio Highlights
Twenty-Five Largest Holdings Percent of Net Assets 6/30/16
GE 3.0%
JPMorganChase 3.0
ExxonMobil 2.7
Pfizer 2.3
Johnson&Johnson 1.9
Microsoft 1.9
Boeing 1.9
RoyalDutchShell 1.8
VerizonCommunications 1.7
Loews 1.5
EIduPontdeNemours 1.4
Total 1.4
MorganStanley 1.4
TycoInternational 1.4
MetLife 1.3
PG&E 1.3
Marsh&McLennan 1.3
NiSource 1.3
Harris 1.2
AppliedMaterials 1.2
AmericanExpress 1.2
Qualcomm 1.2
Archer-Daniels-Midland 1.2
Twenty-FirstCenturyFox 1.2
CanadianNaturalResources 1.2
Total 40.9%
Note:Theinformationshowndoesnotreflectanyexchange-tradedfunds(ETFs),cashreserves,orcollateralforsecuritieslendingthatmaybeheldin the portfolio.
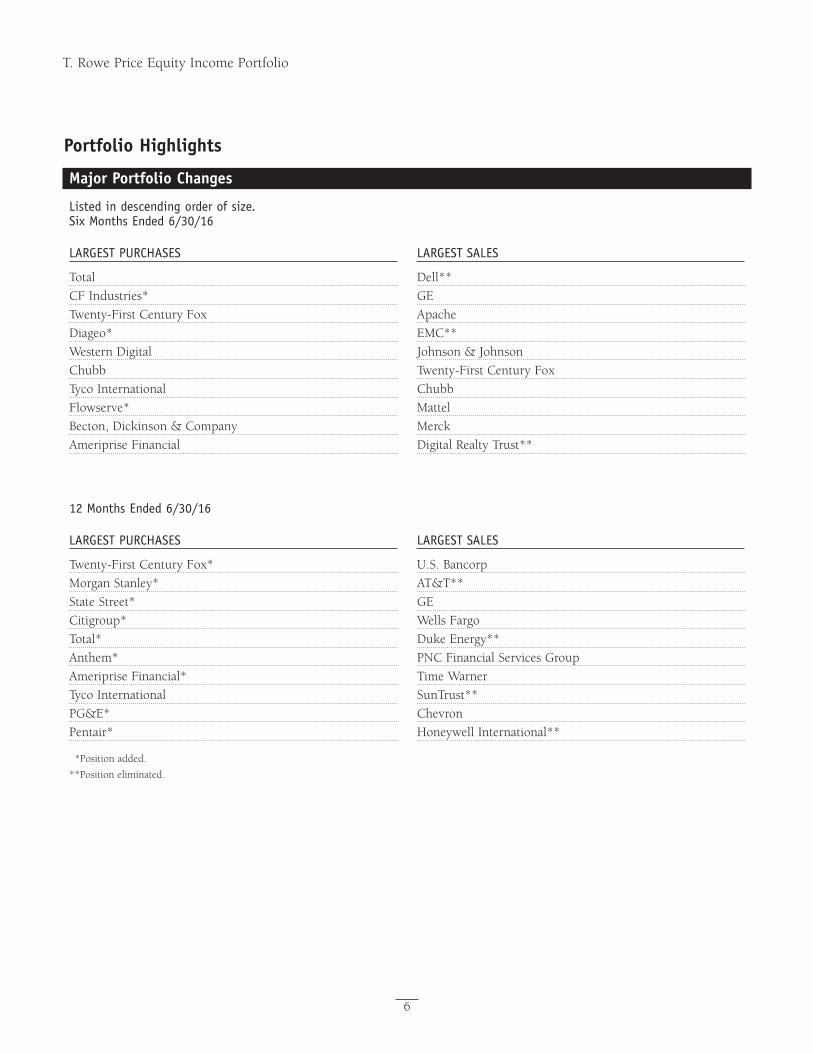
Proof #6
6
T. Rowe Price Equity Income Portfolio
Portfolio Highlights
Major Portfolio Changes
Listed in descending order of size. Six Months Ended 6/30/16
LARGEST PURCHASES
Total
CFIndustries*
Twenty-FirstCenturyFox
Diageo*
WesternDigital
Chubb
Tyco International
Flowserve*
Becton,Dickinson&Company
AmeripriseFinancial
LARGEST SALES
Dell**
GE
Apache
EMC**
Johnson&Johnson
Twenty-FirstCenturyFox
Chubb
Mattel
Merck
DigitalRealtyTrust**
12 Months Ended 6/30/16
LARGEST PURCHASES
Twenty-FirstCenturyFox*
MorganStanley*
StateStreet*
Citigroup*
Total*
Anthem*
AmeripriseFinancial*
Tyco International
PG&E*
Pentair*
LARGEST SALES
U.S.Bancorp
AT&T**
GE
WellsFargo
DukeEnergy**
PNCFinancialServicesGroup
TimeWarner
SunTrust**
Chevron
HoneywellInternational**
*Positionadded.
**Positioneliminated.
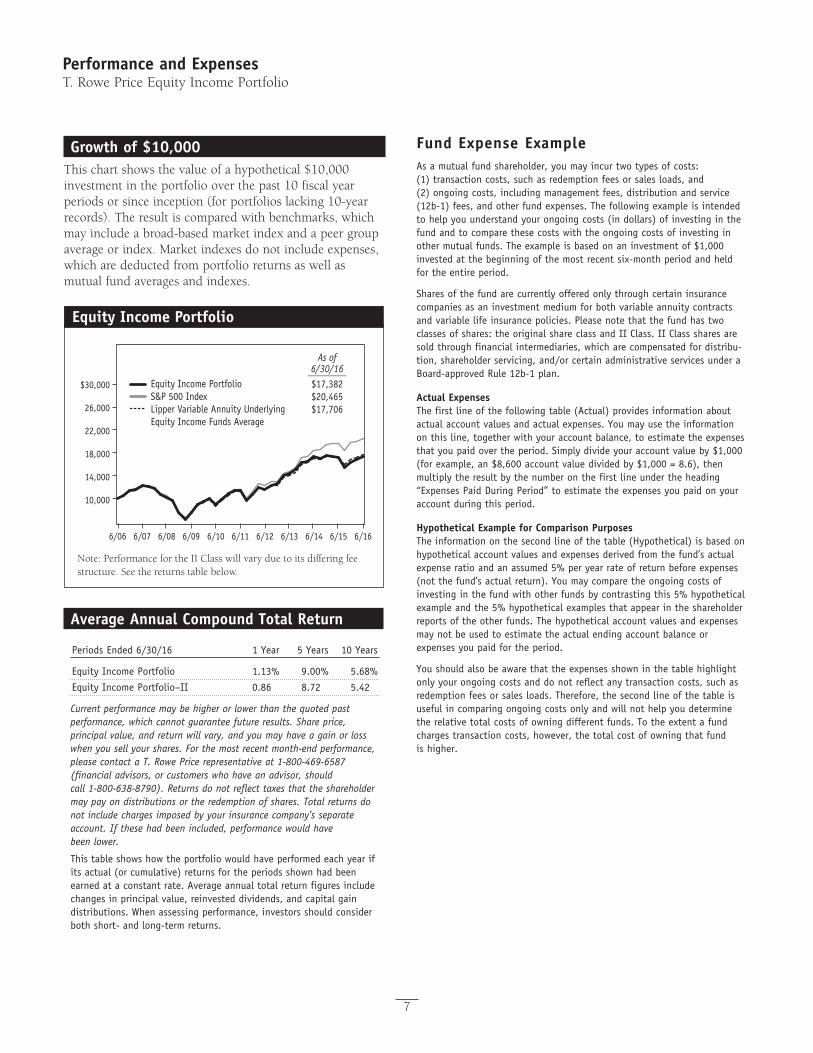
Proof #6
Performance and ExpensesT. Rowe Price Equity Income Portfolio
7
Growth of $10,000Thischartshowsthevalueofahypothetical$10,000investmentintheportfoliooverthepast10fiscalyearperiodsorsinceinception(forportfolioslacking10-yearrecords).Theresultiscomparedwithbenchmarks,whichmayincludeabroad-basedmarketindexandapeergroupaverageorindex.Marketindexesdonotincludeexpenses,which are deducted from portfolio returns as well as mutualfundaveragesandindexes.
Equity Income Portfolio
Note: Performance for the II Class will vary due to its differing fee structure. See the returns table below.
Equity Income PortfolioS&P 500 IndexLipper Variable Annuity UnderlyingEquity Income Funds Average
As of6/30/16________$17,382$20,465$17,706
10,000
14,000
18,000
22,000
26,000
$30,000
6/166/156/146/136/126/116/106/096/086/076/06
Average Annual Compound Total Return
Periods Ended 6/30/16 1 Year 5 Years 10 Years
Equity Income Portfolio 1.13% 9.00% 5.68%
Equity Income Portfolio–II 0.86 8.72 5.42
Current performance may be higher or lower than the quoted past performance, which cannot guarantee future results. Share price, principal value, and return will vary, and you may have a gain or loss when you sell your shares. For the most recent month-end performance, please contact a T. Rowe Price representative at 1-800-469-6587 (financial advisors, or customers who have an advisor, should call 1-800-638-8790). Returns do not reflect taxes that the shareholder may pay on distributions or the redemption of shares. Total returns do not include charges imposed by your insurance company’s separate account. If these had been included, performance would have been lower.
This table shows how the portfolio would have performed each year if its actual (or cumulative) returns for the periods shown had been earned at a constant rate. Average annual total return figures include changes in principal value, reinvested dividends, and capital gain distributions. When assessing performance, investors should consider both short- and long-term returns.
Fund Expense ExampleAs a mutual fund shareholder, you may incur two types of costs: (1) transaction costs, such as redemption fees or sales loads, and (2) ongoing costs, including management fees, distribution and service (12b-1) fees, and other fund expenses. The following example is intended to help you understand your ongoing costs (in dollars) of investing in the fund and to compare these costs with the ongoing costs of investing in other mutual funds. The example is based on an investment of $1,000 invested at the beginning of the most recent six-month period and held for the entire period.
Shares of the fund are currently offered only through certain insurance companies as an investment medium for both variable annuity contracts and variable life insurance policies. Please note that the fund has two classes of shares: the original share class and II Class. II Class shares are sold through financial intermediaries, which are compensated for distribu-tion, shareholder servicing, and/or certain administrative services under a Board-approved Rule 12b-1 plan.
Actual ExpensesThe first line of the following table (Actual) provides information about actual account values and actual expenses. You may use the information on this line, together with your account balance, to estimate the expenses that you paid over the period. Simply divide your account value by $1,000 (for example, an $8,600 account value divided by $1,000 = 8.6), then multiply the result by the number on the first line under the heading “Expenses Paid During Period” to estimate the expenses you paid on your account during this period.
Hypothetical Example for Comparison PurposesThe information on the second line of the table (Hypothetical) is based on hypothetical account values and expenses derived from the fund’s actual expense ratio and an assumed 5% per year rate of return before expenses (not the fund’s actual return). You may compare the ongoing costs of investing in the fund with other funds by contrasting this 5% hypothetical example and the 5% hypothetical examples that appear in the shareholder reports of the other funds. The hypothetical account values and expenses may not be used to estimate the actual ending account balance or expenses you paid for the period.
You should also be aware that the expenses shown in the table highlight only your ongoing costs and do not reflect any transaction costs, such as redemption fees or sales loads. Therefore, the second line of the table is useful in comparing ongoing costs only and will not help you determine the relative total costs of owning different funds. To the extent a fund charges transaction costs, however, the total cost of owning that fund is higher.
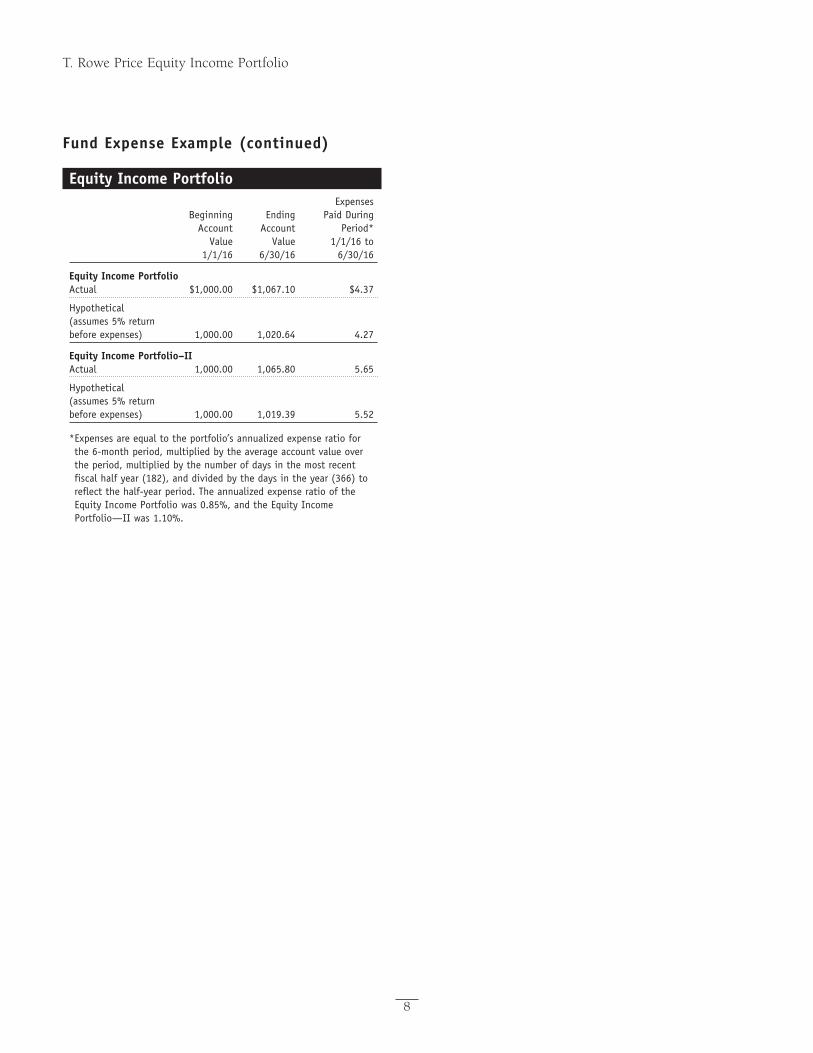
Proof #6
8
T. Rowe Price Equity Income Portfolio
Fund Expense Example (continued)
Equity Income Portfolio Expenses Beginning Ending Paid During Account Account Period* Value Value 1/1/16 to 1/1/16 6/30/16 6/30/16
Equity Income PortfolioActual $1,000.00 $1,067.10 $4.37
Hypothetical (assumes 5% return before expenses) 1,000.00 1,020.64 4.27
Equity Income Portfolio–IIActual 1,000.00 1,065.80 5.65
Hypothetical (assumes 5% return before expenses) 1,000.00 1,019.39 5.52
* Expenses are equal to the portfolio’s annualized expense ratio for the 6-month period, multiplied by the average account value over the period, multiplied by the number of days in the most recent fiscal half year (182), and divided by the days in the year (366) to reflect the half-year period. The annualized expense ratio of the Equity Income Portfolio was 0.85%, and the Equity Income Portfolio—II was 1.10%.
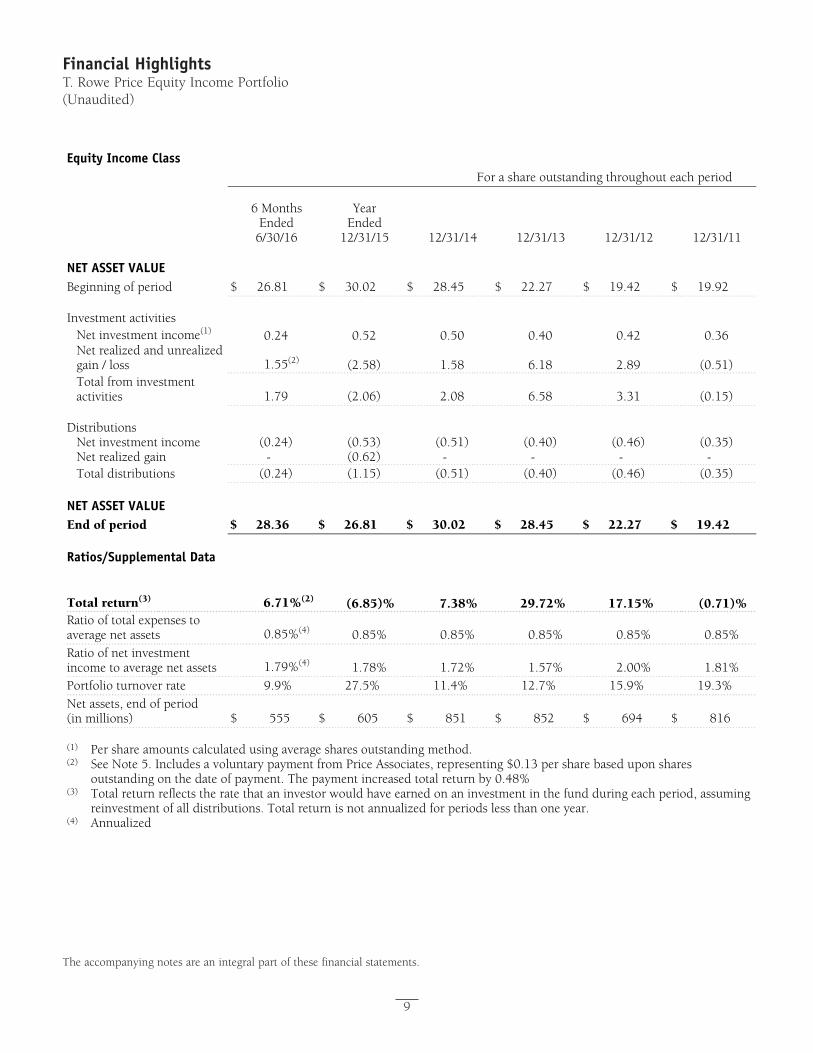
Proof #6
9
Financial HighlightsT. Rowe Price Equity Income Portfolio(Unaudited)
The accompanying notes are an integral part of these financial statements.
Equity Income Class
For a share outstanding throughout each period
6 Months Ended
6/30/16
Year Ended
12/31/15 12/31/14 12/31/13 12/31/12 12/31/11
NET ASSET VALUE
Beginning of period $ 26.81 $ 30.02 $ 28.45 $ 22.27 $ 19.42 $ 19.92 Investment activities
Net investment income(1) 0.24 0.52 0.50 0.40 0.42 0.36
Net realized and unrealized gain / loss 1.55(2) (2.58) 1.58 6.18 2.89 (0.51)
Total from investment activities 1.79 (2.06) 2.08 6.58 3.31 (0.15)
Distributions
Net investment income (0.24) (0.53) (0.51) (0.40) (0.46) (0.35)Net realized gain - (0.62) - - - -Total distributions (0.24) (1.15) (0.51) (0.40) (0.46) (0.35)
NET ASSET VALUE
End of period $ 28.36 $ 26.81 $ 30.02 $ 28.45 $ 22.27 $ 19.42 Ratios/Supplemental Data
Total return(3) 6.71%(2) (6.85)% 7.38% 29.72% 17.15% (0.71)%
Ratio of total expenses to average net assets 0.85%(4) 0.85% 0.85% 0.85% 0.85% 0.85%
Ratio of net investment income to average net assets 1.79%(4) 1.78% 1.72% 1.57% 2.00% 1.81%
Portfolio turnover rate 9.9% 27.5% 11.4% 12.7% 15.9% 19.3%Net assets, end of period (in millions) $ 555 $ 605 $ 851 $ 852 $ 694 $ 816
(1) Per share amounts calculated using average shares outstanding method.(2) See Note 5. Includes a voluntary payment from Price Associates, representing $0.13 per share based upon shares
outstanding on the date of payment. The payment increased total return by 0.48% (3) Total return reflects the rate that an investor would have earned on an investment in the fund during each period, assuming
reinvestment of all distributions. Total return is not annualized for periods less than one year. (4) Annualized
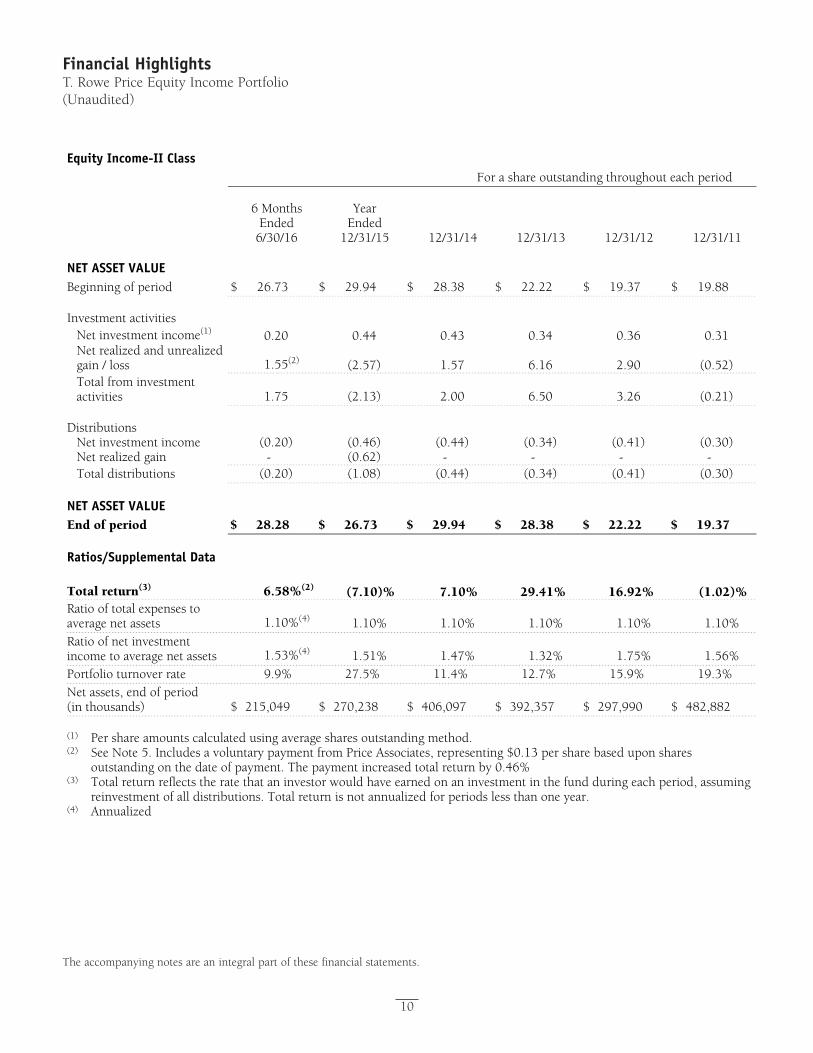
Proof #6
10
Financial HighlightsT. Rowe Price Equity Income Portfolio(Unaudited)
The accompanying notes are an integral part of these financial statements.
Equity Income-II Class
For a share outstanding throughout each period
6 Months Ended
6/30/16
Year Ended
12/31/15 12/31/14 12/31/13 12/31/12 12/31/11
NET ASSET VALUE
Beginning of period $ 26.73 $ 29.94 $ 28.38 $ 22.22 $ 19.37 $ 19.88 Investment activities
Net investment income(1) 0.20 0.44 0.43 0.34 0.36 0.31
Net realized and unrealized gain / loss 1.55(2) (2.57) 1.57 6.16 2.90 (0.52)
Total from investment activities 1.75 (2.13) 2.00 6.50 3.26 (0.21)
Distributions
Net investment income (0.20) (0.46) (0.44) (0.34) (0.41) (0.30)Net realized gain - (0.62) - - - -Total distributions (0.20) (1.08) (0.44) (0.34) (0.41) (0.30)
NET ASSET VALUE
End of period $ 28.28 $ 26.73 $ 29.94 $ 28.38 $ 22.22 $ 19.37 Ratios/Supplemental Data
Total return(3) 6.58%(2) (7.10)% 7.10% 29.41% 16.92% (1.02)%
Ratio of total expenses to average net assets 1.10%(4) 1.10% 1.10% 1.10% 1.10% 1.10%
Ratio of net investment income to average net assets 1.53%(4) 1.51% 1.47% 1.32% 1.75% 1.56%
Portfolio turnover rate 9.9% 27.5% 11.4% 12.7% 15.9% 19.3%Net assets, end of period (in thousands) $ 215,049 $ 270,238 $ 406,097 $ 392,357 $ 297,990 $ 482,882
(1) Per share amounts calculated using average shares outstanding method.(2) See Note 5. Includes a voluntary payment from Price Associates, representing $0.13 per share based upon shares
outstanding on the date of payment. The payment increased total return by 0.46% (3) Total return reflects the rate that an investor would have earned on an investment in the fund during each period, assuming
reinvestment of all distributions. Total return is not annualized for periods less than one year. (4) Annualized
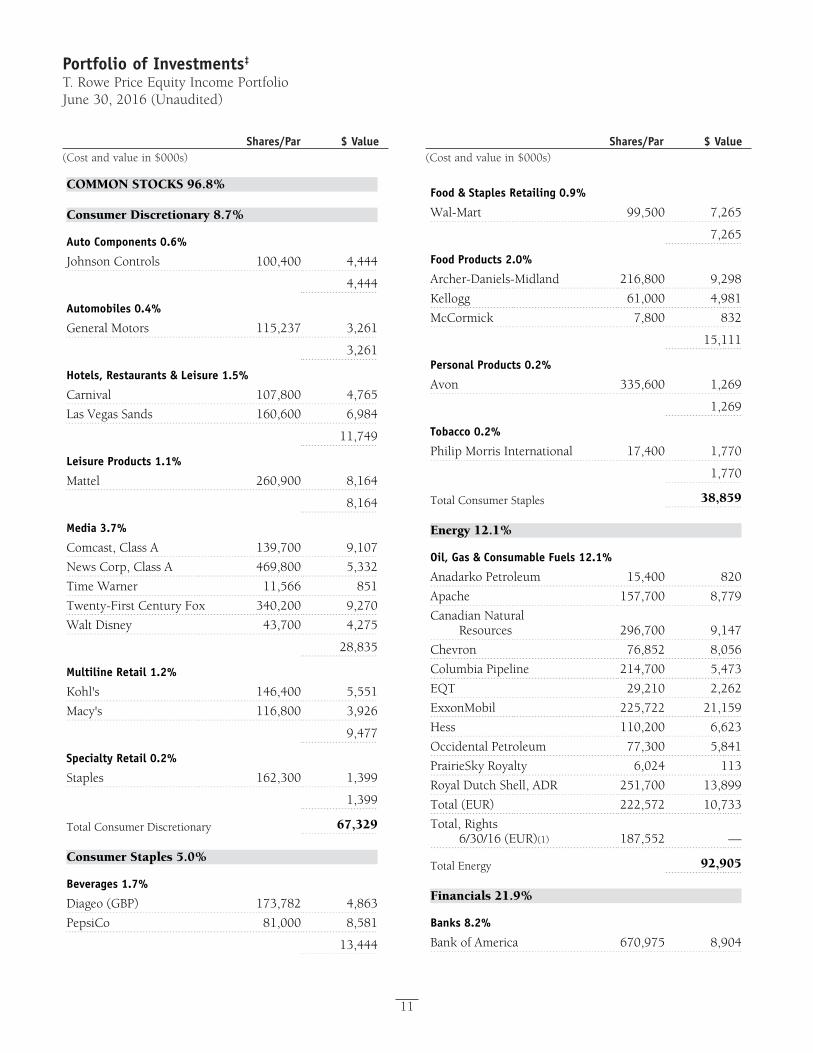
Proof #6
Portfolio of Investments‡
T. Rowe Price Equity Income PortfolioJune 30, 2016 (Unaudited)
Shares/Par $ Value(Cost and value in $000s)
Shares/Par $ Value(Cost and value in $000s)
11
COMMON STOCKS 96.8%
Consumer Discretionary 8.7%
Auto Components 0.6%
Johnson Controls 100,400 4,444
4,444
Automobiles 0.4%
General Motors 115,237 3,261
3,261
Hotels, Restaurants & Leisure 1.5%
Carnival 107,800 4,765
Las Vegas Sands 160,600 6,984
11,749
Leisure Products 1.1%
Mattel 260,900 8,164
8,164
Media 3.7%
Comcast, Class A 139,700 9,107
News Corp, Class A 469,800 5,332
Time Warner 11,566 851
Twenty-First Century Fox 340,200 9,270
Walt Disney 43,700 4,275
28,835
Multiline Retail 1.2%
Kohl's 146,400 5,551
Macy's 116,800 3,926
9,477
Specialty Retail 0.2%
Staples 162,300 1,399
1,399
Total Consumer Discretionary 67,329
Consumer Staples 5.0%
Beverages 1.7%
Diageo (GBP) 173,782 4,863
PepsiCo 81,000 8,581
13,444
Food & Staples Retailing 0.9%
Wal-Mart 99,500 7,265
7,265
Food Products 2.0%
Archer-Daniels-Midland 216,800 9,298
Kellogg 61,000 4,981
McCormick 7,800 832
15,111
Personal Products 0.2%
Avon 335,600 1,269
1,269
Tobacco 0.2%
Philip Morris International 17,400 1,770
1,770
Total Consumer Staples 38,859
Energy 12.1%
Oil, Gas & Consumable Fuels 12.1%
Anadarko Petroleum 15,400 820
Apache 157,700 8,779
Canadian Natural Resources 296,700 9,147
Chevron 76,852 8,056
Columbia Pipeline 214,700 5,473
EQT 29,210 2,262
ExxonMobil 225,722 21,159
Hess 110,200 6,623
Occidental Petroleum 77,300 5,841
PrairieSky Royalty 6,024 113
Royal Dutch Shell, ADR 251,700 13,899
Total (EUR) 222,572 10,733
Total, Rights 6/30/16 (EUR)(1) 187,552 —
Total Energy 92,905
Financials 21.9%
Banks 8.2%
Bank of America 670,975 8,904
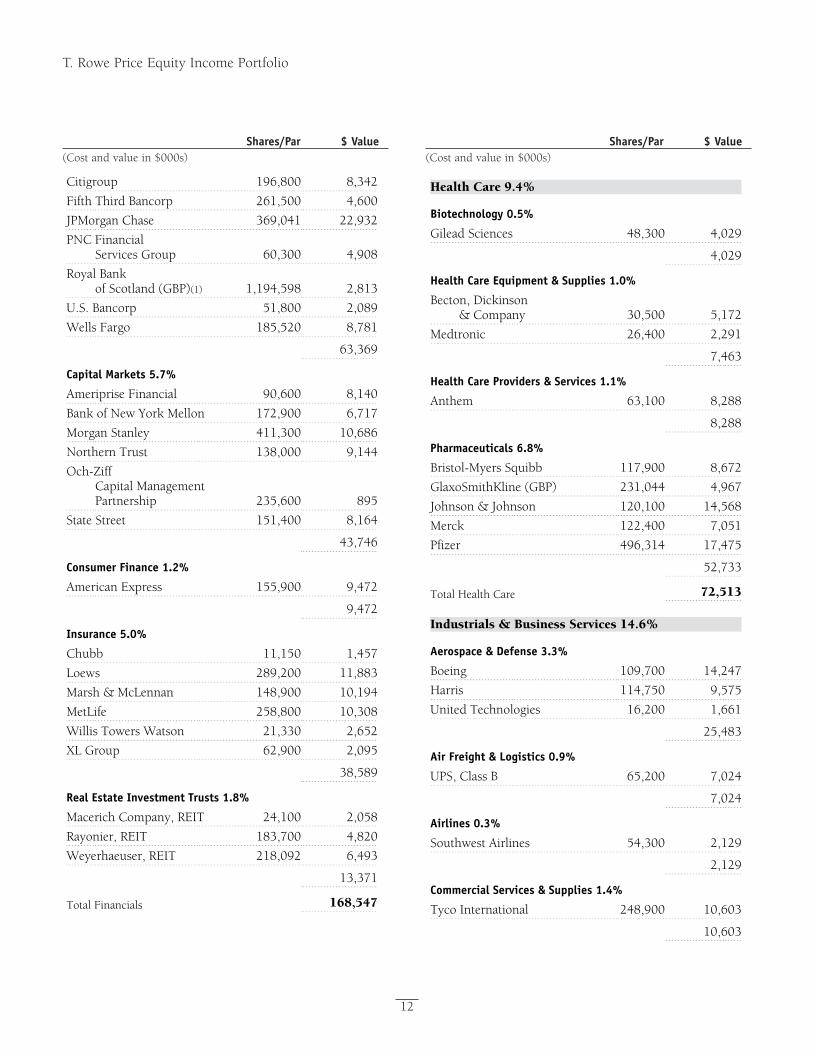
Proof #6
T. Rowe Price Equity Income Portfolio
Shares/Par $ Value(Cost and value in $000s)
Shares/Par $ Value(Cost and value in $000s)
12
Citigroup 196,800 8,342
Fifth Third Bancorp 261,500 4,600
JPMorgan Chase 369,041 22,932
PNC Financial Services Group 60,300 4,908
Royal Bank of Scotland (GBP)(1) 1,194,598 2,813
U.S. Bancorp 51,800 2,089
Wells Fargo 185,520 8,781
63,369
Capital Markets 5.7%
Ameriprise Financial 90,600 8,140
Bank of New York Mellon 172,900 6,717
Morgan Stanley 411,300 10,686
Northern Trust 138,000 9,144
Och-Ziff Capital Management Partnership 235,600 895
State Street 151,400 8,164
43,746
Consumer Finance 1.2%
American Express 155,900 9,472
9,472
Insurance 5.0%
Chubb 11,150 1,457
Loews 289,200 11,883
Marsh & McLennan 148,900 10,194
MetLife 258,800 10,308
Willis Towers Watson 21,330 2,652
XL Group 62,900 2,095
38,589
Real Estate Investment Trusts 1.8%
Macerich Company, REIT 24,100 2,058
Rayonier, REIT 183,700 4,820
Weyerhaeuser, REIT 218,092 6,493
13,371
Total Financials 168,547
Health Care 9.4%
Biotechnology 0.5%
Gilead Sciences 48,300 4,029
4,029
Health Care Equipment & Supplies 1.0%
Becton, Dickinson & Company 30,500 5,172
Medtronic 26,400 2,291
7,463
Health Care Providers & Services 1.1%
Anthem 63,100 8,288
8,288
Pharmaceuticals 6.8%
Bristol-Myers Squibb 117,900 8,672
GlaxoSmithKline (GBP) 231,044 4,967
Johnson & Johnson 120,100 14,568
Merck 122,400 7,051
Pfizer 496,314 17,475
52,733
Total Health Care 72,513
Industrials & Business Services 14.6%
Aerospace & Defense 3.3%
Boeing 109,700 14,247
Harris 114,750 9,575
United Technologies 16,200 1,661
25,483
Air Freight & Logistics 0.9%
UPS, Class B 65,200 7,024
7,024
Airlines 0.3%
Southwest Airlines 54,300 2,129
2,129
Commercial Services & Supplies 1.4%
Tyco International 248,900 10,603
10,603
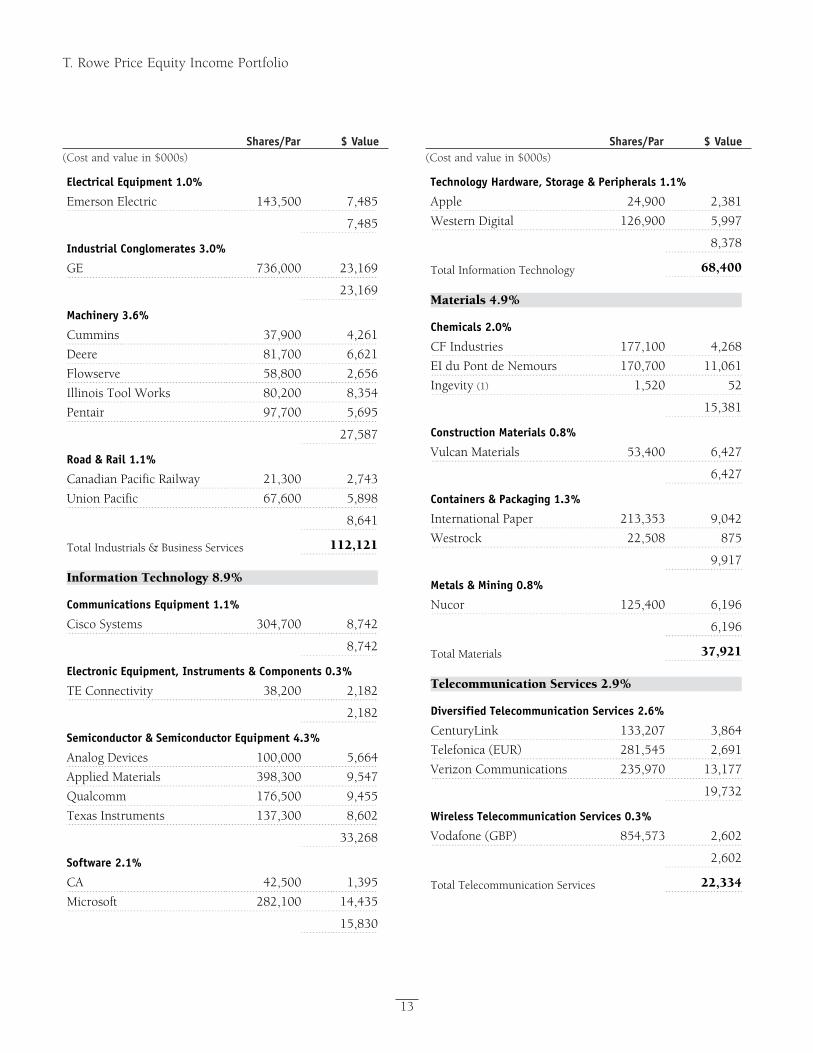
Proof #6
T. Rowe Price Equity Income Portfolio
Shares/Par $ Value(Cost and value in $000s)
Shares/Par $ Value(Cost and value in $000s)
13
Electrical Equipment 1.0%
Emerson Electric 143,500 7,485
7,485
Industrial Conglomerates 3.0%
GE 736,000 23,169
23,169
Machinery 3.6%
Cummins 37,900 4,261
Deere 81,700 6,621
Flowserve 58,800 2,656
Illinois Tool Works 80,200 8,354
Pentair 97,700 5,695
27,587
Road & Rail 1.1%
Canadian Pacific Railway 21,300 2,743
Union Pacific 67,600 5,898
8,641
Total Industrials & Business Services 112,121
Information Technology 8.9%
Communications Equipment 1.1%
Cisco Systems 304,700 8,742
8,742
Electronic Equipment, Instruments & Components 0.3%
TE Connectivity 38,200 2,182
2,182
Semiconductor & Semiconductor Equipment 4.3%
Analog Devices 100,000 5,664
Applied Materials 398,300 9,547
Qualcomm 176,500 9,455
Texas Instruments 137,300 8,602
33,268
Software 2.1%
CA 42,500 1,395
Microsoft 282,100 14,435
15,830
Technology Hardware, Storage & Peripherals 1.1%
Apple 24,900 2,381
Western Digital 126,900 5,997
8,378
Total Information Technology 68,400
Materials 4.9%
Chemicals 2.0%
CF Industries 177,100 4,268
EI du Pont de Nemours 170,700 11,061
Ingevity (1) 1,520 52
15,381
Construction Materials 0.8%
Vulcan Materials 53,400 6,427
6,427
Containers & Packaging 1.3%
International Paper 213,353 9,042
Westrock 22,508 875
9,917
Metals & Mining 0.8%
Nucor 125,400 6,196
6,196
Total Materials 37,921
Telecommunication Services 2.9%
Diversified Telecommunication Services 2.6%
CenturyLink 133,207 3,864
Telefonica (EUR) 281,545 2,691
Verizon Communications 235,970 13,177
19,732
Wireless Telecommunication Services 0.3%
Vodafone (GBP) 854,573 2,602
2,602
Total Telecommunication Services 22,334
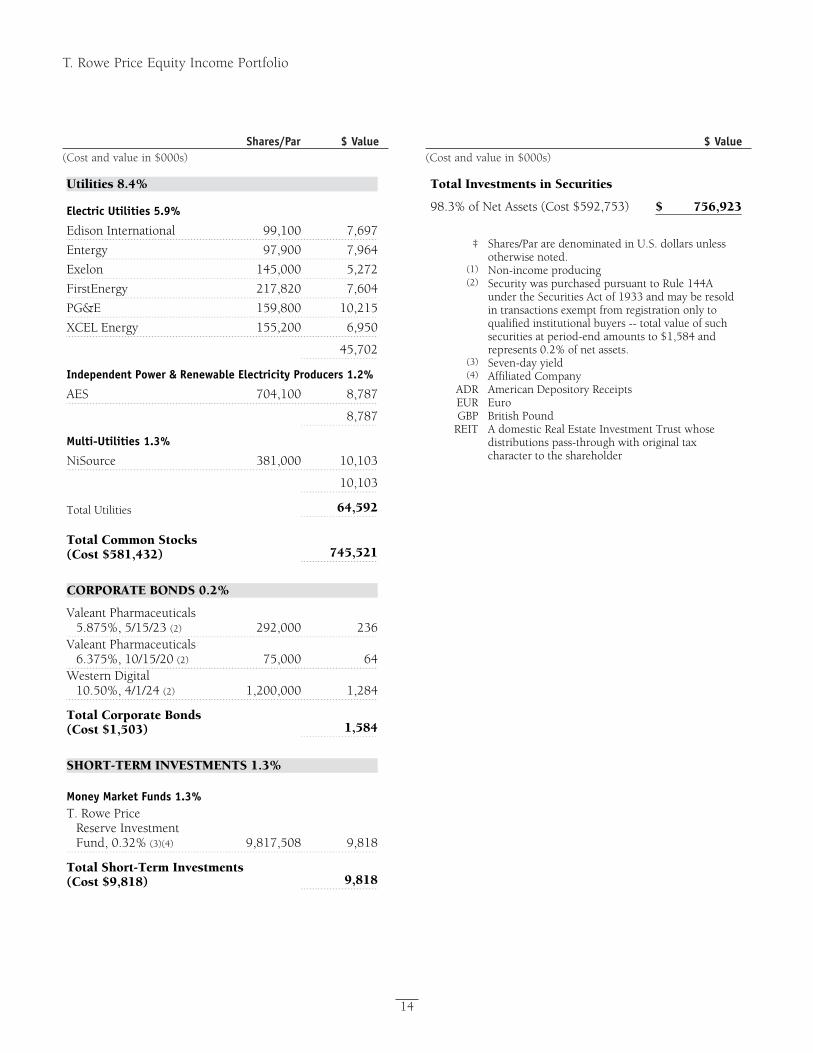
Proof #6
T. Rowe Price Equity Income Portfolio
Shares/Par $ Value(Cost and value in $000s)
14
$ Value(Costandvaluein$000s)
Utilities 8.4%
Electric Utilities 5.9%
Edison International 99,100 7,697
Entergy 97,900 7,964
Exelon 145,000 5,272
FirstEnergy 217,820 7,604
PG&E 159,800 10,215
XCEL Energy 155,200 6,950
45,702
Independent Power & Renewable Electricity Producers 1.2%
AES 704,100 8,787
8,787
Multi-Utilities 1.3%
NiSource 381,000 10,103
10,103
Total Utilities 64,592
Total Common Stocks (Cost $581,432) 745,521
CORPORATE BONDS 0.2%
Valeant Pharmaceuticals 5.875%, 5/15/23 (2) 292,000 236
Valeant Pharmaceuticals 6.375%, 10/15/20 (2) 75,000 64
Western Digital 10.50%, 4/1/24 (2) 1,200,000 1,284
Total Corporate Bonds (Cost $1,503) 1,584
SHORT-TERM INVESTMENTS 1.3%
Money Market Funds 1.3% T. Rowe Price
Reserve Investment Fund, 0.32% (3)(4) 9,817,508 9,818
Total Short-Term Investments (Cost $9,818) 9,818
Total Investments in Securities
98.3% of Net Assets (Cost $592,753) $ 756,923
‡
Shares/Par are denominated in U.S. dollars unless otherwise noted.
(1) Non-income producing (2)
Security was purchased pursuant to Rule 144A under the Securities Act of 1933 and may be resold in transactions exempt from registration only to qualified institutional buyers -- total value of such securities at period-end amounts to $1,584 and represents 0.2% of net assets.
(3) Seven-day yield(4) Affiliated Company
ADR American Depository Receipts EUR EuroGBP British Pound
REIT
A domestic Real Estate Investment Trust whose distributions pass-through with original tax character to the shareholder
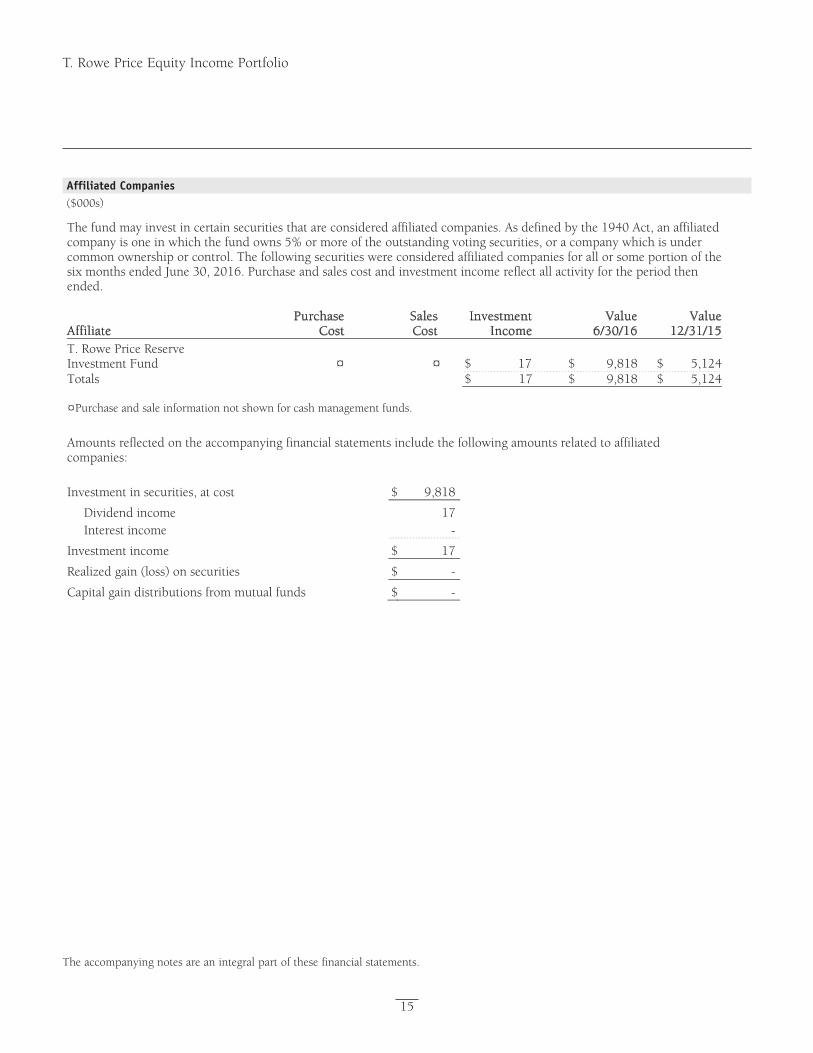
Proof #6
T. Rowe Price Equity Income Portfolio
15
The accompanying notes are an integral part of these financial statements.
Affiliated Companies($000s)
The fund may invest in certain securities that are considered affiliated companies. As defined by the 1940 Act, an affiliated company is one in which the fund owns 5% or more of the outstanding voting securities, or a company which is under common ownership or control. The following securities were considered affiliated companies for all or some portion of the six months ended June 30, 2016. Purchase and sales cost and investment income reflect all activity for the period then ended. Affiliate
PurchaseCost
SalesCost
InvestmentIncome
Value6/30/16
Value12/31/15
T. Rowe Price Reserve Investment Fund ¤ ¤ $ 17 $ 9,818 $ 5,124Totals $ 17 $ 9,818 $ 5,124
¤ Purchase and sale information not shown for cash management funds.
Amounts reflected on the accompanying financial statements include the following amounts related to affiliated companies: Investment in securities, at cost $ 9,818
Dividend income 17 Interest income -
Investment income $ 17
Realized gain (loss) on securities $ -
Capital gain distributions from mutual funds $ -
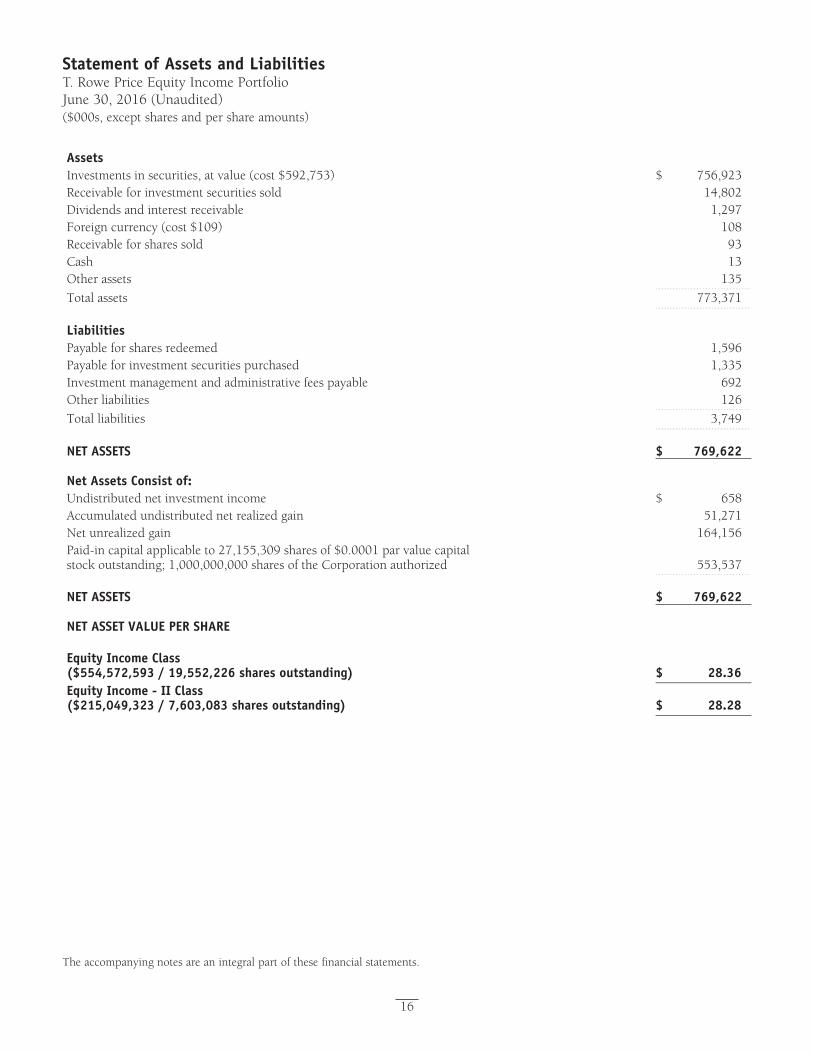
Proof #6
16
Statement of Assets and LiabilitiesT. Rowe Price Equity Income PortfolioJune 30, 2016 (Unaudited)($000s, except shares and per share amounts)
The accompanying notes are an integral part of these financial statements.
Assets Investments in securities, at value (cost $592,753) $ 756,923 Receivable for investment securities sold 14,802 Dividends and interest receivable 1,297 Foreign currency (cost $109) 108 Receivable for shares sold 93 Cash 13 Other assets 135
Total assets 773,371 Liabilities Payable for shares redeemed 1,596 Payable for investment securities purchased 1,335 Investment management and administrative fees payable 692 Other liabilities 126
Total liabilities 3,749 NET ASSETS $ 769,622 Net Assets Consist of: Undistributed net investment income $ 658 Accumulated undistributed net realized gain 51,271 Net unrealized gain 164,156 Paid-in capital applicable to 27,155,309 shares of $0.0001 par value capital stock outstanding; 1,000,000,000 shares of the Corporation authorized 553,537 NET ASSETS $ 769,622 NET ASSET VALUE PER SHARE Equity Income Class ($554,572,593 / 19,552,226 shares outstanding) $ 28.36 Equity Income - II Class ($215,049,323 / 7,603,083 shares outstanding) $ 28.28
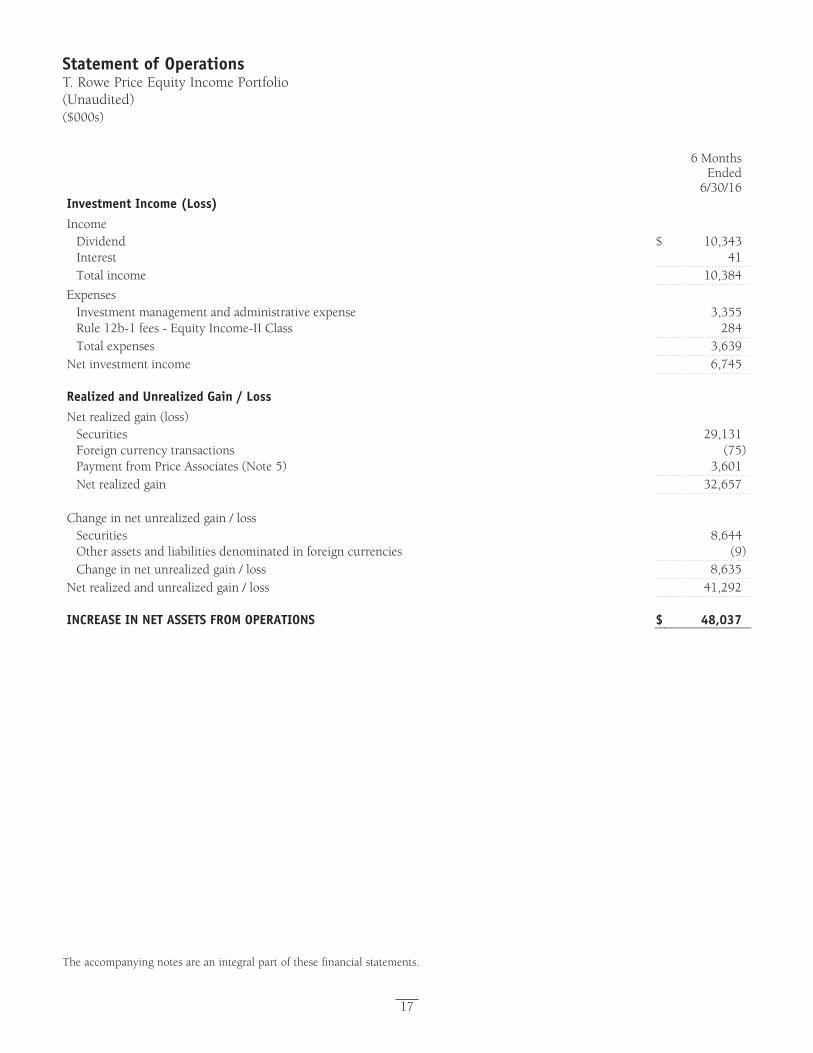
Proof #6
17
Statement of OperationsT. Rowe Price Equity Income Portfolio(Unaudited)($000s)
The accompanying notes are an integral part of these financial statements.
6 Months Ended
6/30/16Investment Income (Loss) Income
Dividend $ 10,343Interest 41Total income 10,384
Expenses Investment management and administrative expense 3,355Rule 12b-1 fees - Equity Income-II Class 284Total expenses 3,639
Net investment income 6,745 Realized and Unrealized Gain / Loss Net realized gain (loss)
Securities 29,131Foreign currency transactions (75)Payment from Price Associates (Note 5) 3,601Net realized gain 32,657
Change in net unrealized gain / loss
Securities 8,644Other assets and liabilities denominated in foreign currencies (9)Change in net unrealized gain / loss 8,635
Net realized and unrealized gain / loss 41,292 INCREASE IN NET ASSETS FROM OPERATIONS $ 48,037
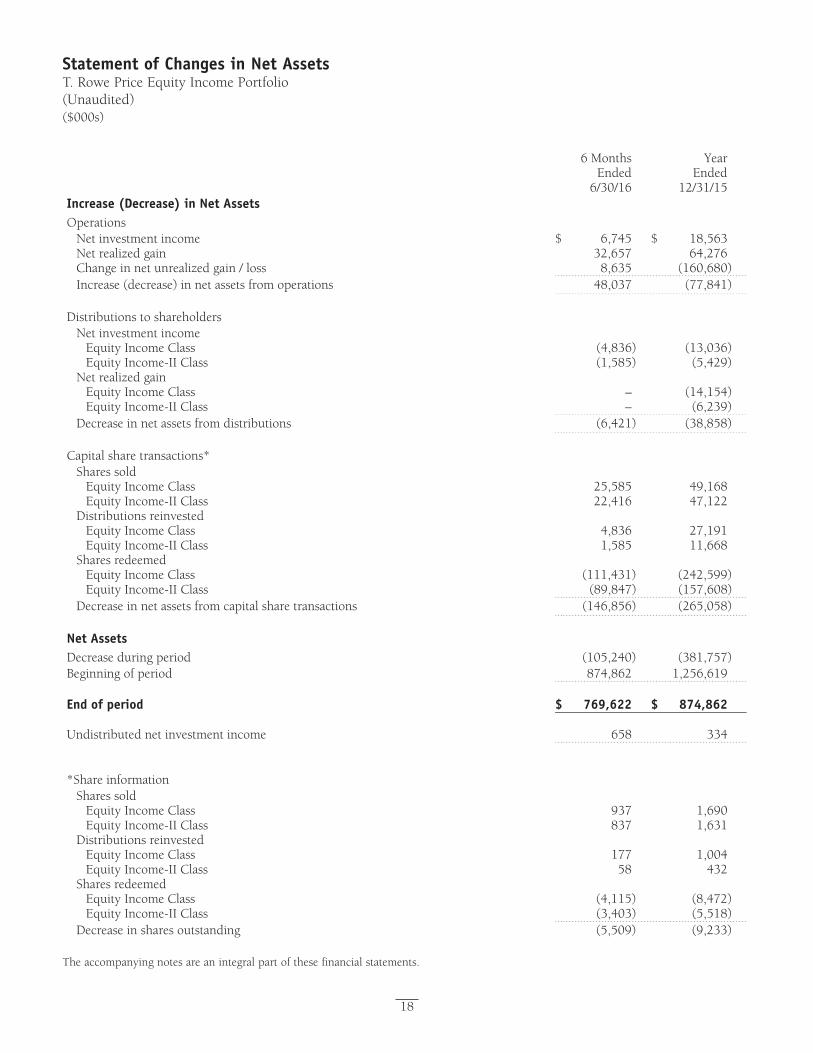
Proof #6
18
Statement of Changes in Net AssetsT. Rowe Price Equity Income Portfolio(Unaudited)($000s)
The accompanying notes are an integral part of these financial statements.
6 Months Ended
6/30/16
Year Ended
12/31/15Increase (Decrease) in Net Assets Operations
Net investment income $ 6,745 $ 18,563Net realized gain 32,657 64,276Change in net unrealized gain / loss 8,635 (160,680)Increase (decrease) in net assets from operations 48,037 (77,841)
Distributions to shareholders
Net investment income Equity Income Class (4,836) (13,036)Equity Income-II Class (1,585) (5,429)
Net realized gain Equity Income Class – (14,154)Equity Income-II Class – (6,239)
Decrease in net assets from distributions (6,421) (38,858) Capital share transactions*
Shares sold Equity Income Class 25,585 49,168Equity Income-II Class 22,416 47,122
Distributions reinvested Equity Income Class 4,836 27,191Equity Income-II Class 1,585 11,668
Shares redeemed Equity Income Class (111,431) (242,599)Equity Income-II Class (89,847) (157,608)
Decrease in net assets from capital share transactions (146,856) (265,058) Net Assets Decrease during period (105,240) (381,757) Beginning of period 874,862 1,256,619 End of period $ 769,622 $ 874,862 Undistributed net investment income 658 334 *Share information
Shares sold Equity Income Class 937 1,690Equity Income-II Class 837 1,631
Distributions reinvested Equity Income Class 177 1,004Equity Income-II Class 58 432
Shares redeemed Equity Income Class (4,115) (8,472)Equity Income-II Class (3,403) (5,518)
Decrease in shares outstanding (5,509) (9,233)
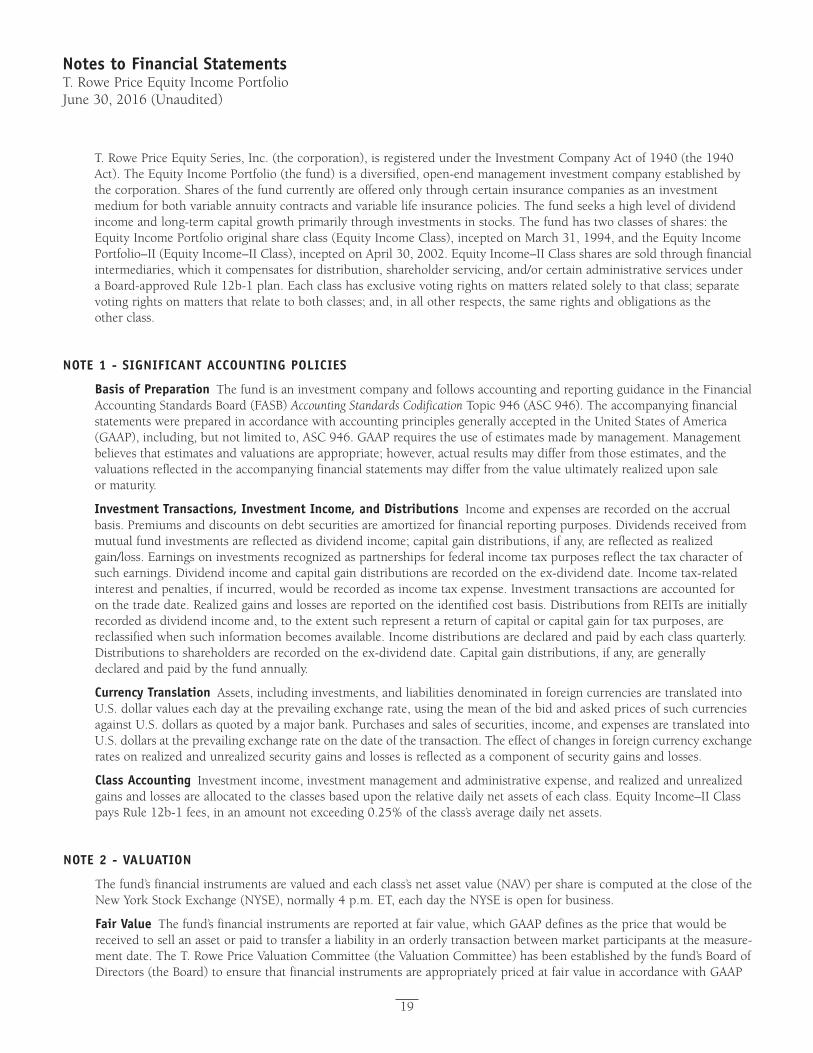
Proof #6
19
Notes to Financial StatementsT. Rowe Price Equity Income PortfolioJune 30, 2016 (Unaudited)
T.RowePriceEquitySeries,Inc.(thecorporation),isregisteredundertheInvestmentCompanyActof1940(the1940Act).TheEquityIncomePortfolio(thefund)isadiversified,open-endmanagementinvestmentcompanyestablishedbythecorporation.Sharesofthefundcurrentlyareofferedonlythroughcertaininsurancecompaniesasaninvestmentmediumforbothvariableannuitycontractsandvariablelifeinsurancepolicies.Thefundseeksahighlevelofdividendincomeandlong-termcapitalgrowthprimarilythroughinvestmentsinstocks.Thefundhastwoclassesofshares:theEquityIncomePortfoliooriginalshareclass(EquityIncomeClass),inceptedonMarch31,1994,andtheEquityIncomePortfolio–II(EquityIncome–IIClass),inceptedonApril30,2002.EquityIncome–IIClasssharesaresoldthroughfinancialintermediaries,whichitcompensatesfordistribution,shareholderservicing,and/orcertainadministrativeservicesunderaBoard-approvedRule12b-1plan.Eachclasshasexclusivevotingrightsonmattersrelatedsolelytothatclass;separatevotingrightsonmattersthatrelatetobothclasses;and,inallotherrespects,thesamerightsandobligationsastheother class.
NOTE 1 - SIGNIFICANT ACCOuNTING POLICIES
Basis of Preparation ThefundisaninvestmentcompanyandfollowsaccountingandreportingguidanceintheFinancialAccountingStandardsBoard(FASB)Accounting Standards CodificationTopic946(ASC946).TheaccompanyingfinancialstatementswerepreparedinaccordancewithaccountingprinciplesgenerallyacceptedintheUnitedStatesofAmerica(GAAP),including,butnotlimitedto,ASC946.GAAPrequirestheuseofestimatesmadebymanagement.Managementbelievesthatestimatesandvaluationsareappropriate;however,actualresultsmaydifferfromthoseestimates,andthevaluationsreflectedintheaccompanyingfinancialstatementsmaydifferfromthevalueultimatelyrealizeduponsaleor maturity.
Investment Transactions, Investment Income, and Distributions Incomeandexpensesarerecordedontheaccrualbasis.Premiumsanddiscountsondebtsecuritiesareamortizedforfinancialreportingpurposes.Dividendsreceivedfrommutualfundinvestmentsarereflectedasdividendincome;capitalgaindistributions,ifany,arereflectedasrealizedgain/loss.Earningsoninvestmentsrecognizedaspartnershipsforfederalincometaxpurposesreflectthetaxcharacterofsuchearnings.Dividendincomeandcapitalgaindistributionsarerecordedontheex-dividenddate.Incometax-relatedinterestandpenalties,ifincurred,wouldberecordedasincometaxexpense.Investmenttransactionsareaccountedforonthetradedate.Realizedgainsandlossesarereportedontheidentifiedcostbasis.DistributionsfromREITsareinitiallyrecordedasdividendincomeand,totheextentsuchrepresentareturnofcapitalorcapitalgainfortaxpurposes,arereclassifiedwhensuchinformationbecomesavailable.Incomedistributionsaredeclaredandpaidbyeachclassquarterly.Distributionstoshareholdersarerecordedontheex-dividenddate.Capitalgaindistributions,ifany,aregenerallydeclared and paid by the fund annually.
Currency Translation Assets,includinginvestments,andliabilitiesdenominatedinforeigncurrenciesaretranslatedintoU.S.dollarvalueseachdayattheprevailingexchangerate,usingthemeanofthebidandaskedpricesofsuchcurrenciesagainstU.S.dollarsasquotedbyamajorbank.Purchasesandsalesofsecurities,income,andexpensesaretranslatedintoU.S.dollarsattheprevailingexchangerateonthedateofthetransaction.Theeffectofchangesinforeigncurrencyexchangeratesonrealizedandunrealizedsecuritygainsandlossesisreflectedasacomponentofsecuritygainsandlosses.
Class Accounting Investmentincome,investmentmanagementandadministrativeexpense,andrealizedandunrealizedgainsandlossesareallocatedtotheclassesbasedupontherelativedailynetassetsofeachclass.EquityIncome–IIClasspaysRule12b-1fees,inanamountnotexceeding0.25%oftheclass’saveragedailynetassets.
NOTE 2 - VALuATION
Thefund’sfinancialinstrumentsarevaluedandeachclass’snetassetvalue(NAV)pershareiscomputedatthecloseoftheNewYorkStockExchange(NYSE),normally4p.m.ET,eachdaytheNYSEisopenforbusiness.
Fair Value Thefund’sfinancialinstrumentsarereportedatfairvalue,whichGAAPdefinesasthepricethatwouldbereceivedtosellanassetorpaidtotransferaliabilityinanorderlytransactionbetweenmarketparticipantsatthemeasure-mentdate.TheT.RowePriceValuationCommittee(theValuationCommittee)hasbeenestablishedbythefund’sBoardofDirectors(theBoard)toensurethatfinancialinstrumentsareappropriatelypricedatfairvalueinaccordancewithGAAP
Proof #6
20
T. Rowe Price Equity Income Portfolio
andthe1940Act.SubjecttooversightbytheBoard,theValuationCommitteedevelopsandoverseespricing-relatedpoliciesandproceduresandapprovesallfairvaluedeterminations.Specifically,theValuationCommitteeestablishesprocedurestovaluesecurities;determinespricingtechniques,sources,andpersonseligibletoeffectfairvaluepricingactions;overseestheselection,services,andperformanceofpricingvendors;overseesvaluation-relatedbusinesscontinuitypractices;andprovidesguidanceoninternalcontrolsandvaluation-relatedmatters.TheValuationCommitteereportstotheBoardandhasrepresentationfromlegal,portfoliomanagementandtrading,operations,riskmanagement,and the fund’s treasurer.
Variousvaluationtechniquesandinputsareusedtodeterminethefairvalueoffinancialinstruments.GAAPestablishesthefollowingfairvaluehierarchythatcategorizestheinputsusedtomeasurefairvalue:
Level1–quotedprices(unadjusted)inactivemarketsforidenticalfinancialinstrumentsthatthefundcanaccessatthereportingdate
Level2–inputsotherthanLevel1quotedpricesthatareobservable,eitherdirectlyorindirectly(including,butnotlimitedto,quotedpricesforsimilarfinancialinstrumentsinactivemarkets,quotedpricesforidenticalorsimilarfinancialinstrumentsininactivemarkets,interestratesandyieldcurves,impliedvolatilities,andcreditspreads)
Level3–unobservableinputs
Observableinputsaredevelopedusingmarketdata,suchaspubliclyavailableinformationaboutactualeventsortransac-tions,andreflecttheassumptionsthatmarketparticipantswouldusetopricethefinancialinstrument.Unobservableinputsarethoseforwhichmarketdataarenotavailableandaredevelopedusingthebestinformationavailableabouttheassumptionsthatmarketparticipantswouldusetopricethefinancialinstrument.GAAPrequiresvaluationtechniquestomaximizetheuseofrelevantobservableinputsandminimizetheuseofunobservableinputs.Whenmultipleinputsareusedtoderivefairvalue,thefinancialinstrumentisassignedtothelevelwithinthefairvaluehierarchybasedonthelowest-levelinputthatissignificanttothefairvalueofthefinancialinstrument.Inputlevelsarenotnecessarilyanindicationoftheriskorliquidityassociatedwithfinancialinstrumentsatthatlevelbutratherthedegreeofjudgmentusedindeterminingthosevalues.
Valuation Techniques Equitysecuritieslistedorregularlytradedonasecuritiesexchangeorintheover-the-counter(OTC)marketarevaluedatthelastquotedsalepriceor,forcertainmarkets,theofficialclosingpriceatthetimethevaluationsaremade.OTCBulletinBoardsecuritiesarevaluedatthemeanoftheclosingbidandaskedprices.Asecuritythatislistedortradedonmorethanoneexchangeisvaluedatthequotationontheexchangedeterminedtobetheprimarymarketforsuchsecurity.Listedsecuritiesnottradedonaparticulardayarevaluedatthemeanoftheclosingbidandaskedpricesfordomesticsecuritiesandthelastquotedsaleorclosingpriceforinternationalsecurities.
Forvaluationpurposes,thelastquotedpricesofnon-U.S.equitysecuritiesmaybeadjustedtoreflectthefairvalueofsuchsecuritiesatthecloseoftheNYSE.IfthefunddeterminesthatdevelopmentsbetweenthecloseofaforeignmarketandthecloseoftheNYSEwill,initsjudgment,materiallyaffectthevalueofsomeorallofitsportfoliosecurities,thefundwilladjustthepreviousquotedpricestoreflectwhatitbelievestobethefairvalueofthesecuritiesasofthecloseoftheNYSE.Indecidingwhetheritisnecessarytoadjustquotedpricestoreflectfairvalue,thefundreviewsavarietyoffactors,includingdevelopmentsinforeignmarkets,theperformanceofU.S.securitiesmarkets,andtheperformanceofinstrumentstradinginU.S.marketsthatrepresentforeignsecuritiesandbasketsofforeignsecurities.Thefundmayalsofairvaluesecuritiesinothersituations,suchaswhenaparticularforeignmarketisclosedbutthefundisopen.Thefundusesoutsidepricingservicestoprovideitwithquotedpricesandinformationtoevaluateoradjustthoseprices.Thefundcannotpredicthowoftenitwillusequotedpricesandhowoftenitwilldetermineitnecessarytoadjustthosepricestoreflectfairvalue.Asameansofevaluatingitssecurityvaluationprocess,thefundroutinelycomparesquotedprices,thenextday’sopeningpricesinthesamemarkets,andadjustedprices.
ActivelytradedequitysecuritieslistedonadomesticexchangegenerallyarecategorizedinLevel1ofthefairvaluehierarchy.Non-U.S.equitysecuritiesgenerallyarecategorizedinLevel2ofthefairvaluehierarchydespitetheavailabilityofquotedpricesbecause,asdescribedabove,thefundevaluatesanddetermineswhetherthosequotedpricesreflectfairvalueatthecloseoftheNYSEorrequireadjustment.OTCBulletinBoardsecurities,certainpreferredsecurities,andequitysecuritiestradedininactivemarketsgenerallyarecategorizedinLevel2ofthefairvaluehierarchy.
Proof #6
21
T. Rowe Price Equity Income Portfolio
DebtsecuritiesgenerallyaretradedintheOTCmarket.Securitieswithremainingmaturitiesofoneyearormoreatthetimeofacquisitionarevaluedatpricesfurnishedbydealerswhomakemarketsinsuchsecuritiesorbyanindependentpricingservice,whichconsiderstheyieldorpriceofbondsofcomparablequality,coupon,maturity,andtype,aswellaspricesquotedbydealerswhomakemarketsinsuchsecurities.Generally,debtsecuritiesarecategorizedinLevel2ofthefair value hierarchy.
Investmentsinmutualfundsarevaluedatthemutualfund’sclosingNAVpershareonthedayofvaluationandarecategorizedinLevel1ofthefairvaluehierarchy.Assetsandliabilitiesotherthanfinancialinstruments,includingshort-termreceivablesandpayables,arecarriedatcost,orestimatedrealizablevalue,ifless,whichapproximatesfairvalue.
Thinly traded financial instruments and those for which the above valuation procedures are inappropriate or are deemed nottoreflectfairvaluearestatedatfairvalueasdeterminedingoodfaithbytheValuationCommittee.Theobjectiveofanyfairvaluepricingdeterminationistoarriveatapricethatcouldreasonablybeexpectedfromacurrentsale.FinancialinstrumentsfairvaluedbytheValuationCommitteeareprimarilyprivateplacements,restrictedsecurities,warrants,rights,andothersecuritiesthatarenotpubliclytraded.
SubjecttooversightbytheBoard,theValuationCommitteeregularlymakesgoodfaithjudgmentstoestablishandadjustthefairvaluationsofcertainsecuritiesaseventsoccurandcircumstanceswarrant.Forinstance,indeterminingthefairvalueofanequityinvestmentwithlimitedmarketactivity,suchasaprivateplacementorathinlytradedpubliccompanystock,theValuationCommitteeconsidersavarietyoffactors,whichmayinclude,butarenotlimitedto,theissuer’sbusinessprospects,itsfinancialstandingandperformance,recentinvestmenttransactionsintheissuer,newroundsoffinancing,negotiatedtransactionsofsignificantsizebetweenotherinvestorsinthecompany,relevantmarketvaluationsofpeercompanies,strategiceventsaffectingthecompany,marketliquidityfortheissuer,andgeneraleconomicconditionsandevents.Inconsultationwiththeinvestmentandpricingteams,theValuationCommitteewilldetermineanappropriatevaluationtechniquebasedonavailableinformation,whichmayincludebothobservableandunobservableinputs.TheValuationCommitteetypicallywillaffordgreatestweighttoactualpricesinarm’slengthtransactions,totheextenttheyrepresentorderlytransactionsbetweenmarketparticipants,transactioninformationcanbereliablyobtained,andpricesaredeemedrepresentativeoffairvalue.However,theValuationCommitteemayalsoconsiderothervaluationmethodssuchasmarket-basedvaluationmultiples;adiscountorpremiumfrommarketvalueofasimilar,freelytradedsecurityofthesameissuer;orsomecombination.Fairvaluedeterminationsarereviewedonaregularbasisandupdatedasinforma-tionbecomesavailable,includingactualpurchaseandsaletransactionsoftheissue.Becauseanyfairvaluedeterminationinvolvesasignificantamountofjudgment,thereisadegreeofsubjectivityinherentinsuchpricingdecisions,andfairvaluepricesdeterminedbytheValuationCommitteecoulddifferfromthoseofothermarketparticipants.Dependingontherelativesignificanceofunobservableinputs,includingthevaluationtechnique(s)used,fairvaluedsecuritiesmaybecategorizedinLevel2or3ofthefairvaluehierarchy.
Valuation Inputs Thefollowingtablesummarizesthefund’sfinancialinstruments,basedontheinputsusedtodeterminetheirfairvaluesonJune30,2016:
Significant Significant Quoted Observable unobservable Prices Inputs InputsInvestmentsinSecurities,except: $ 9,818 $ – $ – $ 9,818
CommonStocks 716,852 28,669 – 745,521
CorporateBonds – 1,584 – 1,584
Total $ 726,670 $ 30,253 $ – $ 756,923
($000s) Total ValueLevel 3Level 2Level 1
TherewerenomaterialtransfersbetweenLevels1and2duringthesixmonthsendedJune30,2016.
Proof #6
22
T. Rowe Price Equity Income Portfolio
Followingisareconciliationofthefund’sLevel3holdingsforthesixmonthsendedJune30,2016.Gain(loss)reflectsbothrealizedandchangeinunrealizedgain/lossonLevel3holdingsduringtheperiod,ifany,andisincludedontheaccompanyingStatementofOperations.Thechangeinunrealizedgain/lossonLevel3instrumentsheldatJune30,2016,totaled$(1,494,000)forthesixmonthsendedJune30,2016.
Investments in Securities
ConvertiblePreferredStock $ 9,430 $ – $ (9,430) $ –
($000s) Ending Balance
6/30/16TotalSales
Gain (Loss)DuringPeriod
BeginningBalance1/1/16
NOTE 3 - OTHER INVESTMENT TRANSACTIONS
Consistentwithitsinvestmentobjective,thefundengagesinthefollowingpracticestomanageexposuretocertainrisksand/ortoenhanceperformance.Theinvestmentobjective,policies,program,andriskfactorsofthefundaredescribedmore fully in the fund’s prospectus and Statement of Additional Information.
Restricted Securities Thefundmayinvestinsecuritiesthataresubjecttolegalorcontractualrestrictionsonresale.Prompt sale of such securities at an acceptable price may be difficult and may involve substantial delays and additional costs.
Other Purchasesandsalesofportfoliosecuritiesotherthanshort-termsecuritiesaggregated$78,151,000and$236,618,000,respectively,forthesixmonthsendedJune30,2016.
NOTE 4 - FEDERAL INCOME TAxES
NoprovisionforfederalincometaxesisrequiredsincethefundintendstocontinuetoqualifyasaregulatedinvestmentcompanyunderSubchapterMoftheInternalRevenueCodeanddistributetoshareholdersallofitstaxableincomeandgains.Distributionsdeterminedinaccordancewithfederalincometaxregulationsmaydifferinamountorcharacterfromnetinvestmentincomeandrealizedgainsforfinancialreportingpurposes.Financialreportingrecordsareadjustedforpermanentbook/taxdifferencestoreflecttaxcharacterbutarenotadjustedfortemporarydifferences.Theamountandcharacteroftax-basisdistributionsandcompositionofnetassetsarefinalizedatfiscalyear-end;accordingly,tax-basisbalances have not been determined as of the date of this report.
AtJune30,2016,thecostofinvestmentsforfederalincometaxpurposeswas$598,619,000.Netunrealizedgainaggregated$158,290,000atperiod-end,ofwhich$203,473,000relatedtoappreciatedinvestmentsand$45,183,000related to depreciated investments.
NOTE 5 - RELATED PARTy TRANSACTIONS
ThefundismanagedbyT.RowePriceAssociates,Inc.(PriceAssociates),awhollyownedsubsidiaryofT.RowePriceGroup,Inc.(PriceGroup).TheinvestmentmanagementandadministrativeagreementbetweenthefundandPriceAssociatesprovidesforanall-inclusiveannualfeeequalto0.85%ofthefund’saveragedailynetassets.Thefeeiscomputeddailyandpaidmonthly.Theall-inclusivefeecoversinvestmentmanagement,shareholderservicing,transferagency,accounting,andcustodyservicesprovidedtothefund,aswellasfunddirectors’feesandexpenses.Interest,taxes,brokeragecommissions,andextraordinaryexpensesarepaiddirectlybythefund.
ThefundmayinvestintheT.RowePriceReserveInvestmentFund,theT.RowePriceGovernmentReserveInvestmentFund,ortheT.RowePriceShort-TermReserveFund(collectively,thePriceReserveInvestmentFunds),open-endmanagementinvestmentcompaniesmanagedbyPriceAssociatesandconsideredaffiliatesofthefund.ThePriceReserveInvestmentFundsareofferedasshort-terminvestmentoptionstomutualfunds,trusts,andotheraccountsmanagedbyPrice Associates or its affiliates and are not available for direct purchase by members of the public. The Price Reserve InvestmentFundspaynoinvestmentmanagementfees.
Proof #6
23
T. Rowe Price Equity Income Portfolio
The fund may participate in securities purchase and sale transactions with other funds or accounts advised by Price Associates(crosstrades),inaccordancewithproceduresadoptedbythefund’sBoardandSecuritiesandExchangeCommissionrules,whichrequire,amongotherthings,thatsuchpurchaseandsalecrosstradesbeeffectedattheindependentcurrentmarketpriceofthesecurity.DuringthesixmonthsendedJune30,2016,theaggregatevalueofpurchasesandsalescrosstradeswithotherfundsoraccountsadvisedbyPriceAssociateswaslessthan1%ofthefund’snetassetsasofJune30,2016.
OnJune6,2016,PriceAssociatesoffered,andthefund’sBoardofDirectorsaccepted,avoluntarypaymenttocompensatethefundforalossofvalueonitsinvestmentinDellasaresultofthefund’sineligibilitytopursueanappraisalactioninDelawarecourtduetoaproxyvotingerrorin2013(theOffer).ThepaymentfromPriceAssociateswasreceivedincashonJune10,2016.Subsequently,afinalsettlementtotheappraisalactionwasnegotiatedwithDell,pursuanttowhichthefundreceivedtheoriginalmergerconsiderationplusnegotiatedinterest.Thenegotiatedinterest,netofcontingentlegalfees,approximated$0.75perDellshareandwasreceivedbythefundonJune30;theoriginalmergerconsiderationwasreceivedonJuly1.ThesettlementfromDellisreflectedasrealizedgain/lossonsecuritiesintheaccompanyingfinancialstatements. The payment from Price Associates, reduced by the settlement from Dell in accordance with the terms of the Offer,was$3,601,000andincreasedthetotalreturnby0.48%and0.46%fortheEquityIncomeClassandEquityIncome-IIClass,respectivelyforthesixmonthsendedJune30,2016.TheamountpaidbyPriceAssociatesmaybefurtherincreasedordecreasedinthefuture,intheeventthereisacourt-determinedchangeinthefairvaluationofDellshares on appeal, or payment is received by the fund from any other source to compensate for the loss of value on its Dell shares.
NOTE 6 - LITIGATION
ThefundisanameddefendantorinaclassofdefendantsinalawsuitthattheUnsecuredCreditorsCommittee(theCommittee)oftheTribuneCompanyhasfiledinDelawarebankruptcycourt.TheCommitteeisseekingtorecoverallpaymentsmadetobeneficialownersofcommonstockinconnectionwithaleveragedbuyout(LBO)ofTribune,includingthosemadeinconnectionwitha2007tenderofferinwhichthefundparticipated.Amotiontodismissiscurrentlypending.Thefundwasnamed,also,asadefendantorincludedinaclassofdefendantsinparallellitigation,whichwasdismissedbydistrictcourtandaffirmedonappealbytheSecondCircuitCourtofAppeals.ThissecondactionassertedstatelawconstructivefraudulenttransferclaimsinanattempttorecoverstockredemptionpaymentsmadetoshareholdersatthetimeoftheLBO.Thecomplaintsallegenomisconductbythefund,andmanagementhasvigorouslydefended thelawsuits.Thevalueoftheproceedsreceivedbythefundis$25,684,000(3.34%ofnetassets),andthefund willincurlegalexpenses.Managementiscurrentlyassessingthecaseandhasnotyetdeterminedtheeffect,ifany,on the fund’s net assets and results of operations.

Proof #6
24
T.RowePriceEquityIncomePortfolio
Information on Proxy Voting Policies, Procedures, and Records
AdescriptionofthepoliciesandproceduresusedbyT.RowePricefundsandportfoliostodeterminehowtovoteproxiesrelatingtoportfoliosecuritiesisavailableineachfund’sStatementofAdditionalInformation.Youmayrequestthisdocumentbycalling1-800-225-5132orbyaccessingtheSEC’swebsite,sec.gov.
Thedescriptionofourproxyvotingpoliciesandproceduresisalsoavailableonourcorporatewebsite.Toaccessit,pleasevisitthefollowingWebpage
https://www3.troweprice.com/usis/corporate/en/utility/policies.html
andscrolldowntothesectionnearthebottomofthepagethatsays,“ProxyVotingPolicies.”ClickontheProxyVotingPolicieslinkintheshadedbox.
Eachfund’smostrecentannualproxyvotingrecordisavailableonourwebsiteandthroughtheSEC’swebsite.ToaccessitthroughT.RowePrice,visitthewebsitelocationshownabove,andscrolldowntothesectionnearthebottomofthepagethatsays,“ProxyVotingRecords.”ClickontheProxyVotingRecordslinkintheshadedbox.
How to Obtain Quarterly Portfolio Holdings
ThefundfilesacompletescheduleofportfolioholdingswiththeSecuritiesandExchangeCommissionforthefirstandthirdquartersofeachfiscalyearonFormN-Q.Thefund’sFormN-QisavailableelectronicallyontheSEC’swebsite(sec.gov);hardcopiesmaybereviewedandcopiedattheSEC’sPublicReferenceRoom,100FSt.N.E.,Washington,DC20549.FormoreinformationonthePublicReferenceRoom,call1-800-SEC-0330.
Proof #6
25
Approval of Investment Management Agreement
OnMarch11,2016,thefund’sBoardofDirectors(Board),includingamajorityofthefund’sindependentdirectors,approvedthecontinuationoftheinvestmentmanagementagreement(AdvisoryContract)betweenthefundanditsinvestmentadvisor,T.RowePriceAssociates,Inc.(Advisor).Inconnectionwithitsdeliberations,theBoardrequested,andtheAdvisorprovided,suchinformationastheBoard(withadvicefromindependentlegalcounsel)deemedreasonablynecessary.TheBoardconsideredavarietyoffactorsinconnectionwithitsreviewoftheAdvisoryContract,alsotakingintoaccountinformationprovidedbytheAdvisorduringthecourseoftheyear,asdiscussedbelow:
Services Provided by the AdvisorTheBoardconsideredthenature,quality,andextentoftheservicesprovidedtothefundbytheAdvisor.Theseservicesincluded,butwerenotlimitedto,directingthefund’sinvestmentsinaccordancewithitsinvestmentprogramandtheoverallmanagementofthefund’sportfolio,aswellasavarietyofrelatedactivitiessuchasfinancial,investmentoperations,andadministrativeservices;compliance;maintainingthefund’srecordsandregistrations;andshareholdercommunications.TheBoardalsoreviewedthebackgroundandexperienceoftheAdvisor’sseniormanagementteamandinvestmentpersonnelinvolvedinthemanagementofthefund,aswellastheAdvisor’scompliancerecord.TheBoardconcludedthatitwassatisfiedwiththenature,quality,andextentoftheservicesprovidedbytheAdvisor.
Investment Performance of the Fund TheBoardreviewedthefund’sthree-month,one-year,andyear-by-yearreturns,aswellasthefund’saverageannualizedtotalreturnsoverthe3-year,5-year,and10-yearperiods,andcomparedthesereturnswithawidevarietyofcomparableperformancemeasuresandmarketdata,includingthosesuppliedbyLipperandMorningstar,whichareindependentproviders of mutual fund data.
OnthebasisofthisevaluationandtheBoard’songoingreviewofinvestmentresultsandfactoringintherelativemarketconditionsduringcertainoftheperformanceperiods,theBoardconcludedthatthefund’sperformancewassatisfactory.
Costs, Benefits, Profits, and Economies of ScaleTheBoardrevieweddetailedinformationregardingtherevenuesreceivedbytheAdvisorundertheAdvisoryContractandotherbenefitsthattheAdvisor(anditsaffiliates)mayhaverealizedfromitsrelationshipwiththefund,includinganyresearchreceivedunder“softdollar”agreementsandcommission-sharingarrangementswithbroker-dealers.TheBoardconsideredthattheAdvisormayreceivesomebenefitfromsoft-dollararrangementspursuanttowhichresearchisreceivedfrombroker-dealersthatexecutetheapplicablefund’sportfoliotransactions.TheBoardreceivedinformationontheestimatedcostsincurredandprofitsrealizedbytheAdvisorfrommanagingT.RowePricemutualfunds.TheBoardalsoreviewedestimatesoftheprofitsrealizedfrommanagingthefundinparticular,andtheBoardconcludedthattheAdvisor’sprofitswerereasonableinlightoftheservicesprovidedtothefund.
TheBoardalsoconsideredwhetherthefundbenefitsunderthefeelevelssetforthintheAdvisoryContractfromanyeconomiesofscalerealizedbytheAdvisor.TheBoardnotedthat,undertheAdvisoryContract,thefundpaystheAdvisorasinglefee,orall-inclusivemanagementfee,whichisbasedonthefund’saveragedailynetassets.Theall-inclusivemanagementfeeincludesinvestmentmanagementservicesandprovidesfortheAdvisortopayallofthefund’sordinary,recurringoperatingexpensesexceptforinterest,taxes,portfoliotransactionfees,andanynonrecurringextraordinaryexpensesthatmayarise.TheBoardconcludedthat,basedontheprofitabilitydataitreviewedandconsistentwiththisall-inclusivemanagementfeestructure,theAdvisoryContractprovidedforareasonablesharingofanybenefitsfromeconomies of scale with the fund.
FeesTheBoardwasprovidedwithinformationregardingindustrytrendsinmanagementfeesandexpenses,andtheBoardreviewedthefund’smanagementfeerateandtotalexpenseratio(fortheOriginalClassandIIClass)incomparisonwithfeesandexpensesofothercomparablefundsbasedoninformationanddatasuppliedbyLipper.Forthesepurposes,theBoardassumedthatthefund’smanagementfeeratewasequaltotheall-inclusivemanagementfeeratelessthefund’sactualoperatingexpenses,andthetotalexpenseratiowasequaltotheall-inclusivemanagementfeerate.TheinformationprovidedtotheBoardindicatedthatthefund’smanagementfeerateandtotalexpenseratioforbothclasseswereabovethe median for comparable funds.
T.RowePriceEquityIncomePortfolio
Proof #6
26
Approval of Investment Management Agreement (continued)
TheBoardalsoreviewedthefeeschedulesforinstitutionalaccounts(includingsubadvisedmutualfunds)andprivateaccountswithsimilarmandatesthatareadvisedorsubadvisedbytheAdvisoranditsaffiliates.ManagementprovidedtheBoardwithinformationabouttheAdvisor’sresponsibilitiesandservicesprovidedtosubadvisoryandotherinstitutionalaccountclients,includinginformationabouthowtherequirementsandeconomicsoftheinstitutionalbusinessdifferfromthoseoftheAdvisor’sproprietarymutualfundbusiness.TheBoardconsideredinformationshowingthattheAdvisor’sproprietarymutualfundbusinessisgenerallymorecomplexfromabusinessandcomplianceperspectivethanitsinstitu-tionalaccountbusinessandconsideredvariousotherrelevantfactors,includingthebroaderscopeofoperationsandoversight,moreextensiveshareholdercommunicationinfrastructure,greaterassetflows,heightenedbusinessrisks,anddifferencesinapplicablelawsandregulationsassociatedwiththeAdvisor’sproprietarymutualfundbusiness.Inassessingthereasonablenessofthefund’smanagementfeerate,theBoardconsideredthedifferencesinthenatureoftheservicesrequiredfortheAdvisortomanageitsproprietarymutualfundbusinessversusmanagingadiscretepoolofassetsasasubadvisortoanotherinstitution’smutualfundorforanotherinstitutionalaccountandthedegreetowhichtheAdvisorperformssignificantadditionalservicesandassumesgreaterriskinmanagingthefundandotherT.RowePricemutualfunds than it does for institutional account clients.
Onthebasisoftheinformationprovidedandthefactorsconsidered,theBoardconcludedthatthefeespaidbythefundundertheAdvisoryContractarereasonable.
Approval of the Advisory Contract Asnoted,theBoardapprovedthecontinuationoftheAdvisoryContract.Nosinglefactorwasconsideredinisolationortobedeterminativetothedecision.Rather,theBoardconcluded,inlightofaweightingandbalancingofallfactorsconsidered,thatitwasinthebestinterestsofthefundanditsshareholdersfortheBoardtoapprovethecontinuationoftheAdvisoryContract(includingthefeestobechargedforservicesthereunder).Theindependentdirectorswereadvisedthroughouttheprocessbyindependentlegalcounsel.
T.RowePriceEquityIncomePortfolio

Proof #6
This page intentionally left blank.

Proof #6
This page intentionally left blank.

Proof #6
This page intentionally left blank.

Proof #6
2016-US-24591 E300-051 8/16
100EastPrattStreet Baltimore,MD21202

Proof #4
International Stock Portfolio
June 30, 2016
Semiannual Report
This report is authorized for distribution only to those who have received a copy of the portfolio’s prospectus.
T. Rowe Price Investment Services, Inc., Distributor.

Proof #4
T. Rowe Price International Stock Portfolio
Highlights
• Internationalstockswerevolatileandpostedlossesinthefirsthalfoftheyear.
•TheInternationalStockPortfoliodeclined0.68%duringthesixmonthsendedJune30,2016,whichwasinlinewiththeMSCIAllCountryWorldIndexexUSAandsignificantlybetterthanourLipperpeergroupaverage.
•Wearefocusedonbuyingandholdinggrowthcompanieswithdurablefranchisesthatcangeneratestableearningsandcashflowatadouble-digitrateoverthelongterm.
•Wearefindinghigh-qualitycompanieswithattractivegrowthprospects,althougheconomicgrowthinmanymarketsremains modest.
The views and opinions in this report were current as of June 30, 2016. They are not guarantees of performance or investment results and should not be taken as investment advice. Investment decisions reflect a variety of factors, and the managers reserve the right to change their views about individual stocks, sectors, and the markets at any time. As a result, the views expressed should not be relied upon as a forecast of the fund’s future investment intent. The report is certified under the Sarbanes-Oxley Act, which requires mutual funds and other public companies to affirm that, to the best of their knowledge, the information in their financial reports is fairly and accurately stated in all material respects.
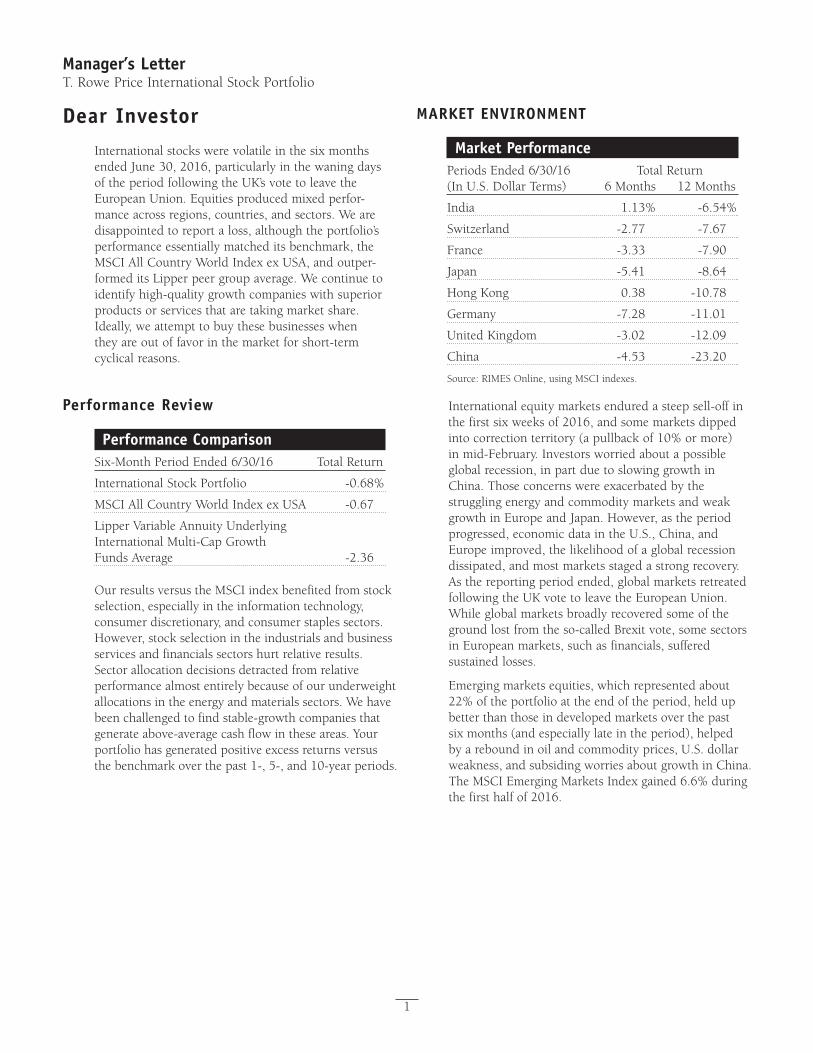
Proof #4
1
Manager’s LetterT. Rowe Price International Stock Portfolio
Dear InvestorInternationalstockswerevolatileinthesixmonthsendedJune30,2016,particularlyinthewaningdaysoftheperiodfollowingtheUK’svotetoleavetheEuropeanUnion.Equitiesproducedmixedperfor-manceacrossregions,countries,andsectors.Wearedisappointedtoreportaloss,althoughtheportfolio’sperformanceessentiallymatcheditsbenchmark,theMSCIAllCountryWorldIndexexUSA,andoutper-formeditsLipperpeergroupaverage.Wecontinuetoidentifyhigh-qualitygrowthcompanieswithsuperiorproductsorservicesthataretakingmarketshare.Ideally, we attempt to buy these businesses when theyareoutoffavorinthemarketforshort-termcyclical reasons.
Performance Review
Performance ComparisonSix-MonthPeriodEnded6/30/16 TotalReturn
InternationalStockPortfolio -0.68%
MSCIAllCountryWorldIndexexUSA -0.67
LipperVariableAnnuityUnderlying International Multi-Cap Growth FundsAverage -2.36
OurresultsversustheMSCIindexbenefitedfromstockselection,especiallyintheinformationtechnology,consumer discretionary, and consumer staples sectors. However,stockselectionintheindustrialsandbusinessservices and financials sectors hurt relative results. Sector allocation decisions detracted from relative performancealmostentirelybecauseofourunderweightallocationsintheenergyandmaterialssectors.Wehavebeenchallengedtofindstable-growthcompaniesthatgenerateabove-averagecashflowintheseareas.Yourportfoliohasgeneratedpositiveexcessreturnsversusthebenchmarkoverthepast1-,5-,and10-yearperiods.
MARKET ENVIRONMENT
Market PerformancePeriodsEnded6/30/16 TotalReturn(InU.S.DollarTerms) 6Months 12Months
India 1.13% -6.54%
Switzerland -2.77 -7.67
France -3.33 -7.90
Japan -5.41 -8.64
HongKong 0.38 -10.78
Germany -7.28 -11.01
UnitedKingdom -3.02 -12.09
China -4.53 -23.20
Source:RIMESOnline,usingMSCIindexes.
Internationalequitymarketsenduredasteepsell-offinthefirstsixweeksof2016,andsomemarketsdippedintocorrectionterritory(apullbackof10%ormore)in mid-February. Investors worried about a possible globalrecession,inpartduetoslowinggrowthinChina.ThoseconcernswereexacerbatedbythestrugglingenergyandcommoditymarketsandweakgrowthinEuropeandJapan.However,astheperiodprogressed,economicdataintheU.S.,China,andEuropeimproved,thelikelihoodofaglobalrecessiondissipated,andmostmarketsstagedastrongrecovery.Asthereportingperiodended,globalmarketsretreatedfollowingtheUKvotetoleavetheEuropeanUnion.Whileglobalmarketsbroadlyrecoveredsomeofthegroundlostfromtheso-calledBrexitvote,somesectorsinEuropeanmarkets,suchasfinancials,sufferedsustained losses.
Emergingmarketsequities,whichrepresentedabout22%oftheportfolioattheendoftheperiod,heldupbetterthanthoseindevelopedmarketsoverthepastsixmonths(andespeciallylateintheperiod),helpedbyareboundinoilandcommodityprices,U.S.dollarweakness,andsubsidingworriesaboutgrowthinChina.TheMSCIEmergingMarketsIndexgained6.6%duringthefirsthalfof2016.
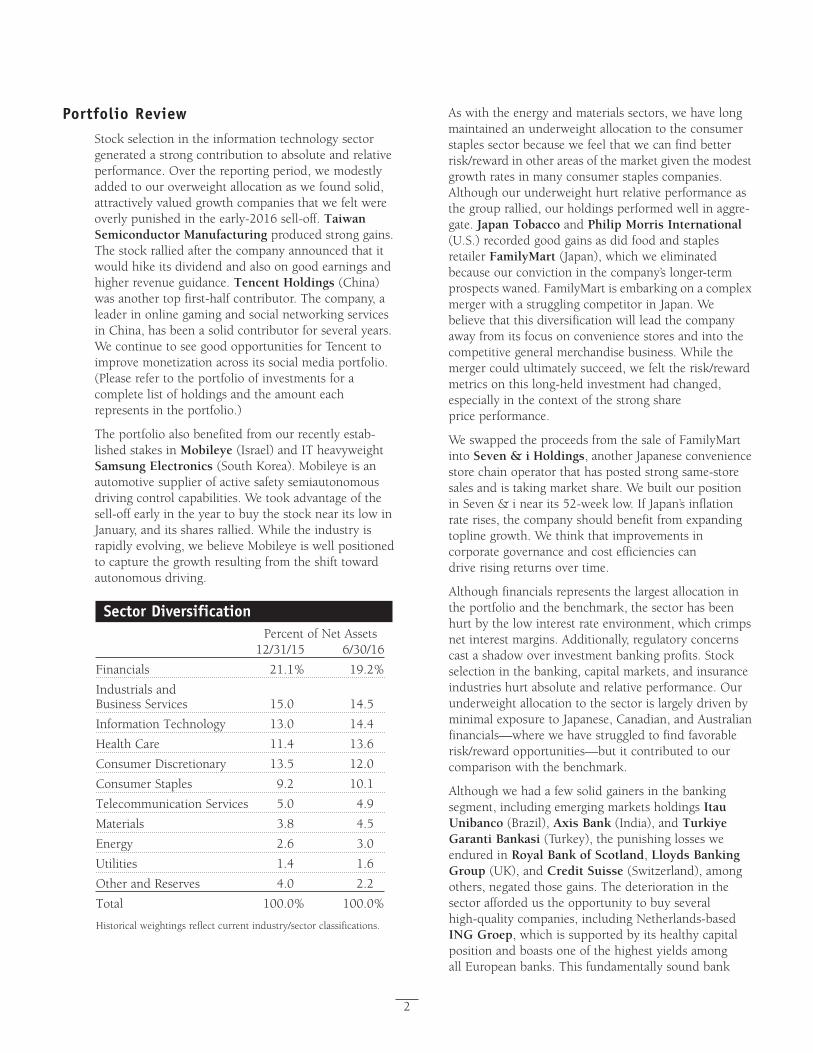
Proof #4
2
Portfolio ReviewStockselectionintheinformationtechnologysectorgeneratedastrongcontributiontoabsoluteandrelativeperformance.Overthereportingperiod,wemodestlyaddedtoouroverweightallocationaswefoundsolid,attractivelyvaluedgrowthcompaniesthatwefeltwereoverlypunishedintheearly-2016sell-off.Taiwan Semiconductor Manufacturingproducedstronggains.Thestockralliedafterthecompanyannouncedthatitwouldhikeitsdividendandalsoongoodearningsandhigherrevenueguidance.Tencent Holdings (China)was another top first-half contributor. The company, a leaderinonlinegamingandsocialnetworkingservicesin China, has been a solid contributor for several years. WecontinuetoseegoodopportunitiesforTencenttoimprove monetization across its social media portfolio. (Please refer to the portfolio of investments for a completelistofholdingsandtheamounteachrepresentsintheportfolio.)
The portfolio also benefited from our recently estab-lishedstakesinMobileye (Israel)andITheavyweightSamsung Electronics (SouthKorea).Mobileyeisanautomotive supplier of active safety semiautonomous drivingcontrolcapabilities.Wetookadvantageofthesell-offearlyintheyeartobuythestocknearitslowinJanuary,anditssharesrallied.Whiletheindustryisrapidlyevolving,webelieveMobileyeiswellpositionedtocapturethegrowthresultingfromtheshifttowardautonomousdriving.
Sector Diversification Percent of Net Assets 12/31/15 6/30/16
Financials 21.1% 19.2%
Industrials and BusinessServices 15.0 14.5
InformationTechnology 13.0 14.4
HealthCare 11.4 13.6
ConsumerDiscretionary 13.5 12.0
ConsumerStaples 9.2 10.1
TelecommunicationServices 5.0 4.9
Materials 3.8 4.5
Energy 2.6 3.0
Utilities 1.4 1.6
OtherandReserves 4.0 2.2
Total 100.0% 100.0%
Historicalweightingsreflectcurrentindustry/sectorclassifications.
Aswiththeenergyandmaterialssectors,wehavelongmaintainedanunderweightallocationtotheconsumerstaples sector because we feel that we can find better risk/rewardinotherareasofthemarketgiventhemodestgrowthratesinmanyconsumerstaplescompanies.Althoughourunderweighthurtrelativeperformanceasthegrouprallied,ourholdingsperformedwellinaggre-gate.Japan Tobacco and Philip Morris International (U.S.)recordedgoodgainsasdidfoodandstaplesretailer FamilyMart (Japan),whichweeliminatedbecauseourconvictioninthecompany’slonger-termprospectswaned.FamilyMartisembarkingonacomplexmergerwithastrugglingcompetitorinJapan.Webelieve that this diversification will lead the company away from its focus on convenience stores and into the competitivegeneralmerchandisebusiness.Whilethemergercouldultimatelysucceed,wefelttherisk/rewardmetricsonthislong-heldinvestmenthadchanged,especiallyinthecontextofthestrongshareprice performance.
We swapped the proceeds from the sale of FamilyMart into Seven & i Holdings,anotherJapaneseconveniencestorechainoperatorthathaspostedstrongsame-storesalesandistakingmarketshare.WebuiltourpositioninSeven&inearits52-weeklow.IfJapan’sinflationraterises,thecompanyshouldbenefitfromexpandingtoplinegrowth.Wethinkthatimprovementsincorporategovernanceandcostefficienciescandriverisingreturnsovertime.
Althoughfinancialsrepresentsthelargestallocationintheportfolioandthebenchmark,thesectorhasbeenhurt by the low interest rate environment, which crimps netinterestmargins.Additionally,regulatoryconcernscastashadowoverinvestmentbankingprofits.Stockselectioninthebanking,capitalmarkets,andinsuranceindustries hurt absolute and relative performance. Our underweightallocationtothesectorislargelydrivenbyminimalexposuretoJapanese,Canadian,andAustralianfinancials—wherewehavestruggledtofindfavorablerisk/rewardopportunities—butitcontributedtoourcomparisonwiththebenchmark.
Althoughwehadafewsolidgainersinthebankingsegment,includingemergingmarketsholdings Itau Unibanco(Brazil),Axis Bank(India),andTurkiye Garanti Bankasi(Turkey),thepunishinglossesweendured in Royal Bank of Scotland, Lloyds Banking Group (UK), and Credit Suisse (Switzerland),amongothers,negatedthosegains.Thedeteriorationinthesector afforded us the opportunity to buy several high-qualitycompanies,includingNetherlands-basedING Groep, which is supported by its healthy capital positionandboastsoneofthehighestyieldsamongallEuropeanbanks.Thisfundamentallysoundbank
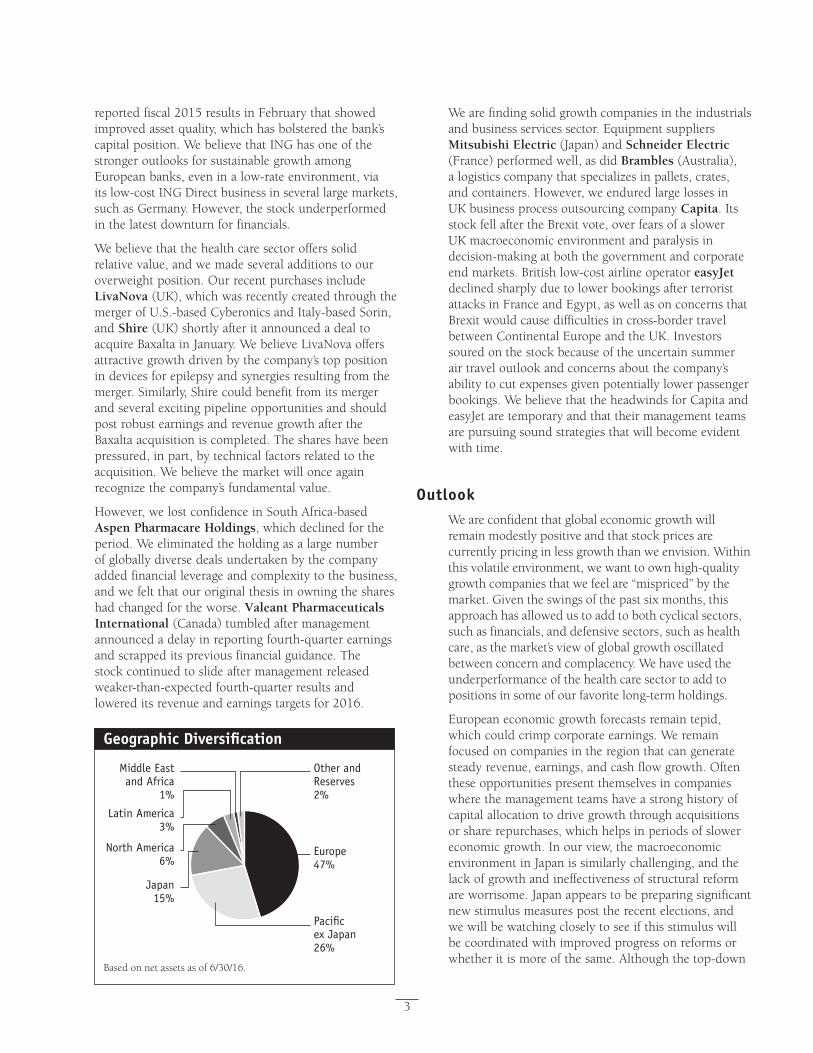
Proof #4
3
reportedfiscal2015resultsinFebruarythatshowedimprovedassetquality,whichhasbolsteredthebank’scapital position. We believe that ING has one of the strongeroutlooksforsustainablegrowthamongEuropeanbanks,eveninalow-rateenvironment,viaitslow-costINGDirectbusinessinseverallargemarkets,suchasGermany.However,thestockunderperformedin the latest downturn for financials.
We believe that the health care sector offers solid relative value, and we made several additions to our overweightposition.OurrecentpurchasesincludeLivaNova (UK),whichwasrecentlycreatedthroughthemergerofU.S.-basedCyberonicsandItaly-basedSorin,and Shire(UK)shortlyafteritannouncedadealtoacquireBaxaltainJanuary.WebelieveLivaNovaoffersattractivegrowthdrivenbythecompany’stoppositionindevicesforepilepsyandsynergiesresultingfromthemerger.Similarly,ShirecouldbenefitfromitsmergerandseveralexcitingpipelineopportunitiesandshouldpostrobustearningsandrevenuegrowthaftertheBaxaltaacquisitioniscompleted.Theshareshavebeenpressured, in part, by technical factors related to the acquisition.Webelievethemarketwillonceagainrecognizethecompany’sfundamentalvalue.
However, we lost confidence in South Africa-based Aspen Pharmacare Holdings, which declined for the period.Weeliminatedtheholdingasalargenumberofgloballydiversedealsundertakenbythecompanyaddedfinancialleverageandcomplexitytothebusiness,andwefeltthatouroriginalthesisinowningtheshareshadchangedfortheworse.Valeant Pharmaceuticals International (Canada) tumbledaftermanagementannouncedadelayinreportingfourth-quarterearningsandscrappeditspreviousfinancialguidance.Thestockcontinuedtoslideaftermanagementreleasedweaker-than-expectedfourth-quarterresultsandlowereditsrevenueandearningstargetsfor2016.
Geographic Diversification
Based on net assets as of 6/30/16.
Europe 47%
Latin America3%
Japan15%
Other and Reserves2%
Pacific ex Japan 26%
North America6%
Middle Eastand Africa
1%
Wearefindingsolidgrowthcompaniesintheindustrialsandbusinessservicessector.EquipmentsuppliersMitsubishi Electric(Japan)andSchneider Electric (France)performedwell,asdidBrambles (Australia),alogisticscompanythatspecializesinpallets,crates,andcontainers.However,weenduredlargelossesinUKbusinessprocessoutsourcingcompanyCapita. Its stockfellaftertheBrexitvote,overfearsofaslowerUKmacroeconomicenvironmentandparalysisindecision-makingatboththegovernmentandcorporateendmarkets.Britishlow-costairlineoperatoreasyJet declinedsharplyduetolowerbookingsafterterroristattacksinFranceandEgypt,aswellasonconcernsthatBrexitwouldcausedifficultiesincross-bordertravelbetweenContinentalEuropeandtheUK.Investorssouredonthestockbecauseoftheuncertainsummerairtraveloutlookandconcernsaboutthecompany’sabilitytocutexpensesgivenpotentiallylowerpassengerbookings.WebelievethattheheadwindsforCapitaandeasyJetaretemporaryandthattheirmanagementteamsarepursuingsoundstrategiesthatwillbecomeevidentwith time.
OutlookWeareconfidentthatglobaleconomicgrowthwillremainmodestlypositiveandthatstockpricesarecurrentlypricinginlessgrowththanweenvision.Withinthisvolatileenvironment,wewanttoownhigh-qualitygrowthcompaniesthatwefeelare“mispriced”bythemarket.Giventheswingsofthepastsixmonths,thisapproach has allowed us to add to both cyclical sectors, such as financials, and defensive sectors, such as health care,asthemarket’sviewofglobalgrowthoscillatedbetween concern and complacency. We have used the underperformance of the health care sector to add to positionsinsomeofourfavoritelong-termholdings.
Europeaneconomicgrowthforecastsremaintepid,whichcouldcrimpcorporateearnings.Weremainfocusedoncompaniesintheregionthatcangeneratesteadyrevenue,earnings,andcashflowgrowth.Oftenthese opportunities present themselves in companies wherethemanagementteamshaveastronghistoryofcapitalallocationtodrivegrowththroughacquisitionsor share repurchases, which helps in periods of slower economicgrowth.Inourview,themacroeconomicenvironmentinJapanissimilarlychallenging,andthelackofgrowthandineffectivenessofstructuralreformareworrisome.Japanappearstobepreparingsignificantnew stimulus measures post the recent elections, and wewillbewatchingcloselytoseeifthisstimuluswillbecoordinatedwithimprovedprogressonreformsorwhetheritismoreofthesame.Althoughthetop-down

Proof #4
4
environmentinJapanhasbeendisappointing,wecontinuetofindselectJapanesecompanieswithabove-averagegrowthprospectstradingatattractive valuations.
Emergingmarketsremainadisparateassetclassinterms of economic performance, as some have suffered from the commodity downturn while others have benefited.However,thesharpbouncebackinseveralemergingmarkets,especiallyBrazil,hasreducedtheattractiveopportunitysetwefoundayearago.Manyofouremergingmarketsholdingsgeneratedsolidgrowthandhavepostedamongthehighestreturnson capital in the entire portfolio. Despite the difficult marketenvironment,westillbelievethattherearegoodlong-termopportunitiesinemergingmarkets.
Asalways,wewillcontinuetoworkdiligentlyonyourbehalf.ThankyouforyoursupportandconfidenceinT. Rowe Price.
Respectfully submitted,
RichardN.ClattenburgChairman of the Investment Advisory Committee
July11,2016
The committee chairman has day-to-day responsibility for managing the portfolio and works with committee members in developing and executing its investment program.
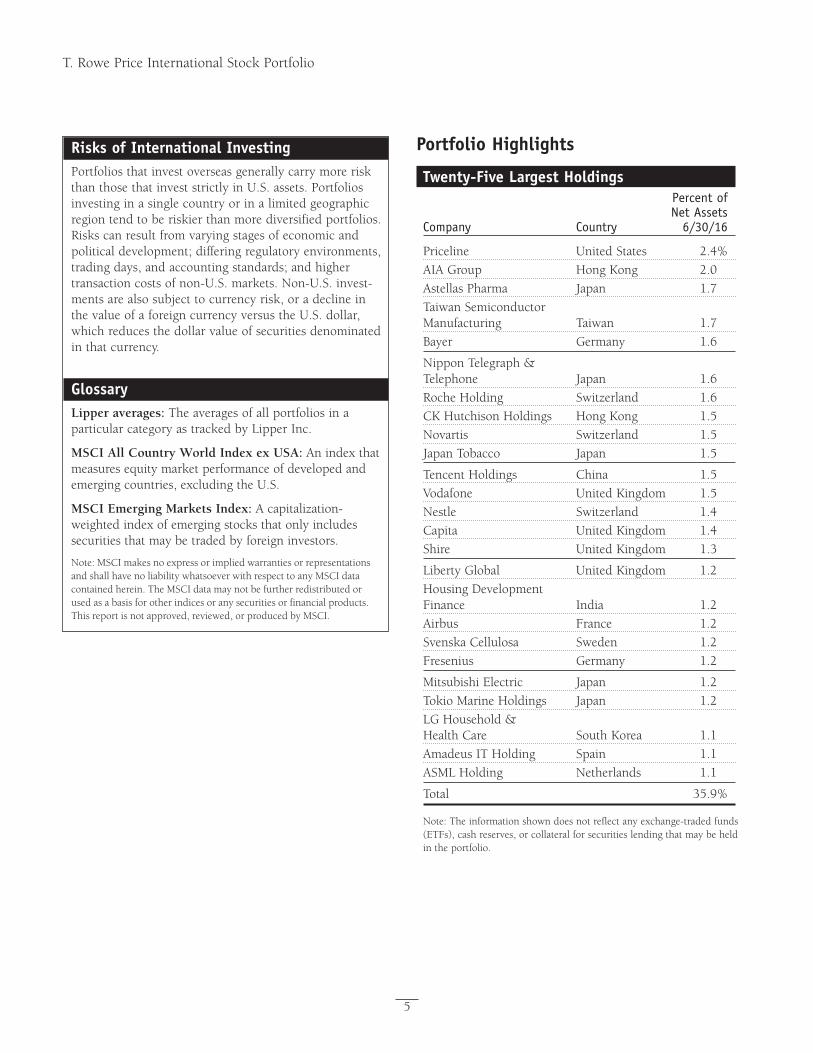
Proof #4
5
T. Rowe Price International Stock Portfolio
Risks of International InvestingPortfoliosthatinvestoverseasgenerallycarrymoreriskthanthosethatinveststrictlyinU.S.assets.Portfoliosinvestinginasinglecountryorinalimitedgeographicregiontendtoberiskierthanmorediversifiedportfolios.Riskscanresultfromvaryingstagesofeconomicandpoliticaldevelopment;differingregulatoryenvironments,tradingdays,andaccountingstandards;andhighertransactioncostsofnon-U.S.markets.Non-U.S.invest-mentsarealsosubjecttocurrencyrisk,oradeclineinthevalueofaforeigncurrencyversustheU.S.dollar,which reduces the dollar value of securities denominated in that currency.
GlossaryLipper averages: TheaveragesofallportfoliosinaparticularcategoryastrackedbyLipperInc.
MSCI All Country World Index ex USA:Anindexthatmeasuresequitymarketperformanceofdevelopedandemergingcountries,excludingtheU.S.
MSCI Emerging Markets Index: A capitalization-weightedindexofemergingstocksthatonlyincludessecuritiesthatmaybetradedbyforeigninvestors.
Note:MSCImakesnoexpressorimpliedwarrantiesorrepresentationsand shall have no liability whatsoever with respect to any MSCI data contained herein. The MSCI data may not be further redistributed or used as a basis for other indices or any securities or financial products. This report is not approved, reviewed, or produced by MSCI.
Portfolio Highlights
Twenty-Five Largest Holdings Percent of Net AssetsCompany Country 6/30/16
Priceline UnitedStates 2.4%
AIAGroup HongKong 2.0
AstellasPharma Japan 1.7
Taiwan Semiconductor Manufacturing Taiwan 1.7
Bayer Germany 1.6
NipponTelegraph& Telephone Japan 1.6
RocheHolding Switzerland 1.6
CKHutchisonHoldings HongKong 1.5
Novartis Switzerland 1.5
JapanTobacco Japan 1.5
TencentHoldings China 1.5
Vodafone UnitedKingdom 1.5
Nestle Switzerland 1.4
Capita UnitedKingdom 1.4
Shire UnitedKingdom 1.3
LibertyGlobal UnitedKingdom 1.2
HousingDevelopment Finance India 1.2
Airbus France 1.2
SvenskaCellulosa Sweden 1.2
Fresenius Germany 1.2
MitsubishiElectric Japan 1.2
TokioMarineHoldings Japan 1.2
LGHousehold& HealthCare SouthKorea 1.1
AmadeusITHolding Spain 1.1
ASMLHolding Netherlands 1.1
Total 35.9%
Note:Theinformationshowndoesnotreflectanyexchange-tradedfunds(ETFs),cashreserves,orcollateralforsecuritieslendingthatmaybeheldin the portfolio.
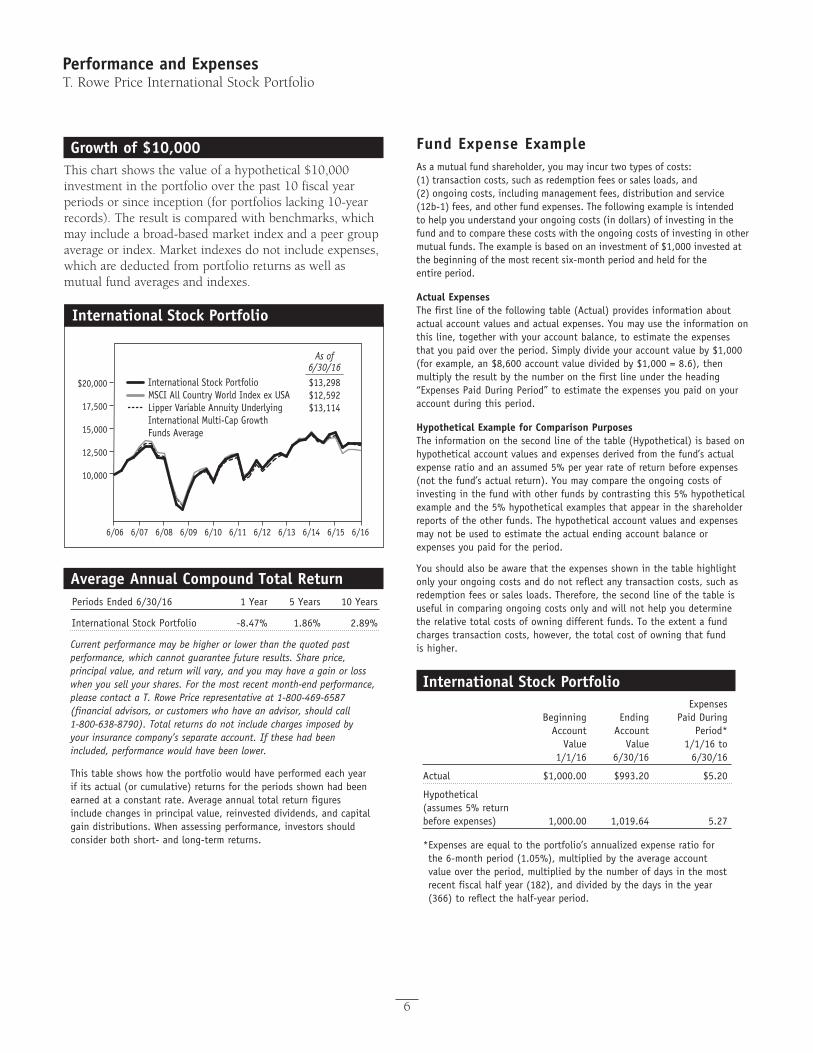
Proof #4
Performance and ExpensesT. Rowe Price International Stock Portfolio
6
Growth of $10,000Thischartshowsthevalueofahypothetical$10,000investmentintheportfoliooverthepast10fiscalyearperiodsorsinceinception(forportfolioslacking10-yearrecords).Theresultiscomparedwithbenchmarks,whichmayincludeabroad-basedmarketindexandapeergroupaverageorindex.Marketindexesdonotincludeexpenses,which are deducted from portfolio returns as well as mutualfundaveragesandindexes.
International Stock Portfolio
International Stock PortfolioMSCI All Country World Index ex USALipper Variable Annuity UnderlyingInternational Multi-Cap GrowthFunds Average
As of6/30/16________$13,298$12,592$13,114
10,000
12,500
15,000
17,500
$20,000
6/166/156/146/136/126/116/106/096/086/076/06
Average Annual Compound Total ReturnPeriods Ended 6/30/16 1 Year 5 Years 10 Years
International Stock Portfolio -8.47% 1.86% 2.89%
Current performance may be higher or lower than the quoted past performance, which cannot guarantee future results. Share price, principal value, and return will vary, and you may have a gain or loss when you sell your shares. For the most recent month-end performance, please contact a T. Rowe Price representative at 1-800-469-6587 (financial advisors, or customers who have an advisor, should call 1-800-638-8790). Total returns do not include charges imposed by your insurance company’s separate account. If these had been included, performance would have been lower.
This table shows how the portfolio would have performed each year if its actual (or cumulative) returns for the periods shown had been earned at a constant rate. Average annual total return figures include changes in principal value, reinvested dividends, and capital gain distributions. When assessing performance, investors should consider both short- and long-term returns.
Fund Expense ExampleAs a mutual fund shareholder, you may incur two types of costs: (1) transaction costs, such as redemption fees or sales loads, and (2) ongoing costs, including management fees, distribution and service (12b-1) fees, and other fund expenses. The following example is intended to help you understand your ongoing costs (in dollars) of investing in the fund and to compare these costs with the ongoing costs of investing in other mutual funds. The example is based on an investment of $1,000 invested at the beginning of the most recent six-month period and held for the entire period.
Actual ExpensesThe first line of the following table (Actual) provides information about actual account values and actual expenses. You may use the information on this line, together with your account balance, to estimate the expenses that you paid over the period. Simply divide your account value by $1,000 (for example, an $8,600 account value divided by $1,000 = 8.6), then multiply the result by the number on the first line under the heading “Expenses Paid During Period” to estimate the expenses you paid on your account during this period.
Hypothetical Example for Comparison PurposesThe information on the second line of the table (Hypothetical) is based on hypothetical account values and expenses derived from the fund’s actual expense ratio and an assumed 5% per year rate of return before expenses (not the fund’s actual return). You may compare the ongoing costs of investing in the fund with other funds by contrasting this 5% hypothetical example and the 5% hypothetical examples that appear in the shareholder reports of the other funds. The hypothetical account values and expenses may not be used to estimate the actual ending account balance or expenses you paid for the period.
You should also be aware that the expenses shown in the table highlight only your ongoing costs and do not reflect any transaction costs, such as redemption fees or sales loads. Therefore, the second line of the table is useful in comparing ongoing costs only and will not help you determine the relative total costs of owning different funds. To the extent a fund charges transaction costs, however, the total cost of owning that fund is higher.
International Stock Portfolio Expenses Beginning Ending Paid During Account Account Period* Value Value 1/1/16 to 1/1/16 6/30/16 6/30/16
Actual $1,000.00 $993.20 $5.20
Hypothetical (assumes 5% return before expenses) 1,000.00 1,019.64 5.27
* Expenses are equal to the portfolio’s annualized expense ratio for the 6-month period (1.05%), multiplied by the average account value over the period, multiplied by the number of days in the most recent fiscal half year (182), and divided by the days in the year (366) to reflect the half-year period.
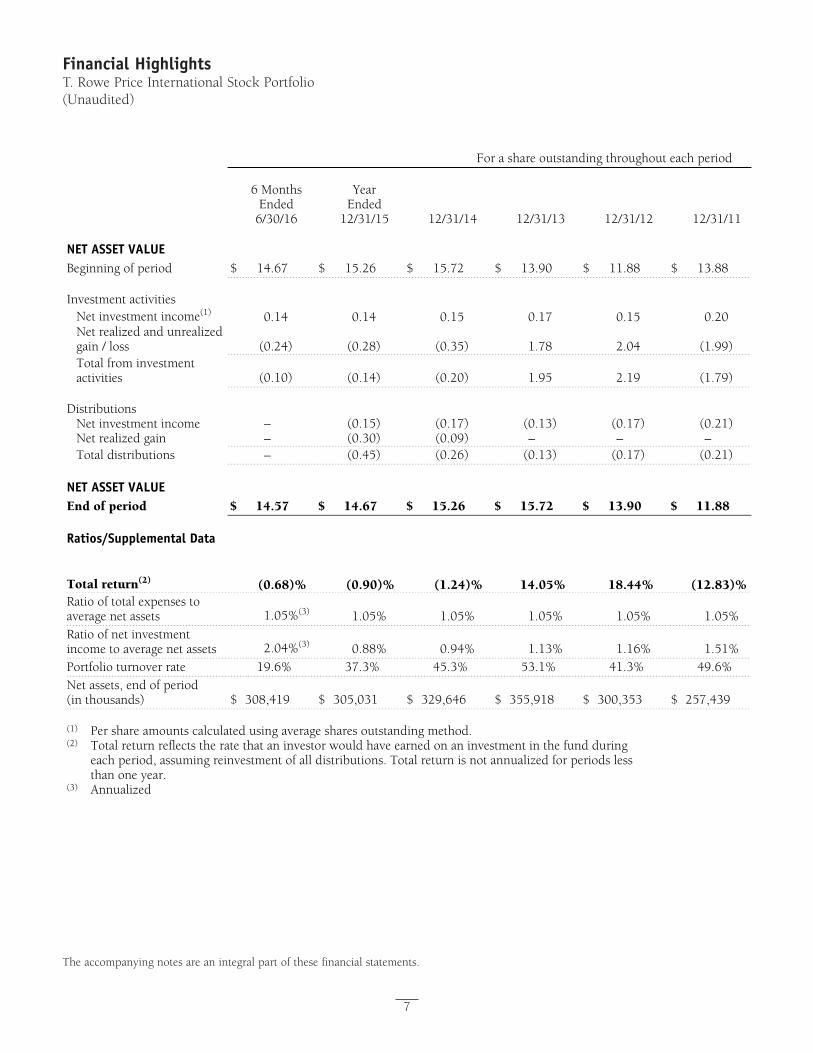
Proof #4
7
Financial HighlightsT. Rowe Price International Stock Portfolio(Unaudited)
The accompanying notes are an integral part of these financial statements.
For a share outstanding throughout each period
6 Months Ended
6/30/16
Year Ended
12/31/15 12/31/14 12/31/13 12/31/12 12/31/11
NET ASSET VALUE
Beginning of period $ 14.67 $ 15.26 $ 15.72 $ 13.90 $ 11.88 $ 13.88 Investment activities
Net investment income(1) 0.14 0.14 0.15 0.17 0.15 0.20
Net realized and unrealized gain / loss (0.24) (0.28) (0.35) 1.78 2.04 (1.99)
Total from investment activities (0.10) (0.14) (0.20) 1.95 2.19 (1.79)
Distributions
Net investment income – (0.15) (0.17) (0.13) (0.17) (0.21)Net realized gain – (0.30) (0.09) – – –Total distributions – (0.45) (0.26) (0.13) (0.17) (0.21)
NET ASSET VALUE
End of period $ 14.57 $ 14.67 $ 15.26 $ 15.72 $ 13.90 $ 11.88 Ratios/Supplemental Data
Total return(2) (0.68)% (0.90)% (1.24)% 14.05% 18.44% (12.83)%
Ratio of total expenses to average net assets 1.05%(3) 1.05% 1.05% 1.05% 1.05% 1.05%
Ratio of net investment income to average net assets 2.04%(3) 0.88% 0.94% 1.13% 1.16% 1.51%
Portfolio turnover rate 19.6% 37.3% 45.3% 53.1% 41.3% 49.6%Net assets, end of period (in thousands) $ 308,419 $ 305,031 $ 329,646 $ 355,918 $ 300,353 $ 257,439
(1) Per share amounts calculated using average shares outstanding method.(2) Total return reflects the rate that an investor would have earned on an investment in the fund during
each period, assuming reinvestment of all distributions. Total return is not annualized for periods less than one year.
(3) Annualized
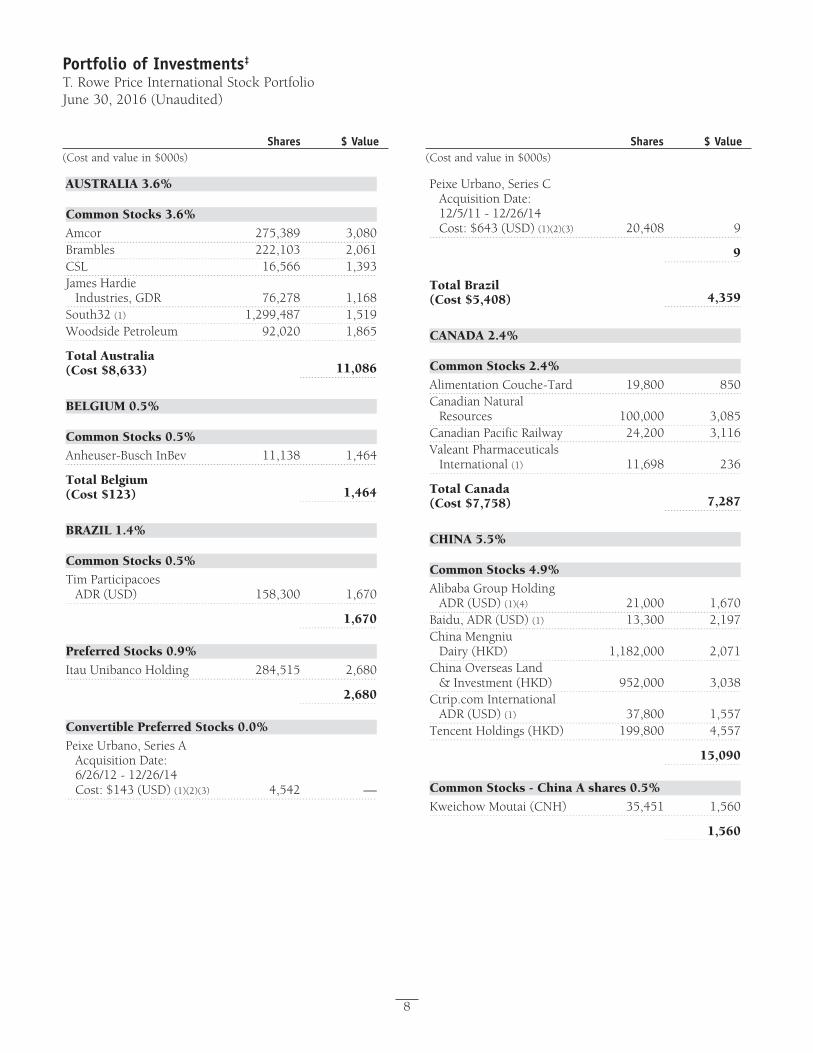
Proof #4
Portfolio of Investments‡
T. Rowe Price International Stock PortfolioJune 30, 2016 (Unaudited)
Shares $ Value(Cost and value in $000s)
Shares $ Value(Cost and value in $000s)
8
AUSTRALIA 3.6%
Common Stocks 3.6%
Amcor 275,389 3,080Brambles 222,103 2,061CSL 16,566 1,393James Hardie
Industries, GDR 76,278 1,168South32 (1) 1,299,487 1,519Woodside Petroleum 92,020 1,865
Total Australia (Cost $8,633) 11,086
BELGIUM 0.5%
Common Stocks 0.5%
Anheuser-Busch InBev 11,138 1,464
Total Belgium (Cost $123) 1,464
BRAZIL 1.4%
Common Stocks 0.5%
Tim Participacoes ADR (USD) 158,300 1,670
1,670
Preferred Stocks 0.9%
Itau Unibanco Holding 284,515 2,680
2,680
Convertible Preferred Stocks 0.0%
Peixe Urbano, Series A Acquisition Date: 6/26/12 - 12/26/14 Cost: $143 (USD) (1)(2)(3) 4,542 —
Peixe Urbano, Series CAcquisition Date: 12/5/11 - 12/26/14 Cost: $643 (USD) (1)(2)(3) 20,408 9
9
Total Brazil (Cost $5,408) 4,359
CANADA 2.4%
Common Stocks 2.4%
Alimentation Couche-Tard 19,800 850Canadian Natural
Resources 100,000 3,085Canadian Pacific Railway 24,200 3,116Valeant Pharmaceuticals
International (1) 11,698 236
Total Canada (Cost $7,758) 7,287
CHINA 5.5%
Common Stocks 4.9%
Alibaba Group HoldingADR (USD) (1)(4) 21,000 1,670
Baidu, ADR (USD) (1) 13,300 2,197China Mengniu
Dairy (HKD) 1,182,000 2,071China Overseas Land
& Investment (HKD) 952,000 3,038Ctrip.com International
ADR (USD) (1) 37,800 1,557Tencent Holdings (HKD) 199,800 4,557
15,090
Common Stocks - China A shares 0.5%
Kweichow Moutai (CNH) 35,451 1,560
1,560
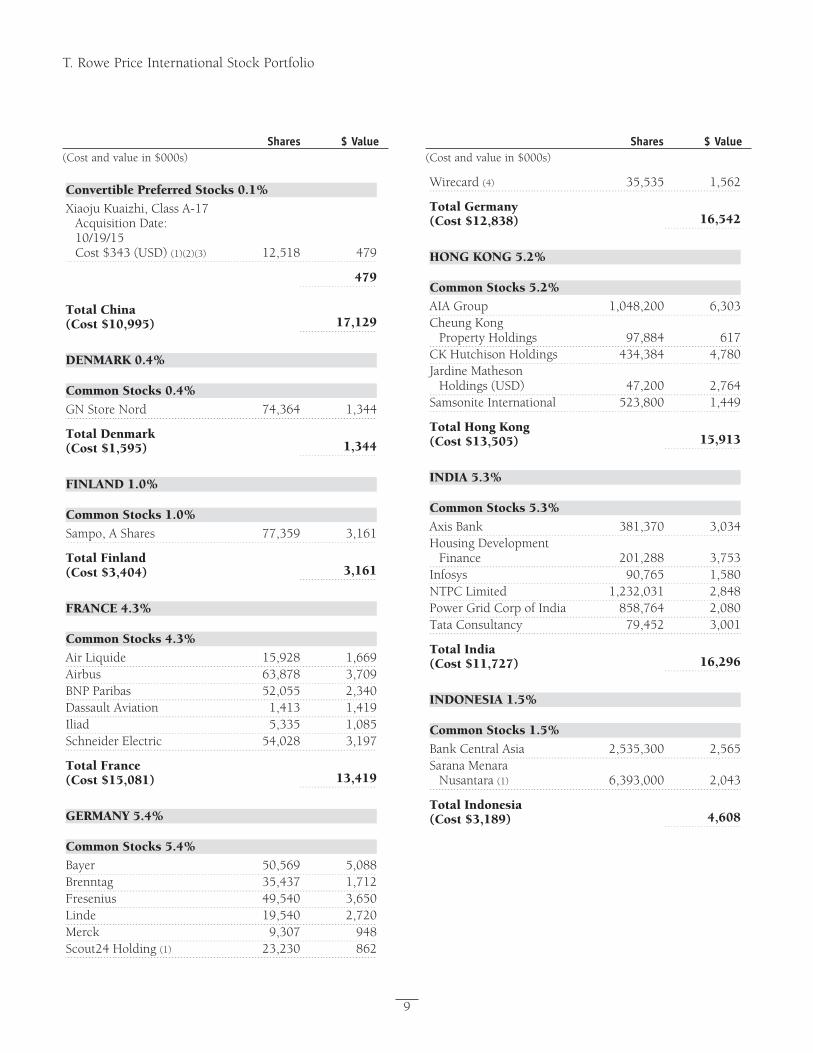
Proof #4
T. Rowe Price International Stock Portfolio
Shares $ Value(Cost and value in $000s)
Shares $ Value(Cost and value in $000s)
9
Convertible Preferred Stocks 0.1%
Xiaoju Kuaizhi, Class A-17 Acquisition Date: 10/19/15 Cost $343 (USD) (1)(2)(3) 12,518 479
479
Total China (Cost $10,995) 17,129
DENMARK 0.4%
Common Stocks 0.4%
GN Store Nord 74,364 1,344
Total Denmark (Cost $1,595) 1,344
FINLAND 1.0%
Common Stocks 1.0%
Sampo, A Shares 77,359 3,161
Total Finland (Cost $3,404) 3,161
FRANCE 4.3%
Common Stocks 4.3%
Air Liquide 15,928 1,669Airbus 63,878 3,709BNP Paribas 52,055 2,340Dassault Aviation 1,413 1,419Iliad 5,335 1,085Schneider Electric 54,028 3,197
Total France (Cost $15,081) 13,419
GERMANY 5.4%
Common Stocks 5.4%
Bayer 50,569 5,088Brenntag 35,437 1,712Fresenius 49,540 3,650Linde 19,540 2,720Merck 9,307 948Scout24 Holding (1) 23,230 862
Wirecard (4) 35,535 1,562
Total Germany (Cost $12,838) 16,542
HONG KONG 5.2%
Common Stocks 5.2%
AIA Group 1,048,200 6,303Cheung Kong
Property Holdings 97,884 617CK Hutchison Holdings 434,384 4,780Jardine Matheson
Holdings (USD) 47,200 2,764Samsonite International 523,800 1,449
Total Hong Kong (Cost $13,505) 15,913
INDIA 5.3%
Common Stocks 5.3%
Axis Bank 381,370 3,034Housing Development
Finance 201,288 3,753Infosys 90,765 1,580NTPC Limited 1,232,031 2,848Power Grid Corp of India 858,764 2,080Tata Consultancy 79,452 3,001
Total India (Cost $11,727) 16,296
INDONESIA 1.5%
Common Stocks 1.5%
Bank Central Asia 2,535,300 2,565Sarana Menara
Nusantara (1) 6,393,000 2,043
Total Indonesia (Cost $3,189) 4,608
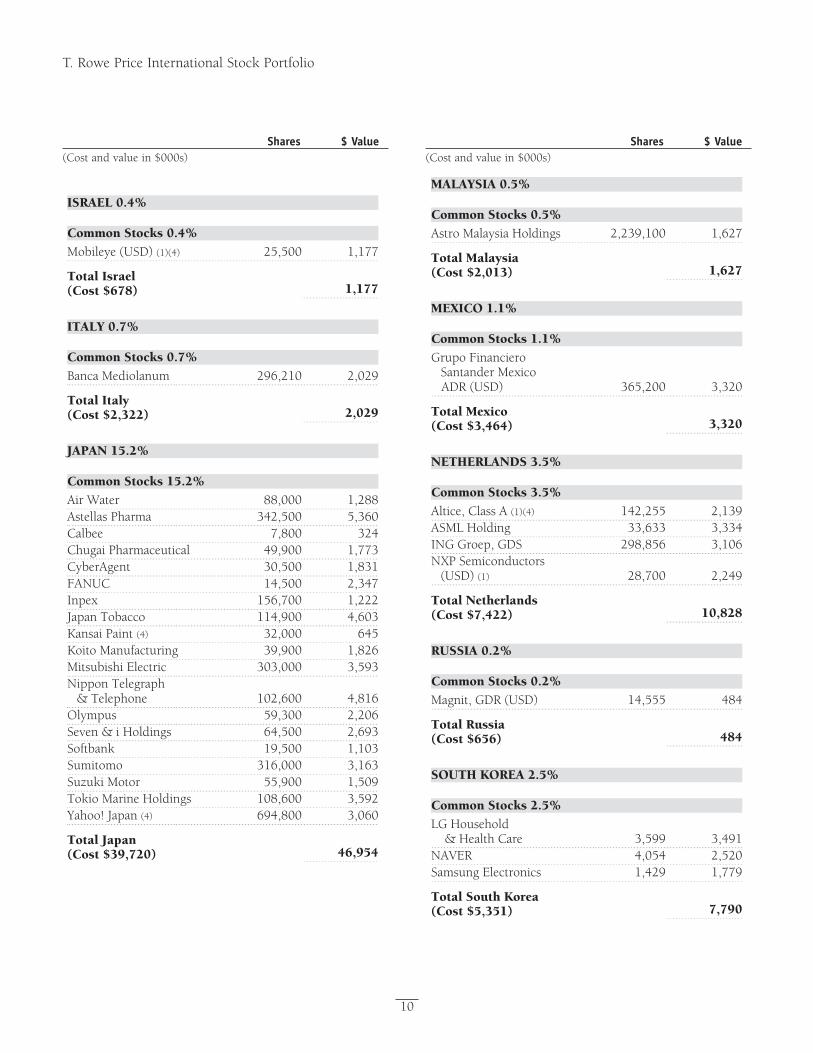
Proof #4
T. Rowe Price International Stock Portfolio
Shares $ Value(Cost and value in $000s)
Shares $ Value(Cost and value in $000s)
10
ISRAEL 0.4%
Common Stocks 0.4%
Mobileye (USD) (1)(4) 25,500 1,177
Total Israel (Cost $678) 1,177
ITALY 0.7%
Common Stocks 0.7%
Banca Mediolanum 296,210 2,029
Total Italy (Cost $2,322) 2,029
JAPAN 15.2%
Common Stocks 15.2%
Air Water 88,000 1,288Astellas Pharma 342,500 5,360Calbee 7,800 324Chugai Pharmaceutical 49,900 1,773CyberAgent 30,500 1,831FANUC 14,500 2,347Inpex 156,700 1,222Japan Tobacco 114,900 4,603Kansai Paint (4) 32,000 645Koito Manufacturing 39,900 1,826Mitsubishi Electric 303,000 3,593Nippon Telegraph
& Telephone 102,600 4,816Olympus 59,300 2,206Seven & i Holdings 64,500 2,693Softbank 19,500 1,103Sumitomo 316,000 3,163Suzuki Motor 55,900 1,509Tokio Marine Holdings 108,600 3,592Yahoo! Japan (4) 694,800 3,060
Total Japan (Cost $39,720) 46,954
MALAYSIA 0.5%
Common Stocks 0.5%
Astro Malaysia Holdings 2,239,100 1,627
Total Malaysia (Cost $2,013) 1,627
MEXICO 1.1%
Common Stocks 1.1%
Grupo Financiero Santander Mexico
ADR (USD) 365,200 3,320
Total Mexico (Cost $3,464) 3,320
NETHERLANDS 3.5%
Common Stocks 3.5%
Altice, Class A (1)(4) 142,255 2,139ASML Holding 33,633 3,334ING Groep, GDS 298,856 3,106NXP Semiconductors
(USD) (1) 28,700 2,249
Total Netherlands (Cost $7,422) 10,828
RUSSIA 0.2%
Common Stocks 0.2%
Magnit, GDR (USD) 14,555 484
Total Russia (Cost $656) 484
SOUTH KOREA 2.5%
Common Stocks 2.5%
LG Household & Health Care 3,599 3,491NAVER 4,054 2,520Samsung Electronics 1,429 1,779
Total South Korea (Cost $5,351) 7,790
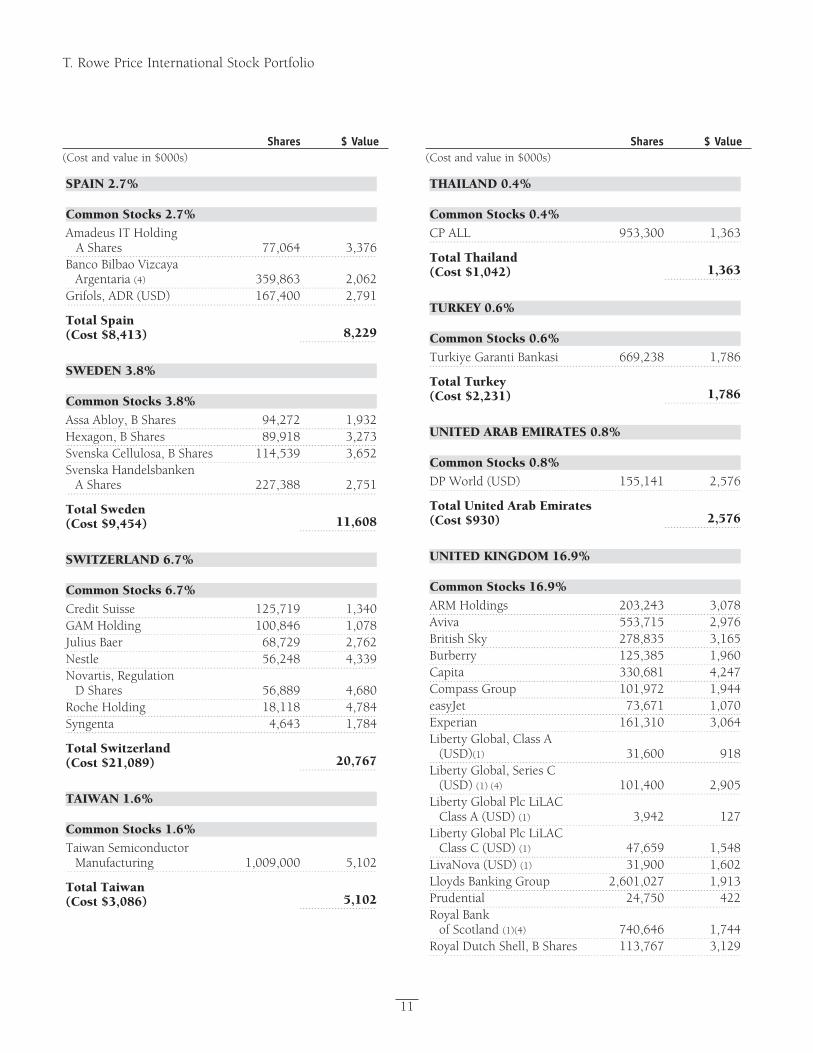
Proof #4
T. Rowe Price International Stock Portfolio
Shares $ Value(Cost and value in $000s)
Shares $ Value(Cost and value in $000s)
11
SPAIN 2.7%
Common Stocks 2.7%
Amadeus IT Holding A Shares 77,064 3,376Banco Bilbao Vizcaya
Argentaria (4) 359,863 2,062Grifols, ADR (USD) 167,400 2,791
Total Spain (Cost $8,413) 8,229
SWEDEN 3.8%
Common Stocks 3.8%
Assa Abloy, B Shares 94,272 1,932Hexagon, B Shares 89,918 3,273Svenska Cellulosa, B Shares 114,539 3,652Svenska Handelsbanken
A Shares 227,388 2,751
Total Sweden (Cost $9,454) 11,608
SWITZERLAND 6.7%
Common Stocks 6.7%
Credit Suisse 125,719 1,340GAM Holding 100,846 1,078Julius Baer 68,729 2,762Nestle 56,248 4,339Novartis, Regulation
D Shares 56,889 4,680Roche Holding 18,118 4,784Syngenta 4,643 1,784
Total Switzerland (Cost $21,089) 20,767
TAIWAN 1.6%
Common Stocks 1.6%
Taiwan Semiconductor Manufacturing 1,009,000 5,102
Total Taiwan (Cost $3,086) 5,102
THAILAND 0.4%
Common Stocks 0.4%
CP ALL 953,300 1,363
Total Thailand (Cost $1,042) 1,363
TURKEY 0.6%
Common Stocks 0.6%
Turkiye Garanti Bankasi 669,238 1,786
Total Turkey (Cost $2,231) 1,786
UNITED ARAB EMIRATES 0.8%
Common Stocks 0.8%
DP World (USD) 155,141 2,576
Total United Arab Emirates (Cost $930) 2,576
UNITED KINGDOM 16.9%
Common Stocks 16.9%
ARM Holdings 203,243 3,078Aviva 553,715 2,976British Sky 278,835 3,165Burberry 125,385 1,960Capita 330,681 4,247Compass Group 101,972 1,944easyJet 73,671 1,070Experian 161,310 3,064Liberty Global, Class A
(USD)(1) 31,600 918Liberty Global, Series C
(USD) (1) (4) 101,400 2,905Liberty Global Plc LiLAC
Class A (USD) (1) 3,942 127Liberty Global Plc LiLAC
Class C (USD) (1) 47,659 1,548LivaNova (USD) (1) 31,900 1,602Lloyds Banking Group 2,601,027 1,913Prudential 24,750 422Royal Bank
of Scotland (1)(4) 740,646 1,744Royal Dutch Shell, B Shares 113,767 3,129
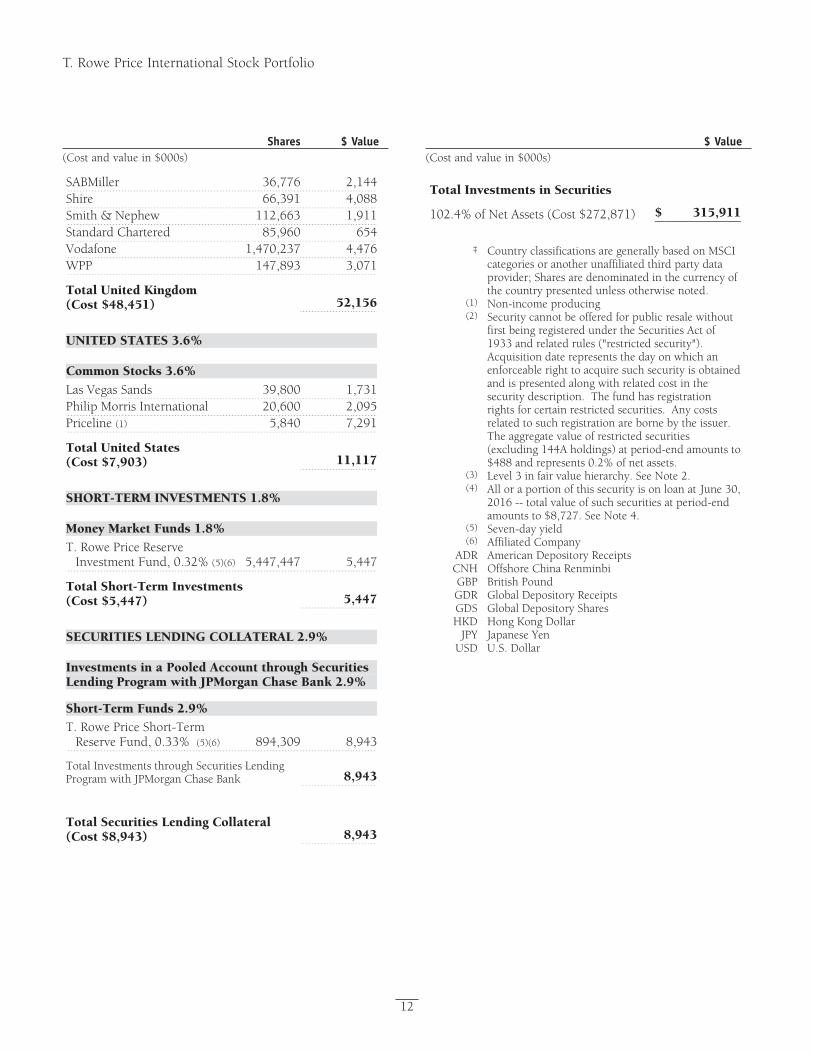
Proof #4
T. Rowe Price International Stock Portfolio
Shares $ Value(Cost and value in $000s)
12
$ Value(Costandvaluein$000s)
SABMiller 36,776 2,144Shire 66,391 4,088Smith & Nephew 112,663 1,911Standard Chartered 85,960 654Vodafone 1,470,237 4,476WPP 147,893 3,071
Total United Kingdom (Cost $48,451) 52,156
UNITED STATES 3.6%
Common Stocks 3.6%
Las Vegas Sands 39,800 1,731Philip Morris International 20,600 2,095Priceline (1) 5,840 7,291
Total United States (Cost $7,903) 11,117
SHORT-TERM INVESTMENTS 1.8%
Money Market Funds 1.8%
T. Rowe Price Reserve Investment Fund, 0.32% (5)(6) 5,447,447 5,447
Total Short-Term Investments (Cost $5,447) 5,447
SECURITIES LENDING COLLATERAL 2.9%
Investments in a Pooled Account through Securities Lending Program with JPMorgan Chase Bank 2.9%
Short-Term Funds 2.9%
T. Rowe Price Short-Term Reserve Fund, 0.33% (5)(6) 894,309 8,943
Total Investments through Securities Lending Program with JPMorgan Chase Bank 8,943
Total Securities Lending Collateral (Cost $8,943) 8,943
Total Investments in Securities
102.4% of Net Assets (Cost $272,871) $ 315,911
‡
Country classifications are generally based on MSCI categories or another unaffiliated third party data provider; Shares are denominated in the currency of the country presented unless otherwise noted.
(1) Non-income producing (2)
Security cannot be offered for public resale without first being registered under the Securities Act of 1933 and related rules ("restricted security"). Acquisition date represents the day on which an enforceable right to acquire such security is obtained and is presented along with related cost in the security description. The fund has registration rights for certain restricted securities. Any costs related to such registration are borne by the issuer. The aggregate value of restricted securities (excluding 144A holdings) at period-end amounts to $488 and represents 0.2% of net assets.
(3) Level 3 in fair value hierarchy. See Note 2.(4)
All or a portion of this security is on loan at June 30,2016 -- total value of such securities at period-end amounts to $8,727. See Note 4.
(5) Seven-day yield(6) Affiliated Company
ADR American Depository Receipts CNH Offshore China Renminbi GBP British PoundGDR Global Depository Receipts GDS Global Depository Shares HKD Hong Kong Dollar
JPY Japanese YenUSD U.S. Dollar
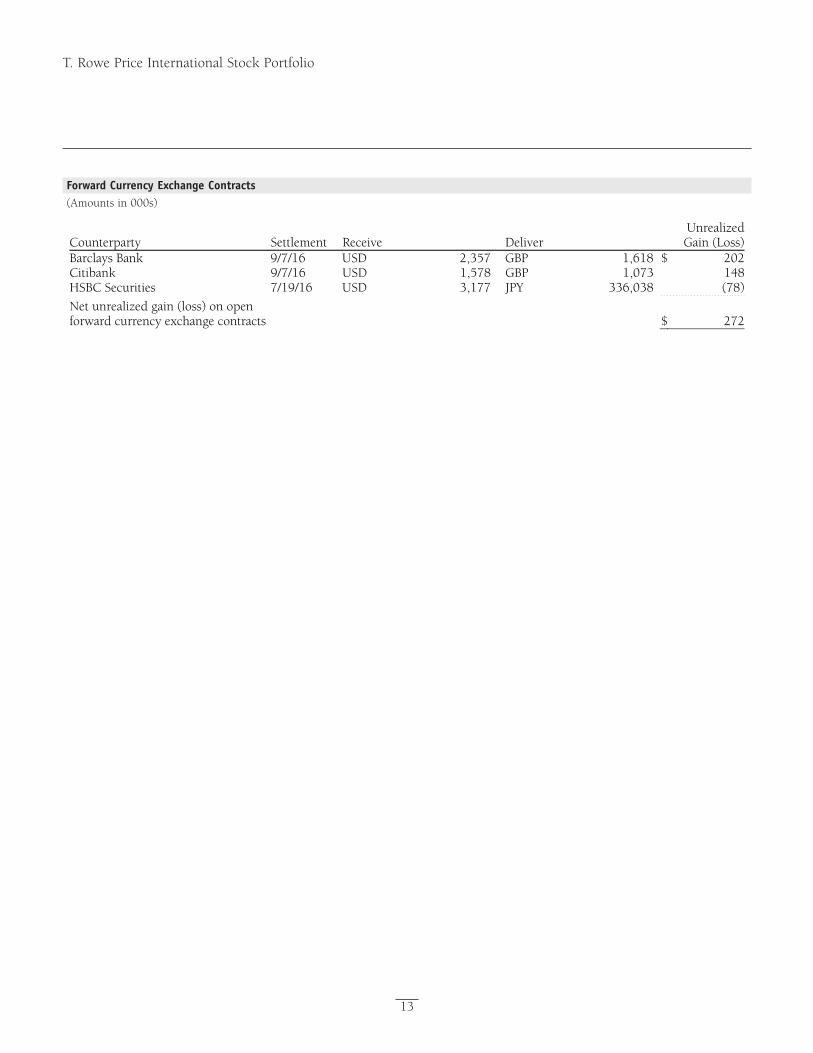
Proof #4
T. Rowe Price International Stock Portfolio
13
Forward Currency Exchange Contracts(Amounts in 000s)
Counterparty Settlement Receive Deliver Unrealized Gain (Loss)
Barclays Bank 9/7/16 USD 2,357 GBP 1,618 $ 202Citibank 9/7/16 USD 1,578 GBP 1,073 148HSBC Securities 7/19/16 USD 3,177 JPY 336,038 (78)
Net unrealized gain (loss) on open forward currency exchange contracts $ 272
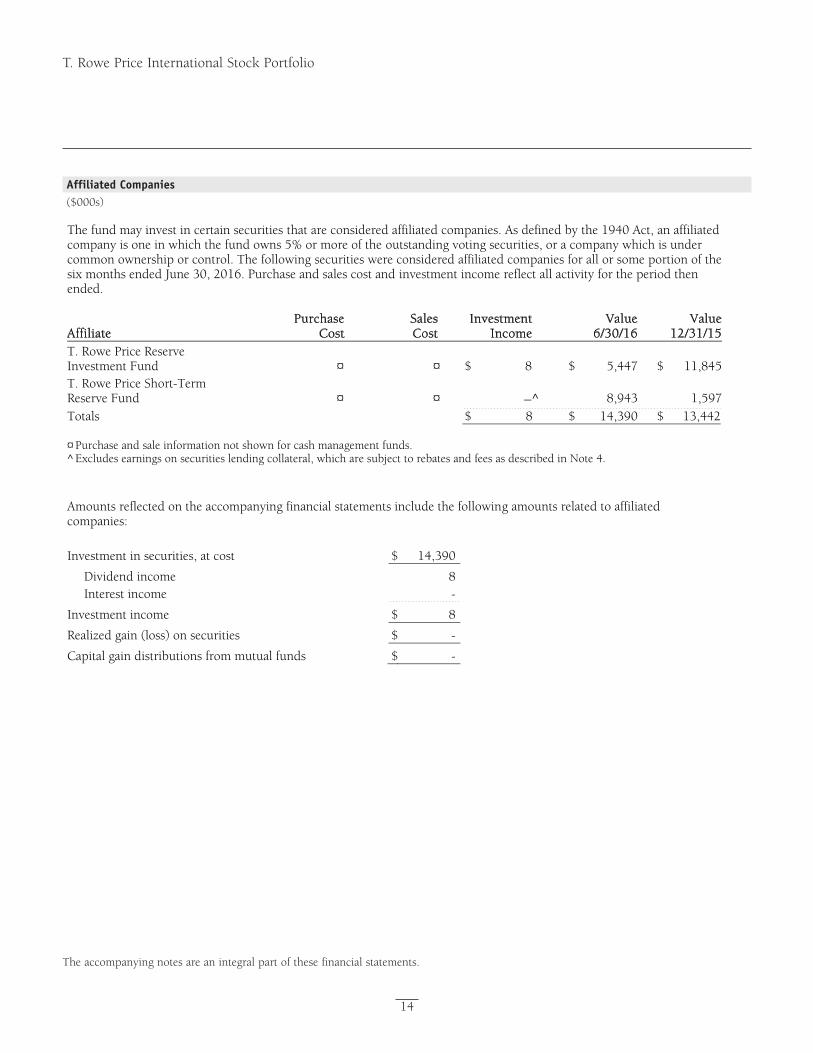
Proof #4
T. Rowe Price International Stock Portfolio
14
The accompanying notes are an integral part of these financial statements.
The fund may invest in certain securities that are considered affiliated companies. As defined by the 1940 Act, an affiliated company is one in which the fund owns 5% or more of the outstanding voting securities, or a company which is under common ownership or control. The following securities were considered affiliated companies for all or some portion of the six months ended June 30, 2016. Purchase and sales cost and investment income reflect all activity for the period then ended. Affiliate
PurchaseCost
SalesCost
InvestmentIncome
Value6/30/16
Value12/31/15
T. Rowe Price Reserve Investment Fund ¤ ¤ $ 8 $ 5,447 $ 11,845T. Rowe Price Short-Term Reserve Fund ¤ ¤ —^ 8,943 1,597Totals $ 8 $ 14,390 $ 13,442
¤ Purchase and sale information not shown for cash management funds.^ Excludes earnings on securities lending collateral, which are subject to rebates and fees as described in Note 4.
Amounts reflected on the accompanying financial statements include the following amounts related to affiliated companies: Investment in securities, at cost $ 14,390
Dividend income 8 Interest income -
Investment income $ 8
Realized gain (loss) on securities $ -
Capital gain distributions from mutual funds $ -
Affiliated Companies($000s)
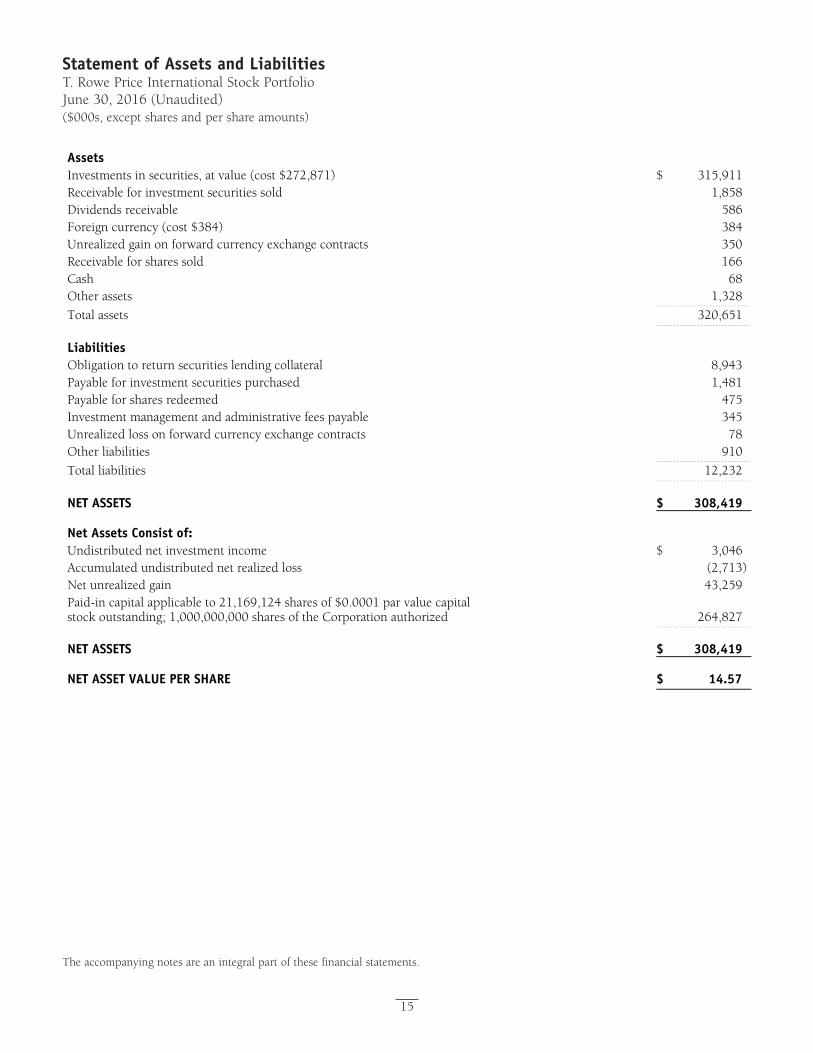
Proof #4
15
Statement of Assets and LiabilitiesT. Rowe Price International Stock PortfolioJune 30, 2016 (Unaudited)($000s, except shares and per share amounts)
The accompanying notes are an integral part of these financial statements.
Assets Investments in securities, at value (cost $272,871) $ 315,911 Receivable for investment securities sold 1,858 Dividends receivable 586 Foreign currency (cost $384) 384 Unrealized gain on forward currency exchange contracts 350 Receivable for shares sold 166 Cash 68 Other assets 1,328
Total assets 320,651 Liabilities Obligation to return securities lending collateral 8,943 Payable for investment securities purchased 1,481 Payable for shares redeemed 475 Investment management and administrative fees payable 345 Unrealized loss on forward currency exchange contracts 78 Other liabilities 910
Total liabilities 12,232 NET ASSETS $ 308,419 Net Assets Consist of: Undistributed net investment income $ 3,046 Accumulated undistributed net realized loss (2,713) Net unrealized gain 43,259 Paid-in capital applicable to 21,169,124 shares of $0.0001 par value capital stock outstanding; 1,000,000,000 shares of the Corporation authorized 264,827 NET ASSETS $ 308,419 NET ASSET VALUE PER SHARE $ 14.57
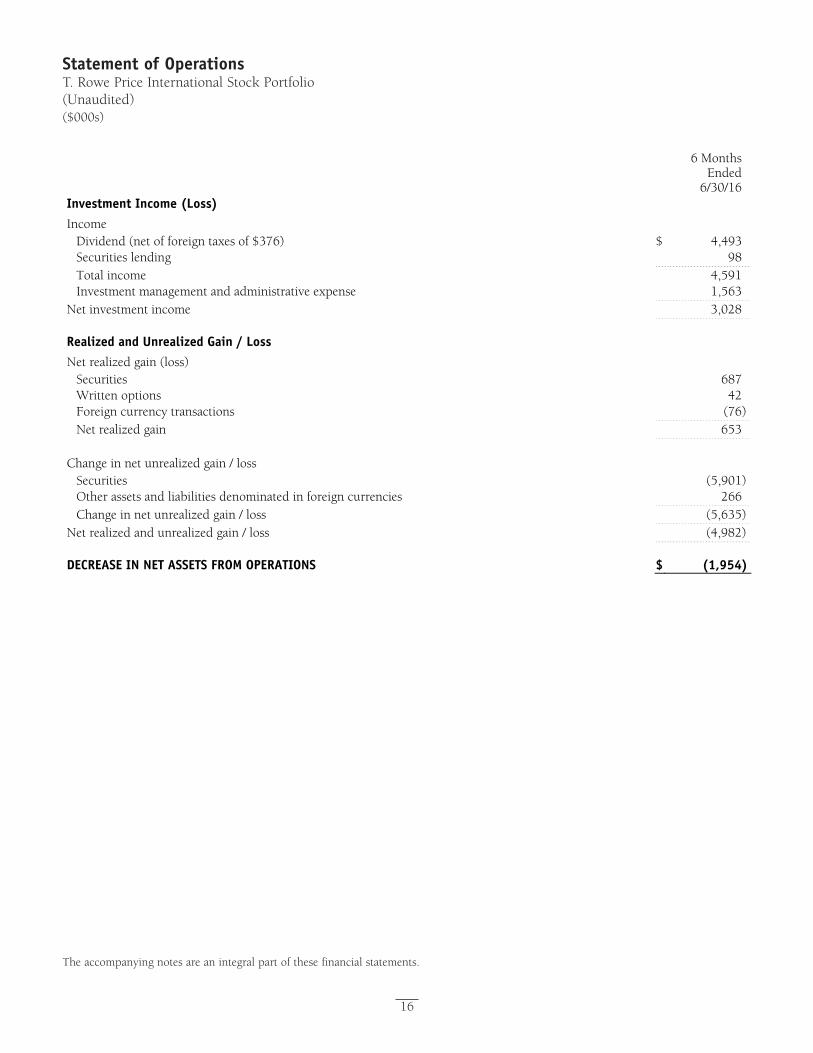
Proof #4
16
Statement of OperationsT. Rowe Price International Stock Portfolio(Unaudited)($000s)
The accompanying notes are an integral part of these financial statements.
6 Months Ended
6/30/16Investment Income (Loss) Income
Dividend (net of foreign taxes of $376) $ 4,493Securities lending 98Total income 4,591 Investment management and administrative expense 1,563
Net investment income 3,028 Realized and Unrealized Gain / Loss Net realized gain (loss)
Securities 687Written options 42Foreign currency transactions (76)Net realized gain 653
Change in net unrealized gain / loss
Securities (5,901)Other assets and liabilities denominated in foreign currencies 266Change in net unrealized gain / loss (5,635)
Net realized and unrealized gain / loss (4,982) DECREASE IN NET ASSETS FROM OPERATIONS $ (1,954)
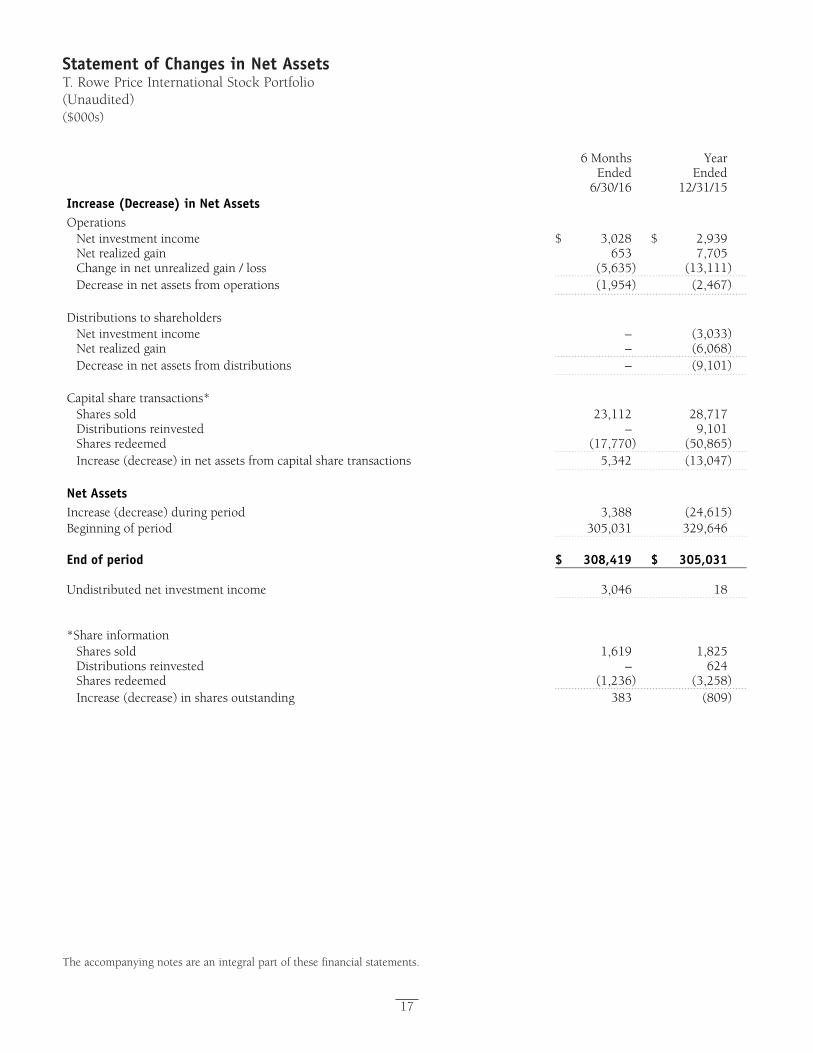
Proof #4
17
Statement of Changes in Net AssetsT. Rowe Price International Stock Portfolio(Unaudited)($000s)
The accompanying notes are an integral part of these financial statements.
6 Months Ended
6/30/16
Year Ended
12/31/15Increase (Decrease) in Net Assets Operations
Net investment income $ 3,028 $ 2,939Net realized gain 653 7,705Change in net unrealized gain / loss (5,635) (13,111)Decrease in net assets from operations (1,954) (2,467)
Distributions to shareholders
Net investment income – (3,033)Net realized gain – (6,068)Decrease in net assets from distributions – (9,101)
Capital share transactions*
Shares sold 23,112 28,717Distributions reinvested – 9,101Shares redeemed (17,770) (50,865)Increase (decrease) in net assets from capital share transactions 5,342 (13,047)
Net Assets Increase (decrease) during period 3,388 (24,615) Beginning of period 305,031 329,646 End of period $ 308,419 $ 305,031 Undistributed net investment income 3,046 18 *Share information
Shares sold 1,619 1,825Distributions reinvested – 624Shares redeemed (1,236) (3,258)Increase (decrease) in shares outstanding 383 (809)
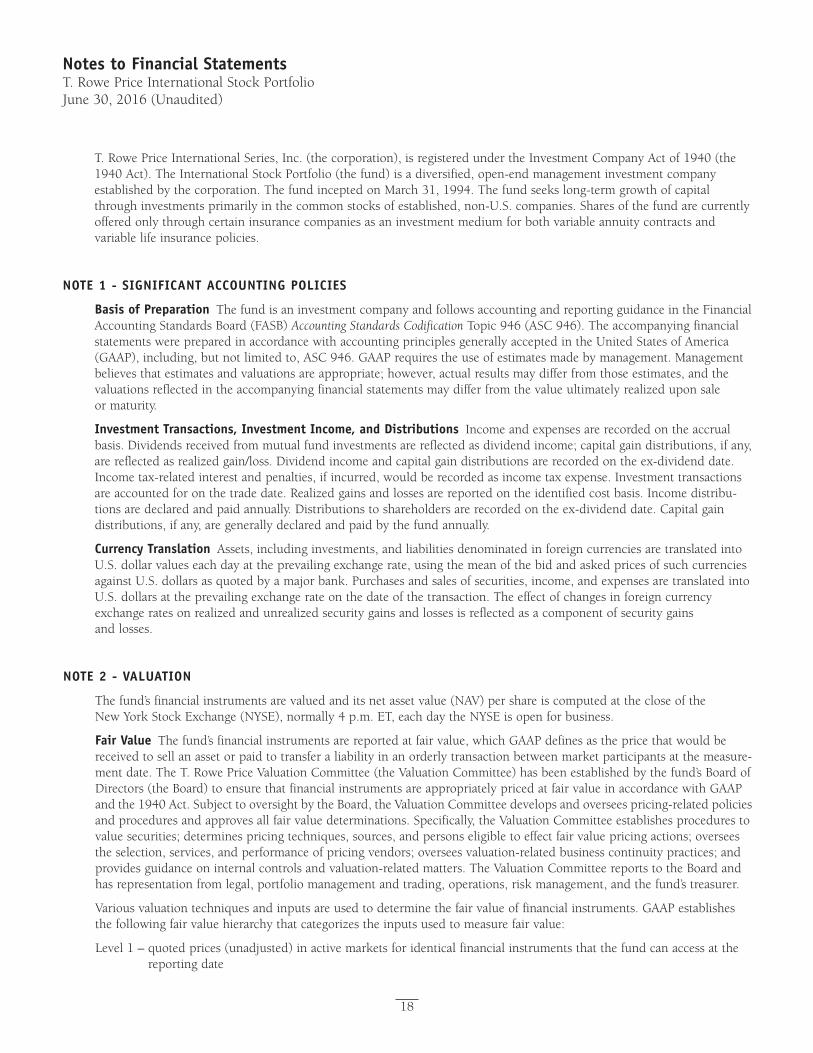
Proof #4
18
Notes to Financial StatementsT. Rowe Price International Stock PortfolioJune 30, 2016 (Unaudited)
T.RowePriceInternationalSeries,Inc.(thecorporation),isregisteredundertheInvestmentCompanyActof1940(the1940Act).TheInternationalStockPortfolio(thefund)isadiversified,open-endmanagementinvestmentcompanyestablishedbythecorporation.ThefundinceptedonMarch31,1994.Thefundseekslong-termgrowthofcapitalthroughinvestmentsprimarilyinthecommonstocksofestablished,non-U.S.companies.Sharesofthefundarecurrentlyofferedonlythroughcertaininsurancecompaniesasaninvestmentmediumforbothvariableannuitycontractsandvariable life insurance policies.
NOTE 1 - SIGNIFICANT ACCOuNTING POLICIES
Basis of Preparation ThefundisaninvestmentcompanyandfollowsaccountingandreportingguidanceintheFinancialAccountingStandardsBoard(FASB)Accounting Standards CodificationTopic946(ASC946).TheaccompanyingfinancialstatementswerepreparedinaccordancewithaccountingprinciplesgenerallyacceptedintheUnitedStatesofAmerica(GAAP),including,butnotlimitedto,ASC946.GAAPrequirestheuseofestimatesmadebymanagement.Managementbelieves that estimates and valuations are appropriate; however, actual results may differ from those estimates, and the valuationsreflectedintheaccompanyingfinancialstatementsmaydifferfromthevalueultimatelyrealizeduponsaleor maturity.
Investment Transactions, Investment Income, and Distributions Incomeandexpensesarerecordedontheaccrualbasis.Dividendsreceivedfrommutualfundinvestmentsarereflectedasdividendincome;capitalgaindistributions,ifany,arereflectedasrealizedgain/loss.Dividendincomeandcapitalgaindistributionsarerecordedontheex-dividenddate.Incometax-relatedinterestandpenalties,ifincurred,wouldberecordedasincometaxexpense.Investmenttransactionsareaccountedforonthetradedate.Realizedgainsandlossesarereportedontheidentifiedcostbasis.Incomedistribu-tionsaredeclaredandpaidannually.Distributionstoshareholdersarerecordedontheex-dividenddate.Capitalgaindistributions,ifany,aregenerallydeclaredandpaidbythefundannually.
Currency Translation Assets,includinginvestments,andliabilitiesdenominatedinforeigncurrenciesaretranslatedintoU.S.dollarvalueseachdayattheprevailingexchangerate,usingthemeanofthebidandaskedpricesofsuchcurrenciesagainstU.S.dollarsasquotedbyamajorbank.Purchasesandsalesofsecurities,income,andexpensesaretranslatedintoU.S.dollarsattheprevailingexchangerateonthedateofthetransaction.Theeffectofchangesinforeigncurrencyexchangeratesonrealizedandunrealizedsecuritygainsandlossesisreflectedasacomponentofsecuritygainsand losses.
NOTE 2 - VALuATION
Thefund’sfinancialinstrumentsarevaluedanditsnetassetvalue(NAV)pershareiscomputedatthecloseoftheNewYorkStockExchange(NYSE),normally4p.m.ET,eachdaytheNYSEisopenforbusiness.
Fair Value The fund’s financial instruments are reported at fair value, which GAAP defines as the price that would be receivedtosellanassetorpaidtotransferaliabilityinanorderlytransactionbetweenmarketparticipantsatthemeasure-mentdate.TheT.RowePriceValuationCommittee(theValuationCommittee)hasbeenestablishedbythefund’sBoardofDirectors(theBoard)toensurethatfinancialinstrumentsareappropriatelypricedatfairvalueinaccordancewithGAAPandthe1940Act.SubjecttooversightbytheBoard,theValuationCommitteedevelopsandoverseespricing-relatedpoliciesandproceduresandapprovesallfairvaluedeterminations.Specifically,theValuationCommitteeestablishesprocedurestovaluesecurities;determinespricingtechniques,sources,andpersonseligibletoeffectfairvaluepricingactions;overseestheselection,services,andperformanceofpricingvendors;overseesvaluation-relatedbusinesscontinuitypractices;andprovidesguidanceoninternalcontrolsandvaluation-relatedmatters.TheValuationCommitteereportstotheBoardandhasrepresentationfromlegal,portfoliomanagementandtrading,operations,riskmanagement,andthefund’streasurer.
Variousvaluationtechniquesandinputsareusedtodeterminethefairvalueoffinancialinstruments.GAAPestablishesthefollowingfairvaluehierarchythatcategorizestheinputsusedtomeasurefairvalue:
Level1–quotedprices(unadjusted)inactivemarketsforidenticalfinancialinstrumentsthatthefundcanaccessatthereportingdate
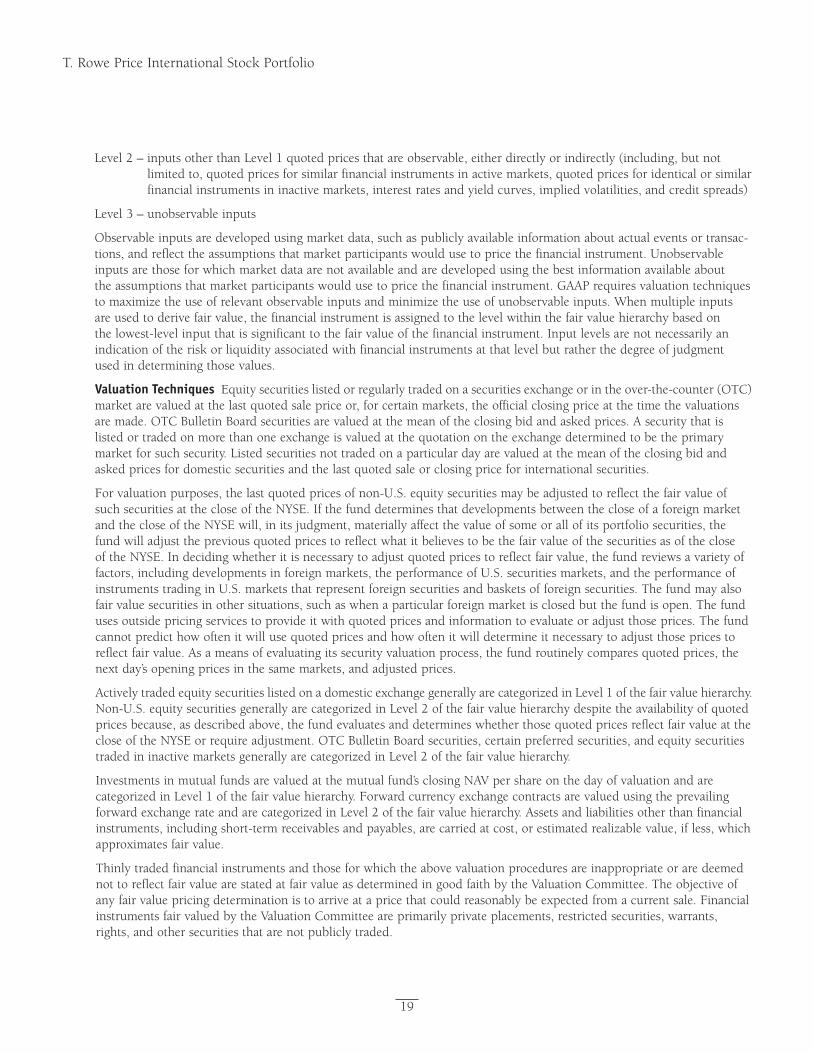
Proof #4
19
T. Rowe Price International Stock Portfolio
Level2–inputsotherthanLevel1quotedpricesthatareobservable,eitherdirectlyorindirectly(including,butnotlimitedto,quotedpricesforsimilarfinancialinstrumentsinactivemarkets,quotedpricesforidenticalorsimilarfinancialinstrumentsininactivemarkets,interestratesandyieldcurves,impliedvolatilities,andcreditspreads)
Level3–unobservableinputs
Observableinputsaredevelopedusingmarketdata,suchaspubliclyavailableinformationaboutactualeventsortransac-tions,andreflecttheassumptionsthatmarketparticipantswouldusetopricethefinancialinstrument.Unobservableinputsarethoseforwhichmarketdataarenotavailableandaredevelopedusingthebestinformationavailableabouttheassumptionsthatmarketparticipantswouldusetopricethefinancialinstrument.GAAPrequiresvaluationtechniquestomaximizetheuseofrelevantobservableinputsandminimizetheuseofunobservableinputs.Whenmultipleinputsareusedtoderivefairvalue,thefinancialinstrumentisassignedtothelevelwithinthefairvaluehierarchybasedonthelowest-levelinputthatissignificanttothefairvalueofthefinancialinstrument.Inputlevelsarenotnecessarilyanindicationoftheriskorliquidityassociatedwithfinancialinstrumentsatthatlevelbutratherthedegreeofjudgmentusedindeterminingthosevalues.
Valuation Techniques Equitysecuritieslistedorregularlytradedonasecuritiesexchangeorintheover-the-counter(OTC)marketarevaluedatthelastquotedsalepriceor,forcertainmarkets,theofficialclosingpriceatthetimethevaluationsaremade.OTCBulletinBoardsecuritiesarevaluedatthemeanoftheclosingbidandaskedprices.Asecuritythatislistedortradedonmorethanoneexchangeisvaluedatthequotationontheexchangedeterminedtobetheprimarymarketforsuchsecurity.Listedsecuritiesnottradedonaparticulardayarevaluedatthemeanoftheclosingbidandaskedpricesfordomesticsecuritiesandthelastquotedsaleorclosingpriceforinternationalsecurities.
Forvaluationpurposes,thelastquotedpricesofnon-U.S.equitysecuritiesmaybeadjustedtoreflectthefairvalueofsuchsecuritiesatthecloseoftheNYSE.IfthefunddeterminesthatdevelopmentsbetweenthecloseofaforeignmarketandthecloseoftheNYSEwill,initsjudgment,materiallyaffectthevalueofsomeorallofitsportfoliosecurities,thefundwilladjustthepreviousquotedpricestoreflectwhatitbelievestobethefairvalueofthesecuritiesasofthecloseoftheNYSE.Indecidingwhetheritisnecessarytoadjustquotedpricestoreflectfairvalue,thefundreviewsavarietyoffactors,includingdevelopmentsinforeignmarkets,theperformanceofU.S.securitiesmarkets,andtheperformanceofinstrumentstradinginU.S.marketsthatrepresentforeignsecuritiesandbasketsofforeignsecurities.Thefundmayalsofairvaluesecuritiesinothersituations,suchaswhenaparticularforeignmarketisclosedbutthefundisopen.Thefundusesoutsidepricingservicestoprovideitwithquotedpricesandinformationtoevaluateoradjustthoseprices.Thefundcannotpredicthowoftenitwillusequotedpricesandhowoftenitwilldetermineitnecessarytoadjustthosepricestoreflectfairvalue.Asameansofevaluatingitssecurityvaluationprocess,thefundroutinelycomparesquotedprices,thenextday’sopeningpricesinthesamemarkets,andadjustedprices.
ActivelytradedequitysecuritieslistedonadomesticexchangegenerallyarecategorizedinLevel1ofthefairvaluehierarchy.Non-U.S.equitysecuritiesgenerallyarecategorizedinLevel2ofthefairvaluehierarchydespitetheavailabilityofquotedpricesbecause,asdescribedabove,thefundevaluatesanddetermineswhetherthosequotedpricesreflectfairvalueatthecloseoftheNYSEorrequireadjustment.OTCBulletinBoardsecurities,certainpreferredsecurities,andequitysecuritiestradedininactivemarketsgenerallyarecategorizedinLevel2ofthefairvaluehierarchy.
Investmentsinmutualfundsarevaluedatthemutualfund’sclosingNAVpershareonthedayofvaluationandarecategorizedinLevel1ofthefairvaluehierarchy.ForwardcurrencyexchangecontractsarevaluedusingtheprevailingforwardexchangerateandarecategorizedinLevel2ofthefairvaluehierarchy.Assetsandliabilitiesotherthanfinancialinstruments,includingshort-termreceivablesandpayables,arecarriedatcost,orestimatedrealizablevalue,ifless,whichapproximatesfairvalue.
Thinly traded financial instruments and those for which the above valuation procedures are inappropriate or are deemed nottoreflectfairvaluearestatedatfairvalueasdeterminedingoodfaithbytheValuationCommittee.Theobjectiveofanyfairvaluepricingdeterminationistoarriveatapricethatcouldreasonablybeexpectedfromacurrentsale.FinancialinstrumentsfairvaluedbytheValuationCommitteeareprimarilyprivateplacements,restrictedsecurities,warrants,rights,andothersecuritiesthatarenotpubliclytraded.
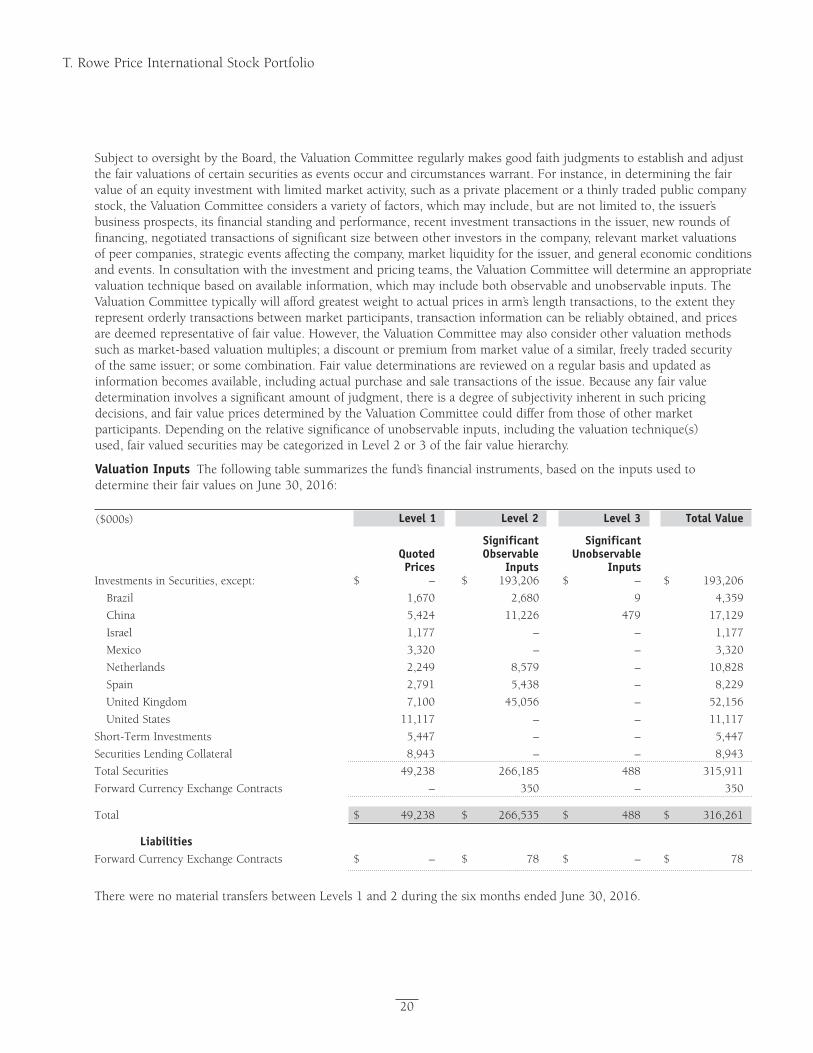
Proof #4
20
T. Rowe Price International Stock Portfolio
SubjecttooversightbytheBoard,theValuationCommitteeregularlymakesgoodfaithjudgmentstoestablishandadjustthefairvaluationsofcertainsecuritiesaseventsoccurandcircumstanceswarrant.Forinstance,indeterminingthefairvalueofanequityinvestmentwithlimitedmarketactivity,suchasaprivateplacementorathinlytradedpubliccompanystock,theValuationCommitteeconsidersavarietyoffactors,whichmayinclude,butarenotlimitedto,theissuer’sbusinessprospects,itsfinancialstandingandperformance,recentinvestmenttransactionsintheissuer,newroundsoffinancing,negotiatedtransactionsofsignificantsizebetweenotherinvestorsinthecompany,relevantmarketvaluationsofpeercompanies,strategiceventsaffectingthecompany,marketliquidityfortheissuer,andgeneraleconomicconditionsandevents.Inconsultationwiththeinvestmentandpricingteams,theValuationCommitteewilldetermineanappropriatevaluationtechniquebasedonavailableinformation,whichmayincludebothobservableandunobservableinputs.TheValuationCommitteetypicallywillaffordgreatestweighttoactualpricesinarm’slengthtransactions,totheextenttheyrepresentorderlytransactionsbetweenmarketparticipants,transactioninformationcanbereliablyobtained,andpricesaredeemedrepresentativeoffairvalue.However,theValuationCommitteemayalsoconsiderothervaluationmethodssuchasmarket-basedvaluationmultiples;adiscountorpremiumfrommarketvalueofasimilar,freelytradedsecurityofthesameissuer;orsomecombination.Fairvaluedeterminationsarereviewedonaregularbasisandupdatedasinformationbecomesavailable,includingactualpurchaseandsaletransactionsoftheissue.Becauseanyfairvaluedeterminationinvolvesasignificantamountofjudgment,thereisadegreeofsubjectivityinherentinsuchpricingdecisions,andfairvaluepricesdeterminedbytheValuationCommitteecoulddifferfromthoseofothermarketparticipants.Dependingontherelativesignificanceofunobservableinputs,includingthevaluationtechnique(s)used,fairvaluedsecuritiesmaybecategorizedinLevel2or3ofthefairvaluehierarchy.
Valuation Inputs Thefollowingtablesummarizesthefund’sfinancialinstruments,basedontheinputsusedtodeterminetheirfairvaluesonJune30,2016:
Significant Significant Quoted Observable unobservable Prices Inputs InputsInvestmentsinSecurities,except: $ – $ 193,206 $ – $ 193,206
Brazil 1,670 2,680 9 4,359
China 5,424 11,226 479 17,129
Israel 1,177 – – 1,177
Mexico 3,320 – – 3,320
Netherlands 2,249 8,579 – 10,828
Spain 2,791 5,438 – 8,229
UnitedKingdom 7,100 45,056 – 52,156
UnitedStates 11,117 – – 11,117
Short-TermInvestments 5,447 – – 5,447
SecuritiesLendingCollateral 8,943 – – 8,943
TotalSecurities 49,238 266,185 488 315,911
ForwardCurrencyExchangeContracts – 350 – 350
Total $ 49,238 $ 266,535 $ 488 $ 316,261
Liabilities ForwardCurrencyExchangeContracts $ – $ 78 $ – $ 78
($000s) Total ValueLevel 3Level 2Level 1
TherewerenomaterialtransfersbetweenLevels1and2duringthesixmonthsendedJune30,2016.
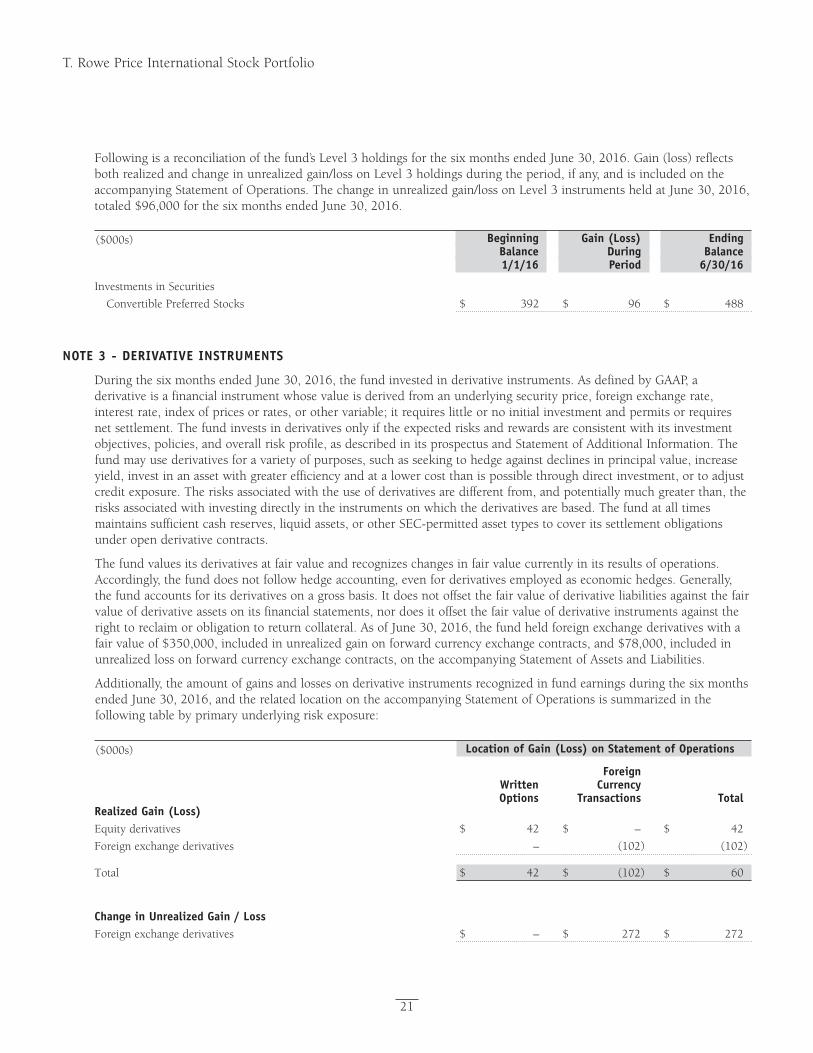
Proof #4
21
T. Rowe Price International Stock Portfolio
Followingisareconciliationofthefund’sLevel3holdingsforthesixmonthsendedJune30,2016.Gain(loss)reflectsbothrealizedandchangeinunrealizedgain/lossonLevel3holdingsduringtheperiod,ifany,andisincludedontheaccompanyingStatementofOperations.Thechangeinunrealizedgain/lossonLevel3instrumentsheldatJune30,2016,totaled$96,000forthesixmonthsendedJune30,2016.
Investments in Securities
ConvertiblePreferredStocks $ 392 $ 96 $ 488
($000s) Ending Balance
6/30/16
Gain (Loss) DuringPeriod
Beginning Balance1/1/16
NOTE 3 - DERIVATIVE INSTRuMENTS
DuringthesixmonthsendedJune30,2016,thefundinvestedinderivativeinstruments.AsdefinedbyGAAP,aderivativeisafinancialinstrumentwhosevalueisderivedfromanunderlyingsecurityprice,foreignexchangerate,interestrate,indexofpricesorrates,orothervariable;itrequireslittleornoinitialinvestmentandpermitsorrequiresnetsettlement.Thefundinvestsinderivativesonlyiftheexpectedrisksandrewardsareconsistentwithitsinvestmentobjectives,policies,andoverallriskprofile,asdescribedinitsprospectusandStatementofAdditionalInformation.Thefundmayusederivativesforavarietyofpurposes,suchasseekingtohedgeagainstdeclinesinprincipalvalue,increaseyield,investinanassetwithgreaterefficiencyandatalowercostthanispossiblethroughdirectinvestment,ortoadjustcreditexposure.Therisksassociatedwiththeuseofderivativesaredifferentfrom,andpotentiallymuchgreaterthan,therisksassociatedwithinvestingdirectlyintheinstrumentsonwhichthederivativesarebased.Thefundatalltimesmaintainssufficientcashreserves,liquidassets,orotherSEC-permittedassettypestocoveritssettlementobligationsunder open derivative contracts.
Thefundvaluesitsderivativesatfairvalueandrecognizeschangesinfairvaluecurrentlyinitsresultsofoperations.Accordingly,thefunddoesnotfollowhedgeaccounting,evenforderivativesemployedaseconomichedges.Generally,thefundaccountsforitsderivativesonagrossbasis.Itdoesnotoffsetthefairvalueofderivativeliabilitiesagainstthefairvalueofderivativeassetsonitsfinancialstatements,nordoesitoffsetthefairvalueofderivativeinstrumentsagainsttherighttoreclaimorobligationtoreturncollateral.AsofJune30,2016,thefundheldforeignexchangederivativeswithafairvalueof$350,000,includedinunrealizedgainonforwardcurrencyexchangecontracts,and$78,000,includedinunrealizedlossonforwardcurrencyexchangecontracts,ontheaccompanyingStatementofAssetsandLiabilities.
Additionally,theamountofgainsandlossesonderivativeinstrumentsrecognizedinfundearningsduringthesixmonthsendedJune30,2016,andtherelatedlocationontheaccompanyingStatementofOperationsissummarizedinthefollowingtablebyprimaryunderlyingriskexposure:
Foreign Written Currency Options Transactions TotalRealized Gain (Loss)Equityderivatives $ 42 $ – $ 42
Foreignexchangederivatives – (102) (102)
Total $ 42 $ (102) $ 60
Change in unrealized Gain / LossForeignexchangederivatives $ – $ 272 $ 272
Location of Gain (Loss) on Statement of Operations($000s)
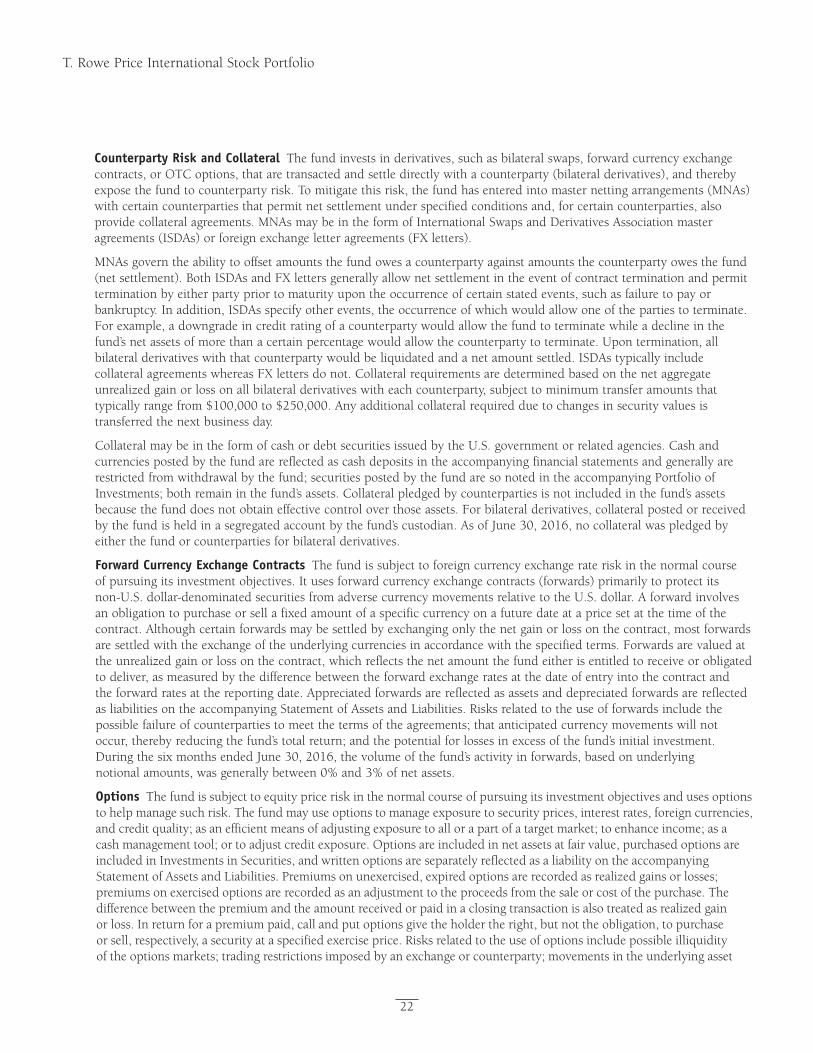
Proof #4
22
T. Rowe Price International Stock Portfolio
Counterparty Risk and Collateral Thefundinvestsinderivatives,suchasbilateralswaps,forwardcurrencyexchangecontracts,orOTCoptions,thataretransactedandsettledirectlywithacounterparty(bilateralderivatives),andtherebyexposethefundtocounterpartyrisk.Tomitigatethisrisk,thefundhasenteredintomasternettingarrangements(MNAs)with certain counterparties that permit net settlement under specified conditions and, for certain counterparties, also providecollateralagreements.MNAsmaybeintheformofInternationalSwapsandDerivativesAssociationmasteragreements(ISDAs)orforeignexchangeletteragreements(FXletters).
MNAsgoverntheabilitytooffsetamountsthefundowesacounterpartyagainstamountsthecounterpartyowesthefund(netsettlement).BothISDAsandFXlettersgenerallyallownetsettlementintheeventofcontractterminationandpermittermination by either party prior to maturity upon the occurrence of certain stated events, such as failure to pay or bankruptcy.Inaddition,ISDAsspecifyotherevents,theoccurrenceofwhichwouldallowoneofthepartiestoterminate.Forexample,adowngradeincreditratingofacounterpartywouldallowthefundtoterminatewhileadeclineinthefund’snetassetsofmorethanacertainpercentagewouldallowthecounterpartytoterminate.Upontermination,allbilateralderivativeswiththatcounterpartywouldbeliquidatedandanetamountsettled.ISDAstypicallyincludecollateralagreementswhereasFXlettersdonot.Collateralrequirementsaredeterminedbasedonthenetaggregateunrealizedgainorlossonallbilateralderivativeswitheachcounterparty,subjecttominimumtransferamountsthattypicallyrangefrom$100,000to$250,000.Anyadditionalcollateralrequiredduetochangesinsecurityvaluesistransferredthenextbusinessday.
CollateralmaybeintheformofcashordebtsecuritiesissuedbytheU.S.governmentorrelatedagencies.Cashandcurrenciespostedbythefundarereflectedascashdepositsintheaccompanyingfinancialstatementsandgenerallyarerestrictedfromwithdrawalbythefund;securitiespostedbythefundaresonotedintheaccompanyingPortfolioofInvestments;bothremaininthefund’sassets.Collateralpledgedbycounterpartiesisnotincludedinthefund’sassetsbecause the fund does not obtain effective control over those assets. For bilateral derivatives, collateral posted or received bythefundisheldinasegregatedaccountbythefund’scustodian.AsofJune30,2016,nocollateralwaspledgedbyeither the fund or counterparties for bilateral derivatives.
Forward Currency Exchange Contracts Thefundissubjecttoforeigncurrencyexchangerateriskinthenormalcourseofpursuingitsinvestmentobjectives.Itusesforwardcurrencyexchangecontracts(forwards)primarilytoprotectitsnon-U.S.dollar-denominatedsecuritiesfromadversecurrencymovementsrelativetotheU.S.dollar.Aforwardinvolvesanobligationtopurchaseorsellafixedamountofaspecificcurrencyonafuturedateatapricesetatthetimeofthecontract.Althoughcertainforwardsmaybesettledbyexchangingonlythenetgainorlossonthecontract,mostforwardsaresettledwiththeexchangeoftheunderlyingcurrenciesinaccordancewiththespecifiedterms.Forwardsarevaluedattheunrealizedgainorlossonthecontract,whichreflectsthenetamountthefundeitherisentitledtoreceiveorobligatedtodeliver,asmeasuredbythedifferencebetweentheforwardexchangeratesatthedateofentryintothecontractandtheforwardratesatthereportingdate.AppreciatedforwardsarereflectedasassetsanddepreciatedforwardsarereflectedasliabilitiesontheaccompanyingStatementofAssetsandLiabilities.Risksrelatedtotheuseofforwardsincludethepossiblefailureofcounterpartiestomeetthetermsoftheagreements;thatanticipatedcurrencymovementswillnotoccur,therebyreducingthefund’stotalreturn;andthepotentialforlossesinexcessofthefund’sinitialinvestment.DuringthesixmonthsendedJune30,2016,thevolumeofthefund’sactivityinforwards,basedonunderlyingnotionalamounts,wasgenerallybetween0%and3%ofnetassets.
Options Thefundissubjecttoequitypriceriskinthenormalcourseofpursuingitsinvestmentobjectivesandusesoptionstohelpmanagesuchrisk.Thefundmayuseoptionstomanageexposuretosecurityprices,interestrates,foreigncurrencies,andcreditquality;asanefficientmeansofadjustingexposuretoallorapartofatargetmarket;toenhanceincome;asacashmanagementtool;ortoadjustcreditexposure.Optionsareincludedinnetassetsatfairvalue,purchasedoptionsareincludedinInvestmentsinSecurities,andwrittenoptionsareseparatelyreflectedasaliabilityontheaccompanyingStatementofAssetsandLiabilities.Premiumsonunexercised,expiredoptionsarerecordedasrealizedgainsorlosses;premiumsonexercisedoptionsarerecordedasanadjustmenttotheproceedsfromthesaleorcostofthepurchase.Thedifferencebetweenthepremiumandtheamountreceivedorpaidinaclosingtransactionisalsotreatedasrealizedgainorloss.Inreturnforapremiumpaid,callandputoptionsgivetheholdertheright,butnottheobligation,topurchaseorsell,respectively,asecurityataspecifiedexerciseprice.Risksrelatedtotheuseofoptionsincludepossibleilliquidityoftheoptionsmarkets;tradingrestrictionsimposedbyanexchangeorcounterparty;movementsintheunderlyingasset
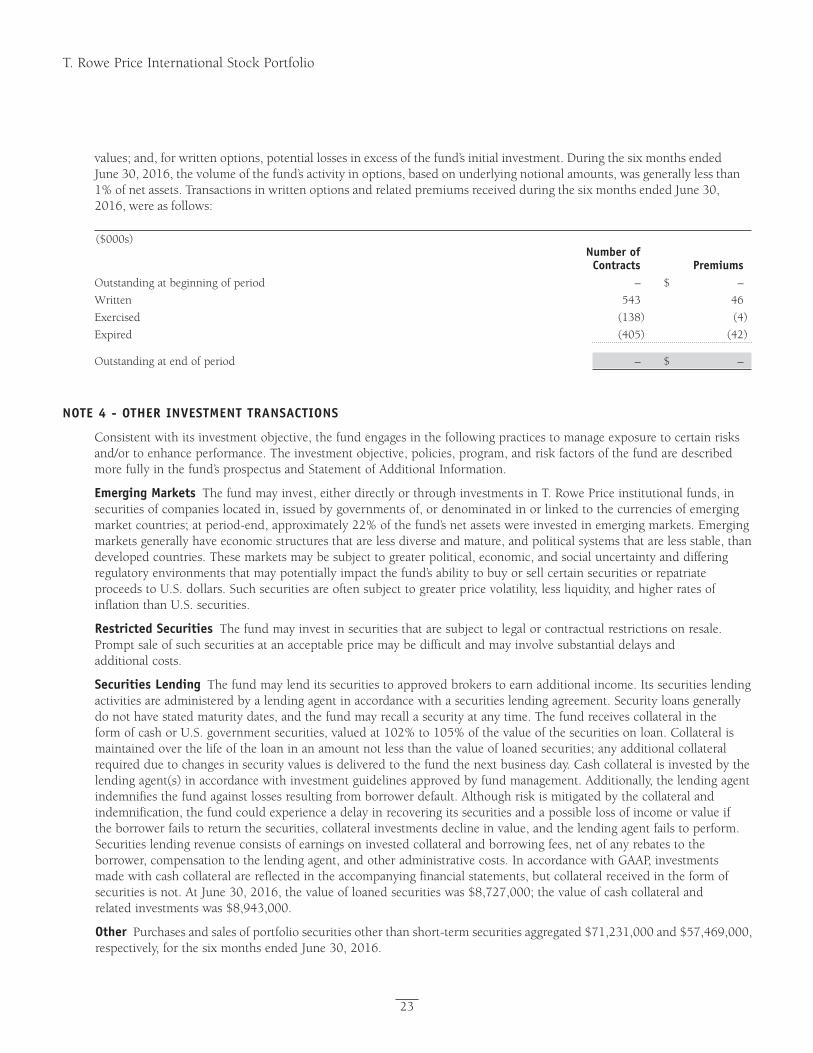
Proof #4
23
T. Rowe Price International Stock Portfolio
values;and,forwrittenoptions,potentiallossesinexcessofthefund’sinitialinvestment.DuringthesixmonthsendedJune30,2016,thevolumeofthefund’sactivityinoptions,basedonunderlyingnotionalamounts,wasgenerallylessthan1%ofnetassets.TransactionsinwrittenoptionsandrelatedpremiumsreceivedduringthesixmonthsendedJune30,2016,wereasfollows:
Number of Contracts PremiumsOutstandingatbeginningofperiod – $ –
Written 543 46
Exercised (138) (4)
Expired (405) (42)
Outstandingatendofperiod – $ –
($000s)
NOTE 4 - OTHER INVESTMENT TRANSACTIONS
Consistentwithitsinvestmentobjective,thefundengagesinthefollowingpracticestomanageexposuretocertainrisksand/ortoenhanceperformance.Theinvestmentobjective,policies,program,andriskfactorsofthefundaredescribedmore fully in the fund’s prospectus and Statement of Additional Information.
Emerging Markets Thefundmayinvest,eitherdirectlyorthroughinvestmentsinT.RowePriceinstitutionalfunds,insecuritiesofcompanieslocatedin,issuedbygovernmentsof, ordenominatedinorlinkedtothecurrenciesofemergingmarketcountries;atperiod-end,approximately22%ofthefund’snetassetswereinvestedinemergingmarkets.Emergingmarketsgenerallyhaveeconomicstructuresthatarelessdiverseandmature,andpoliticalsystemsthatarelessstable,thandevelopedcountries.Thesemarketsmaybesubjecttogreaterpolitical,economic,andsocialuncertaintyanddifferingregulatoryenvironmentsthatmaypotentiallyimpactthefund’sabilitytobuyorsellcertainsecuritiesorrepatriateproceedstoU.S.dollars.Suchsecuritiesareoftensubjecttogreaterpricevolatility,lessliquidity,andhigherratesofinflationthanU.S.securities.
Restricted Securities Thefundmayinvestinsecuritiesthataresubjecttolegalorcontractualrestrictionsonresale.Prompt sale of such securities at an acceptable price may be difficult and may involve substantial delays and additional costs.
Securities Lending Thefundmaylenditssecuritiestoapprovedbrokerstoearnadditionalincome.Itssecuritieslendingactivitiesareadministeredbyalendingagentinaccordancewithasecuritieslendingagreement.Securityloansgenerallydo not have stated maturity dates, and the fund may recall a security at any time. The fund receives collateral in the formofcashorU.S.governmentsecurities,valuedat102%to105%ofthevalueofthesecuritiesonloan.Collateralismaintained over the life of the loan in an amount not less than the value of loaned securities; any additional collateral requiredduetochangesinsecurityvaluesisdeliveredtothefundthenextbusinessday.Cashcollateralisinvestedbythelendingagent(s)inaccordancewithinvestmentguidelinesapprovedbyfundmanagement.Additionally,thelendingagentindemnifiesthefundagainstlossesresultingfromborrowerdefault.Althoughriskismitigatedbythecollateralandindemnification,thefundcouldexperienceadelayinrecoveringitssecuritiesandapossiblelossofincomeorvalueiftheborrowerfailstoreturnthesecurities,collateralinvestmentsdeclineinvalue,andthelendingagentfailstoperform.Securitieslendingrevenueconsistsofearningsoninvestedcollateralandborrowingfees,netofanyrebatestotheborrower,compensationtothelendingagent,andotheradministrativecosts.InaccordancewithGAAP,investmentsmadewithcashcollateralarereflectedintheaccompanyingfinancialstatements,butcollateralreceivedintheformofsecuritiesisnot.AtJune30,2016,thevalueofloanedsecuritieswas$8,727,000;thevalueofcashcollateralandrelatedinvestmentswas$8,943,000.
Other Purchasesandsalesofportfoliosecuritiesotherthanshort-termsecuritiesaggregated$71,231,000and$57,469,000,respectively,forthesixmonthsendedJune30,2016.
Proof #4
24
T. Rowe Price International Stock Portfolio
NOTE 5 - FEDERAL INCOME TAxES
NoprovisionforfederalincometaxesisrequiredsincethefundintendstocontinuetoqualifyasaregulatedinvestmentcompanyunderSubchapterMoftheInternalRevenueCodeanddistributetoshareholdersallofitstaxableincomeandgains.Distributionsdeterminedinaccordancewithfederalincometaxregulationsmaydifferinamountorcharacterfromnetinvestmentincomeandrealizedgainsforfinancialreportingpurposes.Financialreportingrecordsareadjustedforpermanentbook/taxdifferencestoreflecttaxcharacterbutarenotadjustedfortemporarydifferences.Theamountandcharacteroftax-basisdistributionsandcompositionofnetassetsarefinalizedatfiscalyear-end;accordingly,tax-basisbalances have not been determined as of the date of this report.
AtJune30,2016,thecostofinvestmentsforfederalincometaxpurposeswas$276,776,000.Netunrealizedgainaggregated$39,355,000atperiod-end,ofwhich$61,855,000relatedtoappreciatedinvestmentsand$22,500,000relatedtodepreciated investments.
NOTE 6 - FOREIGN TAxES
Thefundissubjecttoforeignincometaxesimposedbycertaincountriesinwhichitinvests.Additionally,certainforeigncurrencytransactionsaresubjecttotax,andcapitalgainsrealizedupondispositionofsecuritiesissuedinorbycertainforeigncountriesaresubjecttocapitalgainstaximposedbythosecountries.Alltaxesarecomputedinaccordancewiththeapplicableforeigntaxlaw,and,totheextentpermitted,capitallossesareusedtooffsetcapitalgains.Taxesattributabletoincomeareaccruedbythefundasareductionofincome.Taxesincurredonthepurchaseofforeigncurrenciesarerecordedasrealizedlossonforeigncurrencytransactions.Currentanddeferredtaxexpenseattributabletocapitalgainsisreflectedasacomponentofrealizedorchangeinunrealizedgain/lossonsecuritiesintheaccompanyingfinancialstatements.AtJune30,2016,thefundhadnodeferredtaxliabilityattributabletoforeignsecuritiesand$1,812,000offoreigncapitallosscarryforwards,including$482,000thatexpirein2017,$475,000thatexpirein2018,$187,000thatexpirein2019,$404,000thatexpirein2020,$38,000thatexpirein2021,$17,000thatexpirein2022,$187,000thatexpirein2023,and$22,000thatexpirein2024.
NOTE 7 - RELATED PARTy TRANSACTIONS
ThefundismanagedbyT.RowePriceAssociates,Inc.(PriceAssociates),awhollyownedsubsidiaryofT.RowePriceGroup,Inc.(PriceGroup).PriceAssociateshasenteredintoasubadvisoryagreement(s)withoneormoreofitswhollyownedsubsidiaries,toprovideinvestmentadvisoryservicestothefund.TheinvestmentmanagementandadministrativeagreementbetweenthefundandPriceAssociatesprovidesforanall-inclusiveannualfeeequalto1.05%ofthefund’saveragedailynetassets.Thefeeiscomputeddailyandpaidmonthly.Theall-inclusivefeecoversinvestmentmanagement,shareholderservicing,transferagency,accounting,andcustodyservicesprovidedtothefund,aswellasfunddirectors’feesandexpenses.Interest,taxes,brokeragecommissions,andextraordinaryexpensesarepaiddirectlybythefund.
The fund may invest in the T. Rowe Price Reserve Investment Fund, the T. Rowe Price Government Reserve Investment Fund,ortheT.RowePriceShort-TermReserveFund(collectively,thePriceReserveInvestmentFunds),open-endmanagementinvestmentcompaniesmanagedbyPriceAssociatesandconsideredaffiliatesofthefund.ThePriceReserveInvestmentFundsareofferedasshort-terminvestmentoptionstomutualfunds,trusts,andotheraccountsmanagedby Price Associates or its affiliates and are not available for direct purchase by members of the public. The Price Reserve InvestmentFundspaynoinvestmentmanagementfees.
The fund may participate in securities purchase and sale transactions with other funds or accounts advised by Price Associates(crosstrades),inaccordancewithproceduresadoptedbythefund’sBoardandSecuritiesandExchangeCommissionrules,whichrequire,amongotherthings,thatsuchpurchaseandsalecrosstradesbeeffectedattheinde-pendentcurrentmarketpriceofthesecurity.DuringthesixmonthsendedJune30,2016,thefundhadnopurchasesor sales cross trades with other funds or accounts advised by Price Associates.

Proof #4
25
Information on Proxy Voting Policies, Procedures, and Records
AdescriptionofthepoliciesandproceduresusedbyT.RowePricefundsandportfoliostodeterminehowtovoteproxiesrelatingtoportfoliosecuritiesisavailableineachfund’sStatementofAdditionalInformation.Youmayrequestthisdocumentbycalling1-800-225-5132orbyaccessingtheSEC’swebsite,sec.gov.
Thedescriptionofourproxyvotingpoliciesandproceduresisalsoavailableonourcorporatewebsite.Toaccessit,pleasevisitthefollowingWebpage
https://www3.troweprice.com/usis/corporate/en/utility/policies.html
andscrolldowntothesectionnearthebottomofthepagethatsays,“ProxyVotingPolicies.”ClickontheProxyVotingPolicieslinkintheshadedbox.
Eachfund’smostrecentannualproxyvotingrecordisavailableonourwebsiteandthroughtheSEC’swebsite.ToaccessitthroughT.RowePrice,visitthewebsitelocationshownabove,andscrolldowntothesectionnearthebottomofthepagethatsays,“ProxyVotingRecords.”ClickontheProxyVotingRecordslinkintheshadedbox.
How to Obtain Quarterly Portfolio Holdings
ThefundfilesacompletescheduleofportfolioholdingswiththeSecuritiesandExchangeCommissionforthefirstandthirdquartersofeachfiscalyearonFormN-Q.Thefund’sFormN-QisavailableelectronicallyontheSEC’swebsite(sec.gov);hardcopiesmaybereviewedandcopiedattheSEC’sPublicReferenceRoom,100FSt.N.E.,Washington,DC20549.FormoreinformationonthePublicReferenceRoom,call1-800-SEC-0330.
T.RowePriceInternationalStockPortfolio
Proof #4
26
Approval of Investment Management Agreement and Subadvisory Agreement
OnMarch11,2016,thefund’sBoardofDirectors(Board),includingamajorityofthefund’sindependentdirectors,approvedthecontinuationoftheinvestmentmanagementagreement(AdvisoryContract)betweenthefundanditsinvestmentadvisor,T.RowePriceAssociates,Inc.(Advisor),aswellasthecontinuationoftheinvestmentsubadvisoryagreement(SubadvisoryContract)thattheAdvisorhasenteredintowithT.RowePriceInternationalLtd(Subadvisor)onbehalfofthefund.Inconnectionwithitsdeliberations,theBoardrequested,andtheAdvisorprovided,suchinformationastheBoard(withadvicefromindependentlegalcounsel)deemedreasonablynecessary.TheBoardconsideredavarietyoffactorsinconnectionwithitsreviewoftheAdvisoryContractandSubadvisoryContract,alsotakingintoaccountinformationprovidedbytheAdvisorduringthecourseoftheyear,asdiscussedbelow:
Services Provided by the Advisor and SubadvisorTheBoardconsideredthenature,quality,andextentoftheservicesprovidedtothefundbytheAdvisorandSubadvisor.Theseservicesincluded,butwerenotlimitedto,directingthefund’sinvestmentsinaccordancewithitsinvestmentprogramandtheoverallmanagementofthefund’sportfolio,aswellasavarietyofrelatedactivitiessuchasfinancial,investmentoperations,andadministrativeservices;compliance;maintainingthefund’srecordsandregistrations;andshareholdercommunications.TheBoardalsoreviewedthebackgroundandexperienceoftheAdvisor’sandSubadvisor’sseniormanagementteamsandinvestmentpersonnelinvolvedinthemanagementofthefund,aswellastheAdvisor’scompliancerecord.TheBoardconcludedthatitwassatisfiedwiththenature,quality,andextentoftheservicesprovidedby the Advisor and Subadvisor.
Investment Performance of the FundTheBoardreviewedthefund’sthree-month,one-year,andyear-by-yearreturns,aswellasthefund’saverageannualizedtotalreturnsoverthe3-,5-,and10-yearperiods,andcomparedthesereturnswithawidevarietyofpreviouslyagreed-uponcomparableperformancemeasuresandmarketdata,includingthosesuppliedbyLipperandMorningstar,whichareindependent providers of mutual fund data.
OnthebasisofthisevaluationandtheBoard’songoingreviewofinvestmentresultsandfactoringintherelativemarketconditionsduringcertainoftheperformanceperiods,theBoardconcludedthatthefund’sperformancewassatisfactory.
Costs, Benefits, Profits, and Economies of ScaleTheBoardrevieweddetailedinformationregardingtherevenuesreceivedbytheAdvisorundertheAdvisoryContractandotherbenefitsthattheAdvisor(anditsaffiliates,includingtheSubadvisor)mayhaverealizedfromitsrelationshipwiththefund,includinganyresearchreceivedunder“softdollar”agreementsandcommission-sharingarrangementswithbroker-dealers.TheBoardconsideredthattheAdvisorandSubadvisormayreceivesomebenefitfromsoft-dollararrangementspursuanttowhichresearchisreceivedfrombroker-dealersthatexecutetheapplicablefund’sportfoliotransactions.TheBoardreceivedinformationontheestimatedcostsincurredandprofitsrealizedbytheAdvisorfrommanagingT.RowePricemutualfunds.TheBoardalsoreviewedestimatesoftheprofitsrealizedfrommanagingthefundinparticular,andtheBoardconcludedthattheAdvisor’sprofitswerereasonableinlightoftheservicesprovidedtothefund.
TheBoardalsoconsideredwhetherthefundbenefitsunderthefeelevelssetforthintheAdvisoryContractfromanyeconomiesofscalerealizedbytheAdvisor.TheBoardnotedthat,undertheAdvisoryContract,thefundpaystheAdvisorasinglefee,orall-inclusivemanagementfee,whichisbasedonthefund’saveragedailynetassets.Theall-inclusivemanagementfeeincludesinvestmentmanagementservicesandprovidesfortheAdvisortopayallofthefund’sordinary,recurringoperatingexpensesexceptforinterest,taxes,portfoliotransactionfees,andanynonrecurringextraordinaryexpensesthatmayarise.UndertheSubadvisoryContract,theAdvisormaypaytheSubadvisorupto60%oftheadvisoryfeethattheAdvisorreceivesfromthefund.TheBoardconcludedthat,basedontheprofitabilitydataitreviewedandconsistentwiththisall-inclusivemanagementfeestructure,theAdvisoryContractprovidedforareasonablesharingofany benefits from economies of scale with the fund.
T.RowePriceInternationalStockPortfolio
Proof #4
27
Approval of Investment Management Agreement and Subadvisory Agreement (continued)
FeesTheBoardwasprovidedwithinformationregardingindustrytrendsinmanagementfeesandexpenses,andtheBoardreviewedthefund’smanagementfeerateandtotalexpenseratioincomparisonwithfeesandexpensesofothercomparablefundsbasedoninformationanddatasuppliedbyLipper.Forthesepurposes,theBoardassumedthatthefund’smanagementfeeratewasequaltotheall-inclusivemanagementfeeratelessthefund’sactualoperatingexpenses,andthetotalexpenseratiowasequaltotheall-inclusivemanagementfeerate.TheinformationprovidedtotheBoardindicatedthatthefund’smanagementfeeratewasabovethemedianforcomparablefundsandthefund’stotalexpenseratiowasatorbelowthemedian for comparable funds.
TheBoardalsoreviewedthefeeschedulesforinstitutionalaccountsandprivateaccountswithsimilarmandatesthatareadvisedorsubadvisedbytheAdvisoranditsaffiliates.ManagementprovidedtheBoardwithinformationabouttheAdvisor’sresponsibilitiesandservicesprovidedtosubadvisoryandotherinstitutionalaccountclients,includinginformationabouthowtherequirementsandeconomicsoftheinstitutionalbusinessarefundamentallydifferentfromthoseofthemutualfundbusiness.TheBoardconsideredinformationshowingthattheAdvisor’smutualfundbusinessisgenerallymorecomplexfromabusinessandcomplianceperspectivethanitsinstitutionalaccountbusinessandconsideredvariousrelevantfactors,suchasthebroaderscopeofoperationsandoversight,moreextensiveshareholdercommunicationinfrastructure,greaterassetflows,heightenedbusinessrisks,anddifferencesinapplicablelawsandregulationsassociatedwiththeAdvisor’sproprietarymutualfundbusiness.Inassessingthereasonablenessofthefund’smanagementfeerate,theBoardconsideredthedifferencesinthenatureoftheservicesrequiredfortheAdvisortomanageitsmutualfundbusinessversusmanagingadiscretepoolofassetsasasubadvisortoanotherinstitution’smutualfundorforaninstitutionalaccountandthattheAdvisorgenerallyperformssignificantadditionalservicesandassumesgreaterriskinmanagingthefundandotherT.RowePricemutualfundsthanitdoesforinstitutionalaccountclients.
Onthebasisoftheinformationprovidedandthefactorsconsidered,theBoardconcludedthatthefeespaidbythefundunder the Advisory Contract are reasonable.
Approval of the Advisory Contract and Subadvisory ContractAsnoted,theBoardapprovedthecontinuationoftheAdvisoryContractandSubadvisoryContract.Nosinglefactorwasconsideredinisolationortobedeterminativetothedecision.Rather,theBoardconcluded,inlightofaweightingandbalancingofallfactorsconsidered,thatitwasinthebestinterestsofthefundanditsshareholdersfortheBoardtoapprovethecontinuationoftheAdvisoryContractandSubadvisoryContract(includingthefeestobechargedforservicesthereunder).Theindependentdirectorswereadvisedthroughouttheprocessbyindependentlegalcounsel.
T.RowePriceInternationalStockPortfolio

Proof #4
This page intentionally left blank.

Proof #4
This page intentionally left blank.

Proof #4
2016-US-24577 E301-051 8/16
100EastPrattStreet Baltimore,MD21202

1"
1V SLIC K.eps
No background behind Service Mark With White Background
7/8"
3/4"
5/8"
1/2"
1800 North Point DriveStevens Point, WI 54481