Embed Size (px)
Citation preview
9 789793 145839
ISBN 978-979-3145-83-9
by :Erdy Santoso, Pratiwi, Erry Purnomo, Ragil S.B. Irianto,
Bambang Wiyono, Eka Novriyanti, Maman Turjaman
Selection Pathogens For Eaglewood (Gaharu) Inoculation
Selection Pathogens For Eaglewood (Gaharu) Inoculation
Production and Utilization Technologyfor Sustainable Development of Eaglewood (Gaharu)
in Indonesia
ITTO PD425/06 Rev. 1 (I)
TECHNICAL REPORT NO. 3
MINISTRY OF FORESTRY OF INDONESIAIN COOPERATION WITH
INTERNATIONAL TROPICAL TIMBER ORGANIZATIONIT OT
TECHNICAL REPORT NO. 3
R & D CENTRE FOR FOREST CONSERVATION AND REHABILITATION FORESTRY RESEARCH AND DEVELOPMENT AGENCY (FORDA)
MINISTRY OF FORESTRYINDONESIA
2011
ii
Authors : Erdy Santoso, Pratiwi, Erry Purnomo, Ragil S.B. Irianto, Bambang Wiyono, Eka Novriyanti, Maman Turjaman
Institution’s full name, address : R&D Centre for Forest Conservation and Rehabilitation; Jalan Gunung Batu No. 5 Bogor, Indonesia; e-mail : [email protected]
The place and date the report was issued
: Bogor, July 1, 2011.
Disclaimer : Copyright @ 2011
This Proceeding is a part of Program ITTO PD425/06 Rev. 1 (I) : Production and Utilization Technology for Sustainable Development of Gaharu (Gaharu) in Indonesia
Published by : Indonesia’s Work Programme for 2011 ITTO PD425/06 Rev.1 (I)R&D Centre for Forest Conservation and RehabilitationJalan Gunung Batu No. 5 Bogor, IndonesiaPhone :62-251-8633234Fax :62-251-8638111E-mail : [email protected]
ISBN : 978-979-3145-83-9
Cover by : Bintoro
Project number : PD425/06 Rev. 1 (I)
Host Government : Indonesia
Name of the Executing Agency and Project Coordinator
: Forestry Research and Development Agency (FORDA), Dr. Ir. Maman Turjaman, DEA
Starting date of the project : May 1, 2008
Duration of the project : 36 months
iii
PREFACE
This technical report entitled “The Selection Pathogen for Eaglewood (Gaharu) Inoculation” consists of (1) Evaluating Basic Properties of Gaharu Stands; (2) Evaluating the Existing Inoculation Engineering Technique; (3) Developing a Better Technique from the Existing Inoculation Engineering Technique; (4) Characterizing and Evaluating Gaharu Product; (5) Visiting Study on the Experiment Gaharu Plantation and Inoculation Technology in Taiwan/Saudi Arabia. This report provides infornation which is quite essential regarding the best pathogen selection to be inoculated into the gaharu-yielding trees, whereby the gaharu is massively produced.
This output depicts the process in selecting gaharu-developing pathogen, and scrutinizes the analysis on chemical compounds in gaharu as developed. In addition, there were also reported the characters of gaharu products that resulted from induction. As the comparison, several researchers conducted a comparative study by visiting Taiwan, which was related to the gaharu-inoculation technology, as has been already developed there. Meanwhile, a visit to Saudi Arabia intended to look into the preference of Arab community to gaharu products resulting from induction, which was conducted in Indonesia.
After all, this technical report can expectedly bring benefits to the decision makers in gaharu development and to the field practitioners in Indonesia.
Maman TurjamanProject Coordinator ITTO PD425/06 Rev.1 (I)R & D Centre for Forest Conservation and RehabilitationFORDA, the Ministry of Forestry, Indonesia

v
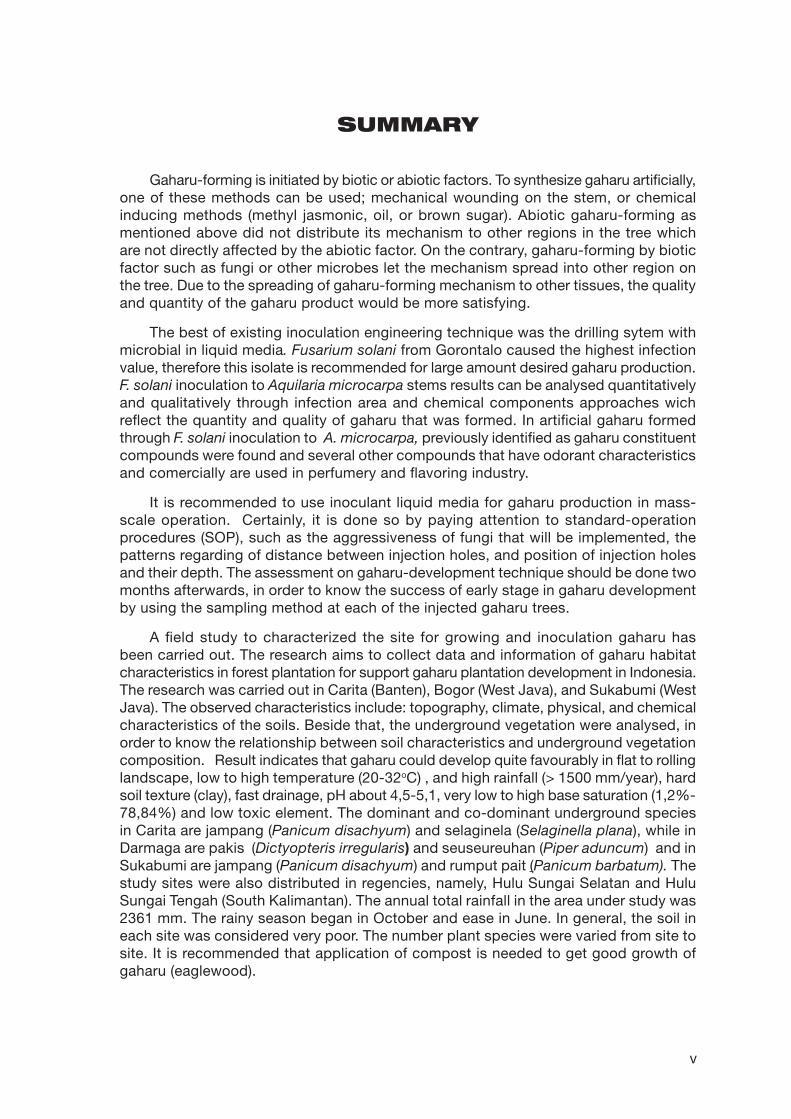
SUMMARY
Gaharu-forming is initiated by biotic or abiotic factors. To synthesize gaharu artificially, one of these methods can be used; mechanical wounding on the stem, or chemical inducing methods (methyl jasmonic, oil, or brown sugar). Abiotic gaharu-forming as mentioned above did not distribute its mechanism to other regions in the tree which are not directly affected by the abiotic factor. On the contrary, gaharu-forming by biotic factor such as fungi or other microbes let the mechanism spread into other region on the tree. Due to the spreading of gaharu-forming mechanism to other tissues, the quality and quantity of the gaharu product would be more satisfying.
The best of existing inoculation engineering technique was the drilling sytem with microbial in liquid media. Fusarium solani from Gorontalo caused the highest infection value, therefore this isolate is recommended for large amount desired gaharu production. F. solani inoculation to Aquilaria microcarpa stems results can be analysed quantitatively and qualitatively through infection area and chemical components approaches wich reflect the quantity and quality of gaharu that was formed. In artificial gaharu formed through F. solani inoculation to A. microcarpa, previously identified as gaharu constituent compounds were found and several other compounds that have odorant characteristics and comercially are used in perfumery and flavoring industry.
It is recommended to use inoculant liquid media for gaharu production in mass-scale operation. Certainly, it is done so by paying attention to standard-operation procedures (SOP), such as the aggressiveness of fungi that will be implemented, the patterns regarding of distance between injection holes, and position of injection holes and their depth. The assessment on gaharu-development technique should be done two months afterwards, in order to know the success of early stage in gaharu development by using the sampling method at each of the injected gaharu trees.
A field study to characterized the site for growing and inoculation gaharu has been carried out. The research aims to collect data and information of gaharu habitat characteristics in forest plantation for support gaharu plantation development in Indonesia. The research was carried out in Carita (Banten), Bogor (West Java), and Sukabumi (West Java). The observed characteristics include: topography, climate, physical, and chemical characteristics of the soils. Beside that, the underground vegetation were analysed, in order to know the relationship between soil characteristics and underground vegetation composition. Result indicates that gaharu could develop quite favourably in flat to rolling landscape, low to high temperature (20-32oC) , and high rainfall (> 1500 mm/year), hard soil texture (clay), fast drainage, pH about 4,5-5,1, very low to high base saturation (1,2%-78,84%) and low toxic element. The dominant and co-dominant underground species in Carita are jampang (Panicum disachyum) and selaginela (Selaginella plana), while in Darmaga are pakis (Dictyopteris irregularis) and seuseureuhan (Piper aduncum) and in Sukabumi are jampang (Panicum disachyum) and rumput pait (Panicum barbatum). The study sites were also distributed in regencies, namely, Hulu Sungai Selatan and Hulu Sungai Tengah (South Kalimantan). The annual total rainfall in the area under study was 2361 mm. The rainy season began in October and ease in June. In general, the soil in each site was considered very poor. The number plant species were varied from site to site. It is recommended that application of compost is needed to get good growth of gaharu (eaglewood).
Chemical analysis were carried out on artificial gaharu produced by inoculating Fusarium sp. from some origin to A. microcarpa, which were Bahorok, Tamiang Layang (Central Kalimantan), Mentawai, and Maluku. Though quantitatively or infection site area, there was indifferent effect of origins, but it was revealed that there were distinctions in compounds composition and relative concentration. Artificial gaharu produced by inoculating Fusarium sp. of Tamiang Layang’s (Central Kalimantan) origin showed the highest confirmed constituents of gaharu but isolate of Maluku’s origin noted to have the highest total concentration of odorant compounds.
Bioinducement for gaharu development at Aquilaria crassna trees in Taiwan was conducted using the so-called infuse system, whereby such inducement was done as deep 80% inward as the tree diameter, thereby touching the tree pith. Due fungi inducement, sooner or later the pith would decay or become rotten. It turned out that 2 years after the inducement, the gaharu developed as thick as 1-2 mm, which shaped like a pipe. From the observation on gaharu development, there did not occur the outward thickening during the gaharu development. The inoculant as induced comprised the combined isolates between those from consecutively China, Vietnam, and Cambodia. The drawback of this technology was that the pith became rotten and physically destroyed, and the outward gaharu-development did not occur thereby reaching gaharu thickness of only 1-2 mm.
vii
LIST OF CONTENTS
PREFACE ........................................................................................iii
SUMMARY ...................................................................................... v
LIST OF CONTENTS .......................................................................vii
LIST OF TABLE .............................................................................. ix
LIST OF FIGURE ............................................................................. xi
1. INTRODUCTION..........................................................................1
2. APPLIED METHODOLOGY .........................................................32.1 Evaluating basic properties of gaharu stands ....................................................3
2.2 Evaluating the existing inoculation engineering technique .................................4
2.3 Developing a better technique from the existing inoculation engineering technique ............................................................................................................4
2.4 Characterizing and evaluation gaharu product ..................................................7
2.5 Visiting gaharu plantation and comparative study of inoculation technology ....9
3. PRESENTATION OF THE DATA .................................................113.1 Evaluating basic properties of gaharu stands ..................................................11
3.2 Evaluating the Existing inoculation enggineering technique ............................24
3.3 Visiting gaharu plantation and comparative study of inoculation technology ..35
4. ANALYSIS AND INTERPRETATION OF THE DATA
AND RESULTS ..........................................................................374.1 Evaluating basic properties of gaharu stands ..................................................37
4.2 Evaluating the existing inoculation engineering technique ..............................38
4.3 Developing a better technique from the existing inoculation engineering technique ..........................................................................................................38
4.4 Characterizing and evaluation gaharu product ................................................39
4.5 Visiting gaharu plantation and comparative study of inoculation technology ..40
5. CONCLUSIONS ........................................................................41
6. RECOMMENDATIONS ..............................................................43
7. IMPLICATIONS FOR PRACTICE ................................................45ANNEX ..........................................................................................47
BIBLIOGRAPHY ............................................................................59

ix
LIST OF TABLE
Table 1. The fungal isolates were used in this experiment from different location .........5
Table 2. Soil physical properties of Darmaga research ................................................11
Table 3. Soil physical properties of Carita research site ...........................................12
Table 4. Soil physical properties of Sukabumi research site ......................................12
Table 5. Soil chemical characteristics in Darmaga research site (Bogor) ...................13
Table 6. Soil chemical characteristics in Carita research site .....................................14
Table 7. Soil chemical characteristics in Sukabumi research site ..............................14
Table 8. Total undeground species and its family in the research sites ........................15
Table 9. Important Value of underground species in Carita ..........................................16
Table 10. Important Value of underground species in Darmaga .....................................17
Table 11. Important Value of underground species in Sukabumi ...................................17
Table 12. Similarity Index (%) of plant communities at research sites ...........................17
Table 13. Evaluating the existing inoculation engineering technique .............................24
Table 14. Liquid media inoculation engineering technique to Aquilaria and Gyrinops ...24
Table 15. Further Duncan test two months after inoculation ..........................................25
Table 16. Components in gaharu resulted through inoculation of Fusarium sp. to A. microcarpa ......................................................................................................28
Table 17. Components in gaharu resulted through inoculation of Fusarium sp. originated from various regions to A. microcarpa which have important odorant characteristics ...................................................................................33
Table 18. Compounds listed as in several references were known as defense mechanism in particular plants and were detected in gaharu resulted through inoculation .........................................................................................34
Table 19. Chemical compounds in leaf of three gaharu tree species .............................34

xi
LIST OF FIGURE
Figure 1. Procedure of gaharu technology inoculation. ..................................................6
Figure 2. Injection equipment for gaharu liquid inoculant with dosage. .........................6
Figure 3. Collecting samples of gaharu-forming after inoculation by Fusarium spp. .....8
Figure 4. Vegetation analyses underground vegetation of gaharu tree stands ............16
Figure 5. The selected study sites ................................................................................18
Figure 6. The rainfall, air temperature and relative humidity for the last 9 years .........18
Figure 7. Particle fraction analysis of each soil ............................................................19
Figure 8. The total soil C content for each site .............................................................19
Figure 9. The total N of soil for each site .....................................................................20
Figure 10. Total K content of soil for each site ...............................................................20
Figure 11. Total P content of soil for each site ..............................................................21
Figure 12. Soil pH for each site ......................................................................................21
Figure 13. Electrical conductivity readings for soil each site .........................................22
Figure 14. Cation exchange capacity of soil for each site ..............................................22
Figure 15. CO2 evolution from soil from each site .........................................................23
Figure 16. The number of plant species found in each site ............................................23
Figure 17. Infection of inoculant to A. microcarpa .........................................................26
Figure 18. Growth of infection length at stem A. microcarpa ........................................26
Figure 19. The infection length on A. microcarpa stems six months after inoculation with isolate origins as differentiator .............................................27

1
1INTRODUCTION
Gaharu (eaglewood) is one of non timber forest products (NTFPs) which plays an important role in gaining foreign exchange and as a source of income people living inside and around the forest in Indonesia. The gaharu is one of important aromatic woods, therefore this non timber forest product is now subject to high rate of commercial extraction. There are several species of trees that produce gaharu. The original gaharu comes from infected trees of tropical species, such as Aquilaria spp., Gonystylus spp., Wikstromiae spp., Enkleia spp., Aetoxylon spp., and Gyrinops spp. (Chakrabarty et al., 1994, Sidiyasa et al., 1986). This research consider two genera, that are Aquilaria and Gyrinops. These genera belongs to the family Thymelaeaceae. Due to the high economic value of these genera, their existences should be sustained by doing several efforts. One of the efforts is developing gaharu plantation in several areas. More over, several information concerning gaharu habitat are inventarized, including soil characteristics as well as underground vegetation composition, in order to know the carrying capacity of the land.
Soil is one of the ecosystem components, has an important role as life supporting system, beside water, air and sun energy. Pratiwi and Mulyanto, (2000) and Jenny (1941) said that soil is the result of weathering processes of rocks or parent material by climatic factors and vegetation, and influenced by topographic factors and time. Specific soil characteristics influence the composition of the vegetation down to the type of dominant species (Pratiwi, 1991). Furthermore Pratiwi and Mulyanto (2000) said that the distribution of plants, soil types and the climate (including the microclimates) must be considered as part of the integrated ecosystem. Therefore the variability of vegetation depend on these factors. According to the above background the aims of this research is to collect data and information of gaharu habitat characteristics in forest plantation in order to support gaharu plantation development in Indonesia. This research was done by making research plots for soil and underground vegetation investigation. It is expected that this information could support the development of gaharu plantation, therefore its exsistence could be sustained as well as increase people income and their prosperity.
Gaharu is a phytoalexin compound which is a secondary metabolites in gaharu trees as a defense mechanism. Healthy gaharu trees never produce fragrant sesquiterpenoid as secondary metabolites (Yuan, referenced in Isnaini 2004). Plants synthesize and accumulate secondary metabolites as responses to particular agent infections, physiological stimulus, or stress (Goodman et al., referenced in Isnaini 2004). Secondary metabolites or plants extractive substances can be effective against plant diseases and pests due to analogy with particular vital component from celluler signals or related to vital enzymes and blocks metabolism pathways (Forestry Commission GIFNFC, 2007). Secondary metabolites on terrace wood can be tree’s defense toward distructive agents even though its influence varies depends on the habitat (Hills, 1987). Secondary metabolites concentration also varies between species, tissues (the highest concentration is in dermal, terrace wood, root, branch base, and wounded tissues), between trees in the same species, inter-species, and seasons (Forestry Commision GIFNFC, 2007).
2
Information about chemicals that gaharu contains is important in product usage. Gaharu chemicals information will be required in product standard system based on chemicals composition it contains, therefore leads to the uniformity of product quality determination in practice. Gaharu chemical study will be the gate for discovery of novel compounds and novel benefits, the gaharu biosynthesis pathway itself, possibly leading to produce compounds synthetically or expand the compounds utilization with biotechnology, and many other development opportunities. Nevertheless, efforts in continous research are to be taken in order to discover the unknown.
The objective of this technical report was to select pathogen for eaglewood (gaharu) inoculation. This technical report consists of (1) evaluating basic properties of gaharu stands; (2) evaluating the existing inoculation engineering technique; (3) developing a better technique from the existing inoculation engineering technique; (4) characterizing and evaluating gaharu product; (5) visiting study on the experiment gaharu plantation and inoculation technology in Taiwan/Saudi Arabia.
3
2APPLIED METHODOLOGY
2.1 Evaluating basic properties of gaharu stands
2.1.1 Gaharu stands in KHDTK Carita (Banten) and West Java
The soil and underground vegetation were sampled on gaharu plantation in the research areas. The plots were selected on the basis of the soil map of West Java and Madura, at scale of 1: 500000 prepared by Lembaga Penelitian Tanah, 1962. Soil samples were taken from identified horizon in all pedons. Two kind of soil samples were collected: bulk samples for routine physico-chemical analyses, and undisturbed unoriented samples for physical analyses. The composite soil samples were taken from depth of 0-30 cm; 30-60 cm and >60 cm in each research sites. In every soil depth, soil samples were taken from 20 points which distribute in each horizon. Then soil samples were mixed according its depth. The total composite soil sample from each location are 6 samples (3 for soil physical analyses and 3 for soil chemical analyses). Therefore there are 18 soil samples.
Underground vegetation analyses were done using the square method (Mueller-Dumbois and Ellenberg, 1974). On every place five transect of 100 m length at distance of 20 m were laid. Every transects is split up in squares of 5 x 5 m, and the distance between the squares is 20 m. Each vegetation individual inside the square was identified like: species, number of individual, and basal area. The routine physico-chemical analyses were carried out mainly according to the methods described in ”Procedures for collecting samples and methods of analyses for Soil Survey Report No.I” (Soil Conservation Service, 1984) unless otherwise mentioned. All data were reported on the basis of the < 2 mm material (fine earth). Organic carbon was determined according to the method of Walkey and Black (Allison, 1965). The involves a wet combustion of the organic matter with a mixture of potassium dichromate and sulphuric acid. After reaction the residual dichromate is titrated against ferrous sulphate. Total nitrogen was determined according to the macro Kjedahl method. For analyses available Phosphorus, two gram of air dry soil sample was shaken for 5 minutes with 20 ml pf Bray 1 extracting reagent (0,05 N NH4F and 0,025 N HCl, pH 2,6). The extractable P was determined colorimetrically with Amonium molybdate reagent. For the CEC of the soil, 1 M NH4OAC pH 7 was used for saturation, and the adsorbed NH+ was then displaced by acidified KCl 1 N. After distillation, titration was done with dilute HCl 0,001 N. CEC sum was calculated from the exchangeable basic cations and the exchangeable acidity. Ca, Mg, K and Na were determined in the NH4Oac extraction solution by AAS. The acidity (H+ + Al3+) released upon exchange by an unbuffered KCl solution. Calculated by dividing the sum of exchangeable Ca, Mg, K, and Na with the CEC (NH4Oact pH 7) and multiplying by 100.
Physical and chemical analyses were calculated based on the formula of procedures and standard analyses of every soil characteristics. Soil data were analysed and intepreted in relation with the existing underground vegetation. From all vegetation data, the frequency, dominancy, density and Important Value (IV) were calculated. The similarity
Tec hn i c a l Repo r t No.3Selection Pathogens For Eaglewood (Gaharu) Inoculation
4
index (SI) was calculated by using Sorensen methode (Mueller-Dumbois and Ellenberg, 1974). For the calculation of SI, the formula is:
SI = 2 w a + b
with:
SI = Similarity Indexw = the sum of the smallest IV for the same species which were found in two
compared communities (A and B)a = the sum of IV for all species in community Ab = the sum of IV for all species in community B
2.2 Evaluating the existing inoculation engineering technique
Evaluation regarding the inoculation technique of gaharu development which was already conducted on the methods as done by the inhabitant community around the forests in South Kalimantan and West Kalimantan comprised the injection using the used-oil and sugar. The technology of gaharu development using nails was also already done in several regions such as Bangka Island, West Kalimantan, South Kalimantan, Sukabumi Regency, and Lombok Island. The use of technology to develop chemical substances, such as jasmonic acid and coconut oil has been evaluated regarding their development advancement in Kalimantan. The advancement of technology about the use of fungi for gaharu development using solid and liquid media was already assessed in depth during the course of this project at several regions in Indonesia.
2.3 Developing a better technique from the existing inoculation engineering technique
Materials that were used in this activity is 21 isolates of Fusarium spp. Which were inoculated in Laboratory of Forest Microbiology, R&D Centre for Forest Conservation and Rehabilitation, Bogor. The fungal isolates were isolated from Aquilaria spp. stems which have shown gaharu forming naturally. Aquilaria spp. stems were taken from various gaharu-producing trees in Java, Kalimantan, Sumatera, Maluku, West Nusa Tenggara, and Sulawesi (Tabel 1). The medium for growing the fungi was Potato Dextrose Agar (PDA). The inoculation targets of the Fusarium spp. isolates were 13 years-old A. microcarpa trees. The fungi isolates used in this research were originated from Gorontalo, jambi, West Kalimantan, and Padang (West Sumatera). Inoculation tools were electric drills, 3 mm-sized drills, generator set, and many others.
APPLIED METHODOLOGYDeveloping a better technique from the existing inoculation engineering technique
5
Table 1. The fungal isolates were used in this experiment from different location
No Isolate codes Origins
1 Ga 1 Kalimantan Tengah
2 Ga 2 Maluku
3 Ga 3 Sukabumi
4 Ga 4 Kalsel
5 Ga 5 Kaltim
6 Ga 6 Belitung
7 Ga 7 Riau
8 Ga 8 Bengkulu
9 Ga 9 Jambi
10 Ga 10 Sumatera Barat
11 Ga 11 Gorontalo
No Isolate codes Origins
12 Ga 12 Lampung
13 Ga 13 Bengkulu
14 Ga 14 Bogor
15 Ga 15 Mentawai
16 Ga 16 Kaltim LK
17 Ga 17 Kalbar
18 Ga 18 Yanlapa
19 Ga 19 NTB
20 Ga 20 Kalsel MIC
21 Ga 21 Kalteng TL
Prior to identification, each colonies were grown in PDA medium in petri dishes, and then incubated in room temperature for seven days. Morphology observation was carried under parameter microscope. The observed parameters were colony diameter, horizontally and vertically, colony color, and miselium aerial presence. The observation for identification also cover the characteristics of macroconidium, microconidium, and the shape of conidiophore. The culture preparation was made by removing a small cut of the fungi isolates using a 5 mm-sized cork borer, placing them each on top of an object glass, and covering them with cover glasses. The slides were then incubated in a closed chamber with mantained moisture (by putting sterile aquadest-wetted cotton inside). After seven days, colonies that have grown on object slides were stained and their the shape and miselium were observed under microscope.
The sample trees were Aquilaria microcarpa grown in Carita Research Forest. In this area there were 360 gaharu trees. The Completely Randomized Design (CRD) was used with isolate origins as observed treatments (I), which were Fusarium spp. From Gorontalo (II); West Kalimantan (12); Jambi (13), and Padang (14) and also mix of these four isolates (15). Each isolates were inoculated with three times as repetitions.
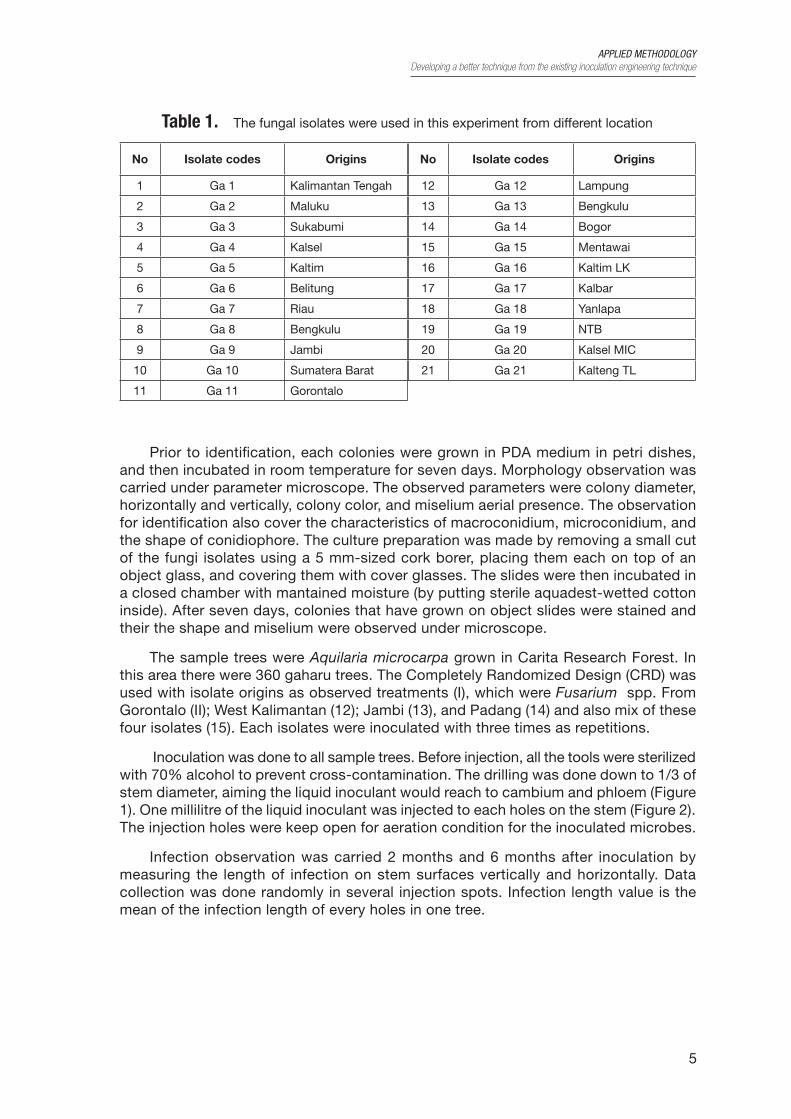
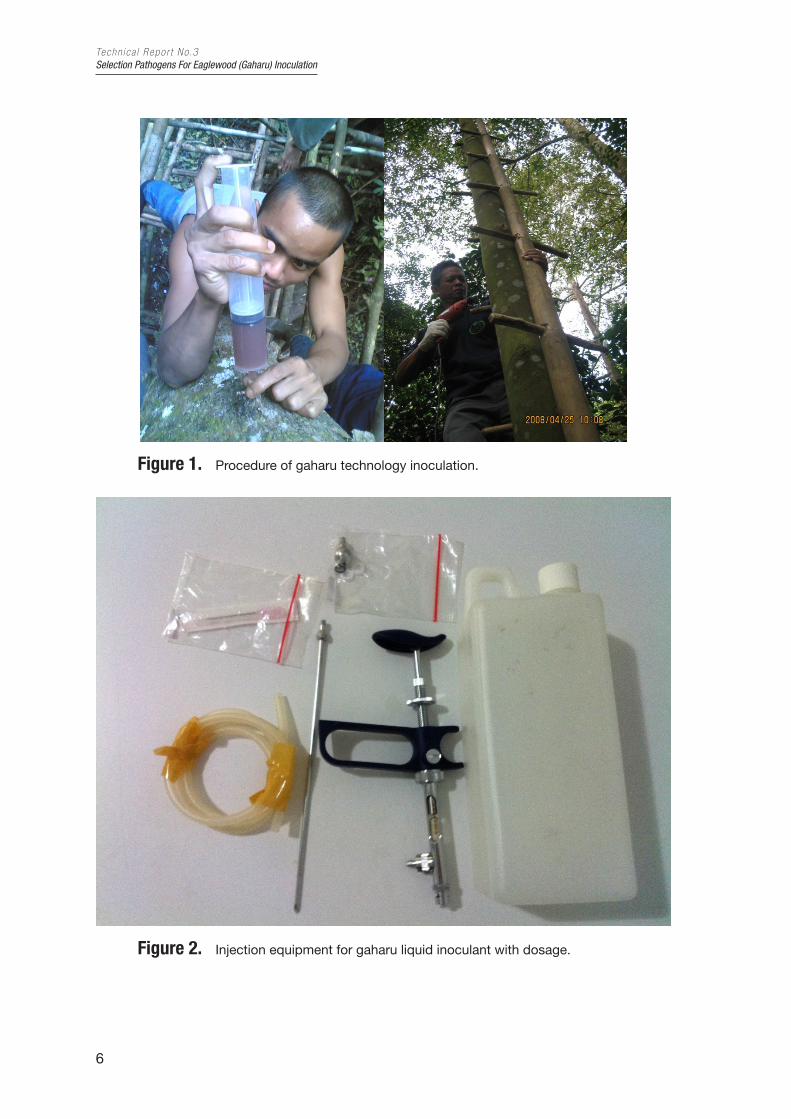
Inoculation was done to all sample trees. Before injection, all the tools were sterilized with 70% alcohol to prevent cross-contamination. The drilling was done down to 1/3 of stem diameter, aiming the liquid inoculant would reach to cambium and phloem (Figure 1). One millilitre of the liquid inoculant was injected to each holes on the stem (Figure 2). The injection holes were keep open for aeration condition for the inoculated microbes.
Infection observation was carried 2 months and 6 months after inoculation by measuring the length of infection on stem surfaces vertically and horizontally. Data collection was done randomly in several injection spots. Infection length value is the mean of the infection length of every holes in one tree.
Tec hn i c a l Repo r t No.3Selection Pathogens For Eaglewood (Gaharu) Inoculation
6
Figure 1. Procedure of gaharu technology inoculation.
Figure 2. Injection equipment for gaharu liquid inoculant with dosage.
APPLIED METHODOLOGYCharacterizing and evaluation gaharu product
7
2.4 Characterizing and evaluation gaharu product
2.4.1 Preparation of liquid Fusarium sp. isolate
Fusarium sp. was at first cultured in potato dextrose agar (PDA). PDA media was prepared by boiling 100 g of potatoes in 1000 ml of water until obtaining potato extract; to the extract was then added 15 g of dextrose and 20 g of agar extract, and the mixture was subsequently reheated over the bunsen gas burner until reaching 100oC. The mycelium of Fusarium sp. was cultivated on the PDA media, which have been placed in petri dish, where the media was previously in room temperature condition. Further, the petri dish with its content was incubated in room temperature. All the activities proceeded aseptically. Meanwhile, media for liquid isolat was also prepared with the procedures as follows: 100 g of potatoes was boiled in 1000 ml of water until the extract was obtained; to the extract was added 15 g of dextrose; and the mixture was then reheated. As much as 600 ml of the mixture was taken, then put into isolation bottle measuring 1000 ml, and further allowed to cool down. Afterwards, to the bottle containing this liquid media was put cut pieces of Fusarium sp. isolat, which previously has been cultured in PDA media. The bottles containing isolats were marked with labels and shaken using a shaker machine for about one week. When, isolation activities were about to be done, the liquid isolat was at first blended in blending machine to obtain homogenous inoculum in juice form thereby being easily injected into gaharu-producing trees.
2.4.2 Inoculation
The sample gaharu trees were of A. microcarpa species growing in Carita Research Forest situated in Banten Province. The arrangement of this research corresponded to a completely randomized design with Fusarium sp. isolat origin regarded as treatment comprising the isolats with origins from consecutively Gorontalo, West Kalimantan, Jambi, and Padang, as well as the mixture containing those four isolats. Each of the isolate was inoculated into three trees then regarded as three replicates. The inoculation was performed on all tree samples. Before inoculation (injection), all the related apparatus/devices should be at first sterilized with 70% alcohol to avoid possible contamination by microbes or other microorganisms. The drilling into the tree stems was carried out until it reached depth about a third diameter inside the stems. In this way, the liquid inoculum during injection could reach the cambium and phloem inside the stems. The injection holes were left open to provide aerated condition for the isolate.
2.4.3 Observation and procuring of gaharu samples
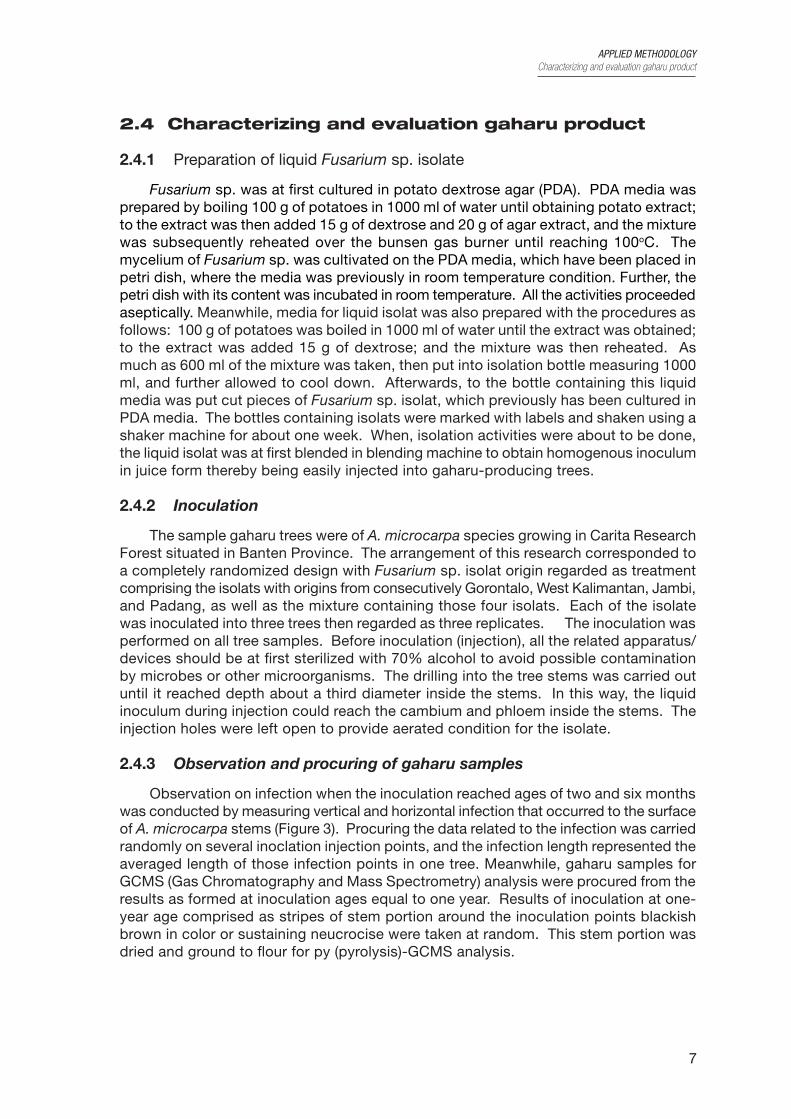
Observation on infection when the inoculation reached ages of two and six months was conducted by measuring vertical and horizontal infection that occurred to the surface of A. microcarpa stems (Figure 3). Procuring the data related to the infection was carried randomly on several inoclation injection points, and the infection length represented the averaged length of those infection points in one tree. Meanwhile, gaharu samples for GCMS (Gas Chromatography and Mass Spectrometry) analysis were procured from the results as formed at inoculation ages equal to one year. Results of inoculation at one-year age comprised as stripes of stem portion around the inoculation points blackish brown in color or sustaining neucrocise were taken at random. This stem portion was dried and ground to flour for py (pyrolysis)-GCMS analysis.
Tec hn i c a l Repo r t No.3Selection Pathogens For Eaglewood (Gaharu) Inoculation
8
Figure 3. Collecting samples of gaharu-forming after inoculation by Fusarium spp.
In addition, some samples of leaf gaharu trees were analyzed to know chemical compounds i.e. alkaloid, tanin, flavonoid, saponin, steroid, triterpenoid, and antioxidan. Three gaharu tree species were analyzed. The gaharu tree species were Aquilaria crassna, A. microcarpa, and Gyrinops versteegii.
2.4.3.1 Analysis of py-GCMS
Gaharu flour was prepared for the pyrolysis GCMS analysis using apparatus the so-called Schimadzu GCMS-QP2010. This analysis used helium (He) gas as a carrier with the flow speed 0.8 ml/min, equipped with capillary column HP 5MS (measuring 60 mm x 0.25 mm, thick film 0.25 µm) operated using electron impact (EI) mode at 70 eV and ion-source temperature 200oC. Injection was performed in split mode comprising isothermal 50oC for 5 minutes, then increased to 280oC in 30 minutes, and afterwards maintained up to 60 minutes. Identification of compounds was carried out based on retention time and MS analysis. Prior to the analysis of samples, the GCMS apparatus was calibrated using pure compound identified as methyl stearic.
2.4.3.2 Data analysis
The resulting data as obtained from infection occurrence on the stem surface were presented and processed descriptively, and further statistically assessed using analysis of variance. When the effect of treatment turned out to be significant, data assessment was carried out further with a Duncan test. Data and pictogram of chemical components in gaharu in each sample were analyzed and presented descriptively.
APPLIED METHODOLOGYVisiting gaharu plantation and comparative study of inoculation technology
9
2.5 Visiting gaharu plantation and comparative study of inoculation technology
This activity was based on ITTO letter with Ref. No. F.10-0219 on September 15, 2010. Dr. Erdy Santoso, Ir. Atok Subiakto, M.Sc, and Dr. Maman Turjaman visited to comparative study in Taiwan on December 23-26, 2011. Two Director Generals and Two Directors from Ministry of Forestry Indonesia also followed and discussed with reperesentative Indonesian Trade Chamber in Taiwan, gaharu company, and Chiayi University. We disscussed about gaharu export-import, gaharu products made by company, gaharu tree cultivation, and gaharu induction technology developed by Chiayi University collaboration with a private company. Dr. Erdy Santoso and Dr. Maman Turjaman visited to Saudi Arabia on March 15-24, 2011. They brought some samples of gaharu induction by fungi.

11
3PRESENTATION OF THE DATA
3.1 Evaluating basic properties of gaharu stands
3.1.1 Physical properties
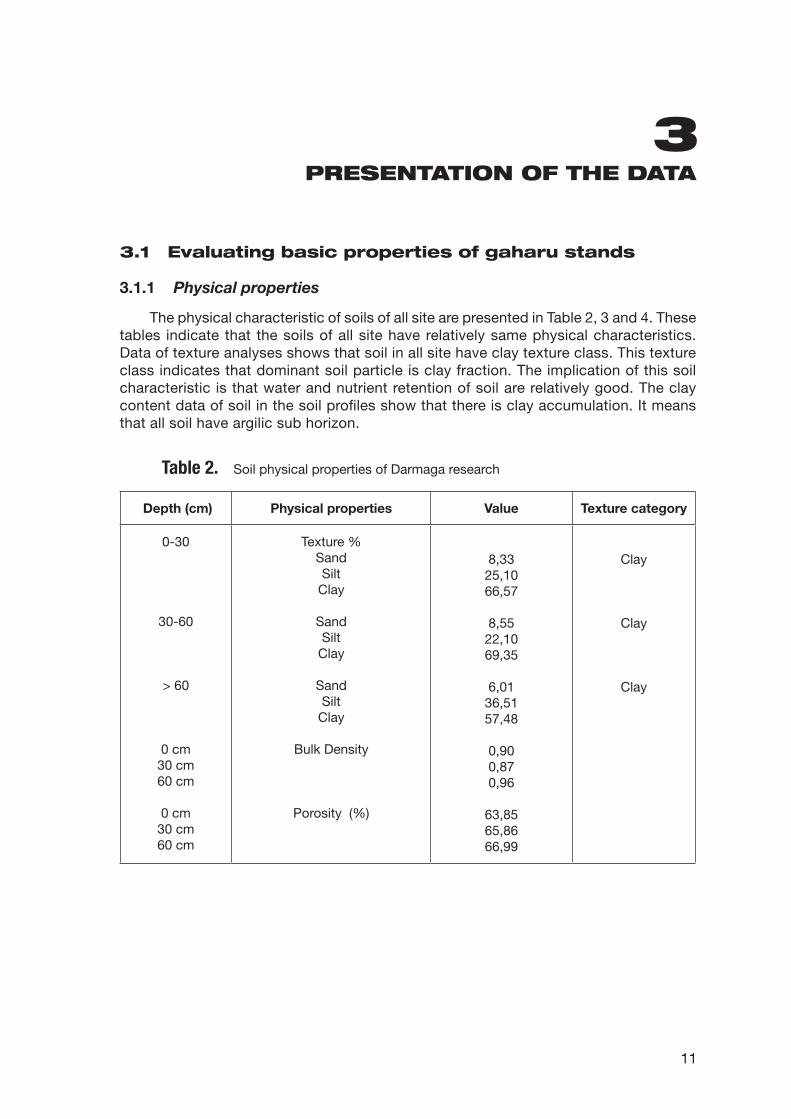
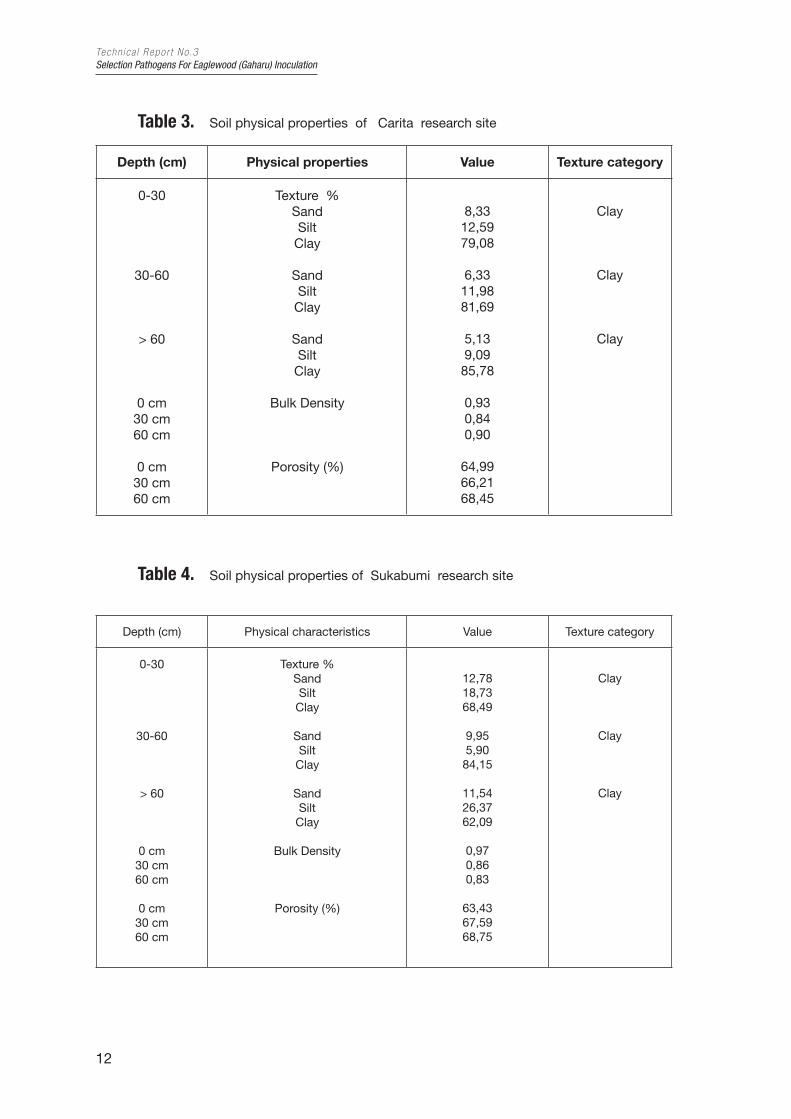
The physical characteristic of soils of all site are presented in Table 2, 3 and 4. These tables indicate that the soils of all site have relatively same physical characteristics. Data of texture analyses shows that soil in all site have clay texture class. This texture class indicates that dominant soil particle is clay fraction. The implication of this soil characteristic is that water and nutrient retention of soil are relatively good. The clay content data of soil in the soil profiles show that there is clay accumulation. It means that all soil have argilic sub horizon.
Table 2. Soil physical properties of Darmaga research
Depth (cm) Physical properties Value Texture category
0-30
30-60
> 60
0 cm30 cm60 cm
0 cm30 cm60 cm
Texture %SandSilt
Clay
SandSilt
Clay
SandSilt
Clay
Bulk Density
Porosity (%)
8,3325,1066,57
8,5522,1069,35
6,0136,5157,48
0,900,870,96
63,8565,8666,99
Clay
Clay
Clay
Tec hn i c a l Repo r t No.3Selection Pathogens For Eaglewood (Gaharu) Inoculation
12
Table 3. Soil physical properties of Carita research site
Depth (cm) Physical properties Value Texture category
0-30
30-60
> 60
0 cm30 cm60 cm
0 cm30 cm60 cm
Texture %SandSilt
Clay
SandSilt
Clay
SandSilt
Clay
Bulk Density
Porosity (%)
8,3312,5979,08
6,3311,9881,69
5,139,0985,78
0,930,840,90
64,9966,2168,45
Clay
Clay
Clay
Table 4. Soil physical properties of Sukabumi research site
Depth (cm) Physical characteristics Value Texture category
0-30
30-60
> 60
0 cm30 cm60 cm
0 cm30 cm60 cm
Texture %SandSilt
Clay
SandSilt
Clay
SandSilt
Clay
Bulk Density
Porosity (%)
12,7818,7368,49
9,955,9084,15
11,5426,3762,09
0,970,860,83
63,4367,5968,75
Clay
Clay
Clay
PRESENTATION OF THE DATAEvaluating basic properties of gaharu stands
13
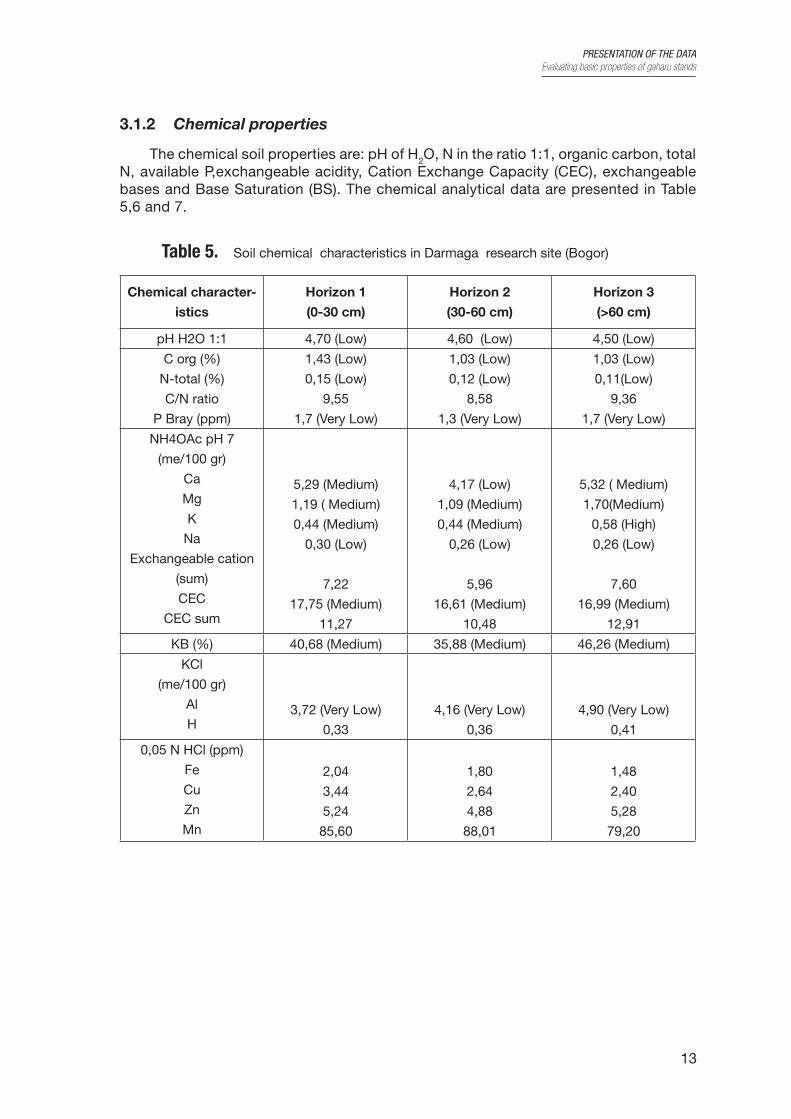
3.1.2 Chemical properties
The chemical soil properties are: pH of H2O, N in the ratio 1:1, organic carbon, total N, available P,exchangeable acidity, Cation Exchange Capacity (CEC), exchangeable bases and Base Saturation (BS). The chemical analytical data are presented in Table 5,6 and 7.
Table 5. Soil chemical characteristics in Darmaga research site (Bogor)
Chemical character-
istics
Horizon 1
(0-30 cm)
Horizon 2
(30-60 cm)
Horizon 3
(>60 cm)
pH H2O 1:1 4,70 (Low) 4,60 (Low) 4,50 (Low)
C org (%)
N-total (%)
C/N ratio
P Bray (ppm)
1,43 (Low)
0,15 (Low)
9,55
1,7 (Very Low)
1,03 (Low)
0,12 (Low)
8,58
1,3 (Very Low)
1,03 (Low)
0,11(Low)
9,36
1,7 (Very Low)
NH4OAc pH 7
(me/100 gr)
Ca
Mg
K
Na
Exchangeable cation
(sum)
CEC
CEC sum
5,29 (Medium)
1,19 ( Medium)
0,44 (Medium)
0,30 (Low)
7,22
17,75 (Medium)
11,27
4,17 (Low)
1,09 (Medium)
0,44 (Medium)
0,26 (Low)
5,96
16,61 (Medium)
10,48
5,32 ( Medium)
1,70(Medium)
0,58 (High)
0,26 (Low)
7,60
16,99 (Medium)
12,91
KB (%) 40,68 (Medium) 35,88 (Medium) 46,26 (Medium)
KCl
(me/100 gr)
Al
H3,72 (Very Low)
0,33
4,16 (Very Low)
0,36
4,90 (Very Low)
0,41
0,05 N HCl (ppm)
Fe
Cu
Zn
Mn
2,04
3,44
5,24
85,60
1,80
2,64
4,88
88,01
1,48
2,40
5,28
79,20
Tec hn i c a l Repo r t No.3Selection Pathogens For Eaglewood (Gaharu) Inoculation
14
Table 6. Soil chemical characteristics in Carita research site
Chemical character-
istics
Horizon 1
(0-30 cm)
Horizon 2
(30-60 cm)
Horizon 3
(>60 cm)
pH H2O 1:1 4,60 (Low) 4,50 (Low) 4,60 (Low)
C org (%)
N-total (%)
C/N ratio
P Bray (ppm)
2,31 (Medium)
0,17 (Low)
13,59
1,70 (Very Low)
1,51 (Low)
0,14 (Low)
10,78
1,20 (Very Low)
0,71 (Very Low)
0,08 (Very Low)
8,88
1,20 (Very Low)
NH4OAc pH 7
(me/100 gr)
Ca
Mg
K
Na
Exchangeable cation
(sum)
CEC
CEC sum
1,49 (Very Low)
0,75 (Low)
0,16 (Low)
0,20 (Low)
2,60
15,77 (Low)
8,93
1,01 (Very Low)
0,53 (Low)
0,14 (Low)
0,22 (Low)
1,90
13,11 (Low)
9,79
1,00 (Very Low)
0,52 (Low)
0,13 (Low)
0,21 (Low)
1,86
13,03 (Low)
8,71
KB (%) 16,49 (Very Low) 14,49 (Very Low) 14,27 (Very Low)
KCl
(me/100 gr)
Al
H5,84 (Low)
0,49
7,36 (Low)
0,53
6,40 (Low)
0,45
0,05 N HCl (ppm)
Fe
Cu
Zn
Mn
1,72
1,64
3,00
28,48
1,00
1,68
2,60
17,08
1,04
1,52
2,80
16,40
Table 7. Soil chemical characteristics in Sukabumi research site
Chemical character-
istics
Horizon 1
(0-30 cm)
Horizon 2
(30-60 cm)
Horizon 3
(>60 cm)
pH H2O 1:1 5,10 (Low) 5,10 (Low) 4,60 (Low)
C org (%)
N-total (%)
C/N ratio
P Bray (ppm)
1,60 (Low)
0,15 (Low)
10,67
3,90 (Very Low)
2,07 (Medium)
0,18 (Low)
11.50
3,70 (Very Low)
1,01 (Low)
0,11 (Low)
9,18
3,40 (Very Low)
PRESENTATION OF THE DATAEvaluating basic properties of gaharu stands
15
Chemical character-
istics
Horizon 1
(0-30 cm)
Horizon 2
(30-60 cm)
Horizon 3
(>60 cm)
NH4OAc pH 7
(me/100 gr)
Ca
Mg
K
Na
Echangeable cation
(sum)
CEC
CEC sum
16,98 (High)
10,52 (Very high)
0,71 (High)
0,36 (Medium)
28,57
41,07 (Very high)
31,14
16,99 (High)
10,94 (Very high)
0,40 (Medium)
0,43 (Medium)
28,76
36,48 (High)
31,82
14,64 (High)
10,05 (Very high)
0,22 (Low)
0,22 (Low)
25,15
39,35 (High)
31,97
KB (%) 69,56 (High) 78,84 (Very high) 63,86 (High)
KCl
(me/100 gr)
Al
H2.32 (Very Low)
0,25
2,76 (Very Low)
0,30
6,40 (Low)
0,42
0,05 N HCl (ppm)
Fe
Cu
Zn
Mn
0,52
1,20
1,40
17,00
0,36
1,12
1,56
22,12
0,32
1,44
1,56
26,36
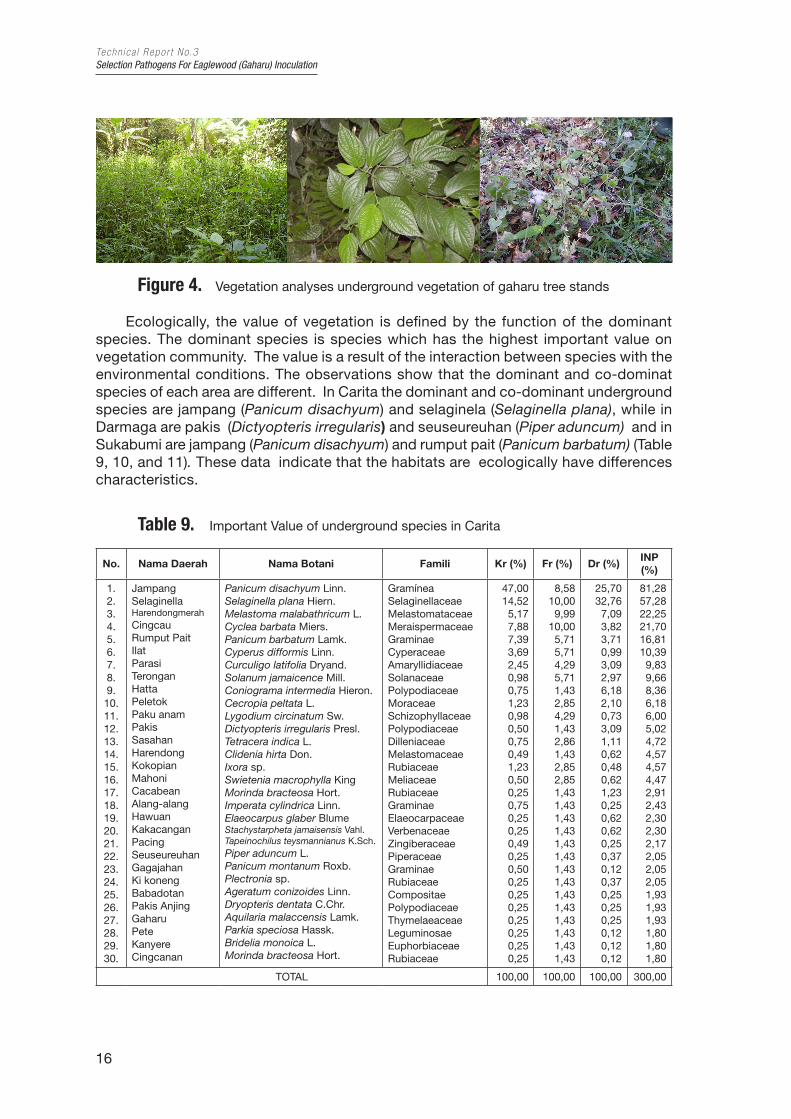
3.1.2.1 Vegetation properties of the studied areas
The vegetation analyses were carried out mainly for underground vegetation in Carita, Darmaga and Sukabumi areas (Figure 4). These areas are gaharu plantation and the dominant tree, sapling and pole stages mainly gaharu. Therefore the vegetation analyses was mainly stressed in underground vegetation. The observation shows that in Carita the underground vegetation is higher than that in Sukabumi and Darmaga (Table 8).
Table 8. Total undeground species and its family in the research sites
Research sites Total Species Total Family
Carita
Darmaga
Sukabumi
30
8
6
18
16
3
This condition seems due to the difference in plantation system. In Carita the gaharu is mixed with multipurpose trees species, while in Sukabumi and Darmaga the gaharu are planted in monoculture system. The conditions of Carita support some seedling from other species.
Tec hn i c a l Repo r t No.3Selection Pathogens For Eaglewood (Gaharu) Inoculation
16
Figure 4. Vegetation analyses underground vegetation of gaharu tree stands
Ecologically, the value of vegetation is defined by the function of the dominant species. The dominant species is species which has the highest important value on vegetation community. The value is a result of the interaction between species with the environmental conditions. The observations show that the dominant and co-dominat species of each area are different. In Carita the dominant and co-dominant underground species are jampang (Panicum disachyum) and selaginela (Selaginella plana), while in Darmaga are pakis (Dictyopteris irregularis) and seuseureuhan (Piper aduncum) and in Sukabumi are jampang (Panicum disachyum) and rumput pait (Panicum barbatum) (Table 9, 10, and 11). These data indicate that the habitats are ecologically have differences characteristics.
Table 9. Important Value of underground species in Carita
No. Nama Daerah Nama Botani Famili Kr (%) Fr (%) Dr (%)INP (%)
1. 2.3.4.5.6.7.8.9.10.11.12.13.14.15.16.17.18.19.20.21.22.23.24.25.26.27.28.29.30.
Jampang SelaginellaHarendongmerahCingcauRumput Pait IlatParasi TeronganHattaPeletokPaku anamPakis Sasahan HarendongKokopianMahoni CacabeanAlang-alangHawuan KakacanganPacingSeuseureuhanGagajahan Ki konengBabadotanPakis AnjingGaharu PeteKanyereCingcanan
Panicum disachyum Linn.Selaginella plana Hiern.Melastoma malabathricum L.Cyclea barbata Miers.Panicum barbatum Lamk.Cyperus difformis Linn.Curculigo latifolia Dryand.Solanum jamaicence Mill.Coniograma intermedia Hieron.Cecropia peltata L.Lygodium circinatum Sw.Dictyopteris irregularis Presl.Tetracera indica L.Clidenia hirta Don.Ixora sp.Swietenia macrophylla KingMorinda bracteosa Hort.Imperata cylindrica Linn.Elaeocarpus glaber BlumeStachystarpheta jamaisensis Vahl.Tapeinochilus teysmannianus K.Sch.Piper aduncum L.Panicum montanum Roxb.Plectronia sp.Ageratum conizoides Linn.Dryopteris dentata C.Chr.Aquilaria malaccensis Lamk.Parkia speciosa Hassk.Bridelia monoica L.Morinda bracteosa Hort.
GramíneaSelaginellaceaeMelastomataceaeMeraispermaceaeGraminaeCyperaceaeAmaryllidiaceaeSolanaceaePolypodiaceaeMoraceaeSchizophyllaceaePolypodiaceaeDilleniaceaeMelastomaceaeRubiaceaeMeliaceaeRubiaceaeGraminaeElaeocarpaceaeVerbenaceaeZingiberaceaePiperaceaeGraminaeRubiaceaeCompositaePolypodiaceaeThymelaeaceaeLeguminosaeEuphorbiaceaeRubiaceae
47,0014,525,177,887,393,692,450,980,751,230,980,500,750,491,230,500,250,750,250,250,490,250,500,250,250,250,250,250,250,25
8,5810,009,99
10,005,715,714,295,711,432,854,291,432,861,432,852,851,431,431,431,431,431,431,431,431,431,431,431,431,431,43
25,7032,767,093,823,710,993,092,976,182,100,733,091,110,620,480,621,230,250,620,620,250,370,120,370,250,250,250,120,120,12
81,2857,2822,2521,7016,8110,399,839,668,366,186,005,024,724,574,574,472,912,432,302,302,172,052,052,051,931,931,931,801,801,80
TOTAL 100,00 100,00 100,00 300,00
PRESENTATION OF THE DATAEvaluating basic properties of gaharu stands
17
Table 10. Important Value of underground species in Darmaga
No. Nama Daerah Nama Botani Famili Kr (%) Fr (%) Dr (%) INP (%)
1. 2.3.4.5.6.7.8.
PakisSeuseureuhanTalesRumput Pait Rumput padiAreuBabadotanPACINE
Dictyopteris irregularis Presl.Piper aduncum L.Alocasia sp.Panicum barbatum Lamk.Oryza grandulata Nees.Micania scandens Willd.Ageratum conizoides Linn.Tapeinochilus teysmannianus K.Sch.
PolypodaceaePiperaceaeAraceaeGraminaeGramíneaCompositaeCompositaeZingiberaceae
29,4111,765,89
17,6411,765,89
11,765,89
16,7211,0316,7216,7216,7211,035,525,53
28,0834,2520,553,421,715,141,715,14
74,2157,0443,1637,7830,1922,0619,0016,56
TOTAL 100,00 100,00 100,00 300,00
Table 11. Important Value of underground species in Sukabumi
No. Nama Daerah Nama Botani Famili Kr (%) Fr (%) Dr (%) INP (%)
1. 2.3.4.5.6.
JampangRumput PaitHarendong Babadotan KirinyuhAlang-alang
Panicum distachyum Linn.Panicum barbatum Lamk.Clidenia hirta Don.Ageratum conizoides Linn.Euphatorium pallascens DC.Imperata cilíndrica Linn.
GramíneaGraminaeMelastomaceaeCompositaeCompositaeGraminae
56.5624,244,767,742,384,16
33.3416,6716,678,33
16,678,33
50,0017,8710,7114,283,573,57
139,958,9432,1430,3522,6216,06
TOTAL 100,00 100,00 100,00 300,00
According to the Similarity Index (SI) of Sorensen (Mueller-Dumbois and Ellenberg, 1974). The composition of underground species is different on every research sites. This is indicated by a low SI value (< 50%) (Table 12). This difference in composition is due to the difference of environmental factor such as climate, topography and soil characteristics.
Table 12. Similarity Index (%) of plant communities at research sites
Location Carita Darmaga Sukabumi
Carita - 9 35
Darmaga - - 9
Sukabumi - - -
South Kalimantan
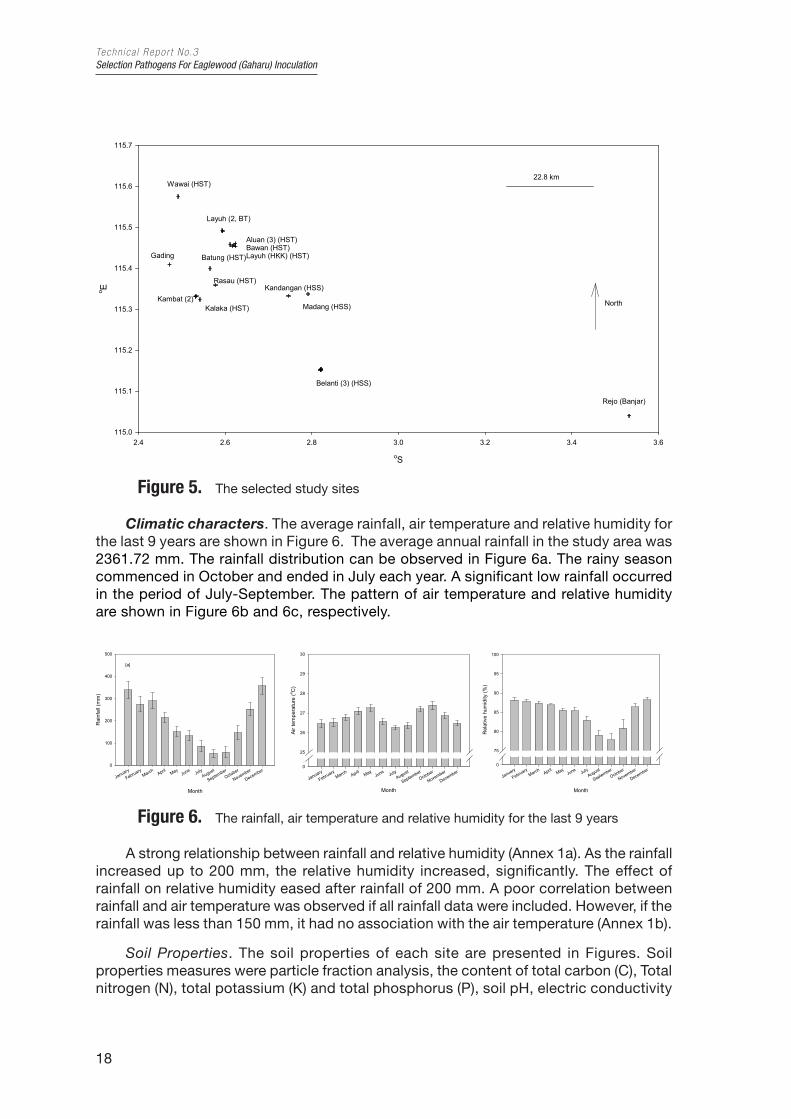
Site. Distribution of selected sites for the project can be seen in Figure 5. The selected site were use for growing gaharu and inoculation. The sites located in Banjar, Hulu Sungai Selatan (HSS) and Hulu Sungai Tengah (HST). There were 18 and 5 sites for growing the gaharu and inoculation activities, respectively. Location-wise, 14 sites would be used for newly planted gaharu trees and 9 sites for inoculation trial.
Tec hn i c a l Repo r t No.3Selection Pathogens For Eaglewood (Gaharu) Inoculation
18
oS
2.4 2.6 2.8 3.0 3.2 3.4 3.6
o E
115.0
115.1
115.2
115.3
115.4
115.5
115.6
115.7
Rejo (Banjar)
Belanti (3) (HSS)
Madang (HSS)
Kandangan (HSS)Rasau (HST)
Batung (HST)Gading
Kalaka (HST)Kambat (2)
Wawai (HST)
Layuh (2, BT)
Aluan (3) (HST)Bawan (HST)Layuh (HKK) (HST)
North
22.8 km
Figure 5. The selected study sites
Climatic characters. The average rainfall, air temperature and relative humidity for the last 9 years are shown in Figure 6. The average annual rainfall in the study area was 2361.72 mm. The rainfall distribution can be observed in Figure 6a. The rainy season commenced in October and ended in July each year. A significant low rainfall occurred in the period of July-September. The pattern of air temperature and relative humidity are shown in Figure 6b and 6c, respectively.
Month
January
FebruaryMarch
April MayJune July
August
SeptemberOctober
November
December
Rai
nfal
l (m
m)
0
100
200
300
400
500
[a]
Month
January
FebruaryMarch
April MayJune July
August
SeptemberOctober
November
December
Air t
empe
ratu
re (o C
)
0
25
26
27
28
29
30
Month
January
FebruaryMarch
April MayJune July
August
SeptemberOctober
November
December
Rel
ativ
e hu
mid
ity (%
)
0
75
80
85
90
95
100
Figure 6. The rainfall, air temperature and relative humidity for the last 9 years
A strong relationship between rainfall and relative humidity (Annex 1a). As the rainfall increased up to 200 mm, the relative humidity increased, significantly. The effect of rainfall on relative humidity eased after rainfall of 200 mm. A poor correlation between rainfall and air temperature was observed if all rainfall data were included. However, if the rainfall was less than 150 mm, it had no association with the air temperature (Annex 1b).
Soil Properties. The soil properties of each site are presented in Figures. Soil properties measures were particle fraction analysis, the content of total carbon (C), Total nitrogen (N), total potassium (K) and total phosphorus (P), soil pH, electric conductivity
PRESENTATION OF THE DATAEvaluating basic properties of gaharu stands
19
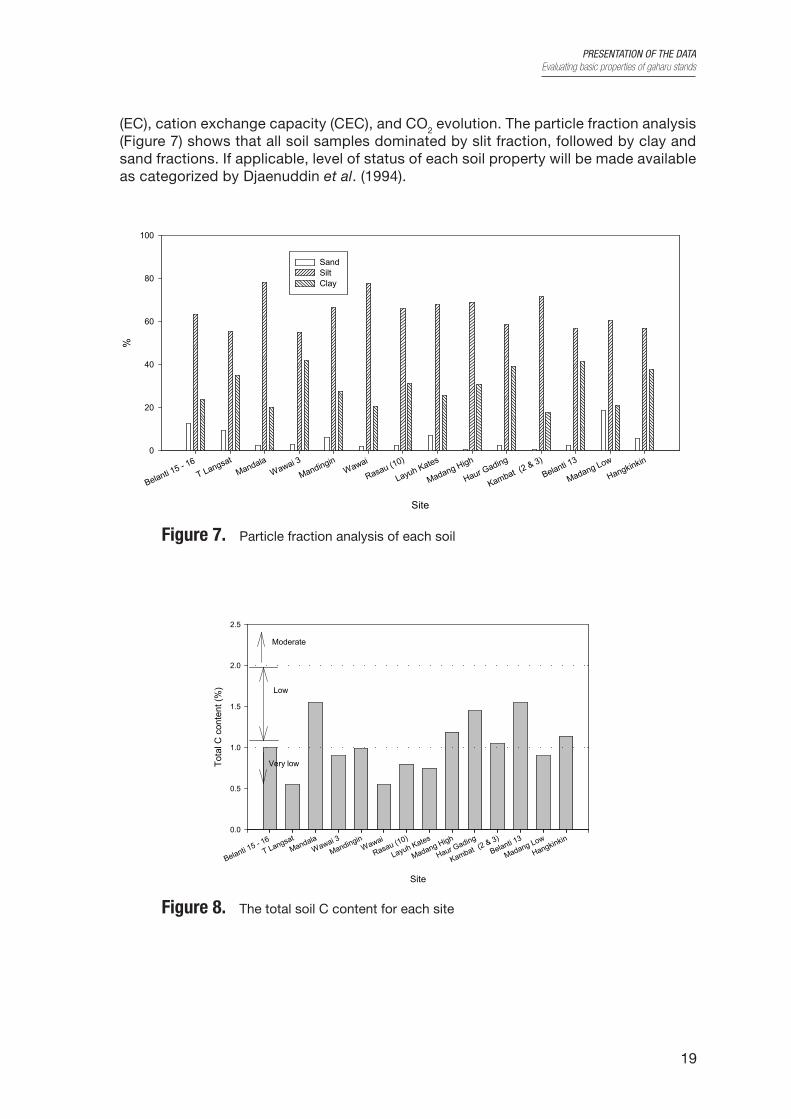
(EC), cation exchange capacity (CEC), and CO2 evolution. The particle fraction analysis (Figure 7) shows that all soil samples dominated by slit fraction, followed by clay and sand fractions. If applicable, level of status of each soil property will be made available as categorized by Djaenuddin et al. (1994).
Site
Belanti 15 - 16
T LangsatMandala
Wawai 3
MandinginWawai
Rasau (10)
Layuh Kates
Madang High
Haur Gading
Kambat (2 & 3)
Belanti 13
Madang Low
Hangkinkin
%
0
20
40
60
80
100
Sand Silt Clay
Figure 7. Particle fraction analysis of each soil
Low value
Very low value
Site
Belanti 15 - 16
T LangsatMandala
Wawai 3
MandinginWawai
Rasau (10)
Layuh Kates
Madang High
Haur Gading
Kambat (2 & 3)
Belanti 13
Madang Low
Hangkinkin
Tota
l C c
onte
nt (%
)
0.0
0.5
1.0
1.5
2.0
2.5
Very low
Low
Moderate
Figure 8. The total soil C content for each site
Tec hn i c a l Repo r t No.3Selection Pathogens For Eaglewood (Gaharu) Inoculation
20
Site
Belanti 15 - 16
T Langsat
MandalaWawai 3
MandinginWawai
Rasau (10)
Layuh Kates
Madang High
Haur Gading
Kambat (2 & 3)
Belanti 13
Madang Low
Hangkinkin
Tota
l N c
onte
nt (%
)
0.00
0.05
0.10
0.15
0.20
0.25
Very low
Low
Moderate
Figure 9. The total N of soil for each site
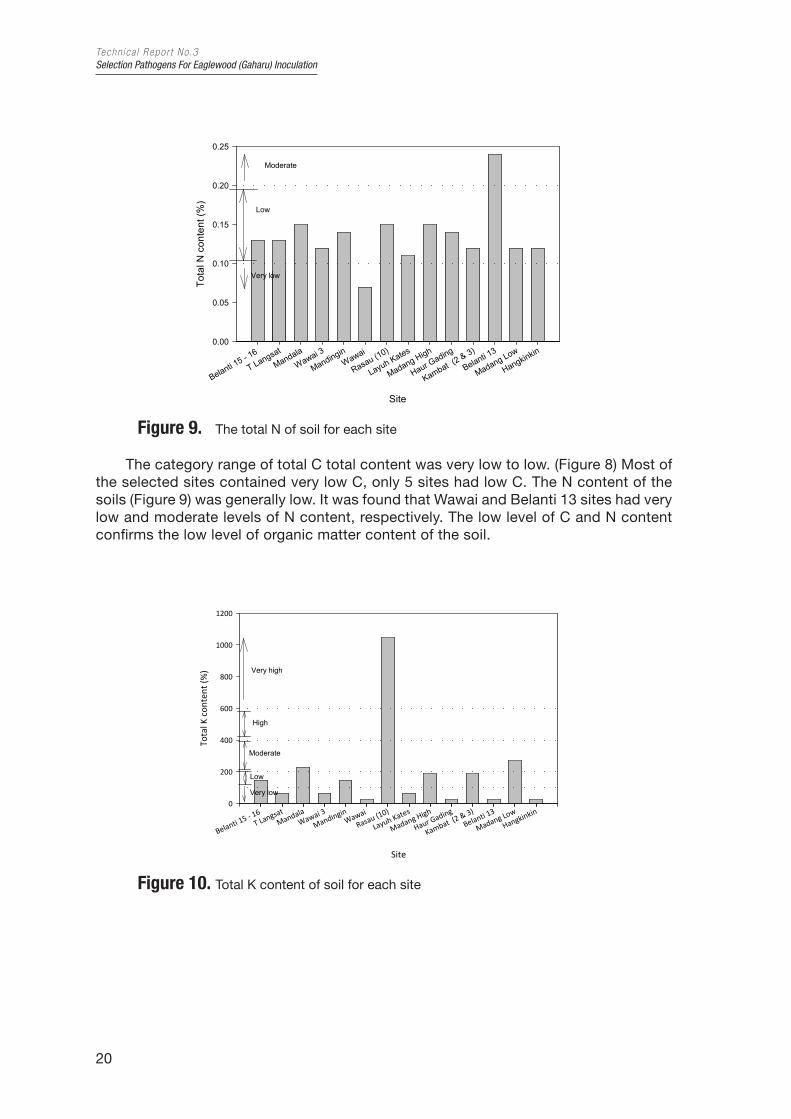
The category range of total C total content was very low to low. (Figure 8) Most of the selected sites contained very low C, only 5 sites had low C. The N content of the soils (Figure 9) was generally low. It was found that Wawai and Belanti 13 sites had very low and moderate levels of N content, respectively. The low level of C and N content confirms the low level of organic matter content of the soil.
Site
Belanti 15 - 16 T Langsat
MandalaWawai 3
MandinginWawai
Rasau (10)
Layuh Kates
Madang High
Haur Gading
Kambat (2 & 3)
Belanti 13
Madang Low
Hangkinkin
Tota
l K c
onte
nt (%
)
0
200
400
600
800
1000
1200
Very high
High
Moderate
Low
Very low
Figure 10. Total K content of soil for each site
PRESENTATION OF THE DATAEvaluating basic properties of gaharu stands
21
Site
Belanti 15 - 16 T Langsat
MandalaWawai 3
MandinginWawai
Rasau (10)
Layuh Kates
Madang High
Haur Gading
Kambat (2 & 3)
Belanti 13
Madang Low
Hangkinkin
Tota
l P c
onte
nt (%
)
0100200300400500600700
2000
2200
2400
2600
Very lowLow
Moderate
High
Very high
Figure 11. Total P content of soil for each site
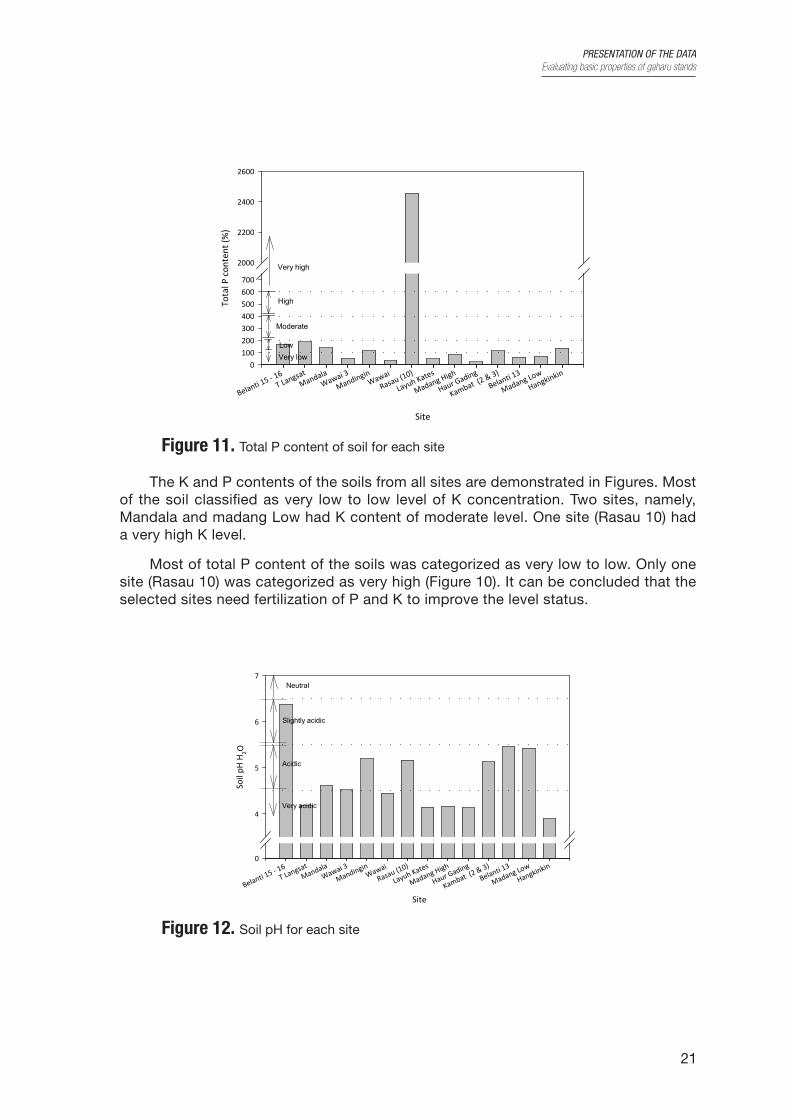
The K and P contents of the soils from all sites are demonstrated in Figures. Most of the soil classified as very low to low level of K concentration. Two sites, namely, Mandala and madang Low had K content of moderate level. One site (Rasau 10) had a very high K level.
Most of total P content of the soils was categorized as very low to low. Only one site (Rasau 10) was categorized as very high (Figure 10). It can be concluded that the selected sites need fertilization of P and K to improve the level status.
SiteBelanti 15 - 16
T LangsatMandala
Wawai 3
MandinginWawai
Rasau (10)
Layuh Kates
Madang High
Haur Gading
Kambat (2 & 3)
Belanti 13
Madang Low
Hangkinkin
Soil
pH H
2O
0
4
5
6
7Neutral
Slightly acidic
Acidic
Very acidic
Figure 12. Soil pH for each site
Tec hn i c a l Repo r t No.3Selection Pathogens For Eaglewood (Gaharu) Inoculation
22
Site
Belanti 15 - 16 T Langsat
MandalaWawai 3
MandinginWawai
Rasau (10)
Layuh Kates
Madang High
Haur Gading
Kambat (2 & 3)
Belanti 13
Madang Low
Hangkinkin
Elec
tric
con
duct
ivity
(mSc
m-1
)
0
1
2100105110115120125130135
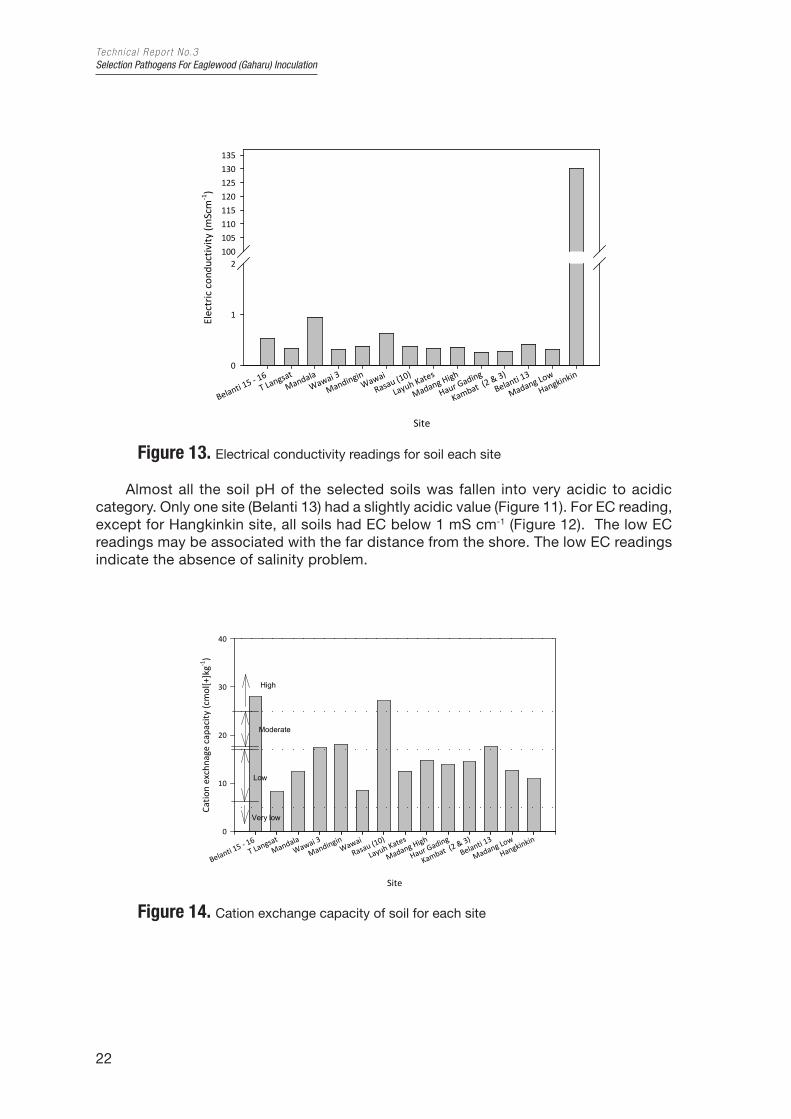
Figure 13. Electrical conductivity readings for soil each site
Almost all the soil pH of the selected soils was fallen into very acidic to acidic category. Only one site (Belanti 13) had a slightly acidic value (Figure 11). For EC reading, except for Hangkinkin site, all soils had EC below 1 mS cm-1 (Figure 12). The low EC readings may be associated with the far distance from the shore. The low EC readings indicate the absence of salinity problem.
Site
Belanti 15 - 16 T Langsat
MandalaWawai 3
MandinginWawai
Rasau (10)
Layuh Kates
Madang High
Haur Gading
Kambat (2 & 3)
Belanti 13
Madang Low
Hangkinkin
Catio
n ex
chna
ge c
apac
ity (c
mol
[+]k
g-1)
0
10
20
30
40
Very low
Low
Moderate
High
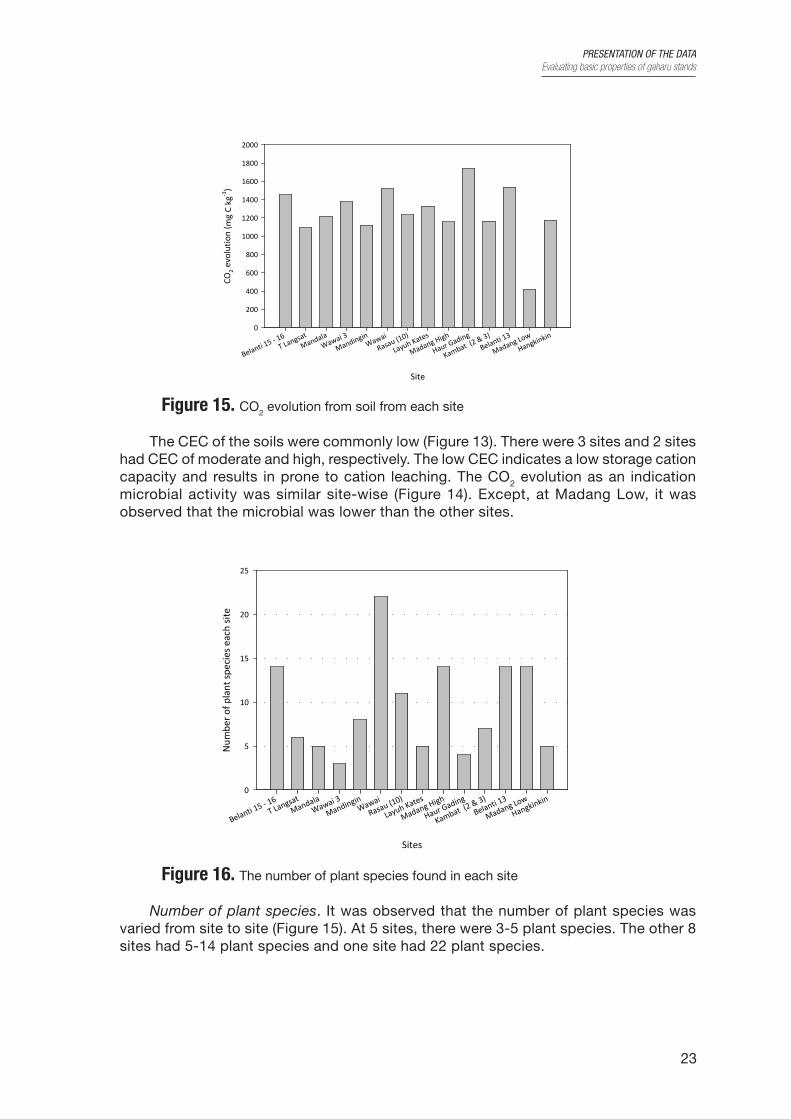
Figure 14. Cation exchange capacity of soil for each site
PRESENTATION OF THE DATAEvaluating basic properties of gaharu stands
23
Site
Belanti 15 - 16 T Langsat
MandalaWawai 3
MandinginWawai
Rasau (10)
Layuh Kates
Madang High
Haur Gading
Kambat (2 & 3)
Belanti 13
Madang Low
Hangkinkin
CO2 e
volu
tion
( mg
C kg
-1)
0
200
400
600
800
1000
1200
1400
1600
1800
2000
Figure 15. CO2 evolution from soil from each site
The CEC of the soils were commonly low (Figure 13). There were 3 sites and 2 sites had CEC of moderate and high, respectively. The low CEC indicates a low storage cation capacity and results in prone to cation leaching. The CO2 evolution as an indication microbial activity was similar site-wise (Figure 14). Except, at Madang Low, it was observed that the microbial was lower than the other sites.
Sites
Belanti 15 - 16 T Langsat
MandalaWawai 3
MandinginWawai
Rasau (10)
Layuh Kates
Madang High
Haur Gading
Kambat (2 & 3)
Belanti 13
Madang Low
Hangkinkin
Num
ber o
f pla
nt sp
ecie
s eac
h sit
e
0
5
10
15
20
25
Figure 16. The number of plant species found in each site
Number of plant species. It was observed that the number of plant species was varied from site to site (Figure 15). At 5 sites, there were 3-5 plant species. The other 8 sites had 5-14 plant species and one site had 22 plant species.
Tec hn i c a l Repo r t No.3Selection Pathogens For Eaglewood (Gaharu) Inoculation
24
3.2 Evaluating the Existing inoculation enggineering technique
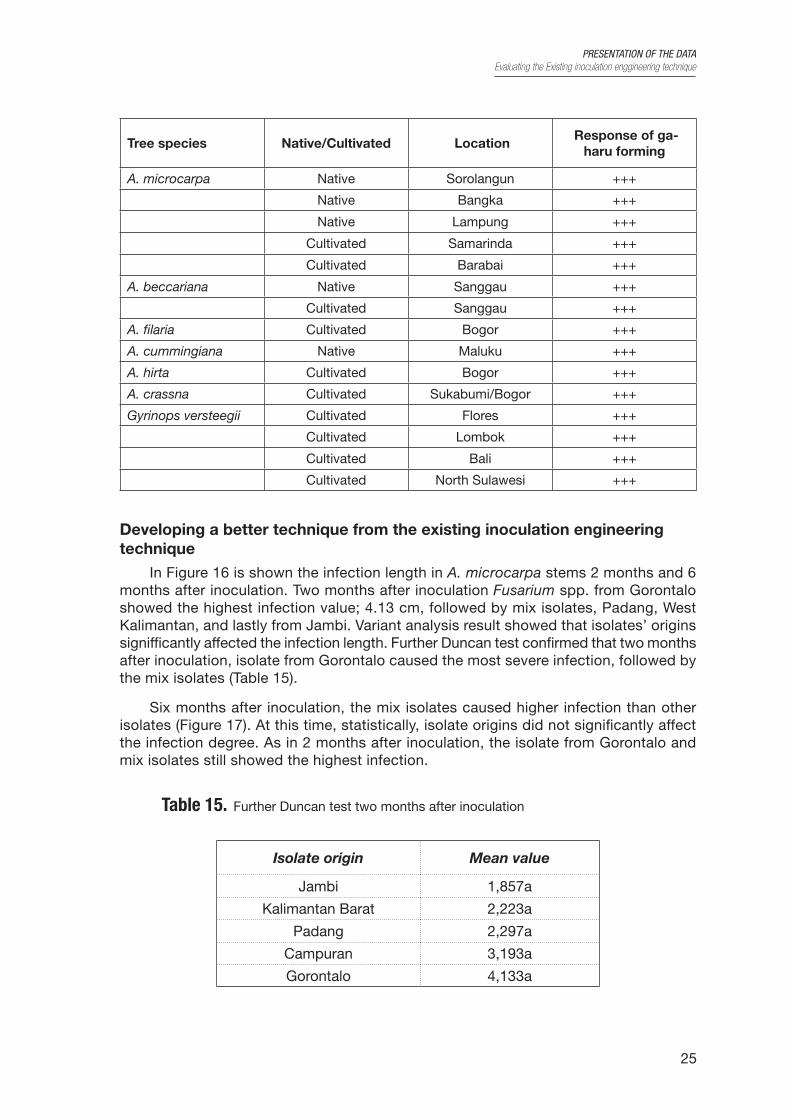
Evaluating the inoculation engineeting technique has shown in Table 13. Inoculation engineering technique by drilling using microbial in liquid media is the best technique and more practice. This technique has been applied to some Aquilaria and Gyrinops species (Table 14).
Table 13. Evaluating the existing inoculation engineering technique
Inoculation technique tree species location response
Drilling (oil + sugar) Aquilaria sp. West Kalimantan very low
Drilling by nail Aquilaria sp. West Kalimantan very low
Gyrinops sp. Lombok very low
Drilling (microbial in solid media)
Aquilaria sp. West Kalimantan low to middle
Gyrinops sp. Lombok low to middle
Drilling (microbial in liquid media)
Aquilaria sp. South Kalimantan middle to high
Aquilaria sp. West Kalimantan middle to high
Gyrinops sp. Bali/Flores middle to high
Jasmonic Acid Aquilaria sp. South Kalimantan very low
Soybean Oil Aquilaria sp. South Kalimantan very low
In condition against fungal infection, gaharu-tree responses to mantain and recover itself. Tree resistance will determine the winner between the tree and the pathogene. In order to get gaharu, one would prefer that the pathogene succeed, therefore the desired gaharu product will be produced. Producing certain chemicals is one of the defense mechanism toward pathogenes. Gaharu, identified as sequiterpenoid compound, defense compound of phytoalexin type. The vulnerability of the tree against fungal infection is related to the gaharu production, reflected by the infection area and chemicals components.
Table 14. Liquid media inoculation engineering technique to Aquilaria and Gyrinops
Tree species Native/Cultivated Location Response of ga-
haru forming
A. malaccensis cultivated Carita, Banten +++
Native Bangka +++
Native Langkat +++
Cultivated Sanggau +++
Cultivated Barabai +++
PRESENTATION OF THE DATAEvaluating the Existing inoculation enggineering technique
25
Tree species Native/Cultivated Location Response of ga-
haru forming
A. microcarpa Native Sorolangun +++
Native Bangka +++
Native Lampung +++
Cultivated Samarinda +++
Cultivated Barabai +++
A. beccariana Native Sanggau +++
Cultivated Sanggau +++
A. filaria Cultivated Bogor +++
A. cummingiana Native Maluku +++
A. hirta Cultivated Bogor +++
A. crassna Cultivated Sukabumi/Bogor +++
Gyrinops versteegii Cultivated Flores +++
Cultivated Lombok +++
Cultivated Bali +++
Cultivated North Sulawesi +++
Developing a better technique from the existing inoculation engineering technique
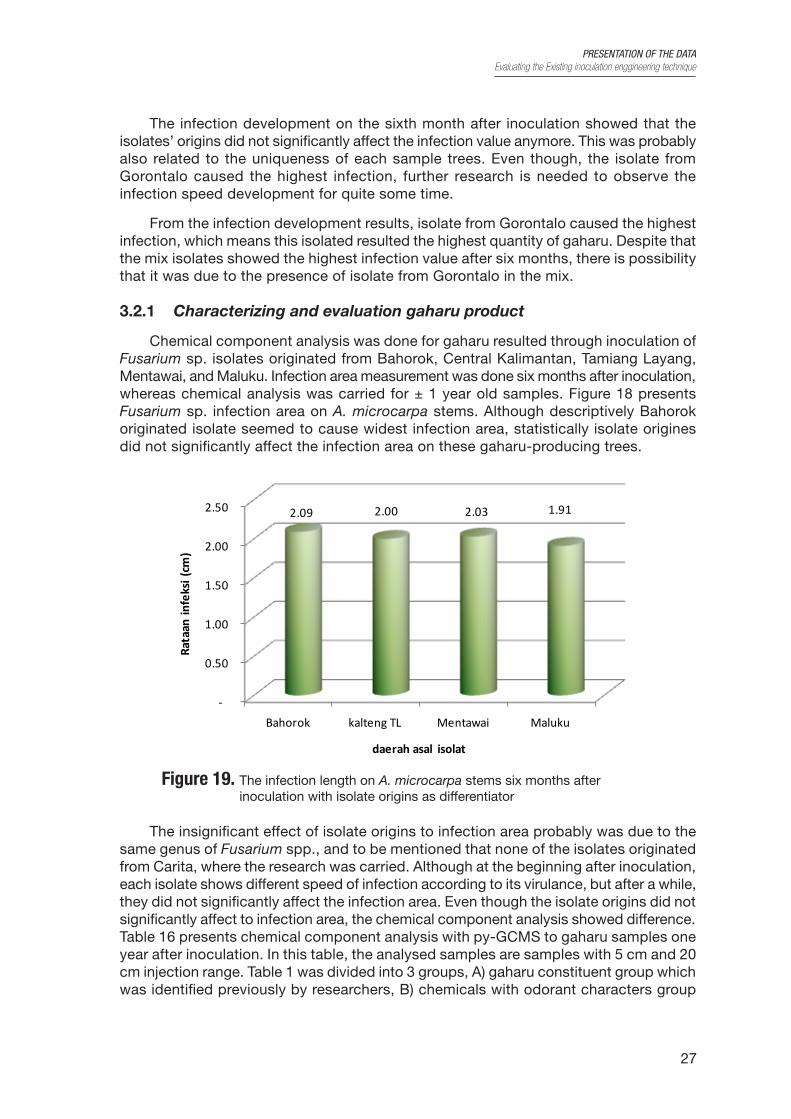
In Figure 16 is shown the infection length in A. microcarpa stems 2 months and 6 months after inoculation. Two months after inoculation Fusarium spp. from Gorontalo showed the highest infection value; 4.13 cm, followed by mix isolates, Padang, West Kalimantan, and lastly from Jambi. Variant analysis result showed that isolates’ origins signifficantly affected the infection length. Further Duncan test confirmed that two months after inoculation, isolate from Gorontalo caused the most severe infection, followed by the mix isolates (Table 15).
Six months after inoculation, the mix isolates caused higher infection than other isolates (Figure 17). At this time, statistically, isolate origins did not significantly affect the infection degree. As in 2 months after inoculation, the isolate from Gorontalo and mix isolates still showed the highest infection.
Table 15. Further Duncan test two months after inoculation
Isolate origin Mean value
Jambi 1,857a
Kalimantan Barat 2,223a
Padang 2,297a
Campuran 3,193a
Gorontalo 4,133a
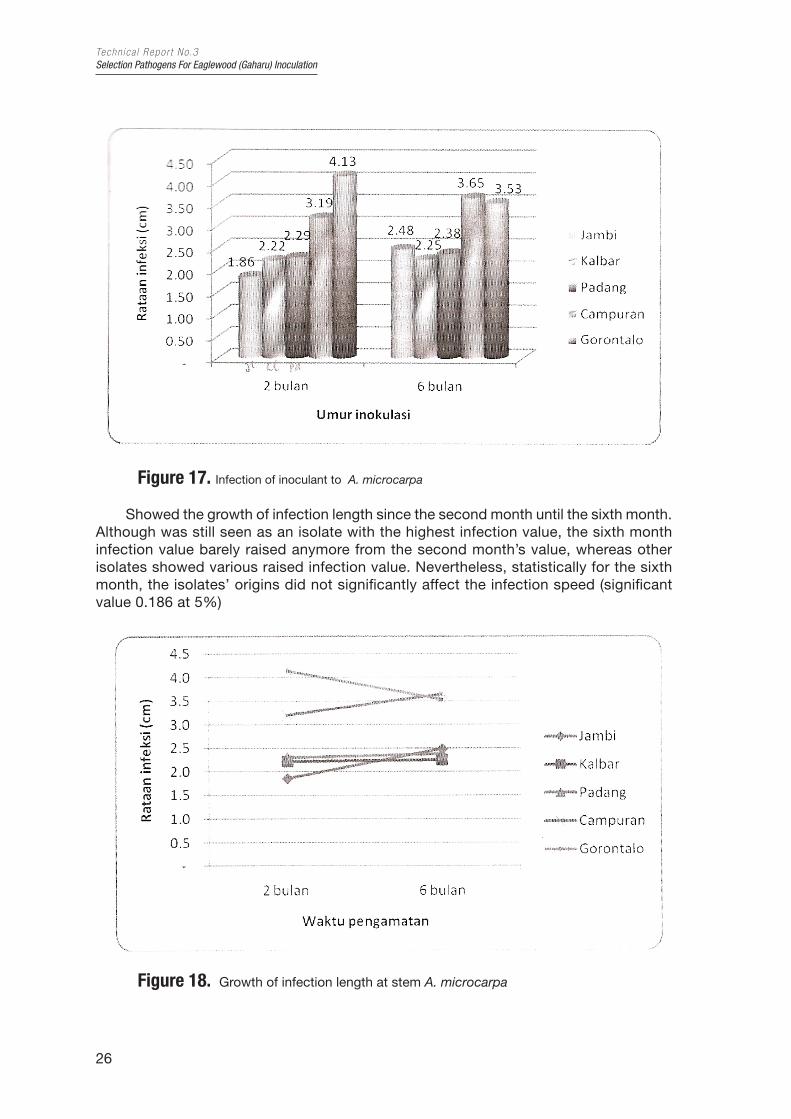
Tec hn i c a l Repo r t No.3Selection Pathogens For Eaglewood (Gaharu) Inoculation
26
Figure 17. Infection of inoculant to A. microcarpa
Showed the growth of infection length since the second month until the sixth month. Although was still seen as an isolate with the highest infection value, the sixth month infection value barely raised anymore from the second month’s value, whereas other isolates showed various raised infection value. Nevertheless, statistically for the sixth month, the isolates’ origins did not significantly affect the infection speed (significant value 0.186 at 5%)
Figure 18. Growth of infection length at stem A. microcarpa
PRESENTATION OF THE DATAEvaluating the Existing inoculation enggineering technique
27
The infection development on the sixth month after inoculation showed that the isolates’ origins did not significantly affect the infection value anymore. This was probably also related to the uniqueness of each sample trees. Even though, the isolate from Gorontalo caused the highest infection, further research is needed to observe the infection speed development for quite some time.
From the infection development results, isolate from Gorontalo caused the highest infection, which means this isolated resulted the highest quantity of gaharu. Despite that the mix isolates showed the highest infection value after six months, there is possibility that it was due to the presence of isolate from Gorontalo in the mix.
3.2.1 Characterizing and evaluation gaharu product
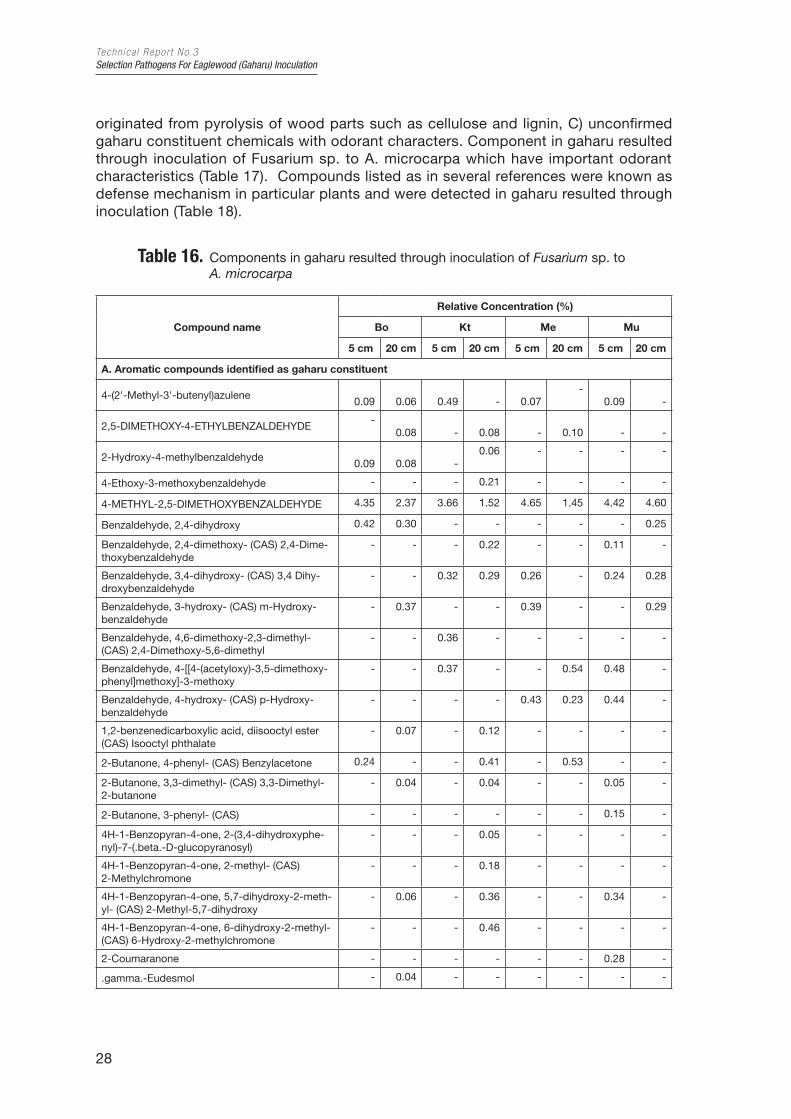
Chemical component analysis was done for gaharu resulted through inoculation of Fusarium sp. isolates originated from Bahorok, Central Kalimantan, Tamiang Layang, Mentawai, and Maluku. Infection area measurement was done six months after inoculation, whereas chemical analysis was carried for ± 1 year old samples. Figure 18 presents Fusarium sp. infection area on A. microcarpa stems. Although descriptively Bahorok originated isolate seemed to cause widest infection area, statistically isolate origines did not significantly affect the infection area on these gaharu-producing trees.
-
0.50
1.00
1.50
2.00
2.50
Bahorok kalteng TL Mentawai Maluku
2.09 2.00 2.03 1.91
Rata
an in
feks
i (cm
)
daerah asal isolat
Figure 19. The infection length on A. microcarpa stems six months after inoculation with isolate origins as differentiator
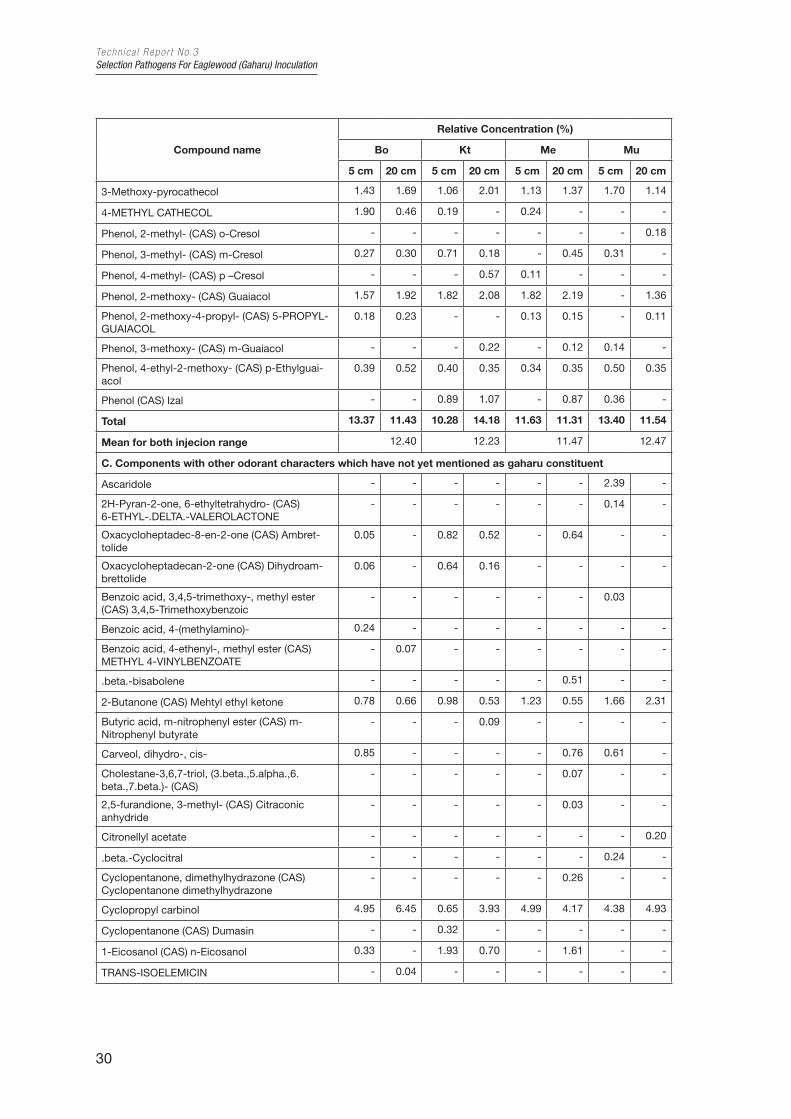
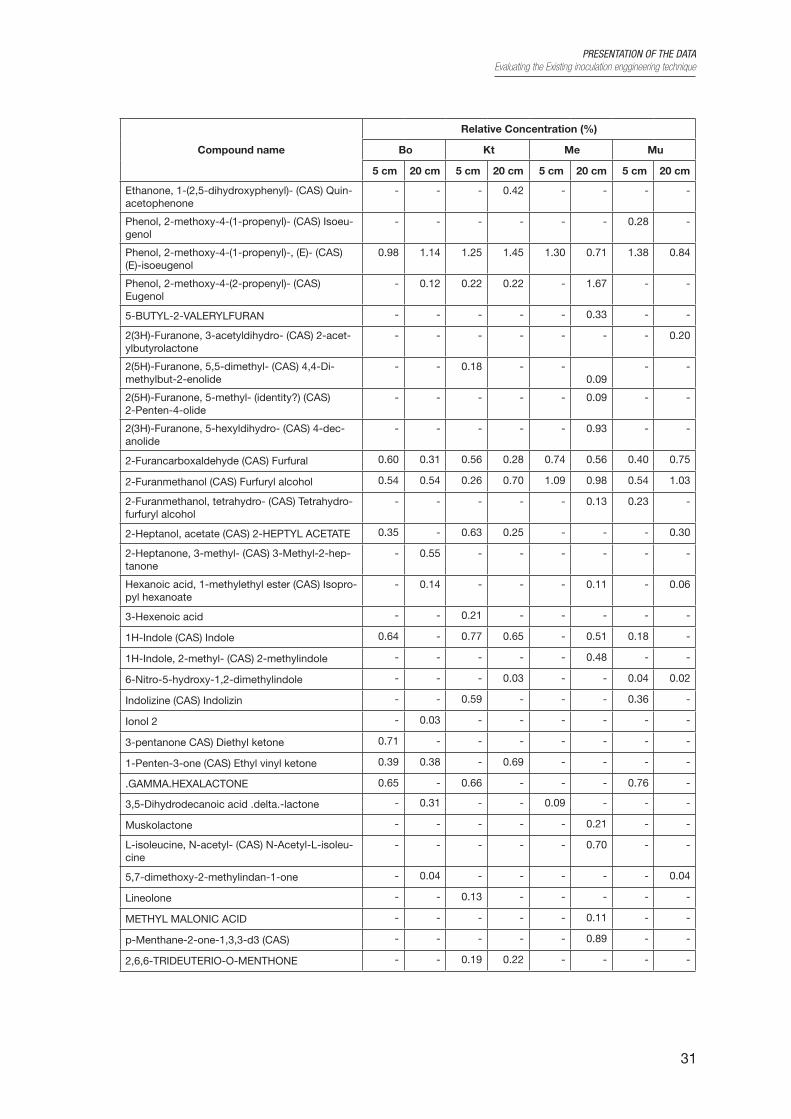
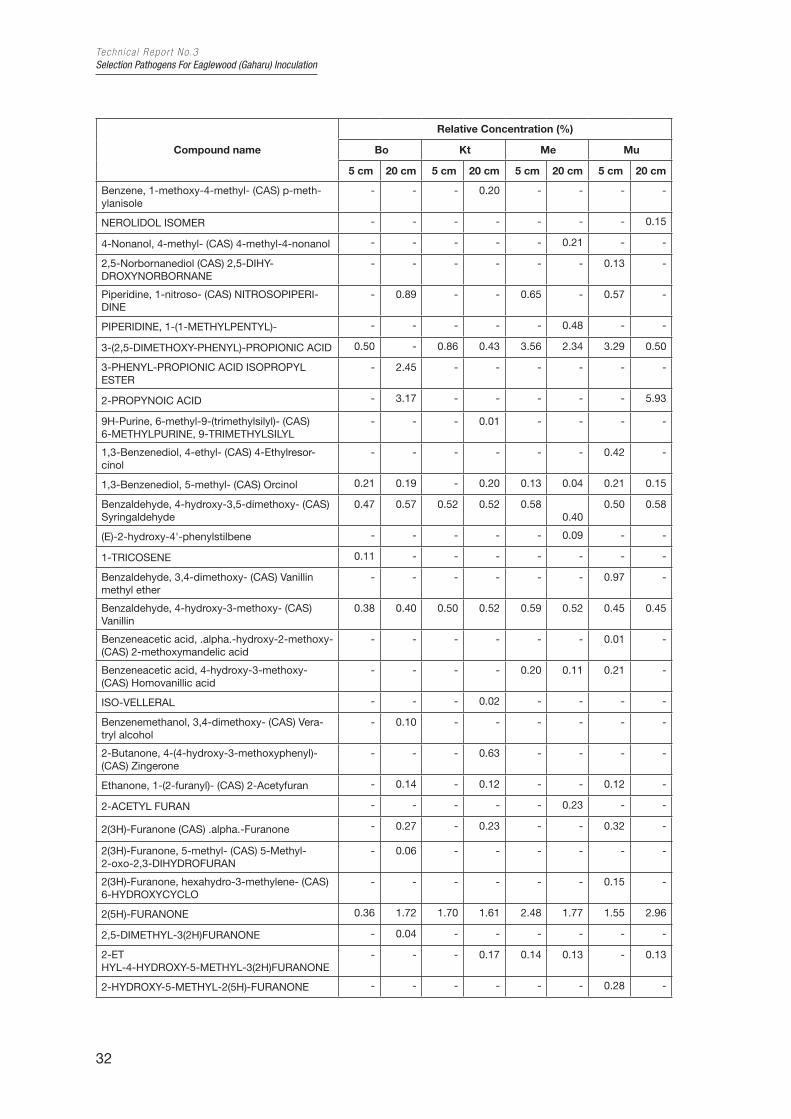
The insignificant effect of isolate origins to infection area probably was due to the same genus of Fusarium spp., and to be mentioned that none of the isolates originated from Carita, where the research was carried. Although at the beginning after inoculation, each isolate shows different speed of infection according to its virulance, but after a while, they did not significantly affect the infection area. Even though the isolate origins did not significantly affect to infection area, the chemical component analysis showed difference. Table 16 presents chemical component analysis with py-GCMS to gaharu samples one year after inoculation. In this table, the analysed samples are samples with 5 cm and 20 cm injection range. Table 1 was divided into 3 groups, A) gaharu constituent group which was identified previously by researchers, B) chemicals with odorant characters group
Tec hn i c a l Repo r t No.3Selection Pathogens For Eaglewood (Gaharu) Inoculation
28
originated from pyrolysis of wood parts such as cellulose and lignin, C) unconfirmed gaharu constituent chemicals with odorant characters. Component in gaharu resulted through inoculation of Fusarium sp. to A. microcarpa which have important odorant characteristics (Table 17). Compounds listed as in several references were known as defense mechanism in particular plants and were detected in gaharu resulted through inoculation (Table 18).
Table 16. Components in gaharu resulted through inoculation of Fusarium sp. to A. microcarpa
Compound name
Relative Concentration (%)
Bo Kt Me Mu
5 cm 20 cm 5 cm 20 cm 5 cm 20 cm 5 cm 20 cm
A. Aromatic compounds identified as gaharu constituent
4-(2'-Methyl-3'-butenyl)azulene
0.09
0.06
0.49
-
0.07 -
0.09
-
2,5-DIMETHOXY-4-ETHYLBENZALDEHYDE -
0.08
-
0.08
-
0.10
-
-
2-Hydroxy-4-methylbenzaldehyde
0.09
0.08
- 0.06 - - - -
4-Ethoxy-3-methoxybenzaldehyde - - - 0.21 - - - -
4-METHYL-2,5-DIMETHOXYBENZALDEHYDE 4.35 2.37 3.66 1.52 4.65 1.45 4.42 4.60
Benzaldehyde, 2,4-dihydroxy 0.42 0.30 - - - - - 0.25
Benzaldehyde, 2,4-dimethoxy- (CAS) 2,4-Dime-thoxybenzaldehyde
- - - 0.22 - - 0.11 -
Benzaldehyde, 3,4-dihydroxy- (CAS) 3,4 Dihy-droxybenzaldehyde
- - 0.32 0.29 0.26 - 0.24 0.28
Benzaldehyde, 3-hydroxy- (CAS) m-Hydroxy-benzaldehyde
- 0.37 - - 0.39 - - 0.29
Benzaldehyde, 4,6-dimethoxy-2,3-dimethyl- (CAS) 2,4-Dimethoxy-5,6-dimethyl
- - 0.36 - - - - -
Benzaldehyde, 4-[[4-(acetyloxy)-3,5-dimethoxy-phenyl]methoxy]-3-methoxy
- - 0.37 - - 0.54 0.48 -
Benzaldehyde, 4-hydroxy- (CAS) p-Hydroxy-benzaldehyde
- - - - 0.43 0.23 0.44 -
1,2-benzenedicarboxylic acid, diisooctyl ester (CAS) Isooctyl phthalate
- 0.07 - 0.12 - - - -
2-Butanone, 4-phenyl- (CAS) Benzylacetone 0.24 - - 0.41 - 0.53 - -
2-Butanone, 3,3-dimethyl- (CAS) 3,3-Dimethyl-2-butanone
- 0.04 - 0.04 - - 0.05 -
2-Butanone, 3-phenyl- (CAS) - - - - - - 0.15 -
4H-1-Benzopyran-4-one, 2-(3,4-dihydroxyphe-nyl)-7-(.beta.-D-glucopyranosyl)
- - - 0.05 - - - -
4H-1-Benzopyran-4-one, 2-methyl- (CAS) 2-Methylchromone
- - - 0.18 - - - -
4H-1-Benzopyran-4-one, 5,7-dihydroxy-2-meth-yl- (CAS) 2-Methyl-5,7-dihydroxy
- 0.06 - 0.36 - - 0.34 -
4H-1-Benzopyran-4-one, 6-dihydroxy-2-methyl- (CAS) 6-Hydroxy-2-methylchromone
- - - 0.46 - - - -
2-Coumaranone - - - - - - 0.28 -
.gamma.-Eudesmol - 0.04 - - - - - -
PRESENTATION OF THE DATAEvaluating the Existing inoculation enggineering technique
29
Compound name
Relative Concentration (%)
Bo Kt Me Mu
5 cm 20 cm 5 cm 20 cm 5 cm 20 cm 5 cm 20 cm
Hexadecanoic acid, 2-(octadecyloxy)-, tetra-decyl ester (CAS) TETRADECYL
- - - - - - - 0.03
Hexadecanoic acid, methyl ester (CAS) Methyl palmitate
- - - - - - 0.05 -
2,4-Hexadienedioic acid, 3,4-diethyl-, dimethyl ester, (Z,Z)- (CAS) CIS.CIS.D
- - - - 0.69 - 0.85 -
2,4-Hexadienedioic acid, 3-methyl-4-propyl-, dimethyl ester, (Z,E)- (CAS)
- 0.12 - 0.16 - 0.09 0.17 -
.alpha.-humulene - - - - - 0.11 - -
1-Naphthalenol, 1,2,3,4-tetrahydro- (CAS) 1-Tetralol
- - - - - 0.07 - -
1-Ethynyl-3,4-dihydro-2-naphthalenecarbade-hyde
- 0.08 - - - - - -
Phenol, 2,6-dimethoxy- (CAS) 2,6-Dimethoxy-phenol
2.94 3.37 2.74 3.67 3.11 3.05 4.22 2.83
Phenol, 3,4-dimethoxy- (CAS) 3,4-dimethoxy-phenol
0.25 0.33 0.33 0.40 0.24 0.42 0.40 0.22
Benzenepropanoic acid, methyl ester (CAS) Methyl hydrocinnamate
-
- - 0.25 - - - -
Propanoic acid, 3-(2-propynyloxy)-, ethyl ester (CAS) ETHYL 3-PROPARGYL
- 0.28 - 0.24 - - - 0.12
Propanoic acid, anhydride (CAS) Propionic anhydride
- 1.31 1.02 0.60 - - 0.44 -
Propanoic acid, ethenyl ester (CAS) vinyl pro-pionate
0.04 - - - - - - -
CYCLOPENTANEPROPANOIC ACID, 1-ACE-TYL-2,2-DIMETHYL-, METHYL
3.86 - - 4.25 0.12 - - -
Benzenepropanoic acid (CAS) Phenylpropionic acid
- - - 2.74 - - - -
3,4,5,6,7,8-HEXAHYDRO-2H-CHROMENE - - 0.20 - - - - -
1,2,3,4,4A,5,6,8A-OCTAHYDRO-NAPHTHALENE - - - - - - 0.58 -
Total 12.28 8.95 9.49 16.30 9.95 6.59 13.30 8.62
Mean for both injection range 10.61 12.89 8.27 10.96
B. Aromatic compounds which are pyrolysed from wood parts
4H-Pyran-4-one, 3-Hydroxy-2-methyl- (CAS) Maltol
0.14 0.17 0.17 0.21 0.19 0.29 0.14 0.27
4H-Pyran-4-one, 5-Hydroxy-2-methyl- (CAS) 5-hydroxy-2-methyl-4H-pyran-4-one
0.66 - 0.18 0.22 - - - 0.20
2-Propanone, 1-(acetyloxy)- (CAS) Acetol acetate
0.12 - - 0.15 - 0.15 0.17 -
2-Propanone, 1-hydroxy- (CAS) Acetol 5.57 4.99 3.55 4.26 6.94 3.84 5.87 6.17
Ethanone, 1-(4-hydroxy-3,5-dimethoxyphenyl)- (CAS) Acetosyringone
0.50 0.58 0.66 0.67 0.56 0.38 0.49 0.65
ACETOVANILLONE - - - 1.03 - 0.49 - -
Ethanone, 1-(4-hydroxy-3-methoxyphenyl)- (CAS) Acetovanillone
- - 0.46 - - - 0.74 0.83
1,2-Benzenediol (CAS) Pyrocathecol - - - - - - 2.20 -
1,2-benzenediol, 3-methyl- (CAS) 3-methylpyro-cathecol
0.66 0.58 0.20 1.17 0.19 0.66 0.79 0.28
Tec hn i c a l Repo r t No.3Selection Pathogens For Eaglewood (Gaharu) Inoculation
30
Compound name
Relative Concentration (%)
Bo Kt Me Mu
5 cm 20 cm 5 cm 20 cm 5 cm 20 cm 5 cm 20 cm
3-Methoxy-pyrocathecol 1.43 1.69 1.06 2.01 1.13 1.37 1.70 1.14
4-METHYL CATHECOL 1.90 0.46 0.19 - 0.24 - - -
Phenol, 2-methyl- (CAS) o-Cresol - - - - - - - 0.18
Phenol, 3-methyl- (CAS) m-Cresol 0.27 0.30 0.71 0.18 - 0.45 0.31 -
Phenol, 4-methyl- (CAS) p –Cresol - - - 0.57 0.11 - - -
Phenol, 2-methoxy- (CAS) Guaiacol 1.57 1.92 1.82 2.08 1.82 2.19 - 1.36
Phenol, 2-methoxy-4-propyl- (CAS) 5-PROPYL-GUAIACOL
0.18 0.23 - - 0.13 0.15 - 0.11
Phenol, 3-methoxy- (CAS) m-Guaiacol - - - 0.22 - 0.12 0.14 -
Phenol, 4-ethyl-2-methoxy- (CAS) p-Ethylguai-acol
0.39 0.52 0.40 0.35 0.34 0.35 0.50 0.35
Phenol (CAS) Izal - - 0.89 1.07 - 0.87 0.36 -
Total 13.37 11.43 10.28 14.18 11.63 11.31 13.40 11.54
Mean for both injecion range 12.40 12.23 11.47 12.47
C. Components with other odorant characters which have not yet mentioned as gaharu constituent
Ascaridole - - - - - - 2.39 -
2H-Pyran-2-one, 6-ethyltetrahydro- (CAS) 6-ETHYL-.DELTA.-VALEROLACTONE
- - - - - - 0.14 -
Oxacycloheptadec-8-en-2-one (CAS) Ambret-tolide
0.05 - 0.82 0.52 - 0.64 - -
Oxacycloheptadecan-2-one (CAS) Dihydroam-brettolide
0.06 - 0.64 0.16 - - - -
Benzoic acid, 3,4,5-trimethoxy-, methyl ester (CAS) 3,4,5-Trimethoxybenzoic
- - - - - - 0.03
Benzoic acid, 4-(methylamino)- 0.24 - - - - - - -
Benzoic acid, 4-ethenyl-, methyl ester (CAS) METHYL 4-VINYLBENZOATE
- 0.07 - - - - - -
.beta.-bisabolene - - - - - 0.51 - -
2-Butanone (CAS) Mehtyl ethyl ketone 0.78 0.66 0.98 0.53 1.23 0.55 1.66 2.31
Butyric acid, m-nitrophenyl ester (CAS) m-Nitrophenyl butyrate
- - - 0.09 - - - -
Carveol, dihydro-, cis- 0.85 - - - - 0.76 0.61 -
Cholestane-3,6,7-triol, (3.beta.,5.alpha.,6.beta.,7.beta.)- (CAS)
- - - - - 0.07 - -
2,5-furandione, 3-methyl- (CAS) Citraconic anhydride
- - - - - 0.03 - -
Citronellyl acetate - - - - - - - 0.20
.beta.-Cyclocitral - - - - - - 0.24 -
Cyclopentanone, dimethylhydrazone (CAS) Cyclopentanone dimethylhydrazone
- - - - - 0.26 - -
Cyclopropyl carbinol 4.95 6.45 0.65 3.93 4.99 4.17 4.38 4.93
Cyclopentanone (CAS) Dumasin - - 0.32 - - - - -
1-Eicosanol (CAS) n-Eicosanol 0.33 - 1.93 0.70 - 1.61 - -
TRANS-ISOELEMICIN - 0.04 - - - - - -
PRESENTATION OF THE DATAEvaluating the Existing inoculation enggineering technique
31
Compound name
Relative Concentration (%)
Bo Kt Me Mu
5 cm 20 cm 5 cm 20 cm 5 cm 20 cm 5 cm 20 cm
Ethanone, 1-(2,5-dihydroxyphenyl)- (CAS) Quin-acetophenone
- - - 0.42 - - - -
Phenol, 2-methoxy-4-(1-propenyl)- (CAS) Isoeu-genol
- - - - - - 0.28 -
Phenol, 2-methoxy-4-(1-propenyl)-, (E)- (CAS) (E)-isoeugenol
0.98 1.14 1.25 1.45 1.30 0.71 1.38 0.84
Phenol, 2-methoxy-4-(2-propenyl)- (CAS) Eugenol
- 0.12 0.22 0.22 - 1.67 - -
5-BUTYL-2-VALERYLFURAN - - - - - 0.33 - -
2(3H)-Furanone, 3-acetyldihydro- (CAS) 2-acet-ylbutyrolactone
- - - - - - - 0.20
2(5H)-Furanone, 5,5-dimethyl- (CAS) 4,4-Di-methylbut-2-enolide
- - 0.18 - - 0.09
- -
2(5H)-Furanone, 5-methyl- (identity?) (CAS) 2-Penten-4-olide
- - - - - 0.09 - -
2(3H)-Furanone, 5-hexyldihydro- (CAS) 4-dec-anolide
- - - - - 0.93 - -
2-Furancarboxaldehyde (CAS) Furfural 0.60 0.31 0.56 0.28 0.74 0.56 0.40 0.75
2-Furanmethanol (CAS) Furfuryl alcohol 0.54 0.54 0.26 0.70 1.09 0.98 0.54 1.03
2-Furanmethanol, tetrahydro- (CAS) Tetrahydro-furfuryl alcohol
- - - - - 0.13 0.23 -
2-Heptanol, acetate (CAS) 2-HEPTYL ACETATE 0.35 - 0.63 0.25 - - - 0.30
2-Heptanone, 3-methyl- (CAS) 3-Methyl-2-hep-tanone
- 0.55 - - - - - -
Hexanoic acid, 1-methylethyl ester (CAS) Isopro-pyl hexanoate
- 0.14 - - - 0.11 - 0.06
3-Hexenoic acid - - 0.21 - - - - -
1H-Indole (CAS) Indole 0.64 - 0.77 0.65 - 0.51 0.18 -
1H-Indole, 2-methyl- (CAS) 2-methylindole - - - - - 0.48 - -
6-Nitro-5-hydroxy-1,2-dimethylindole - - - 0.03 - - 0.04 0.02
Indolizine (CAS) Indolizin - - 0.59 - - - 0.36 -
Ionol 2 - 0.03 - - - - - -
3-pentanone CAS) Diethyl ketone 0.71 - - - - - - -
1-Penten-3-one (CAS) Ethyl vinyl ketone 0.39 0.38 - 0.69 - - - -
.GAMMA.HEXALACTONE 0.65 - 0.66 - - - 0.76 -
3,5-Dihydrodecanoic acid .delta.-lactone - 0.31 - - 0.09 - - -
Muskolactone - - - - - 0.21 - -
L-isoleucine, N-acetyl- (CAS) N-Acetyl-L-isoleu-cine
- - - - - 0.70 - -
5,7-dimethoxy-2-methylindan-1-one - 0.04 - - - - - 0.04
Lineolone - - 0.13 - - - - -
METHYL MALONIC ACID - - - - - 0.11 - -
p-Menthane-2-one-1,3,3-d3 (CAS) - - - - - 0.89 - -
2,6,6-TRIDEUTERIO-O-MENTHONE - - 0.19 0.22 - - - -
Tec hn i c a l Repo r t No.3Selection Pathogens For Eaglewood (Gaharu) Inoculation
32
Compound name
Relative Concentration (%)
Bo Kt Me Mu
5 cm 20 cm 5 cm 20 cm 5 cm 20 cm 5 cm 20 cm
Benzene, 1-methoxy-4-methyl- (CAS) p-meth-ylanisole
- - - 0.20 - - - -
NEROLIDOL ISOMER - - - - - - - 0.15
4-Nonanol, 4-methyl- (CAS) 4-methyl-4-nonanol - - - - - 0.21 - -
2,5-Norbornanediol (CAS) 2,5-DIHY-DROXYNORBORNANE
- - - - - - 0.13 -
Piperidine, 1-nitroso- (CAS) NITROSOPIPERI-DINE
- 0.89 - - 0.65 - 0.57 -
PIPERIDINE, 1-(1-METHYLPENTYL)- - - - - - 0.48 - -
3-(2,5-DIMETHOXY-PHENYL)-PROPIONIC ACID 0.50 - 0.86 0.43 3.56 2.34 3.29 0.50
3-PHENYL-PROPIONIC ACID ISOPROPYL ESTER
- 2.45 - - - - - -
2-PROPYNOIC ACID - 3.17 - - - - - 5.93
9H-Purine, 6-methyl-9-(trimethylsilyl)- (CAS) 6-METHYLPURINE, 9-TRIMETHYLSILYL
- - - 0.01 - - - -
1,3-Benzenediol, 4-ethyl- (CAS) 4-Ethylresor-cinol
- - - - - - 0.42 -
1,3-Benzenediol, 5-methyl- (CAS) Orcinol 0.21 0.19 - 0.20 0.13 0.04 0.21 0.15
Benzaldehyde, 4-hydroxy-3,5-dimethoxy- (CAS) Syringaldehyde
0.47 0.57 0.52 0.52 0.58 0.40
0.50 0.58
(E)-2-hydroxy-4'-phenylstilbene - - - - - 0.09 - -
1-TRICOSENE 0.11 - - - - - - -
Benzaldehyde, 3,4-dimethoxy- (CAS) Vanillin methyl ether
- - - - - - 0.97 -
Benzaldehyde, 4-hydroxy-3-methoxy- (CAS) Vanillin
0.38 0.40 0.50 0.52 0.59 0.52 0.45 0.45
Benzeneacetic acid, .alpha.-hydroxy-2-methoxy- (CAS) 2-methoxymandelic acid
- - - - - - 0.01 -
Benzeneacetic acid, 4-hydroxy-3-methoxy- (CAS) Homovanillic acid
- - - - 0.20 0.11 0.21 -
ISO-VELLERAL - - - 0.02 - - - -
Benzenemethanol, 3,4-dimethoxy- (CAS) Vera-tryl alcohol
- 0.10 - - - - - -
2-Butanone, 4-(4-hydroxy-3-methoxyphenyl)- (CAS) Zingerone
- - - 0.63 - - - -
Ethanone, 1-(2-furanyl)- (CAS) 2-Acetyfuran - 0.14 - 0.12 - - 0.12 -
2-ACETYL FURAN - - - - - 0.23 - -
2(3H)-Furanone (CAS) .alpha.-Furanone - 0.27 - 0.23 - - 0.32 -
2(3H)-Furanone, 5-methyl- (CAS) 5-Methyl-2-oxo-2,3-DIHYDROFURAN
- 0.06 - - - - - -
2(3H)-Furanone, hexahydro-3-methylene- (CAS) 6-HYDROXYCYCLO
- - - - - - 0.15 -
2(5H)-FURANONE 0.36 1.72 1.70 1.61 2.48 1.77 1.55 2.96
2,5-DIMETHYL-3(2H)FURANONE - 0.04 - - - - - -
2-ETHYL-4-HYDROXY-5-METHYL-3(2H)FURANONE
- - - 0.17 0.14 0.13 - 0.13
2-HYDROXY-5-METHYL-2(5H)-FURANONE - - - - - - 0.28 -
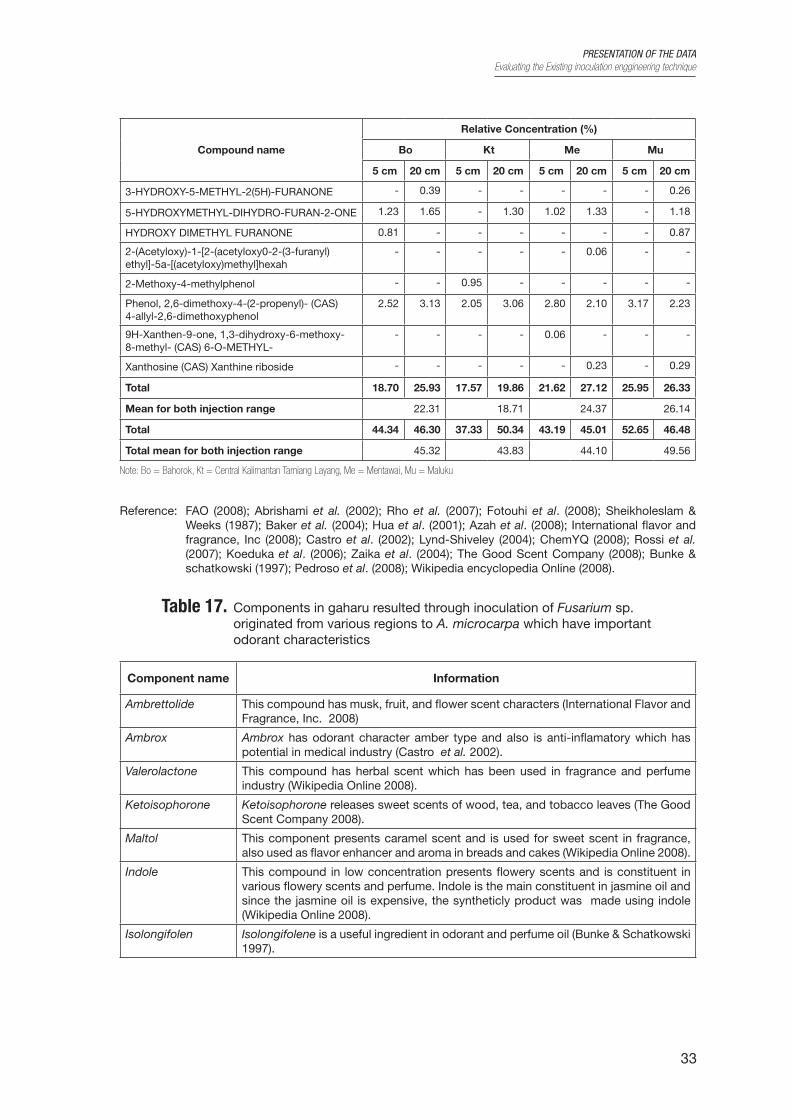
PRESENTATION OF THE DATAEvaluating the Existing inoculation enggineering technique
33
Compound name
Relative Concentration (%)
Bo Kt Me Mu
5 cm 20 cm 5 cm 20 cm 5 cm 20 cm 5 cm 20 cm
3-HYDROXY-5-METHYL-2(5H)-FURANONE - 0.39 - - - - - 0.26
5-HYDROXYMETHYL-DIHYDRO-FURAN-2-ONE 1.23 1.65 - 1.30 1.02 1.33 - 1.18
HYDROXY DIMETHYL FURANONE 0.81 - - - - - - 0.87
2-(Acetyloxy)-1-[2-(acetyloxy0-2-(3-furanyl)ethyl]-5a-[(acetyloxy)methyl]hexah
- - - - - 0.06 - -
2-Methoxy-4-methylphenol - - 0.95 - - - - -
Phenol, 2,6-dimethoxy-4-(2-propenyl)- (CAS) 4-allyl-2,6-dimethoxyphenol
2.52 3.13 2.05 3.06 2.80 2.10 3.17 2.23
9H-Xanthen-9-one, 1,3-dihydroxy-6-methoxy-8-methyl- (CAS) 6-O-METHYL-
- - - - 0.06 - - -
Xanthosine (CAS) Xanthine riboside - - - - - 0.23 - 0.29
Total 18.70 25.93 17.57 19.86 21.62 27.12 25.95 26.33
Mean for both injection range 22.31 18.71 24.37 26.14
Total 44.34 46.30 37.33 50.34 43.19 45.01 52.65 46.48
Total mean for both injection range 45.32 43.83 44.10 49.56
Note: Bo = Bahorok, Kt = Central Kalimantan Tamiang Layang, Me = Mentawai, Mu = Maluku
Reference: FAO (2008); Abrishami et al. (2002); Rho et al. (2007); Fotouhi et al. (2008); Sheikholeslam & Weeks (1987); Baker et al. (2004); Hua et al. (2001); Azah et al. (2008); International flavor and fragrance, Inc (2008); Castro et al. (2002); Lynd-Shiveley (2004); ChemYQ (2008); Rossi et al. (2007); Koeduka et al. (2006); Zaika et al. (2004); The Good Scent Company (2008); Bunke & schatkowski (1997); Pedroso et al. (2008); Wikipedia encyclopedia Online (2008).
Table 17. Components in gaharu resulted through inoculation of Fusarium sp. originated from various regions to A. microcarpa which have important odorant characteristics
Component name Information
Ambrettolide This compound has musk, fruit, and flower scent characters (International Flavor and Fragrance, Inc. 2008)
Ambrox Ambrox has odorant character amber type and also is anti-inflamatory which has potential in medical industry (Castro et al. 2002).
Valerolactone This compound has herbal scent which has been used in fragrance and perfume industry (Wikipedia Online 2008).
Ketoisophorone Ketoisophorone releases sweet scents of wood, tea, and tobacco leaves (The Good Scent Company 2008).
Maltol This component presents caramel scent and is used for sweet scent in fragrance, also used as flavor enhancer and aroma in breads and cakes (Wikipedia Online 2008).
Indole This compound in low concentration presents flowery scents and is constituent in various flowery scents and perfume. Indole is the main constituent in jasmine oil and since the jasmine oil is expensive, the syntheticly product was made using indole (Wikipedia Online 2008).
Isolongifolen Isolongifolene is a useful ingredient in odorant and perfume oil (Bunke & Schatkowski 1997).
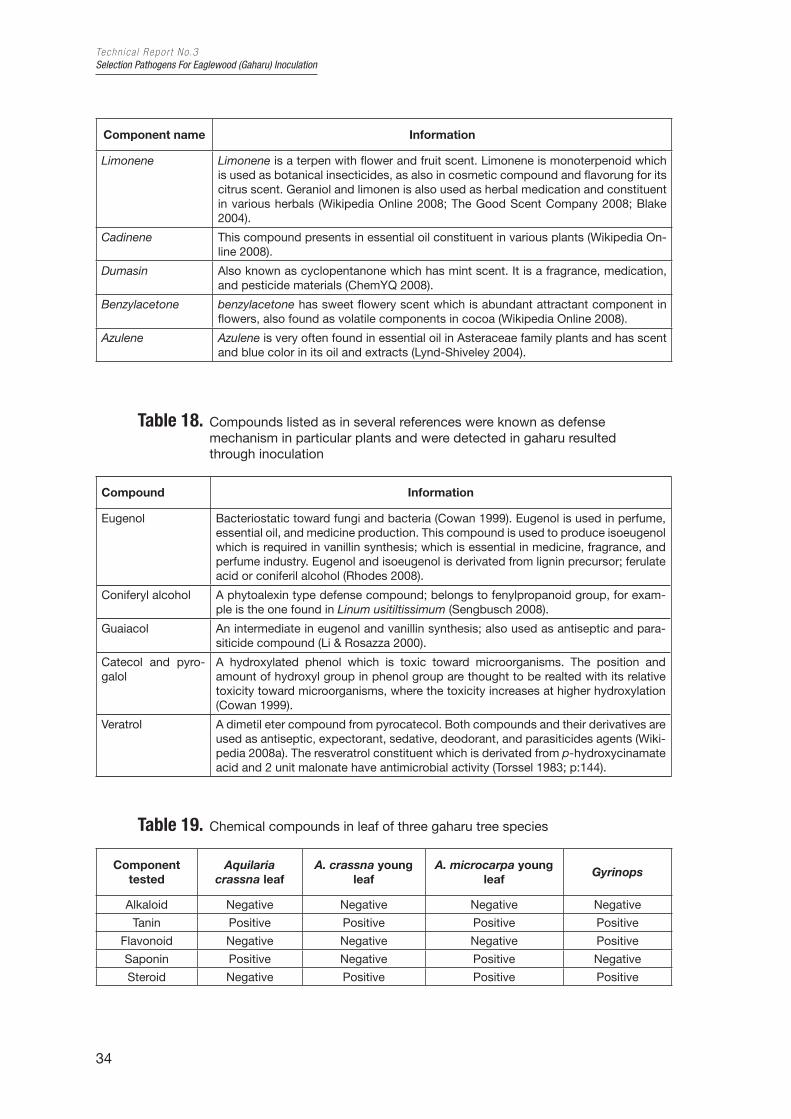
Tec hn i c a l Repo r t No.3Selection Pathogens For Eaglewood (Gaharu) Inoculation
34
Component name Information
Limonene Limonene is a terpen with flower and fruit scent. Limonene is monoterpenoid which is used as botanical insecticides, as also in cosmetic compound and flavorung for its citrus scent. Geraniol and limonen is also used as herbal medication and constituent in various herbals (Wikipedia Online 2008; The Good Scent Company 2008; Blake 2004).
Cadinene This compound presents in essential oil constituent in various plants (Wikipedia On-line 2008).
Dumasin Also known as cyclopentanone which has mint scent. It is a fragrance, medication, and pesticide materials (ChemYQ 2008).
Benzylacetone benzylacetone has sweet flowery scent which is abundant attractant component in flowers, also found as volatile components in cocoa (Wikipedia Online 2008).
Azulene Azulene is very often found in essential oil in Asteraceae family plants and has scent and blue color in its oil and extracts (Lynd-Shiveley 2004).
Table 18. Compounds listed as in several references were known as defense mechanism in particular plants and were detected in gaharu resulted through inoculation
Compound Information
Eugenol Bacteriostatic toward fungi and bacteria (Cowan 1999). Eugenol is used in perfume, essential oil, and medicine production. This compound is used to produce isoeugenol which is required in vanillin synthesis; which is essential in medicine, fragrance, and perfume industry. Eugenol and isoeugenol is derivated from lignin precursor; ferulate acid or coniferil alcohol (Rhodes 2008).
Coniferyl alcohol A phytoalexin type defense compound; belongs to fenylpropanoid group, for exam-ple is the one found in Linum usitiltissimum (Sengbusch 2008).
Guaiacol An intermediate in eugenol and vanillin synthesis; also used as antiseptic and para-siticide compound (Li & Rosazza 2000).
Catecol and pyro-galol
A hydroxylated phenol which is toxic toward microorganisms. The position and amount of hydroxyl group in phenol group are thought to be realted with its relative toxicity toward microorganisms, where the toxicity increases at higher hydroxylation (Cowan 1999).
Veratrol A dimetil eter compound from pyrocatecol. Both compounds and their derivatives are used as antiseptic, expectorant, sedative, deodorant, and parasiticides agents (Wiki-pedia 2008a). The resveratrol constituent which is derivated from p-hydroxycinamate acid and 2 unit malonate have antimicrobial activity (Torssel 1983; p:144).
Table 19. Chemical compounds in leaf of three gaharu tree species
Componenttested
Aquilaria crassna leaf
A. crassna young leaf
A. microcarpa young leaf
Gyrinops
Alkaloid Negative Negative Negative Negative
Tanin Positive Positive Positive Positive
Flavonoid Negative Negative Negative Positive
Saponin Positive Negative Positive Negative
Steroid Negative Positive Positive Positive
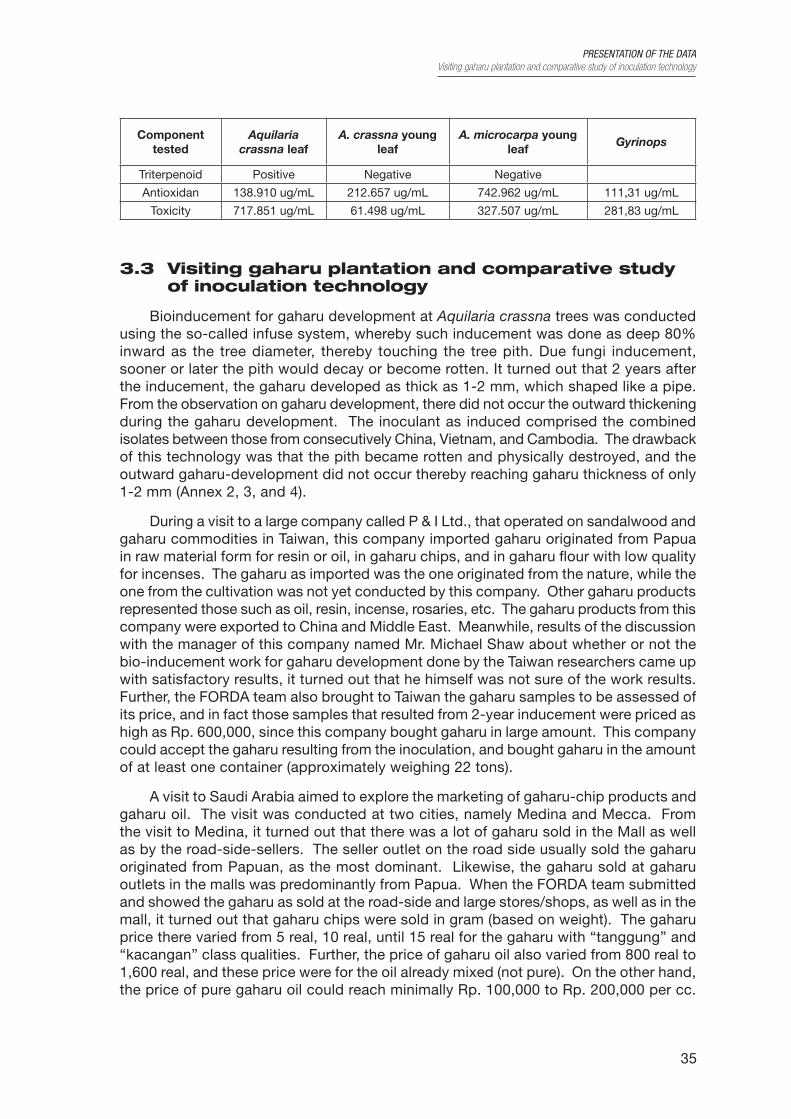
PRESENTATION OF THE DATAVisiting gaharu plantation and comparative study of inoculation technology
35
Componenttested
Aquilaria crassna leaf
A. crassna young leaf
A. microcarpa young leaf
Gyrinops
Triterpenoid Positive Negative Negative
Antioxidan 138.910 ug/mL 212.657 ug/mL 742.962 ug/mL 111,31 ug/mL
Toxicity 717.851 ug/mL 61.498 ug/mL 327.507 ug/mL 281,83 ug/mL
3.3 Visiting gaharu plantation and comparative study of inoculation technology
Bioinducement for gaharu development at Aquilaria crassna trees was conducted using the so-called infuse system, whereby such inducement was done as deep 80% inward as the tree diameter, thereby touching the tree pith. Due fungi inducement, sooner or later the pith would decay or become rotten. It turned out that 2 years after the inducement, the gaharu developed as thick as 1-2 mm, which shaped like a pipe. From the observation on gaharu development, there did not occur the outward thickening during the gaharu development. The inoculant as induced comprised the combined isolates between those from consecutively China, Vietnam, and Cambodia. The drawback of this technology was that the pith became rotten and physically destroyed, and the outward gaharu-development did not occur thereby reaching gaharu thickness of only 1-2 mm (Annex 2, 3, and 4).
During a visit to a large company called P & I Ltd., that operated on sandalwood and gaharu commodities in Taiwan, this company imported gaharu originated from Papua in raw material form for resin or oil, in gaharu chips, and in gaharu flour with low quality for incenses. The gaharu as imported was the one originated from the nature, while the one from the cultivation was not yet conducted by this company. Other gaharu products represented those such as oil, resin, incense, rosaries, etc. The gaharu products from this company were exported to China and Middle East. Meanwhile, results of the discussion with the manager of this company named Mr. Michael Shaw about whether or not the bio-inducement work for gaharu development done by the Taiwan researchers came up with satisfactory results, it turned out that he himself was not sure of the work results. Further, the FORDA team also brought to Taiwan the gaharu samples to be assessed of its price, and in fact those samples that resulted from 2-year inducement were priced as high as Rp. 600,000, since this company bought gaharu in large amount. This company could accept the gaharu resulting from the inoculation, and bought gaharu in the amount of at least one container (approximately weighing 22 tons).
A visit to Saudi Arabia aimed to explore the marketing of gaharu-chip products and gaharu oil. The visit was conducted at two cities, namely Medina and Mecca. From the visit to Medina, it turned out that there was a lot of gaharu sold in the Mall as well as by the road-side-sellers. The seller outlet on the road side usually sold the gaharu originated from Papuan, as the most dominant. Likewise, the gaharu sold at gaharu outlets in the malls was predominantly from Papua. When the FORDA team submitted and showed the gaharu as sold at the road-side and large stores/shops, as well as in the mall, it turned out that gaharu chips were sold in gram (based on weight). The gaharu price there varied from 5 real, 10 real, until 15 real for the gaharu with “tanggung” and “kacangan” class qualities. Further, the price of gaharu oil also varied from 800 real to 1,600 real, and these price were for the oil already mixed (not pure). On the other hand, the price of pure gaharu oil could reach minimally Rp. 100,000 to Rp. 200,000 per cc.
36
The gaharu-oil sample brought to Saudi Arabia by the FORDA team was certainly the one with excellent quality. Further, the shop owner asked the FORDA team, whether the Team brought the gaharu sample in large amount. Then, the FORDA Team showed the shop owner the gaharu with 2-year inducement age. After being burnt, such gaharu evolved a stinging or sharp smell, and afterwards the shop owner said that it was quite good and belonged to his criteria. However, the shop owner further said that such gaharu still deserved further processing, since there was still evolved the wood aroma which caused eye irritation. Therefore, a part of the gaharu sample still needed cleaning to drive away that wood aroma. If the gaharu sample from FORDA was cleaned, then its qualities could be priced at 2.5 real per gram or about Rp. 6,250,000 per kg. Likewise, the opinions of gaharu sellers in Mecca were almost similar to those in Medina (Annex 5-10).
37
4ANALYSIS AND INTERPRETATION OF THE
DATA AND RESULTS
4.1 Evaluating basic properties of gaharu stands
The land use in all the research sites are gaharu plantation. In Carita, the species planted is Aquilaria microcarpa, with areal is around 5 ha, it was developed since 1998, and the total individual plant are 346. This plantation is mixed with other species, mostly multipurpose trees species such as: pete (Parkia speciosa), melinjo (Gnetum gnemon), nangka (Artocarpus integra), durian (Durio zibethinus) etc. The altitude around 100 m above sea level. Both in Darmaga and Sukabumi, the plantations are monoculture, that developed in 1993 and 1999 respectively. The planted species are Aquilaria crassna and A. microcarpa in Darmaga and A.microcarpa in Sukabumi.
The pH H2O of the material in the research sites profiles is mostly less than 5, except in Sukabumi research site are slightly higher than 5. However these soils are still categorized as acid. Although these soils are developed from andesitic volcanic material that rich in base bearing mineral, because of intensive weathering and leaching the reaction remain acid and base saturation mostly < 100%. This reaction influences the availability of essensial elements. The essensial elements are element which are needed by plant, and its function can not be replaced by others elements (Pratiwi 2004 and 2005). These elements are categorized as macro nutrient (C,H, O, N, P,K,Ca,Mg dan S) and micro nutrient (Fe,Mn,B,Mo,Cu,Zn,Cl dan Co). Besides the pH, the availaility of the essensial elements are determind by organic matter content and the dynamic processes in the soil profiles. The organic carbon and total-N content of the soils in the research sites decreases downward. The amount of organic carbon is relatively low in all horizon, but in Carita research site the organic carbon is higher than in Sukabumi and Darmaga research sites. The low content of organic carbon and total – N is related to the low content of organic matter. This agrees to the fact that in Carita there were much more underground vegetation than in Darmaga and Sukabumi research sites. The underground vegetation supplies organic material to the soil. According to Sutanto (1988) the organic matter is also responsible in increasing the CEC by increasing negative charges when the pH increases from natural pH of soil (variable charges). The C/N ratio is high in almost all horizons, particularly in top horizons. It shows that the decomposition of the organic matter is not very strong.
The P content in all research sites are very low (< 2). Pratiwi (2004 and 2005) said that this element especially in the top soil has very important function for seedling growth. Others important elements are K, Al3+ and H+. In Darmaga K is medium, while in Carita and Sukabumi, are low and high respectively, and
Al3+ as well as H+ are low to very low in all research sites. Soil with high available Al has toxic characteristic. Therefore there is no danger of Al toxicity in the research area. The micro nutrient also influence plant growth, but the need are very low. These are Fe,Cu, Zn dan Mn. Elements Fe,Cu and Zn relatively low, while Mn medium to relatively sufficient. Such condition is relatively favourable for plant growth. The Cation
Tec hn i c a l Repo r t No.3Selection Pathogens For Eaglewood (Gaharu) Inoculation
38
Exchange Capacity (CEC) indicates the soil fertility degree. Soil with high CEC able to adsorb and nutrient availability better than soil with low CEC. The Cation Exchange Capacity (CEC) was determined with a buffer solution NH4Oac pH 7 and the CEC sum of cations is a result of the cations summation (K+,Na+,Ca+2, Mg+2,H+ and Al3+ ). Table 4,5 and 6 show clearly that CEC NH4oAct pH 7 of all prolifes is strongly higher that the CEC of the sum cations. The higher the CEC means that the area are relatively fertile. From Table 4,5 and 6 indicate that soil in Sukabumi has high Base Saturation (39,35-41,07), while in Darmaga is medium (16,01-17,75) and the lowest in Carita (13,05-15,77). Soil with higher pH generally has higher CEC. This tendency occure in the research sites, whereas the pH of Sukabumi is higher than that of Carita and Darmaga. The base cation of Sukabumi content is high, while of Darmaga is medium and Carita is low. In all soil horizons of the three sites, the base cation are dominated by calcium and magnesium. The highest sum of cations in research sites show in Sukabumi research site is highest and the lowest is in Carita. This can be related to the fact that Sukabumi has the highest pH H2O. The pH seem has relationship with the Base Saturation. There is tendency that the higher pH shows higher Base Saturation.
4.2 Evaluating the existing inoculation engineering technique
The best of existing inoculation engineering technique was the drilling sytem with microbial in liquid media. Fusarium spp. from Gorontalo caused the highest infection value, therefore this isolate is recommended for large amount desired gaharu production. Fusarium spp. inoculation to Aquilaria microcarpa stems results can be analysed quantitatively and qualitatively through infection area and chemical components approaches wich reflect the quantity and quality of gaharu that was formed. In artificial gaharu formed through Fusarium sp. inoculation to A. microcarpa, previously identified as gaharu constituent compounds were found and several other compounds that have odorant characteristics and comercially are used in perfumery and flavoring industry. Although statistically isolate origins did not show significant difference for infection area 6 months after inoculation, isolate origins made differences in gaharu compounds concentrations. Generally, inoculation of Fusarium sp. from Tamiang Layang (Central Kalimantan) resulted higher concentration of confirmed gaharu constituent compounds, whereas Maluku originated isolate resulted relatively higher total concentration for odorant-character compounds.
4.3 Developing a better technique from the existing inoculation engineering technique
It was stated that the use of liquid inoculant was the most efficient measure in producing artificial gaharu. This technique combined with many small induction holes distributed on the tree stem and branches, have been proven to be the most efficient technique in producing resinous heartwood (gubal) gaharu. With this technique, almost 100% of the induced trees successfully produced gaharu and we found no rotten/decayed holes that were frequently happened if bigger induction holes were used. Another important aspect in order to obtain optimum results from gaharu induction, is the strain of the fungal inoculant which also play a major role in determining the success of gaharu induction. When the strain is not compatible with the host tree, gaharu will not be produced. The tree itself has an optimum physiological stage for a successful induction, and from our observation, the most optimum tree stage for induction is after the tree produces its first fruits. This stage can also be indicated by the size of diameter
ANALYSIS AND INTERPRETATION OF THE DATA AND RESULTSCharacterizing and evaluation gaharu product
39
at breast height size of about 15 cm. Our study showed that smaller-diameter-size of tree of about 8-10 cm that has not produced its first fruit, failed to produce gaharu by induction process. Another important finding was that humidity of the location may decelerate gaharu production.
Isolates of FORDA CC-00509 dan FORDA CC-00512 inflicted the highest virulence on the gaharu-yielding trees, followed in decreasing order by the FORDA CC-00497, FORDA CC-00500, FORDA CC-00511, FORDA CC-00499 dan FORDA CC-00501. The standard of distances between inoculation-hole distance for the gaharu-yielding Aquilaria spp tree species was 10 cm, and for Gyrinops sp. species, it was 20 cm. The FORDA CC-00509 dan FORDA CC-00512 isolates turned out very effective in gaharu development. Each of the species of gaharu-yielding trees exhibited different resistance, such as Aquilaria malaccensis, Aquilaria microcarpa, and Gyrinops sp. species which were more sensitive (vulnerable) to the FORDA CC-00509 dan FORDA CC-00512 isolates. The induction using FORDA CC-00500 on Aquilaria malaccensis with the induction duration for 3 years afforded the gaharu development with favorable qualities.
4.4 Characterizing and evaluation gaharu product
Table 16 was divided into 3 groups, A) gaharu constituent group which was identified previously by researchers, B) chemicals with odorant characters group originated from pyrolysis of wood parts such as cellulose and lignin, C) unconfirmed gaharu constituent chemicals with odorant characters. The A group from Table 16, without differentiating injection range showed that the highest relative concentration accumulation of confirmed constituent (Yagura et al. 2003; Pojanagaroon & Kaewrak 2006; Burfield 2005; Konishi 2002) happened to isolates from Tamiang Layang (Central Kalimantan) for 12.89 %, followed by Maluku (10.96 %), Bahorok (10.61 %), and Mentawai (8.27%). Quantitatively and qualitatively for confirmed chemical components, isolate from Central Kalimantan Tamiang Layang gave the best artificial gaharu result as shown in relatively higher infection area and highest confirmed gaharu compounds accumulation. On Table 17 was shown that the B group is a group for compounds with odorant characters which was resulted from pyrolyisis of cellulose and lignin. This fact was shown beacause gaharu was commonly used as incense which produce fragrant aroma only when the resin-containing wood is burnt. The presence of odorant compounds from pyrolysis of wood parts probably has roles in the whole fragrance produced from burning gaharu incense. In other words, since the incense releases fragrant aroma when it is burnt, the presence of B group compounds can not be ignored despite that they are not the true gaharu resin constituent. For this odorant group which is generated from wood parts pyrolysis, the highest relative concentration was achieved by Maluku originated isolate (12.47 %), followed by Bahorok (12.40 %), Central Kalimantan Tamiang Layang (12.23 %), and Mentawai (11.47 %). This concentration difference probably was affected by the concentration of cellulose and lignin from the stem parts that were taken as samples. The effects from the compounds from this group to gaharu fragrance need further investigation. As in the C group, the highest relative concentration accumulation was achieved by Maluku isolate (26.14 %), mentawai (24.37 %), Bahorok (22.31 %), and last by Central Kalimantan Tamiang Layang isolate (18.71 %). The same order was also applied to the total of relative concentration for odorant-character components; Maluku, followed by Mentawai, Bahorok, and Central Kalimantan Tamiang Layang. Nevertheless, the contribution of odorant-character components for gaharu fragrance needs closer observation.
40
For confirmed gaharu components (the A group), generally the 5 cm injection range resulted higher accumulation concentration, unless for isolate from Tamiang Layang (Central Kalimantan) which showed higher accumulation concentration in 20 cm injection range. Generally, the A group, the 5 cm and 20 cm injection range showed accumulation relative concentration 11.25 % and 10.11 % respectively. For the B group, accumulation for the 5 cm and 20 cm injection range was 12.17 % and 12.11 % respectively. These numbers are not far different because probably the wood components were relatively the same in the tree samples which were in the same age and grew under realtively sam condition. The total accumulation for odorant-character components showed that the 20 cm injection range treatment (52.59 %) resulted higher relative concentration than the 5 cm injection range treatment (50.23 %). The same order was also shown in relative accumulation concentration in the C group compounds, 24.81 % and 20.96 % respectively for 20 cm and 5 cm injection range treatments. With more space between injections, the compounds formation ran relatively slowere as shown in less infection area. Nevertheless, this process might give more time and opportunity for particular compounds to be synthesized or accumulated, therefore resulted in relatively higher concentration. On the other side, with less space between injections where infections occured faster and more massive, the other odorant-character compounds was produced but the accumulation might not high enough when observation was carried. Further study is to be done to observe the development or changes that happen as time pass after inoculation. The py-GCMS analysis results also showed the presence of compounds that were mentioned previously in other researches as defence compounds. Some of these components even also has fragrance characteristics which are known as essential oil constituent and have been used comercially in fragrance and perfume industry, such as vanillin, euginol (Cowan, 1999; Rhodes, 2008; Koeduka et al., 2006), 4H-pyran-4-one compound and its derivats (Abrishami et al., 2002; Rho et al., 2007; Fotouhi et al., 2008), benzoic acid (NBCI, PubChem Compound 2008), cyclopentane derivats (Wikipedia Online, 2008), syringaldehyde (Pedroso et al., 2008), dumasin (ChemYQ, 2008), and elimicin (Rossi et al., 2007). Eugenol and isoeugenol are used in vanillin production which are vital ingredients in fragrance industry (Cowan, 1999). Eugenol, isoeugenol, metileugenol, and isometileugenol are the four fenilpropanoid compounds from 12 volatile compounds which have been known responsible for sweet scent in Clarkia breweri (Rhodes, 2008). Whereas coniferyl alcohol is the intermediate product in eugenol and isoeugenol biosynthesis (Cowan, 1999), and guaiacol is the intermediate in eugenol and vanillin synthesis (Li and Rosazza, 2000).
Leaf of Aquilaria microcapa was higher antioxidant compare with A. crassna and G. versteegii. Toxicity of leaf gaharu was also higher. In this case, clinis analysis should be done if leaf gaharu will use to gaharu tea.
4.5 Visiting gaharu plantation and comparative study of inoculation technology
The inoculation technique in Indonesia has already begun since 1984, as done by R&D Centre for Forest Conservation and Rehabilitation. Afterwards, such was followed by researchers from universities and research institution which started in 1995. The researchers from abroad such as Prof. Blenchette from the University of Minnesota (USA) has conducted a series of gaharu-cultivation techniques in Vietnam. Further in 2009, the ASGARIN (the Association of Indonesia’s Gaharu Enterprisers) delivered information about gaharu inoculation in Taiwan at the particular species of gaharu-yielding trees (Aquilaria crassna), as done by the researchers from the University of Chiayi (Taiwan).
5CONCLUSIONS
Gaharu-forming is initiated by biotic or abiotic factors. To synthesize gaharu artificially, one of these methods can be used; mechanical wounding on the stem, or chemical inducing methods (methyl jasmonic, oil, or brown sugar). Abiotic gaharu-forming as mentioned above did not distribute its mechanism to other regions in the tree which are not directly affected by the abiotic factor. On the contrary, gaharu-forming by biotic factor such as fungi or other microbes let the mechanism spread into other region on the tree. Due to the spreading of gaharu-forming mechanism to other tissues, the quality and quantity of the gaharu product would be more satisfying.
The best of existing inoculation engineering technique was the drilling sytem with microbial in liquid media. Fusarium spp. from Gorontalo caused the highest infection value, therefore this isolate is recommended for large amount desired gaharu production. Fusarium spp. inoculation to Aquilaria microcarpa stems results can be analysed quantitatively and qualitatively through infection area and chemical components approaches wich reflect the quantity and quality of gaharu that was formed. In artificial gaharu formed through Fusarium sp. inoculation to A. microcarpa, previously identified as gaharu constituent compounds were found and several other compounds that have odorant characteristics and comercially are used in perfumery and flavoring industry. Although statistically isolate origins did not show significant difference for infection area six months after inoculation, isolate origins made differences in gaharu compounds concentrations. Generally, inoculation of Fusarium sp. from Tamiang Layang (Central Kalimantan) resulted higher concentration of confirmed gaharu constituent compounds, whereas Maluku originated isolate resulted relatively higher total concentration for odorant-character compounds.
It was stated that the use of liquid inoculant was the most efficient measure in producing artificial gaharu. This technique combined with many small induction holes distributed on the tree stem and branches, have been proven to be the most efficient technique in producing resinous heartwood (gubal) gaharu. With this technique, almost 100% of the induced trees successfully produced gaharu and we found no rotten/decayed holes that were frequently happened if bigger induction holes were used. Another important aspect in order to obtain optimum results from gaharu induction, is the strain of the fungal inoculant which also play a major role in determining the success of gaharu induction. When the strain is not compatible with the host tree, gaharu will not be produced. The tree itself has an optimum physiological stage for a successful induction, and from our observation, the most optimum tree stage for induction is after the tree produces its first fruits. This stage can also be indicated by the size of diameter at breast height size of about 15 cm. Our study showed that smaller-diameter-size of tree of about 8-10 cm that has not produced its first fruit, failed to produce gaharu by induction process. Another important finding was that humidity of the location may decelerate gaharu production.
The soil of three different research sites have relatively the same parent material that are andesitic volcanic materials. Different physical and chemical characteristics of soil
in the research sites are related to different stage of weathering process that related to environmental condition of weathering process. Related to weathering state, Carita soil is less fertile than that of Darmaga and Sukabumi. These fertility state is related to stage of weathering process. Soil physical and chemical characteristics of soil in the studies area are support the gaharu plantation. The dominant and co-dominat species of each area are different. In Carita the dominant and co-dominant underground species are jampang (Panicum disachyum) and selaginela (Selaginella plana), while in Darmaga are pakis (Dictyopteris irregularis) and seuseureuhan (Piper aduncum) and in Sukabumi are jampang (Panicum disachyum) and rumput pait (Panicum barbatum). The composition of underground species is also different on every research sites as indicated by SI < 50%. This difference in composition is due to the difference of environmental factor such as climate, topography and soil characteristics.
In South Kalimantan, the selected sites were distributed in regencies, namely, Hulu Sungai Selatan and Hulu Sungai Tengah. The annual total rainfall in the area under study was 2361 mm. The rainy season began in October and ease in June. In general, the soil in each site was considered very poor. The number plant species were varied from site to site.
43
6RECOMMENDATIONS
It is recommended to use liquid media for gaharu production in mass-scale operation. Certainly, it is done so by paying attention to standard-operation procedures (SOP), such as the aggressiveness of fungi that will be implemented, the patterns regarding of distance between injection holes, and position of injection holes and their depth
The assessment on gaharu-development technique should be done two months afterwards, in order to know the success of early stage in gaharu development by using the sampling method at each of the injected trees.


45
7IMPLICATIONS FOR PRACTICE
Now gaharu farmer’s or users can inject gaharu producing tree quickly and practice. The hole injection could not closed by plasticine (wax), liquid inoculant is easy to use, use small drill (3 mm), and also save the time.


47
ANNEX
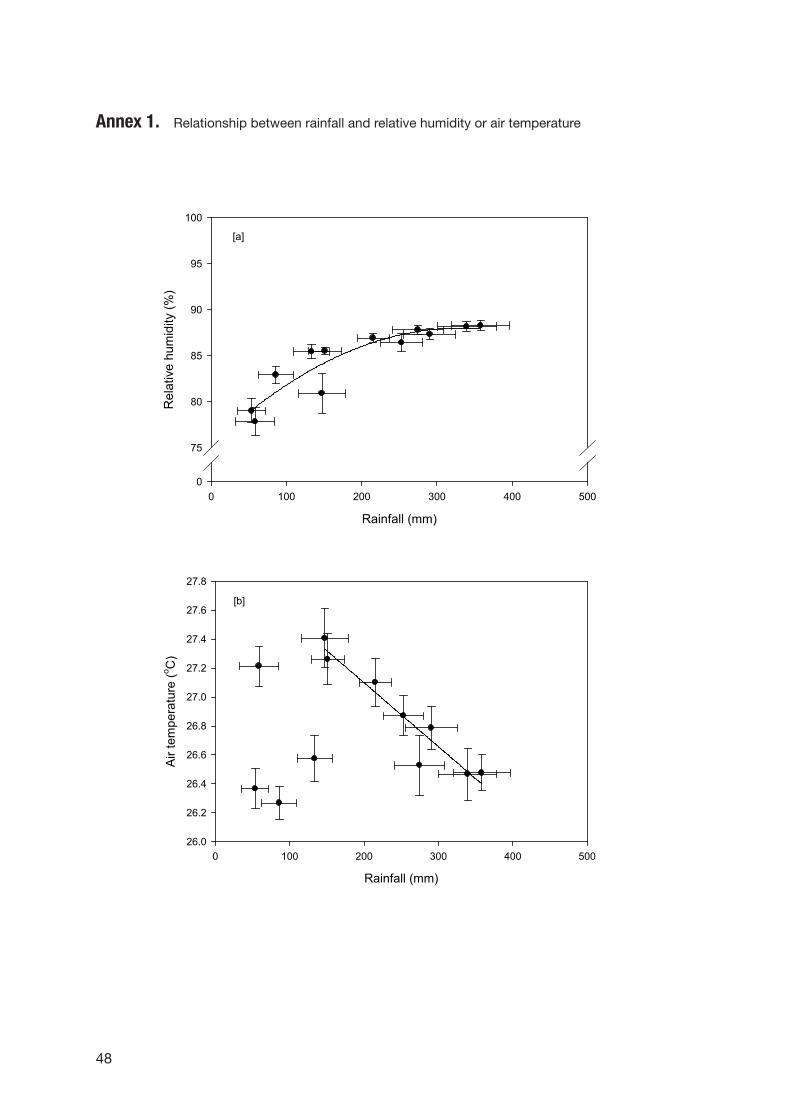
48
Annex 1. Relationship between rainfall and relative humidity or air temperature
Rainfall (mm)
0 100 200 300 400 500
Rel
ativ
e hu
mid
ity (%
)
0
75
80
85
90
95
100
[a]
Rainfall (mm)
0 100 200 300 400 500
Air t
empe
ratu
re (o C
)
26.0
26.2
26.4
26.6
26.8
27.0
27.2
27.4
27.6
27.8
[b]
49
Annex 2. Gaharu plantation in Taiwan
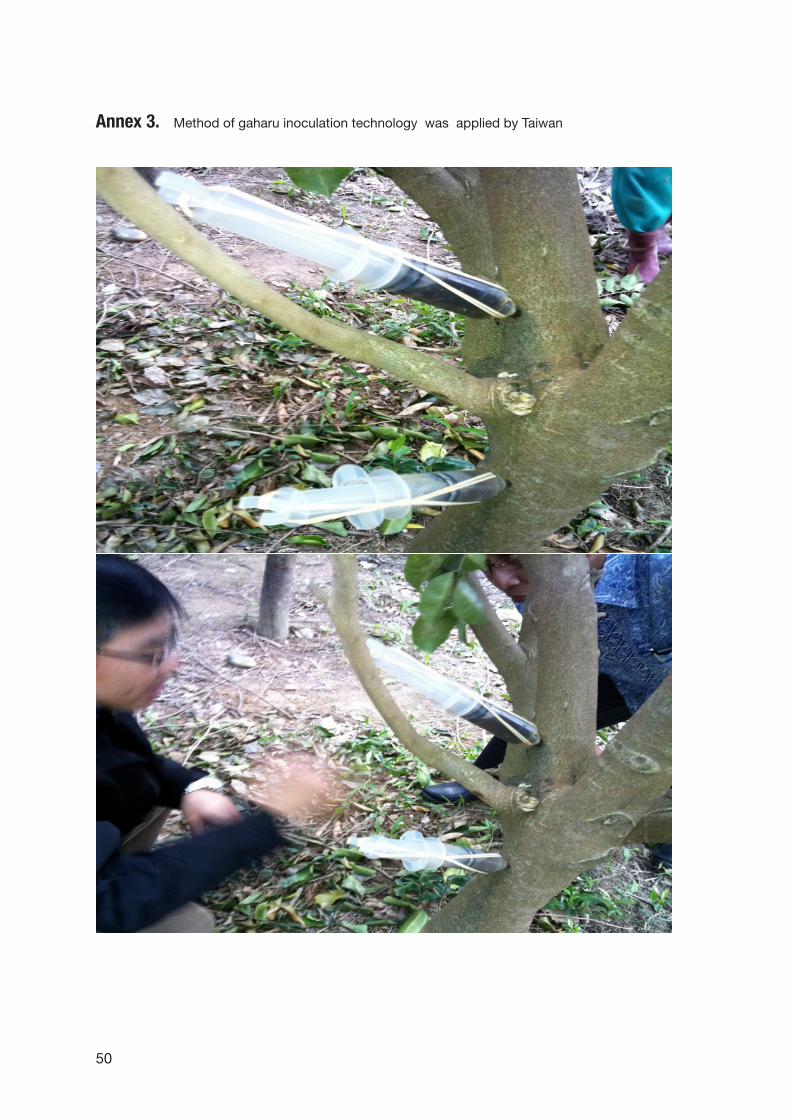
50
Annex 3. Method of gaharu inoculation technology was applied by Taiwan
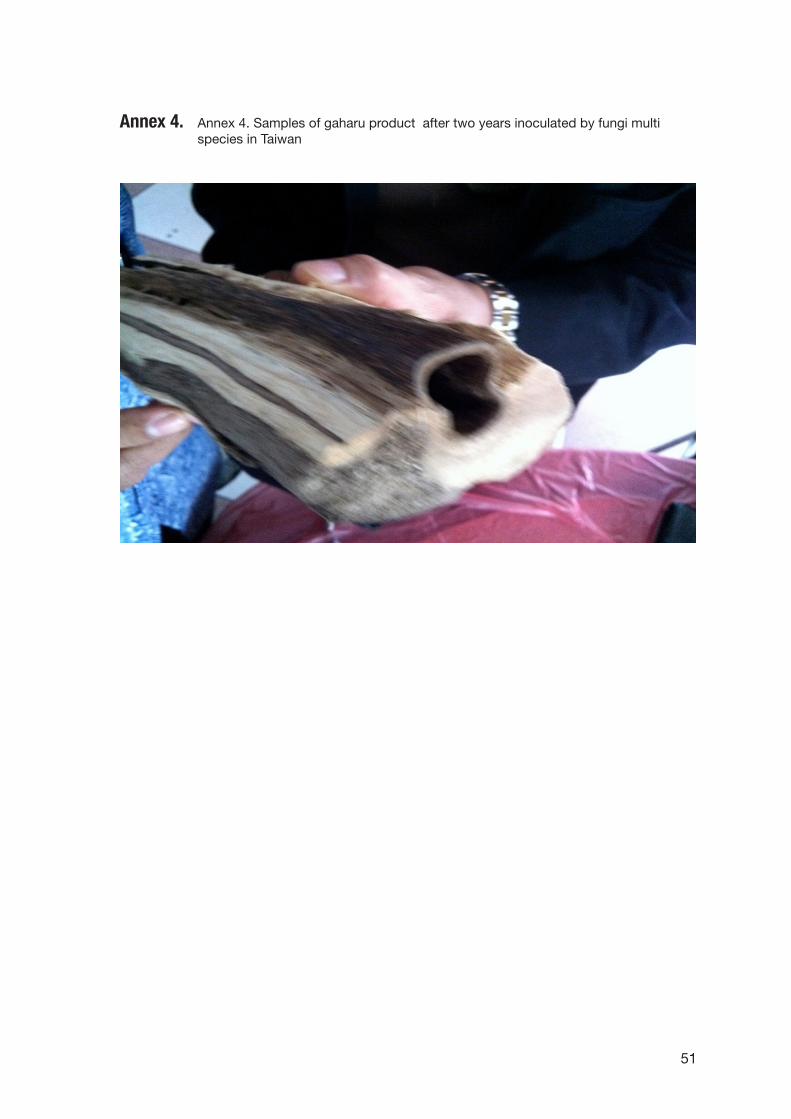
51
Annex 4. Annex 4. Samples of gaharu product after two years inoculated by fungi multi species in Taiwan
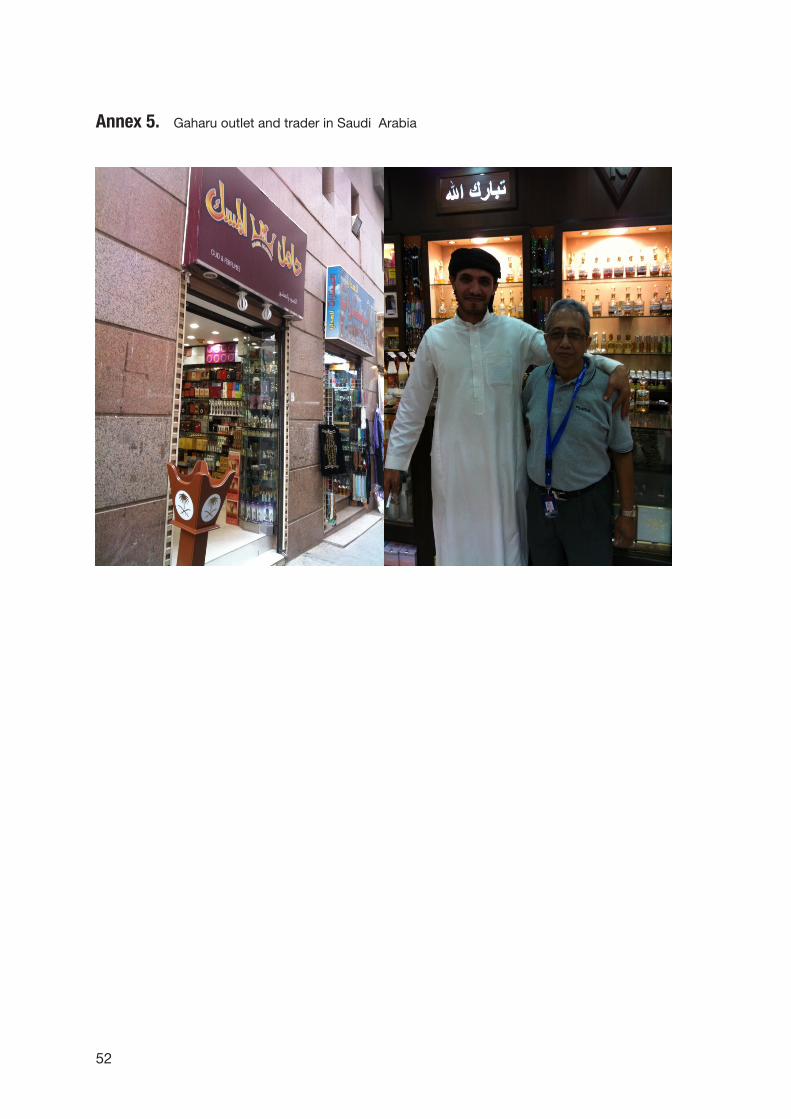
52
Annex 5. Gaharu outlet and trader in Saudi Arabia
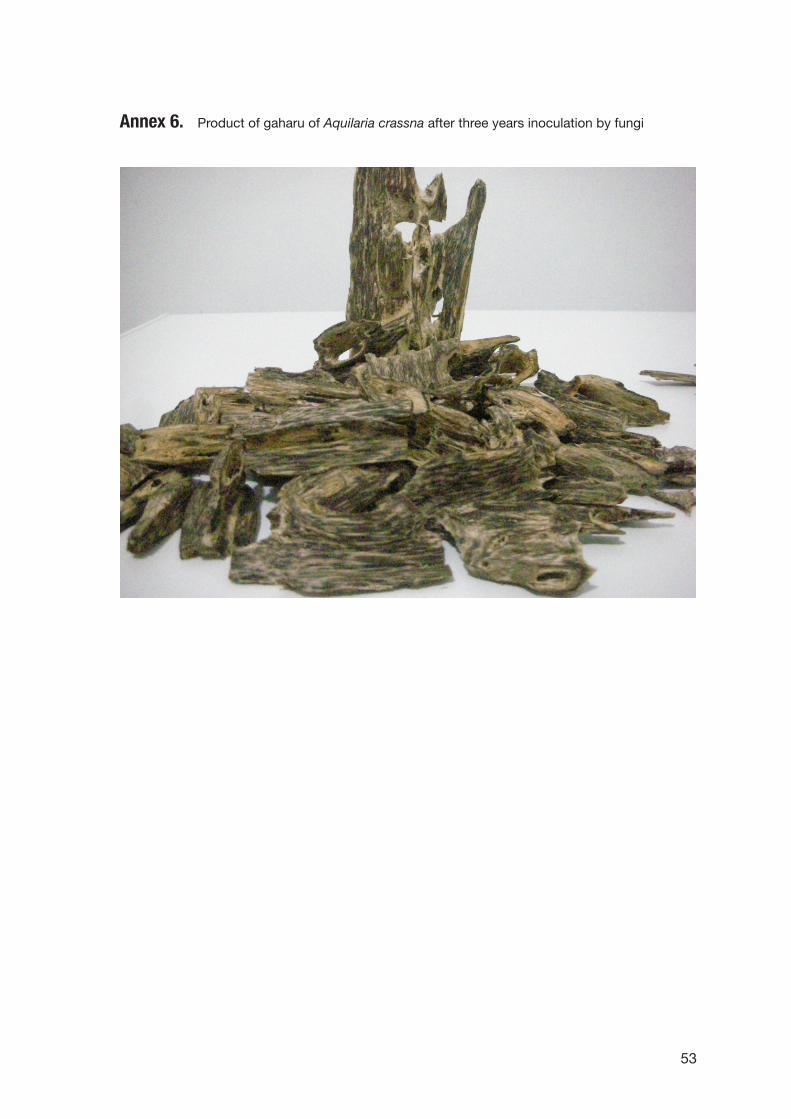
53
Annex 6. Product of gaharu of Aquilaria crassna after three years inoculation by fungi
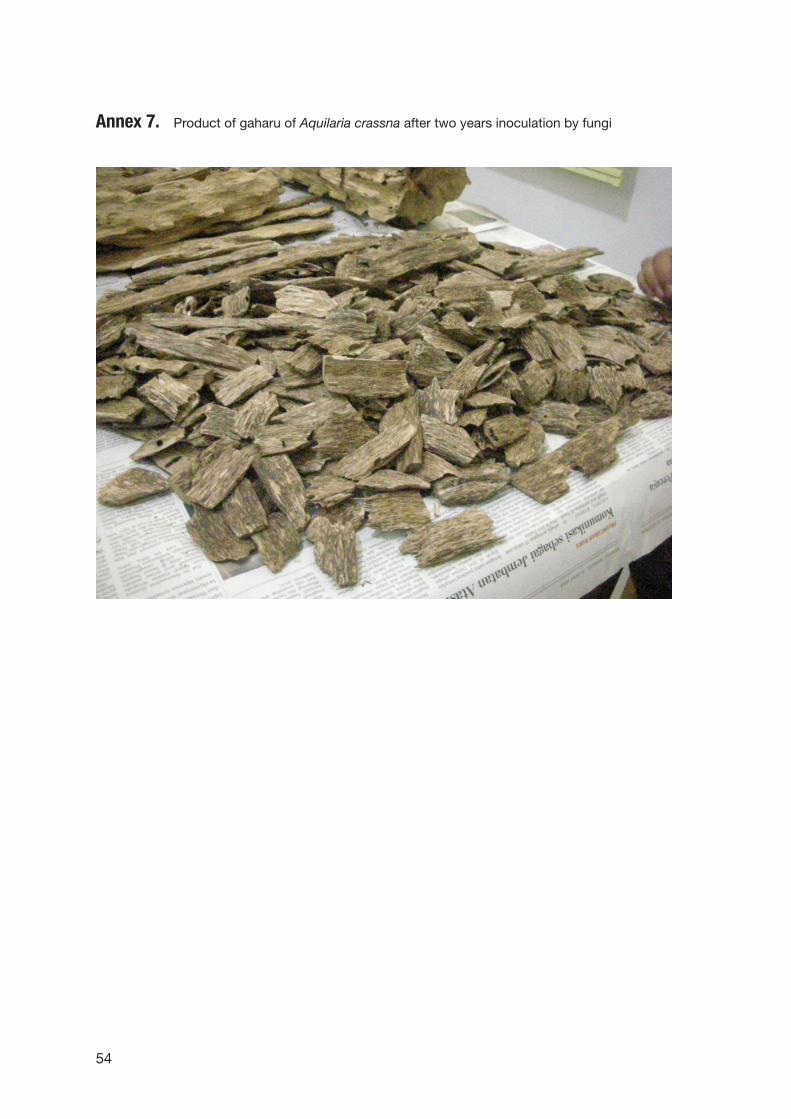
54
Annex 7. Product of gaharu of Aquilaria crassna after two years inoculation by fungi
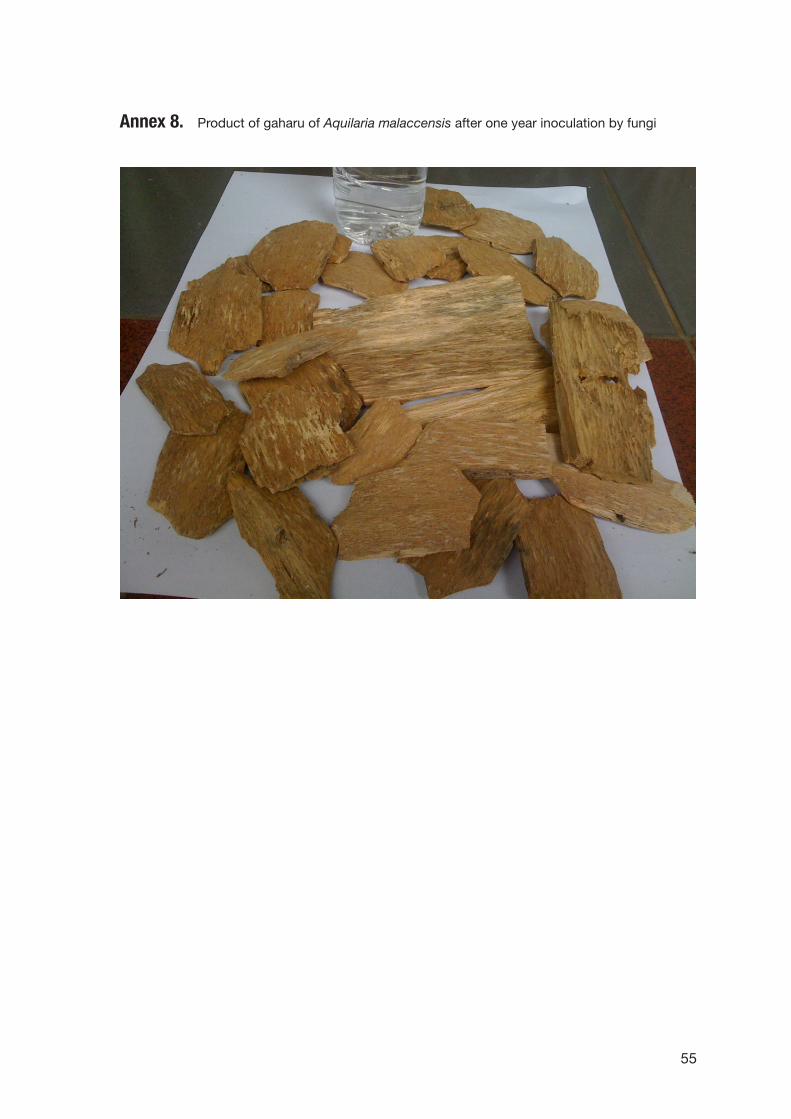
55
Annex 8. Product of gaharu of Aquilaria malaccensis after one year inoculation by fungi
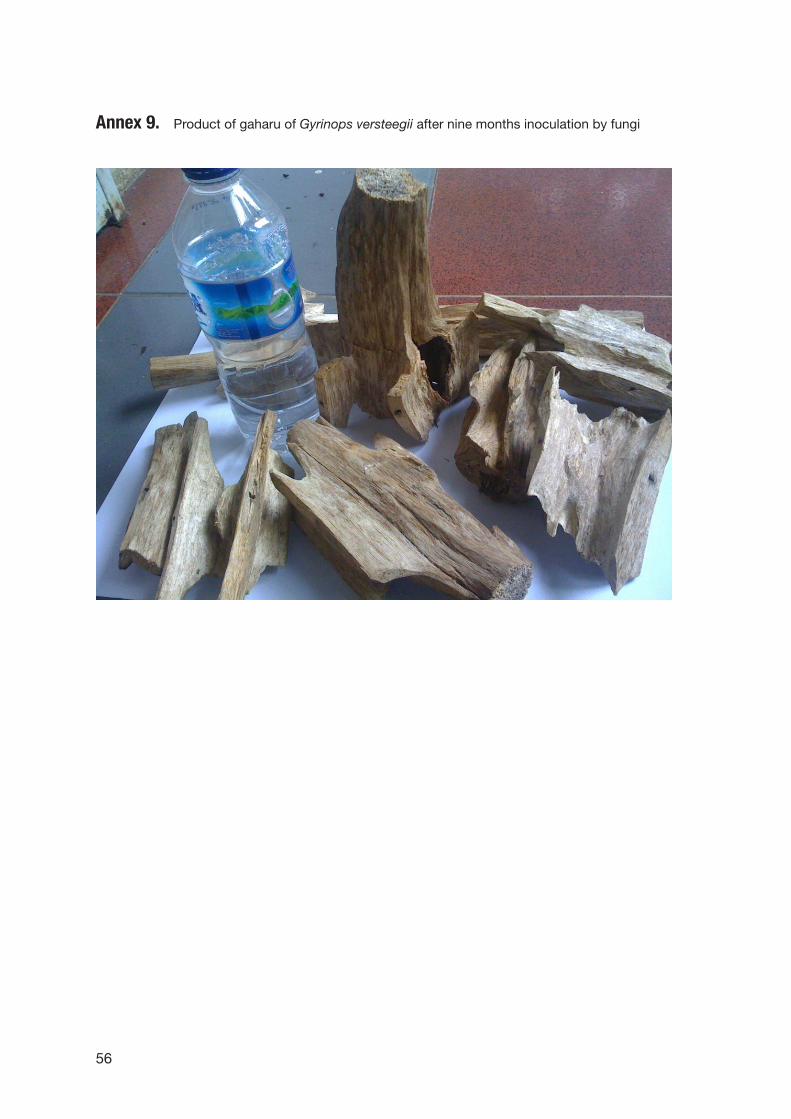
56
Annex 9. Product of gaharu of Gyrinops versteegii after nine months inoculation by fungi
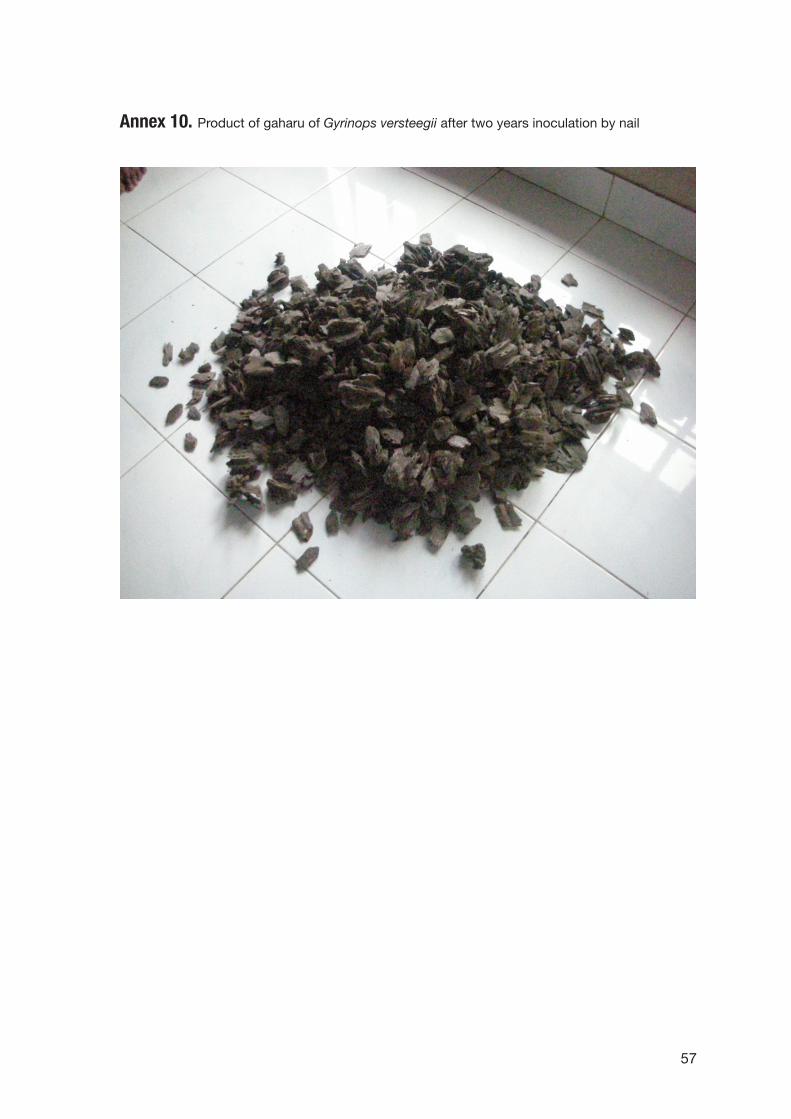
57
Annex 10. Product of gaharu of Gyrinops versteegii after two years inoculation by nail

59
BIBLIOGRAPHY
Abrishami F, Teimuri-Mofrad R, Bayat Y, Shahrisa A. 2002. Synthesis of some aldoxime derivatives of 4H-Pyran-4-ones. Molecules 7: 239–244.
Allison, L.E. 1965. Organic matter by Walkey and Black methods. In C.A. Black (ed.). Soil Analyses. Part II.
Azah MAN, Chang YS, Mailina J, Abu Said A , Abd. Majid J, Saidatul Husni S, Nor Hasnida H, Nik Yasmin Y. 2008. Comparison of chemical profiles of selected gaharu oils from Peninsular Malayia. The Malaysian Journal of Analytical Sciences 12 (2): 338 – 340.
Baker CJ. Whitaker BD, Mock NM, Rice C, Robert DP, Deahl KL, Averyanov AA. 2004. Stimulatory effect of acetosyringone on plant/pathogen recognition. http://www.ars.usda.gov/research/publications/publications. htm. [20 June 2008]
Blake S. 2004 Medicinal Plant Constituents. http://www.naturalhealthwizards. com/MedicinalPlantConstituents.pdf. [21 June 2008].
Bunke EJ, Schatkowski D. 1997. Isolongifolanol derivates, their production and their use. United State Patent. http://www.freepatentsonline.com [31 December 2008]
Burfield T. 2005a. Agarwood Chemistry. www.cropwatch.org. [2 February 2007].
Castro JM, Salido S, Altarejos J, Nogueras M, Sánchez A. 2002. Synthesis of ambrox® from labdanolic acid. Tetrahedron 58 (29): 5941-5949.
Chakrabarty, K., A.Kumar and V. Menon. 1994. Trade in agarwood. WWF-Traffic India.
ChemYQ. 2008. Dumasin; Succinaldehyde. http://www.chemyq.com/En/xz/xz11 [3 April 2008]
Cowan M. 1999. Plant products as antimicrobial agents. Clinical microbiology review. 12 (4): 564 – 582.
Djaenuddin, D., Basuni, Hardjowigeno S., Subagjo H., Sukardi, M., Ismangun, Marsudi, Ds.,Suharta, N., Hakim, L., Widagdo, Dai, J., Suwandi, V., Bachri, S., and Jordens, E.R. Land Suitability for Agricultural and Silviculture Plants. Laporan Teknis No. 7. Versi 1.0. April 1994. Center for Soil and Agroclimate Research, Bogor. (In Indonesian)
FAO. 2008. Food safety and Quality: Flavoruing Index. http://www.fao.org/ ag/agn/jecfa-flav/index.html?showSynonyms=1 [ 1 November 2008: 2.31 pm]
Forestry Commission GIFNFC. 2007. Chemicals from trees. http://treechemicals. csl.gov.uk/review/extraction.cfm. [14 July 2007].
Fotouhi L, Fatehi A, Heravi MM. 2008. Investigation of electrooxidation reaction of some tetrahydrobenzo[b]pyran derivatives. Int. J. Electrochem. Sci. 3: 721 - 726.
Hua SST. 2001. Inhibitory effect of acetosyringone on two aflatoxin biosynthetic genes. Applied Microbiology 32: 278 – 281.
60
Hills WE. 1987. Heartwood and Tree Exudates. Berlin: Springer-Verlag.
International flavor and fragrance, Inc. 2008. http://www.iff.com/Ingredients.nsf/ 0/45BD7B214C6F661E80256990005D79C2 [31 December 2008]
Isnaini Y. 2004. Induksi produksi gubal gaharu melalui inokulasi cendawan dan aplikasi faktor biotik (Disertation). Bogor: Program Pascasarjana Institut Pertanian Bogor.
Lembaga Penelitian Tanah. 1962. Peta Tanah Tinjau Jawa dan Madura. LPT.Bogor.
Li T, Rosazza JPN. 2000. Biocatalytic synthesis of vanillin. Applied and Environmental Microbiology 66 (2): 684 – 687.
Lynd-Shiveley, E.M. 2004. Azulene and chamomile. www. Aromaticplant project.com. [20 June 2008].
Jenny, H. 1941. Factors of soil formation.McGrawhill. New York. 280 p.
Koeduka T, Fridman E, Gang DR, Vassão DG, Jackson BL, Kish CM, Orlova I, Spassova SM, Lewis NG, Noel JP, Baiga TJ, Dudareva N, Pichersky E. 2006. Eugenol and isoeugenol, characteristic aromatic constituents of spices, are biosynthesized via reduction of a coniferyl alcohol ester. Proc Natl Acad Sci U S A. Jun 16 2006.
Konishi T, Konoshima T, Shimada Y, Kiyosawa S. 2002. Six New 2-(2-Phenylethyl)chromones from Agarwood. Chem. Pharm. Bull. 50 (3): 419-422.
Mueller-Dumbois, D., and H. Ellenberg. 1974. Aims and methods of vegetation ecology. John Willey and Son. New York.
Pedroso A.P.D, Santos S.C., Steil A.A., Deschamps F., Barison A., Campos F., Biavatti M.W. 2008. Isolation of syringaldehyde from Mikania laevigata medicinal: extract and its infl uence on the fatty acid profi le of mice. Brazilian Jour of Pharmacognosy 18(1): 63-69.
Pojanagaroon S, Kaewrak C. 2006. Mechanical methods to stimulate aloes wood formation in Aquiliria crassna Pierre ex H Lec (kritsana) trees. ISHS Acta Hort 676. www.actahort.org. [22 May 2007].
Pratiwi. 2004. Hubungan antara sifat-sifat tanah dan komposisi vegetasi di daerah Tabalar, Kabupaten Berau, Kalimantan Timur. Buletin Penelitian Hutan, 644/2004:63-76.
Pratiwi. 2005. Ciri dan sifat lahan habitat mahoni (Swietenia macrophylla King.) di beberapa hutan tanaman di pulau Jawa. Gakuryoku Vol.XI,No.2,2005:127-131.
Pratiwi. 1991. Soil characteristics and vegetation composition along a topotransect in the Gunung Gede Pangrango National Park, West Java, Indonesia. MSc. Thesis. International Training Center For Post Graduate Soil Scientists, Universiteit Gent, Belgium.
Pratiwi and B. Mulyanto. 2000. The relationship between soil characteristics with vegetation diversity in Tanjung Redep, East Kalimantan. Forestry and Estate Crops Research Journal. Vol.1, No.1, 2000: 27-33.
61
Rho HS, Baek HS, You JW, Kim S, Lee JY, Kim DH, and Chang IS. 2007. New 5-Hydroxy-2-(hydroxymethyl)-4H-pyran-4-one derivative has both tyrosinase inhibitory and antioxidant properties. Bull. Korean Chem. Soc. 28 (3): 471-473.
Rhodes D. 2008. Secondary products derived from aromatic amino acids: Eugenol and isoeugenol. www.hort.purdue.edu. [20 June 2008].
Rossi PG, Bao L, Luciani A, Panighi P, Desjobert JM, Costa J, Casanova J, Bolla JM, and Berti L. 2007. (E)-Methylisoeugenol and elemicin: antibacterial components of Daucus carota L. essential oil against Campylobacter jejuni. J. Agric. Food Chem 55 (18): 7332–7336.
Sengbusch PV. 2008. Phenolic compounds. http://www.biologie.uni-hamburg. de/b-online/e20/20d.htm. [10 April 2008].
Sheikholeslam SN, Weeks DP. 1987. Acetosyringone promotes high efficiency transformation of Arabidopsis thaliana explants by Agrobacterium tumafacien. Plant Molecular Biology 8: 291 – 198.
Sidiyasa, K., S.Sutomo., and R. S.A. Prawira. 1986. Eksplorasi dan studi permudaan jenis-jenis penghasil gaharu di wilayah hutan Kintap, Kalimantan Selatan (Exploration and Study of Regeneration of Gaharu producing species in Kintap Forest Region, South Kalimantan). Buletin Penelitian Hutan No. 474:59-66.
Sutanto, R. 1988. Minerlogy, charge properties and classification of soils on volcanic materials and limestone in Central Java. Indonesia. PhD Thesis. ITC-RUG. Gent. 233 p.
Soil Conservation Service. 1984. Procedure for collecting samples and methods of analyses for soil survey. Report No. I. Revised ed.,U.S. Dept.Agric. 68 p.
The Good Scent Company. 2008. Limonene; Ketoisophorone; syringaldehyde, tiglaldehyde. http://www.thegoodscentscompany.com/gca/gc1014951.html [20 June 2008].
Torssell KBG. 1983. Natural Product Chemistry. Chichester, New Tork, brisbane, Toronto, Singapore: John Wiley & Son Limited.
Wikipedia Online. 2008. Pyrrolidine; Propargyl alcohol; Ptalic acid; Mesityl oxide; Maltol; Indole; Glutanic acid, Furanone; Elemicin; DABCO; Crotonic acid; Cadinene; Butyric acid; Benzylacetone; Caprylic acid. http://en.wikipedia.org/wiki/. [1 June 2008]
Yagura T, Ito M, Kiuchi F, Honda G, Shimada Y. 2003. Four new 2-(2-Phenylethyl) chromone derivatives from withered wood of Aquilaria sinensis. Chem Pharm Bull. 51:560-564.
Zaika EI, Perlow RA, Matz E, Broyde S, Gilboa R. 2004. Substrate discrimination by formamidopyrimidine-DNA glycosylase. The J. Biol. Chem. 279 (6) issue 6: 4849-4861.


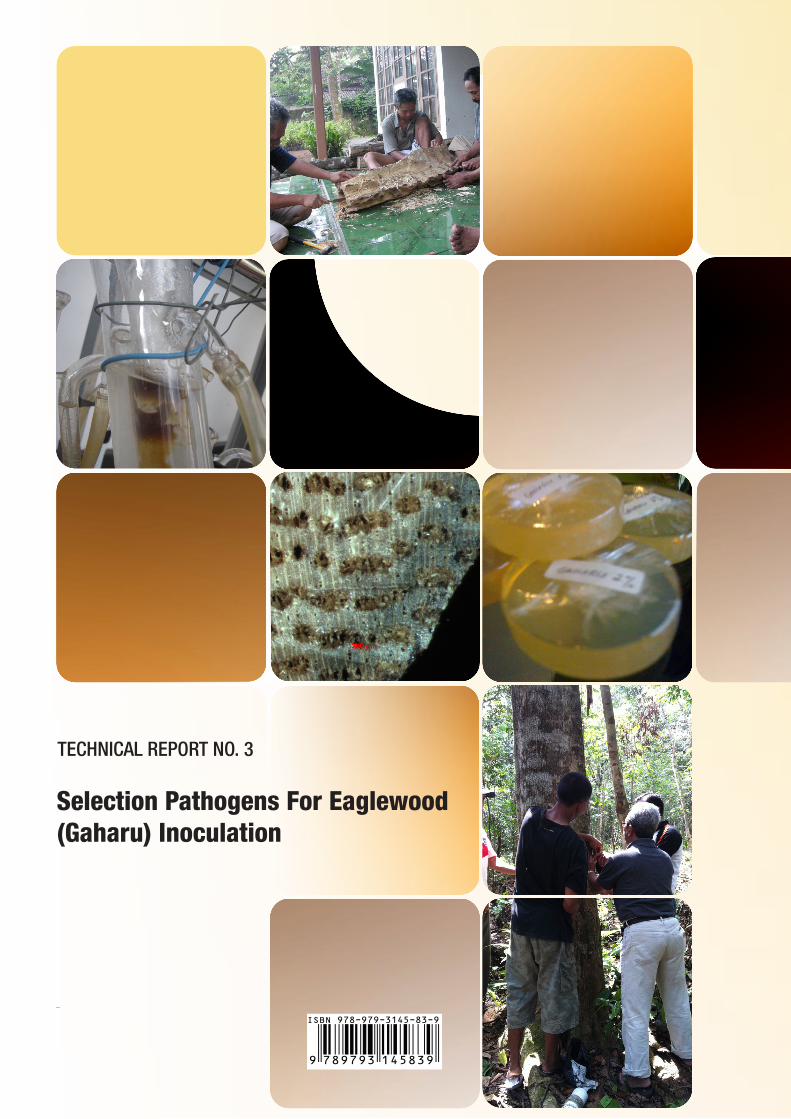
9 789793 145839
ISBN 978-979-3145-83-9
by :Erdy Santoso, Pratiwi, Erry Purnomo, Ragil S.B. Irianto,
Bambang Wiyono, Eka Novriyanti, Maman Turjaman
Selection Pathogens For Eaglewood (Gaharu) Inoculation
Selection Pathogens For Eaglewood (Gaharu) Inoculation
Production and Utilization Technologyfor Sustainable Development of Eaglewood (Gaharu)
in Indonesia
ITTO PD425/06 Rev. 1 (I)
TECHNICAL REPORT NO. 3
MINISTRY OF FORESTRY OF INDONESIAIN COOPERATION WITH
INTERNATIONAL TROPICAL TIMBER ORGANIZATIONIT OT
TECHNICAL REPORT NO. 3
R & D CENTRE FOR FOREST CONSERVATION AND REHABILITATION FORESTRY RESEARCH AND DEVELOPMENT AGENCY (FORDA)
MINISTRY OF FORESTRYINDONESIA
2011