Embed Size (px)
Citation preview

2
Selection of Additive Manufacturing Technologies Using Decision Methods
Anderson Vicente Borille and Jefferson de Oliveira Gomes Technological Institute of Aeronautics - ITA
Brazil
1. Introduction
The use of Rapid Prototyping technologies is becoming increasingly popular due to the reduction of machinery prices. Consequently, more and more industries now have the opportunity to apply such processes to improve their product development cycles. The term Rapid Prototyping was commercially introduced to highlight the first application, the quickly production of prototypes into the product development process. Improvements were done in the quality of the equipments and the variety of materials. Furthermore, new processes were introduced into the market, which enlarged the application’s range of Rapid Prototyping technologies. As a consequence, new terms were also used to describe the final application of such technologies as Rapid Manufacturing (RM); Rapid Tooling (RT), which indicates the use of such technologies to produce moulds and tooling, etc. However, as important as to identify the technical limits of the each technology, it is needed to balance the characteristics of each process in order to decide which one fulfills the product requirements the best way. And this should be done systematically using a decision method. The decision method, in turn, should be able to evaluate the relative weights of product requirements related to the process capabilities. It is not just a matter of manufacturing process substitution. It is possible – and desirable in case of RM – to modify designing and product development processes too. This chapter is divided into two sections. The first part considers prototyping applications, where the requirements of the part to be produced are not too severe. In this case, available process capabilities should be used to satisfy costumer’s needs, usually at the lowest manufacturing cost and delivery time possible. The second section is intended to those who are concerned in Rapid Manufacturing Applications. Rapid Manufacturing means that the parts will be produced as end product, thus, the product requirements are more rigorous then prototyping applications.
2. Part I: Rapid prototyping applications
This chapter aims to present different decision making approaches to choose an adequate RP process. Here, four decision approaches were applied to compare six processes regarding six criteria, using the input data from previous works. As result, three decision methods were compared, additionally to the references. Two different scenarios were constructed, where different important attributes were considered, simulating two different
www.intechopen.com

Rapid Prototyping Technology – Principles and Functional Requirements
30
prototype applications. It was demonstrated that not all methods result to the same RP ranking, however most of them provide the same first option for a given scenario. The characteristics of the methods could be related to their influence on the evaluation, which serve as guidelines for the decision makers in order to reflect their exact opinion or requirements. Although the fundamentals of the decision methods are presented here, one should be careful while comparing the RP process, because their attributes may vary enormously depending on the parameter process to build a part. Despite all the considerations and precautions to be observed, the selection of the RP process can be done in a simple way, dispensing complex calculations.
2.1 Example of application
The decision process requires the evaluation of alternative characteristics (attributes) regarding the desired requirements (criteria) to reach an objective. Byun and Lee (2005), based on questionnaires answered by users, concluded that the following six attributes are the most important regarding the use of RP processes: accuracy (A), surface roughness (R), tensile strength (E), elongation (S), cost of the part (C) and build time (B). Further, they gathered these attributes from six different RP processes, and proposed a method to evaluate these attributes simulating two different scenarios: Scenario 1) where the cost of the part (C) and build time (B) were considered most important factors, followed by S and E, and A and R, and Scenario 2) where accuracy (A) and surface roughness (S) where considered most important followed by S and E, and C and B. Later, Padmanabhan (2007) used the same RP processes attributes to evaluate similar conditions, but using Graph Theory & Matrix Approach (GT&MA) instead of Topsis. The attributes of the Alternatives presented in Table 1 were used by both previous works.
Process A R S E C B
Process1 120 6,5 65 5 Very high Medium
Process2 150 12,5 40 8,5 Very high Medium
Process3 125 21 30 10 High Very high
Process4 185 20 25 10 Slightly high Slightly low
Process5 95 3,5 30 6 Very high Slightly low
Process6 600 15,5 5 1 Very very low Very low
Table 1. Alternatives attributes table (Byun and Lee, 2005; Rao and Padmanabhan, 2007)
Based on the information from the processes and from the requirements, a decision maker should be able to evaluate the alternatives and propose a recommendation. The issues to manage consist that most product requirements are contradictory. For example, in the Table 1 the process which has the lowest cost produces the weakest part. The decision maker should be able to answer – in a systematically form – how much more important is the cost in relation to tensile strength? Such questions are well complicated to be translated into numbers directly, but using established procedures the answer can be very consistent. Decision Making processes are usually elaborated to be useful to a large range of applications, consequently, they have to be lapidated to be applied to each specific use. An important point of this work, is that for each decision approach, some kind of consideration had to be done in order to represent an approximated scenario to different decision
www.intechopen.com

Selection of Additive Manufacturing Technologies Using Decision Methods
31
methods. They were most related to the conversion of scales and weighting procedures. Even with these considerations, most decision methods provided the same process as the first option. Thus, the decision maker may feel free to use the most familiar way, just considering some rough characteristics.
2.1.1 Analytic Hierarchy Process (AHP)
The Analytic Hierarchy Process (AHP) is a multi-criteria decision-making approach and was introduced by Thomas L. Saaty (Saaty, 1977; Saaty 1990). The AHP has attracted the interest of many researchers mainly due to the mathematical properties of the method and the fact that the required input data is rather easy to obtain (Triantaphyllou, 1995, Guglielmetti et. al. 2003). a) Method The method is based on a pairwise comparison of alternatives and criteria of a hierarchical structure (Fig. 1). In order to evaluate the approach, a comparison matrix for the criteria must be described, as the Fig. 2.
Main
Objective
Criterion 1
Alternative 1 Alternative 2
Sub-criterion 1.1
Alternative …
Criterion 2
Alternative 3
Sub-criterion 1.2 Sub-criterion 2.1 Sub-criterion 2.2
Criterion …
Sub-criterion …
Main
Objective
Criterion 1
Alternative 1 Alternative 2
Sub-criterion 1.1
Alternative …
Criterion 2
Alternative 3
Sub-criterion 1.2 Sub-criterion 2.1 Sub-criterion 2.2
Criterion …
Sub-criterion …
Fig. 1. The hierarchical structure of AHP approach (Saaty, 1977)
1 2 ... nC C C
1
2
..
n
C
C
C
1 1 1 2 1
2 1 2 2 2
1 2
/ / ... /
/ / ... /
... ... ... ...
/ / ... /
n
n
n n n n
w w w w w w
w w w w w w
w w w w w w
Fig. 2. Comparison matrix fort the criteria (Saaty, 1977)
Each element wi/wj have to represent how much the i criteria is more important than the j, following the fundamental scale from Saaty (Table 2).
www.intechopen.com

Rapid Prototyping Technology – Principles and Functional Requirements
32
Intensity of importance
Definition Explanation
1 Equal importance Two activities contribute equally to the
objective
3 Moderate importance of one over another
Experience and judgment slightly favour one activity over another
5 Essential or strong
importance Experience and judgment strongly favour one
activity over another
7 Very strong importance
An activity is strongly favoured and its dominance demonstrated in practice
9 Extreme importance The evidence favouring one activity over another is of the highest possible order of
affirmation
2,4,6,8 Intermediate values
between the two adjacent judgments
When compromise is needed
Reciprocals If activity i has one of the above numbers assigned to it when compared
to j, then j has the reciprocal value when compared with i.
Rationals Ratios arising from the
scale If consistency were to be forced by obtaining n
numerical values to span the matrix
Table 2. The fundamental scale (Saaty, 1977)
In order to evaluate the criteria matrix using the AHP method, the principal eigenvector must be calculated. Saaty (2003) justified that the eigenvector has two meanings: first, is a numerical ranking of the alternatives, and second, the ordering should also reflect intensity as indicated by the ratios of the numerical values. The explanation of why the eigenvector should be used (Saaty, 2003; Saaty, 1977) as well how to calculate it (Saaty 2000) can be found in the respective literature. The criteria matrix should be then evaluated related to consistency, because, despite their best efforts, people’s feelings and preferences remain inconsistent and intransitive (Saaty, 1977). Although the AHP approach permits some inconsistency, Saaty accept the judgments w if the consistency ratio (CR) is less than 10%, where:
CICR
RI (1)
max
1
nCI
n
(2)
Where n is the order of the considered matrix, and RI (random index) given by Saaty (2000) (Table 3). n 1 2 3 4 5 6 7 8 9 10 11 12 13 14 15 RI 0 0 0,52 0,89 1,11 1,25 1,35 1,40 1,45 1,49 1,51 1,54 1,56 1,57 1,58
Table 3. Random index (Saaty, 2000)
www.intechopen.com

Selection of Additive Manufacturing Technologies Using Decision Methods
33
After evaluating the criteria matrix, the alternatives must be analysed, through the use of matrixes and calculations of the principal eigenvector, which, in turn, is a Column Matrix. For each criterion, a matrix similar to Fig. 1 must be built, but comparing all the alternatives, following the same weight considerations presented in Table 2. Consequently, n+1 matrices should be created, where n is the number of criteria – one criteria matrix and one matrix of the alternatives for each criterion. So, n eigenvectors are obtained from n alternative matrices (Column Matrix), which are combined into a new nxn matrix. This last matrix is then multiplied by the eigenvector of the criteria matrix. The final ranking of the alternatives results from this multiplication. b) Application Using the initial data of the attributes of RP processes presented in Table 1 and the relative
importance of criteria in Scenario 1 and Scenario 2 described above, a decision maker is able
to execute a process selection using AHP. The first step is to convert the qualitative and
quantitative inputs from Table 1 into the fundamental scale of Saaty. Second, the criteria
data (weights) must be also converted in the AHP matrix-format to calculate the local
eigenvector.
In order to convert the qualitative analysis of cost (C) and build time (B) into numerical values, the results of the machines were compared pairwise to each other in a criteria matrix, and the eigenvector calculated to define local priorities. For this, initially, the 9 linguistic terms – very very low, very low, ..medium… very high, very very high – from Byun and Lee (2005) were converted into the numbers 1 through 9. So, a matrix of combinations could be built as the Table 4. Then, for each criteria (C and B), a matrix was built comparing the attributes of each one of the six processes to each other to convert into numbers. The linguistic relations obtained were then compared to Table 4 to extract the respective numerical weight. The matrix created for the cost criterion (C) is presented as example (Table 3). This procedure intends to be closer to the original AHP approach due the pairwise comparison, instead of converting the linguistic terms directly into a scale to normalize them.
1 2 3 4 5 6 7 8 9
Very very Slow
Very low
LowSlightly
low Medium
Slightlyhigh
Highvery high
very very high
1 Very very slow 1 2 3 4 5 6 7 8 9 2 very low ½ 1 1 1/2 2 2 ½ 3 3 1/2 4 4 1/2 3 low 1/3 2/3 1 1 1/3 1 2/3 2 2 1/3 2 2/3 3 4 slightly low ¼ 1/2 3/4 1 1 ¼ 1 1/2 1 3/4 2 2 1/4 5 Medium 1/5 2/5 3/5 4/5 1 1 1/5 1 2/5 1 3/5 1 4/5 6 slightly high 1/6 1/3 1/2 2/3 5/6 1 1 1/6 1 1/3 1 1/2 7 high 1/7 2/7 3/7 4/7 5/7 6/7 1 1 1/7 1 2/7 8 very high 1/8 1/4 3/8 1/2 5/8 3/4 7/8 1 1 1/8 9 very very high 1/9 2/9 1/3 4/9 5/9 2/3 7/9 8/9 1
Table 4. Pairwise relation between the linguistic terms
The eigenvector obtained from the cost (C) and build time (B) matrixes were employed to build the respective columns to the converted attributes matrix. The numerical values of
www.intechopen.com

Rapid Prototyping Technology – Principles and Functional Requirements
34
accuracy (A) and surface roughness (R) were inverted before they were normalized because they are not beneficial values, i. e., lower values are desirable. The values of tensile strength (S) and elongation (E), where higher values are desirable, are simply normalized. Finally, the attributes matrix is built (Table 6).
Process1 Process2 Process3 Process4 Process5 Process6 Eigenvector
Process1 1,0000 1,0000 0,8750 0,7500 1,0000 0,1250 0,0742 Process2 1,0000 1,0000 0,8750 0,7500 1,0000 0,1250 0,0742 Process3 1,1429 1,1429 1,0000 0,8571 1,1429 0,1429 0,0848 Process4 1,3333 1,3333 1,1667 1,0000 1,3333 0,1667 0,0989 Process5 1,0000 1,0000 0,8750 0,7500 1,0000 0,1250 0,0742 Process6 8,0000 8,0000 7,0000 6,0000 8,0000 1,0000 0,5936
max = 6,0000; CI= 0,0000; CR=0,0000
Table 5. Cost criterion matrix
A R S E C B
Process1 0,2053 0,2257 0,3333 0,1235 0,0742 0,1311 Process2 0,1642 0,1174 0,2051 0,2099 0,0742 0,1311 Process3 0,1971 0,0699 0,1538 0,2469 0,0848 0,0820 Process4 0,1331 0,0733 0,1282 0,2469 0,0989 0,1639 Process5 0,2593 0,4191 0,1538 0,1481 0,0742 0,1639 Process6 0,0411 0,0946 0,0256 0,0247 0,5936 0,3279
Table 6. Attributes matrix to AHP approach
After evaluating the attributes matrix, the information about criteria (Scenario 1 and Scenario 2) and their weights have to be converted into AHP form. It is therefore necessary, for each scenario, to produce the criteria matrix and to calculate the eigenvector. As an example, a decision maker would define the weights and calculate the eigenvector as presented in Table 7. One should note that the judgments applied to scenario 2 matrix are not consistent, however, the inconsistency is at a low level (CR<0,1) and therefore the matrix may be used. One should notice that the process capabilities were intentionally not reproduced here. The processes evaluation itself is a hard work, due to constant new development of materials and machines. Best results of process selection are obtained with up-to-date process analysis.
2.1.2 Multiplicative AHP (MAHP) a) Method The Multiplicative Analytic Hierarchy Process (MAHP) was developed by Prof. Freeek Lootsma in 1990, and is based on AHP, but uses another scale as well as another algorithm to define the priorities (Eguti et al.,2007). In practice, MAHP has the characteristic to moderate the valuation of “extreme” versus “balanced” alternatives and is less susceptible to rank reversal when adding or removing alternatives (Stam and Silva, 2003). The MAHP process has the same hierarchy as the AHP. In order to define the relative
weight between attributes and criteria, the MAHP uses another scale, as represented in
www.intechopen.com

Selection of Additive Manufacturing Technologies Using Decision Methods
35
Table 9. As done to AHP, the MAHP requires one matrix for the alternative attributes and n
matrixes for the n criteria.
Scenario 1 – cost of the part (C) and build
time (B) considered more important Scenario 2 – accuracy (A) and surface
roughness (R) considered more important
A R S E C B eigenvect
or
A 1 1 3 3 1/
5 1/5
0,1113
R 1 1 3 3 1/
5 1/5
0,1113
S 1/3
1/3
1 1 1/3
1/3
0,0634
E 1/3
1/3
1 1 1/3
1/3
0,0634
C 5 5 3 3 1 1 0,3253
B 5 5 3 3 1 1 0,3253
max = 6,589; CI= 0,118; CR=0,09
A R S E C B eigenvect
or
A 1 1 3 3 5 5 0,3253
R 1 1 3 3 5 5 0,3253
S 1/3
1/3 1 1 3 3
0,1113
E 1/3
1/3 1 1 3 3
0,1113
C 1/5
1/5
1/3
1/3 1 1
0,0634
B 1/5
1/5
1/3
1/3 1 1
0,0634
max = 6,589; CI= 0,118; CR=0,09
Table 7. Criteria matrix to AHP approach (adapted from [Byun and Lee, 2005])
The multiplication of the attributes matrix (Table 6) by the eigenvector of each scenario
(Table 7) results in the final ranking.
scenario 1 scenario 2
Process Priority %
Process6 0,3181 31,81%
Process5 0,1721 17,21%
Process1 0,1437 14,37%
Process4 0,1322 13,22%
Process2 0,1244 12,44%
Process3 0,1094 10,94%
Process Priority %
Process5 0,2694 26,94%
Process1 0,2041 20,41%
Process2 0,1508 15,08%
Process3 0,1420 14,20%
Process4 0,1256 12,56%
Process6 0,1082 10,82%
Table 8. AHP final ranking
The evaluation of the matrixes is done as explained by Eguti et al.(2007). For each matrix, the
weights are transformed into new values, calculated by (4), where δij is an integer-valued
index designating the decision maker’s judgments (Table 9), and γ is a scale parameter. A
plausible value for the scale parameter is given by ln 2, which implies on a geometric scale
with progression factor 2 (Lootsma, 1996).
ijija e (4)
www.intechopen.com

Rapid Prototyping Technology – Principles and Functional Requirements
36
Judgements MAHP (δij) AHP (wi/wj)
Very strong preference for wj versus wi -8 1/9 Strong preference for wj versus wi -6 1/7
Definite preference for wj versus wi -4 1/5 Weak preference for wj versus wi -2 1/3
Indifference preference for wi versus wj 0 1 Weak preference for wi versus wj +2 3
Definite preference for wi versus wj +4 5 Strong preference for wi versus wj +6 7
Very strong preference for wi versus wj +8 9
Table 9. Comparison between relative weight scales from AHP to MAHP
1
1 n
i ijj
c an
i = 1, 2,... n (5)
Following, the weights of criteria and attributes matrixes must be calculated. These values are the arithmetical mean, as shown by the equations (5) and (6), respectively.
1
1 m
ik ijj
A am
i = 1, 2,... m; k = 1, 2,... n (6)
1
jcn
i ijj
P A
i = 1, 2,... m (7)
Where m is the number of alternatives and n the number of criteria. The last step of the MAHP is to obtain the decision vector, using (7). b) Application In order to apply the MAHP, the matrixes used for AHP were directly converted using the scale conversion in Table 9 and following the calculations described before. The converted matrixes as well as their respective priority vectors are presented in Table 10.
scenario 1 scenario 2
A R S E C B priority
A 0 0 2 2 -4 -4 0,0914
R 0 0 2 2 -4 -4 0,0914
S -2 -2 0 0 -2 -2 0,0521
E -2 -2 0 0 -2 -2 0,0521
C 4 4 2 2 0 0 0,3566
B 4 4 2 2 0 0 0,3566
A R S E C B priority
A 0 0 2 2 4 4 0,3824
R 0 0 2 2 4 4 0,3824
S -2 -2 0 0 2 2 0,0943
E -2 -2 0 0 2 2 0,0943
C -4 -4 -2 -2 0 0 0,0233
B -4 -4 -2 -2 0 0 0,0233
Table 10. Input matrices for MAHP (Converted from AHP notation)
The calculations of the attributes matrix were carried out as for the AHP. The quantitative attributes had their values inverted (only A and R) and normalized. Relating both
www.intechopen.com

Selection of Additive Manufacturing Technologies Using Decision Methods
37
qualitative attributes, one matrix was built to each criterion, in which each alternative was compared to each other, as done for AHP. The conversion from linguistic terms to numerical values was done with a table similar to Table 4, with the respective MAHP values instead of the AHP scale. Following, these matrixes were submitted to the MAHP process to evaluate the local priorities. As a result, the matrix presented here was obtained as the attribute matrix for the MAHP approach.
A R S E C B
Process1 0,20526 0,22568 0,33333 0,12346 0,00698 0,06985
Process2 0,16421 0,11735 0,20513 0,20988 0,00698 0,06985
Process3 0,19705 0,06985 0,15385 0,24691 0,01405 0,00855
Process4 0,13314 0,07335 0,12821 0,24691 0,02829 0,14066
Process5 0,25928 0,41912 0,15385 0,14815 0,00698 0,14066
Process6 0,04105 0,09464 0,02564 0,02469 0,93674 0,57042
Table 11. Attribute’s matrix of MAHP
The final evaluation of the MAHP is obtained by multiplying the attribute’s matrix by the priority vector of each scenario (Table 10). The results obtained with MAHP for the input data from both previous works are presented and compared in the Table 12.
scenario 1 scenario 2
Process Priority %
Process6 0,5525 55,2%
Process5 0,1303 13,0%
Process4 0,0986 9,9%
Process1 0,0905 9,1%
Process2 0,0747 7,5%
Process3 0,0533 5,3%
Process Priority %
Process5 0,2914 29,1%
Process1 0,2097 21,0%
Process2 0,1486 14,9%
Process3 0,1404 14,0%
Process4 0,1183 11,8%
Process6 0,0917 9,2%
Table 12. MAHP final ranking
2.1.3 VDI guidelines
The Association of German Engineers (VDI – Verein Deutscher Engenieure) edits regularly guidelines to support engineers to their habitual activities. These guidelines oft support or even become standards. Two VDI guidelines are here considered: The VDI 3404 (2007) and the VDI 2225 (1998). The VDI 3404 presents, besides definitions regarding layer-manufacturing processes, a simplified method to select processes. It presents generically prototypes criteria and compares them with most significant characteristics of several RP process can offer. The proposed process selection defines some general characteristics of different kind of parts (from visual analysis prototypes up to final products) as well as process properties. However, these definitions are freezed in time. One should consider new process developments offered by additive manufacturing systems suppliers and its own parts requirements.
www.intechopen.com

Rapid Prototyping Technology – Principles and Functional Requirements
38
A pragmatic view of a RP system selection is the assumption that it is a selection procedure inside of the product development process. Pahl et. al. (2006) presented approaches to evaluate decisions during the product development process. Since Rapid Prototyping system selection is a typical application of product development, the guidelines proposed by VDI 2225 are evaluated here. a) Method A selection procedure presented by Pahl et. al. (2006) is based on the VDI 2225 (1998), a guideline instruction edited by the Association of German Engineers (VDI). This guideline proposes a simple approach, based on a five-points scale to score the alternatives. The scale and the evaluation table are presented in Table 13Error! Reference source not found.
Score scale Technical feature Alternative A Alternative t Ideal
Description Score Criterion 1 Wa1 Wt1 4
Very good 4 Criterion 2 Wa2 Wt2 4
Good 3 … … … ..
Satisfactory 2 Criterion n Wan Wtn 4
Acceptable 1 Sum Wa Wt 4.n
Unsatisfactory 0 Technical value x Wa/4.n Wt/4.n 1
Economical value y Hi/Ha Hi/Ht 1
Table 13. Scale and evaluation table of VDI 2225
Where Wti are the scores of the i criterion given to the t alternative following the scale, n the total number of criteria, Hi the ideal manufacturing cost and the Ht the manufacturing cost of the alternative t. Hi can be estimated by Hi=0,7.Hzul, where Hzul is the permissible manufacturing cost, which is to be determined considering, for example, the lowest price of concurrent products and the revenue margin of the alternative. Some instructions can be found in the literature to predict the cost of each alternative. VDI 2225 (1998) also considers that the criteria may have different weights. In this case, the technical value should be calculated by (8). Although, VDI do not specify or recommend the scale to weight the alternatives.
.
4.i ti
i
g wx
g (8)
Where gi is the weight of the criterion i. It is to observe that the computation of costs is done separately by this approach. It is expressed in terms of the economical value y. Further, the VDI 2225 proposes a graphic approach to evaluate the alternative, plotting the technical value x versus the economical value y, defining a point s, in the s-diagram (graph x versus y). VDI suggested that the best solutions have a balanced relationship between cost and technical skills, thus, being nearly the diagonal (traced) line of the s-diagram (Fig. 3). The s-diagram is also useful to accomplish the evolution of a product. The values s1, s2 and s3 could represent respectively the first, second and third edition of a product. Pahl et. al. (2006) recommends the hyperbole-technique to evaluate the total weight of each alternative, W, by (9).
www.intechopen.com

Selection of Additive Manufacturing Technologies Using Decision Methods
39
s1s2
s3
si
0
0,2
0,4
0,6
0,8
1
0 0,2 0,4 0,6 0,8 1
Technical Value
Eco
no
mic
al V
alu
e
Fig. 3. S-diagram example (VDI 2225, 1998)
.W x y (9)
b) Application In order to apply the guidelines from VDI 2225, the alternative matrix and criteria matrix have to be converted into the VDI scale and form (Table 13). The conversion table of alternatives to VDI notation is present in Table 14.
A R S E B
Process1 4 3 4 2 2 Process2 4 2 2 3 2 Process3 4 0 2 4 0 Process4 3 0 1 4 2 Process5 4 4 2 2 2 Process6 0 1 0 0 4
Table 14. Alternatives matrix following VDI scale
It is to note that attribute Costs (C) were intentionally removed from the Table 14, because VDI proposes a separate economical analysis. The numerical values of the alternatives attributes were mated to the VDI scale, matching the extremity of measured values and of the scale and uniformly distributing the intermediate values. For the attributes A, R and B, the highest values were matched to zero and the lowest to four, because they are unwanted attributes (the higher the value, the less desirable). The calculation of the attributes S and E were made matching the highest values to four, because higher values are desired. After evaluating the attributes of the alternatives, the following step is to convert the criteria matrixes (the 2 scenarios) to extract the weights used in the VDI guideline. Because the matrixes presented by the previous works are not consistent, it is impossible to extract the exact weight relations among the criteria. Although, in order to compare the different approaches, the following matrices are assumed to be likely representative to the both scenarios (Table 15). One should note that the attribute cost (C) was here also removed.
www.intechopen.com

Rapid Prototyping Technology – Principles and Functional Requirements
40
Scenario 1 Scenario 2
A 2 6
R 2 6
S 1 3
E 1 3
B 6 1
Table 15. Scenario matrixes into VDI form
The data presented above is enough to perform the calculation of the technical value. The next step consists of calculating the economical value. Once again, some approximations have to be done to allow this estimation, because neither the real cost relation nor the acceptable value is presented. Since the VDI guideline recommends the economical value to be the relation between the acceptable and the alternative costs, it was considered that the normalized values from the references to be used to represent this relation. VDI also recommends that the acceptable cost should be, if possible, estimated comparing similar products on the market, thus, it was assumed here as the acceptable cost (Hzul) being the lowest cost (value) among the normalized alternatives values.
Sce
na
rio
2
Pro
cess
1
Pro
cess
2
Pro
cess
3
Pro
cess
4
Pro
cess
5
Pro
cess
6
Ide
al
So
luti
on
Cri
teri
a
we
igh
t (g
i)
Sco
re (
wi)
gi.
wi
wi
gi.
wi
wi
gi.
wi
wi
gi.
wi
wi
gi.
wi
wi
gi.
wi
wi
gi.
wi
A 6 4 24 4 24 4 24 3 18 4 24 0 0 4 24
R 6 3 18 2 12 0 0 0 0 4 24 1 6 4 24
S 3 4 12 2 6 2 6 1 3 2 6 0 0 4 12
E 3 2 6 3 9 4 12 4 12 2 6 0 0 4 12
B 1 2 2 2 2 0 0 2 2 2 2 4 4 4 4
Technical value
0,82 0,70 0,55 0,46 0,82 0,13 1
Normalized Cost
1,00 1,00 0,89 0,79 1,00 0,06
Economical value
0,04 0,04 0,05 0,05 0,04 0,70
Table 16. VDI 2225 evaluation table for Scenario 2
Table 16 presents the results of scenario 2 following the VDI notation. The Fig. 4 represents the evaluation of the W (as (9)) for both scenarios. One should note that due to the separate cost evaluation proposed by VDI, the relative weight of cost compared to the others attributes can not be done. Although, it is to note that the cost has the same weight than all
www.intechopen.com

Selection of Additive Manufacturing Technologies Using Decision Methods
41
other attributes together, which makes the relative weight of the attributes cost always very high. This can be observed in the Fig. 4, scenario 2, where the accuracy and surface roughness are to be more important, and the process with a lower cost was also the first option. One should notice that due to the separate cost evaluation proposed by VDI, the relative weight of cost compared to the others attributes can not be done. Although, it is also important that the cost has the same weight than all other attributes together, which makes the relative weight of the attributes cost always very high. This can be observed in the Fig. 4, scenario 2, where the accuracy and surface roughness are to be more important, and the process with a lower cost was also the first option.
Scenario 1
P1 P2
P3
si
P4
P5
P6
0
0,1
0,2
0,3
0,4
0,5
0,6
0,7
0,8
0,9
1
0 0,1 0,2 0,3 0,4 0,5 0,6 0,7 0,8 0,9 1
Technical Value
Eco
no
mic
al V
alu
e
Scenario 2
P1P2
P3
si
P4
P5
P6
0
0,1
0,2
0,3
0,4
0,5
0,6
0,7
0,8
0,9
1
0 0,1 0,2 0,3 0,4 0,5 0,6 0,7 0,8 0,9 1
Technical Value
Eco
no
mic
al V
alu
e
Fig. 4. VDI 2225 graphic results for Scenario 1 and Scenario 2
3. Part II: Rapid manufacturing application
The main advantages of additive manufacturing technologies (AMT) are related to the ability to build geometrically complex shapes without tooling and with high process automation. These characteristics are very useful when producing prototypes, but they can be even more advantageous for final products, if AMT can be integrated into product development. It is because final products may allow the designers and engineers to improve part functionality using more complex shapes. Prototypes have usually a defined form, which may not be modified. However, some conditions are necessary in order to use AMT for final parts. These conditions are related to lot sizes, shape complexity and costs – AMT are still expensive manufacturing processes. At small lot sizes, such as with customized products, traditional manufacturing technologies become expensive due to high costs of required tooling. Small lot sizes and complex shaped parts are typical features encountered in the aircraft industry. This chapter presents a decision support method based on processes technological information concerning Rapid Manufacturing of plastic parts for aircraft cabin interiors. Nowadays, two RP Technologies are able to process plastic materials, which comply flammability requirements: Fused Deposition Modeling (FDM) and Selective Laser Sintering (SLS). A method is presented to consider the possible advantages and restrictions when considering the manufacturing process. Further, a procedure to evaluate quality, production
www.intechopen.com

Rapid Prototyping Technology – Principles and Functional Requirements
42
time and cost is presented. The method is illustrated with examples on the selection of manufacturing technology to produce a customized decoration part and an air duct. Typical costs and manufacturing time of injection moulding processes were also compared and analyzed with the proposed method. It is possible to define the break-even point, when conventional processes become preferred then AMT. Fig. 5 illustrates the general process selection presented in this work.
Fig. 5. Material restriction when considering RT in the aircraft industry
Fig. 5 presents also the parallel comparison with a conventional process chain. Since all parts
are so far designed to be produced by processes other then AMT (called here conventional
processes), there is always an alternative process chain. It has, in turn, been optimized over
years, and the costs, quality and delivery time quite known by manufacturing engineers. It
is not the aim of this work to select the conventional alternative, but, typical delivery time
and costs related to the both examples will be presented later in this chapter.
The proposed procedure to evaluate AMT is divided into two phases: 1) analysis of requirements; and 2) classification and prioritization, as explained in the next sections.
3.1 Analysis of requirements
Analysis of requirements aims to eliminate processes – or process chains – which do not provide adequate properties. It begins with the material analysis. Grimm (2004) argues that material selection may lead to a manageable quantity of process to analyze. Thus, it should be performed first. The Association of German Engineers (VDI), in the outline of guideline VDI 3404 (2007), presents generically parts requirements (Table 17). Decision makers should use it as check list when summarizing their parts requirement. The quality of a part is also related to how its function is performed. Thus, AMT must assure these requirements. Each specific
www.intechopen.com

Selection of Additive Manufacturing Technologies Using Decision Methods
43
requirement should be analyzed based on process information (process attributes) found in literature, but even more important, based on up-to-date analyses. They could be obtained directly at manufacturers and resellers, but they are usually not specific enough. The tensile strength is an example, where the manufacturer information does not specify the material resistance among different building directions. Alternatively, attributes or rule databases (Masood and Soo, 2002; Katschka, 1999) could be used, but with restrictions. Furthermore, a large amount of work would be needed to maintain such databases up to date. The process attributes used in this work were available in the literature (Borille, 2009).
Requirements Relevant quality characteristics
Constructive requirements
Size, scale, weight, density, textures, colors / transparency, odor
Geometrical requirements
Component size and complexity, length and angle dimensions, dimensional tolerances, form and position deviations, shrinkage, minimal structures,
walls, layer thicknesses Processing
requirements Machinability, formability, joinability, Surface finishing (painting, coating,
polishing)
Strength requirements
Tensile, compression, bending and torsion strength, static and dynamic creep rupture strength, impact strength, hardness, friction coefficient,
abrasion Thermal
requirements Use temperature ranges, resistance to heat, softening temperature, specific
heat, thermal conductivity, thermal expansion coefficient Electrical
requirements Dielectric strength, surface and spec. Contact resistance, dielectric property
values, tracking resistance Chemical
requirements Flammability, toxicity, resistance to aggressive media, water absorption,
biocompatibility, light stability, light transmission Economical
requirements Units/lot size, production times/delivery times, production costs, reliability,
waste and disposal costs
Table 17. Quality characteristics of part requirements (adapted from VDI3404, 2007)
In order to evaluate the requirements, the logical question associated to each one is if process and/or material meet the requirement. However, there are two further questions proposed: 1) if the requirement is not met is it possible to meet the requirement by means of design modifications? 2) Is it possible to improve the part quality or reduce cost by means of design modifications? Fig, 6 presents the sequential decision regarding the verification of a requirement. This verification aims at inducing the decision maker to think about all the possibilities regarding AMT. Freedom of form and process flexibility should be always in mind when answering these questions. The potential of implementing AMT lies on the component improvement, which can be as weight reduction, reduction of parts quantity by assembling components, reducing costs of complex shapes among others. Economical requirements, expressed by the cost, have two major functions in the proposed methods. First, in the initial procedure phase, the cost should be use as a filter to eliminate alternatives which are not at reasonable levels. The cost of each alternative will be needed later again, when creating the alternatives ranking, comparing with their quality and fabrication time. It should be interesting to create a database containing the considerations
www.intechopen.com

Rapid Prototyping Technology – Principles and Functional Requirements
44
of each requirement (Design solutions). Applied design solutions could be based on the results from previous processes.
Fig. 6. Analysis of requirements
This procedure aims to evaluate whether an AMT process is able to provide adequate
technical parts. It is a filtering procedure, but, it also aims to integrate product and process.
There is a reason why not to classify the process (create a ranking) at this phase, as proposed
in the literature (Rao and Padmanabhan, 2007; Rao, 2007). It is because the technical analysis
is done separately from cost and time. Cost and time are usually associated to – low values,
better values -, but most technical requirements can not be analyzed this way. It is difficult
to argue that a part, which present surface roughness Ra= 2 µm, is five times better than
other which has 10 µm, when the specification is 15 µm. It is correct to affirm that the both
processes are good enough regarding this requirement. Even when scale normalization is
used, the rates between requirements could still carry such inconsistencies.
Technical requirements act as filters, but they also carry information for the second phase.
All the technical considerations should be stored under – Quality – and will be used to
generate the final ranking – Classification and prioritization. Each relevant aspect observed
when considering the requirements should be aggregated within – Quality.
In doing the analysis of requirements before observing the costs, it is expected that all
improvement possibilities are checked and aggregated together. If the part improvement
reaches a high level, it can be strong enough to be contrasted to cost. One frequent
characteristic observed in industries when studying the possibilities to apply AMT, is the
Does the part/process
meet the
requirement?
Is it possible to improve the
part performance by means of
design modifications?
Is it possible to
meet the
requirement by
means of design
modifications?
Yes
NoEliminate
Candidate
Improve part
design
Analysis of requirement
X
Proceed to analysis of
next requirement
Yes
No
Store design
solution
Yes
No
www.intechopen.com

Selection of Additive Manufacturing Technologies Using Decision Methods
45
cost evaluation as first consideration. As the material costs are comparatively expensive, the
technology is rejected.
3.2 Classification and prioritization
The second phase of the process selection is the ranking generation. It is proposed to use the Analytic Hierarchy Process (AHP) in order to evaluate the three major aspects: quality, cost and time. The general hierarchy of is expresses as in Fig. 7.
Fig. 7. The proposed hierarchical structure of AMT process selection
In the following sections this procedure is applied to two case studies as application examples.
3.3 Example of application
The parts analyzed in the context of this work are presented in Fig. 8.
Part 1 – Air duct Part 2 – Decoration part
Fig. 8. Representative parts
The first part consists of an air duct. The main features are associated to the complex shape and the usual need for assemblies and fixture elements, which were integrated in the design. Part two represents a customized panel, which could include logos, as represented. Esthetical aspects and flexibility to produce different forms at low lot sizes represent great importance to consider the manufacturing process. Air duct is a typical example of AMT in the aircraft industry (DeGrange, 2006; Hopkinson et. al., 2006; Aerospace Engineering, 2004).
Cost Quality
Process ...
Process Selection
Time
Process X Conventional Process chain
www.intechopen.com
Rapid Prototyping Technology – Principles and Functional Requirements
46
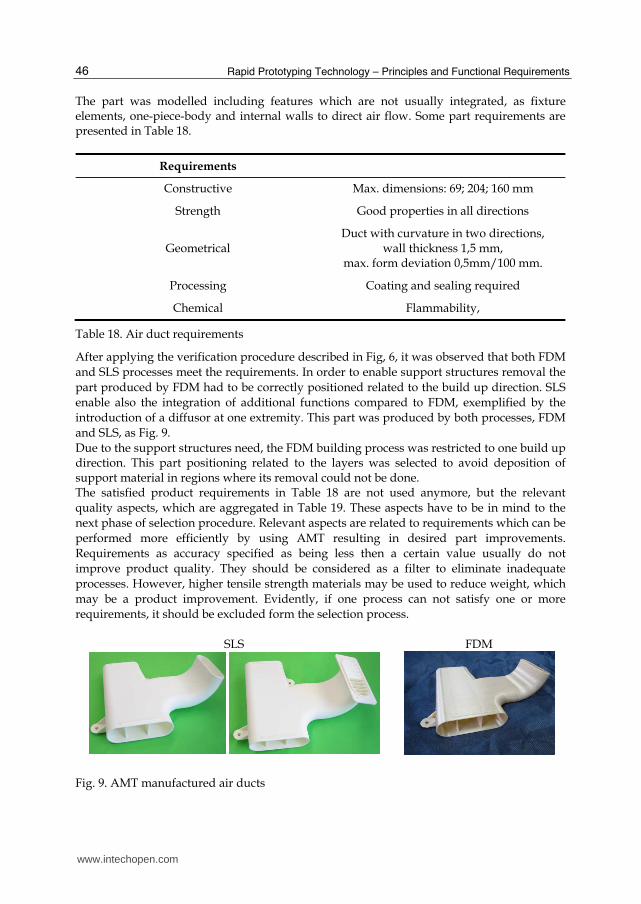
The part was modelled including features which are not usually integrated, as fixture elements, one-piece-body and internal walls to direct air flow. Some part requirements are presented in Table 18.
Requirements
Constructive Max. dimensions: 69; 204; 160 mm
Strength Good properties in all directions
Geometrical Duct with curvature in two directions,
wall thickness 1,5 mm, max. form deviation 0,5mm/100 mm.
Processing Coating and sealing required
Chemical Flammability,
Table 18. Air duct requirements
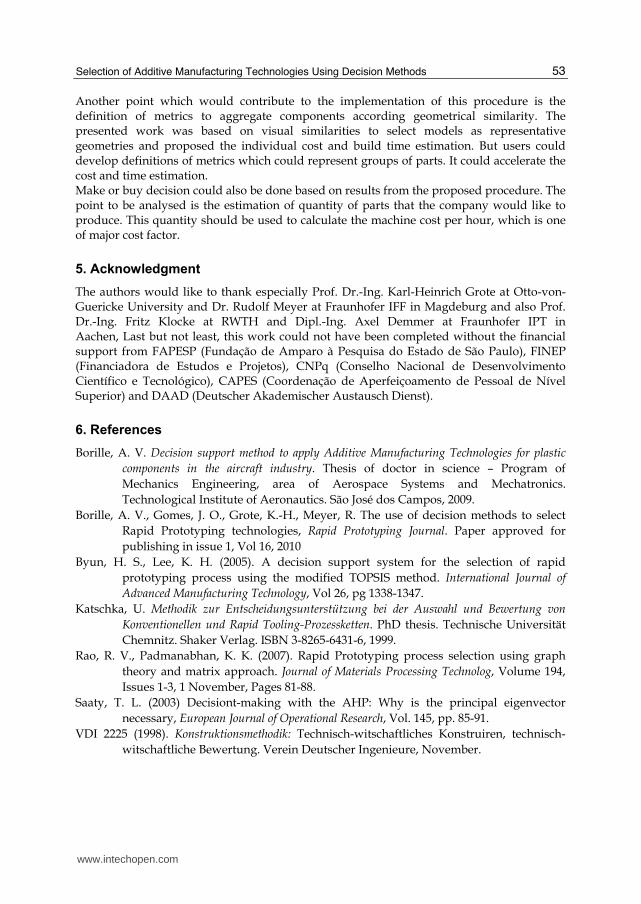
After applying the verification procedure described in Fig, 6, it was observed that both FDM and SLS processes meet the requirements. In order to enable support structures removal the part produced by FDM had to be correctly positioned related to the build up direction. SLS enable also the integration of additional functions compared to FDM, exemplified by the introduction of a diffusor at one extremity. This part was produced by both processes, FDM and SLS, as Fig. 9. Due to the support structures need, the FDM building process was restricted to one build up direction. This part positioning related to the layers was selected to avoid deposition of support material in regions where its removal could not be done. The satisfied product requirements in Table 18 are not used anymore, but the relevant quality aspects, which are aggregated in Table 19. These aspects have to be in mind to the next phase of selection procedure. Relevant aspects are related to requirements which can be performed more efficiently by using AMT resulting in desired part improvements. Requirements as accuracy specified as being less then a certain value usually do not improve product quality. They should be considered as a filter to eliminate inadequate processes. However, higher tensile strength materials may be used to reduce weight, which may be a product improvement. Evidently, if one process can not satisfy one or more requirements, it should be excluded form the selection process.
SLS FDM
Fig. 9. AMT manufactured air ducts
www.intechopen.com

Selection of Additive Manufacturing Technologies Using Decision Methods
47
Requirements SLS FDM
Constructive Better form flexibility because no support
structures are required Restrictions due to support structures
Strength Better isotropic material behavior
Geometrical Duct with curvature in two directions, wall
thickness 1,5 mm
Table 19. Aggregated process attributes for air duct part
As described, the second process selection method phase consists on creating the rank based on weightening quality, cost and time according user needs. Typical applications require low cost. Sometimes the time may be more important or even the quality. In order to exemplify, the next estimations are presented as cost preference, it means that cost is preferred instead of delivery time and quality. How much cost is preferred will be defined using requirements prioritization within AHP method. Cost preference Considering three alternatives and three requirements, four matrices should be filled with pairweise comparisons. The first one refers to comparison among the requirements to identify their priorities. Following, all the alternatives have to be compared considering each requirement. As this example has three major requirements (cost, time and quality), three additional matrices are required. The decision team should fill these matrices with judgments according the fundamental scale of Saaty (Saaty, 2000), presented in Table 2. As quantitative requirements are presented (cost and delivery time), it is possible to fill the matrices with their rates instead of Saaty’s fundamental scale. In this case, one should take care to notice whether the desired values are the higher or the lower ones. The priority related to each matrix is represented by its eigenvector, thus, they have to be calculated to all matrices. A matrix is built assembling the resulting eigenvectors from the alternatives comparison matrices. This resulting matrix, in turn, is then multiplied by the eigenvector resulting from the requirements comparison table. This example considers the costs as being stronger than other requirements. As possible judgments, it was considered that cost is strongly preferred than quality and time delivery, and quality slightly then time. These judgments have to be translated into a matrix, represented in Table 20.
Cost Quality Time Eigenvector
Quality 1/7 1 2 0,1392 Cost 1 7 7 0,7732 Time 1/7 1/2 1 0,0877
max= 3,0536; CI= 0,0268; CR= 0,0516
Table 20. Requirements comparison matrix
The eigenvector presented in Table 20 represents a numerical ranking of the requirements. It translates the decision team preferences into numerical values. The ordering also reflects intensity as indicated by the ratios of the numerical values. It is worth noticing that the AHP allows certain inconsistencies, which are represented by the CR. CR values less than 10% (0,1) are considered acceptable (Saaty, 1977). If CR is greater than 10%, the judgments have
www.intechopen.com

Rapid Prototyping Technology – Principles and Functional Requirements
48
to be revised. In this example, the inconsistency relies on the fact that cost has the same importance rate to quality and time, however quality is judged more important then time. The next step consists on compare the alternatives considering each requirement. At this point, quality is represented by extra functionality which may be performed using AMT, according Table 19. Time and cost were analyzed in the reference (Borille, 2009). Table 21 represents the judgments related to quality of the processes. As SLS allows the integration of additional functions, it is considered more important than FDM. FDM in turn, makes it possible the integration of fixture elements when compared to conventional processes, thus, being also more important then conventional processes.
Quality SLS FDM Conventional Eigenvector
SLS 1 3 7 0,6694
FDM 1/3 1 3 0,2426
Conventional 1/7 1/3 1 0,0879
max = 3,0070; CI= 0,0035; CR=0,0068
Table 21. Alternative matrix for requirement quality
Regarding cost and time, this example uses the values obtained from service provides. Different service providers offer different prices and delivery times. The costs are resumed in Table 22. Time is considered as being the delivery time of the first produced part. As cost is preferred, the less expensive alternatives were selected.
AMT Conventional
SLS FDM
Cost [RS$] 1.674,40 1.371,06 Variable according number of parts
Time [business days]
3 7 20
Table 22. Cost and time for purchasing the air duct part
Conventional process costs per unit are strongly dependent on quantity of produced parts. Costs estimation will be used to define the minimal batch size, which conventional process becomes preferable then AMT. This number is called Break-even-point (Zäh, 2006). Table 23 represents the team’s judgments regarding time. Table 24 exemplifies the judgments for requirement cost. As quantitative values are available, they are used instead of building another comparison matrix. The costs are normalized and their inverse values are used because lower costs are desired. In order to simulate diverse batch sizes, Table 24 was reproduced using different values of conventional process cost per unit.
Time SLS FDM Conventional Eigenvector
SLS 1 3 5 0,6370 FDM 1/3 1 3 0,2583
Conventional 1/5 1/3 1 0,1047 max = 3,0385; CI= 0,0193; CR=0,0370
Table 23. Alternative matrix for requirement time
www.intechopen.com

Selection of Additive Manufacturing Technologies Using Decision Methods
49
Cost [RS$] Preference
SLS 1.674,40 0,3919 FDM 1.371,06 0,4786
Conventional process (10 parts) 5.069,69 0,1294
Table 24. Alternative matrix for requirement cost – example for 10 parts
The final ranking results from multiplying the matrices presented in Table 25. In this case, for ten parts, SLS process would be selected with 45% of preference, although FDM is the cheapest alternative.
Quality Cost Time Requirements Ranking
SLS 0,6694 0,3919 0,6370 0,1392 0,4521
FDM 0,2426 0,4786 0,2583 0,7732 0,4265
Conventional 0,0879 0,1294 0,1047 0,0877 0,1215
Table 25. Final ranking generation (10 parts)
Process preference according quantity of parts
- air duct -
0,0000
0,1000
0,2000
0,3000
0,4000
0,5000
0,6000
1 3 5 10 15 20 25 30 35 40 45 50 55 60 65
produced units
Pre
fere
nc
e
SLS
FDM
Conventional process
Fig. 10. Simulation of process preference quantity of produced parts for part 1
Varying the quantity of produced parts, conventional injection molding process becomes preferred because the cost per part decreases significantly. Using the proposed procedure, one can estimate the break-even-point.
www.intechopen.com

Rapid Prototyping Technology – Principles and Functional Requirements
50
Fig. 10 shows that, in this case, SLS process would be preferred until batch sizes of approximately 50 parts. Larger batches should be produced using injection molding. When AMT batch size becomes larger, it should be considered that the produced parts delivery time may increase depending on the machine capacity of the service provider. The price per part, in this case, may also be reduced due to the better machine usage, specially when considering SLS (Borille, 2009). Case two: interior decoration part The same selection procedure was applied to the part two, an example of decoration part. The quality attributes are aggregated in Table 26, which presented also the manufactured parts.
Requirements SLS FDM
Geometrical Better visual surface quality,
Higher distortions Restricted to one building direction
due to stair-step effect
Strength Higher resistance and rigidity in such a planar part leads to lower
weight
Table 26. Aggregated process attributes for decoration part
The decision team faced the following situation: the customers needs consist on the quickly customization of its aircraft. As requirements, the decision team built up the following requirements matrix, Table 27
Quality Cost Time Eigenvector
Quality 1 3 1/3 0,2308
Cost 1/3 1 1/9 0,0769
Time 3 9 1 0,6923
max= 3,0000; CI= 0,0000; CR= 0,0000
Table 27. Requirements comparison matrix for decoration part
Table 28 presents the decision team judgments for quality, according considerations from Table 26. Although the better surface quality of SLS, the FDM process may produce stronger planar parts due to its higher tensile resistance. SLS and FDM are considered as the same importance. Injection molding process presents some restrictions due to draft angles to allow the mold opening, thus, it was considered less important.
www.intechopen.com

Selection of Additive Manufacturing Technologies Using Decision Methods
51
Quality SLS FDM Conventional Eigenvector
SLS 1 3 3 0,4286
FDM 1 1 3 0,4286
Conventional 1/3 1/3 1 0,1429
max = 3,0000; CI= 0,0000; CR=0,0000
Table 28. Alternative matrix for requirement quality
When purchasing the fastest alternatives from service providers, the cost values are used to judge the alternatives regarding time in Table 29 and to build the cost rates in Table 30.
Time SLS FDM Conventional Eigenvector
SLS 1 2 9 0,5969
FDM 1/2 1 7 0,3458
Conventional 1/9 1/7 1 0,0572
max = 3,0217; CI= 0,0109; CR=0,0209
Table 29. Alternative matrix for requirement time
Cost [RS$] Preference
SLS 1034,80 0,6025
FDM 1040,00 0,3284
Conventional process (5 parts) 4945,44 0,0691
Table 30. Alternative matrix for requirement cost – example for 5 parts
The final ranking results from multiplying the matrices presented in Table 31. In this case, for five parts, SLS process would be selected with 55% of preference.
Quality Cost Time Requirements Ranking
SLS 0,4286 0,6025 0,5969 0,2308 0,5585
FDM 0,4286 0,3284 0,3458 0,0769 0,3636
Conventional 0,1429 0,0691 0,0572 0,6923 0,0779
Table 31. Final ranking generation – decoration part
SLS process was selected because it had in this example the lower price and the shorter delivery time. In this example, the cost per part reduction of injection molding could not overcome the time requirement.
www.intechopen.com

Rapid Prototyping Technology – Principles and Functional Requirements
52
Fig. 11 represents the preference ranking. Injection molding would be effective only when the parts quantity become high enough to imply in higher SLS delivery time.
Process preference according quantity of parts
- decoration part -
0,0000
0,1000
0,2000
0,3000
0,4000
0,5000
0,6000
0,7000
0,8000
1 3 5 10 15 20 25 30 35 40 45 50 55 60 65
produced units
Pre
fere
nc
e
SLS
FDM
Conventional process
Fig. 11. Simulation of process preference quantity of produced parts for part 2
4. Conclusion
Rapid Manufacturing is becoming reality in several industries, among them the
aeronautical. New machine and the further material developments allow the continuous
expansion of applications. Grimm (2004) mentioned that there was at that time no machine
with focus on RM. Three years later, Arcam presented the machine called A2, which is
considered the first one focused on RM applications (Arcam, 2007). Further examples of
these trends were presented at the Euromold 2008 trade fair, in Frankfurt, Germany.
Stratasys as well as EOS presented new material options and new machines. Ultem© for
FDM equipments and PEEK for SLS are both high performance polymers and potential
candidates to be used in aircraft applications by means of AMT.
The introducing into the market of both new materials choices as well new machine
generations are important indicators of the aircraft industry market importance. However,
the method suggested in this work could be applied not only for aeronautical applications.
It could also more options to compare and choose the best alternative considering also the
new alternatives.
www.intechopen.com
Selection of Additive Manufacturing Technologies Using Decision Methods
53
Another point which would contribute to the implementation of this procedure is the definition of metrics to aggregate components according geometrical similarity. The presented work was based on visual similarities to select models as representative geometries and proposed the individual cost and build time estimation. But users could develop definitions of metrics which could represent groups of parts. It could accelerate the cost and time estimation. Make or buy decision could also be done based on results from the proposed procedure. The point to be analysed is the estimation of quantity of parts that the company would like to produce. This quantity should be used to calculate the machine cost per hour, which is one of major cost factor.
5. Acknowledgment
The authors would like to thank especially Prof. Dr.-Ing. Karl-Heinrich Grote at Otto-von-Guericke University and Dr. Rudolf Meyer at Fraunhofer IFF in Magdeburg and also Prof. Dr.-Ing. Fritz Klocke at RWTH and Dipl.-Ing. Axel Demmer at Fraunhofer IPT in Aachen, Last but not least, this work could not have been completed without the financial support from FAPESP (Fundação de Amparo à Pesquisa do Estado de São Paulo), FINEP (Financiadora de Estudos e Projetos), CNPq (Conselho Nacional de Desenvolvimento Científico e Tecnológico), CAPES (Coordenação de Aperfeiçoamento de Pessoal de Nível Superior) and DAAD (Deutscher Akademischer Austausch Dienst).
6. References
Borille, A. V. Decision support method to apply Additive Manufacturing Technologies for plastic
components in the aircraft industry. Thesis of doctor in science – Program of
Mechanics Engineering, area of Aerospace Systems and Mechatronics.
Technological Institute of Aeronautics. São José dos Campos, 2009.
Borille, A. V., Gomes, J. O., Grote, K.-H., Meyer, R. The use of decision methods to select
Rapid Prototyping technologies, Rapid Prototyping Journal. Paper approved for
publishing in issue 1, Vol 16, 2010
Byun, H. S., Lee, K. H. (2005). A decision support system for the selection of rapid
prototyping process using the modified TOPSIS method. International Journal of
Advanced Manufacturing Technology, Vol 26, pg 1338-1347.
Katschka, U. Methodik zur Entscheidungsunterstützung bei der Auswahl und Bewertung von
Konventionellen und Rapid Tooling-Prozessketten. PhD thesis. Technische Universität
Chemnitz. Shaker Verlag. ISBN 3-8265-6431-6, 1999.
Rao, R. V., Padmanabhan, K. K. (2007). Rapid Prototyping process selection using graph
theory and matrix approach. Journal of Materials Processing Technolog, Volume 194,
Issues 1-3, 1 November, Pages 81-88.
Saaty, T. L. (2003) Decisiont-making with the AHP: Why is the principal eigenvector
necessary, European Journal of Operational Research, Vol. 145, pp. 85-91.
VDI 2225 (1998). Konstruktionsmethodik: Technisch-witschaftliches Konstruiren, technisch-
witschaftliche Bewertung. Verein Deutscher Ingenieure, November.
www.intechopen.com

Rapid Prototyping Technology – Principles and Functional Requirements
54
VDI 3404 (2007). Generative Fertigungsverfahren: Rapid-Technologiens (Rapid Prototyping)
Grundlagen, Begriffe, Qualitätskenngrößen, Liefervereinbarungen. Verein
Deutscher Ingenieure, December.
Zäh, Michael F. (2006). Wirtschaftliche Fertigung mit Rapid-Technologien. Anwender-Leitfaden
zur Auswahl geeigneter Verfahren. Hanser Verlag. ISBN 3-446-22854-3
www.intechopen.com

Rapid Prototyping Technology - Principles and FunctionalRequirementsEdited by Dr. M. Hoque
ISBN 978-953-307-970-7Hard cover, 392 pagesPublisher InTechPublished online 26, September, 2011Published in print edition September, 2011
InTech EuropeUniversity Campus STeP Ri Slavka Krautzeka 83/A 51000 Rijeka, Croatia Phone: +385 (51) 770 447 Fax: +385 (51) 686 166www.intechopen.com
InTech ChinaUnit 405, Office Block, Hotel Equatorial Shanghai No.65, Yan An Road (West), Shanghai, 200040, China
Phone: +86-21-62489820 Fax: +86-21-62489821
Modern engineering often deals with customized design that requires easy, low-cost and rapid fabrication.Rapid prototyping (RP) is a popular technology that enables quick and easy fabrication of customizedforms/objects directly from computer aided design (CAD) model. The needs for quick product development,decreased time to market, and highly customized and low quantity parts are driving the demand for RPtechnology. Today, RP technology also known as solid freeform fabrication (SFF) or desktop manufacturing(DM) or layer manufacturing (LM) is regarded as an efficient tool to bring the product concept into the productrealization rapidly. Though all the RP technologies are additive they are still different from each other in theway of building layers and/or nature of building materials. This book delivers up-to-date information about RPtechnology focusing on the overview of the principles, functional requirements, design constraints etc. ofspecific technology.
How to referenceIn order to correctly reference this scholarly work, feel free to copy and paste the following:
Anderson Vicente Borille and Jefferson de Oliveira Gomes (2011). Selection of Additive ManufacturingTechnologies Using Decision Methods, Rapid Prototyping Technology - Principles and FunctionalRequirements, Dr. M. Hoque (Ed.), ISBN: 978-953-307-970-7, InTech, Available from:http://www.intechopen.com/books/rapid-prototyping-technology-principles-and-functional-requirements/selection-of-additive-manufacturing-technologies-using-decision-methods

© 2011 The Author(s). Licensee IntechOpen. This chapter is distributedunder the terms of the Creative Commons Attribution-NonCommercial-ShareAlike-3.0 License, which permits use, distribution and reproduction fornon-commercial purposes, provided the original is properly cited andderivative works building on this content are distributed under the samelicense.