Embed Size (px)
Citation preview
Selection for growth of Nile tilapia
(Oreochromis niloticus L.) in low-
input environments
Harrison Charo-Karisa
Promotoren: Prof. Dr. J.A.J. Verreth Hoogleraar Aquacultuur and visserij Wageningen Universiteit
Prof. Dr. ir. J.A.M. van Arendonk Hoogleraar Fokkerij en genetica Wageningen Universiteit
Copromotor: Dr. ir. J. Komen Universitair docent, leerstoelgroep Fokkerij en genetica Wageningen Universiteit
Promotiecommissie:
Prof. G. Hoersten Schwark (Gottingen University, Germany)
Dr. Raul Ponzoni (The World Fish Centre, Penang, Malaysia)
Prof. Dr. Ir. P. Stam (Wageningen Universiteit)
Prof. Dr. Ir. A.J. van der Zijpp (Wageningen Universiteit)
“Dit onderzoek is uitgevoerd binnen de onderzoekschool WIAS”
Selection for growth of Nile tilapia
(Oreochromis niloticus L.) in low-
input environments
Harrison Charo Karisa
Proefschrift ter verkrijging van de graad van doctor op gezag van de rector magnificus van de Wageningen Universiteit,
Prof. dr. ir. M. Kropff, in het openbaar te verdedigen op Maandag 22 Mei 2006
des namiddags te vier uur in de Aula
Charo-Karisa, H.
Selection for growth of Nile tilapia (Oreochromis niloticus L.)
in low-input environments
PhD Thesis, Wageningen University, 2006
With ref.—with summary in English, Dutch, and Kiswahili
*ISBN-10:90-6464-011-4
ISBN-13:978-90-6464-011-7
*
ISBN-90-8504-466-9

Kwa mpendwa marehemu baba, William Karisa
Kwa mpendwa mama, Hawe Charo Kadzo
“Ninayaweza mambo yote katika Yesu anitiaye nguvu…” Philippians 4:13

Contents
Chapter I General Introduction 9
ChapterII Genetic and environmental factors affecting growth of Nile 19
tilapia juveniles: modelling spatial correlations between hapas
Chapter III Heritability estimates for cold tolerance in juvenile tilapia 41
Chapter IV Effects of rearing conditions on low-temperature tolerance of 57
Nile tilapia (Oreochromis niloticus) juveniles
Chapter V Heritability estimates and response to selection for growth of 73
Nile tilapia (Oreochromis niloticus) in low-input earthen ponds
Chapter VI Phenotypic and genetic parameters for body measurements, 91
reproductive traits and gut length of Nile tilapia (Oreochromis
niloticus) selected for growth in low-input earthen ponds
Chapter VII Genotype by environment interaction in two lines of Nile 109
tilapia (Oreochromis niloticus L.) divergently selected for
growth in different pond environments
Chapter VIII General Discussion 129
Summary (English) 146
Samenvatting (Dutch) 151
Mukhtasari (Kiswahili) 156
Acknowledgments 163
Training and Supervision Plan 165
Curriculum vitae 166
Publications 167


Chapter 1
General Introduction
Chapter 1 ___________________________________________________________________________
10
1. Aquaculture and capture fisheries
While the global human population continues to increase rapidly (UN, 2005), the world’s
fishing areas have reached their maximal potential for capture fisheries production (FAO,
2004). To meet the increased demand for food fish, aquaculture production should increase
by 50 million Metric tons by 2050 (Tacon and Forster, 2001). Aquaculture is currently the
fastest growing segment of food production in the world and by 2002 was contributing
approximately 30% by weight of fish and shellfish consumed worldwide (FAO, 2004).
However, present aquaculture technology requires large amounts of fish meal and oil from
wild caught fish which leads to further depletion of natural stocks (Marra, 2005; Tacon,
2004). In Africa and the rest of the developing world, fish catches hardly meet the demand as
a resource for human food, leaving no room for aquaculture’s requirements. It is clear that the
expansion of aquaculture under the current production conditions is not sustainable.
Alternative protein sources for fish feed, and the production of herbivorous and omnivorous
fishes, such as carp and tilapia, which feed at lower trophic levels have been suggested as
solutions to aquaculture’s reliance on fish meal (El-Sayed, 1999; Kautsky et al., 1997;
Williams et al., 2000; Azim et al., 2004). However, the overall efficiency of fish reared in
fertilized ponds also needs to be improved. Studies have shown that whereas about 15-30%
of the nutrient input in pellet-fed pond systems is converted into harvestable products
(Acosta-Nassar et al., 1994; Gross et al., 2000), only 5-15% of the nutrient input in fertilizer-
only pond systems is converted to harvestable products (Schroeder et al., 1990; Edwards,
1993). To improve the overall nutrient use efficiency of fish in fertilized ponds and reduce
cost of production, efficient breeding programs are crucial. The genetic improvement of
livestock and crops has for a long time led to dramatic increase in yields. Selective breeding
in aquaculture is still at infancy compared to livestock farming. However, because higher
selection responses to growth have already been reported for several fish species (Olesen et
al., 2003), there are high prospects for successful selective breeding in aquaculture.
2. Nile tilapia in aquaculture
Tilapias are among the most important warm water fishes used for aquaculture production
and originate from Africa and the Middle East (Fryer and Iles, 1972). Among tilapiines, the
Nile tilapia, Oreochromis niloticus L. and its hybrids, is the most important cultured fish
General introduction ___________________________________________________________________________
11
species. It is becoming an increasingly important food fish in many parts of the world (Pullin,
1997). Although, principally herbivorous in nature (Moriarty, 1973; Moriarty and Moriarty,
1973), O. niloticus can feed on a wide variety of natural food organisms found in organically
fertilized ponds (Yashouv and Chervinski, 1961; Bowen, 1982) as well as on artificial feeds.
Majority of the culturing of O. niloticus is carried out in the tropics in semi-intensive small-
holder farms. Due to high cost of feeds (Liti et al., 2005) and limited protein sources, most
farmers cannot afford supplementary feeds. Therefore, whereas commercial tilapia farms
report yields of 10 000- 15 000 kg/ha/yr, small-scale tilapia fertilized earthen pond farms
report yields of approximately 500kg/ha/yr (Machena and Moehl, 2001).
2.1 Selective breeding of Nile tilapia
A number of selection experiments and breeding programs aiming at increased growth rates
in ponds have been conducted for O. niloticus (Hulata et al., 1986; Brzeski and Doyle, 1995;
Eknath et al., 1993; Bentsen et al., 1998; Bolivar and Newkirk, 2002). These selective
breeding programmes have typically been done in favourable environments where growth is
high. In these environments, fish receive high protein supplementary feeds formulated
commercially from fish meal and oil. However, in Asia and Africa, Nile tilapia is farmed
under variable small-scale production systems with a wide array of resources as pond inputs:
grasses, weeds, chicken droppings, cow dung, rice bran, and leftover food, which add to the
diversity of tilapia farming systems. In the presence of genotype by environment interaction
(GXE), a strain that has been genetically improved through selection in a favourable
environment may not be necessarily good for less favourable conditions. Large GXE
necessitates the development of strains highly adapted to specific environments, and a small
interaction permits the development of strains that will perform well in a broad spectrum of
environments. Little is known about the degree of GXE in tilapia.
3. Selection for growth in diverse environments
To produce strains that can perform satisfactorily over diverse environments, it is important to
know the conditions in which selection should be carried out. Jinks and Connolly (1973) and
Jinks and Pooni (1988) showed that sensitivity (i.e. the difference between measurements of a
genotype in two environments) is reduced by selection upwards in a bad environment and by
selection downward in a good environment, both of which are cases of antagonistic selection
Chapter 1 ___________________________________________________________________________
12
i.e. the selection changes the character in the opposite direction. Based on the Jinks-Connolly
rule, and a review of a number of selection experiments, Falconer (1990) hypothesized that to
increase the mean performance of a trait over a wide range of environments, selection should
be done in a sub-optimal environment since this is likely to reduce the environmental
sensitivity of the genotypes. However, to select effectively in sub-optimal environments,
several issues need to be addressed. Traditionally, most selective breeding takes place in high-
rather than low-yielding environments. This has been based on the assumption of higher
heritabilities for traits in high-yielding than in low-yielding conditions, because of more
efficient control of the environment and better expression of genetic differences in high-
yielding environments (van Oosterom et al., 1993). Other issues revolve around the correlated
responses to selection for growth in low-input environments and genotype by environment
interactions.
Most sub-tropical regions and highland areas in the tropics frequently go through low
temperatures which hamper tilapia growth. The study presented in this thesis was carried out
at Abbassa, east of the Nile Delta in Egypt, which experiences cold spells during winter. The
optimal temperature for growth of most tilapiine species is between 25-28 °C and feeding
stops below 20 °C (Wohlfarth and Hulata, 1983). Nile tilapia cannot survive temperatures
less than 10-12 °C for more than a few days (Chervinski, 1982). Tolerance to low
temperatures is dependent upon environmental and genetic effects, history of the fish, as well
as fish health and nutrition status (Cnaani et al., 2000). The genetic basis of cold tolerance is
poorly understood and little is known about the differences in cold tolerance within and
between tilapiine species. Wohlfarth et al. (1983) and Cnaani et al. (2000) studying some
tilapia species and their hybrids found that a large component of the trait’s variance was a
result of dominance effects. However, in Nile tilapia, Tave et al. (1989, 1990) and Behrends
et al. (1990) suggested that cold tolerance shows mainly additive genetic variance.
Knowledge of the genetic nature of cold tolerance could aid in improving the tolerance of
Nile tilapia to low temperature and extend its grow-out period.
4. Interdisciplinary collaborative research
This thesis is a part of Wageningen University’s Interdisciplinary Research and Education
Fund project entitled “Optimization of nutrient dynamics and fish for integrated agriculture-
General introduction ___________________________________________________________________________
13
aquaculture systems” (INREF-POND). The main objective of INREF-POND is to quantify
and optimize changes in nutrient dynamics in integrated agriculture-aquaculture (IAA)
farming systems after the introduction of selected fish breeds. The IAA systems are
characterized by low level of inputs, and traditional, indigenous breeds of fish, cattle, pigs,
goats, sheep, and poultry. Due to the exchange of resources between subsystems at the farm,
it is necessary to optimize the efficiency of exchange of resources and nutrients between
different components of the IAA. To achieve this, the INREF-POND project is organized
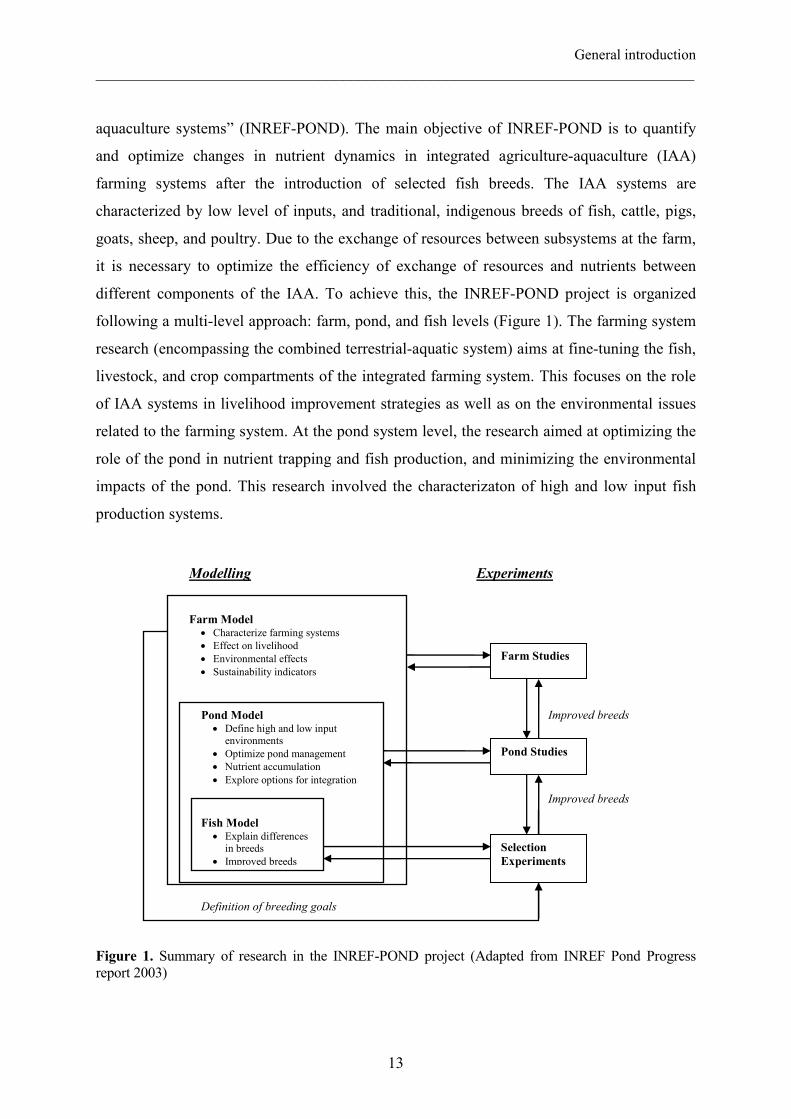
following a multi-level approach: farm, pond, and fish levels (Figure 1). The farming system
research (encompassing the combined terrestrial-aquatic system) aims at fine-tuning the fish,
livestock, and crop compartments of the integrated farming system. This focuses on the role
of IAA systems in livelihood improvement strategies as well as on the environmental issues
related to the farming system. At the pond system level, the research aimed at optimizing the
role of the pond in nutrient trapping and fish production, and minimizing the environmental
impacts of the pond. This research involved the characterizaton of high and low input fish
production systems.
Figure 1. Summary of research in the INREF-POND project (Adapted from INREF Pond Progress report 2003)
Pond Model • Define high and low input environments
• Optimize pond management • Nutrient accumulation • Explore options for integration
Fish Model • Explain differences in breeds
• Improved breeds
Definition of breeding goals
Improved breeds
Improved breeds
Selection
Experiments
Pond Studies
Farm Studies
Farm Model • Characterize farming systems • Effect on livelihood • Environmental effects • Sustainability indicators
Experiments Modelling
Chapter 1 ___________________________________________________________________________
14
The present study, which is at the fish level, aims at improving the fish for optimal performance
in their environments. It involved selective breeding for improved growth of Nile tilapia in low-
and high-input pond systems. The performance of the two resultant strains over a range of
environments was evaluated. This project was implemented collaboratively between
Wageningen University (WU), The WorldFish Center (WFC), and Can Tho University (CTU),
Vietnam. The research presented in this thesis was carried out at WFC’s Regional Centre for
Africa and West Asia, Abbassa, Egypt.
5. Aims and outline of the thesis
This thesis aims at studying the feasibility of selective breeding for the improvement of growth
of Nile tilapia in low-input extensive farming conditions, and at determining the effects of
selection on other performance traits. It further intends to support the production of improved
broodstock and fish seed for the resource poor fish farmers and thereby contribute to reduced
malnutrition and poverty alleviation.
Chapter II presents results of an experiment that was carried out to determine the optimal
conditions for early rearing of tilapia fry in hapa-in-pond systems. Chapters III and IV deal
with cold tolerance of Nile tilapia juveniles. The heritability of cold tolerance and the effect of
size on cold tolerance of juveniles are presented in Chapter III, and the effects of
environmental factors and diet on cold tolerance are presented in Chapter IV. Results of the
main selection experiment are presented in Chapters V and VI. Chapter V gives the estimates
of the heritability and response to selection for body weight and the heritability for survival till
harvest in low-input fertilized ponds. It shows the feasibility for carrying out selection in
fertilized ponds without supplementary feeds. Chapter VI presents an analysis of the
heritability of body measurements, gut length, and correlated responses to selection for growth.
In Chapter VII, the selection lines are tested across a range of potential farm environments to
investigate the presence of genotype by environment interactions. Lastly, Chapter VIII
discusses the feasibility for selection in low-input conditions, and the practical lessons learnt
from this research in view to carrying out selection for low-input and heterogeneous pond
environments.
General introduction ___________________________________________________________________________
15
References
Acosta-Nassar, M.V., Morell, J.M., Corredor, J.E., 1994. The nitrogen budget of a tropical
semi-intensive freshwater fish culture pond. J. World Aquac. Soc. 25, 261-270.
Azim, M.E., Wahab, M.A., Asaeda, T., 2004. The more periphyton substrates, the higher the
fish production in earthen ponds. World Aquaculture 35, 58-60.
Behrends, L.L., Kingsley, J.B., Bulls, M.J., 1990. Cold tolerance in maternal mouthbrooding
tilapias: phenotypic variation among species and hybrids. Aquaculture 85, 271-280.
Bentsen, H.B., Eknath, A.E., Palada de Vera, M.S., Danting, J.C., Bolivar, H.L., Reyes, R.A.,
Dionisio, E.E., Longalong, F.M., Circa, A.V., Tayamen, M.M., Gjerde, B., 1998.
Genetic improvement of farmed tilapias: Growth performances in a complete diallel
cross experiment with eight strains of Oreochromis niloticus. Aquaculture 160, 145-
173.
Bolivar, R.B., Newkirk, G.F., 2002. Response to within family selection for body weight in
Nile tilapia (Oreochromis niloticus) using a single-trait animal model. Aquaculture
204, 371-381.
Bowen, S.H., 1982. Feeding, digestion and growth - qualitative considerations. In: Pullin,
R.S.V., Lowe-McConnell, R.H. (Eds.), The Biology and Culture of Tilapias.
ICLARM Conference Proceedings 7, pp. 141-156.
Brzeski, V.J., Doyle, R.W., 1995. A test of an on-farm selection procedure for tilapia growth
in Indonesia. Aquaculture 137, 219-230.
Chervinski, J., 1982. Environmental physiology of tilapias. In: R.S.V. Pullin and R.H. Lowe-
McConell (Eds.), The Biology and Culture of Tilapias. ICLARM Conference
Proceedings 7, pp. 119-128.
Cnaani, A., Gall, G.A.E., Hulata, G., 2000. Cold tolerance of tilapia species and hybrids.
Aquac. Int. 8, 289-298.
Edwards, P., 1993. Environmental issues in integrated agriculture–aquaculture and
wastewater fed fish culture systems. In: Pullin, R.S.V., Rosenthal, H., Maclean, J.L.
(Eds.), Environment and Aquaculture in Developing Countries. ICLARM Conf. Proc.,
vol. 31, pp. 139-170.
Eknath, A.E., Tayamen, M.M., Palada-de Vera, M.S., Danting, J.C., Reyes, R.A., Dionisio,
E.E., Capili, J.B., Bolivar, H.L., Abella, T.A., Circa, A.V., Bentsen, H.B., Gjerde, B.,
Chapter 1 ___________________________________________________________________________
16
Gjedrem, T., Pullin, R.S.V., 1993. Genetic improvement of farmed tilapias: growth
performance of eight strains of Oreochromis niloticus tested in different farm
environments. Aquaculture 111, 171-188.
El-Sayed, A.M., 1999. Alternative dietary protein sources for farmed tilapia, Oreochromis
spp. Aquaculture 179, 149-168.
Falconer, D.S., 1990. Selection in different environments: effects on environmental
sensitivity (reaction norm) and on mean performance. Genet. Res. Camb. 56, 57-70.
FAO, 2004. The State of World fisheries and Aquaculture (SOFIA). FAO Corporate
Document Repository. www.fao.org
Fryer, G., Iles, T.D., 1972. The Cichlid Fishes of the Great Lakes of Africa, their Biology and
Distribution, Oliver and Boyd; Edinburgh, Scotland, 641pp.
Gross, A., Boyd, C.E., Wood, C.W., 2000. Nitrogen transformations and balance in channel
catfish ponds. Aquacult. Eng. 24, 1-14.
Hulata, G., Wohlfarth, G.W., Halevy, A., 1986. Mass selection for growth rate in the Nile
tilapia (Oreochromis niloticus). Aquaculture 57, 177-184.
Jinks, J.L., Connolly, V., 1973. Selection for specific and general response to environmental
differences. Heredity 30, 33-40.
Jinks, J.L., Pooni, H.S., 1988. The genetic basis of environmental sensitivity. In: Weir, B.S.,
Eisen, E.J., Goodman, M.M., Namkoong, G. (Eds.). Proceedings of the Second
International Conference on Quantitative Genetics, pp 505-522. Sinauer, Sunderland,
Mass., USA.
Kautsky, N., Berg, H., Folke, C., Larrsson, J., Troell, M., 1997. Ecological footprint for
assessment of resource use and development limitations in shrimp and tilapia
aquaculture. Aquac. Res. 28, 735-766.
Liti, D., Cherop, L., Munguti, J., Chhorn, L., 2005. Growth and economic performance of
Nile tilapia (Oreochromis niloticus L.) fed on two formulated diets and two locally
available feeds in fertilized ponds. Aquac, Res. 36, 746-752.
Machena, C; Moehl, J., 2001. African aquaculture: A regional summary with emphasis on
Sub-Saharan Africa. In: Aquaculture in the Third Millennium. NACA, Bangkok,
Thailand, pp. 341-355.
Marra, J., 2005. When will we tame the oceans? Nature 436, 175-176.
General introduction ___________________________________________________________________________
17
Moriarty, D.J.W., 1973. The physiology of digestion of blue-green algae in the cichlid fish,
Tilapia nilotica. J. Zool. (Lond.) 171, 25-39.
Moriarty, D.J.W., Moriarty, C.M., 1973. The assimilation of carbon from phytoplankton by
two herbivorous fishes, Tilapia nilotica and Haplochromis nigripinnus. J. Zool.
(Lond.) 171, 41-55.
Naylor, R.L., Goldburg, R. J., Primavera, J.H., Kautsky, N., Beveridge, M.C.M., Jason, C.,
Folke, C., Lubchenco, J., Mooney, H., Troell, M., 2000. Effect of aquaculture on
world fish supplies. Nature 405, 1017-1024.
Olesen, I., Gjedrem, T., Bentsen, H. B., Gjerde, B., Rye, M., 2003. Breeding programs for
sustainable aquaculture. J. Appl. Aquac. 13, 179-204.
Pullin, R.S.V., 1997. World tilapia culture and its future prospects. In: Pullin, R.S.V., Lazard,
J., Legendre, M., Amon Kothias, J.B., Pauly, D. (Eds.), The Third International
Symposium on Tilapia in Aquaculture, ICLARM Conference Proceedings 41, pp. 1–
16.
Schroeder, G.L., Wohlfarth, G., Alkon, A., Halvey, A., Krueger, H., 1990. The dominance of
algal-based food webs in fish ponds receiving chemical fertilizers plus organic
manures. Aquaculture 86, 219-229.
Tacon, A.G.J., 2004. Use of fish meal and fish oil in aquaculture: a global perspective.
Aquatic Resources, Culture and Development 1, 3-14
Tacon, A.G.J., Forster, I.P., 2001. Global Trends and Challenges to Aquaculture and
Aquafeed Development in the New Millenium. International Aqua Feed Directory and
Buyers Guide. Turret RAI PLC, Uxbridge, pp 4-24.
Tave, D., Jayaprakas, V., Smitherman, O., 1990. Effects on intraspecific hybridization in
Tilapia nilotica on survival under ambient winter temperature in Alabama. World
Aquac. 21, 201-204.
Tave, D., Smitherman, R.O., Jayaprakas, V., 1989. Estimates of additive genetic effects,
maternal effects, specific combining ability, maternal heterosis, and egg cytoplasm
effects for cold tolerance in Oreochromis niloticus (L.). Aqua. Fish. Manage. 20, 159-
166.
Troell, M., Halling C., Neori, A., Chopin, T., Buschmann, A.H., Kautsky, N., Yarish, C.,
2003. Integrated mariculture: asking the right questions. Aquaculture 226, 69-90.
Chapter 1 ___________________________________________________________________________
18
United Nations, 2005. World population prospects: the 2004 revision. Population Newsletter
79, 1-5.
van Oosterom, T.J., Kleijn, D., Ceccarelli, S., Nachit, M.M., 1993. Genotype x Environment
Interactions of barley in the Mediterranean region. Crop Science 33, 669-674.
Von Bubnoff, A., 2005. Africa urged to create more fish farms. Nature 436, 1077.
Williams, M. J. J., Bell, D., Gupta, M.V., Dey, M., Ahmed, M., Prein, M., Child, S.,
Gardiner, P. R., Brummett, R., Jamu, D., 2000. Responsible aquaculture can aid food
problems. Nature 406, 673.
Wohlfarth, G. W., Hulata, G., Rothbard, S., Itzkowich, J., Halevy, A., 1983. Comparison
between interspecific tilapia hybrids for some production traits. In: Fishelson, L.,
Yaron, Z., (Eds.), International Symposium on Tilapia in Aquaculture. Tel Aviv
University, Tel Aviv, Israel, pp. 559-569.
Wohlfarth, G.W., Hulata, G., 1983. Applied Genetics of Tilapias, ICLARM Studies and
Review 6; Manila, Philippines. 26 p.
Yashouv, A., Chervinski, J., 1961. The food of Tilapia nilotica in ponds of the fish culture
research station at Dor. Bamidgeh 13, 33-39.
Chapter 2
Genetic and environmental factors affecting
growth of Nile tilapia (Oreochromis niloticus)
juveniles: modelling spatial correlations
between hapas
Harrison Charo-Karisaa,b,c , Hans Komenb, Sebastian Reynoldsa,
Mahmoud A. Rezkc, Raul W. Ponzonid, Henk Bovenhuisb
a Fish Culture and Fisheries Group, Wageningen Institute of Animal Sciences (WIAS), Wageningen
University, P.O. Box 338, 6700 AH, Wageningen, The Netherlands
b Animal Breeding and Genetics Group, Wageningen Institute of Animal Sciences (WIAS),
Wageningen University, P.O. Box 338, 6700 AH, Wageningen, The Netherlands
c Regional Center for Africa and West Asia, The World Fish Center, Abbassa, Abou Hammad, Egypt
dWorldFish Center, Jalan Batu Maung, 11960 Batu Maung, Penang, Malaysia
Aquaculture, 2006, in press
Chapter 2 ___________________________________________________________________________
20
Abstract
The aim of this study was to quantify the environmental and genetic effects on early growth
of Nile tilapia, Oreochromis niloticus, in hapa-in-earthen pond systems. In a pilot study, we
grew swim-up fry with or without supplementary feed in hapas suspended in fertilised ponds
at 5, 10, 15, and 20 fry/m2 densities. In the main experiment, we reared swim-up fry from 25
full-sib families separately for 42 days at 15 fry/m2 density in hapas suspended in two earthen
ponds. Hapas were arranged in two column arrays along the sides of the ponds. Ponds were
fertilized daily with chicken manure. In addition, fry in one column in each pond were fed
twice daily on 40% protein pelleted feed. Results from the pilot study indicated significant
effects of stocking density and treatment. In the main experiment, the dietary treatment effect
was not significant but there were large differences in growth between ponds. Mean body
weight at 42 days was 1.7 g in pond A, and 0.4 g in pond B. Heritability (h2) of 42-day fry
body weight estimated from the whole data set, using a univariate model, was 0.01±0.06. The
bivariate heritability estimates were 0.59±0.19 in pond A and 0.05±0.11 in pond B. The
common environmental / hapa (c2) effects were 0.14±0.06 and 0.29±0.07 in respective ponds.
We found significant positive spatial autocorrelation (P=0.02) indicating resemblance in
growth of fry in neighboring hapas. Analysis of environmental variables showed that the two
ponds differed significantly in dissolved oxygen. The low genetic correlation (rg = -
0.27±0.69) between body weights of fry in both ponds might therefore suggest genotype by
environment interactions for tolerance to low dissolved oxygen in Nile tilapia juveniles.
Keywords: Nile tilapia; Oreochromis niloticus; hapa-in-pond; heritability; spatial
autocorrelation
1. Introduction
Apart from mechanisms that contribute directly to maintenance of genetic variance, the
conditions under which variance components are estimated may influence the assessment of
heritability (Simons and Roff, 1994). Response to selection can be increased by reducing
environmental variation between families through techniques of rearing and management
(Falconer and Mackay, 1996). However, effective management of the rearing environment
may not be possible without understanding the underlying environmental factors influencing
the expression of traits. This is because fish performance may vary even in apparently similar
Factors affecting early growth of Nile tilapia ___________________________________________________________________________
21
environments. For example, while rearing tilapia fry in seawater pools fertilised with chicken
manure, Ernst et al. (1989) found considerable variability in fish performance among pools
despite identical management methods.
In fish breeding programs, members of a full-sib family usually share a common tank or hapa
prior to tagging and communal testing. In Nile tilapia, Oreochromis niloticus, hapas
suspended in fertilized ponds are increasingly used for rearing of fry until tagging size or
grow-out stage (Little et al., 2003a). Apart from feeding on a variety of supplementary feeds,
tilapias feed on fertilizer-induced phytoplankton (Moriarty and Moriarty, 1973; Bowen,
1981). As a result, fry in hapas-in-pond systems may be reared with a range of feeds and
pond inputs varying in nutrient content. When reared in different environments, genotypes
may exhibit differences in growth performance. However, studies on performance of fry in
hapa-in-ponds have so far only considered the effect of density and nursing duration (Sanches
and Hayashi, 1990; Little et al., 2003b).
For convenience of monitoring and identification of families, hapas are often arranged in
rows over the pond. The micro-environment created within hapas may increase resemblance
of individuals reared in the same hapa. When ponds are heterogeneous, for example with
respect to nutrient availability, the spatial arrangement of hapas may also create an
environmental correlation among neighbouring units. At present, it is not clear whether or
how the spatial arrangement of hapas in the pond and the environment within hapas influence
fry performance.
The aim of this study was therefore to quantify the genetic and common environmental
effects on early rearing stages of O. niloticus in hapa-in-pond nursing conditions. We reared
tilapia fry from full-sib families in two different dietary treatments and ponds to determine (i)
the effects of rearing environments on heritability estimates of early growth, and (ii) whether
and how spatial arrangement of hapas in the ponds affects early growth of O. niloticus.
Chapter 2 ___________________________________________________________________________
22
2. Materials and Methods
2.1 Pilot experiment: Effect of fish density and dietary treatment on fry growth
First we carried out a pilot experiment to compare growth of fry at different densities in
fertilized ponds with or without supplementary feed. The specific objective of this study was
to determine densities at which swim-up fry would grow at comparable rates in natural food
and supplementary-fed hapa conditions. Fry were grown in 6m² (3m X 2m) fine-mesh hapas
suspended in four 2000 m² ponds at a water depth of 0.5 m. In each pond, four hapas with
different stocking densities were used: 5, 10, 15, and 20 fry m-2 which corresponds to 10, 20,
30 and 40 fry m-3, respectively. Each day, dry chicken manure was spread over the surface of
the ponds at a rate of 50 kg dry matter/ha/day. The chicken manure for this study was sourced
from commercial layer and broiler farmers. Fry reared without supplementary feed (= NF)
depended on naturally available food and phytoplankton induced by the manure (Bowen,
1981; Spataru et al., 1983). Those reared with supplementary feed (= SF) were fed on
commercially available 40% protein feed (initially in form of paste balls, and later in form of
pellets) in addition to the natural pond food. Each density and treatment combination was
tested in duplicate. To avoid algal fouling, hapas were cleaned every two weeks and ponds
stocked with fish of 0.68 g average weight at a density of 1 fish/m². Dissolved oxygen (DO),
temperature and pH were measured daily (WTW® model multi 340i meter). Ammonia, nitrite
and nitrate levels (HACH test kits) and turbidity (secchi disk visibility) were monitored every
two weeks.
Average weight of fry at stocking was 0.015 g. Every two weeks, at least 20 fry/ hapa were
collected, bulk-weighed and average wet weight recorded. The experiment lasted 53 days,
allowing all fish to reach tagging size (>2 g). On the harvest day, fish were anaesthetized with
MS222 (Tricaine methanesulphonate) and body weight measured for each fish.
2.2 Main Experiment
This experiment was conducted to determine genetic and environmental factors affecting
early fry growth in hapa-in-pond nursing environments. We specifically considered the
effects of pond, dietary treatment, and spatial arrangement of hapas on fry growth and
estimated additive genetic and common environmental/ rearing hapa effects. Similar to the
Factors affecting early growth of Nile tilapia ___________________________________________________________________________
23
pilot experiment, fry were reared on either naturally available pond food alone (NF) or with
supplements of a 40% protein feed (SF).
Columns
Pond A
Pond B
NS NS NS NS
1 2 51 52
3 4 53 54
5 6 55 56
7 8 57 58
9 10 59 60
11 12 61 62
13 14 63 64
15 16 65 66
17 18 67 68
19 20 69 70
21 22 71 72
23 24 73 74
25 26 75 76
27 28 77 78
29 30 79 80
31 32 81 82
33 34 83 84
35 36 85 86
37 38 87 88
39 40 89 90
41 42 91 92
43 44 93 94
45 46 95 96
47 48 97 98
49 50 99 100
NS NS NS NS
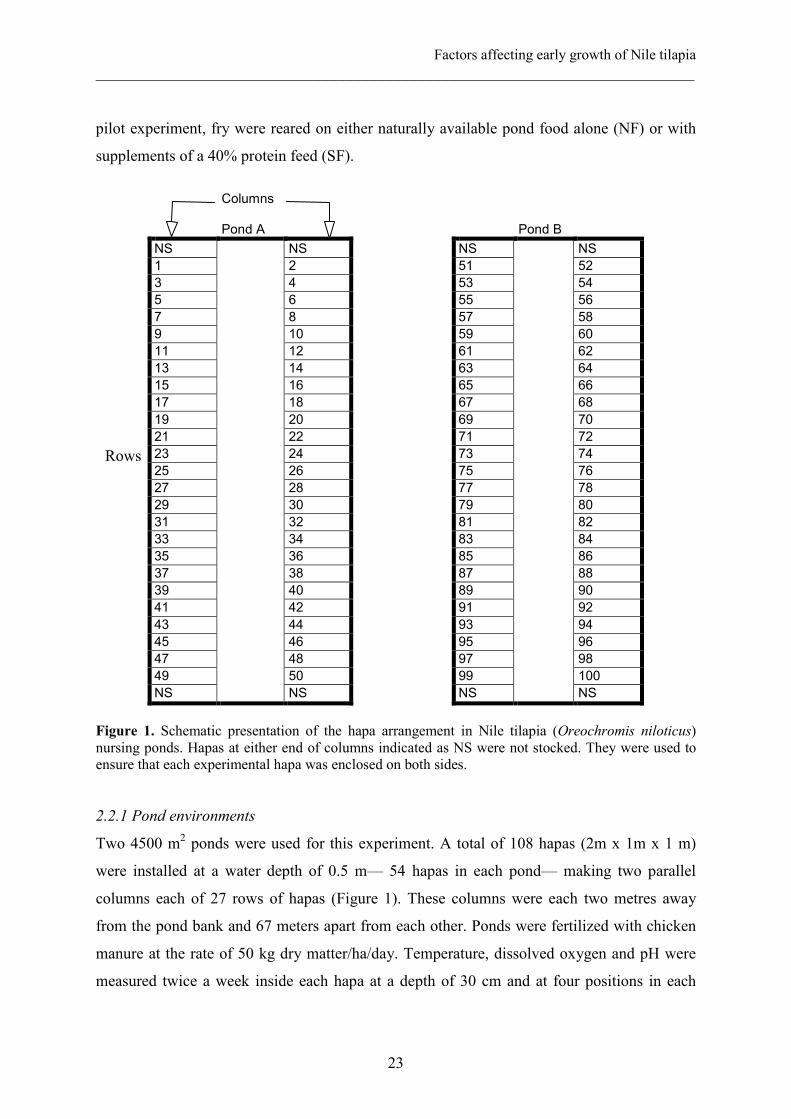
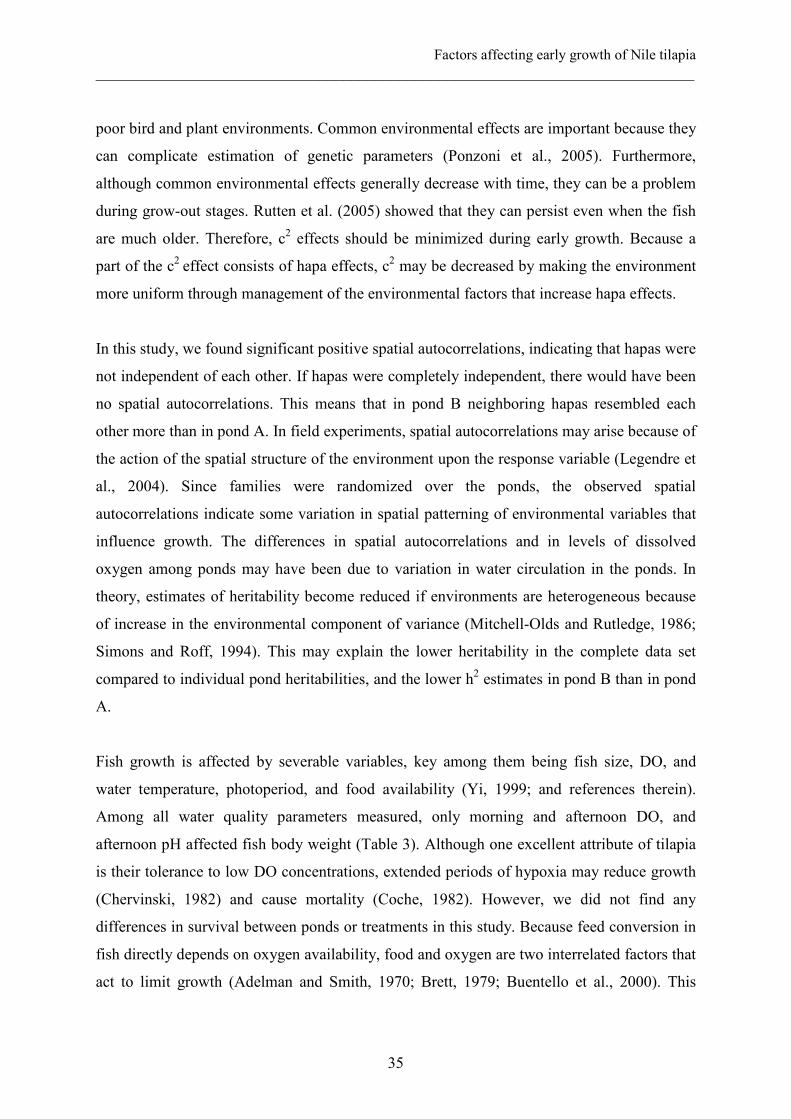
Figure 1. Schematic presentation of the hapa arrangement in Nile tilapia (Oreochromis niloticus) nursing ponds. Hapas at either end of columns indicated as NS were not stocked. They were used to ensure that each experimental hapa was enclosed on both sides.
2.2.1 Pond environments
Two 4500 m2 ponds were used for this experiment. A total of 108 hapas (2m x 1m x 1 m)
were installed at a water depth of 0.5 m— 54 hapas in each pond— making two parallel
columns each of 27 rows of hapas (Figure 1). These columns were each two metres away
from the pond bank and 67 meters apart from each other. Ponds were fertilized with chicken
manure at the rate of 50 kg dry matter/ha/day. Temperature, dissolved oxygen and pH were
measured twice a week inside each hapa at a depth of 30 cm and at four positions in each
Rows
Chapter 2 ___________________________________________________________________________
24
pond outside the hapas. Sampling was done in the morning (6.00-7.00 h) and afternoon
(15.00-16.00 h) with a portable DO meter (WTW® model multi 340i meter). Total ammonia,
nitrate, and nitrite were monitored weekly in five random hapas per column.
2.2.2 Production and rearing of experimental fry
Grandparents of the experimental fish were produced in spring of 2000 from all possible
diallele crosses between four local Egyptian strains (Rezk et al., 2002; 2004). Information on
the production of parental generation is provided in more detail in Charo-Karisa et al.,
(2005). Twenty five full-sib families were produced by single pair mating of 25 dams and 25
sires in separate 6 m2 hapas. Families were produced over a period of five weeks (23 August
to 28 September 2003). At the end of spawning and nursing to swim-up, fry were removed
from the hapas ready for stocking. One hundred and twenty swim-up fry were taken from
each family and divided into four groups of 30 each. Fry groups were randomly stocked into
the 2 x 1 x 1 m experimental hapas ensuring that each family was represented in each nursing
pond and column. Fry were stocked at a density of 15 fry/ m2 (= 30 fish m-3). The remaining
two hapas at either end of each column were not stocked to ensure that each experimental
hapa was enclosed between two hapas.
Fry in one of the two columns in each pond had access to naturally available food only (NF).
As in the pilot experiment, ponds were fertilized with dried chicken manure from commercial
layer and broiler farms. In the other column, fry were fed twice daily (9.00 and 13.00 h) with
commercial 40% protein formulated feed (SF), initially at 30% body weight. This was
gradually reduced in subsequent weeks to 20% BW at the end of the experiment. Fish in this
column also had access to the natural pond food. On day 14, 21, 28, and 35, fry were counted,
bulk weighed and average weight recorded. To control hapa fouling, hapas were removed
after bulk weighing of the fry, and cleaned by scrubbing the hapa sides before restocking with
fry. The experiment was terminated on day 42 when all the fish were removed from the
hapas, anaesthetized (MS222), and individual body weight and standard length measurements
taken.
Factors affecting early growth of Nile tilapia ___________________________________________________________________________
25
2.2.3 Parameters calculated
Survival rate for each hapa (St %) was calculated as St = (Nt/N0) X 100, where Nt is the
number of fry at day t and N0 is the number of fry at stocking. Fulton’s condition factor was
computed at the end of the experiment for each individual by the formula: CF = 100W/L3
(Ricker, 1975), where W is body weight (g) and L is standard body length (cm). Specific
growth rate of the fry was determined at harvest according to Cho and Kaushik, (1985): SGR
= (lnBWf - lnBWi) /t, where BWf is individual final wet body weight (in grams), BWi is
initial mean body weight for each family at stocking, and t is time interval between sampling
in days. The coefficient of variation was calculated as standard deviation*100/ mean for body
weight, standard length, specific growth rate, condition factor and survival.
2.3 Data analysis
Pilot experiment: the effect of stocking density and dietary treatment on mean fry body
weight was evaluated using a linear model including the effects of stocking density and
dietary treatment and their interaction as fixed effects and a random residual error effect.
Differences among dietary treatment and density means were tested (P = 0.01) by least
significant difference (LSD) using SAS (1989).
Main experiment: Due to heterogeneity of variances of fish among ponds, body weight data
was log-transformed. Genetic and environmental effects and effect of spatial hapa
arrangement on individual final body weight were analysed using the following model:
Yijkl = µ + pi + tj + β1*log (INWTijkl) + β2* dijkl + hk + ul + eijkl (Model 1)
where Yijkl = logarithm of 42-day body weight of individual ijkl; µ is overall mean; pi is fixed
effect of pond (i = 1, 2); tj is fixed effect of dietary treatment (j = 1, 2); β1 is regression
coefficient on logarithm of initial body weight; log(INWTijkl) is the co-variable logarithm of
initial body weight (at stocking) of individual ijkl; β2 is regression coefficient on number of
fry in the hapa at the end of the experiment; dijkl is the co-variable number of fry in a hapa at
the end of the experiment; ul is a random additive genetic effect of individual l; hk is a
random effect of the kth hapa; and eijkl is a random residual effect associated with individual
l.
Chapter 2 ___________________________________________________________________________
26
In matrix notation Model 1 can be written as
y = Xb + Z1u + Z2h + e
with expectations
E(y) = Xb, E(u) = E(h) = E(e) = 0
and variance
v(y) = Z1AZ1’
2uσ + Z2GZ2
’
2hσ + I 2
eσ
where, X is an incidence matrix for the fixed effects vector b (including co-variables); u, h
and e are vectors with additive genetic, hapa and residual random effects, Z1 and Z2 are
incidence matrices, A is the additive genetic relationship matrix, G is the correlation matrix
of hapa effects and I is the identity matrix, 2uσ is the additive genetic variance, 2
hσ is the hapa
or the common environmental variance and 2eσ is the error variance. The pedigree consisted
of 2379 fish, including parents and grandparents of the experimental fish.
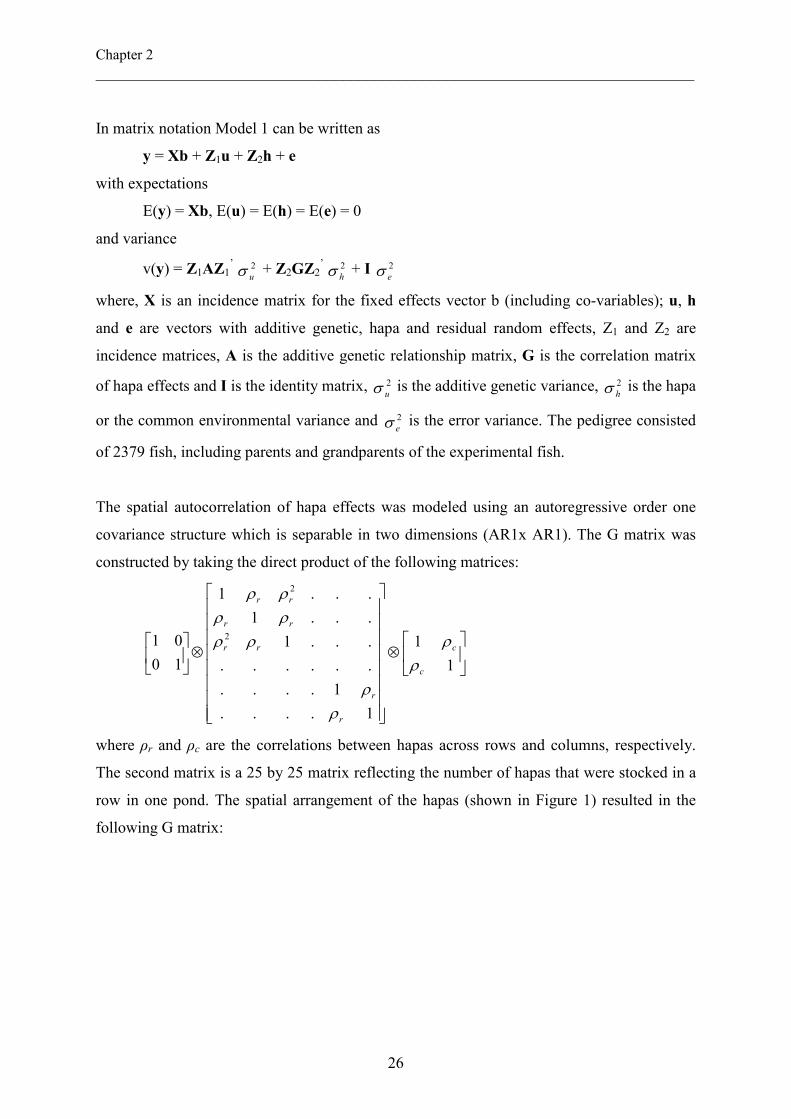
The spatial autocorrelation of hapa effects was modeled using an autoregressive order one
covariance structure which is separable in two dimensions (AR1x AR1). The G matrix was
constructed by taking the direct product of the following matrices:
⊗
⊗
1
1
1....
1....
......
...1
...1
...1
10
01 2
2
c
c
r
r
rr
rr
rr
ρρ
ρρ
ρρρρρρ
where ρr and ρc are the correlations between hapas across rows and columns, respectively.
The second matrix is a 25 by 25 matrix reflecting the number of hapas that were stocked in a
row in one pond. The spatial arrangement of the hapas (shown in Figure 1) resulted in the
following G matrix:
Factors affecting early growth of Nile tilapia ___________________________________________________________________________
27
Hapa number 1 2 3 4 5 6 51 52 .
1 1 ρc ρr ρrρc ρr2 ρr
2ρc . 0 0 . 2 ρc 1 ρrρc ρr ρr
2ρc ρr2 . 0 0 .
3 ρr ρrρc 1 ρc ρr ρrρc . 0 0 . 4 ρrρc ρr ρc 1 ρrρc ρr . 0 0 . 5 ρr
2 ρr2ρc ρr ρrρc 1 ρc . 0 0 .
6 ρr2ρc ρr
2 ρrρc ρr ρc 1 . 0 0 . . . 51 0 0 0 0 . 1 ρc . 52 0 0 0 0 . ρc 1 .
Hapa number
. . . . . . . . . .
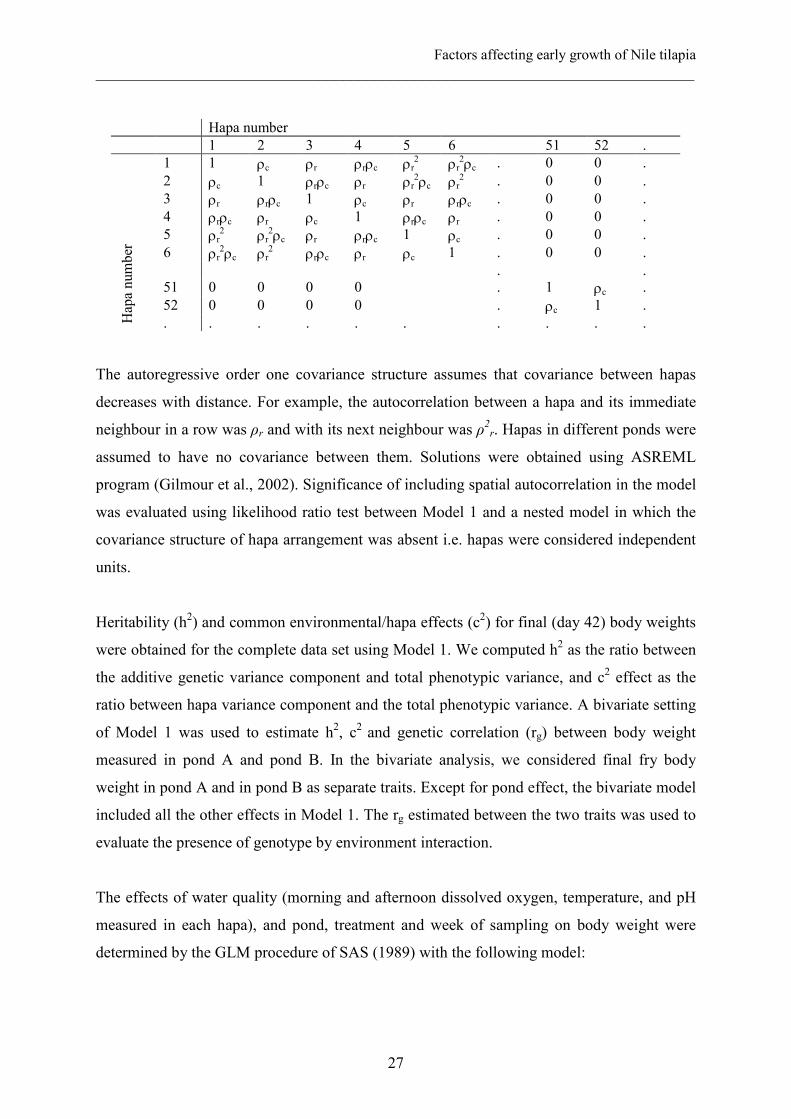
The autoregressive order one covariance structure assumes that covariance between hapas
decreases with distance. For example, the autocorrelation between a hapa and its immediate
neighbour in a row was ρr and with its next neighbour was ρ2r. Hapas in different ponds were
assumed to have no covariance between them. Solutions were obtained using ASREML
program (Gilmour et al., 2002). Significance of including spatial autocorrelation in the model
was evaluated using likelihood ratio test between Model 1 and a nested model in which the
covariance structure of hapa arrangement was absent i.e. hapas were considered independent
units.
Heritability (h2) and common environmental/hapa effects (c2) for final (day 42) body weights
were obtained for the complete data set using Model 1. We computed h2 as the ratio between
the additive genetic variance component and total phenotypic variance, and c2 effect as the
ratio between hapa variance component and the total phenotypic variance. A bivariate setting
of Model 1 was used to estimate h2, c2 and genetic correlation (rg) between body weight
measured in pond A and pond B. In the bivariate analysis, we considered final fry body
weight in pond A and in pond B as separate traits. Except for pond effect, the bivariate model
included all the other effects in Model 1. The rg estimated between the two traits was used to
evaluate the presence of genotype by environment interaction.
The effects of water quality (morning and afternoon dissolved oxygen, temperature, and pH
measured in each hapa), and pond, treatment and week of sampling on body weight were
determined by the GLM procedure of SAS (1989) with the following model:
Chapter 2 ___________________________________________________________________________
28
Yijkl = µ + pi + tj + wk + β1*dijkl+ β2*DOMijkl + β3*DOAijkl+ β4*TMijkl+ β5*TAijkl +
β6*PHMijkl+ β7*PHAijkl + eijkl (Model 2)
where Yijkl is logarithm of mean body weight of fish in the lth hapa at each sampling (i.e. each
week); u is overall mean; pi is fixed effect of pond (i = 1, 2); tj is fixed effect of dietary
treatment (j = 1, 2); wk is fixed effect of the kth week of sampling (k = 1, 2, 3,…6); β1 is the
regression coefficient on number of surviving fish; dijkl is the covariable number of surviving
fish; β2 is the regression coefficient on morning dissolved oxygen (DOM); DOM is the
covariable morning DO in each week; β3 is the regression coefficient on afternoon dissolved
oxygen (DOA); DOA is the covariable afternoon DO in each week; β4 is the regression
coefficient on morning temperature (TM); TM is the covariable morning temperature in each
week; β5 is the regression coefficient on afternoon temperature (TA); TA is the covariable
afternoon temperature in each week; β6 is the regression coefficient on morning pH (PHM);
PHM is the covariable morning pH in each week; β7 is the regression coefficient on afternoon
pH (PHA); PHA is the covariable afternoon pH in each week; and eijkl is a random residual
effect associated with the lth hapa. DOM, DOA, TM, TA, PHM and PHA in the model were
averages of the two weekly measurements in each hapa.
We estimated the Pearson correlation coefficients between final body weight and the hapa
effects (i.e. the hapa solutions from Model 1) and average DOM, DOA, TM, TA, PHM and
PHA readings in each hapa.
3. Results
3.1 Pilot experiment
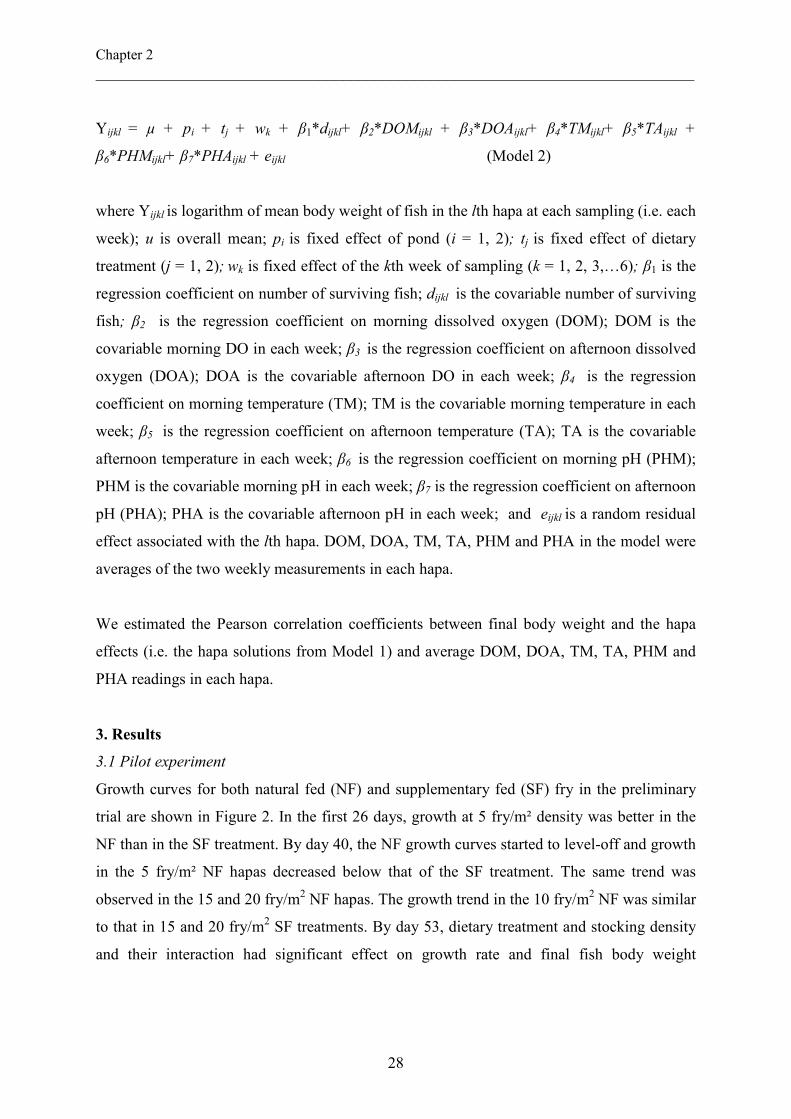
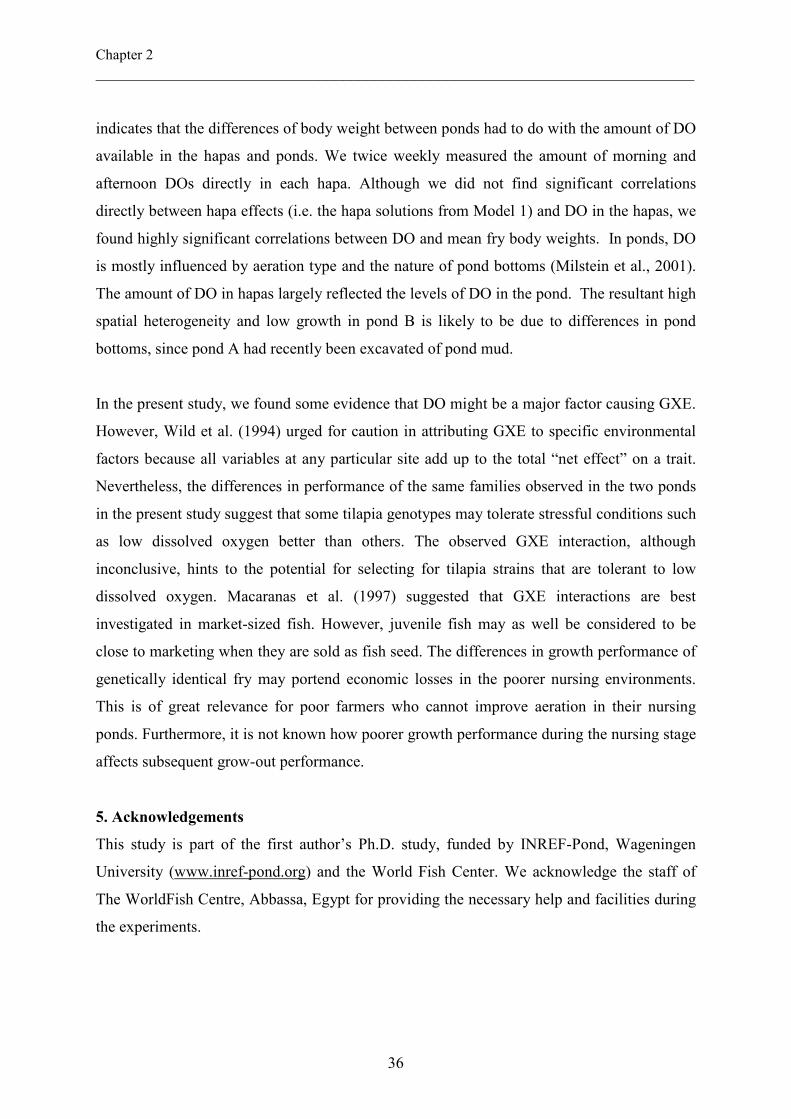
Growth curves for both natural fed (NF) and supplementary fed (SF) fry in the preliminary
trial are shown in Figure 2. In the first 26 days, growth at 5 fry/m² density was better in the
NF than in the SF treatment. By day 40, the NF growth curves started to level-off and growth
in the 5 fry/m² NF hapas decreased below that of the SF treatment. The same trend was
observed in the 15 and 20 fry/m2 NF hapas. The growth trend in the 10 fry/m2 NF was similar
to that in 15 and 20 fry/m2 SF treatments. By day 53, dietary treatment and stocking density
and their interaction had significant effect on growth rate and final fish body weight
Factors affecting early growth of Nile tilapia ___________________________________________________________________________
29
(P<0.001). Mean final body weights at 15 fry/m² density was 4.1 g in the NF treatment 7.3 g
in the SF treatment.
3.2 Main experiment
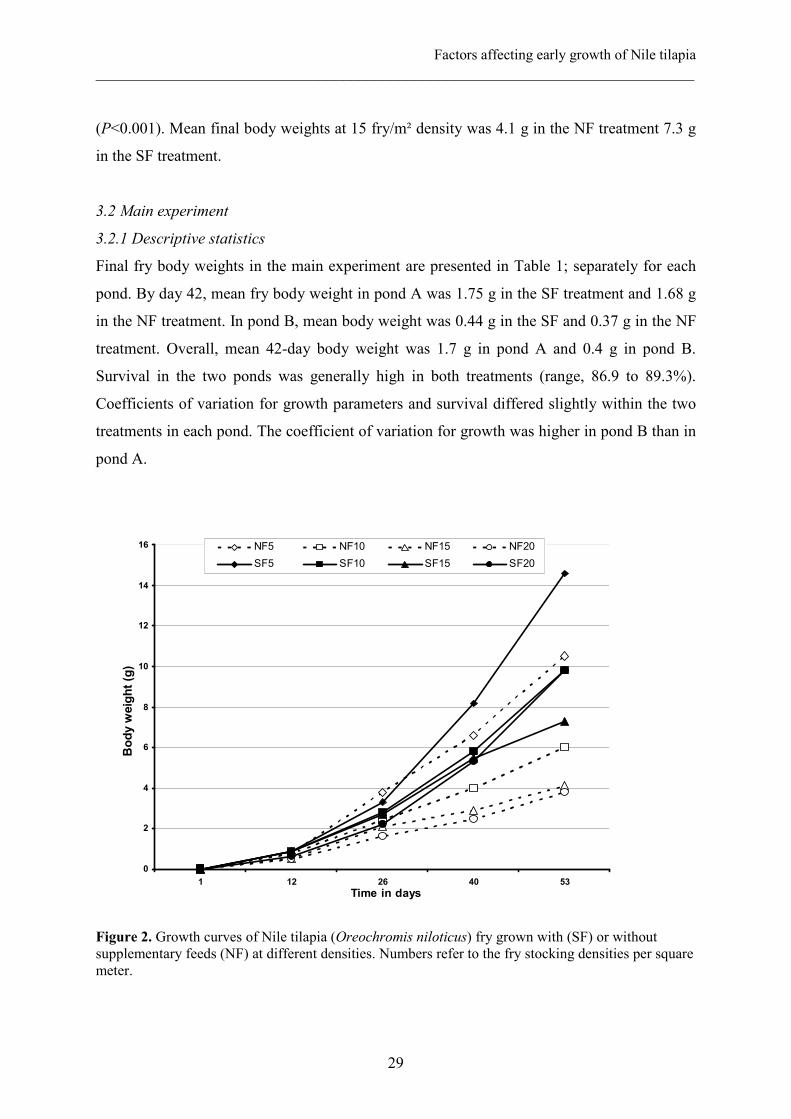
3.2.1 Descriptive statistics
Final fry body weights in the main experiment are presented in Table 1; separately for each
pond. By day 42, mean fry body weight in pond A was 1.75 g in the SF treatment and 1.68 g
in the NF treatment. In pond B, mean body weight was 0.44 g in the SF and 0.37 g in the NF
treatment. Overall, mean 42-day body weight was 1.7 g in pond A and 0.4 g in pond B.
Survival in the two ponds was generally high in both treatments (range, 86.9 to 89.3%).
Coefficients of variation for growth parameters and survival differed slightly within the two
treatments in each pond. The coefficient of variation for growth was higher in pond B than in
pond A.
0
2
4
6
8
10
12
14
16
1 12 26 40 53
Time in days
Body weight (g)
NF5 NF10 NF15 NF20
SF5 SF10 SF15 SF20
Figure 2. Growth curves of Nile tilapia (Oreochromis niloticus) fry grown with (SF) or without supplementary feeds (NF) at different densities. Numbers refer to the fry stocking densities per square meter.
Chapter 2 ___________________________________________________________________________
30
3.2.2 Fixed and covariable effects
Results from the complete data set indicate that the effects of pond and initial body weight on
final body weight were significant (P = 0.01; with F-statistics in the magnitude of 426 and
12.9 respectively). Neither fish density at the end of experiment, nor the dietary treatment
effects or their interactions was significant.
Table 1. Final body measurements, overall growth rate, condition factor, and overall survival of Nile tilapia fry reared in hapas suspended in two nursing ponds (A and B). Fry were from the same families. Fry in supplementary fed (SF) treatment received 40% protein supplements while those in the natural-fed (NF) treatment fed on natural pond food only.
Supplementary fed Natural-fed Parameter Mean CV (%) Mean CV (%) Pond A Body weight (g) Standard length (mm) Specific growth rate Condition factor Survival (%) n
Pond B Body weight (g) Standard length (mm) Specific growth rate Condition factor Survival (%) n
1.75
36.32 8.94 3.52 87.7
573
0.44 23.64 5.64 3.22 89.3
584
41.0 13.0 15.4 18.8 23.3
34.1 11.2 31.4 18.3 17.4
1.68 36.19 8.99 3.42 87.7
572
0.37 22.90 5.34 2.99 86.9
565
36.9 12.4 16.1 12.9 20.5
40.5 9.9 31.5 19.1 23.0
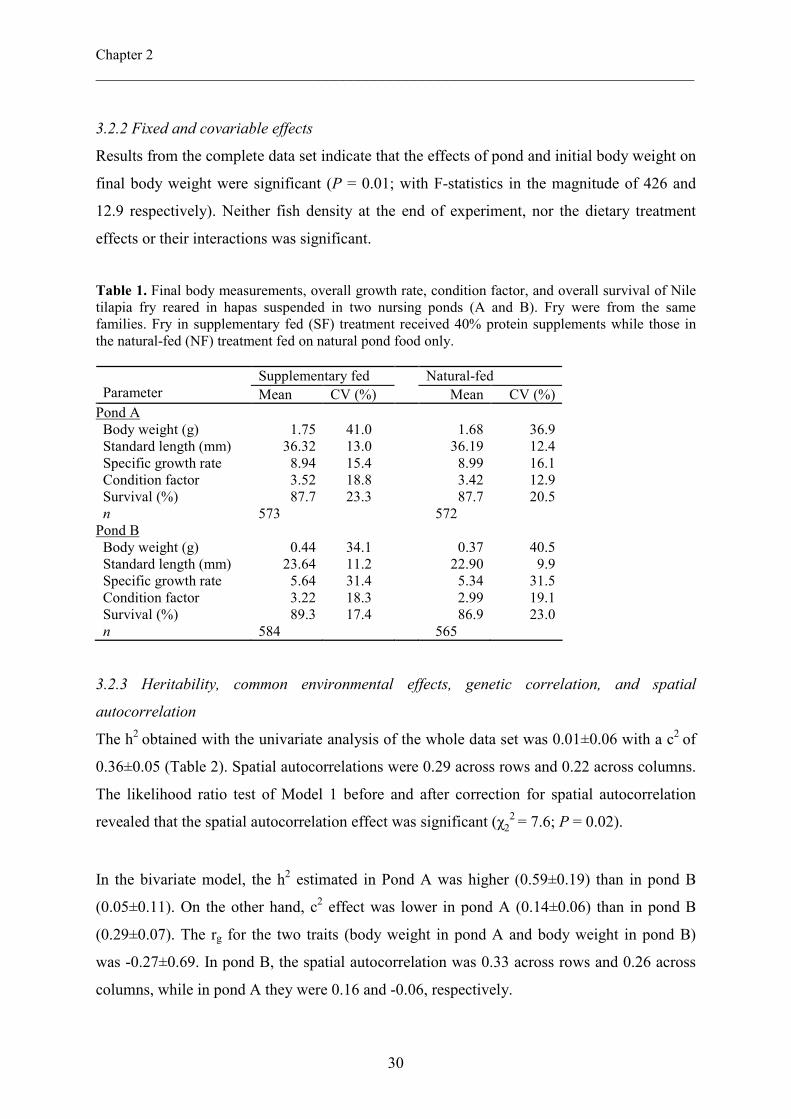
3.2.3 Heritability, common environmental effects, genetic correlation, and spatial
autocorrelation
The h2 obtained with the univariate analysis of the whole data set was 0.01±0.06 with a c2 of
0.36±0.05 (Table 2). Spatial autocorrelations were 0.29 across rows and 0.22 across columns.
The likelihood ratio test of Model 1 before and after correction for spatial autocorrelation
revealed that the spatial autocorrelation effect was significant (χ22 = 7.6; P = 0.02).
In the bivariate model, the h2 estimated in Pond A was higher (0.59±0.19) than in pond B
(0.05±0.11). On the other hand, c2 effect was lower in pond A (0.14±0.06) than in pond B
(0.29±0.07). The rg for the two traits (body weight in pond A and body weight in pond B)
was -0.27±0.69. In pond B, the spatial autocorrelation was 0.33 across rows and 0.26 across
columns, while in pond A they were 0.16 and -0.06, respectively.
Factors affecting early growth of Nile tilapia ___________________________________________________________________________
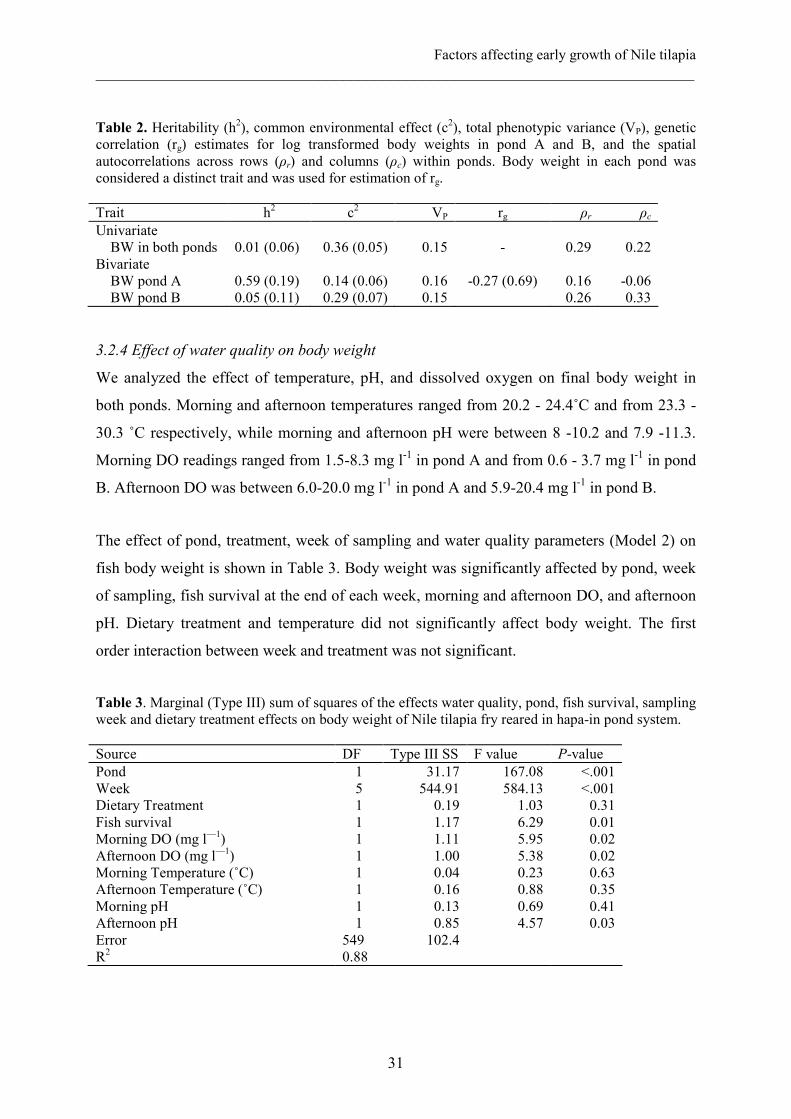
31
Table 2. Heritability (h2), common environmental effect (c2), total phenotypic variance (VP), genetic correlation (rg) estimates for log transformed body weights in pond A and B, and the spatial autocorrelations across rows (ρr) and columns (ρc) within ponds. Body weight in each pond was considered a distinct trait and was used for estimation of rg. Trait h2 c2 VP rg ρr ρc
Univariate BW in both ponds Bivariate BW pond A BW pond B
0.01 (0.06) 0.59 (0.19) 0.05 (0.11)
0.36 (0.05)
0.14 (0.06) 0.29 (0.07)
0.15
0.16 0.15
-
-0.27 (0.69)
0.29
0.16 0.26
0.22
-0.06 0.33
3.2.4 Effect of water quality on body weight
We analyzed the effect of temperature, pH, and dissolved oxygen on final body weight in
both ponds. Morning and afternoon temperatures ranged from 20.2 - 24.4˚C and from 23.3 -
30.3 ˚C respectively, while morning and afternoon pH were between 8 -10.2 and 7.9 -11.3.
Morning DO readings ranged from 1.5-8.3 mg l-1 in pond A and from 0.6 - 3.7 mg l-1 in pond
B. Afternoon DO was between 6.0-20.0 mg l-1 in pond A and 5.9-20.4 mg l-1 in pond B.
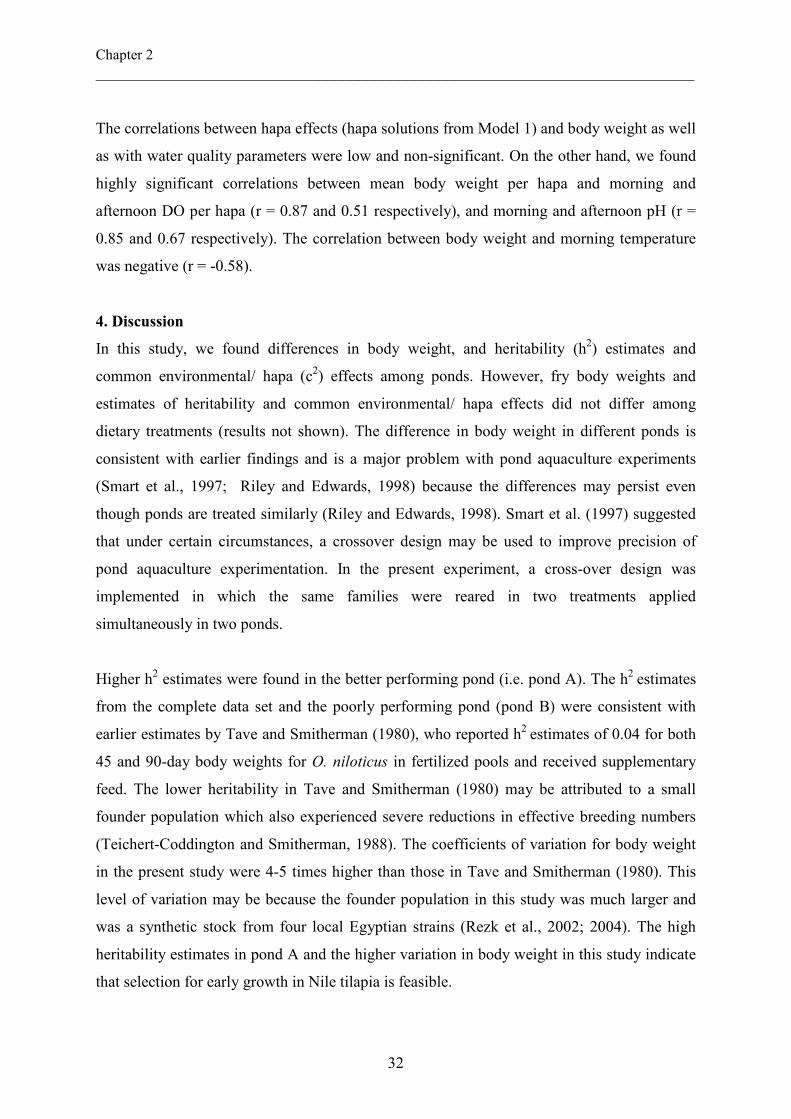
The effect of pond, treatment, week of sampling and water quality parameters (Model 2) on
fish body weight is shown in Table 3. Body weight was significantly affected by pond, week
of sampling, fish survival at the end of each week, morning and afternoon DO, and afternoon
pH. Dietary treatment and temperature did not significantly affect body weight. The first
order interaction between week and treatment was not significant.
Table 3. Marginal (Type III) sum of squares of the effects water quality, pond, fish survival, sampling week and dietary treatment effects on body weight of Nile tilapia fry reared in hapa-in pond system. Source DF Type III SS F value P-value Pond Week Dietary Treatment Fish survival Morning DO (mg l—1) Afternoon DO (mg l—1) Morning Temperature (˚C) Afternoon Temperature (˚C) Morning pH Afternoon pH Error R2
1 5 1 1 1 1 1 1 1 1
549 0.88
31.17 544.91 0.19 1.17 1.11 1.00 0.04 0.16 0.13 0.85 102.4
167.08 584.13 1.03
6.29 5.95 5.38 0.23 0.88 0.69 4.57
<.001 <.001 0.31 0.01 0.02 0.02 0.63 0.35 0.41 0.03
Chapter 2 ___________________________________________________________________________
32
The correlations between hapa effects (hapa solutions from Model 1) and body weight as well
as with water quality parameters were low and non-significant. On the other hand, we found
highly significant correlations between mean body weight per hapa and morning and
afternoon DO per hapa (r = 0.87 and 0.51 respectively), and morning and afternoon pH (r =
0.85 and 0.67 respectively). The correlation between body weight and morning temperature
was negative (r = -0.58).
4. Discussion
In this study, we found differences in body weight, and heritability (h2) estimates and
common environmental/ hapa (c2) effects among ponds. However, fry body weights and
estimates of heritability and common environmental/ hapa effects did not differ among
dietary treatments (results not shown). The difference in body weight in different ponds is
consistent with earlier findings and is a major problem with pond aquaculture experiments
(Smart et al., 1997; Riley and Edwards, 1998) because the differences may persist even
though ponds are treated similarly (Riley and Edwards, 1998). Smart et al. (1997) suggested
that under certain circumstances, a crossover design may be used to improve precision of
pond aquaculture experimentation. In the present experiment, a cross-over design was
implemented in which the same families were reared in two treatments applied
simultaneously in two ponds.
Higher h2 estimates were found in the better performing pond (i.e. pond A). The h2 estimates
from the complete data set and the poorly performing pond (pond B) were consistent with
earlier estimates by Tave and Smitherman (1980), who reported h2 estimates of 0.04 for both
45 and 90-day body weights for O. niloticus in fertilized pools and received supplementary
feed. The lower heritability in Tave and Smitherman (1980) may be attributed to a small
founder population which also experienced severe reductions in effective breeding numbers
(Teichert-Coddington and Smitherman, 1988). The coefficients of variation for body weight
in the present study were 4-5 times higher than those in Tave and Smitherman (1980). This
level of variation may be because the founder population in this study was much larger and
was a synthetic stock from four local Egyptian strains (Rezk et al., 2002; 2004). The high
heritability estimates in pond A and the higher variation in body weight in this study indicate
that selection for early growth in Nile tilapia is feasible.
Factors affecting early growth of Nile tilapia ___________________________________________________________________________
33
We found large differences in h2 estimates in the two nursing ponds, even though the same
full-sib families and management levels were used in both ponds. Similar findings have been
reported for slaughter weight of rainbow trout reared in three similar farms in Norway
(Sylven et al., 1991), and for sexual maturity in cage-cultured Atlantic salmon (Wild et al.,
1994). Similarly, Garant et al. (2003) found lower h2 estimates for growth of salmon (Salmo
salar) in natural habitats which had lower food resource than in habitats with optimal
resource availability. In contrast to the present study, Sylven et al. (1991) found that farms
with the highest performance also showed lowest heritability, which was attributed to
increase in residual variances while the sire variances were of the same magnitude across
environments.
Environments can be categorized as bad or good depending on their effect on the target trait,
with bad being the case where expression of the trait is suppressed and good where it is
enhanced (Falconer, 1990). Differences in h2 estimates in different environments can occur
due to a decrease in the additive genetic variance component in the bad environment or due to
a different set of genes acting in the good and bad environment (Falconer, 1989). A decrease
in additive genetic variance component in the bad environment is a result of low expression
of genes affecting the trait (Falconer, 1989). The large difference in h2 estimates and the low
rg estimates in the two nursing ponds, suggests differences in expression of additive genes
responsible for growth in these environments.
The estimated genetic correlation (rg) for body weight among ponds in this study was well
below unity and negative, suggesting the presence of substantial genotype by environment
(GXE) interactions. Ignoring GXE interactions may bias h2 estimates (Mitchell-Olds and
Rutledge, 1986; Via, 1984) and could have led to the lower heritability estimates in the
complete data set. Low rg between traits expressed in different environments is an indication
that the traits are not influenced by the same genes (Falconer, 1989). However, due to the
high standard errors in the rg estimate we cannot conclude whether this was true in the present
study. Studies of genotype by environment interactions in Nile tilapia have not been
conclusive, and are limited to strain by environment interaction. Macaranas et al. (1997),
evaluated four Nile tilapia strains under two pond culture systems (integrated and non-
integrated). Bentsen et al. (1998) evaluated eight Nile tilapia strains under eight different
Chapter 2 ___________________________________________________________________________
34
farm environments. Both studies indicated that there were no GXE interactions. However,
Romana-Eguia and Doyle (1992) found strong GXE interactions for tolerance to poor
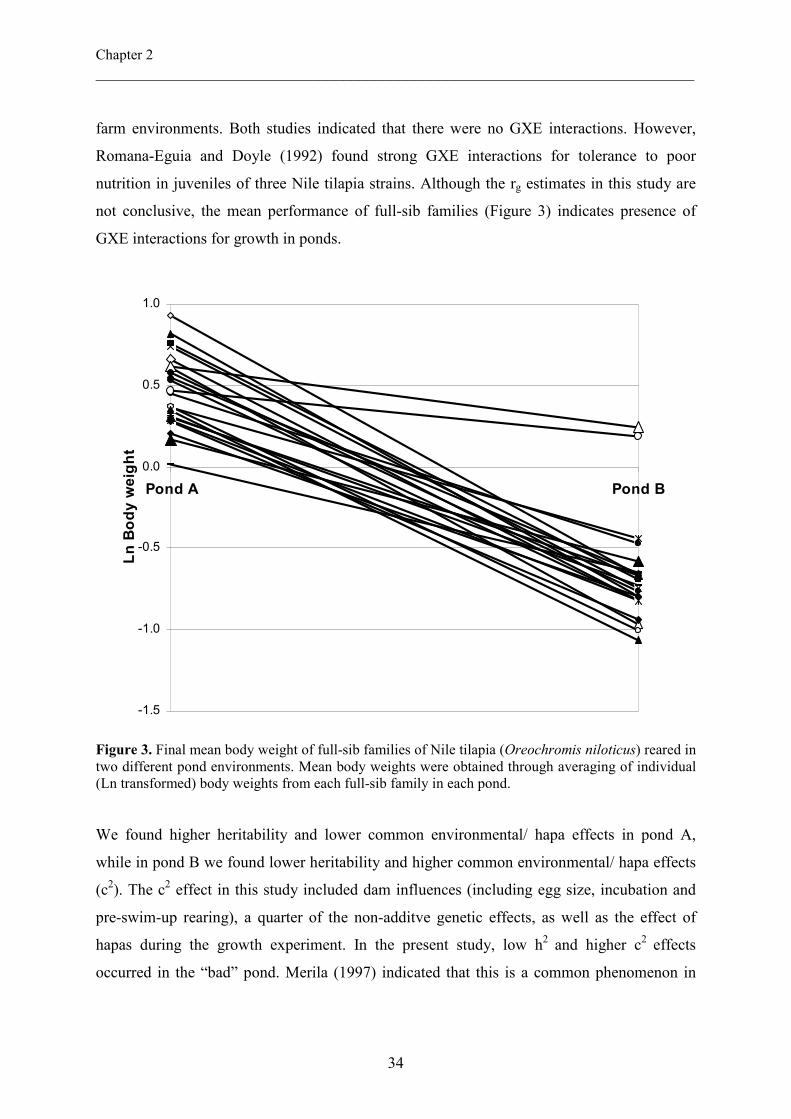
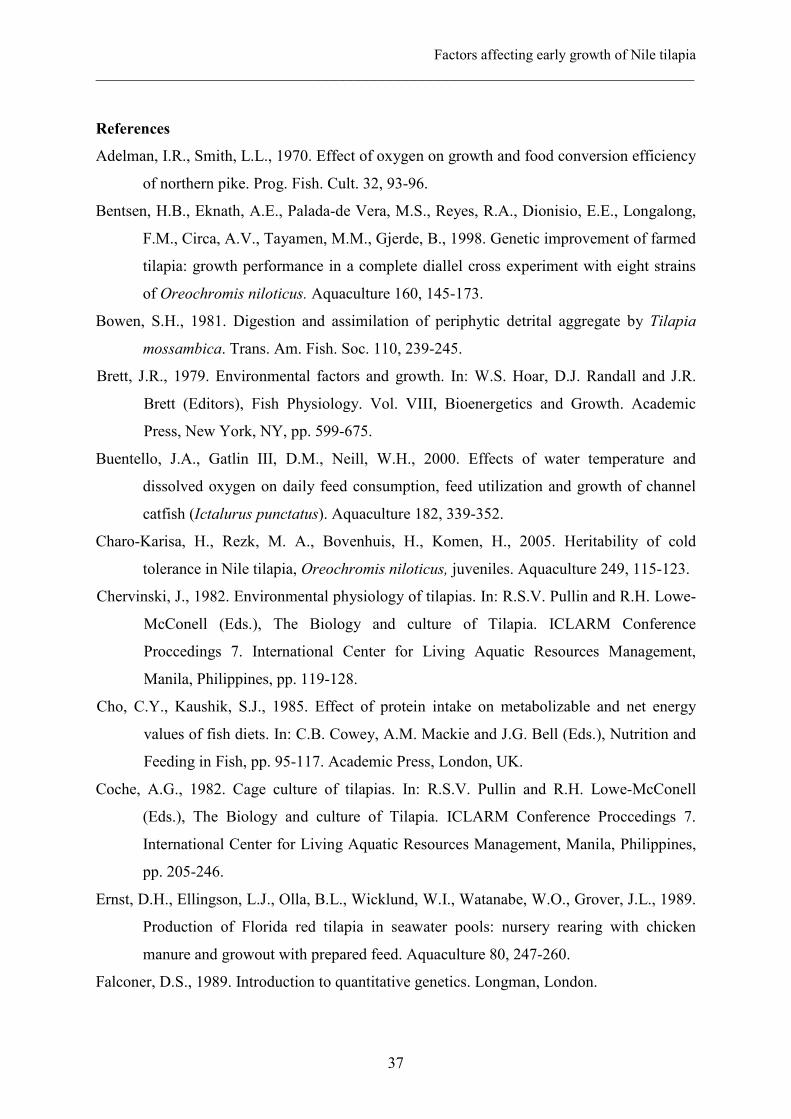
nutrition in juveniles of three Nile tilapia strains. Although the rg estimates in this study are
not conclusive, the mean performance of full-sib families (Figure 3) indicates presence of
GXE interactions for growth in ponds.
-1.5
-1.0
-0.5
0.0
0.5
1.0
Pond A Pond B
Ln Body weight
Figure 3. Final mean body weight of full-sib families of Nile tilapia (Oreochromis niloticus) reared in two different pond environments. Mean body weights were obtained through averaging of individual (Ln transformed) body weights from each full-sib family in each pond.
We found higher heritability and lower common environmental/ hapa effects in pond A,
while in pond B we found lower heritability and higher common environmental/ hapa effects
(c2). The c2 effect in this study included dam influences (including egg size, incubation and
pre-swim-up rearing), a quarter of the non-additve genetic effects, as well as the effect of
hapas during the growth experiment. In the present study, low h2 and higher c2 effects
occurred in the “bad” pond. Merila (1997) indicated that this is a common phenomenon in
Factors affecting early growth of Nile tilapia ___________________________________________________________________________
35
poor bird and plant environments. Common environmental effects are important because they
can complicate estimation of genetic parameters (Ponzoni et al., 2005). Furthermore,
although common environmental effects generally decrease with time, they can be a problem
during grow-out stages. Rutten et al. (2005) showed that they can persist even when the fish
are much older. Therefore, c2 effects should be minimized during early growth. Because a
part of the c2 effect consists of hapa effects, c2 may be decreased by making the environment
more uniform through management of the environmental factors that increase hapa effects.
In this study, we found significant positive spatial autocorrelations, indicating that hapas were
not independent of each other. If hapas were completely independent, there would have been
no spatial autocorrelations. This means that in pond B neighboring hapas resembled each
other more than in pond A. In field experiments, spatial autocorrelations may arise because of
the action of the spatial structure of the environment upon the response variable (Legendre et
al., 2004). Since families were randomized over the ponds, the observed spatial
autocorrelations indicate some variation in spatial patterning of environmental variables that
influence growth. The differences in spatial autocorrelations and in levels of dissolved
oxygen among ponds may have been due to variation in water circulation in the ponds. In
theory, estimates of heritability become reduced if environments are heterogeneous because
of increase in the environmental component of variance (Mitchell-Olds and Rutledge, 1986;
Simons and Roff, 1994). This may explain the lower heritability in the complete data set
compared to individual pond heritabilities, and the lower h2 estimates in pond B than in pond
A.
Fish growth is affected by severable variables, key among them being fish size, DO, and
water temperature, photoperiod, and food availability (Yi, 1999; and references therein).
Among all water quality parameters measured, only morning and afternoon DO, and
afternoon pH affected fish body weight (Table 3). Although one excellent attribute of tilapia
is their tolerance to low DO concentrations, extended periods of hypoxia may reduce growth
(Chervinski, 1982) and cause mortality (Coche, 1982). However, we did not find any
differences in survival between ponds or treatments in this study. Because feed conversion in
fish directly depends on oxygen availability, food and oxygen are two interrelated factors that
act to limit growth (Adelman and Smith, 1970; Brett, 1979; Buentello et al., 2000). This
Chapter 2 ___________________________________________________________________________
36
indicates that the differences of body weight between ponds had to do with the amount of DO
available in the hapas and ponds. We twice weekly measured the amount of morning and
afternoon DOs directly in each hapa. Although we did not find significant correlations
directly between hapa effects (i.e. the hapa solutions from Model 1) and DO in the hapas, we
found highly significant correlations between DO and mean fry body weights. In ponds, DO
is mostly influenced by aeration type and the nature of pond bottoms (Milstein et al., 2001).
The amount of DO in hapas largely reflected the levels of DO in the pond. The resultant high
spatial heterogeneity and low growth in pond B is likely to be due to differences in pond
bottoms, since pond A had recently been excavated of pond mud.
In the present study, we found some evidence that DO might be a major factor causing GXE.
However, Wild et al. (1994) urged for caution in attributing GXE to specific environmental
factors because all variables at any particular site add up to the total “net effect” on a trait.
Nevertheless, the differences in performance of the same families observed in the two ponds
in the present study suggest that some tilapia genotypes may tolerate stressful conditions such
as low dissolved oxygen better than others. The observed GXE interaction, although
inconclusive, hints to the potential for selecting for tilapia strains that are tolerant to low
dissolved oxygen. Macaranas et al. (1997) suggested that GXE interactions are best
investigated in market-sized fish. However, juvenile fish may as well be considered to be
close to marketing when they are sold as fish seed. The differences in growth performance of
genetically identical fry may portend economic losses in the poorer nursing environments.
This is of great relevance for poor farmers who cannot improve aeration in their nursing
ponds. Furthermore, it is not known how poorer growth performance during the nursing stage
affects subsequent grow-out performance.
5. Acknowledgements
This study is part of the first author’s Ph.D. study, funded by INREF-Pond, Wageningen
University (www.inref-pond.org) and the World Fish Center. We acknowledge the staff of
The WorldFish Centre, Abbassa, Egypt for providing the necessary help and facilities during
the experiments.
Factors affecting early growth of Nile tilapia ___________________________________________________________________________
37
References
Adelman, I.R., Smith, L.L., 1970. Effect of oxygen on growth and food conversion efficiency
of northern pike. Prog. Fish. Cult. 32, 93-96.
Bentsen, H.B., Eknath, A.E., Palada-de Vera, M.S., Reyes, R.A., Dionisio, E.E., Longalong,
F.M., Circa, A.V., Tayamen, M.M., Gjerde, B., 1998. Genetic improvement of farmed
tilapia: growth performance in a complete diallel cross experiment with eight strains
of Oreochromis niloticus. Aquaculture 160, 145-173.
Bowen, S.H., 1981. Digestion and assimilation of periphytic detrital aggregate by Tilapia
mossambica. Trans. Am. Fish. Soc. 110, 239-245.
Brett, J.R., 1979. Environmental factors and growth. In: W.S. Hoar, D.J. Randall and J.R.
Brett (Editors), Fish Physiology. Vol. VIII, Bioenergetics and Growth. Academic
Press, New York, NY, pp. 599-675.
Buentello, J.A., Gatlin III, D.M., Neill, W.H., 2000. Effects of water temperature and
dissolved oxygen on daily feed consumption, feed utilization and growth of channel
catfish (Ictalurus punctatus). Aquaculture 182, 339-352.
Charo-Karisa, H., Rezk, M. A., Bovenhuis, H., Komen, H., 2005. Heritability of cold
tolerance in Nile tilapia, Oreochromis niloticus, juveniles. Aquaculture 249, 115-123.
Chervinski, J., 1982. Environmental physiology of tilapias. In: R.S.V. Pullin and R.H. Lowe-
McConell (Eds.), The Biology and culture of Tilapia. ICLARM Conference
Proccedings 7. International Center for Living Aquatic Resources Management,
Manila, Philippines, pp. 119-128.
Cho, C.Y., Kaushik, S.J., 1985. Effect of protein intake on metabolizable and net energy
values of fish diets. In: C.B. Cowey, A.M. Mackie and J.G. Bell (Eds.), Nutrition and
Feeding in Fish, pp. 95-117. Academic Press, London, UK.
Coche, A.G., 1982. Cage culture of tilapias. In: R.S.V. Pullin and R.H. Lowe-McConell
(Eds.), The Biology and culture of Tilapia. ICLARM Conference Proccedings 7.
International Center for Living Aquatic Resources Management, Manila, Philippines,
pp. 205-246.
Ernst, D.H., Ellingson, L.J., Olla, B.L., Wicklund, W.I., Watanabe, W.O., Grover, J.L., 1989.
Production of Florida red tilapia in seawater pools: nursery rearing with chicken
manure and growout with prepared feed. Aquaculture 80, 247-260.
Falconer, D.S., 1989. Introduction to quantitative genetics. Longman, London.
Chapter 2 ___________________________________________________________________________
38
Falconer, D.S., 1990. Selection in different environments: effects on environmental
sensitivity (reaction norm) and on mean performance. Genet. Res. Camb. 56, 57-70.
Falconer, D.S., Mackay, T.F.C., 1996. Introduction to Quantitative Genetics. Longman,
London.
Garant, D., Dodson, J.J., Bernatchez, L., 2003. Differential reproductive success and
heritability of alternative reproductive tactics in wild Atlantic salmon (Salmo salar
L.). Evolution 57, 1133-1141.
Gilmour, A.R., Gogel, B.J., Cullis, B.R., Welham, S.J., Thompson, R., 2002. ASReml User
Guide Release 1.0 VSN International Ltd, Hemel Hempstead, HP11ES, UK.
Legendre, P., Dale, M.R.T., Fortin, M-J., Casgrain, P., Gurevitch, J., 2004. Effects of spatial
structures on the results of field experiments. Ecology 85, 3202-3214.
Little, D., Innes-Taylor, N., Turongruang, D., Sollows, J., 2003a. Fry nursing in rice-fish
systems. Integrated agriculture-aquaculture: A primer. FAO Fisheries Technical Paper
no. 407, pp. 150-153.
Little, D.C., Bhujel, R.C., Pham, T.A., 2003b. Advanced nursing of mixed-sex and mono-sex
tilapia (Oreochromis niloticus) fry, and its impact on subsequent growth in fertilized
ponds. Aquaculture 221, 265-276.
Macaranas, J.M., Mather, P.B., Lal, S.N., Vereivalu, T., Lagibalavu, M., Capra, M.F., 1997.
Genotype and environment: A comparative evaluation of four tilapia stocks in Fiji.
Aquaculture 150, 11-24.
Merila, J., 1997. Expression of genetic variation in body size of the Collared Flycatcher under
different environmental conditions. Evolution 51, 526-536.
Milstein, A., Zoran, M., Kochba, M., Avnimelech, Y., 2001. Effect of different management
practices on water quality of intensive tilapia culture systems in Israel. Aquacult. Int.
9, 133-152.
Mitchell-Olds, T., Rutledge, J.J., 1986. Quantitative genetics in natural plant populations: a
review of the theory. Am. Nat. 127, 379-402.
Moriarty, D.J.W., Moriarty, C.M., 1973. The assimilation of carbon from phytoplankton by
two herbivorous fishes: Tilapia nilotica and Haplochromis nigripinnis. J. Zool. 171,
41-55.
Factors affecting early growth of Nile tilapia ___________________________________________________________________________
39
Ponzoni, R.W., Hamzah, A., Tan, S., Kamaruzzaman, H., 2005. Genetic parameters and
response to selection for live weight in the GIFT strain of Nile tilapia (Oreochromis
niloticus). Aquaculture 247, 203-210.
Rezk, M.A., Kamel, E.A., Ramadan, A.A., Dunham, R.A., 2002. Comparative growth of
Egyptian tilapias in response to declining water temperature. Aquaculture 207, 239-
247.
Rezk, M.A., Kamel, E.A., Dawood, T.I., Dunham, R.A., 2004. Heritability estimates for
some important traits in Egyptian Nile tilapia, Oreochromis niloticus. In:
Aquaculture-An Ecologically sustainable and Profitable venture, World Aquaculture
Society Conference Proceedings, 1-5 March 2004, Honolulu, Hawaii, USA.
Aquaculture 2004 Book of Abstracts, 708pp.
Ricker, W.E., 1975. Computation and interpretation of biological statistics of fish
populations. Bull. Fish Res. Bd. Can. 191, 209-210.
Riley, J., Edwards, P., 1998. Statistical aspects of aquaculture research: pond variability and
pseudoreplication. Aquaculture Research 29, 281-288.
Romana-Eguia, M.R.R., Doyle, R.W., 1992. Genotype-environment interaction in the
response of three strains of Nile tilapia to poor nutrition. Aquaculture 108, 1-12.
Rutten, M.J.M., Komen, H., Bovenhuis, H., 2005. Longitudinal genetic analysis of Nile
tilapia (Oreochromis niloticus L.) body weight using a random regression model.
Aquaculture 246, 101-113.
Sanches, L.E.F., Hayashi, C., 1990. Stocking density effect on Nile tilapia (Oreochromis
niloticus L.) fry. Acta Scient. 21, 619-625.
SAS Institute, 1989. User’s Guide: Statistics, Release 6.12 Edition, SAS Institute, Cary, NC.
Simons, A.M., Roff, D.A., 1994. The effect of environmental variability on the heritabilities
of traits of a field cricket. Evolution 48, 1637-1649.
Smart, T., Riley, J., Haylor, G., 1997. Eliminating pond differences with cross-over designs.
Aquac. Res.2 8, 621-627.
Spataru, P., Wohlfarth, G.W., Hulata, G., 1983. Studies on the natural food of different fish
species in intensively manured polyculture ponds. Aquaculture 35, 283-298.
Sylven, S., Rye, M., Simianer, H., 1991. Interaction of genotype with production
environment for slaughter weight in rainbow trout (Oncorhynchus mykiss). Livest.
Prod. Sci. 28, 253-263.
Chapter 2 ___________________________________________________________________________
40
Tave, D., Smitherman, R.O., 1980. Predicted response to selection for early growth in Tilapia
nilotica. Trans. Am. Fish. Soc. 109, 439-445.
Teichert-Coddington, D.R., Smitherman, R.O., 1988. Lack of response by Tilapia nilotica to
mass selection for rapid early growth. Trans. Am. Fish. Soc. 117, 297-300.
Via, S., 1984. The quantitative genetics of polyphagy in an insect herbivore. II. Genetic
correlations in larval performance within and among host plants. Evolution 38, 896-
905.
Wild, V, Simianer, H., Gjøen, H.M., Gjerde, B., 1994. Genetic parameters and genotype x
environment interaction for early sexual maturity in Atlantic salmon (Salmo salar).
Aquaculture 128, 51-65.
Yi, Y., 1999. Modeling growth of Nile tilapia (Oreochromis niloticus) in a cage-cum-pond
integrated culture system. Aquacult. Eng. 21, 113-133.
Chapter 3
Heritability of cold tolerance in Nile tilapia
(Oreochromis niloticus) juveniles
Harrison Charo-Karisaa,b,c, Mahmoud A. Rezkc, Henk Bovenhuisb,
Hans Komenb
a Fish Culture and Fisheries Group, Wageningen Institute of Animal Sciences (WIAS), Wageningen
University, P.O. Box 338, 6700 AH, Wageningen, The Netherlands
b Animal Breeding and Genetics Group, Wageningen Institute of Animal Sciences (WIAS), Wageningen
University, P.O. Box 338, 6700 AH, Wageningen, The Netherlands
c Regional Center for Africa and West Asia, The World Fish Center, Abbassa, Abou Hammad, Egypt
Aquaculture (2005), 249: 115-123
Chapter 3 ____________________________________________________________________________
42
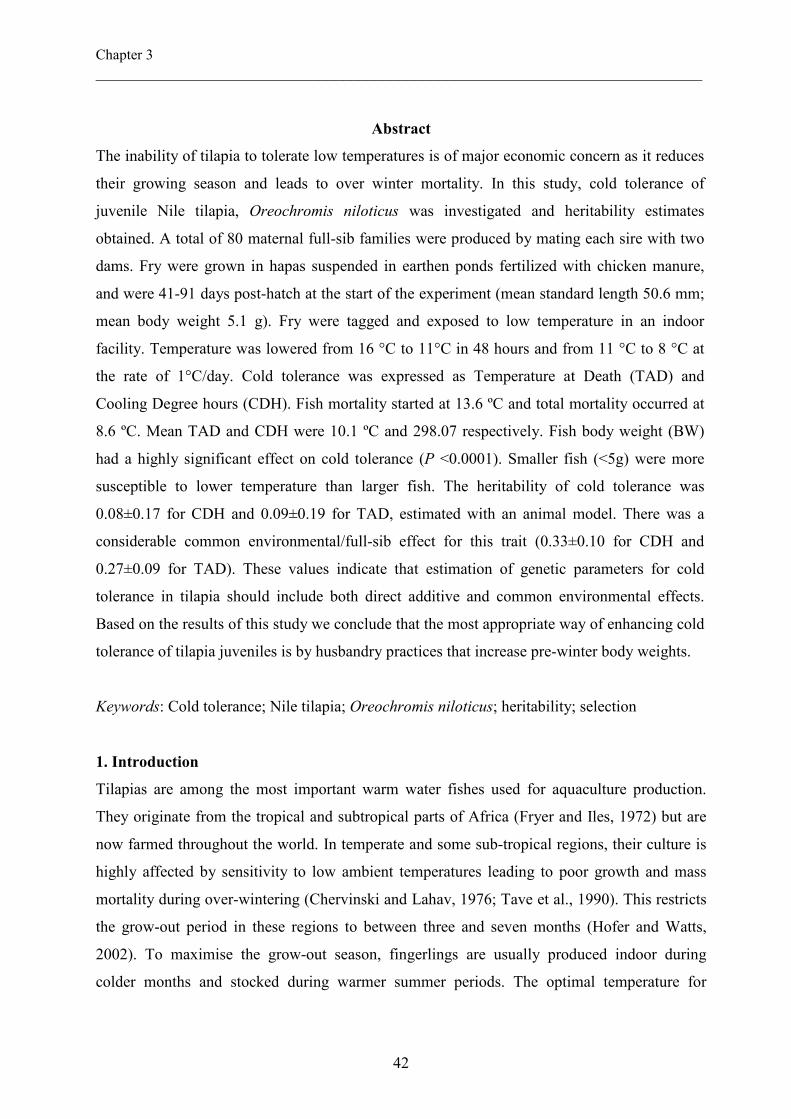
Abstract
The inability of tilapia to tolerate low temperatures is of major economic concern as it reduces
their growing season and leads to over winter mortality. In this study, cold tolerance of
juvenile Nile tilapia, Oreochromis niloticus was investigated and heritability estimates
obtained. A total of 80 maternal full-sib families were produced by mating each sire with two
dams. Fry were grown in hapas suspended in earthen ponds fertilized with chicken manure,
and were 41-91 days post-hatch at the start of the experiment (mean standard length 50.6 mm;
mean body weight 5.1 g). Fry were tagged and exposed to low temperature in an indoor
facility. Temperature was lowered from 16 °C to 11°C in 48 hours and from 11 °C to 8 °C at
the rate of 1°C/day. Cold tolerance was expressed as Temperature at Death (TAD) and
Cooling Degree hours (CDH). Fish mortality started at 13.6 ºC and total mortality occurred at
8.6 ºC. Mean TAD and CDH were 10.1 ºC and 298.07 respectively. Fish body weight (BW)
had a highly significant effect on cold tolerance (P <0.0001). Smaller fish (<5g) were more
susceptible to lower temperature than larger fish. The heritability of cold tolerance was
0.08±0.17 for CDH and 0.09±0.19 for TAD, estimated with an animal model. There was a
considerable common environmental/full-sib effect for this trait (0.33±0.10 for CDH and
0.27±0.09 for TAD). These values indicate that estimation of genetic parameters for cold
tolerance in tilapia should include both direct additive and common environmental effects.
Based on the results of this study we conclude that the most appropriate way of enhancing cold
tolerance of tilapia juveniles is by husbandry practices that increase pre-winter body weights.
Keywords: Cold tolerance; Nile tilapia; Oreochromis niloticus; heritability; selection
1. Introduction
Tilapias are among the most important warm water fishes used for aquaculture production.
They originate from the tropical and subtropical parts of Africa (Fryer and Iles, 1972) but are
now farmed throughout the world. In temperate and some sub-tropical regions, their culture is
highly affected by sensitivity to low ambient temperatures leading to poor growth and mass
mortality during over-wintering (Chervinski and Lahav, 1976; Tave et al., 1990). This restricts
the grow-out period in these regions to between three and seven months (Hofer and Watts,
2002). To maximise the grow-out season, fingerlings are usually produced indoor during
colder months and stocked during warmer summer periods. The optimal temperature for
Heritability of cold tolerance ___________________________________________________________________________________
43
growth of most tilapiine species is between 25- 28 °C. Reproduction stops at 22 °C and feeding
below 20 °C (Wohlfarth and Hulata, 1983). Tilapia cannot survive temperatures less than 10-
12 °C for more than a few days (Chervinski, 1982).
A few studies have been carried out on the genetic basis of cold tolerance in tilapia. Wohlfarth
et al. (1983) and Cnaani et al. (2000) studying some tilapia species and their hybrids found that
a large component of the trait’s variance was a result of dominance effects. But in Nile tilapia,
Oreochromis niloticus, Tave et al. (1989, 1990) and Behrends et al. (1990) suggested that cold
tolerance is controlled by additive genes. However, the only estimate of heritability for cold
tolerance in O. niloticus reported so far was close to zero (-0.05; Behrends et al., 1996).
A collaborative project aimed at selecting for fast growth of O. niloticus in ponds is currently
being carried out by Wageningen University, The Netherlands, and The WorldFish Centre
(formerly ICLARM) Regional Centre for Africa and West Asia, Abbassa, Egypt. Abbassa is
located east of the Nile Delta, which experiences cold spells during winter. Knowledge and
improvement of the temperature tolerance of fingerlings could help extend the grow-out period
and reduce economic losses in this region. The main objective of this study was therefore to
estimate the heritability of cold tolerance in juveniles of O. niloticus.
2. Materials and methods
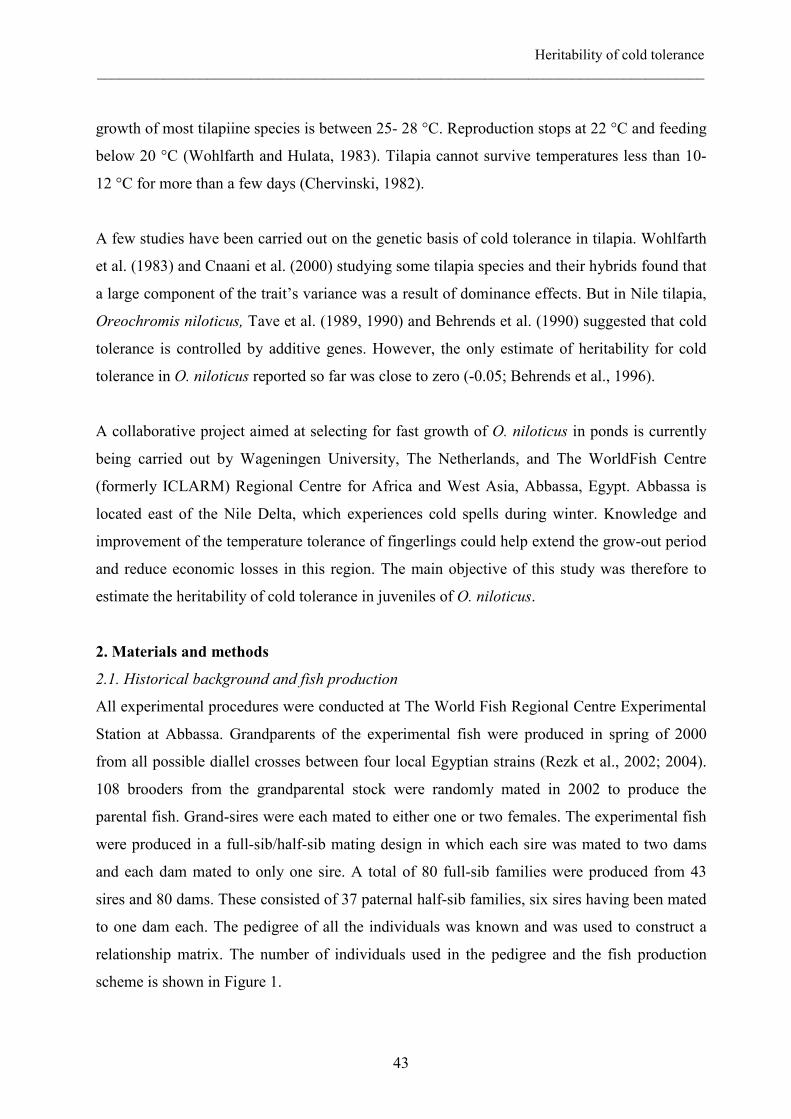
2.1. Historical background and fish production
All experimental procedures were conducted at The World Fish Regional Centre Experimental
Station at Abbassa. Grandparents of the experimental fish were produced in spring of 2000
from all possible diallel crosses between four local Egyptian strains (Rezk et al., 2002; 2004).
108 brooders from the grandparental stock were randomly mated in 2002 to produce the
parental fish. Grand-sires were each mated to either one or two females. The experimental fish
were produced in a full-sib/half-sib mating design in which each sire was mated to two dams
and each dam mated to only one sire. A total of 80 full-sib families were produced from 43
sires and 80 dams. These consisted of 37 paternal half-sib families, six sires having been mated
to one dam each. The pedigree of all the individuals was known and was used to construct a
relationship matrix. The number of individuals used in the pedigree and the fish production
scheme is shown in Figure 1.
Chapter 3 ____________________________________________________________________________
44
Fry were produced over a period of 60 days. During this period 60 fry from each full sib family
were reared in 80 separate 2 x 3 m hapas until the last family reached tagging size (mean of
2g). Hapas were set in two 1000 m2 earthen ponds that received a daily application of chicken
manure at the rate of 50kg/ha. No supplemental feeds were given throughout the growth
period. Fry were 41-91 days old at the beginning of the cold tolerance challenge.
Figure 1. Schematic presentation of production of experimental fish from four local Oreochromis niloticus strains from different parts of Egypt.
2.2. Cold tolerance challenge
From each full-sib family, 12 randomly chosen individual fry were tagged with Floy tags
between the dorsal fin and lateral line. Tagged fish were returned to hapas and allowed to
recover from tag stress for four days. Individual body weights and standard lengths were
recorded and then the fish (in groups of 5 families each in separate 1 x 1 m netting
compartments) were kept for one day in ceramic tanks at ambient temperature (20 ºC). On the
next day, ten healthy individuals from each family were randomly assigned to any two of five
450 l glass aquaria placed in a 1.8 by 3 m cold room served by a thermostatically controlled
chilling unit. The assignment was such that each aquarium in the end contained 160 fish, from
32 half-sib families. Each aquarium was constantly aerated using three air-stones connected to
an air-pump. The temperature of the aquarium water was adjusted to the desired level by
adjusting the compressor settings of the chiller. Fish were acclimatized to aquarium conditions
for 48 hours with water temperature maintained at 20 ºC.
Zawia, Maryout, Abbassa, Aswan
Diallel strain crosses
Grand parents (F1)
Parents (F2)
Experimental fish
1 2 3 5 4
-Rearing and tagging (40-90 days post-hatch) days)
-Aquaria allocation and experiments
2000
2002
2003
Production date
108
123
806
Number of animals
Heritability of cold tolerance ___________________________________________________________________________________
45
Aquarium water temperature was monitored each hour from the beginning to the end of the
experiment. Apart from the hourly temperature measurements, dissolved oxygen (DO), pH,
total ammonia, nitrate and nitrite, were measured once a day, using a WTW® multi 340i meter
and HACH kits. Dissolved oxygen ranged between 6.1-10.3 mg/l; pH, 7.9-8.3; ammonia, 0.01-
0.1 mg/l; nitrate, 0.5-2 mg/l; and nitrite, 0.01-0.02 mg/l. Aquaria were cleaned twice daily by
suction to remove faeces. Water that was removed during aquarium cleaning was replaced with
clean water pre-cooled to the same temperature with ice cubes.
Fish were not fed during the experiment. Temperature was first lowered to 16 ºC within 48
hours, and then to 11 ºC within the next 48 hours. From 11°C to the end of the experiment,
water temperature was reduced at a rate of 1°C per day. Aquaria were observed once each hour
for any fish mortality. Death was defined as the point at which fish lost balance, fell on their
side and ceased fin, body and opercula movements and lost response to external stimuli.
Throughout the experiment, dead fish were removed from the tanks at the end of each hour
with a scoop net, and their tag and aquarium numbers recorded. Mortality was recorded hourly
for each fish, which enabled us to quantify cooling degree hours (CDH) in line with Cnaani et
al. (2000): the sum of hours the fish survived multiplied by the difference between the hourly
and initial temperature for each fish. As in earlier studies (Behrends et al., 1996; Cnaani et al.,
2000; 2003), the initial temperature for calculation of cooling degree hours (CDH) was set at
16 ºC. Temperature at death (TAD), recorded hourly, was used in this study as a second
measure of cold tolerance.
2.3. Data analysis
Initially, the effect of age, aquarium, sire, dam and size (body weight and standard length) on
cold tolerance was tested using the GLM procedure of SAS (1989). Due to the high correlation
between body weight and length, standard length was not included in the final model. The
following model was eventually fitted using Proc GLM in SAS:
Yijkl = µ + ai + β1*AGEijkl + β2*ln(wijkl) +sj + dk(sj) + eijkl (Model 1)
Where Yijkl = cooling degree hours or temperature at death for an individual, µ= overall mean,
ai = fixed effect of aquarium (i= 1, 2, 3, 4, 5), β1= regression coefficient of age; AGEijkl = a co-
Chapter 3 ____________________________________________________________________________
46
variable of age of the lth individual; β2 = regression coefficient of natural logarithm of body
weight, ln(w ijkl) = a co-variable of natural logarithm of body weight of an individual, sj= effect
of the jth sire, dk(sj) = effect of the kth dam nested within the jth sire, and eijkl = random residual
effect associated with an individual.
Estimation of heritability was performed using the ASREML package (Gilmour et al., 2002).
The individual (animal) model was used to estimate genetic parameters using all the
experimental fish and their relatives. A pedigree file with the relationship between the
experimental fish, their parents and grandparents was included in the analysis. The fitted model
was
Yijk = µ + ai + β*AGEijk + dj + uk + eijk (Model 2)
where Yijk is CDH, TAD or natural logarithm of body weight (LnBW); µ is the overall mean; ai
is a fixed effect of aquarium (i = 1, 2, 3, 4, 5); β is a regression coefficient of age; AGEijk is the
effect of age on observation ijk; uk is a random additive genetic effect of the kth individual; dj
is a random effect for full-sib group j, and eijk is a random residual effect associated with
observation ijk. For the analysis of cold tolerance traits (CHD or TAD), Model 2 was then
modified by including the natural logarithm of body weight as a co-variable to correct for
weight differences. The heritability was calculated as the ratio between animal genetic variance
and the total phenotypic variance. The common environmental/ full-sib effect was computed as
the ratio between the dam variance and the total phenotypic variance. This may also contain a
quarter of the non-additive genetic effects, and includes environmental effects caused by
separate rearing of full-sib families until tagging. Phenotypic and genetic correlations between
CDH and TAD and natural logarithm of body weight were estimated in bivariate animal model
analyses using the variance components from the univariate analyses of CDH and TAD as
starting values. The model included both the additive genetic and common environmental/ full-
sib effects together with age and aquaria effects (Model 2).
3. Results
Cold tolerance values and fish size measurements are shown in Table 1. Mean TAD and CDH
were 10.1 ºC and 298.07 respectively. There was a much higher phenotypic variation in cold
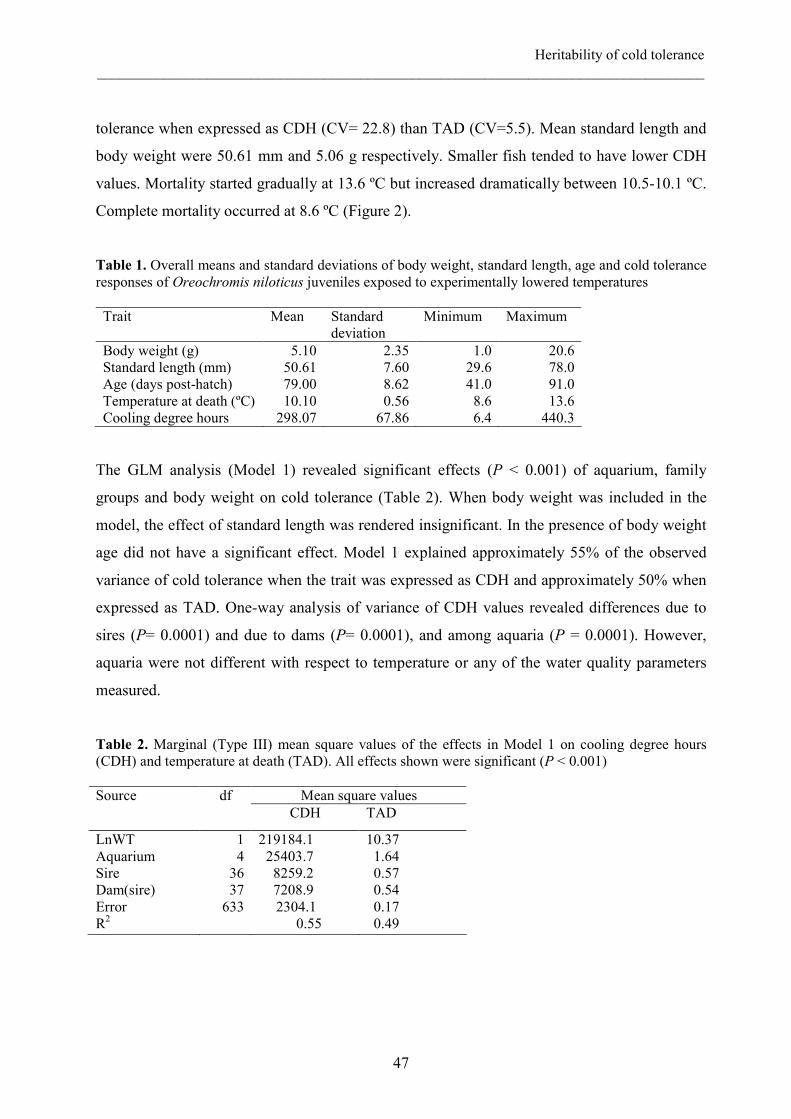
Heritability of cold tolerance ___________________________________________________________________________________
47
tolerance when expressed as CDH (CV= 22.8) than TAD (CV=5.5). Mean standard length and
body weight were 50.61 mm and 5.06 g respectively. Smaller fish tended to have lower CDH
values. Mortality started gradually at 13.6 ºC but increased dramatically between 10.5-10.1 ºC.
Complete mortality occurred at 8.6 ºC (Figure 2).
Table 1. Overall means and standard deviations of body weight, standard length, age and cold tolerance responses of Oreochromis niloticus juveniles exposed to experimentally lowered temperatures Trait Mean Standard
deviation Minimum Maximum
Body weight (g) Standard length (mm) Age (days post-hatch) Temperature at death (ºC) Cooling degree hours
5.10 50.61 79.00 10.10 298.07
2.35 7.60 8.62 0.56 67.86
1.0 29.6 41.0 8.6 6.4
20.6 78.0 91.0 13.6 440.3
The GLM analysis (Model 1) revealed significant effects (P < 0.001) of aquarium, family
groups and body weight on cold tolerance (Table 2). When body weight was included in the
model, the effect of standard length was rendered insignificant. In the presence of body weight
age did not have a significant effect. Model 1 explained approximately 55% of the observed
variance of cold tolerance when the trait was expressed as CDH and approximately 50% when
expressed as TAD. One-way analysis of variance of CDH values revealed differences due to
sires (P= 0.0001) and due to dams (P= 0.0001), and among aquaria (P = 0.0001). However,
aquaria were not different with respect to temperature or any of the water quality parameters
measured.
Table 2. Marginal (Type III) mean square values of the effects in Model 1 on cooling degree hours (CDH) and temperature at death (TAD). All effects shown were significant (P < 0.001)
Mean square values Source
df CDH TAD
LnWT Aquarium Sire Dam(sire) Error R2
1 4 36 37 633
219184.1 25403.7 8259.2 7208.9 2304.1 0.55
10.37 1.64 0.57 0.54 0.17 0.49
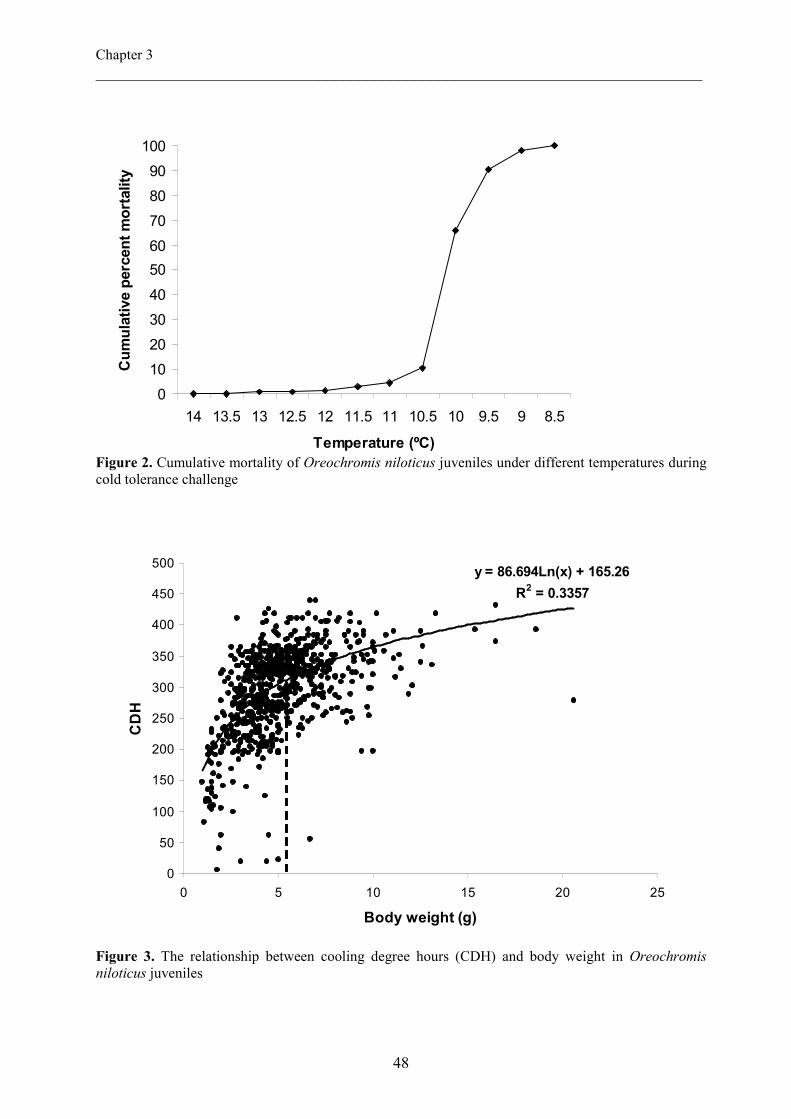
Chapter 3 ____________________________________________________________________________
48
0
10
20
30
40
50
60
70
80
90
100
14 13.5 13 12.5 12 11.5 11 10.5 10 9.5 9 8.5
Temperature (ºC)
Cumulative percent mortality
Figure 2. Cumulative mortality of Oreochromis niloticus juveniles under different temperatures during cold tolerance challenge
y = 86.694Ln(x) + 165.26
R2 = 0.3357
0
50
100
150
200
250
300
350
400
450
500
0 5 10 15 20 25
Body weight (g)
CDH
Figure 3. The relationship between cooling degree hours (CDH) and body weight in Oreochromis niloticus juveniles
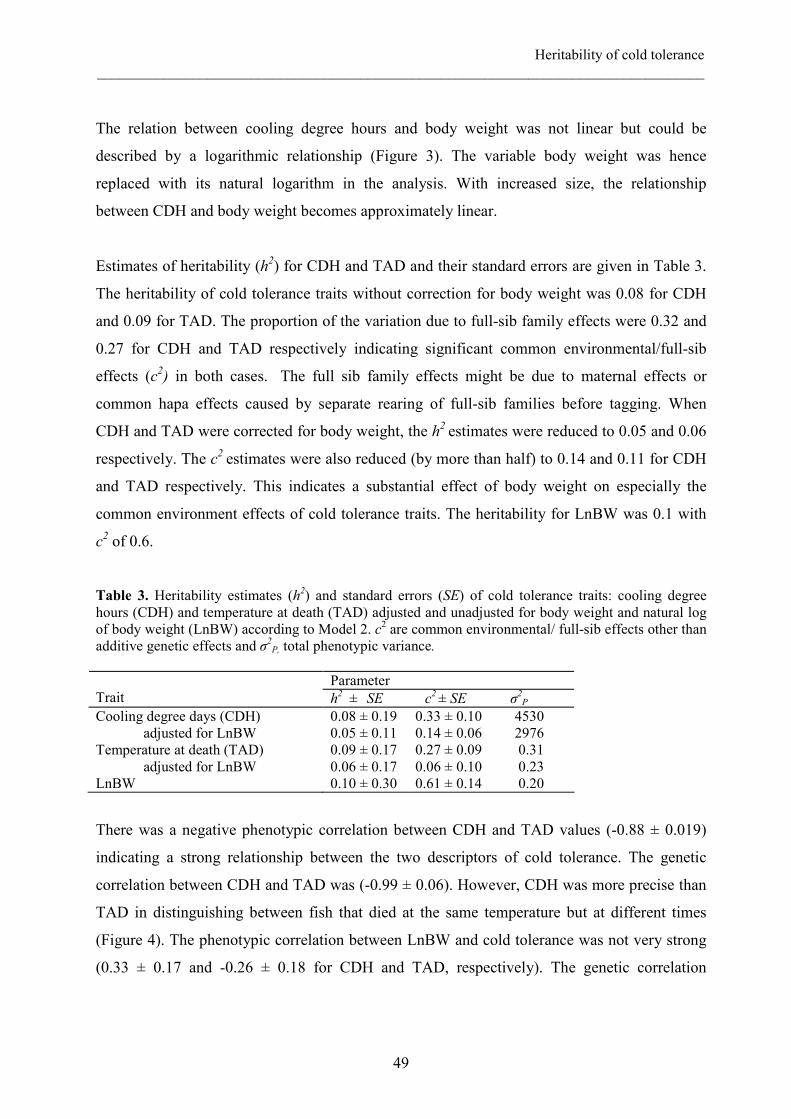
Heritability of cold tolerance ___________________________________________________________________________________
49
The relation between cooling degree hours and body weight was not linear but could be
described by a logarithmic relationship (Figure 3). The variable body weight was hence
replaced with its natural logarithm in the analysis. With increased size, the relationship
between CDH and body weight becomes approximately linear.
Estimates of heritability (h2) for CDH and TAD and their standard errors are given in Table 3.
The heritability of cold tolerance traits without correction for body weight was 0.08 for CDH
and 0.09 for TAD. The proportion of the variation due to full-sib family effects were 0.32 and
0.27 for CDH and TAD respectively indicating significant common environmental/full-sib
effects (c2) in both cases. The full sib family effects might be due to maternal effects or
common hapa effects caused by separate rearing of full-sib families before tagging. When
CDH and TAD were corrected for body weight, the h2 estimates were reduced to 0.05 and 0.06
respectively. The c2 estimates were also reduced (by more than half) to 0.14 and 0.11 for CDH
and TAD respectively. This indicates a substantial effect of body weight on especially the
common environment effects of cold tolerance traits. The heritability for LnBW was 0.1 with
c2 of 0.6.
Table 3. Heritability estimates (h2) and standard errors (SE) of cold tolerance traits: cooling degree hours (CDH) and temperature at death (TAD) adjusted and unadjusted for body weight and natural log of body weight (LnBW) according to Model 2. c2 are common environmental/ full-sib effects other than additive genetic effects and σ2P, total phenotypic variance.
Parameter Trait h2 ±
SE
c2 ± SE σ
2P
Cooling degree days (CDH) adjusted for LnBW Temperature at death (TAD) adjusted for LnBW LnBW
0.08 ± 0.19 0.33 ± 0.10 4530 0.05 ± 0.11 0.14 ± 0.06 2976 0.09 ± 0.17 0.27 ± 0.09 0.31 0.06 ± 0.17 0.06 ± 0.10 0.23 0.10 ± 0.30 0.61 ± 0.14 0.20
There was a negative phenotypic correlation between CDH and TAD values (-0.88 ± 0.019)
indicating a strong relationship between the two descriptors of cold tolerance. The genetic
correlation between CDH and TAD was (-0.99 ± 0.06). However, CDH was more precise than
TAD in distinguishing between fish that died at the same temperature but at different times
(Figure 4). The phenotypic correlation between LnBW and cold tolerance was not very strong
(0.33 ± 0.17 and -0.26 ± 0.18 for CDH and TAD, respectively). The genetic correlation
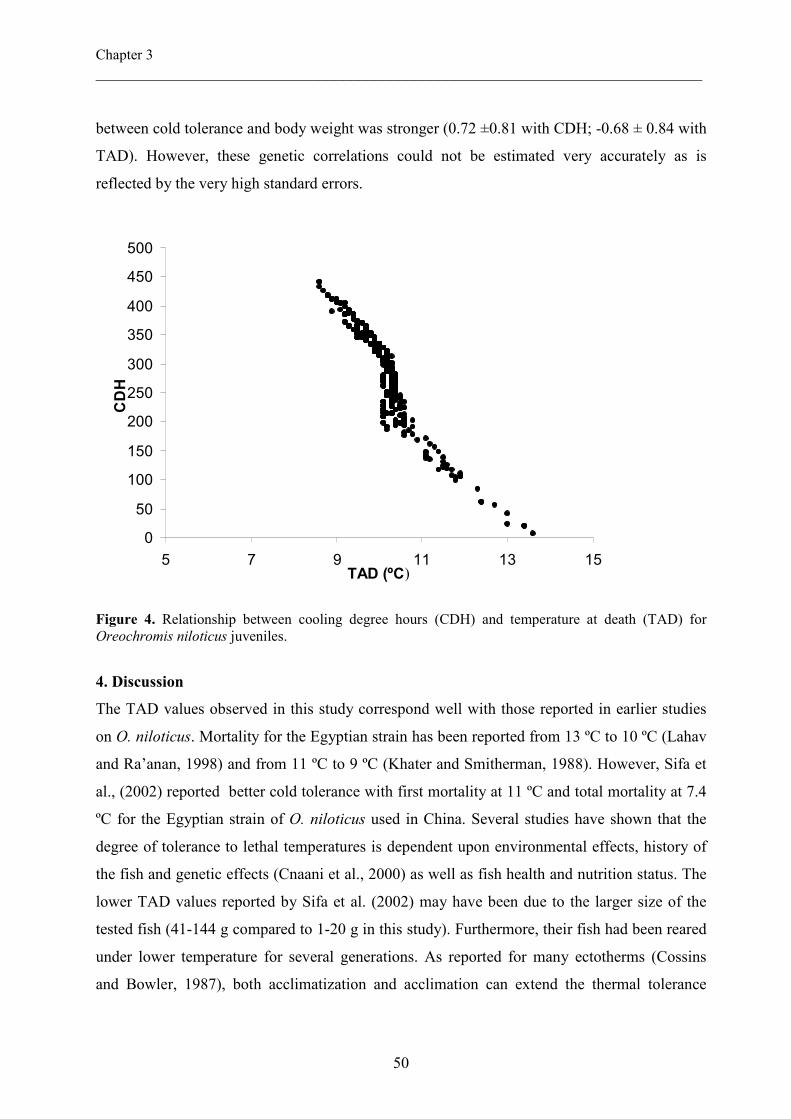
Chapter 3 ____________________________________________________________________________
50
between cold tolerance and body weight was stronger (0.72 ±0.81 with CDH; -0.68 ± 0.84 with
TAD). However, these genetic correlations could not be estimated very accurately as is
reflected by the very high standard errors.
0
50
100
150
200
250
300
350
400
450
500
5 7 9 11 13 15TAD (ºC)
CDH
Figure 4. Relationship between cooling degree hours (CDH) and temperature at death (TAD) for Oreochromis niloticus juveniles.
4. Discussion
The TAD values observed in this study correspond well with those reported in earlier studies
on O. niloticus. Mortality for the Egyptian strain has been reported from 13 ºC to 10 ºC (Lahav
and Ra’anan, 1998) and from 11 ºC to 9 ºC (Khater and Smitherman, 1988). However, Sifa et
al., (2002) reported better cold tolerance with first mortality at 11 ºC and total mortality at 7.4
ºC for the Egyptian strain of O. niloticus used in China. Several studies have shown that the
degree of tolerance to lethal temperatures is dependent upon environmental effects, history of
the fish and genetic effects (Cnaani et al., 2000) as well as fish health and nutrition status. The
lower TAD values reported by Sifa et al. (2002) may have been due to the larger size of the
tested fish (41-144 g compared to 1-20 g in this study). Furthermore, their fish had been reared
under lower temperature for several generations. As reported for many ectotherms (Cossins
and Bowler, 1987), both acclimatization and acclimation can extend the thermal tolerance
Heritability of cold tolerance ___________________________________________________________________________________
51
range of organisms.
We observed significant differences among families (Table 2) suggesting the existence of
genetic variation for cold tolerance. The base population was bred from fish originating from
four different parts of Egypt. These populations also exhibited differences in growth
performance (Elghobashy, 2001; Rezk et al., 2002). Studies have shown that intra-specific
evolution of thermal sensitivity is related to growth rate in fish. Generally, fish from higher
latitudes grow relatively faster at lower temperatures than fish from low latitudes (Angilletta et
al., 2002). Determination of the nature and presence of trade-offs between the two traits may be
a first step towards simultaneously selecting for both growth and cold tolerance.
We found a significant aquaria effect on cold tolerance in this study (for example with CDH as
response variable, the BLUE (estimated from Model 2) ranged from -11.6 to +24.5). However,
aquaria did not differ in either their water quality or temperature. The significant aquarium
effect may have been caused by aquaria position relative to the chiller in the cold room. The
two aquaria that were exposed to direct cold draught also recorded relatively lower mean CDH
values. This indicates the existence of a substantial effect of direct cold currents. Cold winds
have been reported, in Taiwan, as a major cause of mass mortalities of cultured tropical fish
including milkfish and tilapia (Wu et al., 1998). This suggests that the practice of controlling
winter winds by some fish farmers may have a positive effect on fish over-winter survival.
The existence of size-dependent over-winter mortality has been reported for many freshwater
and marine fishes, with smaller individuals being more susceptible than larger conspecifics
(Sogard, 1997). The effect of size on cold tolerance has been reported as non-significant for
several tilapia species and their hybrids (Behrends et al., 1990; Cnaani et al., 2000; 2003).
However, Hofer and Watts (2002) noted that smaller fingerlings, below 5 g, were more
susceptible to acute exposure to lower temperatures stress. Atwood et al. (2003), working with
larger fish indicated that size significantly affected cold tolerance in O. niloticus. The very high
marginal mean square effect for body weight in this study (Table 2) indicates a strong impact
of weight on cold tolerance. Our study also indicates that smaller fish (<5g) are more
susceptible (Figure 3).
Chapter 3 ____________________________________________________________________________
52
Cold tolerance as a trait has been variously described. It has been described as low lethal
temperature or temperature at death (TAD) (Khater and Smitherman, 1988; Behrends et al.,
1990; Atwood et al., 2003). It has also been described as cooling degree days (CDD) or
cumulative degree hours (CDH) (Behrends et al., 1990; Cnaani et al., 2000; Atwood et al.,
2003) or simply as “number of days until death” (Tave et al., 1989). CDD and CDH
incorporate time and temperature at which death occurs in such a way as to distinguish fish that
die at the same temperature but at different times. This makes them more precise than TAD
and number of days until death. CDH gives a better determination of cold tolerance than CDD
because temperature is measured at shorter time intervals. The high correlation between the
hourly TAD and CDH values indicates that both describe cold tolerance in a similar manner.
CDH however, has a better resolution (and higher variation) than TAD and should be used for
description of quantitative genetic parameters for cold tolerance.
Results of this study indicate low (0.08) heritability for cold tolerance trait in O. niloticus
juveniles. These estimates are lower than the realized heritability estimates of 0.33 for O.
aureus and 0.31 for the O. aureus X O. niloticus hybrids obtained by Behrends et al. (1996).
However, they are within the range of the realised estimates of -0.05 to 0.31 for O. niloticus
(Behrends et al., 1996). Estimates of realized heritability can be obtained from selection
experiments using the response/ selection differential ratio or the standard least square
procedures (Becker, 1984). Such estimates may be biased by failure to account for genetic or
environmental sources of variation like maternal effects (Hill, 1972a, b; Johnson et al., 2002).
In this study we found a substantial amount of common environmental/ full-sib effects. A
strong maternal component of cold tolerance has been reported for O. aureus and its hybrids
(Lee, 1979). Tave et al. (1989) reported a slight effect of egg cytoplasm in increasing cold
tolerance but reported insignificant strain maternal effects in O. niloticus. When the CDH and
TAD were corrected for body weight in this study, the common environmental/ full-sib effect
was significantly reduced. This effect is likely to have increased due to body weight
differences.
This study indicates low heritability and substantial common environmental or maternal effects
on cold tolerance in O. niloticus. In the present study common environmental and maternal
effects are confounded and therefore we cannot distinguish between them. Considering earlier
Heritability of cold tolerance ___________________________________________________________________________________
53
work (Tave et al., 1989), maternal effects may have been present in this study. This indicates
that to precisely predict cold tolerance of tilapia progeny a model containing direct additive and
common environmental/ full-sib or maternal effects rather than only direct effects is most
appropriate. Since c2 is expected to reduce with time, this aspect might affect heritability
estimates for larger fish. However, mortality of juveniles is of a greater concern in tilapia
culture and therefore interest is in heritability estimates in juveniles. It has been shown that
rearing conditions can have a significant impact on cold tolerance of tilapia (Cnaani et al.,
2003; Charo-Karisa et al., 2004). Since hapa effects increase c2 for body weight and
consequently cold tolerance, rearing juveniles in a single large hapa or pond could reduce c2.
Cold tolerance can be enhanced by improvement of husbandry practices (environmental or
dietary) that ensure optimal fry body weight before onset of winter. We could not obtain
accurate estimates for genetic correlation between cold tolerance and body weight from our
data probably due to the limited number of observations. Cnaani et al. (2003) found significant
association between two QTL for cold tolerance and body weight within the same linkage
group but the two QTL were approximately 22cM apart. Results from the present study suggest
that selection for higher body weight does not have any negative consequences for cold
tolerance. However, genetic correlations could not be estimated very accurately and further
research is needed to more accurately ascertain the genetic relationship between these traits.
5. Acknowledgements
This study is part of the first author’s Ph.D. study, funded by INREF-Pond, Wageningen
University (www.inref-pond.org) and the World Fish Center. We acknowledge the staff of The
WorldFish Centre, Abbassa, Egypt for providing the necessary help and facilities during the
experiment.
References
Angilletta Jr., M.J., Niewiarowski, P.H., Navas, C.A., 2002. The evolution of thermal
physiology in ectotherms. J. Therm. Biol. 27, 249-268.
Atwood, H.L., Tomasso, J.R., Webb, K., Gatlin III, D.M., 2003. Low-temperature tolerance of
Nile tilapia, Oreochromis niloticus: effects of environmental and dietary factors.
Aquaculture 34, 41-251.
Chapter 3 ____________________________________________________________________________
54
Becker, W.A., 1984. Manual of Quantitative Genetics. Academic Enterprises, Pullman, WA,
SA.
Behrends, L.L., Kingsley, J.B., Bulls, M.J., 1990. Cold tolerance in maternal mouthbrooding
tilapias: phenotypic variation among species and hybrids. Aquaculture 85, 271–280.
Behrends, L.L., Kingsley, J.B., Bulls, M.J., 1996. Cold tolerance in maternal mouthbrooding
tilapias: heritability estimates and correlated growth responses at suboptimal
temperatures. In: Pullin, R.S.V., Lazard, J. M., Legendre, J.B., Kothias, A., Pauly, D.,
(Eds.). The Third International Symposium on Tilapia in Aquaculture, ICLARM
Conference Proceedings 41, pp. 257-265.
Charo-Karisa, H., Rezk, M.A., Bovenhuis, H., Komen, H., 2004. Effects of rearing conditions
on low-temperature tolerance of Nile tilapia, Oreochromis niloticus juveniles. In:
Bolivar, R., Mair, G., Fitzsimmons, K., (Eds.), New Dimensions in Farmed Tilapia.
Proceedings of the 6th International Symposium on Tilapia in Aquaculture, Manila, pp.
30-41.
Chervinski, J., 1982. Environmental physiology of tilapias. In: Pullin, R.S.V., Lowe-
McConnell R.H., (Eds.), The Biology and Culture of Tilapias. ICLARM Conference
Proceedings 7, International Centre for Living Aquatic Resources Management,
Manila, pp. 119-128.
Chervinski, J., Lahav, M., 1976. The effect of exposure to low temperature on fingerlings of
local tilapia (Tilapia aurea) (Steindacher) and imported tilapia (Tilapia vulcani)
(Trewavas) and Tilapia nilotica (Linne) in Israel. Bamidgeh 28, 25-29.
Cnaani, A., Gall, G.A.E., Hulata, G., 2000. Cold tolerance of tilapia species and hybrids.
Aquac. Int. 8, 289-298.
Cnaani, A., Hallerman, E. M., Rona, M., Wellera, J. I., Indelman, M., Kashi, Y., Gall, GA.E.,
Hulata, G., 2003. Detection of a chromosomal region with two quantitative trait loci,
affecting cold tolerance and fish size, in an F2 tilapia hybrid. Aquaculture 223, 117-128.
Cossins, A., Bowler, K., 1987. Temperature Biology of Animals. London, New York:
Chapman and Hall, 339pp.
Elghobashy, H., 2001. Aquaculture genetics research in Egypt, p. 29-34. In: Gupta, M.V.,
Acosta, B.O., (Eds.), Fish genetics research in member countries and institutions of the
International Network on Genetics in Aquaculture. ICLARM Conf. Proc. 64, 179 pp.
Heritability of cold tolerance ___________________________________________________________________________________
55
Fryer, G., Iles, T.D., 1972. The Cichlid Fishes of the Great Lakes of Africa, their Biology and
Distribution, Oliver and Boyd; Edinburgh, Scotland, 641pp.
Gilmour, A.R., Gogel, B.J., Cullis, B.R., Welham, S.J., Thompson, R., 2002. ASReml User
Guide Release 1.0 VSN International Ltd, Hemel Hempstead, HP11ES, UK.
Hill, W.G., 1972a. Estimation of genetic change: I. General theory and design of control
populations. Anim. Breed. Abstr. 40, 1-15.
Hill, W.G., 1972b. Estimation of genetic change: II. Experimental evaluation of control
populations. Anim. Breed. Abstr. 40, 193-213.
Hofer, S.C., Watts, S.A., 2002. Cold tolerance in genetically male tilapia (GMT®),
Oreochromis niloticus. World Aquacult. 33, 19-21.
Johnson, Z.B., Chewning, J.J., Nugent III, R.A., 2002. Maternal effects on traits measured
during post-weaning performance test of swine from four breeds. J. Anim. Sci. 80,
1470-1477.
Khater, A.A., Smitherman, R.O., 1988. Cold tolerance and growth of three strains of
Oreochromis niloticus. In: The Second International Symposium on Tilapia in
Aquaculture. Pullin, R.S.V., Bukhaswan, T., Tonghthai, K., Maclean, J. L., (Eds.),
ICLARM Conference Proceedings 15, Manila, Phillipines. pp. 215-218.
Lahav, E., Ra’anan, Z., 1998. Cold tolerance of genetically produced all-male tilapia hybrids
(Oreochromis aureus). In: Tilapia Aquaculture, Proceedings from the Fourth
International Symposium on Tilapia Aquaculture, Fitzimmons, K., (Ed.), Northeast
Regional Agricultural Engineering Service (NRAES), Ithaca, NY, USA. pp. 662-670.
Lee, J.C., 1979. Reproduction and hybridization of three cichlid fishes, Tilapia aurea, T.
hornorum, and T. nilotica in aquaria and in plastic pools. PhD. Dissertation, Auburn
University, AL, 84pp.
Rezk, M.A., Kamel, E.A., Ramadan, A.A., Dunham, R.A., 2002. Comparative growth of
Egyptian tilapias in response to declining water temperature. Aquaculture 207, 239-247.
Rezk, M.A., Kamel, E.A., Dawood, T.I., Dunham, R.A., 2004. Heritability estimates for some
important traits in Egyptian Nile tilapia, Oreochromis niloticus. In: Aquaculture-An
Ecologically sustainable and Profitable venture, World Aquaculture Society Conference
Proceedings, 1-5 March 2004, Honolulu, Hawaii, USA. Aquaculture 2004 Book of
Abstracts, 708pp.
SAS Institute, 1989. User’s Guide: Statistics, Release 6.12 Edition, SAS Institute, Cary, NC.
Chapter 3 ____________________________________________________________________________
56
Sifa, L., Chenhong, L., Dey, M., Gagalac, F., Dunham, R., 2002. Cold tolerance of three strains
of Nile tilapia, Oreochromis niloticus, in China. Aquaculture 213, 123-129.
Sogard, S., 1997. Size-selective mortality in the juvenile stage of teleost fishes: a review. Bull.
Mar. Sci. 60, 1129-1157.
Tave, D., Smitherman, R.O., Jayaprakas, V., 1989. Estimates of additive genetic effects,
maternal effects, specific combining ability, maternal heterosis, and egg cytoplasm
effects for cold tolerance in Oreochromis niloticus (L.). Aqua. Fish. Manage. 20, 159-
166.
Tave, D., Jayaprakas, V., Smitherman, R.O., 1990. Effects on intraspecific hybridization in
Tilapia nilotica on survival under ambient winter temperature in Alabama. World
Aquacult. 21, 201-204.
Wohlfarth, G.W., Hulata, G., 1983. Applied Genetics of Tilapias, ICLARM Studies and
Review 6; Manila, Philippines. 26 pp.
Wohlfarth, G.W., Hulata, G., Rothbard, S., Itzkowich, J., Halevy, A., 1983. Comparison
between interspecific tilapia hybrids for some production traits. In Fishelson, L., Yaron,
Z., (Eds.), International Symposium on Tilapia in Aquaculture. Tel Aviv University,
Tel Aviv, Israel, pp. 559-569.
Wu, S.M., Hwang, P.P., Hew, C.L., Wu, J.L., 1998. Effect of antifreeze protein on cold
tolerance in juvenile tilapia (Oreochromis mossambicus Peters) and Milkfish (Chanos
chanos Forsskal). Zool. Stud. 37, 39-44.
Chapter 4
Effects of rearing conditions on low-
temperature tolerance of Nile tilapia
(Oreochromis niloticus) juveniles
Harrison Charo-Karisaa,b,c, Mahmoud Rezkc, Henk Bovenhuisb,
Hans Komenb
a Fish Culture and Fisheries Group, Wageningen Institute of Animal Sciences (WIAS), Wageningen
University, P.O. Box 338, 6700 AH, Wageningen, The Netherlands
b Animal Breeding and Genetics Group, Wageningen Institute of Animal Sciences (WIAS),
Wageningen University, P.O. Box 338, 6700 AH, Wageningen, The Netherlands
c Regional Center for Africa and West Asia, The World Fish Center, Abbassa, Abou Hammad, Egypt
A revised version of the paper presented in: Proc. 6th ISTA, New Dimensions in
Farmed Tilapia, 2004, pp. 30-41.
Chapter 4 ___________________________________________________________________________
58
Abstract:
This paper summarizes the results of two experiments in which the effects of genotype, age,
size, condition factor and diet (natural phytoplankton versus formulated protein pellets) on
low-temperature tolerance of juvenile Oreochromis niloticus were studied. The experiments
were conducted at the WFC experimental facilities in Abbassa, Egypt.
In the first experiment, 775 juveniles from 43 sires and 80 dams were reared under mid-
summer conditions for 41-91 days. In the second experiment, 393 juveniles were produced by
single-pair mating of 20 dams and 20 sires from the same brooders as in the first experiment.
These fish were reared for 42 days under autumn conditions with either high protein (40%)
pellets or natural tilapia diet. At the end of the growth period fish from each experiment were
tagged and exposed to gradually lowered temperatures. Cold tolerance was expressed as
“temperature at death” (TAD) and cumulative degree hours (CDH). Cold tolerance was
significantly affected by genotype, size, aquarium, condition factor (P= 0.0001) and diet
(P=0.0547). In both experiments, smaller fish were more vulnerable to cold stress. Age did
not significantly affect cold tolerance. Fish reared under mid-summer conditions died
between 13.6 ºC and 8.6 ºC while those reared under autumn conditions died between 11.7 ºC
and 7.5 ºC. This suggests that acclimatization to lower temperatures before cold stress can
improve the cold tolerance ability of O. niloticus.
Key words: cold tolerance, acclimatization, diet, juveniles, Oreochromis niloticus
1. Introduction
One major constraint to the global expansion of tilapia farming is their sensitivity to low
ambient temperatures. Of the tilapiine species, Nile tilapia (Oreochromis niloticus L.) is the
most important, constituting 90% of all tilapia cultured outside Africa. Exposure to extreme
cold temperatures leads to mass mortality (Chervinski and Lahav, 1976) making over-
wintering a serious economic challenge. In fish, the degree of tolerance to lethal temperatures
is dependent upon environmental effects, history of the fish and genetic effects (Cnaani et al,
2000) as well as fish health and nutrition status. It has been reported for many ectotherms that
animals can extend their thermal tolerance range through acclimatization and acclimation
(Cossins and Bowler, 1987). In tilapia, prior acclimation temperature and rate of temperature
reduction are considered important factors determining mortality at a given temperature
Effects of rearing conditions on low-temperature tolerance ___________________________________________________________________________
59
(Stauffer, 1986; Stauffer et al., 1988). It is thought that the ability of fish to adapt to different
temperatures is closely linked to the lipid composition in their muscles (Hazel, 1984; Greene
and Selivonchick, 1987). Fatty acid composition is in turn influenced by the fish’s diet
(Henderson and Tocher, 1987). Kelly and Kohler (1999), working with bass reported that fish
fed their natural diet suffered no mortality when exposed to simulated cold fronts while those
fed on a prepared diet had 50-90% mortality.
In this paper, we present the results of two experiments in which the effects of genotype, age,
size, condition factor, and diet (natural phytoplankton versus formulated protein pellets) on
low-temperature tolerance of juvenile Oreochromis niloticus were studied. The experiments
were conducted in two different periods of the year at the World Fish Centre, Abbassa,
Egypt.
2. Materials and Methods
2.1 Experiment 1
This experiment was carried out during warmer temperatures at the beginning of summer
(June-July 2003). Fish were produced in a full-sib/half-sib mating design in which each sire
was mated to two dams and each dam mated to only one sire. A total of 80 full-sib families
were produced from 43 sires and 80 dams. Sixty fry from each full sib family were reared in
80 separate 2 x 3 m hapas until they were tagged. The hapas were fixed in two 1000 m2
ponds. Fry were 41-91 days old at the beginning of the cold tolerance challenge. Ten healthy
individuals from each full-sib family were tagged with Floy tags between the dorsal fin and
lateral line and used in the cold tolerance challenge. Individual body weights and standard
lengths were recorded.
2.2 Experiment 2
This experiment was carried out in fall (September-October) of 2003. Twenty full-sib
families were produced by single-pair mating of 20 dams and 20 sires chosen randomly from
the brooders used in the first experiment. Experimental fish were reared in separate 6 m2
hapas up to swim-up. Two groups of 30 swim-up fry each were obtained from each family
and randomly assigned to two treatments described below. The growth experiment was
carried out in a 4000 m2 pond. The pond was fertilized with chicken manure at the rate of 50
Chapter 4 ___________________________________________________________________________
60
kg ha-1day-1. Two rows of 20 (2 m X 1 m) hapas were placed in opposite ends of the pond.
Fish in one row could feed only on naturally available food (Bowen, 1982) and
phytoplankton induced by the chicken manure application. In the other row, fish were in
addition fed twice daily (9.00 and 13.00 hrs) with 40% formulated protein pellets at 30% of
their body weight. Fish were sampled on day 14, 21, 28, 35 and 42. In each sampling day, fry
were counted, bulk weighed and average (family) weight recorded. On day 42, individual
body weights and standard length measurements were also taken. Next, 20 randomly chosen
fry from each full-sib family (10 per treatment) were tagged and used for the cold tolerance
challenge.
2.3 Fish condition and growth
Fulton’s condition factor was computed for each individual by the formula: CF = 100W/L3
(Ricker, 1975), where W= body weight and L= body length. Specific growth rate (SGR;
Experiment 2 only) was calculated according to Cho & Kaushik (1985): (ln final weight – ln
initial weight)/time (days).
2.4 Cold tolerance challenge
After one day in ceramic tanks at ambient temperature, individuals from each family were
randomly assigned to any of five 450 L glass aquaria set in a cold room. The room was
served by a thermostatically controlled chilling unit. Each aquarium was constantly aerated
using three air-stones connected to an air-pump. The temperature of the aquarium water was
adjusted to the desired level by adjusting the compressor settings of the chiller. Fish were
acclimatized to these aquarium conditions for 48 hours at 20 ºC. During the cold tolerance
challenge, fish were not fed.
Following acclimatization, the temperature was first lowered to 16 ºC within 48 hours, and
then to 11 ºC within the next 48 hours. From then on, water temperature was reduced at the
rate of 1°C per day. Death was defined as the point at which fish lost balance, fell on their
side and ceased fin, body and opercula movements and lost response to external stimuli. Dead
fish were removed from the tanks at the end of each hour with a scoop net, and their tag and
aquarium numbers recorded. Cold tolerance was quantified as cooling degree hours (CDH)
(Behrends et al., 1996) and temperature at death (TAD). CDH represents the sum of hours the
Effects of rearing conditions on low-temperature tolerance ___________________________________________________________________________
61
fish survived multiplied by the difference between the hourly and initial temperature for each
fish. As in earlier studies (Behrends et al., 1996; Cnaani et al., 2000, 2003), the initial
temperature for calculation of CDH was 16 ºC.
Aquarium water temperature was monitored hourly from beginning to end of the experiment.
DO, temperature and pH were measured once a day with WTW® multi 340i meter. To
maintain water quality within acceptable levels, total ammonia, nitrate and nitrite, were
measured daily with HACH kits. Aquaria were cleaned twice daily by suction to remove
faeces. Water that was removed during aquarium cleaning was replaced with clean water that
had been pre-cooled with ice cubes.
2.5 Data analysis
All analyses were carried out using SAS software (SAS, Institute, Cary, NC, USA). Factors
affecting cold tolerance in the first experiment were analysed by analysis of variance with the
generalised linear model including sire, dam, aquarium, age, and size effect using the
following model.
Yijkl = µ + ai + β1*dijk l + β2*ln (w) ijkl +sj + dk (sj) + eijkl (Model 1)
Where Yijkl = cooling degree hours for individual l; µ= overall mean; ai = fixed effect of
aquarium (i = 1, 2, 3, 4, 5); β1= regression coefficient of cooling degree hour on age; dijkl = a
co-variable of age of the individual l; β2 = regression coefficient of colling degree hours on
natural logarithm of body weight; ln(w)ijkl = a co-variable of the natural logarithm of body
weight of individual l; sj= effect of the jth sire; dk(sj) = effect of the kth dam nested within
the jth sire; and eijkl= random residual effect associated with individual l.
In the second experiment, the effects of diet, genotype, aquarium, body weight, standard
length, specific growth rate, condition factor, and the first order interaction between genotype
and diet were analyzed. Because specific growth rate did not affect cold tolerance, it was
removed from the model. As in Model 1, the natural logarithm of body weight was used
instead of body weight. The following model was finally fitted
Chapter 4 ___________________________________________________________________________
62
Yijkl = µ + ai +gj + tk + β1*ln (w) ijkl + β2*cijkl + gj* tk + eijkl (Model 2)
Where Yijkl = cooling degree hours for the lth individual; µ= overall mean; ai = fixed effect of
aquarium (i = 1, 2, 3, 4, 5); gj is the effect of the jth family; tk is the effect of diet (k = 1, 2);
β1 and β2 are the regression coefficients of cooling degree hours on body weight and
condition factor respectively; lnwijkl is a co-variable of natural log of body weight of the lth
individual; cijkl is a co-variable of condition factor of the lth individual; and eijkl is a random
residual effect associated with the individual l.
3. Results
3.1 Experiment 1
Means and standard deviation of body weight (BW) and length (SL), condition factor (CF),
temperature at death (TAD) and cooling degree hours (CDH) are shown in Table 1. Size of
fish ranged from 1 to 20.6 g body weight and 29.6 to 78 mm standard length. Fish died due
to cold from 13.6 ºC to 8.6 ºC and had a mean cooling degree hours of 298. The GLM
analysis from Model 1 showed significant effects (P< 0.0001) of body weight, and genotype
(sire and dam) on cold tolerance. Age did not significantly affect cold tolerance. There was a
tendency for smaller fish to have lower CDH values suggesting that size affects the ability of
fingerlings to survive low temperatures. The correlation coefficient of CDH on body weight
was low but significant (0.58, P= 0.0001). The relation between body weight and CDH was
logarithmic with an inflection point around 5 g.
Table 1. Overall means and standard deviations of body weight, standard length, age and cold tolerance responses of Oreochromis niloticus juveniles exposed to experimentally lowered temperatures Trait Mean Std. deviation Minimum Maximum Body weight (g) Standard length (mm) Age (days post-hatch) Temperature at death (ºC) Cooling degree hours *LT50 (full-sib) (ºC) LT50 (half-sib) (ºC)
5.10 50.61 79.00 10.10 298.07 10.10 10.10
2.35 7.60 8.62 0.56 67.86 0.37 0.24
1.0 29.6 41.0 8.6 6.4 9.3 9.4
20.6 78.0 91.0 13.6 440.3 11.5 11.1
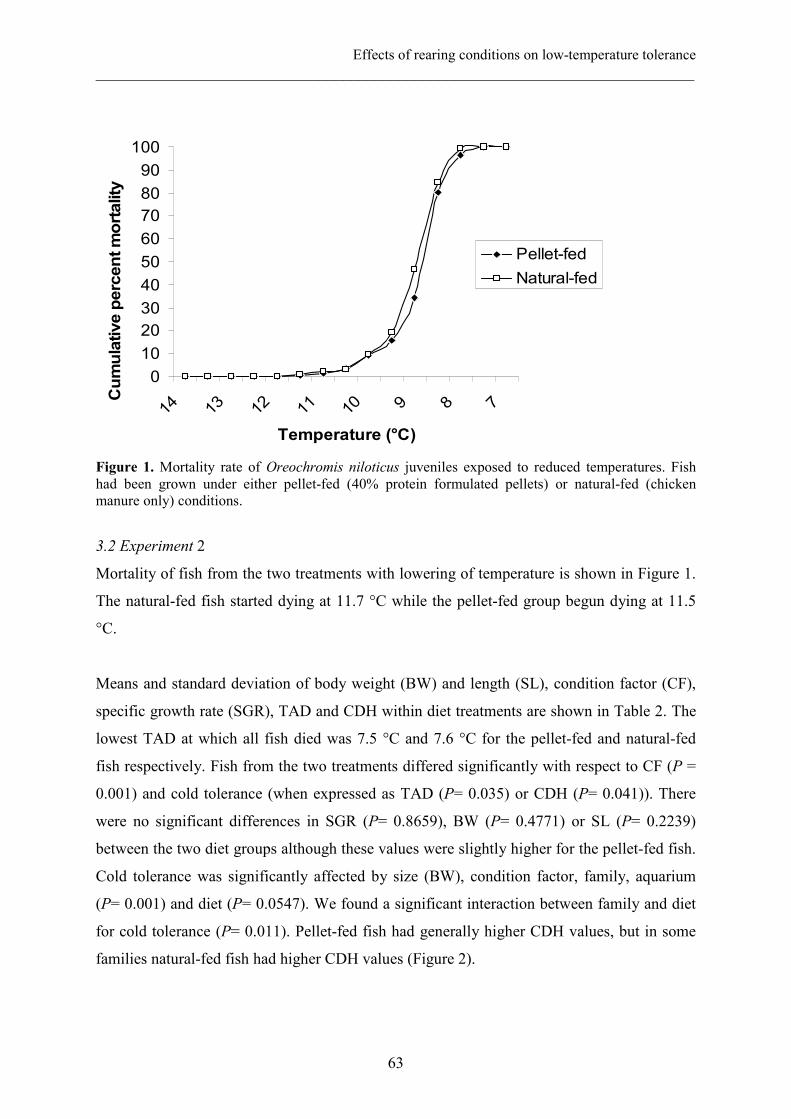
Effects of rearing conditions on low-temperature tolerance ___________________________________________________________________________
63
0
10
20
30
40
50
60
70
80
90
100
14 13 12 11 10 9 8 7
Temperature (°C)
Cumulative percent mortality
Pellet-fed
Natural-fed
Figure 1. Mortality rate of Oreochromis niloticus juveniles exposed to reduced temperatures. Fish had been grown under either pellet-fed (40% protein formulated pellets) or natural-fed (chicken manure only) conditions.
3.2 Experiment 2
Mortality of fish from the two treatments with lowering of temperature is shown in Figure 1.
The natural-fed fish started dying at 11.7 °C while the pellet-fed group begun dying at 11.5
°C.
Means and standard deviation of body weight (BW) and length (SL), condition factor (CF),
specific growth rate (SGR), TAD and CDH within diet treatments are shown in Table 2. The
lowest TAD at which all fish died was 7.5 °C and 7.6 °C for the pellet-fed and natural-fed
fish respectively. Fish from the two treatments differed significantly with respect to CF (P =
0.001) and cold tolerance (when expressed as TAD (P= 0.035) or CDH (P= 0.041)). There
were no significant differences in SGR (P= 0.8659), BW (P= 0.4771) or SL (P= 0.2239)
between the two diet groups although these values were slightly higher for the pellet-fed fish.
Cold tolerance was significantly affected by size (BW), condition factor, family, aquarium
(P= 0.001) and diet (P= 0.0547). We found a significant interaction between family and diet
for cold tolerance (P= 0.011). Pellet-fed fish had generally higher CDH values, but in some
families natural-fed fish had higher CDH values (Figure 2).
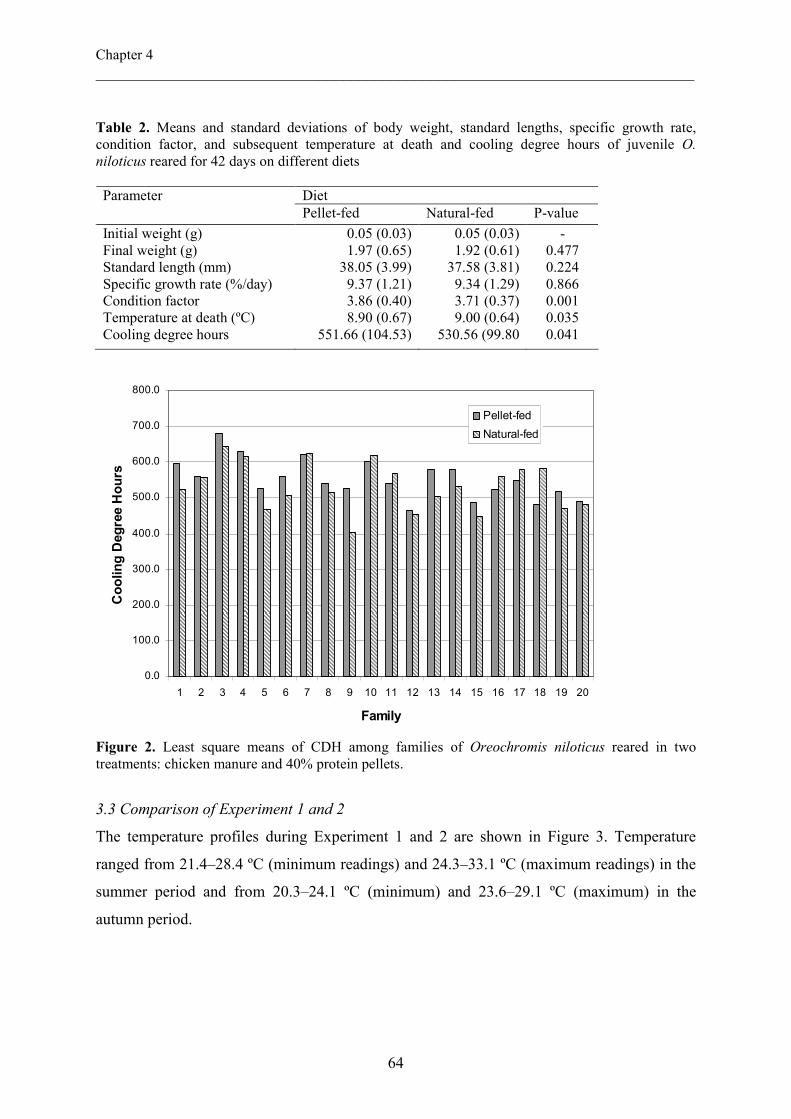
Chapter 4 ___________________________________________________________________________
64
Table 2. Means and standard deviations of body weight, standard lengths, specific growth rate, condition factor, and subsequent temperature at death and cooling degree hours of juvenile O. niloticus reared for 42 days on different diets
Diet Parameter Pellet-fed Natural-fed P-value
Initial weight (g) Final weight (g) Standard length (mm) Specific growth rate (%/day) Condition factor Temperature at death (ºC) Cooling degree hours
0.05 (0.03) 1.97 (0.65) 38.05 (3.99) 9.37 (1.21) 3.86 (0.40) 8.90 (0.67)
551.66 (104.53)
0.05 (0.03) 1.92 (0.61) 37.58 (3.81) 9.34 (1.29) 3.71 (0.37) 9.00 (0.64)
530.56 (99.80
- 0.477 0.224 0.866 0.001 0.035 0.041
0.0
100.0
200.0
300.0
400.0
500.0
600.0
700.0
800.0
1 2 3 4 5 6 7 8 9 10 11 12 13 14 15 16 17 18 19 20
Family
Cooling Degree Hours
Pellet-fed
Natural-fed
Figure 2. Least square means of CDH among families of Oreochromis niloticus reared in two treatments: chicken manure and 40% protein pellets.
3.3 Comparison of Experiment 1 and 2
The temperature profiles during Experiment 1 and 2 are shown in Figure 3. Temperature
ranged from 21.4–28.4 ºC (minimum readings) and 24.3–33.1 ºC (maximum readings) in the
summer period and from 20.3–24.1 ºC (minimum) and 23.6–29.1 ºC (maximum) in the
autumn period.
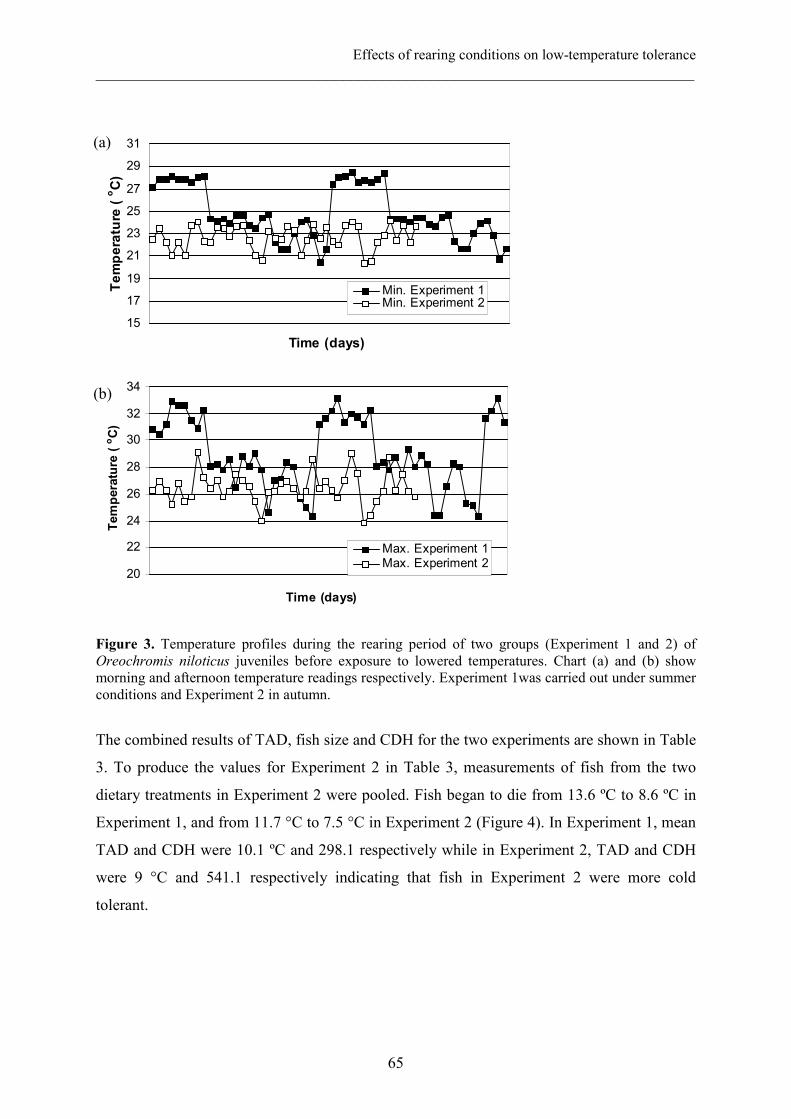
Effects of rearing conditions on low-temperature tolerance ___________________________________________________________________________
65
15
17
19
21
23
25
27
29
31
Time (days)
Temperature (
oC)
Min. Experiment 1Min. Experiment 2
20
22
24
26
28
30
32
34
Time (days)
Temperature (
oC)
Max. Experiment 1Max. Experiment 2
Figure 3. Temperature profiles during the rearing period of two groups (Experiment 1 and 2) of Oreochromis niloticus juveniles before exposure to lowered temperatures. Chart (a) and (b) show morning and afternoon temperature readings respectively. Experiment 1was carried out under summer conditions and Experiment 2 in autumn.
The combined results of TAD, fish size and CDH for the two experiments are shown in Table
3. To produce the values for Experiment 2 in Table 3, measurements of fish from the two
dietary treatments in Experiment 2 were pooled. Fish began to die from 13.6 ºC to 8.6 ºC in
Experiment 1, and from 11.7 °C to 7.5 °C in Experiment 2 (Figure 4). In Experiment 1, mean
TAD and CDH were 10.1 ºC and 298.1 respectively while in Experiment 2, TAD and CDH
were 9 °C and 541.1 respectively indicating that fish in Experiment 2 were more cold
tolerant.
(a)
(b)
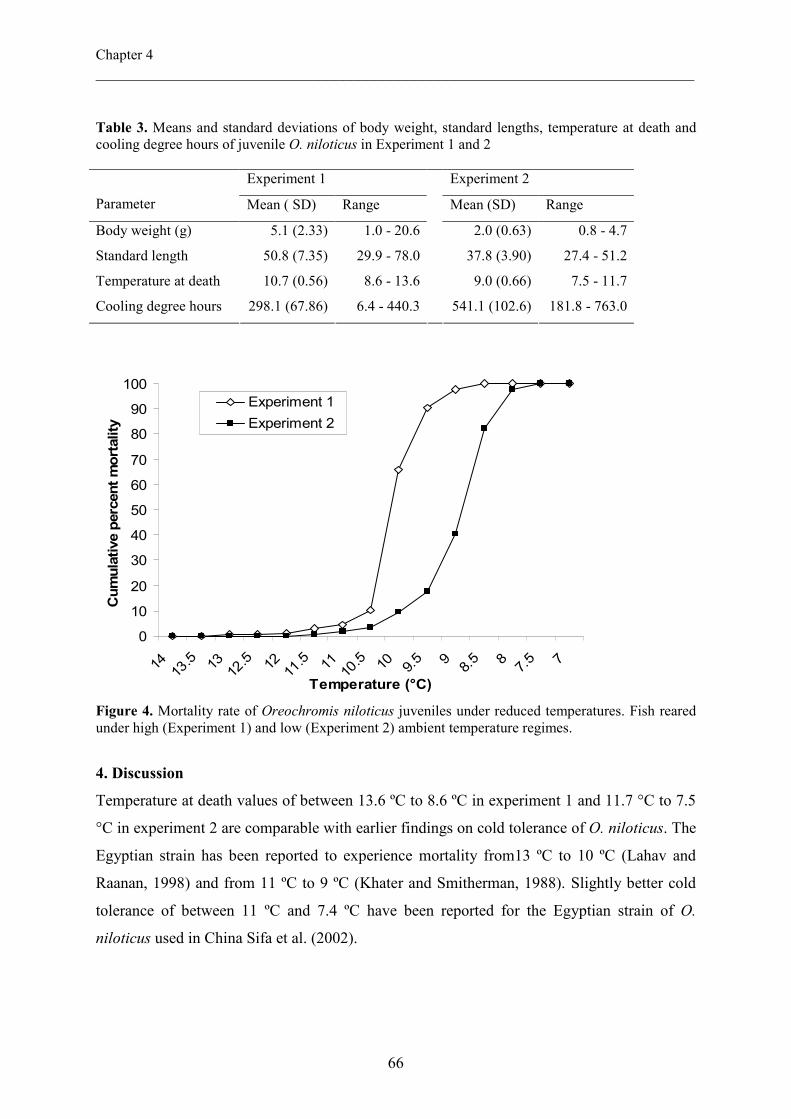
Chapter 4 ___________________________________________________________________________
66
Table 3. Means and standard deviations of body weight, standard lengths, temperature at death and cooling degree hours of juvenile O. niloticus in Experiment 1 and 2
Experiment 1 Experiment 2
Parameter Mean ( SD) Range Mean (SD) Range
Body weight (g)
Standard length
Temperature at death
Cooling degree hours
5.1 (2.33)
50.8 (7.35)
10.7 (0.56)
298.1 (67.86)
1.0 - 20.6
29.9 - 78.0
8.6 - 13.6
6.4 - 440.3
2.0 (0.63)
37.8 (3.90)
9.0 (0.66)
541.1 (102.6)
0.8 - 4.7
27.4 - 51.2
7.5 - 11.7
181.8 - 763.0
0
10
20
30
40
50
60
70
80
90
100
1413
.5 1312
.5 1211
.5 1110
.5 10 9.5 9
8.5 8
7.5 7
Temperature (°C)
Cumulative percent mortality
Experiment 1
Experiment 2
Figure 4. Mortality rate of Oreochromis niloticus juveniles under reduced temperatures. Fish reared under high (Experiment 1) and low (Experiment 2) ambient temperature regimes.
4. Discussion
Temperature at death values of between 13.6 ºC to 8.6 ºC in experiment 1 and 11.7 °C to 7.5
°C in experiment 2 are comparable with earlier findings on cold tolerance of O. niloticus. The
Egyptian strain has been reported to experience mortality from13 ºC to 10 ºC (Lahav and
Raanan, 1998) and from 11 ºC to 9 ºC (Khater and Smitherman, 1988). Slightly better cold
tolerance of between 11 ºC and 7.4 ºC have been reported for the Egyptian strain of O.
niloticus used in China Sifa et al. (2002).
Effects of rearing conditions on low-temperature tolerance ___________________________________________________________________________
67
The existence of size-dependent over-winter mortality has been reported for many freshwater
and marine fishes, with smaller individuals being in most cases more susceptible than larger
con-specifics (Sogard, 1997). The effect of size on cold tolerance in tilapia has been reported
as either significant or insignificant by different authors (Behrends et al 1990; Cnaani et al
2000; Cnaani et al, 2003). Atwood et al. (2003), working with larger fish indicated that size
significantly affected cold tolerance in O. niloticus. Our study indicated that size affected
cold tolerance with smaller fish (<5g) being more susceptible. This confirms the observation
by farmers that smaller fish are more vulnerable during winter months. For better over-winter
survival, juvenile of Nile tilapia should be at least 5g in size.
Diet has been known to improve the ability of fish to tolerate low temperatures. For example
for bass, Kelly and Kohler (1999) reported that fish fed their natural diet suffered no
mortality and had higher levels of unsaturated lipids than those artificially fed. Similarly,
dietary supplementation of L-carnitine at different levels led to higher cold tolerance in an
ornamental cichlid, Pelvicachromis pulcher (Harpaz et al., 1999). It has been shown that the
level of dietary protein affects lipid content of muscles and liver in Nile tilapia (Ogunji and
Wirth, 2002) and its hybrids (O. niloticus x O. aureus; Chou et al., 2001; Huang et al, 1998).
Atwood et al. (2003) found that when O. niloticus were fed either menhaden oil or coconut
oil diets, they incorporated differing levels of saturated (n-6) or unsaturated (n-3) fatty acids
into their muscles. However, this did not significantly affect cold tolerance of the two fish
groups (Atwood et al., 2003). In the present study, fish fed protein pellets had significantly
higher mean cold tolerance than natural-fed fish.
Our study indicated a significant effect of condition factor on cold tolerance. Since the pellet-
fed group had higher condition factor, their higher cold tolerance may be attributed to their
having better condition. Morphometric indices which assume that heavier fish of a given
length are in better condition are simple indicators of energy storage (Lloret et al, 2002). Fish
condition or well-being has a large influence on growth, reproduction and survival of fsih
populations (Lambert and Dutil, 2000). It appears that by improving fish condition factor, one
can increase winter survival of O. niloticus to some degree. It should be noted however that
judging from the the TAD values, this difference may not practically improve survival at the
farm during severe winters.
Chapter 4 ___________________________________________________________________________
68
We observed that significant family by diet interaction effects. Some families had higher cold
tolerance ability after growth with either natural-fed or formulated pellet diets. This within
family variation with respect to diet may indicate the presence of a genotype X environment
interaction in cold tolerance of Nile tilapia.Significant genotype by diet interaction may point
to the need for particular genotype-diet combinations for better low temperature tolerance.
The significance of genotype by diet interaction for cold tolerance in tilapia should be further
studied.
In this study, fish grown under lower autumn temperature showed better tolerance to
exposure to lower temperatures as shown in Figure 4. This confirms the hypothesis that prior
acclimatization to lower temperature conditions can lead to better tolerance to low
temperatures in tilapia (Stauffer, 1986; Stauffer et al., 1988). Temperature in conjunction
with photoperiod has been shown to affect fish physiology. Survival, growth rates and feed
utilization of O. niloticus fry are affected by changes in photoperiod (El-Sayed and Kawanna,
2004). Atwood et al. (2003) showed that for Nile tilapia, the effect of experimentally altering
photoperiod alone has some effect on cold tolerance when the trait was expressed as cooling
degree hours (CDH) but not when expressed as temperature at death (TAD).
In this study, acclimatization to lower temperature not only improved CDH values but also
led to substantial decrease in TAD values indicating better cold tolerance. While it is not
possible, based on this study, to point out the exact factors that led to the improved cold
tolerance in the second experiment, prior low temperature acclimatization coupled with
photoperiod may have played a key role. The large differences in cold tolerance in the two
experiments point to a possibility of using prior low temperature acclimatization conditions
before fish over-wintering as a tool for improvement of cold tolerance in Nile tilapia.
5. Acknowledgements
We wish to thank Tharwat Dawood, Osama Thabet, Mohammed Abd-Hafaz, and Abdalla
Mohammed Abdalla ‘Shisha’ for technical assistance. This study was carried out with funds
from Wageningen University’s INREF fund. The WorldFish Centre, Abbassa Centre
provided space and facilities.
Effects of rearing conditions on low-temperature tolerance ___________________________________________________________________________
69
References
Atwood, H.L., Tomasso J.R., Webb, K., and Gatlin III, D.M., 2003. Low-temperature
tolerance of Nile tilapia, Oreochromis niloticus: effects of environmental and dietary
factors. Aquaculture 34, 241-251.
Behrends, L.L., Kingsley, J.B. and Bulls, M.J., 1990. Cold tolerance in maternal
mouthbrooding tilapias: phenotypic variation among species and hybrids. Aquaculture
85, 271-280.
Behrends, L.L., Kingsley, J.B. and Bulls, M.J., 1996. Cold tolerance in maternal
mouthbrooding tilapias: heritability estimates and correlated growth responses at
suboptimal temperatures. In: The Third International Symposium on Tilapia in
Aquaculture, R.S.V. Pullin, J. Lazard, M. Legendre, J.B. Amon Kothias and D. Pauly
(eds.), ICLARM Conference Proceeding 41. pp. 257-265.
Bowen, S.H., 1982. Feeding, digestion and growth - qualitative considerations. In: R.S.V.
Pullin and R.H. Lowe-McConnell (Eds.). The Biology and Culture of Tilapias.
ICLARM Conference Proceedings 7, International Center for Living Aquatic
Resources Management, Manila, Philippines, pp. 141-156.
Chervinski, J., and Lahav, M., 1976. The effect of exposure to low temperature on fingerlings
of local tilapia (Tilapia aurea) (Steindacher) and imported tilapia (Tilapia vulcani)
(Trewavas) and Tilapia nilotica (Linne) in Israel. Bamidgeh 28, 25-29.
Cho, C.Y., and Kaushik, S.J., 1985. Effect of protein intake on metabolizable and net energy
values of fish diets. In: Nutrition and Feeding in Fish C.B. Cowey, A.M. Mackie &
J.G. Bell (eds.), pp. 95-117. Academic Press, London, UK.
Chou, B., Shiau, S., and Hung, S., 2001. Effect of dietary cod liver oil on growth and fatty
acids of juvenile hybrid tilapia. North American Journal of Aquaculture 63: 277-284.
Cnaani A., Gall G.A.E. and Hulata G., 2000. Cold tolerance of tilapia species and hybrids,
Aquaculture International 8, 289-298.
Cnaani, A., Hallerman, E. M., Rona, M., Wellera, J. I., Indelman, M., Kashi, Y., Gall, GA.E.,
and Hulata, G., 2003. Detection of a chromosomal region with two quantitative trait
loci, affecting cold tolerance and fish size, in an F2 tilapia hybrid. Aquaculture 223,
117-128.
Cossins, A., and Bowler, K., 1987. Temperature Biology of Animals. London, New York:
Chapman and Hall. 339pp.
Chapter 4 ___________________________________________________________________________
70
El-Sayed, A. M., and Kawanna, M., 2004. Effects of photoperiod on the performance of
farmed Nile tilapia Oreochromis niloticus: I. Growth, feed utilization efficiency and
survival of fry and fingerlings. Aquaculture 231, 393-402.
Greene, D.H.S. and D.P., Selivonchick, 1987. Lipid metabolism in fish. Progress in Lipid
Research 26, 53-85.
Harpaz, S., Becker, K., and Blum, R., 1999. The effect of dietary L-carnitine supplementation
on cold tolerance and growth of the ornamental cichlid fish Pelvicachromis pulcher -
preliminary results. Journal of Thermal Biology 24, 57- 62.
Hazel, J. R. 1984. Effects of temperature on the structure and metabolism of cell membranes
in fish. American Journal of Physiology 246, R2460- R470.
Henderson, R.J. and Tocher, D.R., 1987. The lipid composition and biochemistry of
freshwater fish. Progress in Lipid Research 26, 281-347.
Hofer, S. C., and Watts, S.A., 2002. Cold tolerance in genetically male tilapia (GMT®),
Oreochromis niloticus. World Aquaculture 33, 19-21.
Huang, C., Huang, M., and Hou, P., 1998. Effect of dietary lipids on fatty acid composition
and lipid peroxidation in sarcoplasmic reticulum of hybrid tilapia, Oreochromis
niloticus X O. aureus. Comparative Biochemistry and Physiology 1208B, 331-336.
Khater, A.A., Smitherman, R.O., 1988. Cold tolerance and growth of three strains of
Oreochromis niloticus. In: The Second International Symposium on Tilapia in
Aquaculture. Pullin, R.S.V., Bukhaswan, T., Tonghthai, K., Maclean, J. L., (Eds.),
ICLARM Conference Proceedings 15, Manila, Phillipines. pp. 215-218.
Kelly, A.M., and Kohler, C.C., 1999. Cold Tolerance and Fatty Acid Composition of Striped
Bass, White Bass, and Their Hybrids. North American Journal of Aquaculture 61,
278-285.
Lahav, E., Ra’anan, Z., 1998. Cold tolerance of genetically produced all-male tilapia hybrids
(Oreochromis aureus). In: Tilapia Aquaculture, Proceedings from the Fourth
International Symposium on Tilapia Aquaculture, Fitzimmons, K., (Ed.), Northeast
Regional Agricultural Engineering Service (NRAES), Ithaca, NY, USA. pp. 662-670.
Lambert, Y. and Dutil, J.D., 2000. Energetic consequences of reproduction in Atlantic cod
(Gadus morhua) in relation to spawning level of somatic energy reserves. Can. J. Fish.
Aqua. Sci. 57, 815-817.
Effects of rearing conditions on low-temperature tolerance ___________________________________________________________________________
71
Lloret, J., and Ratz, H. J. 2000. Condition of cod (Gadus morhua) off Greenland during
1982–1998. Fisheries Research 48, 79-86.
Ogunji, J.O. and Wirth, M., 2002. Influence of dietary protein deficiency on amino acid and
fatty acid composition in tilapia, Oreochromis niloticus fingerlings. Bamidgeh 54, 64-
72.
Ricker, W.E., 1975. Computation and interpretation of biological statistics of fish
populations. Bull. Fish Res. Bd. Can. 191, 209-210.
SAS Institute, 1989. User’s Guide: Statistics, Release 6.12 Edition, SAS Institute, Cary, NC.
Sifa, L., Chenhong, L., Dey, M., Gagalac, F., Dunham, R., 2002. Cold tolerance of three
strains of Nile tilapia, Oreochromis niloticus, in China. Aquaculture 213, 123-129.
Sogard, S., 1997. Size-selective mortality in juvenile stage of teleost fishes: a review. Bull.
Mar. Sci. 60, 1129-1157.
Spataru, P., Wohlfarth, G.W. and Hulata, G., 1983. Studies on the natural food of different
fish species in intensively manured polyculture ponds. Aquaculture 35, 283-298.
Stauffer, J.R., Jr., 1986. Effects of salinity on preferred and lethal temperatures of the
Mozambique tilapia Oreochromis mossambicus (Peters). Water Res. Bull. 22, 205-
208.
Stauffer, J.R., Jr., Boltz, S.E., Boltz, J.M., 1988. Cold shock susceptibility of blue tilapia
from Susquehanna River, Pennsylvania. North American Journal of Fisheries
management 8, 329-332.

Chapter 5
Heritability estimates and response to selection
for growth of Nile tilapia (Oreochromis
niloticus) in low-input earthen ponds
Harrison Charo-Karisaa,b,c, Hans Komenb, Mahmoud A. Rezkc,
Raul W. Ponzonid, Johan A.M. van Arendonkb, Henk Bovenhuisb
a Fish Culture and Fisheries Group, Wageningen Institute of Animal Sciences (WIAS), Wageningen
University, P.O. Box 338, 6700 AH, Wageningen, The Netherlands
b Animal Breeding and Genetics Group, Wageningen Institute of Animal Sciences (WIAS),
Wageningen University, P.O. Box 338, 6700 AH, Wageningen, The Netherlands
c Regional Center for Africa and West Asia, The World Fish Center, Abbassa, Abou Hammad, Egypt
dWorldFish Center, Jalan Batu Maung, 11960 Batu Maung, Penang, Malaysia
Aquaculture, submitted
Chapter 5 ___________________________________________________________________________
74
Abstract
This study presents results of two generations of selection (G1 and G2) for growth of Nile
tilapia. The selection environment consisted of earthen ponds which were daily fertilized with
50 kg dry matter (dm)/ ha chicken manure. No supplementary feeds were provided. In total,
6429 fully pedigreed experimental fish were included in the analysis. Survival till harvest was
highly variable ranging from 35% to 77% and was affected by initial weight, pond, and age
effects. Body weight at harvest (BW) increased from a mean of 67.4 g in the grandparental
(unselected) population (G0) to 129.5 g in G2 was affected by initial weight, pond, sex and
age effects. Generations were discrete and therefore genetic parameters were estimated
separately for each year. Heritability estimates for BW ranged from 0.38 to 0.60, and the
heritability for survival ranged from 0.03 to 0.14. The estimated selection response was 23.4
g (34.7%) between G0 and G1 and 13.0 g (14.9%) between G1 and G2. These results
demonstrate the feasibility of selection for growth of Nile tilapia in low-input environments.
Keywords: Nile tilapia; Oreochromis niloticus; Selection response; Body weight;
Heritability; Breeding value
1.0 Introduction
Tilapias are, after carp, the second most important group of farm raised fish in the world.
They are the mainstay of many resource-poor fish farmers (Eknath et al., 1993). Among the
tilapiines, the Nile tilapia (Oreochromis niloticus L.), is the most important cultured fish
species. Although O. niloticus is farmed in a wide range of aquaculture systems (Pullin,
1985), majority of its culturing is carried out in the tropics in semi-intensive environments
such as fertilized earthen ponds. Nile tilapia is herbivorous by nature, consuming mainly
phytoplankton (Moriarty, 1973; Moriarty and Moriarty, 1973), but can as well consume a
variety of other natural food organisms found in ponds (Bowen, 1982). To increase fish
production, supplementary or artificial feeds may be added. However, supplementary feeds
can take up to 60% of fish production costs (Green, 1992) making them unaffordable for
most farmers in the developing countries (Nguenga et al., 1997; Liti et al., 2005). Due to the
high cost of supplementary feeds, poor farmers either grow Nile tilapia with organic
fertilization alone or with a variety of locally available farm resources. This leads to reduced
yields and small fish sizes at harvest.
Heritability and response to selection for growth of Nile tilapia ___________________________________________________________________________
75
A number of selective breeding programs have been initiated to improve the growth of O.
niloticus in ponds and cages (e.g. Hulata et al., 1986; Eknath et al., 1993; Bensten et al.,
1998). Initial trials at selective breeding, which were based on mass selection for growth,
indicated low response to selection for growth (Tave and Smitherman, 1980; Hulata et al.,
1986; Teichert-Coddington and Smitherman, 1988; Huang and Liao, 1990). Recently,
considerable improvement of response to growth has been achieved using family selective
breeding schemes and tilapia germplasm assembled from several wild stocks in Africa
(Eknath et al., 1998). These selection programs have typically been carried out in relatively
favorable environments receiving supplementary feed. However, there are reports that the
gains of selection in Nile tilapia were lost when selected breeds were tested in less favorable
environments (Macaranas et al., 1997). This could indicate that the expression of body weight
in different environments, i.e. low and high-input culture conditions, is influenced by a
different set of genes.
Here we report on the analysis of a Nile tilapia selection experiment carried out in ponds
receiving chicken manure as the only external nutrient source. The aim was to estimate
heritability for growth and survival and to investigate the potential of selecting for growth in
low-input environments (i.e. manure fertilized ponds without supplementary feeding).
2.0 Materials and Methods
The experiment was carried out at the Regional Center for Africa and West Asia of the World
Fish Center, Abbassa, Egypt. Fish used for this study were the G0 population produced in
2002, the first generation of selection (G1) produced in 2003, and the second generation of
selection (G2) produced in 2004.
2.1 The founder population and production of G0
The founder population (i.e. parents of the G0 population) was produced in spring of 2000 in
a full diallel mating design among local Egyptian strains namely Maryout, Zawia, Abbasa
and Aswan (Rezk et al., 2002; 2004). Eighty sires and 105 dams, selected at random from
among the founder stock, were subsequently used to produce the G0. Each sire was mated to
two dams and each dam mated to only one sire, thus generating full and half sib groups. Fry
were raised in 2 x 1 x 1 m hapas suspended in concrete tanks and were fed twice daily with
Chapter 5 ___________________________________________________________________________
76
40% protein supplements, initially in the form of powder and later as pellets. Initial feeding
rate was 20% of body weight, which was gradually reduced to 5% body weight at tagging
size (i.e. mean wet weight of 2g).
2.2 Production of G1 and G2
The first and second generations of selection, G1 and G2, were produced in 2 x 3 x 1 m hapas
suspended in fertilized ponds. Each sire was mated to two dams as in G0. Fifty sires and 87
dams were used to produce generation G1, while for generation G2, 54 sires and 104 dams
were used. At first, each sire was kept in a single hapa with two dams. Twice a week, hapas
were checked for occurrence of spawning. Spawning was assumed to have occurred when the
dam had eggs or yolk-sac fry in her mouth. The un-spawned dam and the sire were both
transferred to an adjacent hapa thus producing the paternal half-sibs. To prevent multiple
spawning, the male was removed immediately after spawning occurred. When swim-up fry
were sighted in both hapas, the females were also removed. Two to three weeks later, the
number of swim-up fry in each hapa was reduced to 80 individuals. In contrast to the G0, the
G1 and G2 fry were given no supplementary feeds and were reared in hapas suspended in the
earthen ponds. To boost natural pond productivity, ponds with hapas containing fry were
fertilized daily with chicken manure at the rate of 50 kg dry matter, dm /ha.
2.3 Grow-out and pond management (G0, G1 and G2)
As soon as a family reached suitable tagging size, 24 randomly chosen fry from each full-sib
family were individually tagged with Floy® tags and returned into the hapas until stocking.
Fry were between 31-96 days old at stocking. Each family of fry was randomly divided into
two groups which were then stocked in two 1000 m2 fertilized earthen ponds for grow-out.
Ponds were daily supplied with dry chicken manure from layer and broiler farms at the rate of
50-kg dm/ha. This fertilization rate corresponds to 0.3 kg nitrogen ha-1 day-1 which is enough
to support yields of 4.3 kg fish BW ha-1 day-1 (calculated from Knud-Hansen et al., 1991).
Fish that died within the first week of stocking were, when possible, replaced with
individuals from the same family. Pond water levels were maintained by weekly addition of
water. Water quality parameters (temperature, pH, and dissolved oxygen (DO)) were
monitored daily in the first and second years, and twice a week in the third year. After
approximately 8 months of growth, which included 3-4 months of over-wintering, fish were
Heritability and response to selection for growth of Nile tilapia ___________________________________________________________________________
77
harvested by seine netting. Fish were on average 289 days old at harvest in G0, 293 days old
in G1, and 318 days old in G2.
2.4 Selection procedure
Before measurements were taken, fish were anaesthetized with MS222 (3-aminobenzoic acid
ethyl ester) to avoid handling stress. Each fish was measured for body weight (BW) and their
breeding values estimated from an animal model (Model 1 below). Brooders were selected
based on the rank of EBVs, separately for males and females. These estimates were used to
select 100 males and 200 females as potential brooders for the next generation. We aimed at
spawning the best ranking 50 males and 100 females. However, to minimize inbreeding, the
number of individuals from a single full sib or half sib group was restricted which made fish
that were not among the best ranks to be included as brooders.
2.5 Data Analysis
Because, the generations were discrete i.e. sires and dams were used only one generation,
data from each generation (G0, G1, and G2) were analyzed separately. A complete pedigree
of the experimental fish from G0 onwards was available and was used in each analysis. An
animal model including common environmental/ full-sib family effect was used:
Yijkl = µ + PNDi + SEXj + β1*AGEijkl + β2*log (INWTijkl) + dk + ul + eijkl …. (Model 1)
Where Yijkl is body weight of individual l at harvest; µ is overall mean; PNDi is fixed effect
of pond (i = 1, 2); SEXj is the fixed effect of sex (j = 1, 2); β1 is the regression coefficient of
body weight at harvest (BW) on age at harvest; AGEijkl is a covariate of age at harvest of
individual ijkl; β2 is a regression coefficient of BW on natural logarithm of initial body
weight; log(INWTijkl) is a co-variable of the natural logarithm of initial body weight of
individual ijkl (the natural logarithm was used instead of untransformed initial body weight
values because body weight was logarithmically related to initial body weight); ul is a
random additive genetic effect of the lth individual; dk is a random common environmental/
full-sib effect which included the effect of the dam, the effect of common hapa rearing, and a
quarter of non-additive genetic effects; and eijkl is a random residual effect associated with
individual ijkl. Breeding values for body weight of each individual were estimated from
Chapter 5 ___________________________________________________________________________
78
Model 1. Because the main interest was in the growth that occurred after stocking in the
pond, initial (= stocking) weight was included as a co-variable in the model.
Factors affecting survival at harvest were also analyzed separately for each year. Surviving
fish were given a score of ‘1’; while dead fish and those that had lost tags, and hence could
not be identified, were scored as ‘0’. The factors included in the model were: pond as a fixed
effect, and initial body weight and age at stocking as co-variables. Sex effect on survival was
not estimated because at the time of stocking it was not possible to score sex visually.
Animal and dam were included in the model as random effects. Variance components for
survival at harvest were estimated from a univariate model.
Total phenotypic variance (σ2P), was calculated as the sum of the additive genetic variance
(σ2A), the common environmental/full-sib component of variance (σ2C), and the error variance
(σ2E). The heritability (h2) was computed as σ2A/σ
2P, and the common environmental/full-sib
effect (c2) as σ2C/σ2P. All computations were carried out with ASREML (Gilmour et al.,
2002).
2.5.1 Selection response
The selection differential for growth was estimated for each generation by comparing the
mean estimated breeding value of the brooders that actually produced progeny and the mean
of all the fish before the brooders were selected. The selection differential was calculated
from the EBVs of males and females separately and then averaged over the sexes. EBV was
calculated based on information available at the time of selection, i.e. phenotypic information
from progeny was not used. The selection differential in G0 and G1 was then compared to the
observed differences in mean BW between generations.
3.0 Results
3.1 Descriptive statistics
Mean BW in different ponds ranged from 63.2 and 71.5 g in G0 to 128.1 and 130.9 g in G2
(Table 1). The CVs were higher for initial body weight (46.7 - 87.9%) than for BW (30 -
56%). Survival to harvest ranged from 35 % to 77%, with Pond 2 recording consistently
lower survival throughout the experiment. The realized final yields (from actual surviving
Heritability and response to selection for growth of Nile tilapia ___________________________________________________________________________
79
fish in each pond) were 344.5 to 1042.2 kg /ha per growth cycle. The expected final yields,
which were calculated after correcting for mortality and stocking density, increased from
608.7 to 1264.5 kg /ha between G0 and G2.
In the study period, morning temperatures ranged from 16.3 to 27.5 °C, and afternoon
temperatures from 17.5 to 31.9 °C, and morning pH ranged from 8 to 9.8 and afternoon pH
from 7.9 to 10.8. Morning dissolved oxygen (DO) ranged from 0.6 to 6.5 mg/l, while
afternoon DO from 6.5 to 20.1 mg/l. Water quality parameters were similar between ponds
but differed between generations. For example, mean morning temperature was 22.5 °C in
G0, 24.6 °C in G1, and 24.7 °C in G2; afternoon temperature was 25.4 °C in G0, 28.7 °C in G1,
and 27.8 °C in G2. Morning DO was 2.1 mg/l in G0, 3.4 mg/l in G1, and 2.1 mg/l in G2; and
afternoon DO was 7.4 mg/l in G0, 12.1 mg/l in G1, and 10.8 mg/l in G2.
Table 1. Number of fish stocked and harvested, survival and tag loss in each pond, mean initial weight and mean body weight at harvest (BW), with standard deviations (SD) and coefficients of variation (CV), and realized final yield (RFY) and expected final yields (EFY) of Nile tilapia in each generation
Stocking harvest Initial weight (g) BW (g) Yield (kg/ha)
Generation Pond* n
Mean SD CV % Survival
% Tag loss
Mean SD CV RFY EFYφ
G0 (2002) 1 1058 2.2 1.9 84 72 11 71.5 38.9 54 528.6 692.7
2 1064 2.3 1.8 79 53 3 63.2 35.6 56 344.5 608.7
G1 (2003) 3 1058 4.3 1.8 41 70 7 70.0 23.5 34 485.8 657.3
2 1043 3.7 1.5 41 59 3 104.4 32.6 31 618.2 1006.8
G2 (2004) 3 1101 4.3 3.1 72 77 2 128.1 417 33 1042.2 1237.7
2 1105 4.5 3.8 84 35 2 130.9 39.5 30 493.2 1264.5
*Pond numbers refer to a unique unit φ Calculated from the difference between BW at harvest and initial body weight assuming a stocking density of 1 fish/ m2 with no mortalities
3.2 Environmental effects
BW was affected by initial body weight, sex, age, and pond effects (Table 2). There were
differences in magnitude of effects in different generations. For example, the magnitude of
the effect of pond on BW relative to other effects was greatest in G1 but lowest in G2. The
regression coefficients of BW on logarithm of initial body weight were positive for both
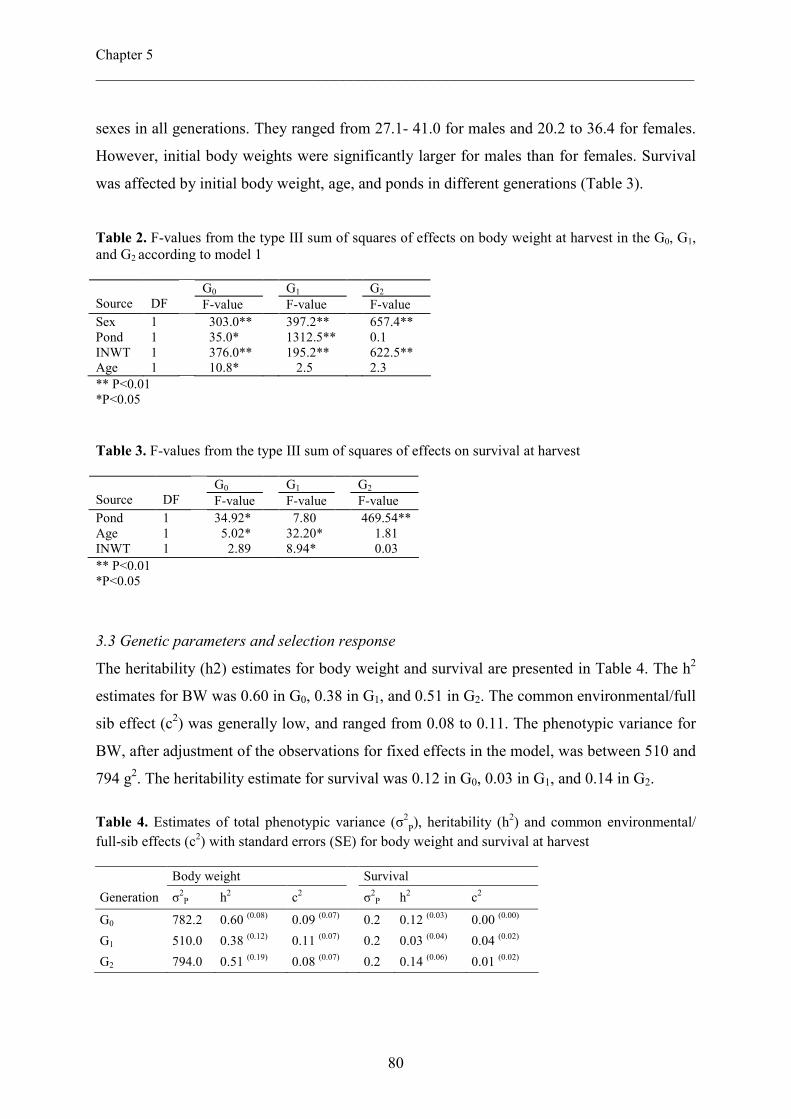
Chapter 5 ___________________________________________________________________________
80
sexes in all generations. They ranged from 27.1- 41.0 for males and 20.2 to 36.4 for females.
However, initial body weights were significantly larger for males than for females. Survival
was affected by initial body weight, age, and ponds in different generations (Table 3).
Table 2. F-values from the type III sum of squares of effects on body weight at harvest in the G0, G1, and G2 according to model 1
G0 G1 G2 Source
DF F-value F-value F-value
Sex Pond INWT Age
1 1 1 1
303.0** 35.0* 376.0** 10.8*
397.2** 1312.5**195.2** 2.5
657.4** 0.1 622.5** 2.3
** P<0.01 *P<0.05
Table 3. F-values from the type III sum of squares of effects on survival at harvest
G0 G1 G2 Source
DF F-value F-value F-value
Pond Age INWT
1 1 1
34.92* 5.02* 2.89
7.80 32.20* 8.94*
469.54** 1.81 0.03
** P<0.01 *P<0.05
3.3 Genetic parameters and selection response
The heritability (h2) estimates for body weight and survival are presented in Table 4. The h2
estimates for BW was 0.60 in G0, 0.38 in G1, and 0.51 in G2. The common environmental/full
sib effect (c2) was generally low, and ranged from 0.08 to 0.11. The phenotypic variance for
BW, after adjustment of the observations for fixed effects in the model, was between 510 and
794 g2. The heritability estimate for survival was 0.12 in G0, 0.03 in G1, and 0.14 in G2.
Table 4. Estimates of total phenotypic variance (σ2P), heritability (h2) and common environmental/
full-sib effects (c2) with standard errors (SE) for body weight and survival at harvest Body weight Survival
Generation σ2P h2 c2 σ2P h2 c2
G0 782.2 0.60 (0.08) 0.09 (0.07) 0.2 0.12 (0.03) 0.00 (0.00)
G1 510.0 0.38 (0.12) 0.11 (0.07) 0.2 0.03 (0.04) 0.04 (0.02)
G2 794.0 0.51 (0.19) 0.08 (0.07) 0.2 0.14 (0.06) 0.01 (0.02)
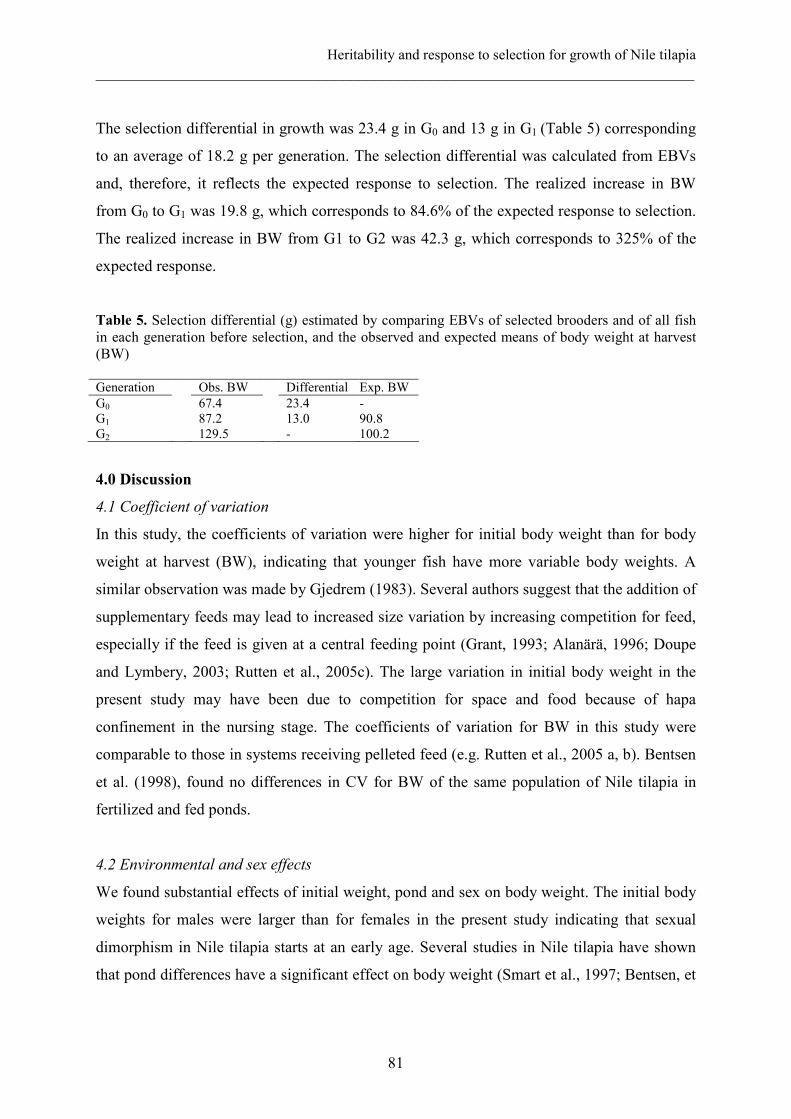
Heritability and response to selection for growth of Nile tilapia ___________________________________________________________________________
81
The selection differential in growth was 23.4 g in G0 and 13 g in G1 (Table 5) corresponding
to an average of 18.2 g per generation. The selection differential was calculated from EBVs
and, therefore, it reflects the expected response to selection. The realized increase in BW
from G0 to G1 was 19.8 g, which corresponds to 84.6% of the expected response to selection.
The realized increase in BW from G1 to G2 was 42.3 g, which corresponds to 325% of the
expected response.
Table 5. Selection differential (g) estimated by comparing EBVs of selected brooders and of all fish in each generation before selection, and the observed and expected means of body weight at harvest (BW) Generation Obs. BW Differential Exp. BW G0 67.4 23.4 - G1 87.2 13.0 90.8 G2 129.5 - 100.2
4.0 Discussion
4.1 Coefficient of variation
In this study, the coefficients of variation were higher for initial body weight than for body
weight at harvest (BW), indicating that younger fish have more variable body weights. A
similar observation was made by Gjedrem (1983). Several authors suggest that the addition of
supplementary feeds may lead to increased size variation by increasing competition for feed,
especially if the feed is given at a central feeding point (Grant, 1993; Alanärä, 1996; Doupe
and Lymbery, 2003; Rutten et al., 2005c). The large variation in initial body weight in the
present study may have been due to competition for space and food because of hapa
confinement in the nursing stage. The coefficients of variation for BW in this study were
comparable to those in systems receiving pelleted feed (e.g. Rutten et al., 2005 a, b). Bentsen
et al. (1998), found no differences in CV for BW of the same population of Nile tilapia in
fertilized and fed ponds.
4.2 Environmental and sex effects
We found substantial effects of initial weight, pond and sex on body weight. The initial body
weights for males were larger than for females in the present study indicating that sexual
dimorphism in Nile tilapia starts at an early age. Several studies in Nile tilapia have shown
that pond differences have a significant effect on body weight (Smart et al., 1997; Bentsen, et
Chapter 5 ___________________________________________________________________________
82
al., 1998; Riley et al., 1998). In the present study, we observed differences in magnitude of
pond effects in different generations. Eknath et al. (1993) observed similar changes in
magnitude of environmental and sex effects in different generations, and attributed them to
the wide range of environments used. Although we cannot find, based on our data, a single
water quality parameter responsible for the differences in magnitude of pond effects between
generations, these differences may be attributed to the sum of the differences in the water
quality parameters between generations. The large differences in body weight and yield
among ponds in this study emphasize the necessity of using replicate ponds in Nile tilapia
selection experiments.
4.3 Survival to harvest
Widely varying survival rates (29-100%) have been recorded in Nile tilapia reared in
fertilized ponds with or without supplementary feeds (e.g. Abdalla et al., 1996; Abdelghany
and Ahmad, 2002; Bolivar and Newkirk, 2002), indicating that survival is an important trait
to consider in pond experiments. Fertilized ponds are frequently affected by extended periods
of low dissolved oxygen leading to hypoxia which may reduce growth (Chervinski, 1982)
and cause mortality (Coche, 1982). In the present study, the lowest level of dissolved oxygen
in the ponds was 0.6 mg/l. As suggested by Teichert-Coddington and Green (1993), it may be
both the duration of hypoxic episodes and the level of dissolved oxygen rather than the level
of dissolved oxygen alone that determine the effect of hypoxia on fish. During over-wintering
in ponds, Nile tilapia frequently experience mortality in the study area (the Nile delta, Egypt).
In a previous study (Charo-Karisa et al., 2005), we showed that small body weight (<5
grams) was a significant factor reducing cold tolerance of juvenile Nile tilapia. The variation
in survival rates in this study was mainly due to pond and initial weight effects. Although our
fish are likely to have been larger than 5g at the onset of winter, size effects may still have
played a role in fish survival during the over-wintering period.
In the present study, we found a substantial amount of additive genetic variation and low
common environmental effects for survival. The heritability (h2) estimates of survival in this
study are comparable with estimates of earlier studies in fish. For example, Standal and
Gjerde (1987) and Rye et al. (1990) reported heritability estimates (0.04 to 0.21) for Atlantic
salmon and Rainbow trout from the sire component and higher heritability from the dam
Heritability and response to selection for growth of Nile tilapia ___________________________________________________________________________
83
component of variance (0.25 and 0.87). Gjerde et al. (2004) found zero heritability and higher
common environmental effects (0.12) for survival in Atlantic cod, suggesting non-additive
genetic common environmental effects. In Nile tilapia reared in ponds, Eknath et al. (1998)
reported lower heritability (0.08) compared to the present study. Murray et al. (1993) found
differences in survival of the coastal and interior populations of Coho salmon. Fish in the
present study had to go through an over-wintering period while those in Eknath et al. (1998)
did not. Exposure to the cold over-winter period could explain the higher heritability found in
our study. The h2 estimates in the present study indicate prospects for improvement of this
trait by selection. Although interesting, we could not obtain reliable estimates of correlations
between survival and initial weight or between survival and BW due to high standard errors.
4.4 Genetic parameters and selection response for growth
In this study, we found high h2 estimates for body weight with a c2 of around 10%. The h2
estimates in this study were at the high end of earlier estimates in ponds receiving
supplementary feeds (e.g. Velasco et al., 1995; Ponzoni et al., 2005). Eknath et al. (1995)
estimated heritability in fertilized ponds receiving no supplementary feeds and obtained a
lower h2 estimate (0.20). Generally, literature indicates widely varying h2 estimates (0.04 to
0.60, Tave and Smitherman 1980; Eknath et al., 1993; Eknath et al., 1998; Bolivar and
Newkirk, 2002; Ponzoni et al., 2005; Rutten et al., 2005a, b) and considerable c2 (Ponzoni et
al., 2005; Rutten et al., 2005a, b) for body weight of mature Nile tilapia in different systems.
Although we found higher c2 in early growth of Nile tilapia in fertilized ponds (Charo-Karisa
et al., in press), the c2 may have reduced with age. The high heritability and low common
environmental effects recorded under the rearing conditions in this study indicate sufficient
additive genetic effects for selection in low input.
We found a substantial selection response for growth, which was higher than in earlier
studies. Earlier studies indicated average genetic gains of between 8.4 –17% per generation in
ponds, cages and tanks receiving pelleted feeds (Eknath et al., 1998; Bolivar and Newkirk,
2002; Ponzoni et al., 2005). However, response in the present study may have been over-
estimated due to the confounding of genetic and environmental effects. The actual or
“realized” phenotypic change will correspond to the expected response to selection only
when the environmental effects on the parental and progeny generation are identical (Gall et
Chapter 5 ___________________________________________________________________________
84
al., 1993). The differences between the observed and expected increase BW in this study
indicate that the environment in G2 was better than in G0 and G1. Furthermore, G2 were reared
for 25-29 days more than the previous generations. To separate year-effects from genetic
effects, it was planned to produce progeny of a number of sires in more than one generation.
However, due to fish mortality or tag loss before the next spawning season, this could not be
realized. If sires had been used in more than one generation, there would have been genetic
links across years which would have resolved the confounding of genetic and environmental
effects in the current experiment.
We have compared the selection differential within a generation with the realized change
over years. The latter change, however, is the combined effect of selection differential and
environmental changes. Results suggest that selection has been successful. To further support
that, we have estimated the difference in BW between offspring of the 10 sires with the
highest EBV and the average of the offspring from all sires. In G0, the average EBV of all
selected sires was 24.2 g higher than the average of all selected sires in G0. Based on this, the
G1 offspring of all the best 10 sires are expected to have 12.1 g higher BW assuming average
group of dams. The realized difference in G1 was 9 g or 74.4% of the expected value. The G2
offspring of the 10 best G1 sires were expected to have 5.2 g higher BW, while the realized
difference was 7.8 g or 150% of the expected response. Assuming a four month over-
wintering period within which there was negligible growth, the 25 day difference between G1
and G2 would have increased the BW of G2 by 16.4 g, or 38.8% of the realized increase in
BW from G1 to G2. This clearly demonstrates that the genetic differences between sires result
in the expected differences in their progeny.
Restrictions on inbreeding to limit its negative effects need to be considered when
implementing a selective breeding program in fish (Gjerde et al., 1996). According to Bijma
(2000), the acceptable level of in-breeding, as determined primarily by the extent of
inbreeding depression on fitness, is between 0.5% and 1% per generation. In the present
study, the inbreeding coefficient after two generations of selection was 0.012. This indicates
that the observed response in this study was not at the expense of fitness of the population. It
should be noted that with more generations of selection, the inbreeding coefficient is likely to
increase. Considering the consistent increase in body weight across generations and the high
Heritability and response to selection for growth of Nile tilapia ___________________________________________________________________________
85
heritability estimates, we can conclude that there are good prospects for selection of Nile
tilapia for growth in low-input conditions.
5.0 Acknowledgements
This study is part of the first author’s Ph-D study, funded by INREF-Pond, Wageningen
University (www.inref-pond.org) and the World Fish Center. We acknowledge the staff of
The WorldFish Centre, Abbassa, Egypt for providing the necessary help and facilities during
the experiments.
References
Abdalla, A.A.F., Mcnabb, C.D., Batterson, T.R., 1993. Ammonia dynamics in fertilized fish
ponds stocked with Nile Tilapia. Prog. Fish-Cult. 58, 117-123.
Abdeghany, A.E., Ahmad, M.H., 2002. Effects of feeding rates on growth and production of
Nile tilapia, common carp and silver carp polycultured in fertilized ponds. Aquac.
Res. 33, 415-423.
Alanärä, A., 1996. The use of self-feeders in rainbow trout Oncorhynchus mykiss production.
Aquaculture 145, 1-20.
Bentsen, H.B., Eknath, A.E., Palada de Vera, M.S., Danting, J.C., Bolivar, H.L., Reyes, R.A.,
Dionisio, E.E., Longalong, F.M., Circa A.V., Tayamen M.M., Gjerde, B., 1998.
Genetic improvement of farmed tilapias: growth performance in a complete diallel
cross experiment with eight strains of Oreochromis niloticus. Aquaculture 160, 145-
173.
Bijma, P., 2000. Long-term genetic contributions. Prediction of rates of inbreeding and
genetic gain in selected populations. PhD thesis, Animal Breeding and Genetics
Group, Wageningen University, The Netherlands, 225 p.
Bolivar, R.B., Newkirk, G.F., 2002. Response to within family selection for body weight in
Nile tilapia (Oreochromis niloticus) using a single-trait animal model. Aquaculture
204, 371-381.
Bowen, S.H., 1982. Feeding, digestion and growth-qualitative considerations. In: Pullin,
R.S.V. and Lowe-McConnell, R.H. (Eds.). The Biology and Culture of Tilapias,
ICLARM Conf. Proc. 7, International Center for Living Aquatic Resources
Management, Manila, Philippines, pp. 141-156.
Chapter 5 ___________________________________________________________________________
86
Charo-Karisa, H., Rezk, M.A., Bovenhuis, H., Komen, H., 2005. Heritability of cold
tolerance in Nile tilapia, Oreochromis niloticus, juveniles. Aquaculture 249, 115–123.
Charo-Karisa, H., Komen, H., Reynolds, S., Rezk, M. A., Ponzoni R.W., Bovenhuis, H.,
2006. Genetic and environmental factors affecting growth of Nile tilapia
(Oreochromis niloticus) juveniles: Modelling spatial correlations between hapas.
Aquaculture, in press.
Chervinski, J., 1982. Environmental physiology of tilapias. In: R.S.V. Pullin and R.H. Lowe-
McConell (Eds.). The Biology and Culture of Tilapias. ICLARM Conference
Proceedings 7. International Center for Living Aquatic Resources Management,
Manila, Philippines, pp. 119-128.
Coche, A.G., 1982. Cage culture of tilapias. In: R.S.V. Pullin and R.H. Lowe-McConell
(Eds.), The Biology and culture of Tilapia. ICLARM Conference Proceedings 7.
International Center for Living Aquatic Resources Management, Manila, Philippines,
pp. 205-246.
Doupe, R.G., Lymbery, A.J., 2003. Toward the genetic improvement of feed conversion
efficiency in fish. J. World Aquac. Soc., 245-254.
Eknath, A. E., Reyes, R.A., Bolivar, H.L., de Vera, M.P., Danting, J.C., Dionisio, E.D.,
Longalong, F.M., 1995. Genetic improvement of farmed tilapia: estimation of genetic
variation and heritability for age and size at first spawning in Nile tilapia
(Oreochromis niloticus). Aquaculture 137, 279-280.
Eknath, A.E., Dey, M.M., Rye, M., Gjerde, B., Abella, T.A., Sevilleja, R., Tayamen, M.M.,
Reyes, R.A., Bentsen, H.B., 1998. Selective breeding of Nile tilapia for Asia. In Proc.
6th World Cong. Genet. Appl. Livest. Prod. 27, 89-96.
Eknath, A.E., Tayamen, M.M., Palada-de Vera, M.S., Danting, J.C., Reyes, R.A., Dionisio,
E.E., Capili, J.B., Bolivar, H.L., Abella, T.A., Circa, A.V., Bentsen, H.B., Gjerde, B.,
Gjedrem, T., Pullin, R.S.V.P., 1993. Genetic improvement of farmed tilapias: growth
performance of eight strains of Oreochromis niloticus tested in different farm
environments. Aquaculture 111, 171-188.
Gall, G.A.E., Bakar, Y.B., Famula, T., 1993. Estimating genetic change from selection.
Aquaculture 111, 75-88.
Gilmour, A.R., Gogel, B.J., Cullis, B.R., Welham, S.J., Thompson, R., 2002. ASReml User
Guide Release 1.0 VSN International Ltd, Hemel Hempstead, HP11ES, UK.
Heritability and response to selection for growth of Nile tilapia ___________________________________________________________________________
87
Gjedrem, T., 1983. Genetic variation in quantitative traits and selective breeding in fish and
shellfish. Aquaculture 33, 51-72.
Gjerde, B., Gjoen, H.M., Villanueva, B., 1996. Optimum designs for fish breeding programs
with constrained inbreeding: Mass selection for normally distributed traits. Livest.
Prod. Sci. 47, 59-72.
Grant, J.W.A., 1993. Whether or not to defend? The influence of resource distribution. Mar.
Behav. Physiol. 23, 137-153.
Green B.W., 1992. Substitution of organic manure for pelleted feed in tilapia production.
Aquaculture 101, 213-222.
Huang, C.M., Liao, I.C., 1990. Response to mass selection for growth rate in Oreochromis
niloticus. Aquaculture 85, 199-205.
Hulata, G., Wohlfarth, G.W., Halevy, A., 1986. Mass selection for growth rate in the Nile
tilapia (Oreochromis niloticus). Aquaculture 57, 177-184.
Knud-Hansen, C.F., Batterson, T.R., McNabb, CD., Harahat, I.S., Sumantadinata, K.,
Eidman, H.M., 1991. Nitrogen input, primary productivity and fish yield in fertilized
freshwater ponds in Indonesia. Aquaculture 94, 49-63.
Liti, D., Cherop, L., Munguti, J., Chhorn, L., 2005. Growth and economic performance of
Nile tilapia (Oreochromis niloticus L.) fed on two formulated diets and two locally
available feeds in fertilized ponds. Aquac. Res. 36, 746-752.
Macaranas, J.M., Mather, P.B., Lal, S.N., Vereivalu, T., Lagibalavu, M., Capra, M.F., 1997.
Genotype and environment: A comparative evaluation of four stocks in Fiji.
Aquaculture 150, 11-24.
Moriarty, D.J.W., 1973. The physiology of digestion of blue-green algae in the cichlid fish,
Tilapia nilotica. J. Zool. (Lond.) 171, 25-39.
Moriarty, D.J.W., Moriarty, C.M., 1973. The assimilation of carbon from phytoplankton by
two herbivorous fishes, Tilapia nilotica and Haplochromis nigripinnus. J. Zool.
(Lond.) 171, 41-55.
Nguenga, D., Breine, J.J., Sulem Yong, S., Teugels, G.G., Ollevier, F., 1997. Effect of animal
manure and chemical fertilizer on the growth and survival of Tilapia cameronensis
Holly in Cameroon. Aquac. Res. 28, 231-234.
Chapter 5 ___________________________________________________________________________
88
Ponzoni, R.W., Hamzah, A., Tan, S., Kamaruzzaman, H., 2005. Genetic parameters and
response to selection for live weight in the GIFT strain of Nile tilapia (Oreochromis
niloticus). Aquaculture 247, 203-210.
Pullin, R.S.V., 1985. Tilapia: everyman’s fish. Biologist 32, 84-88.
Rezk, M.A., Kamel, E.A., Dawood, T.I., Dunham, R.A., 2004. Heritability estimates for
some important traits in Egyptian Nile tilapia, Oreochromis niloticus. In:
Aquaculture-An Ecologically sustainable and Profitable venture, World Aquaculture
Society Conference Proceedings, 1-5 March 2004, Honolulu, Hawaii, USA.
Aquaculture 2004 Book of Abstracts, 708pp.
Rezk, M.A., Kamel, E.A., Ramadan, A.A., Dunham, R.A., 2002. Comparative growth of
Egyptian tilapias in response to declining water temperature. Aquaculture 207, 239-
247.
Riley, J., Edwards, P., 1998. Statistical aspects of aquaculture research: pond variability and
pseudoreplication. Aquac. Res. 29, 281-288.
Rutten, M.J.M., Bovenhuis, H., Komen, H., 2005a. Genetic parameters for fillet traits and
body measurements in Nile tilapia (Oreochromis niloticus L.). Aquaculture 246, 125-
132.
Rutten, M.J.M., Bovenhuis, H., Komen, H., 2005b. Longitudinal genetic analysis of Nile
tilapia (Oreochromis niloticus L.) body weight using a random regression model.
Aquaculture 246, 101-113.
Rutten, M.J.M., Bovenhuis, H., Komen, J., Bijma P., 2005c. Is competitive behavior in Nile
tilapia (Oreochromis niloticus L.) heritable? In: Rutten, M.J.M., 2005. Breeding for
improved production of Nile tilapia (Oreochromis niloticus L.), Doctoral Thesis,
Wageningen University, pp. 74-85.
Smart, T., Riley, J., Haylor, G., 1997. Eliminating pond differences with cross-over designs.
Aquac. Res. 28, 621-627.
Tave, D., Smitherman, R.O., 1980. Predicted response to selection for early growth in Tilapia
nilotica. Trans. Am. Fish. Soc. 109, 439-445.
Teichert-Coddington, D., Green B.W., 1993. Tilapia yield improvement through maintenance
of minimal oxygen concentrations in experimental grow-out ponds in Honduras
Aquaculture 118, 63-71.
Heritability and response to selection for growth of Nile tilapia ___________________________________________________________________________
89
Teichert-Coddington, D.R., Smitherman, R.O., 1988. Lack of response by Tilapia nilotica to
mass selection for rapid early growth. Trans. Am. Fish. Soc. 117, 297-300.
Velasco, R.R., Janagap, C.C., De Vera, M.P., Afan, L.B., Reyes, R.A., Eknath, A.E., 1995.
Genetic improvement of farmed tilapias: estimation of heritability of body and carcass
traits of Nile tilapia (Oreochromis niloticus). Aquaculture 137, 280-281.

Chapter 6
Phenotypic and genetic parameters for body
measurements, reproductive traits and gut
length of Nile tilapia (Oreochromis niloticus)
selected for growth in low-input earthen ponds
Harrison Charo-Karisaa,b,c, Henk Bovenhuisb, Mahmoud A. Rezkc,
Raul W. Ponzonid, Johan A.M. van Arendonkb, Hans Komenb
a Fish Culture and Fisheries Group, Wageningen Institute of Animal Sciences (WIAS), Wageningen
University, P.O. Box 338, 6700 AH, Wageningen, The Netherlands
b Animal Breeding and Genetics Group, Wageningen Institute of Animal Sciences (WIAS),
Wageningen University, P.O. Box 338, 6700 AH, Wageningen, The Netherlands
c Regional Center for Africa and West Asia, The World Fish Center, Abbassa, Abou Hammad, Egypt
dWorldFish Center, Jalan Batu Maung, 11960 Batu Maung, Penang, Malaysia
Aquaculture, submitted
Chapter 6 ___________________________________________________________________________
92
Abstract
This study presents estimates of phenotypic and genetic parameters for body size
measurements, reproductive traits, and gut length for Nile tilapia (Oreochromis niloticus)
selected for growth in fertilized earthen ponds for two generations. Throughout the
experiment, ponds were fertilized daily with 50 kg dry matter, (dm) / ha chicken manure. No
supplementary feeds were added. For the analysis, 6429 fully pedigreed experimental fish
from G0, G1 and G2 were used. Generations were discrete and therefore parameters were
estimated separately for each year. Heritability estimates for body measurements were high
and ranged from 0.4-0.6 for standard length to 0.69-0.79 for head length. Phenotypic
correlations between body weight and body measurements ranged from 0.64 to 0.89. Genetic
correlations were close to unity. The heritability estimate for maturity at harvest was 0.13.
Heritabilities for carcass traits were estimated from G1 only and were 0.16 for gutted weight
and 0.06 for dressing percentage. Phenotypic correlation between body weight and gutted
weight was 0.84 and the genetic correlation was 0.20. Gut length increased with selection for
body weight. Heritability estimate for gut length was 0.22. Moreover, gut length and body
weight were genetically highly correlated. These results indicate that tilapia selected for
growth on a herbivorous diet may develop longer guts as a mechanism for increasing
absorptive capacity through increase of surface area and hence more efficient nutrient
absorption.
Keywords: Nile tilapia; Oreochromis niloticus; Phenotypic correlations; genetic correlations;
reproductive traits; body measurements; gut length
1.0 Introduction
The breeding objective of most fish selective breeding programs is enhanced growth rate
which leads to more efficient fish production (Gjedrem, 1997). A number of selective
breeding programs have been initiated to improve the growth of O. niloticus in ponds
receiving supplementary feed (Hulata et al., 1986; Eknath et al., 1993; Bensten et al., 1998).
These selection programs have typically been carried out in relatively favorable environments
receiving supplementary feed. However, there are reports that the gains of selection in Nile
tilapia were lost when selected breeds were tested in less favorable environments (Macaranas
et al., 1997). This could indicate that the expression of body weight in different
Phenotypic and genetic parameters in Nile tilapia ___________________________________________________________________________
93
environments, i.e. low and high-input culture conditions, is influenced partly by a different
set of genes.
In an earlier paper (Charo-Karisa et al., in prep), we reported phenotypic and genetic
parameters for growth and survival from an experiment in which Nile tilapia had been
selected for body weight during two generations in fertilized ponds with no supplementary
feed. Heritabilities for body weight were between 0.4 and 0.6, and for survival between 0.03
and 0.14. We also observed a considerable selection response for growth. In the present
study, we report on the analysis of body measurements, carcass traits and reproductive traits
collected during this selection experiment for improved growth of O. niloticus. Knowledge of
the correlated changes that occur in other traits due to selection for growth is important for
the design of an efficient genetic improvement program (Falconer and Mackay, 1996). For
Nile tilapia, phenotypic and genetic correlations have been estimated between body weight,
body measurements and fillet weight (Rutten et al., 2004; 2005) and between body weight
and reproductive traits (Kronert et al., 1989). These authors carried out experiments in indoor
recirculation systems and under conditions with high protein pellets, respectively. Phenotypic
and genetic correlations between traits in Nile tilapia reared in fertilized ponds are lacking.
2.0 Materials and Methods
2.1 Background information
The experiment was carried out at the Regional Center for Africa and West Asia of the World
Fish Center, Abbassa, Egypt. Fish used for this study were the grandparental population (G0)
produced in 2002, the G1 generation produced in 2003, and G2 generation produced in 2004.
G1 and G2 were the first and second generations of selection respectively.
2.2 The founder population and production of G0
The founder population (i.e. parents of the G0 population) was produced in spring of 2000 in
a full diallel mating design among local Egyptian strains namely Maryout, Zawia, Abbasa
and Aswan (Rezk et al., 2002; 2004). Eighty sires and 105 dams, selected at random from
among the founder stock, were subsequently used to produce the G0. Each sire was mated to
two dams and each dam mated to only one sire, thus generating full and half sib groups. Fry
were raised in 2 x 1 x 1 m hapas suspended in concrete tanks and were fed twice daily with
Chapter 6 ___________________________________________________________________________
94
40% protein supplements, initially in the form of powder and later as pellets. Initial feeding
rate was 20% of body weight, which was gradually reduced to 5% body weight at tagging
size (i.e. mean wet weight of 2g).
2.3 Production of G1 and G2
The first and second generations of selection, G1 and G2, were produced in 2 x 3 x 1 m hapas
suspended in fertilized ponds. Each sire was mated to two dams as in G0. Fifty sires and 87
dams were used to produce generation G1, while for generation G2, 54 sires and 104 dams
were used. At first, each sire was kept in a single hapa with two dams. Twice a week, hapas
were checked for occurrence of spawning. Spawning was assumed to have occurred when the
dam had eggs or yolk-sac fry in her mouth. The un-spawned dam and the sire were both
transferred to an adjacent hapa thus producing the paternal half-sibs. To prevent multiple
spawning, the male was removed immediately after spawning occurred. When swim-up fry
were sighted in both hapas, the females were also removed. Two to three weeks later, the
number of swim-up fry in each hapa was reduced to 80 individuals. In contrast to the G0, the
G1 and G2 fry were given no supplementary feeds and were reared in hapas suspended in the
earthen ponds. To boost natural pond productivity, ponds with hapas containing fry were
fertilized daily with chicken manure at the rate of 50 kg dry matter, dm /ha.
2.4 Grow-out and pond management (G0, G1 and G2)
As soon as a family reached suitable tagging size, 24 randomly chosen fry from each full-sib
family were individually tagged with Floy® tags and returned into the hapas until stocking.
Fry were between 31-96 days old at stocking. Each family of fry was randomly divided into
two groups which were then stocked in two 1000 m2 fertilized earthen ponds for grow-out.
Ponds were daily supplied with dry chicken manure from layer and broiler farms at the rate of
50-kg dry matter (dm)/ha. This fertilization rate corresponds to 0.3 kg nitrogen ha-1 day-1
which is enough to support yields of 4.3 kg fish BW ha-1 day-1 (calculated from Knud-Hansen
et al., 1991). Fish that died within the first week of stocking were, when possible, replaced
with individuals from the same family. After approximately 8 months of growth, which
included 3-4 months of over-wintering, fish were harvested by seine netting.
Phenotypic and genetic parameters in Nile tilapia ___________________________________________________________________________
95
2.5 Trait measurements
Before measurements were taken, fish were anaesthetized with MS222 (3-aminobenzoic acid
ethyl ester) to avoid handling stress. Each fish was measured for body weight (BW).
Breeding values were estimated from an animal model (Model 1 below). These estimates
were used to select 100 males and 200 females as potential brooders for the next generation.
After selection of brooders, the following body traits were taken on fish which were not
earmarked for breeding: maximum body depth (BD), body thickness (BT), head width (HW),
and head length (HL). Body measurements were taken by six persons using vernier calipers.
The positions on which the body measurements were taken are shown in Figure 1.
After recording of body measurements, the fish were dissected; guts removed and gutted
body weight recorded. Because of high mortality of fish after harvest, only a few fish were
gutted in G0 and G2. Guts were fixed in 10% formalin for later measurement of gut length.
The length of gut (from the stomach to anus) was determined by extending the guts over a
meter rule. Gonads were removed and placed between bloating papers to remove excess fluid
and weighed. They were then checked macroscopically for determination of maturity stage.
Sexual maturity was scored according to Legendre and Ecoutin (1989). Stage 1 refers to
immature females (translucent and elongated ovaries with no oocytes); stage 2 refers to
females beginning maturation (few small cream coloured oocytes); stage 3 refers to maturing
females (light yellow ovaries with numerous distinct small and large oocytes with
cytoplasmic vacuoles). Females at stage 4 are ready to spawn (large bright yellow pear-
shaped or oval oocytes, with few smaller oocytes), stage 5 are ripe females (predominantly
dull yellow large oocytes fully yolked), and stage 6 are spent or post-spawning females
(shrunken and reddish ovaries with resorbed oocytes). For males, three maturity stages were
scored as follows: Stage 1 as immature (thread-like), stage 2 as maturing (absence of intra-
testicular sperm) and stage 3 as mature (presence of intra-testicular sperm). Female gonads at
advanced vitellogenesis (stage 4 and 5) were fixed in formalin for determination of fecundity.
Absolute fecundity was estimated by counting the number eggs in 0.5 g of the ovaries and
multiplying with the total ovary weight.
The weight of visceral organs was determined as the difference between whole body weight
and the sum of gutted body and gonad weight. The following traits were calculated for each
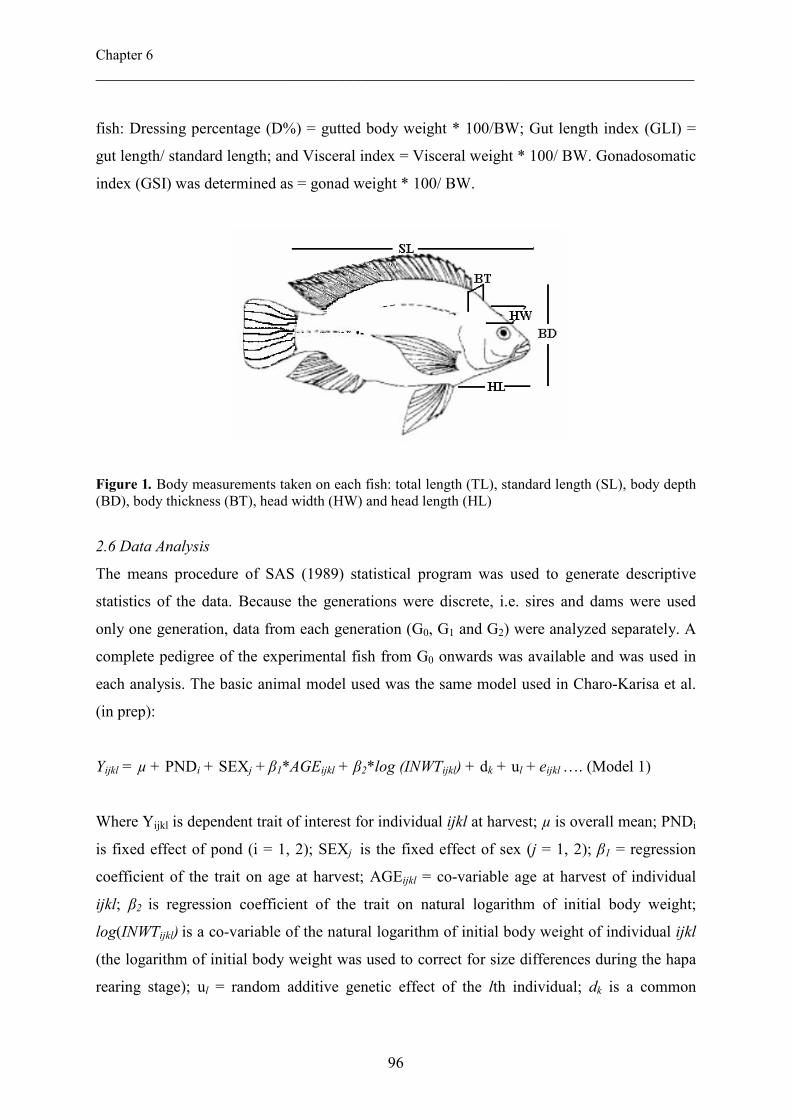
Chapter 6 ___________________________________________________________________________
96
fish: Dressing percentage (D%) = gutted body weight * 100/BW; Gut length index (GLI) =
gut length/ standard length; and Visceral index = Visceral weight * 100/ BW. Gonadosomatic
index (GSI) was determined as = gonad weight * 100/ BW.
Figure 1. Body measurements taken on each fish: total length (TL), standard length (SL), body depth (BD), body thickness (BT), head width (HW) and head length (HL)
2.6 Data Analysis
The means procedure of SAS (1989) statistical program was used to generate descriptive
statistics of the data. Because the generations were discrete, i.e. sires and dams were used
only one generation, data from each generation (G0, G1 and G2) were analyzed separately. A
complete pedigree of the experimental fish from G0 onwards was available and was used in
each analysis. The basic animal model used was the same model used in Charo-Karisa et al.
(in prep):
Yijkl = µ + PNDi + SEXj + β1*AGEijkl + β2*log (INWTijkl) + dk + ul + eijkl …. (Model 1)
Where Yijkl is dependent trait of interest for individual ijkl at harvest; µ is overall mean; PNDi
is fixed effect of pond (i = 1, 2); SEXj is the fixed effect of sex (j = 1, 2); β1 = regression
coefficient of the trait on age at harvest; AGEijkl = co-variable age at harvest of individual
ijkl; β2 is regression coefficient of the trait on natural logarithm of initial body weight;
log(INWTijkl) is a co-variable of the natural logarithm of initial body weight of individual ijkl
(the logarithm of initial body weight was used to correct for size differences during the hapa
rearing stage); ul = random additive genetic effect of the lth individual; dk is a common
Phenotypic and genetic parameters in Nile tilapia ___________________________________________________________________________
97
environmental/ full-sib effect which included a quarter of dominance effects, and
environmental effect of common hapa rearing; and eijkl = random residual effect associated
with an individual.
Heritabilities were estimated using a bivariate setting of Model 1. In the bivariate analysis,
the first trait was always body weight, the trait of selection, which was available for all
animals. The second trait was measured only on the individuals that not selected as brooders,
and the heritability was estimated for this trait. In the bivariate analysis, body measurements
were also corrected for the fixed effect of slaughter day. The genetic and phenotypic
correlations between traits were estimated from a trivariate setting of the model. In the
trivariate model, the first trait was always body weight and the second and third traits were
the traits for which correlations were being estimated. As in the bivariate analysis, traits that
were measured on the slaughtered individuals were also corrected for the effect of day of
slaughter.
Gonad weight and GSI were analyzed separately for each sex. For the estimation of the
heritability, the maturity stages were reclassified into two groups, either mature or immature.
Female fish at stages 1, 2 or 3 were considered immature and were coded as 0, while fish at
stages 4, 5 or 6 were considered mature and were coded as 1. Males at stage 1(immature)
were coded as 0 while stages 2 and 3 were coded as 1. Variance components were estimated
from the G1 data set, using a model which included maturity stage as a fixed effect and
animal and dam as random effects.
3.0 Results
3.1 Descriptive statistics
The descriptive statistics of body measurements, reproductive traits and gut length are shown
in Table 1. Body measurements were taken on 522 fish in G0, 804 fish in G1 (after brooders
were selected) and 1207 fish (all harvested fish with tags) in G2. The lower number of fish
measured for some traits were due to fish mortalities, and spoilt samples. Mean age at harvest
was 289, 293 and 318 days in G0, G1, and G2 respectively. Generally, fish increased in size
across generations. The phenotypic means of body weight increased from 67.8 g in G0 to 129
g in G2. Standard length increased from 12.0 cm in G0 to 14.8 cm in G2; body depth increased
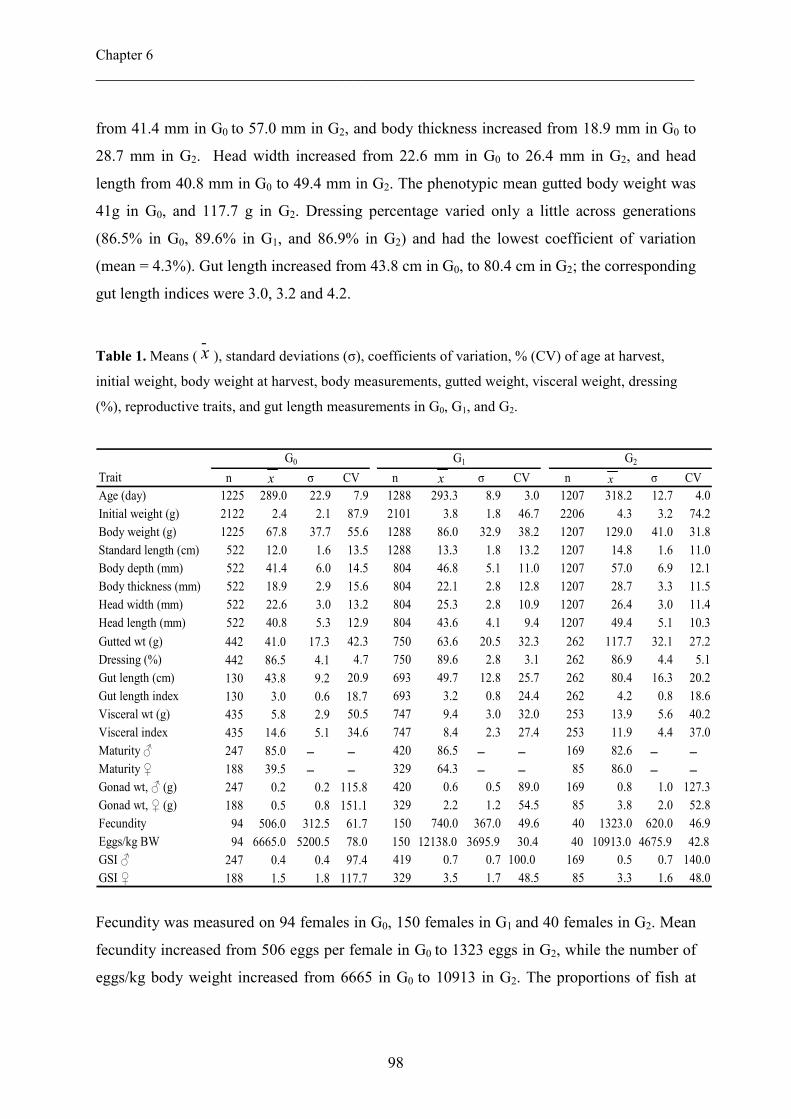
Chapter 6 ___________________________________________________________________________
98
from 41.4 mm in G0 to 57.0 mm in G2, and body thickness increased from 18.9 mm in G0 to
28.7 mm in G2. Head width increased from 22.6 mm in G0 to 26.4 mm in G2, and head
length from 40.8 mm in G0 to 49.4 mm in G2. The phenotypic mean gutted body weight was
41g in G0, and 117.7 g in G2. Dressing percentage varied only a little across generations
(86.5% in G0, 89.6% in G1, and 86.9% in G2) and had the lowest coefficient of variation
(mean = 4.3%). Gut length increased from 43.8 cm in G0, to 80.4 cm in G2; the corresponding
gut length indices were 3.0, 3.2 and 4.2.
Table 1. Means ( - x ), standard deviations (σ), coefficients of variation, % (CV) of age at harvest,
initial weight, body weight at harvest, body measurements, gutted weight, visceral weight, dressing
(%), reproductive traits, and gut length measurements in G0, G1, and G2.
Trait n σ CV n σ CV n σ CV
Age (day) 1225 289.0 22.9 7.9 1288 293.3 8.9 3.0 1207 318.2 12.7 4.0
Initial weight (g) 2122 2.4 2.1 87.9 2101 3.8 1.8 46.7 2206 4.3 3.2 74.2
Body weight (g) 1225 67.8 37.7 55.6 1288 86.0 32.9 38.2 1207 129.0 41.0 31.8
Standard length (cm) 522 12.0 1.6 13.5 1288 13.3 1.8 13.2 1207 14.8 1.6 11.0
Body depth (mm) 522 41.4 6.0 14.5 804 46.8 5.1 11.0 1207 57.0 6.9 12.1
Body thickness (mm) 522 18.9 2.9 15.6 804 22.1 2.8 12.8 1207 28.7 3.3 11.5
Head width (mm) 522 22.6 3.0 13.2 804 25.3 2.8 10.9 1207 26.4 3.0 11.4
Head length (mm) 522 40.8 5.3 12.9 804 43.6 4.1 9.4 1207 49.4 5.1 10.3
Gutted wt (g) 442 41.0 17.3 42.3 750 63.6 20.5 32.3 262 117.7 32.1 27.2
Dressing (%) 442 86.5 4.1 4.7 750 89.6 2.8 3.1 262 86.9 4.4 5.1
Gut length (cm) 130 43.8 9.2 20.9 693 49.7 12.8 25.7 262 80.4 16.3 20.2
Gut length index 130 3.0 0.6 18.7 693 3.2 0.8 24.4 262 4.2 0.8 18.6
Visceral wt (g) 435 5.8 2.9 50.5 747 9.4 3.0 32.0 253 13.9 5.6 40.2
Visceral index 435 14.6 5.1 34.6 747 8.4 2.3 27.4 253 11.9 4.4 37.0
Maturity ♂ 247 85.0 c c 420 86.5 c c 169 82.6 c c
Maturity ♀ 188 39.5 c c 329 64.3 c c 85 86.0 c c
Gonad wt, ♂ (g) 247 0.2 0.2 115.8 420 0.6 0.5 89.0 169 0.8 1.0 127.3
Gonad wt, ♀ (g) 188 0.5 0.8 151.1 329 2.2 1.2 54.5 85 3.8 2.0 52.8
Fecundity 94 506.0 312.5 61.7 150 740.0 367.0 49.6 40 1323.0 620.0 46.9
Eggs/kg BW 94 6665.0 5200.5 78.0 150 12138.0 3695.9 30.4 40 10913.0 4675.9 42.8
GSI ♂ 247 0.4 0.4 97.4 419 0.7 0.7 100.0 169 0.5 0.7 140.0
GSI ♀ 188 1.5 1.8 117.7 329 3.5 1.7 48.5 85 3.3 1.6 48.0
G1G0 G2
x x x
Fecundity was measured on 94 females in G0, 150 females in G1 and 40 females in G2. Mean
fecundity increased from 506 eggs per female in G0 to 1323 eggs in G2, while the number of
eggs/kg body weight increased from 6665 in G0 to 10913 in G2. The proportions of fish at
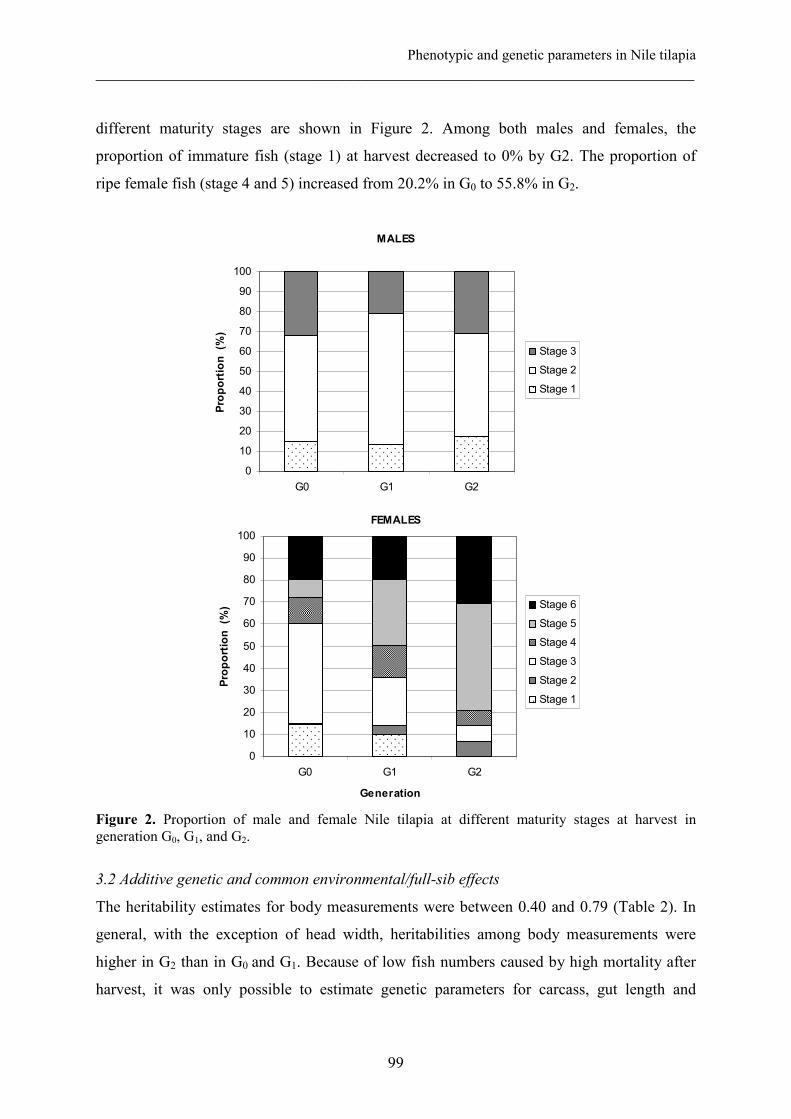
Phenotypic and genetic parameters in Nile tilapia ___________________________________________________________________________
99
different maturity stages are shown in Figure 2. Among both males and females, the
proportion of immature fish (stage 1) at harvest decreased to 0% by G2. The proportion of
ripe female fish (stage 4 and 5) increased from 20.2% in G0 to 55.8% in G2.
MALES
0
10
20
30
40
50
60
70
80
90
100
G0 G1 G2
Proportion (%
)
Stage 3
Stage 2
Stage 1
FEMALES
0
10
20
30
40
50
60
70
80
90
100
G0 G1 G2
Generation
Proportion (%
) Stage 6
Stage 5
Stage 4
Stage 3
Stage 2
Stage 1
Figure 2. Proportion of male and female Nile tilapia at different maturity stages at harvest in generation G0, G1, and G2.
3.2 Additive genetic and common environmental/full-sib effects
The heritability estimates for body measurements were between 0.40 and 0.79 (Table 2). In
general, with the exception of head width, heritabilities among body measurements were
higher in G2 than in G0 and G1. Because of low fish numbers caused by high mortality after
harvest, it was only possible to estimate genetic parameters for carcass, gut length and
Chapter 6 ___________________________________________________________________________
100
reproductive traits in G1 (Table 3). The heritability estimates for both gutted weight was 0.16,
and for dressing (%) was 0.06. The heritability estimates for gut length was 0.22 and that for
gut length index was 0.09. The heritability estimates for visceral weight and visceral index
were 0.44 and 0.03, respectively. The heritability estimate for male gonad weight was higher
(0.25) than for female gonad weight (0.18) whereas the heritability for female GSI was higher
(0.25) than for male GSI (0.03). There was generally low common environmental/ full sib
effect (c2) for body traits, and reproductive traits (Table 2 and 3).
Table 2. Estimates of total phenotypic variance (σ2P), heritability (h2) and common environmental/
full-sib effects (c2) with standard errors (in brackets) for body weight at harvest (BW), standard length (SL), body depth (BD), body thickness (BT), head width (HW) and head length (HL) in G0, G1, and G2. G0 G1 G2
Trait σ2P h2 c2 σ2P h2 c2 σ2P h2 c2
BW* 782.2 0.60 (0.08) 0.09 (0.07) 510.0 0.38 (0.12) 0.11 (0.07) 794.0 0.51 (0.19) 0.08 (0.07)
SL 4.0 0.59 (0.08) 0.01 (0.01) 1.6 0.40 (0.08) 0.03 (0.01) 1.4 0.60 (0.09) 0.01 (0.01)
BD 59.2 0.64 (0.08) 0.00 (0.00) 24.7 0.65 (0.03) 0.00 (0.00) 22.4 0.73 (0.10) 0.02 (0.01)
BT 14.4 0.60 (0.08) 0.00 (0.00) 6.9 0.53 (0.09) 0.00 (0.00) 5.7 0.62 (0.09) 0.02 (0.01)
HW 14.9 0.64 (0.08) 0.00 (0.00) 6.4 0.64 (0.09) 0.01 (0.01) 4.3 0.56 (0.09) 0.03 (0.01)
HL 43.6 0.66 (0.08) 0.00 (0.00)
17.7 0.69 (0.09) 0.00 (0.00)
13.6 0.79 (0.09) 0.01 (0.01)
* Also reported in Charo-Karisa et al., in prep.
3.3 Phenotypic and genetic correlations
Phenotypic and genetic correlations between the selection trait, body weight, and other traits
are presented in Table 4. Only the G1 dataset was used for estimation of correlations between
traits. The phenotypic correlations between body weight and body measurements were
between 0.64 and 0.89 and the genetic correlations were between 0.95 and 0.99. The
phenotypic correlation between body weight and gutted weight was 0.84, while the genetic
correlation was 0.20. On the other hand, the phenotypic correlation between body weight and
dressing percentage was 0.23 while the genetic correlation was 0.65 but with high standard
error. The phenotypic and genetic correlations between body weight and gut length were 0.29
and 0.82 respectively. Except for the genetic correlation between body weight and gonad
weight of females, other correlations between body weight and reproductive traits were low.
A full table of phenotypic and genetic correlations between traits is presented in Appendix 1.
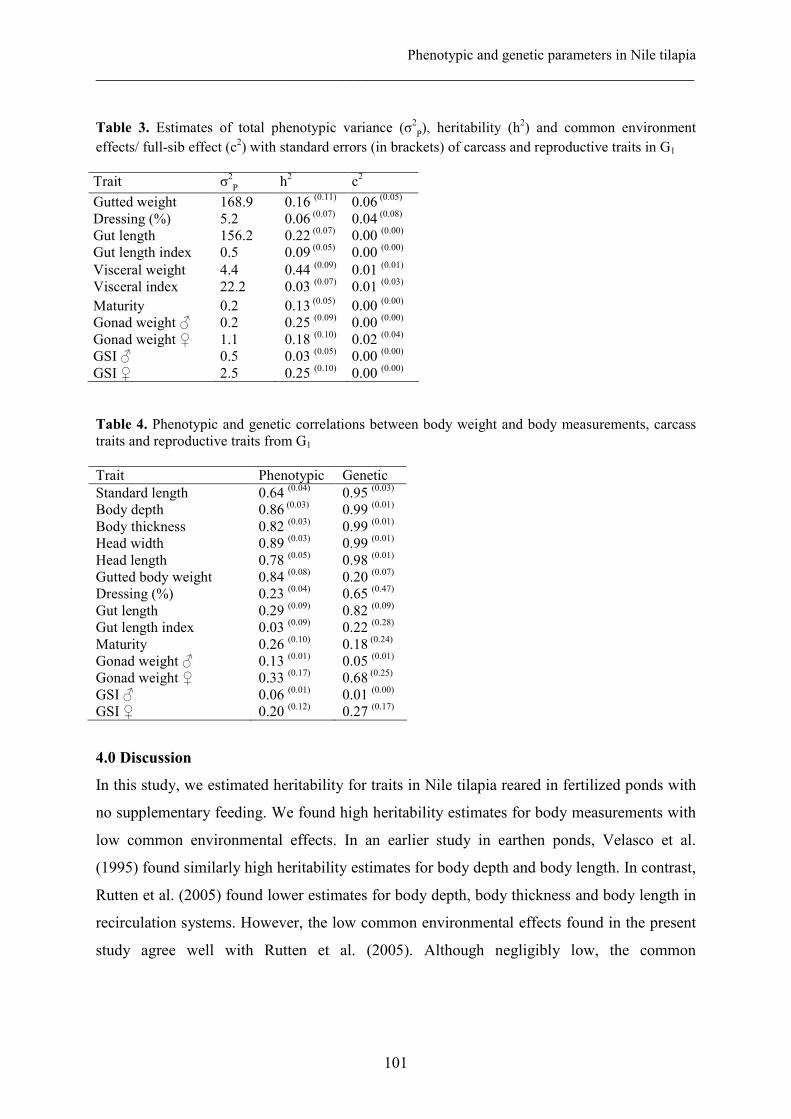
Phenotypic and genetic parameters in Nile tilapia ___________________________________________________________________________
101
Table 3. Estimates of total phenotypic variance (σ2P), heritability (h2) and common environment
effects/ full-sib effect (c2) with standard errors (in brackets) of carcass and reproductive traits in G1 Trait σ2P h2 c2
Gutted weight 168.9 0.16 (0.11) 0.06 (0.05)
Dressing (%) 5.2 0.06 (0.07) 0.04 (0.08) Gut length 156.2 0.22 (0.07) 0.00 (0.00) Gut length index 0.5 0.09 (0.05) 0.00 (0.00) Visceral weight 4.4 0.44 (0.09) 0.01 (0.01) Visceral index 22.2 0.03 (0.07) 0.01 (0.03)
Maturity 0.2 0.13 (0.05) 0.00 (0.00) Gonad weight ♂ 0.2 0.25 (0.09) 0.00 (0.00) Gonad weight ♀ 1.1 0.18 (0.10) 0.02 (0.04) GSI ♂ 0.5 0.03 (0.05) 0.00 (0.00) GSI ♀ 2.5 0.25 (0.10) 0.00 (0.00)
Table 4. Phenotypic and genetic correlations between body weight and body measurements, carcass traits and reproductive traits from G1 Trait Phenotypic Genetic Standard length 0.64 (0.04) 0.95 (0.03) Body depth 0.86 (0.03) 0.99 (0.01) Body thickness 0.82 (0.03) 0.99 (0.01) Head width 0.89 (0.03) 0.99 (0.01) Head length 0.78 (0.05) 0.98 (0.01) Gutted body weight 0.84 (0.08) 0.20 (0.07) Dressing (%) 0.23 (0.04) 0.65 (0.47) Gut length 0.29 (0.09) 0.82 (0.09) Gut length index 0.03 (0.09) 0.22 (0.28) Maturity 0.26 (0.10) 0.18 (0.24)
Gonad weight ♂ 0.13 (0.01) 0.05 (0.01) Gonad weight ♀ 0.33 (0.17) 0.68 (0.25) GSI ♂ 0.06 (0.01) 0.01 (0.00) GSI ♀ 0.20 (0.12) 0.27 (0.17)
4.0 Discussion
In this study, we estimated heritability for traits in Nile tilapia reared in fertilized ponds with
no supplementary feeding. We found high heritability estimates for body measurements with
low common environmental effects. In an earlier study in earthen ponds, Velasco et al.
(1995) found similarly high heritability estimates for body depth and body length. In contrast,
Rutten et al. (2005) found lower estimates for body depth, body thickness and body length in
recirculation systems. However, the low common environmental effects found in the present
study agree well with Rutten et al. (2005). Although negligibly low, the common
Chapter 6 ___________________________________________________________________________
102
environmental/full-sib effects for body measurements in the present study tended to be
slightly higher in later generations.
The high correlations between body weight and body measurements in the present study
agree with findings of Rutten et al. (2004; 2005). In the present study, heritability estimates
were higher for body measurements than for body weight. In contrast, the heritability
estimates for body measurements in recirculation systems (Rutten et al., 2005) were either
similar or lower than for body weight. When the correlated trait has a substantially higher
heritability than the primary selection trait and the genetic correlation between the traits is
high as in this study, indirect selection may be used (Falconer and Mackay, 1996). Our
findings suggest that selection for body measurements is a good alternative for measuring
weight. This may be the only option in field conditions where (electronic) weighing balances
are not available.
Compared to recirculation systems, the Nile tilapia harvested in fertilized ponds are on
average smaller and are usually not filleted. The fish farmer is therefore paid either for whole
or gutted body weight; gutted weight being a direct measure of how much meat the consumer
can get. In this study, the phenotypic correlation between body weight and gutted body
weight was high but the genetic correlation was low. Although the genetic correlation
between body weight and gutted body weight was low, we recorded high phenotypic means
for gutted weight in G2 which was higher than the corresponding increase in body weight.
Although the increase in gutted weight may also be due to environmental influences given the
close resemblance with the increase in body weight, one would expect that gutted body
weight would have a higher genetic correlation with body weight than is reported here. The
low genetic correlation between gutted body weight and body weight is therefore doubtful.
The consistent increase in gutted body weight across generations suggests that selection for
body weight will also improve gutted body weight. Similar to the present study, Gjerde and
Gjedrem (1984) obtained low heritability for dressing percentage in Atlantic salmon and
rainbow trout. Also, Rutten et al. (2005), working with Nile tilapia in recirculation systems,
concluded that no further response in fillet weight can be achieved by including dressing
percentage in a selection index with body weight. Although the genetic correlation between
Phenotypic and genetic parameters in Nile tilapia ___________________________________________________________________________
103
body weight and dressing percentage was with large standard errors, these results suggest that
dressing percentage may be improved by selection for body weight at harvest alone.
The phenotypic and genetic correlations between body weight and gonad weight, body
weight, GSI, and maturity obtained in this study were comparable to earlier studies in O.
niloticus by Kronert et al. (1989). Similar to the present study, Eknath et al. (1995) found
heritability for maturity at spawning of 0.15. The low genetic correlation between maturity
and body weight found in this study is consistent with studies in other fish species (Gjerde,
1986; Gjerde et al., 1994). Although excessive reproduction in culture ponds reduces the
growth of adult fish, low fecundity of tilapia can hinder the production of adequate numbers
of fingerlings for grow-out (Coward and Bromage, 2000). Given the considerable heritability,
the reproductive capacity of females and maturity at an earlier age can be improved by
selection when necessary. Longalong et al. (1999) pointed out that selection for lower
frequency of early maturing females in Nile tilapia may result in poorer growth and that
selection for improved growth may increase the frequency of early maturing females. The
low genetic correlation between maturity and body weight at harvest in the present study
indicate that it is possible to simultaneously select for late maturity and fast growth. The
fecundity and the number of eggs/kg body weight (10912 to 12138) in this study were
consistent with earlier studies (Smitherman et al., 1988; Duponchelle et al., 1998) indicating
that selection in low-input ponds did not reduce fecundity. We did not have difficulties when
reproducing the selected individuals. It should be emphasized however, that because of high
plasticity of reproductive traits in Nile tilapia (Pullin, 1982; Kronert et al., 1986; Duponchelle
et al., 1998; Duponchelle and Legendre, 2001) routine monitoring of reproductive parameters
should be done in tilapia breeding programs.
In this study, our fish were grown on a periphyton/planktonic diet induced by manure
fertilization. Herbivorous fishes are known to have longer intestines than carnivorous or
omnivorous fishes because they live on food requiring greater digestive processing (Nagase,
1964; Smith, 1989). Therefore, we expected that selection for growth would lead to tilapia
with longer relative intestine lengths. In the present study, we found that larger fish tended to
have higher gut length to size ratios. In contrast, Abdel-Tawwab and El-Marakby (2004)
found no differences in gut lengths of Nile tilapia between 25-125 g body weights. It has
Chapter 6 ___________________________________________________________________________
104
been suggested that fish size may be genetically correlated with the efficiency for absorption
of nutrients (Gjedrem and Thodesen (2005), and that growth rates of animals are
fundamentally dependent upon the systems where digestive and absorptive processes occur
(Zimmerman et al., 2005). In the present study, we found substantial additive genetic
variance for gut length and that gut length increased with selection for body weight. Gut
length and body weight were also highly genetically correlated. According to Ferraris and
Ahearn (1984), guts of herbivorous fish are long and appear structurally uniform from
stomach to rectum. However, Sklan et al., (2004) found that tilapia fed fish meal diets did not
have uniform structure and that the sites of nutrient absorption were altered. The intestine of
hybrid tilapia O. niloticus X O. aureus comprises a series of nested loops, which are lined
with villi on the luminal face, considerably enlarging the absorptive area (Sklan et al., 2004).
This suggests that having longer guts may be a mechanism for increasing absorptive capacity
through increase of surface area and hence more efficient nutrient absorption especially for
tilapia fed on a diet of periphyton and phytoplankton.
In this study Nile tilapia were selected for growth in low-input fertilized ponds. Previously,
we reported high heritability estimates and response to growth (Charo-Karisa et al., in prep).
The present findings on the correlated responses in body measurements and gut length
indicate that fish selected for growth in low input environments might become very different
from fish selected for growth on a diet of high protein pellets. Because of the diversity of Nile
tilapia fish farming systems it will be crucial to know how fish selected in high or low input
environments will perform in these different farming systems.
5.0 Acknowledgements
This study is part of the first author’s Ph-D study, funded by INREF-Pond, Wageningen
University (www.inref-pond.org) and the World Fish Center. We acknowledge the staff of
The WorldFish Centre, Abbassa, Egypt for providing the necessary help and facilities during
the experiments.
References
Abdel-Tawwab, M., El-Marakby, H., 2004. Length-weight relationship, natural food and
feeding selectivity of Nile tilapia, Oreochromis niloticus L. in fertilized earthen
Phenotypic and genetic parameters in Nile tilapia ___________________________________________________________________________
105
ponds. In: Bolivar, R., Mair, G., Fitzsimmons, K., (Eds.), New Dimensions in Farmed
Tilapia. Proceedings of the 6th International Symposium on Tilapia in Aquaculture,
Manila, 500-509.
Charo-Karisa, H., Komen, H., Rezk, M. A., Ponzoni, R.W., Van Arendonk, J., Bovenhuis, H.
(XX). Heritability estimates and response to selection for growth of Nile tilapia
(Oreochromis niloticus) in low-input earthen ponds. In prep.
Coward, K., Bromage, N.R., 2000. Reproductive physiology of female tilapia broodstock.
Reviews in Fish Biology and Fisheries 10, 1 –25.
Duponchelle, F., Legendre, M., 2001. Rapid phenotypic changes of reproductive traits in
response to experimental modifications of spatial structure in Nile tilapia,
Oreochromis niloticus. Aquat. Living Resour. 14, 145-152.
Duponchelle, F., Pouyaud, L., Legendre, M., 1998. Evidence of environmental effects on
reproductive characteristics of Nile tilapia (Oreochromis niloticus) populations from
man-made lakes of Ivory Coast. Aquat. Living Resour. 11, 137-144.
Eknath, A. E., Reyes, R.A., Bolivar, H.L., de Vera, M.P., Danting, J.C., Dionisio, E.D.,
Longalong, F.M., 1995. Genetic improvement of farmed tilapia: estimation of genetic
variation and heritability for age and size at first spawning in Nile tilapia
(Oreochromis niloticus). Aquaculture 137, 279-280.
Eknath, A.E., Dey, M.M., Rye, M., Gjerde, B., Abella, T.A., Sevilleja, R., Tayamen, M.M.,
Reyes, R.A., Bentsen, H.B., 1998. Selective breeding of Nile tilapia for Asia. In Proc.
6th World Cong. Genet. Appl. Livest. Prod. 27, 89-96.
Falconer, D.S., Mackay, T.F.C., 1996. Introduction to Quantitative Genetics. Longman,
London.
Ferraris, R. P., Ahearn, G. A., 1984. Sugar and amino acid transport in fish intestine.
Comp.Biochem. Physiol. A. 77, 397 - 413.
Gilmour, A.R., Gogel, B.J., Cullis, B.R., Welham, S.J., Thompson, R., 2002. ASReml User
Guide Release 1.0 VSN International Ltd, Hemel Hempstead, HP11ES, UK.
Gjedrem, T., 1997. Selective breeding to improve aquaculture production. World
Aquaculture March 1997, 33-45.
Gjedrem, T., and Thodesen, J., 2005. Selection. In: Gjedrem, T. (Ed.), Selection and
Breeding Programs in Aquaculture. Dordrecht. pp. 89-111.
Chapter 6 ___________________________________________________________________________
106
Gjerde, B. and Gjedrem, T., 1984. Estimates of phenotypic and genetic parameters for
carcass traits in Atlantic salmon and rainbow trout. Aquaculture 36, 97-110.
Gjerde, B., 1986. Growth and reproduction in fish and shellfish. Aquaculture 57, 37-55.
Gjerde, B., Simianer, H., Refstie, T., 1994. Estimates of genetic and phenotypic parameters
for body weight, growth rate and sexual maturity in Atlantic salmon. Livest. Prod. Sc.
38, 133-143.
Gjerde, B., Terjesen, B.F., Barr, Y., Lein, I., Thorland, I., 2004. Genetic variation for juvenile
growth and survival in Atlantic cod (Gadus morhua). Aquaculture 236, 167-177.
Kornfield, I., 1991. Genetics. pp 104-128. In: Keenleyside, M.H.A. (Ed.). Cichlid Fishes:
Behaviour, Ecology and Evolution. Chapman & Hall, New York.
Kronert, U., Horstgen-Schwark, G., Langholz, H.J., 1989. Prospects of selecting for late
maturity in Tilapia (Oreochromis niloticus) I. Family studies under laboratory
conditions. Aquaculture 77, 113-121.
Legendre, M., Ecoutin, J.M., 1989. Suitability of brackish water tilapia species from the
Ivory Coast for lagoon aquaculture. 1. Reproduction. Aquatic living resources 2, 71 -
79.
Longalong, F. M., Eknath A.E., Bentsen, H.B., 1999. Response to bi-directional selection for
frequency of early maturing females in Nile tilapia (Oreochromis niloticus).
Aquaculture 178, 13-25.
Nagase, G., 1964. Contribution to the physiology of digestion in Tilapia mossambica Peters:
digestive enzymes and the effects of diets on their activity. Zeitschrift fur
Vergleichende Physiologie 49, 270-284.
Pullin, R.S.V., 1982. General discussion on the biology and culture of tilapias. In: R.S.V.
Pullin and R.H. Lowe-McConnell (Eds.), The Biology and Culture of Tilapias.
ICLARM Conference Proceedings, Manila, The Philippines, pp. 331-352.
Rutten, M.J.M., Bovenhuis, H., Komen, H., 2004. Modeling fillet traits based on body
measurements in three Nile tilapia strains (Oreochromis niloticus L.). Aquaculture
231, 113-122.
Rutten, M.J.M., Bovenhuis, H., Komen, H., 2005. Genetic parameters for fillet traits and
body measurements in Nile tilapia (Oreochromis niloticus L.). Aquaculture 246, 125-
132.
Phenotypic and genetic parameters in Nile tilapia ___________________________________________________________________________
107
Rye, M., Lillevik, K.M., Gjerde, B., 1990. Survival in early life of Atlantic salmon and
rainbow trout: estimates of heritabilities and genetic correlations. Aquaculture 89,
209-216.
SAS Institute, 1989. User’s Guide: Statistics, Release 6.12 Edition, SAS Institute, Cary, NC.
Sklan, D., Prag, T., Lupatsch, I., 2004. Structure and function of the small intestine of the
tilapia Oreochromis niloticus X Oreochromis aureus (Teleostei, Cichlidae).
Aquaculture Research 35, 350-357.
Smith, L.S., 1989. Digestive functions in teleost fishes. Pp. 331-421. In J.E. Halver (Ed.),
Fish Nutrition, 2nd Edition. Academic Press, San Diego.
Smitherman, R.O., Khater, A.A., Cassell, N.I., Dunham, R-A., 1988. Reproductive
performance of three strains of Oreochromis niloticus. Aquaculture 70, 29-37.
Standal, M. and Gjerde, B., 1987. Genetic variation in survival of Atlantic salmon during the
sea rearing period. Aquaculture 66, 197-207.
Velasco, R.R., Janagap, C.C., de-Vera M. P., Afan L. B., Reyes, R. A., Eknath A.E., 1995.
Genetic improvement of farmed tilapias: estimation of heritability of body and carcass
traits of Nile tilapia (Oreochromis niloticus). Aquaculture 137, 280-281.
Zimmerman, A.M., Wheeler, P. A., Ristow, S.S., Thorgaard, G. H., 2005. Composite interval
mapping reveals three QTL associated with pyloric caeca number in rainbow trout,
Oncorhynchus mykiss. Aquaculture 247, 85-95.
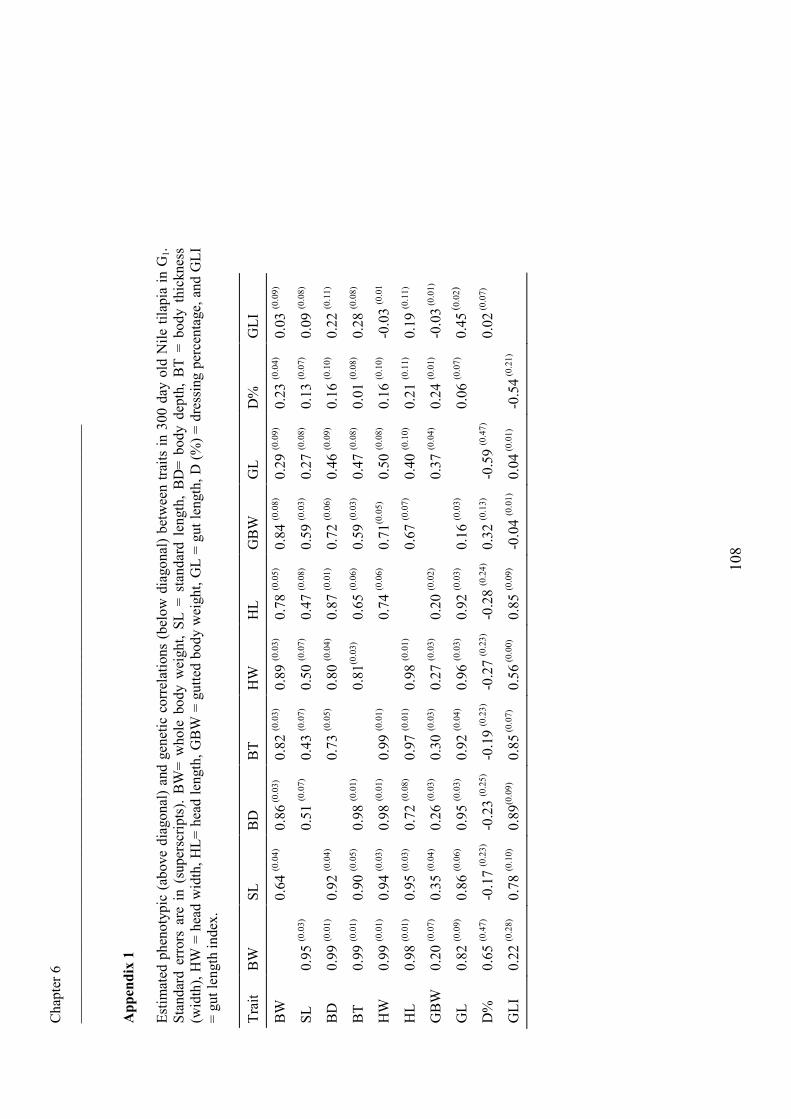
Chapter 6
___________________________________________________________________________
108
Appendix 1
Estimated phenotypic (above diagonal) and genetic correlations (below diagonal) between traits in 300 day old Nile tilapia in G
1.
Standard errors are in (superscripts). BW= whole body weight, SL = standard length, BD= body depth, BT = body thickness
(width), HW = head width, HL= head length, GBW = gutted body weight, GL = gut length, D (%) = dressing percentage, and GLI
= gut length index.
Trait
BW
SL
BD
BT
HW
HL
GBW
GL
D%
GLI
BW
0.64 (0.04) 0.86
(0.03)
0.82 (0.03) 0.89 (0.03) 0.78 (0.05) 0.84 (0.08) 0.29 (0.09) 0.23 (0.04) 0.03 (0.09)
SL
0.95 (0.03)
0.51 (0.07) 0.43 (0.07) 0.50 (0.07) 0.47 (0.08) 0.59 (0.03) 0.27 (0.08) 0.13 (0.07) 0.09 (0.08)
BD
0.99 (0.01) 0.92 (0.04)
0.73 (0.05) 0.80 (0.04) 0.87 (0.01) 0.72 (0.06) 0.46 (0.09) 0.16 (0.10) 0.22 (0.11)
BT
0.99 (0.01) 0.90 (0.05) 0.98 (0.01)
0.81
(0.03)
0.65 (0.06) 0.59 (0.03) 0.47 (0.08) 0.01 (0.08) 0.28 (0.08)
HW
0.99 (0.01) 0.94 (0.03) 0.98 (0.01) 0.99 (0.01)
0.74 (0.06) 0.71
(0.05)
0.50 (0.08) 0.16 (0.10) -0.03 (0.01
HL
0.98 (0.01) 0.95 (0.03) 0.72 (0.08) 0.97 (0.01) 0.98 (0.01)
0.67 (0.07) 0.40 (0.10) 0.21 (0.11) 0.19 (0.11)
GBW 0.20 (0.07) 0.35 (0.04) 0.26 (0.03) 0.30 (0.03) 0.27 (0.03) 0.20 (0.02)
0.37 (0.04) 0.24 (0.01) -0.03 (0.01)
GL
0.82 (0.09) 0.86 (0.06) 0.95 (0.03) 0.92 (0.04) 0.96 (0.03) 0.92 (0.03) 0.16 (0.03)
0.06 (0.07) 0.45
(0.02)
D%
0.65 (0.47) -0.17 (0.23) -0.23 (0.25) -0.19 (0.23) -0.27 (0.23) -0.28 (0.24) 0.32 (0.13) -0.59 (0.47)
0.02
(0.07)
GLI
0.22 (0.28) 0.78 (0.10) 0.89
(0.09)
0.85
(0.07)
0.56
(0.00)
0.85 (0.09) -0.04 (0.01) 0.04
(0.01)
-0.54 (0.21)
Chapter 7
Genotype by environment interaction in two
lines of Nile tilapia (Oreochromis niloticus L.)
divergently selected for growth in different
pond environments
Harrison Charo-Karisaa,b,c, Henk Bovenhuisb, Mahmoud A. Rezkc,
Raul W. Ponzonid, Johan A.M. van Arendonkb, Hans Komenb
a Fish Culture and Fisheries Group, Wageningen Institute of Animal Sciences (WIAS), Wageningen
University, P.O. Box 338, 6700 AH, Wageningen, The Netherlands
b Animal Breeding and Genetics Group, Wageningen Institute of Animal Sciences (WIAS),
Wageningen University, P.O. Box 338, 6700 AH, Wageningen, The Netherlands
c Regional Center for Africa and West Asia, The World Fish Center, Abbassa, Abou Hammad, Egypt
dWorldFish Center, Jalan Batu Maung, 11960 Batu Maung, Penang, Malaysia
Chapter 7 __________________________________________________________________________________
110
Abstract
This study was designed to determine the extent of genotype by environment interaction in
Nile tilapia and to support the decision on the best environment for selection of Nile tilapia
for a wide range of farming conditions. We used two lines of Nile tilapia that had been
divergently selected for two generations in two earthen ponds environments. One line was
selected in earthen ponds that were fertilized daily with chicken manure but no
supplementary feeding (low line). The other line was selected in ponds where fish received
25% protein pellets (high line). The 2 lines were tested in five test environments: 40% protein
pellets feed (P200), 25% protein pellets (P100), 16% protein pellets (P50), 50 kg/ha chicken
manure (M100) and 25 kg/ha chicken manure (M50). Nitrogen input was similar in P50 and
M50, and in P100 and M100 treatments respectively. Survival from stocking to harvest
ranged from 70-75 % in the high line and from 62 to 76% in the low line. Analyses revealed
significant differences in growth performances of the two lines across test environments and
the high line performed better in most test environments. The phenotypic mean body weight
at harvest was highest for test environment P200 (123.4 g in the low line, and 131.7 g in the
high line). Lowest phenotypic body weight means were 92.1g (test environment M50) in the
low line and 82.4g (test environment P100) in the high line. Further, we found significant
evidence for line by test environment interaction. Family by test environment interaction was
significant only in the low line. This genotype by environment interaction was related to the
interaction of the families to nitrogen and dissolved oxygen in the ponds.
Keywords: genotype by environment interaction; Nile tilapia; Oreochromis niloticus; low
input environments
1. Introduction
The effect of selection environment on the performance of selected strains over a range of
potential production environments is a fundamental breeding question. When genotypes
differ in sensitivity to different environmental influences, a genotype by environment
interaction (GXE) occurs (Falconer, 1990). In the presence of GXE, the genetic improvement
obtained by selection in one environment may not be realized in other environments. Using
experimental evidence, Jinks and Connolly (1973, 1975) described the relationship between
the selection environment and environmental sensitivity, and concluded that environmental
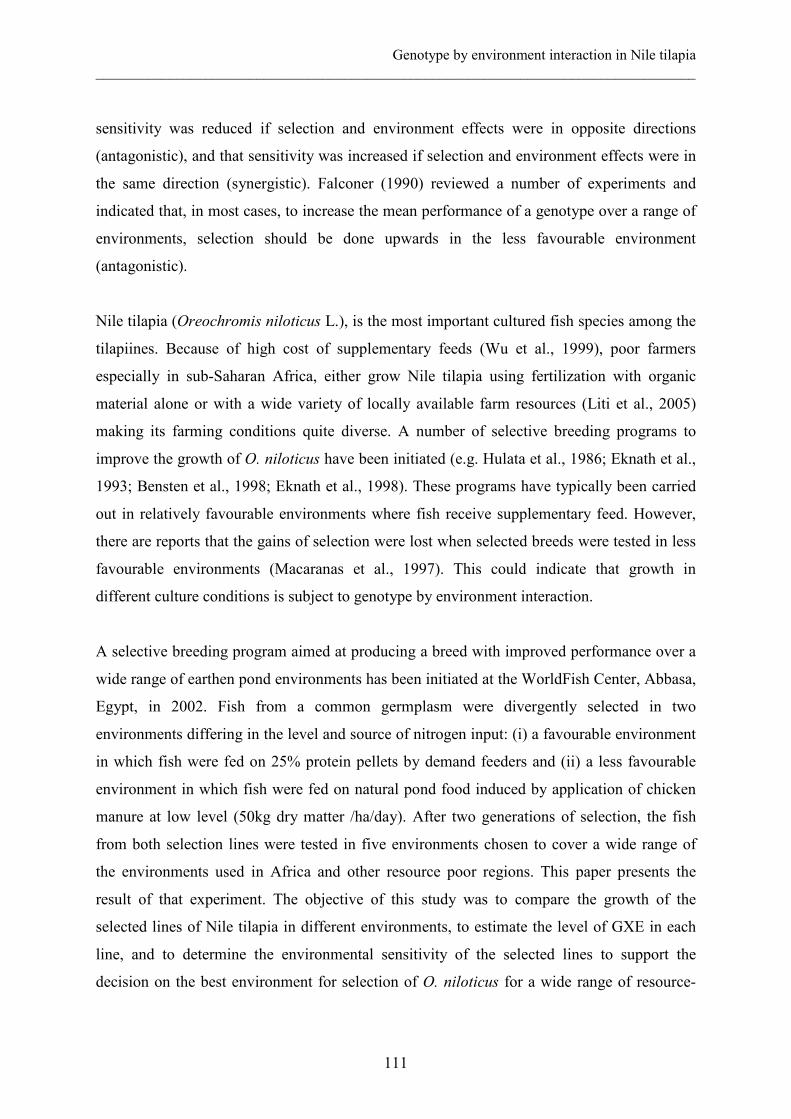
Genotype by environment interaction in Nile tilapia __________________________________________________________________________________
111
sensitivity was reduced if selection and environment effects were in opposite directions
(antagonistic), and that sensitivity was increased if selection and environment effects were in
the same direction (synergistic). Falconer (1990) reviewed a number of experiments and
indicated that, in most cases, to increase the mean performance of a genotype over a range of
environments, selection should be done upwards in the less favourable environment
(antagonistic).
Nile tilapia (Oreochromis niloticus L.), is the most important cultured fish species among the
tilapiines. Because of high cost of supplementary feeds (Wu et al., 1999), poor farmers
especially in sub-Saharan Africa, either grow Nile tilapia using fertilization with organic
material alone or with a wide variety of locally available farm resources (Liti et al., 2005)
making its farming conditions quite diverse. A number of selective breeding programs to
improve the growth of O. niloticus have been initiated (e.g. Hulata et al., 1986; Eknath et al.,
1993; Bensten et al., 1998; Eknath et al., 1998). These programs have typically been carried
out in relatively favourable environments where fish receive supplementary feed. However,
there are reports that the gains of selection were lost when selected breeds were tested in less
favourable environments (Macaranas et al., 1997). This could indicate that growth in
different culture conditions is subject to genotype by environment interaction.
A selective breeding program aimed at producing a breed with improved performance over a
wide range of earthen pond environments has been initiated at the WorldFish Center, Abbasa,
Egypt, in 2002. Fish from a common germplasm were divergently selected in two
environments differing in the level and source of nitrogen input: (i) a favourable environment
in which fish were fed on 25% protein pellets by demand feeders and (ii) a less favourable
environment in which fish were fed on natural pond food induced by application of chicken
manure at low level (50kg dry matter /ha/day). After two generations of selection, the fish
from both selection lines were tested in five environments chosen to cover a wide range of
the environments used in Africa and other resource poor regions. This paper presents the
result of that experiment. The objective of this study was to compare the growth of the
selected lines of Nile tilapia in different environments, to estimate the level of GXE in each
line, and to determine the environmental sensitivity of the selected lines to support the
decision on the best environment for selection of O. niloticus for a wide range of resource-
Chapter 7 __________________________________________________________________________________
112
poor environments.
2. Materials and Methods
2.1 Experimental design and test environments
The experiment was carried out in thirty 200 m2 concrete walled ponds with earthen bottoms.
The experimental ponds were arranged in three rows of ten. Ponds were assigned to five test
environments in three replicates (for each selection line). The layout of the ponds on-site and
assignment of test environments is shown in Figure 1. In each column, each line and test
environment was randomly assigned to ponds. Five different test environments differentiated
by the level and type of nitrogen sources were used: commercially available 40% protein
floating pelleted feed (P200), commercially available 25% protein floating pellets (P100),
commercially available 16% protein floating pellets (P50), 50kg dry matter/ha chicken
manure (M100) and 25kg dry matter/ha chicken manure (M50). Chicken manure was sourced
from broiler and layer farmers near the study area. The fish in pellet-fed ponds were fed to
satiation twice (10.00 hr and 15.00hr) per day whereas fish in the manure fertilized ponds
depended on natural food which was stimulated by the daily (10.00 hr) administration of
chicken manure.
M50 L P50 H P100 L
M50 H M100 H P200 H
P50 L P100 H M100 L
P200 H P200 L M100 H
M100 L M50 H P100 H
P100 L M50 L P50 L
P50 H P100 L M50 H
M100 H P200 H P200 L
P100 H P50 L M50 L
P200 L M100 L P50 H
Figure 1. Schematic presentation of experimental pond layout and assignment of test environments to ponds for the low (L) and high-input (H) selection lines (M50= 25kg/ha/day chicken manure; M100= 50kg/ha/day chicken manure; P50= 16% protein pellets; P100= 25% protein pellets; and P200= 40% protein pellets).
Genotype by environment interaction in Nile tilapia __________________________________________________________________________________
113
2.2 The founder population and production of G0
The founder population (i.e. parents of the G0 population) was produced in spring of 2000 in
a full diallel mating design among local Egyptian Nile tilapia strains (Rezk et al., 2002;
2004). Eighty sires and 105 dams, selected at random from among the founder stock, were
used to produce the G0. Each sire was mated to two dams and each dam mated to only one
sire, thus generating full and half sib groups. Fry were raised in 2 x 1 x 1 m hapas suspended
in concrete tanks and were fed twice daily with 40% protein supplements, initially in the form
of powder and later as pellets. Initial feeding rate was 20% of body weight, which was
gradually reduced to 5% body weight at tagging size (i.e. mean wet weight of 2g). Fry from
each family were individually tagged with Floy® tags and returned to the hapas until all
families were tagged. Each family was then divided into two groups. One line was reared in a
low-input pond environment and the other in a high-input pond environment.
2.2.1 Production of the high line
The first and second generations of selection (G1 and G2) were produced in the same way as
the G0 above. After tagging, the fry were communally grown in a 1000 m2 earthen pond at a
density of 2 fish per m2. In the ponds, fish were fed with 25% protein pellets administered
through demand feeders. The grow-out period was approximately 8 months. This period
included 3-4 months of over-wintering, which occurred in the pond. After harvesting, fish
were ranked based on their estimated breeding values from an animal model. Brooders were
selected based on the rank of EBVs, separately for males and females. A hundred males and
200 females were selected as potential brooders for the next generation. We aimed at
spawning the best ranking 50 males and 100 females. However, to minimize inbreeding, the
number of individuals that were selected from a single full sib or half sib group was restricted
allowing fish that were not among the best ranks (up to the rank of 100 for males and 200 for
females) to be included as brooders.
2.2.2 Production of the low line
The first and second generations of selection (G1 and G2) were spawned and reared in 2 x 3 x
1m hapas suspended in fertilized nursery ponds. No supplementary feeds were given, but the
ponds were fertilized daily with chicken manure at a rate of 50kg dry matter (dm)/ ha. After
tagging, fry were stocked in two 1000m2 ponds at a stocking density of 1 fish m-2. As in the
Chapter 7 __________________________________________________________________________________
114
nursery ponds, chicken manure was added daily at 50kg dm/ ha. No supplementary feeds
were given throughout the study period. The grow-out period was the same as that for the
high line (8 months including 3-4 months of over-wintering). Fish were harvested at the same
time as the high line. After harvesting, fish were ranked based on their estimated breeding
values from an animal model. Brooders were selected based on the rank of EBVs, separately
for males and females. As in the high line the aim was to spawn the best ranking 50 males
and 100 females but animals of lower ranking were used.
2.3 Production of experimental fish
Fish used for the genotype by environment interaction experiment were produced from the
second generation animals (G2) of both lines. The experimental fish were obtained from the
best 37 sires and 40 dams from the high line, and 32 sires and 58 dams from the low line. Fry
from each line were reared in their respective nursing conditions until tagging (from 35 days
old). After tagging, each full-sib family, represented by at least 75 fry, was divided into five
groups of 15 fry each and assigned to the five different test environments i.e. five fry per
family per replicate pond. All ponds were stocked at the same stocking density of 1 fish/ m2.
Due to tag mortalities, not all fish survived to stocking. Equal stocking densities at the start of
the experiment were maintained by stocking some untagged fish from the same families.
Temperature, dissolved oxygen and pH were measured twice a week in all ponds.
Measurements were taken in the morning (6.00-7.00 h) and afternoon (15.00-16.00 h) with a
portable DO meter (WTW® model multi 340i meter). After 4 months of growth (August to
November), the fish were harvested by seine netting and the body weight of each fish
measured.
2.4 Data analysis
Means of body weight for each line and test environment were computed by the means
procedure of SAS (1989). Analyses of data were carried out using general linear models
(GLM procedure of SAS). To obtain homogeneous residuals a logarithm transformation was
used. The present experiment allows studying genotype by environment interaction at two
different levels: differences in sensitivity to the environment between individuals from
different lines, or differences in environmental sensitivity between individuals from different
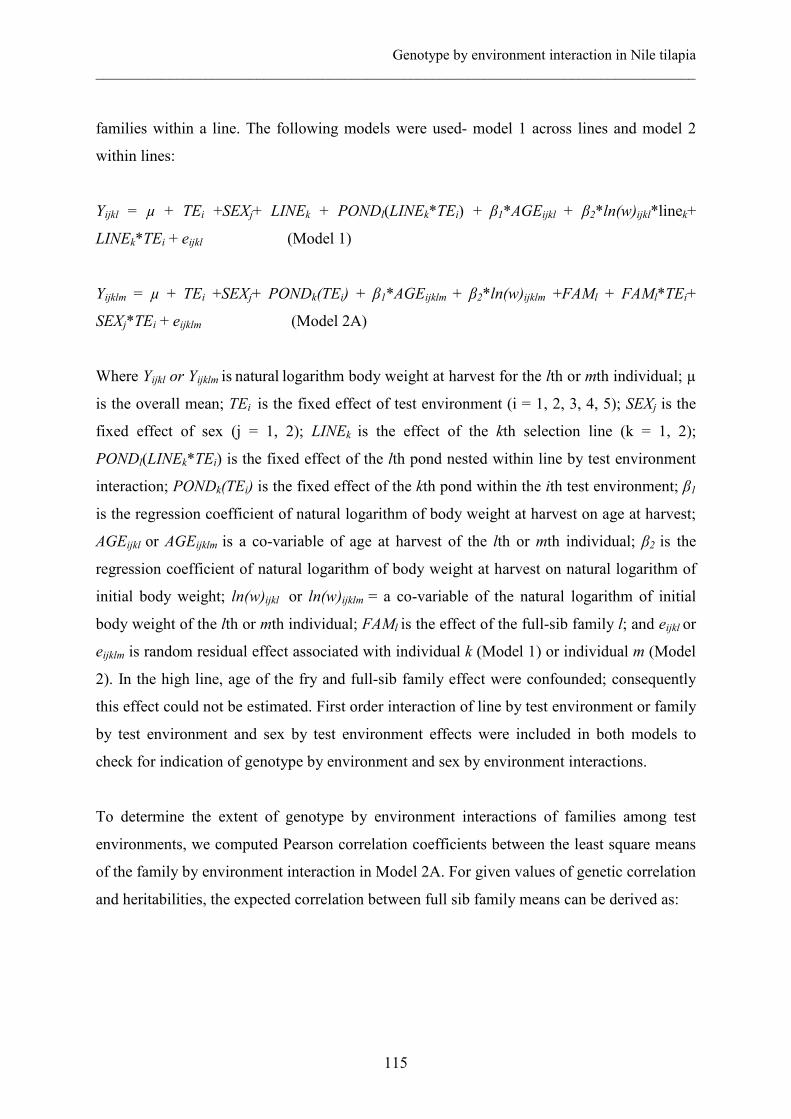
Genotype by environment interaction in Nile tilapia __________________________________________________________________________________
115
families within a line. The following models were used- model 1 across lines and model 2
within lines:
Yijkl = µ + TEi +SEXj+ LINEk + PONDl(LINEk*TEi) + β1*AGEijkl + β2*ln(w)ijkl*linek+
LINEk*TEi + eijkl (Model 1)
Yijklm = µ + TEi +SEXj+ PONDk(TEi) + β1*AGEijklm + β2*ln(w)ijklm +FAMl + FAMl*TEi+
SEXj*TEi + eijklm (Model 2A)
Where Yijkl or Yijklm is natural logarithm body weight at harvest for the lth or mth individual; µ
is the overall mean; TEi is the fixed effect of test environment (i = 1, 2, 3, 4, 5); SEXj is the
fixed effect of sex (j = 1, 2); LINEk is the effect of the kth selection line (k = 1, 2);
PONDl(LINEk*TEi) is the fixed effect of the lth pond nested within line by test environment
interaction; PONDk(TEi) is the fixed effect of the kth pond within the ith test environment; β1
is the regression coefficient of natural logarithm of body weight at harvest on age at harvest;
AGEijkl or AGEijklm is a co-variable of age at harvest of the lth or mth individual; β2 is the
regression coefficient of natural logarithm of body weight at harvest on natural logarithm of
initial body weight; ln(w)ijkl or ln(w)ijklm = a co-variable of the natural logarithm of initial
body weight of the lth or mth individual; FAMl is the effect of the full-sib family l; and eijkl or
eijklm is random residual effect associated with individual k (Model 1) or individual m (Model
2). In the high line, age of the fry and full-sib family effect were confounded; consequently
this effect could not be estimated. First order interaction of line by test environment or family
by test environment and sex by test environment effects were included in both models to
check for indication of genotype by environment and sex by environment interactions.
To determine the extent of genotype by environment interactions of families among test
environments, we computed Pearson correlation coefficients between the least square means
of the family by environment interaction in Model 2A. For given values of genetic correlation
and heritabilities, the expected correlation between full sib family means can be derived as:
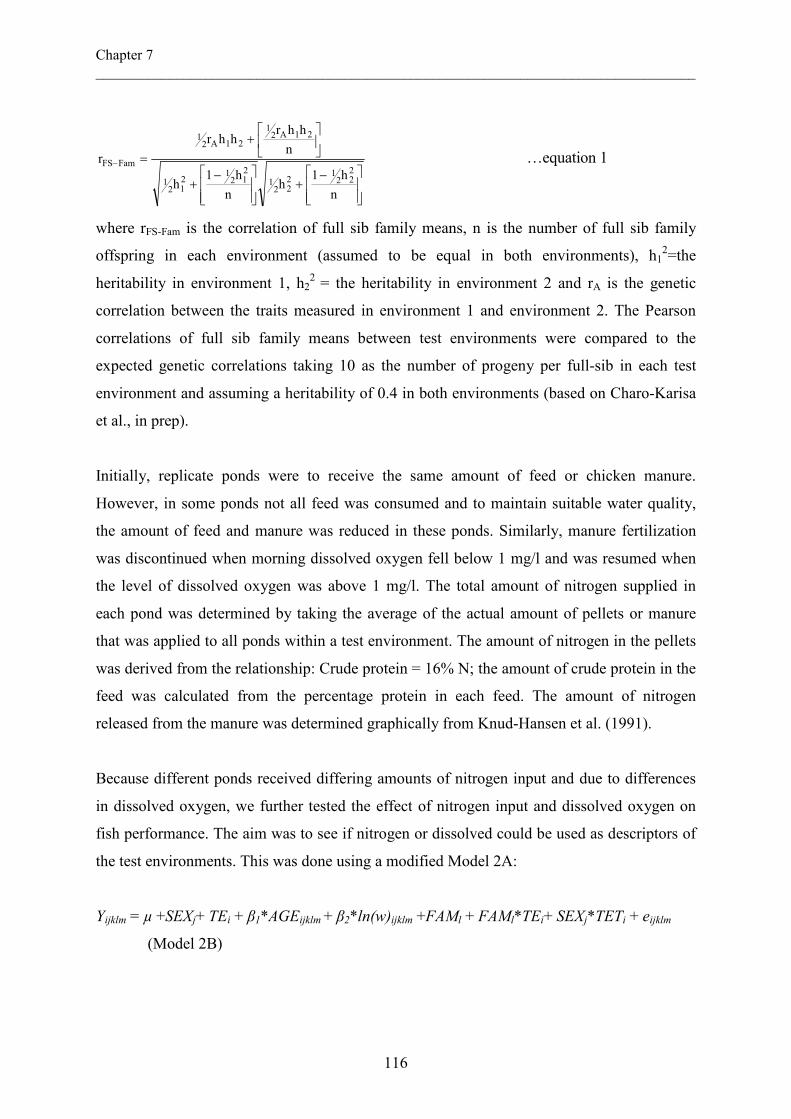
Chapter 7 __________________________________________________________________________________
116
−+
−+
+
=−
n
h1h
n
h1h
n
hhrhhr
r222
1222
1212
1212
1
21A21
21A21
FamFS …equation 1
where rFS-Fam is the correlation of full sib family means, n is the number of full sib family
offspring in each environment (assumed to be equal in both environments), h12=the
heritability in environment 1, h22 = the heritability in environment 2 and rA is the genetic
correlation between the traits measured in environment 1 and environment 2. The Pearson
correlations of full sib family means between test environments were compared to the
expected genetic correlations taking 10 as the number of progeny per full-sib in each test
environment and assuming a heritability of 0.4 in both environments (based on Charo-Karisa
et al., in prep).
Initially, replicate ponds were to receive the same amount of feed or chicken manure.
However, in some ponds not all feed was consumed and to maintain suitable water quality,
the amount of feed and manure was reduced in these ponds. Similarly, manure fertilization
was discontinued when morning dissolved oxygen fell below 1 mg/l and was resumed when
the level of dissolved oxygen was above 1 mg/l. The total amount of nitrogen supplied in
each pond was determined by taking the average of the actual amount of pellets or manure
that was applied to all ponds within a test environment. The amount of nitrogen in the pellets
was derived from the relationship: Crude protein = 16% N; the amount of crude protein in the
feed was calculated from the percentage protein in each feed. The amount of nitrogen
released from the manure was determined graphically from Knud-Hansen et al. (1991).
Because different ponds received differing amounts of nitrogen input and due to differences
in dissolved oxygen, we further tested the effect of nitrogen input and dissolved oxygen on
fish performance. The aim was to see if nitrogen or dissolved could be used as descriptors of
the test environments. This was done using a modified Model 2A:
Yijklm = µ +SEXj+ TEi + β1*AGEijklm + β2*ln(w)ijklm +FAMl + FAMl*TEi+ SEXj*TETi + eijklm
(Model 2B)
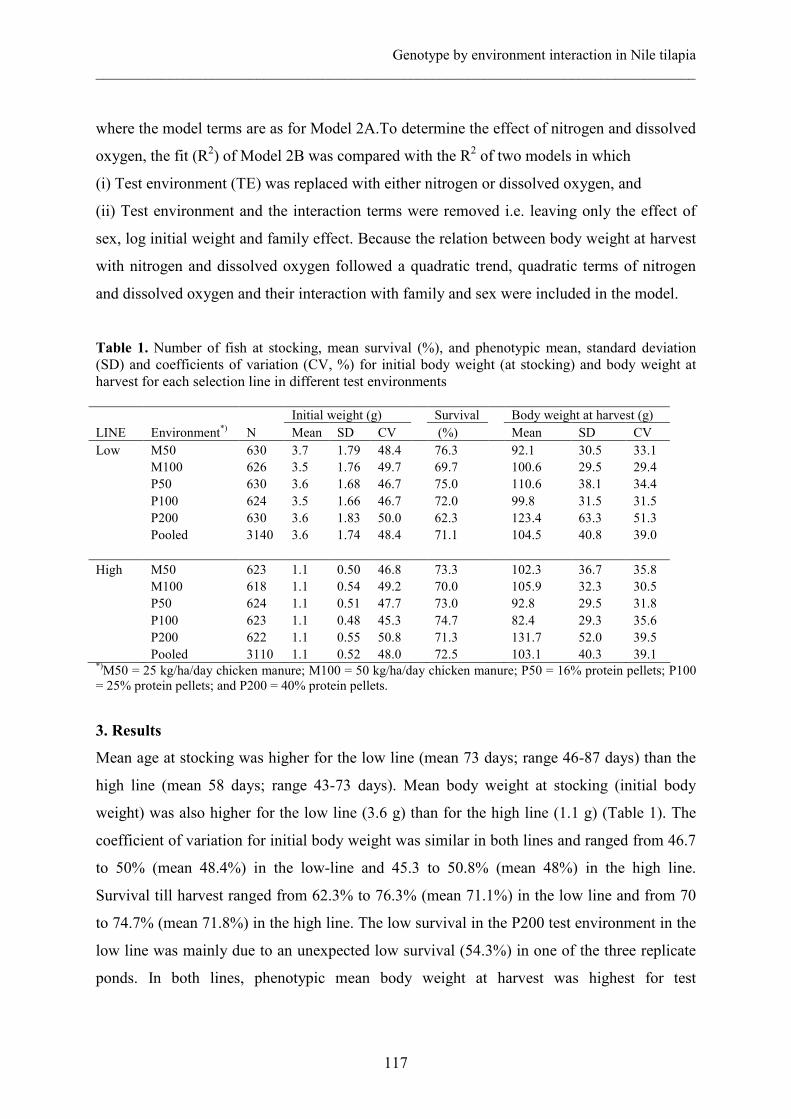
Genotype by environment interaction in Nile tilapia __________________________________________________________________________________
117
where the model terms are as for Model 2A.To determine the effect of nitrogen and dissolved
oxygen, the fit (R2) of Model 2B was compared with the R2 of two models in which
(i) Test environment (TE) was replaced with either nitrogen or dissolved oxygen, and
(ii) Test environment and the interaction terms were removed i.e. leaving only the effect of
sex, log initial weight and family effect. Because the relation between body weight at harvest
with nitrogen and dissolved oxygen followed a quadratic trend, quadratic terms of nitrogen
and dissolved oxygen and their interaction with family and sex were included in the model.
Table 1. Number of fish at stocking, mean survival (%), and phenotypic mean, standard deviation (SD) and coefficients of variation (CV, %) for initial body weight (at stocking) and body weight at harvest for each selection line in different test environments Initial weight (g) Survival Body weight at harvest (g)
LINE Environment*) N Mean SD CV (%) Mean SD CV
Low M50 630 3.7 1.79 48.4 76.3 92.1 30.5 33.1
M100 626 3.5 1.76 49.7 69.7 100.6 29.5 29.4
P50 630 3.6 1.68 46.7 75.0 110.6 38.1 34.4
P100 624 3.5 1.66 46.7 72.0 99.8 31.5 31.5
P200 630 3.6 1.83 50.0 62.3 123.4 63.3 51.3
Pooled 3140 3.6 1.74 48.4 71.1 104.5 40.8 39.0
High M50 623 1.1 0.50 46.8 73.3 102.3 36.7 35.8
M100 618 1.1 0.54 49.2 70.0 105.9 32.3 30.5
P50 624 1.1 0.51 47.7 73.0 92.8 29.5 31.8
P100 623 1.1 0.48 45.3 74.7 82.4 29.3 35.6
P200 622 1.1 0.55 50.8 71.3 131.7 52.0 39.5
Pooled 3110 1.1 0.52 48.0 72.5 103.1 40.3 39.1 *)M50 = 25 kg/ha/day chicken manure; M100 = 50 kg/ha/day chicken manure; P50 = 16% protein pellets; P100 = 25% protein pellets; and P200 = 40% protein pellets.
3. Results
Mean age at stocking was higher for the low line (mean 73 days; range 46-87 days) than the
high line (mean 58 days; range 43-73 days). Mean body weight at stocking (initial body
weight) was also higher for the low line (3.6 g) than for the high line (1.1 g) (Table 1). The
coefficient of variation for initial body weight was similar in both lines and ranged from 46.7
to 50% (mean 48.4%) in the low-line and 45.3 to 50.8% (mean 48%) in the high line.
Survival till harvest ranged from 62.3% to 76.3% (mean 71.1%) in the low line and from 70
to 74.7% (mean 71.8%) in the high line. The low survival in the P200 test environment in the
low line was mainly due to an unexpected low survival (54.3%) in one of the three replicate
ponds. In both lines, phenotypic mean body weight at harvest was highest for test
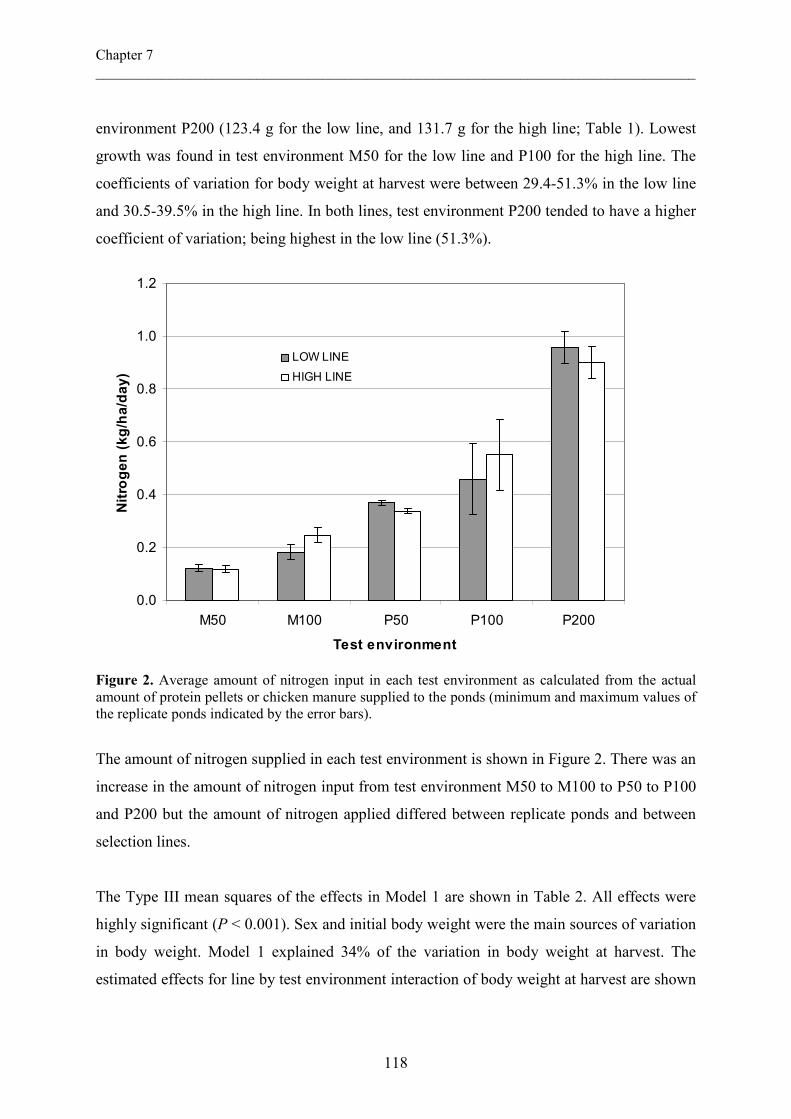
Chapter 7 __________________________________________________________________________________
118
environment P200 (123.4 g for the low line, and 131.7 g for the high line; Table 1). Lowest
growth was found in test environment M50 for the low line and P100 for the high line. The
coefficients of variation for body weight at harvest were between 29.4-51.3% in the low line
and 30.5-39.5% in the high line. In both lines, test environment P200 tended to have a higher
coefficient of variation; being highest in the low line (51.3%).
0.0
0.2
0.4
0.6
0.8
1.0
1.2
M50 M100 P50 P100 P200
Test environment
Nitrogen (kg/ha/day)
LOW LINE
HIGH LINE
Figure 2. Average amount of nitrogen input in each test environment as calculated from the actual amount of protein pellets or chicken manure supplied to the ponds (minimum and maximum values of the replicate ponds indicated by the error bars).
The amount of nitrogen supplied in each test environment is shown in Figure 2. There was an
increase in the amount of nitrogen input from test environment M50 to M100 to P50 to P100
and P200 but the amount of nitrogen applied differed between replicate ponds and between
selection lines.
The Type III mean squares of the effects in Model 1 are shown in Table 2. All effects were
highly significant (P < 0.001). Sex and initial body weight were the main sources of variation
in body weight. Model 1 explained 34% of the variation in body weight at harvest. The
estimated effects for line by test environment interaction of body weight at harvest are shown
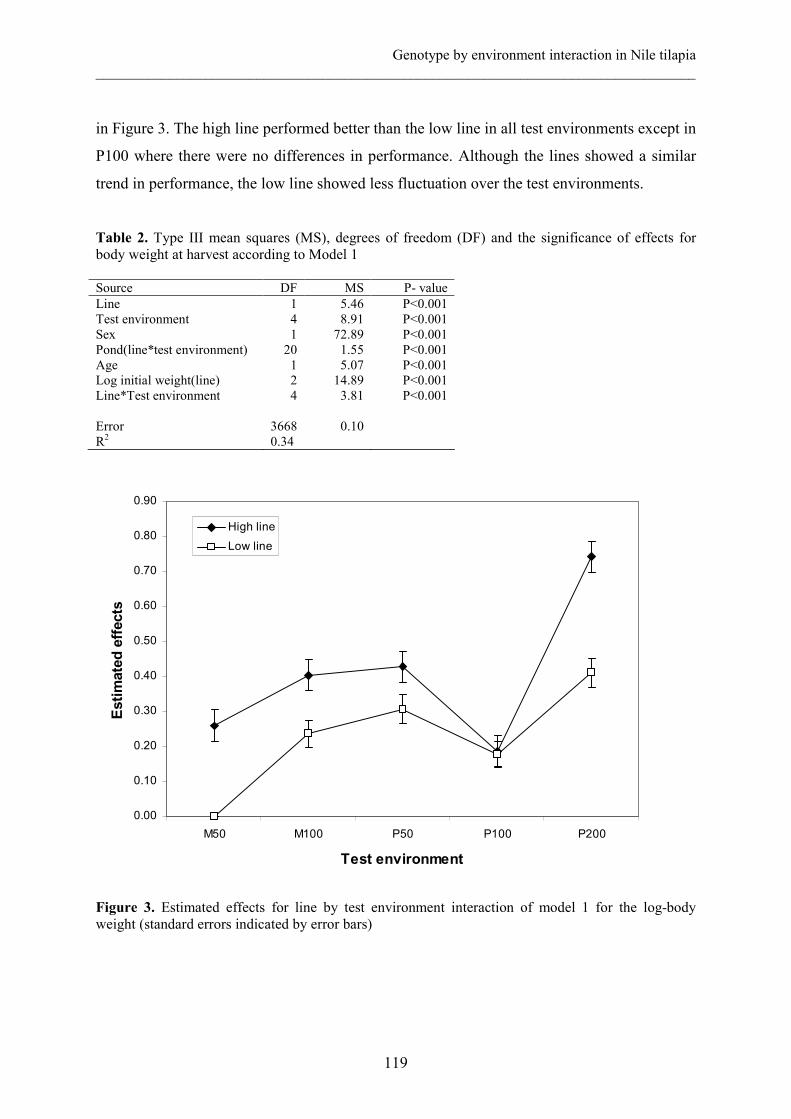
Genotype by environment interaction in Nile tilapia __________________________________________________________________________________
119
in Figure 3. The high line performed better than the low line in all test environments except in
P100 where there were no differences in performance. Although the lines showed a similar
trend in performance, the low line showed less fluctuation over the test environments.
Table 2. Type III mean squares (MS), degrees of freedom (DF) and the significance of effects for body weight at harvest according to Model 1 Source DF MS P- value Line 1 5.46 P<0.001 Test environment 4 8.91 P<0.001 Sex 1 72.89 P<0.001 Pond(line*test environment) 20 1.55 P<0.001 Age 1 5.07 P<0.001 Log initial weight(line) 2 14.89 P<0.001 Line*Test environment 4 3.81 P<0.001 Error 3668 0.10 R2 0.34
0.00
0.10
0.20
0.30
0.40
0.50
0.60
0.70
0.80
0.90
M50 M100 P50 P100 P200
Test environment
Estimated effects
High line
Low line
Figure 3. Estimated effects for line by test environment interaction of model 1 for the log-body weight (standard errors indicated by error bars)
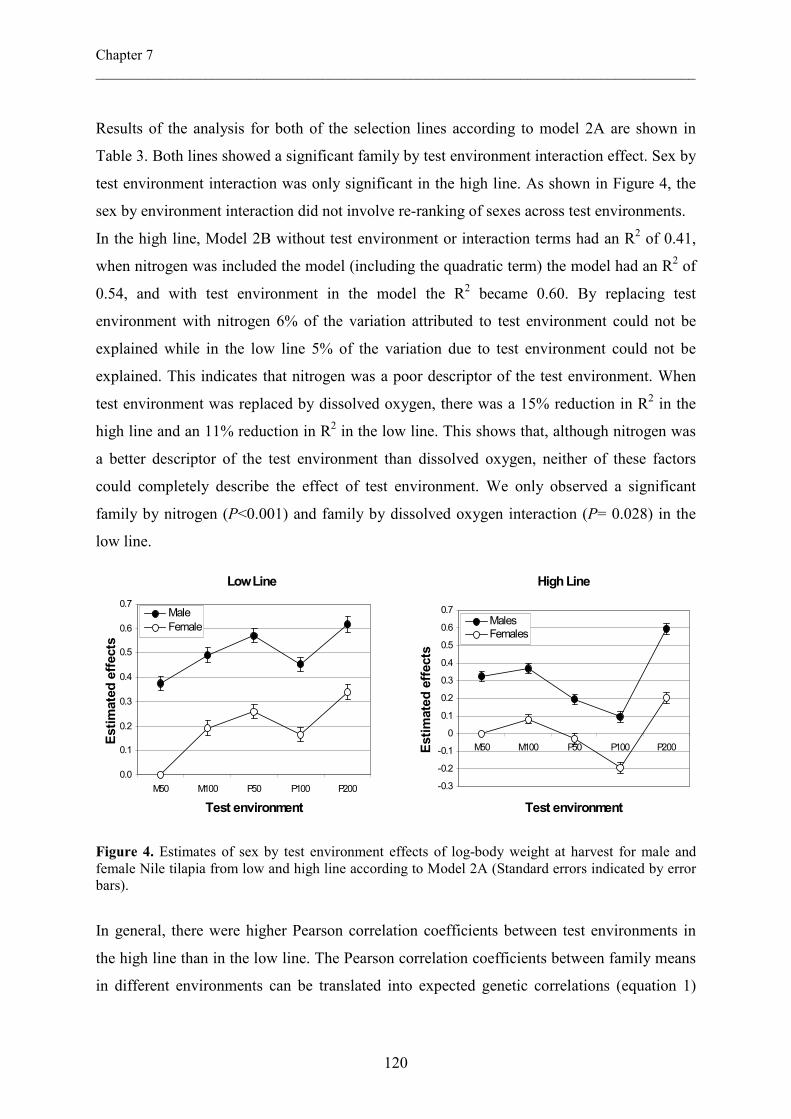
Chapter 7 __________________________________________________________________________________
120
Results of the analysis for both of the selection lines according to model 2A are shown in
Table 3. Both lines showed a significant family by test environment interaction effect. Sex by
test environment interaction was only significant in the high line. As shown in Figure 4, the
sex by environment interaction did not involve re-ranking of sexes across test environments.
In the high line, Model 2B without test environment or interaction terms had an R2 of 0.41,
when nitrogen was included the model (including the quadratic term) the model had an R2 of
0.54, and with test environment in the model the R2 became 0.60. By replacing test
environment with nitrogen 6% of the variation attributed to test environment could not be
explained while in the low line 5% of the variation due to test environment could not be
explained. This indicates that nitrogen was a poor descriptor of the test environment. When
test environment was replaced by dissolved oxygen, there was a 15% reduction in R2 in the
high line and an 11% reduction in R2 in the low line. This shows that, although nitrogen was
a better descriptor of the test environment than dissolved oxygen, neither of these factors
could completely describe the effect of test environment. We only observed a significant
family by nitrogen (P<0.001) and family by dissolved oxygen interaction (P= 0.028) in the
low line.
Low Line
0.0
0.1
0.2
0.3
0.4
0.5
0.6
0.7
M50 M100 P50 P100 P200
Test environment
Estimated effects
Male
Female
High Line
-0.3
-0.2
-0.1
0
0.1
0.2
0.3
0.4
0.5
0.6
0.7
M50 M100 P50 P100 P200
Test environment
Estimated effects
MalesFemales
Figure 4. Estimates of sex by test environment effects of log-body weight at harvest for male and female Nile tilapia from low and high line according to Model 2A (Standard errors indicated by error bars).
In general, there were higher Pearson correlation coefficients between test environments in
the high line than in the low line. The Pearson correlation coefficients between family means
in different environments can be translated into expected genetic correlations (equation 1)
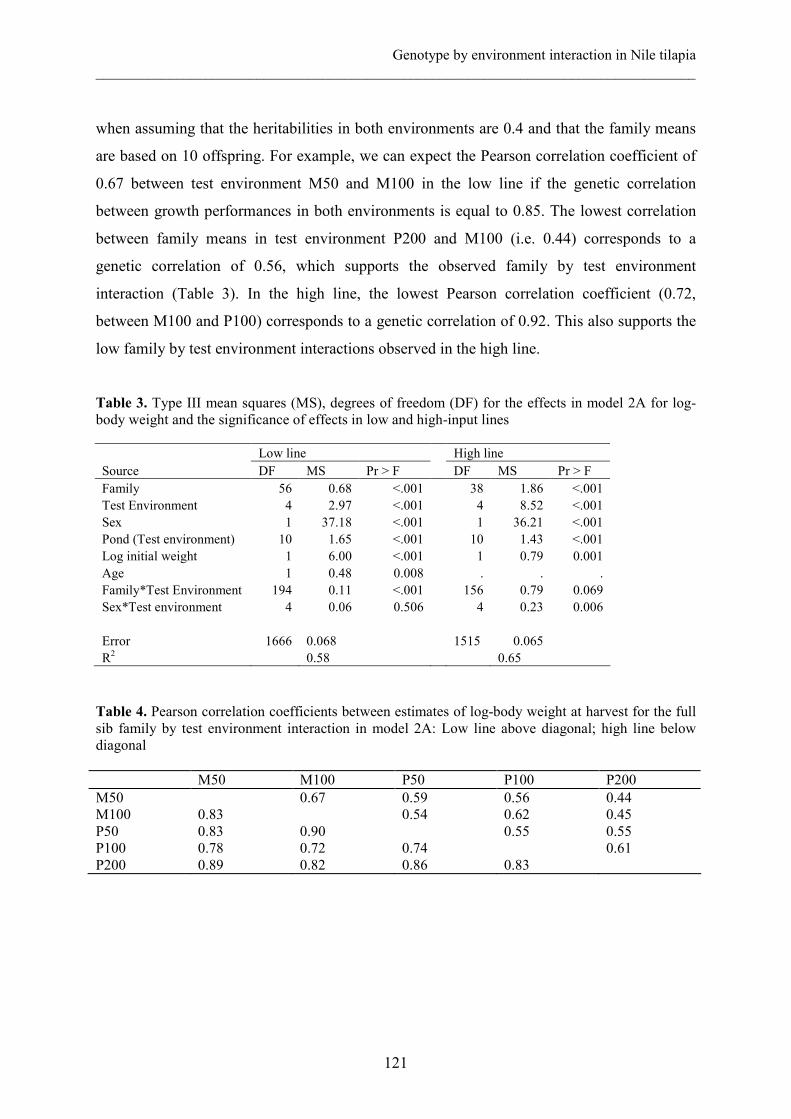
Genotype by environment interaction in Nile tilapia __________________________________________________________________________________
121
when assuming that the heritabilities in both environments are 0.4 and that the family means
are based on 10 offspring. For example, we can expect the Pearson correlation coefficient of
0.67 between test environment M50 and M100 in the low line if the genetic correlation
between growth performances in both environments is equal to 0.85. The lowest correlation
between family means in test environment P200 and M100 (i.e. 0.44) corresponds to a
genetic correlation of 0.56, which supports the observed family by test environment
interaction (Table 3). In the high line, the lowest Pearson correlation coefficient (0.72,
between M100 and P100) corresponds to a genetic correlation of 0.92. This also supports the
low family by test environment interactions observed in the high line.
Table 3. Type III mean squares (MS), degrees of freedom (DF) for the effects in model 2A for log-body weight and the significance of effects in low and high-input lines
Low line High line
Source DF MS Pr > F DF MS Pr > F
Family 56 0.68 <.001 38 1.86 <.001
Test Environment 4 2.97 <.001 4 8.52 <.001
Sex 1 37.18 <.001 1 36.21 <.001
Pond (Test environment) 10 1.65 <.001 10 1.43 <.001
Log initial weight 1 6.00 <.001 1 0.79 0.001
Age 1 0.48 0.008 . . .
Family*Test Environment 194 0.11 <.001 156 0.79 0.069
Sex*Test environment 4 0.06 0.506 4 0.23 0.006
Error 1666 0.068 1515 0.065
R2 0.58 0.65
Table 4. Pearson correlation coefficients between estimates of log-body weight at harvest for the full sib family by test environment interaction in model 2A: Low line above diagonal; high line below diagonal M50 M100 P50 P100 P200 M50 0.67 0.59 0.56 0.44 M100 0.83 0.54 0.62 0.45 P50 0.83 0.90 0.55 0.55 P100 0.78 0.72 0.74 0.61 P200 0.89 0.82 0.86 0.83
Chapter 7 __________________________________________________________________________________
122
4. Discussion
4.1 Methods
The main objectives of the present study were to compare the growth of two selected strains
of Nile tilapia across a range of environments and to test their sensitivity to environmental
changes. To this end, a common genepool was first formed and divided in two groups which
were then selected simultaneously for two generations in fertilized or pellet-fed ponds.
Earlier studies in Nile tilapia were limited to testing wild and farmed strains prior to starting a
selection program. For example, Eknath et al. (1993) and Bentsen et al. (1998) carried out
similar experiments in which Nile tilapia were tested over several test environments. In the
present study, we used test environments that differed by the type and amount of nitrogen
input. The set-up in the present study enables us to determine the effect of the selection
environment on the performance of the selected strains under potential farming conditions.
To detect GXE, environments can be classified into groups and a genotype by environment
interaction term included in the traditional quantitative genetic model, or the expression of
the trait in different environments may be defined as separate traits. A high genetic
correlation indicates that the traits are controlled by the same set of genes (Falconer and
Mackay, 1996) and that there is no GXE. When phenotypes change gradually and
continuously over an environmental gradient, GXE may be described by a reaction norm
model (de Jong, 1995). The reaction norm model describes the phenotype expressed by a
genotype as a function of the environment. In the present study, we could not directly
estimate the genetic correlation between test environments due to small sample size within
test environments. However, as a first step towards modeling a reaction norm, we attempt to
determine variables that describe the pond environment on a continuous scale with nitrogen
and dissolved oxygen as potential descriptors. In this study, the test environment could not be
fully described by nitrogen or dissolved oxygen indicating that other factors are also
involved. These factors may relate to the palatability of the feed provided as well as the
presence of some natural food in the pellet-fed ponds.
4.2 Early growth and environmental effects
In the present study, the initial body weight for the low line was much larger than that for the
high line although their ages did not vary as widely. This may be surprising considering that
Genotype by environment interaction in Nile tilapia __________________________________________________________________________________
123
the high line received high protein feed. In an earlier study in hapa-in-pond environments
(Charo-Karisa et al., in press), we showed that the rearing environment had a large effect on
fry performance. The use of high protein pellets as is used for nursing the high line increases
hapa fouling (Bhujel, 2000). The high line may have experienced water quality problems in
the concrete tanks due to clogging and hapa fouling; something not experienced in the low
line.
4.3 Genotype and sex by environment interactions
We found significant line by test environment interaction that did not involve rank changes of
lines in different test environments. Several authors reported low but significant strain by test
environment interaction in Nile tilapia (Eknath et al., 1993; Macaranas et al., 1997; Bentsen
et al., 1998). As noted by these authors and also in the present study, most of the variation in
Nile tilapia is a result of sex (dimorphism) and initial weight differences. In the present study
the selection lines had been selected in different environments for only two generations. The
observed line by test environment interaction is expected to be stronger after more
generations of selection.
We found significant family by test environment interactions in the low line but not in the
high line. The absence of genotype by environment interaction in the high line was also
confirmed by the Pearson correlations (Table 4). The presence of family by test environment
interaction in the present study agrees with our earlier study (Charo-Karisa et al., in press) in
which we found indications for genotype by environment interaction for early growth of Nile
tilapia juveniles whose parents had been selected for growth in fertilized ponds. In the present
study we found significant interaction of family with nitrogen and dissolved oxygen,
indicating that the family by test environment interaction relates to the responsiveness of the
low line to dissolved oxygen and nitrogen. In an earlier study, we also observed that the
genotype by environment interaction was related to the level of dissolved oxygen (Charo-
Karisa et al., in press).
The high sex effect in the present study was in agreement with earlier studies in Nile tilapia
(e.g. Eknath et al., 1993; Macaranas et al., 1997). We also found a sex by test environment
interaction in the high line but not in the low line (Table 3). Significant sex by test
Chapter 7 __________________________________________________________________________________
124
environment interaction has been reported in earlier studies in Nile tilapia (Eknath et al.,
1993; Macaranas et al., 1997; Bentsen et al., 1998). However, judging from Figure 4, it is
clear that in the present study the sex by environment interactions were not biologically
relevant.
One of the objectives of the present study was to test for the sensitivity of the two lines across
test environments. Falconer (1990) suggested that to increase the mean performance of a
genotype over a range of environments, selection should be done upwards in the less
favourable environment because this reduces the sensitivity of the genotypes. We found
evidence of differences in sensitivity of the selection lines. Although within the high line we
found no evidence of family by environment interaction, its performance fluctuated widely
over the test environments (Figure 3). Further, Figure 3 suggests that, as a strain, the low line
is more stable. It should however be noted that the performance of test environment P100 was
lower than expected in the present study. The feed used for the rearing of the high input line
during selection was similar to the one used in P100 test environment in the present study.
Muendo et al. (2006) compared the growth of fish in manure fertilized ponds (M100) against
the same feed (P100) and found better growth in M100 than in P100. This indicates that the
test environment for the “high” selection line probably was less high than planned and that
the two environments were in fact rather close. To test for Jinks-Connoly rule, the high input
environment should be more favorable than the P100 used in this study.
One of the aims of the present study was to generate data that can be used to support the
decision on the best environment for selection of Nile Tilapia for resource-poor farming
conditions. Although results indicate that the high line performed better across test
environments we noted that it fluctuated more than the low line across test environments. The
decision on the best environment depends upon the genetic correlation and heritabilities of the
trait in the two environments (e.g. Mathur, 2002). Our data did not allow for direct estimation
of the heritability or the genetic correlation between test environments. Further analysis is
needed to answer this question more satisfactorily. It is clear from this study however, that the
selection environment can determine the performance of Nile tilapia strains. Given the high
heritability for body weight in low-input ponds (Charo-Karisa et al., in prep) it is- from a
genetic point of view- efficient to select in low input conditions.
Genotype by environment interaction in Nile tilapia __________________________________________________________________________________
125
5. Acknowledgements
This study is part of the first author’s Ph-D study, funded by INREF-Pond, Wageningen
University (www.inref-pond.org) and the World Fish Center. We acknowledge the staff of
The WorldFish Centre, Abbassa, Egypt for providing the necessary help and facilities during
the experiments.
References
Bentsen, H.B., Eknath, A.E., Palada de Vera, M.S., Danting, J.C., Bolivar, H.L., Reyes, R.A.,
Dionisio, E.E., Longalong, F.M., Circa, A.V., Tayamen, M.M., Gjerde, B., 1998.
Genetic improvement of farmed tilapias: growth performance in a complete diallel
cross experiment with eight strains of Oreochromis niloticus. Aquaculture 160, 145-
173.
Bhujel, R.C., 2000. A review of strategies for the management of Nile tilapia (Oreochromis
niloticus) broodfish in seed production systems, especially hapa-based systems.
Aquaculture 181, 37-59.
Charo-Karisa, H., Komen, H., Reynolds, S., Rezk, M. A., Ponzoni R.W., Bovenhuis, H.,
2006. Genetic and environmental factors affecting growth of Nile tilapia
(Oreochromis niloticus) juveniles: Modelling spatial correlations between hapas.
Aquaculture, in press.
Charo-Karisa, H., Komen, H., Rezk, M. A., Ponzoni, R.W., Van Arendonk, J., Bovenhuis, H.
(XX). Heritability estimates and response to selection for growth of Nile tilapia
(Oreochromis niloticus) in low-input earthen ponds. In prep.
Eknath, A.E., Dey, M.M., Rye, M., Gjerde, B., Abella, T.A., Sevilleja, R., Tayamen, M.M.,
Reyes, R.A., Bentsen, H.B., 1998. Selective breeding of Nile tilapia for Asia. In Proc.
6th World Cong. Genet. Appl. Livest. Prod. 27, 89-96.
Eknath, A.E., Tayamen, M.M., Palada-de Vera, M.S., Danting, J.C., Reyes, R.A., Dionisio,
E.E., Capili, J.B., Bolivar, H.L., Abella, T.A., Circa, A.V., Bentsen, H.B., Gjerde, B.,
Gjedrem, T., Pullin, R.S.V.P., 1993. Genetic improvement of farmed tilapias: growth
performance of eight strains of Oreochromis niloticus tested in different farm
environments. Aquaculture 111, 171-188.
El-Sayed, A-F.M., 1998. Total replacement of fish meal with animal protein sources in Nile
tilapia, Oreochromis niloticus (L.), feeds. Aquac. Res. 29, 275-280.
Chapter 7 __________________________________________________________________________________
126
Falconer, D.S., 1990. Selection in different environments: effects on environmental
sensitivity (reaction norm) and on mean performance. Genet. Res. Camb. 56, 57-70.
Falconer, D.S., Mackay, T.F.C., 1996. Introduction to Quantitative Genetics. Longman,
London.
Hulata, G., Wohlfarth, G.W., Halevy, A., 1986. Mass selection for growth rate in the Nile
tilapia (Oreochromis niloticus). Aquaculture 57, 177-184.
Jinks, J.L., Connolly, V., 1973. Selection for specific and general response to environmental
differences. Heredity 30, 33-40.
Jinks, J.L., Connolly, V., 1975. Determination of the environmental sensitivity of selection
lines by the selection environment. Heredity 34, 401-406.
de Jong, G., 1995. Phenotypic plasticity as a product of selection in a variable environment.
Am. Nat. 145, 493-512.
Knud-Hansen, C.F., Batterson, T.R., McNabb, CD., Harahat, I.S., Sumantadinata, K.,
Eidman, H.M., 1991. Nitrogen input, primary productivity and fish yield in fertilized
freshwater ponds in Indonesia. Aquaculture 94, 49-63.
Liti, D., Cherop, L., Munguti, J., Chhorn, L., 2005. Growth and economic performance of
Nile tilapia (Oreochromis niloticus L.) fed on two formulated diets and two locally
available feeds in fertilized ponds. Aquac. Res. 36, 746-752.
Macaranas, J.M., Mather, P.B., Lal, S.N., Vereivalu, T., Lagibalavu, M., Capra, M.F., 1997.
Genotype and environment: A comparative evaluation of four tilapia stocks in Fiji.
Aquaculture 150, 11-24.
Mathur, P.K., 2002. Methods for estimation and use of genotype-environment interactions.
7th World Congress on Gnetics Applied to Livestock Production, August 19-23,
Montpellier, France. Communication N0 18-01.
Muendo, P.N., Milstein, A., van Dam, A.A, Gamal, E., Stoorvogel, J. J., Verdegem, M. C. J.,
2006. Exploring the trophic structure in organically fertilized and feed-driven tilapia
culture environments using multivariate analyses. Aquac. Res. 37, 151-163
Palada-de Vera, M.S., Eknath, A.E., 1993. Predictability of individual growth rates in Nile
tilapia. Aquaculture 111, 147-158.
SAS Institute, 1989. User’s Guide: Statistics, Release 6.12 Edition, SAS Institute, Cary, NC.
Genotype by environment interaction in Nile tilapia __________________________________________________________________________________
127
Wu, Y.V., Tudor, K.W., Brown, P. B., Rosati, R.R., 1999. Substitution of plant proteins or
meat and bone meal for fish meal in diets of Nile tilapia. North American Journal of
Aquaculture 61, 58-63.


Chapter 8
General Discussion
Chapter 8 __________________________________________________________________________________
130
1. Introduction
Farmed fish are produced in environments which vary widely depending on the culture site,
the culture system and intensity, the levels of management applied, or in the combination of
culture species used (Bardach et al., 1972). Selection for improved growth has typically been
done under favorable conditions where fish were fed high protein pelleted feed. This might
result in breeds which demand more resource than can be provided on the traditional fish
farms, thus increasing cost of production (Moav et al., 1976). In resource poor regions, Nile
tilapia is mainly reared under diverse small-scale systems in earthen ponds with daily organic
fertilizers from livestock and occasional addition of bran or leftover food. To ensure the
availability of consistently high quality genetic material for these wide ranging environments
(Little, 2004), the design of a good breeding scheme and the choice of the best environmental
conditions for selection is crucial. However, an important question is whether a single
population or environment can be used to produce brood stock/fish seed for fast growth in
different farming environments.
The aim of this thesis was to address this question and obtain parameters that can be used to
form guidelines for a breeding program aimed at the production of improved broodstock and
fish seed for resource poor fish farmers. From chapter II to chapter VII, the results of
experiments investigating the prospects of selection for growth in Nile tilapia, and the actual
implementation of a selection program in low input conditions are reported. The present
chapter will, based on literature and the results described in previous chapters, discuss the
prospects and requirements for establishing a practical breeding scheme for the small-scale
farmer in resource poor regions of the world, with a focus on Africa. In doing this, a short
review of the theory behind selecting for a wide range of low-input farming conditions will first
be given, with a focus on phenotypic plasticity and the challenges associated with selecting for
growth in low-input conditions.
2. Choice of selection environment
The theoretical framework for the present study was based on the Jinks-Connolly rule
(Falconer, 1990) mentioned in Chapter I. This theory was tested by selecting two lines from a
single population of Nile tilapia in high and low-input conditions for two generations. The high
input environment consisted of ponds in which fish were fed with 25% fish protein in the form
General Discussion __________________________________________________________________________________
131
of pellets. The low input environment consisted of ponds which were only fertilized with
chicken manure. Before this study, no information on the breeding of fish, nursing of fry, or the
expected response to growth in low-input conditions existed in literature. This study therefore
began by determining whether it was possible to successfully select for growth in such low-
input conditions.
As mentioned in Chapter I, selective breeding is traditionally done in high- rather than low-
yielding environments because of slow growth rates in the low-yielding environment. This
study illustrated, however, that fast growth can be achieved in low-input conditions. In
Chapter II, it was shown that Nile tilapia juveniles can be grown at the same rate with or
without supplementary feeds. Although the environment in which fish are reared has a great
influence on growth, this was mainly caused by factors not directly related to type of inputs
used (Chapter II). The heritability estimates for growth in the “good pond” in chapter II were
very similar to those found in the main selection experiment (Chapter V) indicating that the
expectations for low heritability in low-input conditions are unfounded. We found substantial
response to selection after two generations of selection in the low input environment (Chapter
V). Body weight was highly genetically correlated with body measurements (Chapter VI),
indicating that when needed, alternative traits for measurement of growth can be used.
Together, these results indicated that selection can be carried out effectively in low-input
conditions.
In order to determine the comparative efficiency of selecting in low input environments, the
low input line was compared with the high input line selected divergently from a common
gene-pool. Results of Chapter VII clearly show that although the two lines were only selected
for two generations in different environments, their performance differed across a range of
environments. We found a significant line by test environment interaction and a significant
family by test environment interaction in the low line, while sex by test environment interaction
was found only in the high line. This indicates significant evidence for genotype by
environment interaction in Nile tilapia. We found high heritability and response to growth rate
under low-input conditions as well as a progressive increase in yields across generations
(Chapter V), indicating that selection in low input conditions can be very successful. These
results together suggest that- from a genetic point of view- there are no strong arguments
Chapter 8 __________________________________________________________________________________
132
against selecting in a resource-poor environment. Furthermore, since the farmers use the same
environment selecting in the same environment should be more efficient.
3. Phenotypic plasticity and correlated response
The ability of a single genotype to produce an array of phenotypes (or reaction norm) when
exposed to a set of environments that differ in one or more aspects, is referred to as phenotypic
plasticity (Schlichting, 1986; Stearns, 1989). The benefit of plasticity lies in the ability to
produce a better phenotype-environment match across many environments (Levins, 1968).
Although plasticity cannot be measured on a single individual, considerable evidence indicates
that plasticity can be selected for (Scheiner, 2002). When an organism is faced with an
environment which is less favourable in some aspects, trait values often change due to either
adaptive plasticity or maladaptive stress response (Huey and Kingsolver 1989; Newman, 1992).
These responses are expressed in alternative forms of morphology, behaviour or physiological
states (West-Ebehard 1989). While it is generally agreed that natural selection should favour an
organism that can produce an optimal phenotype in every environment it encounters, in reality
organisms fail to respond optimally in every environment because of genotype by environment
interactions and evolutionary constraints or trade offs (Gomulkiewicz and Kirkpatrick, 1992;
Stearns, 1992).
One of the major problems that lead to reduction in growth rate in tilapia cultured in ponds is
the tendency of females to mature and reproduce earlier and at small size. Consequently, it has
been recommended that both faster growth rate and delayed age at maturation be included as
the most important breeding goals for Nile tilapia (Bolivar et al., 1993). Allocating resources
to growth or reproduction is a fundamental tradeoff in evolutionary life history and depends on
environmental conditions (Stearns, 1992). Individuals in a population allocate their resources
to somatic growth and reproduction depending on proximate environmental cues which are
meant to confer fitness advantages in that particular environment.
The use of life-history theory as a tool to predict reaction norms for age and size at maturity
was originally suggested and developed by Stearns and his co-workers (Stearns, 1983; Stearns
and Crandall, 1984; Stearns and Koella, 1986) as a deterministic process. Later, Heino et al.
(2002) introduced the concept of reaction norms for age and size at maturation as a
General Discussion __________________________________________________________________________________
133
probabilistic process. These predictions sought to explain whether observed changes in age and
size at maturity observed in organisms exposed to unavoidable growth stressors are
adaptations that maximise fitness under given constraints. In sub-optimal or unpredictable
environments, it is expected that natural selection will favor alleles directing a greater part of
the energetic resources toward early reproduction (Stearns, 1992). Although there was a
tendency for females to mature earlier in later generations in this study (Chapter VI), selection
for growth performance did not affect early maturity, i.e. the two traits showed a low genetic
correlation. In contrast to results of Chapter VI, Longalong et al. (1999) noted a high genetic
relation between early maturity and fast growth of Nile tilapia in an experiment carried out
with high protein fish meal.
Siems and Sikes (1998), working with fathead minnows (Pimephales promelas) found that
resource allocation patterns change in response to food availability over short time scales.
Larger Nile tilapia grown under fertilized pond conditions tended to have longer gut to length
ratios (Chapter VI). Having longer guts may be a mechanism for the fish to be more efficient
on a diet that is less nutritious (Bowen et al., 1995; Chapter VI this thesis), the consequence of
increase in gut length on meat yield is not yet clear. For example, it could negatively affect the
dressing percentage of the fish by increasing the amount of offal from Nile tilapia.
4. Establishment of breeding schemes for resource poor regions
The majority of global aquaculture production (approximately 90%) is currently in developing
countries (Hishamunda and Ridler, 2002) with Africa contributing approximately 1% of the
global production (Jamu and Brummet, 2004). Given the under-utilised water resources,
available and inexpensive labour, high demand for fish, and suitable climate, there is a large
potential for improvement of aquaculture in Africa. However, African aquaculture has had a
long history of failure (Machena and Moehl, 2001). The failure for aquaculture to take off has
been blamed on lack of clear policy and technological knowhow, inadequate infrastructure,
poor extension support, lack of fish seed and feed, and poor financing (Hempel, 1993; Machena
and Moehl, 2001).
About 95% of aquaculture production in Africa comes from small-scale farmers, with tilapia
accounting for about 40% of total production. Small-scale production systems are
Chapter 8 __________________________________________________________________________________
134
extensive/semi intensive utility oriented pond systems (100-500 m2) operated by households
and integrated with other agricultural activities (Machena and Moehl, 2001). In highly
productive agricultural areas where land-subdivision has led to small parcels of land, small-
scale aquaculture is the only option left. Targeting small-scale systems for improved production
is therefore synonymous with increasing total production of the aquaculture sector in Africa.
Currently, these systems are characterised by low yields and small fish size at marketing.
Because tilapia prices in most cases depend on fish size and quality, farmed fish should be of
acceptable standards (Adesulu, 2000; Afolabi et al., 2000). Hence, fish farming must compete
with other agricultural activities for labour, water, and farm inputs at the farm level as well as
with fish from capture fisheries at the market place.
Success in aquaculture depends on a viable concept, sound management, adequate financing
and an organism suitable for the production system (Shultz, 1986). A major set-back to
aquaculture production in Africa has been the problem of dependence on donor funding,
making aquaculture unsustainable (Machena and Moehl, 2001). Kosgey et al. (2006) reviewed
several small ruminant breeding programs among resource poor farmers in the tropics and
highlighted issues determining their success or failure. One important issue causing failure is
that of top-down approaches in setting breeding goals and insufficient involvement of farmers
which leads to setting up of wrong breeding goals i.e. not suitable for the target conditions, and
lack of continual monitoring of animals at the multiplier level. These issues may apply in
selective breeding programs for fish breeding as well. Management practices and breeding
goals in resource poor regions may differ from those in favourable environments. The choice of
appropriate selection strategy should therefore be informed by farmer needs, the production
environments, and climatic conditions.
4.1 Choice of selection strategy
Several selection experiments and breeding programs aiming at increased growth rates have
recently been conducted in O. niloticus under favourable environments (Hulata et al., 1986;
Brzeski and Doyle, 1995; Eknath et al., 1993; Bentsen et al., 1998; Bolivar and Newkirk,
2002). The initial low response reported for tilapia produced through mass selection programs
was attributed to the lack of effectiveness of mass selection and the use of genetically poor
strains (Tave and Smitherman, 1980, Hulata et al, 1986, Behrends et al., 1988; Teichert-
General Discussion __________________________________________________________________________________
135
Coddington and Smithermann, 1988; Huang and Liao, 1990). Therefore one of the most
successful tilapia breeding programs, the Genetically Improved Farmed Tilapia, (GIFT) used
combined family and within family selective breeding strategy and wild Nile tilapia stocks
from Africa (Dey and Gupta, 2000). Nile tilapia originates from Africa and therefore there are
good prospects for starting breeding programs with a good genetic base. Currently, there are no
real domesticated strains of Nile tilapia in Africa. It has been suggested that the most efficient
method for selection in Nile tilapia is family selection or BLUP selection (Uraiwan and Doyle,
1986; Gall and Bakar, 2002). However, recent reports indicate that mass selection can be used
with good response in Nile tilapia (Basiao and Doyle, 1999; Basiao et al., 2005). Mass
selection is a simple and cheap strategy to realise improvement when emphasis is on a single
trait. A major advantage of BLUP over mass selection is that it allows for collection and use of
information on relatives and other traits. It can be useful when not all traits can be measured on
the selection candidate, for example for carcass traits and for performance in different
environments. The choice of selection method should therefore depend on the economic
capabilities of the community as much as on the selection criteria.
Rutten (2005) discussed the advantages and disadvantages of various selection strategies in
terms of the necessary facilities, workload, inbreeding levels, and selection response. He found
that under recirculation systems, both BLUP selection and mass selection required basically the
same facilities, and labour, the only difference being the extra cost of tags in BLUP. In the
present study, we used fewer facilities than would normally be required under standard
hatchery conditions. In standard hatcheries using hapa-in-pond systems, e.g. the GIFT project
each full-sib family requires two or more hapas, one at the spawning phase and the others at the
rearing phase; the rearing phase requiring hapas with larger mesh size. In the present study, a
single hapa per full-sib family was used at both the spawning and the rearing phases before
tagging. To reduce the workload, each full-sib family was tagged as soon as fry reached 2 g
mean weight (Chapter V). This way, the tagging work was spread over the rearing period and
only a few workers and minutes were required at any given time. Because no feed was added,
hapa fouling was greatly minimized which reduced the frequency of hapa cleaning. A total of
100 hapa and two ponds were required to produce and rear 100 full sib families. Each
generation, a little over 2000 fish were reared in two ponds. Before selection of brooders, the
harvested fish were measured and returned into the same hapa in ponds, requiring no further
Chapter 8 __________________________________________________________________________________
136
holding facilities. The minimal number of facilities used and the sub-optimal amounts of
manure applied in this study makes this approach appropriate for resource poor regions.
4.2 Founder stocks
Genetic variability is crucial in the breeding program because this is critical for both the short-
term and long term limits of response (Falconer, 1989). A synthetic founder population
incorporating wild strains of wide genetic variability and suitable production traits could be
formed first. This involves comparing the growth performance and survival of pure strains in
potential farm environments with the aim of producing domesticated strains from best
performing wild strains only. Crucially important also is the development of strategies to
maintain the variability (i.e. to limit the rate of inbreeding) through generations of selection.
This means that a relatively large breeding population needs to be used in which selected
parents are not highly related.
4.3. Environment of selection
Whereas the highly intensive culture practiced in developed countries relies heavily on high
protein pelleted supplemental feeds, protein sources are limited in most developing countries.
In fertilized ponds, as used in the present study, the diet consists of mainly phytoplankton. This
diet has limited protein, tends to reduce assimilation efficiency, and is generally less favorable
to fish growth (Bowen et al., 1995). Manure fertilization of ponds also promotes development
of benthos such as chironomids and oligochaetes (Friday, 1987; Kullberg and Peterson, 1987)
which apart from playing a significant role in the release of nutrients are directly eaten by
tilapia (Egna et al, 1997; Teichert-Coddington et al., 1997). By providing substrates in the
fertilized ponds, the growth of periphyton can be increased and this significantly improves fish
yields (van Dam et al., 2002) which indicates more scope for improving the productivity of
low-input fertilized ponds. A two pronged approach to improving tilapia yields with only small
extra cost i.e. improving natural pond productivity and the genetics of the fish can be applied
successfully in low-input ponds.
Feed takes up more than 50% of the operation cost of intensive tilapia culture (El-Sayed, 1998;
Wu et al., 1999). For nursing of fry 40% protein pellets are used. Apart from being expensive
(during the study 40% protein pellets cost 3.0 Egyptian pounds (L.E.)), these high protein
General Discussion __________________________________________________________________________________
137
pellets are not readily available in resource poor regions. Therefore, from an economic point of
view a hatchery that uses manure instead of pellets would spend less and thus produce cheaper
seed and broodstock. Similarly, a farmer that uses manure at the grow-out period spends less
than the one using pellets. To illustrate this we compare the input amounts used for a 200 m2
pond (Chapter VII) for test environment M100 (50kg/ha/day chicken manure) and P100 (25%
protein pellets). On average, each of the M100 ponds received 1 kg chicken manure daily while
the P100 ponds received 0.25 kg pellets per day. Chicken manure in Egypt is sold at 250 L.E.
per ton or 0.25 L.E. per kg, and 25% protein pellets is sold at 2 L.E. per kg. For a grow-out
period of 180 days, the farmer/breeder using chicken manure spends 45 LE per pond while the
farmer/breeder using pellets spends twice as much (90 LE). Integration of fish farming with
poultry or other livestock increases opportunities for saving and is thus more cost-effective.
4.4. Delivering quality seed to farmers: a participatory approach to farmer involvement
A major setback to farming of tilapia in resource poor regions has been the lack of quality fish
seed (Machena and Moehl, 2001; Little et al., 2001; Little, 2004). In most resource poor
regions, delivery of fry at the farm gate as well as the unavailability of the high quality fry from
research stations are important challenges (Little, 2004). Production and dissemination of fish
seed can be either centralised or decentralised. In the centralised approach, the breeding
program is located in a central place and farmers get the fry through multiplier centres. The
advantage of this approach is that genetic quality can be easily maintained. The disadvantage is
that the rural communities remain dependent on a distant source which may become unrealiable
(Little, 2004). Inconsistent performance of fish may arise due to hatcheries that provide seed of
variable age and size from partial, asynchronous spawning of broodfish (Little, 1998; Little and
Hulata, 2000). If the centralised system must be used, multiplier centres that are manned by the
local farmers may be an appropriate alternative. In the decentralised approach, the juveniles are
produced close to the grow-out areas allowing farmers to have a greater control of the seed
availability. Because of the problem with infrastructure in most of Africa, the decentralised
approach seems a better option. This has the advantage of cutting on transport cost and has
been used successful in Asia (Little, 2004). Splitting the breeding program in two or more
separate populations will allow for exchange of broodstock at a later stage which supports the
maintenance of variability within populations. These populations could also act as a backup in
case of accidental loss through disease outbreaks or natural disasters (Bentsen and Gjerde,
Chapter 8 __________________________________________________________________________________
138
1994). However, it should be noted that in case the breeding program is too dispersed, the need
to tag animals and evaluate breeding stocks at many different locations could increase costs.
In establishing a sustainable breeding program it is recommended to involve local fish farmers
from inception of the breeding program onwards. Involving farmers from the program
inception could help to tackle the perception that aquaculture is technically complex and
difficult to handle (Machena and Moehl, 2001). A participatory approach to farmer
involvement will enable farmers to conceive the breeding program as their own, and if
aquaculture extension officers are involved can be used simultaneously to train farmers on
general aquaculture practices. By allowing farmers to define the breeding goals at the onset, the
breeding program ensures that the resultant breeds match local conditions and needs, thus
ensuring program sustainability. Ambali and Malekano (2004) pointed out that selective
breeding programs are likely to be abandoned in Africa because they are expensive, and
because it takes long to improve a strain through selective breeding. However, there was a
progressive increase in size of the fry produced across generations in this study (Chapter V).
We further demonstrated that a breeding program does not necessarily have to be expensive.
What is required is the commitment of farmers to participate. Nile tilapia farmers, who are
accustomed to using unimproved seed, are likely to be encouraged as they use improved seed
after every generation of selection.
In aquaculture, some traits of major economic importance include growth rate and meat yield,
feed conversion efficiency, disease resistance and survival, flesh quality, and age at sexual
maturation (Gjedrem, 2000). In small-scale farms, the most important breeding goal is
improved growth. In fertilized ponds, survival is one of the most important traits for
improvement and is substantially heritable (Chapter V). Schultz (1986) recommends
minimizing the number of traits to be improved to minimize costs of trait measurement and to
keep the breeding program focused. This may be more relevant in resource poor regions.
Therefore body weight and survival should be the first target traits for improvement. Because
of the high genetic correlation between body weight and body measurements (Chapter VI),
body measurements, which are easier and more convenient to measure, may be used as the
traits of selection. In sub-tropical and high land areas in Africa, growth is often hampered by
low temperature. Because of low prospects of improvement of this trait through selective
General Discussion __________________________________________________________________________________
139
breeding (Chapter III), it was recommended that focus should be on increasing body weight of
fry before stocking and the acclimatization of fry to cold temperature before grow-out. Further
study is needed to determine whether acclimatization effects are maintained till harvesting.
Because farmers are involved in the breeding programs, emerging traits of concern may be
identified and the breeding scheme adjusted accordingly.
5. Conclusion
This thesis has demonstrated that there are good prospects for setting up sustainable breeding
programs for resource poor tilapia farming conditions without requiring expensive
supplementary protein pellets. Because poverty alleviation and food security are primary goals
in the developing world, the initiation and implementation of cheaper breeding programs will
ensure that the genetically improved material are accessible to the rural fish farmer. High
response can be achieved within a few generations in Nile tilapia, and because of short
generation times, fish farmers can reap the benefits of genetic improvement programs without
delay thus reducing the risk of failure of the breeding program. Appropriate breeding goals for
these breeding schemes need to be set-up with the involvement of the local farmers, preferably
for each agro-ecological zone (but within the financial capabilities of the community), to ensure
that the breed meets the requirement of local farmers. The formation of multiplication centres
where farmers can collect fry or a decentralised breeding program could ensure that the
improved fish seed gets to the farm gates when required. Full benefit of the breeding program
will be realised by improving husbandry practices that enhance water quality and improves
nutrition such as the use of substrates that provides surface area for growth of periphtyon. It is
important that researchers and aquaculture extension officers are trained on how to keep
records because although record-keeping is a tool for monitoring progress it has not been a
common practice for fish farmers to keeps proper records. This is a necessary step for the
maintenance of domesticated strains. The initiation and implementation of a breeding program
as described in this thesis can still be expensive for the rural poor; however donor dependence
should be discouraged. Instead, the role of governments in forming policies that make it easier
for fish farmers to access credit should be enhanced. This way, fish farmers can also learn how
to manage their own finances or management of corporate breeding schemes.
Chapter 8 __________________________________________________________________________________
140
References
Adesulu, E.A., 2000. Current status of tilapia in Nigerian aquaculture, p. 577-583. In
K.Fitzsimmons (ed.) Tilapia Aquaculture: Proceedings from the Fourth International
Symposium on Tilapia in Aquaculture, Volume 2. Northeastern Regional Agricultural
Engineering Service, Ithaca, New York.
Afolabi, J.A., Imoudu, P.B., Fagbenro, A.O., 2000. Economic and technical viability of
tilapia culture in homestead concrete tanks in peri-urban Nigeria, p. 575-581. In
K.Fitzsimmons (ed.) Tilapia Aquaculture: Proceedings from the Fourth International
Symposium on Tilapia in Aquaculture, Volume 2. Northeastern Regional Agricultural
Engineering Service, Ithaca, New York.
Ambali, A.J.D., Malekano, L.B., 2004. Genetic improvement with specific reference to
tilapia genetic resources in Africa and their use in aquaculture-potential benefits and
risks., pp 10-15. In: Gupta, M.V., Bartley, D.M., Acosta, B.O. (Eds.). Use of
Genetically Improved and Alien Species for Aquaculture and Conservation of Aquatic
Biodiversity in Africa. WorldFish Center Conference Proceedings 68, 113 p.
Basiao, Z.U., Arago, A.L ., Doyle, R.W., 2005. A farmer-oriented Nile tilapia, Oreochromis
niloticus L., breed improvement in the Philippines. Aquaculture Research 36, 113-119.
Basiao, Z.U., Doyle, R.W., 1999. Test of size-specific mass selection for Nile tilapia,
Oreochromis niloticus L., cage farming in the Phillipines. Aquaculture Research 30,
373-378.
Behrends, L.L., Kingsley, J.B., Price III, A.H., 1988. Bidirectional backcross selection for
body weight in a red tilapia. In : The Second International Symposium on Tilapia in
Aquaculture. Pullin, R.S.V., Bhukaswan, T., Tonguthai, K., Maclean, J.L. (Eds.). pp
125-133. ICLARM Conference Proceedings 15. Department of Fisheries, Bangkok,
Thailand, and International Centre for Living aquatic Resources Management,
Manila, Phillipines.
Bentsen, H.B., Eknath, A.E., Palada de Vera, M.S., Danting, J.C., Bolivar, H.L., Reyes, R.A.,
Dionisio, E.E., Longalong, F.M., Circa A.V., Tayamen M.M., Gjerde, B., 1998.
Genetic improvement of farmed tilapias: growth performance in a complete diallel
cross experiment with eight strains of Oreochromis niloticus. Aquaculture 160, 145-
173.
General Discussion __________________________________________________________________________________
141
Bentsen, H.B., Gjerde, B., 1994. Design of fish breeding programs. Proc. 5th World Congr.
Genet. Appl. Livest. Prod. Guelph, 7-12 Aug., vol 19, pp. 353-359.
Bhujel, R.C., 2000. A review of strategies for the management of Nile tilapia (Oreochromis
niloticus) broodfish in seed production systems, especially hapa-based systems.
Aquaculture 181, 37-59.
Bolivar, R.B., Eknath, A.E., Bolivar, H.L., Abella, T.A., 1993. Growth and reproduction of
individually tagged Nile tilapia Oreochromis niloticus of different strains. Aquaculture
111, 159-160.
Bolivar, R.B., Newkirk, G.F., 2002. Response to within family selection for body weight in
Nile tilapia (Oreochromis niloticus) using a single-trait animal model. Aquaculture
204, 371-381.
Bowen, S. H., Lutz, E.V., Ahlgren M.O., 1995. Dietary protein and energy as determinants of
food quality: trophic strategies compared. Ecology 76, 899-907.
Brzeski, V.J., Doyle, R.W., 1995. A test of an on-farm selection procedure for tilapia growth in
Indonesia. Aquaculture 137, 219-230.
Dey, M. M., Gupta, M. V., 2000. Socioeconomics of disseminating genetically improved
Nile tilapia in Asia: an introduction Aquaculture Economics and Management 4, 5-11.
Egna, H.S., Boyd, C. E., Burke, D.A., 1997. Introduction. In: Dynamics of Pond Aquaculture,
Egna, H.S., Boyd, C. E (Eds.). CKRC Press, Boca Raton, New York., pp. 1-14.
Eknath, A.E., Tayamen, M.M., Palada-de Vera, M.S., Danting, J.C., Reyes, R.A., Dionisio,
E.E., Capili, J.B., Bolivar, H.L., Abella, T.A., Circa, A.V., Bentsen, H.B., Gjerde, B.,
Gjedrem, T., Pullin, R.S.V.P., 1993. Genetic improvement of farmed tilapias: growth
performance of eight strains of Oreochromis niloticus tested in different farm
environments. Aquaculture 111, 171-188.
Falconer, D.S., 1989. Introduction to quantitative genetics. Longman, London.
Friday, L.E., 1987. The diversity of microinvertebrate and macrophyte community in ponds.
Freshwater Biology 18, 87-104.
Gall, G.A.E., Bakar, Y., 2002. Application of mixed-model techniques to fish breed
improvement: analysis of breeding-value selection to increase 98-day body weight in
tilapia. Aquaculture 212, 93-113.
Gjedrem, T., 2000. Genetic improvement of cold-water species. Aquac. Res. 31, 25-33.
Gomulkiewicz, R., Kirkpatrick, M., 1992. Quantitative genetics and the evolution of reaction
Chapter 8 __________________________________________________________________________________
142
norms. Evolution 46, 390-411.
Heino, M., Dieckmann, U., Godø, O. R., 2002. Measuring probabilistic reaction norms for
age and size at maturation. Evolution 56, 669-678.
Hempel, E., 1993. Constraints and possibilities for developing aquaculture. Aquaculture
International 1, 2-19.
Hishamunda, N., Ridler, N.B., 2002. Macro policies to promote sustainable commercial
aquaculture. Aquaculture International 10, 491-505.
Huang, C.M., Liao, L.C., 1990. Response to mass selection for growth rate in Oreochromis
niloticus. Aquaculture 85, 199-205.
Huey, R.B., Kingsolver, J., 1989. Evolution of thermal sensitivity of ectotherm performance.
Trends in Ecology and Evolution 4, 131-135.
Hulata, G., Wohlfarth, G.W., Halevy, A., 1986. Mass selection for growth rate in the Nile
tilapia (Oreochromis niloticus). Aquaculture 57, 177-184.
Jamu, D., Brummett, R., 2004. Opportunities and Challenges for African Aquaculture. In:
Gupta, M.V., Bartley, D.M., Acosta, B.O. (Eds.). pp 1-9. Use of Genetically
Improved and Alien Species for Aquaculture and Conservation of Aquatic
Biodiversity in Africa. WorldFish Center Conference Proceedings 68, 113 p.
Kosgey, I.S., Baker, R.L., Udo, H.M.J., Van Arendonk, J.A.M., 2006. Successes and failures
of small ruminant breeding programmes in the tropics: a review. Small Ruminant
Research 61, 13-28.
Kullberg, A., Peterson, R.C., 1987. Dissolved organic carbon, seston and macroinvertebrate
drift in an acidified and limed humic stream. Freshwater Biology 17, 553-564.
Levins, R., 1968. Evolution in changing environments. Princeton University Press, Princeton,
New Jersey, USA.
Little, D., 2004. Delivering better quality seed to farmers. In: Bolivar, R., Mair, G.,
Fitzsimmons, K., (Eds.), New Dimensions in Farmed Tilapia. Proceedings of the 6th
International Symposium on Tilapia in Aquaculture, Manila, pp. 3-17.
Little, D.C., 1998. Options in the development of the ‘aquatic chicken’. Fish Farmer
(July/August).
Little, D.C., Hulata, G., 2000. Strategies for tilapia seed production. In: Beveridge, M.C.M.,
McAndrew, B.J. (Eds.), Tilapias: Biology and Exploitation. Fish and Fisheries Series,
vol. 25. Kluwer Academic Publishing, Dordrecht, pp. 267-326.
General Discussion __________________________________________________________________________________
143
Little, D.C., Satapornvanit, A., Edwards P., 2001. Freshwater fish seed quality in Asia. In:
Rural Aquaculture. Edwards, P., Little, D.C., Demaine, H. (Eds.). CABI Publishing,
Wallingford, UK., pp 185-196.
Longalong, F. M., Eknath A.E., Bentsen, H.B., 1999. Response to bi-directional selection for
frequency of early maturing females in Nile tilapia (Oreochromis niloticus).
Aquaculture 178, 13-25.
Machena, C., Moehl, J., 2001. Sub-Saharan African aquaculture: regional summary. pp. 341-
355. In: Aquaculture in the Third Millennium. Subasinghe, R.P., Bueno, P., Phillips,
M.J., Hough, C., McGladdery, S.E., Arthur, J.R., (Eds.). Technical Proceedings of the
Conference on Aquaculture in the Third Millennium, Bangkok, Thailand, 20-25
February 2000. NACA, Bangkok and FAO, Rome.
Moav, R., Soller, M., Hulata, G., Wohlfarth, G., 1976. Genetic aspects of the transition from
traditional to modern fish farming. Theoretical and Applied Genetics 47, 285-290.
Newman, R.A. 1992. Adaptive plasticity in amphibian metamorphosis. Bioscience 42, 671-
678.
Rutten, M.J.M., 2005. Breeding for improved production of Nile tilapia (Oreochromis
niloticus L.). PhD thesis, Fish Culture and Fisheries Group and Animal Breeding and
Genetics Group, Wageningen University, The Netherlands, 122p.
Scheiner, S. M., 2002. Selection experiments and the study of phenotypic plasticity. J. Evol.
Biol. 15, 889-898.
Schlichting, C.D., 1986. The evolution of phenotypic plasticity in plants. Ann Rev Ecol. Syst
17, 667-693.
Shultz, F.T., 1986. Developing a commercial breeding program. Aquaculture 57, 65-76.
Siems, D.P., Sikes, R.S., 1998. Tradeoffs between growth and reproduction in response to
temporal variation in food supply. Environmental Biology of Fishes 53, 319-329.
Stearns, S.C., 1983. A natural experiment in life-history evolution: Field data on the
introduction of Mosquitofish (Gambusia affinis) to Hawaii. Evolution 37, 601-617.
Stearns, S.C., 1989. The evolutionary significance of phenotypic plasticity. Bioscience 39, 436-
445.
Stearns, S.C., 1992. The Evolution of Life Histories. Oxford: Oxford University Press.
Stearns, S.C., Crandall, R.E., 1984. Plasticity for age and size at sexual maturity: a life-history
response to unavoidable stress. In: Fish Reproduction. Potts, G., Wootton, R. J. (Eds.).
Chapter 8 __________________________________________________________________________________
144
Academic Press, London., pp. 13-33.
Stearns, S.C., Koella, J.C., 1986. The evolution of phenotypic plasticity in life-history traits:
predictions of reaction norms for age and size at maturity. Evolution 40, 893-913.
Tave, D., Smitherman, R.O., 1980. Predicted response to selection for early growth in Tilapia
nilotica. Trans. Am. Fish. Soc. 109, 439-445.
Teichert-Coddington, D.R., Popma, T.J., Lovshin, L.L., 1997. Attributes of tropical pond-
cultured fish. In: Dynamics of Pond Aquaculture. Egna, H.S., Boyd, C. E (Eds.). CKRC
Press, Boca Raton, New York., pp. 183-197.
Teichert-Coddington, D.R., Smitherman, R.O., 1988. Lack of response by Tilapia nilotica to
mass selection for rapid early growth. Trans. Am. Fish. Soc. 117, 297-300.
Uraiwan, S., Doyle, R.W., 1986. Replicate variance and the choice of selection procedures for
tilapia (Oreochromis niloticus) stock improvement in Thailand. Aquaculture 57, 93-98.
van Dam, A. A., Beveridge M.C.M., Azim, M. E., Verdegem, M.C.J., 2002. The potential of
fish production based on periphyton. Rev. Fish Biol. Fisher. 12, 1-31.
West-Eberhard, M. J., 1989. Phenotypic plasticity and the origins of diversity. Annual Review
of Ecology and Systematics 20, 249-278.
Yamada, R., 1986. Pond production systems: fertilization practices in warmwater fish ponds.
In: J.E. Lannan, R.O. Smitherman, and G. Tchobanoglous (Eds.), Principles and
Practices of Pond Aquaculture. Oregon State University Press, Corvalis, OR, pp. 97-
110.

Summary (English, Dutch, Kiswahili)
Summary __________________________________________________________________________________
146
SUMMARY
Among the tilapias, Nile tilapia is the most important species farmed in the world and is the
mainstay of many resource-poor fish farmers. The majority of its culturing is carried out in the
tropics in semi-intensive environments with a wide array of pond inputs from the farm. To
increase production, the overall efficiency of fish reared in these systems needs to be improved.
Studies have shown that whereas about 15-30% of the nutrient input in pellet fed-pond systems
is converted into harvestable products, only 5-15% of the nutrient input in fertilizer-only pond
systems is converted to harvestable products. This thesis was a part of the INREF-POND
project (Chapter I), which consisted of sub-projects at the fish, pond and farm level with
experimental and modelling studies. The aim of the project was to find ways of increasing the
efficiency of nutrient use of integrated systems. Efficient breeding programs are needed to
improve the overall nutrient use efficiency of fish in fertilized ponds. This thesis aims at (i)
studying the feasibility of selective breeding for the improvement of growth of Nile tilapia in
low-input extensive farming conditions, (ii) determining the effects of selection on other
performance traits and (iii) investigate genotype bye environment interaction in Nile tilapia.
A common practice in tilapia farming is to nurse fry in hapa-in-pond systems with high
protein pellets. To carry out a selective breeding in low-input condition, knowledge of factors
determining growth in these systems is important. Chapter II presents results of an
experiment that was carried out to determine the optimal conditions for early rearing of tilapia
fry in hapa-in-pond systems. The aim of this study was to quantify the environmental and
genetic effects on early growth of Nile tilapia, in hapa-in-earthen pond systems. In a pilot
study, we grew swim-up fry with or without supplementary feed in hapas suspended in
fertilised ponds at 5, 10, 15, and 20 fry/m2 densities. In the main experiment, we reared
swim-up fry from 25 full-sib families separately for 42 days at 15 fry/m2 density in hapas
suspended in two earthen ponds. Hapas were arranged in two column arrays along the sides
of the ponds. Ponds were fertilized daily with chicken manure. In addition, fry in one column
in each pond were fed twice daily on 40% protein pelleted feed. Results from the pilot study
indicated significant effects of stocking density and treatment on fry growth. In the main
experiment, the dietary treatment effect was not significant but there were large differences in
growth between ponds: mean body weight at 42 days was 1.7 g in pond A and 0.4 g in pond
B. Heritability (h2) of 42-day fry body weight estimated from the whole data set using a
Summary __________________________________________________________________________________
147
univariate model was 0.01±0.06. The bivariate heritability estimates were 0.59±0.19 in pond
A and 0.05±0.11 in pond B. The common environmental / hapa (c2) effects were 0.14±0.06
and 0.29±0.07 in respective ponds. We found significant positive spatial autocorrelation (P =
0.02) indicating resemblance in growth of fry in neighboring hapas. Analysis of
environmental variables showed that the two ponds differed significantly in dissolved
oxygen. The low genetic correlation (rg = -0.27±0.69) between body weights of fry in both
ponds therefore might suggest genotype by environment interactions for tolerance to low
dissolved oxygen in Nile tilapia juveniles.
The inability of tilapia to tolerate low temperatures is of major economic concern as it
reduces their growing season and leads to over winter mortality. In Chapter III, cold
tolerance of juvenile Nile tilapia was investigated and heritability estimates obtained. Eighty
full-sib families were produced by mating each sire with two dams. Fry were grown in hapas
suspended in earthen ponds fertilized with chicken manure, and were 41-91 days post-hatch
at the start of the experiment (mean standard length 50.6 mm; mean body weight 5.1 g). Fry
were tagged and exposed to low temperature in an indoor facility. Temperature was lowered
from 16 °C to 11°C in 48 hours and from 11 °C to 8 °C at the rate of 1°C/day. Cold tolerance
was expressed as Temperature at Death (TAD) and Cooling Degree hours (CDH). Fish
mortality started at 13.6 ºC and total mortality occurred at 8.6 ºC. Mean TAD and CDH were
10.1 ºC and 298.07 respectively. Fish body weight (BW) had a highly significant effect on
cold tolerance (P <0.0001). Smaller fish (<5g) were more susceptible to lower temperature
than larger fish. The heritability of cold tolerance was 0.08±0.17 for CDH and 0.09±0.19 for
TAD, estimated with an animal model. There was a considerable common
environmental/full-sib effect for this trait (0.33±0.10 for CDH and 0.27±0.09 for TAD).
These values indicate that estimation of genetic parameters for cold tolerance in tilapia
should include both direct additive and common environmental effects. Based on the results
of this study we conclude that the most appropriate way of enhancing cold tolerance of tilapia
juveniles is by husbandry practices that increase pre-winter body weights.
The effects of genotype, age, size, condition factor and diet (natural phytoplankton versus
formulated protein pellets) on low-temperature tolerance of juveniles were investigated and
reported in Chapter IV. This chapter compared the results of the experiments reported in
Summary __________________________________________________________________________________
148
Chapter III with a second experiment carried out to determine the effect of the environment
and diet on cold tolerance. In the first experiment, 775 juveniles from 43 sires and 80 dams
were reared under mid-summer conditions for 41-91 days. In the second experiment, 393
juveniles were produced by single-pair mating of 20 dams and 20 sires from the same
brooders as in the first experiment. These fish were reared for 42 days under autumn
conditions with either high protein (40%) pellets or natural tilapia diet. At the end of the
growth period fish from each experiment were tagged and exposed to gradually lowered
temperatures. Cold tolerance was significantly affected by genotype, size, aquarium,
condition factor (P= 0.0001) and diet (P=0.0547). In both experiments, smaller fish were
more vulnerable to cold stress. Age did not significantly affect cold tolerance. Fish reared
under mid-summer conditions died between 13.6 ºC and 8.6 ºC while those reared under
autumn conditions died between 11.7 ºC and 7.5 ºC. This suggests that acclimatization to
lower temperatures before cold stress can improve the cold tolerance ability of O. niloticus.
Knowledge of the heritability for growth and the correlated changes that occur in other traits
due to selection for growth is important for the design of an efficient genetic improvement
program. In Chapter V and Chapter VI estimates of phenotypic and genetic parameters for
growth, body measurements, reproductive traits and gut length from two generations of
selection for growth in a low input environment are presented. The selection environment
consisted of earthen ponds which were daily fertilized with 50 kg dry matter (dm) /ha chicken
manure. No supplementary feeds were provided. In total, 6429 fully pedigreed experimental
fish were included in the analysis. Survival till harvest was highly variable ranging from 35%
to 77% and was affected by initial weight, pond, and age effects. Body weight at harvest
(BW) increased from a mean of 67.4 g in the grandparental (unselected) population (G0) to
129.5 g in G2 was affected by initial weight, pond, sex and age effects. Generations were
discrete and therefore genetic parameters were estimated separately for each year. Heritability
estimates for BW ranged from 0.38 to 0.60, and the heritability for survival ranged from 0.03
to 0.14. The estimated selection response was 23.4 g (34.7%) between G0 and G1 and 13.0 g
(14.9%) between G1 and G2 (Chapter V). Chapter VI presents the estimates of phenotypic
and genetic parameters for body size measurements, reproductive traits, and gut length.
Heritability estimates for body measurements ranged from 0.4-0.6 for standard length to
0.69-0.79 for head length. Phenotypic correlations between body weight and body
Summary __________________________________________________________________________________
149
measurements ranged from 0.64 to 0.89. Genetic correlations were close to unity. The
heritability estimate for maturity at harvest was 0.13. Heritabilities for carcass traits were
estimated from G1 only and were 0.16 for gutted weight and 0.06 for dressing percentage.
Phenotypic correlation between body weight and gutted weight was 0.84 and the genetic
correlation was 0.20. Gut length increased with selection for body weight. Heritability
estimate for gut length was 0.22. Moreover, gut length and body weight were genetically
highly correlated. These results demonstrate the feasibility of selection for growth of Nile
tilapia in low-input environments.
The effect of selection environment on the performance of selected strains over a range of
potential production environments is a fundamental breeding question. In the presence of
genotype by environment interaction, genetic improvement obtained by selection in one
environment may not be realized in other environments. In Chapter VII, the results of a
study designed to determine the extent of genotype by environment interaction in Nile tilapia
are presented. We compared the performance of the low line with a high line selected for
growth in ponds where fish received 25% protein. The 2 lines were tested in five test
environments: 40% protein pellets feed (P200), 25% protein pellets (P100), 16% protein
pellets (P50), 50 kg/ha chicken manure (M100) and 25 kg/ha chicken manure (M50).
Nitrogen input was similar in P50 and M50, and in P100 and M100 treatments respectively.
Survival from stocking to harvest ranged from 70-75% in the high line and from 62 to 76% in
the low line. Analyses revealed significant differences in growth performances of the two
lines across test environments. The phenotypic mean body weight at harvest was highest for
test environment P200 (123.4 g in the low line, and 131.7 g in the high line). Lowest
phenotypic body weight means were 92.1g (test environment M50) in the low line and 82.4g
(test environment P100) in the high line. Although the high line performed better in more test
environments, there was a significant line by test environment interaction indicating that both
lines were sensitive to the environment. Family by test environment interaction was
significant only in the low line. This genotype by environment interaction was related to the
interaction of the families to nitrogen and dissolved oxygen in the ponds.
These results described in this thesis show that there are good prospects for setting up
sustainable breeding programs for resource poor tilapia farming conditions without requiring
Summary __________________________________________________________________________________
150
expensive supplementary protein pellets. The prospects and requirements for establishing
such a practical breeding scheme for the small-scale farmer in resource poor regions of the
world are discussed in Chapter VIII. Because poverty alleviation and food security are
primary goals in the developing world, it is important that cheaper breeding programs are
initiated and implemented and the genetically improved material made accessible to the rural
fish farmer. High genetic variability is crucial in the breeding program because it is critical
for both the short-term and long term limits of response. Therefore, strategies to maintain the
variability through generations of selection should be part of the breeding program.
Appropriate breeding goals for these breeding schemes need to be set-up with the
involvement of the local farmers, preferably for each agro-ecological zone to ensure that the
breed meets the requirement of local farmers. The formation of multiplication centres where
farmers can collect fry or a decentralised breeding program should ensure that the improved
fish seed gets to the farm gates when required. Full benefit of the breeding program will be
realised by promoting husbandry practices that use locally available crop residues and
manure to boost the productivity of the pond and provide ample nutrients for the genetically
improved breeds of Nile tilapia.
Samenvatting __________________________________________________________________________________
151
SAMENVATTING
Van alle tilapia soorten is de Nijl tilapia wereldwijd de meest gekweekte; voor arme boeren is
het bovendien een belangrijke dierlijke eiwitbron. De vis wordt vooral gekweekt in de
tropen, in semi-intensieve milieus zoals aarden vijvers die bemest worden met allerhande
restproducten uit de landbouw en veeteelt. Om de produktie te verhogen dient de
voederbenutting van de vis gekweekt in deze systemen verbeterd te worden. Studies hebben
aangetoond dat 15-30% van de nutrienten, aanwezig in pellets, omgezet worden in een
oogstbaar produkt. Bij vijvers die uitsluitend bemest worden is dit slechts 5-15%. Het
onderzoek beschreven in dit proefschrift maakte deel uit van het INREF-POND project (zie
hoofdstuk 1), wat uit drie deelprojecten bestond. Deze projecten bestudeerden het vis, vijver
en bedrijfsniveau en waren onderling verbonden door modellerings studies. Het uiteindelijke
doel van het INREF project was te onderzoeken hoe de efficiëntie van nutriëntgebruik op
kleine geïntegreerde bedrijven verbeterd kon worden door gebruik te maken van visvijvers.
Efficiente fokprogrammas zijn nodig om de voederbenutting van vis in bemeste visvijvers te
verbeteren. Het doel van dit onderzoek was: 1) de haalbaarheid te onderzoeken van het
fokken op groei van Nijl tilapia in laag bemeste vijvers; 2) te onderzoeken wat de effecten
van een dergelijke selectie op groei voor andere kenmerken waren, en 3) te onderzoeken of er
sprake was van genotype x milieu interactie.
Gewoonlijk worden tilapia larven in hapas, opgehangen in vijvers, opgekweekt en met
eiwitrijke pellets gevoerd. Indien een selectieprogramma onder laag-input condities
uitgevoerd moet worden is het belangrijk te weten welke faktoren larvale groei in dergelijke
milieus bepalen. In hoofdstuk 2 worden resultaten beschreven van een experiment dat was
opgezet om de optimale condities voor larvale opkweek in hapa-in- vijvers te bepalen. Het
doel van deze studie was het kwantificeren van de omgevings- en genetische faktoren die de
vroege groei van Nijl tilapia in hapas, opgehangen in bemeste aarden vijvers, bepalen. In een
voorstudie werden pas uitgekomen larven met of zonder extra voer, in hapas, opgehangen in
bemeste vijvers, opgekweekt bij dichtheden van 5, 10, 15 en 20 larven per m2. In het
hoofdexperiment werden pas uitgekomen larven van 25 full-sib families per familie
gescheiden opgekweekt gedurende 42 dagen bij een dichtheid van 15 larven per m2. In dit
experiment waren de hapas in twee rijen aan weerszijden van de vijver opgehangen. In de ene
rij werd bijgevoerd met 40% eiwit pellets, in de andere rij werd niet bijgevoerd. Het hele
Samenvatting __________________________________________________________________________________
152
experiment werd in duplo (2 vijvers) uitgevoerd. De resultaten van het voorexperiment lieten
zien dat er significante effecten waren van behandeling (wel of niet voeren) en dichtheid op
groei. In het hoofdexperiment was het effect van voeren niet significant, maar er waren grote
verschillen in groei tussen de twee vijvers: het gemiddelde gewicht in vijver A was 1,7 gram
terwijl dat in vijver B slechts 0,4 gram was. De erfelijkheid van lichaamsgewicht op een
leeftijd van 42 dagen, geschat op de hele dataset en met een univariaat model, was 0.01 ±
0.06. De bivariate schattingen waren 0.59 ± 0.19 in vijver A en 0.05 ± 0.11 in vijver B. Het
effect van gemeenschappelijk milieu (c2 = hapa plus familie effect) was achtereenvolgens
0.14 ± 0.06 en 0.29 ± 0.07 in beide vijvers. We vonden een significant positieve
autocorrelatie tussen nabij gelegen hapas, wat er op duidt dat de groei in twee aan elkaar
grenzende hapas op elkaar lijkt. Een analyse van milieu faktoren toonde aan dat de twee
vijvers vooral in de hoeveelheid beschikbare zuurstof van elkaar verschilden. De lage
genetische correlatie (rg = -0.27 ± 0.69) tussen lichaamsgewicht van larven in beide vijvers
suggereert genotype x milieu interactie voor lage zuurstof tolerantie in Nijltilapia larven.
Nijl tilapia zijn weinig koude resistent. Dit is een economisch belangrijk probleem voor
subtropische gebieden waar koude perioden het groeiseizoen verkorten en winter mortaliteit
veroorzaken. In hoofdstuk III, werd de koude tolerantie van juvenile Nijl tilapia onderzocht
en werd de erfelijkheid van koude tolerantie geschat. Tachtig full sib families werden
geproduceerd door steeds 1 mannetje met 2 vrouwtjes te paren. Larven werden opgekweekt
in hapas in aarden vijvers, bemest met kippenmest, en waren 41-91 dagen oud bij het begin
van het experiment (gem.lengte 50.6 mm; gem. lichaamsgewicht 5.1 gram). De jonge visjes
werden gemerkt en blootgesteld aan lage temperaturen in een koelcel. De temperatuur werd
gedurende 48 uur verlaagd van 16 ºC tot 11 ºC, en daarna van 11ºC naar 8ºC met stappen van
1 ºC /dag. Koude tolerantie werd uitgedrukt als “temperature at death (TAD)” en “cooling
degree hours (CDH)”. Sterfte begon op 13.6 ºC en was bij 8.6 ºC volledig. Gemiddelde TAD
en CDH waren respectievelijk 10.1 ºC en 298.07. Lichaamsgewicht had een significant effect
op koude tolerantie. Kleinere vissen (<5 gram) waren meer gevoelig voor lage temperaturen
dan grotere vissen. De erfelijkheid van koudetolerantie, geschat met een animal model, was
0.08 ± 0.17 voor CDH en 0.09 ± 0.19 voor TAD. Er was een aanzienlijk effect van
gemeenschappelijk milieu + familie voor dit kenmerk (0.33 ±0.10 voor CDH en 0.27 ± 0.09
voor TAD). Deze waarden tonen aan dat de schatting van genetische parameters voor koude
Samenvatting __________________________________________________________________________________
153
tolerantie zowel additief genetische als gemeenschappelijke effecten moet betreffen. De beste
manier om koude tolerantie in Nijl tilapia te verbeteren is door, via verbeterde houderij, te
streven naar hogere lichaamsgewichten voorafgaand aan de winterperiode.
In hoofdstuk IV worden de effecten van genotype, leeftijd, gewicht, konditie factor en dieet
(natuurlijk fytoplankton versus eiwitrijk voer) op de koudetolerantie beschreven. In dit
hoofdstuk worden de resultaten van het experiment beschreven in hoofdstuk III vergeleken
met de resultaten van een tweede experiment waarin specifiek naar het effect van omgeving
en dieet gekeken werd. In het eerste experiment werden 775 juvenielen, afkomstig van 43
vaders en 80 moeders, opgekweekt bij zomer temperaturen gedurende 41-91 dagen. In het
tweede experiment werden 393 vissen geproduceerd door een op een kruisen van 20
vrouwtjes met 20 mannetjes. Deze vissen werden gedurende 42 dagen onder na-zomer/herfst
temperaturen opgekweekt. Gedurende deze periode werd een deel van de vissen gevoerd met
een 40% eiwit pellet, terwijl een tweede groep alleen natuurlijk vijver voedsel tot zijn
beschikking had. Aan het eind van de groeiperiode werden de dieren gemerkt en
overgebracht naar een aquarium in een koelcel waarin de temperatuur geleidelijk omlaag
gebracht werd. Koude tolerantie werd significant beïnvloed door genotype, gewicht,
aquarium, conditiefaktor (P <0.0001) en dieet (P= 0.0547). Ook in dit experiment bleken
kleinere vissen gevoeliger voor koude dan grote. Leeftijd hadden geen invloed op de
koudetolerantie maar er was wel een effect van seizoen. Vissen,opgekweekt onder zomerse
temperaturen stierven bij temperaturen tussen 13.6ºC en 8.6ºC, terwijl vissen opgekweekt bij
herfst temperaturen stierven bij 11.7 – 7.5 ºC. Dit suggereert dat acclimatie aan lagere
temperaturen voorafgaand aan de winter de koudetolerantie van Nijltilapia aanmerkelijk kan
verbeteren.
Kennis van de erfelijkheid van groei en de gecorreleerde veranderingen die plaatsvinden in
andere kenmerken als gevolg van selectie op groei is belangrijk voor het ontwerp van een
efficiënt fokprogramma. In hoofdstuk V en hoofdstuk VI worden schattingen van
fenotypische en genetische parameters voor groei, lichaamsmaten, voortplantings kenmerken
en darmlengte gepresenteerd. Het selectie milieu bestond uit aarden vijvers die dagelijks
bemest werden met 50 kilogram (droge stof) / hectare kippenmest. Er werd niet bijgevoerd.
In totaal werden 6429 vissen met bekende afstamming gebruikt in de analyse. Overleving tot
Samenvatting __________________________________________________________________________________
154
oogst varieerde van 35% tot 77%. Overleving werd beïnvloed door begingewicht, vijver, en
leeftijds effecten. Lichaamsgewicht bij oogst nam toe van gemiddeld 67.4 gram in de
ongeselecteerde grootouder generatie (G0) tot 129.5 gram in de tweede generatie van selectie,
en werd beïnvloed door begingewicht, vijver, sexe en leeftijds effecten. Aangezien de
generaties niet overlappend waren, werden de genetische parameters voor elke generatie
afzonderlijk geschat. Erfelijkheid van lichaamsgewicht varieerde van 0.38 tot 0.6; de
erfelijkheid van overleving varieerde van 0.03 tot 0.14. De geschatte selectie respons was
23.4 gram (34.7%) tussen G0 en G1 en 13.0 gram (14.9%) tussen G1 enG2 (hoofdstuk V). In
hoofdstuk VI worden schattingen gegeven van fenotypische en genetische parameters voor
lichaamsmaten, voortplantingskenmerken en darmlengte van Nijl tilapia. Erfelijkheidsgraden
voor lichaamsmaten varieerden van 0.4-0.6 voor standaardlengte, tot 0.69-0.79 voor
koplengte. Phenotypische correlaties tussen lichaamsgewicht en lichaamsmaten varieerden
van 0.64 tot 0.89. Genetische correlaties waren allen bijna 1. De erfelijkheids schatting voor
geslachtsrijpheid bij oogst was 0.13. Erfelijkheidsgraden voor slacht kenmerken werden
alleen aan dieren uit generatie 1 geschat, en waren 0.16 voor uitslachtgewicht en 0.06 voor
filetpercentage. De fenotypische correlatie tussen lichaamsgewicht en uitslachtgewicht was
0.84; de genetische correlatie was 0.20. Darmlengte nam toe met selectie op
lichaamsgewicht. De erfelijksgraad schatting voor darmlengte was 0.22. Darmlengte en
lichaamsgewicht bleken bovendien genetisch sterk gecorreleerd. Deze resultaten laten zien
dat selectie op groei in bemeste vijvers zonder bijvoeren zeer goede perspectieven biedt.
De selectieomgeving is van groot belang bij het voorspellen van de prestatie van
geselecteerde rassen over een groot scala aan potentiele productieomstandigheden. In het
geval van genotype x milieu interactie kan de genetische verbetering, verkregen in een
selectieomgeving, niet volledig gerealiseerd worden in andere milieus. In hoofdstuk VII
worden de resultaten van een studie naar het belang van genotype x milieu interactie in
geselecteerde Nijl tilapia gepresenteerd. We vergeleken de prestatie van de geselecteerde
“lage lijn” (zie hoofdstuk V en VI) met die van een lijn, geselecteerd op groei in vijvers die
bijgevoerd werden met 25% eiwit pellets (“hoge lijn”). Deze twee lijnen werden getest in 5
behandelingen: bijvoeren met resp. 40% eiwit pellets (P200), 25% eiwit pellets (P100) en
16% eiwit pellets (P50), of geen bijvoeren en alleen bemesten met resp. 50 kilogram ds / ha
kippenmest (M100) of 25 kilogram ds / ha kippenmest (M50). De hoeveelheid stikstof was
Samenvatting __________________________________________________________________________________
155
hetzelfde in de P50 en M50 behandelingen, en in de P100 en M100 behandelingen.
Overleving tot oogst varieerde van 70-75% in de hoge lijn tot 62-76% in de lage lijn.
Statistische analyse lieten significante verschillen zien in de groei prestaties van de twee
lijnen in de verschillende behandelingen. Lichaamsgewicht bij oogst was het hoogst in
testmilieu P200 (123.4 gram in de lage lijn en 131.7 gram in de hoge lijn). De laagste
gemiddelde lichaamsgewichten werden gevonden in M50 (92.1 gram) in de lage lijn en 82.4
gram in de hoge lijn (P100). Hoewel de hoge lijn beter presteerde in de meeste test milieus,
was er een significante lijn x testmilieu interactie, hetgeen aangeeft dat beide lijnen gevoelig
zijn voor het milieu. Er was ook een significante familie x milieu interactie maar alleen voor
de lage lijn. De geobserveerde genotype x milieu interactie hield verband met de interactie
van specifieke families met de hoeveelheid beschikbare stikstof en zuurstof in de vijvers.
De resultaten beschreven in dit proefschrift laten zien dat er goede perspectieven zijn voor het
opzetten van duurzame fokprogrammas voor boeren met weinig economische middelen en
zonder dure bijvoedering van eiwitrijke pellets. De vooruitzichten en benodigdheden voor
een dergelijk praktisch fokprogramma in economisch minder bedeelde regios van de wereld
worden bediscussieerd in hoofdstuk VIII. Bestrijding van de armoede en voedselzekerheid
zijn primaire doelen in ontwikkelingslanden, en het is belangrijk dat goedkope
fokprogrammas worden opgestart en dat het genetisch verbeterde materiaal beschikbaar voor
de plattelandsboeren. Grote genetische variatie is belangrijk voor het succes van een
fokprogramma omdat het de respons op korte en langere termijn bepaald. Strategien om de
genetische variatie te behouden horen daarom deel uit te maken van een fokprogramma.
Fokdoelen dienen samen met lokale boeren opgesteld te worden, bij voorkeur voor elke agro-
ecologische zone, zodat elk ras de behoeften van de lokale boeren dekt. Het oprichten van
vermeerderings centra waar boeren pootvis kunnen krijgen, of een gedecentraliseerd
fokprogramma, moeten ervoor zorgen dat genetisch verbeterd materiaal beschikbaar is
wanneer het nodig is. Het in dit proefschrift beschreven fokprogramma zal alleen dan
maximaal rendement opleveren als tegelijkertijd boeren worden gestimuleerd om lokaal
beschikbare plantaardige restprodukten en dierlijke mest te gebruiken om de natuurlijke
produktiviteit van vijvers en daarmee de groei van de genetisch verbeterde vis maximaal te
stimuleren.
Mukhtasari __________________________________________________________________________________
156
MUKHTASARI
Kati ya samaki wa aina ya tilapia wanaofugwa kwa chakula, ni Naili tilapia ambaye ni
muhimu zaidi duniani, na ndiye tegemeo la wakulima wengi maskini. Wingi wa ufugaji wa
Naili tilapia unafanywa kwenye maeneo ya Kitropiki katika mazingira ya kinusu-shadidi
kwenye vidimbwi mchanga ambavyo huwekwa mbolea. Wakulima hawa maskini hutumia
maliasili zinazotoka shambani, kwa mfano wishwa, ugali kiporo, makapi, majani, na
kadhalika. Ili kuongeza mapato ya samaki, inastahili ukuaji wao uende sambamba na wingi
wa chakula walacho. Utafiti umeonyesha kwamba kati ya 15-30% ya virutubishi kutoka
kwenye chakula cha samaki chenye protini nyingi huvunwa, lakini ni 5-15% pekee ya
virutubishi wanavyopata samaki kwenye vidimbwi vinavyowekwa mbolea ambayo huvunwa.
Tasnifu hii ni sehemu ya mradi wa INREF-POND (Sura ya Kwanza), inayojumuisha utafiti
katika viwango vya samaki, vidimbwi, na mashamba. Lengo la mradi huu ni kutafuta njia ya
kuboresha utumiaji wa virutubishi kwenye mashamba yanayotungamanisha ufugaji wa
samaki na ufugaji wa wanyama howa na/au kilimo cha mimea. Ili kuongeza uzalishaji wa
samaki, tunahitaji kubuni njia za kuboresha utumiaji wa virutubishi kwenye vidimbwi
mchanga vinavyotiwa mbolea. Utafiti huu una nia ya (i) kubaini uwezekano wa kutumia
uzalishaji teuzi (selective breeding) ili kuboresha ukuaji wa Naili tilapia katika hali ya ufugaji
yenye pembejeo duni, (ii) kufahamu athari za uzalishaji teuzi juu ya utendaji wa samaki kwa
jumla, na (iii) kuchunguza utangamano wa jenotaipu na mazingara ya Naili tilapia.
Ni kawaida kwa wakulima wa tilapia kukuza vifaranga samaki kwenye mahapa-ndani ya-
vidimbwi wakitumia vyakula vya protini nyingi vinavyotoka viwandani. Ili kufanya
uzalishaji teuzi kwenye mazingara ya lishe duni, inapasa kufahamu mambo yanayochangia
ukuaji wa samaki kwenye mazingara haya. Sura ya Pili inaonyesha matokeo ya jaribio
lililofanywa ili kufahamu hali njema ya kukuza vifaranga samaki vya tilapia kwenye mahapa-
ndani ya-vidimbwi. Lengo la masomo haya lilikuwa ni kukadiria jinsi athari za kimazingira
na za kijenetiki zinavyochangia ukuaji wa Naili tilapia wanaokuzwa kwenye mahapa-ndani
ya-vidimbwi. Kwenye jaribio tangulizi, tulikuza vifaranga samaki ogelezi-juu (swim-up fry)
na chakula cha samaki cha kijalizo au bila chakula hicho kwenye mahapa yaliyoning’inizwa
kwenye vidimbwi vilivyotiwa mbolea. Wingi wa samaki hao ulikuwa ni vifaranga samaki 5,
10, 15 na 20 kwa mita mraba (m2). Katika jaribio kuu, tulifuga vifaranga samaki ogelezi-juu
toka kwa jamii au familia 25, kila jamii ikigawanywa kwenye mahapa manne. Jaribio
Mukhtasari __________________________________________________________________________________
157
lilikuwa kwa muda wa siku 42, na samaki walikuzwa katiko kiwango cha vifaranga samaki
15/m2. Mahapa yaliyoning’inizwa ndani ya vidimbwi viwili, yalipangwa kwenye safu mbili
zilizokuwa mbalimbali, kila safu ikiwa karibu na ufuo wa kidimbwi. Kila siku, vidimbwi
vilitiwa mbolea ya kuku. Kisha vifaranga samaki kwenye safu moja kati ya zile mbili kwenye
kila kidimbwi walilishwa chakula cha samaki chenye 40% protini mara mbili kwa siku.
Matokeo ya jaribio tangulizi yalionyesha kwamba ukuaji wa vifaranga samaki hutegemea
wingi wa vifaranga kwa mita mraba na aina ya mlo. Kwenye jaribio kuu, mlo haukuleta
tofauti kubwa katika ukuaji wa vifaranga samaki lakini kulikuwa na tofauti kubwa kati ya
vidimbwi: uzani wa samaki baada ya siku 42 ulikuwa 1.7 g kwenye kidimbwi cha kwanza
(Kidimbwi A) na 0.4 g kwenye kidimbwi cha pili (Kidimbwi B). Kiwezorithi (heritability,
h2) cha uzito wa vifaranga samaki kilichokisiwa kutumia data zote na ruwaza ya kigeu-
kimoja kilikuwa 0.01±0.06. Makisio ya kiwezorithi kwa kutumia kigeu-jozi yalikuwa
0.59±0.19 kwenye kidimbwi A na 0.05±0.11 kwenye kidimbwi B. Athari za kukua pamoja
utotoni zikijumuishwa na za kinasaba/athari za mahapa (c2) zilikuwa 0.14±0.06 na 0.29±0.07
kwenye kidimbwi A na B, vikifuatana hivyo. Tulipata mahusiano maeneo (spatial
autocorrelation) makubwa (P = 0.02), kuonyesha kwamba ukuaji wa vifaranga samaki
kwenye mahapa jirani ulifanana. Tulipochambua baadhi ya vipengee vya mazingira, tulipata
kuwa wingi wa hewa ya okisijeni kwenye maji ulitofautiana sana kati ya vidimbwi. Uhuiano
mdogo na hasi wa kijenetiki, rg, wa kiwango cha -0.27±0.69 wa uzito wa vifaranga samaki
kati ya vidimbwi unaelekea kuhusiana na tofauti za wingi wa hewa ya okisijeni kwenye maji
na hii inaonyesha kuwepo kwa utangamano wa jenotaipu na mazingira ya Naili tilapia.
Kushindwa kwa tilapia kuvumilia halijoto ya chini huathiri vibaya hali ya uchumi wa
wakulima, kwa maana hupunguza muda wa ukuzaji wa samaki hao na huleta mauti ya samaki
wakati wa msimu wa baridi kali. Katika Sura ya Tatu, uwezo wa kustahimili baridi wa Naili
tilapia ulitathminiwa na kiwezorithi cha uwezo wa kustahmili baridi kukadiriwa. Jamii 80
zilifanywa kwa kumpa kila samaki mume majike wawili. Vifaranga samaki walikuzwa
kwenye mahapa yaliyoning’inizwa kwenye vidimbwi mchanga vilivyotiwa mbolea ya kuku,
na vilikuwa na umri wa siku 41-91 baada ya kutotolewa, urefu wa 50.6 mm, uzito 5.1 g
wakati wa kuanza jaribio hilo. Vifaranga samaki walitiwa alama na wakawekwa kwenye
chumba baridi. Joto lilipunguzwa kutoka nyuzi 16 centigredi (C) hadi nyuzi 11 C, katika
masaa 48, na kutoka nyuzi 11 C hadi nyuzi 8 C, katika kiwango cha nyuzi moja kwa siku.
Mukhtasari __________________________________________________________________________________
158
Tuliueleza uwezo wa kustahimili baridi kama halijoto wakati samaki alipokufa (TAD), na
dakika zilizopita na mabadiliko ya halijoto kabla ya kufa kwa samaki (CDH). Kufa kwa
samaki wa kwanza kulianza nyuzi 13.6 C na samaki wote wakafa ilipofika nyuzi 8.6 C.
Wastani wa TAD ulikuwa nyuzi 10.1 C na CDH ukawa 298.1. Uzito wa samaki uliathiri
uwezo wa kustahimili baridi kwa kiwango kikubwa (P<0.001). Samaki wadogo (<5 g)
waliathirika zaidi kwa halijoto ya chini kuliko samaki wakubwa. Kiwezorithi cha kustahimili
baridi kilichokadiriwa kwa ruwaza mnyama kilikuwa 0.08±0.17 kwa CDH, na 0.09±0.19 kwa
TAD. Kulikuwa na athari za kukua pamoja utotoni na jamii za 0.33±0.10 kwa CDH na
0.27±0.09 kwa TAD. Viwango hivi vyaonyesha kuwa ukadiriaji wa parameta jenia za
kustahimili baridi kwa tilapia unafaa kuhusisha athari nyongezi za kijenetiki na zile za
mazingira ya kukua pamoja. Kulingana na matokeo ya jaribio hili, tunahitimisha kuwa njia
ifaayo zaidi kuongeza uwezo wa kustahimili baridi kwa vijana wa tilapia ni kwa kuzingatia
ufugaji unaoongeza uzito wa samaki kabla ya msimu wa baridi kali.
Athari za jenotaipu, umri, ukubwa, hali-afya (condition factor), na mlo (mwani asili au
chakula kilichotengenezwa na protini nyingi viwandani) juu ya uwezo wa kustahimili halijoto
ya chini wa vijana samaki zilichunguzwa na kuripotiwa kwenye Sura ya Nne. Sura hii
ililinganisha matokeo ya jaribio lililoripotiwa kwenye Sura ya Tatu na jaribio lengine
lililofanywa kutambua athari za mazingira na mlo juu ya uwezo wa kustahimili baridi.
Kwenye jaribio la kwanza, vijana samaki 775 waliozaliwa na samaki dume 43 na samaki jike
80 walilelewa kwenye halijoto ya juu kwa siku 41-91. Kwenye jaribio la pili, vijana samaki
393 walizalishwa kutoka kwa samaki dume 20 na samaki jike 20, waliochaguliwa kati ya
wazazi waliotumika kwenye jaribio la kwanza. Samaki hawa 393 walilelewa kwa siku 42
kwenye halijoto ya chini wakila chakula cha 40% protini au chakula asili cha mwani. Baada
ya muda wa kuwakuza, samaki waliwekwa kwenye halijoto iliyopunguzwa polepole. Uwezo
wa kustahimili baridi uliathiriwa na jenotaipu, ukubwa, hali-afya, akwariamu (P = 0.0001) na
mlo (P = 0.0547). Umri haukuathiri uwezo wa kustahimili baridi. Samaki waliolelewa
kwenye halijoto ya juu walikufa kati ya nyuzi 13.6 na 8.6 C, hali wale waliolelewa kwenye
halijoto ya chini walikufa kati ya nyuzi 11.7 na 7.5 C. Hii inaonyesha kuwa ukabilihali wa
halijoto ya chini kabla ya kupitia msimu wa baridi unaweza kuboresha uwezo wa kustahimili
baridi wa Naili tilapia.
Mukhtasari __________________________________________________________________________________
159
Ufahamu wa kiwezorithi cha ukuaji na mabadiliko shabihi yanayofanyika kwenye nduni
nyengine baada ya uzalishaji teuzi unaolenga ukuaji ni muhimu kwa ufanyizi wa miradi bora
ya uboreshaji jenia. Katika Sura ya Tano na Sura ya Sita, zimeripotiwa kadirio za
kimaumbile na za kijenetiki za ukuaji, vipimo vya kiwiliwili, nduni za uzao, na urefu wa
utumbo zilizorekodiwa kwa vizazi viwili vya uzalishaji teuzi uliolenga ukuaji kwenye
pembejeo duni. Mazingira ya uteuzi yalikuwa vidimbwi mchanga vilivyotiwa mbolea ya
kuku ya kiwango cha kilo 50/hekta kila siku. Hakuna chakula chochote jalizo kilichopeanwa.
Kwa jumla, samaki 6429 wa jaribio walioandikishwa nasaba zao walitumika kwenye
uchanganuzi. Kuishi kwa samaki hadi kuvunwa kulitofautiana sana kati ya vidimbwi na
kulihududi kati ya 35% na 77%. Kuishi kwa samaki kuliathiriwa na uzito wa samaki ujanani,
vidimbwi na umri. Uzito wa samaki wakati wa kuvunwa uliongezeka kutoka wastani wa 67.4
g kwenye kizazi cha mababu (wasioteuliwa) au G0, mpaka 129.5 g katika G2. Vizazi vilikuwa
tuli (discrete) na kwa hivyo parameta za kijenetiki zilikadiriwa kila mwaka pekee (mwane-
mwane). Kiwezorithi cha uzito kilihududi kutoka 0.38 mpaka 0.60, na kiwezorithi cha kuishi
kilihududi kutoka 0.03 mpaka 0.14. Makadirio ya itikio la uzalishaji teuzi yalikuwa 23.4 g
(34.7%) kati ya G0 na G1 na 13.0 g (14.9%) kati ya G1 na G2 (Sura ya Tano). Sura ya Sita
inaripoti makadirio ya parameta za kimaumbile na za kijenetiki za vipimo vya kiwiliwili,
nduni za uzao, na urefu wa utumbo. Makadirio ya kiwezorithi cha vipimo kiwiliwili
yalihududi kutoka 0.4-0.6 kwa urefu wa mwili mpaka 0.69-0.79 kwa urefu wa kichwa.
Makadirio ya uhuiano wa kimaumbile kati ya uzito na vipimo vya kiwiliwili yalihududi
kutoka 0.64 hadi 0.89. Uhuiano wa kijenetiki ulikaribia moja. Kadirio la kiwezorithi cha
kukomaa kwa samaki wakati wa kuvunwa lilikuwa 0.13. Viwezorithi vya nduni mwilimfu
vilikadiriwa katika G1 pekee na vilikuwa 0.16 kwa mwilimfu uliotolewa utumbo na 0.06 kwa
asilimia-nyama baada ya kutoa matumbo. Uhuiano wa kimaumbile kati ya uzito wa mwili
mzima na mwili uliotolewa utumbo ulikuwa 0.84 na uhuiano wa kijenetiki ukawa 0.20. Urefu
wa utumbo uliongezeka kila kizazi cha uteuzi. Kiwezorithi cha urefu wa utumbo kilikuwa
0.22. Tena, urefu wa utumbo na uzito wa mwili vilihuiana sana kijenetiki. Matokeo haya
yaonyesha yakini kuwa uteuzi uzalishaji wa ukuaji wa Naili tilapia kwenye mazingira ya
pembejeo za chini unawezekana.
Athari za mazingira ya uteuzi kwenye utendaji wa samaki walioteuliwa wakati wanapokuzwa
kwenye mazingira tofauti yanayotofautiana kwa ushadidi wa utumiaji wa nyenzo ni swala
Mukhtasari __________________________________________________________________________________
160
muhimu la uzalishaji. Kunapokuwa na utangamano kati ya jenotaipu na mazingira, uboreshaji
wa kijenetiki upatikanao kwa uteuzi kwenye mazingira fulani huenda usipatikane kwenye
mazingira mengine. Katika Sura ya Saba, matokeo ya somo lililoundwa kubainisha uwepo
wa utangamano kati ya jenotaipu na mazingira katika Naili tilapia yametolewa.
Tulilinganisha utendaji wa samaki walioteuliwa kwenye mazingira duni (Samaki Chini) na
wale walioteuliwa kwenye vidimbwi vilivyopokea chakula chenye 25% ya protini (Samaki
Juu). Samaki hao mbari mbili walijaribishwa kwenye mazingira matano tofauti: kwenye
chakula chenye 40% ya protini (P200), chakula chenye 25% ya protini (P100), chakula
chenye 16% ya protini (P50), kilo 50 kwa hekta za mbolea ya kuku (M100), au kilo 25 kwa
hekta za mbolea ya kuku (M50). Pembejeo za naitrojeni zilifanana kati ya P50 na M50, na
kati ya P100 na M100. Kuishi toka kuwekezwa kwenye vidimbwi hadi kuvunwa kwa samaki
kulihududi kati ya 70-75% kwa Samaki Juu na kati ya 62-76% kwa Samaki Chini.
Uchanganuzi ulionyesha tofauti kubwa za ukuaji kati ya mbari hizo za samaki kwenye
mazingira hayo. Wastani wa uzito wa samaki wakati wa mavuno ulikuwa wa juu zaidi
kwenye P200 (123.4 g Samaki Chini na 131.7 Samaki Juu). Viwango vya chini vya uzito
wastani vilikuwa 92.1 g (mazingira M50) kwa Samaki Chini na 82.4 g (mazingira P100) kwa
Samaki Juu. Ijapokuwa Samaki Juu walionyesha utendaji bora kwenye mazingira mengi
zaidi, kulikuwa na utengamano mkubwa wa mbari na mazingira, kuonyesha kuwa mbari zote
mbili zilikuwa nyetifu kwa mazingira. Utangamano kati ya jamii na mazingira ulipatikana
kwenye Samaki Chini pekee. Utangamano huu wa kijenetiki na mazingira ulihusiana na
utangamano kati ya jamii za samaki na naitrojeni na pia okisijeni iliyo ndani ya vidimbwi.
Matokeo yaliyoelezwa kwenye tasnifu hii yanaonyesha uwezekano mzuri wa kuanzisha
miradi ya uzalishaji wa tilapia kwa minajili ya kilimo kisichohitaji vyakula jalizo ghali vya
protini. Uwezekano na mahitaji ya kuanzisha mifumo ya uzalishaji kwa mkulima mdogo
kwenye maeneo ya nyenzo duni duniani yamejadiliwa kwenye Sura ya Nane. Kwa sababu
kuondoa umaskini na kuwa na hali salama ya chakula ni malengo msingi katika nchi
zinazoendelea duniani, ni muhimu kwamba mifumo rahisi ya uzalishaji ianzishwe na
kudumishwa, na mbegu zilizoboreshwa kijenetiki zifanywe rahisi kupatikana na wakulima
wa samaki vijijini. Mwachano mkubwa wa kijenetiki unahitajika katika miradi ya uzalishaji
kwa sababu ya umuhimu wa maitikio ya uzalishaji teuzi ya karibuni na ya zama zijazo. Kwa
hivyo, mikakati ya kudumisha mwachano wa kijenetiki kizazi baada ya kizazi cha uteuzi
Mukhtasari __________________________________________________________________________________
161
yanafaa kujumuishwa kwenye mpango wa uzalishaji. Malengo muafaka ya mifumo ya
uzalishaji yanahitaji kuwekwa tukizingatia kuwahusisha wakulima walengwa, hasa hasa
katika kila jimbo au eneo tofauti la kiekolojia la zaraa ili kuhakikisha kwamba mzao wa
samaki unatosheleza mahitaji ya mkulima mlengwa mahali popote alipo. Utengenezaji wa
vituo vya uzidishaji wa mbegu za samaki ambapo wakulima wanaweza kupata vifaranga
samaki au ufanyaji wa miradi ya uzalishaji karibu na wakulima yafaa uhimizwe ili
kuhakikisha kwamba mbegu zilizoboreshwa zinawafikia wakulima kwa wakati muafaka. Ili
kupata manufaa kamili ya uzalishaji, inahitaji wakulima wahimizwe kufuga samaki
wakitumia nyenzo za mashambani mwao na mbolea katika njia zinazofaa ila kuhakikisha
kuwa Naili tilapia walioboreshwa kijenetiki wanapata lishe tosha.

Acknowledgements __________________________________________________________________________________
163
Acknowledgements
First and foremost, I would like to thank my God for the strength, good health, and for
provisions of the required resources throughout this study.
I am indebted to the Wageningen University who provided funds for the research through the
INREF-Pond project. I am also grateful to the Worldfish Centre which allowed us to use their
facilities during field experiments. The Tilapia International Foundation and the CTA (ACP-
EU): Technical Centre for Agriculture and Rural Cooperation of the European Union
provided funds for conferences and are highly acknowledged. I thank the Dr Judith Zwartz
Foundation for financial support for the printing of this thesis.
My warmest gratitude goes to Prof. Johan van Arendonk for his very constructive criticism.
Johan your support and insight led to a much more improved thesis. My gratitude also goes to
Prof. Johan Verreth for constant encouragement. Special thanks to my supervisors Dr. Hans
Komen and Dr. Henk Bovenhuis for sharing your vast knowledge in selective breeding, for
the guidance you gave, and for promptly reading through the various versions of the
manuscripts. I vote you the best supervisors in the world! Dr. Mahmoud Rezk thanks for your
practical help in the field and making sure my stay in Egypt was fruitful. Drs. Patrick Dugan
and George John, thanks for your kind comments and facilitation of my work at the
WorldFish Center. Roel Bosma and Anne van Dam, it was nice and pleasant working with
you as project managers.
Thanks also to Dr. Johnson Kazungu, director Kenya Marine and Fisheries Research Institute
(KMFRI) for giving permission to pursue my studies. Dr. Rennison Ruwa and J.C. Ogunja
(KMFRI) thanks for encouraging me while applying for the scholarship and throughout the
study period.
During the four years of study, I was privileged to belong to two WIAS chairgroups:
Aquaculture and Fisheries Group and the Animal Breeding and Genetics Group. Special
thanks to the PhD students and staff in both groups for being a source of encouragement as we
together shared and laughed away the tough and good times. Patricia Muendo, Yonas, Bosso,
Richard, Marc Rutten, Neil, Ir. Piet de Groot, Solomon, Beatriz, Oliver with whom we shared
offices at one time or another, you provided a wonderful working environment. Oanh and
Sebastian- it was nice working with you in Egypt. Group mates Mulder, Rota, Esther,
Acknowledgements __________________________________________________________________________________
164
Briggitte, Gonzalos, Catarina, An, Tito, Iyob...to mention but a few for stimulating
discussions -it was a great experience working with you all! Valentina and Evangelina, I will
always remember the way you worked tirelessly to format the first draft of this thesis! Indeed
each member of ABG and AFG had a unique important way in making this thesis a reality, be
it a smile, a kind comment, or even in asking “when will you finish and go back to Kenya?”
Thanks!
This thesis would not have been without the support of some Egyptian and Kenyan friends
and colleagues in Egypt. Tharwat, thanks for ensuring that all went well during field
experiments. The Sheesha group: Abdalla Sheesha and Mohammed Sheesha and Ahmed
Abdu -shukran gazilan for giving yourselves fully to the work and the sumptuous meals we
ate in your homes! The Mohandes group: Abdelkadir, Megaheed, Abd Hafez, Chalabi for
your untiring help during the data collection. Elly, Kawaga, Mamsaa, Wambua and Imali:
your true friendship kept me going. The Moharebs you ushered me into Egyptian Christian
circles; Sirya, mucheo na anao nina muvera kwa kunikaribisha mdzini mwako Misri. The
Munyifwas for your hospitality and making me feel part of your family during my low
moments; The Mulaas, the Onyangos, Paul (Uganda), Bosuben, Ambassador Mary Odinga,
and the BS group it was great knowing and fellowshiping with you. Brother Philip, Sister
Lillian and Zack thanks! Nyakwere Christian Fellowship and all brethren thanks for your
constant prayers.
The ICF Monday Bible study and Wednesday prayer groups and members of Amazing Parish,
RCCG, Wageningen -you were a constant source of spiritual nourishment. Lastly, I would
like to acknowledge the African student fraternity and in particularly the Wabongo and
Ugandan Communities: Tuendelee vivyo hivyo, umoja wetu na udumu na kudumu! The
Kenyan community at Wageningen: Ronald and Anke Simiyu, Mageria, Geoffrey, Mose, E.
Muyanga, Mercy, Lydia, P. Maingi, Liz, Vivienne, Faith, Susan, S. Ongaro, Wanzala, A.
Oduor, Ochieno, B.A.M. Mweri thanks for your good company.
For all I did not mention by name, but who participated in one way or anther to make this
thesis a success: Thanks na Asanteni sana!
Harrison Charo
10 April 2006
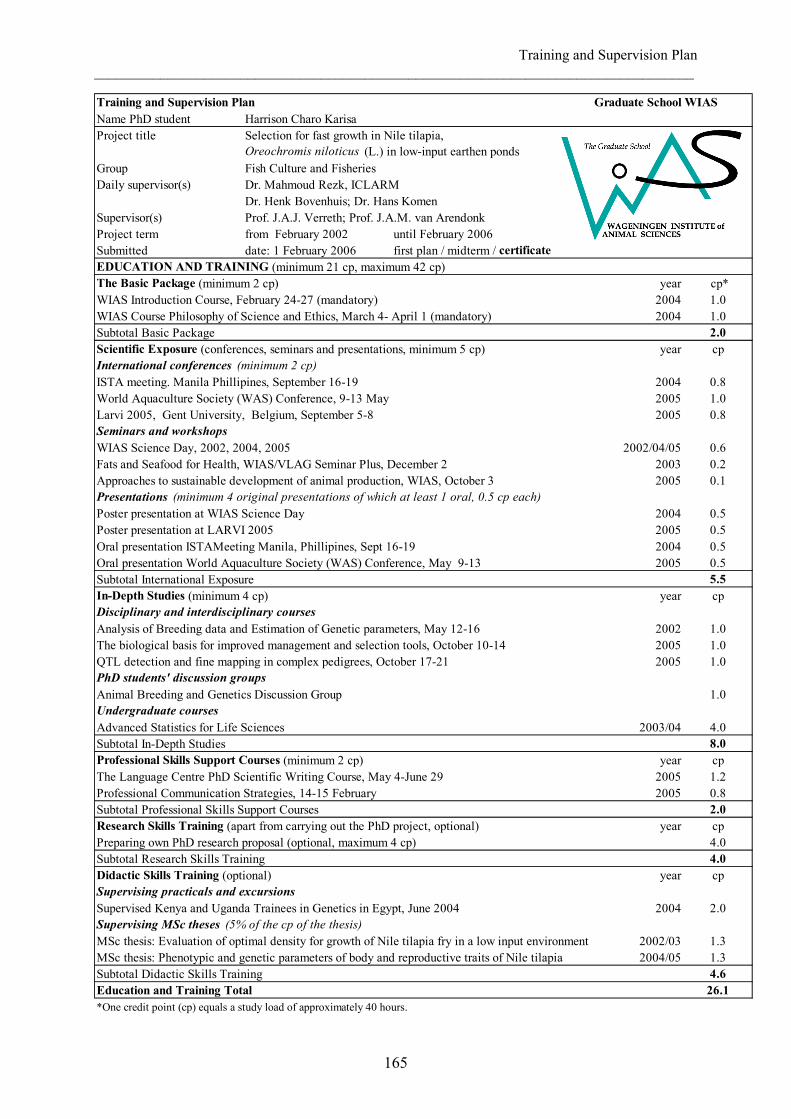
Training and Supervision Plan __________________________________________________________________________________
165
Name PhD student
Project title
Oreochromis niloticus (L.) in low-input earthen ponds
Group
Daily supervisor(s)
Dr. Henk Bovenhuis; Dr. Hans Komen
Supervisor(s)
Project term from February 2002 until February 2006
Submitted date: 1 February 2006
year cp*
2004 1.0
2004 1.0
2.0
year cp
2004 0.8
2005 1.0
2005 0.8
WIAS Science Day, 2002, 2004, 2005 2002/04/05 0.6
Fats and Seafood for Health, WIAS/VLAG Seminar Plus, December 2 2003 0.2
2005 0.1
2004 0.5
2005 0.5
2004 0.5
2005 0.5
5.5
year cp
2002 1.0
2005 1.0
2005 1.0
1.0
2003/04 4.0
8.0
year cp
2005 1.2
2005 0.8
2.0
year cp
4.0
4.0
year cp
2004 2.0
2002/03 1.3
MSc thesis: Phenotypic and genetic parameters of body and reproductive traits of Nile tilapia 2004/05 1.3
4.6
26.1
QTL detection and fine mapping in complex pedigrees, October 17-21
Professional Communication Strategies, 14-15 February
Undergraduate courses
Animal Breeding and Genetics Discussion Group
The Language Centre PhD Scientific Writing Course, May 4-June 29
Education and Training Total
Subtotal Research Skills Training
Subtotal Didactic Skills Training
PhD students' discussion groups
Disciplinary and interdisciplinary courses
Poster presentation at LARVI 2005
Scientific Exposure (conferences, seminars and presentations, minimum 5 cp)
Oral presentation World Aquaculture Society (WAS) Conference, May 9-13
Advanced Statistics for Life Sciences
Supervised Kenya and Uganda Trainees in Genetics in Egypt, June 2004
Supervising MSc theses (5% of the cp of the thesis)
Supervising practicals and excursions
MSc thesis: Evaluation of optimal density for growth of Nile tilapia fry in a low input environment
Subtotal Professional Skills Support Courses
Subtotal In-Depth Studies
Professional Skills Support Courses (minimum 2 cp)
Didactic Skills Training (optional)
Research Skills Training (apart from carrying out the PhD project, optional)
Preparing own PhD research proposal (optional, maximum 4 cp)
The biological basis for improved management and selection tools, October 10-14
Larvi 2005, Gent University, Belgium, September 5-8
ISTA meeting. Manila Phillipines, September 16-19
Subtotal International Exposure
In-Depth Studies (minimum 4 cp)
Oral presentation ISTAMeeting Manila, Phillipines, Sept 16-19
Seminars and workshops
Presentations (minimum 4 original presentations of which at least 1 oral, 0.5 cp each)
EDUCATION AND TRAINING (minimum 21 cp, maximum 42 cp)
WIAS Introduction Course, February 24-27 (mandatory)
The Basic Package (minimum 2 cp)
Poster presentation at WIAS Science Day
Approaches to sustainable development of animal production, WIAS, October 3
International conferences (minimum 2 cp)
World Aquaculture Society (WAS) Conference, 9-13 May
Training and Supervision Plan Graduate School WIAS
Harrison Charo Karisa
Selection for fast growth in Nile tilapia,
*One credit point (cp) equals a study load of approximately 40 hours.
Fish Culture and Fisheries
Analysis of Breeding data and Estimation of Genetic parameters, May 12-16
Dr. Mahmoud Rezk, ICLARM
Prof. J.A.J. Verreth; Prof. J.A.M. van Arendonk
first plan / midterm / certificate
WIAS Course Philosophy of Science and Ethics, March 4- April 1 (mandatory)
Subtotal Basic Package
Curriculum vitae __________________________________________________________________________________
166
The author was born on 22 February 1972 to William Karisa Yaa and Rachel Kadzo. He was
educated at Bamba Full Primary School from 1979 to 1986 and obtained a Kenya Primary
School Certificate of Education. He proceeded to Mangu High School from 1987, from where
in 1990 he obtained a Kenya Secondary Certificate of Education. In 1992 he joined the Jomo
Kenyatta University of Agriculture and Technology (JKUAT) where he graduated with a BSc
honours degree in 1996. While studying at JKUAT, he taught Chemistry, Biology and
Mathematics at Kilifi Township and Godoma Secondary Schools during the holidays. After
his BSc, he worked as a Chemistry and Biology teacher at Sokoke Secondary School from
January to June, 1996. In July 1996, he was offered a job at the JKUAT as a Teaching
Assistant and at The Kenya Marine and Fisheries Research Institute (KMFRI) as a Research
Officer. He opted for the research job where he is currently. In 1999, he obtained two
scholarships: a one year MSc. course in Nematology at Gent University, Belgium and an MSc
course in Biodiversity at the Swedish Biodiversity Center (CBM) of Uppsala University and
the Swedish University of Agricultural Sciences, Uppsala, Sweden. He opted for the MSc.
Biodiversity course from which he graduated in June 2001. In October the same year he
obtained an INREF-Pond Scholarship to pursue a PhD course in Fish Genetics at Wageningen
University.
Contact address:
Kenya Marine and Fisheries Research Institute, P.O. Box 136, Pap-Onditi, Kenya
Telephone: +254-725555143
E-mail: [email protected] or [email protected]
Publications __________________________________________________________________________________
167
Publications and Proceedings
1. Charo-Karisa, H., Rezk, M. A., Bovenhuis, H., Komen, H., 2005. Heritability of cold
tolerance in Nile tilapia, Oreochromis niloticus juveniles. Aquaculture, 249: 115–123.
2. Charo-Karisa, H., Komen, H., Reynolds, S., Rezk, M.A., Ponzoni. R.W., Bovenhuis, H.,
2006. Genetic and environmental factors affecting growth of Nile tilapia juveniles:
modelling spatial correlations between hapas. Aquaculture, in press.
3. Charo-Karisa, H., Komen, H., Rezk, M. A., Ponzoni, R.W., van Arendonk, J.A.M.,
Bovenhuis, H., 2006. Heritability estimates and response to selection for growth of Nile
tilapia (Oreochromis niloticus) in low-input earthen ponds. Submitted to Aquaculture.
4. Charo-Karisa, H., Bovenhuis, H., Rezk, M. A., Ponzoni, R.W., van Arendonk, J.A.M., H.,
Komen. Phenotypic and genetic parameters for body measurements, reproductive traits
and gut length of Nile tilapia (Oreochromis niloticus) selected for growth in low-input
earthen ponds. Submitted to Aquaculture.
5. Charo, H., Oirere, W., 2000. River-based artificial breeding of Clarias gariepinus
Burchell: A case for the African Small-scale fish farmer. ICLARM Q. 23(1):14-16.
6. Charo-Karisa, H., Rezk, Phan, O., M. A., Bovenhuis, H., Komen, H., 2005. Estimates of
phenotypic and genetic parameters for carcass traits in Nile tilapia selected for fast growth
in low-input conditions. Paper presented at the World Aquaculture Society Meeting, Bali
International Convention Centre, 9-13 May 2005, pp. 113.
7. Maithya, J., Charo, H., Okeyo-Owuor, J.B., Wangila, B.C.C., Ouma, H., Orinda, C.,
Hoggren, M., Dannewitz, J., Carlsson, M., 2005. Aquaculture strategy for restoration of
threatened Lake Victoria fishes: The case for Oreochromis variabilis (Boulenger, 1906)
and Labeo victorianus (Boulenger, 1901). In:Mallya, G.A., Katagira, F.F., Kanggoha, G.,
Mbwana, S.B., Katunzi, E.F., Wambende, J.T., Azza, N., Wakwabi, E., Njoka, S.W.,
Kusewa, M., Busulwa, H. (Eds.). Knowledge and Experiences gained from managing The
Lake Victoria Ecosytem, LVEMP, Dar es Salam, Tanzania, pp 445-466.
Publications __________________________________________________________________________________
168
8. Charo-Karisa, H., Rezk, M.A., Bovenhuis, H., Komen, H., 2005. Factors affecting early
growth of Nile tilapia fry in hapa-in-pond environments. Hendry, C.I., Van Stappen, G.,
Wille, M., Sorgeloos, P., (Eds). Fish & Shellfish Larviculture Symposium. European
Aquaculture Society, Special Publication No. 36, Oostende, Belgium, 2005 LARVI ’05.
9. Charo-Karisa, H., Rezk, M.A., Bovenhuis, H., Komen, H., 2004. Effects of rearing
conditions on low-temperature tolerance of Nile tilapia, Oreochromis niloticus juveniles.
In: Bolivar, R., Mair, G., Fitzsimmons, K., (Eds.), New Dimensions in Farmed Tilapia.
Proceedings of the 6th International Symposium on Tilapia in Aquaculture, Manila, pp.
30-41.
10. Charo, H., Dannevitz, J., Carlsson, M., Hoggren, M., 2001. Genetic and morphological
variation in an African cyprinid (Labeo victorianus): implications for aquaculture and
conservation. Presented at the First LVEMP National Conference, October, 2001.
11. Maithya, J., Charo, H., Ototo, A., Ouma, H., 2000. The aquaculture potential of Lake
Victoria catchment area - Kenyan sector. In Proceedings of Lake Victoria 2000
International Conference, 16-19 May 2000, Jinja, Uganda.

NOTES __________________________________________________________________________________
169
This study was the result of a joint project of The World Fish Centre and Wageningen
University, and was financially supported by the Wageningen University's Interdisciplinary
Research and Education Fund (INREF-POND) and The World Fish Centre.
Printed by: Ponsen en Looijen - Wageningen
Financial support for the printing of this thesis was obtained from the Dr Judith Zwartz
Foundation, Wageningen, The Netherlands.