Embed Size (px)
Citation preview

Asia Pacific Journal of Research Vol: I Issue XIV, February 2014
ISSN: 2320-5504, E-ISSN-2347-4793
Page | 151
Invasion, Biology and impact of feral population of Nile tilapia (Oreochromis
niloticus Linnaeus, 1757) in the Ganga River (India).
A.K.Singh1, Pankaj Verma
1, Sharad C. Srivastava
1 and Madhu Tripathi
2
1National Bureau of Fish Genetic Resources
Canal Ring Road P. O. Dilkusha, Lucknow-226002, Uttar Pradesh, India
2Department of Zoology, University of Lucknow, Uttar Pradesh, India
Abstract
In this study, we aimed to determine the dispersion area and population characteristic of
Oreochromis niloticus (i.e., the abundance, length-weight, food and feeding, gastro somatic index
(GaSi), sex ratio, gonado somatic index (GSI) and fecundity) which has formed a feral population in
the Ganga River, the largest one in the country. Water parameters were studied in relation to
Oreochromis niloticus between years 2008 and 2012. Abundance of O. niloticus in the fishery of
the river was observed. Condition factor for feral O.niloticus was calculated which ranged from
2.07-3.64 during successive years. The gut content analysis revealed the presence of over 80%
bacillariophyta and cyanophyta comprising of the phytoplankton; crustaceans and rotifera were the
primary groups of zooplankton. Calculated GaSi ranged from 7.05 to 11.41 at different sampling
sites. Sex ratio indicated the presence of more females than males, indicating an increased
propagule pressurs. GSI was ranged from 0.27-3.90 in different catches. High fecundity was
observed at locations where the fish had high abundance, indicating an enhanced spawning potential
of the feral fish. Well documented negative impacts and increased yield of O.niloticus in the Ganga
River attracting attention to conserve native fish germplasm for rich aquatic biodiversity.
1. Introduction
Tilapia, a native to Africa [1] and Middle East [2] has emerged as one of the most internationally
traded food fishes in the world [3]. There are about 70 species of tilapias, most of them are native to
Western rivers of Africa. Of these, eight species mainly Nile tilapia (Oreochromis niloticus,
Linnaeus 1757 ), Mozambique tilapia (O. mossambicus, Peters 1852), Blue tilapia (O.aureus
,Steindachner 1864), Tilapia urolepis (O. hornorum, Trewavas 1966) Gallilee tilapia
(Sarotherodon galilaeus, Hasselquist 1757) Black-chinned tilapia (S.melanotheron , Ruppel, 1852)

Asia Pacific Journal of Research Vol: I Issue XIV, February 2014
ISSN: 2320-5504, E-ISSN-2347-4793
Page | 152
Redbreast tilapia (Tilapia rendalii , Boulenger 1896) Redbelly tilapia (T. zillii, Ge vais 1848) are
used in aquaculture worldwide [4]. Of these species, Nile tilapia is a relatively large cichlid fish [5],
The natural distributions and global genetic resources of tilapias are in Africa, yet the main centers
of utilization for aquaculture are primarily in Asia [3]. World tilapia production has been booming
during the last decade, with output doubling from 830000 tonnes in 1990 to 1.6 million tonnes in
1999, 3.23 million in 2011 [7] and estimated to increase 8.89 million metric tons by the year 2020
[8]. Commercially, tilapias are the second most important Group of wild-captured fish, after carps,
with a global capture (harvest reaching) 769,936 tonnes metric tonnes in 2007[4]. China is by far
the largest consumer and producer (about 46% of global production) of tilapia, with a production
estimated at 1.15 million tonnes in 2009 and is estimated to reach 1.5 million tons in 2012 [9] .
Typical size of tilapia sold in the Asian market is between 450 to 680G (1.0 to 1.5 lb). It is sold live
as well as fresh, frozen as whole, frozen fillets, gutted, gutted and scaled, skinless and boneless. The
United State is the world’s single largest importer of tilapia [10].
The O.niloticus was introduced to India during late 1987 [6]. The aquaculture of O.niloticus
expanded in the southern region of the country especially by private entrepreneurs. During 1995,
Vorion Chemicals Ltd. Chennai claimed high production of hybrid red tilapia popularly called as
golden tilapia [11]. However, the production collapsed for some unknown reason [6]. Culture of
O.niloticus particularly in Andhra Pradesh, Orissa and West Bengal is now gearing up and the fish
is now distributed to many states particularly the coastal areas. Cultivated tilapias are typically
hybrids between the O.niloticus and other closely related species native to Africa [12]. O.niloticus
are one of the easiest and profitable fish to farm, in part because they are omnivorous [3] and can be
fed a diet derived exclusively from plants. O.niloticus and other fish that feed on vegetable
materials offer a much more ecologically sound and environmentally friendly means of providing
humankind with an abundance of nutritious and delicious fish.
Escapement of tilapia from aquaculture facilities due to recurring floods or inadvertent releases
frequently happened. However, recent occurrence of tilapia in the fishery of the Ganga River system
has been a concern. It was interesting to see a considerable size of O.niloticus in the fishery of the
Ganga River system particularly in an area where tilapia culture is hardly practiced. This scenario
prompted us to study its population characteristics i.e., the abundance, size range, food and feeding,
GaSi, GSI, maturity, and breeding. The study was undertaken under two perspectives; the former
was to ascertaining the colonization of the escapee O.niloticus through natural population in the
Ganga River system and the latter was to assess its possible impacts on the local fishery and the fish
diversity.
2. Methods and materials
2.1 Location. The study area covered approximately 450 km of the river stretch of the middle Ganga
flowing along the districts of Kannauj,Kanpur, Unnao, Allahabad, Mirzapur, Varanasi, Ghazipur
and Ballia districts of Uttar Pradesh. Data was collected from fish landing areas of Mehdighat in
Kannauj, bridge area and Tiwarighat in Kanpur, Shuklaganj in Unnao, Daraganj and Jhunsi in
Allahabad, Adalhat and Pakka ghat in Mirzapur, Saraimohana and Ramnagar in Varanasi, Dadri
ghat in Ghazipur and Ganga ghat in Ballia district (Figure 1).

Asia Pacific Journal of Research Vol: I Issue XIV, February 2014
ISSN: 2320-5504, E-ISSN-2347-4793
Page | 153
2.2 Physico-chemical analysis. Atmospheric and water temperatures were recorded at sampling sites
using digital thermometer with accuracy of ± 0.05 OC. Water pH, dissolved oxygen (DO),
conductivity were determined using a water quality analysis kit (WTW Multi340i-SET, Germany).
The value of COD was determined by remixing the water sample for two hours in the presence of
mercuric sulphate, 0.025N potassium dichromate and sulphuric acid digested with silver sulphate (a
catalyst). Refluxing was followed by titration of sample with 0.01N ferrous ammonium sulphate in
the presence of ferroin indicator. After comparison with a blank set, COD was estimated as follows:
(B-A)×N of ferrous Ammonium Sulphate×1000×8
COD (mg/L) =
Volume (ml) of sample taken
Where, A was volume (ml) of titrant with sample: B was volume (ml) of titrant with blank sample: N
was normality of ferrous ammonium sulphate. Silver sulphate was used to neutralize the effect of
chlorides as it gets converted in the stable mercuric chloride. Some volume of added potassium
dichromate was utilized to oxidize the chemical present in the water; only rest of the potassium
dichromate was titrated. Ferroin indicator was prepared by adding 1.485 gm of 1/10 phenenthrodein and
0.695 gm of ferrous sulphate in 100 ml of distilled water.
Biochemical oxygen demand was estimated by the incubation of samples in dark at 20˚C for five days,
proceeded by the addition of phosphate buffer which was prepared by dissolving 8.5 g KH2SO4, 21.75 g
K2PO4, 33.4 g Na2HPO4.7H2O and 1.7g NH4Cl in distilled water of volume 1 lit. After incubation in
BOD incubator, samples were analyzed by a modified Winkler’s Method. A blank set (un-incubated) of
sample was also analyzed to find out the differences. The BOD was further calculated as follows:
BOD (mg/L) = (DO – DO5) × dilution factor
Where DO = volume of oxygen in blank set; DO5 = volume of oxygen in incubated set.
2.3 Fish sampling. Fish samples were collected from the landing centers on quarterly basis during 2008
to 2012. Fishermen generally used multi-meshed gill nets of mesh size 8.5–50 mm as well as dragnets
for fishing. From commercial catches, fishes were collected at the landing centers and were identified,
measured (fork length, Total Length nearest cm), and weighed (g) using portable digital balance. Keys
for identification of fish species [13] and FAO identification sheet as [4]. From the total catch, the
abundance index of O.niloticus was calculated using the following formula:
AI=𝐧(𝐤)×𝟏𝟎𝟎
𝐍
Where:
AI = abundance index,
n(k) = number of tilapia caught at each study site.
N = number of all the fish species caught at that site.
2.4 Biometric studies. Total length (cm) of each fish was taken from the tip of the snout (mouth
closed) to the extended tip of the caudal fin using a measuring board. Body weight was measured to
the nearest gram using a portable digital balance [14].
Asia Pacific Journal of Research Vol: I Issue XIV, February 2014
ISSN: 2320-5504, E-ISSN-2347-4793
Page | 154
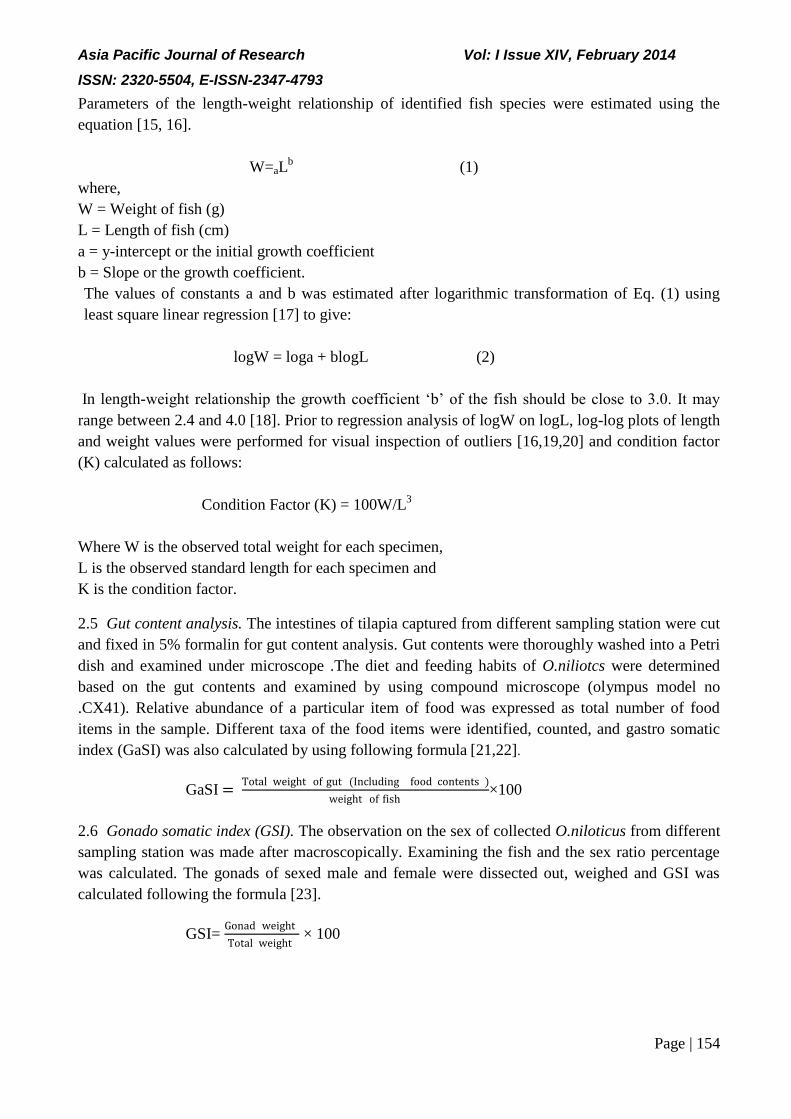
Parameters of the length-weight relationship of identified fish species were estimated using the
equation [15, 16].
W=aLb
(1)
where,
W = Weight of fish (g)
L = Length of fish (cm)
a = y-intercept or the initial growth coefficient
b = Slope or the growth coefficient.
The values of constants a and b was estimated after logarithmic transformation of Eq. (1) using
least square linear regression [17] to give:
logW = loga + blogL (2)
In length-weight relationship the growth coefficient ‘b’ of the fish should be close to 3.0. It may
range between 2.4 and 4.0 [18]. Prior to regression analysis of logW on logL, log-log plots of length
and weight values were performed for visual inspection of outliers [16,19,20] and condition factor
(K) calculated as follows:
Condition Factor (K) = 100W/L3
Where W is the observed total weight for each specimen,
L is the observed standard length for each specimen and
K is the condition factor.
2.5 Gut content analysis. The intestines of tilapia captured from different sampling station were cut
and fixed in 5% formalin for gut content analysis. Gut contents were thoroughly washed into a Petri
dish and examined under microscope .The diet and feeding habits of O.niliotcs were determined
based on the gut contents and examined by using compound microscope (olympus model no
.CX41). Relative abundance of a particular item of food was expressed as total number of food
items in the sample. Different taxa of the food items were identified, counted, and gastro somatic
index (GaSI) was also calculated by using following formula [21,22].
GaSI = Total weight of gut (Including food contents )
weight of fish×100
2.6 Gonado somatic index (GSI). The observation on the sex of collected O.niloticus from different
sampling station was made after macroscopically. Examining the fish and the sex ratio percentage
was calculated. The gonads of sexed male and female were dissected out, weighed and GSI was
calculated following the formula [23].
GSI= Gonad weight
Total weight × 100

Asia Pacific Journal of Research Vol: I Issue XIV, February 2014
ISSN: 2320-5504, E-ISSN-2347-4793
Page | 155
Fecundity was measured by weighing the eggs present in ovary as per formula-
Fecundity = number of eggs in one gm of ovary × total weight of ovary (g)
2.7 Statistical Analyses. All data were presented as mean ± SD. Data obtained from the experiment were
subjected to one way analysis of variance (ANOVA) test using the Statistical Package for the Social
Sciences (SPSS), version 8.1. The correlation coefficients between the quality parameter pairs of the
water samples were calculated by the application of Pearson correlation analysis. Parameters were
analysed statistically (at 5 %) and significance was calculated by student’s ‘t’ test.
3. Results
The physico-chemical parameters of the river water during the study period are presented as mean
±SD (Table1). Temperature was recorded to range from 17±2 to 30±1.1, while pH values
varied from 7.2±0.2 to 8.1±0.8 .Electrical conductivity ranged between 304±42 μmho/cm to
798±45 μmho/cm. No clear seasonal or temporal changes of EC in the river water was
observed. TDS value ranged between 261±9.7 to 614±28.8 mg/L. Total hardness ranged between
120±12.8 to 358±30.4 mg/L. While alkalinity ranged between 126±7.1 to 327±9.1 mg/L. Temporal
variations of alkalinity in river water was recorded during the study period at different locations
(Table 1). Dissolved oxygen ranged between 4.6±2.1 to 8±1 mg/L. Low dissolved oxygen was
observed at Kanpur and BOD value in the river water ranged from 1.6±1.1 to 4.6±3.0 where as
COD value ranged between 8±1.4 to 40.76±4.8 mg/L (Table 1).
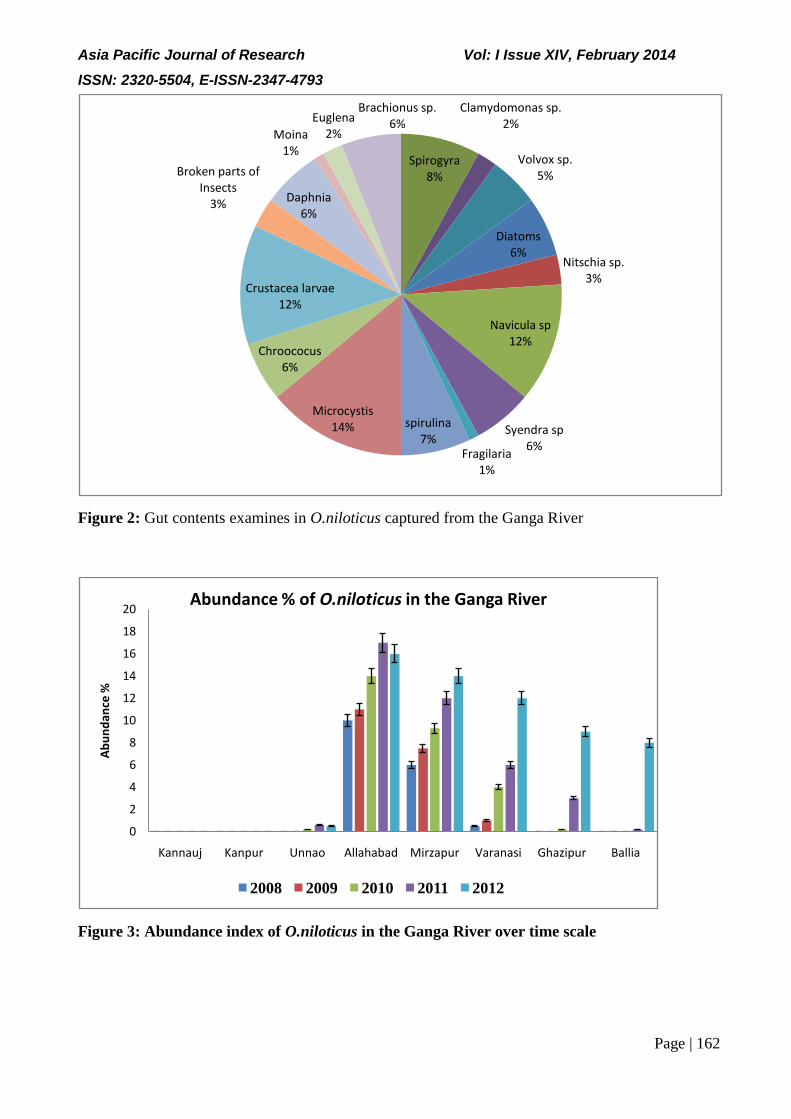
The abundance of the O. niloticus ranged from 7-12% during 2008 at different sampling
locations. However it increased to 9 – 24.6% during 2012. The size of the fish ranged from 14 cm to
19 cm in length and 70 to 250 g in weight in year 2008 and 12 to 28 cm in length and 60 to 610 g in
weight by the year 2012. The O. niloticus included high proportion of large fish weighing 450-600 g
and the small fishes were in low proportion. The condition factors (K) for O. niloticus ranged from
2.07 to 3.64 (Table 2). The recorded data on the occurrence of O.niloticus for the years 2008 to
2012 revealed that catch of O.niloticus increased successively during this period (Figure 3).
Gonadal examination of O.niloticus in different catches revealed that immature, maturing, and
mature fishes were available. Mature males were found at smaller size while mature females were
bigger in size and sex ratio revealed slight variation 1.11 : 1 for female and male in 2008 and 1.31:1
for female and male in 2012 as expected against Mendelian sex ratio 1:1(Table 2). Observation of
sex ratio revealed that female individual increased from 2008 to 2012. Gonads of examined
specimens revealed varying gonado-somatic index (GSI) i.e 0.27 to 3.90 at different locations of the
river. The calculated absolute fecundity ranged between 632 to 6262 and it increased through
successive years as the weight of fishes increased. The gonado somatic index (GSI) and fecundity
over time scale is presented in Table 2.The important fish biodiversity of the Ganga River collected
from different sampling station and fish diversity were identified as Indian major carps (IMCs),
minor carp, catfishes, and exotic fishes. The Indian major carp (Labeo rohita, Catla catla and
Cirrhinus mrigala) constituting 4.5% to 9 % , catfishes and minor carp were 9%–11% and 4.5%–
6% of total catch. The IMCs incorporated high percentage of large fish weighing 2.8–7.2 kg and
the small fishes share a low fraction of total catch. During the study period, we have observed that,
there was a decline in catch of IMCs. In total catch minor carps were identified as Labeo bata ,
L.calbasu, Cirrhinus reba, Puntius sophore, P.conchonius and catfishes were represented by
Sperata aor, S.seenghala, Bagarius bagarius, Wallago attu, Rita rita ,Clupisoma garua. Other
identified fishes were Salmophasiab acaila, Gonialosa manmina,Glossogobius giuris, Johniu
scoitor , Ailia coila, Mastacembelus armatus and Anabas testudineus representing 9.5%–14% of
total catch. O.niloticus was present in all the catches from the Ganga River except Kanpur and
Kannauj (Figure 3). Trophic spectra of examined specimens of O.niloticus revealed that there was

Asia Pacific Journal of Research Vol: I Issue XIV, February 2014
ISSN: 2320-5504, E-ISSN-2347-4793
Page | 156
similarity in the ingested food at different locations. Gut content analysis of O.niloticus collected
from all sampling locations had both phytoplankton and zooplankton. By number, phytoplankton
was the most abundant upto70%. Two phytoplankton groups, bacillariophyta and cyanophyta
comprised over 80% of the phytoplankton in the gut of all species (Figure 2). Crustaceans and
Rotifera were the primary groups of zooplankton in fish guts. Feeding intensity as gastro somatic
index (GaSi) ranged between7.05 to 11.41 (Table 2).
4. Discussion
Oreochromis niloticus was introduced into India during 1987 for aquaculture purpose and now it
contributes more than 7.17% in total inland fish production [24]. Results of this study delineated
increased abundance of O.niloticus in the fishery the fish has now established feral population in the
Ganga River. O.niloticus grows normally above 16°C, loses activities below 16°C and begins to die
at 10°C [25]. Nile tilapia are notorious with their resistance against bad water quality conditions
[26]. Tilapia are more tolerant than most commonly farmed freshwater fish to high salinity, high
water temperature, low dissolved oxygen, and high ammonia concentrations, O. niloticus is the least
saline tolerant of the commercially important species [27]. Although we found no significant
variation in water quality by latitude of sampled areas but combination of long life span and high
variability in life history traits such as variation in biometry, GSI, fecundity in response to locations
and time scale may aid thriving of escapee O.niloticus in the river., It is an African omnivorous
filtering fish, which is largely phytoplanktivorous [28]. Gut content analysis confirmed that the fish
had high preference towards plant materials. High value of feeding intensity or Gastro Somatic
Index (GaSI) also showed that it fed more intensely on planktons. Observed sex ratio showed higher
number of females which helped the fish to colonize rapidly during successive years. The relatively
high fecundity observed in our study may indicate the enhanced spawning potential of the feral
population of O.niloticus after it successfully established in river. Our data showed that the
fecundity of O.niloticus generally increased with the length and weight of the fish and it may due to
the size which affects the increased number of eggs in the females. However , we observed
variations in fecundity between the fishes having similar length or weight. Gonadal development of
O.niloticus has been reported to be continuous in females and the results of the present study also
supported wild spawning of O.niloticus in the Ganga River. Since O.niloticus, is known to exhibit
early sexual maturity, rapid colonization and wide environmental tolerances, these attributes have
been considered to help the fish to successfully spread into new environments of the Ganga River.
Nile tilapia develops its own ecology for its survival and repopulating by competing with other
fishes as was confirmed by the biology, ecology, reproduction, food and feeding of feral
O.niloticus.
Significant negative effects of exotic O.niloticus on the native fish diversity have been
observed. O.niloticus in India has already been reported to cause sharp decline in the catches of
endemic fishes [24,30].The fishery of the Ganga River is now subjected to the threats of pollution
by sewage and industrial wastes, deforestation, excessive use of fertilizers, pesticides, and water
development programmes [32-34]. Consequently, the catches of local fish species have been
adversely affected [35] but invasion of exotic O. niloticus in the fishery of the Ganga River has been
recent further aggravating the threats to the indigenous fish diversity including environmental
problem [36]. It has historically been accepted that successful biological invasions detrimentally
affect the structure and function of native ecosystems [29,31], the first being habitat degradation.
O.niloticus negatively impacted on the important indigenous fishes particularly Indian major carps
[38]. The potential risk not only affect the quality or level of biodiversity but also the socio-
economic aspects of the human community that depend on aquatic ecosystem for their sustenance
[37]. Introductions of exotic species generally threaten the stability of ecosystems, resulting in
extinction through long-term predation and competition and leading to replacement of native

Asia Pacific Journal of Research Vol: I Issue XIV, February 2014
ISSN: 2320-5504, E-ISSN-2347-4793
Page | 157
species by exotic species. Other documented effects are hybridization with native species,
disruption of the food chain and environmental degradation [39,40]. O.niloticus causes the local
extinction of many indigenous fish species, and changes the nature of fisheries [41]. The results of
this study that the revealed that O.niloticus has established its feral population in the Ganga River
and it may create great threat to the ecological integrity as well as native fish biodiversity of Ganga
River. It is especially noticeable that invasive O.niloticus imposed adverse impacts on the wild
population and cause remarkable ecological alterations and also implicated adverse effect on
community as well as ecosystem levels .It has drawn attention to conservation biologists to
understand cause of invasion, rate of invasion and adverse ecological impacts of exotic species that
may provide better management policies for sustainable fisheries.
Acknowledgements
Authors are grateful to Dr. J. K. Jena, Director of National Bureau of Fish Genetic Resources
(NBFGR) Lucknow for his generous support and guidance. The financial support of Uttar Pradesh
Biodiversity Board, Lucknow is also thankfully acknowledged.
References.
[1] E. Trewavas, "Nomenclature of the tilapias of southern Africa" Journal, Limnological Society of
South Africa, vol.7 no1, pp. 42, 1981.
[2] E.C. Boyd, Farm-Level Issues in Aquaculture Certification: Tilapia. Auburn University, Alabama
36831. 2004.
[3] E. Eknath and G. Hulata, Use and exchange of genetic resources of Nile tilapia
(Oreochromis niloticus). Reviews in Aquaculture, vol.1, pp.197–213 ,2009.
[4] FAO, Aquatic Species Information Programme, Oreochromis niloticus (Linnaeus,1758)
http://www.fao.org/fishery/culturedspecies/Oreochromis_niloticus/en. 2010.
[5] A. Bocek, Introduction to Tilapia Raising. International Center for Aquaculture and Aquatic.
Environments Swingle Hall Auburn University, 2008.
[6] A.K. Singh, and W.S. Lakra, Risk and benefit assessment of alien fish species of the aquaculture and
aquarium trade into India. Reviews in Aquaculture vol.3, pp.3-18, 2011.
[7] De Jolio de, Tilapia genetic strains and hatchery technology. Panorama acuicola April, 2012.
[8] A.G.J. Tacon and M. Metian, Global overview on the use of fish meal and fish oil in industrially
compounded aquafeeds: Trends and futureprospects. Aquaculture, Vol. 285, pp.14-158, 2008.
[9] FAO, The State of World Fisheries and Aquaculture. FAO fisheries and aquaculture department
FAO Rome, pp.1-230, 2012.
[10] ERS. USDA, Economic Research Service Imports and Exports of Tilapia,
http://www.ers.usda.gov/data/TilapiaImportsValue.htm. 2012.
[11] G. Rangaswami, Intensive Inland Fish Culture to eliminate protein malnutrition in India. In: BCIL
journal publication on biotechnology, Agriculture and environment- A portfolio of essays, pp.
83-88, 1995.

Asia Pacific Journal of Research Vol: I Issue XIV, February 2014
ISSN: 2320-5504, E-ISSN-2347-4793
Page | 158
[12] FAO, FAO Year Book. Fishery and aquaculture statistics.
http://www.fao.org/fishery/publications/year -books/en., 2012.
[13] V.G. Jhingran, Fish and fisheries of India. Hindustan Publishing Corporation (India). pp. 954,
1975.
[14] O.O. Fafioye and O.A. Oluajo, Length-weight relationships of five fish species in Epe Lagoon,
Nigeria. African Journal of Biotechnology, vol. 4, pp. 749-751, 2005.
[15] W.E. Rickter, Linear regressions in fisheries research. Journal of Fisheries Research Board of
Canada. ,vol.30, no.3, pp. 409-434, 1973.
[16] D, Pauly, Some simple methods for the assessment of tropical fish stocks. FAO Fisheries
Technical paper, FAO, Rome, Italy, pp 52, 1983.
[17] J.H. Zar, Biostatistical Analysis. Prentice Hall, New Jersey, pp.718, 1984.
[18] R.B. Dahare, and A. Dhamani, Length-weight relationship of a freshwater fish Chella bacaila
(Gunther). Nat Sem on ETICLSEC, vol. 79,2009.
[19] R. Froese, The length-weight relationship of fishes: a review. Journal of Applied Ichthyology,
vol. 22, pp. 241- 253, 2006.
[20] L. M. Gomiero and F. M. S. Braga, The condition factor of fishes from two river basins in Sao
Paulo state, Southeast of Brazil. Acta Scientiarum.vol. 27, pp.73-78, 2005.
[21] V. R. Desai, Studies on the Fishery and Biology of Tor tor (Ham.) from River Narmada. Journal
of Inland Fisheries Society of India, vol. 2, pp.101-112,1970.
[22] S.P. Biswas, Manual of Methods in Fish Biology. South Asia Publishers Pvt. Ltd., Delhi. pp .65-
67, 1993.
[23] S.Z. Qasim, An appraisal of the studies on maturation and spawning in marine teleosts from the
Indian waters. Ibid. vol. 20, pp. 351-371,1973.
[24] A.K. Singh and W.S. Lakra, Alien fish species in India: Impact and emerging scenario. Journal of
Ecophysiology and Occupational Health vol. 6, no. (3–4) pp. 165–174, 2006.
[25] R.C. Bhujel and A.V Suresh, Advances in tilapia broodstock management. Global Aquaculture
Advocate, vol. 3,no.5, pp.19-22, 2000.
[26] Turker H., Effect of different color light on growth of Nile tilapia (O. niloticus L.).Journal of Fish
Science vol 3,no.,pp. 231-236, 2009.
[27] T J. Popma and L L. Lovshin., Worldwide Prospects for Commercial Production of Tilapia. International Center for Aquaculture and Aquatic Environments Department of Fisheries and Allied
Aquacultures Auburn University, Alabama 36849. Pp 1-42.
[28] C C. Figueredo And Alessandra Giani. Ecological interactions between Nile tilapia (Oreochromis
niloticus, L.) and the phytoplanktonic community of the Furnas Reservoir (Brazil). Freshwater
Biology 50, 1391–1403,2005.

Asia Pacific Journal of Research Vol: I Issue XIV, February 2014
ISSN: 2320-5504, E-ISSN-2347-4793
Page | 159
[29] CS Elton (1958) The ecology of invasions by animals and plants. The University of Chicago Press,
Chicago, IL.
[30] W.S. Lakra, A.K. Singh and S. Ayyappan, Fish introductions in India: Status, potential and
challenges. Narendra Publishers, New Delhi, India. 2008.
[31] Wilson EO (2006) The Creation. 175 p. An appeal to save life on earth. W.H. Norton and
Company, New York.
[32] R.J. Rao, Biological resources of the Ganga River, India. Hydrobiologia vol. 458, no. (1–3), pp.
159–168, 2001.
[33] U.K. Sarkar and M.B. Bain, Priority habitats for the conservation of large river fish in the Ganges
River basin. Aquatic Conservation: Marine and Freshwater Ecosystems vol.17 no.4, pp. 349–
359, 2006.
[34] P.B. Singh and V. Singh, Pesticide bioaccumulation and plasma sex steroids in fishes during
breeding phase from north India. Environmental Toxicology and Pharmacology vol. 25,no. 3,pp.
342–350, 2008.
[35] W.S. Lakra, A.K. Singh and P.C. Mahanta, Fish genetic resources. Narendra Publishers, New
Delhi, India. 2009.
[36] A.K. Singh, W.S Lakra and A. Mishra, Spread and colonization of alien fish species in open
waters: a reliable indicator of aquatic health. Aquaculture Health International vol. 13, pp. 40–
42, 2008.
[37] Philipp,D.P., J.M Epifanio, J.E Mardsen and J.E Claussen (eds).Protection of aquatic biodiversity.
Proceedings of world fisheries congress, Theme 3.Oxford and IBH Publ. Co. New Delhi Pp 282.
1995.
[38] A. K. Singh, A. K. Pathak, and W. S. Lakra, Invasion of an exotic fish—common carp, cyprinus
carpio L. (actinopterygii: cypriniformes: cyprinidae) in the Ganga River, India and its impacts
Acta ichthyologica et piscatoria vol. 40, no.1, pp.11–19, 2010.
[39] M. Williamson,. Biological Invasions. Chapman Hall, London, pp: 244, 1996.
[40] G.W, Cox. Conservation Biology: Concepts and Applications. In: 2nd Edn., Wm. C. Brown Publ.,
Dubuque, USA., ISBN-13: 9780697218148, Pages: 362, 1997.
[41] R.M. Wise, B.W. van Wilgen, M.P. Hill, F. Schulthess, D. Tweddle, A. Chabi-Olay, and H.G
Zimmermann. The Economic Impact and Appropriate Management of Selected Invasive Alien
Species on the African Continent. Global Invasive Species Programme. CSIR report number:
CSIR/NRE/RBSD/ER/2007/0044/C,2007.

Asia Pacific Journal of Research Vol: I Issue XIV, February 2014
ISSN: 2320-5504, E-ISSN-2347-4793
Page | 160
Figure1: Map showing sampling locations

Asia Pacific Journal of Research Vol: I Issue XIV, February 2014
ISSN: 2320-5504, E-ISSN-2347-4793
Page | 161
Table 1: Physico-chemical parameter analysis of Ganga River
Table 2: Catch contribution and biometry of Oreochromis niloticus captured from the Ganga River
Year Abundance
(%) of
O.niloticus
Length
Range (cm) Weight
Range (gm)
K- Value GaSI Sex Ratio GSI Fecundity of
different
weight fish
(Above 150-500
g)
Female Male
2008 7-12 14-19 70-250 2.55-3.64 7.14-9.72 1.11 1 0.27-1.15 632-2184
2009 6.52-13.5 16-22 85-320 2.07-3.00 9.10-8.96 1.17 1 0.70-1.80 711-3250
2010 7.32-17.4 13-24 65-370 2.67-2.95 7.05-10.71 1.21 1 0.49-2.60 769-4622
2011 8.6-19.5 14-24 70-440 2.55-2.89 8.79-9.26 1.26 1 0.51-3.17 802-5336
2012 9-24.6 12-28 60-610 3.07-2.54 8.86-11.41 1.31 1 0.86-3.90 825-6262
Parameter Kannauj Kanpur Unnao Allahabad Mirzapur Varanasi Ghazipur Ballia
Temperature
(⁰C)
19±2-
27±3.2
17±2-
29±3.1
18±1-
27±3.5
17±3.2-
28±1.6
19±1.1-
26±2.1
20±1.2-
27±2.1
18.2±2.1-
30±1.1
18±2.6-
29±1.6
EC
(µmho /cm)
361±72.2-
722±31.6
344±71.2-
730±31.4
368±72-
684±40
358±68-
798±45
342±56-
652±26
340±59-
642±36
306±45-
656±22
304±42-
526±21
TDS
( mg/L)
270±11.6-
602±28.2
265.2±11.3-
614±28.8
261±9.7-
599±40.2
265±15-
504±31.2
272±27-
542±32.4
270±20-
511±34.1
284±56-
540±30.2
281±46-
512±36
pH 7.4±0.1-
7.2±0.2
7.2±0.2-
7.8±0.3
7.6±0.4-
7.8±0.1
7.8±0.4-
8.0±0.6
7.6±0.1-
8.1±0.8
7.4±0.1-
7.8±0.6
7.6±0.2-
7.8±0.2
7.4±0.3-
7.8±0.1
DO
( mg/L)
6.2±2.4-
7.4±2.6
4.6±2.1-
5.4±3
5.1±1.1-
6±2.0
6±1-
6.5±1.2
6.1±1.2-
7.1±1.5
6.4±1.1-
7.5±2
6.8±1-
8±1
6.5±1.1-
7.5±1.2
BOD
( mg/L)
2.1±1-
3.2±2.6
2.6±1-
4.6±3.0
2.1±1-
4.3±2.1
2 ±1.7-
3.8±1.6
1.8±1-
3.6±1.5
1.6±1.1-
3.9±1.2
1.9±1.2-
3.6±1.2
2±1.2-
3.9±1.2
COD
( mg/L)
8±1.4-
38±3.1
13.3±1.6-
40.76±4.8
12.0±1.1-
33.1±2.9
12.9±1.5-
34.6±2.6
10.9±1.2-
38.4±4.6
11.9±1.1-
36.4-3.4
13±1-
39±2.2
12.2±1.1-
29.2±1.1
Alkalinity
( mg/L)
126±7.1-
317±7.1
129±8.1-
327±9.1
128±9-
321±10
128±8.9-
318±20
131±9-
315±22
132±11-
316±25
141±20-
321±12
144±21-
320±16
T. Hardness
( mg/L)
128±11.8-
358±30.4
120±12.8-
342±22.4
138±24-
305±35
126±22-
325±22
141±24-
311±17
139±22-
322±27
152±50-
352±25
162±60-
342±21
Asia Pacific Journal of Research Vol: I Issue XIV, February 2014
ISSN: 2320-5504, E-ISSN-2347-4793
Page | 162
Figure 2: Gut contents examines in O.niloticus captured from the Ganga River
Figure 3: Abundance index of O.niloticus in the Ganga River over time scale
Spirogyra8%
Clamydomonas sp.2%
Volvox sp.5%
Diatoms6%
Nitschia sp.3%
Navicula sp12%
Syendra sp6%
Fragilaria1%
spirulina7%
Microcystis14%
Chroococus6%
Crustacea larvae12%
Broken parts of Insects
3% Daphnia6%
Moina 1%
Euglena2%
Brachionus sp.6%
0
2
4
6
8
10
12
14
16
18
20
Kannauj Kanpur Unnao Allahabad Mirzapur Varanasi Ghazipur Ballia
Ab
un
dan
ce %
Abundance % of O.niloticus in the Ganga River
2008 2009 2010 2011 2012