Embed Size (px)
Citation preview
Scientific Quarterly “Organization and Management”, 2021, Vol. 1, No. 53; DOI: 10.29119/1899-6116.2021.53.9 www.oamquarterly.polsl.pl
SELECTED PROBLEMS OF CONSUMER ACCEPTANCE 1
OF INNOVATIVE FOOD PRODUCTS 2
Irena ŚLIWIŃSKA1*, Jadwiga STOBIECKA2 3
1 Department of Market Analysis and Marketing Research (PhD student), Cracow University of Economics, 4 Poland; [email protected], ORCID: 0000-0003-3769-7414 5
2 Department of Market Analysis and Marketing Research, Cracow University of Economics, Poland; 6 [email protected], ORCID: 0000-0001-9063-6616 7
* Correspondence author 8
Introduction/background: Consumer reluctance to try new, formerly unknown foods poses 9
a serious obstacle for the development of innovations in the food market. Considerable attention 10
has been given to the threats perceived by consumers related to eating selected innovative foods: 11
genetically modified food (GMF), convenience food and functional food. 12
Aim of the paper: This paper is aimed at indicating factors that shape consumer acceptance of 13
innovative food products. The research was focused on establishing the association between the 14
attitude towards new food and the selected demographic (age, sex) as well as psychological 15
traits (the speed of adopting innovation based on Rogers’ Diffusion of Innovation Theory) of 16
the respondents. 17
Materials and methods: The paper presents the results of the authors’ own studies conducted 18
among Polish consumers using the direct survey method. The research was carried out in 2019 19
and involved employing a purposive sampling technique (n = 240). The data were analysed 20
utilising the following methods: analysis of the internal consistency of the attitude scale using 21
Cronbach’s alpha, k-means cluster analysis, contingency tables. 22
Results and conclusions: The 9-item Food Neophobia Scale (FNS) was reduced to three 23
variables: enthusiasm, neutrality and reluctance. These variables were subjected to k-means 24
cluster analysis, which resulted in identifying two homogenous groups with similar attitude 25
towards new food. We have found a statistically significant association between belonging to 26
a cluster-based on the approach to innovative food and the speed of accepting innovation using 27
Rogers’ model of diffusion of innovation – and the sex and age of the respondents. 28
Keywords: consumer attitudes, consumer acceptance of innovation, consumer perceived risk, 29
food innovation. 30
1. Introduction 31
The food market undergoes dynamic development thanks to technological progress in 32
agriculture and industry. Traditional as well as internet media, providing both information and 33
advertising content, play an important role in the public discussion on nutrition. The Internet 34
126 I. Śliwińska, J. Stobiecka
represents a specific type of media that enables fast dissemination of information as well as 35
direct information exchange among consumers. A wide-ranging discussion on food and 36
nutrition has an impact on shaping consumers’ attitudes and on consumers’ purchasing 37
decisions (McCluskey, Kalaitzandonakes, Swinnen, 2016, pp. 467-486). Consumers make 38
more conscious dietary choices and confront food producers with increasingly difficult 39
challenges. Currently the food market is shaped by various fads and trends that must be 40
carefully observed by food producers, especially when it comes to developing new food 41
products (Si, 2020, pp. 305-321). The purpose of this paper is to indicate factors affecting 42
consumer acceptance of innovative food products. We have searched for the association 43
between the attitude towards new food (positive/neutral/reluctant) and demographic traits, 44
such as the age and sex of the respondents, and the speed of welcoming innovation according 45
to the model of diffusion of innovation developed by Rogers. 46
2. Consumer resistance to innovation: perceived threats and food 47
neophobia 48
Developing innovative products becomes a necessity for producers operating in the 49
increasingly competitive food market (Makała, Olkiewicz, 2004, pp. 121-124). Given the 50
constant growth in consumer expectations, the range of products delivered by food producers 51
must constantly change and expand. The main trends in developing new food products emerge 52
as a result of needs communicated by consumers and by the technological solutions available 53
at a given time. According to the literature, innovative food is commonly subdivided into three 54
categories: convenience food, GM food, and functional food (Gawęcki, 2002, pp. 5-15; 55
Lähteenmäki, Grunert et al., 2002, pp. 523-533; Tuorila, 2001; Urala and Lähteenmäki, 2004, 56
pp. 793-803). From the consumers’ point of view, innovations in the food market are 57
completely subjective and frequently constitute minor modifications of the product, 58
e.g. connected with changing packaging design, finding innovative uses or new functionalities 59
(Babicz-Zielińska, Dąbrowska, 2011, p. 40). 60
The innovations introduced by manufacturers do not always meet with favorable reception 61
from consumers. Genetically-engineered foods represent a category that arouses a considerable 62
concerns due to limited knowledge about genetic modifications, difficulties in providing 63
an explicit definition of genetically modified organisms (GMO), general lack of widespread 64
understanding for scientific achievements, ethical dilemmas, and religious beliefs as well as the 65
inability to indicate the benefits GMO could deliver (Rzymski, Królczyk, 2016, p. 690). 66
Convenience food that can be prepared quickly and easily, which represents an obvious 67
advantage, is highly-processed and perceived by consumers as unhealthy and unnatural 68
(Botonaki, Mattas, 2010, p. 630; Brunner, van der Horst, Siegrist, 2010, p. 499). As healthy 69
Selected problems of consumer acceptance… 127
lifestyle trends continue to grow, one could expect that functional food should meet market 70
demands. Unfortunately, due to lack of legal regulations, this type of food is not widely known 71
and accepted among consumers (Annunziata, Vecchio, 2013, pp. 350-351; Krygier, Florowska, 72
2008, p. 2; Kudełka 2011, p. 291). Besides consumer perceptions of threats associated with the 73
types of food discussed above, the innovation on the food market can be seriously hindered by 74
reluctance to try unknown food products. 75
Trying innovative food is somehow tantamount to taking a risk. Fear of the unknown and 76
selecting products that we are familiar with represent typical human reactions (Dolgopolova, 77
Teuber, Bruschi, 2015). Negative attitude towards different food forms and nutrition is often 78
associated with the lack of products knowledge (Babicz-Zielińska, 2006, p. 379). Fears and lack 79
of trust in new technologies applied in food production are strongly correlated with reluctance 80
to try novelties (Cox, Evans, 2008, p. 704; Royzman, Cusimano, Leeman, 2017, pp. 466-467). 81
Consumer reluctance to eat new, unknown foods is defined as food neophobia (Tuorila, 82
Hartmann, 2020, pp. 1-2). This eating trait is understood as an attitude towards food manifesting 83
as avoidance of trying new products (Babicz-Zielińska, 2006, p. 380). The level of food 84
neophobia depends, among others, on the following factors: age, sex, place of residence 85
(town/village), income, education, psychological characteristics (attitude towards innovation), 86
genetic factors, cultural traits, purchasing knowledge and experience, and sensory sensitivity 87
(Kowalczuk, Fusiek, Nowocień, 2017, p. 76). 88
3. Research methodology 89
The results presented and analysed here were obtained in the course of the authors’ own 90
research conducted in 2019 among Polish consumers using direct survey as the research 91
technique. Purposive sampling involved taking into account respondents’ age (two categories) 92
and sex (two categories). The analyses presented in this paper were carried out based on answers 93
provided by 240 respondents. Questionnaire survey was used as a research tool. The questions 94
in the questionnaire regarded consumers’ attitudes towards innovative food products as well as 95
their habits and behaviour connected with trying new foods that they have not sampled before. 96
With regard the questionnaire, two measuring scales were adopted based on available 97
literature. The first used in the study was applied to assess food neophobia. Original Food 98
Neophobia Scale (FNS) consists of 10 statements (10-item test) about trying novel foods 99
(Pliner, Hobden, 1992, pp. 105-120). Our questionnaire included 9 statements taken from that 100
scale1. The second scale was based on the model of diffusion of innovation devised by Rogers 101
(Rogers' Diffusion of Innovation Theory). According to that model, it is natural that consumers 102
1 The statement ‘I like to try new ethnic restaurants’ was omitted, as the research was focused on the consumers’
attitude towards new food products selected during everyday grocery shopping.
128 I. Śliwińska, J. Stobiecka
differ with regard to accepting innovations. ‘Innovators’, who are the first to welcome 103
innovations, usually constitute a small percentage of the population. ‘Early adopters’ are 104
relatively less innovative. The following groups, comprising the majority of consumers, include 105
the ‘early majority’, who hesitate to adopt novelties, and ‘late majority’, who are skeptical about 106
innovation. The last group consists of laggards, who are conservative and do not like changes 107
(Rogers, 1983, pp. 248-251). That question was aimed at identifying respondents’ general 108
attitude towards innovations on the food market. 109
4. Results 110
4.1. Consumer acceptance and distrust in new foods 111
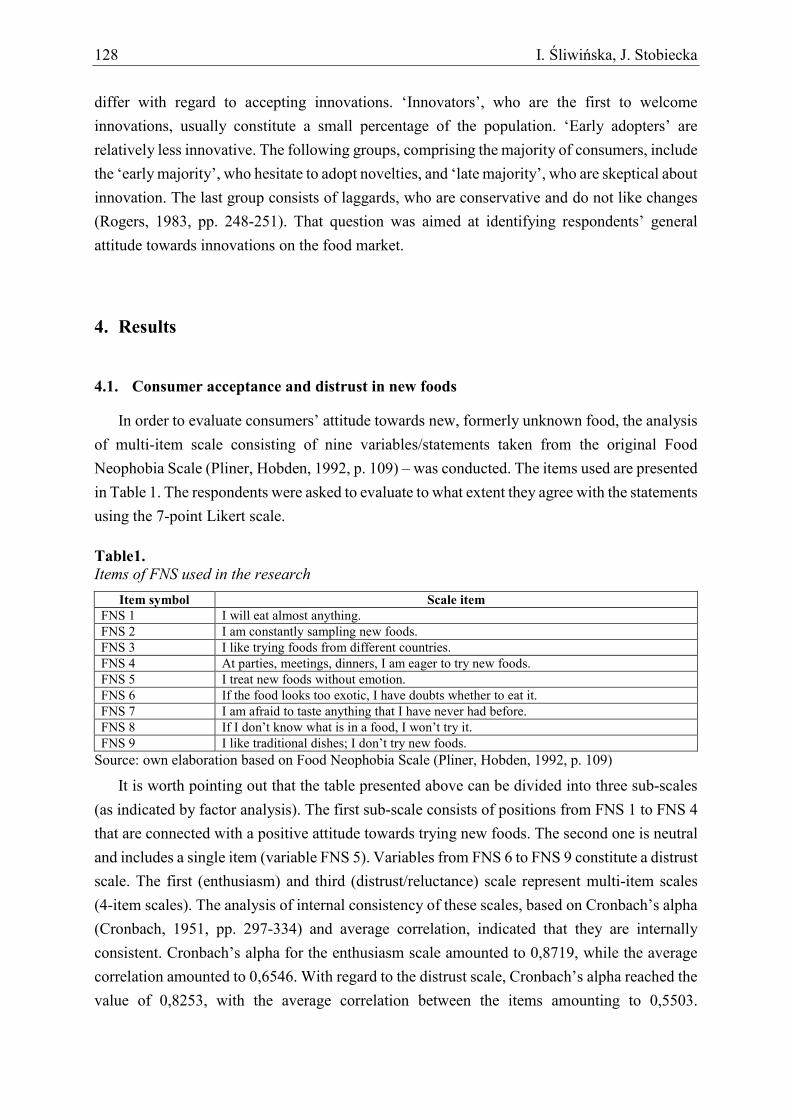
In order to evaluate consumers’ attitude towards new, formerly unknown food, the analysis 112
of multi-item scale consisting of nine variables/statements taken from the original Food 113
Neophobia Scale (Pliner, Hobden, 1992, p. 109) – was conducted. The items used are presented 114
in Table 1. The respondents were asked to evaluate to what extent they agree with the statements 115
using the 7-point Likert scale. 116
Table1. 117 Items of FNS used in the research 118
Item symbol Scale item FNS 1 I will eat almost anything. FNS 2 I am constantly sampling new foods. FNS 3 I like trying foods from different countries. FNS 4 At parties, meetings, dinners, I am eager to try new foods. FNS 5 I treat new foods without emotion. FNS 6 If the food looks too exotic, I have doubts whether to eat it. FNS 7 I am afraid to taste anything that I have never had before. FNS 8 If I don’t know what is in a food, I won’t try it. FNS 9 I like traditional dishes; I don’t try new foods.
Source: own elaboration based on Food Neophobia Scale (Pliner, Hobden, 1992, p. 109) 119
It is worth pointing out that the table presented above can be divided into three sub-scales 120
(as indicated by factor analysis). The first sub-scale consists of positions from FNS 1 to FNS 4 121
that are connected with a positive attitude towards trying new foods. The second one is neutral 122
and includes a single item (variable FNS 5). Variables from FNS 6 to FNS 9 constitute a distrust 123
scale. The first (enthusiasm) and third (distrust/reluctance) scale represent multi-item scales 124
(4-item scales). The analysis of internal consistency of these scales, based on Cronbach’s alpha 125
(Cronbach, 1951, pp. 297-334) and average correlation, indicated that they are internally 126
consistent. Cronbach’s alpha for the enthusiasm scale amounted to 0,8719, while the average 127
correlation amounted to 0,6546. With regard to the distrust scale, Cronbach’s alpha reached the 128
value of 0,8253, with the average correlation between the items amounting to 0,5503. 129
Selected problems of consumer acceptance… 129
According to Nunnally (Nunnally, 1978, p. 245; DeVellis, 2012, pp. 109-110) the values for 130
Cronbach’s alpha obtained here are acceptable and are recommended for basic research. 131
The results demonstrate that all four items in the analysed scales measure the same aspect of 132
the studied phenomenon and constitute single dimensional scales. For that reason it was 133
possible to use arithmetic mean as a variable representing each dimension and reducing four 134
items to one synthetic variable. Thus, each sub-scale reflecting the attitude to new, unknown 135
food was represented by one variable. Mean values obtained for particular dimensions and 136
standard deviation are shown in Table 2. 137
Table 2. 138 Mean values and standard deviation for identified three sub-scales (all respondents) 139
Variable Total
Mean SD Enthusiasm 4,36 1,5935 Neutrality 3,54 1,7425 Reluctance 3,26 1,4977
Source: own elaboration. 140
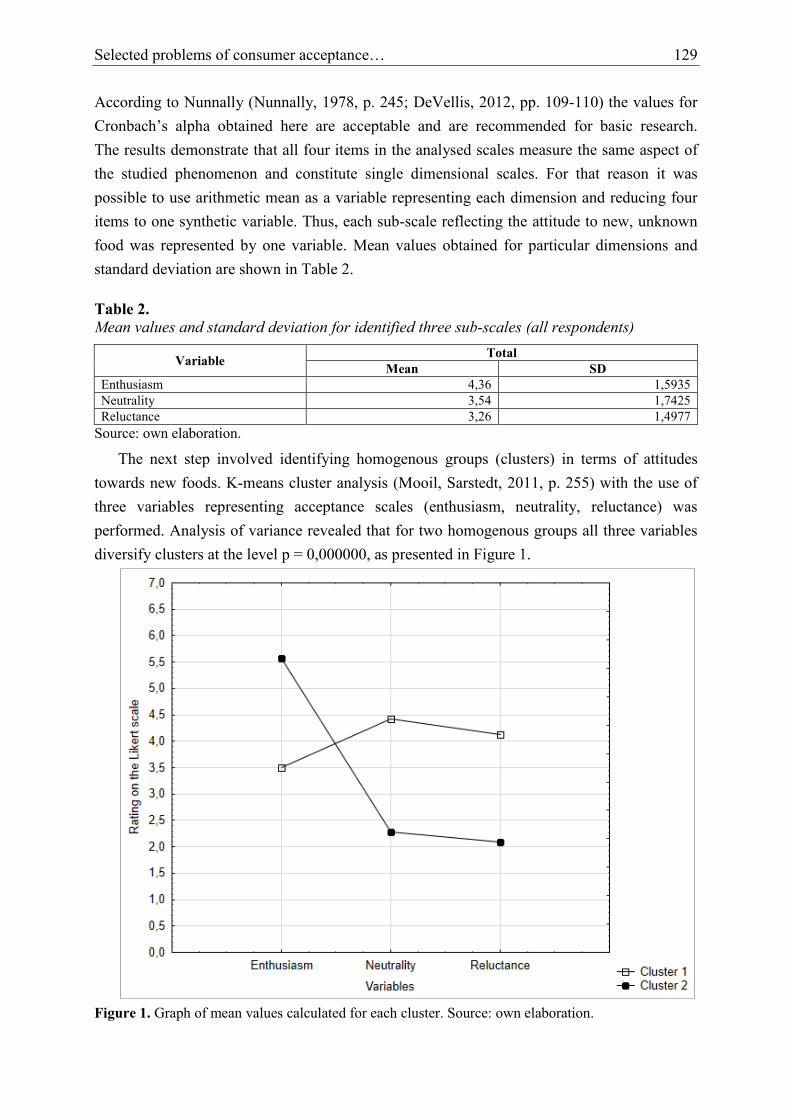
The next step involved identifying homogenous groups (clusters) in terms of attitudes 141
towards new foods. K-means cluster analysis (Mooil, Sarstedt, 2011, p. 255) with the use of 142
three variables representing acceptance scales (enthusiasm, neutrality, reluctance) was 143
performed. Analysis of variance revealed that for two homogenous groups all three variables 144
diversify clusters at the level p = 0,000000, as presented in Figure 1. 145
146
Figure 1. Graph of mean values calculated for each cluster. Source: own elaboration. 147
130 I. Śliwińska, J. Stobiecka
The first cluster, including 140 persons, was designated ‘reserved’. This group is rather 148
reluctant to try new food products and treats them with high level of distrust. The second cluster 149
includes ‘enthusiasts’. Mean values obtained for the neutral and distrust scale were very low, 150
which indicates that respondents from that cluster were not afraid of novelties. Quite the 151
opposite; they are eager to taste new foods, which is clearly seen from the high score on the 152
enthusiasm scale. Standard deviation presented in the table indicates that answers delivered by 153
respondents assigned to the second cluster were more diversified. Means for particular variables 154
and corresponding standard deviation are shown in Table 3. 155
Table 3. 156 Mean values calculated for each cluster 157
Variable Cluster 1 ‘Reserved’
N = 140 Cluster 2 ‘Enthusiasts’
N = 100 Mean SD Mean SD
Enthusiasm 3,50 1,1208 5,58 1,2842 Neutrality 4,43 1,0759 2,29 1,5738 Reluctance 4,12 0,7683 2,09 1,3056
Source: own elaboration. 158
Subsequent stages of the analysis involved studying the relationship between belonging to 159
a homogenous group and the respondents’ demographic characteristics, such as sex (two 160
categories) and age (two categories). Men outnumbered (59%) women (41%) in the ‘reserved’ 161
cluster. There were 22% more women in the cluster ‘enthusiasts’ as compared to the first 162
cluster, while men constituted 37% of ‘enthusiasts’. The observed association is statistically 163
significant (p = 0,00066), but weak (Phi coefficient amounts to 0,2197, while contingency 164
coefficient to 0,2146). Men displayed reluctance towards innovative foods more often than 165
women. The first cluster included more respondents aged between 35 and 64 (56%). The trend 166
was opposite among enthusiasts. The majority of enthusiasts (59%) constituted young people, 167
aged between 18 and 34. The association between the assignment to a given cluster and age 168
was statistically significant, assuming α = 0,05 (p = 0,01844). However, this relationship is very 169
weak (Phi coefficient amounts to -0,1521, while contingency coefficient to 0,1504). 170
Enthusiastic attitude towards innovative food weakens with age. Assignment to clusters 171
considering age and sex is presented in Figures 2 and 3. 172
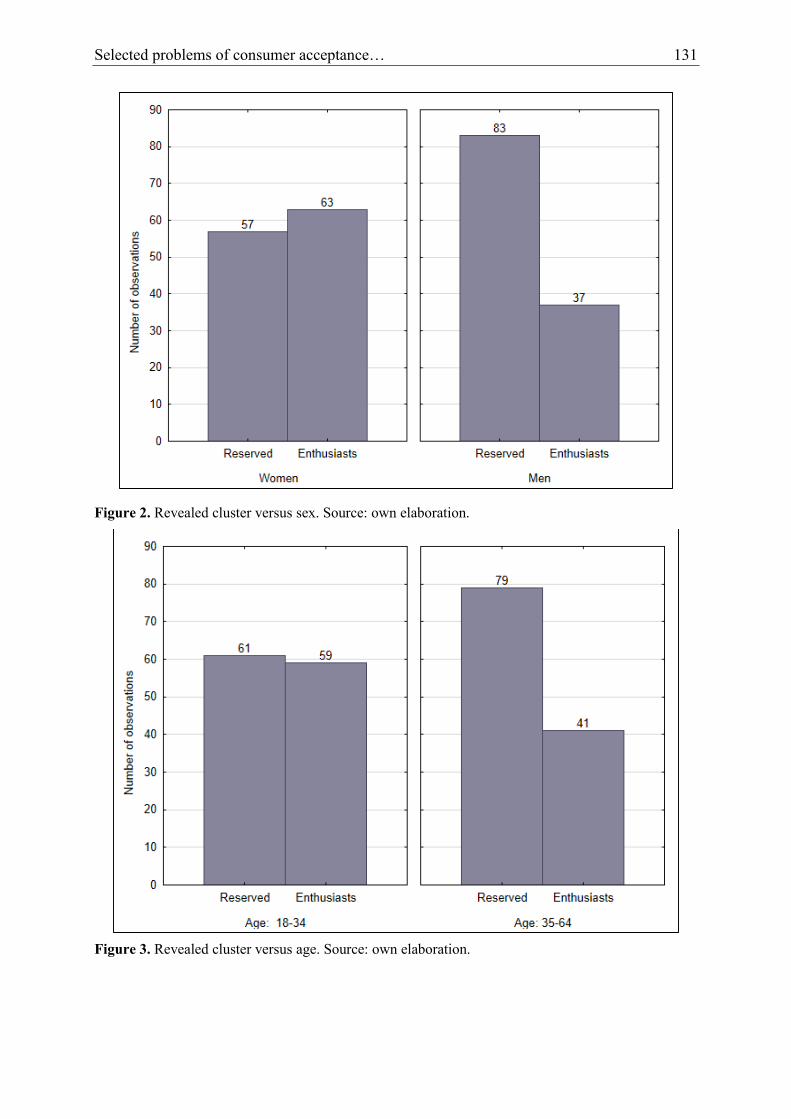
Selected problems of consumer acceptance… 131
173
Figure 2. Revealed cluster versus sex. Source: own elaboration. 174
175
Figure 3. Revealed cluster versus age. Source: own elaboration. 176
177
132 I. Śliwińska, J. Stobiecka
4.2. Acceptance of innovative food versus the speed of acceptance of innovations based 178
on Rogers’ Diffusion of Innovation 179
The questionnaire included the following closed question: ‘What is your attitude towards 180
innovations appearing on the food market?’ It was devised to assess the speed at which food 181
innovation was adopted by the consumers. The respondents were allowed to select one of five 182
statements derived from Rogers’ Diffusion of Innovation Theory: 183
I like to be the first to have it, when a new food product appears on the market; 184
I buy relatively quickly, but after some thought; 185
I buy when some friends have tried it already; 186
I buy when most of my friends have already bought it and assessed it positively; 187
I'm reluctant to buy. 188
Based on the reply determining respondents’ attitude towards innovations (in terms of the 189
speed of its adoption), they were assigned to appropriate groups. Detailed results are presented 190
in Table 4. Innovators represented the least numerous group, consisting of as few as 2% of all 191
survey participants. The next three groups (early adopters, early majority, late majority) 192
comprised a similar number of respondents, those between 62 and 65. Laggards represented 193
almost one fifth of all respondents. 194
Table 4. 195 The speed of adopting innovations in the food market based on Rogers’ Theory 196
Group name Number Cumulative number Percentage Cumulative percentage Innovators 5 5 2,08 2,08 Early Adopters 65 70 27,08 29,17 Early Majority 64 134 26,67 55,83 Late Majority 62 196 25,83 81,67 Laggards 44 240 18,33 100,00
Source: own elaboration. 197
Due to the low number of innovators in the studied sample, this group was merged with 198
early adopters to carry out subsequent analyses. Then, the association between the speed of 199
adopting innovation based on Rogers’ model and assignment to a homogenous group in 200
accordance with attitude towards innovative food was examined. 201
Table 5. 202 The speed of adopting innovations versus assignment to homogenous group 203
Group name Assignment to cluster
Total Reserved Enthusiasts
Early Adopters 23 47 70 % from the column 16,43% 47,00% Early Majority 42 22 64 % from the column 30,00% 22,00% Late Majority 39 23 62 % from the column 27,86% 23,00%
204
205
Selected problems of consumer acceptance… 133
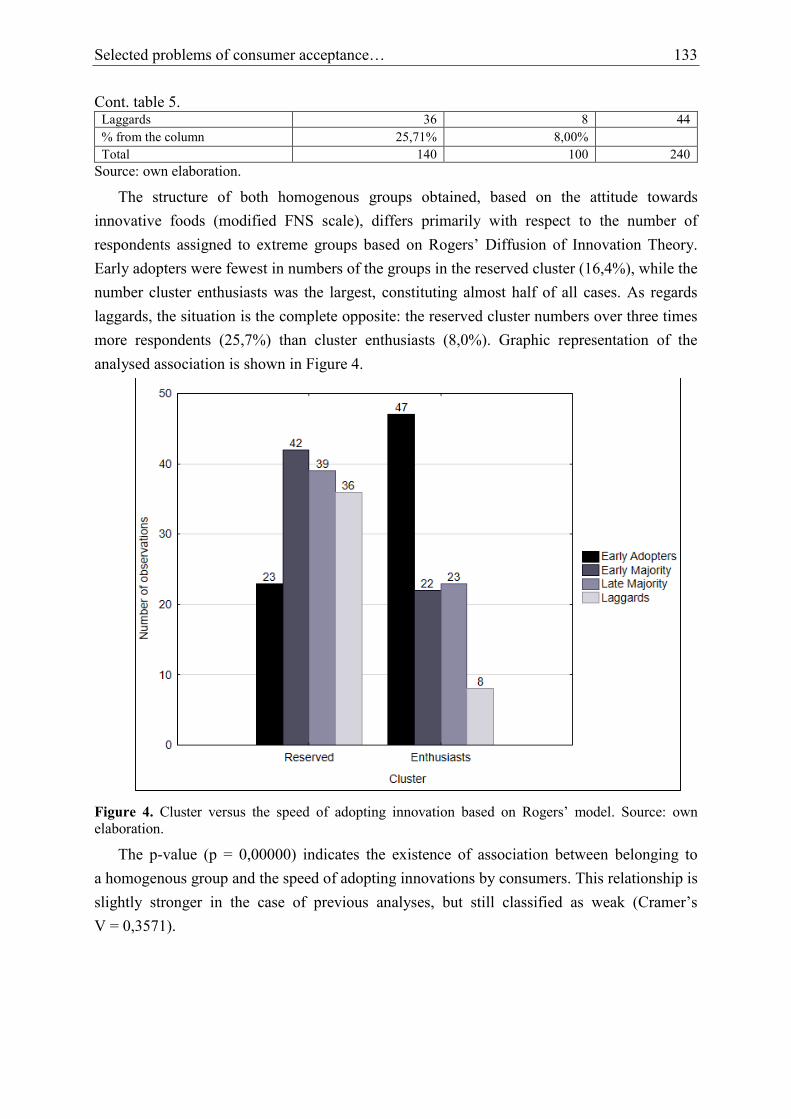
Cont. table 5. 206 Laggards 36 8 44 % from the column 25,71% 8,00% Total 140 100 240
Source: own elaboration. 207
The structure of both homogenous groups obtained, based on the attitude towards 208
innovative foods (modified FNS scale), differs primarily with respect to the number of 209
respondents assigned to extreme groups based on Rogers’ Diffusion of Innovation Theory. 210
Early adopters were fewest in numbers of the groups in the reserved cluster (16,4%), while the 211
number cluster enthusiasts was the largest, constituting almost half of all cases. As regards 212
laggards, the situation is the complete opposite: the reserved cluster numbers over three times 213
more respondents (25,7%) than cluster enthusiasts (8,0%). Graphic representation of the 214
analysed association is shown in Figure 4. 215
216
Figure 4. Cluster versus the speed of adopting innovation based on Rogers’ model. Source: own 217 elaboration. 218
The p-value (p = 0,00000) indicates the existence of association between belonging to 219
a homogenous group and the speed of adopting innovations by consumers. This relationship is 220
slightly stronger in the case of previous analyses, but still classified as weak (Cramer’s 221
V = 0,3571). 222
223
134 I. Śliwińska, J. Stobiecka
5. Conclusions 224
In the present study, we attempted to identify factors that have an impact on consumers’ 225
acceptance of innovative food products by applying two popular measuring scales: 226
Food Neophobia Scale (10-item scale; 9 items were selected for the purpose of this research) 227
and the model of diffusion of innovation (Rogers’ Diffusion of Innovation Theory; 5-point 228
scale). An initial factor analysis revealed that the first scale (FNS) can be reduced to three 229
attributes designated: enthusiasm (four internally consistent items of the FNS scale), neutrality 230
(one item in the FNS scale), and distrust (four internally consistent items). K-means cluster 231
analysis for these three new variables resulted in creating two homogenous groups displaying 232
a similar attitude towards innovative foods. The majority of respondents (58%) represented the 233
‘reserved’ cluster, as they expressed their lack of interest innovelty foods and their reluctance 234
to try them. The cluster innovative-foods ‘enthusiasts’ comprised 42% of all study participants, 235
which indicates that there is plenty of opportunity to expand this market. The research 236
demonstrates that the attitude towards new, unknown food is associated with the consumer 237
propensity generally to adopt innovations quickly (Rogers’ Diffusion of Innovations Theory). 238
As shown in this paper, women show more positive attitude towards innovative food than men, 239
and that the reluctance to novelty foods is greater in the older age group. That being the case, 240
the major difficulty involves reaching older citizens (including men). Currently, the easiest way 241
to convey convincing information is to reach Internet users, which describes almost all young 242
and middle-aged persons. Thus, in the future, launching new food products targeted at senior 243
citizens will be easier. 244
Functional food with proven health effects, constituting one of the innovative food products 245
discussed in the theoretical part of the paper, seems to be the most promising in terms of 246
developing the market. Food producers who plan to design innovative foods boosting health 247
are challenged with convincing reserved and distrustful consumers to make a purchase. 248
Moreover, functional foods should be targeted mostly at older populations and the most difficult 249
task in this respect is concerned with reaching senior consumers. As regards the scientific 250
community, it should focus on advancing methodology to enable detailed time-trend analysis 251
of this phenomenon. When it comes to FNS scale, it would be beneficial to introduce three 252
additional items into the neutral sub-scale to obtain the same number of positions for all 253
analysed variables. Additionally, more attention should be given to the psychographic 254
characteristics of the respondents and to the application of qualitative methods to understand 255
the basis of the reluctance of the older part of our society to avail themselves of scientific 256
achievements in innovative foods, especially those intended for the improvement of health. 257
258
Selected problems of consumer acceptance… 135
Acknowledgements 259
This publication was financed from the subsidy granted to Cracow University of 260
Economics. 261
References 262
1. Annunziata, A., & Vecchio, R. (2013). Consumer perception of functional foods: A conjoint 263
analysis with probiotics. Food Quality and Preference, Vol. 28, Iss.1, pp. 348-355. 264
doi:10.1016/j.foodqual.2012.10.009. 265
2. Babicz-Zielińska, E. (2006). Role of psychological factors in food choice – a review. Polish 266
Journal of Food and Nutrition Sciences, Vol. 56, Iss. 4, pp. 379-384. 267
3. Babicz-Zielińska, E., Dąbrowska, A. (2011). Zachowania konsumentów w stosunku do 268
żywności nowej generacji. Hygeia Public Health, Vol. 45, Iss. 1, pp. 39-46. 269
4. Botonaki, A., Mattas, K. (2010). Revealing the values behind convenience food 270
consumption. Appetite, Vol. 55, Iss. 3, pp. 629-638. doi: 10.1016/j.appet.2010.09.017. 271
5. Brunner, T.A., van der Horst, K., Siegrist, M. (2010). Convenience food products. Drivers 272
for consumption. Appetite, Vol. 55, Iss. 3, pp. 498-506. doi:10.1016/j.appet.2010.08.017. 273
6. Cox, D.N., & Evans, G. (2008). Construction and validation of a psychometric scale to 274
measure consumers’ fears of novel food technologies: The food technology neophobia 275
scale. Food quality and preference, Vol. 19, Iss .8, pp. 704-710. 276
7. Cronbach, L.J. (1951). Coefficient alpha and the internal structure of tests. Psychometrika, 277
Vol. 16, Iss. 3, pp. 297-334. 278
8. DeVellis R.F. (2012). Scale development: Theory and applications. Sage: Los Angeles. 279
9. Dolgopolova, I., Teuber, R., Bruschi, V. (2015), Consumers' perceptions of functional 280
foods: trust and food‐neophobia in a cross‐cultural context. International Journal of 281
Consumer Studies, Vol. 39, pp. 708-715. doi:10.1111/ijcs.12184. 282
10. Gawęcki, J. (2002). Żywność nowej generacji a racjonalne żywienie. Żywność, vol. 33(4), 283
pp. 5-15. Retrieved from: http://journal.pttz.org/wp-content/uploads/2018/01/01_ 284
Gawecki.pdf, 02.07.2020. 285
11. Kowalczuk, I., Fusiek, M., Nowocień, M. (2018). Postawy studentów wobec nowych 286
produktów i technologii w produkcji żywności. Handel Wewnętrzny, Vol. 1, pp. 75-86. 287
12. Krygier, K., Florowska, A. (2008). Żywność funkcjonalna obecnie i w przyszłości. 288
Przemysł Spożywczy, Vol. 62, Iss. 5, pp. 2-6. 289
13. Kudełka, W. (2011). Innowacyjny segment żywności wspierającej zdrowie człowieka. 290
In: M.G. Woźniak (Ed.), Nierówności społeczne a wzrost gospodarczy. Modernizacja dla 291
136 I. Śliwińska, J. Stobiecka
spójności społeczno-ekonomicznej (pp. 290-302). Wydawnictwo Uniwersytetu 292
Rzeszowskiego: Rzeszów. 293
14. Lähteenmäki, L., Grunert, K., Ueland, O., Astrom, A., Arvola, A., Bech-Larsen, T. (2002). 294
Acceptability of genetically modified cheese presented as real product alternative. Food 295
Quality and Preference, Vol. 13, Iss. 7, pp. 523-533. doi:10.1016/S0950-3293(01)00077-5. 296
15. Makała, H., Olkiewicz, M. (2004). Zasady opracowywania nowych produktów 297
z uwzględnieniem oczekiwań konsumentów, na przykładzie mięsa i jego przetworów. 298
Żywność. Nauka. Technologia. Jakość, Vol. 38, Iss. 1, pp. 120-133. 299
16. McCluskey, J.J., Kalaitzandonakes, N., Swinnen, J. (2016). Media Coverage, Public 300
Perceptions, and Consumer Behavior: Insights from New Food Technologies. Annual 301
Review of Resource Economics, Vol. 8, Iss. 1, pp. 467-486. doi: 10.1146/annurev-resource-302
100913-012630. 303
17. Mooil, E., Sarstedt, M. (2011). A Concise Guide to Market Research. The Process, Data, 304
and Methods Using IBM SPSS Statistics. Springer-Verlag: Berlin-Heidelberg. 305
18. Nunnally, J.C. (1978). Psychometric theory. McGraw-Hill: New York. 306
19. Pliner, P., Hobden, K. (1992). Development of a scale to measure the trait of food neophobia 307
in humans. Appetite, Vol. 19, Iss. 2, pp. 105-120. doi: 10.1016/0195-6663(92)90014-w. 308
20. Rogers, E.M. (1983). Diffusion of Innovations. Free Press: New York. 309
21. Royzman, E., Cusimano, C., Leeman, R. (2017). What lies beneath? Fear vs. disgust as 310
affective predictors of absolutist opposition to genetically modified food and other new 311
technologies. Judgment and Decision Making. Vol. 12, pp. 466-480. 312
22. Rzymski, P., & Królczyk, A. (2016). Attitudes toward genetically modified organisms in 313
Poland: to GMO or not to GMO? Food Security, Vol. 8, Iss. 3, pp. 689-697. 314
https://doi.org/10.1007/s12571-016-0572-z. 315
23. Si, L.W. (2020). Trending foods and beverages. Food and Society, pp. 305-321. 316
doi:10.1016/b978-0-12-811808-5.00016-7. 317
24. Tuorila, H. (2001). Keeping up with the change: Consumer responses to new and modified 318
foods. Food Chain 2001, Programme Abstract, pp. 38-40. 319
25. Tuorila, H., Hartmann, Ch. (2020). Consumer responses to novel and unfamiliar foods. 320
Current Opinion in Food Science, Vol. 33, pp. 1-8. doi: 10.1016/j.cofs.2019.09.004. 321
26. Urala, N., Lähteenmäki, L. (2004). Attitudes behind consumers’ willingness to use 322
functional foods. Food Quality and Preference, Vol. 15, Iss. 7, pp. 793-803. 323
doi:/10.1016/j.foodqual.2004.02.008. 324