Embed Size (px)
Citation preview

F O O D & B E V E R A G E
MERG E R S & A CQU I S I T I O N S A D V I S O R Y • P U B L I C O F F E R I N G S
P R I V A T E P L A C EM EN T S • F A I R N E S S O P I N I O N S
F O O D & B E V E R A G EQ2 2013 QUARTERLY NEWSLETTER
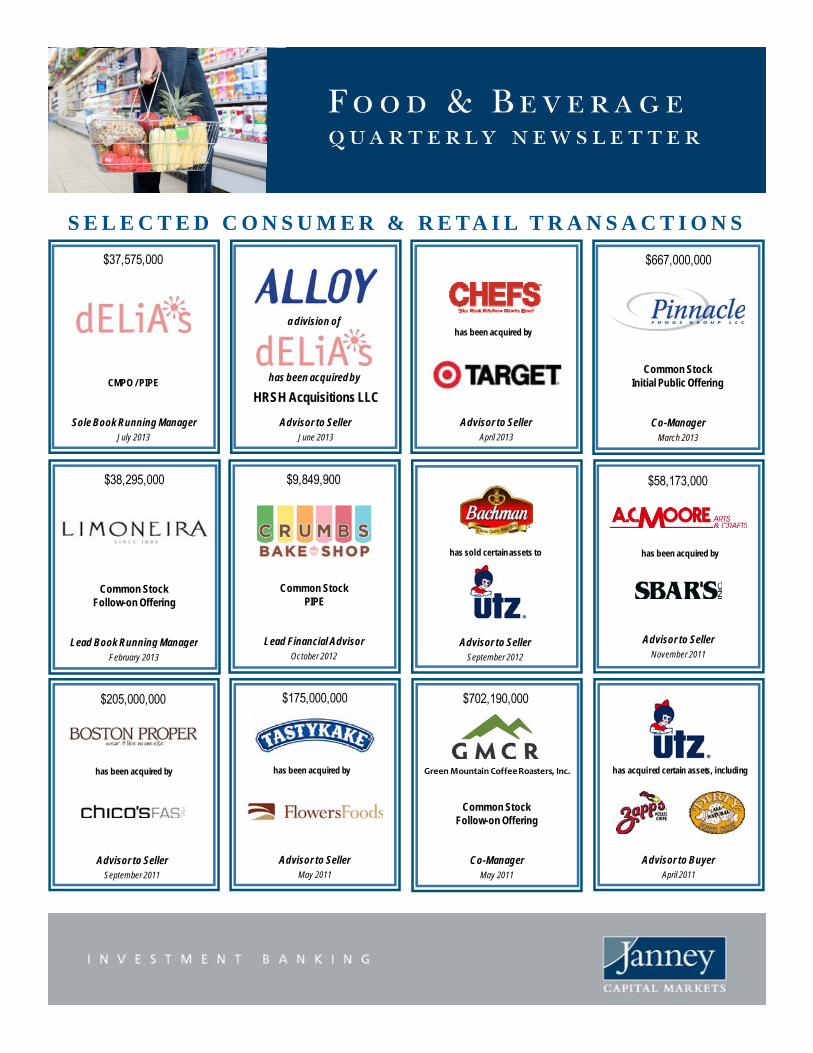
S E L E C T E D C O N S U M E R & R E TA I L T R A N S A C T I O N S
$667,000,000$37,575,000
Common StockInitial Public Offering
has been acquired by
CMPO / PIPE
a division of
has been acquired by
HRSH Acquisitions LLC
$9,849,900 $58,173,000
Co-ManagerMarch 2013
$38,295,000
Advisor to SellerApril 2013
Sole Book Running ManagerJuly 2013
Advisor to SellerJune 2013
Common StockPIPE
Lead Financial Advisor Advisor to Seller
has been acquired by
Advisor to Seller
has sold certain assets to
Common StockFollow-on Offering
Lead Book Running ManagerOctober 2012
$702,190,000 $ 165,000,000$175,000,000$205,000,000
November 2011Advisor to Seller
September 2012
Lead Book Running ManagerFebruary 2013
Common StockFollow-on Offering
Co-ManagerMay 2011
Green Mountain Coffee Roasters, Inc.
Advisor to BuyerApril 2011
has acquired certain assets, including
Advisor to SellerMay 2011
has been acquired by
Advisor to SellerSeptember 2011
has been acquired by

Q 2 2 0 1 3 : I N S I D E T H I S I S S U E
Select Headlines 1
Public Company Universe Snapshot 2
Macro Story 3
View from the Street: Q2 Earnings 4
Equity Offering Activity 7
Debt Offering Activity 8
M&A Activity 10y
Financial Sponsor Activity 12
Financial Sponsor Sector Snapshot: Fresh Baked Goods 12
Select Commodity Trends 13
Public Company Universe Details 14
This material is a publication of Janney Montgomery Scott LLC’s Investment Banking Department and for informational Purpose only and shallin no event be construed as an offer to sell or a solicitation of an offer to buy any securities. The views expressed in this publication may differfrom those expressed by other areas of the Firm including the Firm’s Research Department. To view the firm’s current research on the Consumer& Retail sector please go to www.janney.com. Janney Montgomery Scott LLC’s Investment Banking Department is independent of the Firm’sResearch Department.
The factual information described herein is taken from sources which we believe to be reliable, but the accuracy and completeness of suchinformation is not guaranteed by us. The opinions expressed herein may be given only such weight as opinions warrant. Opinions expressed aresubject to change without notice and do not take into account the particular investment objectives, financial situations or needs of individualinvestors. This Firm, its officers, directors, employees, or members of their families may have positions in the securities mentioned and maymake purchases or sales of such securities from time to time in the open market or otherwise and may sell to or buy from customers suchsecurities on a principal basis. Supporting information related to the recommendation, if any, made in this material is available upon request.
Janney Montgomery Scott LLC is a registered broker-dealer member of FINRA, NYSE, and SIPC.
B. JOHN LINDEMANManaging Director
215.665.6302jlindeman@janney com
JOHN W. DAMIANDirector
215.665.4451jdamian@janney [email protected] [email protected]
S E L E C T H E A D L I N E S
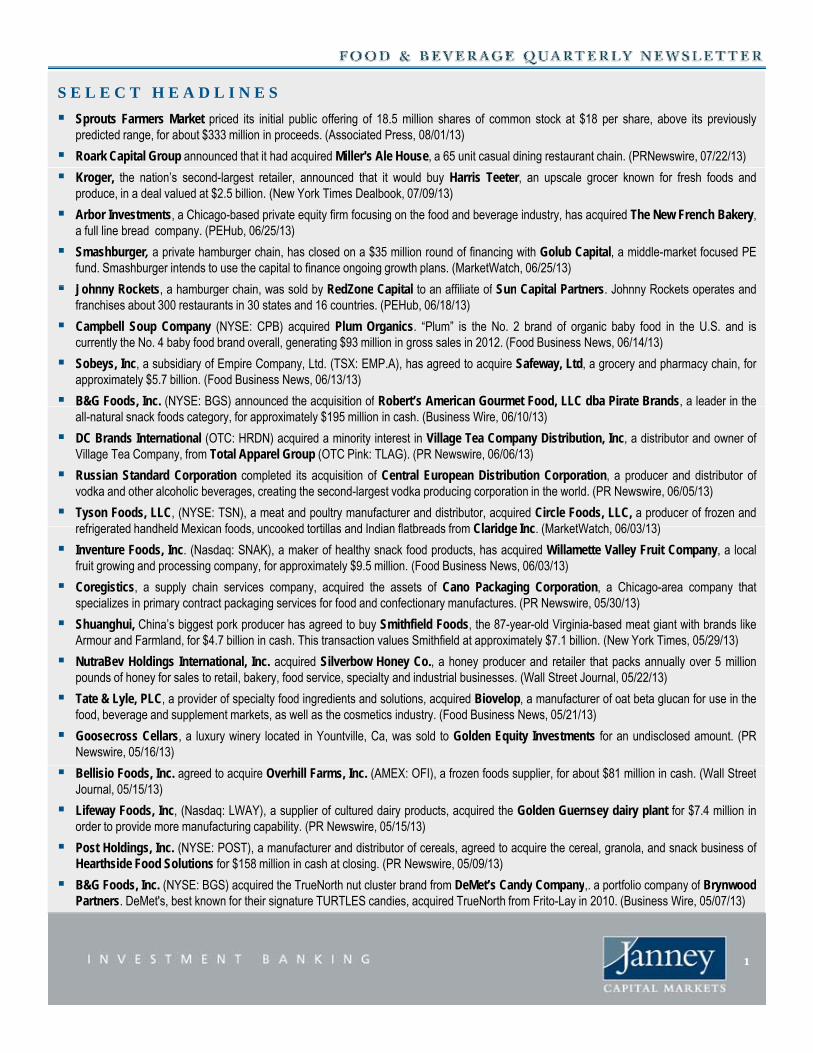
Sprouts Farmers Market priced its initial public offering of 18.5 million shares of common stock at $18 per share, above its previouslypredicted range, for about $333 million in proceeds. (Associated Press, 08/01/13)
Roark Capital Group announced that it had acquired Miller's Ale House, a 65 unit casual dining restaurant chain. (PRNewswire, 07/22/13)
Kroger, the nation’s second-largest retailer, announced that it would buy Harris Teeter, an upscale grocer known for fresh foods andproduce, in a deal valued at $2.5 billion. (New York Times Dealbook, 07/09/13)
Arbor Investments, a Chicago-based private equity firm focusing on the food and beverage industry, has acquired The New French Bakery,a full line bread company. (PEHub, 06/25/13)
Smashburger, a private hamburger chain, has closed on a $35 million round of financing with Golub Capital, a middle-market focused PEfund. Smashburger intends to use the capital to finance ongoing growth plans. (MarketWatch, 06/25/13)
Johnny Rockets a hamburger chain was sold by RedZone Capital to an affiliate of Sun Capital Partners Johnny Rockets operates and Johnny Rockets, a hamburger chain, was sold by RedZone Capital to an affiliate of Sun Capital Partners. Johnny Rockets operates andfranchises about 300 restaurants in 30 states and 16 countries. (PEHub, 06/18/13)
Campbell Soup Company (NYSE: CPB) acquired Plum Organics. “Plum” is the No. 2 brand of organic baby food in the U.S. and iscurrently the No. 4 baby food brand overall, generating $93 million in gross sales in 2012. (Food Business News, 06/14/13)
Sobeys, Inc, a subsidiary of Empire Company, Ltd. (TSX: EMP.A), has agreed to acquire Safeway, Ltd, a grocery and pharmacy chain, forapproximately $5.7 billion. (Food Business News, 06/13/13)
B&G Foods, Inc. (NYSE: BGS) announced the acquisition of Robert’s American Gourmet Food, LLC dba Pirate Brands, a leader in the, ( ) q , ,all-natural snack foods category, for approximately $195 million in cash. (Business Wire, 06/10/13)
DC Brands International (OTC: HRDN) acquired a minority interest in Village Tea Company Distribution, Inc, a distributor and owner ofVillage Tea Company, from Total Apparel Group (OTC Pink: TLAG). (PR Newswire, 06/06/13)
Russian Standard Corporation completed its acquisition of Central European Distribution Corporation, a producer and distributor ofvodka and other alcoholic beverages, creating the second-largest vodka producing corporation in the world. (PR Newswire, 06/05/13)
Tyson Foods, LLC, (NYSE: TSN), a meat and poultry manufacturer and distributor, acquired Circle Foods, LLC, a producer of frozen andrefrigerated handheld Mexican foods uncooked tortillas and Indian flatbreads from Claridge Inc (MarketWatch 06/03/13)refrigerated handheld Mexican foods, uncooked tortillas and Indian flatbreads from Claridge Inc. (MarketWatch, 06/03/13)
Inventure Foods, Inc. (Nasdaq: SNAK), a maker of healthy snack food products, has acquired Willamette Valley Fruit Company, a localfruit growing and processing company, for approximately $9.5 million. (Food Business News, 06/03/13)
Coregistics, a supply chain services company, acquired the assets of Cano Packaging Corporation, a Chicago-area company thatspecializes in primary contract packaging services for food and confectionary manufactures. (PR Newswire, 05/30/13)
Shuanghui, China’s biggest pork producer has agreed to buy Smithfield Foods, the 87-year-old Virginia-based meat giant with brands likeArmour and Farmland, for $4.7 billion in cash. This transaction values Smithfield at approximately $7.1 billion. (New York Times, 05/29/13), $ pp y $ ( , )
NutraBev Holdings International, Inc. acquired Silverbow Honey Co., a honey producer and retailer that packs annually over 5 millionpounds of honey for sales to retail, bakery, food service, specialty and industrial businesses. (Wall Street Journal, 05/22/13)
Tate & Lyle, PLC, a provider of specialty food ingredients and solutions, acquired Biovelop, a manufacturer of oat beta glucan for use in thefood, beverage and supplement markets, as well as the cosmetics industry. (Food Business News, 05/21/13)
Goosecross Cellars, a luxury winery located in Yountville, Ca, was sold to Golden Equity Investments for an undisclosed amount. (PRNewswire, 05/16/13)
Bellisio Foods, Inc. agreed to acquire Overhill Farms, Inc. (AMEX: OFI), a frozen foods supplier, for about $81 million in cash. (Wall StreetJournal, 05/15/13)
Lifeway Foods, Inc, (Nasdaq: LWAY), a supplier of cultured dairy products, acquired the Golden Guernsey dairy plant for $7.4 million inorder to provide more manufacturing capability. (PR Newswire, 05/15/13)
Post Holdings, Inc. (NYSE: POST), a manufacturer and distributor of cereals, agreed to acquire the cereal, granola, and snack business ofHearthside Food Solutions for $158 million in cash at closing. (PR Newswire, 05/09/13)
B&G Foods Inc (NYSE: BGS) acquired the TrueNorth nut cluster brand from DeMet’s Candy Company a portfolio company of Brynwood B&G Foods, Inc. (NYSE: BGS) acquired the TrueNorth nut cluster brand from DeMet s Candy Company,. a portfolio company of BrynwoodPartners. DeMet's, best known for their signature TURTLES candies, acquired TrueNorth from Frito-Lay in 2010. (Business Wire, 05/07/13)
11

S E L E C T H E A D L I N E S , continued
Bolder Brands, Inc (Nasdaq: BDBD), a supplier of gluten free and health & wellness products under the Udi’s brand, acquired DaviesBakery, one of UK’s prominent gluten-free bakery and bread manufacturer, for $3.9 million. The deal will see the manufacture and distributionof more than 15 of Udi’s products throughout the UK. (Food Business News, 05/03/13)
Hain Celestial Group (Nasdaq: HAIN), an organics products company, acquired Ella’s Kitchen Group, Ltd., a manufacturer and distributorof premium organic baby foods, to form a Global Infant Toddler & Kids Division under Hain Celestial US. (Newswire, 05/02/13)
Pearson’s Candy Company, a portfolio company of Brynwood Partners, acquired the Bit-O-Honey confectionary brand from Nestle USA, asubsidiary of Nestle S.A. (SWX: NESN). (Reuters, 05/01/13)
Anheuser-Busch InBev (Euronext: ABI, NYSE: BUD) has completed the merger of Diblo, S.A. de C.V. and Direccion de Fabricas, S.A. deC.V. with Grupo Modelo, S.A.b. de C.V. (BMV: GMODELOC) with a tender offer of $9.15 per share, a deal valued at $20.1 billion (PRNewswire 04/25/13)
Public Company Universe Snapshot (1)(2)
Newswire, 04/25/13)
Westin Foods, a packaged foods business, acquired a majority interest in Dominex Natural Foods, LLC., a packaged foods productscompany specializing in vegan and vegetarian offerings. (Food Business News, 04/16/13)
Ronnoco Coffee, a portfolio company of Huron Capital Partners LLC, announced the acquisition of International Blends. InternationalBlends is a distributor of coffee and other related products to convenience stores, restaurants, and offices. (PR Newswire, 04/10/13)
Index(as of 6/30/13)
% Change % of 52-Week
High
ValuationNet Debt /EBITDA30
Day YTD LTM EBITDA
2013EEBITDA
LTM P / E
2013E P / E
Dow Jones Industrial Average -1.4% 13.8% 95.9% 8.6x 8.1x 14.5x 13.4x -
S&P 500 Index -1.5% 12.6% 94.7% 9.8x 9.0x 15.7x 14.6x -
NASDAQ Composite Index -1.5% 12.7% 94.2% 11.7x 16.3x 21.8x 17.7x -
Russell 2000 Index 0 7% 15 1% 92 8% 11 9x 8 1x 35 5x 22 6xRussell 2000 Index -0.7% 15.1% 92.8% 11.9x 8.1x 35.5x 22.6x -
S&P 500 Food Products Index 1.1% 19.7% 95.3% 11.2x 11.0x 16.3x 17.4x -
Branded Packaged Foods 0.9% 17.8% 93.5% 11.3x 10.7x 21.2x 18.1x 2.5x
Private Label -0.6% 2.7% 83.3% 9.3x 9.2x 26.1x 20.5x 2.3x
Natural / Organic / Healthy Living 2.4% 27.7% 85.4% 18.5x 15.2x 38.4x 33.5x 2.8x
Snack Foods / Baked Goods 3.8% 19.1% 91.6% 11.6x 10.7x 26.7x 24.4x 3.0x
Confectionary 0.6% 16.5% 94.1% 16.2x 13.9x 29.4x 26.0x 1.0x
Dairy -2.9% 23.2% 85.5% 12.4x 12.9x 26.3x 21.7x 1.5x
Coffee -1.1% 25.2% 87.0% 13.1x 14.1x 29.5x 28.6x 0.4x
Non-Alcoholic Beverages 2.1% 22.1% 87.8% 12.2x 12.0x 26.2x 19.4x 3.1x
Alcoholic Beverages -1.7% 17.2% 88.9% 15.4x 12.3x 26.5x 27.0x 2.8x
Weight Management / Other 4.2% 16.7% 83.2% 9.2x 8.4x 25.3x 18.2x 2.3x
Proteins -0.4% 37.4% 92.4% 8.2x 5.9x 19.1x 11.8x 1.9x
Produce 5 8% 10 3% 90 6% 10 1x 12 9x 16 6x 21 8x 7 5xProduce 5.8% 10.3% 90.6% 10.1x 12.9x 16.6x 21.8x 7.5x
Ingredients -1.5% 15.9% 88.3% 12.7x 11.6x 24.9x 17.0x 2.2x
Agribusiness -4.4% 7.6% 86.7% 8.5x 10.0x 17.8x 18.7x 3.0x
Food Retail 2.7% 39.0% 90.3% 10.8x 9.9x 20.3x 26.4x 1.8x
Food Service / Distribution 0.6% 11.0% 90.8% 10.2x 9.1x 18.7x 17.3x 2.0x
Restaurant - Quick Service 3.7% 27.6% 90.6% 13.4x 11.5x 27.8x 26.0x 2.6x
Restaurant - Fast Casual 0.7% 30.2% 83.2% 17.3x 15.2x 35.3x 30.4x 4.2x
Restaurant - Casual Dining 4.7% 33.4% 92.7% 10.0x 10.0x 30.2x 24.8x 1.5x
2
Bolded numbers denote highs and lows in each column; composite data calculated as simple means (excluding DJIA, S&P, Nasdaq, Russell, S&P Food); refer to the comparable sets attached for information about companies within each index
2

M A C R O S T O R Y
The Conference Board Consumer Confidence Index®, which had improved in June, pulled back slightly in July. The Index now stands at 80.3,up from 74.3 in May and 68.1 in January. Consumers’ assessment of current conditions continues to gain ground and expectations remain inexpansionary territory despite the July retreat. Overall, indications are that the economy is strengthening and may even gain some momentumin the months ahead.
The U.S. Department of Labor reported that the unemployment rate remained unchanged at 7.6 percent in June as the 195,000 increase intotal nonfarm payrolls was offset by increased labor force participation. Employment continued to trend up over the month in food servicesand drinking places and in wholesale trade.
The combined percentage of loans in foreclosure or at least one payment past due was 10.3 percent on a non-seasonally adjusted basis, a 95basis point decrease from last quarter and a 103 basis point decrease from the same quarter one year ago.
Personal saving was $387 6 billion in May compared with $359 2 billion in April The personal savings rate which refers to personal saving
12%
Unemployment Rate (4)
Personal saving was $387.6 billion in May, compared with $359.2 billion in April. The personal savings rate, which refers to personal savingas a percentage of disposable personal income, was 3.2 percent in May, compared with 3.0 percent in April.
Enrollment in the Supplemental Nutrition Assistance Program (SNAP) declined in April, falling to 47.6 participants. Improvement in the jobmarket, particularly the low wage sector, has led to a decrease in the number of people dependent on the SNAP program.
Consumer Confidence (3)
SourceRelease
DateActual
% Chg MoM
% Chg YoY
Estimate SourceRelease
DateActual
% Chg MoM
% Chg YoY
80
100
120
140
160
5%
6%
7%
8%
9%
10%
11%Conference Board 7/30/2013 80.3 -1.4% 22.8% 81.3
Reuters / U. of Michigan
6/28/2013 84.1 -0.5% 14.9% 81.0
US Dept. of Labor 7/5/2013 7.6 -0.0% -7.3%
0
20
40
60
1989 1991 1993 1995 1997 1999 2001 2003 2005 2007 2009 2011 20130%
1%
2%
3%
4%
1989 1991 1993 1995 1997 1999 2001 2003 2005 2007 2009 2011 2013
Credit Card Delinquency & Personal Saving (6)(7)Mortgage Delinquencies & Foreclosures (5)
12%
15%
7%
8%
9%
Credit Card Delinquency
Personal Savings
Credit Card Delinquency & Personal Saving (6)(7)Mortgage Delinquencies & Foreclosures (5)
SourceRelease
DateActual
% Chg QoQ
% Chg YoY
Federal Reserve 5/19/13 2.65% -2.6% -13.7%
US Dept. of Commerce 6/27/13 3.2% 23.1% -17.9%
SourceRelease
DateActual
% Chg QoQ
% ChgYoY
Foreclosure – Mortgage Bankers Association 5/9/13 3.6% -5.1% -19.1%
Delinquent – Mortgage Bankers Association 5/9/13 6.8% -4.8% -8.8%
0%
3%
6%
9%
0%
1%
2%
3%
4%
5%
6%
0%1989 1991 1993 1995 1997 1999 2001 2003 2005 2007 2009 2011
0%1991 1992 1994 1995 1997 1998 2000 2001 2003 2004 2006 2007 2009 2010 2012
3

V I E W F R O M T H E S T R E E T : Q 3 E A R N I N G S (8)
NameExp.Ann. Date
Janney /Street
EPS %Beat
(Miss) Est.
Janney YoY EPS
Growth
Street Expects… Janney Thinks…
General Mills Jun- 26 $0.53(Actual)
0.0%(Actual)
(11.5%)(Actual)
Positive Q4 preannouncement suggests confidence in the FY14 outlook, underpinned by an improving U.S. consumer, solid innovation, productivity, and modest inflation.
Looking to 2014, both volumes and ad spend remain below peak 2010 levels while market share has softened (cereal, yogurt), suggesting the potential need for greater investment.
ConAgra Jun-27 $0.60(Actual)
1.7%(Actual)
17.6%(Actual)
Discount valuation is warranted due to subpar category exposure and a growing private label mix, with challenges in both areas.
Moderating input costs and sequentially improving volumes could drive EPS upside in the quarters ahead; CAG's projections for Ralcorp (~$400M in pre-synergy EBIT) could prove conservative.
McCormick Jun-27 $0.59 (1.7%) (6.7%) McCormick's strong competitive moat generates significant We are more cautious on volumes, as we believe the relative (Actual) (Actual) (Actual) pricing power sufficient to support input cost volatility; volume
softness temporary and should rebound in 2H13.softness in N.A. and Europe is equally attributable to lasting challenges endemic to the center-store (low-end consumer malaise, channel shift).
Dole Food Co.
Jul-16 $0.28(Actual)
250.0%(Actual)
(53.3%)(Actual)
Stock likely to trade on deal speculation; fundamental outlook not likely to improve anytime soon on headwinds in bananas and strawberries.
Tough NT outlook (bananas, strawberries) is likely cyclical and looks well below mid-cycle earnings power; Murdock's offer likely to proceed at or around this price level.
Annie's Jul-22 $0.29(Actual)
3.6%(Actual)
20.8%(Actual)
Momentum behind the pizza rollout and the potential success of mac and cheese microcups and future product launches h th t ti l t l t t li th f it t
Nearer term, we think the staging of investment behind new products, especially frozen pizza in light of the recent recall,
lik l t i d i i th t has the potential to accelerate top line growth from its current trajectory.
are likely to pressure margins and earnings in the quarters ahead.
PepsiCo Jul-24 $1.31(Actual)
11.0%(Actual)
17.0%(Actual)
With numbers reset, visible path to earnings upside on improved developed market execution and solid international growth.
Frito Lay remains solid; maintained investments in sizable global growth platforms provide decent visibility while company works to stabilize domestic CSDs.
Hershey Jul-25 $0.72(Actual)
0.0%(Actual)
9.1%(Actual)
Shorter Easter and timing of int'l investments could weigh on Q2; top and bottom line momentum could slow due to stiffer competition and catch-up emg mkt investments.
Likelihood of greater than expected cost relief and improving volume growth support potential NT EPS upside; long tail from accelerating expense investments continues to drive LT growthgrowth.
J&J Snack Foods
Jul-31 $1.12(Actual)
0.0%(Actual)
13.1%(Actual)
Organic growth should show some deceleration on macro pressures; higher wheat prices will begin to pressure margins in 2H13.
J&J moved to firm pricing in Q2 ahead of anticipated cost inflation in the back half of the year, a change in course from its historical practice of being reactive to input volatility -which should preserve margins.
Fresh DelMonteProduce
Jul-31 $1.02(Actual)
21.4%(Actual)
1.0%(Actual)
Weak banana fundamentals likely to persist in Q2, while industrial business faces tough comps.
Pristine BS makes share repo likely and limits downside through this NT downcycle in bananas.
K ll A 01 $1 00 0 0% 12 4% 2013 id l k ti d t t Whil i k t th t li FY13 b l k l l Kellogg Aug-01 $1.00 (Actual)
0.0%(Actual)
12.4% (Actual)
2013 guidance looks conservative; modest costs, accelerating innovation, and Pringles momentum offer clear path for EPS upside.
While we see risk to the top line, FY13 numbers look largely achievable due to sustained brand support and improvinginnovation.
Senomyx Aug-01 ($0.06) (Actual)
14.3% (Actual)
25.0% (Actual)
The company continues to make progress towards a sustainable business model with pipeline development and commercial sales growth.
We believe the value of Senomyx lies in the medium-term succession of commercialization opportunities to turn cash flow positive while becoming much less dependent on funded R&D as a source of revenue.
I t A 01 $0 07 (22 2%) (12 5%) Investment and slotting behind new growth vehicles (i e While choppiness is likely for a growth business such as InventureFoods
Aug-01 $0.07 (Actual)
(22.2%) (Actual)
(12.5%) (Actual)
Investment and slotting behind new growth vehicles (i.e. Seattle's Best) should stunt near-term earnings growth, while the core snack biz will be pressured by category innovation.
While choppiness is likely for a growth business such as Inventure, distribution gains and licensing deals should drive well above-average sales growth, while improved utilization boosts gross margins from their relatively low level.
Kraft Foods Aug-01 $0.76(Actual)
5.6% (Actual)
(12.6%) (Actual)
Strong productivity and new product momentum suggest high visibility to EPS, but sole exposure to U.S. market limits upside.
With Q1, mgmt is off to a good start, having delivered strong FCF, volume, and ad spend, which together suggest improving visibility to FY13 FCF guidance (at least $1B).
Mondelēz Aug-07 $0.33 /$0.33
(6.8%) (8.0%) Sales and margins likely to remain weak in Q2 but should accelerate in 2H13 and beyond due to increased investments
Sales growth and margins likely to remain depressed in Q2; anticipated 2H13 acceleration on easier comps and emg mkt
ffin emerging markets and productivity in developed markets. investments could be offset by prolonged weakness in gum, which worsened in Q1.
4

V I E W F R O M T H E S T R E E T : Q 3 E A R N I N G S , continued (8)
NameExp.Ann. Date
Janney /Street
EPS %Beat
(Miss) Est.
Janney YoY EPS
Growth
Street Expects… Janney Thinks…
GreenMountainCoffeeRoasters
Aug-07 $0.78 /$0.72
2.5% 49.3% Near-term outlook solid given continued strong takeaway for brewers and K-Cups and easing headwinds (green coffee prices, capacity utilization); Starbucks re-up removes key intermediate risk; channel, line, and international expansion suggest meaningful long-term opportunity.
We anticipate sustained top line momentum and near-term margin improvement, though quality Green Mountain-produced K-Cups at the low end of the pricing scale (i.e. Kirkland) has potential implications for the retail price/mix and profit efficiency.
Dean Foods Aug-07 $0.15 /$0.16
8.5% (58.0%) While Dean is likely to benefit from productivity improvements, anticipated milk volume declines resulting from a key contract loss and general category weakness, will drive operational deleveraging above those benefits.
While we expect 2Q13 operating margin per gallon to rise modestly in the face of a potentially significant volume decline (-7%), we believe that both mixshift and plant-level cost savings will help offset production inefficiencies.
Snyder's-Lance
Aug-08 $0.29 /$0.28
5.5% 35.6% Looking for top line trends to stabilize as focus narrows to core brands; 10% EBIT margin in 2-3 years on improved scale efficiency, portfolio optimization.
While the long-suffering non-branded sgmt appears to be closer to right-sized, with improved profitability, and core four brands are gaining market share, a ramp in mktingspend to support those and catch up invmt in Pretzel Crisps in subsequent Q at least temporarily stunt margin growth.
Chiquita Aug-08 $0.52 /$0.41
25.8% 91.6% Weak banana fundamentals unlikely to turn around anytime soon; euro volatility, financial leverage make for lowvisibility.
Soft NT banana outlook remains a drag on 2013 but should be offset by good progress on restructuring initiatives and new product wins; suggests improved visibility to midcycleconditions.
TreeHouse Aug-08 $0.61 /$0.63
(2.7%) 3.0% Industry headwinds appear to be abating, but visibility remains choppy from one quarter to the next; talk on M&A yet to materialize.
Gross margin upside should continue on moderating input costs and improving consumption trends; expect fundamentals and deals to pick up in the year ahead on moderating costs and normal margins.
FlowersFoods
Aug-13 $0.37 /$0.35
3.9% 69.3% Upside to current forecasts on anticipated top line andmargin accretion while Hostess dark; longer-term, theacquisition of select Hostess assets and brands will likely improve the industry's profit pool significantly.
The recent step-function improvement from the Hostess liquidation makes for a strong near-term outlook, but bread is historically a low return business and remained so during a pre-Hostess period of dramatic consolidation.
Pinnacle Aug 14 $0 28 / 86 7% 60 3% High probability of upside to FY guidance driven by Should see improved margin flexibility throughout the year Pinnacle Foods
Aug-14 $0.28 / $0.15
86.7% 60.3% High probability of upside to FY guidance driven by favorable mix and tepid cost inflation.
Should see improved margin flexibility throughout the year on modest cost inflation, leading share positions, and mix-positive innovations.
J.M. Smucker
Aug-16 $1.20 /$1.20
0.0% 2.2% Deceleration in K-Cups, both in volume and pricing as increased competition at the low end enters the fray in ever-increasing numbers, brings into question the outlook for Smucker's fastest growth segment.
We view concerns over lower pricing and Kcup deceleration as overblown–especially given that we believe its a 25% margin business driving upwards of $75M in FCF during thisperiod of green coffee cost deflation, which in part drives oursuspicion that guidance for FY14 FCF of $600M appearsconservative.
H i $0 62 / % % R f i U S t li th i t C t i i d it tili ti d t HainCelestial
Aug-21 $0.62 /$0.62
0.0% 31.3% Runway for organic U.S. top line growth remains strong. There is meaningful scale leverage available in Europe on the heels of recent deals (Daniels Group, Premier).
Customer wins, improved capacity utilization, and apparent cost and mfg synergies, figures to drive LDD margins in the UK over the next 18 months, which is largely built into our model, and combined with the limited potential for accretive N-T acquisitions, implies minimal upside.
Hormel Aug-22 $0.42 /$0.47
(11.9%) 0.9% Negative preannouncement offers buying opportunity; likely to regain EPS momentum on better results in pork, strong portfolio, and solid balance sheet.
The quickness of the neg. preannouncement after Q2 update implies low NT visibility; prolonged headwinds in pork and mean reversion in turkey margins should continue to pressure earnings in the quarters ahead.
Campbell Aug-30 $0.40 /$0.42
(5.5%) (3.0%) EPS momentum likely to slow on tough weather comps and continued pressures in beverages and foodservice.
Despite solid new product innovations and a strong soup season, we think ad spend will eventually need to increase, especially as CPB consciously diversifies away from its dominant soup business.
CalavoGrowers
Sep-05 $0.39 /$0.40
(3.0%) 0.7% Lumpy investment in avocado market share likely to be only a NT impact; LT growth outlook remains solid on favorable avocado industry trends and momentum in RFG.
Top line outlook remains stellar but aggressive discounting to grow share of Mexican imports has pressured per box profits; since this is a new direction for the company, we will wait and see if profitability can return to historical levels.
Limoneira Sep-05 $0.47 / 7.4% 7.1% Encouraging NT outlook for development of East Area I & II; Good momentum in Agribusiness ops (lemons, avocados),
5
o e a Sep 05 $0 /$0.44
7.4% cou ag g out oo o de e op e t o ast ea & ;FY guidance for volume growth in lemons (+25%) and avocados (+50%) looks conservative.
Good o e tu g bus ess ops ( e o s, a ocados),but that's a tertiary consideration to the outlook for dev. of East Area I & II, which appears to be accelerating.
V I E W F R O M T H E S T R E E T : Q 3 E A R N I N G S , continued (8)
NameExp.Ann. Date
Janney /Street
EPS %Beat
(Miss) Est.
Janney YoY EPS
Growth
Janney Thinks…
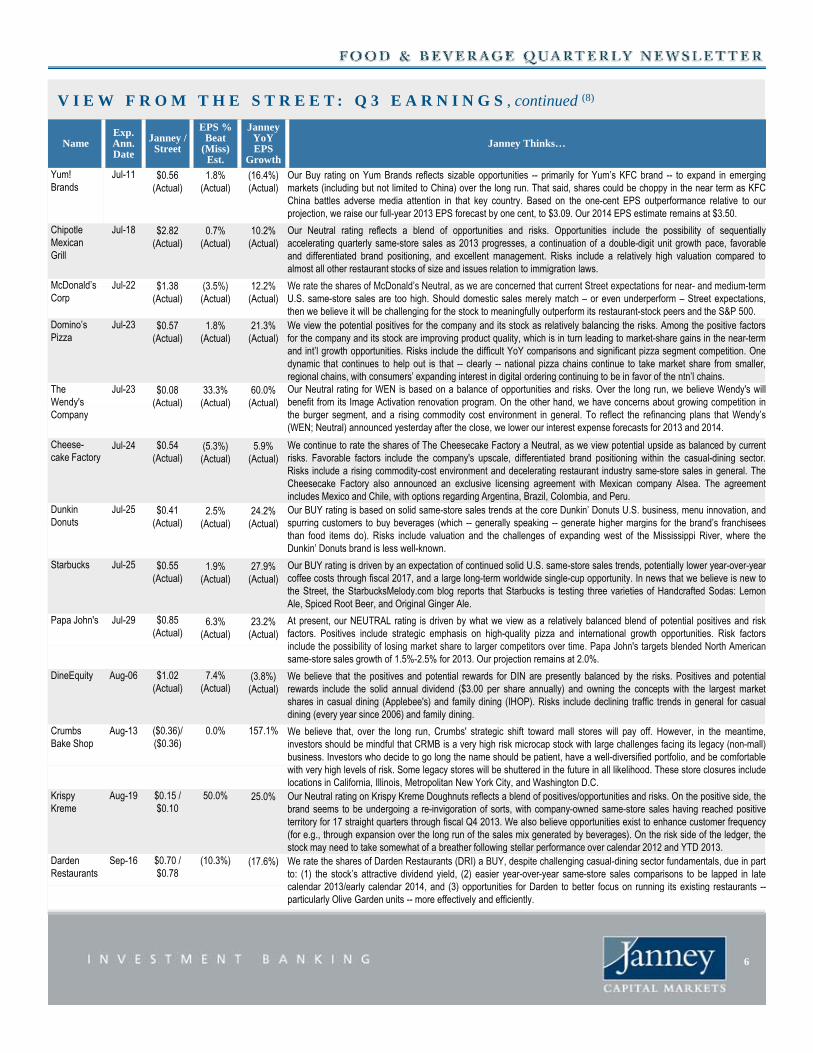
Yum! Brands
Jul-11 $0.56 (Actual)
1.8%(Actual)
(16.4%)(Actual)
Our Buy rating on Yum Brands reflects sizable opportunities -- primarily for Yum’s KFC brand -- to expand in emergingmarkets (including but not limited to China) over the long run. That said, shares could be choppy in the near term as KFCChina battles adverse media attention in that key country. Based on the one-cent EPS outperformance relative to ourprojection, we raise our full-year 2013 EPS forecast by one cent, to $3.09. Our 2014 EPS estimate remains at $3.50.
Chipotle Mexican Grill
Jul-18 $2.82 (Actual)
0.7% (Actual)
10.2% (Actual)
Our Neutral rating reflects a blend of opportunities and risks. Opportunities include the possibility of sequentiallyaccelerating quarterly same-store sales as 2013 progresses, a continuation of a double-digit unit growth pace, favorableand differentiated brand positioning, and excellent management. Risks include a relatively high valuation compared toalmost all other restaurant stocks of size and issues relation to immigration laws.
McDonald’s Jul-22 $1 38 (3 5%) 12 2% We rate the shares of McDonald’s Neutral as we are concerned that current Street expectations for near- and medium-termMcDonald s Corp
Jul 22 $1.38 (Actual)
(3.5%)(Actual)
12.2% (Actual)
We rate the shares of McDonald s Neutral, as we are concerned that current Street expectations for near- and medium-termU.S. same-store sales are too high. Should domestic sales merely match – or even underperform – Street expectations,then we believe it will be challenging for the stock to meaningfully outperform its restaurant-stock peers and the S&P 500.
Domino’s Pizza
Jul-23 $0.57 (Actual)
1.8% (Actual)
21.3% (Actual)
We view the potential positives for the company and its stock as relatively balancing the risks. Among the positive factorsfor the company and its stock are improving product quality, which is in turn leading to market-share gains in the near-termand int’l growth opportunities. Risks include the difficult YoY comparisons and significant pizza segment competition. Onedynamic that continues to help out is that -- clearly -- national pizza chains continue to take market share from smaller,regional chains, with consumers’ expanding interest in digital ordering continuing to be in favor of the ntn’l chains.
The Wendy's
Jul-23 $0.08 (Actual)
33.3%(Actual)
60.0%(Actual)
Our Neutral rating for WEN is based on a balance of opportunities and risks. Over the long run, we believe Wendy's willbenefit from its Image Activation renovation program. On the other hand, we have concerns about growing competition iny
Company ( ) ( ) ( ) g p g , g g p
the burger segment, and a rising commodity cost environment in general. To reflect the refinancing plans that Wendy’s(WEN; Neutral) announced yesterday after the close, we lower our interest expense forecasts for 2013 and 2014.
Cheese-cake Factory
Jul-24 $0.54(Actual)
(5.3%)(Actual)
5.9%(Actual)
We continue to rate the shares of The Cheesecake Factory a Neutral, as we view potential upside as balanced by currentrisks. Favorable factors include the company's upscale, differentiated brand positioning within the casual-dining sector.Risks include a rising commodity-cost environment and decelerating restaurant industry same-store sales in general. TheCheesecake Factory also announced an exclusive licensing agreement with Mexican company Alsea. The agreementincludes Mexico and Chile, with options regarding Argentina, Brazil, Colombia, and Peru.
Dunkin Donuts
Jul-25 $0.41(Actual)
2.5%(Actual)
24.2%(Actual)
Our BUY rating is based on solid same-store sales trends at the core Dunkin’ Donuts U.S. business, menu innovation, andspurring customers to buy beverages (which -- generally speaking -- generate higher margins for the brand’s franchisees(Actual) (Actual) (Actual) spu g custo e s to buy be e ages ( c ge e a y spea g ge e ate g e a g s o t e b a d s a c seesthan food items do). Risks include valuation and the challenges of expanding west of the Mississippi River, where theDunkin’ Donuts brand is less well-known.
Starbucks Jul-25 $0.55(Actual)
1.9%(Actual)
27.9%(Actual)
Our BUY rating is driven by an expectation of continued solid U.S. same-store sales trends, potentially lower year-over-yearcoffee costs through fiscal 2017, and a large long-term worldwide single-cup opportunity. In news that we believe is new tothe Street, the StarbucksMelody.com blog reports that Starbucks is testing three varieties of Handcrafted Sodas: LemonAle, Spiced Root Beer, and Original Ginger Ale.
Papa John's Jul-29 $0.85(Actual)
6.3%(Actual)
23.2%(Actual)
At present, our NEUTRAL rating is driven by what we view as a relatively balanced blend of potential positives and riskfactors. Positives include strategic emphasis on high-quality pizza and international growth opportunities. Risk factorsinclude the possibility of losing market share to larger competitors over time Papa John's targets blended North Americaninclude the possibility of losing market share to larger competitors over time. Papa John s targets blended North Americansame-store sales growth of 1.5%-2.5% for 2013. Our projection remains at 2.0%.
DineEquity Aug-06 $1.02 (Actual)
7.4% (Actual)
(3.8%) (Actual)
We believe that the positives and potential rewards for DIN are presently balanced by the risks. Positives and potentialrewards include the solid annual dividend ($3.00 per share annually) and owning the concepts with the largest marketshares in casual dining (Applebee's) and family dining (IHOP). Risks include declining traffic trends in general for casualdining (every year since 2006) and family dining.
Crumbs Bake Shop
Aug-13 ($0.36)/ ($0.36)
0.0% 157.1% We believe that, over the long run, Crumbs' strategic shift toward mall stores will pay off. However, in the meantime,investors should be mindful that CRMB is a very high risk microcap stock with large challenges facing its legacy (non-mall)business. Investors who decide to go long the name should be patient, have a well-diversified portfolio, and be comfortable
i h hi h l l f i k S l ill b h d i h f i ll lik lih d Th l i l dwith very high levels of risk. Some legacy stores will be shuttered in the future in all likelihood. These store closures includelocations in California, Illinois, Metropolitan New York City, and Washington D.C.
KrispyKreme
Aug-19 $0.15 / $0.10
50.0% 25.0% Our Neutral rating on Krispy Kreme Doughnuts reflects a blend of positives/opportunities and risks. On the positive side, thebrand seems to be undergoing a re-invigoration of sorts, with company-owned same-store sales having reached positiveterritory for 17 straight quarters through fiscal Q4 2013. We also believe opportunities exist to enhance customer frequency(for e.g., through expansion over the long run of the sales mix generated by beverages). On the risk side of the ledger, thestock may need to take somewhat of a breather following stellar performance over calendar 2012 and YTD 2013.
Darden Restaurants
Sep-16 $0.70 / $0.78
(10.3%) (17.6%) We rate the shares of Darden Restaurants (DRI) a BUY, despite challenging casual-dining sector fundamentals, due in partto: (1) the stock’s attractive dividend yield, (2) easier year-over-year same-store sales comparisons to be lapped in latecalendar 2013/early calendar 2014 and (3) opportunities for Darden to better focus on running its existing restaurantscalendar 2013/early calendar 2014, and (3) opportunities for Darden to better focus on running its existing restaurants --particularly Olive Garden units -- more effectively and efficiently.
6

$10,00060IPO
Annual Equity Offering Activity (9)Quarterly Equity Offering Activity (9)
While Q1 2013 was the most active quarter for equityofferings since 2009, Q2 2013 offering activity fell…
… however, post deal performances have generallybeen strong (Noodles IPO up 104%).
8
10
12
14
16
r of O
fferin
gs
IPO
FO
CVT
Series4
32
11
2
1
$
$5,000
$6,000
$7,000
$8,000
$9,000
30
40
50
Deal Value ($ be
r of O
fferin
gs
IPOFOCVTAgg Deal Value
5
32
4
1
1
1
2
13
8
5
1
3
12
4
12
1 12
3
6
1
1
1
14
1
2 21
4 2
1
1
0
2
4
6
Num
ber
3 2 2 2
18 20
63
9 712
11
23
10 9 7 72
6 86
63 9
2
$0
$1,000
$2,000
$3,000
$4,000
0
10
20
2003 2005 2007 2009 2011 2013 YTD
MM
)
Num
b
YTD
Select Recent Equity Offering Activity (9)
PricingDate Issuer Business Description Deal Sub Type Amt
($MM)% Ch. 1-day
% Ch. 1-month
06/27/13 Noodles & Co. Fast casual restaurants IPO – Common Shares $96.4 104.2% N/A
05/22/13 Bloomin Brands Casual dining restaurants FO – Common Shares $408.5 2.9% 16.4%
03/27/13 Pinnacle Foods Inc. Manufactures branded food products IPO – Common Shares $667.0 11.1% 18.0% 03/ / 3 ac e oods c a u actu es b a ded ood p oducts O Co o S a es $66 0 % 18.0%
03/21/13 Fiesta Restaurant Group, Inc. Casual dining restaurants FO – Common Shares $70.3 7.1% 0.9%
03/12/13 Annie’s, Inc. Natural food products FO – Common Shares $140.0 0.1% -5.9%
03/07/13 Del Frisco’s Restaurant Group, Inc. Full-service restaurants FO – Common Shares $80.8 0.0% -4.5%
02/13/13 Limoneira Company Agribusiness FO – Common Shares $38.3 0.5% 0.5%
01/24/13 Chuy’s Holdings, Inc. Casual dining restaurants FO – Common Shares $129.4 13.1% 11.9%
01/07/13 ConAgra Foods, Inc. Packaged food FO – Common Shares $275.0 1.3% 11.9%g g
12/04/12 Carrols Restaurant Group Quick-service and quick-casual restaurants FO – Common Shares $23.7 7.2% 6.6%
10/25/12 The WhiteWave Foods Co. Consumer food and beverage IPO – Common Shares $391.0 -1.5% -1.5%
10/09/12 Amira Nature Foods Ltd. Packaged specialty rice and snacks IPO – Common Shares $90.0 -18.3% -4.2%
10/02/12 B&G Foods, Inc. Packaged food and meats FO – Common Shares $126.2 -3.1% 0.1%
08/09/12 Dunkin’ Brands Group, Inc. Serves coffee, baked goods FO – Common Shares $661.3 -0.3% -2.7%
08/07/12 Bloomin Brands Casual dining restaurants IPO – Common Shares $202.3 12.8% 31.3%
07/31/12 Annie's Natural food products FO – Common Shares $143.3 1.6% 5.9%
07/26/12 Del Frisco's Steakhouse restaurants IPO – Common Shares $75.4 0.0% -2.1%
07/24/12 Natural Grocers Natural grocery store IPO – Common Shares $107.1 19.1% 30.5%
07/23/12 Chuy's Holdings Casual dining restaurants IPO – Common Shares $87.2 15.9% 38.8%
06/12/12 The Fresh Market Gourmet supermarket FO – Common Shares $506.7 0.0% 9.8%
05/10/12 Ignite Restaurant Group Casual dining restaurants IPO – Common Shares $92.9 22.4% 28.9%
03/30/12 Dunkin’ Brands Group, Inc. Serves coffee, baked goods FO – Common Shares $895.6 2.0% 10.3%All data shown above for Food, Beverage & Restaurant industry only, most recent transactions to 6/30/13
7

35
40
45
50
60
70
80
90
s V
Number of Loans
Volume of Loans ($ in MM)
20
25
35
40
45
s
Number of Bonds
$ of Bonds
Quarterly Bond Volume (2) Quarterly Loan Volume (2)
0
5
10
15
20
25
30
35
0
10
20
30
40
50
60
Num
ber o
f Loa
ns
Volumes ($ BN
)
0
5
10
15
0
5
10
15
20
25
30
Volumes ($ BN
)
Num
ber o
f Bon
ds
Interest Rate Forecasts (%) (2) Credit Spreads (2)
Security 6/30/13Forecast
3Q13
4Q13
1Q14
2Q14
1200 bps
1400 bps
1600 bpsAaa
Aa
A
BaaFed Funds Target 0.25 0.25 0.25 0.25 0.25
3-Month LIBOR 0.27 0.30 0.31 0.33 0.36
2-Year T-Note 0.36 0.37 0.45 0.54 0.65
10-Year T-Note 2.52 2.50 2.62 2.78 2.90
30-Year T-Note 3.52 3.58 3.67 3.81 3.93
+386bps
+221bps+132 bps200 bps
400 bps
600 bps
800 bps
1000 bps
1200 bps Baa
Ba/B
Sign. Date
Borrower Description Type Size
($ MM)Maturity Rating Use of Proceeds
06/28/13 CTI Foods Holding Co LLC Food & Beverage TERM 140.0 06/28/21 CCC+ / Caa1 LBO06/28/13 CTI Foods Holding Co LLC Food & Beverage TERM 345 0 06/28/20 B / B2 LBO
Select Recent Debt Offerings (2)
+73 bps+98 bps
p
00 bps
200 bps
01/06 07/06 01/07 07/07 01/08 07/08 01/09 07/09 01/10 07/10 01/11 07/11 01/12 07/12 01/13 07/13
06/28/13 CTI Foods Holding Co LLC Food & Beverage TERM 345.0 06/28/20 B / B2 LBO06/26/13 CHS Inc Retail Staples REV 2,500.0 06/26/18 NR / NR Refinance Debt06/21/13 Rite Aid Corp Retail Staples TERM 500.0 06/21/21 B- / B3 Refinance Debt06/19/13 Glazers Inc Food & Beverage REV 600.0 06/19/18 NR / NR General Corporate Purposes06/19/13 Orchard Supply Hardware LLC Retail Staples DIP REV 140.0 12/14/13 NR / NR General Corporate Purposes06/18/13 Rite Aid Corp Retail Staples 6.75 Cpn Bond 810.0 6/15/21 CCC / Caa2 Repay/Refinance Debt06/18/13 Rite Aid Corp Retail Staples 6.75 Cpn Bond 810.0 6/15/21 CCC / Caa2 Repay/Refinance Debt06/17/13 Casey‘s General Stores Inc Retail Staples 3.67 Cpn Bond 150.0 06/15/28 NR / NR N/A06/10/13 PepsiCo Inc Food & Beverage REV 2,875.0 06/10/18 NR / NR General Corporate Purposes06/10/13 PepsiCo Inc Food & Beverage REV 2,875.0 06/09/14 NR / NR General Corporate Purposes06/07/13 HJ Heinz Co Food & Beverage TERM 6,550.0 06/05/20 BB / Ba2 LBO06/07/13 HJ Heinz Co Food & Beverage TERM 2,950.0 06/07/19 BB / Ba2 LBO06/07/13 HJ Heinz Co Food & Beverage REV 1,000.0 06/07/18 BB / Ba2 LBO06/07/13 HJ Heinz Co Food & Beverage REV 375.0 06/07/18 NR / NR LBO06/07/13 HJ Heinz Co Food & Beverage REV 625.0 06/07/18 NR / NR LBO06/07/13 US Foods Inc Retail Staples TERM 2,100.0 03/31/19 B- / B2 Refinance Debt06/04/13 Nestle Holdings Inc Food & Beverage 2 Cpn Bond 500.0 12/11/19 NR / Aa2 N/A6/3/2013 Beam Inc Food & Beverage 1.75 Cpn Bond 250.0 06/15/18 BBB- / Baa2 Repay/Refinance Debt6/3/ 0 3 ea c ood & e e age 5 Cp o d 50 0 06/ 5/ 8 / aa epay/ e a ce eb6/3/2013 Beam Inc Food & Beverage 3.25 Cpn Bond 250.0 06/15/23 BBB- / Baa2 Repay/Refinance Debt
8
All data shown above for Food, Beverage & Restaurant industry only from 4/1/2013 to 6/30/13; ratings by S&P / Moody’s; date represents signing data for loans and announcement date for bonds

Select Recent Debt Offerings, continued (2)
Sign. Date
Borrower Description Type Size
($ MM)Maturity Rating Use of Proceeds
6/1/2013 Wal-Mart Stores Inc Retail Staples 5.403 Cpn Bond 500.0 6/1/2014 AA / Aa2 General Working Capital05/31/13 JR Simplot Co Food & Beverage REV 110.0 09/15/18 NR / NR Refinance Debt05/29/13 Smart & Final Inc Supermarkets TERM 578.7 11/15/19 NR / NR Refinance Debt5/29/2013 Ingles Markets Inc Supermarkets 5.75 Cpn Bond 700.0 06/15/23 BB- / B1 Capital Expenditures5/29/2013 Ingles Markets Inc Supermarkets 5.75 Cpn Bond 700.0 06/15/23 BB- / B1 Capital Expenditures05/20/13 B&G Foods Inc Food & Beverage 4.625 Cpn Bond 700.0 06/01/21 B+ / B1 Repay/Refinance Debt05/16/13 SUPERVALU Inc Supermarkets TERM 1,500.0 03/21/19 B+ / B1 Refinance Debt05/16/13 Wendy's International Inc Restaurants TERM 769.4 05/15/19 BB- / B1 Refinance Debt05/16/13 Wendy's International Inc Restaurants TERM 350.0 05/15/18 BB- / B1 Refinance Debt05/16/13 Supervalu Inc Supermarkets 6.75 Cpn Bond 400.0 06/01/21 B- / Caa1 Loan Payment05/16/13 Supervalu Inc Supermarkets 6 75 Cpn Bond 400 0 06/01/21 B- / Caa1 General Corporate Purpose05/16/13 Supervalu Inc Supermarkets 6.75 Cpn Bond 400.0 06/01/21 B / Caa1 General Corporate Purpose05/15/13 Pinnacle Operating Corp Retail Staples TERM 348.3 11/13/18 B / B2 Refinance Debt05/15/13 Mcdonald'S Corp Restaurants 2 Cpn Bond 350.0 06/01/23 A / A2 Loan Payment05/14/13 Dave & Buster's Inc Restaurants TERM 145.9 06/01/16 NR / NR Refinance Debt05/14/13 Hershey Co/The Food & Beverage 2.625 Cpn Bond 250.0 05/01/23 A / A2 /*+ General Corporate Purpose05/13/13 Cedc Finance Corp International Food & Beverage 10 Cpn Bond 200.0 04/30/18 NR / NR N/A05/13/13 Cedc Finance Corp International Food & Beverage 8 Cpn Bond 465.0 04/30/18 NR / NR N/A05/09/13 Albertsons LLC Supermarkets TERM 700.0 05/09/19 BB- / NR Refinance Debt05/09/13 Albertsons LLC Supermarkets TERM 450.0 03/21/16 NR / NR Refinance Debt05/08/13 B i k I t ti l I R t t 3 875 C B d 300 0 05/15/23 BBB / B 2 Sh B b k05/08/13 Brinker International Inc Restaurants 3.875 Cpn Bond 300.0 05/15/23 BBB- / Ba2 Share Buyback05/08/13 Brinker International Inc Restaurants 2.6 Cpn Bond 250.0 05/15/18 BBB- / Ba2 Repay/Refinance Debt05/08/13 Tops Holding Ii Corp Retail Staples 8.75 Cpn Bond 150.0 06/15/18 CCC+ / Caa2 Loan Payment05/08/13 Tops Holding Ii Corp Retail Staples 8.75 Cpn Bond 150.0 06/15/18 CCC+ / Caa2 General Corporate Purpose05/06/13 Fresh Mark Inc Food & Beverage REV 125.0 05/06/18 NR / NR General Corporate Purposes05/03/13 Fairway Group Acquisition Co Supermarkets TERM 274.3 08/17/18 NR / NR Refinance Debt05/01/13 Landry'S Inc Restaurants 9.375 Cpn Bond 235.0 05/01/20 CCC+ / B3 Repay/Refinance Debt04/30/13 FOCUS Brands Inc Restaurants TERM 358.0 02/22/18 NR / B1 Refinance Debt04/30/13 Constellation Brands Inc Food & Beverage 4.25 Cpn Bond 1,050.0 05/01/23 BB+ / Ba1 Acquisition Financing04/30/13 Constellation Brands Inc Food & Beverage 3.75 Cpn Bond 500.0 05/01/21 BB+ / Ba1 Loan Payment04/29/13 Pinnacle Foods Finance LLC Retail Staples TERM 1,630.0 04/29/20 BB / Ba3 Refinance Debt04/29/13 Coca-Cola Enterprises Inc Food & Beverage 2.375 Cpn Bond 350.0 05/07/25 BBB / A3 General Corporate Purpose04/29/13 McDonald’s Corp Restaurants 3.625 Cpn Bond 500.0 5/1/243 A / A2 General Corporate Purpose04/25/13 Cst Brands Inc Retail Staples 5 Cpn Bond 550.0 05/01/23 BB- / Ba3 N/A04/25/13 Cst Brands Inc Retail Staples 5 Cpn Bond 550.0 05/01/23 BB- / Ba3 N/A04/24/13 Denny's Inc Restaurants REV 190.0 04/24/18 NR / NR Refinance Debt04/24/13 Pantry Inc/The Retail Staples 8.375 Cpn Bond 250.0 08/01/20 B+ / Caa1 General Corporate Purpose04/15/13 Pinnacle Foods Finance Llc Food & Beverage 4 875 Cpn Bond 350 0 05/01/21 B- / B3 Repay/Refinance Debt04/15/13 Pinnacle Foods Finance Llc Food & Beverage 4.875 Cpn Bond 350.0 05/01/21 B- / B3 Repay/Refinance Debt04/15/13 Pinnacle Foods Finance Llc Food & Beverage 4.875 Cpn Bond 350.0 05/01/21 B- / B3 General Corporate Purpose04/11/13 Dollar General Corp Retail Staples TERM 1,000.0 04/11/18 BBB- / NR Refinance Debt04/11/13 Dollar General Corp Retail Staples REV 850.0 04/11/18 BBB- / NR Refinance Debt04/10/13 OSI Restaurant Partners LLC Restaurants TERM 975.0 10/26/19 BB / B1 Refinance Debt04/09/13 Ignite Restaurant Group Inc Restaurants REV 100.0 04/08/18 NR / NR Acquisition04/08/13 Dollar General Corp Retail Staples 3.25 Cpn Bond 900.0 04/15/23 BB+ *+ / Baa3 Loan Payment04/08/13 Dollar General Corp Retail Staples 1.875 Cpn Bond 400.0 04/15/18 BB+ *+ / Baa3 General Corporate Purpose04/05/13 Flowers Foods Inc Food & Beverage DELAY-DRAW TERM 300.0 04/05/18 NR / NR Acquisition04/05/13 Us Foods Inc Retail Staples 8.5 Cpn Bond 1,323.8 06/30/19 CCC+ / Caa2 General Corporate Purpose04/04/13 Wal-Mart Stores Inc Retail Staples 2.55 Cpn Bond 1,750.0 04/11/23 AA / Aa2 General Corporate Purpose04/04/13 Wal-Mart Stores Inc Retail Staples 1.125 Cpn Bond 1,250.0 04/11/18 AA / Aa2 General Corporate Purpose04/04/13 Wal-Mart Stores Inc Retail Staples 4 Cpn Bond 1,000.0 04/11/43 AA / Aa2 General Corporate Purpose04/04/13 Wal-Mart Stores Inc Retail Staples 0.6 Cpn Bond 1,000.0 04/11/16 AA / Aa2 General Corporate Purpose04/03/13 Ruby Tuesday Inc Restaurants 7.625 Cpn Bond 234.9 05/15/20 B- / B3 Bond Exchange04/01/13 Dole Food Co Inc Food & Beverage TERM 675.0 04/01/20 B+ / Ba3 Refinance Debt04/01/13 Dole Food Co Inc Food & Beverage DELAY-DRAW TERM 125.0 04/01/20 NR / WR Refinance Debt04/01/13 Reddy Ice Corp Food & Beverage TERM 120.0 10/01/19 NR / NR Refinance Debt
9
y p g04/01/13 Reddy Ice Corp Food & Beverage TERM 225.0 04/01/19 B / B1 Refinance Debt
All data shown above for Food, Beverage & Restaurant industry only from 4/1/2013 to 6/30/13; ratings by S&P / Moody’s; date represents signing data for loans and announcement date for bonds
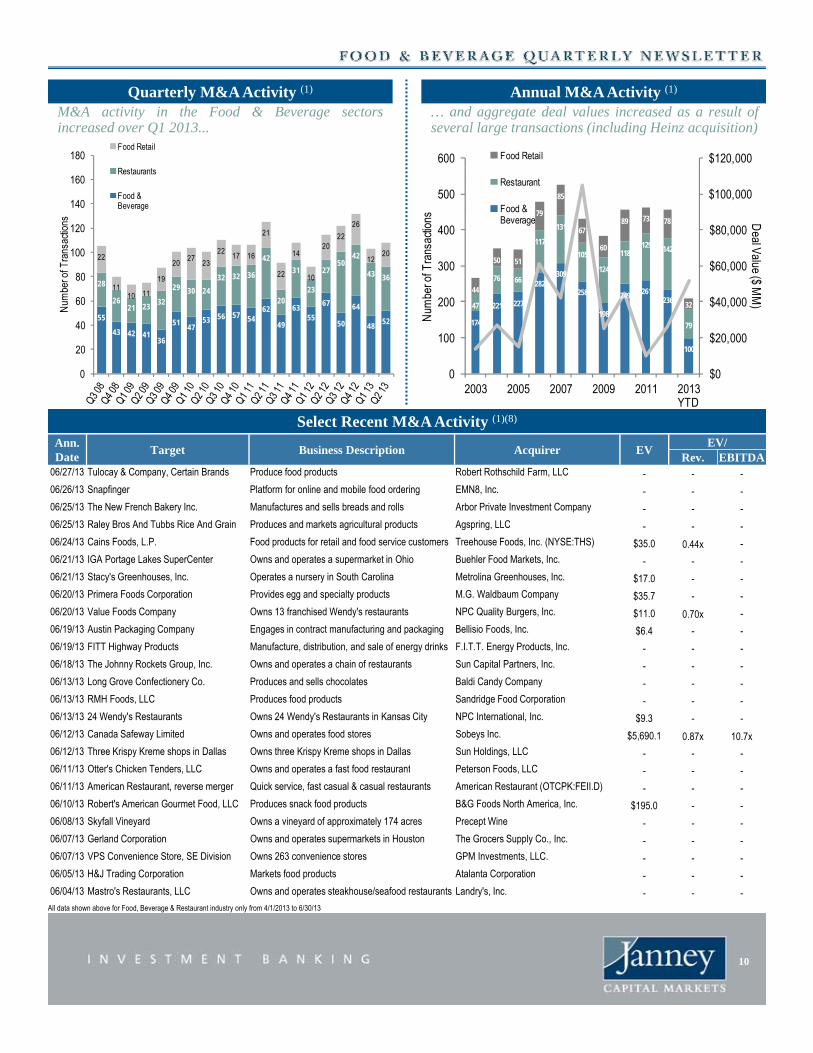
$120,000600 Food Retail180Food Retail
Annual M&A Activity (1)Quarterly M&A Activity (1)
M&A activity in the Food & Beverage sectorsincreased over Q1 2013...
… and aggregate deal values increased as a result ofseveral large transactions (including Heinz acquisition)
28230976 66
117
131
105
124
118129 142
50 51
79
85
67
60
89 73 78
$60,000
$80,000
$100,000
300
400
500
Deal Value ($ r o
f Tra
nsac
tions
Restaurant
Food & Beverage
28 2932 32 36
42
31
23
2750
42
43 36
22
1119
2027
23
2217 16
21
22
14
10
2022
26
1220
80
100
120
140
160
er o
f Tra
nsac
tions
Restaurants
Food & Beverage
174
221 227258
198
249 261236
100
47
79
44
32
$0
$20,000
$40,000
0
100
200
2003 2005 2007 2009 2011 2013 YTD
MM
)
Num
ber
55
43 42 4136
5147
53 56 57 5462
49
6355
67
50
64
4852
2621 23
32
29 30 2420
231110 11
0
20
40
60
Num
be
Ann.Date
Target Business Description Acquirer EVEV/
Rev. EBITDA06/27/13 Tulocay & Company, Certain Brands Produce food products Robert Rothschild Farm, LLC - - -
06/26/13 Snapfinger Platform for online and mobile food ordering EMN8, Inc. - - -
06/25/13 The New French Bakery Inc. Manufactures and sells breads and rolls Arbor Private Investment Company - - -
06/25/13 Raley Bros And Tubbs Rice And Grain Produces and markets agricultural products Agspring LLC
YTD
Select Recent M&A Activity (1)(8)
06/25/13 Raley Bros And Tubbs Rice And Grain Produces and markets agricultural products Agspring, LLC - - -
06/24/13 Cains Foods, L.P. Food products for retail and food service customers Treehouse Foods, Inc. (NYSE:THS) $35.0 0.44x -
06/21/13 IGA Portage Lakes SuperCenter Owns and operates a supermarket in Ohio Buehler Food Markets, Inc. - - -
06/21/13 Stacy's Greenhouses, Inc. Operates a nursery in South Carolina Metrolina Greenhouses, Inc. $17.0 - -
06/20/13 Primera Foods Corporation Provides egg and specialty products M.G. Waldbaum Company $35.7 - -
06/20/13 Value Foods Company Owns 13 franchised Wendy's restaurants NPC Quality Burgers, Inc. $11.0 0.70x -
06/19/13 Austin Packaging Company Engages in contract manufacturing and packaging Bellisio Foods, Inc. $6.4 - -
06/19/13 FITT Highway Products Manufacture distribution and sale of energy drinks F I T T Energy Products Inc06/19/13 FITT Highway Products Manufacture, distribution, and sale of energy drinks F.I.T.T. Energy Products, Inc. - - -
06/18/13 The Johnny Rockets Group, Inc. Owns and operates a chain of restaurants Sun Capital Partners, Inc. - - -
06/13/13 Long Grove Confectionery Co. Produces and sells chocolates Baldi Candy Company - - -
06/13/13 RMH Foods, LLC Produces food products Sandridge Food Corporation - - -
06/13/13 24 Wendy's Restaurants Owns 24 Wendy's Restaurants in Kansas City NPC International, Inc. $9.3 - -
06/12/13 Canada Safeway Limited Owns and operates food stores Sobeys Inc. $5,690.1 0.87x 10.7x06/12/13 Three Krispy Kreme shops in Dallas Owns three Krispy Kreme shops in Dallas Sun Holdings, LLC - - -
06/11/13 Ott ' Chi k T d LLC O d t f t f d t t P t F d LLC06/11/13 Otter's Chicken Tenders, LLC Owns and operates a fast food restaurant Peterson Foods, LLC - - -
06/11/13 American Restaurant, reverse merger Quick service, fast casual & casual restaurants American Restaurant (OTCPK:FEII.D) - - -
06/10/13 Robert's American Gourmet Food, LLC Produces snack food products B&G Foods North America, Inc. $195.0 - -
06/08/13 Skyfall Vineyard Owns a vineyard of approximately 174 acres Precept Wine - - -
06/07/13 Gerland Corporation Owns and operates supermarkets in Houston The Grocers Supply Co., Inc. - - -
06/07/13 VPS Convenience Store, SE Division Owns 263 convenience stores GPM Investments, LLC. - - -
06/05/13 H&J Trading Corporation Markets food products Atalanta Corporation - - -
06/04/13 Mastro's Restaurants, LLC Owns and operates steakhouse/seafood restaurants Landry's, Inc. - - -
10
All data shown above for Food, Beverage & Restaurant industry only from 4/1/2013 to 6/30/13

Select Recent M&A Activity, continued (1)(7)
Ann.Date
Target Business Description Acquiror EVEV/
Rev. EBITDA06/03/13 Pryority Food Marketing, Inc. Operates as a food brokerage company Advantage Sales and Marketing LLC - - -
06/03/13 Thompsons Limited Supplies and offers food products The Andersons, Inc. (Nasdaq:ANDE) $145.0 - -
06/03/13 Farmland in Marion County Owns a farm to cultivate blueberries Gladstone Land (Nasdaq:LAND) $3.1 - -
06/03/13 Circle Foods, LLC Produces and sells specialty food products Tyson Foods, Inc. (NYSE:TSN) - - -
06/03/13 43 Church Operates as a restaurant and offers dining services J. Turner Seafoods Inc. $1.5 - -
05/29/13 Smithfield Foods, Inc. (NYSE:SFD) Produces Fresh meat and packaged meat Henan Shineway Industry Group Co., Ltd. $6,965.6 0.53x 9.17x05/28/13 Delhaize America, Supermarket stores Owns 165 supermarket stores BI-LO, LLC $265.0 0.15x -
05/28/13 Jack in the Box,18 Restaurants in TX Owns 18 Restaurants in Beaumont, Texas TLIG Restaurants, LLC - - -
05/24/13 248-Acre Vineyard Sonoma Coast Owns a 248-Acre Vineyard Guarachi Family Wines05/24/13 248 Acre Vineyard, Sonoma Coast Owns a 248 Acre Vineyard Guarachi Family Wines - - -
05/23/13 Plum Organics, Inc. Production of organic baby food products Campbell Soup Company (NYSE:CPB) - - -
05/22/13 Silverbow Honey Co., Inc. Processing, packaging, and sale of honey NutraBev Holdings International, Inc. - - -
05/21/13 Gregory Farmers Elevator Company Provides grain storage and distribution services Interstate Commodities, Inc. $0.6 - -
05/21/13 Empire Wineries, LLC Produces wines, vodka and spirits Panache Distillery, LLC $4.4 - -
05/16/13 Goosecross Cellars Operates a winery Golden Equity Investments - - -
05/15/13 Panther Creek Cellars LLC Produces wines Bacchus Capital Management - - -
05/15/13 Adi N t iti I P d ti A t P id i f bi ti d t Li i E i I (OTCPK LVVV)05/15/13 Adia Nutrition, Inc., Production Assets Provides services of probiotics products Livewire Ergogenics, Inc. (OTCPK:LVVV) $1.0 - -
05/15/13 Overhill Farms, Inc. (AMEX:OFI) Manufactures prepared frozen food products Bellisio Foods, Inc. $84.6 0.44x 13.1x05/14/13 Golden Guernsey Dairy, LLC Manufactures, bottles, and distributes dairy products Lifeway Foods Inc. (Nasdaq:LWAY) $7.4 - -
05/14/13 David's Steak & Spirits Operates as a restaurant Solanbridge Group, Inc. (OTCPK:SLNX) - - -
05/13/13 Nurture, Inc. Produces baby and toddler meals Danone (ENXTPA:BN) - - -
05/10/13 Florida Chemical Company, Inc. Manufactures and supplies citrus oils Flotek Industries Inc. (NYSE:FTK) $102.2 1.00x 10.3x05/10/13 Burger Bar 419 Owns and operates a restaurant in Ohio Star Bar & Grille - - -
05/09/13 CTI Foods, Inc. Provides food solutions for foodservice industry Thomas H. Lee Partners; Goldman Sachs - - -
05/09/13 Hearthside Food, Cereal & Snacks Branded and private label cereal, granola & snacks Attune Foods, Inc. $158.0 - -
05/09/13 Gracious Gifts, Inc. Produces and sells gourmet confectionary snacks Consolidated Investment Group, LLC - - -
05/08/13 Canadian Nutrition Super Stores Owns and operates a chain of discount retail stores Creative Edge Nutrition (OTCPK:FITX) $0.4 - -
05/07/13 DeMet's Candy Company, TrueNorth Owns a roasted nut brand B&G Foods Inc. (NYSE:BGS) - - -
05/06/13 Matilija Pure Water, Bottled Water Owns a bottled water and coffee delivery business DS Waters of America, Inc. - - -
05/06/13 Tru Meals-Diet Gourmet Produces and offers prepared meals Snap Kitchen LLC - - -p p p
05/01/13 Nestlé USA, Inc., Bit-O-Honey Owns Bit-O-Honey candy brand Pearson's Candy Company - - -
04/30/13 Flat Out Crazy, LLC Full-service Asian-style restaurants in the Midwest HillStreet Capital Inc. $2.3 - -
04/26/13 Healthy & Tasty Ventures, LLC Fast food and casual restaurant franchise GRILLiT, Inc. (OTCPK:GRLT) - - -
04/25/13 Willamette Valley, Berry Processing Provides berry processing services Inventure Foods, Inc. (Nasdaq:SNAK) $12.5 0.83x -
04/25/13 Mekonza Corp. Fresh and frozen seafood products Latteno Food Corp. (OTCPK:LATF) - - -
04/23/13 Blue Smoke, Inc. Provides food products National Fruit Product Company, Inc. - - -
04/17/13 Maria's Santa Fe Inc Operates a bar and restaurant in New Mexico Santa Fe Dining Inc - - -04/17/13 Maria s Santa Fe, Inc. Operates a bar and restaurant in New Mexico Santa Fe Dining Inc. - - -
04/16/13 Coca-Cola Bottling Operations in Denver Provides beverage bottling services Swire Coca-Cola, USA - - -
04/16/13 Six Quick Service Restaurants in TX Owns six restaurants in Texas. Indigo Group LLC, Investment Arm - - -
04/15/13 Weathervane Restaurant Property Owns a restaurant offering seafood Turf Hotels, Inc. - - -
04/12/13 Caviness Beef Packers San Angelo, Ltd. Operates a meat processing plant Caviness Beef Packers, LTD. - - -
04/09/13 Eppa Wine Company Produces Eppa SupraFruta Sangria Deutsch Family Wine & Spirits - - -
04/08/13 CB Mart Inc., 46 Stores in South Carolina Owns 46 brand convenience store locations 7-Eleven, Inc. - - -
11
All data shown above for Food, Beverage & Restaurant industry only from 4/1/2013 to 6/30/13
04/05/13 Newark Diner Operates as a restaurant in New York Larkin Enterprises, Inc. - - -

Ann.Date Target Acquiror Seller
06/26/13 BAI Brands Strand Equity Partners -
Th N F h A b P i t I t t
Financial Sponsor Activity (1)Select Recent Financial Sponsor Activity (1)
69
75InvestmentsExits
06/25/13 The New French Bakery
Arbor Private Investment Company
-
06/18/13 The Johnny Rockets Group
Sun Capital Partners Red Zone Capital Management
06/10/13 Robert's American Gourmet Food
B&G Foods North America
VMG Partners
06/05/13 Brad's Raw Foods Ben Franklin Technology Partners of SEPA
- 4648
59
5045
60
Tran
sact
ions
06/03/13 Circle Foods Tyson Foods (NYSE:TSN)
Claridge
05/29/13 NextFoods Maveron; Emil Capital Partners
-
05/23/13 Plum Organics Campbell Soup Company (NYSE:CPB)
Catterton Partners; Catamount Ventures;
05/15/13 Overhill Farms (AMEX:OFI)
Bellisio Foods (Centre Partners)
Public
38
27
22
15
21
14
25
20
26
20
37
2931
15
30
Num
ber o
f T
05/01/13 Philz Coffee Summit Partners -
05/01/13 Tokyo Inc. Gridiron Capital -
04/30/13 Flat Out Crazy HillStreet Capital -
Select Financial Sponsor Sector Snapshot: Fresh Baked Goods
02005 2006 2007 2008 2009 2010 2011 2012 2013
YTD
Select Financial Sponsor Sector Snapshot: Fresh Baked Goods
Financial Sponsor Portfolio Holding Yr. Invested Est. $ Sales (in MMs)(10)
% Sales Growth(10)
% Volume Growth(10)
Plaza Belmont Labriola Baking 2013 2.7 8.8% 5.4%
Arbor Investments New French Bakery 2013 12.0 -11.0% -14.4%
Metropoulos & Co. and Apollo Group Hostess Brands 2013 NMF NMF NMF
Goode Partners Dave’s Killer Bread 2012 44.1 64.0% 66.6%
Frontenac Company Wenner Bread Products 2011 2 8 12 4% 16 9%Frontenac Company Wenner Bread Products 2011 2.8 -12.4% -16.9%
Wind Point Partners Nonni’s Biscotti 2011 - - -
Blue Point Capital JTM Foods 2011 27.9 19.0% 14.3%
Stonebridge Partners Specialty Bakers 2010 36.8 -4.1% -4.5%
Glencoe Capital Pattco 2010 50.7 13.3% 12.1%
Quad-C Management Cloverhill Bakery 2009 106.7 8.8% 5.0%
Ancor Capital Partners Tom Cat Bakery Inc 2008 0.8 -10.6% -8.6%
Arbor Private Investment Gold Standard Baking 2008 - - -
OMERS Give and Go Prepared Foods 2007 91.9 14.5% 11.3%
Swander Pace Pineridge Bakery 2007 - - -
Sherbrooke Capital Immaculate Baking 2006 - - -
Charterhouse Group Charter Baking Company 2005 26.1 34.8% 24.4%
GESD Capital Partners Dobake Bakeries 2002 1.2 -72.1% -76.1%
GESD Capital Partners Gold Coast Baking 2002 3 3 -11 7% -13 4%
12
All data shown above for Food and Beverage and Restaurant sector only; select recent activity list may include non-North American businesses
GESD Capital Partners Gold Coast Baking 2002 3.3 11.7% 13.4%

120
140
160
el)
200
250
Commodity Price Index
Commodity Food & Beverage Price Index
Crude Oil (2)Food & Beverage CPI (2)
0
20
40
60
80
100
2001 2002 2003 2004 2005 2006 2007 2008 2009 2010 2011 2012 2013
Nea
r Fut
ure
( $ p
er b
arre
0
50
100
150
2001 2002 2003 2004 2005 2006 2007 2008 2009 2010 2011 2012 2013
15
20
25
Cen
ts p
er b
ushe
l)
400
500
600
700
800
900
ure
(Cen
ts p
er B
ushe
l)
Wheat (2)Corn (2)
0
5
10
2001 2002 2003 2004 2005 2006 2007 2008 2009 2010 2011 2012 2013
Whe
aat (
C
0
100
200
300
400
2001 2002 2003 2004 2005 2006 2007 2008 2009 2010 2011 2012 2013
Cor
n -N
ear F
utu
Soybeans (2)Chicken (2)
100
150
200
250
300
Chi
cken
Bre
ast (
cent
s pe
r Lb.
)
600
800
1,000
1,200
1,400
1,600
1,800
2,000
bean
-ne
ar fu
ture
(cen
ts p
er b
ushe
l)
2.5
0
50
2001 2002 2003 2004 2005 2006 2007 2008 2009 2010 2011 2012 20130
200
400
2001 2002 2003 2004 2005 2006 2007 2008 2009 2010 2011 2012 2013
Soy
35
40
World Sugar (2)Cheddar Cheese (2)
0.5
1.0
1.5
2.0
Che
ddar
Che
ese
($ p
er L
b.)
5
10
15
20
25
30
Suga
r -N
ear F
utur
e (C
ents
per
Pou
nd)
0.02001 2002 2003 2004 2005 2006 2007 2008 2009 2010 2011 2012 2013
02001 2002 2003 2004 2005 2006 2007 2008 2009 2010 2011 2012 2013
13

14
Inst
.
Mul
tiple
Ow
ners
hip
Div
iden
d
E20
14E
(% o
f Tot
al)
Yie
ld (%
)
x16
.0x
27.1
%3.
3%
x17
.3x
70.4
%2.
6%
x17
.4x
73.0
%3.
5%
x16
.0x
71.6
%2.
9%
x15
.7x
81.0
%2.
7%
x13
.6x
70.8
%2.
7%
x15
.7x
42.7
%2.
5%
x16
.9x
73.8
%2.
1%
x17
.4x
33.6
%1.
6%
x20
.1x
78.5
%1.
9%
x14
.6x
80.2
%2.
8%
x16
.5x
79.2
%1.
4%
x16
.4x
65.2
%2.
5%
x16
.2x
72.3
%2.
7%
x19
.1x
NM
0.0%
x19
.8x
42.6
%2.
1%
x14
.3x
92.2
%0.
0%
x12
.0x
58.4
%2.
8%
AN
/A62
.8%
0.0%
AN
/A41
.8%
0.0%
x16
.3x
59.5
%0.
8%
x16
.7x
58.4
%0.
0%
x28
.3x
84.3
%0.
7%
x20
.7x
92.1
%0.
0%
x19
.5x
23.7
%0.
0%
x19
.9x
96.0
%0.
0%
x26
.3x
85.6
%0.
0%
x38
.5x
NM
0.0%
x27
.0x
88.5
%0.
0%
x45
.7x
41.6
%0.
0%
x14
.5x
65.9
%0.
0%
x34
.4x
17.0
%0.
4%
M33
.3x
5.8%
0.0%
x28
.0x
60.0
%0.
1%
x27
.0x
75.1
%0.
0%
Val
uatio
n B
ench
mar
ks
EV/
Rev
.EV
/ EB
ITD
AP
E
LTM
LTM
2013
E20
14E
2013
2.28
x12
.2x
11.8
x11
.0x
17.4
x
2.24
x11
.9x
11.5
x10
.8x
18.7
x
2.29
x10
.7x
11.9
x10
.9x
19.1
x
2.24
x11
.4x
11.2
x10
.5x
17.5
x
2.10
x14
.3x
11.7
x11
.2x
17.0
x
1.57
x11
.8x
10.4
x9.
4x15
.6x
2.14
x10
.4x
10.4
x10
.1x
16.6
x
2.15
x10
.5x
10.3
x9.
7x18
.2x
1.21
x12
.1x
10.7
x10
.0x
19.0
x
2.60
x15
.5x
14.6
x13
.4x
22.2
x
2.14
x12
.3x
11.9
x11
.5x
15.8
x
0.32
x2.
8x2.
7x2.
4x20
.1x
1.94
x11
.3x
10.7
x10
.1x
18.1
x
2.15
x11
.9x
11.3
x10
.7x
17.9
x
1.43
x10
.5x
9.8x
9.2x
21.2
x
1.52
x14
.0x
11.9
x10
.8x
23.1
x
0.33
x5.
5x8.
5x8.
0x18
.9x
0.60
x6.
6x6.
6x5.
9x18
.7x
0.43
x6.
5xN
/AN
/AN
/A
0.43
x12
.8x
N/A
N/A
N/A
0.79
x9.
3x9.
2x8.
5x20
.5x
0.52
x8.
5x9.
1x8.
6x20
.1x
1.41
x15
.0x
14.3
x12
.0x
33.6
x
2.28
x17
.4x
14.3
x12
.5x
23.9
x
1.52
x13
.2x
12.5
x11
.1x
23.0
x
0.49
x13
.1x
11.7
x10
.0x
23.0
x
1.75
x15
.6x
13.7
x11
.4x
31.7
x
4.26
x34
.4x
24.6
x20
.9x
45.9
x
2.21
x16
.3x
12.6
x10
.4x
39.1
x
1.85
x27
.0x
20.9
x16
.6x
59.9
x
0.65
x11
.2x
9.5x
7.9x
18.2
x
3.29
x21
.7x
18.4
x15
.9x
36.5
x
2.17
xN
MN
/AN
/AN
M
1.99
x18
.5x
15.2
x12
.9x
33.5
x
1.85
x16
.0x
14.0
x11
.7x
32.7
x
Net
Deb
t /N
ext 5
Yr
EPS
LTM
EPS
Gro
w
3E20
14E
EBIT
DA
Rat
e
76$4
.08
1.0x
7.3%
374.
731.
7x8.
7%
923.
222.
2x7.
3%
773.
042.
1x7.
8%
784.
093.
4x7.
6%
242.
564.
6x10
.4%
702.
852.
2x6.
4%
676.
091.
5x8.
9%
042.
21N
M11
.0%
173.
491.
8x8.
9%
531.
665.
8x10
.6%
642.
011.
1x4.
0%
053.
342.
5x8.
2%
843.
132.
1x8.
3%
09$3
.42
2.6x
10.1
%
231.
443.
0x13
.0%
530.
702.
6x12
.0%
420.
652.
7x14
.1%
/A N
/A2.
6xN
/A
/A N
/A0.
6xN
/A
321.
552.
3x12
.3%
881.
072.
6x12
.5%
53$1
.82
NM
18.6
%
723.
152.
9x17
.4%
710.
832.
8x18
.0%
342.
720.
8x15
.0%
571.
890.
0x21
.3%
931.
110.
1x22
.5%
310.
454.
0x20
.0%
520.
680.
2x26
.5%
420.
523.
1x30
.0%
480.
510.
0x13
.0%
010.
1513
.8x
35.0
%
051.
262.
8x21
.6%
710.
831.
8x20
.0%
ics
LTM
EBIT
DA
EBIT
DA
LTM
2013
EM
argi
n20
13
$18,
916
$19,
529
18.8
%$3
.
12,4
1812
,899
18.8
%4.
3,94
53,
518
21.5
%2.
3,47
73,
554
19.6
%2.
2,18
22,
654
14.7
%3.
2,05
42,
343
13.3
%2.
1,72
01,
722
20.5
%2.
1,21
21,
231
20.5
%5.
843
954
10.0
%2.
678
723
16.7
%3.
430
447
17.4
%1.
478
497
11.7
%1.
4,02
94,
172
16.9
%3.
1,88
72,
032
18.1
%2.
$299
$320
13.6
%$3
.
179
210
10.9
%1.
683
446
6.0%
0.
196
196
9.0%
0.
85N
/A6.
7% N
6N
/A3.
3% N
241
293
8.2%
1.
187
265
7.9%
0.
$1,2
12$1
,268
9.4%
$1.
212
258
13.1
%2.
270
285
11.5
%0.
216
241
3.7%
2.
154
175
11.2
%1.
2129
12.4
%0.
5875
13.5
%0.
2633
6.8%
0.
6476
5.7%
0.
1315
15.1
%0.
0N
/A1.
4%0.
204
246
9.4%
1.
6412
511
.2%
0.
Ope
ratin
g M
etri
arke
tEn
terp
rise
LT
M
Cap
.V
alue
Rev
enue
08,7
96$2
30,1
75$1
00,8
41
26,4
8114
7,95
865
,994
33,2
1342
,019
18,3
81
31,1
0139
,752
17,7
74
23,6
2231
,187
14,8
58
14,6
5424
,263
15,4
91
14,0
2617
,890
8,37
6
10,9
3212
,693
5,89
8
10,2
1810
,213
8,44
7
9,28
710
,539
4,06
0
2,83
25,
305
2,47
5
786
1,31
94,
077
40,4
9647
,776
22,2
23
14,3
4021
,076
11,6
53
$2,3
75$3
,140
$2,1
98
1,96
52,
498
1,64
4
1,87
13,
771
11,4
71
744
1,29
32,
170
330
555
1,27
7
7983
194
1,22
71,
890
3,15
9
1,30
71,
895
1,90
7
19,0
94$1
8,13
2$1
2,85
2
3,07
23,
694
1,62
2
2,81
23,
561
2,34
6
2,66
32,
825
5,76
6
2,40
12,
405
1,37
1
721
724
170
717
953
432
694
699
379
502
720
1,11
5
284
284
86
6369
32
3,00
23,
097
2,37
9
721
953
1,11
5
% o
f
% C
hang
e52
Wee
kM
a
0 D
ayY
TD
Hig
hC
-1.0
%0.
6%88
.5%
$20
1.3%
19.5
%96
.5%
12
1.3%
22.9
%96
.6%
3
3.1%
20.1
%95
.2%
3
3.5%
15.0
%96
.1%
2
3.7%
18.4
%96
.2%
1
4.6%
28.4
%91
.7%
1
2.2%
19.6
%98
.1%
1
-3.1
%23
.6%
89.4
%1
1.9%
10.8
%93
.5%
-1.7
%N
/A91
.2%
-4.5
%17
.6%
88.7
%
0.9%
17.8
%93
.5%
4
1.6%
19.5
%94
.4%
1
0.1%
25.7
%97
.1%
$
9.6%
17.8
%99
.3%
-4.5
%-3
9.3%
47.6
%
-5.0
%-3
.1%
71.8
%
-4.0
%0.
9%85
.1%
0.0%
14.3
%99
.0%
-0.6
%2.
7%83
.3%
-2.0
%7.
6%91
.1%
-0.7
%12
.9%
96.0
%$ 1
-2.4
%19
.9%
88.2
%
-6.8
%4.
6%83
.0%
2.0%
0.7%
88.1
%
0.4%
N/A
75.7
%
9.8%
27.8
%87
.5%
14.9
%N
/A86
.1%
9.3%
62.4
%90
.3%
-3.7
%34
.4%
93.6
%
-0.9
%98
.6%
94.5
%
4.2%
-12.
0%56
.7%
2.4%
27.7
%85
.4%
0.4%
19.9
%88
.1%
Mar
ket S
tatis
tics
Sto
ck
Pri
ce30
$65.
46
81.7
9
c.55
.87
48.5
3
64.2
3
34.9
3
pany
44.7
9
ompa
ny10
3.15
atio
n38
.58
any
70.3
6
24.1
5
pany
33.0
8
Mea
n
Med
ian
$65.
54
28.4
1
y10
.02
7.80
30.6
8
4.95
Mea
n
Med
ian
HY
LIVI
NG
Inc.
$51.
48
oup,
Inc.
65.0
1
s C
ompa
ny16
.25
Inc.
53.9
9
.49
.72
42.7
4
12.0
5
tam
in C
otta
ge, I
nc.
31.0
0
7.57
17.3
6
5.00
Mea
n
Med
ian
As
of J
une
30, 2
013
($ in
milli
ons,
exc
ept p
er s
hare
dat
a)
Tic
ker
Com
pany
BR
AND
ED P
ACK
AGED
FO
OD
SN
ES
NN
estlé
S.A
.
PE
PP
epsi
co, I
nc.
KR
FTK
raft
Food
s G
roup
, In c
GIS
Gen
eral
Mills
, Inc
.
KK
ello
gg C
ompa
ny
CA
GC
onA
gra
Food
s, In
c.
CP
BC
ampb
ell S
oup
Com
p
SJM
The
J. M
. Sm
ucke
r Co
HR
LH
orm
el F
oods
Cor
pora
MK
CM
cCor
mic
k &
Com
pa
PF
Pin
nacl
e Fo
ods
Inc.
HS
HH
illshi
re B
rand
s C
omp
PRIV
ATE
LAB
ELTH
STr
eeho
use
Food
s, In
c.
LNC
ES
nyde
r's-L
ance
, Inc
.
DF
Dea
n Fo
ods
Com
pan y
BC
BC
ott C
orpo
ratio
n
SE
NE
.AS
enec
a Fo
ods
Cor
p.
OFI
Ove
rhill
Farm
s, In
c.
NAT
UR
AL /
OR
GAN
IC /
HEA
LTH
WFM
Who
le F
oods
Mar
ket,
HA
INTh
e H
ain
Cel
estia
l Gr o
WW
AV
The
Whi
teW
ave
Food
s
UN
FIU
nite
d N
atur
al F
oods
,
TFM
The
Fres
h M
arke
t, In
c
BN
NY
Ann
ie's
, Inc
.
BD
BD
Bou
lder
Bra
nds,
Inc.
NG
VC
Nat
ural
Gro
cers
by
Vi t
TSX:
SO
YS
unO
pta
Inc.
LWA
YLi
few
ay F
oods
Inc.
RE
ED
RE
ED
S, I
nc.

15
Inst
.
E M
ultip
leO
wne
rshi
p D
ivid
end
3E20
14E
(% o
f Tot
al)
Yie
ld (%
)
4x16
.6x
76.5
%1.
7%
4x15
.9x
14.7
%1.
6%
4x24
.3x
NM
0.4%
x10
.0x
41.3
%1.
1%
7x20
.4x
67.0
%1.
9%
x17
.5x
55.9
%1.
9%
x19
.8x
42.6
%2.
1%
5x20
.9x
70.0
%0.
8%
8x29
.1x
47.8
%0.
0%
AN
/A58
.5%
0.0%
7x18
.4x
44.1
%0.
0%
AN
/A12
.0%
3.6%
4x19
.3x
48.2
%1.
2%
6x19
.1x
47.8
%1.
3%
4x16
.0x
27.1
%3.
3%
0x21
.8x
83.4
%1.
8%
7x26
.9x
NM
1.4%
9x32
.1x
25.8
%0.
9%
0x24
.2x
45.4
%1.
8%
9x24
.3x
27.1
%1.
6%
6x16
.7x
48.4
%2.
5%
3x14
.6x
12.0
%1.
7%
2x16
.4x
57.3
%0.
9%
AN
/AN
M2.
1%
9x14
.3x
92.2
%0.
0%
5x34
.4x
17.0
%0.
4%
7x19
.3x
45.4
%1.
3%
6x16
.4x
48.4
%1.
3%
Val
uatio
n B
ench
mar
ks
EV/
Rev
.EV
/ EB
ITD
AP
E
LTM
LTM
2013
E20
14E
2013
1.90
x13
.0x
12.0
x11
.0x
18.4
1.21
x9.
7x9.
4x8.
8x17
.4
1.28
x13
.6x
12.6
x10
.7x
38.4
1.10
x8.
7x8.
2x7.
5x11
.1
1.58
x14
.0x
11.2
x10
.2x
22.7
1.73
x11
.0x
10.8
x9.
9x19
.1
1.52
x14
.0x
11.9
x10
.8x
23.1
1.58
x10
.6x
10.0
x9.
4x22
.5
1.17
x19
.0x
9.8x
9.0x
46.8
0.44
x5.
7xN
/AN
/AN
/A
0.97
x12
.8x
11.1
x9.
1x24
.7
0.29
x7.
3xN
/AN
/AN
/A
1.23
x11
.6x
10.7
x9.
6x24
.4
1.25
x11
.9x
11.0
x9.
6x22
.6
2.28
x12
.2x
11.8
x11
.0x
17.4
3.12
x14
.6x
13.4
x12
.5x
24.0
3.10
x18
.0x
16.5
x15
.1x
29.7
3.33
x20
.0x
N/A
N/A
32.9
2.96
x16
.2x
13.9
x12
.9x
26.0
3.11
x16
.3x
13.4
x12
.5x
26.9
1.99
x12
.0x
11.3
x10
.4x
18.6
1.48
x12
.6x
10.9
x10
.2x
16.3
1.53
x16
.6x
15.3
x13
.8x
18.2
0.74
x6.
0xN
/AN
/AN
/A
0.33
x5.
5x8.
5x8.
0x18
.9
3.29
x21
.7x
18.4
x15
.9x
36.5
1.56
x12
.4x
12.9
x11
.7x
21.7
1.50
x12
.3x
11.3
x10
.4x
18.6
Net
Deb
t /N
ext 5
Yr
EPS
LTM
EPS
Gro
w
3E20
14E
EBIT
DA
Rat
e
.55
$1.7
13.
1x11
.4%
.51
1.66
0.8x
10.6
%
.08
0.12
2.2x
44.9
%
.06
5.61
1.9x
18.6
%
.97
1.08
1.7x
9.1%
.09
4.45
NM
9.0%
.23
1.44
3.0x
13.0
%
.47
3.72
NM
10.0
%
.44
0.71
10.6
x11
.2%
/A N
/A1.
7xN
/A
.34
0.46
1.8x
16.0
%
/A N
/AN
MN
/A
.87
2.10
3.0x
15.4
%
.37
1.55
1.9x
11.3
%
.76
$4.0
81.
0x7.
3%
.71
4.10
0.9x
9.5%
.69
1,61
6.87
NM
9.5%
.97
0.99
NM
N/A
.28
406.
511.
0x8.
8%
.74
4.09
1.0x
9.5%
.04
$4.4
92.
4x7.
5%
.82
3.14
2.0x
11.2
%
.74
0.82
1.9x
11.7
%
/A N
/A0.
2xN
/A
.53
0.70
2.6x
12.0
%
.48
0.51
0.0x
13.0
%
.72
1.93
1.5x
11.1
%
.74
0.82
1.9x
11.7
%
ics
LTM
EBIT
DA
EBIT
DA
LTM
2013
EM
argi
n20
13
$5,1
20$5
,544
14.6
%$1
.
2,40
92,
494
12.5
%1.
1,25
81,
358
9.4%
0.
748
792
12.6
%5.
371
462
11.3
%0.
185
187
15.8
%4.
179
210
10.9
%1.
130
138
14.9
%3.
5510
76.
1%0.
56N
/A7.
7% N
1517
7.6%
0.
6N
/A4.
0% N
878
1,13
110
.6%
1.
182
336
11.1
%1.
$18,
916
$19,
529
18.8
%$3
.
1,45
71,
587
21.3
%3.
503
550
17.2
%1,
464.
92N
/A16
.7%
0.
5,24
27,
222
18.5
%36
8.
980
1,58
718
.0%
3.
$4,6
24$4
,913
16.6
%$4
.
846
972
11.8
%2.
269
292
9.2%
0.
431
N/A
12.3
% N
683
446
6.0%
0.
1315
15.1
%0.
1,14
41,
327
11.8
%1.
557
446
12.1
%0.
Ope
ratin
g M
etr
arke
tEn
terp
rise
LT
M
Cap
.V
alue
Rev
enue
50,9
10$6
6,72
1$3
5,09
2
20,8
0323
,364
19,2
52
14,1
7817
,087
13,3
58
4,93
96,
493
5,92
8
4,57
25,
196
3,27
9
2,13
02,
030
1,17
1
1,96
52,
498
1,64
4
1,46
31,
381
872
462
1,04
088
8
222
318
724
161
186
192
4140
137
8,48
710
,530
6,87
8
2,04
82,
264
1,40
7
08,7
96$2
30,1
75$1
00,8
41
19,9
7521
,303
6,83
4
9,66
59,
072
2,92
7
1,90
01,
834
550
60,0
8465
,596
27,7
88
14,8
2015
,187
4,88
0
44,5
95$5
5,51
0$2
7,88
7
8,95
810
,621
7,17
5
3,96
14,
469
2,92
3
2,51
02,
599
3,49
2
1,87
13,
771
11,4
71
284
284
86
10,3
6312
,876
8,83
9
3,23
64,
120
5,33
3
% o
f
% C
hang
e52
Wee
kM
a
0 D
ayY
TD
Hig
hC
-3.2
%12
.1%
67.1
%$
-4.0
%3.
9%84
.9%
1.8%
15.9
%93
.0%
-2.4
%9.
7%88
.1%
-0.9
%42
.1%
91.2
%
-5.4
%12
.7%
91.9
%
9.6%
17.8
%99
.3%
2.5%
21.8
%96
.2%
33.8
%51
.8%
97.9
%
4.1%
10.9
%95
.5%
11.2
%28
.8%
98.9
%
-1.4
%2.
0%94
.6%
3.8%
19.1
%91
.6%
0.5%
14.3
%93
.8%
-1.0
%0.
6%88
.5%
$2
0.2%
23.6
%97
.1%
2.0%
15.4
%94
.7%
1.1%
26.3
%96
.2%
0.6%
16.5
%94
.1%
0.7%
19.5
%95
.5%
1.9%
13.6
%96
.1%
$ 4
-6.4
%-9
.4%
88.5
%
-2.1
%21
.9%
92.0
%
-5.3
%53
.9%
94.5
%
-4.5
%-3
9.3%
47.6
%
-0.9
%98
.6%
94.5
%
-2.9
%23
.2%
85.5
%
-3.3
%17
.8%
93.2
%
Mar
ket S
tatis
tics
Sto
ck
Pri
ce30
DS l, In
c.$2
8.53
ods
plc
26.3
7
de
C.V
.3.
01
56.1
1
22.0
5
rpor
atio
n77
.99
28.4
1
orp.
77.8
0
20.7
5
Son
Inc.
20.1
6
8.36
c.3.
50
Mea
n
Med
ian
$65.
46
ny89
.28
dt43
,490
.21
Inc.
31.7
8
Mea
n
Med
ian
$74.
96
45.8
7
13.4
5
368.
41
y10
.02
17.3
6
Mea
n
Med
ian
As
of J
une
30, 2
013
($ in
milli
ons,
exc
ept p
er s
hare
dat
a)
Tic
ker
Com
pany
SN
ACK
FO
OD
S /
BAK
ED G
OO
DM
DLZ
Mon
dele
z In
tern
atio
nal
AB
FA
ssoc
iate
d B
ritis
h Fo
o
BIM
BO
AG
rupo
Bim
bo, S
.A.B
.
AR
YN
AR
YZT
A A
G
FLO
Flow
ers
Food
s, In
c.
LAN
CLa
ncas
ter C
olon
y C
or
LNC
ES
nyde
r's-L
ance
, Inc
.
JJS
FJ&
J S
nack
Foo
ds C
o
DM
ND
Dia
mon
d Fo
ods,
Inc.
JBS
SJo
hn B
San
filipp
o &
S
SN
AK
Inve
ntur
e Fo
ods,
Inc.
GLD
CG
olde
n E
nter
pris
es In
c
CO
NFE
CTI
ON
ARY
NE
SN
Nes
tlé S
.A.
HS
YTh
e H
ersh
ey C
ompa
n
LIS
NC
hoco
lade
fabr
iken
Lin
TRTo
otsi
e R
oll I
ndus
tries
DAI
RY
BN
Dan
one
TSX:
SA
PS
aput
o, In
c.
ISE
:GL9
Gla
nbia
plc
FBE
LFr
omag
erie
s B
el
DF
Dea
n Fo
ods
Com
pan y
LWA
YLi
few
ay F
oods
Inc.

16
Inst
.
Mul
tiple
Ow
ners
hip
Div
iden
d
E20
14E
(% o
f Tot
al)
Yie
ld (%
)
x23
.5x
76.7
%1.
2%
x20
.0x
98.5
%0.
0%
x22
.0x
NM
0.0%
x17
.5x
35.4
%0.
0%
x8.
3x4.
4%0.
0%
x18
.3x
53.8
%0.
2%
x20
.0x
56.0
%0.
0%
x17
.6x
62.4
%2.
7%
x17
.3x
70.4
%2.
6%
x14
.0x
95.9
%3.
1%
x20
.8x
86.3
%0.
0%
x17
.9x
56.4
%1.
8%
AN
/A16
.1%
0.0%
x12
.0x
58.4
%2.
8%
AN
/A28
.0%
1.7%
M33
.3x
5.8%
0.0%
AN
/A5.
4%0.
0%
x19
.0x
48.5
%1.
5%
x17
.6x
57.4
%1.
8%
x16
.3x
31.1
%2.
5%
x17
.3x
29.8
%2.
0%
x14
.9x
47.0
%2.
2%
AN
/A29
.2%
2.2%
x21
.2x
43.5
%1.
4%
x15
.8x
80.4
%0.
0%
x30
.1x
17.1
%0.
0%
x19
.3x
39.7
%1.
5%
x16
.8x
31.1
%2.
0%
Val
uatio
n B
ench
mar
ks
EV/
Rev
.EV
/ EB
ITD
AP
E
LTM
LTM
2013
E20
14E
2013
3.29
x17
.5x
15.0
x12
.7x
28.4
x
2.73
x12
.9x
11.2
x9.
8x22
.6x
2.70
x19
.3x
16.0
x13
.9x
24.9
x
0.44
x8.
3xN
/AN
/A53
.5x
0.21
x7.
7xN
/AN
/A13
.7x
1.87
x13
.1x
14.1
x12
.1x
28.6
x
2.70
x12
.9x
15.0
x12
.7x
24.9
x
4.11
x14
.9x
14.3
x13
.5x
19.0
x
2.24
x11
.9x
11.5
x10
.8x
18.7
x
1.97
x9.
2x9.
0x8.
7x14
.9x
3.00
x23
.1x
17.8
x14
.5x
25.3
x
2.47
x14
.0x
13.1
x12
.0x
19.6
x
1.27
x10
.3x
N/A
N/A
N/A
0.60
x6.
6x6.
6x5.
9x18
.7x
0.91
x8.
0xN
/AN
/AN
/A
2.17
xN
MN
/AN
/AN
M
1.48
xN
MN
/AN
/AN
/A
2.02
x12
.2x
12.0
x10
.9x
19.4
x
2.07
x11
.1x
12.3
x11
.4x
18.9
x
4.72
x12
.3x
11.2
x9.
8x18
.8x
5.38
x17
.1x
14.0
x13
.2x
19.3
x
4.95
x14
.6x
13.4
x12
.3x
16.4
x
1.29
x8.
2x8.
0x7.
8xN
/A
5.35
x16
.0x
15.4
x14
.1x
23.7
x
5.05
x21
.2x
11.7
x8.
7x20
.3x
1.00
x18
.6x
N/A
N/A
63.4
x
3.96
x15
.4x
12.3
x11
.0x
27.0
x
4.95
x16
.0x
12.5
x11
.1x
19.8
x
Net
Deb
t /N
ext 5
Yr
EPS
LTM
EPS
Gro
w
E20
14E
EBIT
DA
Rat
e
31$2
.79
NM
19.3
%
323.
770.
2x18
.9%
640.
730.
7x10
.6%
260.
81N
M20
.0%
440.
72N
M22
.5%
391.
760.
4x18
.3%
640.
810.
4x19
.3%
11$2
.28
1.3x
7.9%
374.
731.
7x8.
7%
083.
281.
9x7.
5%
883.
50N
M26
.6%
390.
430.
6x8.
3%
/A N
/A0.
4xN
/A
420.
652.
7x14
.1%
/A N
/A2.
6xN
/A
010.
1513
.8x
35.0
%
/A N
/AN
/AN
/A
892.
153.
1x15
.4%
112.
281.
8x8.
7%
72$5
.45
2.8x
10.9
%
482.
763.
0x11
.8%
741.
922.
1x11
.9%
/A N
/A2.
6x9.
7%
863.
180.
8x11
.6%
573.
296.
7x13
.6%
130.
271.
3x22
.5%
422.
812.
8x13
.1%
532.
972.
6x11
.8%
ics
LTM
EBIT
DA
EBIT
DA
LTM
2013
EM
argi
n20
13
$2,7
24$3
,168
18.8
%$2
.
882
1,01
521
.2%
3.
511
614
14.0
%0.
27N
/A5.
3%0.
4N
/A2.
7%0.
829
1,59
912
.4%
1.
511
1,01
514
.0%
0.
$13,
127
$13,
627
27.6
%$2
.
12,4
1812
,899
18.8
%4.
1,29
01,
316
21.5
%3.
6484
13.0
%2.
6671
17.6
%0.
82N
/A12
.4%
N/
196
196
9.0%
0.
114
N/A
11.3
% N
/
0N
/A1.
4%0.
(1)
N/A
NM
N/
2,73
64,
699
14.7
%1.
9875
613
.0%
2.
$15,
526
$17,
030
38.5
%$4
.
5,49
96,
719
31.5
%2.
5,89
96,
429
33.9
%1.
3,07
13,
137
15.8
% N
/
951
991
33.4
%2.
675
1,22
923
.8%
2.
9N
/A5.
4%0.
4,51
95,
923
26.0
%2.
3,07
14,
783
31.5
%2.
Ope
ratin
g M
etri
arke
tEn
terp
rise
LT
M
Cap
.V
alue
Rev
enue
49,0
47$4
7,55
9$1
4,46
1
11,2
2211
,375
4,16
0
9,51
29,
852
3,65
1
216
223
502
3831
148
14,0
0713
,808
4,58
4
9,51
29,
852
3,65
1
78,6
40$1
95,4
72$4
7,57
9
26,4
8114
7,95
865
,994
9,37
211
,837
6,00
3
1,50
51,
486
495
887
928
375
809
841
662
744
1,29
32,
170
606
918
1,01
2
6369
32
2423
16
31,9
1336
,082
12,4
34
848
1,11
083
7
42,4
70$1
90,3
76$4
0,31
2
76,4
0293
,983
17,4
58
71,7
3086
,002
17,3
77
15,0
3825
,092
19,3
98
14,4
4215
,240
2,84
9
9,82
314
,324
2,83
5
156
167
167
47,1
5160
,740
14,3
42
15,0
3825
,092
17,3
77
% o
f
% C
hang
e52
Wee
kM
a
0 D
ayY
TD
Hig
hC
3.8%
22.2
%97
.1%
$4
2.9%
81.9
%90
.7%
1
1.9%
38.7
%97
.6%
0.1%
-2.6
%83
.2%
-14.
1%-1
4.1%
66.3
%
-1.1
%25
.2%
87.0
%1
1.9%
22.2
%90
.7%
0.3%
10.6
%92
.4%
$17
1.3%
19.5
%96
.5%
12
-0.1
%4.
0%91
.2%
13.9
%61
.8%
93.4
%
-8.8
%-4
.5%
85.8
%
6.3%
19.7
%96
.2%
-5.0
%-3
.1%
71.8
%
0.2%
14.6
%99
.8%
4.2%
-12.
0%56
.7%
8.6%
110.
0%94
.7%
2.1%
22.1
%87
.8%
3
0.8%
12.6
%92
.9%
-3.6
%2.
3%85
.9%
$14
-5.1
%4.
5%85
.6%
7
-3.4
%-1
.5%
88.9
%7
-4.6
%34
.2%
83.2
%1
-1.8
%6.
8%90
.9%
1
-1.7
%47
.3%
95.4
%
8.7%
27.2
%92
.4%
-1.7
%17
.2%
88.9
%4
-3.4
%6.
8%88
.9%
1
Mar
ket S
tatis
tics
Sto
ck
Pri
ce30
$65.
51
e R
oast
ers,
Inc.
75.2
2
15.9
9
14.0
6
any,
Inc.
6.01
Mea
n
Med
ian
S any
$40.
11
81.7
9
roup
, Inc
.45
.93
nal L
td.
72.6
5
7.68
orp.
17.4
7
7.80
nc.
86.7
3
5.00
0.63
Mea
n
Med
ian
v S
A/N
V$8
8.90
47.9
1
28.5
7
ny, L
imite
d15
.66
ratio
n67
.55
nc.
52.1
2
nc.
8.24
Mea
n
Med
ian
As
of J
une
30, 2
013
($ in
milli
ons,
exc
ept p
er s
hare
dat
a)
Tic
ker
Com
pany
CO
FFEE
SB
UX
Sta
rbuc
ks C
orpo
ratio
n
GM
CR
Gre
en M
ount
ain
Cof
fee
EN
XTA
M:D
ED
.E M
aste
r Ble
nder
s
FAR
MFa
rmer
Bro
ther
s C
o.
JVA
Cof
fee
Hol
ding
Com
pa
NO
N-A
LCO
HO
LIC
BEV
ERAG
ESK
OTh
e C
oca-
Col
a C
ompa
PE
PP
epsi
co, I
nc.
DP
SD
r Pep
per S
napp
le G
r
SO
DA
Sod
aStre
am In
tern
atio
n
LSE
:BA
GA
.G.B
arr p
.l.c.
FIZZ
Nat
iona
l Bev
erag
e C
o
BC
BC
ott C
orpo
ratio
n
LAS
.ALa
sson
de In
dust
ries
In
RE
ED
RE
ED
S, I
nc.
JSD
AJo
nes
Sod
a C
o.
ALC
OH
OLI
C B
EVER
AGES
AB
IA
nheu
ser-B
usch
InB
ev
LSE
:SA
BS
AB
Mille
r plc
DG
ED
iage
o pl
c
TSE
:250
3K
irin
Hol
ding
s C
ompa
n
BF.
BB
row
n-Fo
rman
Cor
por
STZ
Con
stel
latio
n B
rand
s In
BR
EW
Cra
ft B
rew
Allia
nce,
In

17
Inst
.
Mul
tiple
Ow
ners
hip
Div
iden
d
E20
14E
(% o
f Tot
al)
Yie
ld (%
)
x8.
0x93
.1%
2.2%
x13
.9x
46.3
%1.
5%
x12
.0x
86.1
%0.
0%
x20
.9x
66.1
%6.
0%
x13
.7x
72.9
%2.
4%
x12
.9x
76.1
%1.
8%
x9.
9x79
.3%
0.7%
x9.
8x22
.3%
0.0%
x12
.7x
99.2
%0.
0%
x7.
3x12
.6%
0.0%
x10
.9x
20.2
%0.
1%
x9.
0x89
.8%
1.0%
x11
.9x
51.5
%1.
5%
x11
.0x
77.3
%0.
0%
x10
.3x
56.5
%0.
4%
x10
.4x
64.4
%0.
1%
x11
.9x
69.9
%1.
8%
x17
.8x
68.9
%0.
0%
x9.
8x81
.8%
0.0%
x18
.6x
54.0
%2.
3%
AN
/A62
.8%
0.0%
x69
.1x
22.4
%0.
7%
x7.
8xN
M3.
5%
AN
/AN
M0.
0%
x22
.5x
60.0
%1.
0%
x14
.8x
65.9
%0.
4%
Val
uatio
n B
ench
mar
ks
EV/
Rev
.EV
/ EB
ITD
AP
E
LTM
LTM
2013
E20
14E
2013
1.08
x6.
2x5.
9x5.
2x9.
1x
2.76
x9.
2x10
.1x
10.5
x12
.7x
0.79
x6.
5x5.
9x5.
1x14
.3x
0.85
x14
.6x
11.8
x7.
2x36
.5x
1.37
x9.
2x8.
4x7.
0x18
.2x
0.96
x7.
9x8.
0x6.
2x13
.5x
0.31
x5.
9x5.
5x5.
0x11
.4x
0.42
x7.
6x6.
8x6.
0x12
.2x
0.51
x9.
1x8.
4x7.
5x16
.5x
0.56
x8.
6x5.
5x5.
5x6.
9x
0.48
x8.
1xN
/AN
/A12
.4x
0.66
x10
.7x
4.9x
5.0x
8.3x
0.78
x10
.8x
6.3x
5.9x
14.1
x
0.72
x4.
4x3.
9x3.
9x12
.6x
0.55
x8.
2x5.
9x5.
5x11
.8x
0.53
x8.
3x5.
5x5.
5x12
.3x
0.49
x8.
1x8.
6x7.
9x13
.2x
0.32
x14
.2x
8.9x
7.9x
21.3
x
0.35
x12
.9x
7.5x
6.4x
19.9
x
0.74
x13
.9x
12.2
x10
.3x
21.4
x
0.43
x6.
5xN
/AN
/AN
/A
4.23
xN
M35
.1x
37.3
x47
.1x
0.25
x5.
2x5.
1x5.
0x8.
0x
0.37
xN
MN
/AN
/AN
/A
0.90
x10
.1x
12.9
x12
.5x
21.8
x
0.40
x10
.5x
8.8x
7.9x
20.6
x
Net
Deb
t /N
ext 5
Yr
EPS
LTM
EPS
Gro
w
E20
14E
EBIT
DA
Rat
e
95$5
.61
0.1x
15.2
%
633.
324.
4x7.
0%
802.
15N
M17
.0%
320.
56N
M16
.5%
672.
912.
3x13
.9%
712.
732.
3x15
.9%
25$2
.60
0.8x
8.5%
240.
303.
5xN
/A
982.
572.
9x9.
0%
182.
041.
5xN
/A
7524
8.35
NM
N/A
027.
390.
8xN
/A
313.
90N
MN
/A
720.
82N
M10
.0%
6833
.49
1.9x
9.2%
212.
591.
5x9.
0%
11$2
.35
0.4x
N/A
600.
722.
6x8.
0%
551.
116.
8xN
/A
271.
461.
4x13
.0%
/A N
/A2.
6xN
/A
440.
308.
6x35
.0%
110.
12N
M14
.5%
/A N
/A29
.8x
10.4
%
851.
017.
5x16
.2%
580.
912.
6x13
.0%
ics
LTM
EBIT
DA
EBIT
DA
LTM
2013
EM
argi
n20
13
$762
$808
17.2
%$4
.
535
489
29.9
%3.
4449
12.1
%1.
2025
5.8%
0.
340
343
16.3
%2.
290
269
14.7
%2.
$1,7
92$1
,936
5.3%
$2.
2,18
82,
430
5.6%
0.
744
808
5.6%
1.
547
858
6.5%
2.
372
N/A
5.9%
218.
154
339
6.2%
8.
9316
07.
2%3.
4045
16.3
%0.
741
939
7.3%
29.
460
808
6.1%
2.
$213
$201
6.1%
$2.
9815
62.
3%0.
8314
32.
7%0.
3236
5.3%
1.
85N
/A6.
7% N
/
710
9.2%
0.
5051
4.9%
0.
2N
/A0.
3% N
/
7110
04.
7%0.
6797
5.1%
0.
Ope
ratin
g M
etri
arke
tEn
terp
rise
LT
M
Cap
.V
alue
Rev
enue
$4,6
47$4
,761
$4,4
19
2,57
14,
947
1,79
1
356
288
364
328
293
347
1,97
62,
572
1,73
0
1,46
32,
527
1,07
7
$9,1
12$1
0,61
0$3
4,01
8
8,37
716
,533
39,1
37
4,55
16,
759
13,2
21
3,87
04,
706
8,47
9
3,24
13,
003
6,30
0
1,52
91,
655
2,49
0
1,12
11,
003
1,28
8
179
175
243
3,99
75,
556
13,1
47
3,55
63,
855
7,39
0
$1,5
93$1
,724
$3,5
08
1,12
81,
393
4,32
3
507
1,06
93,
059
400
445
601
330
555
1,27
7
276
339
80
271
260
1,03
3
145
204
552
581
749
1,80
4
365
500
1,15
5
% o
f
% C
hang
e52
Wee
kM
a
0 D
ayY
TD
Hig
hC
-3.3
%37
.0%
80.0
%$
0.3%
-12.
1%76
.3%
-10.
6%-2
.4%
77.4
%
30.5
%44
.2%
99.1
%
4.2%
16.7
%83
.2%
-1.5
%17
.3%
78.7
%
2.7%
32.4
%98
.8%
$
-11.
1%-0
.1%
82.4
%
-0.6
%51
.8%
96.4
%
24.9
%10
6.4%
99.7
%
-1.7
%7.
0%92
.3%
-3.8
%39
.7%
92.1
%
4.0%
15.6
%97
.4%
-17.
8%46
.7%
80.1
%
-0.4
%37
.4%
92.4
%
-1.1
%36
.0%
94.4
%
4.1%
5.8%
99.0
%$
34.6
%11
.2%
83.9
%
8.1%
32.4
%97
.2%
-8.5
%7.
9%83
.5%
-4.0
%0.
9%85
.1%
6.7%
6.9%
84.3
%
8.0%
26.5
%97
.4%
-2.9
%-9
.4%
94.1
%
5.8%
10.3
%90
.6%
5.4%
7.4%
89.6
%
Mar
ket S
tatis
tics
Sto
ck
Pri
ce30
R$4
5.14
natio
nal,
Inc.
46.0
0
25.7
6
11.7
8
Mea
n
Med
ian
$25.
68
2.92
32.7
5
atio
n14
.94
2,70
8.00
c.66
.42
.46
.51
8.98
Mea
n
Med
ian
uce
Inc.
$27.
88
nc.
12.7
5
atio
nal I
nc.
10.9
2
27.1
9
30.6
8
20.7
3
0.91
d.1.
24
Mea
n
Med
ian
As
of J
une
30, 2
013
($ in
milli
ons,
exc
ept p
er s
hare
dat
a)
Tic
ker
Com
pany
WEI
GH
T M
ANAG
EMEN
T / O
THE
HLF
Her
balife
Ltd
.
WTW
Wei
ght W
atch
ers
Inte
r n
ME
DM
edifa
st In
c.
NTR
IN
utris
yste
m, I
nc.
PRO
TEIN
STS
NTy
son
Food
s, In
c.
JBS
S3
JBS
S.A
.
SFD
Sm
ithfie
ld F
oods
, Inc
.
PP
CP
ilgrim
's P
ride
Cor
por a
SE
BS
eabo
ard
Cor
p.
SA
FMS
ande
rson
Far
ms,
Inc
CA
LMC
al-M
aine
Foo
ds, I
nc.
OM
EO
meg
a P
rote
in C
orp.
PRO
DU
CE
FDP
Fres
h D
el M
onte
Pro
du
DO
LED
ole
Food
Com
pany
I
CQ
BC
hiqu
ita B
rand
s In
tern
a
CV
GW
Cal
avo
Gro
wer
s In
c.
SE
NE
.AS
enec
a Fo
ods
Cor
p.
LMN
RLi
mon
eira
Com
pany
ISE
:FQ
3Fy
ffes
plc
NZS
E:T
UR
Turn
ers
& G
row
ers
Ltd
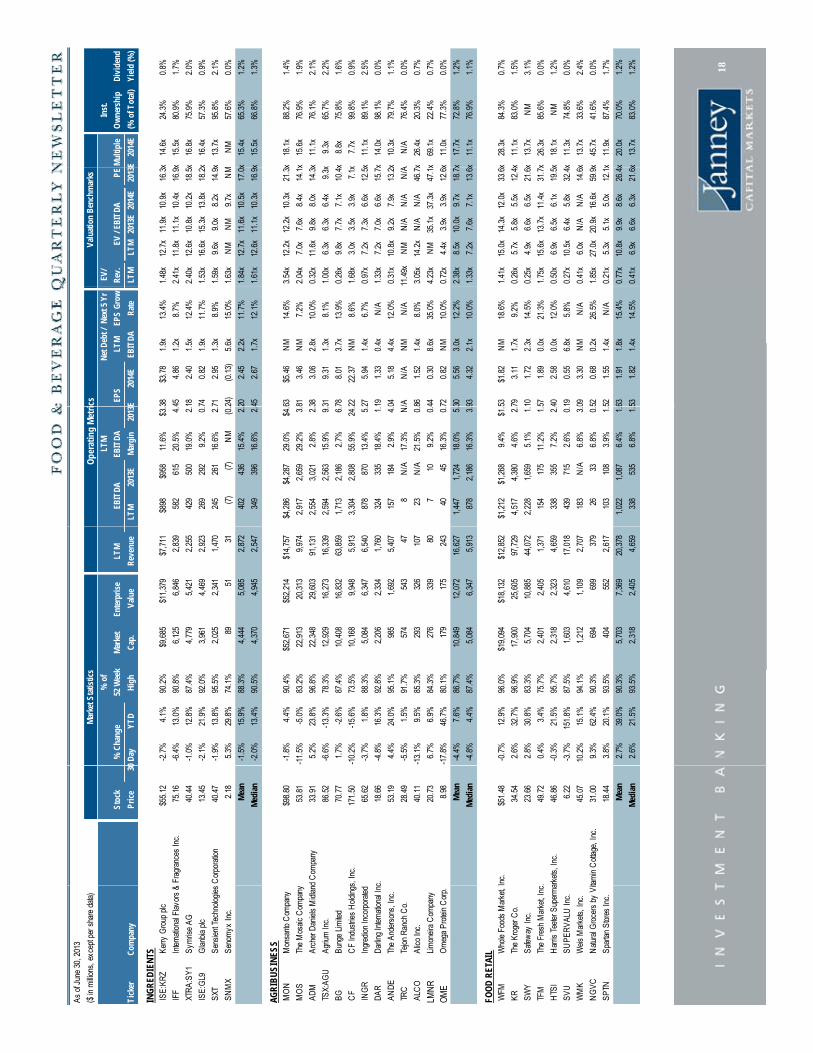
18
Inst
.
Mul
tiple
Ow
ners
hip
Div
iden
d
E20
14E
(% o
f Tot
al)
Yie
ld (%
)
x14
.6x
24.3
%0.
8%
x15
.5x
80.9
%1.
7%
x16
.8x
75.9
%2.
0%
x16
.4x
57.3
%0.
9%
x13
.7x
95.8
%2.
1%
MN
M57
.6%
0.0%
x15
.4x
65.3
%1.
2%
x15
.5x
66.8
%1.
3%
x18
.1x
88.2
%1.
4%
x15
.6x
76.9
%1.
9%
x11
.1x
76.1
%2.
1%
x9.
3x65
.7%
2.2%
x8.
8x75
.8%
1.6%
x7.
7x99
.8%
0.9%
x11
.1x
89.1
%2.
5%
x14
.0x
98.1
%0.
0%
x10
.3x
79.7
%1.
1%
AN
/A76
.4%
0.0%
x26
.4x
20.3
%0.
7%
x69
.1x
22.4
%0.
7%
x11
.0x
77.3
%0.
0%
x17
.7x
72.8
%1.
2%
x11
.1x
76.9
%1.
1%
x28
.3x
84.3
%0.
7%
x11
.1x
83.0
%1.
5%
x13
.7x
NM
3.1%
x26
.3x
85.6
%0.
0%
x18
.1x
NM
1.2%
x11
.3x
74.8
%0.
0%
x13
.7x
33.6
%2.
4%
x45
.7x
41.6
%0.
0%
x11
.9x
87.4
%1.
7%
x20
.0x
70.0
%1.
2%
x13
.7x
83.0
%1.
2%
Val
uatio
n B
ench
mar
ks
EV/
Rev
.EV
/ EB
ITD
AP
E
LTM
LTM
2013
E20
14E
2013
1.48
x12
.7x
11.9
x10
.9x
16.3
x
2.41
x11
.8x
11.1
x10
.4x
16.9
x
2.40
x12
.6x
10.8
x10
.2x
18.5
x
1.53
x16
.6x
15.3
x13
.8x
18.2
x
1.59
x9.
6x9.
0x8.
2x14
.9x
1.63
xN
MN
M9.
7xN
M
1.84
x12
.7x
11.6
x10
.5x
17.0
x
1.61
x12
.6x
11.1
x10
.3x
16.9
x
3.54
x12
.2x
12.2
x10
.3x
21.3
x
2.04
x7.
0x7.
6x8.
4x14
.1x
0.32
x11
.6x
9.8x
8.0x
14.3
x
1.00
x6.
3x6.
3x6.
4x9.
3x
0.26
x9.
8x7.
7x7.
1x10
.4x
1.68
x3.
0x3.
5x3.
9x7.
1x
0.97
x7.
2x7.
3x6.
6x12
.5x
1.33
x7.
2x7.
0x6.
6x15
.7x
0.31
x10
.8x
9.2x
7.9x
13.2
x
11.4
9xN
MN
/AN
/AN
/A
3.05
x14
.2x
N/A
N/A
46.7
x
4.23
xN
M35
.1x
37.3
x47
.1x
0.72
x4.
4x3.
9x3.
9x12
.6x
2.38
x8.
5x10
.0x
9.7x
18.7
x
1.33
x7.
2x7.
6x7.
1x13
.6x
1.41
x15
.0x
14.3
x12
.0x
33.6
x
0.26
x5.
7x5.
8x5.
5x12
.4x
0.25
x4.
9x6.
6x6.
5x21
.6x
1.75
x15
.6x
13.7
x11
.4x
31.7
x
0.50
x6.
9x6.
5x6.
1x19
.5x
0.27
x10
.5x
6.4x
5.8x
32.4
x
0.41
x6.
0xN
/AN
/A14
.6x
1.85
x27
.0x
20.9
x16
.6x
59.9
x
0.21
x5.
3x5.
1x5.
0x12
.1x
0.77
x10
.8x
9.9x
8.6x
26.4
x
0.41
x6.
9x6.
6x6.
3x21
.6x
Net
Deb
t /N
ext 5
Yr
EPS
LTM
EPS
Gro
w
E20
14E
EBIT
DA
Rat
e
38$3
.78
1.9x
13.4
%
454.
861.
2x8.
7%
182.
401.
5x12
.4%
740.
821.
9x11
.7%
712.
951.
3x8.
9%
24)
(0.1
3)5.
6x15
.0%
202.
452.
2x11
.7%
452.
671.
7x12
.1%
63$5
.46
NM
14.6
%
813.
46N
M7.
2%
383.
062.
8x10
.0%
319.
311.
3x8.
1%
788.
013.
7x13
.9%
2222
.37
NM
8.6%
275.
941.
4x6.
7%
191.
330.
4xN
/A
045.
184.
4x12
.0%
/A N
/AN
MN
/A
861.
521.
4x8.
0%
440.
308.
6x35
.0%
720.
82N
M10
.0%
305.
563.
0x12
.2%
934.
322.
1x10
.0%
53$1
.82
NM
18.6
%
793.
111.
7x9.
2%
101.
722.
3x14
.5%
571.
890.
0x21
.3%
402.
580.
0x12
.0%
190.
556.
8x5.
8%
093.
30N
MN
/A
520.
680.
2x26
.5%
521.
551.
4xN
/A
631.
911.
8x15
.4%
531.
821.
4x14
.5%
ics
LTM
EBIT
DA
EBIT
DA
LTM
2013
EM
argi
n20
13
$898
$958
11.6
%$3
.
582
615
20.5
%4.
429
500
19.0
%2.
269
292
9.2%
0.
245
261
16.6
%2.
(7)
(7)
NM
(0.
402
436
15.4
%2.
349
396
16.6
%2.
$4,2
86$4
,287
29.0
%$4
.
2,91
72,
659
29.2
%3.
2,55
43,
021
2.8%
2.
2,59
42,
563
15.9
%9.
1,71
32,
186
2.7%
6.
3,30
42,
808
55.9
%24
.
878
870
13.4
%5.
324
335
18.4
%1.
157
184
2.9%
4.
8N
/A17
.3%
N/
23N
/A21
.5%
0.
710
9.2%
0.
4045
16.3
%0.
1,44
71,
724
18.0
%5.
878
2,18
616
.3%
3.
$1,2
12$1
,268
9.4%
$1.
4,51
74,
380
4.6%
2.
2,22
81,
659
5.1%
1.
154
175
11.2
%1.
338
355
7.2%
2.
439
715
2.6%
0.
183
N/A
6.8%
3.
2633
6.8%
0.
103
108
3.9%
1.
1,02
21,
087
6.4%
1.
338
535
6.8%
1.
Ope
ratin
g M
etri
arke
tEn
terp
rise
LT
M
Cap
.V
alue
Rev
enue
$9,6
85$1
1,37
9$7
,711
6,12
56,
846
2,83
9
4,77
95,
421
2,25
5
3,96
14,
469
2,92
3
2,02
52,
341
1,47
0
8951
31
4,44
45,
085
2,87
2
4,37
04,
945
2,54
7
52,6
71$5
2,21
4$1
4,75
7
22,9
1320
,313
9,97
4
22,3
4829
,603
91,1
31
12,9
2916
,273
16,3
39
10,4
0816
,832
63,8
59
10,1
689,
948
5,91
3
5,08
46,
347
6,54
0
2,20
62,
334
1,76
0
985
1,69
25,
407
574
543
47
293
326
107
276
339
80
179
175
243
10,8
4912
,072
16,6
27
5,08
46,
347
5,91
3
19,0
94$1
8,13
2$1
2,85
2
17,9
0025
,605
97,7
29
5,70
410
,885
44,0
72
2,40
12,
405
1,37
1
2,31
82,
323
4,65
9
1,60
34,
610
17,0
18
1,21
21,
109
2,70
7
694
699
379
404
552
2,61
7
5,70
37,
369
20,3
78
2,31
82,
405
4,65
9
% o
f
% C
hang
e52
Wee
kM
a
0 D
ayY
TD
Hig
hC
-2.7
%4.
1%90
.2%
$
-6.4
%13
.0%
90.8
%
-1.0
%12
.8%
87.4
%
-2.1
%21
.9%
92.0
%
-1.9
%13
.8%
95.5
%
5.3%
29.8
%74
.1%
-1.5
%15
.9%
88.3
%
-2.0
%13
.4%
90.5
%
-1.8
%4.
4%90
.4%
$5
-11.
5%-5
.0%
83.2
%2
5.2%
23.8
%96
.8%
2
-6.6
%-1
3.3%
78.3
%1
1.7%
-2.6
%87
.4%
1
-10.
2%-1
5.6%
73.5
%1
-3.7
%1.
8%88
.3%
-4.8
%16
.3%
92.8
%
4.4%
24.0
%95
.1%
-5.5
%1.
5%91
.7%
-13.
1%9.
5%85
.3%
6.7%
6.9%
84.3
%
-17.
8%46
.7%
80.1
%
-4.4
%7.
6%86
.7%
1
-4.8
%4.
4%87
.4%
-0.7
%12
.9%
96.0
%$ 1
2.6%
32.7
%96
.9%
1
2.8%
30.8
%83
.3%
0.4%
3.4%
75.7
%
-0.3
%21
.5%
95.7
%
-3.7
%15
1.8%
87.5
%
10.2
%15
.1%
94.1
%
9.3%
62.4
%90
.3%
3.8%
20.1
%93
.5%
2.7%
39.0
%90
.3%
2.6%
21.5
%93
.5%
Mar
ket S
tatis
tics
Sto
ck
Pri
ce3 0
$55.
12
Fra
gran
ces
Inc.
75.1
6
40.4
4
13.4
5
Cor
pora
tion
40.4
7
2.18
Mea
n
Med
ian
$98.
80
53.8
1
d C
ompa
ny33
.91
86.5
2
70.7
7
s, In
c.17
1.50
65.6
2
c.18
.66
53.1
9
28.4
9
40.1
1
20.7
3
8.98
Mea
n
Med
ian
Inc.
$51.
48
34.5
4
23.6
6
.49
.72
arke
ts, I
nc.
46.8
6
6.22
45.0
7
tam
in C
otta
ge, I
nc.
31.0
0
18.4
4
Mea
n
Med
ian
As
of J
une
30, 2
013
($ in
milli
ons,
exc
ept p
er s
hare
dat
a)
Tic
ker
Com
pany
ING
RED
IEN
TSIS
E:K
RZ
Ker
ry G
roup
plc
IFF
Inte
rnat
iona
l Fla
vors
&
XTR
A:S
Y1
Sym
rise
AG
ISE
:GL9
Gla
nbia
plc
SXT
Sen
sien
t Tec
hnol
ogie
s
SN
MX
Sen
omyx
Inc.
AGR
IBU
SIN
ESS
MO
NM
onsa
nto
Com
pany
MO
STh
e M
osai
c C
ompa
ny
AD
MA
rche
r Dan
iels
Mid
lan d
TSX:
AG
UA
griu
m In
c.
BG
Bun
ge L
imite
d
CF
CF
Indu
strie
s H
oldi
ngs
ING
RIn
gred
ion
Inco
rpor
ated
DA
RD
arlin
g In
tern
atio
nal I
nc
AN
DE
The
And
erso
ns, I
nc.
TRC
Tejo
n R
anch
Co.
ALC
OA
lico
Inc.
LMN
RLi
mon
eira
Com
pany
OM
EO
meg
a P
rote
in C
orp.
FOO
D R
ETAI
LW
FMW
hole
Foo
ds M
arke
t,
KR
The
Kro
ger C
o.
SW
YS
afew
ay In
c.
TFM
The
Fres
h M
arke
t, In
c
HTS
IH
arris
Tee
ter S
uper
ma
SV
US
UP
ER
VA
LU In
c.
WM
KW
eis
Mar
kets
, Inc
.
NG
VC
Nat
ural
Gro
cers
by
Vit
SP
TNS
parta
n S
tore
s In
c.

19
Inst
.
Mul
tiple
Ow
ners
hip
Div
iden
d
E20
14E
(% o
f Tot
al)
Yie
ld (%
)
x15
.8x
83.7
%3.
1%
x20
.5x
96.0
%0.
0%
x13
.7x
90.4
%1.
2%
x15
.7x
62.3
%0.
0%
x10
.6x
87.7
%2.
8%
x15
.2x
84.0
%1.
4%
x15
.7x
87.7
%1.
2%
x16
.0x
65.6
%3.
1%
x23
.7x
76.7
%1.
2%
x18
.3x
81.6
%1.
9%
x17
.3x
69.9
%1.
8%
x30
.0x
13.4
%1.
2%
x23
.8x
97.6
%1.
8%
x21
.2x
94.3
%1.
3%
x25
.4x
56.7
%2.
4%
x17
.9x
96.3
%0.
0%
x18
.9x
71.7
%0.
0%
x24
.8x
74.4
%0.
0%
x22
.2x
87.3
%0.
0%
x17
.2x
86.1
%0.
0%
x13
.4x
NM
2.1%
x21
.2x
52.5
%0.
0%
x26
.4x
39.9
%0.
0%
x24
.6x
30.4
%0.
0%
MN
M67
.5%
0.0%
AN
/A26
.3%
0.0%
AN
/A1.
8%0.
0%
AN
/A0.
0%0.
3%
MN
M9.
2%0.
0%
AN
/A9.
3%9.
9%
x21
.3x
54.9
%1.
2%
x21
.2x
66.5
%0.
0%
Val
uatio
n B
ench
mar
ks
EV/
Rev
.EV
/ EB
ITD
AP
E
LTM
LTM
2013
E20
14E
2013
0.52
x9.
1x9.
3x8.
5x17
.9x
0.49
x13
.1x
11.8
x10
.3x
23.1
x
0.11
x9.
1x6.
8x6.
2x16
.2x
0.95
x14
.1x
10.2
x9.
1x18
.3x
0.14
x6.
0x6.
4x6.
1x11
.6x
0.44
x10
.3x
8.9x
8.0x
17.4
x
0.49
x9.
1x9.
3x8.
5x17
.9x
3.50
x9.
8x9.
4x8.
8x17
.5x
3.42
x18
.5x
15.3
x13
.0x
28.8
x
2.55
x12
.3x
12.2
x10
.3x
22.4
x
2.83
x12
.0x
11.4
x10
.6x
19.2
x
5.38
x14
.3x
14.7
x13
.4x
38.3
x
9.33
x19
.9x
16.9
x15
.3x
28.2
x
2.78
x15
.5x
14.1
x13
.0x
24.3
x
1.32
x9.
7x9.
3x8.
8x29
.1x
1.38
x9.
5x8.
8x8.
1x22
.7x
1.12
x11
.2x
10.8
x9.
7x21
.7x
2.44
x20
.8x
18.3
x16
.0x
27.6
x
4.91
x15
.8x
14.7
x12
.8x
25.8
x
2.32
x9.
5x9.
4x8.
8x20
.2x
1.29
x6.
2x6.
1x5.
9x14
.4x
0.98
x17
.8x
11.3
x8.
7x37
.0x
0.69
x10
.1x
8.9x
8.3x
38.4
x
2.91
x15
.8x
N/A
N/A
28.2
x
0.46
x15
.7x
7.8x
5.9x
NM
1.15
xN
MN
/AN
/AN
/A
3.62
x8.
7xN
/AN
/AN
/A
0.48
x11
.0x
N/A
N/A
N/A
0.37
xN
MN
M5.
6xN
M
2.11
x23
.2x
N/A
N/A
N/A
2.49
x13
.7x
11.7
x10
.2x
26.1
x
2.32
x12
.3x
11.3
x9.
3x25
.8x
Net
Deb
t /N
ext 5
Yr
EPS
LTM
EPS
Gro
w
3E20
14E
EBIT
DA
Rat
e
90$2
.17
1.0x
7.7%
342.
640.
8x15
.0%
924.
650.
4x14
.0%
941.
103.
7x19
.3%
902.
083.
6xN
/A
202.
531.
9x14
.0%
902.
171.
0x14
.5%
66$6
.18
NM
9.1%
272.
77N
M19
.3%
093.
800.
9x12
.1%
813.
120.
6x10
.5%
510.
653.
8x15
.7%
521.
805.
3x16
.3%
402.
744.
8x14
.4%
200.
233.
0x15
.8%
732.
191.
7x16
.8%
023.
470.
6x13
.0%
630.
70N
M23
.1%
391.
621.
0x18
.5%
720.
843.
3x15
.0%
863.
062.
0xN
/A
400.
71N
M18
.3%
220.
320.
7x12
.0%
852.
12N
MN
/A
47)
(0.2
3)7.
5x5.
0%
N/A
N/A
1.8x
N/A
N/A
N/A
1.2x
N/A
N/A
N/A
7.2x
N/A
05)
(0.7
5)0.
4xN
/A
N/A
N/A
NM
N/A
571.
862.
7x14
.7%
521.
801.
8x15
.3%
ics
LTM
EBIT
DA
EBIT
DA
LTM
2013
EM
argi
n20
1 3
$2,5
01$2
,441
5.7%
$1.
216
240
3.7%
2.
8411
31.
2%3.
3548
6.8%
0.
111
105
2.3%
1.
589
590
3.9%
2.
111
113
3.7%
1.
$9,9
29$1
0,36
135
.7%
$5.
2,59
03,
140
18.5
%2.
2,72
82,
760
20.7
%3.
728
764
23.7
%2.
648
631
37.6
%0.
313
368
46.9
%1.
307
338
17.9
%2.
343
357
13.6
%0.
224
242
14.5
%1.
136
141
9.9%
3.
5360
11.7
%0.
5862
31.1
%1.
131
132
24.4
%0.
170
173
20.9
%2.
1320
5.5%
0.
2529
6.9%
0.
13N
/A18
.5%
1.
1836
2.9%
(0.
1N
/A2.
4%N
3N
/A41
.5%
N
4N
/A0
N
(8)
(4)
NM
(1.
0N
/A9.
1%N
801
1,08
919
.0%
1.
131
207
18.2
%1.
Ope
ratin
g M
etri
arke
tEn
terp
rise
LT
M
Cap
.V
alue
Rev
enue
20,2
73$2
2,73
6$4
3,85
6
2,66
32,
825
5,76
6
728
764
6,97
9
364
496
522
271
667
4,84
5
4,86
05,
498
12,3
93
728
764
5,76
6
99,2
52$9
7,38
3$2
7,79
4
49,0
4747
,905
14,0
23
30,9
4133
,548
13,1
61
8,26
48,
715
3,07
8
6,82
79,
274
1,72
4
4,56
56,
230
668
3,27
14,
751
1,71
1
2,29
33,
320
2,51
6
1,74
82,
128
1,54
2
1,42
41,
527
1,36
7
1,14
31,
092
448
858
915
186
813
1,23
953
5
705
1,04
981
2
249
226
231
239
257
372
233
207
71
148
282
610
4648
42
2327
7
1748
99
1416
44
65
2
9,22
39,
574
3,08
9
858
1,09
261
0
% o
f
% C
hang
e52
Wee
kM
a
0 D
ayY
TD
Hig
hC
1.1%
7.9%
95.9
%$2
2.0%
0.7%
88.1
%
7.3%
34.1
%99
.0%
-8.9
%8.
8%81
.6%
1.3%
3.4%
89.4
%
0.6%
11.0
%90
.8%
1.3%
7.9%
89.4
%
2.5%
12.2
%95
.5%
$9
3.8%
22.2
%97
.1%
4
2.3%
4.4%
92.8
%3
1.2%
9.9%
96.7
%
5.6%
18.7
%89
.8%
8.1%
29.1
%98
.4%
-1.9
%33
.5%
95.0
%
-2.0
%24
.0%
93.6
%
7.7%
37.4
%99
.3%
1.5%
19.0
%97
.2%
0.8%
86.0
%93
.4%
-1.4
%37
.5%
96.3
%
10.9
%39
.8%
95.7
%
2.5%
23.7
%96
.7%
-0.1
%33
.3%
85.3
%
-0.4
%26
.3%
96.4
%
2.2%
55.0
%94
.9%
13.3
%8.
0%94
.7%
18.9
%67
.1%
62.4
%
13.6
%57
.7%
97.5
%
2.0%
20.0
%89
.5%
-6.3
%-6
1.7%
33.3
%
1.2%
32.3
%91
.7%
3.7%
27.6
%90
.6%
2.2%
26.3
%95
.0%
Mar
ket S
tatis
tics
Sto
ck
Pri
ce3 0
ON
$34.
16
Inc.
53.9
9
ompa
ny, I
nc.
63.5
0
e, In
c.17
.20
22.0
1
Mea
n
Med
ian
CE
$99.
00
65.5
1
69.3
4
53.9
7
e, In
c.19
.51
, Inc
.42
.82
58.1
5
ny5.
83
39.2
9
nal I
nc.
65.3
7
nuts
, Inc
.17
.45
35.9
4
14.5
5
c.41
.04
14.9
3
8.45
52.2
5
oup,
Inc.
6.46
nc.
5.73
1.17
roup
Inc.
3.06
nc.
1.19
0.82
Mea
n
Med
ian
As
of J
une
30, 2
013
($ in
milli
ons,
exc
ept p
er s
hare
dat
a)
Tic
ker
Com
pany
FOO
D S
ERVI
CE
/ DIS
TRIB
UTI
OS
YY
Sys
co C
orpo
ratio
n
UN
FIU
nite
d N
atur
al F
oods
,
CO
RE
Cor
e-M
ark
Hol
ding
Co
CH
EF
The
Che
fs' W
areh
ouse
NA
FCN
ash
Finc
h C
o.
RES
TAU
RAN
T - Q
UIC
K S
ERVI
CM
CD
McD
onal
d's
Cor
p.
SB
UX
Sta
rbuc
ks C
orpo
ratio
n
YU
MY
um! B
rand
s, In
c.
THI
Tim
Hor
tons
Inc.
BK
WB
urge
r Kin
g W
orld
wid
e
DN
KN
Dun
kin'
Bra
nds
Gro
up
DP
ZD
omin
o's
Piz
za, I
nc.
WE
NTh
e W
endy
's C
ompa
n
JAC
KJa
ck in
the
Box
Inc.
PZZ
AP
apa
John
's In
tern
atio
n
KK
DK
rispy
Kre
me
Dou
ghn
AFC
EA
FC E
nter
pris
es In
c.
SO
NC
Son
ic C
orp.
CE
CC
EC
Ent
erta
inm
ent I
nc
JMB
AJa
mba
, Inc
.
LUB
Luby
's, I
nc.
NA
THN
atha
n's
Fam
ous
Inc.
TAS
TC
arro
ls R
esta
uran
t Gro
PZZ
IP
izza
Inn
Hol
ding
s, In
NR
OM
Nob
le R
oman
's In
c.
MH
GU
Mer
itage
Hos
pita
lity G
CR
MB
Cru
mbs
Bak
e S
hop,
I
BA
BB
BA
B, I
nc.

20
Inst
.
Mul
tiple
Ow
ners
hip
Div
iden
d
E20
14E
(% o
f Tot
al)
Yie
ld (%
)
x28
.4x
NM
0.0%
x22
.7x
85.9
%0.
0%
M69
.3x
36.3
%0.
0%
x35
.5x
83.3
%0.
0%
x13
.4x
30.8
%2.
9%
M23
.2x
21.7
%0.
0%
x32
.1x
51.6
%0.
5%
x25
.8x
36.3
%0.
0%
x16
.1x
82.4
%4.
0%
x18
.5x
21.5
%0.
0%
x13
.5x
NM
2.0%
x15
.8x
63.9
%3.
0%
x16
.9x
98.6
%1.
1%
x22
.2x
NM
0.0%
x18
.9x
99.3
%2.
0%
x16
.0x
82.5
%4.
2%
x15
.5x
85.9
%2.
1%
x25
.6x
98.9
%0.
0%
x21
.5x
NM
0.0%
x45
.8x
80.6
%0.
0%
x34
.7x
66.5
%0.
0%
x22
.5x
87.2
%0.
0%
x14
.7x
91.3
%0.
0%
x19
.6x
45.8
%0.
0%
x21
.1x
32.0
%0.
0%
x17
.4x
71.3
%1.
3%
x16
.6x
78.9
%0.
0%
x21
.0x
36.3
%0.
0%
x22
.1x
37.8
%0.
0%
x17
.5x
56.9
%3.
4%
x10
.6x
25.7
%4.
9%
x20
.2x
67.2
%1.
2%
x18
.5x
75.1
%0.
0%
Val
uatio
n B
ench
mar
ks
EV/
Rev
.EV
/ EB
ITD
AP
E
LTM
LTM
2013
E20
14E
2013
3.66
x18
.5x
16.8
x14
.3x
34.4
x
2.35
x13
.4x
11.8
x10
.4x
26.4
x
3.69
x33
.6x
26.4
x21
.9x
NM
1.95
x16
.5x
14.7
x12
.6x
44.3
x
0.86
x7.
8x6.
9x6.
7x15
.4x
0.30
xN
MN
/A2.
5xN
M
2.13
x18
.0x
15.3
x11
.4x
30.1
x
2.15
x16
.5x
14.7
x11
.5x
30.4
x
1.08
x8.
9x8.
8x8.
3x16
.5x
1.07
x12
.5x
10.0
x9.
0x22
.0x
1.20
x8.
7x8.
1x7.
3x15
.6x
0.98
x9.
5x9.
4x8.
6x17
.8x
1.16
x9.
2x8.
7x7.
9x19
.3x
1.68
x12
.0x
9.9x
8.1x
27.1
x
1.32
x10
.2x
9.6x
8.6x
21.5
x
3.40
x9.
6x10
.4x
10.1
x18
.0x
0.92
x8.
0x7.
9x7.
4x17
.9x
1.38
x11
.8x
10.5
x8.
8x31
.1x
0.88
x8.
7x8.
1x7.
3x24
.9x
3.45
x28
.0x
24.0
x19
.7x
55.8
x
0.65
x8.
4xN
/AN
/A32
.3x
0.63
x9.
2x8.
1x7.
7x32
.2x
1.45
x8.
8x8.
7x8.
3x16
.9x
1.99
x12
.9x
11.1
x9.
6x22
.5x
1.09
x11
.3x
9.1x
7.0x
27.5
x
1.16
x9.
7x10
.0x
9.3x
19.7
x
0.88
x7.
9x7.
5x6.
7x19
.5x
0.89
x11
.9x
9.7x
8.3x
28.1
x
0.97
x8.
6x9.
1x7.
1x27
.0x
0.54
x5.
2xN
/AN
/A15
.8x
0.53
x5.
4xN
/AN
/A11
.5x
1.27
x10
.3x
9.9x
8.7x
23.5
x
1.08
x9.
2x9.
3x8.
3x21
.5x
Net
Deb
t /N
ext 5
Yr
EPS
LTM
EPS
Gro
w
3E20
14E
EBIT
DA
Rat
e
60$1
2.83
NM
20.4
%
048.
18N
M18
.0%
440.
532.
9xN
/A
780.
973.
2x20
.0%
921.
062.
6x16
.3%
08)
0.10
6.6x
13.0
%
283.
943.
8x17
.5%
851.
023.
1x18
.0%
06$3
.13
2.5x
8.7%
131.
353.
6x17
.7%
522.
931.
6x14
.4%
325.
991.
3x10
.0%
172.
48N
M14
.2%
634.
43N
M18
.6%
161.
32N
M14
.0%
834.
304.
7x7.
1%
623.
031.
0x12
.0%
191.
45N
M18
.8%
212.
570.
8x13
.4%
690.
840.
1x25
.7%
6911
.82
NM
N/A
290.
413.
1x8.
5%
330.
382.
2x17
.3%
951.
09N
M19
.0%
690.
900.
8x20
.0%
610.
700.
8x12
.8%
911.
070.
4x16
.3%
560.
741.
5x11
.0%
430.
53N
M14
.0%
181.
070.
7x9.
0%
852.
000.
0xN
/A
172.
371.
6x14
.4%
181.
351.
2x14
.0%
ics
LTM
EBIT
DA
EBIT
DA
LTM
2013
EM
argi
n20
1 3
$581
$640
19.8
%$1
0.
386
437
17.6
%7.
3443
11.0
%0.
6169
11.8
%0.
4753
11.1
%0.
(2)
N/A
NM
(0.
185
248
14.2
%3.
5469
11.8
%0.
$1,0
37$1
,050
12.1
%$3
.
346
432
8.6%
1.
390
422
13.7
%2.
274
276
10.3
%5.
231
246
12.6
%2.
153
185
14.0
%3.
168
178
13.0
%1.
272
250
35.5
%3.
184
187
11.5
%2.
8596
11.6
%1.
100
106
10.1
%2.
2226
12.3
%0.
57N
/A7.
7%12
.
9010
16.
9%0.
7979
16.6
%0.
3845
15.4
%0.
4657
9.6%
0.
4847
11.9
%0.
4649
11.2
%0.
1114
7.4%
0.
1110
11.3
%0.
21N
/A10
.3%
1.
13N
/A9.
8%1.
162
193
12.3
%2.
8510
411
.5%
1.
Ope
ratin
g M
etri
arke
tEn
terp
rise
LT
M
Cap
.V
alue
Rev
enue
11,2
47$1
0,76
3$2
,943
5,48
15,
157
2,19
3
1,05
11,
150
312
812
1,01
051
7
246
369
428
4028
95
3,14
63,
080
1,08
1
932
1,08
047
3
$6,5
77$9
,200
$8,5
52
3,06
44,
317
4,02
4
2,78
23,
401
2,84
4
2,25
22,
610
2,67
1
2,15
92,
128
1,83
6
1,84
31,
833
1,09
4
1,74
81,
714
1,29
8
1,33
32,
609
768
1,29
01,
484
1,60
9
1,04
51,
004
729
781
864
984
625
627
182
589
482
742
548
822
1,30
7
516
692
476
509
495
249
484
521
480
432
469
406
349
366
414
119
137
154
100
9295
9410
920
2
6972
136
1,27
41,
567
1,35
9
625
822
742
% o
f
% C
hang
e52
Wee
kM
a
0 D
ayY
TD
Hig
hC
0.9%
22.5
%90
.1%
$1
-3.1
%17
.1%
95.5
%
N/A
N/A
92.6
%
-3.4
%12
4.3%
88.5
%
1.4%
16.3
%76
.4%
7.8%
-29.
3%56
.1%
0.7%
30.2
%83
.2%
0.9%
17.1
%89
.3%
-2.5
%12
.0%
87.1
%$
7.0%
59.1
%95
.4%
0.6%
27.2
%94
.1%
5.8%
47.3
%94
.7%
4.9%
28.1
%98
.5%
2.4%
34.9
%97
.3%
5.8%
48.9
%97
.9%
-4.9
%2.
8%87
.8%
1.8%
16.9
%96
.9%
-1.2
%12
.8%
81.3
%
5.1%
56.4
%95
.4%
10.0
%71
.6%
93.6
%
2.0%
5.2%
98.6
%
-0.2
%17
.4%
93.8
%
-6.8
%15
.2%
90.1
%
15.2
%37
.3%
98.4
%
3.1%
45.2
%92
.0%
7.8%
66.0
%94
.7%
-1.0
%32
.7%
93.3
%
29.8
%69
.6%
98.9
%
14.3
%34
.7%
99.7
%
11.5
%0.
9%55
.7%
-1.9
%25
.5%
96.1
%
4.7%
33.4
%92
.7%
3.1%
32.7
%94
.7%
Mar
ket S
tatis
tics
Sto
ck
Pri
ce30
l, In
c.$3
64.3
5
185.
94
36.7
5
up, I
nc.
34.3
6
rant
Gro
up, I
nc.
14.2
0
2.20
Mea
n
Med
ian
NG nc
.$5
0.48
24.8
8
nc.
39.4
3
ount
ry S
tore
, Inc
.94
.66
ory
Inco
rpor
ated
41.8
9
c.98
.24
c.25
.02
68.8
7
c.46
.98
37.1
0
urge
rs In
c.55
.18
38.3
4
410.
40
9.23
5.62
nt G
roup
, Inc
.21
.41
p, In
c.18
.87
up In
c.12
.07
t Gro
up, I
nc.
17.8
2
mer
ica
Inc.
15.5
9
11.7
2
nc.
18.6
6
21.1
5
Mea
n
Med
ian
As
of J
une
30, 2
013
($ in
milli
ons,
exc
ept p
er s
hare
dat
a)
Tic
ker
Com
pany
RES
TAU
RAN
T - F
AST
CAS
UAL
CM
GC
hipo
tle M
exic
an G
rill
PN
RA
Pan
era
Bre
ad C
o.
ND
LSN
oodl
es &
Com
pany
FRG
IFi
esta
Res
taur
ant G
rou
BA
GL
Ein
stei
n N
oah
Res
taur
CO
SI
Cos
i Inc
.
RES
TAU
RAN
T - C
ASU
AL D
ININ
DR
ID
arde
n R
esta
uran
ts, I
n
BLM
NB
loom
in' B
rand
s, In
c.
EA
TB
rinke
r Int
erna
tiona
l, I n
CB
RL
Cra
cker
Bar
rel O
ld C
o
CA
KE
The
Che
esec
ake
Fact
o
BW
LDB
uffa
lo W
ild W
ings
Inc
TXR
HTe
xas
Roa
dhou
se, I
nc
DIN
Din
eEqu
ity, I
nc.
BO
BE
Bob
Eva
ns F
arm
s, In
c
BJR
IB
J's
Res
taur
ants
, Inc
.
RR
GB
Red
Rob
in G
ourm
et B
CH
UY
Chu
y's
Hol
ding
s, In
c.
BH
Big
lari
Hol
ding
s In
c.
RT
Rub
y Tu
esda
y, In
c.
DE
NN
Den
ny's
Cor
pora
tion
DFR
GD
el F
risco
's R
esta
ura n
IRG
Igni
te R
esta
uran
t Gro
u
RU
THR
uth'
s H
ospi
tality
Gro
u
BB
RG
Bra
vo B
rio R
esta
uran
t
DA
VE
Fam
ous
Dav
e's
of A
m
KO
NA
Kon
a G
rill I
nc.
FRS
Fris
ch's
Res
taur
ants
, I
AR
KR
Ark
Res
taur
ants
Cor
p.

Jonathon Feeney, CFA, Managing Director Food & Beverage, Food Retail
Annie‘s BNNY
F O O D & B E V E R A G E E Q U I T Y R E S E A R C H T E A MMark Kalinowski, DirectorRestaurants
Chipotle Mexican Group CMG
Calavo Growers CVGW
Campbell Soup CPB
Chiquita Brands CQB
Conagra Foods CAG
Dean Foods DF
Diamond Foods DMND
Dole Food Company, Inc. DOLE
Crumbs Bake Shop CRMB
Darden Restaurants DRI
DineEquity DIN
Domino’s Pizza DPZ
Dunkin Brands DNKN
Krispy Kreme Doughnuts KKD
McDonald’s Corp. MCDFlowers Foods FLO
Fresh Del Monte FDP
General Mills GIS
Green Mountain Coffee Roasters GMCR
H J Heinz Co. HNZ
Hershey HSY
Hormel Foods HRL
Papa John’s International PZZA
Starbucks Corp. SBUX
The Cheesecake Factory CAKE
Wendy’s WEN
Yum! Brands YUM
Select Industry ResearchInventure Foods SNAK
J & J Snack Foods JJSF
Kellogg K
Kraft Foods Group KRFT
Limoneira Company LMNR
McCormick & Co. MKC
Mondelez International MDLZ
Select Industry Research
In addition to coverage reports our analysts have published the followingindustry sector reports, which may be available upon request.
Report Title Date
Feeney’s Food Cost Factor 7/22/2013
Burger Sector Sales Hit by a Sharknado in the Last Week of June 7/16/2013
Pepsico Inc. PEP
Pinnacle Foods PF
Senomyx, Inc. SNMX
Snyders-Lance LNCE
Hain Celestial Group HAIN
J.M. Smucker Company SJM
TreeHouse Foods THS
Restaurants: Same Store Sales Trend Commentary 7/02/2013
Casual Dining Same Store Sales Remain in Negative Territory 6/28/2013
Checking Out Staples Trends: IRI Quick Takes 6/27/2013
Q2 Looks OK on Lower Costs, Limited Visibility to ‘14 6/20/2013
Chain Casual Dining Comps -2.4% for Week Ended June 2 6/12/2013
Gauging the Amazon Grocery Effect 6/11/2013
Banana, Avocado Trends Improving 6/07/2013
Sweets & Snacks Expo Takeaways 5/24/2013
Chain Casual Dining String of Positive Comp Weeks Ends 4/23/2013
Evaluating EV/Gross Profit Recasts Food Valuations 4/12/2013
21
Checking Out Food Trends – IRI Quick Takes 4/04/2013

Sources:1. Capital IQ
2. Bloomberg
3. The Conference Board
4. US Department of Laborp
5. Mortgage Bankers Association, seasonally-adjusted
6. Federal Reserve; shown as a percent of period end loans
7. U.S. Department of Commerce: Bureau of Economic Analysis
8. Janney Research
9. Ipreo
10. IRI for the latest 52 weeks ended June 16, 2013 for Total US MULO Bakery Category
IRI Disclaimer The information supplied by IRI and presented by Janney Montgomery Scott LLC hereunder is based on data believed to be reliable at the timesupplied by IRI but is neither all-inclusive nor guaranteed by IRI. Without limiting the generality of the foregoing, specific data points may varyconsiderably from other information sources. Any opinions expressed herein reflect the judgment of Janney Montgomery Scott LLC at this dateand are subject to change. IRI disclaims liability for any claims, losses or damages of any kind arising from the use of this information.
Established in 1832, Janney Montgomery Scott LLCprovides comprehensive financial advice and superiorservice to individual, corporate and institutionalinvestors. A full-service, financial services firm, Janneyi itt d t idi li t d i th h
M E R G E R S & A C Q U I S I T I O N S
Exclusive SalesAcquisition AdvisoryManagement BuyoutsL d B is committed to providing our clients advice through a
wealth management approach by focusing on the deliveryof strategic financial plans that utilize a variety offinancial products and services best suited to help meettheir financial goals. Janney is equally committed toproviding our corporate and institutional clients objectiveadvice for the successful execution of their uniquebusiness plans. Janney provides advice and service to
Leveraged BuyoutsFairness OpinionsCorporate Defense
P U B L I C O F F E R I N G S
Initial Public OfferingsFollow-on OfferingsHigh-Grade and High-Yield DebtSubordinated Debt
clients through a network of professionals in branchoffices located along the entire east coast. Janney is anindependently operated subsidiary of The Penn MutualLife Insurance Company, the seventh largest mutualinsurance company in the nation, and is a member of theNew York Stock Exchange, Financial Industry Regulatory
Authority and Securities Investor Protection Corporation.
Subordinated DebtConvertible Securities
P R I V A T E P L A C E M E N T S
PIPEsPrivate EquitySenior DebtConvertible SecuritiesPreferred SecuritiesRegistered Direct
22