Embed Size (px)
Citation preview

Selected Financial Data(dollars in millions, except per share amounts)
2015 2014 2013 2012 2011
Results of Operations
Operating revenues $ 131,620 $ 127,079 $ 120,550 $ 115,846 $ 110,875
Operating income 33,060 19,599 31,968 13,160 12,880
Net income attributable to Verizon 17,879 9,625 11,497 875 2,404
Per common share — basic 4.38 2.42 4.01 .31 .85
Per common share — diluted 4.37 2.42 4.00 .31 .85
Cash dividends declared per common share 2.230 2.160 2.090 2.030 1.975
Net income attributable to noncontrolling interests 496 2,331 12,050 9,682 7,794
Financial Position
Total assets $ 244,640 $ 232,616 $ 273,654 $ 222,911 $ 228,194
Debt maturing within one year 6,489 2,735 3,933 4,369 4,849
Long-term debt 103,705 110,536 89,658 47,618 50,303
Employee benefit obligations 29,957 33,280 27,682 34,346 32,957
Noncontrolling interests 1,414 1,378 56,580 52,376 49,938
Equity attributable to Verizon 16,428 12,298 38,836 33,157 35,970
• Significant events affecting our historical earnings trends in 2013 through 2015 are described in “Other Items” in the “Management’s Discussion and Analysis of Financial Condition and
Results of Operations” section.
• 2012 data includes severance, pension and benefit charges, early debt redemption costs and litigation settlement charges. 2011 data includes severance, pension and benefit charges
and early debt redemption costs.
Stock Performance GraphComparison of Five-Year Total Return Among Verizon, S&P 500 Telecommunications Services Index and S&P 500 Stock Index
At December 31,
Data Points in Dollars 2010 2011 2012 2013 2014 2015
Verizon 100.0 118.3 133.9 158.5 157.7 163.2
S&P 500 Telecom Services 100.0 106.3 125.7 140.0 144.2 149.0
S&P 500 100.0 102.1 118.4 156.7 178.1 180.6
The graph compares the cumulative total returns of Verizon, the S&P 500 Telecommunications Services Index, and the S&P 500 Stock Index over a five-year period. It assumes $100 was
invested on December 31, 2010 with dividends being reinvested.
2010 2011 2012 2013 2014 2015
$60
$80
$100
$120
$140
$160
$180
$200
Verizon
S&P 500 Telecom Services
S&P 500
Do
lla
rs
9Verizon Communications Inc. and Subsidiaries

Management’s Discussion and Analysis of Financial Condition and Results of Operations
OverviewVerizon Communications Inc. (Verizon or the Company) is a holding
company that, acting through its subsidiaries, is one of the world’s
leading providers of communications, information and entertainment
products and services to consumers, businesses and governmental
agencies. With a presence around the world, we offer voice, data and
video services and solutions on our wireless and wireline networks
that are designed to meet customers’ demand for mobility, reliable
network connectivity, security and control. We have two reportable
segments, Wireless and Wireline. Our wireless business, operating
as Verizon Wireless, provides voice and data services and equipment
sales across the United States (U.S.) using one of the most extensive
and reliable wireless networks. Our wireline business provides
consumer, business and government customers with communications
products and enhanced services, including broadband data and
video, corporate networking solutions, data center and cloud services,
security and managed network services and local and long distance
voice services, and also owns and operates one of the most expansive
end-to-end global Internet Protocol (IP) networks. We have a highly
skilled, diverse and dedicated workforce of approximately 177,700
employees as of December 31, 2015.
To compete effectively in today’s dynamic marketplace, we are
focused on transforming around the capabilities of our high-
performing networks with a goal of future growth based on delivering
what customers want and need in the new digital world. Our three tier
strategy is to lead at the network connectivity level in the markets we
serve, develop new business models through global platforms in video
and Internet of Things (IoT) and create certain opportunities in applica-
tions and content for incremental monetization. Our strategy requires
significant capital investments primarily to acquire wireless spectrum,
put the spectrum into service, provide additional capacity for growth
in our networks, invest in the fiber optic network that supports our
businesses, maintain our networks and develop and maintain sig-
nificant advanced information technology systems and data system
capabilities. We believe that steady and consistent investments in our
networks and platforms will drive innovative products and services
and fuel our growth. Our network leadership will continue to be the
hallmark of our brand, and provide the fundamental strength at the
connectivity, platform and solutions layers upon which we build our
competitive advantage.
Strategic Transactions
Spectrum AuctionIn January 2015, the Federal Communications Commission (FCC)
completed an auction of 65 MHz of spectrum in the Advanced
Wireless Services (AWS)-3 band. We participated in that auction and
were the high bidder on 181 spectrum licenses, for which we paid cash
of approximately $10.4 billion. The FCC granted us these spectrum
licenses in April 2015.
Acquisition of AOL Inc.On May 12, 2015, we entered into an Agreement and Plan of Merger
(the Merger Agreement) with AOL Inc. (AOL) pursuant to which we
commenced a tender offer to acquire all of the outstanding shares of
common stock of AOL at a price of $50.00 per share, net to the seller
in cash, without interest and less any applicable withholding taxes. On
June 23, 2015, we completed the tender offer and merger, and AOL
became a wholly-owned subsidiary of Verizon. The aggregate cash
consideration paid by Verizon at the closing of these transactions
was approximately $3.8 billion. Holders of approximately 6.6 million
shares exercised appraisal rights under Delaware law. If they had
not exercised these rights, Verizon would have paid an additional
$330 million for such shares at the closing.
AOL is a leader in the digital content and advertising platform space.
Verizon has been investing in emerging technology that taps into the
market shift to digital content and advertising. AOL’s business model
aligns with this approach, and we believe that its combination of owned
and operated content properties plus a digital advertising platform
enhances our ability to further develop future revenue streams.
See Note 2 to the consolidated financial statements for additional
information.
Access Line SaleOn February 5, 2015, we announced that we have entered into a defin-
itive agreement with Frontier Communications Corporation (Frontier)
pursuant to which Verizon will sell its local exchange business and
related landline activities in California, Florida and Texas, including
Fios Internet and video customers, switched and special access lines
and high-speed Internet service and long distance voice accounts
in these three states for approximately $10.5 billion (approximately
$7.5 billion net of income taxes), subject to certain adjustments and
including the assumption of $0.6 billion of indebtedness from Verizon
by Frontier. The transaction, which includes the acquisition by Frontier
of the equity interests of Verizon’s incumbent local exchange carriers
(ILECs) in California, Florida and Texas, does not involve any assets
or liabilities of Verizon Wireless. The assets and liabilities that will be
sold are currently included in Verizon’s continuing operations and
classified as assets held for sale and liabilities related to assets held for
sale on our consolidated balance sheet as of December 31, 2015. The
transaction is subject to the satisfaction of certain closing conditions
including, among others, receipt of federal approvals from the FCC and
the antitrust authorities and state regulatory approvals. All federal and
state regulatory approvals have been obtained. We expect this trans-
action to close at the end of the first quarter of 2016.
Based on the number of voice connections and Fios Internet and video
subscribers, respectively, as of December 31, 2015, the transaction will
result in Frontier acquiring approximately 3.4 million voice connections,
1.6 million Fios Internet subscribers, 1.2 million Fios video subscribers
and the related ILEC businesses from Verizon.
Tower Monetization TransactionDuring March 2015, we completed a transaction with American Tower
Corporation (American Tower) pursuant to which American Tower
acquired the exclusive rights to lease and operate approximately
11,300 of our wireless towers for an upfront payment of $5.0 billion
(the Tower Monetization Transaction). Under the terms of the leases,
American Tower has exclusive rights to lease and operate the towers
over an average term of approximately 28 years. As the leases expire,
American Tower has fixed-price purchase options to acquire these
towers based on their anticipated fair market values at the end of
the lease terms. As part of this transaction, we sold 162 towers for
$0.1 billion. We have subleased capacity on the towers from American
Tower for a minimum of 10 years at current market rates, with options
to renew. We have accounted for the upfront payment as deferred rent
and as a financing obligation.
10 Verizon Communications Inc. and Subsidiaries

Wireless TransactionOn February 21, 2014, we completed the acquisition of Vodafone
Group Plc’s (Vodafone) indirect 45% interest in Cellco Partnership
d/b/a Verizon Wireless for aggregate consideration of approximately
$130 billion (the Wireless Transaction). The consideration paid was
primarily comprised of cash of approximately $58.89 billion and
Verizon common stock with a value of approximately $61.3 billion.
With full control of Verizon Wireless enhancing our operational effi-
ciency, we believe we are well- positioned to meet the challenges of
an increasingly competitive industry. See Note 2 to the consolidated
financial statements for additional information.
Business Overview
WirelessIn our Wireless business, revenues grew 4.6% during 2015 driven
by a 54.4% increase in equipment revenue as a result of an increase
in device sales, primarily smartphones, under the Verizon device
payment program (formerly known as Verizon Edge), partially offset
by a decline in device sales under our traditional fixed-term service
plans. Customers on our fixed-term service plans have historically
paid higher fees for their wireless service in exchange for the ability
to purchase their wireless devices at subsidized prices. Under the
Verizon device payment program, our eligible wireless customers
purchase phones or tablets at unsubsidized prices on an installment
basis (a device installment plan). Customers that activate service
on devices purchased under the device payment program or on
a compatible device that they already own pay lower service fees
(unsubsidized service pricing) as compared to those under our fixed-
term service plans. The increase in activations of devices purchased
under the Verizon device payment program has resulted in a relative
shift of revenue from service revenue to equipment revenue and
caused a change in the timing of the recognition of revenue. This shift
in revenue was the result of recognizing a higher amount of equipment
revenue at the time of sale of devices under the device payment
program. For the year ended December 31, 2015, phone activations
under the Verizon device payment program represented approximately
54% of retail postpaid phones activated compared to approximately
18% during 2014. During the fourth quarter of 2015, phone activations
under the Verizon device payment program represented approx-
imately 67% of retail postpaid phones activated. At December 31,
2015, approximately 29% of our retail postpaid phone connections
participated in the Verizon device payment program compared to
approximately 8% at December 31, 2014. At December 31, 2015,
approximately 42% of our retail postpaid phone connections were on
unsubsidized service pricing. At December 31, 2015, retail postpaid
connections were 4.4% higher than at December 31, 2014, with
smartphones representing 84% of our retail postpaid phone base at
December 31, 2015 compared to 79% at December 31, 2014.
In August 2015, we launched a simplified shared data plan, the Verizon
Plan, that offers customers various sizes of data packages that can
be shared among up to 10 devices on a customer’s account. New
customers who wish to participate in this new plan can do so by
purchasing a device from Verizon either under our device payment
program or at full retail, or by using their own compatible device. In
addition, our current customers have the option of either moving
to the Verizon Plan, subject to certain restrictions, or keeping their
existing plan.
We are focusing our wireless capital spending on adding capacity
and density to our fourth generation (4G) Long Term Evolution (LTE)
network, which is available to over 98% of the U.S. population in
more than 500 markets covering approximately 312 million people,
including those in areas served by our LTE in Rural America partners.
Approximately 91% of our total data traffic in December 2015 was
carried on our 4G LTE network. We are investing in the densification of
our network by utilizing small cell technology, in- building solutions and
distributed antenna solutions. Densification enables us to add capacity
to manage mobile video consumption and demand for IoT, as well
as position us for future fifth- generation (5G) technology. In 2015, we
announced our commitment to developing and deploying 5G wireless
technology. We are working with key partners to ensure the aggressive
pace of innovation, standards development and appropriate require-
ments for this next generation of wireless technology.
WirelineIn our Wireline business, revenues declined 1.8% during 2015 primarily
due to revenue declines in Global Enterprise resulting from lower voice
services and data networking revenues, as well as the negative impact
of foreign exchange rates. To compensate for the shrinking market for
traditional voice service, we continue to build our Wireline segment
around data, video and advanced business services — areas where
demand for reliable high-speed connections is growing. The decrease
in revenues in our Wireline segment was partially offset by revenue
increases in Consumer retail driven by Fios. During the year ended
December 31, 2015, Fios represented approximately 79% of Consumer
retail revenue compared to approximately 76% in 2014. As the pen-
etration of Fios products increases, we continue to seek ways to
increase revenue and further realize operating and capital efficiencies
as well as maximize profitability. As more applications are developed
for this high-speed service, we expect that Fios will become a hub for
managing multiple home services that will eventually be part of the
digital grid, including not just entertainment and communications, but
also IoT technology used to support wireless communications in areas
such as home monitoring, health monitoring, energy management and
utilities management.
We continue to develop offerings on our Fios platform. During 2015,
Verizon announced the introduction of Fios Custom TV, which offers
customers the option of purchasing a package of channels that
includes a base set of select national networks and local broadcast
stations plus their choice of two sets of channels grouped into
various content categories, such as news, sports and entertainment.
Customers can add more sets of categorized channels to their
Custom TV package for an additional monthly fee. As with all Fios TV
packages, Custom TV customers also receive the Fios Local Package,
which contains local versions of the Fox, CBS, NBCU, and ABC
broadcast stations and other similar local content.
Capital Expenditures and InvestmentsWe continue to invest in our wireless network, high-speed fiber and
other advanced technologies to position ourselves at the center of
growth trends for the future. During 2015, these investments included
$17.8 billion for capital expenditures and $9.9 billion for acquisitions of
wireless licenses. In addition, we acquired AOL to enhance our digital
media and advertising capabilities. See “Cash Flows Used in Investing
Activities” and Note 2 to the consolidated financial statements for addi-
tional information. We believe that our investments aimed at expanding
our portfolio of products and services will provide our customers with
an even more efficient, reliable infrastructure for competing in the infor-
mation economy.
11Verizon Communications Inc. and Subsidiaries
Management’s Discussion and Analysis of Financial Condition and Results of Operations continued

TrendsIn the sections that follow, we provide information about the important
aspects of our operations and investments, both at the consolidated
and segment levels, and discuss our results of operations, financial
position and sources and uses of cash. In addition, we highlight key
trends and uncertainties to the extent practicable.
The industries that we operate in are highly competitive, which we
expect to continue particularly as traditional, non- traditional and
emerging service providers seek increased market share. We believe
that our high- quality customer base and superior networks differ-
entiate us from our competitors and enable us to provide enhanced
communications experiences to our customers. We believe our focus
on the fundamentals of running a good business, including operating
excellence and financial discipline, gives us the ability to plan and
manage through changing economic and competitive conditions.
We will continue to invest for growth, which we believe is the key to
creating value for our shareowners. We are investing in innovative
technology, like wireless networks and high-speed fiber, as well as the
platforms that will position us to capture incremental profitable growth
in new areas, like mobile video and IoT, to position ourselves at the
center of growth trends of the future.
Connection and Operating TrendsIn our Wireless segment, we expect to continue to attract and maintain
the loyalty of high- quality retail postpaid customers, capitalizing on
demand for data services and bringing our customers new ways
of using wireless services in their daily lives. We expect that future
connection growth will be driven by smartphones, tablets and other
connected devices. We believe these devices will attract and retain
higher value retail postpaid connections, contribute to continued
increases in the penetration of data services and help us remain
competitive with other wireless carriers. We expect future growth
opportunities will be dependent on expanding the penetration of
our network services, offering innovative wireless devices for both
consumer and business customers and increasing the number of ways
that our customers can connect with our network and services, and
we expect to manage churn by focusing on improving the customer
experience through simplified pricing and better execution in our distri-
bution channels.
Service and equipment pricing play an important role in the wireless
competitive landscape. As the demand for wireless services continues
to grow, wireless service providers are offering service plans that
include unlimited voice minutes and text messages and a specific
amount of data access in varying megabyte or gigabyte sizes or,
in some cases, unlimited data usage at competitive prices. Some
wireless service providers also allow customers to roll over unused
data allowances to the next billing period. Furthermore, some wireless
service providers offer price plans to new customers that undercut
pricing under the customer’s service plan with its current wireless
provider. Some wireless providers also offer promotional pricing and
incentives targeted specifically to customers of Verizon Wireless.
Many wireless service providers, as well as equipment manufac-
turers, offer device payment options that decouple service pricing
from equipment pricing and blur the traditional boundary between
prepaid and postpaid plans. These payment options include device
installment plans, which provide customers with the ability to pay for
their device over a period of time, and device leasing arrangements.
Historically, wireless service providers offered customers wireless
plans whereby, in exchange for the customer entering into a fixed-term
service agreement, the wireless service providers significantly, and in
some cases fully, subsidized the customer’s device purchase. Wireless
providers recovered those subsidies through higher service fees as
compared to those paid by customers on device installment plans. We
and many other wireless providers have limited or discontinued the use
of device subsidies. As a result of the increased penetration of device
installment plans, we expect the number of customers on plans with
unsubsidized service pricing to continue to grow in 2016. We compete
in this area by offering our customers services and devices that we
believe they will regard as the best available value for the price, while
meeting their wireless service needs.
In our Wireline segment, we have experienced continuing access line
losses as customers have disconnected both primary and secondary
lines and switched to alternative technologies such as wireless, voice
over Internet protocol (VoIP) and cable for voice and data services.
We expect to continue to experience access line losses as customers
continue to switch to alternate technologies. We also expect
Consumer retail revenues to increase, primarily driven by our Fios
services, as we seek to increase our penetration rates within our Fios
service areas.
Despite this challenging environment, we expect that we will be able
to grow key aspects of our Wireline segment by providing network
reliability, offering product bundles that include broadband Internet
access, digital television and local and long distance voice services,
offering more robust IP products and services, and accelerating our
cloud computing and IoT strategies. We will also continue to focus on
cost efficiencies to attempt to offset adverse impacts from unfavorable
economic conditions and competitive pressures.
Operating RevenueWe expect to experience revenue growth in our Wireless segment in
2016, primarily as a result of an increase in the sale of devices under
the Verizon device payment program. The increase in activations of
these devices with unsubsidized service pricing results in a relative
shift of revenue from service revenue to equipment revenue and
causes a change in the timing of the recognition of revenue. This shift
in revenue is the result of recognizing a higher amount of equipment
revenue at the time of sale of devices under the device payment
program. As a result of the increased penetration of device installment
plans, we expect the number of customers on plans with unsubsidized
service pricing to continue to grow in 2016.
We expect Fios broadband and video penetration to positively impact
our Mass Markets revenue and subscriber base. Although we have
experienced revenue declines in our Global Enterprise business, we
expect our Global Enterprise business to be positively impacted by
additional revenues from application services, such as our cloud,
security and other solutions-based services and from continued
customer migration of their services to Private IP and other strategic
networking services. We believe the trend in these growth areas as
well as our offerings in telematics and video streaming will help offset
the continuing decline in revenues in our Wireline segment related to
retail voice connection losses and the continued decline in our legacy
wholesale and enterprise markets.
We are focused on developing new products and services as well as
commercial models in mobile video and the IoT to monetize usage
on our networks and expand our revenue mix. Although we do not
expect to realize material incremental revenues from these initiatives in
2016, we expect these initiatives will have a long-term positive impact
on revenues.
12 Verizon Communications Inc. and Subsidiaries
Management’s Discussion and Analysis of Financial Condition and Results of Operations continued

Operating Costs and ExpensesWe anticipate our overall wireless operating costs will increase as a
result of the expected increase in the volume of smartphone sales,
which will result in higher equipment costs. In addition, we expect
content costs for our Fios video service to continue to increase. We
also expect to incur costs related to the development of new products
and services in mobile video and IoT. However, we expect to achieve
certain cost efficiencies in 2016 and beyond as we continue to stream-
line our business processes with a focus on improving productivity and
increasing profitability.
Upon the closing of the sale of our local exchange business and related
landline activities in California, Florida and Texas, we expect that
our Wireline segment EBITDA margin and operating income margin
will decline. We expect to continue to undertake initiatives, including
headcount and organizational realignment initiatives, to address our
cost structure to mitigate this impact to our consolidated margins.
Cash Flow from OperationsWe create value for our shareowners by investing the cash flows
generated by our business in opportunities and transactions that
support continued profitable growth, thereby increasing customer
satisfaction and usage of our products and services. In addition, we
have used our cash flows to maintain and grow our dividend payout to
shareowners. Verizon’s Board of Directors increased the Company’s
quarterly dividend by 2.7% during 2015, making this the ninth consecu-
tive year in which we have raised our dividend.
Our goal is to use our cash to create long-term value for our share-
holders. We will continue to look for investment opportunities that will
help us to grow the business, acquire spectrum licenses (see “Cash
Flows from Investing Activities”), pay dividends to our shareholders
and, when appropriate, buy back shares of our outstanding common
stock (see “Cash Flows from Financing Activities”). We expect to use
the proceeds from the Frontier transaction to reduce our debt levels.
We also remain committed to returning to our pre Wireless Transaction
credit- rating profile in the 2018 to 2019 timeframe.
Capital ExpendituresOur 2016 capital program includes capital to fund advanced networks
and services, including 4G LTE and Fios, the continued expansion of
our core networks, including our IP and data center enhancements,
and support for our copper-based legacy voice networks and other
expenditures to drive operating efficiencies. The level and the timing
of the Company’s capital expenditures within these broad catego-
ries can vary significantly as a result of a variety of factors outside
our control, including, for example, material weather events. We are
replacing copper wire with fiber-optic cable which will not alter our
capital program but should result in lower maintenance costs in the
future. Capital expenditures were $17.8 billion in 2015 and $17.2 billion
in 2014. We believe that we have significant discretion over the amount
and timing of our capital expenditures on a Company-wide basis as
we are not subject to any agreement that would require significant
capital expenditures on a designated schedule or upon the occurrence
of designated events. We expect capital expenditures in 2016, which
will be primarily focused on adding capacity to our 4G LTE network in
order to stay ahead of our customers’ increasing data demands, to be
in the range of approximately $17.2 billion to $17.7 billion. This includes
capital spending up to approximately $150 million for the properties to
be sold to Frontier.
Consolidated Results of OperationsIn this section, we discuss our overall results of operations and
highlight items of a non- operational nature that are not included in
our segment results. We have two reportable segments, Wireless
and Wireline, which we operate and manage as strategic business
units and organize by products and services. In “Segment Results
of Operations,” we review the performance of our two report-
able segments.
On February 21, 2014, we completed the acquisition of Vodafone’s
indirect 45% interest in Verizon Wireless. As a result, for 2014 our
results reflect our 55% ownership of Verizon Wireless through the
closing of the Wireless Transaction and reflect our full ownership of
Verizon Wireless from the closing of the Wireless Transaction through
December 31, 2014.
Corporate and other includes the operations of AOL and related
businesses, unallocated corporate expenses, the results of other
businesses, such as our investments in unconsolidated businesses,
pension and other employee benefit related costs and lease
financing. Effective January 1, 2014, we have also reclassified the
results of certain businesses, such as development stage businesses
that support our strategic initiatives, from our Wireline segment to
Corporate and other. The impact of this reclassification was not
material to our consolidated financial statements or our segment
results of operations. Corporate and other also includes the historical
results of divested operations and other adjustments and gains and
losses that are not allocated in assessing segment performance due to
their non- operational nature. Although such transactions are excluded
from the business segment results, they are included in reported
consolidated earnings. Gains and losses that are not individually sig-
nificant are included in all segment results as these items are included
in the chief operating decision maker’s assessment of segment perfor-
mance. We believe that this presentation assists users of our financial
statements in better understanding our results of operations and
trends from period to period.
On July 1, 2014, our Wireline segment sold a non- strategic business
(see “Acquisitions and Divestitures”). Accordingly, the historical
Wireline results for these operations, which were not material to our
consolidated financial statements or our segment results of operations,
have been reclassified to Corporate and other to reflect comparable
segment operating results. The results of operations related to this
divestiture included within Corporate and other are as follows:
(dollars in millions)
Years Ended December 31, 2015 2014 2013
Impact of Divested OperationsOperating revenues $ – $ 256 $ 599
Cost of services – 239 531
Selling, general and administrative
expense – 5 25
13Verizon Communications Inc. and Subsidiaries
Management’s Discussion and Analysis of Financial Condition and Results of Operations continued

Consolidated Revenues(dollars in millions)
Increase/(Decrease)Years Ended December 31, 2015 2014 2013 2015 vs. 2014 2014 vs. 2013
Wireless
Service $ 70,396 $ 72,630 $ 69,033 $ (2,234) (3.1)% $ 3,597 5.2 %
Equipment 16,924 10,959 8,111 5,965 54.4 2,848 35.1
Other 4,360 4,057 3,879 303 7.5 178 4.6
Total 91,680 87,646 81,023 4,034 4.6 6,623 8.2
Wireline
Mass Markets 18,473 18,047 17,383 426 2.4 664 3.8
Global Enterprise 12,943 13,649 14,156 (706) (5.2) (507) (3.6)
Global Wholesale 5,979 6,190 6,560 (211) (3.4) (370) (5.6)
Other 325 543 525 (218) (40.1) 18 3.4
Total 37,720 38,429 38,624 (709) (1.8) (195) (0.5)
Corporate and other 3,444 2,144 2,113 1,300 60.6 31 1.5
Eliminations (1,224) (1,140) (1,210) (84) 7.4 70 (5.8)
Consolidated Revenues $ 131,620 $ 127,079 $ 120,550 $ 4,541 3.6 $ 6,529 5.4
2015 Compared to 2014The increase in consolidated revenues during 2015 was primarily
due to higher equipment revenues in our Wireless segment, higher
revenues as a result of the acquisition of AOL and higher Mass
Markets revenues driven by Fios services at our Wireline segment.
Partially offsetting these increases were lower Service revenues at
our Wireless segment and lower Global Enterprise revenues at our
Wireline segment.
Wireless’ revenues increased $4.0 billion, or 4.6%, during 2015
primarily as a result of growth in equipment revenue. Equipment
revenue increased by $6.0 billion, or 54.4% during 2015 as a result of
an increase in device sales, primarily smartphones, under the Verizon
device payment program, partially offset by a decline in device sales
under traditional fixed-term service plans. Service revenue, which
does not include recurring device installment billings related to the
Verizon device payment program, decreased by $2.2 billion, or 3.1%,
during 2015 primarily driven by an increase in the activation of devices
purchased under the Verizon device payment program on plans with
unsubsidized service pricing. The increase in these activations resulted
in a relative shift of revenue from service revenue to equipment
revenue and caused a change in the timing of the recognition of
revenue. This shift in revenue was the result of recognizing a higher
amount of equipment revenue at the time of sale of devices under
the device payment program. During the year ended December 31,
2015, phone activations under the Verizon device payment program
represented approximately 54% of retail postpaid phones activated
compared to approximately 18% during 2014. During the fourth quarter
of 2015, phone activations under the Verizon device payment program
represented approximately 67% of retail postpaid phones activated.
At December 31, 2015, approximately 29% of our retail postpaid
phone connections participated in the Verizon device payment
program compared to approximately 8% at December 31, 2014. At
December 31, 2015, approximately 42% of our retail postpaid phone
connections were on unsubsidized service pricing. Service revenue
plus recurring device installment billings related to the Verizon device
payment program increased 2.0% during 2015.
Retail postpaid connection net additions decreased during 2015
primarily due to a decrease in retail postpaid connection gross
additions, partially offset by a lower retail postpaid connection
churn rate. Retail postpaid connections per account increased as of
December 31, 2015 compared to December 31, 2014, primarily due to
increases in Internet devices.
Wireline’s revenues decreased $0.7 billion, or 1.8%, during 2015
primarily as a result of declines in Global Enterprise, partially offset by
higher Mass Markets revenues driven by Fios services.
Mass Markets revenues increased $0.4 billion, or 2.4%, during 2015
primarily due to the expansion of Fios services (voice, internet and
video), including our Fios Quantum offerings, as well as changes in
our pricing strategies, partially offset by the continued decline of local
exchange revenues.
Global Enterprise revenues decreased $0.7 billion, or 5.2%, during
2015 primarily due to lower voice services and data networking
revenues, lower networking solutions revenues, a decline in customer
premise equipment revenues and the negative impact of foreign
exchange rates.
Corporate and other revenues increased $1.3 billion, or 60.6%,
during 2015 primarily as a result of the acquisition of AOL, which was
completed on June 23, 2015.
2014 Compared to 2013The increase in consolidated revenues during 2014 was primarily
due to higher revenues at Wireless, as well as higher Mass Markets
revenues driven by Fios services at our Wireline segment. Partially off-
setting these increases were lower Global Enterprise Core and Global
Wholesale revenues at our Wireline segment.
Wireless’ revenues increased $6.6 billion, or 8.2%, during 2014
primarily as a result of growth in service revenue and equipment
revenue. The increase in service revenue, which does not include
recurring equipment installment billings related to the Verizon device
payment program, during 2014 was primarily driven by higher retail
postpaid service revenue, which increased largely as a result of
an increase in retail postpaid connections as well as the continued
increase in penetration of 4G LTE smartphones and tablets through
our More Everything plans. Retail postpaid connection net additions
increased during 2014 primarily due to an increase in retail postpaid
connection gross additions partially offset by an increase in our
retail postpaid connection churn rate. Retail postpaid connections
per account increased as of December 31, 2015 compared to
December 31, 2014 primarily due to the increased penetration of
tablets. Equipment revenue increased during 2014 primarily due to an
increase in device sales under both traditional fixed-term service plans
and the Verizon device payment program.
Wireline’s revenues decreased $0.2 billion, or 0.5%, during 2014
primarily as a result of declines in Global Enterprise Core and Global
14 Verizon Communications Inc. and Subsidiaries
Management’s Discussion and Analysis of Financial Condition and Results of Operations continued

Wholesale, partially offset by higher Mass Markets revenues driven by
Fios services and increased Strategic services revenues within Global
Enterprise.
Mass Markets revenues increased $0.7 billion, or 3.8%, during 2014
primarily due to the expansion of Fios services (voice, internet and
video), including our Fios Quantum offerings, as well as changes in
our pricing strategies, partially offset by the continued decline of local
exchange revenues.
Global Enterprise revenues decreased $0.5 billion, or 3.6%, during
2014 primarily due to lower voice services and data networking
revenues, the contraction of market rates due to competition and a
decline in Core customer premise equipment revenues. This decrease
was partially offset by an increase in Strategic services revenues,
primarily due to growth in our application services, such as our cloud
and data center offerings and contact center solutions.
Global Wholesale revenues decreased $0.4 billion, or 5.6%, during
2014 primarily due to a decline in data revenues driven by the
continuing demand for high-speed digital data services from fiber-
to-the-cell customers upgrading their core data circuits to Ethernet
facilities, as well as a decline in traditional voice revenues. During 2014,
we also experienced a decline in domestic wholesale connections.
Consolidated Operating Expenses(dollars in millions)
Increase/(Decrease)Years Ended December 31, 2015 2014 2013 2015 vs. 2014 2014 vs. 2013
Cost of services $ 29,438 $ 28,306 $ 28,534 $ 1,132 4.0 % $ (228) (0.8)%
Wireless cost of equipment 23,119 21,625 16,353 1,494 6.9 5,272 32.2
Selling, general and administrative expense 29,986 41,016 27,089 (11,030) (26.9) 13,927 51.4
Depreciation and amortization expense 16,017 16,533 16,606 (516) (3.1) (73) (0.4)
Consolidated Operating Expenses $ 98,560 $ 107,480 $ 88,582 $ (8,920) (8.3) $ 18,898 21.3
Consolidated operating expenses decreased during 2015 primarily
due to non- operational credits recorded in 2015 as compared to
non- operational charges recorded in 2014 (see “Other Items”).
Consolidated operating expenses increased during 2014 primarily
due to non- operational charges recorded in 2014 as compared to
non- operational credits recorded in 2013 (see “Other Items”) as well as
increased operating expenses at Wireless.
2015 Compared to 2014Cost of Services
Cost of services includes the following costs directly attributable to a
service: salaries and wages, benefits, materials and supplies, content
costs, contracted services, network access and transport costs,
customer provisioning costs, computer systems support, and costs to
support our outsourcing contracts and technical facilities. Aggregate
customer care costs, which include billing and service provisioning, are
allocated between Cost of services and Selling, general and adminis-
trative expense.
Cost of services increased during 2015 primarily due to an increase
in costs as a result of the acquisition of AOL, higher rent expense
as a result of an increase in wireless macro and small cell sites,
higher wireless network costs from an increase in fiber facilities
supporting network capacity expansion and densification, including
the deployment of small cell technology, a volume- driven increase
in costs related to the wireless device protection package offered
to our customers as well as a $0.5 billion increase in content costs
at our Wireline segment. Partially offsetting these increases were a
$0.3 billion decline in employee costs and a $0.3 billion decline in
access costs at our Wireline segment. Also offsetting the increase was
a decrease in Cost of services reflected in the results of operations
related to a non- strategic Wireline business that was divested on
July 1, 2014.
Wireless Cost of Equipment
Wireless cost of equipment increased during 2015 primarily as a result
of an increase in the average cost per unit, driven by a shift to higher
priced units in the mix of devices sold, partially offset by a decline in
the number of units sold.
Selling, General and Administrative Expense
Selling, general and administrative expense includes: salaries and
wages and benefits not directly attributable to a service or product,
bad debt charges, taxes other than income taxes, advertising and
sales commission costs, customer billing, call center and information
technology costs, regulatory fees, professional service fees, and
rent and utilities for administrative space. Also included is a portion
of the aggregate customer care costs as discussed in “Cost of
Services” above.
Selling, general and administrative expense decreased during 2015
primarily due to non- operational credits, primarily severance, pension
and benefit credits, recorded in 2015 as compared to non- operational
charges, primarily severance, pension and benefit charges, recorded
in 2014 (see “Other Items”). Also contributing to this decrease was a
decline in sales commission expense at our Wireless segment, which
was driven by an increase in activations under the Verizon device
payment program. The decrease is partially offset by an increase in
bad debt expense at our Wireless segment. The increase in bad debt
expense was primarily driven by a volume increase in our installment
receivables, as the credit quality of our customers remained consistent
throughout the periods presented.
Depreciation and Amortization Expense
Depreciation and amortization expense decreased during 2015
primarily due to $0.9 billion of depreciation and amortization expense
not being recorded on our depreciable Wireline assets in California,
Florida and Texas which were classified as held for sale as of
February 5, 2015, partially offset by an increase in depreciable assets
at our Wireless segment.
We will not record depreciation and amortization expense on our
depreciable Wireline assets in California, Florida and Texas through
the closing of the transaction with Frontier, which is expected to occur
at the end of the first quarter of 2016.
15Verizon Communications Inc. and Subsidiaries
Management’s Discussion and Analysis of Financial Condition and Results of Operations continued

2014 Compared to 2013Wireless Cost of Equipment
Wireless cost of equipment increased during 2014 primarily due to an
increase in cost of equipment sales at our Wireless segment as a result
of an increase in the number of devices sold as well as an increase in
the cost per unit.
Selling, General and Administrative Expense
Selling, general and administrative expense increased during 2014
primarily due to non- operational charges, primarily severance, pension
and benefit charges, recorded in 2014 as compared to non- operational
credits, primarily severance, pension and benefit credits, recorded in
2013 (see “Other Items”).
Depreciation and Amortization Expense
Depreciation and amortization expense decreased during 2014
primarily due to a decrease in net depreciable assets at our Wireline
segment, partially offset by an increase in depreciable assets at our
Wireless segment.
Non- operational (Credits) ChargesNon- operational (credits) charges included in operating expenses
(see “Other Items”) were as follows:
(dollars in millions)
Years Ended December 31, 2015 2014 2013
Severance, Pension and Benefit (Credits) Charges
Selling, general and administrative expense $ (2,256) $ 7,507 $ (6,232)
Gain on Spectrum License Transactions
Selling, general and administrative expense (254) (707) (278)
Other CostsCost of services and sales – 27 –
Selling, general and administrative expense – 307 –
– 334 –
Total non- operating (credits) charges included in operating expenses $ (2,510) $ 7,134 $ (6,510)
See “Other Items” for a description of these and other non-
operational items.
Consolidated Operating Income and EBITDA
Consolidated earnings before interest, taxes, depreciation and amor-
tization expenses (Consolidated EBITDA) and Consolidated Adjusted
EBITDA, which are presented below, are non-GAAP measures and
do not purport to be alternatives to operating income as a measure of
operating performance. Management believes that these measures
are useful to investors and other users of our financial information in
evaluating operating profitability on a more variable cost basis as they
exclude the depreciation and amortization expense related primarily to
capital expenditures and acquisitions that occurred in prior years, as
well as in evaluating operating performance in relation to our competi-
tors. Consolidated EBITDA is calculated by adding back interest, taxes,
depreciation and amortization expense, equity in (losses) earnings of
unconsolidated businesses and other income and (expense), net to
net income.
Consolidated Adjusted EBITDA is calculated by excluding the effect
of non- operational items and the impact of divested operations from
the calculation of Consolidated EBITDA. Management believes that
this measure provides additional relevant and useful information
to investors and other users of our financial data in evaluating the
effectiveness of our operations and underlying business trends in a
manner that is consistent with management’s evaluation of business
performance. See “Other Items” for additional details regarding these
non- operational items.
Operating expenses include pension and benefit related credits and/or
charges based on actuarial assumptions, including projected discount
rates and an estimated return on plan assets. These estimates are
updated in the fourth quarter to reflect actual return on plan assets and
updated actuarial assumptions. The adjustment has been recognized
in the income statement during the fourth quarter or upon a remea-
surement event pursuant to our accounting policy for the recognition
of actuarial gains/losses.
It is management’s intent to provide non-GAAP financial information
to enhance the understanding of Verizon’s GAAP financial informa-
tion, and it should be considered by the reader in addition to, but
not instead of, the financial statements prepared in accordance with
GAAP. Each non-GAAP financial measure is presented along with the
corresponding GAAP measure so as not to imply that more emphasis
should be placed on the non-GAAP measure. The non-GAAP financial
information presented may be determined or calculated differently by
other companies.
(dollars in millions)
Years Ended December 31, 2015 2014 2013
Consolidated Operating Income $ 33,060 $ 19,599 $ 31,968
Add Depreciation and amortization
expense 16,017 16,533 16,606
Consolidated EBITDA 49,077 36,132 48,574
Add (Less) Non- operating (credits)
charges included in operating
expenses (2,510) 7,134 (6,510)
Less Impact of divested operations – (12) (43)
Consolidated Adjusted EBITDA $ 46,567 $ 43,254 $ 42,021
The changes in Consolidated Operating Income, Consolidated
EBITDA and Consolidated Adjusted EBITDA in the table above were
primarily a result of the factors described in connection with operating
revenues and operating expenses.
16 Verizon Communications Inc. and Subsidiaries
Management’s Discussion and Analysis of Financial Condition and Results of Operations continued

Other Consolidated Results
Equity in Earnings of Unconsolidated BusinessesEquity in earnings of unconsolidated businesses decreased $1.9 billion during 2015 and increased $1.6 billion during 2014 primarily due to the
gain of $1.9 billion recorded on the sale of our interest in Vodafone Omnitel N.V. (the Omnitel Transaction, and such interest, the Omnitel Interest)
during the first quarter of 2014, which was part of the consideration for the Wireless Transaction completed on February 21, 2014.
Other Income and (Expense), NetAdditional information relating to Other income and (expense), net is as follows:
(dollars in millions)
Increase/(Decrease)Years Ended December 31, 2015 2014 2013 2015 vs. 2014 2014 vs. 2013
Interest income $ 115 $ 108 $ 64 $ 7 6.5% $ 44 68.8%
Other, net 71 (1,302) (230) 1,373 nm (1,072) nm
Total $ 186 $ (1,194) $ (166) $ 1,380 nm $ (1,028) nm
nm - not meaningful
Other income and (expense), net changed favorably during 2015 and changed unfavorably during 2014 primarily driven by net early debt redemp-
tion costs of $1.4 billion incurred in 2014 (see “Other Items”).
Interest Expense(dollars in millions)
Increase/(Decrease)Years Ended December 31, 2015 2014 2013 2015 vs. 2014 2014 vs. 2013
Total interest costs on debt balances $ 5,504 $ 5,291 $ 3,421 $ 213 4.0% $ 1,870 54.7 %
Less capitalized interest costs 584 376 754 208 55.3 (378) (50.1)
Total $ 4,920 $ 4,915 $ 2,667 $ 5 0.1 $ 2,248 84.3
Average debt outstanding $ 113,325 $ 108,461 $ 65,959
Effective interest rate 4.9% 4.9% 5.2%
Total interest costs on debt balances increased during 2015 primarily due to a $4.9 billion increase in average debt (see “Consolidated Financial
Condition”). Capitalized interest costs were higher in 2015 primarily due to an increase in wireless licenses that are currently under development,
which was a result of our winning bid in the FCC spectrum license auction during 2015. The FCC granted us those wireless licenses on April 8,
2015 (see Note 2 for additional information).
Total interest costs on debt balances increased during 2014 primarily due to the issuance of fixed and floating rate notes to finance the Wireless
Transaction (see “Acquisitions and Divestitures”) resulting in an increase in average debt and a corresponding increase in interest expense,
partially offset by a lower effective interest rate (see “Consolidated Financial Condition”). Capitalized interest costs were lower in 2014 primarily
due to a decrease in wireless licenses that are currently under development, which was due to the deployment of AWS licenses for commercial
service during 2014.
17Verizon Communications Inc. and Subsidiaries
Management’s Discussion and Analysis of Financial Condition and Results of Operations continued

Provision for Income Taxes(dollars in millions)
Increase/(Decrease)Years Ended December 31, 2015 2014 2013 2015 vs. 2014 2014 vs. 2013
Provision for income taxes $ 9,865 $ 3,314 $ 5,730 $ 6,551 nm $ (2,416) (42.2)%
Effective income tax rate 34.9% 21.7% 19.6%
nm - not meaningful
The effective income tax rate is calculated by dividing the provision
for income taxes by income before the provision for income taxes.
The effective income tax rate for 2015 was 34.9% compared to 21.7%
for 2014. The increase in the effective income tax rate and provision
for income taxes was primarily due to the impact of higher income
before income taxes due to severance, pension and benefit credits
recorded in 2015 compared to severance, pension and benefit
charges recorded in 2014, as well as tax benefits associated with the
utilization of certain tax credits in 2014 in connection with the Omnitel
Transaction. The 2014 effective income tax rate also included a benefit
from the inclusion of income attributable to Vodafone’s noncontrolling
interest in the Verizon Wireless partnership prior to the Wireless
Transaction completed on February 21, 2014.
The effective income tax rate for 2014 was 21.7% compared to 19.6%
for 2013. The increase in the effective income tax rate was primarily
due to additional income taxes on the incremental income from the
Wireless Transaction completed on February 21, 2014 and was partially
offset by the utilization of certain tax credits in connection with the
Omnitel Transaction in 2014 and the effective income tax rate impact
of lower income before income taxes due to severance, pension and
benefit charges recorded in 2014 compared to severance, pension
and benefit credits recorded in 2013. The decrease in the provision
for income taxes was primarily due to lower income before income
taxes due to severance, pension and benefit charges recorded in 2014
compared to severance, pension and benefit credits recorded in 2013.
Our effective income tax rate differed significantly from the statutory
federal income tax rate for 2013 due to the inclusion of income attrib-
utable to Vodafone’s noncontrolling interest in the Verizon Wireless
partnership for the full year within our income before the provision
for income taxes. In 2013, we recorded a tax provision on income
before the provision for income taxes and when we included the
income attributable to Vodafone’s noncontrolling interest in the Verizon
Wireless partnership in our income before the provision for income
taxes it resulted in our effective income tax rate being 13.7 percentage
points lower during 2013.
A reconciliation of the statutory federal income tax rate to the effective
income tax rate for each period is included in Note 12 to the consoli-
dated financial statements.
Net Income Attributable to Noncontrolling Interests(dollars in millions)
Increase/(Decrease)Years Ended December 31, 2015 2014 2013 2015 vs. 2014 2014 vs. 2013
Net income attributable to noncontrolling interests $ 496 $ 2,331 $ 12,050 $ (1,835) (78.7)% $ (9,719) (80.7)%
The decrease in Net income attributable to noncontrolling interests during 2015 and 2014 was primarily due to the completion of the Wireless
Transaction on February 21, 2014. As a result, our results reflect our 55% ownership interest of Verizon Wireless through the closing of the
Wireless Transaction and reflect our full ownership of Verizon Wireless for the remainder of the year. The noncontrolling interests that remained
after the completion of the Wireless Transaction primarily relate to wireless partnership entities.
18 Verizon Communications Inc. and Subsidiaries
Management’s Discussion and Analysis of Financial Condition and Results of Operations continued

Segment Results of OperationsWe have two reportable segments, Wireless and Wireline, which we operate and manage as strategic business units and organize by products
and services. We measure and evaluate our reportable segments based on segment operating income. The use of segment operating income is
consistent with the chief operating decision maker’s assessment of segment performance.
Segment earnings before interest, taxes, depreciation and amortization (Segment EBITDA), which is presented below, is a non-GAAP measure
and does not purport to be an alternative to operating income as a measure of operating performance. Management believes that this measure
is useful to investors and other users of our financial information in evaluating operating profitability on a more variable cost basis as it excludes
the depreciation and amortization expenses related primarily to capital expenditures and acquisitions that occurred in prior years, as well as in
evaluating operating performance in relation to our competitors. Segment EBITDA is calculated by adding back depreciation and amortization
expense to segment operating income.
Wireless Segment EBITDA margin is calculated by dividing Wireless Segment EBITDA by total Wireless revenues. Wireless Segment EBITDA
service margin, also presented below, is calculated by dividing Wireless Segment EBITDA by Wireless service revenues. Wireless Segment
EBITDA service margin utilizes service revenues rather than total revenues. Service revenues primarily exclude equipment revenues in order
to reflect the impact of providing service to the wireless customer base on an ongoing basis. Wireline Segment EBITDA margin is calculated by
dividing Wireline Segment EBITDA by total Wireline revenues. You can find additional information about our segments in Note 13 to the consoli-
dated financial statements.
WirelessOur Wireless segment, doing business as Verizon Wireless, provides wireless communications services across one of the most extensive
wireless networks in the United States. Verizon Wireless was formed as a joint venture in April 2000 by the combination of the U.S. wireless
operations and interests of Verizon and Vodafone. Prior to the completion of the Wireless Transaction, Verizon owned a controlling 55% interest in
Verizon Wireless and Vodafone owned the remaining 45%. On February 21, 2014, the Wireless Transaction was completed and Verizon acquired
100% ownership of Verizon Wireless.
We provide these services and equipment sales to consumer, business and government customers in the United States on a postpaid and
prepaid basis. Postpaid connections represent individual lines of service for which a customer is billed in advance a monthly access charge in
return for a monthly network service allowance, and usage beyond the allowance is billed monthly in arrears. Our prepaid service enables individ-
uals to obtain wireless services without credit verification by paying for all services in advance.
All financial results included in the tables below reflect the consolidated results of Verizon Wireless.
Operating Revenues and Selected Operating Statistics(dollars in millions, except ARPA)
Increase/(Decrease)Years Ended December 31, 2015 2014 2013 2015 vs. 2014 2014 vs. 2013
Service $ 70,396 $ 72,630 $ 69,033 $ (2,234) (3.1)% $ 3,597 5.2%
Equipment 16,924 10,959 8,111 5,965 54.4 2,848 35.1
Other 4,360 4,057 3,879 303 7.5 178 4.6
Total Operating Revenues $ 91,680 $ 87,646 $ 81,023 $ 4,034 4.6 $ 6,623 8.2
Connections (’000):(1)
Retail connections 112,108 108,211 102,799 3,897 3.6 5,412 5.3
Retail postpaid connections 106,528 102,079 96,752 4,449 4.4 5,327 5.5
Net additions in period (’000):(2)
Retail connections 3,956 5,568 4,472 (1,612) (29.0) 1,096 24.5
Retail postpaid connections 4,507 5,482 4,118 (975) (17.8) 1,364 33.1
Churn Rate:
Retail connections 1.24% 1.33% 1.27%
Retail postpaid connections 0.96% 1.04% 0.97%
Account Statistics:
Retail postpaid ARPA $ 152.63 $ 159.86 $ 153.93 $ (7.23) (4.5) $ 5.93 3.9
Retail postpaid accounts (’000)(1) 35,736 35,616 35,083 120 0.3 533 1.5
Retail postpaid connections per account(1) 2.98 2.87 2.76 0.11 3.8 0.11 4.0
(1) As of end of period
(2) Excluding acquisitions and adjustments
19Verizon Communications Inc. and Subsidiaries
Management’s Discussion and Analysis of Financial Condition and Results of Operations continued

2015 Compared to 2014Wireless’ total operating revenues increased by $4.0 billion, or 4.6%,
during 2015 primarily as a result of growth in equipment revenue.
Accounts and Connections
Retail (non- wholesale) postpaid accounts primarily represent retail
customers with Verizon Wireless that are directly served and managed
by Verizon Wireless and use its branded services. Accounts include
shared data plans, such as our new Verizon Plan and More Everything
plans, and corporate accounts, as well as legacy single connection
plans and family plans. A single account may include monthly wireless
services for a variety of connected devices. Retail connections
represent our retail customer device connections. Churn is the rate at
which service to connections is terminated.
Retail connections under an account may include: smartphones and
basic phones (collectively, phones) as well as tablets, LTE Internet
(Installed) and other connected devices. Retail postpaid connection
net additions decreased during 2015 primarily due to a decrease in
retail postpaid connection gross additions, partially offset by lower
retail postpaid connection churn rate. The decrease in retail postpaid
connection gross additions during 2015 was driven by a decline in
gross additions of smartphones, tablets and other Internet devices.
Retail Postpaid Connections per Account
Retail postpaid connections per account is calculated by dividing the
total number of retail postpaid connections by the number of retail
postpaid accounts as of the end of the period. Retail postpaid con-
nections per account increased as of December 31, 2015 compared
to December 31, 2014. The increase in retail postpaid connections
per account is primarily due to increases in Internet devices, which
represented 16.8% of our retail postpaid connection base as of
December 31, 2015, compared to 14.1% as of December 31, 2014.
Service Revenue
Service revenue, which does not include recurring device installment
billings related to the Verizon device payment program, decreased
by $2.2 billion, or 3.1%, during 2015 primarily driven by lower retail
postpaid service revenue. Retail postpaid service revenue was
negatively impacted as a result of an increase in the activation of
devices purchased under the Verizon device payment program on
plans with unsubsidized service pricing. The increase in these acti-
vations resulted in a relative shift of revenue from service revenue to
equipment revenue and caused a change in the timing of the recog-
nition of revenue. At December 31, 2015, approximately 29% of our
retail postpaid phone connections participated in the Verizon device
payment program compared to approximately 8% at December 31,
2014. At December 31, 2015, approximately 42% of our retail postpaid
phone connections were on unsubsidized service pricing. The
decrease in service revenue was partially offset by the impact of
an increase in retail postpaid connections as well as the continued
increase in penetration of smartphones and tablets through our
shared data plans. Service revenue plus recurring device installment
billings related to the Verizon device payment program increased 2.0%
during 2015.
Retail postpaid ARPA (the average revenue per account from retail
postpaid accounts), which does not include recurring device install-
ment billings related to the Verizon device payment program, was
negatively impacted during 2015 as a result of the increase in the
activation of devices purchased under the Verizon device payment
program on plans with unsubsidized service pricing. Partially offsetting
this impact during 2015 was an increase in our retail postpaid connec-
tions per account, as discussed above.
Equipment Revenue
Equipment revenue increased by $6.0 billion, or 54.4%, during 2015 as
a result of an increase in device sales, primarily smartphones, under
the Verizon device payment program, partially offset by a decline in
device sales under traditional fixed-term service plans. For the year
ended December 31, 2015, phone activations under the Verizon device
payment program represented approximately 54% of retail postpaid
phones activated compared to approximately 18% during 2014. During
the fourth quarter of 2015, phone activations under the Verizon device
payment program represented approximately 67% of retail postpaid
phones activated. The increase in these activations resulted in a
relative shift of revenue from service revenue to equipment revenue
and caused a change in the timing of the recognition of revenue.
This shift in revenue was the result of recognizing a higher amount
of equipment revenue at the time of sale of devices under the device
payment program.
Other Revenue
Other revenue includes non- service revenues such as regulatory
fees, cost recovery surcharges, revenues associated with our device
protection package, sublease rentals and financing revenue. Other
revenue increased $0.3 billion, or 7.5%, during 2015 primarily due to
a volume- driven increase in revenues related to our device protec-
tion package.
2014 Compared to 2013Wireless’ total operating revenues increased by $6.6 billion, or 8.2%,
during 2014 primarily as a result of growth in service revenue and
equipment revenue.
Accounts and Connections
Retail postpaid connection net additions increased during 2014
primarily due to an increase in retail postpaid connection gross
additions partially offset by an increase in our retail postpaid connec-
tion churn rate. Higher retail postpaid connection gross additions were
driven by gross additions of tablets as well as 4G LTE smartphones.
During 2014, our retail postpaid connection net additions included
approximately 4.2 million tablets as compared to 1.4 million tablets
in 2013.
Retail Postpaid Connections per Account
Retail postpaid connections per account increased 4.0% as of
December 31, 2014 compared to December 31, 2013 primarily due to
the increased penetration of tablets.
Service Revenue
Service revenue, which does not include recurring device installment
billings related to the Verizon device payment program, increased
by $3.6 billion, or 5.2%, during 2014 primarily driven by higher retail
postpaid service revenue, which increased largely as a result of
an increase in retail postpaid connections as well as the continued
increase in penetration of 4G LTE smartphones and tablets through
our More Everything plans. The penetration of 4G LTE smartphones
was driven by the activation of smartphones by new customers as well
as existing customers migrating from basic phones and 3G smart-
phones to 4G LTE smartphones.
20 Verizon Communications Inc. and Subsidiaries
Management’s Discussion and Analysis of Financial Condition and Results of Operations continued

The increase in retail postpaid ARPA, which does not include recurring
device installment billings related to the Verizon device payment
program, during 2014 was primarily driven by increases in smart-
phone penetration and retail postpaid connections per account. As of
December 31, 2014, we experienced a 4.0% increase in retail postpaid
connections per account compared to 2013, with smartphones rep-
resenting 79% of our retail postpaid phone base as of December 31,
2014 compared to 70% as of December 31, 2013. The increased
penetration in retail postpaid connections per account is primarily due
to increases in Internet data devices, which represented 14.1% of our
retail postpaid connection base as of December 31, 2014 compared
to 10.7% as of December 31, 2013, primarily due to tablet activations.
Additionally, during 2014, postpaid smartphone activations repre-
sented 92% of phones activated compared to 86% during 2013.
Other service revenue increased during 2014 due to growth in
wholesale connections.
Equipment Revenue
Equipment revenue increased during 2014 primarily due to an increase
in device sales under both traditional fixed-term service plans and the
Verizon device payment program.
Operating Expenses(dollars in millions)
Increase/(Decrease)Years Ended December 31, 2015 2014 2013 2015 vs. 2014 2014 vs. 2013
Cost of services $ 7,803 $ 7,200 $ 7,295 $ 603 8.4 % $ (95) (1.3)%
Cost of equipment 23,119 21,625 16,353 1,494 6.9 5,272 32.2
Selling, general and administrative expense 21,805 23,602 23,176 (1,797) (7.6) 426 1.8
Depreciation and amortization expense 8,980 8,459 8,202 521 6.2 257 3.1
Total Operating Expenses $ 61,707 $ 60,886 $ 55,026 $ 821 1.3 $ 5,860 10.6
Cost of Services
Cost of services increased $0.6 billion, or 8.4%, during 2015 primarily
due to higher rent expense as a result of an increase in macro and
small cell sites as well as higher wireless network costs from an
increase in fiber facilities supporting network capacity expansion
and densification, including the deployment of small cell technology,
to meet growing customer demand for 4G LTE data services. Also
contributing to the increase in Cost of services during 2015 was a
volume- driven increase in costs related to the device protection
package offered to our customers.
Cost of Equipment
Cost of equipment increased $1.5 billion, or 6.9%, during 2015 primarily
as a result of an increase in the average cost per unit, driven by a shift
to higher priced units in the mix of devices sold, partially offset by a
decline in the number of units sold.
Cost of equipment increased during 2014 primarily due to an increase
in cost of equipment sales of $5.3 billion as a result of an increase in
the number of devices sold as well as an increase in the cost per unit.
The increase in the number of devices sold was driven, in part, by the
launch of new devices.
Selling, General and Administrative Expense
Selling, general and administrative expense decreased during 2015
primarily due to a $2.8 billion decline in sales commission expense.
The decline in sales commission expense was driven by an increase
in activations under the Verizon device payment program, which has
a lower commission per unit than activations under traditional fixed-
term service plans, partially offset by an increase in bad debt expense.
The increase in bad debt expense was primarily driven by a volume
increase in our device installment receivables, as the credit quality of
our customers remained consistent throughout the periods presented.
Selling, general and administrative expense increased during 2014
primarily due to a $0.2 billion increase in advertising expense and
gains recorded in the first quarter of 2013 related to wireless license
exchange agreements, partially offset by a decline in sales commis-
sion expense, which was driven by the adoption of the Verizon device
payment program.
Depreciation and Amortization Expense
The increase in depreciation and amortization expense increased
during 2015 and 2014, respectively, was primarily driven by an increase
in net depreciable assets.
21Verizon Communications Inc. and Subsidiaries
Management’s Discussion and Analysis of Financial Condition and Results of Operations continued

Segment Operating Income and EBITDA(dollars in millions)
Increase/(Decrease)Years Ended December 31, 2015 2014 2013 2015 vs. 2014 2014 vs. 2013
Segment Operating Income $ 29,973 $ 26,760 $ 25,997 $ 3,213 12.0% $ 763 2.9%
Add Depreciation and amortization expense 8,980 8,459 8,202 521 6.2 257 3.1
Segment EBITDA $ 38,953 $ 35,219 $ 34,199 $ 3,734 10.6 $ 1,020 3.0
Segment operating income margin 32.7% 30.5% 32.1%
Segment EBITDA margin 42.5% 40.2% 42.2%
Segment EBITDA service margin 55.3% 48.5% 49.5%
The changes in the table above during the periods presented were primarily a result of the factors described in connection with operating
revenues and operating expenses.
Non- operational items excluded from Wireless’ Operating income were as follows:
(dollars in millions)
Years Ended December 31, 2015 2014 2013
Gain on spectrum license transactions $ (254) $ (707) $ (278)
Severance, pension and benefit (credits)
charges 5 86 (61)
Other costs – 109 –
$ (249) $ (512) $ (339)
WirelineOur Wireline segment provides voice, data and video communications products and enhanced services, including broadband video and
data, corporate networking solutions, data center and cloud services, security and managed network services and local and long distance
voice services. We provide these products and services to consumers in the United States, as well as to carriers, businesses and government
customers both in the United States and around the world.
The operating results of Verizon’s local exchange business and related landline activities in California, Florida and Texas, which will be sold to
Frontier, are included within our Wireline segment for all periods presented. The assets and liabilities that will be sold are currently included in
Verizon’s continuing operations and classified as assets held for sale and liabilities related to assets held for sale on our consolidated balance
sheet as of December 31, 2015. We expect this transaction to close at the end of the first quarter of 2016.
Operating Revenues and Selected Operating Statistics(dollars in millions)
Increase/(Decrease)Years Ended December 31, 2015 2014 2013 2015 vs. 2014 2014 vs. 2013
Consumer retail $ 16,123 $ 15,583 $ 14,842 $ 540 3.5 % $ 741 5.0 %
Small business 2,350 2,464 2,541 (114) (4.6) (77) (3.0)
Mass Markets 18,473 18,047 17,383 426 2.4 664 3.8
Strategic services 8,165 8,324 8,140 (159) (1.9) 184 2.3
Core 4,778 5,325 6,016 (547) (10.3) (691) (11.5)
Global Enterprise 12,943 13,649 14,156 (706) (5.2) (507) (3.6)
Global Wholesale 5,979 6,190 6,560 (211) (3.4) (370) (5.6)
Other 325 543 525 (218) (40.1) 18 3.4
Total Operating Revenues $ 37,720 $ 38,429 $ 38,624 $ (709) (1.8) $ (195) (0.5)
Connections (’000):(1)
Total voice connections 18,387 19,795 21,085 (1,408) (7.1) (1,290) (6.1)
Total Broadband connections 9,228 9,205 9,015 23 0.2 190 2.1
Fios Internet subscribers 7,034 6,616 6,072 418 6.3 544 9.0
Fios video subscribers 5,827 5,649 5,262 178 3.2 387 7.4
(1) As of end of period
22 Verizon Communications Inc. and Subsidiaries
Management’s Discussion and Analysis of Financial Condition and Results of Operations continued

Wireline’s revenues decreased $0.7 billion, or 1.8%, during 2015
primarily driven by declines in Global Enterprise, partially offset by
higher Mass Markets revenues driven by Fios services. Fios revenues
increased $1.1 billion, or 8.6%, during 2015.
Mass MarketsMass Markets operations provide broadband Internet and video
services (including high-speed Internet, Fios Internet and Fios video
services), local exchange (basic service and end-user access) and
long distance (including regional toll) voice services to residential and
small business subscribers.
2015 Compared to 2014
Mass Markets revenues increased $0.4 billion, or 2.4%, during 2015
primarily due to the expansion of Fios services (voice, Internet and
video), including our Fios Quantum offerings, as well as changes in
our pricing strategies, partially offset by the continued decline of local
exchange revenues.
During 2015, we grew our subscriber base by 0.4 million Fios Internet
subscribers and by 0.2 million Fios video subscribers, while also
improving the penetration rate within our Fios service areas for Fios
Internet. As of December 31, 2015, we achieved a penetration rate of
41.8% for Fios Internet compared to a penetration rate of 41.1% for Fios
Internet as of December 31, 2014. During 2015, Consumer Fios revenue
increased $1.0 billion, or 8.3%. Fios represented approximately 79% of
Consumer retail revenue during 2015 compared to approximately 76%
during 2014.
The decline of local exchange revenues was primarily due to a 6.9%
decline in Consumer retail voice connections resulting primarily from
competition and technology substitution with wireless, competing
VoIP and cable telephony services. Total voice connections include
traditional switched access lines in service as well as Fios digital voice
connections. There was also a 7.1% decline in Small business retail
voice connections, reflecting competition and a shift to both IP and
high-speed circuits, primarily in areas outside of our Fios footprint.
2014 Compared to 2013
Mass Markets revenues increased $0.7 billion, or 3.8%, during 2014
primarily due to the expansion of Fios services (voice, Internet and
video), including our Fios Quantum offerings, as well as changes
in our pricing strategies, partially offset by the continued decline of
local exchange revenues. Fios represented approximately 76% of
Consumer retail revenue during 2014 compared to approximately 71%
during 2013.
During 2014, we grew our subscriber base by 0.5 million Fios Internet
subscribers and by 0.4 million Fios video subscribers, while also
improving penetration rates within our Fios service areas. As of
December 31, 2014, we achieved penetration rates of 41.1% and 35.8%
for Fios Internet and Fios video, respectively, compared to penetration
rates of 39.5% and 35.0% for Fios Internet and Fios video, respectively,
at December 31, 2013.
The increase in Mass Markets revenues was partially offset by the
decline of local exchange revenues primarily due to a 5.5% decline
in Consumer retail voice connections resulting primarily from com-
petition and technology substitution with wireless, competing VoIP
and cable telephony services. Total voice connections include tra-
ditional switched access lines in service as well as Fios digital voice
connections. There was also a decline in Small business retail voice
connections, primarily reflecting competition and a shift to both IP and
high-speed circuits.
Global EnterpriseGlobal Enterprise offers strategic services and other core communica-
tions services to medium and large business customers, multinational
corporations and state and federal government customers.
2015 Compared to 2014
Global Enterprise revenues decreased $0.7 billion, or 5.2%, during
2015 primarily due to a $0.4 billion, or 11.7%, decline in core voice
services and data networking revenues, which consist of traditional
circuit-based services such as frame relay, private line and legacy
voice and data services. These core services declined as a result of
secular declines. Also contributing to the decrease were lower net-
working solutions revenues, a decline in customer premise equipment
revenues and the negative impact of foreign exchange rates.
Networking solutions, which include Private IP, Public Internet, Ethernet
and optical network services, declined $0.2 billion, or 4.6%, as a result
of competitive price compression.
2014 Compared to 2013
Global Enterprise revenues decreased $0.5 billion, or 3.6%, during
2014 primarily due to a decline in voice services and data networking
revenues, which consist of traditional circuit-based services such as
frame relay, private line and legacy voice and data services. These
core services declined as customers continued to migrate to next
generation IP services. Also contributing to the decrease was the
contraction of market rates due to competition and a decline in Core
customer premise equipment revenues. This decrease was partially
offset by an increase in strategic services revenues of $0.2 billion, or
2.3%, primarily due to growth in our application services, such as our
cloud and data center offerings and contract center solutions.
Global WholesaleGlobal Wholesale provides communications services including data,
voice and local dial tone and broadband services primarily to local,
long distance and other carriers that use our facilities to provide
services to their customers.
2015 Compared to 2014
Global Wholesale revenues decreased $0.2 billion, or 3.4%, during
2015 primarily due to declines in traditional voice revenues and data
revenues driven by the effect of technology substitution as well as
continuing contraction of market rates due to competition. The decline
in traditional voice revenue was primarily due to a decrease in minutes
of use (MOUs) driven by a 6.5% decline in domestic wholesale con-
nections between December 31, 2015 and December 31, 2014. As
a result of technology substitution, the number of core data circuits
at December 31, 2015 experienced a 14.5% decline compared to
December 31, 2014.
2014 Compared to 2013
Global Wholesale revenues decreased $0.4 billion, or 5.6%, during
2014 primarily due to a decline in data and traditional voice revenues.
Data revenue declines were driven by the continuing demand for high-
speed digital data services from fiber-to-the-cell customers upgrading
their core data circuits to Ethernet facilities. As a result of the customer
migrations, at December 31, 2014, the number of core data circuits
experienced a 14.2% decline. The traditional voice revenue declines
are primarily due to a decrease in MOUs and the effect of technology
substitution. As of December 31, 2014, we also experienced a 6.2%
decline in domestic wholesale connections. Also contributing to the
decline in voice revenues is the continuing contraction of market rates
due to competition.
23Verizon Communications Inc. and Subsidiaries
Management’s Discussion and Analysis of Financial Condition and Results of Operations continued

Operating Expenses(dollars in millions)
Increase/(Decrease)Years Ended December 31, 2015 2014 2013 2015 vs. 2014 2014 vs. 2013
Cost of services $ 20,878 $ 21,332 $ 21,396 $ (454) (2.1)% $ (64) (0.3)%
Selling, general and administrative expense 7,989 8,180 8,571 (191) (2.3) (391) (4.6)
Depreciation and amortization expense 6,678 7,882 8,327 (1,204) (15.3) (445) (5.3)
Total Operating Expenses $ 35,545 $ 37,394 $ 38,294 $ (1,849) (4.9) $ (900) (2.4)
Cost of Services
Cost of services decreased during 2015 primarily due to a $0.3 billion
decline in employee costs as a result of reduced headcount as
well as a $0.3 billion decline in access costs driven by declines in
overall wholesale long distance volumes. Partially offsetting these
decreases was an increase in content costs of $0.5 billion associated
with continued Fios subscriber growth and programming license
fee increases.
Cost of services decreased slightly during 2014 primarily due to a
decrease in employee costs as a result of reduced headcount and a
decline in access costs driven by declines in overall wholesale long
distance volumes, which was partially offset by an increase in content
costs of $0.4 billion associated with continued Fios subscriber growth
and programming license fee increases.
Selling, General and Administrative Expense
Selling, general and administrative expense decreased during 2015
primarily due to declines in employee costs as a result of reduced
headcount and decreased administrative expenses, partially offset by
an increase in transaction taxes and regulatory expenses.
Selling, general and administrative expense decreased during 2014
primarily due to declines in employee costs as a result of reduced
headcount, decreased advertising expense and lower transaction and
property taxes.
Depreciation and Amortization Expense
Depreciation and amortization expense decreased during 2015
primarily due to $0.9 billion of depreciation and amortization expense
not being recorded on our assets in California, Florida and Texas,
which were classified as held for sale as of February 5, 2015, as well as
decreases in net depreciable assets.
We will not record depreciation and amortization expense on our
depreciable Wireline assets in California, Florida and Texas through
the closing of the transaction with Frontier, which is expected to occur
at the end of the first quarter of 2016.
Depreciation and amortization expense decreased during 2014 due to
decreases in net depreciable assets.
Segment Operating Income and EBITDA(dollars in millions)
Increase/(Decrease)Years Ended December 31, 2015 2014 2013 2015 vs. 2014 2014 vs. 2013
Segment Operating Income $ 2,175 $ 1,035 $ 330 $ 1,140 nm $ 705 nm
Add Depreciation and amortization expense 6,678 7,882 8,327 (1,204) (15.3)% (445) (5.3)%
Segment EBITDA $ 8,853 $ 8,917 $ 8,657 $ (64) (0.7) $ 260 3.0
Segment operating income margin 5.8% 2.7% 0.9%
Segment EBITDA margin 23.5% 23.2% 22.4%
nm - not meaningful
The changes in Wireline’s Operating income, Segment EBITDA and Segment EBITDA margin during the periods presented were primarily a
result of the factors described in connection with operating revenues and operating expenses.
Non- operational items excluded from Wireline’s Operating income were as follows:
(dollars in millions)
Years Ended December 31, 2015 2014 2013
Severance, pension and benefit charges $ 15 $ 189 $ –
Impact of divested operations – (12) (43)
Other costs – 137 –
$ 15 $ 314 $ (43)
24 Verizon Communications Inc. and Subsidiaries
Management’s Discussion and Analysis of Financial Condition and Results of Operations continued

Other ItemsSeverance, Pension and Benefit (Credits) ChargesDuring 2015, we recorded net pre-tax severance, pension and benefit
credits of approximately $2.3 billion primarily for our pension and post-
retirement plans in accordance with our accounting policy to recognize
actuarial gains and losses in the year in which they occur. The credits
were primarily driven by an increase in our discount rate assumption
used to determine the current year liabilities from a weighted- average
of 4.2% at December 31, 2014 to a weighted- average of 4.6% at
December 31, 2015 ($2.5 billion), the execution of a new prescription
drug contract during 2015 ($1.0 billion) and a change in mortality
assumptions primarily driven by the use of updated actuarial tables
(MP-2015) issued by the Society of Actuaries ($0.9 billion), partially
offset by the difference between our estimated return on assets of
7.25% at December 31, 2014 and our actual return on assets of 0.7% at
December 31, 2015 ($1.2 billion), severance costs recorded under our
existing separation plans ($0.6 billion) and other assumption adjust-
ments ($0.3 billion).
During 2014, we recorded net pre-tax severance, pension and
benefit charges of approximately $7.5 billion primarily for our
pension and postretirement plans in accordance with our accounting
policy to recognize actuarial gains and losses in the year in which
they occur. The charges were primarily driven by a decrease in
our discount rate assumption used to determine the current year
liabilities from a weighted- average of 5.0% at December 31, 2013 to
a weighted- average of 4.2% at December 31, 2014 ($5.2 billion), a
change in mortality assumptions primarily driven by the use of updated
actuarial tables (RP-2014 and MP-2014) issued by the Society of
Actuaries in October 2014 ($1.8 billion) and revisions to the retirement
assumptions for participants and other assumption adjustments,
partially offset by the difference between our estimated return on
assets of 7.25% and our actual return on assets of 10.5% ($0.6 billion).
As part of this charge, we recorded severance costs of $0.5 billion
under our existing separation plans.
During 2013, we recorded net pre-tax severance, pension and benefit
credits of approximately $6.2 billion primarily for our pension and post-
retirement plans in accordance with our accounting policy to recognize
actuarial gains and losses in the year in which they occur. The credits
were primarily driven by an increase in our discount rate assumption
used to determine the current year liabilities from a weighted- average
of 4.2% at December 31, 2012 to a weighted- average of 5.0% at
December 31, 2013 ($4.3 billion), lower than assumed retiree medical
costs and other assumption adjustments ($1.4 billion) and the differ-
ence between our estimated return on assets of 7.5% at December 31,
2012 and our actual return on assets of 8.6% at December 31, 2013
($0.5 billion).
The Consolidated Adjusted EBITDA non-GAAP measure presented
in the Consolidated Operating Income and EBITDA discussion (see
“Consolidated Results of Operations”) excludes the severance,
pension and benefit (credits) charges presented above.
Early Debt Redemption and Other CostsDuring March 2014, we recorded net debt redemption costs of
$0.9 billion in connection with the early redemption of $1.25 billion
aggregate principal amount of Cellco Partnership and Verizon Wireless
Capital LLC 8.50% Notes due 2018, and the purchase of the following
notes pursuant to the Tender Offer: $0.7 billion of the then outstanding
$1.5 billion aggregate principal amount of Verizon 6.10% Notes due
2018, $0.8 billion of the then outstanding $1.5 billion aggregate
principal amount of Verizon 5.50% Notes due 2018, $0.6 billion of the
then outstanding $1.3 billion aggregate principal amount of Verizon
8.75% Notes due 2018, $0.7 billion of the then outstanding $1.25 billion
aggregate principal amount of Verizon 5.55% Notes due 2016,
$0.4 billion of the then outstanding $0.75 billion aggregate principal
amount of Verizon 5.50% Notes due 2017, $0.6 billion of the then out-
standing $1.0 billion aggregate principal amount of Cellco Partnership
and Verizon Wireless Capital LLC 8.50% Notes due 2018, $0.2 billion
of the then outstanding $0.3 billion aggregate principal amount of
Alltel Corporation 7.00% Debentures due 2016 and $0.3 billion of
the then outstanding $0.6 billion aggregate principal amount of GTE
Corporation 6.84% Debentures due 2018.
See Note 7 to the consolidated financial statements for additional
information regarding the Tender Offer.
During the fourth quarter of 2014, we recorded net debt redemp-
tion costs of $0.5 billion in connection with the early redemption of
$0.5 billion aggregate principal amount of Verizon 4.90% Notes due
2015, $0.6 billion aggregate principal amount of Verizon 5.55% Notes
due 2016, $1.3 billion aggregate principal amount of Verizon 3.00%
Notes due 2016, $0.4 billion aggregate principal amount of Verizon
5.50% Notes due 2017, $0.7 billion aggregate principal amount of
Verizon 8.75% Notes due 2018, $1.0 billion of the then outstanding
$3.2 billion aggregate principal amount of Verizon 2.50% Notes due
2016, $0.1 billion aggregate principal amount Alltel Corporation 7.00%
Debentures due 2016 and $0.4 billion aggregate principal amount of
Cellco Partnership and Verizon Wireless Capital LLC 8.50% Notes due
2018, as well as $0.3 billion of other costs.
We recognize early debt redemption costs in Other income and
(expense), net on our consolidated statements of income.
Gain on Spectrum License TransactionsDuring the fourth quarter of 2015, we completed a license exchange
transaction with an affiliate of T- Mobile USA Inc. (T- Mobile USA)
to exchange certain AWS and Personal Communication Services
(PCS) licenses. As a result of this non-cash exchange, we received
$0.4 billion of AWS and PCS spectrum licenses at fair value and we
recorded a pre-tax gain of approximately $0.3 billion in Selling, general
and administrative expense on our consolidated statement of income
for the year ended December 31, 2015.
During the second quarter of 2014, we completed license exchange
transactions with T- Mobile USA to exchange certain AWS and PCS
licenses. The exchange included a number of swaps that we expect
will result in more efficient use of the AWS and PCS bands. As a
result of these exchanges, we received $0.9 billion of AWS and PCS
spectrum licenses at fair value and we recorded an immaterial gain.
25Verizon Communications Inc. and Subsidiaries
Management’s Discussion and Analysis of Financial Condition and Results of Operations continued

During the second quarter of 2014, we completed transactions
pursuant to two additional agreements with T- Mobile USA with
respect to our remaining 700 MHz A block spectrum licenses. Under
one agreement, we sold certain of these licenses to T- Mobile USA in
exchange for cash consideration of approximately $2.4 billion, and
under the second agreement we exchanged the remainder of our 700
MHz A block spectrum licenses as well as AWS and PCS spectrum
licenses for AWS and PCS spectrum licenses. As a result, we received
$1.6 billion of AWS and PCS spectrum licenses at fair value and we
recorded a pre-tax gain of approximately $0.7 billion in Selling, general
and administrative expense on our consolidated statement of income
for the year ended December 31, 2014.
During the third quarter of 2013, after receiving the required regu-
latory approvals, Verizon Wireless sold 39 lower 700 MHz B block
spectrum licenses to AT&T in exchange for a payment of $1.9 billion
and the transfer by AT&T to Verizon Wireless of AWS (10 MHz) licenses
in certain markets in the western United States. Verizon Wireless
also sold certain lower 700 MHz B block spectrum licenses to an
investment firm for a payment of $0.2 billion. As a result, we received
$0.5 billion of AWS licenses at fair value and we recorded a pre-tax
gain of approximately $0.3 billion in Selling, general and administrative
expense on our consolidated statement of income for the year ended
December 31, 2013.
The Consolidated Adjusted EBITDA non-GAAP measure presented
in the Consolidated Operating Income and EBITDA discussion (see
“Consolidated Results of Operations”) excludes the gains on the
spectrum license transactions described above.
Wireless Transaction CostsAs a result of the third-party indebtedness incurred to finance the
Wireless Transaction, we incurred interest expense of $0.4 billion
during 2014 (see “Consolidated Financial Condition”). This amount
represents the interest expense incurred prior to the closing of the
Wireless Transaction.
During 2013, as a result of the Wireless Transaction, we recorded costs
of $0.9 billion primarily for interest expense of $0.7 billion related to
the issuance of the new notes, as well as $0.2 billion in fees primarily
in connection with the bridge credit agreement (see “Consolidated
Financial Condition”).
Gain on Sale of Omnitel InterestAs a result of the sale of the Omnitel Interest on February 21, 2014,
which was part of the consideration for the Wireless Transaction, we
recorded a gain of $1.9 billion in Equity in earnings of unconsolidated
businesses on our consolidated statement of income during 2014.
Impact of Divested OperationsOn July 1, 2014, we sold a non- strategic Wireline business that provides
communications solutions to a variety of government agencies.
The Consolidated Adjusted EBITDA non-GAAP measure presented
in the Consolidated Operating Income and EBITDA discussion (see
“Consolidated Results of Operations”) excludes the historical financial
results of the divested operations described above.
Consolidated Financial Condition(dollars in millions)
Years Ended December 31, 2015 2014 2013
Cash Flows Provided By (Used In)Operating activities $ 38,930 $ 30,631 $ 38,818
Investing activities (30,043) (15,856) (14,833)
Financing activities (15,015) (57,705) 26,450
Increase (Decrease) In Cash and Cash Equivalents $ (6,128) $ (42,930) $ 50,435
We use the net cash generated from our operations to fund network
expansion and modernization, service and repay external financing,
pay dividends, invest in new businesses and, when appropriate, buy
back shares of our outstanding common stock. Our sources of funds,
primarily from operations and, to the extent necessary, from external
financing arrangements, are sufficient to meet ongoing operating
and investing requirements. We expect that our capital spending
requirements will continue to be financed primarily through internally
generated funds. Debt or equity financing may be needed to fund
additional investments or development activities or to maintain an
appropriate capital structure to ensure our financial flexibility. Our cash
and cash equivalents are primarily held domestically and are invested
to maintain principal and liquidity. Accordingly, we do not have signifi-
cant exposure to foreign currency fluctuations. See “Market Risk” for
additional information regarding our foreign currency risk management
strategies.
Our available external financing arrangements include an active
commercial paper program, credit available under credit facilities and
other bank lines of credit, vendor financing arrangements, issuances
of registered debt or equity securities and privately- placed capital
market securities. In addition, in 2015, we established an active
program to sell selected device installment plan receivables under the
Verizon device payment program to a group of primarily relationship
banks (Purchasers).
Cash Flows Provided By Operating ActivitiesOur primary source of funds continues to be cash generated from
operations, primarily from our Wireless segment. Net cash provided
by operating activities during 2015 increased by $8.3 billion primarily
due to $5.9 billion of cash proceeds, net of remittances, related to the
sale of wireless device installment receivables as well as $2.4 billion of
cash proceeds received related to the Tower Monetization Transaction
attributable to the portion of the towers for which the right-of-use has
passed to the tower operator (see Note 2) as well as an increase in
earnings at our Wireless segment.
During 2015, we established an on-going program to sell from
time to time, on an uncommitted basis, selected device installment
plan receivables under the Verizon device payment program to
the Purchasers. Under the program, we transfer the receivables
to wholly-owned subsidiaries that are bankruptcy remote special
purpose entities (Sellers). The Sellers then sell the receivables to the
Purchasers for cash and additional consideration upon settlement
of the receivables (the deferred purchase price). The receivables
sold under the program are no longer considered assets of Verizon.
We continue to bill and collect on the receivables in exchange for a
monthly servicing fee, which is not material.
26 Verizon Communications Inc. and Subsidiaries
Management’s Discussion and Analysis of Financial Condition and Results of Operations continued

Net cash provided by operating activities during 2014 decreased by
$8.2 billion due in part to a $3.7 billion increase in income tax payments
due to the incremental pre-tax income attributable to Verizon included
in Verizon’s income since the closing of the Wireless Transaction. Also
contributing to the decrease was a $2.3 billion increase in interest
payments primarily due to the incremental debt needed to fund the
Wireless Transaction as well as a $1.5 billion increase in pension con-
tributions. The decrease in Cash flows provided by operating activities
was partially offset by an increase in earnings at our Wireless segment.
On February 21, 2014, we completed the Wireless Transaction which
provides full access to the cash flows of Verizon Wireless. Having
full access to all the cash flows from our wireless business gives us
the ability to continue to invest in our networks and spectrum, meet
evolving customer requirements for products and services and take
advantage of new growth opportunities across our lines of business.
Cash Flows Used In Investing Activities
Capital ExpendituresCapital expenditures continue to be a primary use of capital resources
as they facilitate the introduction of new products and services,
enhance responsiveness to competitive challenges and increase the
operating efficiency and productivity of our networks.
Capital expenditures, including capitalized software, were as follows:
(dollars in millions)
Years Ended December 31, 2015 2014 2013
Wireless $ 11,725 $ 10,515 $ 9,425
Wireline 5,049 5,750 6,229
Other 1,001 926 950
$ 17,775 $ 17,191 $ 16,604
Total as a percentage of revenue 13.5% 13.5% 13.8%
Capital expenditures increased at Wireless in 2015 and 2014 in order
to increase the capacity of our 4G LTE network. Capital expenditures
declined at Wireline in 2015 and 2014 as a result of decreased legacy
spending requirements as well as decreased Fios spending require-
ments in 2015.
AcquisitionsDuring 2015, 2014 and 2013, we invested $9.9 billion, $0.4 billion and
$0.6 billion, respectively, in acquisitions of wireless licenses. During
2015, 2014 and 2013, we also invested $3.5 billion, $0.2 billion and
$0.5 billion, respectively, in acquisitions of investments and businesses,
net of cash acquired.
On January 29, 2015, the FCC completed an auction of 65 MHz of
spectrum, which it identified as the AWS-3 band. Verizon participated
in that auction, and was the high bidder on 181 spectrum licenses,
for which we paid cash of approximately $10.4 billion. During the
fourth quarter of 2014, we made a deposit of $0.9 billion related to
our participation in this auction, which is classified within Other, net
investing activities on our consolidated statement of cash flows for the
year ended December 31, 2014. During the first quarter of 2015, we
submitted an application to the FCC and paid $9.5 billion to the FCC to
complete payment for these licenses. The cash payment of $9.5 billion
is classified within Acquisitions of wireless licenses on our consoli-
dated statement of cash flows for the year ended December 31, 2015.
On April 8, 2015, the FCC granted us these spectrum licenses.
On May 12, 2015, we entered into the Merger Agreement with AOL
pursuant to which we commenced a tender offer to acquire all of the
outstanding shares of common stock of AOL at a price of $50.00 per
share, net to the seller in cash, without interest and less any applicable
withholding taxes. On June 23, 2015, we completed the tender offer
and merger, and AOL became a wholly-owned subsidiary of Verizon.
The aggregate cash consideration paid by Verizon at the closing of
these transactions was approximately $3.8 billion, net of cash acquired
of $0.5 billion. Holders of approximately 6.6 million shares exercised
appraisal rights under Delaware law. If they had not exercised these
rights, Verizon would have paid an additional $330 million for such
shares at closing. See Note 2 to the consolidated financial statements
for additional information.
In October 2015, AOL acquired an advertising technology business for
cash consideration that was not significant.
In February 2014, Verizon acquired a business dedicated to the devel-
opment of IP television for cash consideration that was not significant.
During the fourth quarter of 2013, Verizon acquired an industry leader
in content delivery networks for $0.4 billion. Additionally, we acquired a
technology company for cash consideration that was not significant.
DispositionsDuring 2014, we received proceeds of $2.4 billion related to spectrum
license transactions and $0.1 billion related to the disposition of a non-
strategic Wireline business. See Note 2 to the consolidated financial
statements for additional information.
During 2013, we completed the sale of 700 MHz lower B block
spectrum licenses and as a result, we received proceeds of $2.1 billion.
Other, netOn May 19, 2015, Verizon consummated a sale- leaseback transac-
tion with a financial services firm for the buildings and real estate at
our Basking Ridge, New Jersey location. We received total gross
proceeds of $0.7 billion resulting in a deferred gain of $0.4 billion,
which will be amortized over the initial leaseback term of twenty years.
The leaseback of the buildings and real estate is accounted for as an
operating lease. The proceeds received as a result of this transaction
have been classified within Other, net investing activities for the year
ended December 31, 2015. Also in 2015, Verizon received proceeds of
$0.2 billion related to a sale of real estate.
Cash Flows Provided by (Used In) Financing ActivitiesWe seek to maintain a mix of fixed and variable rate debt to lower
borrowing costs within reasonable risk parameters. During 2015,
2014 and 2013, net cash provided by (used in) financing activities was
$(15.0) billion, $(57.7) billion and $26.5 billion, respectively.
2015During 2015, our net cash used in financing activities of $15.0 billion
was primarily driven by:
• $9.3 billion used for repayments of long-term borrowings and capital
lease obligations, including the repayment of $6.5 billion of borrow-
ings under a term loan agreement;
• $8.5 billion used for dividend payments; and
• $5.0 billion payment for our accelerated share repurchase agreement.
27Verizon Communications Inc. and Subsidiaries
Management’s Discussion and Analysis of Financial Condition and Results of Operations continued

These uses of cash were partially offset by proceeds from long-term
borrowings of $6.7 billion, which included $6.5 billion of borrowings
under a term loan agreement which was used for general corporate
purposes, including the acquisition of spectrum licenses, as well
as $2.7 billion of cash proceeds received related to the Tower
Monetization Transaction attributable to the portion of the towers that
we continue to occupy and use for network operations.
Proceeds from and Repayments of Long-Term Borrowings
At December 31, 2015, our total debt decreased to $110.2 billion as
compared to $113.3 billion at December 31, 2014. The substantial
majority of our total debt portfolio consists of fixed rate indebtedness,
therefore, changes in interest rates do not have a material effect on our
interest payments. See Note 7 to the consolidated financial statements
for additional details regarding our debt activity.
At December 31, 2015, approximately $8.2 billion or 7.5% of the
aggregate principal amount of our total debt portfolio consisted
of foreign denominated debt, primarily the Euro and British Pound
Sterling. We have entered into cross currency swaps in order to fix our
future interest and principal payments in U.S. dollars and mitigate the
impact of foreign currency transaction gains or losses. See “Market
Risk” for additional information.
Verizon may continue to acquire debt securities issued by Verizon and
its affiliates in the future through open market purchases, privately
negotiated transactions, tender offers, exchange offers, or otherwise,
upon such terms and at such prices as Verizon may from time to time
determine for cash or other consideration.
Other, net
Other, net financing activities during 2015, include $2.7 billion of cash
proceeds received related to the Tower Monetization Transaction,
which relates to the portion of the towers that we continue to occupy
and use for network operations, partially offset by the settlement of
derivatives upon maturity for $0.4 billion.
Dividends
The Verizon Board of Directors assesses the level of our dividend
payments on a periodic basis taking into account such factors as
long-term growth opportunities, internal cash requirements and the
expectations of our shareholders. During the third quarter of 2015, the
Board increased our quarterly dividend payment 2.7% to $.565 per
share from $.550 per share in the prior period. This is the ninth consec-
utive year that Verizon’s Board of Directors has approved a quarterly
dividend increase.
As in prior periods, dividend payments were a significant use of capital
resources. During 2015, we paid $8.5 billion in dividends.
2014During 2014, our net cash used in financing activities of $57.7 billion
was primarily driven by:
• $58.9 billion used to partially fund the Wireless Transaction (see
Note 2 to the consolidated financial statements);
• $17.7 billion used for repayments of long-term borrowings and
capital lease obligations; and
• $7.8 billion used for dividend payments.
These uses of cash were partially offset by proceeds from long-term
borrowings of $31.0 billion.
Proceeds from and Repayments of Long-Term Borrowings
At December 31, 2014, our total debt increased to $113.3 billion as
compared to $93.6 billion at December 31, 2013 primarily as a result
of additional debt issued to finance the Wireless Transaction. Since
the substantial majority of our total debt portfolio consists of fixed rate
indebtedness, changes in interest rates do not have a material effect
on our interest payments. Throughout 2014, we accessed the capital
markets to optimize the maturity schedule of our debt portfolio and
take advantage of lower interest rates, thereby reducing our effective
interest rate to 4.9% from 5.2% in 2013. See Note 7 to the consolidated
financial statements for additional details regarding our debt activity.
At December 31, 2014, approximately $9.6 billion or 8.5% of the
aggregate principal amount of our total debt portfolio consisted
of foreign denominated debt, primarily the Euro and British Pound
Sterling. We have entered into cross currency swaps in order to fix our
future interest and principal payments in U.S. dollars and mitigate the
impact of foreign currency transaction gains or losses. See “Market
Risk” for additional information.
See “Other Items” for additional information related to the early debt
redemption costs incurred in 2014.
Dividends
During the third quarter of 2014, the Board increased our quarterly
dividend payment 3.8% to $.550 per share from $.530 per share in
the same period of 2013. As in prior periods, dividend payments were
a significant use of capital resources. During 2014, we paid $7.8 billion
in dividends compared to $5.9 billion in 2013. The increase is primarily
due to the issuance of approximately 1.27 billion additional shares of
common stock as a result of the Wireless Transaction.
2013During 2013, our net cash provided by financing activities of
$26.5 billion was primarily driven by proceeds from long-term borrow-
ings of $49.2 billion to fund the Wireless Transaction. This source of
cash was partially offset by:
• $8.2 billion used for repayments of long-term borrowings and capital
lease obligations;
• $5.9 billion used for dividend payments; and
• $3.2 billion used for a special distribution to a noncontrolling interest.
Proceeds from and Repayments of Long-Term Borrowings
At December 31, 2013, our total debt increased to $93.6 billion as
compared to $52.0 billion at December 31, 2012 primarily as a result
of additional debt issued to finance the Wireless Transaction. Since
the substantial majority of our total debt portfolio consists of fixed rate
indebtedness, changes in interest rates do not have a material effect
on our interest payments. See Note 7 to the consolidated financial
statements for additional details regarding our debt activity.
Dividends
During the third quarter of 2013, the Board increased our quarterly
dividend payment 2.9% to $.530 per share from $.515 per share in the
same period of 2012. As in prior periods, dividend payments were a
significant use of capital resources.
Special Distributions
In May 2013, the Board of Representatives of Verizon Wireless
declared a distribution to its owners, which was paid in the second
quarter of 2013 in proportion to their partnership interests on the
payment date, in the aggregate amount of $7.0 billion. As a result,
Vodafone received a cash payment of $3.15 billion and the remainder
of the distribution was received by Verizon.
28 Verizon Communications Inc. and Subsidiaries
Management’s Discussion and Analysis of Financial Condition and Results of Operations continued

Other, net
The change in Other, net financing activities during 2013 was primarily
driven by higher distributions to Vodafone, which owned a 45% non-
controlling interest in Verizon Wireless as of December 31, 2013.
Credit FacilityAs of December 31, 2015, the unused borrowing capacity under our
$8.0 billion four-year credit facility was approximately $7.9 billion. The
credit facility does not require us to comply with financial covenants
or maintain specified credit ratings, and it permits us to borrow even
if our business has incurred a material adverse change. We use the
credit facility for the issuance of letters of credit and for general
corporate purposes.
Common StockCommon stock has been used from time to time to satisfy some
of the funding requirements of employee and shareholder plans,
including 22.6 million, 18.2 million and 6.9 million common shares
issued from Treasury stock during 2015, 2014 and 2013, respectively,
which had aggregate values of $0.9 billion, $0.7 billion and $0.3 billion,
respectively.
In February 2015, the Verizon Board of Directors authorized Verizon to
enter into an accelerated share repurchase (ASR) agreement to repur-
chase $5.0 billion of the Company’s common stock. On February 10,
2015, in exchange for an upfront payment totaling $5.0 billion, Verizon
received an initial delivery of 86.2 million shares having a value of
approximately $4.25 billion. On June 5, 2015, Verizon received an addi-
tional 15.4 million shares as final settlement of the transaction under
the ASR agreement. In total, 101.6 million shares were delivered under
the ASR at an average repurchase price of $49.21.
On March 7, 2014, the Verizon Board of Directors approved a share
buyback program, which authorizes the repurchase of up to 100 million
shares of Verizon common stock terminating no later than the close of
business on February 28, 2017. The program permits Verizon to repur-
chase shares over time, with the amount and timing of repurchases
depending on market conditions and corporate needs. The Board also
determined that no additional shares were to be purchased under the
prior program. During 2015, we repurchased $0.1 billion of our common
stock as part of our previously announced share buyback program.
There were no repurchases of common stock during 2014. During
2013, we repurchased $0.2 billion of our common stock under our
previous share buyback program.
As a result of the Wireless Transaction, in February 2014, Verizon
issued approximately 1.27 billion shares.
Credit RatingsVerizon’s credit ratings did not change in 2015 or 2014.
During the third quarter of 2013, Verizon’s credit ratings were down-
graded by Moody’s Investors Service (Moody’s), Standard & Poor’s
Ratings Services (Standard & Poor’s) and Fitch Ratings (Fitch) as
a result of Verizon’s announcement of the agreement to acquire
Vodafone’s 45% noncontrolling interest in Verizon Wireless for
approximately $130 billion including the incurrence of third-party
indebtedness to fund the cash portion of the purchase price for the
Wireless Transaction. Moody’s downgraded Verizon’s long-term debt
ratings one notch from A3 to Baa1, while Standard & Poor’s lowered
its corporate credit rating and senior unsecured debt rating one notch
from A- to BBB+ and Fitch lowered its long-term issuer default rating
and senior unsecured debt rating one notch from A to A-.
Securities ratings assigned by rating organizations are expressions of
opinion and are not recommendations to buy, sell or hold securities. A
securities rating is subject to revision or withdrawal at any time by the
assigning rating organization. Each rating should be evaluated inde-
pendently of any other rating.
CovenantsOur credit agreements contain covenants that are typical for large,
investment grade companies. These covenants include requirements
to pay interest and principal in a timely fashion, pay taxes, maintain
insurance with responsible and reputable insurance companies,
preserve our corporate existence, keep appropriate books and
records of financial transactions, maintain our properties, provide
financial and other reports to our lenders, limit pledging and dispo-
sition of assets and mergers and consolidations, and other similar
covenants. Additionally, our term loan credit agreement requires us to
maintain a leverage ratio (as such term is defined in those agreements)
not in excess of 3.50:1.00 until our credit ratings are equal to or higher
than A3 and A-. See Note 7 to the consolidated financial statements for
additional details related to our term loan credit agreement.
We and our consolidated subsidiaries are in compliance with all of our
financial and restrictive covenants.
Increase (Decrease) In Cash and Cash EquivalentsOur Cash and cash equivalents at December 31, 2015 totaled
$4.5 billion, a $6.1 billion decrease compared to Cash and cash
equivalents at December 31, 2014 primarily as a result of the factors
discussed above. Our Cash and cash equivalents at December 31,
2014 totaled $10.6 billion, a $42.9 billion decrease compared to Cash
and cash equivalents at December 31, 2013 primarily as a result of
the cash payment made to Vodafone as part of the completion of the
Wireless Transaction.
Free Cash FlowFree cash flow is a non-GAAP financial measure that management
believes is useful to investors and other users of Verizon’s financial
information in evaluating cash available to pay debt and dividends.
Free cash flow is calculated by subtracting capital expenditures from
net cash provided by operating activities. The following table recon-
ciles net cash provided by operating activities to Free cash flow:
(dollars in millions)
Years Ended December 31, 2015 2014 2013
Net cash provided by operating
activities $ 38,930 $ 30,631 $ 38,818
Less Capital expenditures
(including capitalized software) 17,775 17,191 16,604
Free cash flow $ 21,155 $ 13,440 $ 22,214
The changes in free cash flow during 2015, 2014 and 2013 were a
result of the factors described in connection with net cash provided by
operating activities and capital expenditures. During 2015, we received
$5.9 billion of cash proceeds, net of remittances, related to the sale of
wireless device installment receivables as well as $2.4 billion of cash
proceeds received related to the Tower Monetization Transaction
attributable to the portion of the towers for which the right-of-use has
passed to the tower operator. On February 21, 2014, we completed the
Wireless Transaction which provides full access to the cash flows of
Verizon Wireless. The completion of the Wireless Transaction resulted
in an increase in income tax payments as well as an increase in interest
payments, which reduced our net cash provided by operating activities
during 2014 (see “Cash Flows Provided by Operating Activities”).
29Verizon Communications Inc. and Subsidiaries
Management’s Discussion and Analysis of Financial Condition and Results of Operations continued

Employee Benefit Plan Funded Status and Contributions
Employer ContributionsWe operate numerous qualified and nonqualified pension plans and
other postretirement benefit plans. These plans primarily relate to our
domestic business units. During 2015 and 2014, contributions to our
qualified pension plans were $0.7 billion and $1.5 billion, respectively.
During 2013, contributions to our qualified pension plans were not
material. We also contributed $0.1 billion, $0.1 billion and $0.1 billion to
our nonqualified pension plans in 2015, 2014 and 2013, respectively.
In an effort to reduce the risk of our portfolio strategy and better
align assets with liabilities, we have adopted a liability driven pension
strategy that seeks to better match cash flows from investments
with projected benefit payments. We expect that the strategy will
reduce the likelihood that assets will decline at a time when liabilities
increase (referred to as liability hedging), with the goal to reduce the
risk of underfunding to the plan and its participants and beneficia-
ries, however, we also expect the strategy to result in lower asset
returns. Based on this strategy and the funded status of the plans at
December 31, 2015, we expect the minimum required qualified pension
plan contribution in 2016 to be $0.6 billion. Nonqualified pension contri-
butions are estimated to be approximately $0.1 billion in 2016.
Contributions to our other postretirement benefit plans generally
relate to payments for benefits on an as- incurred basis since the other
postretirement benefit plans do not have funding requirements similar
to the pension plans. We contributed $0.9 billion, $0.7 billion and
$1.4 billion to our other postretirement benefit plans in 2015, 2014 and
2013, respectively. Contributions to our other postretirement benefit
plans are estimated to be approximately $0.9 billion in 2016.
Leasing ArrangementsSee Note 6 to the consolidated financial statements for a discussion of leasing arrangements.
Off Balance Sheet Arrangements and Contractual Obligations
Contractual Obligations and Commercial CommitmentsThe following table provides a summary of our contractual obligations and commercial commitments at December 31, 2015. Additional detail
about these items is included in the notes to the consolidated financial statements.
(dollars in millions)
Payments Due By Period
Contractual Obligations Total
Less than
1 year 1–3 years 3–5 years
More than
5 years
Long-term debt(1) $ 109,073 $ 6,054 $ 10,843 $ 14,381 $ 77,795
Capital lease obligations(2) 957 271 424 124 138
Total long-term debt, including current maturities 110,030 6,325 11,267 14,505 77,933
Interest on long-term debt(1) 88,562 5,058 9,731 8,880 64,893
Operating leases(2) 18,213 2,744 4,697 3,475 7,297
Purchase obligations(3) 21,934 8,440 9,166 2,278 2,050
Other long-term liabilities(4) 2,402 1,462 940 – –
Finance obligations(5) 2,625 261 538 560 1,266
Total contractual obligations $ 243,766 $ 24,290 $ 36,339 $ 29,698 $ 153,439
(1) Items included in long-term debt with variable coupon rates are described in Note 7 to the consolidated financial statements.
(2) See Note 6 to the consolidated financial statements.
(3) The purchase obligations reflected above are primarily commitments to purchase programming and network services, equipment, software, handsets and peripherals, and marketing
activities, which will be used or sold in the ordinary course of business. These amounts do not represent our entire anticipated purchases in the future, but represent only those items
that are the subject of contractual obligations. We also purchase products and services as needed with no firm commitment. For this reason, the amounts presented in this table alone
do not provide a reliable indicator of our expected future cash outflows or changes in our expected cash position (see Note 16 to the consolidated financial statements).
(4) Other long-term liabilities include estimated postretirement benefit and qualified pension plan contributions (see Note 11 to the consolidated financial statements).
(5) Represents future minimum payments under the sublease arrangement for our tower transaction (see Note 2 to the consolidated financial statements).
We are not able to make a reliable estimate of when the unrecognized tax benefits balance of $1.6 billion and related interest and penalties
will be settled with the respective taxing authorities until issues or examinations are further developed (see Note 12 to the consolidated
financial statements).
30 Verizon Communications Inc. and Subsidiaries
Management’s Discussion and Analysis of Financial Condition and Results of Operations continued

GuaranteesWe guarantee the debentures and first mortgage bonds of our
operating telephone company subsidiaries as well as the debt obli-
gations of GTE Corporation that were issued and outstanding prior to
July 1, 2003 (see Note 7 to the consolidated financial statements).
In connection with the execution of agreements for the sale of busi-
nesses and investments, Verizon ordinarily provides representations
and warranties to the purchasers pertaining to a variety of nonfinancial
matters, such as ownership of the securities being sold, as well as
financial losses (see Note 16 to the consolidated financial statements).
As of December 31, 2015, letters of credit totaling approximately
$0.1 billion, which were executed in the normal course of business
and support several financing arrangements and payment obligations
to third parties, were outstanding (see Note 16 to the consolidated
financial statements).
Market RiskWe are exposed to various types of market risk in the normal course
of business, including the impact of interest rate changes, foreign
currency exchange rate fluctuations, changes in investment, equity
and commodity prices and changes in corporate tax rates. We employ
risk management strategies, which may include the use of a variety
of derivatives including cross currency swaps, foreign currency
and prepaid forwards and collars, interest rate swap agreements,
commodity swap and forward agreements and interest rate locks. We
do not hold derivatives for trading purposes.
It is our general policy to enter into interest rate, foreign currency and
other derivative transactions only to the extent necessary to achieve
our desired objectives in optimizing exposure to various market risks.
Our objectives include maintaining a mix of fixed and variable rate
debt to lower borrowing costs within reasonable risk parameters
and to protect against earnings and cash flow volatility resulting
from changes in market conditions. We do not hedge our market risk
exposure in a manner that would completely eliminate the effect of
changes in interest rates and foreign exchange rates on our earnings.
At December 31, 2015 and 2014, we posted collateral of approximately
$0.1 billion and $0.6 billion, respectively, related to derivative contracts
under collateral exchange arrangements. During the first and second
quarter of 2015, we paid an immaterial amount of cash to enter into
amendments to certain collateral exchange arrangements. These
amendments suspend cash collateral posting for a specified period of
time by both counterparties. While we may be exposed to credit losses
due to the nonperformance of our counterparties, we consider the
risk remote. As such, we do not expect that our results of operations
or financial condition will be materially affected by these risk manage-
ment strategies.
Interest Rate RiskWe are exposed to changes in interest rates, primarily on our short-
term debt and the portion of long-term debt that carries floating
interest rates. As of December 31, 2015, approximately 81% of the
aggregate principal amount of our total debt portfolio consisted of
fixed rate indebtedness, including the effect of interest rate swap
agreements designated as hedges. The impact of a 100 basis point
change in interest rates affecting our floating rate debt would result
in a change in annual interest expense, including our interest rate
swap agreements that are designated as hedges, of approximately
$0.2 billion. The interest rates on substantially all of our existing
long-term debt obligations are unaffected by changes to our
credit ratings.
The table that follows summarizes the fair values of our long-term
debt, including current maturities, and interest rate swap derivatives as
of December 31, 2015 and 2014. The table also provides a sensitivity
analysis of the estimated fair values of these financial instruments
assuming 100-basis-point upward and downward shifts in the yield
curve. Our sensitivity analysis does not include the fair values of our
commercial paper and bank loans, if any, because they are not signifi-
cantly affected by changes in market interest rates.
(dollars in millions)
Long-term debt and
related derivatives Fair Value
Fair Value
assuming
+ 100 basis
point shift
Fair Value
assuming
− 100 basis
point shift
At December 31, 2015 $ 117,943 $ 108,992 $ 128,641At December 31, 2014 126,139 115,695 138,420
Interest Rate SwapsWe enter into domestic interest rate swaps to achieve a targeted mix of
fixed and variable rate debt. We principally receive fixed rates and pay
variable rates based on LIBOR, resulting in a net increase or decrease
to Interest expense. These swaps are designated as fair value hedges
and hedge against changes in the fair value of our debt portfolio. We
record the interest rate swaps at fair value on our consolidated balance
sheets as assets and liabilities.
During the third quarter of 2015, we entered into interest rate swaps
with a total notional value of $3.2 billion. During the fourth quarter of
2015, we entered into interest rate swaps with a total notional value of
$2.6 billion. At December 31, 2015 and 2014, the total notional amount
of the interest rate swaps was $7.6 billion and $1.8 billion, respectively.
The fair value of these contracts was $0.1 billion at December 31, 2015
and was not material at December 31, 2014. The ineffective portion
of these interest rate swaps was not material at December 31, 2015
and 2014.
Forward Interest Rate SwapsIn order to manage our exposure to future interest rate changes, we
have entered into forward interest rate swaps. We designated these
contracts as cash flow hedges. At December 31, 2014, these swaps
had a notional value of $2.0 billion. The fair value of these contracts
was $0.2 billion at December 31, 2014, which was included within
Other liabilities on our consolidated balance sheet. During the third
quarter of 2015, we settled these forward interest rate swaps and the
pre-tax loss was not material. During the third quarter of 2015, we
entered into forward interest rate swaps with a total notional value
of $0.8 billion. The fair value of these contracts was not material at
December 31, 2015.
Foreign Currency TranslationThe functional currency for our foreign operations is primarily the local
currency. The translation of income statement and balance sheet
amounts of our foreign operations into U.S. dollars is recorded as
cumulative translation adjustments, which are included in Accumulated
other comprehensive income in our consolidated balance sheets.
Gains and losses on foreign currency transactions are recorded in the
consolidated statements of income in Other income and (expense),
net. At December 31, 2015, our primary translation exposure was to the
British Pound Sterling, Euro and Australian Dollar.
31Verizon Communications Inc. and Subsidiaries
Management’s Discussion and Analysis of Financial Condition and Results of Operations continued

Cross Currency SwapsVerizon Wireless previously entered into cross currency swaps des-
ignated as cash flow hedges to exchange approximately $1.6 billion
of British Pound Sterling and Euro- denominated debt into U.S. dollars
and to fix our future interest and principal payments in U.S. dollars, as
well as to mitigate the impact of foreign currency transaction gains or
losses. In June 2014, we settled $0.8 billion of these cross currency
swaps and the gains with respect to these swaps were not material. In
December 2015, we settled $0.6 billion of these cross currency swaps
on maturity.
During the first quarter of 2014, we entered into cross currency
swaps designated as cash flow hedges to exchange approximately
$5.4 billion of Euro and British Pound Sterling denominated debt into
U.S. dollars. During the second quarter of 2014, we entered into cross
currency swaps designated as cash flow hedges to exchange approx-
imately $1.2 billion of British Pound Sterling denominated debt into
U.S. dollars. During the fourth quarter of 2014, we entered into cross
currency swaps designated as cash flow hedges to exchange approxi-
mately $3.0 billion of Euro denominated debt into U.S. dollars and to fix
our future interest and principal payments in U.S. dollars. Each of these
cross currency swaps was entered into in order to mitigate the impact
of foreign currency transaction gains or losses.
A portion of the gains and losses recognized in Other comprehensive
income was reclassified to Other income and (expense), net to offset
the related pre-tax foreign currency transaction gain or loss on the
underlying debt obligations. The fair value of the outstanding swaps
was $1.6 billion and $0.6 billion, which was primarily included within
Other liabilities on our consolidated balance sheets at December 31,
2015 and 2014, respectively. At December 31, 2015, the total notional
amount of the cross currency swaps was $9.7 billion. During 2015
and 2014, a pre-tax loss of $1.2 billion and a pre-tax loss of $0.1 billion,
respectively, was recognized in Other comprehensive income with
respect to these swaps.
Net Investment HedgesWe entered into foreign currency forward contracts that are des-
ignated as net investment hedges to mitigate foreign exchange
exposure related to non-U.S. dollar net investments in certain foreign
subsidiaries against changes in foreign exchange rates. During
the third quarter of 2015, we entered into net investment hedges
with a total notional value of $0.9 billion with the contract tenor
maturing in 2018. The fair value of these contracts was not material at
December 31, 2015.
Critical Accounting Estimates and Recently Issued Accounting StandardsCritical Accounting EstimatesA summary of the critical accounting estimates used in preparing our
financial statements is as follows:
• Wireless licenses and Goodwill are a significant component of
our consolidated assets. Both our wireless licenses and goodwill
are treated as indefinite-lived intangible assets and, therefore are
not amortized, but rather are tested for impairment annually in the
fourth fiscal quarter, unless there are events requiring an earlier
assessment or changes in circumstances during an interim period
that indicate these assets may not be recoverable. We believe our
estimates and assumptions are reasonable and represent appro-
priate marketplace considerations as of the valuation date. Although
we use consistent methodologies in developing the assumptions
and estimates underlying the fair value calculations used in our
impairment tests, these estimates are uncertain by nature and can
vary from actual results. It is possible that in the future there may be
changes in our assumptions, including estimated cash flow projec-
tions, margins, growth rates and discount rate, which could result in
different fair value estimates and an impairment charge.
Wireless Licenses
The carrying value of our wireless licenses was approximately
$86.6 billion as of December 31, 2015. We aggregate our wireless
licenses into one single unit of accounting, as we utilize our wireless
licenses on an integrated basis as part of our nationwide wireless
network. Our wireless licenses provide us with the exclusive right
to utilize certain radio frequency spectrum to provide wireless
communication services. There are currently no legal, regulatory,
contractual, competitive, economic or other factors that limit the
useful life of our wireless licenses.
In 2015, our quantitative impairment test consisted of comparing the
estimated fair value of our aggregate wireless licenses to the aggre-
gated carrying amount as of the test date. If the estimated fair value
of our aggregated wireless licenses is less than the aggregated
carrying amount of the wireless licenses then an impairment charge
would have been recognized. Our quantitative impairment test for
2015 indicated that the fair value significantly exceeded the carrying
value and, therefore, did not result in an impairment.
In 2015, using a quantitative assessment, we estimated the fair
value of our wireless licenses using the Greenfield approach.
The Greenfield approach is an income based valuation approach
that values the wireless licenses by calculating the cash flow
generating potential of a hypothetical start-up company that goes
into business with no assets except the wireless licenses to be
valued. A discounted cash flow analysis is used to estimate what
a marketplace participant would be willing to pay to purchase
the aggregated wireless licenses as of the valuation date. As a
result, we were required to make significant estimates about future
cash flows specifically associated with our wireless licenses, an
appropriate discount rate based on the risk associated with those
estimated cash flows and assumed terminal value and growth rates.
We considered current and expected future economic conditions,
current and expected availability of wireless network technology
and infrastructure and related equipment and the costs thereof as
well as other relevant factors in estimating future cash flows. The
discount rate represented our estimate of the weighted- average
cost of capital (WACC), or expected return, that a marketplace par-
ticipant would have required as of the valuation date. We developed
the discount rate based on our consideration of the cost of debt
32 Verizon Communications Inc. and Subsidiaries
Management’s Discussion and Analysis of Financial Condition and Results of Operations continued

and equity of a group of guideline companies as of the valuation
date. Accordingly, our discount rate incorporated our estimate of
the expected return a marketplace participant would have required
as of the valuation date, including the risk premium associated with
the current and expected economic conditions as of the valuation
date. The terminal value growth rate represented our estimate of the
marketplace’s long-term growth rate.
In 2014 and 2013, we performed a qualitative impairment assess-
ment to determine whether it is more likely than not that the fair
value of our wireless licenses was less than the carrying amount. As
part of our assessment we considered several qualitative factors
including the business enterprise value of Wireless, macroeconomic
conditions (including changes in interest rates and discount rates),
industry and market considerations (including industry revenue and
EBITDA margin projections), the projected financial performance of
Wireless, as well as other factors. Based on our assessment in 2014
and 2013, we qualitatively concluded that it was more likely than not
that the fair value of our wireless licenses significantly exceeded
their carrying value and therefore, did not result in an impairment.
Goodwill
At December 31, 2015, the balance of our goodwill was approx-
imately $25.3 billion, of which $18.4 billion was in our Wireless
reporting unit, $4.3 billion was in our Wireline reporting unit and
$2.6 billion was in our other reporting unit. Determining whether an
impairment has occurred requires the determination of fair value of
each respective reporting unit. The fair value of our reporting units
exceeded the carrying values. Accordingly, our annual impairment
tests for 2015, 2014 and 2013 did not result in an impairment. In
the event of a 10% decline in the fair value of any of our reporting
units, the fair value would have still exceeded the book value of the
reporting unit and no impairment charge would be recorded.
The fair value of the reporting unit is calculated using a market
approach and a discounted cash flow method. The market
approach includes the use of comparative multiples to corroborate
discounted cash flow results. The discounted cash flow method
is based on the present value of two components — projected
cash flows and a terminal value. The terminal value represents the
expected normalized future cash flows of the reporting unit beyond
the cash flows from the discrete projection period. The fair value
of the reporting unit is calculated based on the sum of the present
value of the cash flows from the discrete period and the present
value of the terminal value. The discount rate represented our
estimate of the WACC, or expected return, that a marketplace par-
ticipant would have required as of the valuation date.
• We maintain benefit plans for most of our employees, including, for
certain employees, pension and other postretirement benefit plans.
At December 31, 2015, in the aggregate, pension plan benefit obliga-
tions exceeded the fair value of pension plan assets, which will result
in higher future pension plan expense. Other postretirement benefit
plans have larger benefit obligations than plan assets, resulting
in expense. Significant benefit plan assumptions, including the
discount rate used, the long-term rate of return on plan assets, the
determination of the substantive plan and health care trend rates are
periodically updated and impact the amount of benefit plan income,
expense, assets and obligations. Changes to one or more of these
assumptions could significantly impact our accounting for pension
and other postretirement benefits. A sensitivity analysis of the
impact of changes in these assumptions on the benefit obligations
and expense (income) recorded, as well as on the funded status due
to an increase or a decrease in the actual versus expected return on
plan assets as of December 31, 2015 and for the year then ended
pertaining to Verizon’s pension and postretirement benefit plans is
provided in the table below.
(dollars in millions)
Percentage point
change
Increase (decrease) at December 31,
2015*
Pension plans discount rate +0.50 $ (1,195)
−0.50 1,333
Rate of return on pension plan assets +1.00 (175)
−1.00 175
Postretirement plans discount rate +0.50 (1,565)
−0.50 1,761
Rate of return on postretirement plan assets +1.00 (21)
−1.00 21
Health care trend rates +1.00 3,074
−1.00 (2,516)
* In determining its pension and other postretirement obligation, the Company used a
weighted- average discount rate of 4.6%. The rate was selected to approximate the
composite interest rates available on a selection of high- quality bonds available in
the market at December 31, 2015. The bonds selected had maturities that coincided
with the time periods during which benefits payments are expected to occur, were
non- callable and available in sufficient quantities to ensure marketability (at least
$0.3 billion par outstanding).
The annual measurement date for both our pension and other
postretirement benefits is December 31st. Effective January 1, 2016,
we adopted the full yield curve approach to estimate the interest
cost component of net periodic benefit cost for pension and other
postretirement benefits. We will account for this change as a
change in accounting estimate and, accordingly, will account for
it prospectively beginning in the first quarter of 2016. Prior to this
change, we estimated the interest cost component utilizing a single
weighted- average discount rate derived from the yield curve used to
measure the benefit obligation at the beginning of the period.
The full yield curve approach refines our estimate of interest cost
by applying the individual spot rates from a yield curve composed
of the rates of return on several hundred high- quality, fixed income
corporate bonds available at the measurement date. These indi-
vidual spot rates align with the timing of each future cash outflow for
benefit payments and therefore provide a more precise estimate of
interest cost.
This change in accounting estimate does not affect the measure-
ment of our total benefit obligations at year end or our annual net
periodic benefit cost as the change in the interest cost is offset in
the actuarial gain or loss recorded at year end. Accordingly, this
change in accounting estimate has no impact on our annual con-
solidated GAAP results. We estimate the impact of this change on
our consolidated GAAP results for the first quarter of 2016 will be
a reduction of the interest cost component of net periodic benefit
cost and an increase to Net income by approximately $0.1 billion.
However, at this time the estimated impact of this change on the
remaining 2016 interim periods and for annual 2016 results cannot
be reasonably estimated because it is possible that in the future
there may be changes to underlying assumptions, including an
interim remeasurement of our benefit obligations, which could result
in different estimates. Our non-GAAP measure for segment EBITDA
is unaffected because net periodic benefit costs are not included
in our segment results. For additional discussion of Non-GAAP
measures and non- operational items see “Consolidated Results of
Operations”.
33Verizon Communications Inc. and Subsidiaries
Management’s Discussion and Analysis of Financial Condition and Results of Operations continued
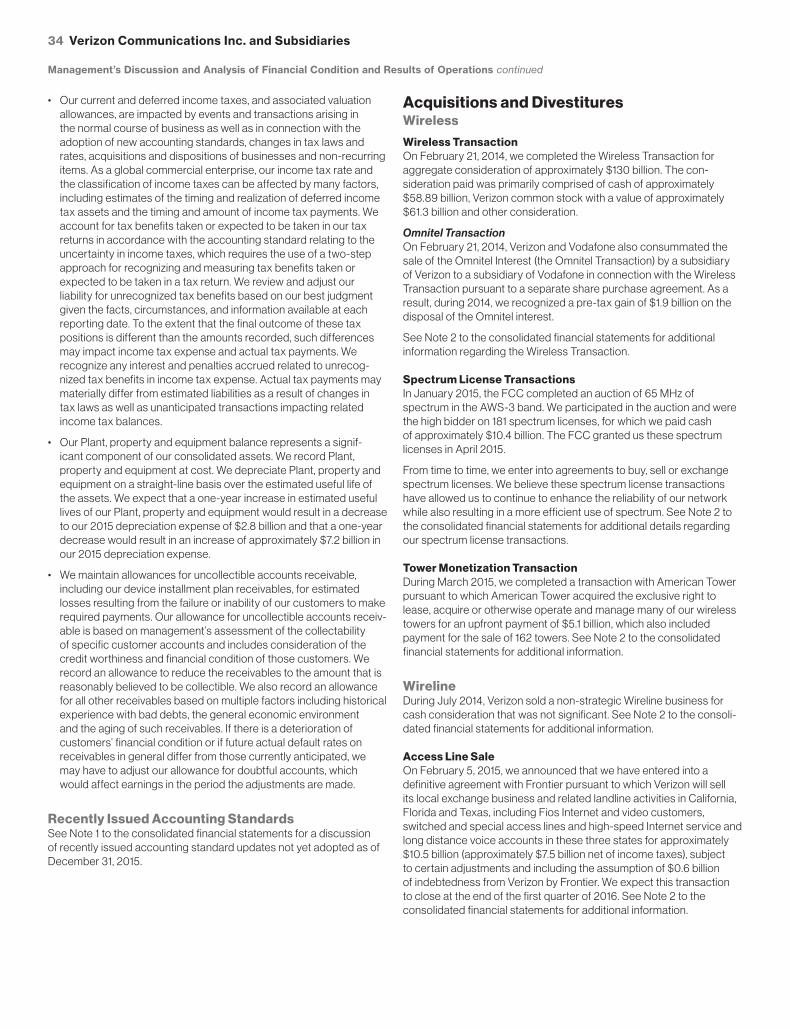
• Our current and deferred income taxes, and associated valuation
allowances, are impacted by events and transactions arising in
the normal course of business as well as in connection with the
adoption of new accounting standards, changes in tax laws and
rates, acquisitions and dispositions of businesses and non- recurring
items. As a global commercial enterprise, our income tax rate and
the classification of income taxes can be affected by many factors,
including estimates of the timing and realization of deferred income
tax assets and the timing and amount of income tax payments. We
account for tax benefits taken or expected to be taken in our tax
returns in accordance with the accounting standard relating to the
uncertainty in income taxes, which requires the use of a two-step
approach for recognizing and measuring tax benefits taken or
expected to be taken in a tax return. We review and adjust our
liability for unrecognized tax benefits based on our best judgment
given the facts, circumstances, and information available at each
reporting date. To the extent that the final outcome of these tax
positions is different than the amounts recorded, such differences
may impact income tax expense and actual tax payments. We
recognize any interest and penalties accrued related to unrecog-
nized tax benefits in income tax expense. Actual tax payments may
materially differ from estimated liabilities as a result of changes in
tax laws as well as unanticipated transactions impacting related
income tax balances.
• Our Plant, property and equipment balance represents a signif-
icant component of our consolidated assets. We record Plant,
property and equipment at cost. We depreciate Plant, property and
equipment on a straight-line basis over the estimated useful life of
the assets. We expect that a one-year increase in estimated useful
lives of our Plant, property and equipment would result in a decrease
to our 2015 depreciation expense of $2.8 billion and that a one-year
decrease would result in an increase of approximately $7.2 billion in
our 2015 depreciation expense.
• We maintain allowances for uncollectible accounts receivable,
including our device installment plan receivables, for estimated
losses resulting from the failure or inability of our customers to make
required payments. Our allowance for uncollectible accounts receiv-
able is based on management’s assessment of the collectability
of specific customer accounts and includes consideration of the
credit worthiness and financial condition of those customers. We
record an allowance to reduce the receivables to the amount that is
reasonably believed to be collectible. We also record an allowance
for all other receivables based on multiple factors including historical
experience with bad debts, the general economic environment
and the aging of such receivables. If there is a deterioration of
customers’ financial condition or if future actual default rates on
receivables in general differ from those currently anticipated, we
may have to adjust our allowance for doubtful accounts, which
would affect earnings in the period the adjustments are made.
Recently Issued Accounting StandardsSee Note 1 to the consolidated financial statements for a discussion
of recently issued accounting standard updates not yet adopted as of
December 31, 2015.
Acquisitions and DivestituresWireless
Wireless TransactionOn February 21, 2014, we completed the Wireless Transaction for
aggregate consideration of approximately $130 billion. The con-
sideration paid was primarily comprised of cash of approximately
$58.89 billion, Verizon common stock with a value of approximately
$61.3 billion and other consideration.
Omnitel Transaction
On February 21, 2014, Verizon and Vodafone also consummated the
sale of the Omnitel Interest (the Omnitel Transaction) by a subsidiary
of Verizon to a subsidiary of Vodafone in connection with the Wireless
Transaction pursuant to a separate share purchase agreement. As a
result, during 2014, we recognized a pre-tax gain of $1.9 billion on the
disposal of the Omnitel interest.
See Note 2 to the consolidated financial statements for additional
information regarding the Wireless Transaction.
Spectrum License TransactionsIn January 2015, the FCC completed an auction of 65 MHz of
spectrum in the AWS-3 band. We participated in the auction and were
the high bidder on 181 spectrum licenses, for which we paid cash
of approximately $10.4 billion. The FCC granted us these spectrum
licenses in April 2015.
From time to time, we enter into agreements to buy, sell or exchange
spectrum licenses. We believe these spectrum license transactions
have allowed us to continue to enhance the reliability of our network
while also resulting in a more efficient use of spectrum. See Note 2 to
the consolidated financial statements for additional details regarding
our spectrum license transactions.
Tower Monetization TransactionDuring March 2015, we completed a transaction with American Tower
pursuant to which American Tower acquired the exclusive right to
lease, acquire or otherwise operate and manage many of our wireless
towers for an upfront payment of $5.1 billion, which also included
payment for the sale of 162 towers. See Note 2 to the consolidated
financial statements for additional information.
WirelineDuring July 2014, Verizon sold a non- strategic Wireline business for
cash consideration that was not significant. See Note 2 to the consoli-
dated financial statements for additional information.
Access Line SaleOn February 5, 2015, we announced that we have entered into a
definitive agreement with Frontier pursuant to which Verizon will sell
its local exchange business and related landline activities in California,
Florida and Texas, including Fios Internet and video customers,
switched and special access lines and high-speed Internet service and
long distance voice accounts in these three states for approximately
$10.5 billion (approximately $7.5 billion net of income taxes), subject
to certain adjustments and including the assumption of $0.6 billion
of indebtedness from Verizon by Frontier. We expect this transaction
to close at the end of the first quarter of 2016. See Note 2 to the
consolidated financial statements for additional information.
34 Verizon Communications Inc. and Subsidiaries
Management’s Discussion and Analysis of Financial Condition and Results of Operations continued

Other
Acquisition of AOL Inc.On May 12, 2015, we entered into the Merger Agreement with AOL
pursuant to which we commenced a tender offer to acquire all of the
outstanding shares of common stock of AOL at a price of $50.00 per
share, net to the seller in cash, without interest and less any applicable
withholding taxes.
On June 23, 2015, we completed the tender offer and merger, and
AOL became a wholly-owned subsidiary of Verizon. The aggregate
cash consideration paid by Verizon at the closing of these transactions
was approximately $3.8 billion. Holders of approximately 6.6 million
shares exercised their appraisal rights under Delaware law. If they
had not exercised these rights, Verizon would have paid an additional
$330 million for such shares at the closing.
AOL is a leader in the digital content and advertising platform space.
Verizon has been investing in emerging technology that taps into the
market shift to digital content and advertising. AOL’s business model
aligns with this approach, and we believe that its combination of owned
and operated content properties plus a digital advertising platform
enhances our ability to further develop future revenue streams.
See Note 2 to the consolidated financial statements for additional
information.
OtherOn September 3, 2015, AOL announced an agreement to acquire an
advertising technology business for cash consideration that was not
significant. The transaction was completed in October 2015.
During the fourth quarter of 2014, Redbox Instant by Verizon, a venture
between Verizon and Redbox Automated Retail, LLC (Redbox), a
wholly-owned subsidiary of Outerwall Inc., ceased providing service to
its customers. In accordance with an agreement between the parties,
Redbox withdrew from the venture on October 20, 2014 and Verizon
wound down and dissolved the venture during the fourth quarter
of 2014. As a result of the termination of the venture, we recorded a
pre-tax loss of $0.1 billion in the fourth quarter of 2014.
During February 2014, Verizon acquired a business dedicated to
the development of IP television for cash consideration that was not
significant.
During the fourth quarter of 2013, Verizon acquired an industry leader
in content delivery networks for $0.4 billion.
See Note 2 to the consolidated financial statements for additional
information.
Cautionary Statement Concerning Forward- Looking StatementsIn this report we have made forward- looking statements. These state-
ments are based on our estimates and assumptions and are subject
to risks and uncertainties. Forward- looking statements include the
information concerning our possible or assumed future results of oper-
ations. Forward- looking statements also include those preceded or
followed by the words “anticipates,” “believes,” “estimates,” “hopes” or
similar expressions. For those statements, we claim the protection of
the safe harbor for forward- looking statements contained in the Private
Securities Litigation Reform Act of 1995.
The following important factors, along with those discussed elsewhere
in this report and in other filings with the Securities and Exchange
Commission (SEC), could affect future results and could cause those
results to differ materially from those expressed in the forward- looking
statements:
• adverse conditions in the U.S. and international economies;
• the effects of competition in the markets in which we operate;
• material changes in technology or technology substitution;
• disruption of our key suppliers’ provisioning of products or services;
• changes in the regulatory environment in which we operate,
including any increase in restrictions on our ability to operate
our networks;
• breaches of network or information technology security, natural
disasters, terrorist attacks or acts of war or significant litigation and
any resulting financial impact not covered by insurance;
• our high level of indebtedness;
• an adverse change in the ratings afforded our debt securities by
nationally accredited ratings organizations or adverse conditions in
the credit markets affecting the cost, including interest rates, and/or
availability of further financing;
• material adverse changes in labor matters, including labor negotia-
tions, and any resulting financial and/or operational impact;
• significant increases in benefit plan costs or lower investment
returns on plan assets;
• changes in tax laws or treaties, or in their interpretation;
• changes in accounting assumptions that regulatory agencies,
including the SEC, may require or that result from changes in the
accounting rules or their application, which could result in an impact
on earnings; and
• the inability to implement our business strategies.
35Verizon Communications Inc. and Subsidiaries
Management’s Discussion and Analysis of Financial Condition and Results of Operations continued

Report of Management on Internal Control Over Financial Reporting
We, the management of Verizon Communications Inc., are responsible
for establishing and maintaining adequate internal control over financial
reporting of the company. Management has evaluated internal control
over financial reporting of the company using the criteria for effective
internal control established in Internal Control–Integrated Framework
issued by the Committee of Sponsoring Organizations of the Treadway
Commission in 2013.
Management has assessed the effectiveness of the company’s
internal control over financial reporting as of December 31, 2015.
Based on this assessment, we believe that the internal control over
financial reporting of the company is effective as of December 31,
2015. In connection with this assessment, there were no material
weaknesses in the company’s internal control over financial reporting
identified by management.
The company’s financial statements included in this Annual Report
have been audited by Ernst & Young LLP, independent registered
public accounting firm. Ernst & Young LLP has also provided
an attestation report on the company’s internal control over
financial reporting.
Lowell C. McAdamChairman and Chief Executive Officer
Francis J. ShammoExecutive Vice President and Chief Financial Officer
Anthony T. SkiadasSenior Vice President and Controller
Report of Independent Registered Public Accounting Firm on Internal Control Over Financial Reporting
To The Board of Directors and Shareowners of Verizon Communications Inc.:
We have audited Verizon Communications Inc. and subsidiaries’
(Verizon) internal control over financial reporting as of December 31,
2015, based on criteria established in Internal Control–Integrated
Framework issued by the Committee of Sponsoring Organizations
of the Treadway Commission (2013 framework) (the COSO criteria).
Verizon’s management is responsible for maintaining effective
internal control over financial reporting, and for its assessment of the
effectiveness of internal control over financial reporting included in
the accompanying Report of Management on Internal Control Over
Financial Reporting. Our responsibility is to express an opinion on the
company’s internal control over financial reporting based on our audit.
We conducted our audit in accordance with the standards of the
Public Company Accounting Oversight Board (United States). Those
standards require that we plan and perform the audit to obtain reason-
able assurance about whether effective internal control over financial
reporting was maintained in all material respects. Our audit included
obtaining an understanding of internal control over financial reporting,
assessing the risk that a material weakness exists, testing and evalu-
ating the design and operating effectiveness of internal control based
on the assessed risk, and performing such other procedures as we
considered necessary in the circumstances. We believe that our audit
provides a reasonable basis for our opinion.
A company’s internal control over financial reporting is a process
designed to provide reasonable assurance regarding the reliability
of financial reporting and the preparation of financial statements
for external purposes in accordance with generally accepted
accounting principles. A company’s internal control over financial
reporting includes those policies and procedures that (1) pertain to
the maintenance of records that, in reasonable detail, accurately and
fairly reflect the transactions and dispositions of the assets of the
company; (2) provide reasonable assurance that transactions are
recorded as necessary to permit preparation of financial statements
in accordance with generally accepted accounting principles, and
that receipts and expenditures of the company are being made only in
accordance with authorizations of management and directors of the
company; and (3) provide reasonable assurance regarding prevention
or timely detection of unauthorized acquisition, use, or disposition
of the company’s assets that could have a material effect on the
financial statements.
36 Verizon Communications Inc. and Subsidiaries
Because of its inherent limitations, internal control over financial
reporting may not prevent or detect misstatements. Also, projections
of any evaluation of effectiveness to future periods are subject to
the risk that controls may become inadequate because of changes
in conditions, or that the degree of compliance with the policies or
procedures may deteriorate.
In our opinion, Verizon maintained, in all material respects, effective
internal control over financial reporting as of December 31, 2015,
based on the COSO criteria.
We also have audited, in accordance with the standards of the
Public Company Accounting Oversight Board (United States), the
consolidated balance sheets of Verizon as of December 31, 2015 and
2014, and the related consolidated statements of income, comprehen-
sive income, cash flows and changes in equity for each of the three
years in the period ended December 31, 2015 and our report dated
February 23, 2016 expressed an unqualified opinion thereon.
Ernst & Young LLPNew York, New York
February 23, 2016
Report of Independent Registered Public Accounting Firm
To The Board of Directors and Shareowners of Verizon Communications Inc.:
We have audited the accompanying consolidated balance sheets
of Verizon Communications Inc. and subsidiaries (Verizon) as of
December 31, 2015 and 2014, and the related consolidated statements
of income, comprehensive income, cash flows and changes in equity
for each of the three years in the period ended December 31, 2015.
These financial statements are the responsibility of Verizon’s man-
agement. Our responsibility is to express an opinion on these financial
statements based on our audits.
We conducted our audits in accordance with the standards of
the Public Company Accounting Oversight Board (United States).
Those standards require that we plan and perform the audit to obtain
reasonable assurance about whether the financial statements are free
of material misstatement. An audit includes examining, on a test basis,
evidence supporting the amounts and disclosures in the financial
statements. An audit also includes assessing the accounting principles
used and significant estimates made by management, as well as eval-
uating the overall financial statement presentation. We believe that our
audits provide a reasonable basis for our opinion.
In our opinion, the financial statements referred to above present fairly,
in all material respects, the consolidated financial position of Verizon
at December 31, 2015 and 2014, and the consolidated results of its
operations and its cash flows for each of the three years in the period
ended December 31, 2015, in conformity with U.S. generally accepted
accounting principles.
We also have audited, in accordance with the standards of the
Public Company Accounting Oversight Board (United States),
Verizon’s internal control over financial reporting as of December 31,
2015, based on criteria established in Internal Control–Integrated
Framework issued by the Committee of Sponsoring Organizations
of the Treadway Commission (2013 framework) and our report dated
February 23, 2016 expressed an unqualified opinion thereon.
Ernst & Young LLPNew York, New York
February 23, 2016
37Verizon Communications Inc. and Subsidiaries

Consolidated Statements of Income(dollars in millions, except per share amounts)
Years Ended December 31, 2015 2014 2013
Operating Revenues
Service revenues and other $ 114,696 $ 116,122 $ 112,454
Wireless equipment revenues 16,924 10,957 8,096
Total Operating Revenues 131,620 127,079 120,550
Operating Expenses
Cost of services (exclusive of items shown below) 29,438 28,306 28,534
Wireless cost of equipment 23,119 21,625 16,353
Selling, general and administrative expense 29,986 41,016 27,089
Depreciation and amortization expense 16,017 16,533 16,606
Total Operating Expenses 98,560 107,480 88,582
Operating Income 33,060 19,599 31,968
Equity in (losses) earnings of unconsolidated businesses (86) 1,780 142
Other income and (expense), net 186 (1,194) (166)
Interest expense (4,920) (4,915) (2,667)
Income Before Provision For Income Taxes 28,240 15,270 29,277
Provision for income taxes (9,865) (3,314) (5,730)
Net Income $ 18,375 $ 11,956 $ 23,547
Net income attributable to noncontrolling interests $ 496 $ 2,331 $ 12,050
Net income attributable to Verizon 17,879 9,625 11,497
Net Income $ 18,375 $ 11,956 $ 23,547
Basic Earnings Per Common Share
Net income attributable to Verizon $ 4.38 $ 2.42 $ 4.01
Weighted- average shares outstanding (in millions) 4,085 3,974 2,866
Diluted Earnings Per Common Share
Net income attributable to Verizon $ 4.37 $ 2.42 $ 4.00
Weighted- average shares outstanding (in millions) 4,093 3,981 2,874
See Notes to Consolidated Financial Statements
38 Verizon Communications Inc. and Subsidiaries

Consolidated Statements of Comprehensive Income(dollars in millions)
Years Ended December 31, 2015 2014 2013
Net Income $ 18,375 $ 11,956 $ 23,547
Other Comprehensive Income, net of taxes
Foreign currency translation adjustments (208) (1,199) 60
Unrealized gains (losses) on cash flow hedges (194) (197) 25
Unrealized gains (losses) on marketable securities (11) (5) 16
Defined benefit pension and postretirement plans (148) 154 22
Other comprehensive income (loss) attributable to Verizon (561) (1,247) 123
Other comprehensive loss attributable to noncontrolling interests – (23) (15)
Total Comprehensive Income $ 17,814 $ 10,686 $ 23,655
Comprehensive income attributable to noncontrolling interests 496 2,308 12,035
Comprehensive income attributable to Verizon 17,318 8,378 11,620
Total Comprehensive Income $ 17,814 $ 10,686 $ 23,655
See Notes to Consolidated Financial Statements
39Verizon Communications Inc. and Subsidiaries

Consolidated Balance Sheets(dollars in millions, except per share amounts)
At December 31, 2015 2014
Assets
Current assets
Cash and cash equivalents $ 4,470 $ 10,598
Short-term investments 350 555
Accounts receivable, net of allowances of $882 and $739 13,457 13,993
Inventories 1,252 1,153
Assets held for sale 792 552
Prepaid expenses and other 1,959 2,648
Total current assets 22,280 29,499
Plant, property and equipment 220,163 230,508
Less accumulated depreciation 136,622 140,561
Plant, property and equipment, net 83,541 89,947
Investments in unconsolidated businesses 796 802
Wireless licenses 86,575 75,341
Goodwill 25,331 24,639
Other intangible assets, net 8,338 5,728
Non- current assets held for sale 10,267 –
Deposit for wireless licenses – 921
Other assets 7,512 5,739
Total assets $ 244,640 $ 232,616
Liabilities and Equity
Current liabilities
Debt maturing within one year $ 6,489 $ 2,735
Accounts payable and accrued liabilities 19,362 16,680
Liabilities related to assets held for sale 463 –
Other 8,738 8,572
Total current liabilities 35,052 27,987
Long-term debt 103,705 110,536
Employee benefit obligations 29,957 33,280
Deferred income taxes 45,484 41,563
Non- current liabilities related to assets held for sale 959 –
Other liabilities 11,641 5,574
Equity
Series preferred stock ($.10 par value; none issued) – –
Common stock ($.10 par value; 4,242,374,240 shares issued in each period) 424 424
Contributed capital 11,196 11,155
Reinvested earnings 11,246 2,447
Accumulated other comprehensive income 550 1,111
Common stock in treasury, at cost (7,416) (3,263)
Deferred compensation — employee stock ownership plans and other 428 424
Noncontrolling interests 1,414 1,378
Total equity 17,842 13,676
Total liabilities and equity $ 244,640 $ 232,616
See Notes to Consolidated Financial Statements
40 Verizon Communications Inc. and Subsidiaries

Consolidated Statements of Cash Flows(dollars in millions)
Years Ended December 31, 2015 2014 2013
Cash Flows from Operating Activities
Net Income $ 18,375 $ 11,956 $ 23,547
Adjustments to reconcile net income to net cash provided by operating activities:
Depreciation and amortization expense 16,017 16,533 16,606
Employee retirement benefits (1,747) 8,130 (5,052)
Deferred income taxes 3,516 (92) 5,785
Provision for uncollectible accounts 1,610 1,095 993
Equity in losses (earnings) of unconsolidated businesses, net of dividends received 127 (1,743) (102)
Changes in current assets and liabilities, net of effects from acquisition/disposition
of businesses
Accounts receivable (945) (2,745) (843)
Inventories (99) (132) 56
Other assets 942 (695) (143)
Accounts payable and accrued liabilities 2,545 1,412 925
Other, net (1,411) (3,088) (2,954)
Net cash provided by operating activities 38,930 30,631 38,818
Cash Flows from Investing Activities
Capital expenditures (including capitalized software) (17,775) (17,191) (16,604)
Acquisitions of investments and businesses, net of cash acquired (3,545) (182) (494)
Acquisitions of wireless licenses (9,942) (354) (580)
Proceeds from dispositions of wireless licenses – 2,367 2,111
Proceeds from dispositions of businesses 48 120 –
Other, net 1,171 (616) 734
Net cash used in investing activities (30,043) (15,856) (14,833)
Cash Flows from Financing Activities
Proceeds from long-term borrowings 6,667 30,967 49,166
Repayments of long-term borrowings and capital lease obligations (9,340) (17,669) (8,163)
Decrease in short-term obligations, excluding current maturities (344) (475) (142)
Dividends paid (8,538) (7,803) (5,936)
Proceeds from sale of common stock 40 34 85
Purchase of common stock for treasury (5,134) – (153)
Special distribution to noncontrolling interest – – (3,150)
Acquisition of noncontrolling interest – (58,886) –
Other, net 1,634 (3,873) (5,257)
Net cash provided by (used in) financing activities (15,015) (57,705) 26,450
Increase (decrease) in cash and cash equivalents (6,128) (42,930) 50,435
Cash and cash equivalents, beginning of period 10,598 53,528 3,093
Cash and cash equivalents, end of period $ 4,470 $ 10,598 $ 53,528
See Notes to Consolidated Financial Statements
41Verizon Communications Inc. and Subsidiaries

Consolidated Statements of Changes in Equity(dollars in millions, except per share amounts, and shares in thousands)
Years Ended December 31, 2015 2014 2013
Shares Amount Shares Amount Shares Amount
Common Stock
Balance at beginning of year 4,242,374 $ 424 2,967,610 $ 297 2,967,610 $ 297
Common shares issued (Note 2) – – 1,274,764 127 – –
Balance at end of year 4,242,374 424 4,242,374 424 2,967,610 297
Contributed Capital
Balance at beginning of year 11,155 37,939 37,990
Acquisition of noncontrolling interest (Note 2) – (26,898) –
Other 41 114 (51)
Balance at end of year 11,196 11,155 37,939
Reinvested Earnings (Accumulated Deficit)
Balance at beginning of year 2,447 1,782 (3,734)
Net income attributable to Verizon 17,879 9,625 11,497
Dividends declared ($2.23, $2.16, $2.09) per share (9,080) (8,960) (5,981)
Balance at end of year 11,246 2,447 1,782
Accumulated Other Comprehensive Income
Balance at beginning of year attributable to Verizon 1,111 2,358 2,235
Foreign currency translation adjustments (208) (1,199) 60
Unrealized gains (losses) on cash flow hedges (194) (197) 25
Unrealized gains (losses) on marketable securities (11) (5) 16
Defined benefit pension and postretirement plans (148) 154 22
Other comprehensive income (loss) (561) (1,247) 123
Balance at end of year attributable to Verizon 550 1,111 2,358
Treasury Stock
Balance at beginning of year (87,410) (3,263) (105,610) (3,961) (109,041) (4,071)
Shares purchased (104,402) (5,134) – – (3,500) (153)
Employee plans (Note 15) 17,072 740 14,132 541 6,835 260
Shareowner plans (Note 15) 5,541 241 4,105 157 96 3
Other – – (37) – – –
Balance at end of year (169,199) (7,416) (87,410) (3,263) (105,610) (3,961)
Deferred Compensation — ESOPs and Other
Balance at beginning of year 424 421 440
Restricted stock equity grant 208 166 152
Amortization (204) (163) (171)
Balance at end of year 428 424 421
Noncontrolling Interests
Balance at beginning of year 1,378 56,580 52,376
Acquisition of noncontrolling interest (Note 2) – (55,960) –
Net income attributable to noncontrolling interests 496 2,331 12,050
Other comprehensive loss – (23) (15)
Total comprehensive income 496 2,308 12,035
Distributions and other (460) (1,550) (7,831)
Balance at end of year 1,414 1,378 56,580
Total Equity $ 17,842 $ 13,676 $ 95,416
See Notes to Consolidated Financial Statements
42 Verizon Communications Inc. and Subsidiaries
Notes to Consolidated Financial Statements
Note 1Description of Business and Summary of Significant Accounting Policies
Description of BusinessVerizon Communications Inc. (Verizon or the Company) is a holding
company that, acting through its subsidiaries, is one of the world’s
leading providers of communications, information and entertainment
products and services to consumers, businesses and governmental
agencies with a presence around the world. We have two reportable
segments, Wireless and Wireline. For further information concerning
our business segments, see Note 13.
The Wireless segment provides wireless communications products
and services across one of the most extensive and reliable
wireless networks in the United States (U.S.) and has the largest
fourth- generation (4G) Long-Term Evolution (LTE) technology and
third- generation (3G) networks of any U.S. wireless service provider.
The Wireline segment provides voice, data and video communications
products and enhanced services, including broadband video and
data, corporate networking solutions, data center and cloud services,
security and managed network services and local and long distance
voice services. We provide these products and services to consumers
in the United States, as well as to carriers, businesses and government
customers both in the United States and around the world.
ConsolidationThe method of accounting applied to investments, whether consoli-
dated, equity or cost, involves an evaluation of all significant terms of
the investments that explicitly grant or suggest evidence of control
or influence over the operations of the investee. The consolidated
financial statements include our controlled subsidiaries, as well as
variable interest entities (VIE) where we are deemed to be the primary
beneficiary. For controlled subsidiaries that are not wholly-owned, the
noncontrolling interests are included in Net income and Total equity.
Investments in businesses which we do not control, but have the ability
to exercise significant influence over operating and financial policies,
are accounted for using the equity method. Investments in which we
do not have the ability to exercise significant influence over operating
and financial policies are accounted for under the cost method. Equity
and cost method investments are included in Investments in unconsol-
idated businesses in our consolidated balance sheets. All significant
intercompany accounts and transactions have been eliminated.
Basis of PresentationWe have reclassified certain prior year amounts to conform to the
current year presentation.
Use of EstimatesWe prepare our financial statements using U.S. generally accepted
accounting principles (GAAP), which require management to make
estimates and assumptions that affect reported amounts and disclo-
sures. Actual results could differ from those estimates.
Examples of significant estimates include: the allowance for doubtful
accounts, the recoverability of plant, property and equipment, the
recoverability of intangible assets and other long-lived assets, fair
values of financial instruments, unrecognized tax benefits, valuation
allowances on tax assets, accrued expenses, pension and postre-
tirement benefit assumptions, contingencies and the identification of
assets acquired and liabilities assumed in connection with business
combinations.
Revenue RecognitionMultiple Deliverable Arrangements
We offer products and services to our wireless and wireline customers
through bundled arrangements. These arrangements involve multiple
deliverables which may include products, services, or a combination of
products and services.
Wireless
Our Wireless segment earns revenue primarily by providing access to
and usage of its network as well as the sale of equipment. In general,
access revenue is billed one month in advance and recognized when
earned. Usage revenue is generally billed in arrears and recognized
when service is rendered. Equipment sales revenue associated with
the sale of wireless devices and accessories is generally recognized
when the products are delivered to and accepted by the customer, as
this is considered to be a separate earnings process from providing
wireless services. For agreements involving the resale of third-party
services in which we are considered the primary obligor in the
arrangements, we record the revenue gross at the time of the sale.
Under the Verizon device payment program (formerly known as
Verizon Edge), our eligible wireless customers purchase phones
or tablets at unsubsidized prices on an installment basis (a device
installment plan). Certain devices are subject to promotions that
allow customers to upgrade to a new device after paying down the
minimum percentage of the device installment plan and trading in their
device. When a customer has the right to upgrade to a new device
by paying down the minimum percentage of the device installment
plan and trading in their device, we account for this trade-in right as a
guarantee obligation. The full amount of the trade-in right’s fair value
(not an allocated value) is recognized as a guarantee liability and the
remaining allocable consideration is allocated to the device. The value
of the guarantee liability effectively results in a reduction to the revenue
recognized for the sale of the device.
In multiple element arrangements that bundle devices and monthly
wireless service, revenue is allocated to each unit of accounting using
a relative selling price method. At the inception of the arrangement, the
amount allocable to the delivered units of accounting is limited to the
amount that is not contingent upon the delivery of the monthly wireless
service (the noncontingent amount). We effectively recognize revenue
on the delivered device at the lesser of the amount allocated based
on the relative selling price of the device or the noncontingent amount
owed when the device is sold.
Wireline
Our Wireline segment earns revenue based upon usage of its network
and facilities and contract fees. In general, fixed monthly fees for voice,
video, data and certain other services are billed one month in advance
and recognized when earned. Revenue from services that are not fixed
in amount and are based on usage is generally billed in arrears and
recognized when service is rendered.
We sell each of the services offered in bundled arrangements (i.e.,
voice, video and data), as well as separately; therefore each product
or service has a standalone selling price. For these arrangements,
revenue is allocated to each deliverable using a relative selling price
method. Under this method, arrangement consideration is allocated
to each separate deliverable based on our standalone selling price for
each product or service. These services include Fios services, individ-
ually or in bundles, and High Speed Internet.
43Verizon Communications Inc. and Subsidiaries

When we bundle equipment with maintenance and monitoring
services, we recognize equipment revenue when the equipment is
installed in accordance with contractual specifications and ready
for the customer’s use. The maintenance and monitoring services
are recognized monthly over the term of the contract as we provide
the services.
Installation- related fees, along with the associated costs up to but not
exceeding these fees, are deferred and amortized over the estimated
customer relationship period.
Other
Advertising revenues are generated through display advertising and
search advertising. Display advertising revenue is generated by the
display of graphical advertisements and other performance-based
advertising. Search advertising revenue is generated when a consumer
clicks on a text-based advertisement on their screen. Agreements for
advertising typically take the forms of impression-based contracts,
time-based contracts or performance-based contracts. Advertising
revenues derived from impression-based contracts, in which we
provide impressions in exchange for a fixed fee, are generally recog-
nized as the impressions are delivered. Advertising revenues derived
from time-based contracts, in which we provide promotions over a
specified time period for a fixed fee, are recognized on a straight-line
basis over the term of the contract, provided that we meet and will
continue to meet our obligations under the contract. Advertising
revenues derived from contracts where we are compensated based
on certain performance criteria are recognized as we complete the
contractually specified performance.
We report taxes imposed by governmental authorities on revenue-
producing transactions between us and our customers on a net basis.
Maintenance and RepairsWe charge the cost of maintenance and repairs, including the cost of
replacing minor items not constituting substantial betterments, princi-
pally to Cost of services as these costs are incurred.
Advertising CostsCosts for advertising products and services as well as other pro-
motional and sponsorship costs are charged to Selling, general and
administrative expense in the periods in which they are incurred
(see Note 15).
Earnings Per Common ShareBasic earnings per common share are based on the weighted- average
number of shares outstanding during the period. Where appropriate,
diluted earnings per common share include the dilutive effect of shares
issuable under our stock-based compensation plans.
There were a total of approximately 8 million, 7 million and 8 million
outstanding dilutive securities, primarily consisting of restricted stock
units, included in the computation of diluted earnings per common
share for the years ended December 31, 2015, 2014 and 2013,
respectively. For the year ended December 31, 2015, there were no
outstanding options to purchase shares that would have been anti-
dilutive. Outstanding options to purchase shares that were not included
in the computation of diluted earnings per common share, because to
do so would have been anti- dilutive for the period, were not significant
for the years ended December 31, 2014 and 2013, respectively.
On January 28, 2014, at a special meeting of our shareholders, we
received shareholder approval to increase our authorized shares of
common stock by 2 billion shares to an aggregate of 6.25 billion autho-
rized shares of common stock. On February 4, 2014, this authorization
became effective. On February 21, 2014, we issued approximately
1.27 billion shares of common stock upon completing the acquisition of
Vodafone Group Plc’s indirect 45% interest in Cellco Partnership d/b/a
Verizon Wireless. See Note 2 for additional information.
Cash and Cash EquivalentsWe consider all highly liquid investments with a maturity of 90 days
or less when purchased to be cash equivalents. Cash equivalents are
stated at cost, which approximates quoted market value and include
amounts held in money market funds.
Marketable SecuritiesWe have investments in marketable securities, which are consid-
ered “ available-for-sale” under the provisions of the accounting
standard for certain debt and equity securities, and are included in
the accompanying consolidated balance sheets in Short-term invest-
ments or Other assets. We continually evaluate our investments in
marketable securities for impairment due to declines in market value
considered to be other-than- temporary. That evaluation includes, in
addition to persistent, declining stock prices, general economic and
company- specific evaluations. In the event of a determination that a
decline in market value is other-than- temporary, a charge to earnings
is recorded for the loss, and a new cost basis in the investment is
established.
Allowance for Doubtful AccountsAccounts receivable are recorded in the consolidated financial
statements at cost net of an allowance for credit losses. We maintain
allowances for uncollectible accounts receivable, including our device
installment plan receivables, for estimated losses resulting from
the failure or inability of our customers to make required payments.
Similar to traditional service revenue accounting treatment, we record
device installment plan bad debt expense based on an estimate of
the percentage of equipment revenue that will not be collected. This
estimate is based on a number of factors including historical write-off
experience, credit quality of the customer base and other factors such
as macroeconomic conditions. Due to the device installment plan
being incorporated in the standard Verizon Wireless bill, the collection
and risk strategies continue to follow historical practices. We monitor
the aging of our accounts with device installment plan receivables and
write off account balances if collection efforts are unsuccessful and
future collection is unlikely.
InventoriesInventory consists of wireless and wireline equipment held for sale,
which is carried at the lower of cost (determined principally on either
an average cost or first-in, first-out basis) or market.
Plant and DepreciationWe record plant, property and equipment at cost. Plant, property and
equipment are generally depreciated on a straight-line basis.
Leasehold improvements are amortized over the shorter of the
estimated life of the improvement or the remaining term of the related
lease, calculated from the time the asset was placed in service.
When depreciable assets are retired or otherwise disposed of, the
related cost and accumulated depreciation are deducted from the
plant accounts, and any gains or losses on disposition are recognized
in income.
44 Verizon Communications Inc. and Subsidiaries
Notes to Consolidated Financial Statements continued

We capitalize and depreciate network software purchased
or developed along with related plant assets. We also capi-
talize interest associated with the acquisition or construction of
network- related assets. Capitalized interest is reported as a reduction
in interest expense and depreciated as part of the cost of the
network- related assets.
In connection with our ongoing review of the estimated remaining
average useful lives of plant, property and equipment, we determined
that changes were necessary to the remaining estimated useful lives
of certain assets as a result of technology upgrades, enhancements,
and planned retirements. These changes resulted in an increase in
depreciation expense of $0.4 billion and $0.6 billion in 2015 and 2014,
respectively. While the timing and extent of current deployment plans
are subject to ongoing analysis and modification, we believe the
current estimates of useful lives are reasonable.
Computer Software CostsWe capitalize the cost of internal-use network and non- network
software that has a useful life in excess of one year. Subsequent
additions, modifications or upgrades to internal-use network and
non- network software are capitalized only to the extent that they allow
the software to perform a task it previously did not perform. Planning,
software maintenance and training costs are expensed in the period
in which they are incurred. Also, we capitalize interest associated with
the development of internal-use network and non- network software.
Capitalized non- network internal-use software costs are amortized
using the straight-line method over a period of 3 to 8 years and are
included in Other intangible assets, net in our consolidated balance
sheets. For a discussion of our impairment policy for capitalized
software costs, see “Goodwill and Other Intangible Assets” below.
Also, see Note 3 for additional detail of internal-use non- network
software reflected in our consolidated balance sheets.
Goodwill and Other Intangible AssetsGoodwill
Goodwill is the excess of the acquisition cost of businesses over the
fair value of the identifiable net assets acquired. Impairment testing
for goodwill is performed annually in the fourth fiscal quarter or
more frequently if impairment indicators are present. To determine if
goodwill is potentially impaired, we have the option to perform a qual-
itative assessment. However, we may elect to bypass the qualitative
assessment and perform an impairment test even if no indications of
a potential impairment exist. The impairment test for goodwill uses a
two-step approach, which is performed at the reporting unit level. Step
one, performed to identify potential impairment, compares the fair
value of the reporting unit (calculated using a market approach and/
or a discounted cash flow method) to its carrying value. If the carrying
value exceeds the fair value, there is a potential impairment and step
two must be performed to measure the amount of the impairment
charge. Step two compares the carrying value of the reporting unit’s
goodwill to its implied fair value (i.e., fair value of reporting unit less
the fair value of the unit’s assets and liabilities, including identifiable
intangible assets). If the implied fair value of goodwill is less than the
carrying amount of goodwill, an impairment charge is recognized.
Intangible Assets Not Subject to Amortization
A significant portion of our intangible assets are wireless licenses that
provide our wireless operations with the exclusive right to utilize des-
ignated radio frequency spectrum to provide wireless communication
services. While licenses are issued for only a fixed time, generally
ten years, such licenses are subject to renewal by the Federal
Communications Commission (FCC). License renewals have occurred
routinely and at nominal cost. Moreover, we have determined that there
are currently no legal, regulatory, contractual, competitive, economic
or other factors that limit the useful life of our wireless licenses. As a
result, we treat the wireless licenses as an indefinite-lived intangible
asset. We reevaluate the useful life determination for wireless licenses
each year to determine whether events and circumstances continue to
support an indefinite useful life.
We test our wireless licenses for potential impairment annually or
more frequently if impairment indicators are present. We have the
option to first perform a qualitative assessment to determine whether
it is necessary to perform a quantitative impairment test. However,
we may elect to bypass the qualitative assessment in any period
and proceed directly to performing the quantitative impairment test.
The most recent quantitative assessment of our wireless licenses
occurred in 2015. Our quantitative assessment consisted of comparing
the estimated fair value of our aggregate wireless licenses to the
aggregated carrying amount as of the test date. Using a quantitative
assessment, we estimated the fair value of our aggregate wireless
licenses using the Greenfield approach. The Greenfield approach is
an income based valuation approach that values the wireless licenses
by calculating the cash flow generating potential of a hypothetical
start-up company that goes into business with no assets except the
wireless licenses to be valued. A discounted cash flow analysis is
used to estimate what a marketplace participant would be willing to
pay to purchase the aggregated wireless licenses as of the valuation
date. If the estimated fair value of the aggregated wireless licenses
is less than the aggregated carrying amount of the wireless licenses
then an impairment charge is recognized. In 2014 and 2013, we
performed a qualitative assessment to determine whether it is more
likely than not that the fair value of our wireless licenses was less
than the carrying amount. As part of our assessment, we considered
several qualitative factors including the business enterprise value of
our Wireless segment, macroeconomic conditions (including changes
in interest rates and discount rates), industry and market consid-
erations (including industry revenue and EBITDA (Earnings before
interest, taxes, depreciation and amortization) margin projections), the
projected financial performance of our Wireless segment, as well as
other factors.
Interest expense incurred while qualifying activities are performed to
ready wireless licenses for their intended use is capitalized as part of
wireless licenses. The capitalization period ends when the develop-
ment is discontinued or substantially complete and the license is ready
for its intended use.
Intangible Assets Subject to Amortization and Long-Lived Assets
Our intangible assets that do not have indefinite lives (primarily
customer lists and non- network internal-use software) are amortized
over their estimated useful lives. All of our intangible assets subject
to amortization and long-lived assets are reviewed for impairment
whenever events or changes in circumstances indicate that the
carrying amount of the asset may not be recoverable. If any indica-
tions were present, we would test for recoverability by comparing the
carrying amount of the asset group to the net undiscounted cash flows
expected to be generated from the asset group. If those net undis-
counted cash flows do not exceed the carrying amount, we would
perform the next step, which is to determine the fair value of the asset
and record an impairment, if any. We reevaluate the useful life deter-
minations for these intangible assets each year to determine whether
events and circumstances warrant a revision to their remaining
useful lives.
45Verizon Communications Inc. and Subsidiaries
Notes to Consolidated Financial Statements continued

For information related to the carrying amount of goodwill, wireless
licenses and other intangible assets, as well as the major components
and average useful lives of our other acquired intangible assets,
see Note 3.
Fair Value MeasurementsFair value of financial and non- financial assets and liabilities is defined
as an exit price, representing the amount that would be received to
sell an asset or paid to transfer a liability in an orderly transaction
between market participants. The three-tier hierarchy for inputs used
in measuring fair value, which prioritizes the inputs used in the method-
ologies of measuring fair value for assets and liabilities, is as follows:
Level 1 — Quoted prices in active markets for identical assets or
liabilities
Level 2 — Observable inputs other than quoted prices in active
markets for identical assets and liabilities
Level 3 — No observable pricing inputs in the market
Financial assets and financial liabilities are classified in their entirety
based on the lowest level of input that is significant to the fair value
measurements. Our assessment of the significance of a particular
input to the fair value measurements requires judgment, and may
affect the valuation of the assets and liabilities being measured and
their categorization within the fair value hierarchy.
Income TaxesOur effective tax rate is based on pre-tax income, statutory tax rates,
tax laws and regulations and tax planning strategies available to us in
the various jurisdictions in which we operate.
Deferred income taxes are provided for temporary differences in the
bases between financial statement and income tax assets and liabili-
ties. Deferred income taxes are recalculated annually at tax rates then
in effect. We record valuation allowances to reduce our deferred tax
assets to the amount that is more likely than not to be realized.
We use a two-step approach for recognizing and measuring tax
benefits taken or expected to be taken in a tax return. The first step
is recognition: we determine whether it is more likely than not that a
tax position will be sustained upon examination, including resolution
of any related appeals or litigation processes, based on the technical
merits of the position. In evaluating whether a tax position has met
the more- likely-than-not recognition threshold, we presume that the
position will be examined by the appropriate taxing authority that has
full knowledge of all relevant information. The second step is measure-
ment: a tax position that meets the more- likely-than-not recognition
threshold is measured to determine the amount of benefit to recognize
in the financial statements. The tax position is measured at the largest
amount of benefit that is greater than 50 percent likely of being realized
upon ultimate settlement. Differences between tax positions taken in
a tax return and amounts recognized in the financial statements will
generally result in one or more of the following: an increase in a liability
for income taxes payable, a reduction of an income tax refund receiv-
able, a reduction in a deferred tax asset, or an increase in a deferred
tax liability.
The accounting standard relating to income taxes generated by
leveraged lease transactions requires that changes in the projected
timing of income tax cash flows generated by a leveraged lease
transaction be recognized as a gain or loss in the year in which the
change occurs.
Significant management judgment is required in evaluating our tax
positions and in determining our effective tax rate.
Stock-Based CompensationWe measure and recognize compensation expense for all stock-based
compensation awards made to employees and directors based on
estimated fair values. See Note 10 for further details.
Foreign Currency TranslationThe functional currency of our foreign operations is generally the local
currency. For these foreign entities, we translate income statement
amounts at average exchange rates for the period, and we translate
assets and liabilities at end-of- period exchange rates. We record
these translation adjustments in Accumulated other comprehensive
income, a separate component of Equity, in our consolidated balance
sheets. We report exchange gains and losses on intercompany
foreign currency transactions of a long-term nature in Accumulated
other comprehensive income. Other exchange gains and losses are
reported in income.
Employee Benefit PlansPension and postretirement health care and life insurance benefits
earned during the year as well as interest on projected benefit
obligations are accrued currently. Prior service costs and credits
resulting from changes in plan benefits are generally amortized over
the average remaining service period of the employees expected to
receive benefits. Expected return on plan assets is determined by
applying the return on assets assumption to the actual fair value of plan
assets. Actuarial gains and losses are recognized in operating results
in the year in which they occur. These gains and losses are measured
annually as of December 31 or upon a remeasurement event. Verizon
management employees no longer earn pension benefits or earn
service towards the company retiree medical subsidy (see Note 11).
We recognize a pension or a postretirement plan’s funded status as
either an asset or liability on the consolidated balance sheets. Also, we
measure any unrecognized prior service costs and credits that arise
during the period as a component of Accumulated other comprehen-
sive income, net of applicable income tax.
Derivative InstrumentsWe enter into derivative transactions primarily to manage our exposure
to fluctuations in foreign currency exchange rates, interest rates, equity
and commodity prices. We employ risk management strategies, which
may include the use of a variety of derivatives including cross currency
swaps, foreign currency and prepaid forwards and collars, interest
rate swap agreements, commodity swap and forward agreements and
interest rate locks. We do not hold derivatives for trading purposes.
We measure all derivatives, including derivatives embedded in other
financial instruments, at fair value and recognize them as either assets
or liabilities on our consolidated balance sheets. Our derivative instru-
ments are valued primarily using models based on readily observable
market parameters for all substantial terms of our derivative contracts
and thus are classified as Level 2. Changes in the fair values of deriva-
tive instruments not qualifying as hedges or any ineffective portion of
hedges are recognized in earnings in the current period. Changes in
the fair values of derivative instruments used effectively as fair value
hedges are recognized in earnings, along with changes in the fair value
of the hedged item. Changes in the fair value of the effective portions
of cash flow hedges are reported in Other comprehensive income
(loss) and recognized in earnings when the hedged item is recognized
in earnings. Changes in the fair value of the effective portion of net
investment hedges of certain of our foreign operations are reported in
Other comprehensive income (loss) as part of the cumulative trans-
lation adjustment and partially offset the impact of foreign currency
changes on the value of our net investment.
46 Verizon Communications Inc. and Subsidiaries
Notes to Consolidated Financial Statements continued

Variable Interest EntitiesVIEs are entities which lack sufficient equity to permit the entity to
finance its activities without additional subordinated financial support
from other parties, have equity investors which do not have the ability
to make significant decisions relating to the entity’s operations through
voting rights, do not have the obligation to absorb the expected losses,
or do not have the right to receive the residual returns of the entity. We
consolidate the assets and liabilities of VIEs when we are deemed to
be the primary beneficiary. The primary beneficiary is the party which
has the power to make the decisions that most significantly affect the
economic performance of the VIE and has the obligation to absorb
losses or the right to receive benefits that could potentially be signifi-
cant to the VIE.
Recently Adopted Accounting StandardsDuring the first quarter of 2015, we adopted the accounting standard
update related to the reporting of discontinued operations and dis-
closures of disposals of components of an entity, which changes
the criteria for reporting discontinued operations. As a result of this
standard update, a disposal of a component of an entity or a group
of components of an entity is required to be reported in discontinued
operations if the disposal represents a strategic shift that has, or will
have, a major effect on an entity’s operations and financial results. The
prospective adoption of this standard update did not have an impact
on our consolidated financial statements.
During the fourth quarter of 2015, we early adopted the accounting
standard update related to the balance sheet classification of deferred
taxes. The standard update requires that deferred tax liabilities
and assets be classified as noncurrent in the statement of financial
position. We applied the amendments in this accounting standard
update retrospectively to all periods presented. The adoption of this
standard update did not have a significant impact on our consolidated
financial statements.
Recently Issued Accounting StandardsIn September 2015, the accounting standard update related to the
simplification of the accounting for measurement- period adjustments
in business combinations was issued. This standard update requires
an acquirer to recognize measurement- period adjustments in the
reporting period in which the adjustments are determined and to
record the effects on earnings of any changes resulting from the
change in provisional amounts, calculated as if the accounting had
been completed at the acquisition date. We will adopt this standard
update during the first quarter of 2016. The adoption of this standard
update is not expected to have a significant impact on our consoli-
dated financial statements.
In May 2015, the accounting standard update related to disclosures for
investments in certain entities that calculate net asset value per share
was issued. This standard update removes the requirement to catego-
rize within the fair value hierarchy all investments for which fair value
is measured using the net asset value per share practical expedient.
The standard update also removes the requirement to make certain
disclosures for all investments that are eligible to be measured at fair
value using the net asset value per share practical expedient. We will
adopt this standard update during the first quarter of 2016 and apply it
retrospectively to all periods presented. The adoption of this standard
update is not expected to have a significant impact on our consoli-
dated financial statements.
In April 2015, the accounting standard update related to the sim-
plification of the presentation of debt issuance costs was issued.
This standard update requires that debt issuance costs related to a
recognized debt liability be presented in the balance sheet as a direct
deduction from the carrying amount of that debt liability. In August
2015, the accounting standard update related to the presentation and
subsequent measurement of debt issuance costs associated with
line-of- credit arrangements was issued. This standard adds Securities
and Exchange Commission (SEC) paragraphs pursuant to an SEC
Staff Announcement that the SEC staff would not object to an entity
deferring and presenting debt issuance costs associated with a line-
of- credit arrangement as an asset and subsequently amortizing the
costs ratably over the term of the arrangement. We will adopt these
standard updates during the first quarter of 2016. The adoption of
these standard updates is not expected to have a significant impact on
our consolidated financial statements.
In June 2014, an accounting standard update was issued related
to the accounting for share-based payments when the terms of an
award provide that a performance target could be achieved after the
requisite service period. The standard update requires that a perfor-
mance target that affects vesting and that could be achieved after the
requisite service period be treated as a performance condition. We
will adopt this standard update during the first quarter of 2016. The
adoption of this standard update is not expected to have a significant
impact on our consolidated financial statements.
In May 2014, the accounting standard update related to the recognition
of revenue from contracts with customers was issued. This standard
update clarifies the principles for recognizing revenue and develops a
common revenue standard for U.S. GAAP and International Financial
Reporting Standards. The standard update intends to provide a more
robust framework for addressing revenue issues; improve compa-
rability of revenue recognition practices across entities, industries,
jurisdictions, and capital markets; and provide more useful information
to users of financial statements through improved disclosure require-
ments. Upon adoption of this standard update, we expect that the
allocation and timing of revenue recognition will be impacted. In August
2015, an accounting standard update was issued that delays the
effective date of this standard until the first quarter of 2018. Companies
are permitted to early adopt the standard in the first quarter of 2017.
There are two adoption methods available for implementation of the
standard update related to the recognition of revenue from contracts
with customers. Under one method, the guidance is applied retro-
spectively to contracts for each reporting period presented, subject to
allowable practical expedients. Under the other method, the guidance
is applied only to the most current period presented, recognizing the
cumulative effect of the change as an adjustment to the beginning
balance of retained earnings, and also requires additional disclosures
comparing the results to the previous guidance. We are currently
evaluating these adoption methods and the impact that this standard
update will have on our consolidated financial statements.
47Verizon Communications Inc. and Subsidiaries
Notes to Consolidated Financial Statements continued

Note 2Acquisitions and Divestitures
WirelessWireless Transaction
On September 2, 2013, Verizon entered into a stock purchase
agreement (the Stock Purchase Agreement) with Vodafone Group
Plc (Vodafone) and Vodafone 4 Limited (Seller), pursuant to which
Verizon agreed to acquire Vodafone’s indirect 45% interest in Cellco
Partnership d/b/a Verizon Wireless (the Partnership, and such interest,
the Vodafone Interest) for aggregate consideration of approximately
$130 billion.
On February 21, 2014, pursuant to the terms and subject to the con-
ditions set forth in the Stock Purchase Agreement, Verizon acquired
(the Wireless Transaction) from Seller all of the issued and outstanding
capital stock (the Transferred Shares) of Vodafone Americas Finance
1 Inc., a subsidiary of Seller (VF1 Inc.), which indirectly through certain
subsidiaries (together with VF1 Inc., the Purchased Entities) owned the
Vodafone Interest. In consideration for the Transferred Shares, upon
completion of the Wireless Transaction, Verizon (i) paid approximately
$58.89 billion in cash, (ii) issued approximately 1.27 billion shares
of Verizon’s common stock, par value $0.10 per share (the Stock
Consideration), which was valued at approximately $61.3 billion at
the closing of the Wireless Transaction, (iii) issued senior unsecured
Verizon notes in an aggregate principal amount of $5.0 billion (the
Verizon Notes), (iv) sold Verizon’s indirectly owned 23.1% interest
in Vodafone Omnitel N.V. (Omnitel, and such interest, the Omnitel
Interest), valued at $3.5 billion and (v) provided other consideration,
which included the assumption of preferred stock valued at approxi-
mately $1.7 billion. The total cash paid to Vodafone and the other costs
of the Wireless Transaction, including financing, legal and bank fees,
were financed through the incurrence of third-party indebtedness. See
Note 7 for additional information.
In accordance with the accounting standard on consolidation, a
change in a parent’s ownership interest while the parent retains a con-
trolling financial interest in its subsidiary is accounted for as an equity
transaction and remeasurement of assets and liabilities of previously
controlled and consolidated subsidiaries is not permitted. As a result,
we accounted for the Wireless Transaction by adjusting the carrying
amount of the noncontrolling interest to reflect the change in Verizon’s
ownership interest in the Partnership. Any difference between the fair
value of the consideration paid and the amount by which the noncon-
trolling interest is adjusted has been recognized in equity attributable
to Verizon.
Omnitel Transaction
On February 21, 2014, Verizon and Vodafone also consummated the
sale of the Omnitel Interest (the Omnitel Transaction) by a subsidiary
of Verizon to a subsidiary of Vodafone in connection with the Wireless
Transaction pursuant to a separate share purchase agreement. As a
result, during 2014, we recognized a pre-tax gain of $1.9 billion on the
disposal of the Omnitel interest in Equity in (losses) earnings of uncon-
solidated businesses on our consolidated statement of income.
Verizon Notes (Non-Cash Transaction)
The Verizon Notes were issued pursuant to Verizon’s existing
indenture. The Verizon Notes were issued in two separate series, with
$2.5 billion due February 21, 2022 (the eight-year Verizon Notes) and
$2.5 billion due February 21, 2025 (the eleven-year Verizon Notes).
The Verizon Notes bear interest at a floating rate, which will be reset
quarterly, with interest payable quarterly in arrears, beginning May 21,
2014. The eight-year Verizon notes bear interest at a floating rate
equal to three-month London Interbank Offered Rate (LIBOR), plus
1.222%, and the eleven-year Verizon notes bear interest at a floating
rate equal to three-month LIBOR, plus 1.372%. The indenture that
governs the Verizon Notes contains certain negative covenants,
including a negative pledge covenant and a merger or similar trans-
action covenant, affirmative covenants and events of default that are
customary for companies maintaining an investment grade credit
rating. An event of default for either series of the Verizon Notes may
result in acceleration of the entire principal amount of all debt securi-
ties of that series. Beginning two years after the closing of the Wireless
Transaction, Verizon may redeem all or any portion of the outstanding
Verizon Notes held by Vodafone or any of its affiliates for a redemp-
tion price of 100% of the principal amount plus accrued and unpaid
interest. The Verizon Notes may only be transferred by Vodafone
to third parties in specified amounts during specified periods, com-
mencing January 1, 2017. Any Verizon Notes held by third parties will
not be redeemable by Verizon prior to their maturity dates. Verizon
has agreed to file a registration statement with respect to the Verizon
Notes at least three months prior to the Verizon Notes becoming
transferable.
Other Consideration (Non-Cash Transaction)
Included in the other consideration provided to Vodafone is the indirect
assumption of long-term obligations with respect to 5.143% Class
D and Class E cumulative preferred stock (Preferred Stock) issued
by one of the Purchased Entities. Both the Class D shares (825,000
shares outstanding) and Class E shares (825,000 shares outstanding)
are mandatorily redeemable in April 2020 at $1,000 per share plus any
accrued and unpaid dividends. Dividends accrue at 5.143% per annum
and will be treated as interest expense. Both the Class D and Class E
shares have been classified as liability instruments and were recorded
at fair value as determined at the closing of the Wireless Transaction.
Deferred Tax Liabilities
Certain deferred taxes directly attributable to the Wireless Transaction
have been calculated based on an analysis of taxes attributable to
the difference between the tax basis of the investment in the noncon-
trolling interest that is assumed compared to Verizon’s book basis.
As a result, Verizon recorded a deferred tax liability of approximately
$13.5 billion.
48 Verizon Communications Inc. and Subsidiaries
Notes to Consolidated Financial Statements continued

Spectrum License Transactions
Since 2013, we have entered into several strategic spectrum transac-
tions including:
• During the first quarter of 2013, we completed license exchange
transactions with T- Mobile License LLC and Cricket License
Company, LLC, a subsidiary of Leap Wireless, to exchange certain
Advanced Wireless Services (AWS) licenses. These non-cash
exchanges included a number of intra- market swaps that we expect
will enable Verizon Wireless to make more efficient use of the AWS
band. As a result of these exchanges, we received an aggregate
$0.5 billion of AWS licenses at fair value and recorded an immate-
rial gain.
• During the third quarter of 2013, after receiving the required regu-
latory approvals, Verizon Wireless sold 39 lower 700 MHz B block
spectrum licenses to AT&T Inc. (AT&T) in exchange for a payment
of $1.9 billion and the transfer by AT&T to Verizon Wireless of AWS
(10 MHz) licenses in certain markets in the western United States.
Verizon Wireless also sold certain lower 700 MHz B block spectrum
licenses to an investment firm for a payment of $0.2 billion. As a
result, we received $0.5 billion of AWS licenses at fair value and
we recorded a pre-tax gain of approximately $0.3 billion in Selling,
general and administrative expense on our consolidated statement
of income for the year ended December 31, 2013.
• During the second quarter of 2014, we completed license exchange
transactions with T- Mobile USA, Inc. (T- Mobile USA) to exchange
certain AWS and Personal Communication Services (PCS) licenses.
The exchange included a number of swaps that we expect will result
in more efficient use of the AWS and PCS bands. As a result of these
exchanges, we received $0.9 billion of AWS and PCS spectrum
licenses at fair value and we recorded an immaterial gain.
• During the second quarter of 2014, we completed transactions
pursuant to two additional agreements with T- Mobile USA with
respect to our remaining 700 MHz A block spectrum licenses.
Under one agreement, we sold certain of these licenses to
T- Mobile USA in exchange for cash consideration of approximately
$2.4 billion, and under the second agreement we exchanged the
remainder of our 700 MHz A block spectrum licenses as well as
AWS and PCS spectrum licenses for AWS and PCS spectrum
licenses. As a result, we received $1.6 billion of AWS and PCS
spectrum licenses at fair value and we recorded a pre-tax gain of
approximately $0.7 billion in Selling, general and administrative
expense on our consolidated statement of income for the year
ended December 31, 2014.
• During the third quarter of 2014, we entered into a license exchange
agreement with affiliates of AT&T to exchange certain AWS and
PCS spectrum licenses. This non-cash exchange was completed in
January 2015 at which time we recorded an immaterial gain.
• On January 29, 2015, the FCC completed an auction of 65 MHz
of spectrum, which it identified as the AWS-3 band. Verizon par-
ticipated in that auction and was the high bidder on 181 spectrum
licenses, for which we paid cash of approximately $10.4 billion.
During the fourth quarter of 2014, we made a deposit of $0.9 billion
related to our participation in this auction which is classified within
Other, net investing activities on our consolidated statement of cash
flows for the year ended December 31, 2014. During the first quarter
of 2015, we submitted an application to the FCC and paid $9.5 billion
to the FCC to complete payment for these licenses. The cash
payment of $9.5 billion is classified within Acquisitions of wireless
licenses on our consolidated statement of cash flows for the year
ended December 31, 2015. On April 8, 2015, the FCC granted us
these spectrum licenses.
• During the fourth quarter of 2015, we completed a license exchange
transaction with an affiliate of T- Mobile USA to exchange certain
AWS and PCS spectrum licenses. As a result we received
$0.4 billion of AWS and PCS spectrum licenses at fair value and
recorded a pre-tax gain of approximately $0.3 billion in Selling,
general and administrative expense on our consolidated statement
of income for the year ended December 31, 2015.
• During the fourth quarter of 2015, we entered into a license
exchange agreement with affiliates of AT&T to exchange certain
AWS and PCS spectrum licenses. This non-cash exchange is
expected to be completed during the first quarter of 2016 and we
expect to record an immaterial gain.
• During the first quarter of 2016, we entered into a license exchange
agreement with affiliates of Sprint Corporation, which provides for
the exchange of certain AWS and PCS spectrum licenses. This
non-cash exchange is expected to be completed in the second
quarter of 2016 and we expect to record an immaterial gain.
Tower Monetization Transaction
During March 2015, we completed a transaction with American Tower
Corporation (American Tower) pursuant to which American Tower
acquired the exclusive rights to lease and operate approximately
11,300 of our wireless towers for an upfront payment of $5.0 billion.
Under the terms of the leases, American Tower has exclusive rights to
lease and operate the towers over an average term of approximately
28 years. As the leases expire, American Tower has fixed-price
purchase options to acquire these towers based on their anticipated
fair market values at the end of the lease terms. As part of this trans-
action, we also sold 162 towers for $0.1 billion. We have subleased
capacity on the towers from American Tower for a minimum of 10
years at current market rates, with options to renew. The upfront
payment, including the towers sold, which is primarily included within
Other liabilities on our consolidated balance sheet, is accounted for as
deferred rent and as a financing obligation. The $2.4 billion accounted
for as deferred rent, which is presented within Other, net cash flows
provided by operating activities, relates to the portion of the towers
for which the right-of-use has passed to the tower operator. The
$2.7 billion accounted for as a financing obligation, which is presented
within Other, net cash flows used in financing activities, relates to the
portion of the towers that we continue to occupy and use for network
operations.
Other
During 2015, 2014 and 2013, we acquired various other wireless
licenses and markets for cash consideration that was not significant.
Additionally, during 2013, we obtained control of previously uncon-
solidated wireless partnerships, which were previously accounted for
under the equity method and are now consolidated, which resulted in
an immaterial gain. In 2013, we recorded $0.2 billion of goodwill as a
result of these transactions.
49Verizon Communications Inc. and Subsidiaries
Notes to Consolidated Financial Statements continued

WirelineAccess Line Sale
On February 5, 2015, we announced that we have entered into a defin-
itive agreement with Frontier Communications Corporation (Frontier)
pursuant to which Verizon will sell its local exchange business and
related landline activities in California, Florida and Texas, including
Fios Internet and video customers, switched and special access lines
and high-speed Internet service and long distance voice accounts
in these three states for approximately $10.5 billion (approximately
$7.5 billion net of income taxes), subject to certain adjustments and
including the assumption of $0.6 billion of indebtedness from Verizon
by Frontier. The transaction, which includes the acquisition by Frontier
of the equity interests of Verizon’s incumbent local exchange carriers
(ILECs) in California, Florida and Texas, does not involve any assets
or liabilities of Verizon Wireless. The assets and liabilities that will be
sold are currently included in Verizon’s continuing operations and
classified as assets held for sale and liabilities related to assets held
for sale on our consolidated balance sheet as of December 31, 2015.
For the years ended December 31, 2015 and 2014, these businesses
generated approximately $5.4 billion of revenues, excluding revenues
with affiliates, for each respective year and operating income of
approximately $0.8 billion and an immaterial loss, respectively, based
on the stand-alone financial results of the businesses. These amounts
include direct expenses incurred of approximately $2.7 billion in each
of the years ended December 31, 2015 and 2014 and (credits) charges
related to pension and benefit actuarial valuation adjustments for these
ILEC employees of $(0.2) billion and $0.6 billion for the years ended
December 31, 2015 and 2014, respectively. The amounts also include
indirect overhead expenses, which are a significant component of our
cost structure. These stand-alone financial results also include approx-
imately $1.0 billion of depreciation and amortization for the years
ended December 31, 2015 and 2014, respectively. In our consolidated
results, the depreciation and amortization of these ILEC assets ceased
at the beginning of 2015 in accordance with the accounting model for
assets held for sale. The transaction is subject to the satisfaction of
certain closing conditions including, among others, receipt of federal
approvals from the FCC and the antitrust authorities and state regu-
latory approvals. All federal and state regulatory approvals have been
obtained. We expect this transaction to close at the end of the first
quarter of 2016.
Based on the number of voice connections and Fios Internet and
video subscribers, respectively, as of December 31, 2015, the trans-
action would result in Frontier acquiring approximately 3.4 million
voice connections, 1.6 million Fios Internet subscribers, 1.2 million Fios
video subscribers and the related ILEC businesses from Verizon. The
operating results of these businesses, collectively, are included within
our Wireline segment for all periods presented.
The following table summarizes the major classes of assets and liabil-
ities of our local exchange and related landline activities in California,
Florida and Texas which are classified as held for sale on our consoli-
dated balance sheet as of December 31, 2015:
(dollars in millions)
Assets held for sale:Accounts receivable $ 435
Prepaid expense and other 58
Total current assets held for sale 493
Plant, property and equipment, net 8,884
Goodwill (Note 3) 1,328
Other assets 55
Total non- current assets held for sale 10,267
Total assets held for sale $ 10,760
Liabilities related to assets held for sale:Accounts payable and accrued liabilities $ 256
Other current liabilities 207
Total current liabilities related to assets held for sale 463
Long-term debt 594
Employee benefit obligations 289
Other liabilities 76
Total non- current liabilities related to assets held for sale 959
Total liabilities related to assets held for sale $ 1,422
Other
On July 1, 2014, we sold a non- strategic Wireline business that provides
communications solutions to a variety of government agencies for net
cash proceeds of $0.1 billion and recorded an immaterial gain.
During the fourth quarter of 2015, Verizon completed a sale of real
estate for which we received total gross proceeds of $0.2 billion and
recognized an immaterial deferred gain. The proceeds received as a
result of this transaction have been classified within Cash flows used in
investing activities on our consolidated statement of cash flows for the
year ended December 31, 2015.
OtherAcquisition of AOL Inc.
On May 12, 2015, we entered into an Agreement and Plan of Merger
(the Merger Agreement) with AOL Inc. (AOL) pursuant to which we
commenced a tender offer to acquire all of the outstanding shares of
common stock of AOL at a price of $50.00 per share, net to the seller
in cash, without interest and less any applicable withholding taxes.
On June 23, 2015, we completed the tender offer and merger, and
AOL became a wholly-owned subsidiary of Verizon. The aggregate
cash consideration paid by Verizon at the closing of these transactions
was approximately $3.8 billion. Holders of approximately 6.6 million
shares exercised appraisal rights under Delaware law. If they had
not exercised these rights, Verizon would have paid an additional
$330 million for such shares at the closing.
50 Verizon Communications Inc. and Subsidiaries
Notes to Consolidated Financial Statements continued

AOL is a leader in the digital content and advertising platform space.
Verizon has been investing in emerging technology that taps into the
market shift to digital content and advertising. AOL’s business model
aligns with this approach, and we believe that its combination of owned
and operated content properties plus a digital advertising platform
enhances our ability to further develop future revenue streams.
The acquisition of AOL has been accounted for as a business combi-
nation. The identification of the assets acquired and liabilities assumed
are finalized and we are in the process of finalizing our valuations for
deferred taxes. These adjustments are not expected to have a material
impact on our consolidated financial statements. The valuations will be
finalized within 12 months following the close of the acquisition.
The fair values of the assets acquired and liabilities assumed were
determined using the income, cost and market approaches. The fair
value measurements were primarily based on significant inputs that are
not observable in the market and thus represent a Level 3 measure-
ment as defined in Accounting Standards Codification (ASC) 820, other
than long-term debt assumed in the acquisition. The income approach
was primarily used to value the intangible assets, consisting primarily
of acquired technology and customer relationships. The income
approach indicates value for an asset based on the present value
of cash flow projected to be generated by the asset. Projected cash
flow is discounted at a required rate of return that reflects the relative
risk of achieving the cash flow and the time value of money. The cost
approach, which estimates value by determining the current cost of
replacing an asset with another of equivalent economic utility, was used,
as appropriate, for plant, property and equipment. The cost to replace a
given asset reflects the estimated reproduction or replacement cost for
the property, less an allowance for loss in value due to depreciation.
The following table summarizes the consideration to AOL’s share-
holders and the identification of the assets acquired, including cash
acquired of $0.5 billion, and liabilities assumed as of the close of the
acquisition, as well as the fair value at the acquisition date of AOL’s
noncontrolling interests:
(dollars in millions) As of June 23, 2015Cash payment to AOL’s equity holders $ 3,764
Estimated liabilities to be paid 377
Total consideration $ 4,141
Assets acquired:
Goodwill $ 1,903
Intangible assets subject to amortization 2,504
Other 1,551
Total assets acquired 5,958
Liabilities assumed:
Total liabilities assumed 1,816
Net assets acquired: 4,142
Noncontrolling interest (1)
Total consideration $ 4,141
Goodwill is calculated as the difference between the acquisition date
fair value of the consideration transferred and the fair value of the
net assets acquired. The goodwill recorded as a result of the AOL
transaction represents future economic benefits we expect to achieve
as a result of combining the operations of AOL and Verizon as well as
assets acquired that could not be individually identified and separately
recognized. The preliminary goodwill related to this acquisition is
included within Corporate and other (see Note 3 for additional details).
Pro Forma Information
If the acquisition of AOL had been completed as of January 1, 2014, our
results of operations, including Operating revenues and Net income
attributable to Verizon, would not have been materially different from
our previously reported results of operations.
Real Estate Transaction
On May 19, 2015, Verizon consummated a sale- leaseback transac-
tion with a financial services firm for the buildings and real estate at
our Basking Ridge, New Jersey location. We received total gross
proceeds of $0.7 billion resulting in a deferred gain of $0.4 billion,
which will be amortized over the initial leaseback term of twenty years.
The leaseback of the buildings and real estate is accounted for as an
operating lease. The proceeds received as a result of this transaction
have been classified within Cash flows used in investing activities
on our consolidated statement of cash flows for the year ended
December 31, 2015.
Other
On September 3, 2015, AOL announced an agreement to acquire an
advertising technology business for cash consideration that was not
significant. The transaction was completed in October 2015.
On October 7, 2014, Redbox Instant by Verizon, a venture between
Verizon and Redbox Automated Retail, LLC (Redbox), a wholly-owned
subsidiary of Outerwall Inc., ceased providing service to its customers.
In accordance with an agreement between the parties, Redbox
withdrew from the venture on October 20, 2014 and Verizon wound
down and dissolved the venture during the fourth quarter of 2014. As a
result of the termination of the venture, we recorded a pre-tax loss of
$0.1 billion in the fourth quarter of 2014.
During February 2014, Verizon acquired a business dedicated to the
development of Internet Protocol (IP) television for cash consideration
that was not significant.
During the fourth quarter of 2013, Verizon acquired an industry leader
in content delivery networks for $0.4 billion. Upon closing, we recorded
$0.3 billion of goodwill. Additionally, we acquired a technology
company for cash consideration that was not significant. The consoli-
dated financial statements include the results of the operations of each
of these acquisitions from the date each acquisition closed.
On February 20, 2016, Verizon entered into a purchase agreement
to acquire XO Holdings’ wireline business which owns and operates
one of the largest fiber-based IP and Ethernet networks outside of
Verizon's footprint for approximately $1.8 billion, subject to adjust-
ment. The transaction is subject to customary regulatory approvals
and is expected to close in the first half of 2017. Separately, Verizon
entered into an agreement to lease certain wireless spectrum from
XO Holdings and has an option to buy XO Holdings’ entity that owns
its wireless spectrum exercisable under certain circumstances.
51Verizon Communications Inc. and Subsidiaries
Notes to Consolidated Financial Statements continued

Note 3Wireless Licenses, Goodwill and Other Intangible Assets
Wireless LicensesChanges in the carrying amount of Wireless licenses are as follows:
(dollars in millions)
Balance at January 1, 2014 $ 75,747
Acquisitions (Note 2) 444
Dispositions (Note 2) (1,978)
Capitalized interest on wireless licenses 167
Reclassifications, adjustments and other 961
Balance at December 31, 2014 $ 75,341
Acquisitions (Note 2) 10,474Capitalized interest on wireless licenses 389Reclassifications, adjustments and other 371
Balance at December 31, 2015 $ 86,575
Reclassifications, adjustments and other includes the exchanges of wireless licenses in 2015 and 2014 as well as $0.3 billion of Wireless licenses
that are classified as Assets held for sale on our consolidated balance sheets at December 31, 2015 and 2014, respectively. See Note 2 for addi-
tional details.
At December 31, 2015 and 2014, approximately $10.4 billion and $0.4 billion, respectively, of wireless licenses were under development for com-
mercial service for which we were capitalizing interest costs. The increase is primarily due to licenses acquired in the AWS-3 auction.
The average remaining renewal period of our wireless license portfolio was 5.6 years as of December 31, 2015. See Note 1 for additional details.
GoodwillChanges in the carrying amount of Goodwill are as follows:
(dollars in millions)
Wireless Wireline Other TotalBalance at January 1, 2014 $ 18,376 $ 6,258 $ – $ 24,634
Acquisitions (Note 2) 15 40 – 55
Dispositions (Note 2) – (38) – (38)
Reclassifications, adjustments and other (1) (11) – (12)
Balance at December 31, 2014 $ 18,390 $ 6,249 $ – $ 24,639
Acquisitions (Note 2 ) 3 – 2,035 2,038Reclassifications, adjustments and other – (1,918) 572 (1,346)
Balance at December 31, 2015 $ 18,393 $ 4,331 $ 2,607 $ 25,331
As a result of the acquisition of AOL in the second quarter of 2015, we recognized preliminary Goodwill of $1.9 billion, which is included within
Other (see Note 2 for additional details). We also allocated $0.6 billion of goodwill on a relative fair value basis from Wireline to Other as a result of
an internal reorganization. This increase was partially offset by a decrease in Goodwill in Wireline primarily due to the reclassification of $1.3 billion
of Goodwill to Non- current assets held for sale on our consolidated balance sheet at December 31, 2015 as a result of our agreement to sell our
local exchange business and related landline activities in California, Florida and Texas to Frontier (see Note 2 for additional details). The amount
of Goodwill reclassified was based on a relative fair value basis.
52 Verizon Communications Inc. and Subsidiaries
Notes to Consolidated Financial Statements continued

Other Intangible AssetsThe following table displays the composition of Other intangible assets, net:
(dollars in millions)
2015 2014
At December 31,
Gross Amount
Accumulated Amortization
Net Amount
Gross
Amount
Accumulated
Amortization
Net
Amount
Customer lists (5 to 14 years) $ 4,139 $ (2,365) $ 1,774 $ 3,618 $ (2,924) $ 694
Non- network internal-use software (3 to 8 years) 14,542 (9,620) 4,922 12,791 (8,428) 4,363
Other (5 to 25 years) 2,220 (578) 1,642 1,073 (402) 671
Total $ 20,901 $ (12,563) $ 8,338 $ 17,482 $ (11,754) $ 5,728
The amortization expense for Other intangible assets was as follows:
Years (dollars in millions)
2015 $ 1,6942014 1,567
2013 1,587
Estimated annual amortization expense for Other intangible assets is
as follows:
Years (dollars in millions)
2016 $ 1,696
2017 1,491
2018 1,311
2019 1,082
2020 805
Note 4Plant, Property and Equipment
The following table displays the details of Plant, property and
equipment, which is stated at cost:
(dollars in millions)
At December 31, Lives (years) 2015 2014
Land – $ 709 $ 763
Buildings and equipment 15 – 45 25,587 25,209
Central office and other network
equipment 3 – 50 129,201 129,619
Cable, poles and conduit 11 – 50 44,290 54,797
Leasehold improvements 5 – 20 7,104 6,374
Work in progress – 4,907 4,580
Furniture, vehicles and other 3 – 20 8,365 9,166
220,163 230,508
Less accumulated depreciation 136,622 140,561
Plant, property and equipment, net $ 83,541 $ 89,947
Note 5Investments in Unconsolidated Businesses
Equity Method InvestmentsVodafone Omnitel
Vodafone Omnitel N.V. (Vodafone Omnitel) is one of the largest
wireless communications companies in Italy. Prior to the completion
of the Wireless Transaction on February 21, 2014, Verizon held a 23.1%
ownership interest in Vodafone Omnitel. As part of the consideration
of the Wireless Transaction, a subsidiary of Verizon sold its entire
ownership interest in Vodafone Omnitel to a subsidiary of Vodafone on
February 21, 2014. See Note 2 for additional information.
Other Equity and Cost Investees
The remaining investments include wireless partnerships in the U.S.,
limited partnership investments in entities that invest in affordable
housing projects and other smaller domestic and international
investments.
Summarized Financial InformationThe financial information for our equity method investees in 2015 and
2014, including Vodafone Omnitel through the closing of the Wireless
Transaction in February 2014, was not significant and therefore is
not reflected in the table below.
Summarized financial information for our equity investees in 2013 is
as follows:
Income Statement(dollars in millions)
Years Ended December 31, 2013
Net revenue $ 8,984
Operating income 1,632
Net income 925
53Verizon Communications Inc. and Subsidiaries
Notes to Consolidated Financial Statements continued

Note 6Leasing Arrangements
As LessorWe are the lessor in leveraged and direct financing lease agree-
ments for commercial aircraft and power generating facilities, which
comprise the majority of our leasing portfolio along with telecom-
munications equipment, commercial real estate property and other
equipment. These leases have remaining terms of up to 23 years as of
December 31, 2015. In addition, we lease space on certain of our cell
towers to other wireless carriers. Minimum lease payments receivable
represent unpaid rentals, less principal and interest on third-party non-
recourse debt relating to leveraged lease transactions. Since we have
no general liability for this debt, which is secured by a senior security
interest in the leased equipment and rentals, the related principal and
interest have been offset against the minimum lease payments. All
recourse debt is reflected in our consolidated balance sheets.
At each reporting period, we monitor the credit quality of the various
lessees in our portfolios. Regarding the leveraged lease portfolio,
external credit reports are used where available and where not
available we use internally developed indicators. These indicators or
internal credit risk grades factor historic loss experience, the value of
the underlying collateral, delinquency trends, and industry and general
economic conditions. The credit quality of our lessees varies from A
to CCC+. For each reporting period, the leveraged leases within the
portfolio are reviewed for indicators of impairment where it is probable
the rent due according to the contractual terms of the lease will not be
collected. All significant accounts, individually or in the aggregate, are
current and none are classified as impaired.
Finance lease receivables, which are included in Prepaid expenses and other and Other assets in our consolidated balance sheets, are
comprised of the following:(dollars in millions)
At December 31, 2015 2014
Leveraged Leases
Direct Finance Leases Total
Leveraged
Leases
Direct
Finance
Leases Total
Minimum lease payments receivable $ 778 $ 7 $ 785 $ 1,095 $ 8 $ 1,103
Estimated residual value 496 2 498 600 2 602
Unearned income (309) (2) (311) (535) (2) (537)
Total $ 965 $ 7 $ 972 $ 1,160 $ 8 $ 1,168
Allowance for doubtful accounts (78) (78)
Finance lease receivables, net $ 894 $ 1,090
Prepaid expenses and other $ 3 $ 4
Other assets 891 1,086
$ 894 $ 1,090
Accumulated deferred taxes arising from leveraged leases, which are included in Deferred income taxes, amounted to $0.8 billion at
December 31, 2015 and $0.9 billion at December 31, 2014.
54 Verizon Communications Inc. and Subsidiaries
Notes to Consolidated Financial Statements continued

The future minimum lease payments to be received from non-
cancelable capital leases (direct financing and leveraged leases), net
of nonrecourse loan payments related to leveraged leases and allow-
ances for doubtful accounts, along with expected receipts relating
to operating leases for the periods shown at December 31, 2015, are
as follows:
(dollars in millions)
YearsCapital
Leases
Operating
Leases
2016 $ 93 $ 128
2017 94 103
2018 52 82
2019 44 51
2020 72 23
Thereafter 430 12
Total $ 785 $ 399
As LesseeWe lease certain facilities and equipment for use in our operations
under both capital and operating leases. Total rent expense under
operating leases amounted to $3.2 billion in 2015, $2.7 billion in 2014
and $2.6 billion in 2013, respectively.
During March 2015, we completed a transaction with American Tower
pursuant to which American Tower acquired the exclusive rights to
lease and operate approximately 11,300 of our wireless towers for an
upfront payment of $5.0 billion. We have subleased capacity on the
towers from American Tower for a minimum of 10 years at current
market rates, with options to renew. Under this agreement, total rent
payments amounted to $0.2 billion for the year ended December 31,
2015. We expect to make minimum future lease payments of approxi-
mately $2.6 billion. We continue to include the towers in Plant, property
and equipment, net in our consolidated balance sheets and depreciate
them accordingly. At December 31, 2015, $0.5 billion of towers were
included in Plant, property and equipment, net. See Note 2 for addi-
tional information.
Amortization of capital leases is included in Depreciation and amortiza-
tion expense in the consolidated statements of income. Capital lease
amounts included in Plant, property and equipment are as follows:
(dollars in millions)
At December 31, 2015 2014
Capital leases $ 421 $ 319
Less accumulated amortization (221) (171)
Total $ 200 $ 148
The aggregate minimum rental commitments under noncancelable
leases for the periods shown at December 31, 2015, are as follows:
(dollars in millions)
YearsCapital
Leases
Operating
Leases
2016 $ 302 $ 2,744
2017 278 2,486
2018 187 2,211
2019 97 1,939
2020 45 1,536
Thereafter 159 7,297
Total minimum rental commitments 1,068 $ 18,213
Less interest and executory costs 111
Present value of minimum lease payments 957
Less current installments 271
Long-term obligation at December 31, 2015 $ 686
55Verizon Communications Inc. and Subsidiaries
Notes to Consolidated Financial Statements continued

Note 7Debt
Changes to debt during 2015 are as follows:
(dollars in millions)
Debt Maturing within One Year
Long-term Debt Total
Balance at January 1, 2015 $ 2,735 $ 110,536 $ 113,271Proceeds from long-term borrowings 4,000 2,667 6,667Repayments of long-term borrowings and capital leases obligations (9,340) – (9,340)Decrease in short-term obligations, excluding current maturities (344) – (344)Reclassifications of long-term debt 8,556 (8,556) –Reclassification of long-term debt to Non- current liabilities related to
assets held for sale (Note 2) – (594) (594)Debt acquired (Note 2) 461 92 553Other 421 (440) (19)
Balance at December 31, 2015 $ 6,489 $ 103,705 $ 110,194
Debt maturing within one year is as follows:
(dollars in millions)
At December 31, 2015 2014
Long-term debt maturing within one year $ 6,325 $ 2,397
Short-term notes payable 158 319
Commercial paper and other 6 19
Total debt maturing within one year $ 6,489 $ 2,735
The weighted- average interest rate for our commercial paper outstanding was 1.0% and 0.4% at December 31, 2015 and 2014, respectively.
Credit FacilityAs of December 31, 2015, the unused borrowing capacity under our $8.0 billion four-year credit facility was approximately $7.9 billion. The credit
facility does not require us to comply with financial covenants or maintain specified credit ratings, and it permits us to borrow even if our business
has incurred a material adverse change. We use the credit facility for the issuance of letters of credit and for general corporate purposes.
Long-Term DebtOutstanding long-term debt obligations are as follows:
(dollars in millions)
At December 31, Interest Rates % Maturities 2015 2014
Verizon Communications — notes payable and other 0.30 – 3.85 2016 – 2042 $ 26,281 $ 27,617
4.15 – 5.50 2018 – 2055 51,156 40,701
5.85 – 6.90 2018 – 2054 16,420 24,341
7.35 – 8.95 2018 – 2039 2,300 2,264
Floating 2016 – 2025 14,100 14,600
Verizon Wireless — notes payable and other 8.88 2018 68 676
Verizon Wireless — Alltel assumed notes 6.80 – 7.88 2029 – 2032 686 686
Telephone subsidiaries–debentures 5.13 – 6.50 2028 – 2033 575 1,075
7.38 – 7.88 2022 – 2032 1,099 1,099
8.00 – 8.75 2019 – 2031 780 880
Other subsidiaries — debentures and other 6.84 – 8.75 2018 – 2028 1,432 1,432
Capital lease obligations (average rate of 3.4% and 4.0% in 2015 and
2014, respectively) 957 516
Unamortized discount, net of premium (5,824) (2,954)
Total long-term debt, including current maturities 110,030 112,933
Less long-term debt maturing within one year 6,325 2,397
Total long-term debt $ 103,705 $ 110,536
56 Verizon Communications Inc. and Subsidiaries
Notes to Consolidated Financial Statements continued

2015
February Exchange Offers
On February 11, 2015, we announced the commencement of seven
separate private offers to exchange (the February Exchange Offers)
specified series of outstanding notes and debentures issued by
Verizon and GTE Corporation (collectively, the Old Notes) for new
Notes to be issued by Verizon (the New Notes) and, in the case of the
6.94% debentures due 2028 of GTE Corporation, cash. The February
Exchange Offers have been accounted for as a modification of debt.
On March 13, 2015, Verizon issued $2.9 billion aggregate principal
amount of 4.272% Notes due 2036 (the 2036 New Notes), $5.0 billion
aggregate principal amount of 4.522% Notes due 2048 (the 2048
New Notes) and $5.5 billion aggregate principal amount of 4.672%
Notes due 2055 (the 2055 New Notes) in satisfaction of the exchange
offer consideration on tendered Old Notes (not including accrued and
unpaid interest on the Old Notes). The following tables list the series of
Old Notes included in the February Exchange Offers and the principal
amount of each such series accepted by Verizon for exchange.
The table below lists the series of Old Notes included in the February Exchange Offers for the 2036 New Notes:
(dollars in millions)Interest
Rate MaturityPrincipal Amount
Outstanding
Principal Amount Accepted For
ExchangeVerizon Communications Inc. 5.15% 2023 $ 11,000 $ 2,483
The table below lists the series of Old Notes included in the February Exchange Offers for the 2048 New Notes:
(dollars in millions)Interest
Rate MaturityPrincipal Amount
Outstanding
Principal Amount Accepted For
ExchangeVerizon Communications Inc. 6.90% 2038 $ 1,250 $ 773
6.40% 2038 1,750 884
6.40% 2033 4,355 2,159
6.25% 2037 750 –
GTE Corporation 6.94% 2028 800 –
$ 3,816
The table below lists the series of Old Notes included in the February Exchange Offers for the 2055 New Notes:
(dollars in millions)Interest
Rate MaturityPrincipal Amount
Outstanding
Principal Amount Accepted For
ExchangeVerizon Communications Inc. 6.55% 2043 $ 10,670 $ 4,084
Term Loan Agreement
During the first quarter of 2015, we entered into a term loan agreement
with a major financial institution, pursuant to which we borrowed
$6.5 billion for general corporate purposes, including the acquisition of
spectrum licenses. Borrowings under the term loan agreement were
to mature in March 2016, with a $4.0 billion mandatory prepayment
required in June 2015. The term loan agreement contained certain
negative covenants, including a negative pledge covenant, a merger
or similar transaction covenant and an accounting changes covenant,
affirmative covenants and events of default that are customary for
companies maintaining an investment grade credit rating. In addition,
the term loan agreement required us to maintain a leverage ratio
(as defined in the term loan agreement) not in excess of 3.50:1.00,
until our credit ratings were equal to or higher than A3 and A- at
Moody’s Investors Service and Standard & Poor’s Ratings Services,
respectively.
During March 2015, we prepaid approximately $5.0 billion of the term
loan agreement, which satisfied the mandatory prepayment. During the
third and fourth quarters of 2015, respectively, we made repayments of
approximately $1.0 billion and $0.5 billion. As of December 31, 2015, no
amounts remained outstanding under the term loan agreement.
Other
During June 2015, as part of the Merger Agreement with AOL, we
assumed approximately $0.6 billion of debt and capital lease obli-
gations. As of December 31, 2015, approximately $0.4 billion of the
assumed debt and capital lease obligations were repaid.
During October 2015, we executed a $0.2 billion, 1.5% loan due
2018. Also, during March 2015, $0.5 billion of floating rate Verizon
Communications Notes matured and were repaid. During November
2015, $1.0 billion of 0.7% Verizon Communications Notes matured and
were repaid.
2014
During February 2014, we issued €1.75 billion aggregate principal
amount of 2.375% Notes due 2022, €1.25 billion aggregate principal
amount of 3.25% Notes due 2026 and £0.85 billion aggregate
principal amount of 4.75% Notes due 2034. The issuance of these
Notes resulted in cash proceeds of approximately $5.4 billion, net
of discounts and issuance costs. The net proceeds were used, in
part, to finance the Wireless Transaction. Net proceeds not used to
finance the Wireless Transaction were used for general corporate
purposes. Also, during February 2014, we issued $0.5 billion aggregate
principal amount of 5.90% Notes due 2054 resulting in cash proceeds
of approximately $0.5 billion, net of discounts and issuance costs.
The net proceeds were used for general corporate purposes.
57Verizon Communications Inc. and Subsidiaries
Notes to Consolidated Financial Statements continued

During March 2014, we issued $4.5 billion aggregate principal
amount of fixed and floating rate notes resulting in cash proceeds
of approximately $4.5 billion, net of discounts and issuance costs.
The issuances consisted of the following: $0.5 billion aggregate
principal amount Floating Rate Notes due 2019 that bear interest
at a rate equal to three-month LIBOR plus 0.77% which rate will be
reset quarterly, $0.5 billion aggregate principal amount of 2.55% Notes
due 2019, $1.0 billion aggregate principal amount of 3.45% Notes due
2021, $1.25 billion aggregate principal amount of 4.15% Notes due 2024
and $1.25 billion aggregate principal amount of 5.05% Notes due
2034. During March 2014, the net proceeds were used to purchase
notes in the Tender Offer described below.
Also, during March 2014, $1.0 billion of LIBOR plus 0.61%
Verizon Communications Notes and $1.5 billion of 1.95% Verizon
Communications Notes matured and were repaid.
During September 2014, we issued $0.9 billion aggregate principal
amount of 4.8% Notes due 2044. The issuance of these Notes resulted
in cash proceeds of approximately $0.9 billion, net of discounts and
issuance costs. The net proceeds were used for general corporate
purposes. Also, during September 2014, we redeemed $0.8 billion
aggregate principal amount of Verizon 1.25% Notes due November
2014 and recorded an immaterial amount of early debt redemp-
tion costs.
During October 2014, we issued $6.5 billion aggregate principal
amount of fixed rate notes. The issuance of these notes resulted
in cash proceeds of approximately $6.4 billion, net of discounts
and issuance costs and after reimbursement of certain expenses.
The issuance consisted of the following: $1.5 billion aggregate
principal amount of 3.00% Notes due 2021, $2.5 billion aggregate
principal amount of 3.50% Notes due 2024, and $2.5 billion
aggregate principal amount of 4.40% Notes due 2034. The net
proceeds from the issuance was used to redeem (i) in whole the
following series of outstanding notes which were called for early
redemption in November 2014 (collectively, November Early Debt
Redemption): $0.5 billion aggregate principal amount of Verizon
Communications 4.90% Notes due 2015 at 103.7% of the principal
amount of such notes, $0.6 billion aggregate principal amount of
Verizon Communications 5.55% Notes due 2016 at 106.3% of the
principal amount of such notes, $1.3 billion aggregate principal amount
of Verizon Communications 3.00% Notes due 2016 at 103.4% of
the principal amount of such notes, $0.4 billion aggregate principal
amount of Verizon Communications 5.50% Notes due 2017 at 110.5%
of the principal amount of such notes, $0.7 billion aggregate principal
amount of Verizon Communications 8.75% Notes due 2018 at 125.2%
of the principal amount of such notes, $0.1 billion aggregate principal
amount of Alltel Corporation 7.00% Debentures due 2016 at 108.7% of
the principal amount of such notes and $0.4 billion aggregate principal
amount of Cellco Partnership and Verizon Wireless Capital LLC 8.50%
Notes due 2018 at 124.5% of the principal amount of such notes; and
(ii) $1.0 billion aggregate principal amount of Verizon Communications
2.50% Notes due 2016 at 103.0% of the principal amount of such
notes. Proceeds not used for the redemption of these notes were
used for general corporate purposes. Any accrued and unpaid interest
was paid to the date of redemption (see “Early Debt Redemption and
Other Costs”).
During December 2014, we issued €1.4 billion aggregate principal
amount of 1.625% Notes due 2024 and €1.0 billion aggregate
principal amount of 2.625% Notes due 2031. The issuance of these
Notes resulted in cash proceeds of approximately $3.0 billion,
net of discounts and issuance costs and after reimbursement
of certain expenses. The net proceeds were used for general
corporate purposes.
Verizon Notes (Non-Cash Transaction)
During February 2014, in connection with the Wireless Transaction,
we issued $5.0 billion aggregate principal amount of floating rate
notes. The Verizon Notes were issued in two separate series, with
$2.5 billion due February 21, 2022 and $2.5 billion due February 21,
2025. The Verizon Notes bear interest at a floating rate, which will be
reset quarterly, with interest payable quarterly in arrears, beginning
May 21, 2014 (see Note 2). The eight-year Verizon notes bear interest
at a floating rate equal to three-month LIBOR, plus 1.222%, and the
eleven-year Verizon notes bear interest at a floating rate equal to
three-month LIBOR, plus 1.372%.
Preferred Stock (Non-Cash Transaction)
As a result of the Wireless Transaction, we assumed long-term obliga-
tions with respect to 5.143% Class D and Class E cumulative Preferred
Stock issued by one of the Purchased Entities. Both the Class D
shares (825,000 shares outstanding) and Class E shares (825,000
shares outstanding) are mandatorily redeemable in April 2020 at
$1,000 per share plus any accrued and unpaid dividends. Dividends
accrue at 5.143% per annum and will be treated as interest expense.
Both the Class D and Class E shares have been classified as liability
instruments and were recorded at fair value as determined at the
closing of the Wireless Transaction.
Term Loan Agreement
During February 2014, we drew $6.6 billion pursuant to a term loan
agreement, which was entered into during October 2013, with a
group of major financial institutions to finance, in part, the Wireless
Transaction. $3.3 billion of the loans under the term loan agreement
had a maturity of three years (the 3-Year Loans) and $3.3 billion of
the loans under the term loan agreement had a maturity of five years
(the 5-Year Loans). The 5-Year Loans provide for the partial amorti-
zation of principal during the last two years that they are outstanding.
Loans under the term loan agreement bear interest at floating rates.
The term loan agreement contains certain negative covenants,
including a negative pledge covenant, a merger or similar transaction
covenant and an accounting changes covenant, affirmative covenants
and events of default that are customary for companies maintaining
an investment grade credit rating. In addition, the term loan agreement
requires us to maintain a leverage ratio (as defined in the term loan
agreement) not in excess of 3.50:1.00, until our credit ratings are
equal to or higher than A3 and A- at Moody’s Investors Service and
Standard & Poor’s Ratings Services, respectively.
During June 2014, we issued $3.3 billion aggregate principal amount
of fixed and floating rate notes resulting in cash proceeds of approxi-
mately $3.3 billion, net of discounts and issuance costs. The issuances
consisted of the following: $1.3 billion aggregate principal amount of
Floating Rate Notes due 2017 that will bear interest at a rate equal
to three-month LIBOR plus 0.40% which will be reset quarterly and
$2.0 billion aggregate principal amount of 1.35% Notes due 2017. We
used the net proceeds from the offering of these notes to repay the
3-Year Loans on June 12, 2014.
During July 2014, we amended the term loan agreement, settled the
outstanding $3.3 billion of 5-Year Loans and borrowed $3.3 billion of
new loans. The new loans mature in July 2019, bear interest at a lower
interest rate and require lower amortization payments in 2017 and
2018. In connection with the transaction, which primarily settled on a
net basis, we recorded approximately $0.5 billion of proceeds from
long-term borrowings and of repayments of long-term borrowings,
respectively.
58 Verizon Communications Inc. and Subsidiaries
Notes to Consolidated Financial Statements continued

Tender Offer
On March 10, 2014, we announced the commencement of a tender offer (the Tender Offer) to purchase for cash any and all of the series of notes
listed in the following table:
(dollars in millions, except for Purchase Price)Interest
Rate MaturityPrincipal Amount
OutstandingPurchase
Price(1)
Principal Amount Purchased
Verizon Communications 6.10% 2018 $ 1,500 $ 1,170.07 $ 748
5.50% 2018 1,500 1,146.91 763
8.75% 2018 1,300 1,288.35 564
5.55% 2016 1,250 1,093.62 652
5.50% 2017 750 1,133.22 353
Cellco Partnership and Verizon Wireless Capital LLC 8.50% 2018 1,000 1,279.63 619
Alltel Corporation 7.00% 2016 300 1,125.26 157
GTE Corporation 6.84% 2018 600 1,196.85 266
$ 4,122
(1) Per $1,000 principal amount of notes
The Tender Offer for each series of notes was subject to a financing
condition, which was either satisfied or waived with respect to all
series. The Tender Offer expired on March 17, 2014 and settled
on March 19, 2014. In addition to the purchase price, any accrued
and unpaid interest on the purchased notes was paid to the date
of purchase. During March 2014, we recorded early debt redemp-
tion costs in connection with the Tender Offer (see “Early Debt
Redemption and Other Costs”).
May Exchange Offer
On May 29, 2014, we announced the commencement of a private
exchange offer (the May Exchange Offer) to exchange up to all
Cellco Partnership and Verizon Wireless Capital LLC’s £0.6 billion
outstanding aggregate principal amount of 8.875% Notes due 2018
(the 2018 Old Notes) for Verizon’s new sterling- denominated Notes
due 2024 (the New Notes) and an amount of cash. This exchange
offer has been accounted for as a modification of debt. In connection
with the May Exchange Offer, which expired on June 25, 2014, we
issued £0.7 billion aggregate principal of New Notes and made a cash
payment of £22 million in exchange for £0.6 billion aggregate principal
amount of tendered 2018 Old Notes. The New Notes bear interest at a
rate of 4.073% per annum.
Concurrent with the issuance of the New Notes, we entered into cross
currency swaps to fix our future interest and principal payments in U.S.
dollars (see Note 9).
July Exchange Offers
On July 23, 2014, we announced the commencement of eleven
separate private offers to exchange (the July Exchange Offers)
specified series of outstanding Notes issued by Verizon and Alltel
Corporation (collectively, the Old Notes) for new Notes to be issued
by Verizon. The July Exchange Offers have been accounted for as a
modification of debt. On August 21, 2014, Verizon issued $3.3 billion
aggregate principal amount of 2.625% Notes due 2020 (the 2020
New Notes), $4.5 billion aggregate principal amount of 4.862% Notes
due 2046 (the 2046 New Notes) and $5.5 billion aggregate principal
amount of 5.012% Notes due 2054 (the 2054 New Notes) in satisfac-
tion of the exchange offer consideration on tendered Old Notes (not
including accrued and unpaid interest on the Old Notes). The following
tables list the series of Old Notes included in the July Exchange Offers
and the principal amount of each such series accepted by Verizon
for exchange.
The table below lists the series of Old Notes included in the July Exchange Offers for the 2020 New Notes:
(dollars in millions)Interest
Rate MaturityPrincipal Amount
Outstanding
Principal Amount Accepted For
ExchangeVerizon Communications 3.65% 2018 $ 4,750 $ 2,052
2.50% 2016 4,250 1,068
$ 3,120
The table below lists the series of Old Notes included in the July Exchange Offers for the 2046 New Notes:
(dollars in millions)Interest
Rate MaturityPrincipal Amount
Outstanding
Principal Amount Accepted For
ExchangeVerizon Communications 6.40% 2033 $ 6,000 $ 1,645
7.75% 2030 2,000 794
7.35% 2039 1,000 520
7.75% 2032 400 149
Alltel Corporation 7.875% 2032 700 248
6.80% 2029 300 65
$ 3,421
59Verizon Communications Inc. and Subsidiaries
Notes to Consolidated Financial Statements continued

The table below lists the series of Old Notes included in the July Exchange Offers for the 2054 New Notes:
(dollars in millions)Interest
Rate MaturityPrincipal Amount
Outstanding
Principal Amount Accepted For
ExchangeVerizon Communications 6.55% 2043 $ 15,000 $ 4,330
6.40% 2038 1,750 –
6.90% 2038 1,250 –
$ 4,330
Verizon Wireless — Notes Payable and OtherVerizon Wireless Capital LLC, a wholly-owned subsidiary of Verizon
Wireless, is a limited liability company formed under the laws of
Delaware on December 7, 2001 as a special purpose finance subsid-
iary to facilitate the offering of debt securities of Verizon Wireless by
acting as co- issuer. Other than the financing activities as a co- issuer of
Verizon Wireless indebtedness, Verizon Wireless Capital LLC has no
material assets, operations or revenues. Verizon Wireless is jointly and
severally liable with Verizon Wireless Capital LLC for co- issued notes.
2015
During December 2015, we repaid $0.6 billion upon maturity for
€0.5 billion aggregate principal amount of Cellco Partnership and
Verizon Wireless Capital LLC 8.750% Notes due 2015, and the related
cross currency swap was settled.
2014
In addition to the retirements of debt securities in connection with the
Tender Offer, the May Exchange Offer, the July Exchange Offers and
the November Early Debt Redemption, as noted above, during March
2014, Verizon Wireless redeemed $1.25 billion aggregate principal
amount of the Cellco Partnership and Verizon Wireless Capital LLC
8.50% Notes due 2018 at 127.135% of the principal amount of such
notes, plus accrued and unpaid interest (see “Early Debt Redemption
and Other Costs”).
Telephone and Other Subsidiary Debt2014
During 2014, a series of notes held by GTE Corporation was included
in the Tender Offer described above.
Early Debt Redemption and Other CostsDuring March 2014, we recorded net debt redemption costs of
$0.9 billion in connection with the early redemption of $1.25 billion
aggregate principal amount of Cellco Partnership and Verizon Wireless
Capital LLC 8.50% Notes due 2018, and the purchase of the following
notes pursuant to the Tender Offer: $0.7 billion of the then outstanding
$1.5 billion aggregate principal amount of Verizon 6.10% Notes due
2018, $0.8 billion of the then outstanding $1.5 billion aggregate
principal amount of Verizon 5.50% Notes due 2018, $0.6 billion of the
then outstanding $1.3 billion aggregate principal amount of Verizon
8.75% Notes due 2018, $0.7 billion of the then outstanding $1.25 billion
aggregate principal amount of Verizon 5.55% Notes due 2016,
$0.4 billion of the then outstanding $0.75 billion aggregate principal
amount of Verizon 5.50% Notes due 2017, $0.6 billion of the then out-
standing $1.0 billion aggregate principal amount of Cellco Partnership
and Verizon Wireless Capital LLC 8.50% Notes due 2018, $0.2 billion
of the then outstanding $0.3 billion aggregate principal amount of
Alltel Corporation 7.00% Debentures due 2016 and $0.3 billion of
the then outstanding $0.6 billion aggregate principal amount of GTE
Corporation 6.84% Debentures due 2018.
During the fourth quarter of 2014, we recorded net debt redemp-
tion costs of $0.5 billion in connection with the early redemption of
$0.5 billion aggregate principal amount of Verizon 4.90% Notes due
2015, $0.6 billion aggregate principal amount of Verizon 5.55% Notes
due 2016, $1.3 billion aggregate principal amount of Verizon 3.00%
Notes due 2016, $0.4 billion aggregate principal amount of Verizon
5.50% Notes due 2017, $0.7 billion aggregate principal amount of
Verizon 8.75% Notes due 2018, $1.0 billion of the then outstanding
$3.2 billion aggregate principal amount of Verizon 2.50% Notes due
2016, $0.1 billion aggregate principal amount Alltel Corporation 7.00%
Debentures due 2016 and $0.4 billion aggregate principal amount of
Cellco Partnership and Verizon Wireless Capital LLC 8.50% Notes due
2018, as well as $0.3 billion of other costs.
We recognize early debt redemption costs in Other income and
(expense), net on our consolidated statements of income.
Additional Financing Activities (Non-Cash Transaction)We financed, primarily through vendor financing arrangements, the
purchase of approximately $0.7 billion of long-lived assets during 2015
and 2014, consisting primarily of network equipment. At December 31,
2015, $0.9 billion of vendor financing arrangements remained out-
standing. These purchases are non-cash financing activities and
therefore not reflected within Capital expenditures on our consolidated
statements of cash flows.
GuaranteesWe guarantee the debentures and first mortgage bonds of our
operating telephone company subsidiaries. As of December 31, 2015,
$3.1 billion aggregate principal amount of these obligations remained
outstanding. Each guarantee will remain in place for the life of the obli-
gation unless terminated pursuant to its terms, including the operating
telephone company no longer being a wholly-owned subsidiary
of Verizon.
We also guarantee the debt obligations of GTE Corporation that were
issued and outstanding prior to July 1, 2003. As of December 31, 2015,
$1.4 billion aggregate principal amount of these obligations remain
outstanding.
Debt CovenantsWe and our consolidated subsidiaries are in compliance with all of our
financial and restrictive covenants.
Maturities of Long-Term DebtMaturities of long-term debt outstanding at December 31, 2015 are
as follows:
Years (dollars in millions)
2016 $ 6,325
2017 4,195
2018 7,072
2019 5,645
2020 8,860
Thereafter 77,933
60 Verizon Communications Inc. and Subsidiaries
Notes to Consolidated Financial Statements continued

Note 8Wireless Device Installment Plans
Under the Verizon device payment program, our eligible wireless
customers purchase phones or tablets at unsubsidized prices on an
installment basis (a device installment plan). Customers that activate
service on devices purchased under the device payment program pay
lower service fees as compared to those under our fixed-term service
plans, and their installment charge is included in their standard wireless
monthly bill. As of December 31, 2015 and 2014, respectively, the total
portfolio of device installment plan receivables we are servicing was
$11.9 billion and $3.8 billion. During 2015, we entered into programs to
sell certain device installment receivables. The outstanding portfolio
of device installment plan receivables derecognized from our consoli-
dated balance sheets but which we continue to service was $8.2 billion
at December 31, 2015.
Wireless Device Installment Plan ReceivablesThe following table displays device installment plan receivables, net,
that continue to be recognized in our consolidated balance sheets:
(dollars in millions)
At December 31, 2015 2014
Device installment plan receivables, gross $ 3,720 $ 3,833
Unamortized imputed interest (142) (155)
Device installment plan receivables, net of
unamortized imputed interest 3,578 3,678
Allowance for credit losses (444) (76)
Device installment plan receivables, net $ 3,134 $ 3,602
Classified on our consolidated balance sheets:
Accounts receivable, net $ 1,979 $ 2,470
Other assets 1,155 1,132
Device installment plan receivables, net $ 3,134 $ 3,602
At the time of sale, we impute risk adjusted interest on the device
installment plan receivables. We record the imputed interest as a
reduction to the related accounts receivable. Interest income, which is
included within Service revenues and other on our consolidated state-
ments of income, is recognized over the financed installment term.
We assess the collectability of our device installment plan receivables
based upon a variety of factors, including the credit quality of the
customer base, payment trends and other qualitative factors. We
use custom, empirical, risk models to measure the credit quality of a
customer and determine eligibility for the device payment program.
Based upon the risk assessed by the models, a customer may be
required to provide a down payment to enter into the program and
may be subject to lower limits on the total amount financed. The down
payment will vary in accordance with the risk assessed. We update
our risk assessments monthly based on payment trends and other
qualitative factors in order to monitor the overall quality of our receiv-
ables. The credit quality of our customers is consistent throughout the
periods presented.
Activity in the allowance for credit losses for the device installment
plan receivables was as follows:
(dollars in millions)
Balance at January 1, 2015 $ 76
Bad debt expenses 662
Write-offs (203)
Allowance related to receivables sold (101)
Other 10
Balance at December 31, 2015 $ 444
Customers entering into device installment agreements prior to
May 31, 2015 have the right to upgrade their device, subject to certain
conditions, including making a stated portion of the required device
payments and trading in their device. Generally, customers entering into
device installment agreements on or after June 1, 2015 are required to
repay all amounts due under their device installment agreement before
being eligible to upgrade their device. However, certain devices are
subject to promotions that allow customers to upgrade to a new device
after paying down the minimum percentage of their device installment
plan and trading in their device. When a customer is eligible to upgrade
to a new device, we record a guarantee liability in accordance with our
accounting policy. The gross guarantee liability related to the upgrade
program, which was approximately $0.2 billion at December 31, 2015
and $0.7 billion at December 31, 2014, was primarily included in Other
current liabilities on our consolidated balance sheets.
Sales of Wireless Device Installment Plan ReceivablesWireless Device Installment Plan Receivables Purchase Agreement
During the first quarter of 2015, we established a program
(Receivables Purchase Agreement, or RPA) to sell from time to time,
on an uncommitted basis, eligible device installment plan receivables
to a group of primarily relationship banks (Purchasers). Under the
program, we transfer the eligible receivables to wholly-owned sub-
sidiaries that are bankruptcy remote special purpose entities (Sellers
or SPEs). The Sellers then sell the receivables to the Purchasers for
upfront cash proceeds and additional consideration upon settlement
of the receivables (the deferred purchase price). The receivables
sold under the program are no longer considered assets of Verizon.
We continue to bill and collect on the receivables in exchange for a
monthly servicing fee, which is not material. Eligible receivables under
the RPA exclude device installment plans where a customer was
required to provide a down payment.
Revolving Sale of Wireless Device Installment Plan Receivables
During the fourth quarter of 2015, we entered into a one-year uncom-
mitted facility to sell eligible device installment plan receivables on a
revolving basis (Revolving Program), subject to a maximum funding
limit, to the Purchasers. Sales of eligible receivables by the Sellers, once
initiated, generally occur and are settled on a monthly basis. The receiv-
ables sold under the Revolving Program are no longer considered
assets of Verizon. We continue to bill and collect on the receivables in
exchange for a monthly servicing fee, which is not material. Customer
installment payments will be available to purchase eligible installment
plan receivables originated over the facility’s term. Eligible receivables
under the Revolving Program exclude device installment plans where a
customer was required to provide a down payment.
The sales of receivables under the RPA and Revolving Program did not
have a material impact on our consolidated statements of income. The
cash proceeds received from the Purchasers are recorded within Cash
flows provided by operating activities on our consolidated statement of
cash flows.
The following table provides a summary of device installment receiv-
ables sold under the RPA and the Revolving Program during the year
ended December 31, 2015:
(dollars in millions) RPARevolving Program Total
Device installment plan receivables
sold, net(1) $ 6,093 $ 3,270 $ 9,363Cash proceeds received(2) 4,502 2,738 7,240Deferred purchase price recorded 1,690 532 2,222
(1) Device installment plan receivables net of allowances, imputed interest and the device
trade-in right.
(2) As of December 31, 2015, cash proceeds received, net of remittances, were $5.9 billion.
61Verizon Communications Inc. and Subsidiaries
Notes to Consolidated Financial Statements continued

Variable Interest Entities
Under both the RPA and the Revolving Program, the SPE’s sole
business consists of the acquisition of the receivables from Verizon and
the resale of the receivables to the Purchasers. The assets of the SPEs
are not available to be used to satisfy obligations of any Verizon entities
other than the Sellers. We determined that the SPEs are VIEs as they
lack sufficient equity to finance their activities. Given that we have the
power to direct the activities of the SPEs that most significantly impact
the SPE’s economic performance, we are deemed to be the primary
beneficiary of the SPEs. As a result, we consolidate the assets and lia-
bilities of the SPEs into our consolidated financial statements.
Deferred Purchase Price
Under both the RPA and the Revolving Program, the deferred
purchase price was initially recorded at fair value, based on the
remaining installment amounts expected to be collected, adjusted, as
applicable, for the time value of money and by the timing and estimated
value of the device trade-in. The estimated value of the device trade-in
considers prices expected to be offered to us by independent third
parties. This estimate contemplates changes in value after the launch
of a device. The fair value measurements are considered to be Level
3 measurements within the fair value hierarchy. The collection of the
deferred purchase price is contingent on collections from customers.
At December 31, 2015, our deferred purchase price receivable was
$2.2 billion, which is held by the SPEs and is included within Other
assets on our consolidated balance sheet.
Continuing Involvement
Verizon has continuing involvement with the sold receivables as it
services the receivables. We continue to service the customer and
their related receivables, including facilitating customer payment
collection, in exchange for a monthly servicing fee. While servicing
the receivables, the same policies and procedures are applied to the
sold receivables that apply to owned receivables, and we continue to
maintain normal relationships with our customers. The credit quality
of the customers we continue to service is consistent throughout the
periods presented. During the year ended December 31, 2015, we have
collected and remitted approximately $1.3 billion, net of fees, of which
an immaterial amount was returned as deferred purchase price. During
the year ended December 31, 2015, credit losses on receivables sold
were an immaterial amount.
In addition, we have continuing involvement related to the sold
receivables as we may be responsible for absorbing additional
credit losses pursuant to the agreements. The Company’s maximum
exposure to loss related to the involvement with the SPEs is limited
to the amount of the deferred purchase price, which was $2.2 billion
as of December 31, 2015. The maximum exposure to loss represents
an estimated loss that would be incurred under severe, hypothetical
circumstances whereby the Company would not receive the portion of
the proceeds withheld by the Purchasers. As we believe the probability
of these circumstances occurring is remote, the maximum exposure to
loss is not an indication of the Company’s expected loss.
Note 9Fair Value Measurements and Financial Instruments
Recurring Fair Value MeasurementsThe following table presents the balances of assets and liabilities
measured at fair value on a recurring basis as of December 31, 2015:
(dollars in millions)
Level 1(1) Level 2(2) Level 3(3) TotalAssets:Short-term investments:
Equity securities $ 265 $ – $ – $ 265Fixed income securities – 85 – 85
Other current assets:
Fixed income securities 250 – – 250Other assets:
Fixed income securities – 928 – 928Interest rate swaps – 128 – 128Net investment hedges – 13 – 13Cross currency swaps – 1 – 1
Total $ 515 $ 1,155 $ – $ 1,670
Liabilities:Other liabilities:
Interest rate swaps $ – $ 19 $ – $ 19Cross currency swaps – 1,638 – 1,638Forward interest rate swaps – 24 – 24
Total $ – $ 1,681 $ – $ 1,681
(1) quoted prices in active markets for identical assets or liabilities
(2) observable inputs other than quoted prices in active markets for identical assets and
liabilities
(3) no observable pricing inputs in the market
Equity securities consist of investments in common stock of domestic
and international corporations measured using quoted prices in
active markets.
Fixed income securities consist primarily of investments in municipal
bonds as well as U.S. Treasury securities. We use quoted prices in
active markets for our U.S. Treasury securities, therefore these secu-
rities are classified as Level 1. For all other fixed income securities that
do not have quoted prices in active markets, we use alternative matrix
pricing resulting in these debt securities being classified as Level 2.
Derivative contracts are valued using models based on readily observ-
able market parameters for all substantial terms of our derivative
contracts and thus are classified within Level 2. We use mid- market
pricing for fair value measurements of our derivative instruments. Our
derivative instruments are recorded on a gross basis.
We recognize transfers between levels of the fair value hierarchy as of
the end of the reporting period. There were no transfers within the fair
value hierarchy during 2015.
62 Verizon Communications Inc. and Subsidiaries
Notes to Consolidated Financial Statements continued

Fair Value of Short-term and Long-term Debt
The fair value of our debt is determined using various methods, including quoted prices for identical terms and maturities, which is a Level 1 mea-
surement, as well as quoted prices for similar terms and maturities in inactive markets and future cash flows discounted at current rates, which
are Level 2 measurements. The fair value of our short-term and long-term debt, excluding capital leases, was as follows:
(dollars in millions)
At December 31, 2015 2014
Carrying Amount
Fair Value
Carrying
Amount
Fair
Value
Short- and long-term debt, excluding capital leases $ 109,237 $ 118,216 $ 112,755 $ 126,549
Derivative InstrumentsInterest Rate Swaps
We enter into domestic interest rate swaps to achieve a targeted mix of
fixed and variable rate debt. We principally receive fixed rates and pay
variable rates based on LIBOR, resulting in a net increase or decrease
to Interest expense. These swaps are designated as fair value hedges
and hedge against changes in the fair value of our debt portfolio. We
record the interest rate swaps at fair value on our consolidated balance
sheets as assets and liabilities.
During the third quarter of 2015, we entered into interest rate swaps
with a total notional value of $3.2 billion. During the fourth quarter of
2015, we entered into interest rate swaps with a total notional value of
$2.6 billion. At December 31, 2015 and 2014, the total notional amount of
the interest rate swaps was $7.6 billion and $1.8 billion, respectively. The
fair value of these contracts was $0.1 billion at December 31, 2015 and
was not material at December 31, 2014. The ineffective portion of these
interest rate swaps was not material at December 31, 2015 and 2014.
Forward Interest Rate Swaps
In order to manage our exposure to future interest rate changes, we
have entered into forward interest rate swaps. We designated these
contracts as cash flow hedges. At December 31, 2014, these swaps
had a notional value of $2.0 billion. The fair value of these contracts
was $0.2 billion at December 31, 2014, which was included within
Other liabilities on our consolidated balance sheet. During the third
quarter of 2015, we settled these forward interest rate swaps and the
pre-tax loss was not material. During the third quarter of 2015, we
entered into forward interest rate swaps with a total notional value
of $0.8 billion. The fair value of these contracts was not material at
December 31, 2015.
Cross Currency Swaps
Verizon Wireless previously entered into cross currency swaps des-
ignated as cash flow hedges to exchange approximately $1.6 billion
of British Pound Sterling and Euro- denominated debt into U.S. dollars
and to fix our future interest and principal payments in U.S. dollars, as
well as to mitigate the impact of foreign currency transaction gains or
losses. In June 2014, we settled $0.8 billion of these cross currency
swaps and the gains with respect to these swaps were not material. In
December 2015, we settled $0.6 billion of these cross currency swaps
on maturity.
During the first quarter of 2014, we entered into cross currency
swaps designated as cash flow hedges to exchange approximately
$5.4 billion of Euro and British Pound Sterling denominated debt into
U.S. dollars. During the second quarter of 2014, we entered into cross
currency swaps designated as cash flow hedges to exchange approx-
imately $1.2 billion of British Pound Sterling denominated debt into
U.S. dollars. During the fourth quarter of 2014, we entered into cross
currency swaps designated as cash flow hedges to exchange approxi-
mately $3.0 billion of Euro denominated debt into U.S. dollars and to fix
our future interest and principal payments in U.S. dollars. Each of these
cross currency swaps was entered into in order to mitigate the impact
of foreign currency transaction gains or losses.
A portion of the gains and losses recognized in Other comprehensive
income was reclassified to Other income and (expense), net to offset
the related pre-tax foreign currency transaction gain or loss on the
underlying debt obligations. The fair value of the outstanding swaps
was $1.6 billion and $0.6 billion, which was primarily included within
Other liabilities on our consolidated balance sheets at December 31,
2015 and 2014, respectively. At December 31, 2015, the total notional
amount of the cross currency swaps was $9.7 billion. During 2015
and 2014, a pre-tax loss of $1.2 billion and a pre-tax loss of $0.1 billion,
respectively, was recognized in Other comprehensive income with
respect to these swaps.
Net Investment Hedges
We entered into foreign currency forward contracts that are designated
as net investment hedges to mitigate foreign exchange exposure
related to non-U.S. dollar net investments in certain foreign subsidiaries
against changes in foreign exchange rates. During the third quarter of
2015, we entered into net investment hedges with a total notional value
of $0.9 billion with the contract tenor maturing in 2018. The fair value of
these contracts was not material at December 31, 2015.
Concentrations of Credit RiskFinancial instruments that subject us to concentrations of credit risk
consist primarily of temporary cash investments, short-term and
long-term investments, trade receivables, certain notes receivable,
including lease receivables, and derivative contracts. Our policy is to
deposit our temporary cash investments with major financial institu-
tions. Counterparties to our derivative contracts are also major financial
institutions with whom we have negotiated derivatives agreements
(ISDA master agreement) and credit support annex agreements which
provide rules for collateral exchange. We generally apply collateralized
arrangements with our counterparties for uncleared derivatives to
mitigate credit risk. At December 31, 2015 and 2014, we posted collat-
eral of approximately $0.1 billion and $0.6 billion, respectively, related
to derivative contracts under collateral exchange arrangements, which
were recorded as Prepaid expenses and other in our consolidated
balance sheets. During the first and second quarters of 2015, we paid
an immaterial amount of cash to enter into amendments to certain
collateral exchange arrangements. These amendments suspend cash
collateral posting for a specified period of time by both counterpar-
ties. We may enter into swaps on an uncollateralized basis in certain
circumstances. While we may be exposed to credit losses due to the
nonperformance of our counterparties, we consider the risk remote and
do not expect the settlement of these transactions to have a material
effect on our results of operations or financial condition.
Nonrecurring Fair Value MeasurementsThe Company measures certain assets and liabilities at fair value
on a nonrecurring basis. During the fourth quarter of 2014, certain
long-lived assets met the criteria to be classified as held for sale. At
that time, the fair value of these long-lived assets was measured,
resulting in expected disposal losses of $0.1 billion. The fair value of
these assets held for sale was measured with the assistance of third-
party appraisals and other estimates of fair value, which used market
63Verizon Communications Inc. and Subsidiaries
Notes to Consolidated Financial Statements continued

approach techniques as part of the analysis. The fair value measure-
ment was categorized as Level 3, as significant unobservable inputs
were used in the valuation. The expected disposal losses, which rep-
resented the difference between the fair value less cost to sell and the
carrying amount of the assets held for sale, were included in Selling,
general and administrative expenses.
Note 10Stock-Based Compensation
Verizon Communications Long-Term Incentive PlanThe Verizon Communications Inc. Long-Term Incentive Plan (the
Plan) permits the granting of stock options, stock appreciation rights,
restricted stock, restricted stock units, performance shares, perfor-
mance stock units and other awards. The maximum number of shares
available for awards from the Plan is 119.6 million shares.
Restricted Stock UnitsThe Plan provides for grants of Restricted Stock Units (RSUs) that
generally vest at the end of the third year after the grant. The RSUs are
classified as equity awards because the RSUs will be paid in Verizon
common stock upon vesting. The RSU equity awards are measured
using the grant date fair value of Verizon common stock and are not
remeasured at the end of each reporting period. Dividend equivalent
units are also paid to participants at the time the RSU award is paid,
and in the same proportion as the RSU award.
Performance Stock UnitsThe Plan also provides for grants of Performance Stock Units (PSUs)
that generally vest at the end of the third year after the grant. As
defined by the Plan, the Human Resources Committee of the Board of
Directors determines the number of PSUs a participant earns based
on the extent to which the corresponding performance goals have
been achieved over the three-year performance cycle. The PSUs are
classified as liability awards because the PSU awards are paid in cash
upon vesting. The PSU award liability is measured at its fair value at the
end of each reporting period and, therefore, will fluctuate based on the
price of Verizon common stock as well as performance relative to the
targets. Dividend equivalent units are also paid to participants at the
time that the PSU award is determined and paid, and in the same pro-
portion as the PSU award. The granted and cancelled activity for the
PSU award includes adjustments for the performance goals achieved.
The following table summarizes Verizon’s Restricted Stock Unit and
Performance Stock Unit activity:
(shares in thousands)Restricted
Stock UnitsPerformance
Stock UnitsOutstanding January 1, 2013 18,669 39,463
Granted 4,950 7,470
Payments (7,246) (22,703)
Cancelled/Forfeited (180) (506)
Outstanding December 31, 2013 16,193 23,724
Granted 5,278 7,359
Payments (6,202) (9,153)
Cancelled/Forfeited (262) (1,964)
Outstanding December 31, 2014 15,007 19,966
Granted 4,958 7,044Payments (5,911) (6,732)Cancelled/Forfeited (151) (3,075)Outstanding December 31, 2015 13,903 17,203
As of December 31, 2015, unrecognized compensation expense
related to the unvested portion of Verizon’s RSUs and PSUs was
approximately $0.3 billion and is expected to be recognized over
approximately two years.
The RSUs granted in 2015 and 2014 have weighted- average grant date
fair values of $48.15 and $47.23 per unit, respectively. During 2015,
2014 and 2013, we paid $0.4 billion, $0.6 billion and $1.1 billion, respec-
tively, to settle RSUs and PSUs classified as liability awards.
Verizon Wireless’ Long-Term Incentive PlanThe Verizon Wireless Long-Term Incentive Plan (the Wireless Plan)
provided compensation opportunities to eligible employees of
Verizon Wireless (the Partnership). Under the Wireless Plan, Value
Appreciation Rights (VARs) were granted to eligible employees. We
have not granted new VARs since 2004. As of December 31, 2015,
there are no VARs that remain outstanding.
Stock-Based Compensation ExpenseAfter-tax compensation expense for stock-based compensation
related to RSUs, PSUs and VARs described above included in Net
income attributable to Verizon was $0.3 billion, $0.3 billion and
$0.4 billion for 2015, 2014 and 2013, respectively.
Stock OptionsThe Plan provides for grants of stock options to participants at an
option price per share of no less than 100% of the fair market value
of Verizon common stock on the date of grant. Each grant has a
10-year life, vesting equally over a three-year period, starting at the
date of the grant. We have not granted new stock options since 2004.
As of December 31, 2015, there are no stock options that remain
outstanding.
Note 11Employee Benefits
We maintain non- contributory defined benefit pension plans for many
of our employees. In addition, we maintain postretirement health care
and life insurance plans for our retirees and their dependents, which
are both contributory and non- contributory, and include a limit on our
share of the cost for certain recent and future retirees. In accordance
with our accounting policy for pension and other postretirement
benefits, operating expenses include pension and benefit related
credits and/or charges based on actuarial assumptions, including
projected discount rates and an estimated return on plan assets.
These estimates are updated in the fourth quarter to reflect actual
return on plan assets and updated actuarial assumptions. The adjust-
ment is recognized in the income statement during the fourth quarter
or upon a remeasurement event pursuant to our accounting policy for
the recognition of actuarial gains and losses.
Pension and Other Postretirement BenefitsPension and other postretirement benefits for many of our employees
are subject to collective bargaining agreements. Modifications in
benefits have been bargained from time to time, and we may also peri-
odically amend the benefits in the management plans. The following
tables summarize benefit costs, as well as the benefit obligations, plan
assets, funded status and rate assumptions associated with pension
and postretirement health care and life insurance benefit plans.
64 Verizon Communications Inc. and Subsidiaries
Notes to Consolidated Financial Statements continued

Obligations and Funded Status(dollars in millions)
Pension Health Care and LifeAt December 31, 2015 2014 2015 2014
Change in Benefit ObligationsBeginning of year $ 25,320 $ 23,032 $ 27,097 $ 23,042
Service cost 374 327 324 258
Interest cost 969 1,035 1,117 1,107
Plan amendments – (89) (45) (412)
Actuarial (gain) loss, net (1,361) 2,977 (2,733) 4,645
Benefits paid (971) (1,566) (1,370) (1,543)
Curtailment and termination benefits – 11 – –
Settlements paid (2,315) (407) – –
Reclassifications (Note 2) – – (167) –
End of year $ 22,016 $ 25,320 $ 24,223 $ 27,097
Change in Plan AssetsBeginning of year $ 18,548 $ 17,111 $ 2,435 $ 3,053
Actual return on plan assets 118 1,778 28 193
Company contributions 744 1,632 667 732
Benefits paid (971) (1,566) (1,370) (1,543)
Settlements paid (2,315) (407) – –
End of year $ 16,124 $ 18,548 $ 1,760 $ 2,435
Funded StatusEnd of year $ (5,892) $ (6,772) $ (22,463) $ (24,662)
We reclassified $0.2 billion to Non- current liabilities related to assets held for sale as a result of our agreement to sell our local exchange business
and related landline activities in California, Florida and Texas to Frontier (see Note 2 for additional details).
(dollars in millions)
Pension Health Care and LifeAt December 31, 2015 2014 2015 2014
Amounts recognized on the balance sheetNoncurrent assets $ 349 $ 337 $ – $ –
Current liabilities (93) (122) (695) (528)
Noncurrent liabilities (6,148) (6,987) (21,768) (24,134)
Total $ (5,892) $ (6,772) $ (22,463) $ (24,662)
Amounts recognized in Accumulated Other Comprehensive Income (Pre-tax)Prior Service Benefit (Cost) $ (51) $ (56) $ (2,038) $ (2,280)
Total $ (51) $ (56) $ (2,038) $ (2,280)
The accumulated benefit obligation for all defined benefit pension plans was $22.0 billion and $25.3 billion at December 31, 2015 and 2014,
respectively.
Information for pension plans with an accumulated benefit obligation in excess of plan assets follows:
(dollars in millions)
At December 31, 2015 2014
Projected benefit obligation $ 21,694 $ 24,919
Accumulated benefit obligation 21,636 24,851
Fair value of plan assets 15,452 17,810
65Verizon Communications Inc. and Subsidiaries
Notes to Consolidated Financial Statements continued

Net Periodic CostThe following table summarizes the benefit (income) cost related to our pension and postretirement health care and life insurance plans:
(dollars in millions)
Pension Health Care and LifeYears Ended December 31, 2015 2014 2013 2015 2014 2013
Service cost $ 374 $ 327 $ 395 $ 324 $ 258 $ 318
Amortization of prior service cost (credit) (5) (8) 6 (287) (253) (247)
Expected return on plan assets (1,270) (1,181) (1,245) (101) (161) (143)
Interest cost 969 1,035 1,002 1,117 1,107 1,095
Remeasurement (gain) loss, net (209) 2,380 (2,470) (2,659) 4,615 (3,989)
Net periodic benefit (income) cost (141) 2,553 (2,312) (1,606) 5,566 (2,966)
Curtailment and termination benefits – 11 4 – – –
Total $ (141) $ 2,564 $ (2,308) $ (1,606) $ 5,566 $ (2,966)
Other pre-tax changes in plan assets and benefit obligations recognized in other comprehensive (income) loss are as follows:
(dollars in millions)
Pension Health Care and LifeAt December 31, 2015 2014 2015 2014
Prior service cost $ – $ (89) $ (45) $ (413)
Reversal of amortization items
Prior service cost 5 8 287 253
Total recognized in other comprehensive (income) loss (pre-tax) $ 5 $ (81) $ 242 $ (160)
The estimated prior service cost for the defined benefit pension plans that will be amortized from Accumulated other comprehensive income
(loss) into net periodic benefit (income) cost over the next fiscal year is not significant. The estimated prior service cost for the defined benefit
postretirement plans that will be amortized from Accumulated other comprehensive income into net periodic benefit (income) cost over the next
fiscal year is $0.3 billion.
AssumptionsThe weighted- average assumptions used in determining benefit obligations follow:
Pension Health Care and LifeAt December 31, 2015 2014 2015 2014
Discount Rate 4.60% 4.20% 4.60% 4.20%
Rate of compensation increases 3.00 3.00 N/A N/A
The weighted- average assumptions used in determining net periodic cost follow:
Pension Health Care and LifeAt December 31, 2015 2014 2013 2015 2014 2013
Discount Rate 4.20% 5.00% 4.20% 4.20% 5.00% 4.20%
Expected return on plan assets 7.25 7.25 7.50 4.80 5.50 5.60
Rate of compensation increases 3.00 3.00 3.00 N/A N/A N/A
Effective January 1, 2016, we changed the method we use to estimate
the interest component of net periodic benefit cost for pension and
other postretirement benefits. Historically, we estimated the interest
cost component utilizing a single weighted- average discount rate
derived from the yield curve used to measure the benefit obligation at
the beginning of the period. We have elected to utilize a full yield curve
approach in the estimation of interest cost by applying the specific
spot rates along the yield curve used in the determination of the benefit
obligation to the relevant projected cash flows. We have made this
change to provide a more precise measurement of interest cost by
improving the correlation between projected benefit cash flows to the
corresponding spot yield curve rates. We will account for this change
as a change in accounting estimate and accordingly will account for
it prospectively. We estimate the impact of this change on our con-
solidated GAAP results for the first quarter of 2016 will be a reduction
of the interest cost component of net periodic benefit cost and an
increase to Net income by approximately $0.1 billion. However, at this
time the estimated impact of this change on the remaining 2016 interim
periods and for annual 2016 results cannot be reasonably estimated
because it is possible that in the future there may be changes to
underlying assumptions, including an interim remeasurement of our
benefit obligations, which could result in different estimates. The use
of the full yield curve approach does not impact how we measure our
total benefit obligations at year end or our annual net periodic benefit
cost as any change in the interest cost component is completely offset
by the actuarial gain or loss measured at year end which is immedi-
ately recognized in the income statement. Accordingly, this change in
estimate will not impact our income from continuing operations, net
income or earnings per share as measured on an annual basis.
66 Verizon Communications Inc. and Subsidiaries
Notes to Consolidated Financial Statements continued

In order to project the long-term target investment return for the total
portfolio, estimates are prepared for the total return of each major
asset class over the subsequent 10-year period. Those estimates are
based on a combination of factors including the current market interest
rates and valuation levels, consensus earnings expectations and his-
torical long-term risk premiums. To determine the aggregate return for
the pension trust, the projected return of each individual asset class is
then weighted according to the allocation to that investment area in the
trust’s long-term asset allocation policy.
The assumed health care cost trend rates follow:
Health Care and LifeAt December 31, 2015 2014 2013
Healthcare cost trend rate assumed for
next year 6.00% 6.50% 6.50%
Rate to which cost trend rate gradually
declines 4.50 4.75 4.75
Year the rate reaches the level it is
assumed to remain thereafter 2024 2022 2020
A one- percentage point change in the assumed health care cost trend
rate would have the following effects:
(dollars in millions)
One- Percentage Point Increase DecreaseEffect on 2015 service and interest cost $ 249 $ (194)
Effect on postretirement benefit obligation as of
December 31, 2015 3,074 (2,516)
Plan AssetsThe company’s overall investment strategy is to achieve a mix of
assets which allows us to meet projected benefit payments while
taking into consideration risk and return. While target allocation
percentages will vary over time, the current target allocation for plan
assets is designed so that 65% of the assets have the objective of
achieving a return in excess of the growth in liabilities (comprised of
public equities, private equities, real estate, hedge funds and emerging
debt) and 35% of the assets are invested as liability hedging assets
(where cash flows from investments better match projected benefit
payments, typically longer duration fixed income). This allocation
will shift as funded status improves to a higher allocation of liability
hedging assets. Target policies will be revisited periodically to
ensure they are in line with fund objectives. Both active and passive
management approaches are used depending on perceived market
efficiencies and various other factors. Due to our diversification and
risk control processes, there are no significant concentrations of risk,
in terms of sector, industry, geography or company names.
Pension and healthcare and life plans assets do not include significant
amounts of Verizon common stock.
Pension Plans
The fair values for the pension plans by asset category at
December 31, 2015 are as follows:
(dollars in millions)
Asset Category Total Level 1 Level 2 Level 3Cash and cash equivalents $ 1,459 $ 1,375 $ 84 $ –Equity securities 3,216 2,313 900 3Fixed income securities
U.S. Treasuries and agencies 1,264 884 380 –Corporate bonds 3,024 194 2,702 128International bonds 713 34 659 20Other 3 – 3 –
Real estate 1,670 – 39 1,631Other
Private equity 2,988 – – 2,988Hedge funds 1,787 – 730 1,057
Total $ 16,124 $ 4,800 $ 5,497 $ 5,827
The fair values for the pension plans by asset category at
December 31, 2014 are as follows:
(dollars in millions)
Asset Category Total Level 1 Level 2 Level 3Cash and cash equivalents $ 1,983 $ 1,814 $ 169 $ –
Equity securities 4,339 2,952 1,277 110
Fixed income securities
U.S. Treasuries and agencies 1,257 830 427 –
Corporate bonds 2,882 264 2,506 112
International bonds 582 39 524 19
Other 3 – 3 –
Real estate 1,792 – – 1,792
Other
Private equity 3,748 – 204 3,544
Hedge funds 1,962 – 1,164 798
Total $ 18,548 $ 5,899 $ 6,274 $ 6,375
The following is a reconciliation of the beginning and ending balance of pension plan assets that are measured at fair value using significant
unobservable inputs:(dollars in millions)
Equity Securities
Corporate Bonds
International Bonds
Real Estate
Private Equity
Hedge Funds Total
Balance at January 1, 2014 $ – $ 162 $ – $ 1,784 $ 3,942 $ 1,196 $ 7,084
Actual gain (loss) on plan assets (1) 5 – 42 73 33 152
Purchases and sales 106 (50) 8 (34) (471) 144 (297)
Transfers in (out) 5 (5) 11 – – (575) (564)
Balance at December 31, 2014 $ 110 $ 112 $ 19 $ 1,792 $ 3,544 $ 798 $ 6,375
Actual gain (loss) on plan assets 1 4 (3) 132 63 12 209Purchases and sales 16 18 5 (259) (619) 324 (515)Transfers in (out) (124) (6) (1) (34) – (77) (242)Balance at December 31, 2015 $ 3 $ 128 $ 20 $ 1,631 $ 2,988 $ 1,057 $ 5,827
67Verizon Communications Inc. and Subsidiaries
Notes to Consolidated Financial Statements continued

Health Care and Life Plans
The fair values for the other postretirement benefit plans by asset
category at December 31, 2015 are as follows:
(dollars in millions)
Asset Category Total Level 1 Level 2 Level 3Cash and cash equivalents $ 162 $ 8 $ 154 $ –Equity securities 974 752 222 –Fixed income securities
U.S. Treasuries and agencies 21 18 3 –Corporate bonds 524 133 391 –International bonds 79 19 60 –Other – – – –
Total $ 1,760 $ 930 $ 830 $ –
The fair values for the other postretirement benefit plans by asset
category at December 31, 2014 are as follows:
(dollars in millions)
Asset Category Total Level 1 Level 2 Level 3Cash and cash equivalents $ 208 $ 6 $ 202 $ –
Equity securities 1,434 1,172 262 –
Fixed income securities
U.S. Treasuries and agencies 105 98 7 –
Corporate bonds 461 119 296 46
International bonds 111 14 97 –
Other 116 – 116 –
Total $ 2,435 $ 1,409 $ 980 $ 46
The following is a reconciliation of the beginning and ending balance of
the other postretirement benefit plans assets that are measured at fair
value using significant unobservable inputs:
(dollars in millions)
Corporate Bonds Total
Balance at December 31, 2013 $ – $ –
Actual gain on plan assets 1 1
Purchases and sales 45 45
Balance at December 31, 2014 $ 46 $ 46
Transfers in (out) (46) (46)Balance at December 31, 2015 $ – $ –
The following are general descriptions of asset categories, as well
as the valuation methodologies and inputs used to determine the fair
value of each major category of assets.
Cash and cash equivalents include short-term investment funds,
primarily in diversified portfolios of investment grade money market
instruments and are valued using quoted market prices or other
valuation methods, and thus are classified within Level 1 or Level 2.
Equity securities are investments in common stock of domestic and
international corporations in a variety of industry sectors, and are
valued primarily using quoted market prices at the end of the reporting
period or other valuation methods based on observable inputs, and
thus are classified as Level 1 or Level 2. Investments not traded on a
national securities exchange use other valuation methods such as
pricing models or quoted prices of securities with similar characteris-
tics depending upon market activity and availability of quoted market
prices, and thus are classified as Level 3.
Fixed income securities include U.S. Treasuries and agencies, debt
obligations of foreign governments and domestic and foreign cor-
porations. Fixed income also includes investments in collateralized
mortgage obligations, mortgage backed securities and interest rate
swaps. The fair value of fixed income securities is based on observable
prices for identical or comparable assets, adjusted using benchmark
curves, sector grouping, matrix pricing, broker/dealer quotes and
issuer spreads, and thus are classified within Level 1 or Level 2.
Real estate investments include those in limited partnerships that
invest in various commercial and residential real estate projects both
domestically and internationally. The fair values of real estate assets
are typically determined by using income and/or cost approaches or
a comparable sales approach, taking into consideration discount and
capitalization rates, financial conditions, local market conditions and
the status of the capital markets, and thus are classified within Level 3.
Commingled funds, included within the Cash and cash equivalents,
Equity securities, Fixed income securities and Real estate investment
asset categories, are typically valued at net asset value (NAV) provided
by the fund administrator. NAV is the redemption value of the units held
at year end. As a practical expedient, management has determined
that NAV approximates fair value. These assets are categorized as
Level 2 or Level 3 depending upon liquidity.
Private equity investments include those in limited partnerships that
invest in operating companies that are not publicly traded on a stock
exchange. Investment strategies in private equity include leveraged
buyouts, venture capital, distressed investments and investments in
natural resources. These investments are valued using inputs such as
trading multiples of comparable public securities, merger and acqui-
sition activity and pricing data from the most recent equity financing
taking into consideration illiquidity, and thus are classified within
Level 3.
Hedge fund investments include those seeking to maximize absolute
returns using a broad range of strategies to enhance returns and
provide additional diversification. The fair values of hedge funds are
estimated using the NAV of the investments as a practical expedient.
Investments of this type for which Verizon has the ability to fully
redeem at NAV within the near term are classified within Level 2.
Investments that cannot be redeemed in the near term are classified
within Level 3.
Employer ContributionsIn 2015, we contributed $0.7 billion to our qualified pension plans,
$0.1 billion to our nonqualified pension plans and $0.9 billion to our
other postretirement benefit plans. We anticipate a minimum contribu-
tion of $0.6 billion to our qualified pension plans in 2016. Nonqualified
pension plans contributions are estimated to be $0.1 billion and contri-
butions to our other postretirement benefit plans are estimated to be
$0.9 billion in 2016.
Estimated Future Benefit PaymentsThe benefit payments to retirees are expected to be paid as follows:
(dollars in millions)
Year Pension Benefits Health Care and Life2016 $ 1,906 $ 1,390
2017 1,757 1,390
2018 1,441 1,384
2019 1,391 1,354
2020 1,371 1,349
2021–2025 6,699 6,889
68 Verizon Communications Inc. and Subsidiaries
Notes to Consolidated Financial Statements continued

Savings Plan and Employee Stock Ownership PlansWe maintain four leveraged employee stock ownership plans (ESOP).
We match a certain percentage of eligible employee contributions to
the savings plans with shares of our common stock from this ESOP.
At December 31, 2015, the number of allocated shares of common
stock in this ESOP was 57 million. There were no unallocated shares of
common stock in this ESOP at December 31, 2015. All leveraged ESOP
shares are included in earnings per share computations.
Total savings plan costs were $0.9 billion in 2015, $0.9 billion in 2014
and $1.0 billion in 2013.
Severance BenefitsThe following table provides an analysis of our actuarially determined
severance liability recorded in accordance with the accounting standard
regarding employers’ accounting for postemployment benefits:
(dollars in millions)
Year
Beginning
of Year
Charged to
Expense Payments Other
End
of Year
2013 $ 1,010 $ 134 $ (381) $ (6) $ 757
2014 757 531 (406) (7) 875
2015 875 551 (619) (7) 800
Severance, Pension and Benefit (Credits) Charges
During 2015, we recorded net pre-tax severance, pension and benefit
credits of approximately $2.3 billion primarily for our pension and post-
retirement plans in accordance with our accounting policy to recognize
actuarial gains and losses in the year in which they occur. The credits
were primarily driven by an increase in our discount rate assumption
used to determine the current year liabilities from a weighted- average
of 4.2% at December 31, 2014 to a weighted- average of 4.6% at
December 31, 2015 ($2.5 billion), the execution of a new prescription
drug contract during 2015 ($1.0 billion) and a change in mortality
assumptions primarily driven by the use of updated actuarial tables
(MP-2015) issued by the Society of Actuaries ($0.9 billion), partially
offset by the difference between our estimated return on assets of
7.25% at December 31, 2014 and our actual return on assets of 0.7% at
December 31, 2015 ($1.2 billion), severance costs recorded under our
existing separation plans ($0.6 billion) and other assumption adjust-
ments ($0.3 billion).
During 2014, we recorded net pre-tax severance, pension and
benefit charges of approximately $7.5 billion primarily for our pension
and postretirement plans in accordance with our accounting
policy to recognize actuarial gains and losses in the year in which
they occur. The charges were primarily driven by a decrease in
our discount rate assumption used to determine the current year
liabilities from a weighted- average of 5.0% at December 31, 2013 to
a weighted- average of 4.2% at December 31, 2014 ($5.2 billion), a
change in mortality assumptions primarily driven by the use of updated
actuarial tables (RP-2014 and MP-2014) issued by the Society of
Actuaries in October 2014 ($1.8 billion) and revisions to the retirement
assumptions for participants and other assumption adjustments,
partially offset by the difference between our estimated return on
assets of 7.25% and our actual return on assets of 10.5% ($0.6 billion).
As part of this charge, we recorded severance costs of $0.5 billion
under our existing separation plans.
During 2013, we recorded net pre-tax severance, pension and benefit
credits of approximately $6.2 billion primarily for our pension and post-
retirement plans in accordance with our accounting policy to recognize
actuarial gains and losses in the year in which they occur. The credits
were primarily driven by an increase in our discount rate assumption
used to determine the current year liabilities from a weighted- average
of 4.2% at December 31, 2012 to a weighted- average of 5.0% at
December 31, 2013 ($4.3 billion), lower than assumed retiree medical
costs and other assumption adjustments ($1.4 billion) and the differ-
ence between our estimated return on assets of 7.5% at December 31,
2012 and our actual return on assets of 8.6% at December 31, 2013
($0.5 billion).
Note 12Taxes
The components of income before provision for income taxes are
as follows:
(dollars in millions)
Years Ended December 31, 2015 2014 2013
Domestic $ 27,639 $ 12,992 $ 28,833
Foreign 601 2,278 444
Total $ 28,240 $ 15,270 $ 29,277
The components of the provision for income taxes are as follows:
(dollars in millions)
Years Ended December 31, 2015 2014 2013
Current
Federal $ 5,476 $ 2,657 $ (197)
Foreign 70 81 (59)
State and Local 803 668 201
Total 6,349 3,406 (55)
Deferred
Federal 3,377 (51) 5,060
Foreign 9 (9) 8
State and Local 130 (32) 717
Total 3,516 (92) 5,785
Total income tax provision $ 9,865 $ 3,314 $ 5,730
The following table shows the principal reasons for the difference
between the effective income tax rate and the statutory federal income
tax rate:
Years Ended December 31, 2015 2014 2013
Statutory federal income tax rate 35.0 % 35.0 % 35.0 %
State and local income tax rate,
net of federal tax benefits 2.1 2.7 2.1
Affordable housing credit (0.5) (1.0) (0.6)
Employee benefits including
ESOP dividend (0.4) (0.7) (0.4)
Disposition of Omnitel Interest – (5.9) –
Noncontrolling interests (0.5) (5.0) (14.3)
Other, net (0.8) (3.4) (2.2)
Effective income tax rate 34.9 % 21.7 % 19.6 %
The effective income tax rate for 2015 was 34.9% compared to 21.7%
for 2014. The increase in the effective income tax rate and provision
for income taxes was primarily due to the impact of higher income
before income taxes due to severance, pension and benefit credits
recorded in 2015 compared to severance, pension and benefit
charges recorded in 2014, as well as tax benefits associated with
the utilization of certain tax credits in connection with the Omnitel
Transaction in 2014.
69Verizon Communications Inc. and Subsidiaries
Notes to Consolidated Financial Statements continued

The effective income tax rate for 2014 was 21.7% compared to 19.6%
for 2013. The increase in the effective income tax rate was primarily
due to additional income taxes on the incremental income from the
Wireless Transaction completed on February 21, 2014 and was partially
offset by the utilization of certain tax credits in connection with the
Omnitel Transaction in 2014 and the effective income tax rate impact
of lower income before income taxes due to severance, pension and
benefit charges recorded in 2014 compared to severance, pension
and benefit credits recorded in 2013. The decrease in the provision
for income taxes was primarily due to lower income before income
taxes due to severance, pension and benefit charges recorded in 2014
compared to severance, pension and benefit credits recorded in 2013.
The amounts of cash taxes paid are as follows:
(dollars in millions)
Years Ended December 31, 2015 2014 2013
Income taxes, net of amounts refunded $ 5,293 $ 4,093 $ 422
Employment taxes 1,284 1,290 1,282
Property and other taxes 1,868 1,797 2,082
Total $ 8,445 $ 7,180 $ 3,786
Deferred taxes arise because of differences in the book and tax bases
of certain assets and liabilities. Significant components of deferred tax
assets and liabilities are as follows:
(dollars in millions)
At December 31, 2015 2014
Employee benefits $ 12,220 $ 13,350
Tax loss and credit carry forwards 4,099 2,255
Other — assets 2,504 2,247
18,823 17,852
Valuation allowances (3,414) (1,841)
Deferred tax assets 15,409 16,011
Spectrum and other intangible amortization 29,945 28,283
Depreciation 24,725 23,423
Other — liabilities 6,125 5,754
Deferred tax liabilities 60,795 57,460
Net deferred tax liability $ 45,386 $ 41,449
At December 31, 2015, undistributed earnings of our foreign sub-
sidiaries indefinitely invested outside the United States amounted
to approximately $1.8 billion. The majority of Verizon’s cash flow is
generated from domestic operations and we are not dependent on
foreign cash or earnings to meet our funding requirements, nor do we
intend to repatriate these undistributed foreign earnings to fund U.S.
operations. Furthermore, a portion of these undistributed earnings
represent amounts that legally must be kept in reserve in accordance
with certain foreign jurisdictional requirements and are unavailable
for distribution or repatriation. As a result, we have not provided U.S.
deferred taxes on these undistributed earnings because we intend that
they will remain indefinitely reinvested outside of the United States and
therefore unavailable for use in funding U.S. operations. Determination
of the amount of unrecognized deferred taxes related to these undis-
tributed earnings is not practicable.
At December 31, 2015, we had net after-tax loss and credit carry
forwards for income tax purposes of approximately $4.1 billion that
primarily relate to state and foreign tax losses. Of these net after-tax
loss and credit carry forwards, approximately $2.5 billion will expire
between 2016 and 2035 and approximately $1.6 billion may be carried
forward indefinitely.
During 2015, the valuation allowance increased approximately
$1.6 billion primarily as a result of the acquisition of AOL. The balance
of the valuation allowance at December 31, 2015 and the 2015 activity
is primarily related to state and foreign tax losses.
Unrecognized Tax BenefitsA reconciliation of the beginning and ending balance of unrecognized
tax benefits is as follows:
(dollars in millions)
2015 2014 2013
Balance at January 1, $ 1,823 $ 2,130 $ 2,943
Additions based on tax positions
related to the current year 194 80 116
Additions for tax positions of prior
years 330 627 250
Reductions for tax positions of
prior years (412) (278) (801)
Settlements (79) (239) (210)
Lapses of statutes of limitations (221) (497) (168)
Balance at December 31, $ 1,635 $ 1,823 $ 2,130
Included in the total unrecognized tax benefits at December 31, 2015,
2014 and 2013 is $1.2 billion, $1.3 billion and $1.4 billion, respectively,
that if recognized, would favorably affect the effective income tax rate.
We recognized the following net after-tax benefits related to interest
and penalties in the provision for income taxes:
Years Ended December 31, (dollars in millions)
2015 $ 432014 92
2013 33
The after-tax accruals for the payment of interest and penalties in the
consolidated balance sheets are as follows:
At December 31, (dollars in millions)
2015 $1252014 169
The decrease in unrecognized tax benefits was primarily due to an
internal restructure that eliminated certain state unrecognized tax
benefits and the expiration of the statute of limitations in various juris-
dictions, partially offset by an increase in unrecognized tax benefits
related to the acquisition of AOL.
Verizon and/or its subsidiaries file income tax returns in the U.S. federal
jurisdiction, and various state, local and foreign jurisdictions. As a large
taxpayer, we are under audit by the IRS and multiple state and foreign
jurisdictions for various open tax years. The IRS is currently examining
the Company’s U.S. income tax returns for tax years 2010-2012, Cellco
Partnership’s U.S. income tax returns for tax years 2013-2014, and
AOL’s U.S. income tax returns for tax years 2011-2012. Tax controver-
sies are ongoing for tax years as early as 2006. The amount of the
liability for unrecognized tax benefits will change in the next twelve
months due to the expiration of the statute of limitations in various
jurisdictions and it is reasonably possible that various current tax
examinations will conclude or require reevaluations of the Company’s
tax positions during this period. An estimate of the range of the
possible change cannot be made until these tax matters are further
developed or resolved.
70 Verizon Communications Inc. and Subsidiaries
Notes to Consolidated Financial Statements continued

Note 13Segment Information
Reportable SegmentsWe have two reportable segments, Wireless and Wireline, which we operate and manage as strategic business units and organize by products
and services. We measure and evaluate our reportable segments based on segment operating income, consistent with the chief operating
decision maker’s assessment of segment performance.
Corporate and other includes the operations of AOL and related businesses, unallocated corporate expenses, the results of other businesses,
such as our investments in unconsolidated businesses, pension and other employee benefit related costs and lease financing. Effective
January 1, 2014, we have also reclassified the results of certain businesses, such as development stage businesses that support our strategic
initiatives, from our Wireline segment to Corporate and other. The impact of this reclassification was not material to our consolidated financial
statements or our segment results of operations. Corporate and other also includes the historical results of divested operations and other
adjustments and gains and losses that are not allocated in assessing segment performance due to their non- operational nature. Although such
transactions are excluded from the business segment results, they are included in reported consolidated earnings. Gains and losses that are
not individually significant are included in all segment results as these items are included in the chief operating decision maker’s assessment of
segment performance.
On July 1, 2014, our Wireline segment sold a non- strategic business (see Note 2). Accordingly, the historical Wireline results for these operations
have been reclassified to Corporate and other to reflect comparable segment operating results.
The reconciliation of segment operating revenues and expenses to consolidated operating revenues and expenses below also includes those
items of a non- operational nature. We exclude from segment results the effects of certain items that management does not consider in assessing
segment performance, primarily because of their non- operational nature.
We have adjusted prior period consolidated and segment information, where applicable, to conform to current year presentation.
Our segments and their principal activities consist of the following:
Segment DescriptionWireless Wireless’ communications products and services include wireless voice and data services and equipment sales, which are provided to
consumer, business and government customers across the United States.
Wireline Wireline’s voice, data and video communications products and enhanced services include broadband video and data, corporate
networking solutions, data center and cloud services, security and managed network services and local and long distance voice services.
We provide these products and services to consumers in the United States, as well as to carriers, businesses and government customers
both in the United States and around the world.
The following table provides operating financial information for our two reportable segments:(dollars in millions)
2015 Wireless Wireline Total SegmentsExternal Operating Revenues
Service revenue $ 70,305 $ – $ 70,305Equipment 16,924 – 16,924Other 4,294 – 4,294
Consumer retail – 16,123 16,123Small business – 2,350 2,350
Mass Markets – 18,473 18,473
Strategic services – 8,164 8,164Core – 4,777 4,777
Global Enterprise – 12,941 12,941
Global Wholesale – 4,958 4,958Other – 322 322
Intersegment revenues 157 1,026 1,183Total operating revenues 91,680 37,720 129,400
Cost of services 7,803 20,878 28,681Wireless cost of equipment 23,119 – 23,119Selling, general and administrative expense 21,805 7,989 29,794Depreciation and amortization expense 8,980 6,678 15,658
Total operating expenses 61,707 35,545 97,252Operating income $ 29,973 $ 2,175 $ 32,148
Assets $ 185,406 $ 78,316 $ 263,722Plant, property and equipment, net 40,911 41,044 81,955Capital expenditures 11,725 5,049 16,774
71Verizon Communications Inc. and Subsidiaries
Notes to Consolidated Financial Statements continued

(dollars in millions)
2014 Wireless Wireline Total Segments
External Operating Revenues
Service revenue $ 72,555 $ – $ 72,555
Equipment 10,957 – 10,957
Other 4,021 – 4,021
Consumer retail – 15,583 15,583
Small business – 2,464 2,464
Mass Markets – 18,047 18,047
Strategic services – 8,316 8,316
Core – 5,323 5,323
Global Enterprise – 13,639 13,639
Global Wholesale – 5,207 5,207
Other – 529 529
Intersegment revenues 113 1,007 1,120
Total operating revenues 87,646 38,429 126,075
Cost of services 7,200 21,332 28,532
Wireless cost of equipment 21,625 – 21,625
Selling, general and administrative expense 23,602 8,180 31,782
Depreciation and amortization expense 8,459 7,882 16,341
Total operating expenses 60,886 37,394 98,280
Operating income $ 26,760 $ 1,035 $ 27,795
Assets $ 160,333 $ 76,640 $ 236,973
Plant, property and equipment, net 38,276 50,318 88,594
Capital expenditures 10,515 5,750 16,265
(dollars in millions)
2013 Wireless Wireline Total Segments
External Operating Revenues
Service revenue $ 68,973 $ – $ 68,973
Equipment 8,096 – 8,096
Other 3,851 – 3,851
Consumer retail – 14,842 14,842
Small business – 2,537 2,537
Mass Markets – 17,379 17,379
Strategic services – 8,129 8,129
Core – 6,002 6,002
Global Enterprise – 14,131 14,131
Global Wholesale – 5,549 5,549
Other – 502 502
Intersegment revenues 103 1,063 1,166
Total operating revenues 81,023 38,624 119,647
Cost of services 7,295 21,396 28,691
Wireless cost of equipment 16,353 – 16,353
Selling, general and administrative expense 23,176 8,571 31,747
Depreciation and amortization expense 8,202 8,327 16,529
Total operating expenses 55,026 38,294 93,320
Operating income $ 25,997 $ 330 $ 26,327
Assets $ 146,363 $ 84,524 $ 230,887
Plant, property and equipment, net 35,932 51,885 87,817
Capital expenditures 9,425 6,229 15,654
72 Verizon Communications Inc. and Subsidiaries
Notes to Consolidated Financial Statements continued

Reconciliation to Consolidated Financial InformationA reconciliation of the reportable segment operating revenues to con-
solidated operating revenues is as follows:
(dollars in millions)
Years Ended December 31, 2015 2014 2013
Operating RevenuesTotal reportable segments $ 129,400 $ 126,075 $ 119,647
Corporate and other 3,444 1,888 1,514
Reconciling items:
Impact of divested operations (Note 2) – 256 599
Eliminations (1,224) (1,140) (1,210)
Consolidated operating revenues $ 131,620 $ 127,079 $ 120,550
Fios revenues are included within our Wireline segment and amounted
to approximately $13.8 billion, $12.7 billion, and $11.2 billion for the years
ended December 31, 2015, 2014, and 2013, respectively.
A reconciliation of the total of the reportable segments’ operating
income to consolidated Income before provision for income taxes is
as follows:
(dollars in millions)
Years Ended December 31, 2015 2014 2013
Operating Income
Total reportable segments $ 32,148 $ 27,795 $ 26,327
Corporate and other (1,598) (1,074) (912)
Reconciling items:
Severance, pension and benefit
credits (charges) (Note 11) 2,256 (7,507) 6,232
Gain on spectrum license
transactions (Note 2) 254 707 278
Impact of divested operations (Note 2) – 12 43
Other costs – (334) –
Consolidated operating income 33,060 19,599 31,968
Equity in (losses) earnings of
unconsolidated businesses (86) 1,780 142
Other income and (expense), net 186 (1,194) (166)
Interest expense (4,920) (4,915) (2,667)
Income Before Provision for Income Taxes $ 28,240 $ 15,270 $ 29,277
A reconciliation of the total of the reportable segments’ assets to con-
solidated assets is as follows:(dollars in millions)
At December 31, 2015 2014
AssetsTotal reportable segments $ 263,722 $ 236,973
Corporate and other 205,930 191,686
Eliminations (225,012) (196,043)
Total consolidated $ 244,640 $ 232,616
We generally account for intersegment sales of products and services
and asset transfers at arm’s length prices. No single customer
accounted for more than 10% of our total operating revenues during
the years ended December 31, 2015, 2014 and 2013. International
operating revenues and long-lived assets are not significant.
Note 14Comprehensive Income
Comprehensive income consists of net income and other gains and losses affecting equity that, under U.S. GAAP, are excluded from net income.
Significant changes in the components of Other comprehensive income, net of provision for income taxes are described below.
Accumulated Other Comprehensive IncomeThe changes in the balances of Accumulated other comprehensive income by component are as follows:
(dollars in millions)
Foreign currency translation
adjustments
Unrealized loss on cash flow hedges
Unrealized loss on
marketable securities
Defined benefit pension and
postretirement plans Total
Balance at January 1, 2015 $ (346) $ (84) $ 112 $ 1,429 $ 1,111
Other comprehensive loss (208) (1,063) (5) – (1,276)Amounts reclassified to net income – 869 (6) (148) 715
Net other comprehensive loss (208) (194) (11) (148) (561)Balance at December 31, 2015 $ (554) $ (278) $ 101 $ 1,281 $ 550
The amounts presented above in net other comprehensive loss are net of taxes and noncontrolling interests, which are not significant. For the
year ended December 31, 2015, the amounts reclassified to net income related to defined benefit pension and postretirement plans in the table
above are included in Cost of services and Selling, general and administrative expense on our consolidated statement of income. For the year
ended December 31, 2015, all other amounts reclassified to net income in the table above are included in Other income and (expense), net on our
consolidated statement of income.
73Verizon Communications Inc. and Subsidiaries
Notes to Consolidated Financial Statements continued

Foreign Currency Translation Adjustments
The change in Foreign currency translation adjustments during 2015
was related to our non-U.S. dollar net investments in foreign subsid-
iaries. The change in Foreign currency translation adjustments during
2014 was primarily a result of the completion of the Omnitel transac-
tion. The change in Foreign currency translation adjustments during
2013 was primarily related to our investment in Vodafone Omnitel N.V.
which was driven by the movements of the U.S. dollar against the Euro.
Net Unrealized Gains (Losses) on Cash Flow Hedges
During 2014 and 2013, Unrealized gains (losses) on cash flow hedges
included in Other comprehensive income (loss) attributable to non-
controlling interests primarily reflect activity related to cross currency
swaps. Reclassification adjustments on cash flow hedges primarily
reflect the reclassification to Other income and (expense), net of a
portion of the unrealized gains and losses on cross currency swaps to
offset related pre-tax foreign currency transaction gain or loss on the
underlying debt obligations (see Note 9).
Net Unrealized Gains (Losses) on Marketable Securities
During 2015, 2014 and 2013, reclassification adjustments on mar-
ketable securities for gains (losses) realized in net income were not
significant.
Defined Benefit Pension and Postretirement Plans
The change in Defined benefit pension and postretirement plans at
December 31, 2015 and 2014, respectively, was not significant.
Note 15Additional Financial Information
The tables that follow provide additional financial information related to
our consolidated financial statements:
Income Statement Information(dollars in millions)
Years Ended December 31, 2015 2014 2013
Depreciation expense $ 14,323 $ 14,966 $ 15,019
Interest costs on debt balances 5,504 5,291 3,421
Capitalized interest costs (584) (376) (754)
Advertising expense 2,749 2,526 2,438
Balance Sheet Information(dollars in millions)
At December 31, 2015 2014
Accounts Payable and Accrued LiabilitiesAccounts payable $ 6,391 $ 5,598
Accrued expenses 5,281 4,016
Accrued vacation, salaries and wages 4,107 4,131
Interest payable 1,529 1,478
Taxes payable 2,054 1,457
$ 19,362 $ 16,680
Other Current LiabilitiesAdvance billings and customer deposits $ 2,969 $ 3,125
Dividends payable 2,323 2,307
Other 3,446 3,140
$ 8,738 $ 8,572
Cash Flow Information(dollars in millions)
Years Ended December 31, 2015 2014 2013
Cash PaidInterest, net of amounts capitalized $ 4,491 $ 4,429 $ 2,122
During the year ended December 31, 2015, Verizon repurchased
approximately 2.8 million shares of the Company’s common stock
under our authorized share buyback program for approximately
$0.1 billion. At December 31, 2015, the maximum number of shares
that could be purchased by or on behalf of Verizon under our share
buyback program was 97.2 million.
In addition to the previously authorized three-year share buyback
program, in February 2015, the Verizon Board of Directors autho-
rized Verizon to enter into an accelerated share repurchase (ASR)
agreement to repurchase $5.0 billion of the Company’s common
stock. On February 10, 2015, in exchange for an up-front payment
totaling $5.0 billion, Verizon received an initial delivery of 86.2 million
shares having a value of approximately $4.25 billion. On June 5, 2015,
Verizon received an additional 15.4 million shares as final settlement
of the transaction under the ASR agreement. In total, 101.6 million
shares were delivered under the ASR at an average repurchase price
of $49.21.
Common stock has been used from time to time to satisfy some of the
funding requirements of employee and shareowner plans, including
22.6 million common shares issued from Treasury stock during the
year ended December 31, 2015, which had an aggregate value of
$0.9 billion.
Note 16Commitments and Contingencies
In the ordinary course of business Verizon is involved in various com-
mercial litigation and regulatory proceedings at the state and federal
level. Where it is determined, in consultation with counsel based on
litigation and settlement risks, that a loss is probable and estimable
in a given matter, the Company establishes an accrual. In none of
the currently pending matters is the amount of accrual material. An
estimate of the reasonably possible loss or range of loss in excess
of the amounts already accrued cannot be made at this time due to
various factors typical in contested proceedings, including (1) uncertain
damage theories and demands; (2) a less than complete factual
record; (3) uncertainty concerning legal theories and their resolution by
courts or regulators; and (4) the unpredictable nature of the opposing
party and its demands. We continuously monitor these proceedings
as they develop and adjust any accrual or disclosure as needed. We
do not expect that the ultimate resolution of any pending regulatory or
legal matter in future periods, including the Hicksville matter described
below, will have a material effect on our financial condition, but it
could have a material effect on our results of operations for a given
reporting period.
Reserves have been established to cover environmental matters
relating to discontinued businesses and past telecommunications
activities. These reserves include funds to address contamination
at the site of a former Sylvania facility in Hicksville NY, which had
processed nuclear fuel rods in the 1950s and 1960s. In September
2005, the Army Corps of Engineers (ACE) accepted the site into its
Formerly Utilized Sites Remedial Action Program. As a result, the ACE
has taken primary responsibility for addressing the contamination at
the site. An adjustment to the reserves may be made after a cost allo-
cation is conducted with respect to the past and future expenses of all
of the parties. Adjustments to the environmental reserve may also be
made based upon the actual conditions found at other sites requiring
remediation.
Verizon is currently involved in approximately 60 federal district court
actions alleging that Verizon is infringing various patents. Most of these
cases are brought by non- practicing entities and effectively seek only
monetary damages; a small number are brought by companies that
74 Verizon Communications Inc. and Subsidiaries
Notes to Consolidated Financial Statements continued

have sold products and seek injunctive relief as well. These cases have
progressed to various stages and a small number may go to trial in the
coming 12 months if they are not otherwise resolved.
In connection with the execution of agreements for the sales of busi-
nesses and investments, Verizon ordinarily provides representations
and warranties to the purchasers pertaining to a variety of nonfinancial
matters, such as ownership of the securities being sold, as well as
indemnity from certain financial losses. From time to time, counterparties
may make claims under these provisions, and Verizon will seek to defend
against those claims and resolve them in the ordinary course of business.
Subsequent to the sale of Verizon Information Services Canada in
2004, we continue to provide a guarantee to publish directories, which
was issued when the directory business was purchased in 2001 and
had a 30-year term (before extensions). The preexisting guarantee
continues, without modification, despite the subsequent sale of
Verizon Information Services Canada and the spin-off of our domestic
print and Internet yellow pages directories business. The possible
financial impact of the guarantee, which is not expected to be adverse,
cannot be reasonably estimated as a variety of the potential outcomes
available under the guarantee result in costs and revenues or benefits
that may offset each other. We do not believe performance under the
guarantee is likely.
As of December 31, 2015, letters of credit totaling approximately
$0.1 billion, which were executed in the normal course of business and
support several financing arrangements and payment obligations to
third parties, were outstanding.
We have several commitments primarily to purchase programming and
network services, equipment, software, handsets and peripherals, and
marketing activities, which will be used or sold in the ordinary course of
business, from a variety of suppliers totaling $21.9 billion. Of this total
amount, $8.4 billion is attributable to 2016, $9.2 billion is attributable
to 2017 through 2018, $2.3 billion is attributable to 2019 through 2020
and $2.0 billion is attributable to years thereafter. These amounts
do not represent our entire anticipated purchases in the future, but
represent only those items that are the subject of contractual obli-
gations. Our commitments are generally determined based on the
noncancelable quantities or termination amounts. Purchases against
our commitments for 2015 totaled approximately $10.2 billion. Since
the commitments to purchase programming services from television
networks and broadcast stations have no minimum volume require-
ment, we estimated our obligation based on number of subscribers at
December 31, 2015, and applicable rates stipulated in the contracts in
effect at that time. We also purchase products and services as needed
with no firm commitment.
Note 17Quarterly Financial Information (Unaudited)
(dollars in millions, except per share amounts)
Net Income (Loss) attributable to Verizon(1)
Quarter Ended
Operating
Revenues
Operating
Income (Loss) Amount
Per Share —
Basic
Per Share —
Diluted
Net Income
(Loss)
2015March 31 $ 31,984 $ 7,960 $ 4,219 $ 1.03 $ 1.02 $ 4,338June 30 32,224 7,821 4,231 1.04 1.04 4,353September 30 33,158 7,535 4,038 .99 .99 4,171December 31 34,254 9,744 5,391 1.32 1.32 5,513
2014
March 31 $ 30,818 $ 7,160 $ 3,947 $ 1.15 $ 1.15 $ 5,986
June 30 31,483 7,685 4,214 1.02 1.01 4,324
September 30 31,586 6,890 3,695 .89 .89 3,794
December 31 33,192 (2,136) (2,231) (.54) (.54) (2,148)
• Results of operations for the third quarter of 2015 include after-tax charges attributable to Verizon of $0.2 billion related to a pension remeasurement.
• Results of operations for the fourth quarter of 2015 include after-tax credits attributable to Verizon of $1.6 billion related to severance, pension and benefit credits, as well as after-tax
credits attributable to Verizon of $0.2 billion related to a gain on spectrum license transactions.
• Results of operations for the first quarter of 2014 include after-tax- credits attributable to Verizon of $1.9 billion related to the sale of its entire ownership interest in Vodafone Omnitel, as
well as after-tax costs attributable to Verizon of $0.6 billion related to early debt redemptions and $0.3 billion related to the Wireless Transaction.
• Results of operations for the second quarter of 2014 include after-tax credits attributable to Verizon of $0.4 billion related to a gain on spectrum license transactions.
• Results of operations for the fourth quarter of 2014 include after-tax charges attributable to Verizon of $4.7 billion related to severance, pension and benefit charges, as well as after-tax
costs attributable to Verizon of $0.5 billion related to early debt redemption and other costs.
(1) Net income (loss) attributable to Verizon per common share is computed independently for each quarter and the sum of the quarters may not equal the annual amount.
75Verizon Communications Inc. and Subsidiaries
Notes to Consolidated Financial Statements continued

Board of Directors
Shellye L. Archambeau
Chief Executive Officer MetricStream, Inc.
Mark T. Bertolini
Chairman and Chief Executive Officer Aetna Inc.
Richard L. Carrión
Chairman and Chief Executive Officer Popular, Inc.
Melanie L. Healey
Former Group President The Procter & Gamble Company
M. Frances Keeth
Retired Executive Vice President Royal Dutch Shell plc
Karl- Ludwig Kley
Chairman of the Executive Board and Chief Executive Officer Merck KGaA
Lowell C. McAdam
Chairman and Chief Executive Officer Verizon Communications Inc.
Donald T. Nicolaisen
Former Chief Accountant United States Securities and Exchange Commission
Clarence Otis, Jr.
Former Chairman and Chief Executive Officer Darden Restaurants, Inc.
Rodney E. Slater
Partner Squire Patton Boggs LLP
Kathryn A. Tesija
Strategic Advisor Target Corporation
Gregory D. Wasson
Former President and Chief Executive Officer Walgreens Boots Alliance, Inc.
Gregory G. Weaver
Former Chairman and Chief Executive Officer Deloitte & Touche LLP
Corporate Officers and
Executive Leadership
Lowell C. McAdam
Chairman and Chief Executive Officer
Francis J. Shammo
Executive Vice President and Chief Financial Officer
Caroline Armour
Senior Vice President of Internal Auditing
Roy H. Chestnutt
Executive Vice President — Strategy, Development and Planning
James J. Gerace
Chief Communications Officer
Roger Gurnani
Executive Vice President and Chief Information and Technology Architect
William L. Horton, Jr.
Senior Vice President, Deputy General Counsel and Corporate Secretary
Scott Krohn
Senior Vice President and Treasurer
Daniel S. Mead
Executive Vice President and President of Strategic Initiatives
Marc C. Reed
Executive Vice President and Chief Administrative Officer
Diego Scotti
Executive Vice President and Chief Marketing Officer
Craig L. Silliman
Executive Vice President of Public Policy and General Counsel
Anthony T. Skiadas
Senior Vice President and Controller
John G. Stratton
Executive Vice President and President of Operations
Marni M. Walden
Executive Vice President and President of Product Innovation and New Businesses
76 Directors and Executive Leadership
2015 Annual Report www.verizon.com/2015AnnualReport

Investor information
Stock transfer agent
Questions or requests for assistance regarding changes to or transfers of your registered stock ownership should be directed to our Transfer Agent, Computershare Trust Company, N.A. at:
Verizon Communications Inc.c/o ComputershareP.O. Box 43078Providence, RI 02940-3078Phone: 800 631-2355 or 781 575-3994Outside the U.S.: 866 725-6576Website: www.computershare.com/verizonEmail: [email protected]
Persons using a telecommunications device for the deaf (TDD) may call: 800 952-9245
Shareowner services
Please contact our Transfer Agent regarding information on the following services:
Online account access: Registered shareowners can view account information online at: www.computershare.com/verizon
Click on “Create Login” to register. For existing users, click on “Login.”
Direct dividend deposit service: Verizon offers an electronic funds transfer service to registered shareowners wishing to deposit dividends directly into savings or checking accounts on dividend payment dates.
Direct invest stock purchase and share
ownership plan: Verizon offers a direct stock purchase and share ownership plan. The plan allows current and new investors to purchase common stock and to reinvest the dividends toward the purchase of additional shares. For more information, go to www.verizon.com/about/stock- transfer-agent
Electronic delivery: By receiving links to proxy, annual report and shareowner materials online, you can help Verizon reduce the amount of materials we print and mail. As a thank you for choosing electronic delivery, Verizon will plant a tree on your behalf. It’s fast and easy, and you can change your electronic delivery options at any time. Sign up at www.computershare.com/verizon to take advantage of the many benefits electronic delivery offers, including:
- Faster access to financial documents - Email notification of document availability - Access to your documents online 24/7 - Convenience of managing your
documents (view and print)
If your shares are held by a broker, bank or other nominee, you may elect to receive an electronic copy of the annual report and proxy materials online at www.proxyvote.com, or you can contact your broker.
Investor services
Investor website: Get company information and news on our investor website — www.verizon.com/about/investors
Email Alerts: Get the latest investor information delivered directly to you. Subscribe to Email alerts at our investor website.
Stock market information
Shareowners of record at December 31, 2015: 602,700
Verizon (ticker symbol: VZ) is listed on the New York Stock Exchange (NYSE) and the NASDAQ Global Select Market (NASDAQ). Verizon also maintains a standard listing on the London Stock Exchange.
Dividend information
At its September 2015 meeting, the Board of Directors increased our quarterly dividend 2.7 percent. On an annual basis, this increased Verizon’s dividend to $2.26 per share. Dividends have been paid since 1984.
Form 10-K
To receive a printed copy of the 2015 Annual Report on Form 10-K, which is filed with the Securities and Exchange Commission, please contact Investor Relations:
Verizon Communications Inc.Investor RelationsOne Verizon WayBasking Ridge, NJ 07920Phone: 212 395-1525
Corporate governance statement
Verizon is subject to the corporate governance standards of the NYSE and NASDAQ, which are available on their respective websites. In addition, Verizon has adopted its own corporate governance framework. Information relating to Verizon’s corporate governance framework, including Verizon’s Code of Conduct, Corporate Governance Guidelines and the charters of the Committees of its Board of Directors, can be found on the corporate governance section of our website at: www.verizon.com/ about/investors. Verizon believes it is in compliance with the applicable corporate governance requirements in the United States, including under Delaware law, the corporate governance standards of the NYSE and NASDAQ, and U.S. federal securities laws.
If you would like to receive a printed copy of Verizon’s Corporate Governance Guidelines, please contact the Assistant Corporate Secretary:
Verizon Communications Inc.Assistant Corporate Secretary1095 Avenue of the AmericasNew York, NY 10036
77Investor information
www.verizon.com/2015AnnualReport 2015 Annual Report

Verizon Communications Inc.
1095 Avenue of the AmericasNew York, New York 10036212 395-1000
© 2016. Verizon. All Rights Reserved.002CSN622B 3.EPCP90276283RD
verizon.com/about

![[2]s21.q4cdn.com/487940486/files/doc_financials/... · in the Boost brand. 2.77 2.78 2.83 2.85 4QFY16 1QFY17 2QFY17 3QFY17 4QFY17 Average postpaid connections Average Postpaid Connections](https://img.pdfslide.us/doc/110x75/5f096e247e708231d426cd2c/2s21q4cdncom487940486filesdocfinancials-in-the-boost-brand-277-278.jpg)