Embed Size (px)
Citation preview
Select Comfort Corporation Investor Presentation
April 22, 2015
DisclosuresTHIS PRESENTATION IS FOR DISCUSSION AND GENERAL INFORMATIONAL PURPOSES ONLY. IT DOES NOT HAVE REGARD TO THE SPECIFIC INVESTMENT OBJECTIVE, FINANCIAL SITUATION, SUITABILITY, OR THE PARTICULAR NEED OF ANY SPECIFIC PERSON WHO MAY RECEIVE THIS PRESENTATION, AND SHOULD NOT BE TAKEN AS ADVICE ON THE MERITS OF ANY INVESTMENT DECISION. THE VIEWS EXPRESSED HEREIN REPRESENT THE OPINIONS OF BLUE CLAY CAPITAL MANAGEMENT, LLC (“BLUE CLAY”), AND ARE BASED ON PUBLICLY AVAILABLE INFORMATION WITH RESPECT TO SELECT COMFORT CORPORATION (THE “COMPANY”) AND THE INDUSTRY IN WHICH IT OPERATES. CERTAIN FINANCIAL INFORMATION AND DATA USED HEREIN HAVE BEEN DERIVED OR OBTAINED FROM PUBLIC FILINGS, INCLUDING FILINGS MADE BY THE COMPANY AND ITS COMPETITORS WITH THE SECURITIES AND EXCHANGE COMMISSION (“SEC”), AND OTHER SOURCES.
BLUE CLAY HAS NOT SOUGHT OR OBTAINED CONSENT FROM ANY THIRD PARTY TO USE ANY STATEMENTS OR INFORMATION INDICATED HEREIN AS HAVING BEEN OBTAINED OR DERIVED FROM STATEMENTS MADE OR PUBLISHED BY THIRD PARTIES. ANY SUCH STATEMENTS OR INFORMATION SHOULD NOT BE VIEWED AS INDICATING THE SUPPORT OF SUCH THIRD PARTY FOR THE VIEWS EXPRESSED HEREIN. NO WARRANTY IS MADE THAT DATA OR INFORMATION, WHETHER DERIVED OR OBTAINED FROM FILINGS MADE WITH THE SEC OR FROM ANY THIRD PARTY, ARE ACCURATE.
EXCEPT FOR THE HISTORICAL INFORMATION CONTAINED HEREIN, THE MATTERS ADDRESSED IN THIS PRESENTATION ARE FORWARD-LOOKING STATEMENTS THAT INVOLVE CERTAIN RISKS AND UNCERTAINTIES. ACTUAL RESULTS MAY DIFFER MATERIALLY FROM THOSE CONTAINED IN THE FORWARD-LOOKING STATEMENTS.
BLUE CLAY SHALL NOT BE RESPONSIBLE OR HAVE ANY LIABILITY FOR ANY MISINFORMATION CONTAINED IN ANY SEC FILING, ANY THIRD PARTY REPORT OR THIS PRESENTATION. THERE IS NO ASSURANCE OR GUARANTEE WITH RESPECT TO THE PRICES AT WHICH ANY SECURITIES OF THE COMPANY WILL TRADE, AND SUCH SECURITIES MAY NOT TRADE AT PRICES THAT MAY BE IMPLIED HEREIN. THE ESTIMATES, PROJECTIONS AND PRO FORMA INFORMATION SET FORTH HEREIN ARE BASED ON ASSUMPTIONS THAT BLUE CLAY BELIEVES TO BE REASONABLE, BUT THERE CAN BE NO ASSURANCE OR GUARANTEE THAT ACTUAL RESULTS OR PERFORMANCE OF THE COMPANY WILL NOT DIFFER, AND SUCH DIFFERENCES MAY BE MATERIAL. THIS PRESENTATION DOES NOT RECOMMEND THE PURCHASE OR SALE OF ANY SECURITY.
BLUE CLAY RESERVES THE RIGHT TO CHANGE ANY OF ITS OPINIONS EXPRESSED HEREIN AT ANY TIME AS IT DEEMS APPROPRIATE. BLUE CLAY DISCLAIMS ANY OBLIGATION TO UPDATE THE INFORMATION CONTAINED HEREIN.
UNDER NO CIRCUMSTANCES IS THIS PRESENTATION TO BE USED OR CONSIDERED AS AN OFFER TO SELL OR A SOLICITATION OF AN OFFER TO BUY ANY SECURITY.
2
Table of Contents
3
4 Overview of Blue Clay, its Nominees and the Opportunity for Shareholders
10 Change is Needed• Stock Price Underperformance• Financial Deterioration• Failure to Meet Stated Objectives• Recent Changes Not Enough
28 Blue Clay Nominees are Better Qualified to Drive Change• Blue Clay’s Nominees Have More Relevant and Diverse Experience• Incumbents’ Poor Corporate Governance, Excessive Tenure and Interlocks• Current Board’s Misalignment with Shareholders• Incumbents’ Failure to Hold Management Accountable• Current Directors’ Capital Allocation Mistakes
43 Blue Clay’s Analysis of the Future Opportunity
56 Conclusion
58 Appendix
• Addressing Company Statements
I. Overview of Blue Clay, its Nominees and the Opportunity for Shareholders
4
Overview of Blue Clay Capital Management
5
Blue Clay is an investment management firm with an experienced team focused on small- and mid-cap publicly-traded securities
• Blue Clay aims to deliver superior absolute results utilizing a fundamental and long‐term investment approach with a focus on capital preservation
• Our investment approach involves performing extensive due diligence through meetings with company management and analysts, industry and competitive research, and detailed review of all company filings and earnings calls
• We seek to engage in constructive dialogues with management teams on how to maximize long‐term shareholder valueo Where appropriate, our discussions with management may lead to actively pursuing board representation to increase
shareholder value through strengthening corporate governance, operating strategy and capital allocation
• The breadth and depth of Blue Clay’s investment team make it well prepared to address the needs of underperforming companies for the benefit of all stakeholderso Chief Investment Officer Gary Kohler’s depth of investment experience spans 30 years managing both family office assets at
Okabena & Company and hedge fund assets at Whitebox Advisors, where he produced outstanding results across market cycles
o Investment team’s breadth of experience spans public markets, private equity, venture capital, corporate development and activist investing at Whitebox Advisors, Stark Investments, Wind Point Partners, Goldman, Sachs & Co., UnitedHealth Group and Quad/Graphics• With significant corporate development, private equity and board‐level experience, Blue Clay is well equipped to assess
management team and board capabilities while bringing first‐hand experience in executing corporate strategy and capital allocation decisions
• We are dedicated to upholding an ethical culture and the highest level of fiduciary duty
• Substantial investments by members of the Blue Clay group directly align interests with Select Comfort shareholders
Why We Are Involved with Select Comfort
6
I. Blue Clay Principals Have Long History with the Company
• Principals of Blue Clay have invested in Select Comfort Corporation (“Select Comfort” or the “Company”) since 2001 when the Company raised capital in a private placement as a result of the first of two times the Board’s decisions pushed the Company into financial distress
• Blue Clay and its principals have been long‐term investors in the Company• Our extensive history with and research of the Company reinforce our belief that, with proper leadership at the Board level, significant shareholder value
can be created
II. Shareholder Representation Needed at the Board Level after Multiple Missteps
• We strongly believe shareholders’ interests are not being adequately represented and change is needed at the Board level, as evidenced by:o Significant stock price underperformance: The Company’s total shareholder return has significantly lagged the major indices and its mattress
industry peerso Financial deterioration: During the tenure of the current CEO, operating margins have declined 31.2%, G&A expenses have increased 42.6%, total
operating expenses have increased 48.4% and return on invested capital (ROIC) has declined 28.9%o Repeated failure to achieve stated performance goals: The Company’s failed execution has led to its failure to achieve forecasted margin expansion,
flow‐through and store growtho Poor capital allocation decisions: Poor capital allocation decisions have caused significant shareholder dilution, missed opportunities to repurchase
shares at attractive valuations and significant destruction of shareholder valueo Questionable corporate governance practices: Classified board, excessive tenure, interlocking directors and failure to hold management accountable
raise concerns of independence and highlight the need for fresh perspectives on the Board
III. The Company has Failed to Realize its Potential Under the Current Board
• The Company has only recently begun to implement changes in reaction to Blue Clay’s nominations, but they are too little, too late• We believe our highly‐qualified nominees are far better equipped than the incumbent nominees to help the Board maximize long‐term shareholder value• Blue Clay urges shareholders to vote the BLUE proxy card today
Blue Clay’s nominees will work to ensure the Company realizes the promises that the current Board has failed to keep
Blue Clay believes change at the Board level is needed to maximize long-term shareholder value
Sources: Company SEC filings.Stock price performance measured from May 31, 2012 closing price through December 31, 2014. Financial period measured is LTMMarch‐2012 through FY2014, Ms. Ibach became CEO as of June 1, 2012.
7
I. Share price should be 65%‐100%+ greater if the Board and management had achieved their May 2012 guidance
• At May 2012 Investor Day, the Company guided for 2015 sales of >$1.5B and 15% operating margin, implying >$225mm EBITo Based on Company’s enterprise value to 2015 EBIT valuation, if guidance was achieved, stock would be worth in excess of
$54/share, >65% higher than the Company’s actual stock price as of April 17, 2015o $225mm of EBIT in 2015 would imply 2015 EPS of approximately $2.79• At Company’s current P/E, stock would be worth in excess of $67/share, >100% higher than actual stock price• Additionally, 2015E EPS of $2.79 is 1.5% greater than the Company’s recent guidance for 2019 EPS
II. Share price should be 136% greater without poor capital allocation decisions
• Twice the Company has put itself into financial distress and was forced to raise capital at highly dilutive prices• Share count is 136% higher as a result of needing to raise capital during financial distress in 2001 (when two current directors
were on Board) and 2009 (when five current directors, including Mr. Gulis and Ms. Lauderback, were on the Board)• If this dilution hadn’t occurred, today’s market cap would equate to a share price in excess of $77/share
III.Share price should be nearly 400% greater if the Company had achieved its May 2012 guidance and without massive dilution resulting from poor capital allocation decisions by the Board
• Without dilutive raises, May 2012 Investor Day guidance of 2015E EBIT of >$225mm would imply a 2015E EPS of $6.65• At Company’s current P/E, stock would be worth in excess of $161/share, nearly 400% higher than actual stock price
We are deeply concerned the Company’s failure to execute and the Board’s poor decisions have suppressed long‐term shareholder value creation
Failure to Realize Potential for ShareholdersShare price should be substantially higher. Missed performance goals and poor capital allocation decisions by the Board have significantly impaired value creation
Sources: Company SEC filings, earnings transcripts and investor presentations. Wall Street estimates per Bloomberg.Wall Street 2015 consensus estimates include other income, net of $0.2mm and a tax rate of 34.4%. Share count would be 22.2mm shares outstanding without dilutive raises in 2001 and 2009.
Blue Clay Nominees are Far Superior to Incumbents
8
Blue Clay nominees are aligned with shareholders and bring exceptional and relevant credentials
Blue Clay’s Nominees
• Brian A. Spaly: An experienced CEO with noted public success as Founder and Chief Executive Officer of Trunk Club, Inc., an innovative apparel retailer. Trunk Club was recently acquired by Nordstrom for $350 milliono Remains CEO of Trunk Club in addition to playing a significant role in Nordstrom’s corporate development activitieso Founder of Bonobos, Inc., an e‐commerce driven men’s apparel company• Bonobos was named one of America’s 50 hottest brands by Ad Age in 2009
o Extensive capital allocation and strategy development and execution experience through his roles in private equity, corporate development and consulting
o Extensive expertise in retail, sales and marketing, brand‐building and customer acquisition• Built Trunk Club sales team from scratch to over 400 people• Trunk Club used as case study and Mr. Spaly participates as a featured speaker at Stanford Graduate School of Business’ Managing Growing
Enterprises and Building and Managing Professional Sales Organizationso Featured as part of keynote program in Salesforce.com’s customer company tour with CEO Marc Benioffo Expertise in the convergence of online and offline retail would greatly benefit the Company as it competes with newer market entrants,
such as Casper, Saatva and Tuft & Needle, primarily focused on an online platformo MBA from the Stanford Graduate School of Business and AB from Princeton University
• Adam J. Wright: Founding Principal, Managing Partner and Senior Analyst of Blue Clay Capital Management, an investment firm focused on small‐ and mid‐cap publicly traded securitieso Serves as a director of Famous Dave’s of America, Inc. (NASDAQ: DAVE), which develops, operates and franchises barbecue restaurants• Chair of the corporate governance and nominating committee and serves on the compensation committee
o Prior to founding Blue Clay Capital Management, Mr. Wright served as a Senior Fundamental Analyst with Whitebox Advisors, LLC, an SEC‐registered investment adviser
o Extensive experience in corporate development at UnitedHealth Group and investment banking at Goldman, Sachs & Co.o Strong financial and investment background, which we believe is sorely lacking on the current Board and would be instrumental to
improving the Board’s capital allocation decision‐making processo MBA from the Stanford Graduate School of Business and BA from Dartmouth College
Vote the BLUE Proxy Card:Blue Clay’s nominees have the right blend of experience, qualifications, fresh perspectives and alignment with shareholders
Sources: Nordstrom SEC filings, Advertising Age website.
Blue Clay Nominees are Far Superior to Incumbents
9
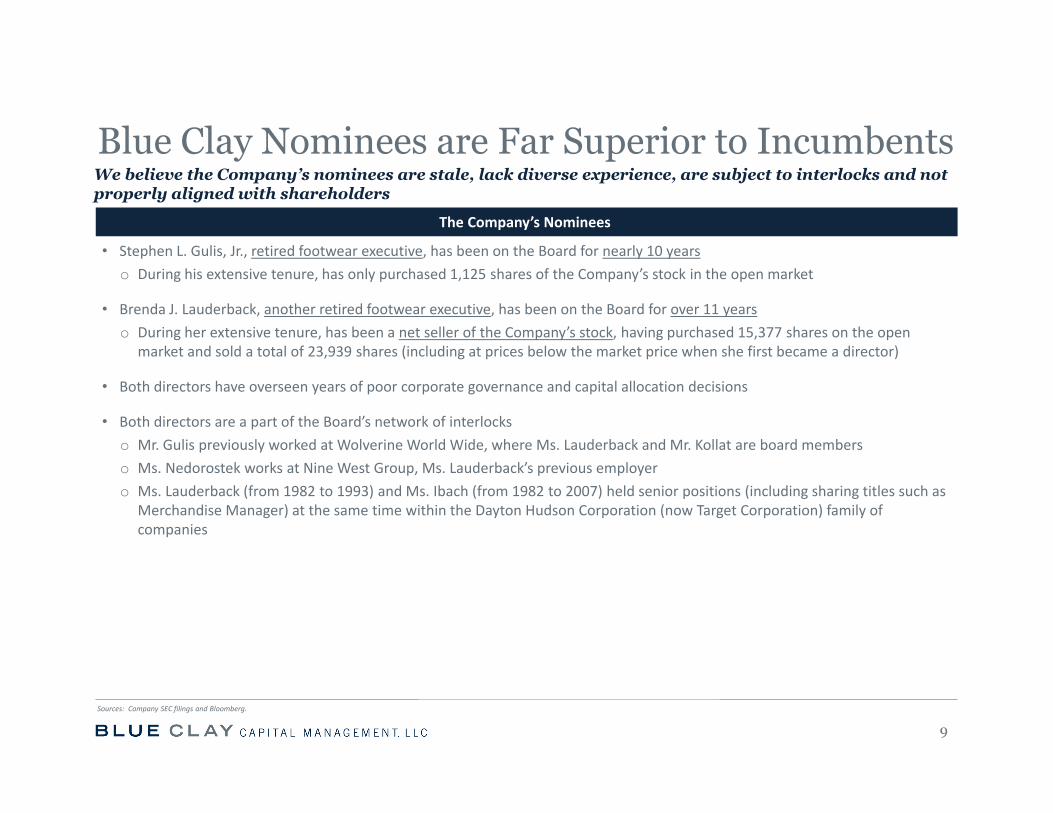
We believe the Company’s nominees are stale, lack diverse experience, are subject to interlocks and not properly aligned with shareholders
The Company’s Nominees
• Stephen L. Gulis, Jr., retired footwear executive, has been on the Board for nearly 10 yearso During his extensive tenure, has only purchased 1,125 shares of the Company’s stock in the open market
• Brenda J. Lauderback, another retired footwear executive, has been on the Board for over 11 yearso During her extensive tenure, has been a net seller of the Company’s stock, having purchased 15,377 shares on the open
market and sold a total of 23,939 shares (including at prices below the market price when she first became a director)
• Both directors have overseen years of poor corporate governance and capital allocation decisions
• Both directors are a part of the Board’s network of interlockso Mr. Gulis previously worked at Wolverine World Wide, where Ms. Lauderback and Mr. Kollat are board memberso Ms. Nedorostek works at Nine West Group, Ms. Lauderback’s previous employero Ms. Lauderback (from 1982 to 1993) and Ms. Ibach (from 1982 to 2007) held senior positions (including sharing titles such as
Merchandise Manager) at the same time within the Dayton Hudson Corporation (now Target Corporation) family of companies
Sources: Company SEC filings and Bloomberg.
II. Change is Needed
10
During CEO’s Tenure TSR Significantly Below Peers and Indices
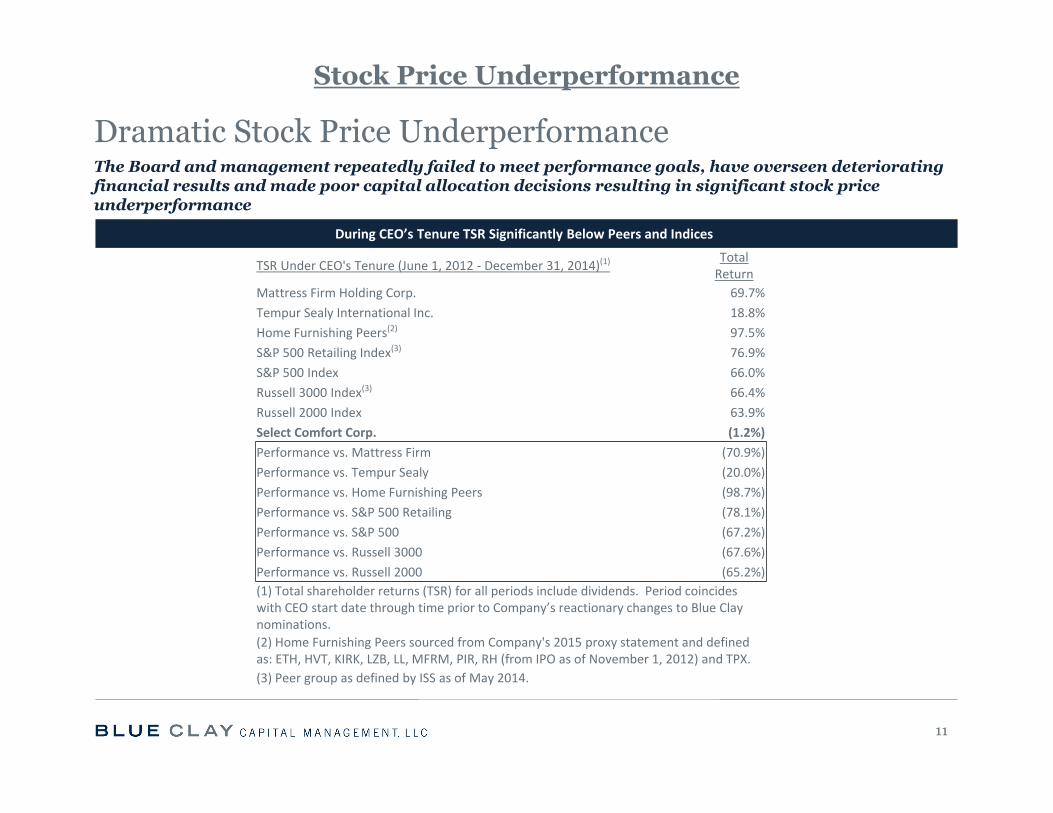
The Board and management repeatedly failed to meet performance goals, have overseen deteriorating financial results and made poor capital allocation decisions resulting in significant stock price underperformance
11
Dramatic Stock Price Underperformance
TSR Under CEO's Tenure (June 1, 2012 ‐ December 31, 2014)(1) Total Return
Mattress Firm Holding Corp. 69.7% Tempur Sealy International Inc. 18.8% Home Furnishing Peers(2) 97.5% S&P 500 Retailing Index(3) 76.9% S&P 500 Index 66.0% Russell 3000 Index(3) 66.4% Russell 2000 Index 63.9% Select Comfort Corp. (1.2%)Performance vs. Mattress Firm (70.9%)Performance vs. Tempur Sealy (20.0%)Performance vs. Home Furnishing Peers (98.7%)Performance vs. S&P 500 Retailing (78.1%)Performance vs. S&P 500 (67.2%)Performance vs. Russell 3000 (67.6%)Performance vs. Russell 2000 (65.2%)(1) Total shareholder returns (TSR) for all periods include dividends. Period coincides with CEO start date through time prior to Company’s reactionary changes to Blue Clay nominations.(2) Home Furnishing Peers sourced from Company's 2015 proxy statement and defined as: ETH, HVT, KIRK, LZB, LL, MFRM, PIR, RH (from IPO as of November 1, 2012) and TPX.(3) Peer group as defined by ISS as of May 2014.
Stock Price Underperformance
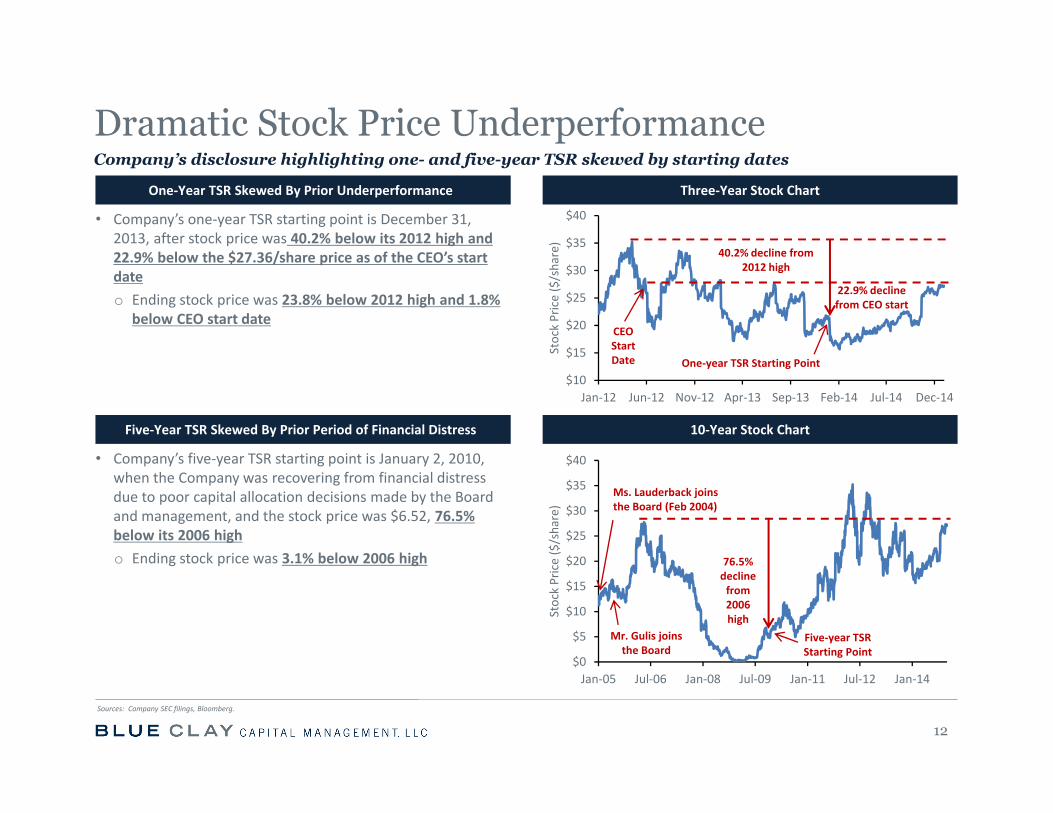
One‐Year TSR Skewed By Prior Underperformance Three‐Year Stock Chart
• Company’s one‐year TSR starting point is December 31, 2013, after stock price was 40.2% below its 2012 high and 22.9% below the $27.36/share price as of the CEO’s start dateo Ending stock price was 23.8% below 2012 high and 1.8%
below CEO start date
Five‐Year TSR Skewed By Prior Period of Financial Distress 10‐Year Stock Chart
• Company’s five‐year TSR starting point is January 2, 2010, when the Company was recovering from financial distress due to poor capital allocation decisions made by the Board and management, and the stock price was $6.52, 76.5% below its 2006 higho Ending stock price was 3.1% below 2006 high
$10
$15
$20
$25
$30
$35
$40
Jan‐12 Jun‐12 Nov‐12 Apr‐13 Sep‐13 Feb‐14 Jul‐14 Dec‐14
Stock Price ($/share)
22.9% decline from CEO start
40.2% decline from 2012 high
$0
$5
$10
$15
$20
$25
$30
$35
$40
Jan‐05 Jul‐06 Jan‐08 Jul‐09 Jan‐11 Jul‐12 Jan‐14
Stock Price ($/share)
12
Dramatic Stock Price UnderperformanceCompany’s disclosure highlighting one- and five-year TSR skewed by starting dates
One‐year TSR Starting Point
Five‐year TSR Starting Point
CEO Start Date
76.5% decline from 2006 high
Mr. Gulis joins the Board
Ms. Lauderback joins the Board (Feb 2004)
Sources: Company SEC filings, Bloomberg.
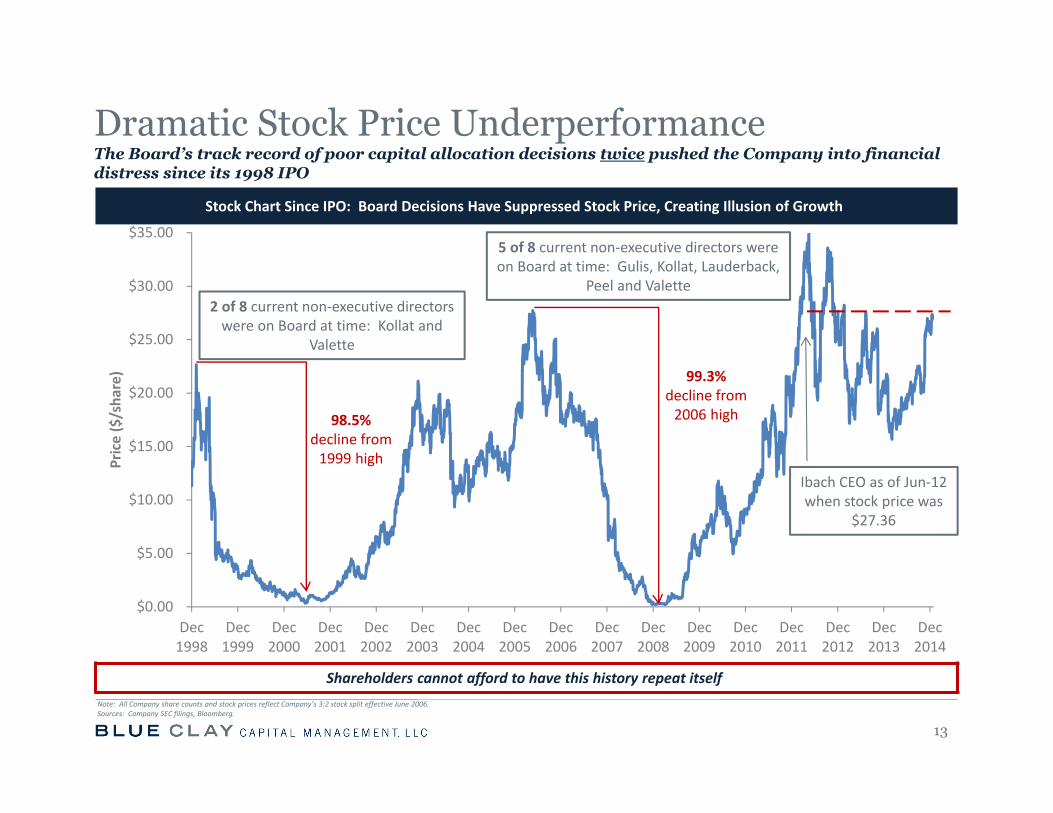
13
$0.00
$5.00
$10.00
$15.00
$20.00
$25.00
$30.00
$35.00
Dec1998
Dec1999
Dec2000
Dec2001
Dec2002
Dec2003
Dec2004
Dec2005
Dec2006
Dec2007
Dec2008
Dec2009
Dec2010
Dec2011
Dec2012
Dec2013
Dec2014
Price ($/sha
re)
98.5% decline from 1999 high
99.3%decline from 2006 high
2 of 8 current non‐executive directors were on Board at time: Kollat and
Valette
5 of 8 current non‐executive directors were on Board at time: Gulis, Kollat, Lauderback,
Peel and Valette
Ibach CEO as of Jun‐12 when stock price was
$27.36
The Board’s track record of poor capital allocation decisions twice pushed the Company into financial distress since its 1998 IPO
Dramatic Stock Price Underperformance
Stock Chart Since IPO: Board Decisions Have Suppressed Stock Price, Creating Illusion of Growth
Shareholders cannot afford to have this history repeat itselfNote: All Company share counts and stock prices reflect Company’s 3:2 stock split effective June 2006.Sources: Company SEC filings, Bloomberg.
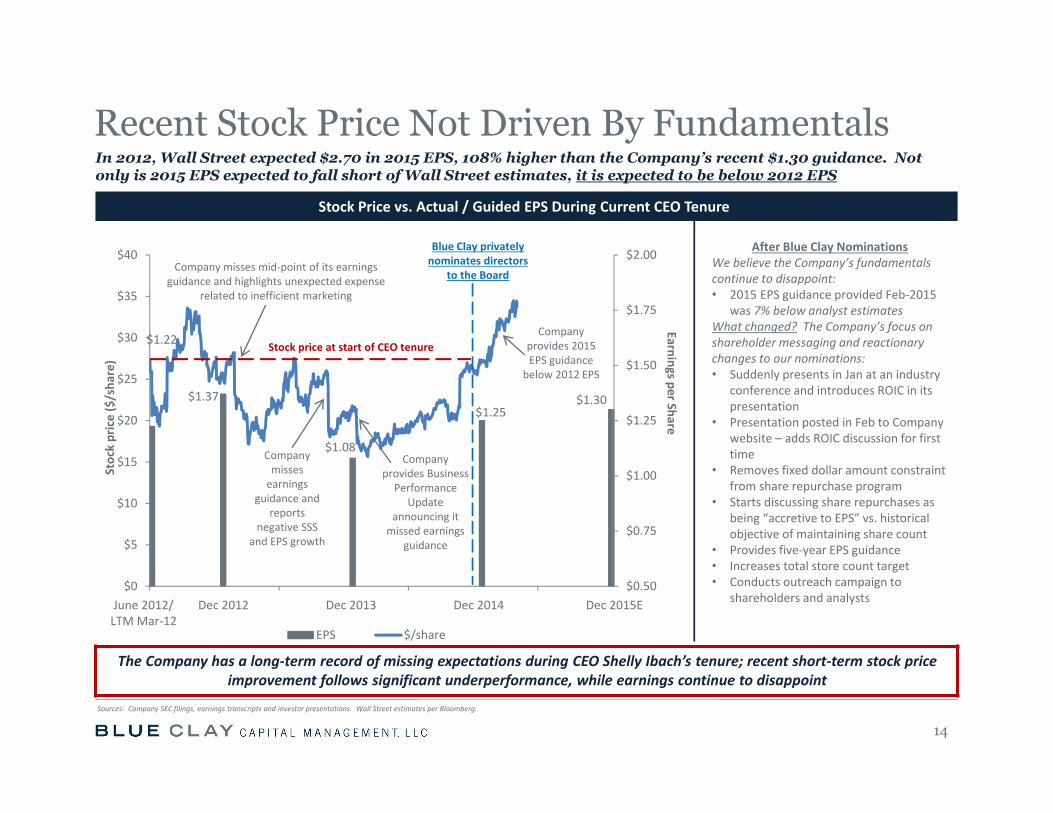
Stock Price vs. Actual / Guided EPS During Current CEO Tenure
The Company has a long‐term record of missing expectations during CEO Shelly Ibach’s tenure; recent short‐term stock price improvement follows significant underperformance, while earnings continue to disappoint
$1.22
$1.37
$1.08
$1.25 $1.30
$0.50
$0.75
$1.00
$1.25
$1.50
$1.75
$2.00
$0
$5
$10
$15
$20
$25
$30
$35
$40
Earnings per Share
Stock price ($/sha
re)
EPS $/share
In 2012, Wall Street expected $2.70 in 2015 EPS, 108% higher than the Company’s recent $1.30 guidance. Not only is 2015 EPS expected to fall short of Wall Street estimates, it is expected to be below 2012 EPS
14
Recent Stock Price Not Driven By Fundamentals
Sources: Company SEC filings, earnings transcripts and investor presentations. Wall Street estimates per Bloomberg.
June 2012/ LTM Mar‐12
Dec 2012 Dec 2013 Dec 2014 Dec 2015E
Company misses mid‐point of its earnings guidance and highlights unexpected expense
related to inefficient marketing
Company misses earnings
guidance and reports
negative SSS and EPS growth
Blue Clay privately nominates directors
to the Board
After Blue Clay NominationsWe believe the Company’s fundamentals continue to disappoint:• 2015 EPS guidance provided Feb‐2015
was 7% below analyst estimatesWhat changed? The Company’s focus on shareholder messaging and reactionary changes to our nominations:• Suddenly presents in Jan at an industry
conference and introduces ROIC in its presentation
• Presentation posted in Feb to Company website – adds ROIC discussion for first time
• Removes fixed dollar amount constraint from share repurchase program
• Starts discussing share repurchases as being “accretive to EPS” vs. historical objective of maintaining share count
• Provides five‐year EPS guidance• Increases total store count target• Conducts outreach campaign to
shareholders and analysts
Stock price at start of CEO tenure
Company provides Business Performance
Update announcing it missed earnings
guidance
Company provides 2015 EPS guidance
below 2012 EPS
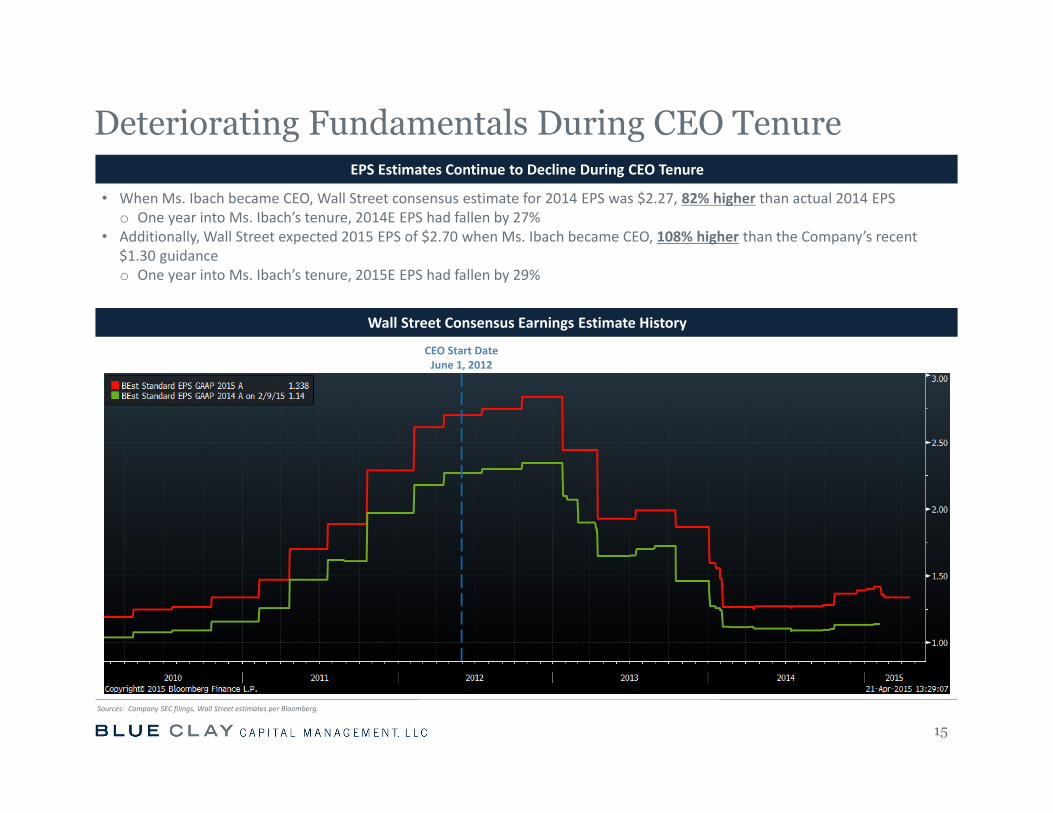
EPS Estimates Continue to Decline During CEO Tenure
• When Ms. Ibach became CEO, Wall Street consensus estimate for 2014 EPS was $2.27, 82% higher than actual 2014 EPSo One year into Ms. Ibach’s tenure, 2014E EPS had fallen by 27%
• Additionally, Wall Street expected 2015 EPS of $2.70 when Ms. Ibach became CEO, 108% higher than the Company’s recent $1.30 guidanceo One year into Ms. Ibach’s tenure, 2015E EPS had fallen by 29%
Wall Street Consensus Earnings Estimate History
Deteriorating Fundamentals During CEO Tenure
15
Sources: Company SEC filings, Wall Street estimates per Bloomberg.
CEO Start DateJune 1, 2012
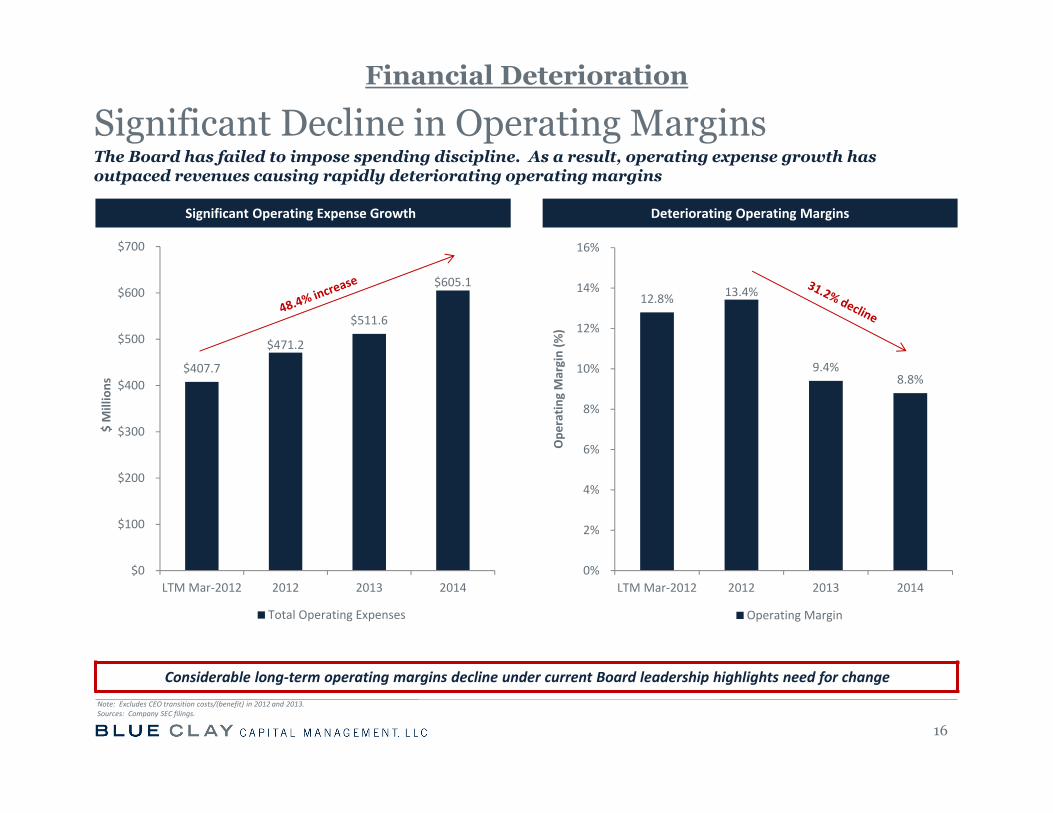
Significant Operating Expense Growth Deteriorating Operating Margins
Considerable long‐term operating margins decline under current Board leadership highlights need for change
12.8% 13.4%
9.4% 8.8%
0%
2%
4%
6%
8%
10%
12%
14%
16%
LTM Mar‐2012 2012 2013 2014
Ope
ratin
g Margin (%
)
Operating Margin
16
Significant Decline in Operating Margins
Note: Excludes CEO transition costs/(benefit) in 2012 and 2013.Sources: Company SEC filings.
The Board has failed to impose spending discipline. As a result, operating expense growth has outpaced revenues causing rapidly deteriorating operating margins
$407.7
$471.2
$511.6
$605.1
$0
$100
$200
$300
$400
$500
$600
$700
LTM Mar‐2012 2012 2013 2014
$ Millions
Total Operating Expenses
Financial Deterioration
General & Administrative Expense Growth Number of Employees at Corporate Is Ballooning
G&A Expense Per Store Continues to Increase Management & Administrative Employees Per Store
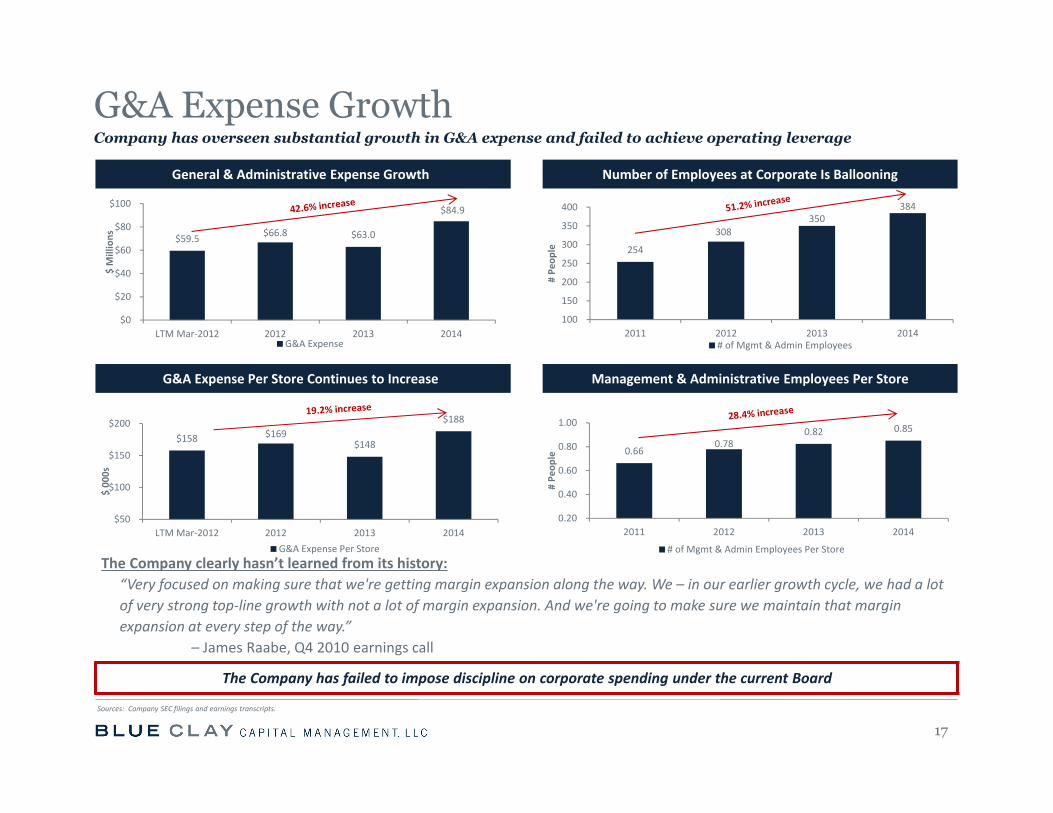
The Company clearly hasn’t learned from its history:“Very focused on making sure that we're getting margin expansion along the way. We – in our earlier growth cycle, we had a lot of very strong top‐line growth with not a lot of margin expansion. And we're going to make sure we maintain that margin expansion at every step of the way.”
– James Raabe, Q4 2010 earnings call
The Company has failed to impose discipline on corporate spending under the current Board
$158 $169 $148
$188
$50
$100
$150
$200
LTM Mar‐2012 2012 2013 2014
$ 000s
G&A Expense Per Store
G&A Expense GrowthCompany has overseen substantial growth in G&A expense and failed to achieve operating leverage
17
Sources: Company SEC filings and earnings transcripts.
$59.5 $66.8 $63.0
$84.9
$0
$20
$40
$60
$80
$100
LTM Mar‐2012 2012 2013 2014
$ Millions
G&A Expense
254
308 350
384
100
150
200
250
300
350
400
2011 2012 2013 2014
# Pe
ople
# of Mgmt & Admin Employees
0.66 0.78
0.82 0.85
0.20
0.40
0.60
0.80
1.00
2011 2012 2013 2014
# Pe
ople
# of Mgmt & Admin Employees Per Store
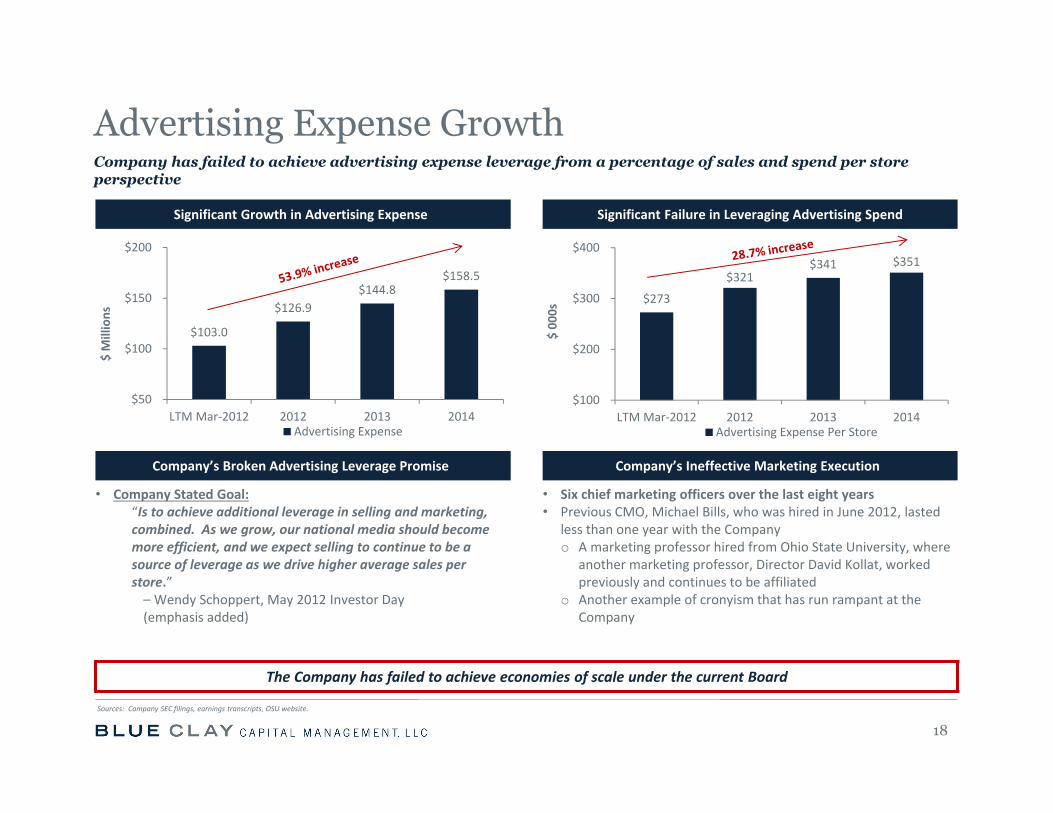
Significant Growth in Advertising Expense Significant Failure in Leveraging Advertising Spend
Company’s Broken Advertising Leverage Promise Company’s Ineffective Marketing Execution
• Company Stated Goal:“Is to achieve additional leverage in selling and marketing, combined. As we grow, our national media should become more efficient, and we expect selling to continue to be a source of leverage as we drive higher average sales per store.” – Wendy Schoppert, May 2012 Investor Day (emphasis added)
• Six chief marketing officers over the last eight years• Previous CMO, Michael Bills, who was hired in June 2012, lasted
less than one year with the Companyo A marketing professor hired from Ohio State University, where
another marketing professor, Director David Kollat, worked previously and continues to be affiliated
o Another example of cronyism that has run rampant at the Company
The Company has failed to achieve economies of scale under the current Board
Advertising Expense GrowthCompany has failed to achieve advertising expense leverage from a percentage of sales and spend per store perspective
18
Sources: Company SEC filings, earnings transcripts, OSU website.
$103.0
$126.9 $144.8
$158.5
$50
$100
$150
$200
LTM Mar‐2012 2012 2013 2014
$ Millions
Advertising Expense
$273
$321 $341 $351
$100
$200
$300
$400
LTM Mar‐2012 2012 2013 2014
$ 00
0s
Advertising Expense Per Store
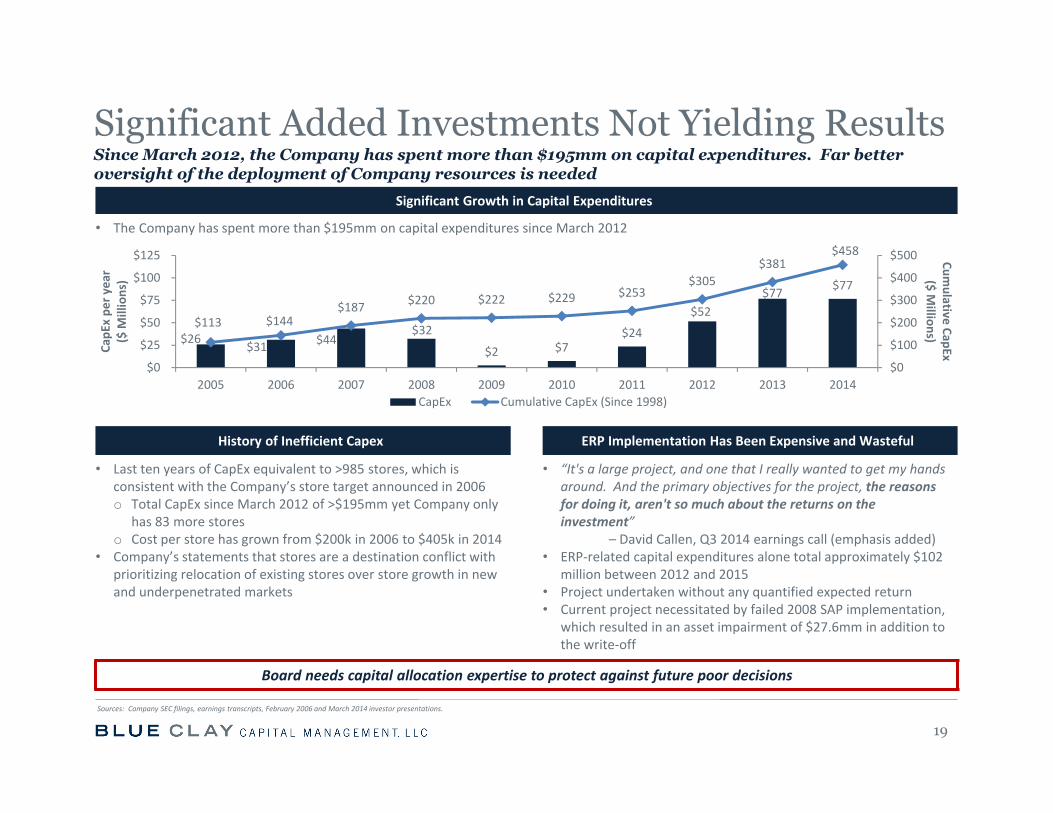
Significant Growth in Capital Expenditures
• The Company has spent more than $195mm on capital expenditures since March 2012
History of Inefficient Capex ERP Implementation Has Been Expensive and Wasteful
• Last ten years of CapEx equivalent to >985 stores, which is consistent with the Company’s store target announced in 2006o Total CapEx since March 2012 of >$195mm yet Company only
has 83 more storeso Cost per store has grown from $200k in 2006 to $405k in 2014
• Company’s statements that stores are a destination conflict with prioritizing relocation of existing stores over store growth in new and underpenetrated markets
• “It's a large project, and one that I really wanted to get my hands around. And the primary objectives for the project, the reasons for doing it, aren't so much about the returns on the investment”
– David Callen, Q3 2014 earnings call (emphasis added)• ERP‐related capital expenditures alone total approximately $102
million between 2012 and 2015• Project undertaken without any quantified expected return• Current project necessitated by failed 2008 SAP implementation,
which resulted in an asset impairment of $27.6mm in addition to the write‐off
Board needs capital allocation expertise to protect against future poor decisions
Since March 2012, the Company has spent more than $195mm on capital expenditures. Far better oversight of the deployment of Company resources is needed
19
Significant Added Investments Not Yielding Results
Sources: Company SEC filings, earnings transcripts, February 2006 and March 2014 investor presentations.
$26 $31 $44 $32
$2 $7 $24
$52 $77 $77
$113 $144 $187 $220 $222 $229 $253
$305 $381
$458
$0
$100
$200
$300
$400
$500
$0
$25
$50
$75
$100
$125
2005 2006 2007 2008 2009 2010 2011 2012 2013 2014
Cumulative CapEx ($ M
illions)Ca
pEx pe
r year
($ M
illions)
CapEx Cumulative CapEx (Since 1998)
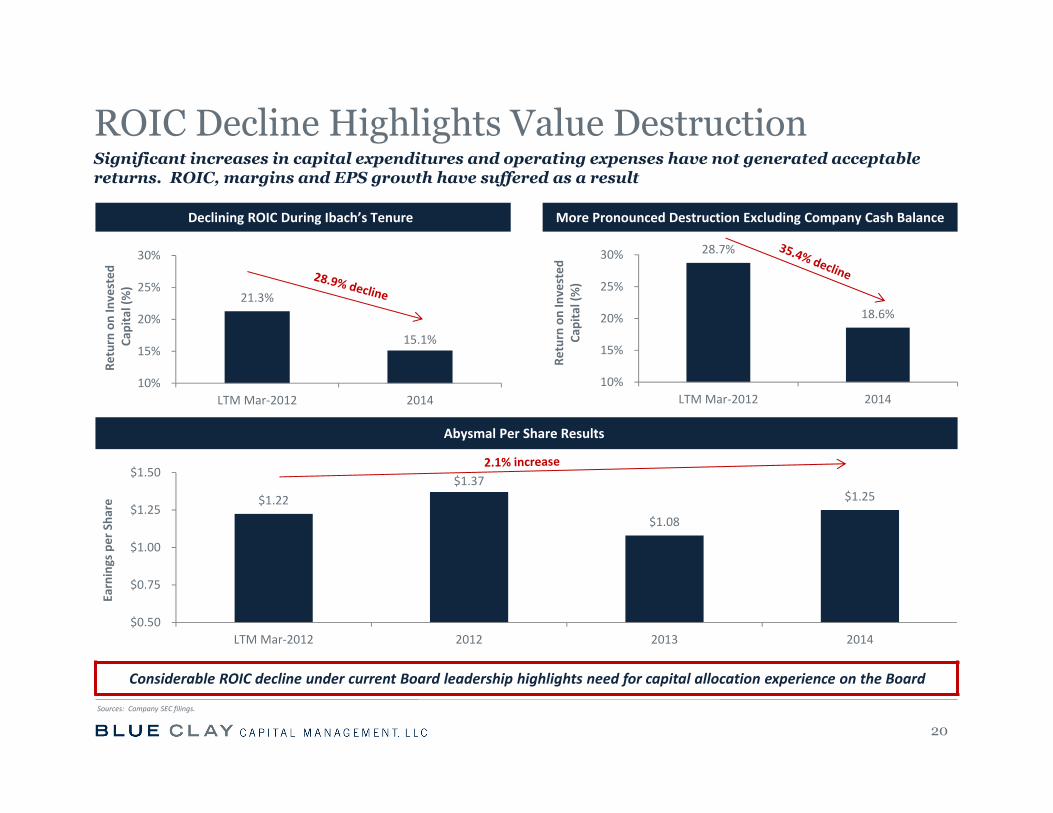
21.3%
15.1%
10%
15%
20%
25%
30%
LTM Mar‐2012 2014
Return on Invested
Capital (%)
Declining ROIC During Ibach’s Tenure More Pronounced Destruction Excluding Company Cash Balance
Abysmal Per Share Results
Considerable ROIC decline under current Board leadership highlights need for capital allocation experience on the Board
20
ROIC Decline Highlights Value Destruction
Sources: Company SEC filings.
Significant increases in capital expenditures and operating expenses have not generated acceptable returns. ROIC, margins and EPS growth have suffered as a result
28.7%
18.6%
10%
15%
20%
25%
30%
LTM Mar‐2012 2014
Return on Invested
Ca
pital (%)
$1.22 $1.37
$1.08
$1.25
$0.50
$0.75
$1.00
$1.25
$1.50
LTM Mar‐2012 2012 2013 2014
Earnings per Sha
re
I. May 2012 Investor Day Presentation II. Wall Street Expects Company to Dramatically Miss Estimates
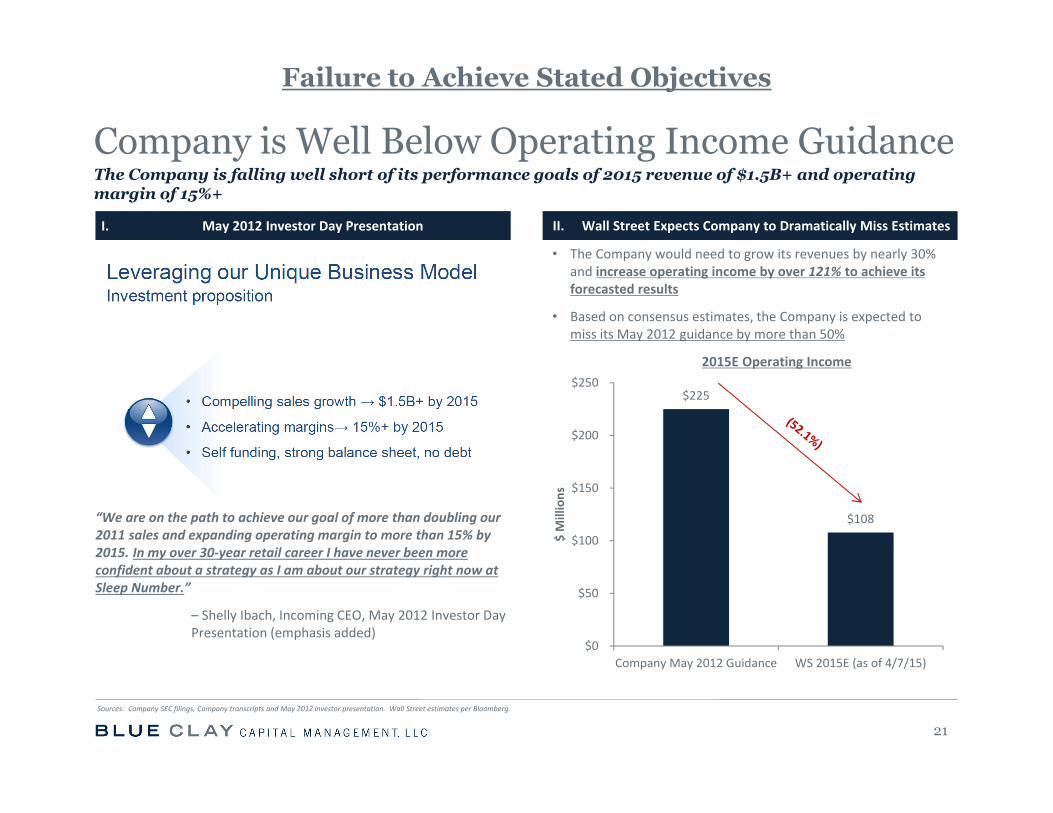
“We are on the path to achieve our goal of more than doubling our 2011 sales and expanding operating margin to more than 15% by 2015. In my over 30‐year retail career I have never been more confident about a strategy as I am about our strategy right now at Sleep Number.”
– Shelly Ibach, Incoming CEO, May 2012 Investor Day Presentation (emphasis added)
• The Company would need to grow its revenues by nearly 30% and increase operating income by over 121% to achieve its forecasted results
• Based on consensus estimates, the Company is expected to miss its May 2012 guidance by more than 50%
2015E Operating Income
$225
$108
$0
$50
$100
$150
$200
$250
Company May 2012 Guidance WS 2015E (as of 4/7/15)
$ Millions
The Company is falling well short of its performance goals of 2015 revenue of $1.5B+ and operating margin of 15%+
21
Company is Well Below Operating Income Guidance
Sources: Company SEC filings, Company transcripts and May 2012 investor presentation. Wall Street estimates per Bloomberg.
Failure to Achieve Stated Objectives
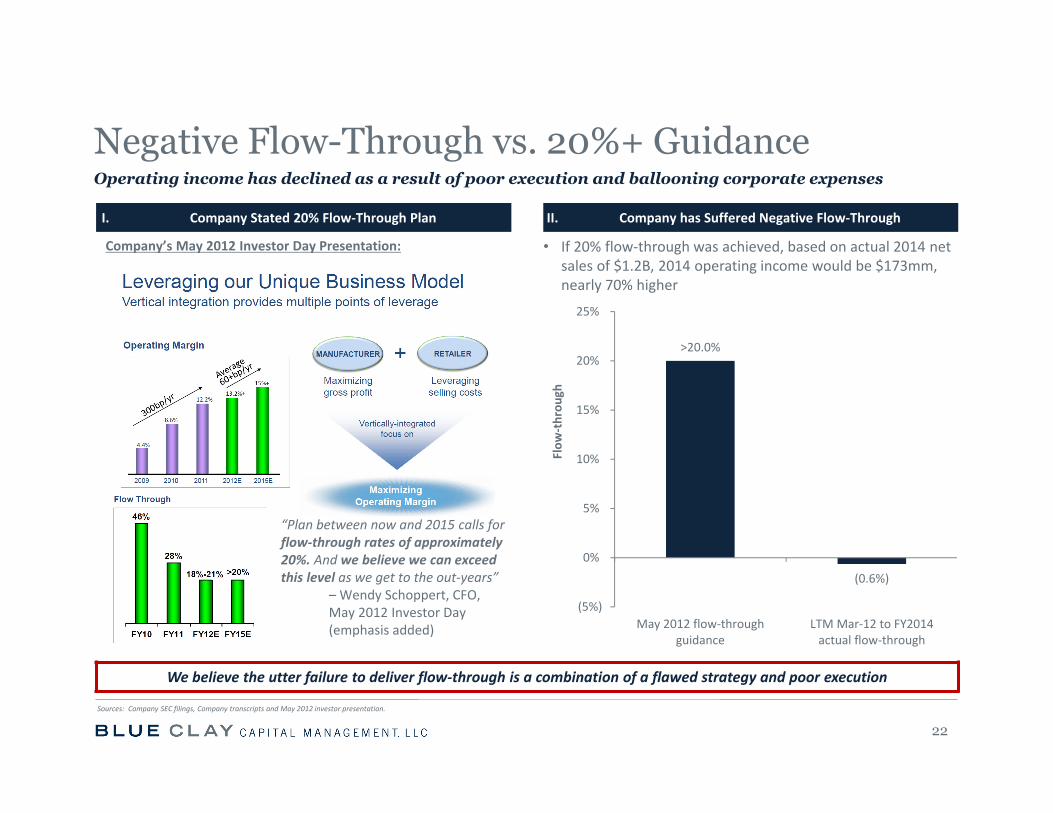
I. Company Stated 20% Flow‐Through Plan II. Company has Suffered Negative Flow‐Through
Company’s May 2012 Investor Day Presentation: • If 20% flow‐through was achieved, based on actual 2014 net sales of $1.2B, 2014 operating income would be $173mm, nearly 70% higher
We believe the utter failure to deliver flow‐through is a combination of a flawed strategy and poor execution
22
Negative Flow-Through vs. 20%+ GuidanceOperating income has declined as a result of poor execution and ballooning corporate expenses
“Plan between now and 2015 calls for flow‐through rates of approximately 20%. And we believe we can exceed this level as we get to the out‐years”
–Wendy Schoppert, CFO, May 2012 Investor Day (emphasis added)
>20.0%
(0.6%)
(5%)
0%
5%
10%
15%
20%
25%
May 2012 flow‐throughguidance
LTM Mar‐12 to FY2014actual flow‐through
Flow
‐throu
gh
Sources: Company SEC filings, Company transcripts and May 2012 investor presentation.
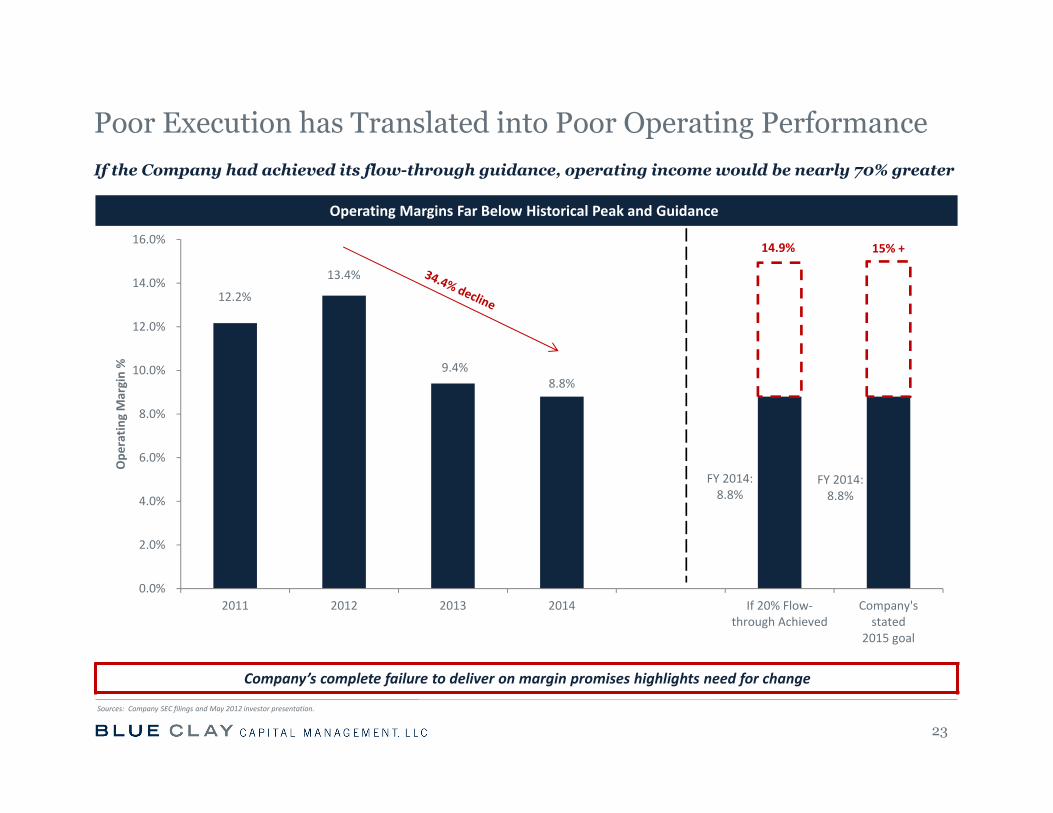
Operating Margins Far Below Historical Peak and Guidance
Company’s complete failure to deliver on margin promises highlights need for change
12.2%
13.4%
9.4% 8.8%
FY 2014:8.8%
FY 2014:8.8%
14.9% 15% +
0.0%
2.0%
4.0%
6.0%
8.0%
10.0%
12.0%
14.0%
16.0%
2011 2012 2013 2014 If 20% Flow‐through Achieved
Company'sstated
2015 goal
Ope
ratin
g Margin %
23
Poor Execution has Translated into Poor Operating Performance
Sources: Company SEC filings and May 2012 investor presentation.
If the Company had achieved its flow-through guidance, operating income would be nearly 70% greater
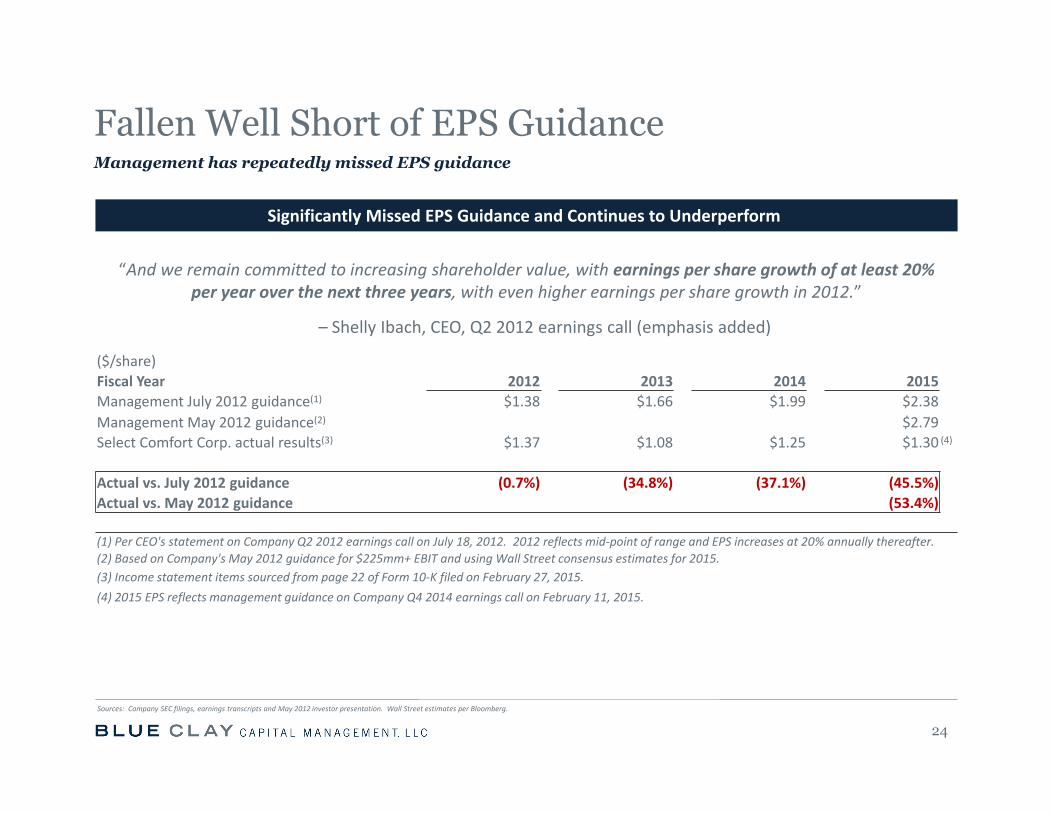
Significantly Missed EPS Guidance and Continues to Underperform
“And we remain committed to increasing shareholder value, with earnings per share growth of at least 20% per year over the next three years, with even higher earnings per share growth in 2012.”
– Shelly Ibach, CEO, Q2 2012 earnings call (emphasis added)
Management has repeatedly missed EPS guidance
24
Fallen Well Short of EPS Guidance
Sources: Company SEC filings, earnings transcripts and May 2012 investor presentation. Wall Street estimates per Bloomberg.
($/share)Fiscal Year 2012 2013 2014 2015Management July 2012 guidance(1) $1.38 $1.66 $1.99 $2.38 Management May 2012 guidance(2) $2.79 Select Comfort Corp. actual results(3) $1.37 $1.08 $1.25 $1.30 (4)
Actual vs. July 2012 guidance (0.7%) (34.8%) (37.1%) (45.5%)Actual vs. May 2012 guidance (53.4%)
(1) Per CEO's statement on Company Q2 2012 earnings call on July 18, 2012. 2012 reflects mid‐point of range and EPS increases at 20% annually thereafter.(2) Based on Company's May 2012 guidance for $225mm+ EBIT and using Wall Street consensus estimates for 2015.(3) Income statement items sourced from page 22 of Form 10‐K filed on February 27, 2015. (4) 2015 EPS reflects management guidance on Company Q4 2014 earnings call on February 11, 2015.
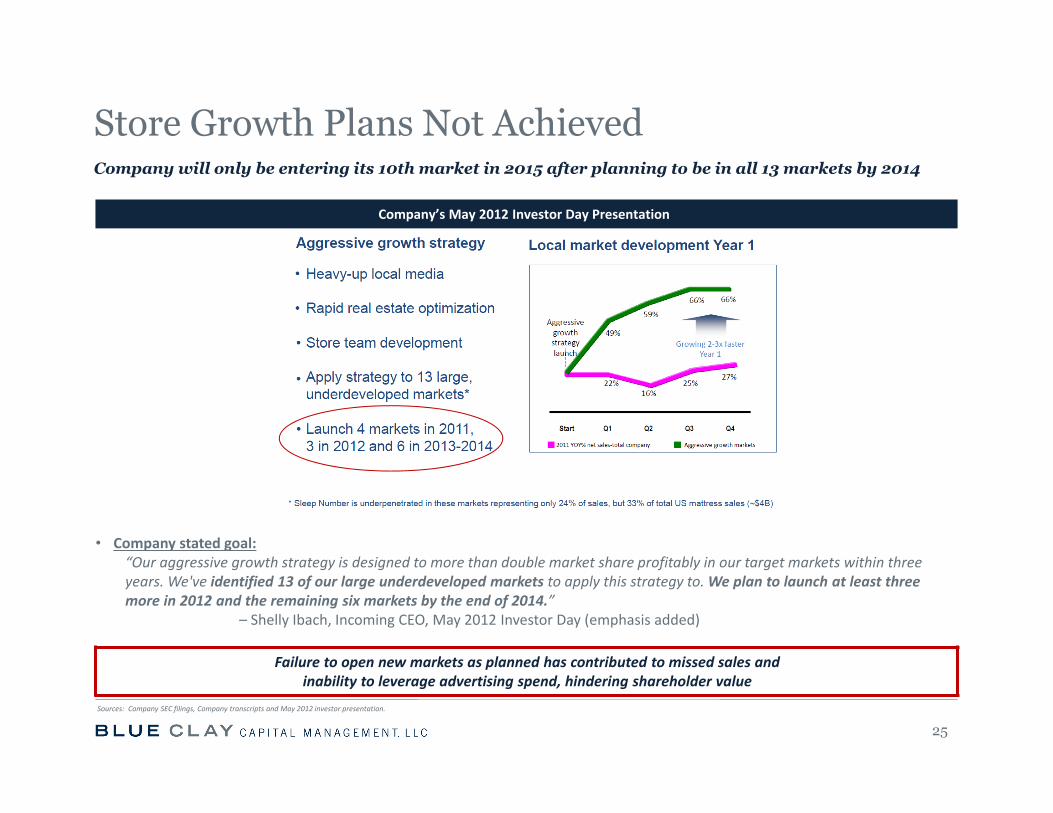
Company’s May 2012 Investor Day Presentation
• Company stated goal:“Our aggressive growth strategy is designed to more than double market share profitably in our target markets within three years. We've identified 13 of our large underdeveloped markets to apply this strategy to. We plan to launch at least three more in 2012 and the remaining six markets by the end of 2014.”
– Shelly Ibach, Incoming CEO, May 2012 Investor Day (emphasis added)Occurring
Failure to open new markets as planned has contributed to missed sales and inability to leverage advertising spend, hindering shareholder value
25
Store Growth Plans Not Achieved
Sources: Company SEC filings, Company transcripts and May 2012 investor presentation.
Company will only be entering its 10th market in 2015 after planning to be in all 13 markets by 2014tore Growth Plan Not
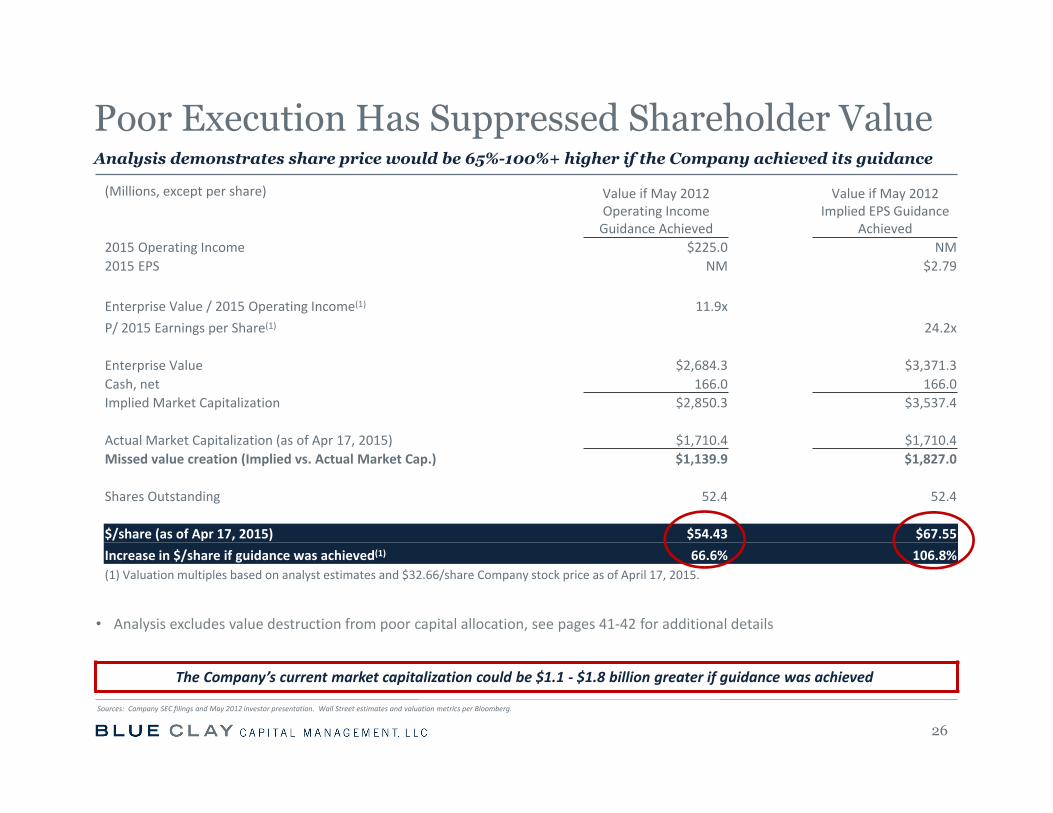
• Analysis excludes value destruction from poor capital allocation, see pages 41‐42 for additional details
The Company’s current market capitalization could be $1.1 ‐ $1.8 billion greater if guidance was achieved
(Millions, except per share) Value if May 2012 Operating Income Guidance Achieved
Value if May 2012 Implied EPS Guidance
Achieved2015 Operating Income $225.0 NM2015 EPS NM $2.79
Enterprise Value / 2015 Operating Income(1) 11.9xP/ 2015 Earnings per Share(1) 24.2x
Enterprise Value $2,684.3 $3,371.3 Cash, net 166.0 166.0 Implied Market Capitalization $2,850.3 $3,537.4
Actual Market Capitalization (as of Apr 17, 2015) $1,710.4 $1,710.4 Missed value creation (Implied vs. Actual Market Cap.) $1,139.9 $1,827.0
Shares Outstanding 52.4 52.4
$/share (as of Apr 17, 2015) $54.43 $67.55 Increase in $/share if guidance was achieved(1) 66.6% 106.8% (1) Valuation multiples based on analyst estimates and $32.66/share Company stock price as of April 17, 2015.
Analysis demonstrates share price would be 65%-100%+ higher if the Company achieved its guidance
26
Poor Execution Has Suppressed Shareholder Value
Sources: Company SEC filings and May 2012 investor presentation. Wall Street estimates and valuation metrics per Bloomberg.
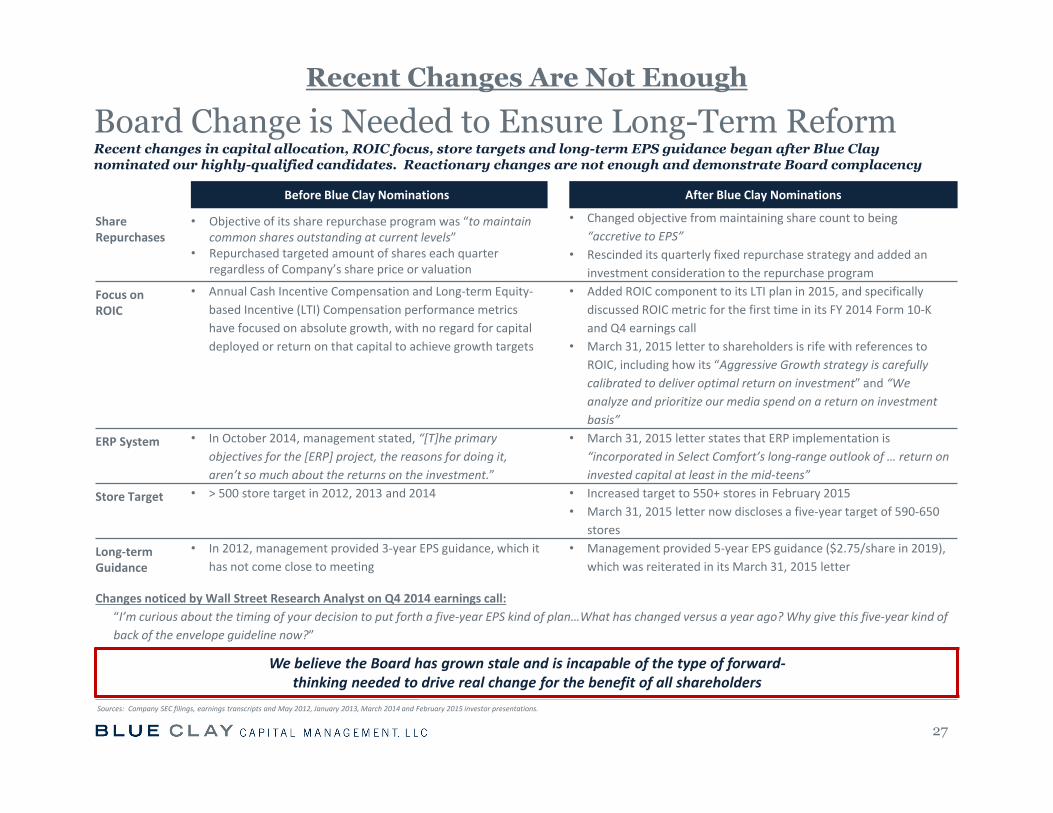
Before Blue Clay Nominations After Blue Clay Nominations
Share Repurchases
• Objective of its share repurchase program was “to maintain common shares outstanding at current levels”
• Repurchased targeted amount of shares each quarter regardless of Company’s share price or valuation
• Changed objective from maintaining share count to being “accretive to EPS”
• Rescinded its quarterly fixed repurchase strategy and added an investment consideration to the repurchase program
Focus on ROIC
• Annual Cash Incentive Compensation and Long‐term Equity‐based Incentive (LTI) Compensation performance metrics have focused on absolute growth, with no regard for capital deployed or return on that capital to achieve growth targets
• Added ROIC component to its LTI plan in 2015, and specifically discussed ROIC metric for the first time in its FY 2014 Form 10‐K and Q4 earnings call
• March 31, 2015 letter to shareholders is rife with references to ROIC, including how its “Aggressive Growth strategy is carefully calibrated to deliver optimal return on investment” and “We analyze and prioritize our media spend on a return on investment basis”
ERP System • In October 2014, management stated, “[T]he primary objectives for the [ERP] project, the reasons for doing it, aren’t so much about the returns on the investment.”
• March 31, 2015 letter states that ERP implementation is “incorporated in Select Comfort’s long‐range outlook of … return on invested capital at least in the mid‐teens”
Store Target • > 500 store target in 2012, 2013 and 2014 • Increased target to 550+ stores in February 2015• March 31, 2015 letter now discloses a five‐year target of 590‐650
stores
Long‐term Guidance
• In 2012, management provided 3‐year EPS guidance, which it has not come close to meeting
• Management provided 5‐year EPS guidance ($2.75/share in 2019), which was reiterated in its March 31, 2015 letter
Changes noticed by Wall Street Research Analyst on Q4 2014 earnings call:“I’m curious about the timing of your decision to put forth a five‐year EPS kind of plan…What has changed versus a year ago? Why give this five‐year kind of back of the envelope guideline now?”
We believe the Board has grown stale and is incapable of the type of forward‐thinking needed to drive real change for the benefit of all shareholders
Recent changes in capital allocation, ROIC focus, store targets and long-term EPS guidance began after Blue Clay nominated our highly-qualified candidates. Reactionary changes are not enough and demonstrate Board complacency
27
Board Change is Needed to Ensure Long-Term Reform
Sources: Company SEC filings, earnings transcripts and May 2012, January 2013, March 2014 and February 2015 investor presentations.
Recent Changes Are Not Enough
III. Blue Clay Nominees are Better Qualified to Drive Change
28
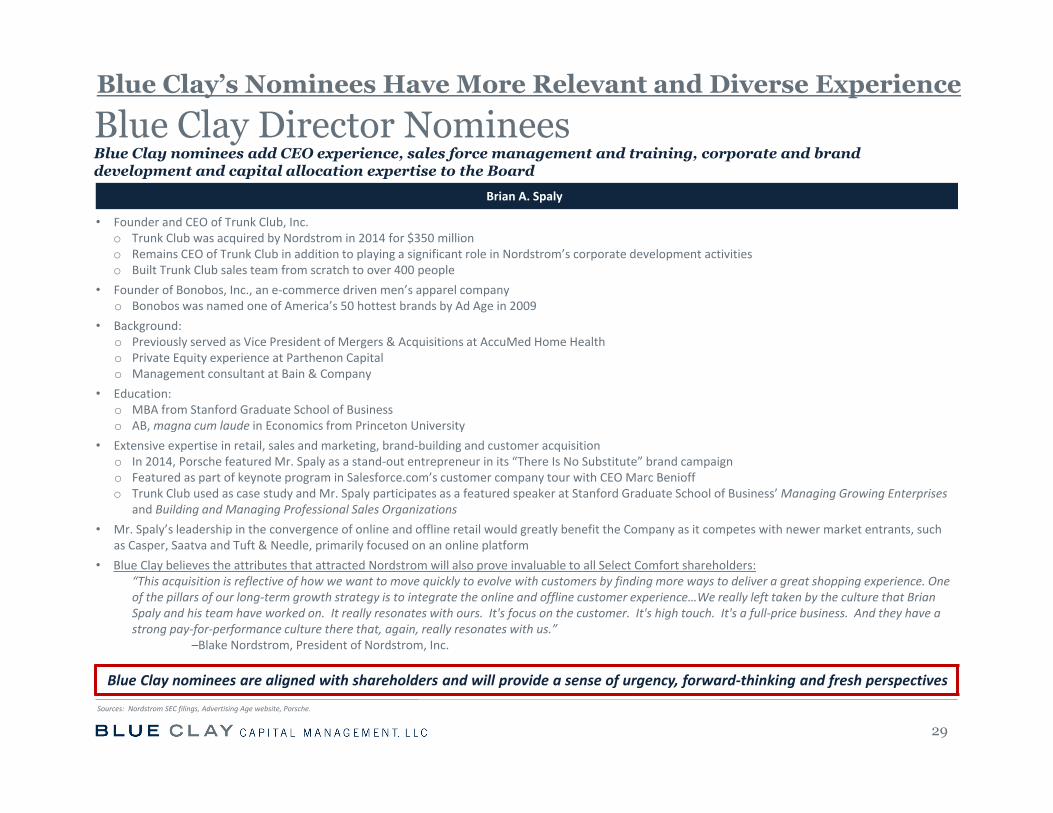
Blue Clay Director NomineesBlue Clay nominees add CEO experience, sales force management and training, corporate and brand development and capital allocation expertise to the Board
29
Brian A. Spaly
• Founder and CEO of Trunk Club, Inc.o Trunk Club was acquired by Nordstrom in 2014 for $350 milliono Remains CEO of Trunk Club in addition to playing a significant role in Nordstrom’s corporate development activitieso Built Trunk Club sales team from scratch to over 400 people
• Founder of Bonobos, Inc., an e‐commerce driven men’s apparel companyo Bonobos was named one of America’s 50 hottest brands by Ad Age in 2009
• Background:o Previously served as Vice President of Mergers & Acquisitions at AccuMed Home Healtho Private Equity experience at Parthenon Capitalo Management consultant at Bain & Company
• Education:o MBA from Stanford Graduate School of Businesso AB, magna cum laude in Economics from Princeton University
• Extensive expertise in retail, sales and marketing, brand‐building and customer acquisitiono In 2014, Porsche featured Mr. Spaly as a stand‐out entrepreneur in its “There Is No Substitute” brand campaigno Featured as part of keynote program in Salesforce.com’s customer company tour with CEO Marc Benioffo Trunk Club used as case study and Mr. Spaly participates as a featured speaker at Stanford Graduate School of Business’ Managing Growing Enterprises
and Building and Managing Professional Sales Organizations• Mr. Spaly’s leadership in the convergence of online and offline retail would greatly benefit the Company as it competes with newer market entrants, such
as Casper, Saatva and Tuft & Needle, primarily focused on an online platform• Blue Clay believes the attributes that attracted Nordstrom will also prove invaluable to all Select Comfort shareholders:
“This acquisition is reflective of how we want to move quickly to evolve with customers by finding more ways to deliver a great shopping experience. One of the pillars of our long‐term growth strategy is to integrate the online and offline customer experience…We really left taken by the culture that Brian Spaly and his team have worked on. It really resonates with ours. It's focus on the customer. It's high touch. It's a full‐price business. And they have a strong pay‐for‐performance culture there that, again, really resonates with us.”
–Blake Nordstrom, President of Nordstrom, Inc.
Blue Clay nominees are aligned with shareholders and will provide a sense of urgency, forward‐thinking and fresh perspectives
Blue Clay’s Nominees Have More Relevant and Diverse Experience
Sources: Nordstrom SEC filings, Advertising Age website, Porsche.
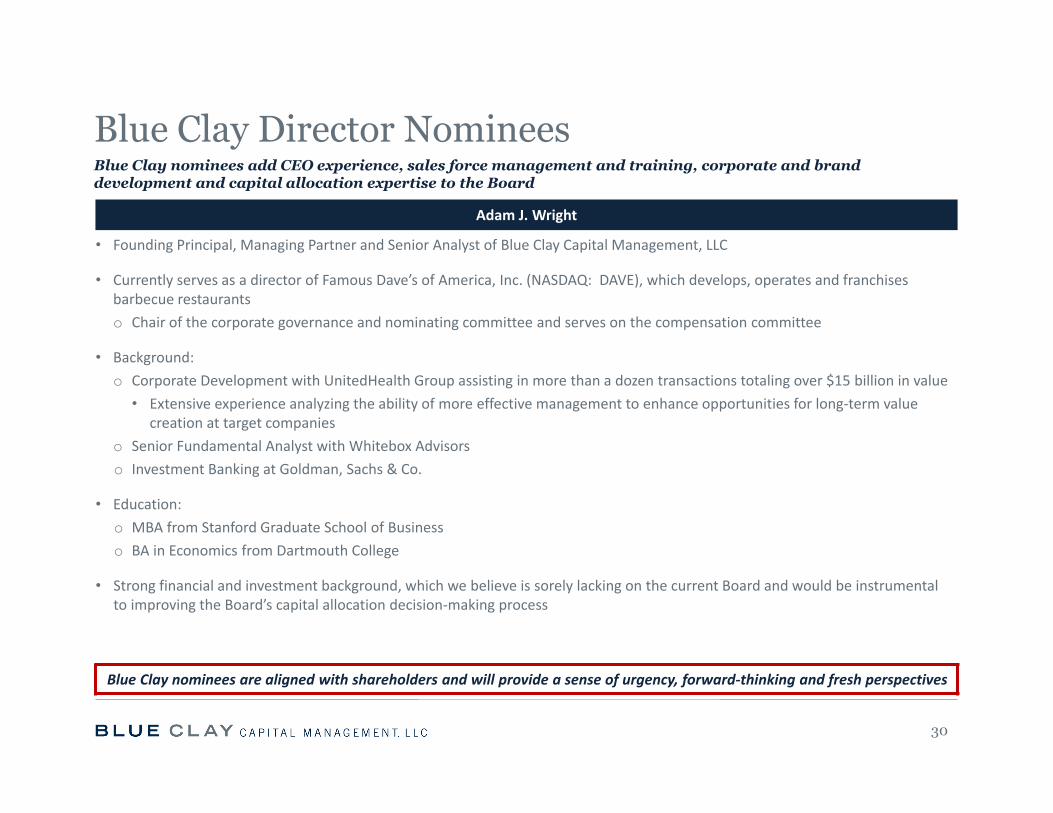
Blue Clay Director NomineesBlue Clay nominees add CEO experience, sales force management and training, corporate and brand development and capital allocation expertise to the Board
30
Adam J. Wright
• Founding Principal, Managing Partner and Senior Analyst of Blue Clay Capital Management, LLC
• Currently serves as a director of Famous Dave’s of America, Inc. (NASDAQ: DAVE), which develops, operates and franchises barbecue restaurantso Chair of the corporate governance and nominating committee and serves on the compensation committee
• Background:o Corporate Development with UnitedHealth Group assisting in more than a dozen transactions totaling over $15 billion in value• Extensive experience analyzing the ability of more effective management to enhance opportunities for long‐term value
creation at target companieso Senior Fundamental Analyst with Whitebox Advisorso Investment Banking at Goldman, Sachs & Co.
• Education:o MBA from Stanford Graduate School of Businesso BA in Economics from Dartmouth College
• Strong financial and investment background, which we believe is sorely lacking on the current Board and would be instrumentalto improving the Board’s capital allocation decision‐making process
Blue Clay nominees are aligned with shareholders and will provide a sense of urgency, forward‐thinking and fresh perspectives
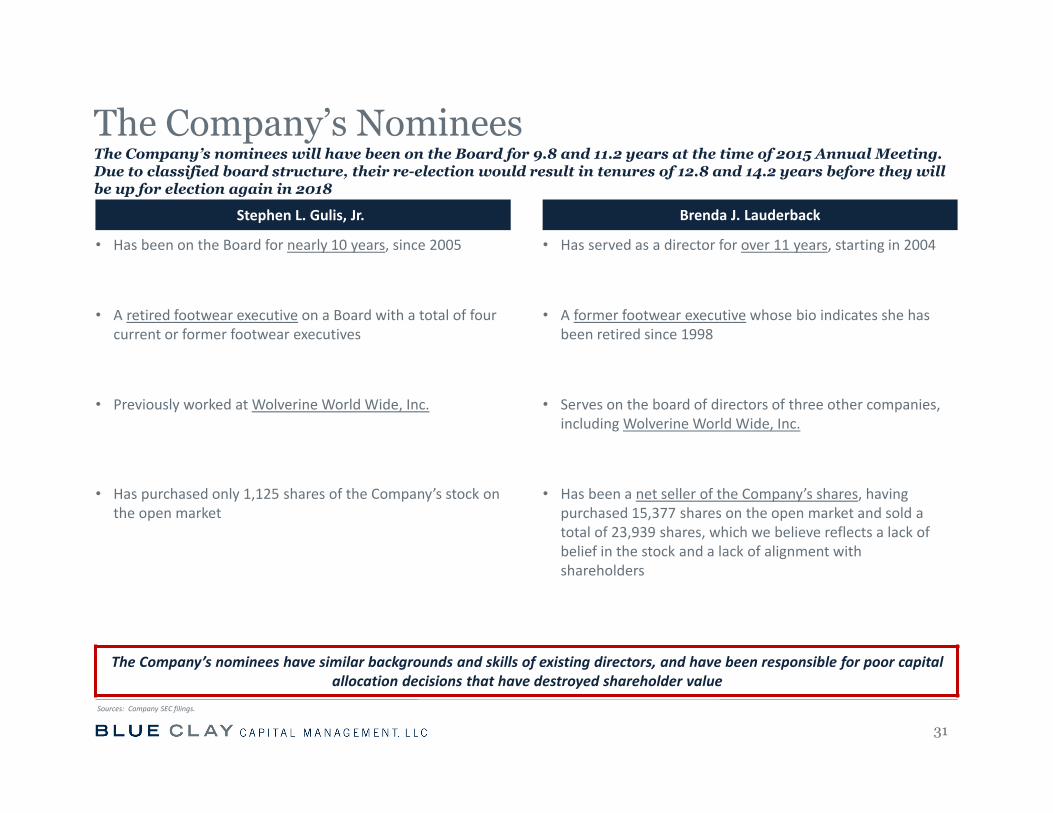
The Company’s NomineesThe Company’s nominees will have been on the Board for 9.8 and 11.2 years at the time of 2015 Annual Meeting. Due to classified board structure, their re-election would result in tenures of 12.8 and 14.2 years before they will be up for election again in 2018
31
Stephen L. Gulis, Jr. Brenda J. Lauderback
• Has been on the Board for nearly 10 years, since 2005
• A retired footwear executive on a Board with a total of four current or former footwear executives
• Previously worked at Wolverine World Wide, Inc.
• Has purchased only 1,125 shares of the Company’s stock on the open market
• Has served as a director for over 11 years, starting in 2004
• A former footwear executive whose bio indicates she has been retired since 1998
• Serves on the board of directors of three other companies, including Wolverine World Wide, Inc.
• Has been a net seller of the Company’s shares, having purchased 15,377 shares on the open market and sold a total of 23,939 shares, which we believe reflects a lack of belief in the stock and a lack of alignment with shareholders
The Company’s nominees have similar backgrounds and skills of existing directors, and have been responsible for poor capital allocation decisions that have destroyed shareholder value
Sources: Company SEC filings.
32
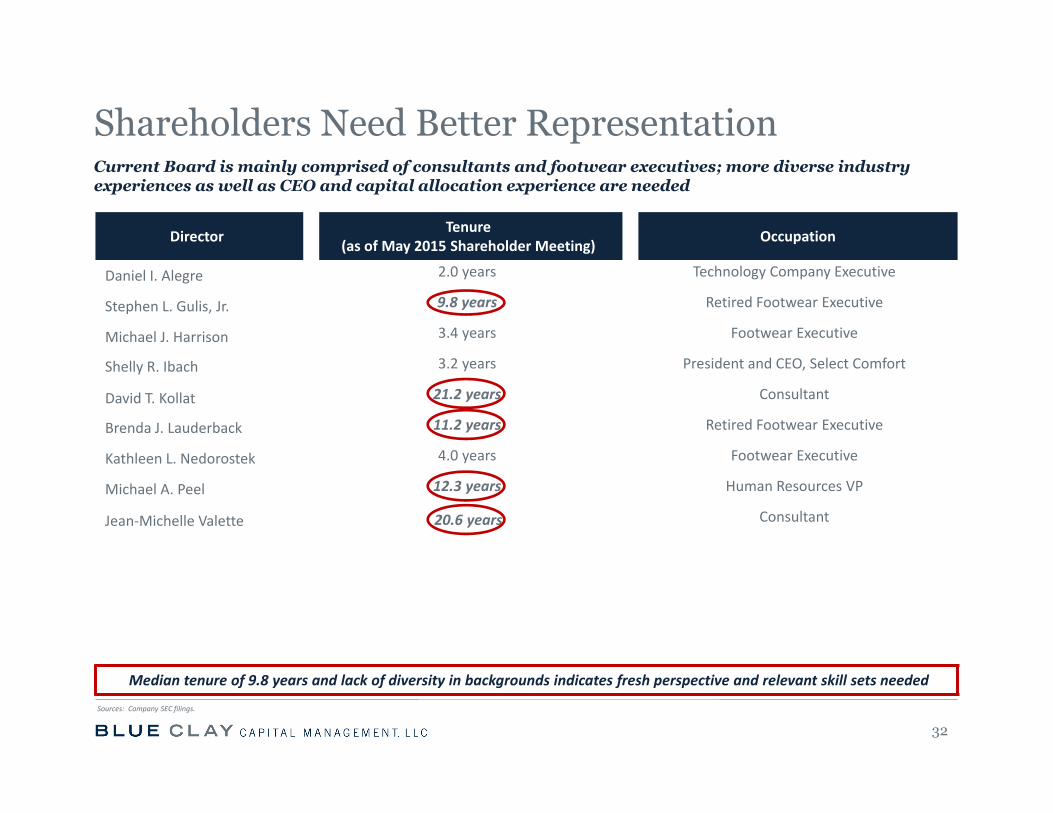
Director Tenure (as of May 2015 Shareholder Meeting) Occupation
Daniel I. Alegre 2.0 years Technology Company Executive
Stephen L. Gulis, Jr. 9.8 years Retired Footwear Executive
Michael J. Harrison 3.4 years Footwear Executive
Shelly R. Ibach 3.2 years President and CEO, Select Comfort
David T. Kollat 21.2 years Consultant
Brenda J. Lauderback 11.2 years Retired Footwear Executive
Kathleen L. Nedorostek 4.0 years Footwear Executive
Michael A. Peel 12.3 years Human Resources VP
Jean‐Michelle Valette 20.6 years Consultant
Median tenure of 9.8 years and lack of diversity in backgrounds indicates fresh perspective and relevant skill sets needed
Shareholders Need Better RepresentationCurrent Board is mainly comprised of consultants and footwear executives; more diverse industry experiences as well as CEO and capital allocation experience are needed
Sources: Company SEC filings.
• Classified Board results in directors only being subject to re‐election by shareholders every three years and impedes shareholders’ ability to regularly and effectively evaluate the Board’s performance
• Directors may be removed only for cause
• Vacancies on the Board may be filled only by the directors
• Supermajority shareholder approval required for a sale of the Company that is not approved by 2/3 of the Board
• Supermajority shareholder approval required to amend this provision
Poor Corporate Governance Practices
33
Sources: Company SEC filings.
The current Board continues to sanction shareholder-unfriendly and outdated corporate governance
Incumbents’ Poor Corporate Governance, Excessive Tenure and Interlocks
We Believe the Board has Grown Stale and is Entrenched
34
• Median tenure of 9.8 years by the time of the 2015 Annual Meeting
• Two directors have been on the Board for more than 20 years, while three other directors have been on the Board for more than nine years
• Tellingly, in 2012, changed its position in its proxy statement regarding median Board tenure, from “if the median tenure of the Board exceeds 8.5 years…then one or more Directors will either not be re‐nominated or asked to resign from the Board” to “…then the Board may consider alternatives to achieve an appropriate balance of new perspectives and experienced directors on the Board over the ensuing years.” (emphasis added)
• We do not believe that the addition of Ms. Ibach and one new independent director to the Board since 2012 achieves an “appropriate balance,” and that further change on the Board is warranted to ensure new insight and a renewed commitment to enhancing shareholder value
Sources: Company SEC filings.
Fresh perspectives and forward-thinking urgently needed
Interlocking Directors Leads to Lack of Independent Thinking
35
• Board includes four current or retired footwear executives
• Interlocked directors comprise a majority of the current Board – current nominees Mr. Gulis and Ms. Lauderback, as well as Ms. Ibach, Mr. Kollat and Ms. Nedorostek
• Mr. Gulis previously worked at Wolverine World Wide – Ms. Lauderback and Mr. Kollat serve on the board of Wolverine World Wide
• Ms. Nedorostek currently works at Nine West Group, Ms. Lauderback’s former employer
• Ms. Lauderback (from 1982 to 1993) and Ms. Ibach (from 1982 to 2007) held senior positions (including sharing titles such as Merchandise Manager) at the same time within the Dayton Hudson Corporation (now Target Corporation) family of companies
We have serious concerns that this type of cronyism and overlap among board members fails to generate the vigorous board discussion needed to spur positive change for the benefit of shareholders
Sources: Company SEC filings, Bloomberg.
Majority of current Board is subject to interlocks
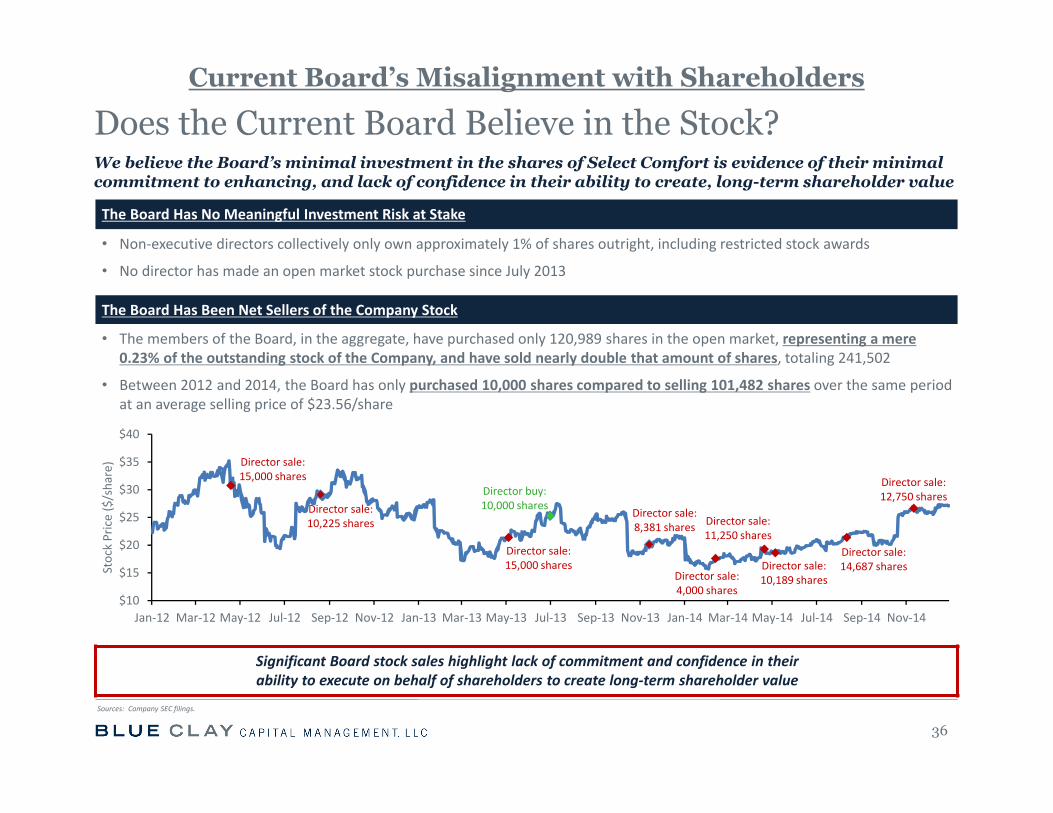
The Board Has No Meaningful Investment Risk at Stake
• Non‐executive directors collectively only own approximately 1% of shares outright, including restricted stock awards
• No director has made an open market stock purchase since July 2013
The Board Has Been Net Sellers of the Company Stock
• The members of the Board, in the aggregate, have purchased only 120,989 shares in the open market, representing a mere 0.23% of the outstanding stock of the Company, and have sold nearly double that amount of shares, totaling 241,502
• Between 2012 and 2014, the Board has only purchased 10,000 shares compared to selling 101,482 shares over the same period at an average selling price of $23.56/share
Significant Board stock sales highlight lack of commitment and confidence in their ability to execute on behalf of shareholders to create long‐term shareholder value
$10
$15
$20
$25
$30
$35
$40
Jan‐12 Mar‐12 May‐12 Jul‐12 Sep‐12 Nov‐12 Jan‐13 Mar‐13 May‐13 Jul‐13 Sep‐13 Nov‐13 Jan‐14 Mar‐14 May‐14 Jul‐14 Sep‐14 Nov‐14
Stock Price ($/share)
Does the Current Board Believe in the Stock?
36
We believe the Board’s minimal investment in the shares of Select Comfort is evidence of their minimal commitment to enhancing, and lack of confidence in their ability to create, long-term shareholder value
Current Board’s Misalignment with Shareholders
Sources: Company SEC filings.
Director buy: 10,000 shares
Director sale: 11,250 shares
Director sale: 15,000 shares
Director sale: 15,000 shares Director sale:
12,750 shares
Director sale: 10,189 shares
Director sale: 14,687 shares
Director sale: 4,000 shares
Director sale: 8,381 shares
Director sale: 10,225 shares
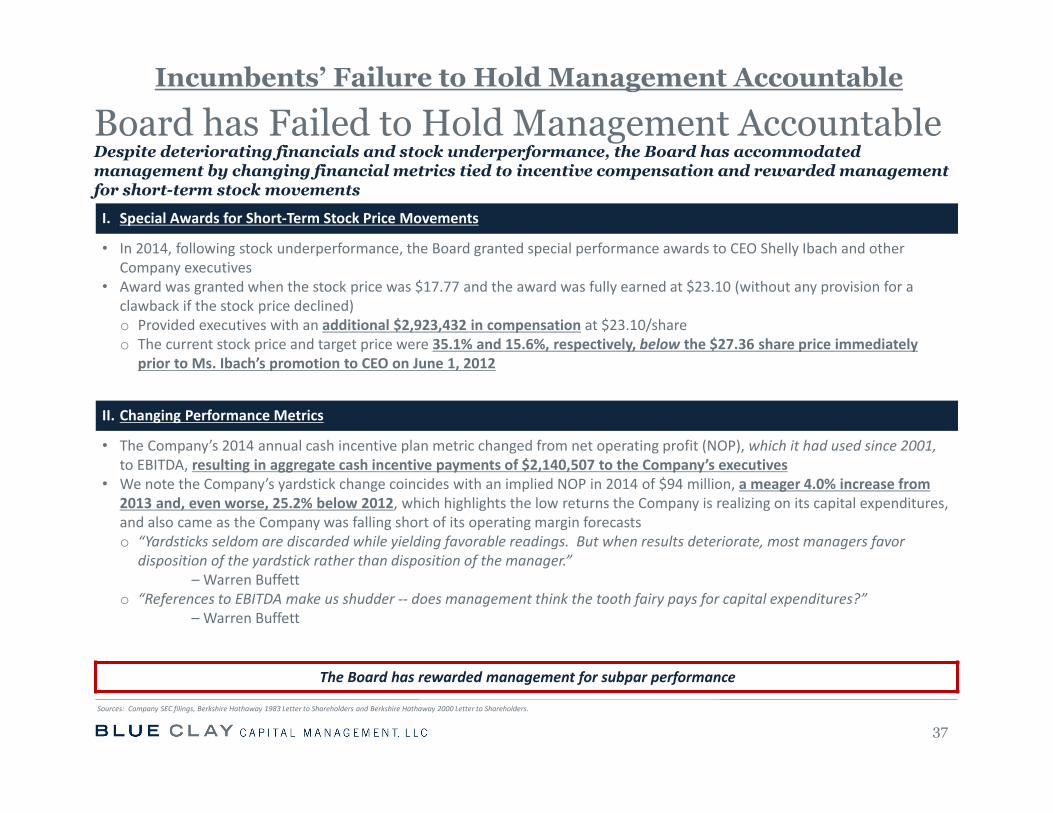
Board has Failed to Hold Management AccountableDespite deteriorating financials and stock underperformance, the Board has accommodated management by changing financial metrics tied to incentive compensation and rewarded management for short-term stock movements
37
I. Special Awards for Short‐Term Stock Price Movements
• In 2014, following stock underperformance, the Board granted special performance awards to CEO Shelly Ibach and other Company executives
• Award was granted when the stock price was $17.77 and the award was fully earned at $23.10 (without any provision for a clawback if the stock price declined)o Provided executives with an additional $2,923,432 in compensation at $23.10/share o The current stock price and target price were 35.1% and 15.6%, respectively, below the $27.36 share price immediately
prior to Ms. Ibach’s promotion to CEO on June 1, 2012
II. Changing Performance Metrics
• The Company’s 2014 annual cash incentive plan metric changed from net operating profit (NOP), which it had used since 2001,to EBITDA, resulting in aggregate cash incentive payments of $2,140,507 to the Company’s executives
• We note the Company’s yardstick change coincides with an implied NOP in 2014 of $94 million, a meager 4.0% increase from 2013 and, even worse, 25.2% below 2012, which highlights the low returns the Company is realizing on its capital expenditures, and also came as the Company was falling short of its operating margin forecastso “Yardsticks seldom are discarded while yielding favorable readings. But when results deteriorate, most managers favor
disposition of the yardstick rather than disposition of the manager.”– Warren Buffett
o “References to EBITDA make us shudder ‐‐ does management think the tooth fairy pays for capital expenditures?”– Warren Buffett
The Board has rewarded management for subpar performance
Incumbents’ Failure to Hold Management Accountable
Sources: Company SEC filings, Berkshire Hathaway 1983 Letter to Shareholders and Berkshire Hathaway 2000 Letter to Shareholders.
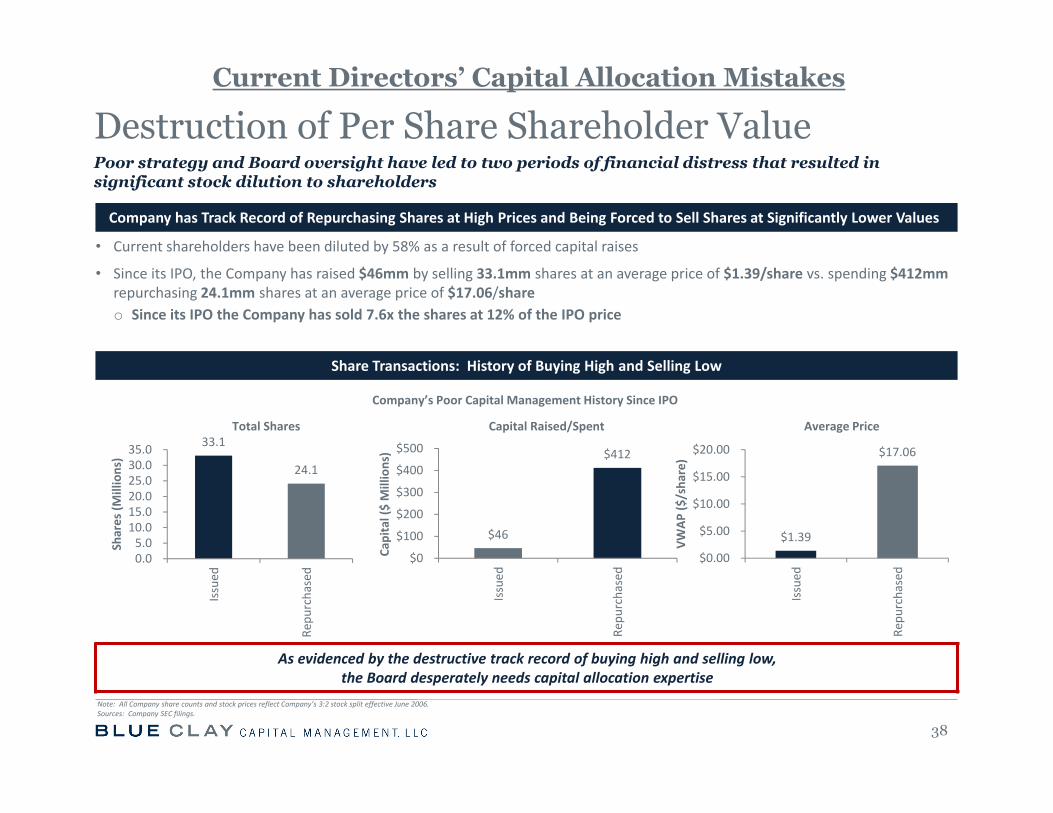
Company has Track Record of Repurchasing Shares at High Prices and Being Forced to Sell Shares at Significantly Lower Values
• Current shareholders have been diluted by 58% as a result of forced capital raises
• Since its IPO, the Company has raised $46mm by selling 33.1mm shares at an average price of $1.39/share vs. spending $412mmrepurchasing 24.1mm shares at an average price of $17.06/shareo Since its IPO the Company has sold 7.6x the shares at 12% of the IPO price
Share Transactions: History of Buying High and Selling Low
As evidenced by the destructive track record of buying high and selling low,the Board desperately needs capital allocation expertise
$1.39
$17.06
$0.00
$5.00
$10.00
$15.00
$20.00
Issued
Repu
rchased
VWAP
($/sha
re)
Poor strategy and Board oversight have led to two periods of financial distress that resulted in significant stock dilution to shareholders
38
Destruction of Per Share Shareholder Value
Note: All Company share counts and stock prices reflect Company’s 3:2 stock split effective June 2006.Sources: Company SEC filings.
Capital Raised/SpentTotal Shares Average Price
Company’s Poor Capital Management History Since IPO
$46
$412
$0
$100
$200
$300
$400
$500
Issued
Repu
rchased
Capital ($ Millions)
33.1
24.1
0.05.0
10.015.020.025.030.035.0
Issued
Repu
rchased
Shares (M
illions)
Current Directors’ Capital Allocation Mistakes
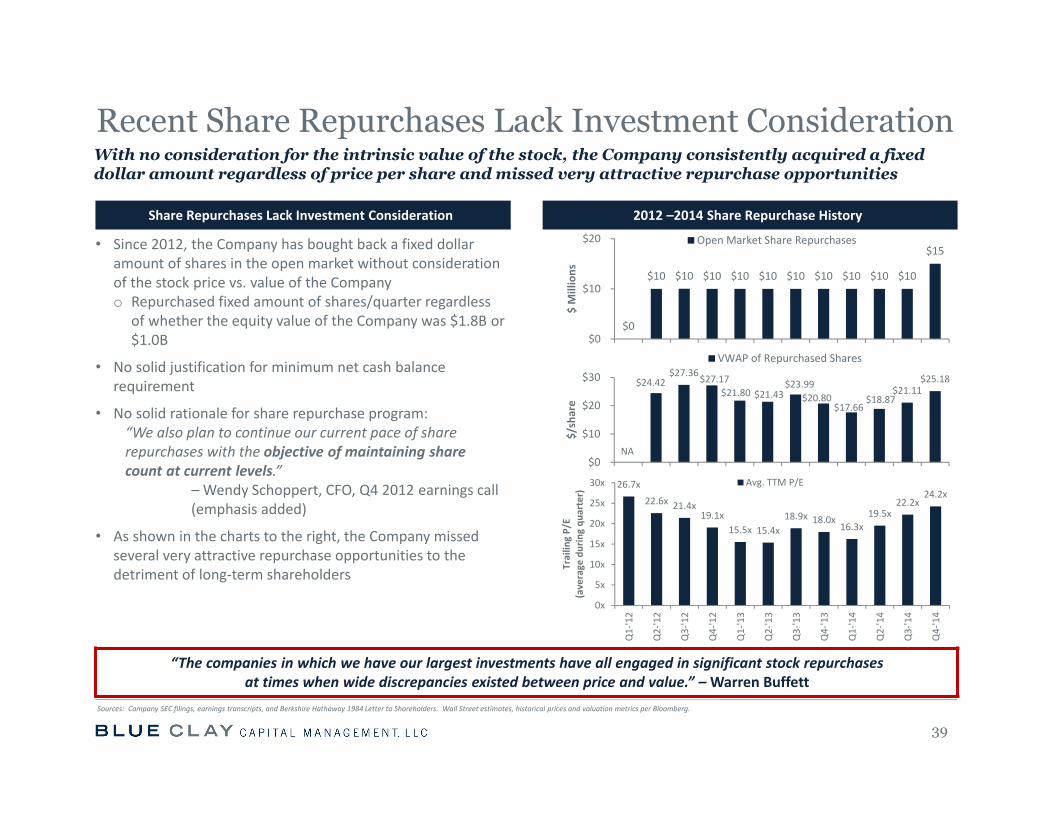
Share Repurchases Lack Investment Consideration 2012 –2014 Share Repurchase History
• Since 2012, the Company has bought back a fixed dollar amount of shares in the open market without consideration of the stock price vs. value of the Companyo Repurchased fixed amount of shares/quarter regardless
of whether the equity value of the Company was $1.8B or $1.0B
• No solid justification for minimum net cash balance requirement
• No solid rationale for share repurchase program: “We also plan to continue our current pace of share repurchases with the objective of maintaining share count at current levels.”
–Wendy Schoppert, CFO, Q4 2012 earnings call (emphasis added)
• As shown in the charts to the right, the Company missed several very attractive repurchase opportunities to the detriment of long‐term shareholders
“The companies in which we have our largest investments have all engaged in significant stock repurchasesat times when wide discrepancies existed between price and value.” –Warren Buffett
Recent Share Repurchases Lack Investment Consideration
39
With no consideration for the intrinsic value of the stock, the Company consistently acquired a fixed dollar amount regardless of price per share and missed very attractive repurchase opportunities
Sources: Company SEC filings, earnings transcripts, and Berkshire Hathaway 1984 Letter to Shareholders. Wall Street estimates, historical prices and valuation metrics per Bloomberg.
$0
$10 $10 $10 $10 $10 $10 $10 $10 $10 $10
$15
$0
$10
$20
$ Millions
Open Market Share Repurchases
$24.42 $27.36 $27.17
$21.80 $21.43 $23.99
$20.80 $17.66
$18.87 $21.11
$25.18
$0
$10
$20
$30
$/share
VWAP of Repurchased Shares
NA
26.7x
22.6x 21.4x19.1x
15.5x 15.4x18.9x 18.0x
16.3x19.5x
22.2x24.2x
0x
5x
10x
15x
20x
25x
30x
Q1‐'12
Q2‐'12
Q3‐'12
Q4‐'12
Q1‐'13
Q2‐'13
Q3‐'13
Q4‐'13
Q1‐'14
Q2‐'14
Q3‐'14
Q4‐'14
Trailin
g P/E
(average
during qu
arter)
Avg. TTM P/E
Board has Long History of Value Destructive DecisionsFive of the current Board members (including Mr. Gulis and Ms. Lauderback) were responsible for a series of moves that we believe forced the Company into financial distress in 2009
40
Disastrous 2006 – 2009 Capital Allocation Decisions
Aggressive increase in spending despite declining business, industry and economic fundamentals• SSS began to slow in Q2 2006 and turned negative in Q4 2006• Company moved into a new corporate headquarters and began a massive ERP system upgrade (which was subsequently
scrapped)
Chose to leverage business – went from net cash to net debt position• Levered with bank debt containing onerous covenants to fund an aggressive share repurchase program• From Q3 2006 – Q3 2007 repurchased $190mm of shares as same store sale comparisons continued to decline
Decisions led to financial distress and highly‐dilutive equity raises in 2009• The stock price declined 99.3% from its 2006 high of $27.72 to $0.19 in 2008• In May 2009, the Board approved a transaction to sell 50mm shares at $0.70/share (a 30% discount to the closing market
price the day prior to the Board’s approval)o Two independent board members with the largest direct shareholdings at the time voted against this onerous financing, and
are no longer directors todayo Fortunately shareholders rejected this transaction
• Company later sold 8.6mm shares at an average price of $3.44 to remedy bank debt covenant defaults
Decisions led to net closing of 101 stores from March 2008 through September 2011, and the impairment and abandonment of $27.6 million of the ERP system investment• Necessitated significant additional future capital expenditures to reopen stores and install the Company’s new ERP system
As evidenced by its destructive track record, the Board desperately needs capital allocation expertiseNote: All Company share counts and stock prices reflect Company’s 3:2 stock split effective June 2006.Sources: Company SEC filings, Bloomberg.
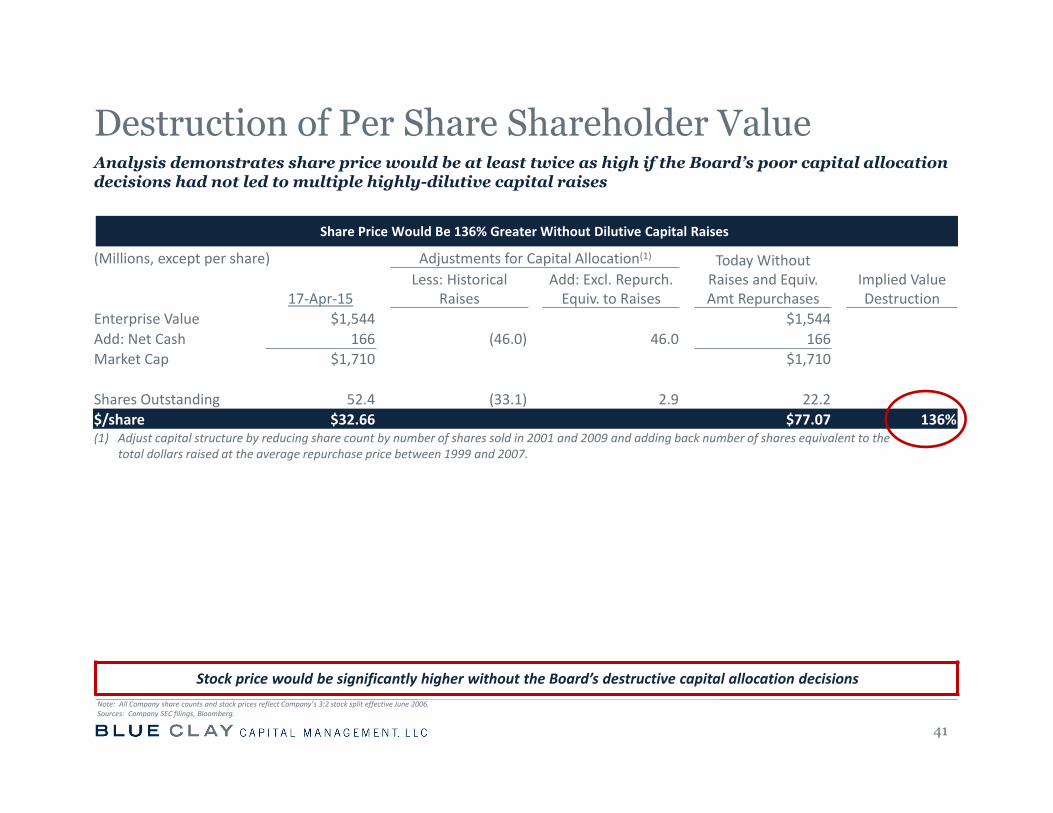
Share Price Would Be 136% Greater Without Dilutive Capital Raises
Stock price would be significantly higher without the Board’s destructive capital allocation decisions
Analysis demonstrates share price would be at least twice as high if the Board’s poor capital allocation decisions had not led to multiple highly-dilutive capital raises
41
Destruction of Per Share Shareholder Value
Note: All Company share counts and stock prices reflect Company’s 3:2 stock split effective June 2006.Sources: Company SEC filings, Bloomberg.
(Millions, except per share) Adjustments for Capital Allocation(1) Today Without Raises and Equiv. Amt Repurchases
Implied Value Destruction
Less: Historical Raises
Add: Excl. Repurch. Equiv. to Raises17‐Apr‐15
Enterprise Value $1,544 $1,544 Add: Net Cash 166 (46.0) 46.0 166 Market Cap $1,710 $1,710
Shares Outstanding 52.4 (33.1) 2.9 22.2 $/share $32.66 $77.07 136% (1) Adjust capital structure by reducing share count by number of shares sold in 2001 and 2009 and adding back number of shares equivalent to the
total dollars raised at the average repurchase price between 1999 and 2007.
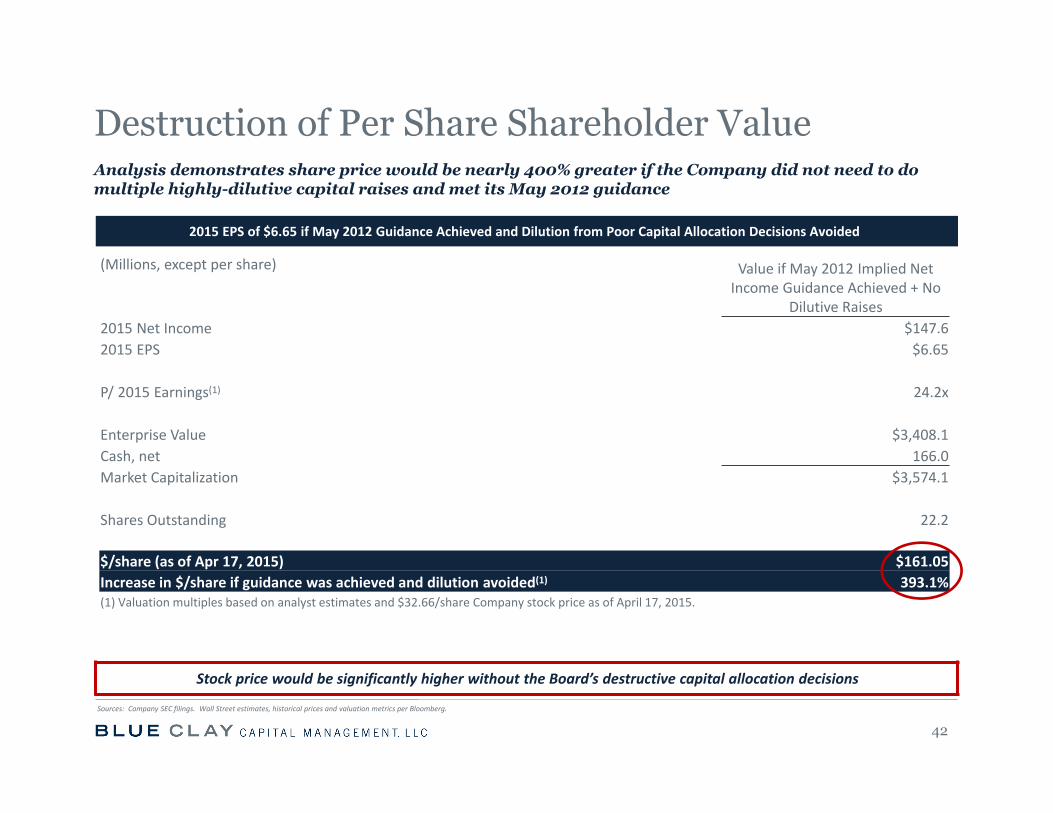
2015 EPS of $6.65 if May 2012 Guidance Achieved and Dilution from Poor Capital Allocation Decisions Avoided
Stock price would be significantly higher without the Board’s destructive capital allocation decisions
(Millions, except per share) Value if May 2012 Implied Net Income Guidance Achieved + No
Dilutive Raises2015 Net Income $147.6 2015 EPS $6.65
P/ 2015 Earnings(1) 24.2x
Enterprise Value $3,408.1 Cash, net 166.0 Market Capitalization $3,574.1
Shares Outstanding 22.2
$/share (as of Apr 17, 2015) $161.05 Increase in $/share if guidance was achieved and dilution avoided(1) 393.1% (1) Valuation multiples based on analyst estimates and $32.66/share Company stock price as of April 17, 2015.
Analysis demonstrates share price would be nearly 400% greater if the Company did not need to do multiple highly-dilutive capital raises and met its May 2012 guidance
42
Destruction of Per Share Shareholder Value
Sources: Company SEC filings. Wall Street estimates, historical prices and valuation metrics per Bloomberg.
IV. Blue Clay’s Analysis of the Future Opportunity
43
44
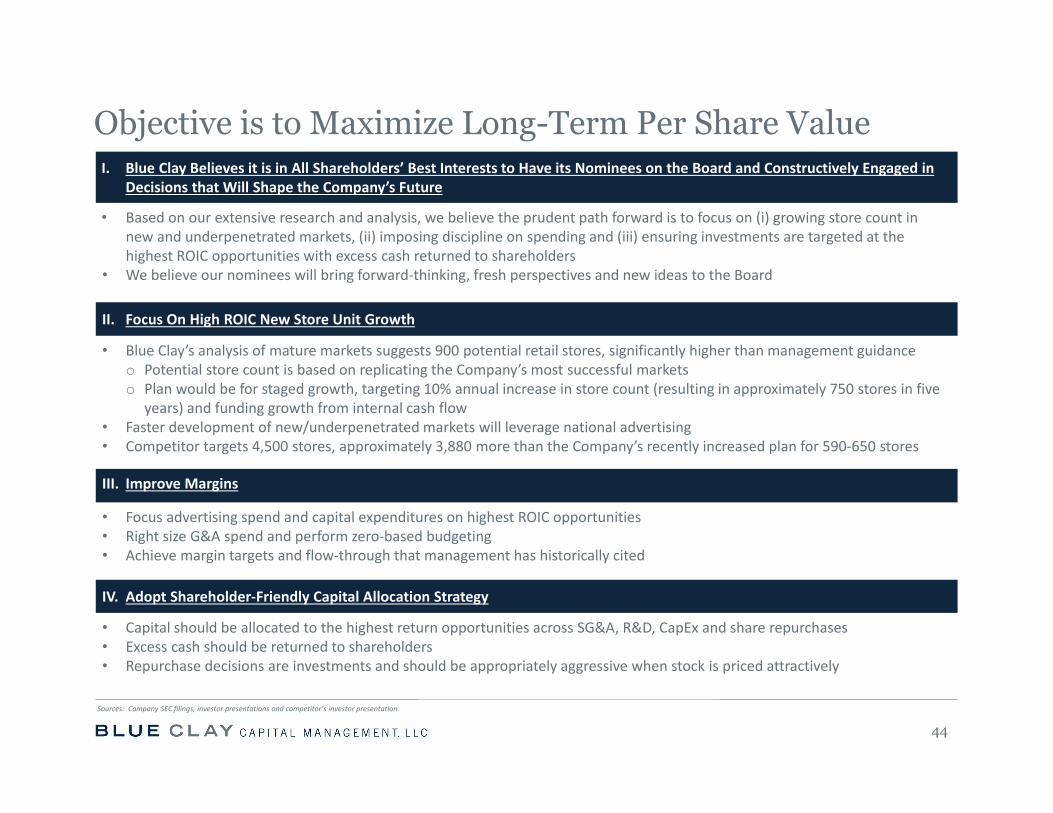
Objective is to Maximize Long-Term Per Share Value
Sources: Company SEC filings, investor presentations and competitor’s investor presentation.
I. Blue Clay Believes it is in All Shareholders’ Best Interests to Have its Nominees on the Board and Constructively Engaged in Decisions that Will Shape the Company’s Future
• Based on our extensive research and analysis, we believe the prudent path forward is to focus on (i) growing store count in new and underpenetrated markets, (ii) imposing discipline on spending and (iii) ensuring investments are targeted at the highest ROIC opportunities with excess cash returned to shareholders
• We believe our nominees will bring forward‐thinking, fresh perspectives and new ideas to the Board
II. Focus On High ROIC New Store Unit Growth
• Blue Clay’s analysis of mature markets suggests 900 potential retail stores, significantly higher than management guidanceo Potential store count is based on replicating the Company’s most successful marketso Plan would be for staged growth, targeting 10% annual increase in store count (resulting in approximately 750 stores in five
years) and funding growth from internal cash flow• Faster development of new/underpenetrated markets will leverage national advertising• Competitor targets 4,500 stores, approximately 3,880 more than the Company’s recently increased plan for 590‐650 stores
III. Improve Margins
• Focus advertising spend and capital expenditures on highest ROIC opportunities• Right size G&A spend and perform zero‐based budgeting• Achieve margin targets and flow‐through that management has historically cited
IV. Adopt Shareholder‐Friendly Capital Allocation Strategy
• Capital should be allocated to the highest return opportunities across SG&A, R&D, CapEx and share repurchases• Excess cash should be returned to shareholders• Repurchase decisions are investments and should be appropriately aggressive when stock is priced attractively
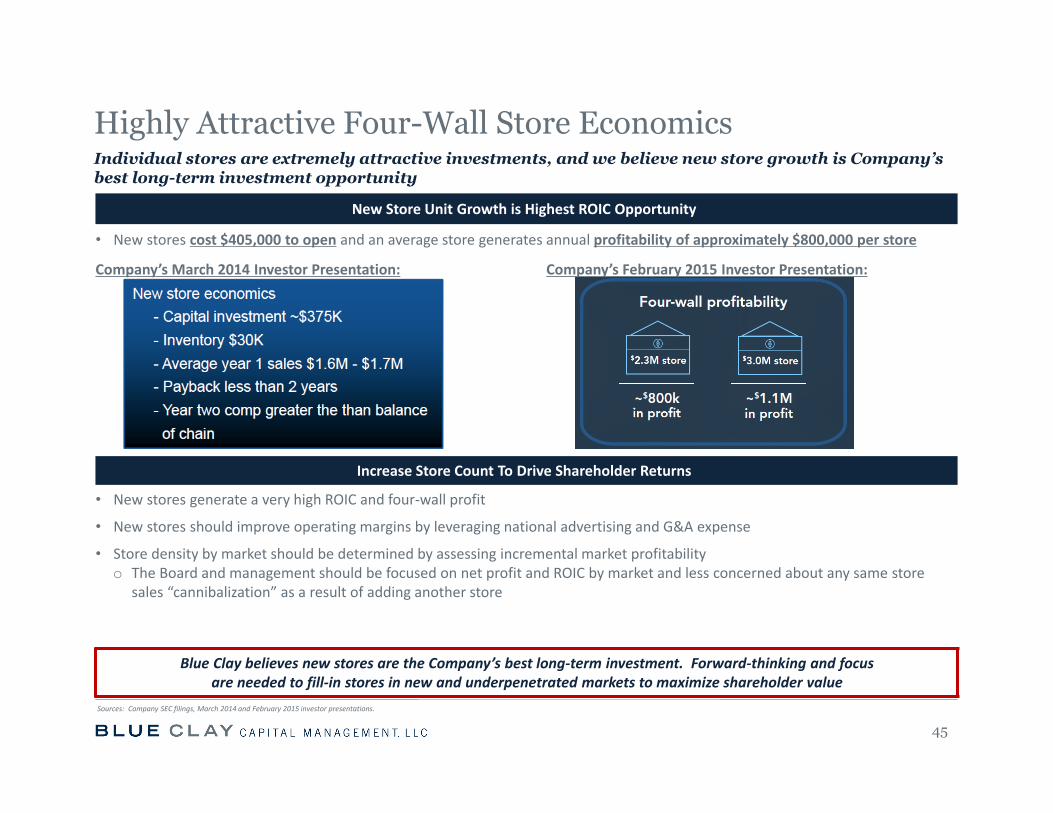
New Store Unit Growth is Highest ROIC Opportunity
• New stores cost $405,000 to open and an average store generates annual profitability of approximately $800,000 per store
Company’s March 2014 Investor Presentation: Company’s February 2015 Investor Presentation:
Increase Store Count To Drive Shareholder Returns
• New stores generate a very high ROIC and four‐wall profit
• New stores should improve operating margins by leveraging national advertising and G&A expense
• Store density by market should be determined by assessing incremental market profitability o The Board and management should be focused on net profit and ROIC by market and less concerned about any same store
sales “cannibalization” as a result of adding another store
Blue Clay believes new stores are the Company’s best long‐term investment. Forward‐thinking and focus are needed to fill‐in stores in new and underpenetrated markets to maximize shareholder value
Highly Attractive Four-Wall Store EconomicsIndividual stores are extremely attractive investments, and we believe new store growth is Company’s best long-term investment opportunity
45
Sources: Company SEC filings, March 2014 and February 2015 investor presentations.
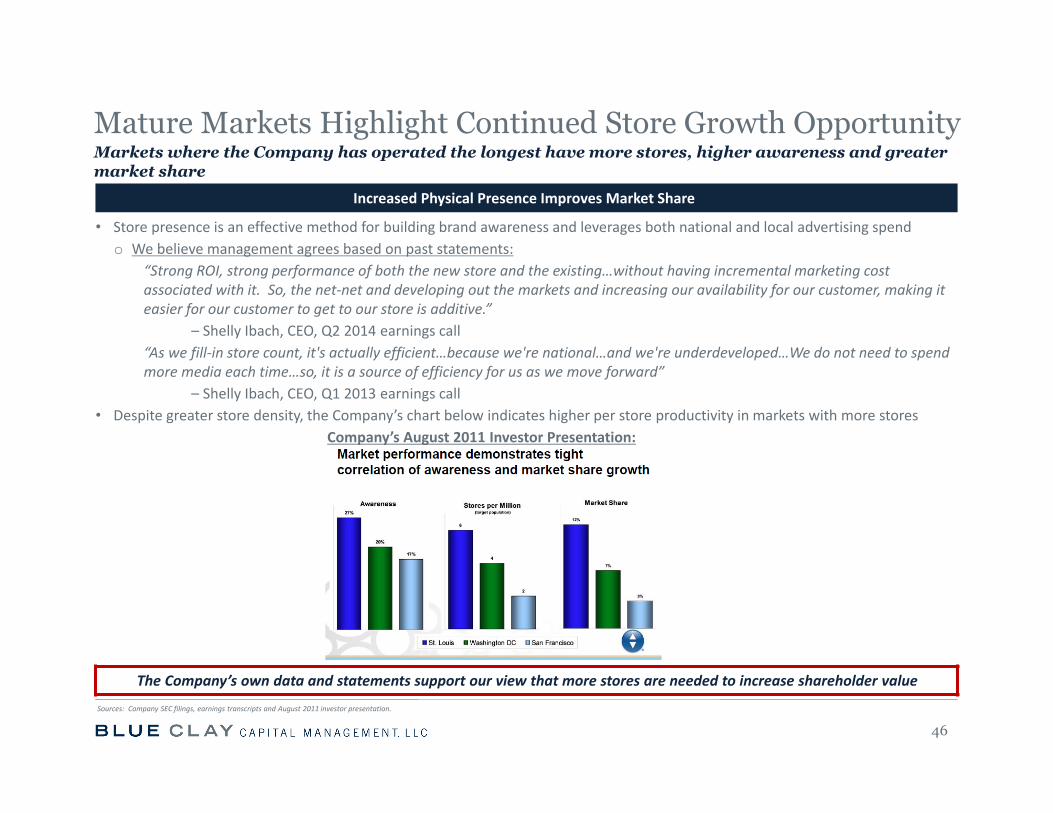
Increased Physical Presence Improves Market Share
• Store presence is an effective method for building brand awareness and leverages both national and local advertising spendo We believe management agrees based on past statements:
“Strong ROI, strong performance of both the new store and the existing…without having incremental marketing cost associated with it. So, the net‐net and developing out the markets and increasing our availability for our customer, making it easier for our customer to get to our store is additive.”
– Shelly Ibach, CEO, Q2 2014 earnings call“As we fill‐in store count, it's actually efficient…because we're national…and we're underdeveloped…We do not need to spend more media each time…so, it is a source of efficiency for us as we move forward”
– Shelly Ibach, CEO, Q1 2013 earnings call• Despite greater store density, the Company’s chart below indicates higher per store productivity in markets with more stores
Company’s August 2011 Investor Presentation:
The Company’s own data and statements support our view that more stores are needed to increase shareholder value
Mature Markets Highlight Continued Store Growth OpportunityMarkets where the Company has operated the longest have more stores, higher awareness and greater market share
46
Sources: Company SEC filings, earnings transcripts and August 2011 investor presentation.
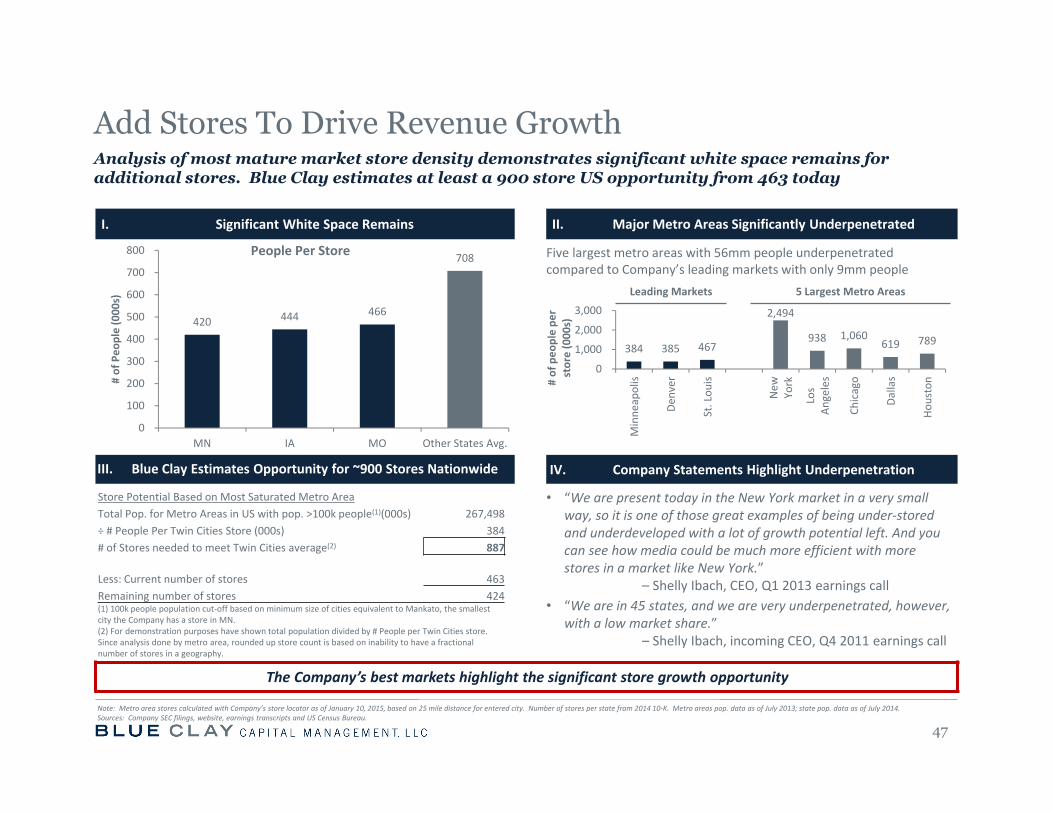
I. Significant White Space Remains II. Major Metro Areas Significantly Underpenetrated
Five largest metro areas with 56mm people underpenetrated compared to Company’s leading markets with only 9mm people
III. Blue Clay Estimates Opportunity for ~900 Stores Nationwide IV. Company Statements Highlight Underpenetration
• “We are present today in the New York market in a very small way, so it is one of those great examples of being under‐stored and underdeveloped with a lot of growth potential left. And you can see how media could be much more efficient with more stores in a market like New York.”
– Shelly Ibach, CEO, Q1 2013 earnings call• “We are in 45 states, and we are very underpenetrated, however,
with a low market share.” – Shelly Ibach, incoming CEO, Q4 2011 earnings call
The Company’s best markets highlight the significant store growth opportunity
Leading Markets 5 Largest Metro Areas
Add Stores To Drive Revenue GrowthAnalysis of most mature market store density demonstrates significant white space remains for additional stores. Blue Clay estimates at least a 900 store US opportunity from 463 today
47
Store Potential Based on Most Saturated Metro AreaTotal Pop. for Metro Areas in US with pop. >100k people(1)(000s) 267,498 ÷ # People Per Twin Cities Store (000s) 384# of Stores needed to meet Twin Cities average(2) 887
Less: Current number of stores 463 Remaining number of stores 424 (1) 100k people population cut‐off based on minimum size of cities equivalent to Mankato, the smallest city the Company has a store in MN.(2) For demonstration purposes have shown total population divided by # People per Twin Cities store. Since analysis done by metro area, rounded up store count is based on inability to have a fractional number of stores in a geography.
Note: Metro area stores calculated with Company’s store locator as of January 10, 2015, based on 25 mile distance for entered city. Number of stores per state from 2014 10‐K. Metro areas pop. data as of July 2013; state pop. data as of July 2014. Sources: Company SEC filings, website, earnings transcripts and US Census Bureau.
384 385 467
2,494
938 1,060 619 789
0
1,000
2,000
3,000
Minne
apolis
Denver
St. Lou
is
New
York
Los
Angeles
Chicago
Dallas
Houston# of peo
ple pe
r store (000
s)420 444 466
708
0
100
200
300
400
500
600
700
800
MN IA MO Other States Avg.
# of Peo
ple (000
s)
People Per Store
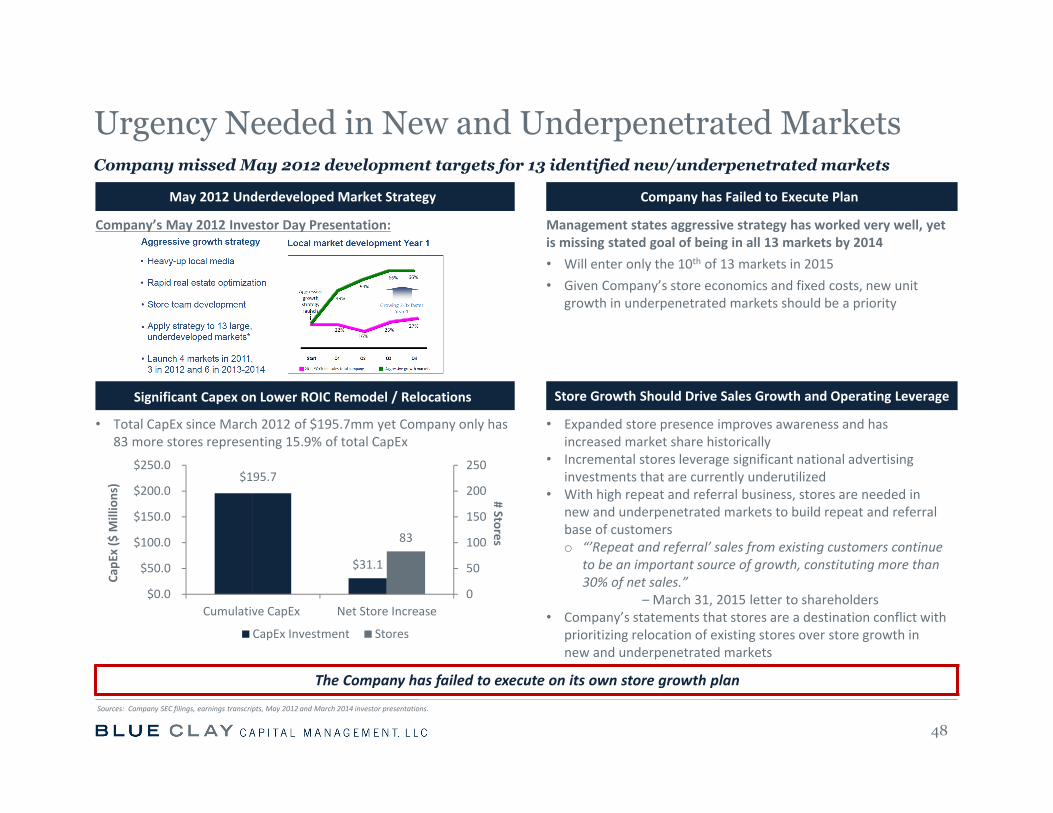
May 2012 Underdeveloped Market Strategy Company has Failed to Execute Plan
Company’s May 2012 Investor Day Presentation: Management states aggressive strategy has worked very well, yet is missing stated goal of being in all 13 markets by 2014• Will enter only the 10th of 13 markets in 2015• Given Company’s store economics and fixed costs, new unit
growth in underpenetrated markets should be a priority
Significant Capex on Lower ROIC Remodel / Relocations Store Growth Should Drive Sales Growth and Operating Leverage
• Total CapEx since March 2012 of $195.7mm yet Company only has 83 more stores representing 15.9% of total CapEx
• Expanded store presence improves awareness and has increased market share historically
• Incremental stores leverage significant national advertising investments that are currently underutilized
• With high repeat and referral business, stores are needed in new and underpenetrated markets to build repeat and referral base of customerso “’Repeat and referral’ sales from existing customers continue
to be an important source of growth, constituting more than 30% of net sales.”
–March 31, 2015 letter to shareholders• Company’s statements that stores are a destination conflict with
prioritizing relocation of existing stores over store growth in new and underpenetrated markets
The Company has failed to execute on its own store growth plan
Urgency Needed in New and Underpenetrated MarketsCompany missed May 2012 development targets for 13 identified new/underpenetrated markets
48
Sources: Company SEC filings, earnings transcripts, May 2012 and March 2014 investor presentations.
$195.7
$31.1
83
0
50
100
150
200
250
$0.0
$50.0
$100.0
$150.0
$200.0
$250.0
Cumulative CapEx Net Store Increase
# Stores
CapE
x ($ M
illions)
CapEx Investment Stores
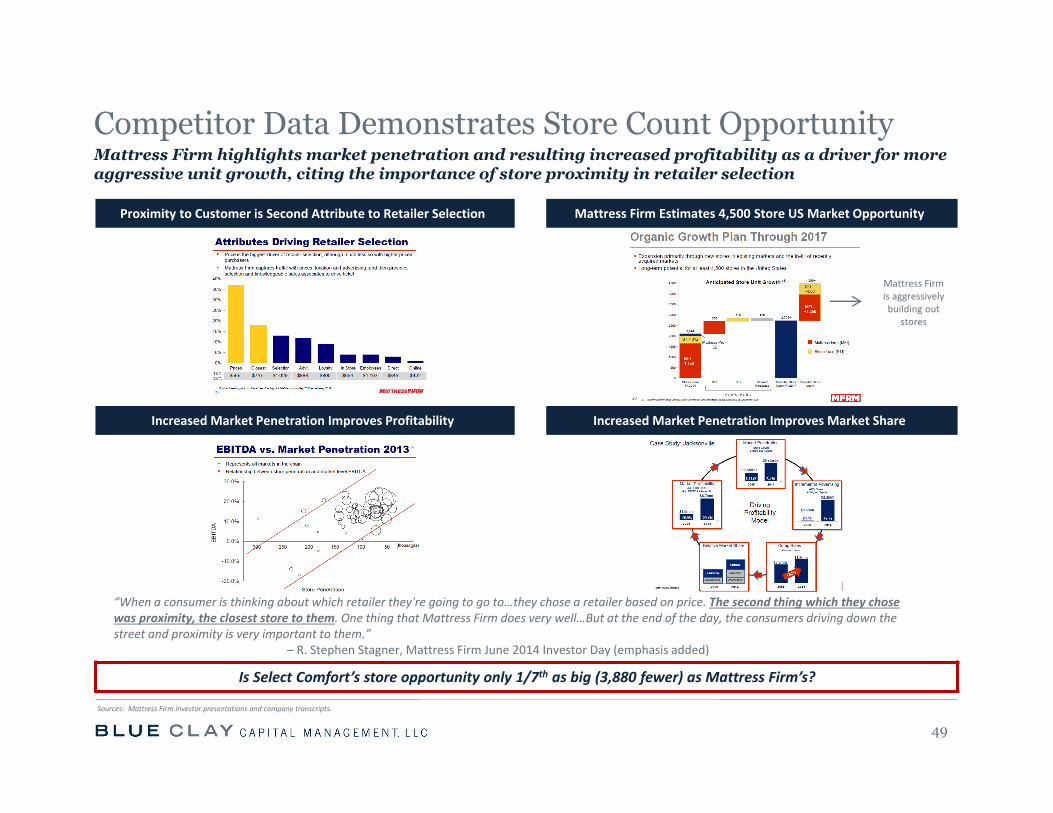
Proximity to Customer is Second Attribute to Retailer Selection Mattress Firm Estimates 4,500 Store US Market Opportunity
Increased Market Penetration Improves Profitability Increased Market Penetration Improves Market Share
“When a consumer is thinking about which retailer they're going to go to…they chose a retailer based on price. The second thing which they chosewas proximity, the closest store to them. One thing that Mattress Firm does very well…But at the end of the day, the consumers driving down thestreet and proximity is very important to them.”
– R. Stephen Stagner, Mattress Firm June 2014 Investor Day (emphasis added)
Is Select Comfort’s store opportunity only 1/7th as big (3,880 fewer) as Mattress Firm’s?
Competitor Data Demonstrates Store Count OpportunityMattress Firm highlights market penetration and resulting increased profitability as a driver for more aggressive unit growth, citing the importance of store proximity in retailer selection
49
Mattress Firm is aggressively building out
stores
Sources: Mattress Firm investor presentations and company transcripts.
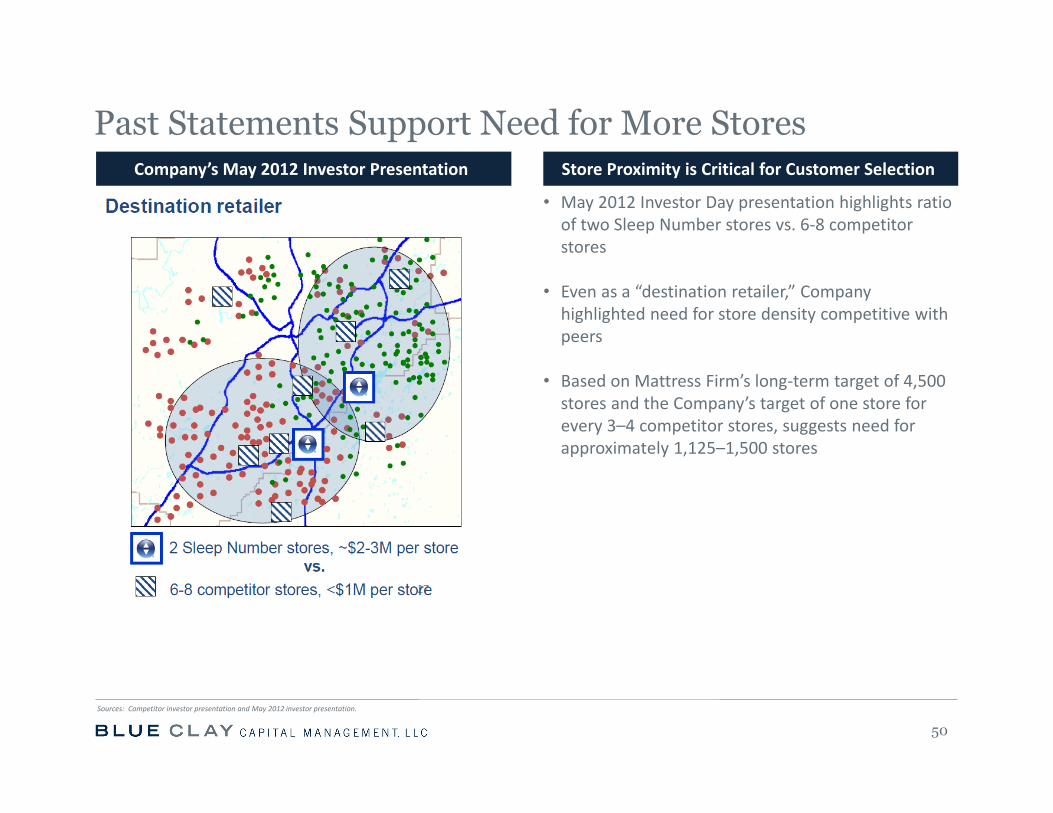
Company’s May 2012 Investor Presentation Store Proximity is Critical for Customer Selection
• May 2012 Investor Day presentation highlights ratio of two Sleep Number stores vs. 6‐8 competitor stores
• Even as a “destination retailer,” Company highlighted need for store density competitive with peers
• Based on Mattress Firm’s long‐term target of 4,500 stores and the Company’s target of one store for every 3–4 competitor stores, suggests need for approximately 1,125–1,500 stores
Past Statements Support Need for More Stores
50
Sources: Competitor investor presentation and May 2012 investor presentation.
• In 2006, the Company provided guidance to open new stores at a rate of up to 10% per year, from a base of 396 locations
• Had the Company been able to achieve its 10% growth forecast, it would have 934 stores today
• The Company has fewer stores than it had seven years ago largely due to disastrous business and capital allocation decisions made by the Board
• The Company is only in nine of the 13 targeted new/underpenetrated markets identified in May 2012
o Breaking Company promise to open all 13 markets by 2014
• The Company highlighted an international opportunity in 2006, yet has failed to pursue
o 15.8% of Tempur‐Sealy’s total sales in FY 2014 were from outside North America
We are simply aiming to fulfill the promises that the Board and managementonce made to shareholders but have since failed to keep
Focus on Store Growth Should Not be a Surprise to Company
51
Sources: Company and competitor SEC filings, February 2006 and May 2012 investor presentations.
Blue Clay’s plan to grow stores is consistent with the Company’s prior statements and store density from the Company’s most successful markets
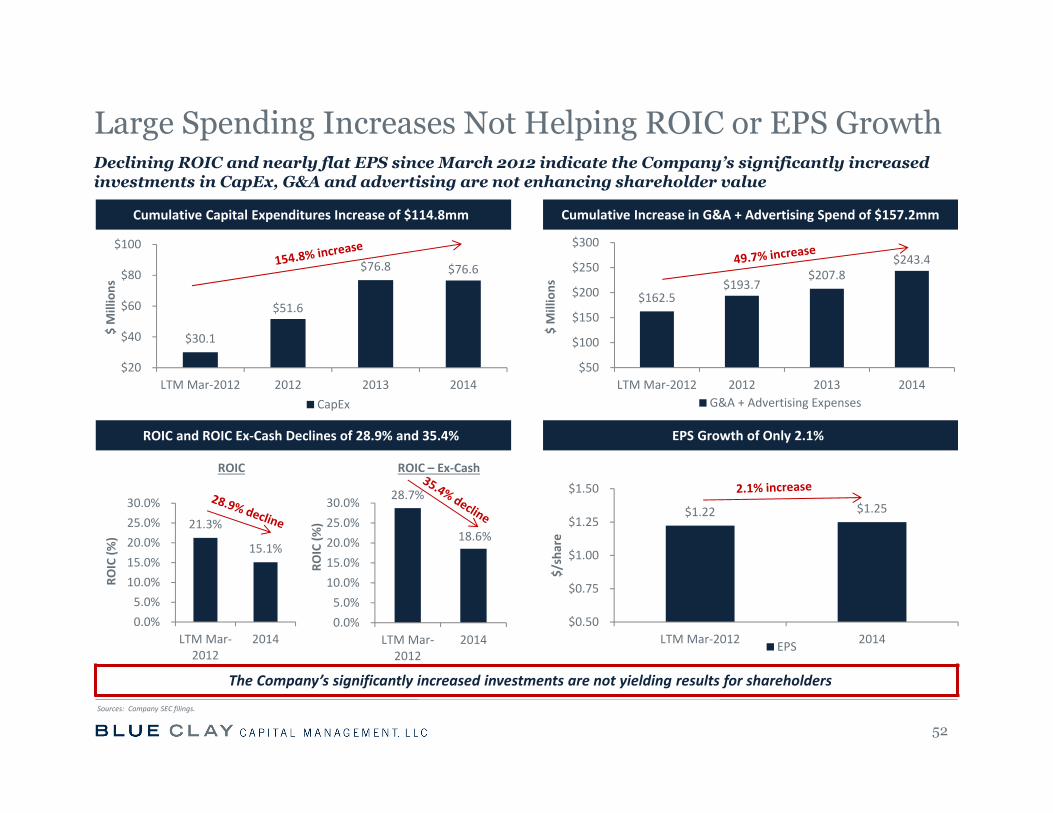
Cumulative Capital Expenditures Increase of $114.8mm Cumulative Increase in G&A + Advertising Spend of $157.2mm
ROIC and ROIC Ex‐Cash Declines of 28.9% and 35.4% EPS Growth of Only 2.1%
The Company’s significantly increased investments are not yielding results for shareholders
Declining ROIC and nearly flat EPS since March 2012 indicate the Company’s significantly increased investments in CapEx, G&A and advertising are not enhancing shareholder value
52
Large Spending Increases Not Helping ROIC or EPS Growth
Sources: Company SEC filings.
$30.1
$51.6
$76.8 $76.6
$20
$40
$60
$80
$100
LTM Mar‐2012 2012 2013 2014
$ Millions
CapEx
$1.22 $1.25
$0.50
$0.75
$1.00
$1.25
$1.50
LTM Mar‐2012 2014
$/share
EPS
21.3%
15.1%
0.0%5.0%10.0%15.0%20.0%25.0%30.0%
LTM Mar‐2012
2014
ROIC (%
)
28.7%
18.6%
0.0%5.0%10.0%15.0%20.0%25.0%30.0%
LTM Mar‐2012
2014
ROIC (%
)
ROIC ROIC – Ex‐Cash
$162.5 $193.7
$207.8 $243.4
$50
$100
$150
$200
$250
$300
LTM Mar‐2012 2012 2013 2014
$ Millions
G&A + Advertising Expenses
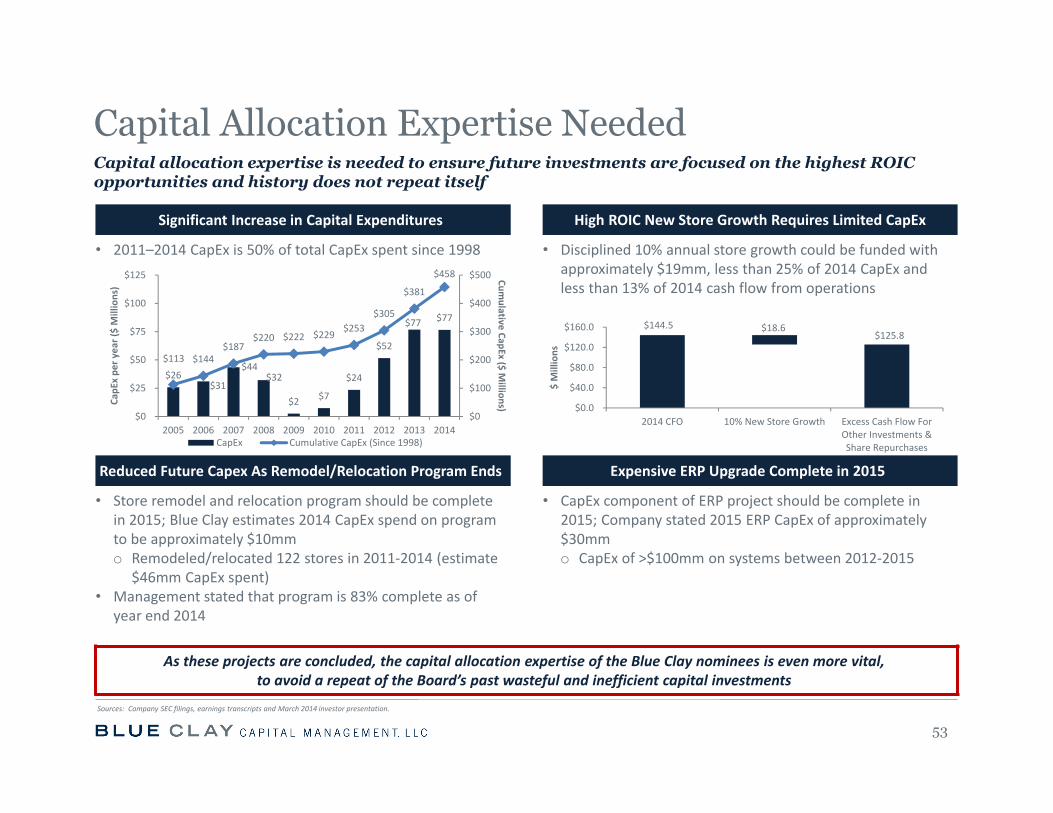
Capital Allocation Expertise NeededCapital allocation expertise is needed to ensure future investments are focused on the highest ROIC opportunities and history does not repeat itself
53
Significant Increase in Capital Expenditures High ROIC New Store Growth Requires Limited CapEx
• 2011–2014 CapEx is 50% of total CapEx spent since 1998 • Disciplined 10% annual store growth could be funded with approximately $19mm, less than 25% of 2014 CapEx and less than 13% of 2014 cash flow from operations
Reduced Future Capex As Remodel/Relocation Program Ends Expensive ERP Upgrade Complete in 2015
• Store remodel and relocation program should be complete in 2015; Blue Clay estimates 2014 CapEx spend on program to be approximately $10mmo Remodeled/relocated 122 stores in 2011‐2014 (estimate
$46mm CapEx spent) • Management stated that program is 83% complete as of
year end 2014
• CapEx component of ERP project should be complete in 2015; Company stated 2015 ERP CapEx of approximately $30mmo CapEx of >$100mm on systems between 2012‐2015
As these projects are concluded, the capital allocation expertise of the Blue Clay nominees is even more vital, to avoid a repeat of the Board’s past wasteful and inefficient capital investments
Sources: Company SEC filings, earnings transcripts and March 2014 investor presentation.
$26 $31
$44 $32
$2 $7
$24
$52
$77 $77
$113 $144 $187
$220 $222 $229 $253 $305
$381
$458
$0
$100
$200
$300
$400
$500
$0
$25
$50
$75
$100
$125
2005 2006 2007 2008 2009 2010 2011 2012 2013 2014
Cumulative CapEx ($ M
illions)CapE
x pe
r year ($ Millions)
CapEx Cumulative CapEx (Since 1998)
$144.5 $125.8
$18.6
$0.0
$40.0
$80.0
$120.0
$160.0
2014 CFO 10% New Store Growth Excess Cash Flow ForOther Investments &Share Repurchases
$ Millions
I. Company Philosophy is Overly Conservative
• Our number one priority remains to invest in our innovation roadmap and a scalable infrastructure
• Our second priority for cash is to maintain a minimum of $100 million cash and securities, net of customer deposits. This will provide adequate liquidity to enable us to meet our operating needs…even in the face of an economic downturn, and pursue strategic opportunities as they may arise
• Our third priority is returning cash to shareholders through an ongoing flexible stock repurchase program
– Shelly Ibach, CEO, Q3 2014 Earnings Call (emphasis added)
II. New Philosophy Needed
• All uses of capital need to be compared against each other, and the highest long‐term ROIC opportunities should be given preference
• Minimum cash balance of $100mm needs to be re‐evaluated and adjusted according to capital requirements
• Company must ensure investments in G&A and advertising are driving per share value creation
• Focus needs to be on best opportunities to maximize long‐term shareholder value
54
Capital Should be Allocated to Highest ROIC Opportunities
Sources: Company earnings transcripts.
Board needs capital allocation expertise, Vote the BLUE Proxy Card
55
Current financial position and favorable economic backdrop enable the Company to more aggressively return capital to shareholders
Return Excess Capital to Shareholders
I. Financial Cushion Enables Company to Lower Minimum Cash Requirement
• The Company has significant gap to break‐even sales; margin improvement opportunities should further increase gap to break‐even
• Company gross profits and cash flow from operations enable ample flexibility for long‐term growth investments with respect to advertising, R&D and capital expenditures.
• We fundamentally disagree with management’s assertions regarding cash cushion required to fund these investments:“And the $125mm – puts us in a position that we’re able to continue to invest in our business when we have a suppressed top line. I think, last year would be a great example of that where we did not deliver the sale we expected. But we’re working on such important initiatives to be able to support our long‐term growth strategy and it allowed us to be able to continue to invest in our product innovation and our local market development in a way that is positioning us today to be able to outpacegrowth expectations in the future”
– Shelly Ibach, CEO, Q1 2014 earnings callo Declining operating income and ROIC indicate these investments are not generating adequate returns for shareholders
II. Share Repurchase Activity Must be Analyzed as an Investment
• Decision to repurchase shares should be considered along with all investment decisions such as G&A spend, advertising spend and capital expenditures. Ultimate decision should be determined based on ability to best grow long‐term EPS or free cash flow per share
• Repurchases should be conducted to create value for shareholders, not to maintain share count• Due to investment nature and changes in stock price/intrinsic value, repurchases should not be “steady”• Company has missed multiple opportunities to repurchase shares at very attractive valuations
“When companies with outstanding businesses and comfortable financial positions find their shares selling far below intrinsicvalue in the marketplace, no alternative action can benefit shareholders as surely as repurchases.” –Warren Buffett
Sources: Company SEC filings, earnings transcripts, October 2012 investor presentation and Berkshire Hathaway 1984 Letter to Shareholders.
V. Conclusion
56
57
Conclusion
I. Change is Needed
• Stock price has significantly underperformed during CEO Shelly Ibach’s tenure
• Operating margins and ROIC have dramatically declined
• The Company has repeatedly failed to executed on its plan and meet its stated performance objectives
• The Board has a disastrous capital allocation track record, twice taking the Company’s stock price to nearly zero and repeatedlymaking decisions that have resulted in destruction of shareholder value
• Poor corporate governance is rampant as evidenced by a classified Board, excessive tenure and multiple examples of Board interlocks and cronyism
• The Board has failed to hold management accountable for their underperformance and the Company’s financial deterioration
II. Blue Clay Nominees are More Qualified and Aligned with Shareholders
• Blue Clay nominees have the CEO experience, marketing, brand‐building and capital allocation expertise the current Board is lacking, and their interests are aligned with all shareholders
• The Company’s nominees have excessive tenures, are part of the questionable interlocks on the Board, lack diverse skill sets and have an ownership track record that underscores their misalignment with shareholders
Vote the BLUE Proxy Card to elect Blue Clay’s Nominees
Sources: Company SEC filings.
Blue Clay believes changes are needed on the Board, and Blue Clay’s nominees bring shareholder representation and expertise the current Board is lacking
VI. Appendix
58
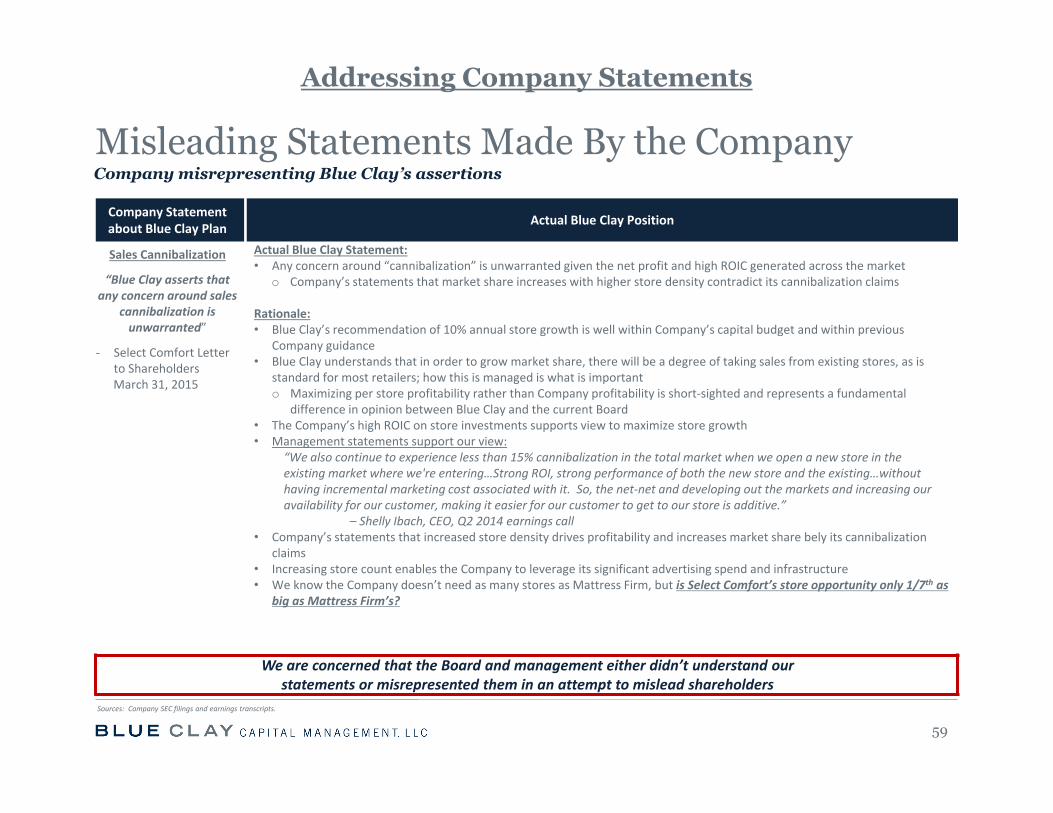
Misleading Statements Made By the Company
59
Company misrepresenting Blue Clay’s assertions
Company Statement about Blue Clay Plan Actual Blue Clay Position
Sales Cannibalization
“Blue Clay asserts that any concern around sales
cannibalization is unwarranted”
‐ Select Comfort Letter to ShareholdersMarch 31, 2015
Actual Blue Clay Statement:• Any concern around “cannibalization” is unwarranted given the net profit and high ROIC generated across the market
o Company’s statements that market share increases with higher store density contradict its cannibalization claims
Rationale:• Blue Clay’s recommendation of 10% annual store growth is well within Company’s capital budget and within previous
Company guidance• Blue Clay understands that in order to grow market share, there will be a degree of taking sales from existing stores, as is
standard for most retailers; how this is managed is what is importanto Maximizing per store profitability rather than Company profitability is short‐sighted and represents a fundamental
difference in opinion between Blue Clay and the current Board• The Company’s high ROIC on store investments supports view to maximize store growth• Management statements support our view:
“We also continue to experience less than 15% cannibalization in the total market when we open a new store in theexisting market where we're entering…Strong ROI, strong performance of both the new store and the existing…without having incremental marketing cost associated with it. So, the net‐net and developing out the markets and increasing our availability for our customer, making it easier for our customer to get to our store is additive.”
– Shelly Ibach, CEO, Q2 2014 earnings call• Company’s statements that increased store density drives profitability and increases market share bely its cannibalization
claims• Increasing store count enables the Company to leverage its significant advertising spend and infrastructure• We know the Company doesn’t need as many stores as Mattress Firm, but is Select Comfort’s store opportunity only 1/7th as
big as Mattress Firm’s?
We are concerned that the Board and management either didn’t understand our statements or misrepresented them in an attempt to mislead shareholders
Addressing Company Statements
Sources: Company SEC filings and earnings transcripts.
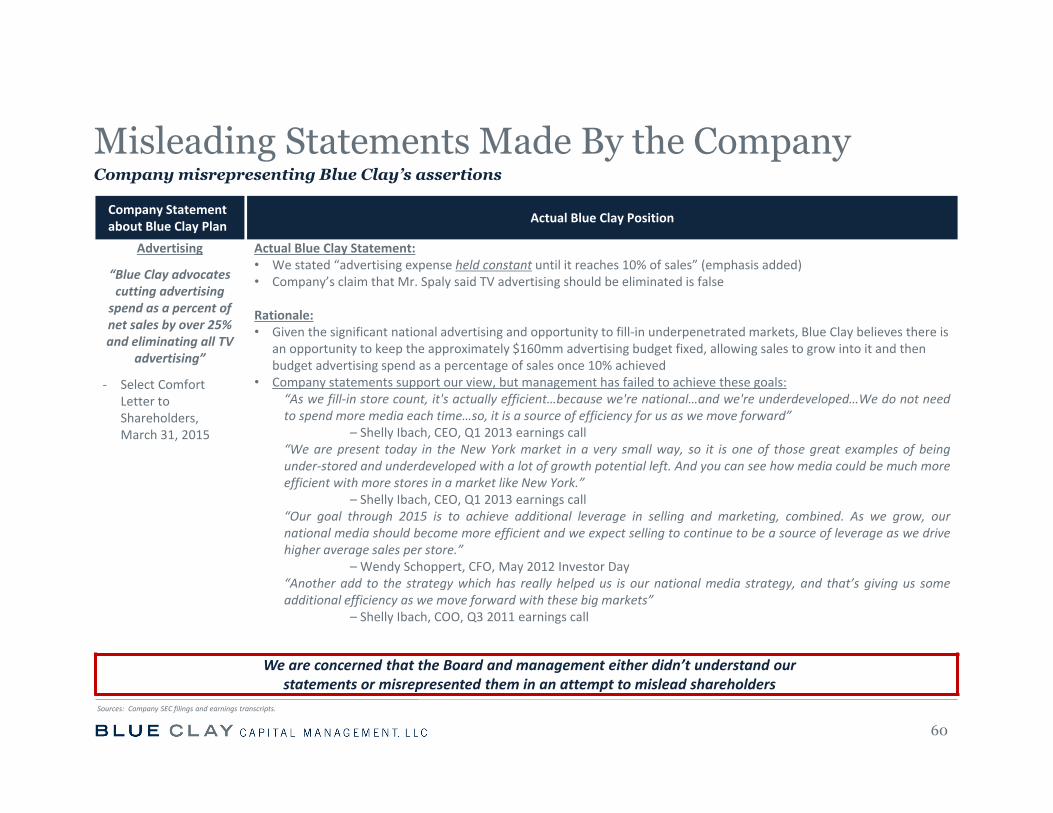
Misleading Statements Made By the Company
60
Company Statement about Blue Clay Plan Actual Blue Clay Position
Advertising
“Blue Clay advocates cutting advertising spend as a percent of net sales by over 25% and eliminating all TV
advertising”
‐ Select Comfort Letter to Shareholders, March 31, 2015
Actual Blue Clay Statement:• We stated “advertising expense held constant until it reaches 10% of sales” (emphasis added)• Company’s claim that Mr. Spaly said TV advertising should be eliminated is false
Rationale:• Given the significant national advertising and opportunity to fill‐in underpenetrated markets, Blue Clay believes there is
an opportunity to keep the approximately $160mm advertising budget fixed, allowing sales to grow into it and then budget advertising spend as a percentage of sales once 10% achieved
• Company statements support our view, but management has failed to achieve these goals:“As we fill‐in store count, it's actually efficient…because we're national…and we're underdeveloped…We do not needto spend more media each time…so, it is a source of efficiency for us as we move forward”
– Shelly Ibach, CEO, Q1 2013 earnings call“We are present today in the New York market in a very small way, so it is one of those great examples of beingunder‐stored and underdeveloped with a lot of growth potential left. And you can see how media could be much moreefficient with more stores in a market like New York.”
– Shelly Ibach, CEO, Q1 2013 earnings call“Our goal through 2015 is to achieve additional leverage in selling and marketing, combined. As we grow, ournational media should become more efficient and we expect selling to continue to be a source of leverage as we drivehigher average sales per store.”
– Wendy Schoppert, CFO, May 2012 Investor Day“Another add to the strategy which has really helped us is our national media strategy, and that’s giving us someadditional efficiency as we move forward with these big markets”
– Shelly Ibach, COO, Q3 2011 earnings call
We are concerned that the Board and management either didn’t understand our statements or misrepresented them in an attempt to mislead shareholders
Company misrepresenting Blue Clay’s assertions
Sources: Company SEC filings and earnings transcripts.
Contact Information
800 Nicollet Mall, Suite 2870Minneapolis, MN 55402
(612) 200‐1748E‐mail: [email protected]
If you have any questions, require assistance with voting your BLUE proxy card, or need additional copies of the proxy materials, please contact our proxy solicitor:
OKAPI PARTNERS LLC437 Madison Avenue, 28th Floor
New York, NY 10022(212) 297‐0720
Shareholders Call Toll‐Free at: (855) 208‐8902E‐mail: [email protected]
61