Embed Size (px)
Citation preview
Oil & Gas Science and Technology – Rev. IFP, Vol. 59 (2004), No. 4, pp. 371-403Copyright © 2004, Institut français du pétrole
Seismic While Drilling (SWD) Techniques with Downhole Measurements,
Introduced by IFP and its Partners in 1990-2000Ch. Naville1, S. Serbutoviez1, A. Throo1, O. Vincké1 and F. Cecconi2
1 Institut français du pétrole, 1 et 4, avenue de Bois-Préau, 92852 Rueil-Malmaison Cedex - France2 Geoservices, BP 20, 93151 Le Blanc-Mesnil Cedex - France
e-mail: [email protected] - [email protected] - [email protected] - [email protected] - [email protected]
Résumé — Techniques de sismique pendant forage avec mesures de fond, inaugurées par l’IFP etses partenaires en 1990-2000 — La sismique pendant forage (SWD), comprend toute technique opéréependant que le train de tige est dans le puits, pendant le forage effectif ou pendant les manœuvres d’ajoutde tige ou de nettoyage. Deux techniques utilisées par l’industrie sont développées ici :– l’écoute sismique du trépan pendant forage (drillbit–SWD), usitée depuis 1986, qui consiste à
enregistrer le signal avec un nombre indéfini de capteurs de surface, ainsi qu’un signal de référencereprésentatif des vibrations du trépan ;
– le profil sismique vertical pendant forage (VSP-WD), qui consiste à enregistrer le signal émis par unesource de surface avec un capteur sismique et un enregistreur intégrés à la garniture de forage (BHA).Cette technique émergente est opérée depuis l’année 2000 principalement par la société Schlumberger.
Les deux techniques efficaces suivantes, assimilables à la sismique pendant le forage, ne seront pas dis-cutées ici :– la technique de VSP dans le tubage (TLC), en particulier le VSP au câble avec outil descendu au câble
dans un tubing de production ou un train de tiges de forage ;– le « VSP intermédiaire », qui consiste à acquérir un VSP conventionnel au câble avant la pose et la
cimentation d’un cuvelage (casing), afin d’affiner le calage du puits à la sismique de surface et deprédire les zones en surpression au-dessous du trépan.
Les développements récents effectués par l’IFP et ses partenaires en sismique pendant forage ont bénéfi-cié de la technologie de transmission temps réel à haut débit par fils et tiges câblés du système TRAFOR,qui a permis d’exécuter rapidement des tests terrains cruciaux.Pendant la période 1986-2003, la pratique d’écoute sismique du trépan visait une utilisation continue surla profondeur totale du forage, avec peu de capteurs de surface, et sans adjonction d’enregistreur de puitspendant le forage : cette technique a donné des résultats mitigés, quasi nuls avec les trépans de type PDC(Polycrystalline Diamond Cutter). Les meilleurs résultats ont été obtenus avec l’usage de trépan de typetricône, lors du forage de formations plutôt dures, en évitant des valeurs faibles pour les paramètres depoids sur outil (WOB) et vitesse de rotation (RPM). L’IFP a introduit dans la technique d’écoute sismique du trépan les innovations suivantes : – les mesures de fond pendant forage, afin de mieux comprendre le processus d’émission sismique du
trépan ;– l’amélioration de l’architecture mécanique de la garniture (BHA) en intégrant un élément amortisseur
permettant d’optimiser la qualité du signal source émis et de diminuer les émissions secondaires indésirables ;
Interactive Drilling / Forage interactif
D o s s i e r
Oil & Gas Science and Technology – Rev. IFP, Vol. 59 (2004), No. 4372
– conception et fabrication d’une technologie sismique d’écoute du trépan avec mesure de fond pendantforage, validée par une succession de tests terrain sévères : cette phase de développement a été effec-tuée en partenariat avec l’industrie et avec le soutien de la Commission européenne et du ministère français de l’Industrie ;
– restriction de la technique sismique d’écoute du trépan à la configuration du walkaway inverse, assurant les meilleures chances d’application industrielle ;
– intégration des connaissances et du savoir-faire de disciplines multiples : forage, mesures de fondMWD et sismique, acquisition et traitement des données.
De façon similaire, la technique de PSV pendant forage (VSP-while drilling) a fait l’objet d’une investi-gation, donnant les résultats suivants :
– définition et validation de capteurs sismiques résistant aux conditions sévères de vibration de fondpendant le forage ;
– test terrain de la méthode de VSP-WD, afin d’évaluer la qualité du signal obtenu par VSP-WD relativement au signal obtenu par VSP conventionnel au câble. Les résultats obtenus permettent dedéfinir les applications industrielles de la méthode ;
– amélioration de la précision d’horloge embarquée dans l’enregistreur sismique de fond pendant foragepour les systèmes sans fil.
Enfin, le présent article relate la chronologie de l’émergence des techniques de sismique pendant forage,et esquisse quelques perspectives prévisibles compte tenu des développements parallèles accomplis parles principales sociétés industrielles de diagraphie pendant forage.
Abstract — Seismic While Drilling (SWD) Techniques with Downhole Measurements, Introduced byIFP and its Partners in 1990-2000 — Seismic While Drilling (SWD), specifically encompasses the seis-mic techniques operated while the drillstring is lowered in the borehole, during effective drilling, duringmanœuvres or while connecting drill pipes. Two SWD techniques have been used by the industry:
– drillbit-SWD, which consists in recording the seismic noise generated by a rock bit under effectivedrilling on any number of surface seismic sensors. This technique have been used steadily since 1986;
– Vertical Seismic Profile While Drilling (VSP-WD), which consists in recording the seismic signal gen-erated by a surface seismic source on seismic sensors integrated inside the downhole BoreholeAssembly (BHA). This emerging technique have been operated since year 2000 about, mainly bySchlumberger.
Two efficient wireline VSP techniques aimed at gathering geological information potentially useful to thedrilling decision making process, and which could rightfully be assimilated to SWD techniques, will notbe considered here:
– the technique of Tube Logging Conveying (TLC), in particular the TLC-VSP, where a wireline VSPtool is lowered inside the drillstring through a side entry sub at the top of the drillstring;
– the standard wireline logging technique of “intermediate VSP”, which consists in recording a VSPwith a set of wireline logs right before setting an intermediate casing, is used to predict geological fea-tures and possible overpressures in depth intervals located hundreds of meters below the intermediatedrilled depth, with good success in some geographical regions.
The recent developments achieved by IFP and its partners in SWD greatly benefited from the availabilityof a high rate and real time wireline transmission system while drilling called TRAFOR, allowing for fastfield testing of the SWD methods.
In the past 18 years (1986-2003), the drillbit–SWD technique practiced by the industry, aimed at a con-tinuous application over the whole drilling depth span, with only a few surface sensors, and without anydownhole measurement technology (MWD), reached a very mitigated success rate: although the geo-physicists have been intrigued by the large amount of seismic energy imparted to the ground by sometypes of drillbits, the drillbit-SWD technique fails to yield any substantial results in many circumstances:in the early 1990’s, the industry had already gathered an extensive enough experience so as to define thenecessary conditions for obtaining any useful drillbit signal: drilling formations sufficiently hard, with a
C Naville et al. / Seismic While Drilling (SWD) Techniques with Downhole Measurements
NOMENCLATURE
SWD Seismic While DrillingDrillbit-SWD Method of recording the Drillbit Seismic noise
While DrillingMWD Measurement While DrillingTRAFOR high rate/real time TRAnsmission system dur-
ing FORationSACZ Surface Accelerometer in Z-vertical axisDACZ Downhole Accelerometer in Z-vertical axisEMWD Electro-Magnetic While DrillingEM-SWD Electro-Magnetic Seismic While DrillingPOOH Pull Out Of HoleBHA BoreHole AssemblyDP Drill PipeDRU Downhole Recorder UnitSCU Surface Command Unit TB Time BreakWSP Well Seismic ProfileVSP-WD Vertical Seismic Profile While Drilling
WA WAlkaway (seismic survey)S/N Signal-to-Noise ratioNMO Normal Move Out twt two way timeENEL Italian National Electricity companyGDF Gaz de FranceEC European Community.
INTRODUCTION
We present here a history of the SWD techniques. The firstknown attempt to exploit the vibration signal emitted by thedrillbit was made around 1968 by an IFP geologist, M. Chapuis (from personal communication of L. Chaize,geophysicist now retired from IFP). M. Chapuis havingobserved that in vicinity of the drilling apparatus, “the harderthe formation under drilling, the stronger the noise”, he thendecided to record the noise level from drilling with a geo-phone planted into the ground in the vicinity of the rig, inorder to obtain a formation “stiffness” indicator versus
373
roller cone bit type equipped with milled teeth or inserts, and avoiding the lower range values for theWeight On Bit (WOB) and Round Per Minute (RPM) drilling parameters. The innovative drillbit-SWDtechnique input from IFP in the past decade is described in the present paper and consists in:– introducing downhole measurements while drilling, in order to understand the downhole process of
seismic emission by roller cone rock bits mostly;– improving the mechanical design of the BHA, by integrating a shock absorber element in order to
optimize the quality of the seismic signals imparted into the ground and to reduce the amplitudes ofundesirable secondary seismic emissions, which considerably complicate the subsequent seismic pro-cessing and blur the final seismic image;
– designing, manufacturing and validating an operational MWD assisted drillbit-SWD techniquethrough a set of successive, complete and severe field tests achieved through several R&D projects inpartnership with the industry;
– restricting the application of drillbit-SWD technique to the reverse seismic walkaway configuration tobe applied in geological-geographic areas ensuring the best chances of operational and economicsuccess;
– integrating the knowledge and know-how of multiple categories of specialists in the various domainsof drilling, MWD and seismic, involved in the multidisciplinary applied SWD field operations.
In a similar approach successfully applied to the drillbit SWD developments, the technique of VSP-whiledrilling has been investigated, resulting in several advanced achievements, namely:– definition of downhole seismic sensors able to withstand severe drilling conditions;– field testing the feasibility of the VSP-WD method as a whole, in order to evaluate the quality of the
recorded seismic signal in comparison with the equivalent signals from the conventional wirelinetechnique. Depending on the level of seismic signal quality obtained, the domain of application of theVSP-WD technique and the priorities in the successive technological developments to be implementedhave been defined;
– improving the precision of downhole clock to be embarked in an industrial wireless downholerecorder able to sustain the rough downhole drilling conditions of shock and temperature variations.
Last, the present paper overviews the emergence of SWD technique in a brief preliminary history, and isended with the expression of a few prospective views taking in account the developments achieved byother prominent industrial organizations active in the difficult and promising domains of seismic whiledrilling technique and field practice.
Oil & Gas Science and Technology – Rev. IFP, Vol. 59 (2004), No. 4
depth. Later, Elf-Aquitaine geoscientists and drillersimproved the technique by fixing an accelerometer at the topof the drillstring, attached to the nonrotating part of the injec-tion head: monitoring of the vibratory energy level versusdepth was displayed continuously and in real time whiledrilling, constituting the Snaplog [1]. In 1983, Elf was eagerto develop the horizontal drilling technique, and invited CGGto record some seismic noise while drilling a horizontaldrain, using vertical geophones on surface and an accelerom-eter on top of the drillstring, which from now on we will referto as SACZ (Surface Accelerometer along Z-axis).Correlating the geophone signals by the SACZ pilot randomsignal came naturally to the mind of the geophysicists wellversed in the art of vibroseis. Interesting and positive resultscame with a second drillbit SWD test at shallow verticalwell, using air drilling. The first SWD attempt in the horizon-tal drain did not yield any encouraging results as the drill bitin a horizontal well generates S-wave propagating verticallyand very little P-waves, which could not be recorded prop-erly with vertical geophones, but this detail had been over-looked at the time and understood later. A few years passeduntil Elf filed for a patent in 1985, [2], then Western-Atlaspublished interesting results obtained onshore in NorthAmerica in wells drilled by Amoco, in 1986 (TomexTM-typeSWD survey, [3]). Unfortunately, the geophysical experienceaccumulated by numerous seismic contractors with variousoperating companies soon showed that the TomexTM tech-nique would not yield systematic good results: the results arequite insufficient when a PDC bit (Polycrystalline DiamondCutter) is used, and good results were not regularly obtainedeven with roller cone bits in favorable conditions: i.e. whiledrilling hard/medium hard formations, with roller cone teethlong enough, with appropriate drilling parameters and withsimple geometry of the well trajectory. Before 1990, verylimited technical exchanges occurred between geophysicistsand drillers, and seismic measurements were not authorizedto interfere in any way with the drilling process, thus thequality of drillbit reflection results could not be guaranteed.
1 DRILLBIT SWD AND VSP-WD
This section describes the feasibility of drillbit SWD andVSP-WD experiments with downhole measurements of thereference signal and emergence of a new drillbit techniqueusing a shock absorber, 1991-1998, by IFP and Gaz deFrance (GDF).
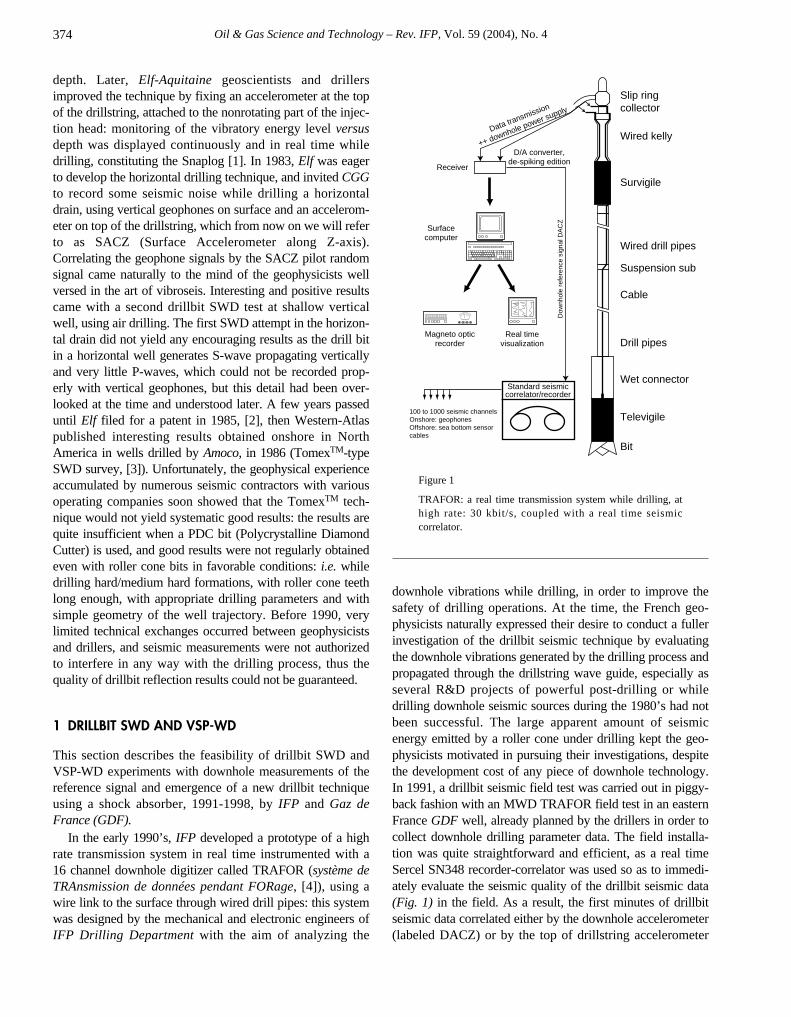
In the early 1990’s, IFP developed a prototype of a highrate transmission system in real time instrumented with a 16 channel downhole digitizer called TRAFOR (système deTRAnsmission de données pendant FORage, [4]), using awire link to the surface through wired drill pipes: this systemwas designed by the mechanical and electronic engineers ofIFP Drilling Department with the aim of analyzing the
Figure 1
TRAFOR: a real time transmission system while drilling, athigh rate: 30 kbit/s, coupled with a real time seismiccorrelator.
downhole vibrations while drilling, in order to improve thesafety of drilling operations. At the time, the French geo-physicists naturally expressed their desire to conduct a fullerinvestigation of the drillbit seismic technique by evaluatingthe downhole vibrations generated by the drilling process andpropagated through the drillstring wave guide, especially asseveral R&D projects of powerful post-drilling or whiledrilling downhole seismic sources during the 1980’s had notbeen successful. The large apparent amount of seismicenergy emitted by a roller cone under drilling kept the geo-physicists motivated in pursuing their investigations, despitethe development cost of any piece of downhole technology.In 1991, a drillbit seismic field test was carried out in piggy-back fashion with an MWD TRAFOR field test in an easternFrance GDF well, already planned by the drillers in order tocollect downhole drilling parameter data. The field installa-tion was quite straightforward and efficient, as a real timeSercel SN348 recorder-correlator was used so as to immedi-ately evaluate the seismic quality of the drillbit seismic data(Fig. 1) in the field. As a result, the first minutes of drillbitseismic data correlated either by the downhole accelerometer(labeled DACZ) or by the top of drillstring accelerometer
Receiver
Surfacecomputer
Magneto opticrecorder
Real timevisualization
Slip ring collector
Wired kelly
Survigile
Wired drill pipes
Suspension sub
Cable
Drill pipes
Wet connector
Televigile
Bit
Data transmission
++ downhole power supply
D/A converter,de-spiking edition
100 to 1000 seismic channelsOnshore: geophonesOffshore: sea bottom sensorcables
Standard seismiccorrelator/recorder
Dow
nhol
e re
fere
nce
sign
al D
AC
Z
374
C Naville et al. / Seismic While Drilling (SWD) Techniques with Downhole Measurements
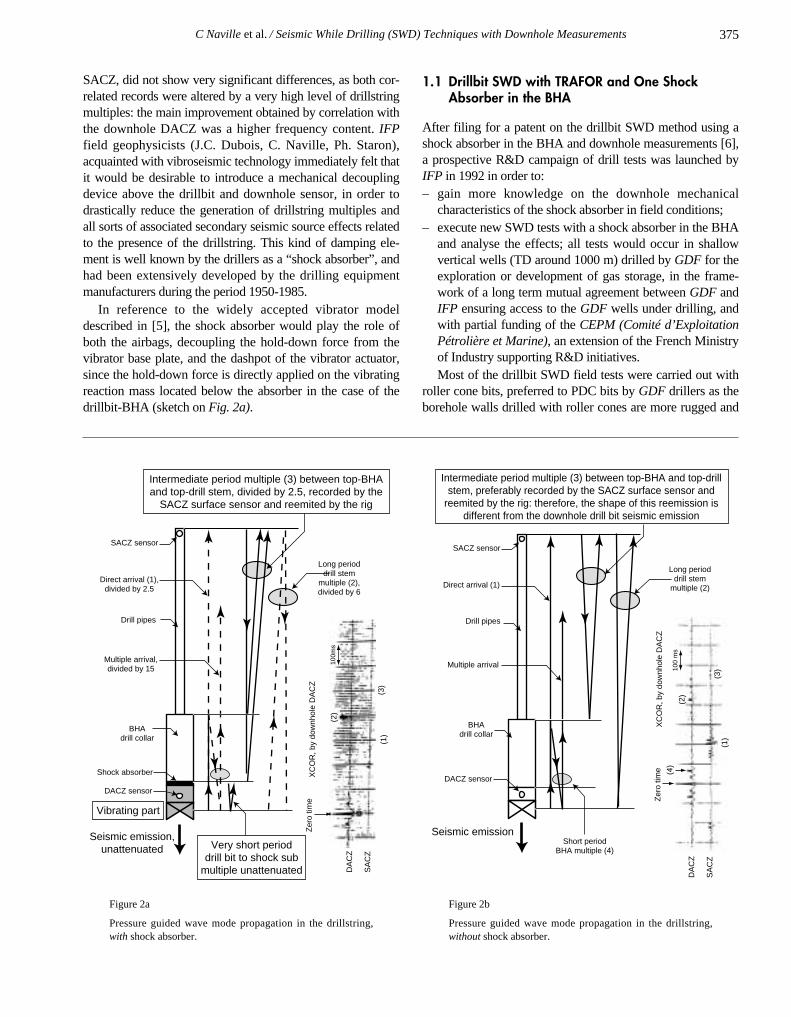
SACZ, did not show very significant differences, as both cor-related records were altered by a very high level of drillstringmultiples: the main improvement obtained by correlation withthe downhole DACZ was a higher frequency content. IFPfield geophysicists (J.C. Dubois, C. Naville, Ph. Staron),acquainted with vibroseismic technology immediately felt thatit would be desirable to introduce a mechanical decouplingdevice above the drillbit and downhole sensor, in order todrastically reduce the generation of drillstring multiples andall sorts of associated secondary seismic source effects relatedto the presence of the drillstring. This kind of damping ele-ment is well known by the drillers as a “shock absorber”, andhad been extensively developed by the drilling equipmentmanufacturers during the period 1950-1985.
In reference to the widely accepted vibrator modeldescribed in [5], the shock absorber would play the role ofboth the airbags, decoupling the hold-down force from thevibrator base plate, and the dashpot of the vibrator actuator,since the hold-down force is directly applied on the vibratingreaction mass located below the absorber in the case of thedrillbit-BHA (sketch on Fig. 2a).
1.1 Drillbit SWD with TRAFOR and One ShockAbsorber in the BHA
After filing for a patent on the drillbit SWD method using ashock absorber in the BHA and downhole measurements [6],a prospective R&D campaign of drill tests was launched byIFP in 1992 in order to:– gain more knowledge on the downhole mechanical
characteristics of the shock absorber in field conditions;– execute new SWD tests with a shock absorber in the BHA
and analyse the effects; all tests would occur in shallowvertical wells (TD around 1000 m) drilled by GDF for theexploration or development of gas storage, in the frame-work of a long term mutual agreement between GDF andIFP ensuring access to the GDF wells under drilling, andwith partial funding of the CEPM (Comité d’ExploitationPétrolière et Marine), an extension of the French Ministryof Industry supporting R&D initiatives.Most of the drillbit SWD field tests were carried out with
roller cone bits, preferred to PDC bits by GDF drillers as theborehole walls drilled with roller cones are more rugged and
375
SACZ sensor
DACZ sensor
Direct arrival (1),divided by 2.5
Multiple arrival,divided by 15
Drill pipes
BHAdrill collar
Shock absorber
Seismic emission,unattenuated
Long perioddrill stem
multiple (2),divided by 6
Intermediate period multiple (3) between top-BHAand top-drill stem, divided by 2.5, recorded by the
SACZ surface sensor and reemited by the rig
(1)
(2)
(3)
XC
OR
, by
dow
nhol
e D
AC
ZZ
ero
time
DA
CZ
SA
CZ
100m
s
Very short perioddrill bit to shock sub
multiple unattenuated
Vibrating part
Figure 2a
Pressure guided wave mode propagation in the drillstring,with shock absorber.
SACZ sensor
DACZ sensor
Direct arrival (1)
Multiple arrival
Drill pipes
BHAdrill collar
Seismic emission
Long perioddrill stem
multiple (2)
Intermediate period multiple (3) between top-BHA and top-drillstem, preferably recorded by the SACZ surface sensor and
reemited by the rig: therefore, the shape of this reemission isdifferent from the downhole drill bit seismic emission
(1)
(4)
(2)
(3)
XC
OR
, by
dow
nhol
e D
AC
ZZ
ero
time
DA
CZ
SA
CZ
100
ms
Short periodBHA multiple (4)
Figure 2b
Pressure guided wave mode propagation in the drillstring,without shock absorber.
Oil & Gas Science and Technology – Rev. IFP, Vol. 59 (2004), No. 4
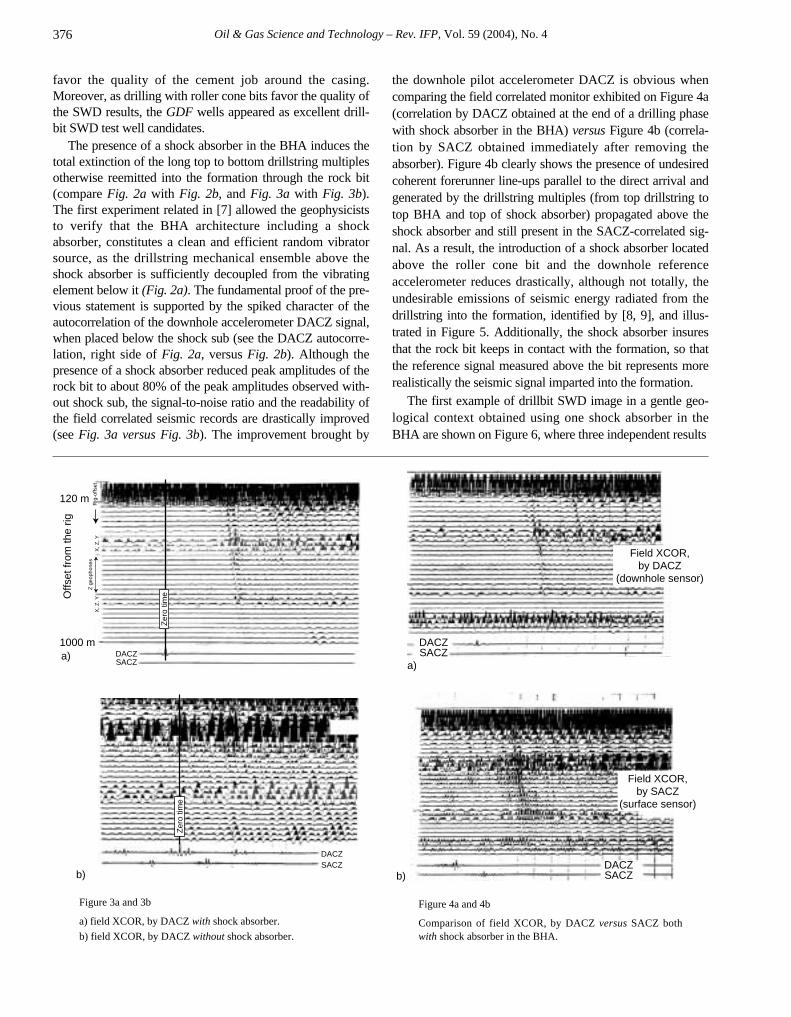
favor the quality of the cement job around the casing.Moreover, as drilling with roller cone bits favor the quality ofthe SWD results, the GDF wells appeared as excellent drill-bit SWD test well candidates.
The presence of a shock absorber in the BHA induces thetotal extinction of the long top to bottom drillstring multiplesotherwise reemitted into the formation through the rock bit(compare Fig. 2a with Fig. 2b, and Fig. 3a with Fig. 3b).The first experiment related in [7] allowed the geophysiciststo verify that the BHA architecture including a shockabsorber, constitutes a clean and efficient random vibratorsource, as the drillstring mechanical ensemble above theshock absorber is sufficiently decoupled from the vibratingelement below it (Fig. 2a). The fundamental proof of the pre-vious statement is supported by the spiked character of theautocorrelation of the downhole accelerometer DACZ signal,when placed below the shock sub (see the DACZ autocorre-lation, right side of Fig. 2a, versus Fig. 2b). Although thepresence of a shock absorber reduced peak amplitudes of therock bit to about 80% of the peak amplitudes observed with-out shock sub, the signal-to-noise ratio and the readability ofthe field correlated seismic records are drastically improved(see Fig. 3a versus Fig. 3b). The improvement brought by
the downhole pilot accelerometer DACZ is obvious whencomparing the field correlated monitor exhibited on Figure 4a(correlation by DACZ obtained at the end of a drilling phasewith shock absorber in the BHA) versus Figure 4b (correla-tion by SACZ obtained immediately after removing theabsorber). Figure 4b clearly shows the presence of undesiredcoherent forerunner line-ups parallel to the direct arrival andgenerated by the drillstring multiples (from top drillstring totop BHA and top of shock absorber) propagated above theshock absorber and still present in the SACZ-correlated sig-nal. As a result, the introduction of a shock absorber locatedabove the roller cone bit and the downhole referenceaccelerometer reduces drastically, although not totally, theundesirable emissions of seismic energy radiated from thedrillstring into the formation, identified by [8, 9], and illus-trated in Figure 5. Additionally, the shock absorber insuresthat the rock bit keeps in contact with the formation, so thatthe reference signal measured above the bit represents morerealistically the seismic signal imparted into the formation.
The first example of drillbit SWD image in a gentle geo-logical context obtained using one shock absorber in theBHA are shown on Figure 6, where three independent results
376
Offs
et fr
om th
e rig
X, Z
, YZ
geo
phon
esX
, Z, Y
Zer
o tim
e
120 m
1000 m
Rig
-offs
et
a) DACZSACZ
Figure 3a and 3b
a) field XCOR, by DACZ with shock absorber.
b) field XCOR, by DACZ without shock absorber.
DACZSACZ
Field XCOR,by DACZ
(downhole sensor)
a)
DACZSACZ
Field XCOR,by SACZ
(surface sensor)
b)
Figure 4a and 4b
Comparison of field XCOR, by DACZ versus SACZ bothwith shock absorber in the BHA.
Zer
o tim
e
DACZSACZ
b)
C Naville et al. / Seismic While Drilling (SWD) Techniques with Downhole Measurements
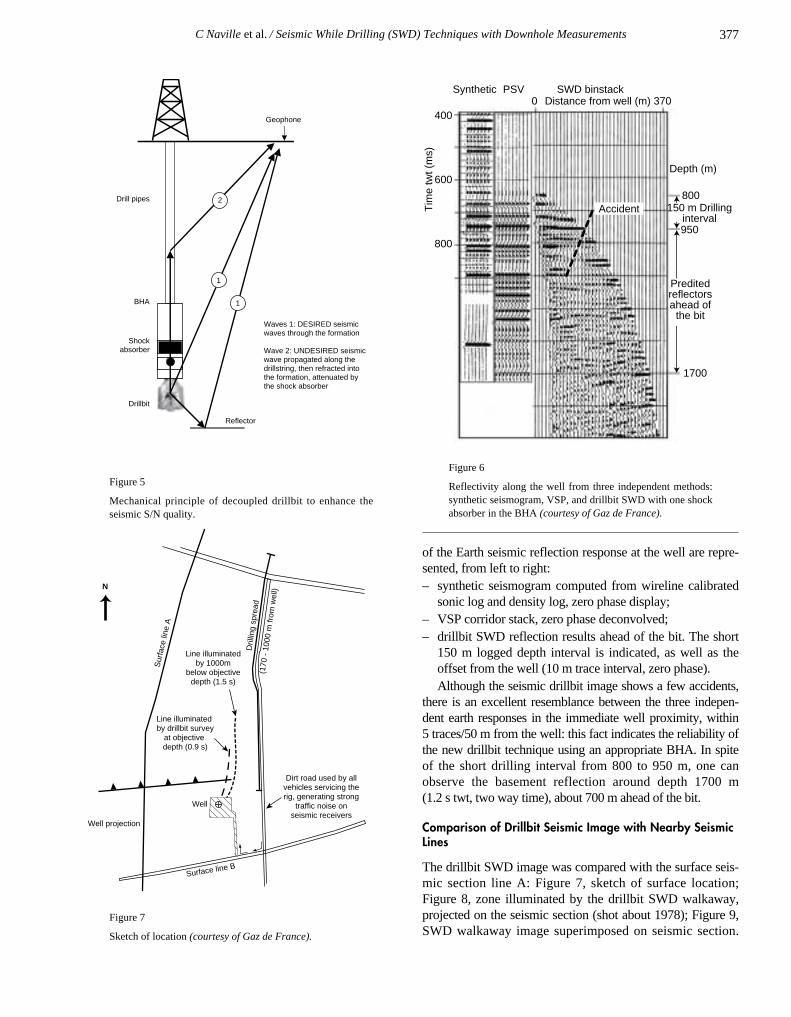
of the Earth seismic reflection response at the well are repre-sented, from left to right: – synthetic seismogram computed from wireline calibrated
sonic log and density log, zero phase display;– VSP corridor stack, zero phase deconvolved;– drillbit SWD reflection results ahead of the bit. The short
150 m logged depth interval is indicated, as well as theoffset from the well (10 m trace interval, zero phase).Although the seismic drillbit image shows a few accidents,
there is an excellent resemblance between the three indepen-dent earth responses in the immediate well proximity, within 5 traces/50 m from the well: this fact indicates the reliability ofthe new drillbit technique using an appropriate BHA. In spiteof the short drilling interval from 800 to 950 m, one canobserve the basement reflection around depth 1700 m (1.2 s twt, two way time), about 700 m ahead of the bit.
Comparison of Drillbit Seismic Image with Nearby SeismicLines
The drillbit SWD image was compared with the surface seis-mic section line A: Figure 7, sketch of surface location;Figure 8, zone illuminated by the drillbit SWD walkaway,projected on the seismic section (shot about 1978); Figure 9,SWD walkaway image superimposed on seismic section.
377
Reflector
Geophone
Drill pipes
BHA
Drillbit
1
1
2
Waves 1: DESIRED seismic waves through the formation
Wave 2: UNDESIRED seismic wave propagated along thedrillstring, then refracted intothe formation, attenuated bythe shock absorber
Shockabsorber
Synthetic PSV SWD binstackDistance from well (m) 3700
Depth (m)
800
950
1700
400
600
800
Tim
e tw
t (m
s)
Accident 150 m Drillinginterval
Preditedreflectorsahead of
the bit
Dirt road used by all vehicles servicing the rig, generating strong
traffic noise on seismic receivers
Line illuminated by drillbit survey
at objective depth (0.9 s)
Line illuminatedby 1000m
below objectivedepth (1.5 s)
Well projection
Well
Surface line B
Sur
face
line
A
Dril
ling
spre
ad(1
70 -
100
0 m
from
wel
l)N
Figure 5
Mechanical principle of decoupled drillbit to enhance theseismic S/N quality.
Figure 6
Reflectivity along the well from three independent methods:synthetic seismogram, VSP, and drillbit SWD with one shockabsorber in the BHA (courtesy of Gaz de France).
Figure 7
Sketch of location (courtesy of Gaz de France).
Oil & Gas Science and Technology – Rev. IFP, Vol. 59 (2004), No. 4
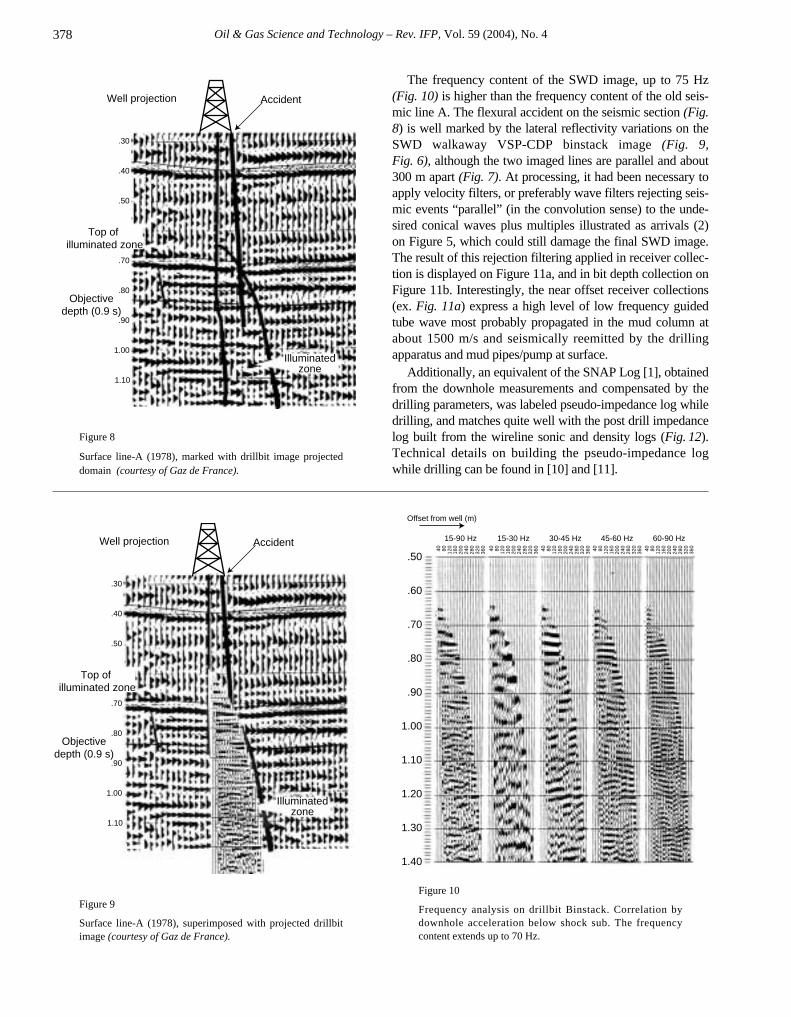
Figure 8
Surface line-A (1978), marked with drillbit image projecteddomain (courtesy of Gaz de France).
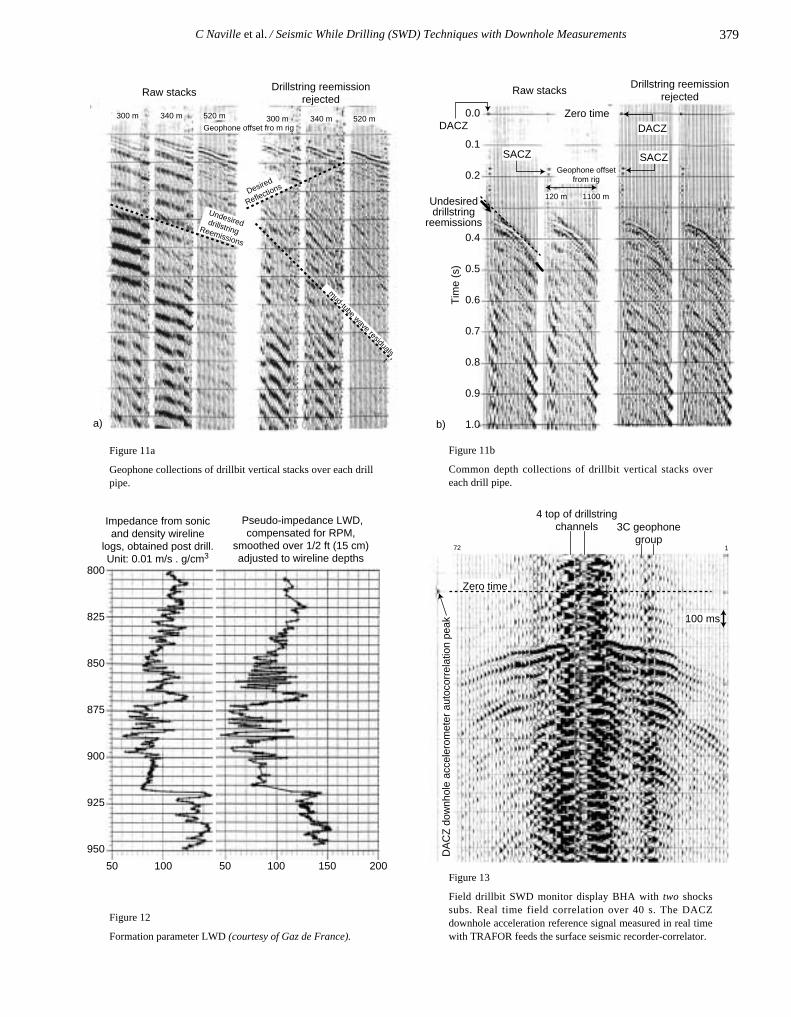
The frequency content of the SWD image, up to 75 Hz (Fig. 10) is higher than the frequency content of the old seis-mic line A. The flexural accident on the seismic section (Fig.8) is well marked by the lateral reflectivity variations on theSWD walkaway VSP-CDP binstack image (Fig. 9, Fig. 6), although the two imaged lines are parallel and about300 m apart (Fig. 7). At processing, it had been necessary toapply velocity filters, or preferably wave filters rejecting seis-mic events “parallel” (in the convolution sense) to the unde-sired conical waves plus multiples illustrated as arrivals (2)on Figure 5, which could still damage the final SWD image.The result of this rejection filtering applied in receiver collec-tion is displayed on Figure 11a, and in bit depth collection on Figure 11b. Interestingly, the near offset receiver collections(ex. Fig. 11a) express a high level of low frequency guidedtube wave most probably propagated in the mud column atabout 1500 m/s and seismically reemitted by the drillingapparatus and mud pipes/pump at surface.
Additionally, an equivalent of the SNAP Log [1], obtainedfrom the downhole measurements and compensated by thedrilling parameters, was labeled pseudo-impedance log whiledrilling, and matches quite well with the post drill impedancelog built from the wireline sonic and density logs (Fig. 12).Technical details on building the pseudo-impedance logwhile drilling can be found in [10] and [11].
1.00
1.10
.90
.80
.70
.60
.50
.40
.30
Well projection Accident
Objectivedepth (0.9 s)
Illuminatedzone
Top of illuminated zone
378
1.00
1.10
.90
.80
.70
.60
.50
.40
.30
Well projection Accident
Objectivedepth (0.9 s)
Illuminatedzone
Top of illuminated zone
1.00
1.10
1.20
1.30
1.40
.90
.80
.70
.60
.50
40 80 120
160
200
240
280
320
360
15-90 Hz
40 80 120
160
200
240
280
320
360
15-30 Hz40 80 12
016
020
024
028
032
036
0
30-45 Hz
40 80 120
160
200
240
280
320
360
45-60 Hz
40 80 120
160
200
240
280
320
360
60-90 Hz
Offset from well (m)
Figure 9
Surface line-A (1978), superimposed with projected drillbitimage (courtesy of Gaz de France).
Figure 10
Frequency analysis on drillbit Binstack. Correlation bydownhole acceleration below shock sub. The frequencycontent extends up to 70 Hz.
C Naville et al. / Seismic While Drilling (SWD) Techniques with Downhole Measurements 379
Undesired drillstring Reemissions
mud-tube wave residuals
t
Desired
Reflections
Drillstring reemissionrejected
Raw stacks
300 m 340 m 520 m 300 m 340 m 520 mGeophone offset fro m rig
a)
0.0
0.1
0.2
0.4
0.5
0.6
0.7
0.8
0.9
1.0
Tim
e (s
)
Undesireddrillstring
reemissions
Geophone offsetfrom rig
1100 m120 m
Drillstring reemissionrejected
Raw stacks
Zero timeDACZ
SACZ SACZ
b)
DACZ
50 100 50 100 150 200
Impedance from sonic and density wireline
logs, obtained post drill.Unit: 0.01 m/s . g/cm3
Pseudo-impedance LWD,compensated for RPM,
smoothed over 1/2 ft (15 cm) adjusted to wireline depths
800
825
850
875
900
925
950 DA
CZ
dow
nhol
e ac
cele
rom
eter
aut
ocor
rela
tion
peak
Zero time
72 1
100 ms
3C geophonegroup
4 top of drillstringchannels
Figure 11a
Geophone collections of drillbit vertical stacks over each drillpipe.
Figure 11b
Common depth collections of drillbit vertical stacks overeach drill pipe.
Figure 12
Formation parameter LWD (courtesy of Gaz de France).
Figure 13
Field drillbit SWD monitor display BHA with two shockssubs. Real time field correlation over 40 s. The DACZdownhole acceleration reference signal measured in real timewith TRAFOR feeds the surface seismic recorder-correlator.
Oil & Gas Science and Technology – Rev. IFP, Vol. 59 (2004), No. 4
1.2 Drillbit SWD with TRAFOR and Two ShockAbsorbers in the BHA
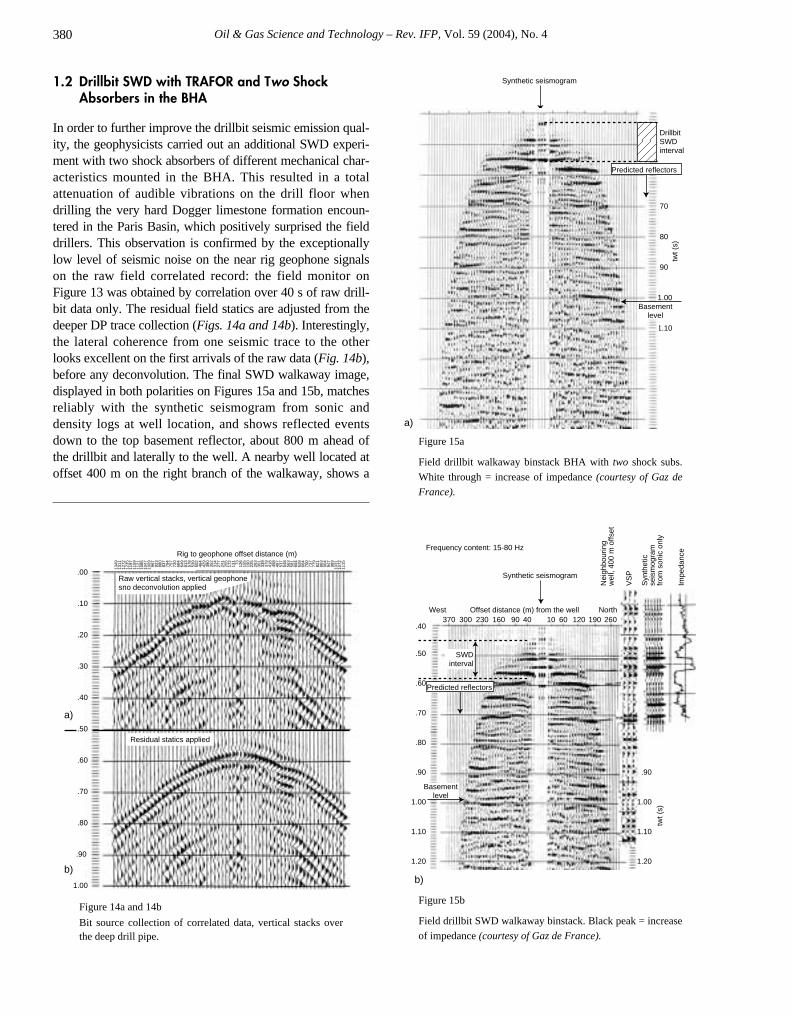
In order to further improve the drillbit seismic emission qual-ity, the geophysicists carried out an additional SWD experi-ment with two shock absorbers of different mechanical char-acteristics mounted in the BHA. This resulted in a totalattenuation of audible vibrations on the drill floor whendrilling the very hard Dogger limestone formation encoun-tered in the Paris Basin, which positively surprised the fielddrillers. This observation is confirmed by the exceptionallylow level of seismic noise on the near rig geophone signalson the raw field correlated record: the field monitor on Figure 13 was obtained by correlation over 40 s of raw drill-bit data only. The residual field statics are adjusted from thedeeper DP trace collection (Figs. 14a and 14b). Interestingly,the lateral coherence from one seismic trace to the otherlooks excellent on the first arrivals of the raw data (Fig. 14b),before any deconvolution. The final SWD walkaway image,displayed in both polarities on Figures 15a and 15b, matchesreliably with the synthetic seismogram from sonic and density logs at well location, and shows reflected eventsdown to the top basement reflector, about 800 m ahead of the drillbit and laterally to the well. A nearby well located atoffset 400 m on the right branch of the walkaway, shows a
Figure 14a and 14b
Bit source collection of correlated data, vertical stacks overthe deep drill pipe.
Figure 15a
Field drillbit walkaway binstack BHA with two shock subs.
White through = increase of impedance (courtesy of Gaz de
France).
Figure 15b
Field drillbit SWD walkaway binstack. Black peak = increase
of impedance (courtesy of Gaz de France).
Frequency content: 15-80 Hz
1.20
1.10
1.00
.90
1.20
1.10
1.00
.90
.80
.70
.60
.50
.40104090160230300370 60 120 190 260
twt (
s)
West North Offset distance (m) from the well
Basementlevel
SWDinterval
Synthetic seismogram
Nei
ghbo
urin
g w
ell,
400
m o
ffset
VS
P
Syn
thet
ic
seis
mog
ram
from
son
ic o
nly
Impe
danc
ePredicted reflectors
b)
1.10
.90
.80
.70
twt (
s)
Synthetic seismogram
1.00Basement
level
DrillbitSWDinterval
Predicted reflectors
a)
.00
.10
.20
.30
.40
.50
.60
.70
.80
.90
1.00
Residual statics applied
1349
1311
12
7212
3511
9711
5911
2110
8510
4710
09 967
923
880
837
794
757
720
684
649
613
578
539
502
464
429
390
352
314
277
241
205
172
131 73 126
155
190
225
263
301
339
379
418
458
497
537
548
563
581
604
628
664
700
737
779
821
863
904
947
989
1031
1072
1115
Raw vertical stacks, vertical geophonesno deconvolution applied
Rig to geophone offset distance (m)
a)
b)
380
C Naville et al. / Seismic While Drilling (SWD) Techniques with Downhole Measurements
fair resemblance with the walkaway image (right side of Fig. 15b). Remarkably, this reverse walkaway SWD imagewas obtained with no more processing effort as for a conven-tional direct walkaway recorded post drilling with a surfacesource and a multilevel string of downhole seismic receiversclamped on the borehole wall. Financially, the rental cost of ashock absorber is lower than the processing cost of heavy filtering the raw data, and the final walkaway SWD reflectionimage is cleaner and more reliable.
1.3 Transfer Function of a Shock Absorber
We describe here the measurement of the transfer function ofa shock absorber with TRAFOR in drilling conditions.
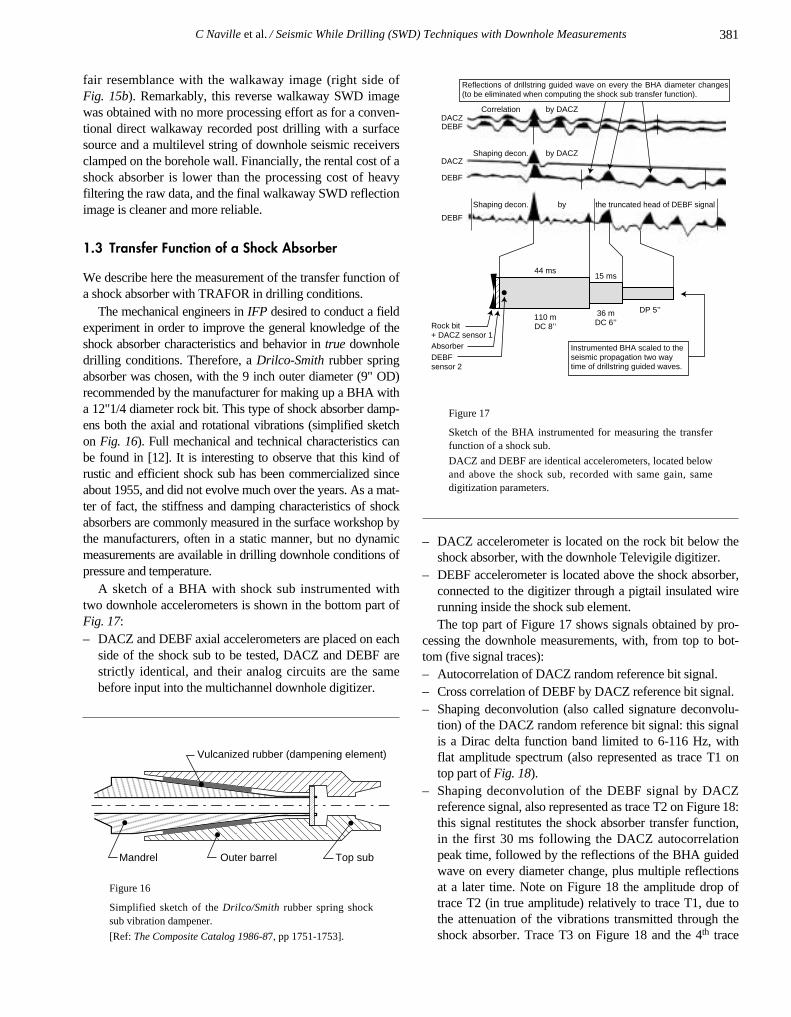
The mechanical engineers in IFP desired to conduct a fieldexperiment in order to improve the general knowledge of theshock absorber characteristics and behavior in true downholedrilling conditions. Therefore, a Drilco-Smith rubber springabsorber was chosen, with the 9 inch outer diameter (9" OD)recommended by the manufacturer for making up a BHA witha 12"1/4 diameter rock bit. This type of shock absorber damp-ens both the axial and rotational vibrations (simplified sketchon Fig. 16). Full mechanical and technical characteristics canbe found in [12]. It is interesting to observe that this kind ofrustic and efficient shock sub has been commercialized sinceabout 1955, and did not evolve much over the years. As a mat-ter of fact, the stiffness and damping characteristics of shockabsorbers are commonly measured in the surface workshop bythe manufacturers, often in a static manner, but no dynamicmeasurements are available in drilling downhole conditions ofpressure and temperature.
A sketch of a BHA with shock sub instrumented with two downhole accelerometers is shown in the bottom part ofFig. 17:– DACZ and DEBF axial accelerometers are placed on each
side of the shock sub to be tested, DACZ and DEBF arestrictly identical, and their analog circuits are the samebefore input into the multichannel downhole digitizer.
Figure 16
Simplified sketch of the Drilco/Smith rubber spring shocksub vibration dampener.
[Ref: The Composite Catalog 1986-87, pp 1751-1753].
Figure 17
Sketch of the BHA instrumented for measuring the transferfunction of a shock sub.
DACZ and DEBF are identical accelerometers, located belowand above the shock sub, recorded with same gain, samedigitization parameters.
– DACZ accelerometer is located on the rock bit below theshock absorber, with the downhole Televigile digitizer.
– DEBF accelerometer is located above the shock absorber,connected to the digitizer through a pigtail insulated wirerunning inside the shock sub element. The top part of Figure 17 shows signals obtained by pro-
cessing the downhole measurements, with, from top to bot-tom (five signal traces):– Autocorrelation of DACZ random reference bit signal.– Cross correlation of DEBF by DACZ reference bit signal.– Shaping deconvolution (also called signature deconvolu-
tion) of the DACZ random reference bit signal: this signalis a Dirac delta function band limited to 6-116 Hz, withflat amplitude spectrum (also represented as trace T1 ontop part of Fig. 18).
– Shaping deconvolution of the DEBF signal by DACZ reference signal, also represented as trace T2 on Figure 18:this signal restitutes the shock absorber transfer function,in the first 30 ms following the DACZ autocorrelationpeak time, followed by the reflections of the BHA guidedwave on every diameter change, plus multiple reflectionsat a later time. Note on Figure 18 the amplitude drop oftrace T2 (in true amplitude) relatively to trace T1, due tothe attenuation of the vibrations transmitted through theshock absorber. Trace T3 on Figure 18 and the 4th trace
DACZDEBF
DACZ
DEBF
DEBF
Correlation
Shaping decon.
Shaping decon.
by DACZ
by DACZ
by the truncated head of DEBF signal
Absorber
Rock bit+ DACZ sensor 1
DEBFsensor 2
44 ms
110 mDC 8’’
15 ms
36 mDC 6’’
DP 5’’
Instrumented BHA scaled to the seismic propagation two way time of drillstring guided waves.
Reflections of drillstring guided wave on every the BHA diameter changes (to be eliminated when computing the shock sub transfer function).
Mandrel Outer barrel Top sub
Vulcanized rubber (dampening element)
381
Oil & Gas Science and Technology – Rev. IFP, Vol. 59 (2004), No. 4
from the top on Figure 17, both represent the same signalas trace T2, but with normalized amplitude (peak ampli-tude equals unit amplitude).
– Shaping deconvolution of the previous DEBF signal bythe shock absorber transfer function signal (same signalrestricted to its head wavelet by truncation of the signaltail). This operation enhances the readability of the BHAmultiples: the sketch of the BHA on the bottom is trans-formed into seismic time scale by division of the BHAlength by the 5000 m/s velocity factor corresponding to the acoustic velocity of BHA guided waves in the borehole.
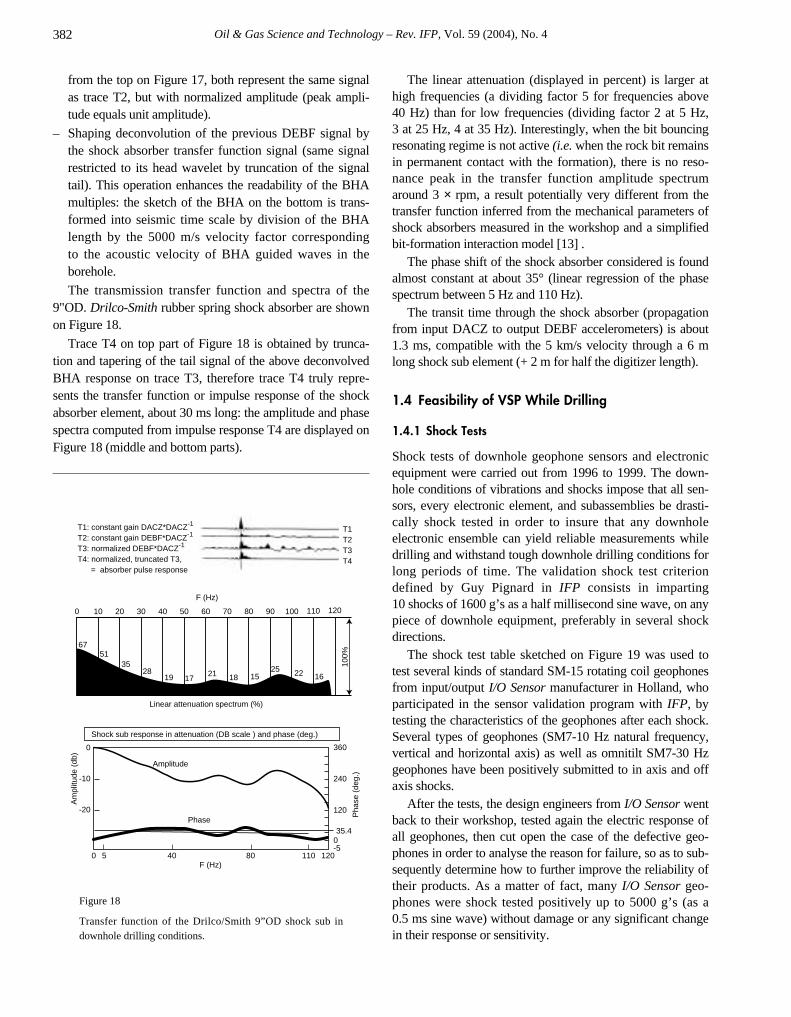
The transmission transfer function and spectra of the9"OD. Drilco-Smith rubber spring shock absorber are shownon Figure 18.
Trace T4 on top part of Figure 18 is obtained by trunca-tion and tapering of the tail signal of the above deconvolvedBHA response on trace T3, therefore trace T4 truly repre-sents the transfer function or impulse response of the shockabsorber element, about 30 ms long: the amplitude and phasespectra computed from impulse response T4 are displayed on Figure 18 (middle and bottom parts).
Figure 18
Transfer function of the Drilco/Smith 9”OD shock sub indownhole drilling conditions.
The linear attenuation (displayed in percent) is larger athigh frequencies (a dividing factor 5 for frequencies above40 Hz) than for low frequencies (dividing factor 2 at 5 Hz, 3 at 25 Hz, 4 at 35 Hz). Interestingly, when the bit bouncingresonating regime is not active (i.e. when the rock bit remainsin permanent contact with the formation), there is no reso-nance peak in the transfer function amplitude spectrumaround 3 × rpm, a result potentially very different from thetransfer function inferred from the mechanical parameters ofshock absorbers measured in the workshop and a simplifiedbit-formation interaction model [13] .
The phase shift of the shock absorber considered is foundalmost constant at about 35° (linear regression of the phasespectrum between 5 Hz and 110 Hz).
The transit time through the shock absorber (propagationfrom input DACZ to output DEBF accelerometers) is about1.3 ms, compatible with the 5 km/s velocity through a 6 mlong shock sub element (+ 2 m for half the digitizer length).
1.4 Feasibility of VSP While Drilling
1.4.1 Shock Tests
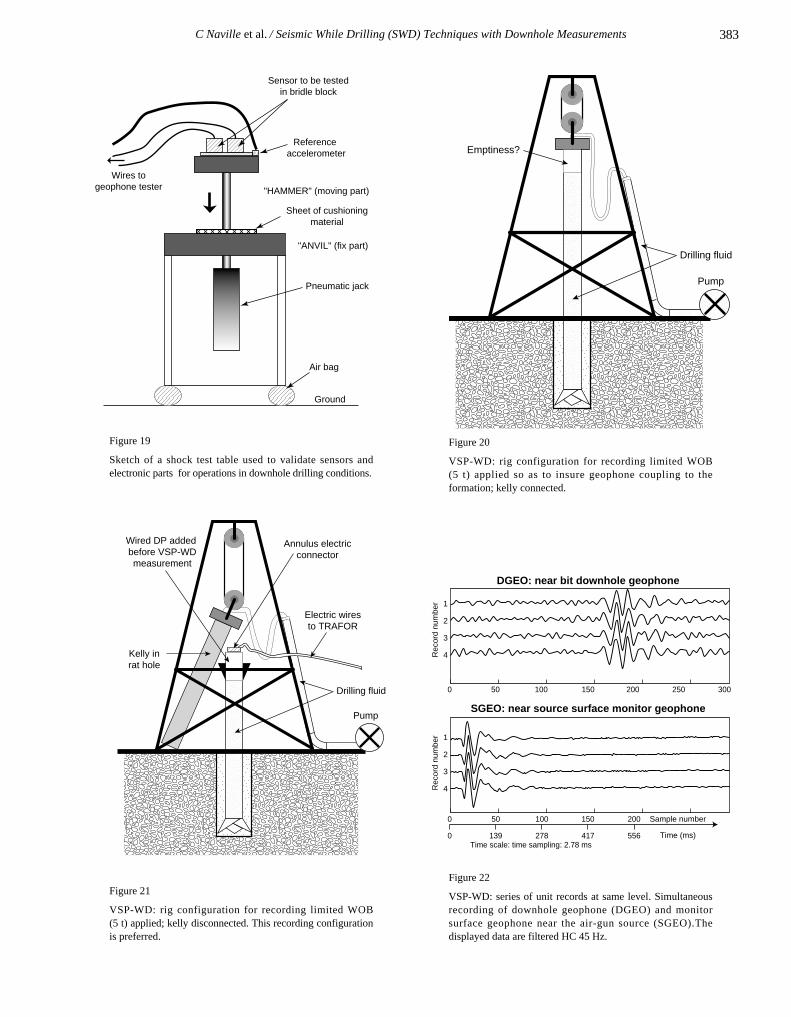
Shock tests of downhole geophone sensors and electronicequipment were carried out from 1996 to 1999. The down-hole conditions of vibrations and shocks impose that all sen-sors, every electronic element, and subassemblies be drasti-cally shock tested in order to insure that any downholeelectronic ensemble can yield reliable measurements whiledrilling and withstand tough downhole drilling conditions forlong periods of time. The validation shock test criteriondefined by Guy Pignard in IFP consists in imparting 10 shocks of 1600 g’s as a half millisecond sine wave, on anypiece of downhole equipment, preferably in several shockdirections.
The shock test table sketched on Figure 19 was used totest several kinds of standard SM-15 rotating coil geophonesfrom input/output I/O Sensor manufacturer in Holland, whoparticipated in the sensor validation program with IFP, bytesting the characteristics of the geophones after each shock.Several types of geophones (SM7-10 Hz natural frequency,vertical and horizontal axis) as well as omnitilt SM7-30 Hzgeophones have been positively submitted to in axis and offaxis shocks.
After the tests, the design engineers from I/O Sensor wentback to their workshop, tested again the electric response ofall geophones, then cut open the case of the defective geo-phones in order to analyse the reason for failure, so as to sub-sequently determine how to further improve the reliability oftheir products. As a matter of fact, many I/O Sensor geo-phones were shock tested positively up to 5000 g’s (as a 0.5 ms sine wave) without damage or any significant changein their response or sensitivity.
0 5 40 80 110 120
0
-10
-20
035.4
120
240
360
-5
F (Hz)
F (Hz)
Am
plitu
de (
db)
Pha
se (
deg.
)
T1: constant gain DACZ*DACZ-1
T2: constant gain DEBF*DACZ-1
T3: normalized DEBF*DACZ-1
T4: normalized, truncated T3, = absorber pulse response
T1T2T3T4
0 10 20 30 40 50 60 70 80 90 100 110 120
6751
3528
19 1721 18 15
25 22 16
Linear attenuation spectrum (%)
100%
Shock sub response in attenuation (DB scale ) and phase (deg.)
Amplitude
Phase
382
C Naville et al. / Seismic While Drilling (SWD) Techniques with Downhole Measurements 383
Reference accelerometer
Pneumatic jack
Ground
Air bag
Wires togeophone tester
"ANVIL" (fix part)
"HAMMER" (moving part)
Sensor to be testedin bridle block
Sheet of cushioningmaterial
Emptiness?
Drilling fluid
Pump
Electric wiresto TRAFOR
Wired DP added before VSP-WDmeasurement
Kelly inrat hole
Annulus electricconnector
Drilling fluid
Pump
1
2
3
4
1
2
3
4
Sample number
Time (ms)Time scale: time sampling: 2.78 ms
0 139 278 417 556
0 50 100 150 200
0 50 100 150 200 250 300
DGEO: near bit downhole geophone
SGEO: near source surface monitor geophone
Rec
ord
num
ber
Rec
ord
num
ber
Figure 19
Sketch of a shock test table used to validate sensors andelectronic parts for operations in downhole drilling conditions.
Figure 20
VSP-WD: rig configuration for recording limited WOB (5 t) applied so as to insure geophone coupling to theformation; kelly connected.
Figure 21
VSP-WD: rig configuration for recording limited WOB(5 t) applied; kelly disconnected. This recording configurationis preferred.
Figure 22
VSP-WD: series of unit records at same level. Simultaneousrecording of downhole geophone (DGEO) and monitorsurface geophone near the air-gun source (SGEO).Thedisplayed data are filtered HC 45 Hz.
Oil & Gas Science and Technology – Rev. IFP, Vol. 59 (2004), No. 4
Given the proven sturdiness of the geophone receivers, aVSP test program could be pursued by IFP on one hand, andthe miniaturisation of the geophones could be envisaged byI/O Sensor on the other hand.
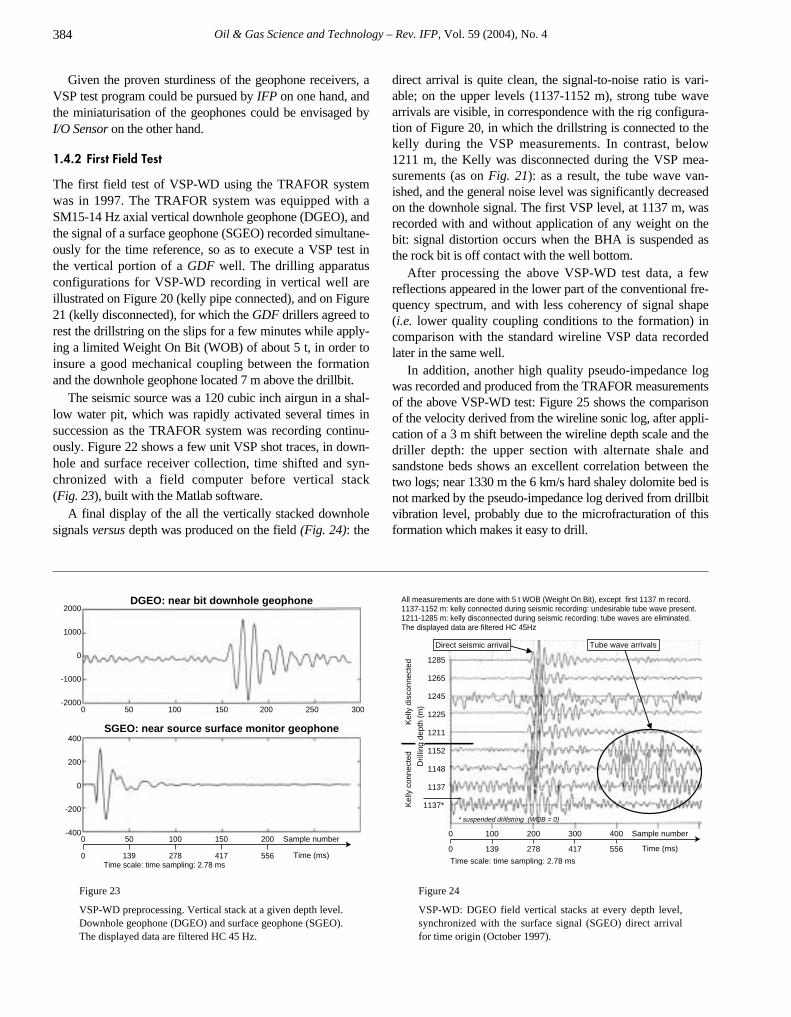
1.4.2 First Field Test
The first field test of VSP-WD using the TRAFOR systemwas in 1997. The TRAFOR system was equipped with aSM15-14 Hz axial vertical downhole geophone (DGEO), andthe signal of a surface geophone (SGEO) recorded simultane-ously for the time reference, so as to execute a VSP test inthe vertical portion of a GDF well. The drilling apparatusconfigurations for VSP-WD recording in vertical well areillustrated on Figure 20 (kelly pipe connected), and on Figure21 (kelly disconnected), for which the GDF drillers agreed torest the drillstring on the slips for a few minutes while apply-ing a limited Weight On Bit (WOB) of about 5 t, in order toinsure a good mechanical coupling between the formationand the downhole geophone located 7 m above the drillbit.
The seismic source was a 120 cubic inch airgun in a shal-low water pit, which was rapidly activated several times insuccession as the TRAFOR system was recording continu-ously. Figure 22 shows a few unit VSP shot traces, in down-hole and surface receiver collection, time shifted and syn-chronized with a field computer before vertical stack (Fig. 23), built with the Matlab software.
A final display of the all the vertically stacked downholesignals versus depth was produced on the field (Fig. 24): the
direct arrival is quite clean, the signal-to-noise ratio is vari-able; on the upper levels (1137-1152 m), strong tube wavearrivals are visible, in correspondence with the rig configura-tion of Figure 20, in which the drillstring is connected to thekelly during the VSP measurements. In contrast, below 1211 m, the Kelly was disconnected during the VSP mea-surements (as on Fig. 21): as a result, the tube wave van-ished, and the general noise level was significantly decreasedon the downhole signal. The first VSP level, at 1137 m, wasrecorded with and without application of any weight on thebit: signal distortion occurs when the BHA is suspended asthe rock bit is off contact with the well bottom.
After processing the above VSP-WD test data, a fewreflections appeared in the lower part of the conventional fre-quency spectrum, and with less coherency of signal shape(i.e. lower quality coupling conditions to the formation) incomparison with the standard wireline VSP data recordedlater in the same well.
In addition, another high quality pseudo-impedance logwas recorded and produced from the TRAFOR measurementsof the above VSP-WD test: Figure 25 shows the comparisonof the velocity derived from the wireline sonic log, after appli-cation of a 3 m shift between the wireline depth scale and thedriller depth: the upper section with alternate shale and sandstone beds shows an excellent correlation between thetwo logs; near 1330 m the 6 km/s hard shaley dolomite bed isnot marked by the pseudo-impedance log derived from drillbitvibration level, probably due to the microfracturation of thisformation which makes it easy to drill.
384
2000
1000
0
-1000
-2000
400
200
0
-200
-400Sample number
Time (ms)Time scale: time sampling: 2.78 ms
0 139 278 417 556
0 50 100 150 200
0 50 100 150 200 250 300
DGEO: near bit downhole geophone
SGEO: near source surface monitor geophone
Kel
ly c
onne
cted
Kel
ly d
isco
nnec
ted
All measurements are done with 5 t WOB (Weight On Bit), except first 1137 m record. 1137-1152 m: kelly connected during seismic recording: undesirable tube wave present. 1211-1285 m: kelly disconnected during seismic recording: tube waves are eliminated.The displayed data are filtered HC 45Hz
1285
1265
1245
1225
1211
1152
1148
1137
1137*
Direct seismic arrival Tube wave arrivals
Sample number
Time (ms)
Time scale: time sampling: 2.78 ms
0 139 278 417 556
0 100 200 300 400
Dril
ling
dept
h (m
)
* suspended drillstring (WOB = 0)
Figure 23
VSP-WD preprocessing. Vertical stack at a given depth level.Downhole geophone (DGEO) and surface geophone (SGEO).The displayed data are filtered HC 45 Hz.
Figure 24
VSP-WD: DGEO field vertical stacks at every depth level,synchronized with the surface signal (SGEO) direct arrivalfor time origin (October 1997).
C Naville et al. / Seismic While Drilling (SWD) Techniques with Downhole Measurements
1.5 Industrialization
We describe here an industrialization approach of the drillbit-SWD and VSP-WD techniques using wireless downholemeasurement technology.
The experimental drillbit SWD tests run by IFP in theParis Basin with the TRAFOR wireline transmission systemallowed two conclusions to be drawn. Firstly, reliable drillbitseismic reflection results can be obtained up to 70 Hz using aroller cone bit (with teeth/insert length not too small) with oneor two shock absorbers in the BHA and a downhole referencesensor in between, provided that the formation under drillingis not too tender. Secondly, in practice, the P-wave velocityVp should, in practice, exceed 2500 m/s in order to haveenough drillbit seismic energy. Reliable seismic reflectionshave been recovered up to 1000 m or more ahead of the bit.
Moreover, as the TRAFOR system is more intrusive andheavy-to-operate for the drilling teams in comparison withexisting wireless MWD systems, other transmission and datatransmission avenues needed to be explored in order toapproach the industrial drilling sites with SWD applications
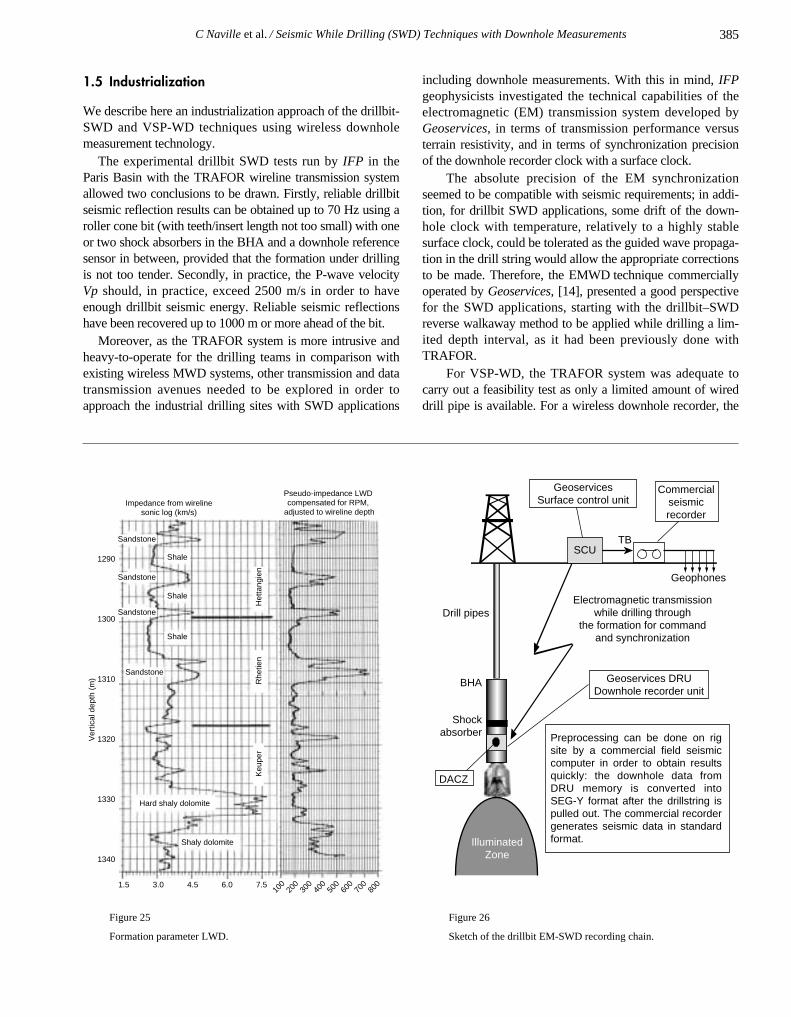
including downhole measurements. With this in mind, IFPgeophysicists investigated the technical capabilities of theelectromagnetic (EM) transmission system developed byGeoservices, in terms of transmission performance versusterrain resistivity, and in terms of synchronization precisionof the downhole recorder clock with a surface clock.
The absolute precision of the EM synchronizationseemed to be compatible with seismic requirements; in addi-tion, for drillbit SWD applications, some drift of the down-hole clock with temperature, relatively to a highly stable surface clock, could be tolerated as the guided wave propaga-tion in the drill string would allow the appropriate correctionsto be made. Therefore, the EMWD technique commerciallyoperated by Geoservices, [14], presented a good perspectivefor the SWD applications, starting with the drillbit–SWDreverse walkaway method to be applied while drilling a lim-ited depth interval, as it had been previously done withTRAFOR.
For VSP-WD, the TRAFOR system was adequate tocarry out a feasibility test as only a limited amount of wireddrill pipe is available. For a wireless downhole recorder, the
385
Hard shaly dolomite
Shaly dolomite
1290
1300
1310
1320
1330
1340
1.5 3.0 4.5 6.0 7.5
Ver
tical
dep
th (
m)
100
200
300
400
500
600
700
800
Keu
per
Het
tang
ien
Rhe
tien
Sandstone
Sandstone
Sandstone
Sandstone
Shale
Shale
Shale
Pseudo-impedance LWD compensated for RPM,
adjusted to wireline depthImpedance from wireline
sonic log (km/s)
Geophones
SCU
BHA
GeoservicesSurface control unit
Drill pipes
Geoservices DRUDownhole recorder unit
Electromagnetic transmissionwhile drilling through
the formation for commandand synchronization
TB
Commercialseismicrecorder
DACZ
IlluminatedZone
Shockabsorber Preprocessing can be done on rig
site by a commercial field seismic computer in order to obtain results quickly: the downhole data from DRU memory is converted into SEG-Y format after the drillstring is pulled out. The commercial recorder generates seismic data in standard format.
Figure 25
Formation parameter LWD.
Figure 26
Sketch of the drillbit EM-SWD recording chain.
Oil & Gas Science and Technology – Rev. IFP, Vol. 59 (2004), No. 4
tolerance on the downhole clock drift would be much moresevere than for the drillbit-SWD method, of the order of 1 msover 5 or 10 days, and this point would have required anadditional technological improvement of its own.
Another economical argument was in favor of develop-ing a drillbit-SWD prototype first, rather than an VSP-WDprototype: a commercial drillbit-SWD downhole recorder-WD can be built as a central tool to be used only over a depthinterval of 200 to 400 m in a vertical to low deviated well,around mid target depth. In contrast, a VSP-WD downholerecorder would have to work in the deep section of all kindsof borehole, vertical to horizontal, therefore it must be builtin the steel crown of a drill collar, resulting in higher costs.
The above reasons lead IFP and Geoservices to developa wireless SWD prototype for the drillbit-SWD method inthe first instance. Depending on the success of this first co-operation project, the more challenging VSP-WD methodwould be engaged in a second stage.
2 WIRELESS DRILLBIT EM-SWD
This method was implemented by a demonstrator downholeMWD recorder prototype in the framework of an ENEL-Geoservices-IFP project carried out in 1997-2000 with par-tial funding of the EC (project GE 019/96).
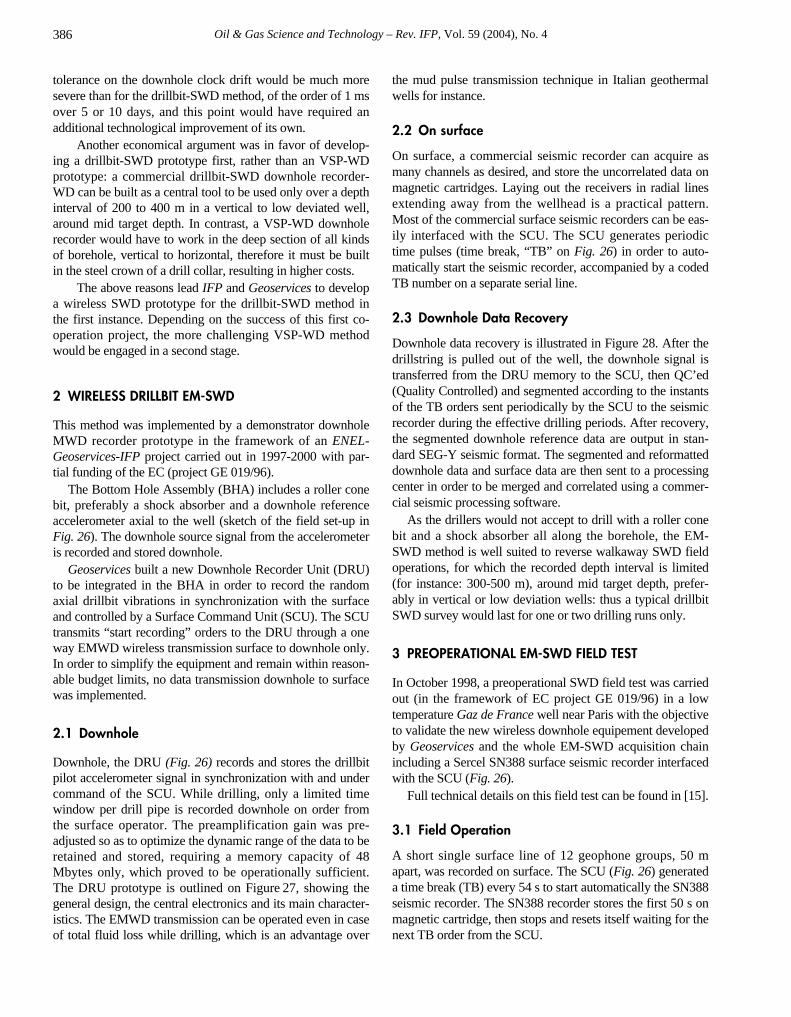
The Bottom Hole Assembly (BHA) includes a roller conebit, preferably a shock absorber and a downhole referenceaccelerometer axial to the well (sketch of the field set-up inFig. 26). The downhole source signal from the accelerometeris recorded and stored downhole.
Geoservices built a new Downhole Recorder Unit (DRU)to be integrated in the BHA in order to record the randomaxial drillbit vibrations in synchronization with the surfaceand controlled by a Surface Command Unit (SCU). The SCUtransmits “start recording” orders to the DRU through a oneway EMWD wireless transmission surface to downhole only.In order to simplify the equipment and remain within reason-able budget limits, no data transmission downhole to surfacewas implemented.
2.1 Downhole
Downhole, the DRU (Fig. 26) records and stores the drillbitpilot accelerometer signal in synchronization with and undercommand of the SCU. While drilling, only a limited timewindow per drill pipe is recorded downhole on order fromthe surface operator. The preamplification gain was pre-adjusted so as to optimize the dynamic range of the data to beretained and stored, requiring a memory capacity of 48Mbytes only, which proved to be operationally sufficient.The DRU prototype is outlined on Figure 27, showing thegeneral design, the central electronics and its main character-istics. The EMWD transmission can be operated even in caseof total fluid loss while drilling, which is an advantage over
the mud pulse transmission technique in Italian geothermalwells for instance.
2.2 On surface
On surface, a commercial seismic recorder can acquire asmany channels as desired, and store the uncorrelated data onmagnetic cartridges. Laying out the receivers in radial linesextending away from the wellhead is a practical pattern.Most of the commercial surface seismic recorders can be eas-ily interfaced with the SCU. The SCU generates periodictime pulses (time break, “TB” on Fig. 26) in order to auto-matically start the seismic recorder, accompanied by a codedTB number on a separate serial line.
2.3 Downhole Data Recovery
Downhole data recovery is illustrated in Figure 28. After thedrillstring is pulled out of the well, the downhole signal istransferred from the DRU memory to the SCU, then QC’ed(Quality Controlled) and segmented according to the instantsof the TB orders sent periodically by the SCU to the seismicrecorder during the effective drilling periods. After recovery,the segmented downhole reference data are output in stan-dard SEG-Y seismic format. The segmented and reformatteddownhole data and surface data are then sent to a processingcenter in order to be merged and correlated using a commer-cial seismic processing software.
As the drillers would not accept to drill with a roller conebit and a shock absorber all along the borehole, the EM-SWD method is well suited to reverse walkaway SWD fieldoperations, for which the recorded depth interval is limited(for instance: 300-500 m), around mid target depth, prefer-ably in vertical or low deviation wells: thus a typical drillbitSWD survey would last for one or two drilling runs only.
3 PREOPERATIONAL EM-SWD FIELD TEST
In October 1998, a preoperational SWD field test was carriedout (in the framework of EC project GE 019/96) in a lowtemperature Gaz de France well near Paris with the objectiveto validate the new wireless downhole equipement developedby Geoservices and the whole EM-SWD acquisition chainincluding a Sercel SN388 surface seismic recorder interfacedwith the SCU (Fig. 26).
Full technical details on this field test can be found in [15].
3.1 Field Operation
A short single surface line of 12 geophone groups, 50 mapart, was recorded on surface. The SCU (Fig. 26) generateda time break (TB) every 54 s to start automatically the SN388seismic recorder. The SN388 recorder stores the first 50 s onmagnetic cartridge, then stops and resets itself waiting for thenext TB order from the SCU.
386
C Naville et al. / Seismic While Drilling (SWD) Techniques with Downhole Measurements
After Pull Out Of the Hole (POOH), all the downhole datawere correctly recovered: 1000 time segments of 54 s wereextracted with 8 bits sample, per 4 ms sample rate, and 1300 time segments in sign bit (1 bit per sample), all con-verted into SEG-Y format. On surface, 2400 seismic recordsof 50 s with 16 channels were stored by the SN388 on IBM 3490 cartridges in SEG-D format. Downhole and surfacechannels were almost continuously recorded during the effec-tive drilling periods.
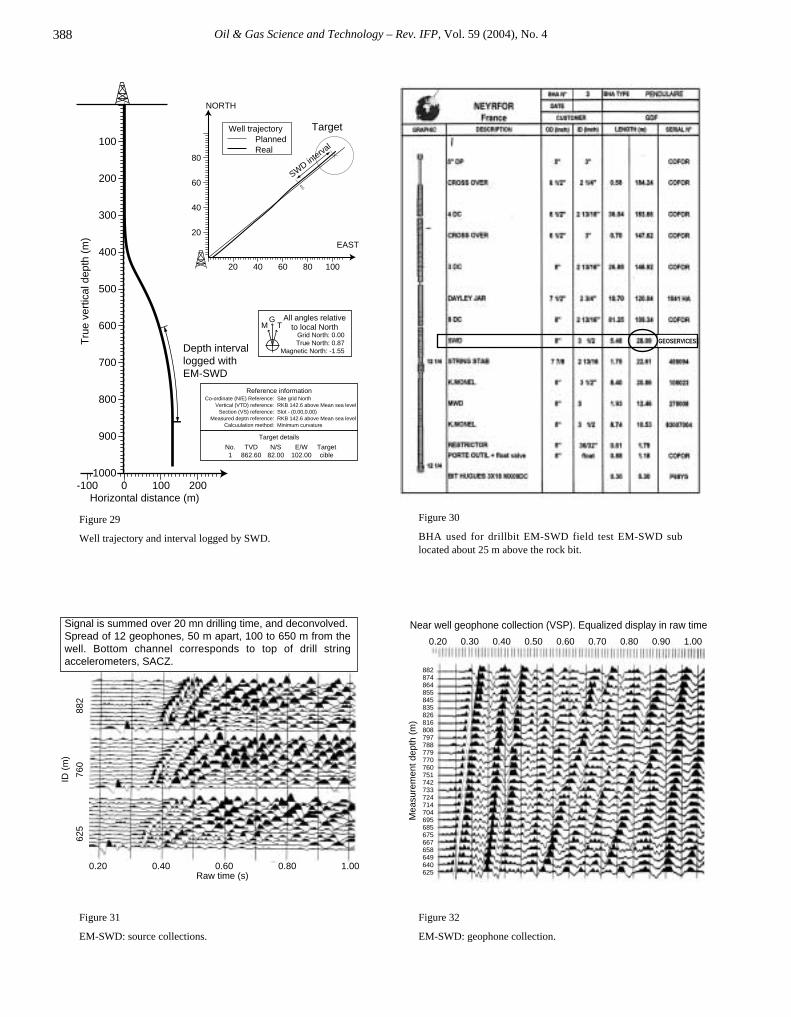
Two vertical accelerometers SACZ were placed at the topof the drill string and connected to the seismic recorder. Theseismic acquisition occurred during the drilling of the devi-ated part of a Gaz de France well, up to 25° incidence, in the12" 1/4 diameter, from 620 to 880 m depth, as illustrated bythe well trajectory Figure 29. The downhole EM-SWDrecording sub (Fig. 27) was placed above the directional mudpulse MWD system in the BHA sketched on Figure 30, about 25 m above the rock bit. The mud pulse transmission was notaltered by the presence of the EM-SWD sub.
Although the presence of a shock absorber in the BHA isrecommended to attenuate undesired drill string head waves[2-4], GDF drilling operators did not wish to have any shockabsorber in the deviated well part. During the operation, theEM orders were sent downhole during the drill pipe connec-
tion manoeuvre while the drill string is seated on the slips.Thus, the EM signal is optimal and no rig downtime is neces-sary for the surface to downhole transmission of EM start orders.
3.2 In House Preprocessing
The preprocessing phase addresses the questions of mergingcontrol of the downhole and surface data, synchronizationcontrol and correction of the clock drift between the down-hole and surface recorders. The TB pulse number labelling ofsurface and downhole records facilitates the merging of sur-face records and corresponding downhole reference time seg-ments. First, the top drill string accelerometer SACZ signal iscorrelated by the downhole reference accelerometer DACZcorresponding to the same time segment and TB number, inorder to insure the following quality control actions:– Check of the exactitude of the downhole and surface TB
pulse number correspondence, from correlated records.– Edition of the single surface (resp. downhole) seismic
records without correspondence with downhole (resp. sur-face) record, and during the drilling interruptions.
– Evaluate and compensate the downhole clock drift relativeto the surface clock: as the propagation time from DACZ
387
Characteristics:OD diameter: 8’’ID diameter: 3’’1/4
Length: 5.5mThreading: 6’’5/8 regBit diameter: 12’’1/4
Tolerances, up toFlow: 3500 l/mnPressure: 10 000 psiTension: 400 tTorque: 13 000 mDaNTemperature: 125°C
Electronic housing
Accelerometer
Bottom sub
Carrier
Geophones
SCUDRU
Seismic recorder
Geoservices surface unit: • Reads the DRU downhole memory after POOH • Adjusts the clock drift of the (DRU) downhole recorder time to the surface recorder clock with the synchro codes emitted by the SCU during acquisition • Writes the downhole reference data into SEG-Y formatted traces segmented according to the TB pulses generated by the SCU
At rig site or office site, the processing computer: • Reads the SEG-Y reference data from SCU • Reads the SEG-D receiver data from the seismic recorder • Merges downhole and surface data according to common TB pulse number • Correlates the surface data with reference signal for QC control and further processing • Labels the surface data with the geometry of the geophone lay-out and tricone depth • Processes the correlated data with conventional seismic routines to produce the final seismic image • Writes correlated data and final processed data into SEG-Y format
Figure 27
Drillbit EM-SWD recording sub manufactured and operatedby Geoservices.
Figure 28
Data recovery procedure applied when the BHA is pulled outof the hole.
Oil & Gas Science and Technology – Rev. IFP, Vol. 59 (2004), No. 4388
Horizontal distance (m)
Tru
e ve
rtic
al d
epth
(m
)
100
200
300
400
500
600
700
800
900
-100 0 100 2001000
Depth intervallogged withEM-SWD
SWD interva
l80
60
40
20
20 40 60 80 100
NORTH
EAST
610
Well trajectory Planned Real
MG
TAll angles relative
to local NorthGrid North: 0.00True North: 0.87
Magnetic North: -1.55
Reference information
Target details
Co-ordinate (N/E) Reference: Site grid North Vertical (VTD) reference: RKB 142.6 above Mean sea level Section (VS) reference: Slot - (0.00,0.00) Measured deptn reference: RKB 142.6 above Mean sea level Calcuulation method: Minimum curvature
No. TVD N/S E/W Target 1 862.60 82.00 102.00 cible
Target
GEOSERVICES
Figure 29
Well trajectory and interval logged by SWD.
Figure 30
BHA used for drillbit EM-SWD field test EM-SWD sublocated about 25 m above the rock bit.
760
625
ID (
m)
882
Raw time (s)
Signal is summed over 20 mn drilling time, and deconvolved.Spread of 12 geophones, 50 m apart, 100 to 650 m from the well. Bottom channel corresponds to top of drill string accelerometers, SACZ.
0.20 0.40 0.60 1.000.80
Mea
sure
men
t dep
th (
m)
882874864855845835826816808797788779770760751742733724714704695685675667658649640625
0.400.300.20 0.50 0.60 0.70 0.80 0.90 1.00
Near well geophone collection (VSP). Equalized display in raw time
Figure 31
EM-SWD: source collections.
Figure 32
EM-SWD: geophone collection.
C Naville et al. / Seismic While Drilling (SWD) Techniques with Downhole Measurements 389
310
300
290 7000
6000
5000
4000
3000
2000
280
270
260
250
240
Tim
e (m
s)
Vel
ociti
es (
m/s
)
620 640 660 680 700 720 740 760Depth (m)
780 800 820 840 860 880
Mea
sure
men
t dep
th (
m)
882874864855845835826816808797788779770760751742733724714704695685675667658649640625
0.40 0.50 0.60 0.70 0.80 0.90 1.00
Reflected wavefield deconvolved on near well geophone collection.VSP-type processing applied. Equalized display in two way times (twt)
Figure 33
EM-SWD: time-depth and velocity curves.
Figure 34
EM-SWD: geophone collection.
Interval ofEM-SWD
measurement
Reflectorsahead of the bit
300m
450m
0.40
0.50
0.60
0.70
0.80
0.90
1.00
1.10
280
260
240
220
200
180
160
140
120
100
80 60 40 20 0
0 5 10 15 20 25 30 35 40 45 50 55 60 65 70 75 80
Offse fromwellhead (m)
EM-SWD Vibrator walkaway
SWD reflection images, (10-65 Hz), compared with Binstack of standard vibrator walkaway (10-100 Hz)on nearby well equiped with permanent downhole geophone on tubing. Courtesy of Gaz de France
CDP
Stations-0.40
-0.30
-0.20
-0.10
0.00
0.10
0.20
0.30
0.40
0.50
0.60
0.70
0.80
0.90
1.00
1.10
1.20
1.30
1.40
1.50
1.60
1.70
1.80
1.90
550
420 400 360 350 330 320 300 290
530 510 470 450 430 410 390 370 350SE21
NW SEWell
Zone illuminatedby drillbit
SWD
Figure 35
EM-SWD survey: Binstack image (courtesy of Gaz deFrance).
Figure 36
Surface seismic section across the geothermal well: imagetotally blurred.
Oil & Gas Science and Technology – Rev. IFP, Vol. 59 (2004), No. 4
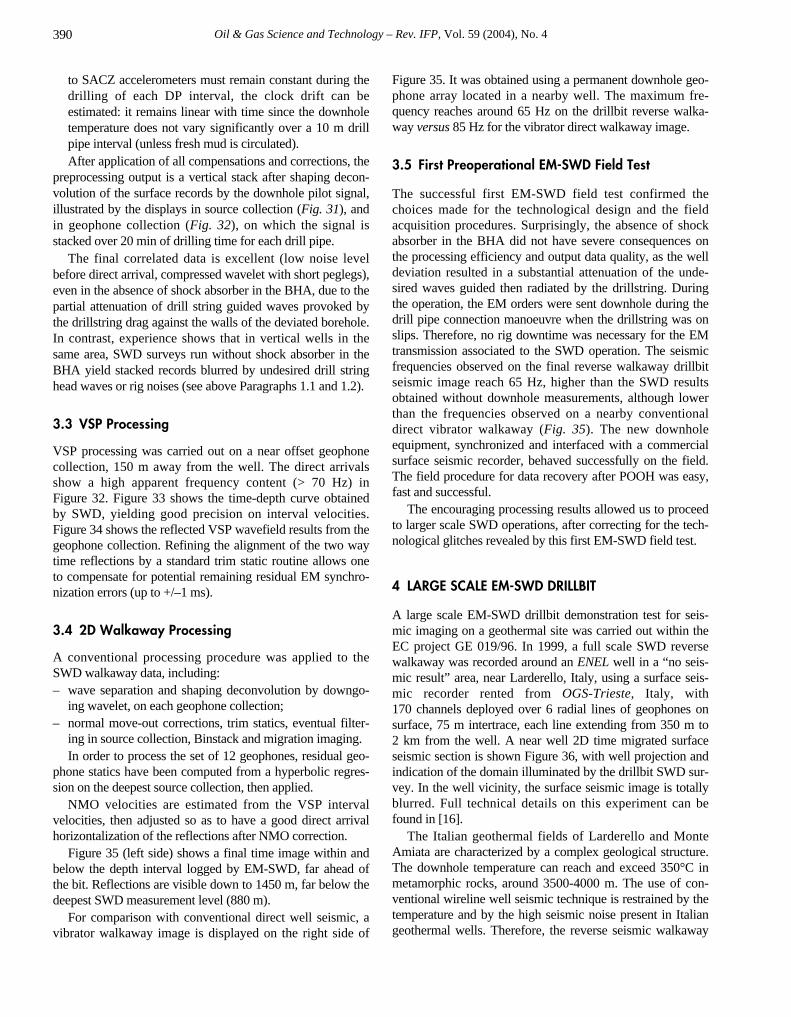
to SACZ accelerometers must remain constant during thedrilling of each DP interval, the clock drift can be estimated: it remains linear with time since the downholetemperature does not vary significantly over a 10 m drillpipe interval (unless fresh mud is circulated). After application of all compensations and corrections, the
preprocessing output is a vertical stack after shaping decon-volution of the surface records by the downhole pilot signal,illustrated by the displays in source collection (Fig. 31), andin geophone collection (Fig. 32), on which the signal isstacked over 20 min of drilling time for each drill pipe.
The final correlated data is excellent (low noise levelbefore direct arrival, compressed wavelet with short peglegs),even in the absence of shock absorber in the BHA, due to thepartial attenuation of drill string guided waves provoked bythe drillstring drag against the walls of the deviated borehole.In contrast, experience shows that in vertical wells in thesame area, SWD surveys run without shock absorber in theBHA yield stacked records blurred by undesired drill stringhead waves or rig noises (see above Paragraphs 1.1 and 1.2).
3.3 VSP Processing
VSP processing was carried out on a near offset geophonecollection, 150 m away from the well. The direct arrivalsshow a high apparent frequency content (> 70 Hz) in Figure 32. Figure 33 shows the time-depth curve obtained by SWD, yielding good precision on interval velocities.Figure 34 shows the reflected VSP wavefield results from thegeophone collection. Refining the alignment of the two waytime reflections by a standard trim static routine allows oneto compensate for potential remaining residual EM synchro-nization errors (up to +/–1 ms).
3.4 2D Walkaway Processing
A conventional processing procedure was applied to theSWD walkaway data, including:– wave separation and shaping deconvolution by downgo-
ing wavelet, on each geophone collection;– normal move-out corrections, trim statics, eventual filter-
ing in source collection, Binstack and migration imaging.In order to process the set of 12 geophones, residual geo-
phone statics have been computed from a hyperbolic regres-sion on the deepest source collection, then applied.
NMO velocities are estimated from the VSP intervalvelocities, then adjusted so as to have a good direct arrivalhorizontalization of the reflections after NMO correction.
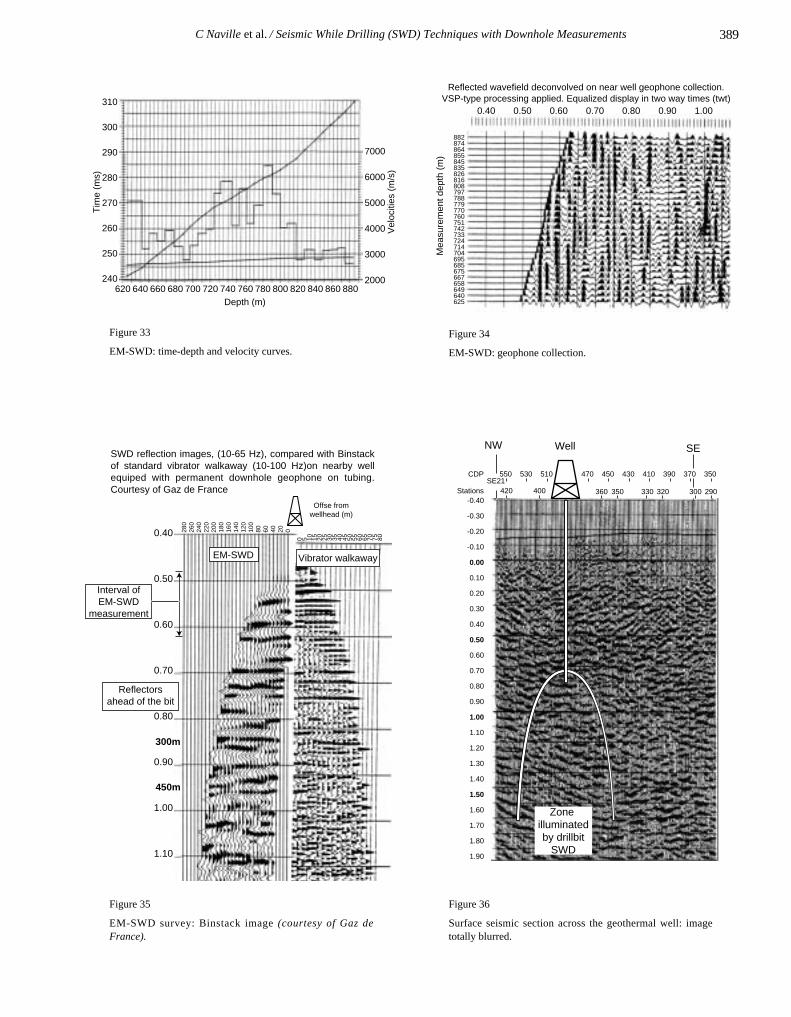
Figure 35 (left side) shows a final time image within andbelow the depth interval logged by EM-SWD, far ahead ofthe bit. Reflections are visible down to 1450 m, far below thedeepest SWD measurement level (880 m).
For comparison with conventional direct well seismic, avibrator walkaway image is displayed on the right side of
Figure 35. It was obtained using a permanent downhole geo-phone array located in a nearby well. The maximum fre-quency reaches around 65 Hz on the drillbit reverse walka-way versus 85 Hz for the vibrator direct walkaway image.
3.5 First Preoperational EM-SWD Field Test
The successful first EM-SWD field test confirmed thechoices made for the technological design and the fieldacquisition procedures. Surprisingly, the absence of shockabsorber in the BHA did not have severe consequences onthe processing efficiency and output data quality, as the welldeviation resulted in a substantial attenuation of the unde-sired waves guided then radiated by the drillstring. Duringthe operation, the EM orders were sent downhole during thedrill pipe connection manoeuvre when the drillstring was onslips. Therefore, no rig downtime was necessary for the EMtransmission associated to the SWD operation. The seismicfrequencies observed on the final reverse walkaway drillbitseismic image reach 65 Hz, higher than the SWD resultsobtained without downhole measurements, although lowerthan the frequencies observed on a nearby conventionaldirect vibrator walkaway (Fig. 35). The new downholeequipment, synchronized and interfaced with a commercialsurface seismic recorder, behaved successfully on the field.The field procedure for data recovery after POOH was easy,fast and successful.
The encouraging processing results allowed us to proceedto larger scale SWD operations, after correcting for the tech-nological glitches revealed by this first EM-SWD field test.
4 LARGE SCALE EM-SWD DRILLBIT
A large scale EM-SWD drillbit demonstration test for seis-mic imaging on a geothermal site was carried out within theEC project GE 019/96. In 1999, a full scale SWD reversewalkaway was recorded around an ENEL well in a “no seis-mic result” area, near Larderello, Italy, using a surface seis-mic recorder rented from OGS-Trieste, Italy, with 170 channels deployed over 6 radial lines of geophones onsurface, 75 m intertrace, each line extending from 350 m to 2 km from the well. A near well 2D time migrated surfaceseismic section is shown Figure 36, with well projection andindication of the domain illuminated by the drillbit SWD sur-vey. In the well vicinity, the surface seismic image is totallyblurred. Full technical details on this experiment can befound in [16].
The Italian geothermal fields of Larderello and MonteAmiata are characterized by a complex geological structure.The downhole temperature can reach and exceed 350°C inmetamorphic rocks, around 3500-4000 m. The use of con-ventional wireline well seismic technique is restrained by thetemperature and by the high seismic noise present in Italiangeothermal wells. Therefore, the reverse seismic walkaway
390
C Naville et al. / Seismic While Drilling (SWD) Techniques with Downhole Measurements
technique using the drillbit noise as seismic source looksattractive; additionally, the temperature in the well whiledrilling is substantially lowered by the drilling fluid circula-tion. As the formations to be drilled are hard, only roller conebits can be used, which is most favorable to the generation ofdrillbit seismic vibrations. Moreover, the unfavorable condi-tions of surface accessibility such as rugged relief, forestcover, sensitive permit and environmental constraints make itdifficult to operate surface seismic sources. Actually, similarexploration difficulties are encountered in many oil and gasfield areas worldwide, locally or regionally.
4.1 Acquisition and Preprocessing
170 surface channels were recorded over two drilling runs,about 35 Gbytes of raw uncorrelated surface data was col-lected and stored on IBM 3490 magnetic cartridges. The sur-face data were acquired in 2 ms sampling/4 bytes per sample,then the data volume was reduced by a factor of 1500 aftercorrelation by the downhole reference data and stacking overthe top 5 m interval of each DP: the raw data recorded con-tinuously while drilling (about 1h/DP) is compressed into 3 sof correlated/stacked seismic data for each surface receiver
channel. The whole chain of field equipment behaved suc-cessfully and a shock absorber was integrated into the BHA.
4.2 Processing and Results
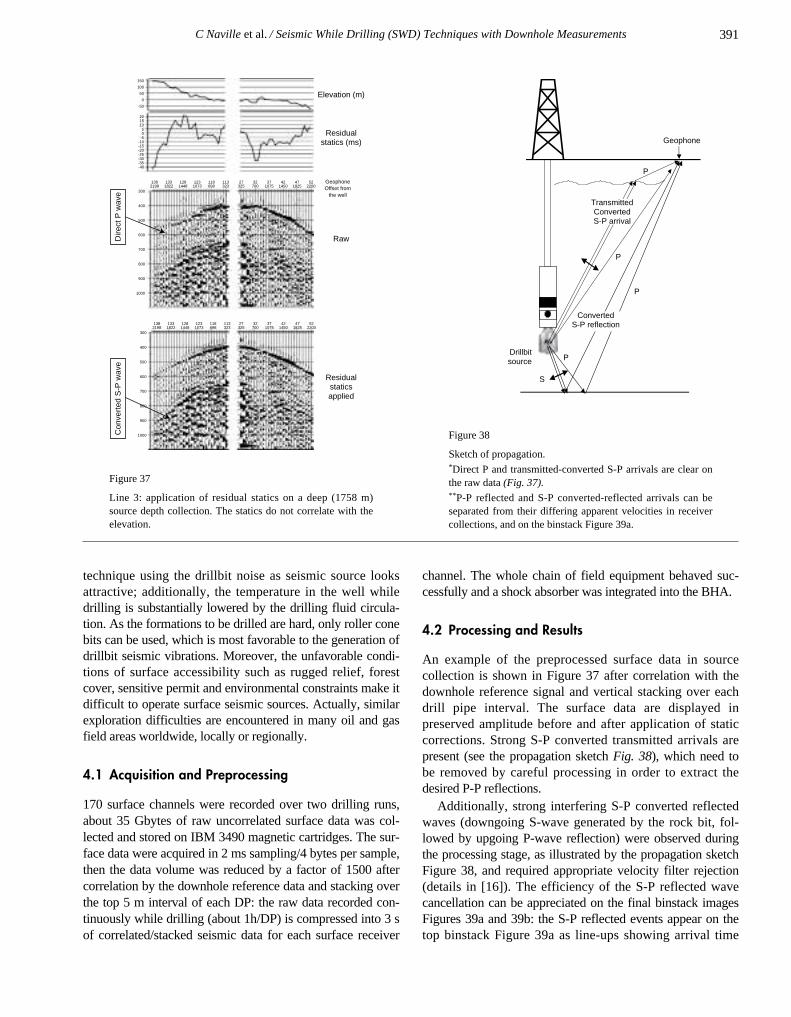
An example of the preprocessed surface data in source collection is shown in Figure 37 after correlation with thedownhole reference signal and vertical stacking over eachdrill pipe interval. The surface data are displayed in preserved amplitude before and after application of static corrections. Strong S-P converted transmitted arrivals arepresent (see the propagation sketch Fig. 38), which need tobe removed by careful processing in order to extract thedesired P-P reflections.
Additionally, strong interfering S-P converted reflectedwaves (downgoing S-wave generated by the rock bit, fol-lowed by upgoing P-wave reflection) were observed duringthe processing stage, as illustrated by the propagation sketchFigure 38, and required appropriate velocity filter rejection(details in [16]). The efficiency of the S-P reflected wavecancellation can be appreciated on the final binstack imagesFigures 39a and 39b: the S-P reflected events appear on thetop binstack Figure 39a as line-ups showing arrival time
391
Residualstaticsapplied
Raw
GeophoneOffset from
the well
Residualstatics (ms)
Elevation (m)
Con
vert
ed S
-P w
ave
150
100
50
0
-50
20151050
-5-10-15-20-25-30-35-40
300
1382198
1331822
1281448
1231073
118698
113323
27325
32700
371075
421450
471825
522200
1382198
1331822
1281448
1231073
118698
113323
27325
32700
371075
421450
471825
522200
400
500
600
700
800
900
1000
300
400
500
600
700
800
900
1000
Dire
ct P
wav
e
Geophone
Drillbitsource
TransmittedConvertedS-P arrival
P
P
P
P
S
ConvertedS-P reflection
Figure 37
Line 3: application of residual statics on a deep (1758 m)source depth collection. The statics do not correlate with theelevation.
Figure 38
Sketch of propagation.*Direct P and transmitted-converted S-P arrivals are clear onthe raw data (Fig. 37).**P-P reflected and S-P converted-reflected arrivals can beseparated from their differing apparent velocities in receivercollections, and on the binstack Figure 39a.
Oil & Gas Science and Technology – Rev. IFP, Vol. 59 (2004), No. 4
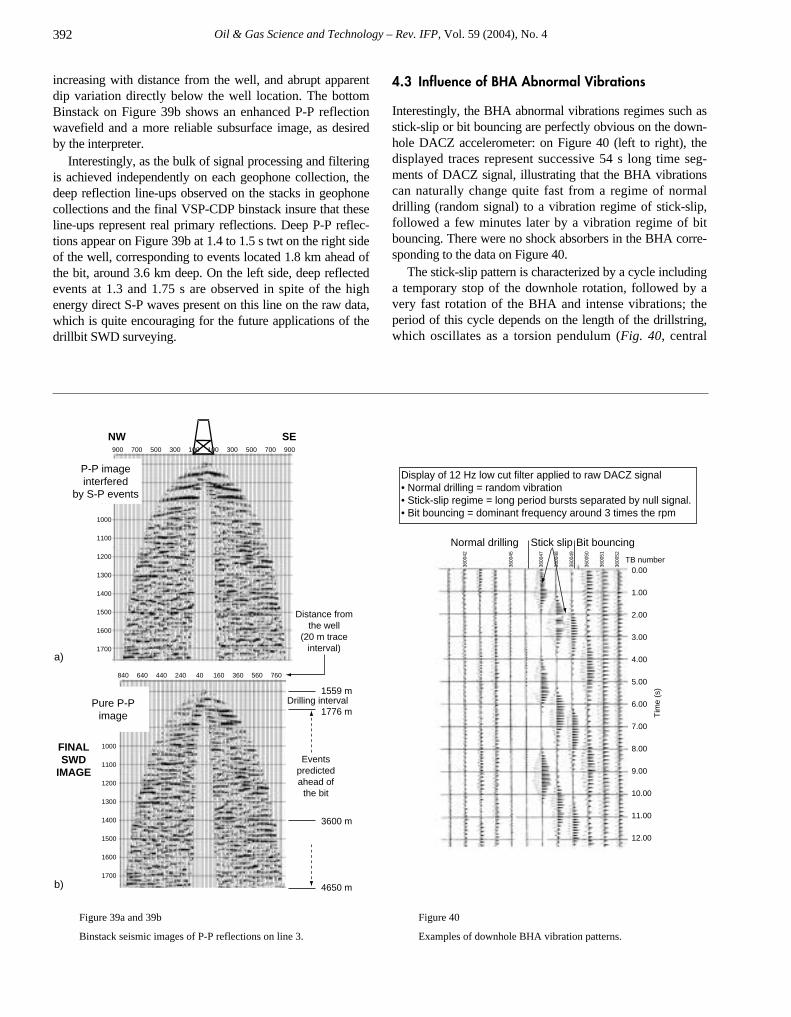
increasing with distance from the well, and abrupt apparentdip variation directly below the well location. The bottomBinstack on Figure 39b shows an enhanced P-P reflectionwavefield and a more reliable subsurface image, as desiredby the interpreter.
Interestingly, as the bulk of signal processing and filteringis achieved independently on each geophone collection, thedeep reflection line-ups observed on the stacks in geophonecollections and the final VSP-CDP binstack insure that theseline-ups represent real primary reflections. Deep P-P reflec-tions appear on Figure 39b at 1.4 to 1.5 s twt on the right sideof the well, corresponding to events located 1.8 km ahead ofthe bit, around 3.6 km deep. On the left side, deep reflectedevents at 1.3 and 1.75 s are observed in spite of the highenergy direct S-P waves present on this line on the raw data,which is quite encouraging for the future applications of thedrillbit SWD surveying.
4.3 Influence of BHA Abnormal Vibrations
Interestingly, the BHA abnormal vibrations regimes such asstick-slip or bit bouncing are perfectly obvious on the down-hole DACZ accelerometer: on Figure 40 (left to right), thedisplayed traces represent successive 54 s long time seg-ments of DACZ signal, illustrating that the BHA vibrationscan naturally change quite fast from a regime of normaldrilling (random signal) to a vibration regime of stick-slip,followed a few minutes later by a vibration regime of bitbouncing. There were no shock absorbers in the BHA corre-sponding to the data on Figure 40.
The stick-slip pattern is characterized by a cycle includinga temporary stop of the downhole rotation, followed by avery fast rotation of the BHA and intense vibrations; theperiod of this cycle depends on the length of the drillstring,which oscillates as a torsion pendulum (Fig. 40, central
392
3600 m
1559 m
1776 mDrilling interval
NW SE
4650 m
FINALSWD
IMAGEEvents
predictedahead of
the bit
700
800
900
1000
1100
1200
1300
1400
1500
1600
1700
700
800
900
1000
1100
1200
1300
1400
1500
1600
1700
900 700 500 300 100 900700500300100
840 640 440 240 40 760560360160
P-P imageinterfered
by S-P events
Pure P-Pimage
Distance fromthe well
(20 m traceinterval)
a)
b)
Normal drilling Stick slip Bit bouncing
TB number
3600
45
3600
42
3600
48
3600
47
3600
50
3600
49
3600
52
3600
51
0.00
1.00
2.00
3.00
4.00
5.00
6.00
7.00
8.00
9.00
10.00
11.00
12.00
Tim
e (s
)
Display of 12 Hz low cut filter applied to raw DACZ signal• Normal drilling = random vibration• Stick-slip regime = long period bursts separated by null signal.• Bit bouncing = dominant frequency around 3 times the rpm
Figure 39a and 39b
Binstack seismic images of P-P reflections on line 3.
Figure 40
Examples of downhole BHA vibration patterns.
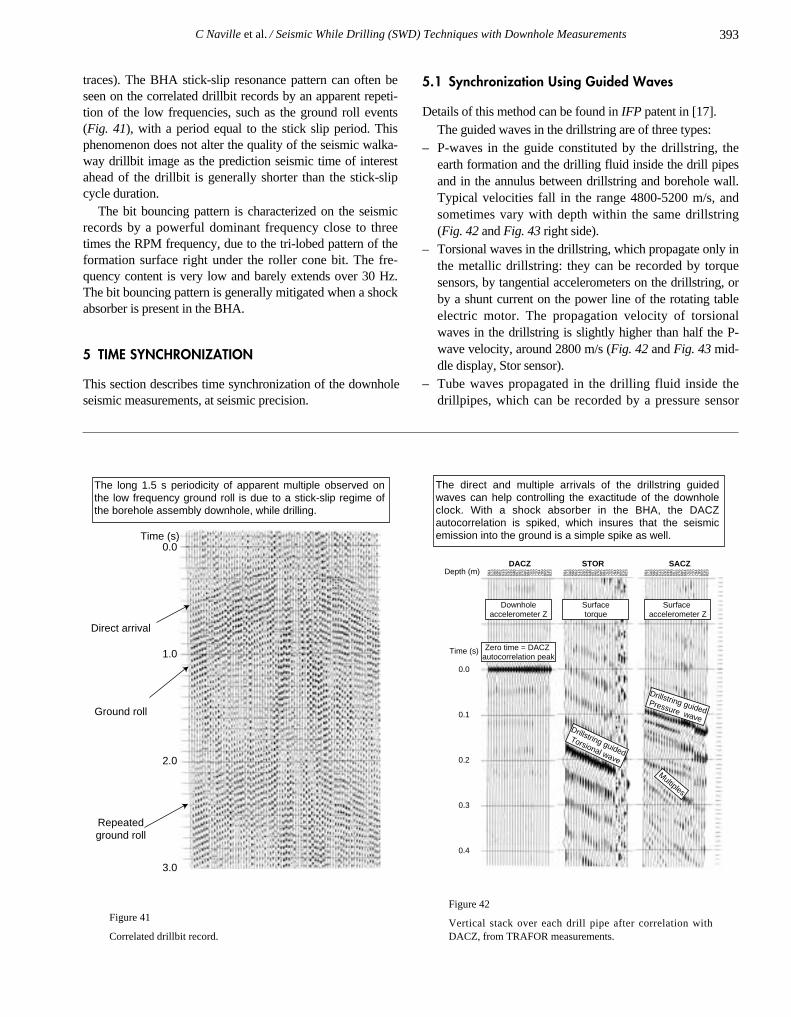
C Naville et al. / Seismic While Drilling (SWD) Techniques with Downhole Measurements
traces). The BHA stick-slip resonance pattern can often beseen on the correlated drillbit records by an apparent repeti-tion of the low frequencies, such as the ground roll events(Fig. 41), with a period equal to the stick slip period. Thisphenomenon does not alter the quality of the seismic walka-way drillbit image as the prediction seismic time of interestahead of the drillbit is generally shorter than the stick-slipcycle duration.
The bit bouncing pattern is characterized on the seismicrecords by a powerful dominant frequency close to threetimes the RPM frequency, due to the tri-lobed pattern of theformation surface right under the roller cone bit. The fre-quency content is very low and barely extends over 30 Hz.The bit bouncing pattern is generally mitigated when a shockabsorber is present in the BHA.
5 TIME SYNCHRONIZATION
This section describes time synchronization of the downholeseismic measurements, at seismic precision.
5.1 Synchronization Using Guided Waves
Details of this method can be found in IFP patent in [17].The guided waves in the drillstring are of three types:
– P-waves in the guide constituted by the drillstring, theearth formation and the drilling fluid inside the drill pipesand in the annulus between drillstring and borehole wall.Typical velocities fall in the range 4800-5200 m/s, andsometimes vary with depth within the same drillstring(Fig. 42 and Fig. 43 right side).
– Torsional waves in the drillstring, which propagate only inthe metallic drillstring: they can be recorded by torquesensors, by tangential accelerometers on the drillstring, orby a shunt current on the power line of the rotating tableelectric motor. The propagation velocity of torsionalwaves in the drillstring is slightly higher than half the P-wave velocity, around 2800 m/s (Fig. 42 and Fig. 43 mid-dle display, Stor sensor).
– Tube waves propagated in the drilling fluid inside thedrillpipes, which can be recorded by a pressure sensor
393
The long 1.5 s periodicity of apparent multiple observed on the low frequency ground roll is due to a stick-slip regime of the borehole assembly downhole, while drilling.
Direct arrival
Ground roll
Repeatedground roll
Time (s)0.0
1.0
2.0
3.0
0.0
0.1
0.2
0.3
0.4
Surface accelerometer Z
Depth (m)
Surfacetorque
Downholeaccelerometer Z
Zero time = DACZ autocorrelation peak
Drillstring guided
Torsional wave
Multiples
Drillstring guidedPressure wave
DACZ STOR SACZ
Time (s)
564
573
588
596
602
613
623
630
639
648
657
665
676
685
694
703
709
720
794
799
809
816
823
564
573
588
596
602
613
623
630
639
648
657
665
676
685
694
703
709
720
794
799
809
816
823
564
573
588
596
602
613
623
630
639
648
657
665
676
685
694
703
709
720
794
799
809
816
823
The direct and multiple arrivals of the drillstring guided waves can help controlling the exactitude of the downhole clock. With a shock absorber in the BHA, the DACZ autocorrelation is spiked, which insures that the seismic emission into the ground is a simple spike as well.
Figure 41
Correlated drillbit record.
Figure 42
Vertical stack over each drill pipe after correlation withDACZ, from TRAFOR measurements.
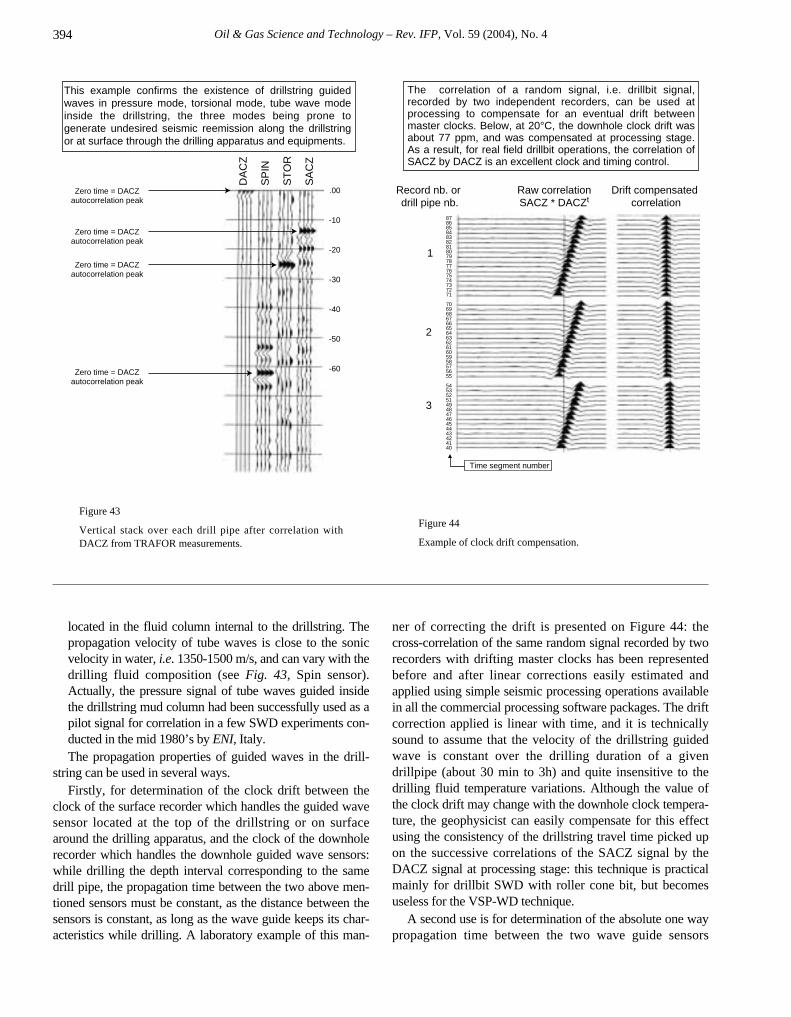
Oil & Gas Science and Technology – Rev. IFP, Vol. 59 (2004), No. 4
located in the fluid column internal to the drillstring. Thepropagation velocity of tube waves is close to the sonicvelocity in water, i.e. 1350-1500 m/s, and can vary with thedrilling fluid composition (see Fig. 43, Spin sensor).Actually, the pressure signal of tube waves guided insidethe drillstring mud column had been successfully used as apilot signal for correlation in a few SWD experiments con-ducted in the mid 1980’s by ENI, Italy.The propagation properties of guided waves in the drill-
string can be used in several ways.Firstly, for determination of the clock drift between the
clock of the surface recorder which handles the guided wavesensor located at the top of the drillstring or on surfacearound the drilling apparatus, and the clock of the downholerecorder which handles the downhole guided wave sensors:while drilling the depth interval corresponding to the samedrill pipe, the propagation time between the two above men-tioned sensors must be constant, as the distance between thesensors is constant, as long as the wave guide keeps its char-acteristics while drilling. A laboratory example of this man-
ner of correcting the drift is presented on Figure 44: thecross-correlation of the same random signal recorded by tworecorders with drifting master clocks has been representedbefore and after linear corrections easily estimated andapplied using simple seismic processing operations availablein all the commercial processing software packages. The driftcorrection applied is linear with time, and it is technicallysound to assume that the velocity of the drillstring guidedwave is constant over the drilling duration of a givendrillpipe (about 30 min to 3h) and quite insensitive to thedrilling fluid temperature variations. Although the value ofthe clock drift may change with the downhole clock tempera-ture, the geophysicist can easily compensate for this effectusing the consistency of the drillstring travel time picked upon the successive correlations of the SACZ signal by theDACZ signal at processing stage: this technique is practicalmainly for drillbit SWD with roller cone bit, but becomesuseless for the VSP-WD technique.
A second use is for determination of the absolute one waypropagation time between the two wave guide sensors
394
Zero time = DACZautocorrelation peak
Zero time = DACZautocorrelation peak
Zero time = DACZautocorrelation peak
Zero time = DACZautocorrelation peak
DA
CZ
SP
IN
ST
OR
SA
CZ
.00
-10
-20
-30
-40
-50
-60
This example confirms the existence of drillstring guided waves in pressure mode, torsional mode, tube wave mode inside the drillstring, the three modes being prone to generate undesired seismic reemission along the drillstring or at surface through the drilling apparatus and equipments.
Drift compensated correlation
Raw correlationSACZ * DACZt
Record nb. or drill pipe nb.
Time segment number
1
2
3
The correlation of a random signal, i.e. drillbit signal, recorded by two independent recorders, can be used at processing to compensate for an eventual drift between master clocks. Below, at 20°C, the downhole clock drift was about 77 ppm, and was compensated at processing stage. As a result, for real field drillbit operations, the correlation of SACZ by DACZ is an excellent clock and timing control.
8786858483828180797877767574737271
70696867666564636261605958575655
5453525149484746454443424140
Figure 43
Vertical stack over each drill pipe after correlation withDACZ from TRAFOR measurements.
Figure 44
Example of clock drift compensation.
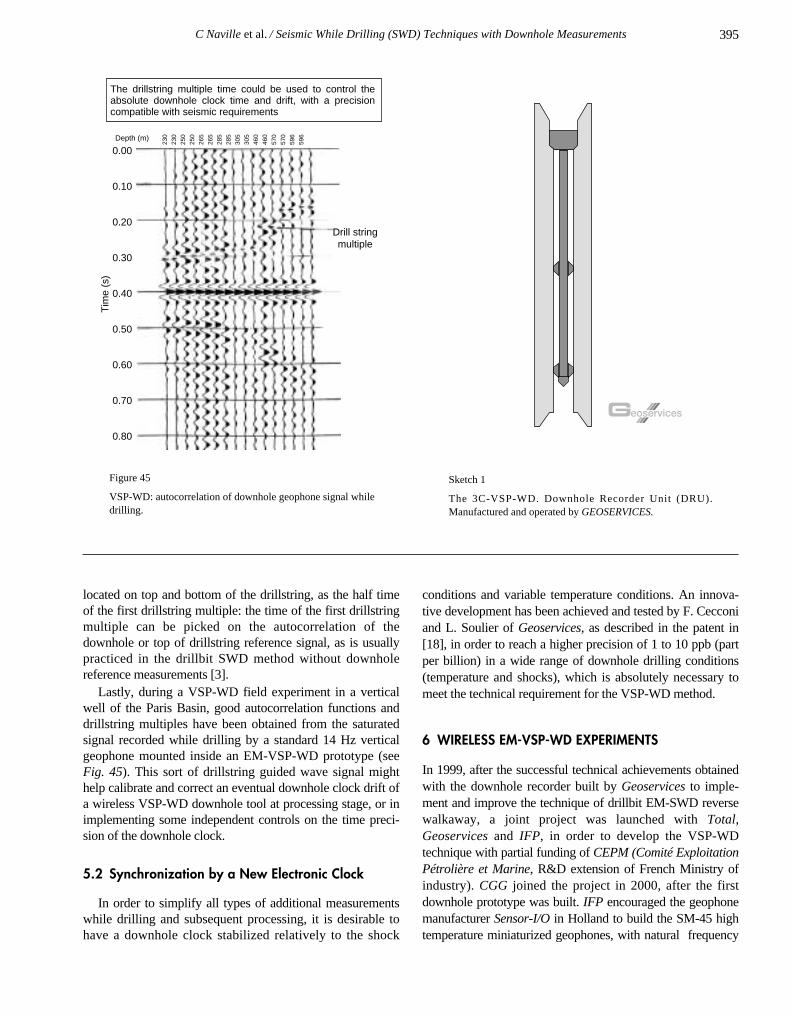
C Naville et al. / Seismic While Drilling (SWD) Techniques with Downhole Measurements
located on top and bottom of the drillstring, as the half timeof the first drillstring multiple: the time of the first drillstringmultiple can be picked on the autocorrelation of the downhole or top of drillstring reference signal, as is usuallypracticed in the drillbit SWD method without downhole reference measurements [3].
Lastly, during a VSP-WD field experiment in a verticalwell of the Paris Basin, good autocorrelation functions anddrillstring multiples have been obtained from the saturatedsignal recorded while drilling by a standard 14 Hz verticalgeophone mounted inside an EM-VSP-WD prototype (seeFig. 45). This sort of drillstring guided wave signal mighthelp calibrate and correct an eventual downhole clock drift ofa wireless VSP-WD downhole tool at processing stage, or inimplementing some independent controls on the time preci-sion of the downhole clock.
5.2 Synchronization by a New Electronic Clock
In order to simplify all types of additional measurementswhile drilling and subsequent processing, it is desirable tohave a downhole clock stabilized relatively to the shock
conditions and variable temperature conditions. An innova-tive development has been achieved and tested by F. Cecconiand L. Soulier of Geoservices, as described in the patent in[18], in order to reach a higher precision of 1 to 10 ppb (partper billion) in a wide range of downhole drilling conditions (temperature and shocks), which is absolutely necessary tomeet the technical requirement for the VSP-WD method.
6 WIRELESS EM-VSP-WD EXPERIMENTS
In 1999, after the successful technical achievements obtainedwith the downhole recorder built by Geoservices to imple-ment and improve the technique of drillbit EM-SWD reversewalkaway, a joint project was launched with Total,Geoservices and IFP, in order to develop the VSP-WD technique with partial funding of CEPM (Comité ExploitationPétrolière et Marine, R&D extension of French Ministry ofindustry). CGG joined the project in 2000, after the firstdownhole prototype was built. IFP encouraged the geophonemanufacturer Sensor-I/O in Holland to build the SM-45 hightemperature miniaturized geophones, with natural frequency
395
0.00
0.10
0.20
0.30
0.40
Tim
e (s
)
0.50
0.60
0.70
0.80
230
230
250
250
265
265
285
285
305
305
460
460
570
570
596
596
Drill stringmultiple
The drillstring multiple time could be used to control the absolute downhole clock time and drift, with a precision compatible with seismic requirements
Depth (m)
Figure 45
VSP-WD: autocorrelation of downhole geophone signal whiledrilling.
Sketch 1
The 3C-VSP-WD. Downhole Recorder Unit (DRU).Manufactured and operated by GEOSERVICES.
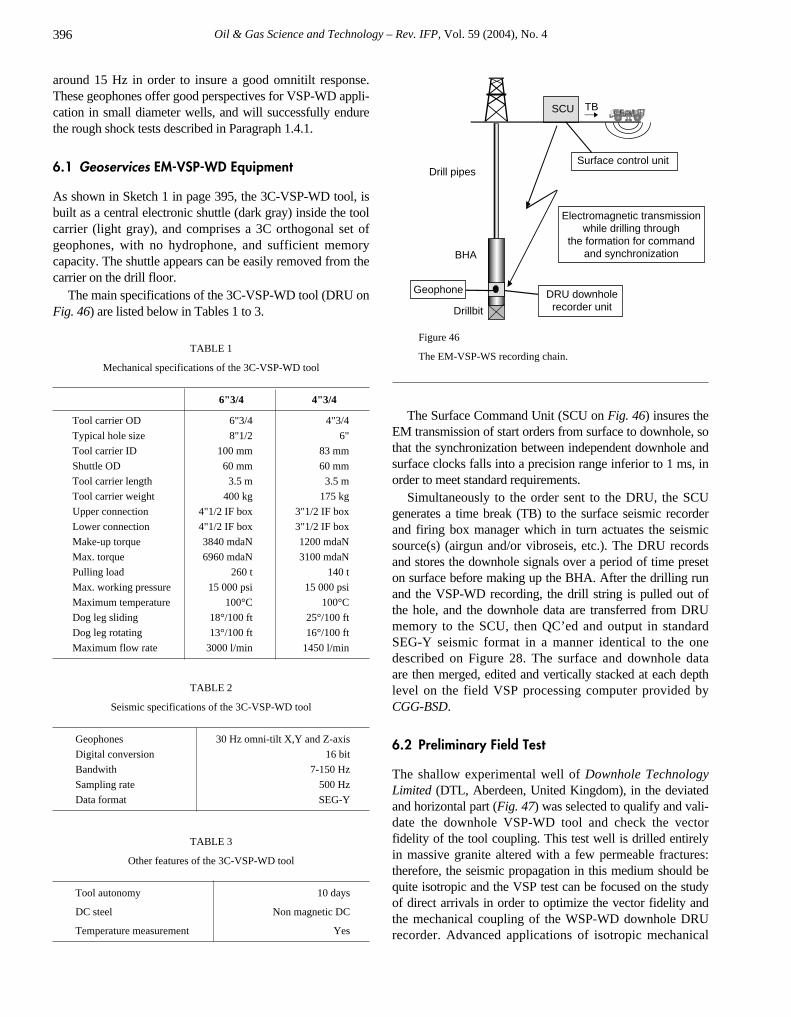
Oil & Gas Science and Technology – Rev. IFP, Vol. 59 (2004), No. 4
around 15 Hz in order to insure a good omnitilt response.These geophones offer good perspectives for VSP-WD appli-cation in small diameter wells, and will successfully endurethe rough shock tests described in Paragraph 1.4.1.
6.1 Geoservices EM-VSP-WD Equipment
As shown in Sketch 1 in page 395, the 3C-VSP-WD tool, isbuilt as a central electronic shuttle (dark gray) inside the toolcarrier (light gray), and comprises a 3C orthogonal set ofgeophones, with no hydrophone, and sufficient memorycapacity. The shuttle appears can be easily removed from thecarrier on the drill floor.
The main specifications of the 3C-VSP-WD tool (DRU onFig. 46) are listed below in Tables 1 to 3.
TABLE 1
Mechanical specifications of the 3C-VSP-WD tool
6"3/4 4"3/4
Tool carrier OD 6"3/4 4"3/4
Typical hole size 8"1/2 6"
Tool carrier ID 100 mm 83 mm
Shuttle OD 60 mm 60 mm
Tool carrier length 3.5 m 3.5 m
Tool carrier weight 400 kg 175 kg
Upper connection 4"1/2 IF box 3"1/2 IF box
Lower connection 4"1/2 IF box 3"1/2 IF box
Make-up torque 3840 mdaN 1200 mdaN
Max. torque 6960 mdaN 3100 mdaN
Pulling load 260 t 140 t
Max. working pressure 15 000 psi 15 000 psi
Maximum temperature 100°C 100°C
Dog leg sliding 18°/100 ft 25°/100 ft
Dog leg rotating 13°/100 ft 16°/100 ft
Maximum flow rate 3000 l/min 1450 l/min
TABLE 2
Seismic specifications of the 3C-VSP-WD tool
Geophones 30 Hz omni-tilt X,Y and Z-axis
Digital conversion 16 bit
Bandwith 7-150 Hz
Sampling rate 500 Hz
Data format SEG-Y
TABLE 3
Other features of the 3C-VSP-WD tool
Tool autonomy 10 days
DC steel Non magnetic DC
Temperature measurement Yes
Figure 46
The EM-VSP-WS recording chain.
The Surface Command Unit (SCU on Fig. 46) insures theEM transmission of start orders from surface to downhole, sothat the synchronization between independent downhole andsurface clocks falls into a precision range inferior to 1 ms, inorder to meet standard requirements.
Simultaneously to the order sent to the DRU, the SCUgenerates a time break (TB) to the surface seismic recorderand firing box manager which in turn actuates the seismicsource(s) (airgun and/or vibroseis, etc.). The DRU recordsand stores the downhole signals over a period of time preseton surface before making up the BHA. After the drilling runand the VSP-WD recording, the drill string is pulled out ofthe hole, and the downhole data are transferred from DRUmemory to the SCU, then QC’ed and output in standardSEG-Y seismic format in a manner identical to the onedescribed on Figure 28. The surface and downhole data are then merged, edited and vertically stacked at each depthlevel on the field VSP processing computer provided by CGG-BSD.
6.2 Preliminary Field Test
The shallow experimental well of Downhole TechnologyLimited (DTL, Aberdeen, United Kingdom), in the deviatedand horizontal part (Fig. 47) was selected to qualify and vali-date the downhole VSP-WD tool and check the vectorfidelity of the tool coupling. This test well is drilled entirelyin massive granite altered with a few permeable fractures:therefore, the seismic propagation in this medium should bequite isotropic and the VSP test can be focused on the studyof direct arrivals in order to optimize the vector fidelity andthe mechanical coupling of the WSP-WD downhole DRUrecorder. Advanced applications of isotropic mechanical
BHA
Drillbit
SCU
Surface control unitDrill pipes
DRU downholerecorder unit
Electromagnetic transmissionwhile drilling through
the formation for commandand synchronization
Geophone
TB
396
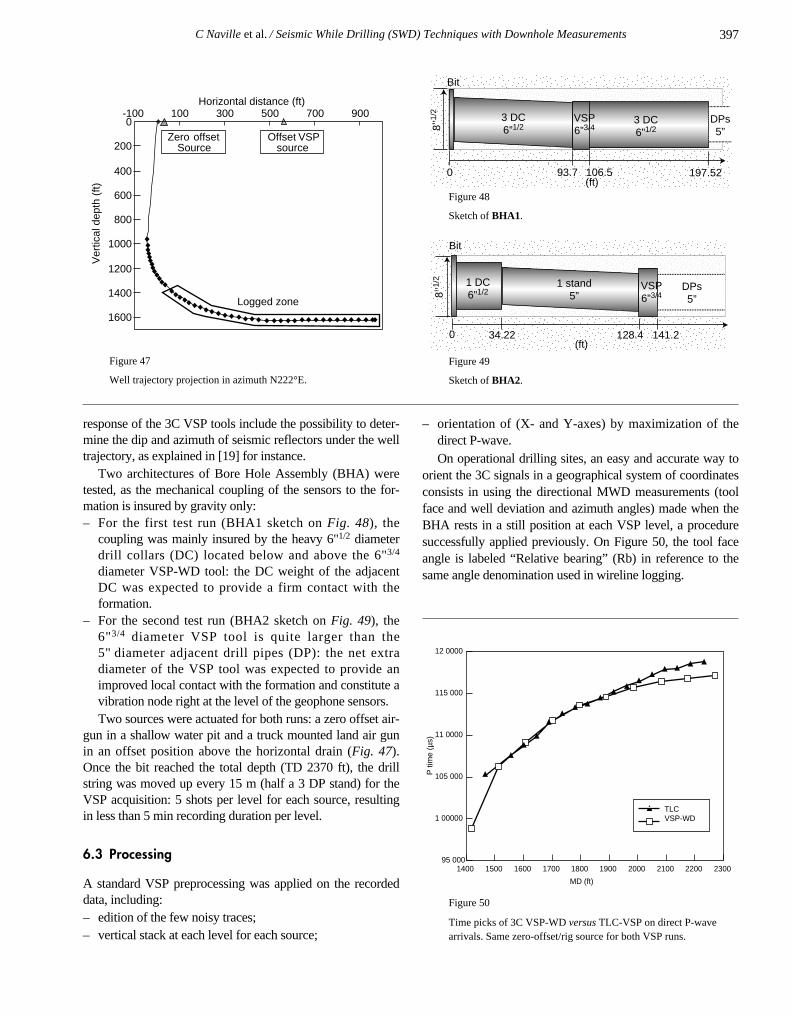
C Naville et al. / Seismic While Drilling (SWD) Techniques with Downhole Measurements
response of the 3C VSP tools include the possibility to deter-mine the dip and azimuth of seismic reflectors under the welltrajectory, as explained in [19] for instance.
Two architectures of Bore Hole Assembly (BHA) weretested, as the mechanical coupling of the sensors to the for-mation is insured by gravity only:– For the first test run (BHA1 sketch on Fig. 48), the
coupling was mainly insured by the heavy 6"1/2 diameterdrill collars (DC) located below and above the 6"3/4
diameter VSP-WD tool: the DC weight of the adjacentDC was expected to provide a firm contact with theformation.
– For the second test run (BHA2 sketch on Fig. 49), the6"3/4 diameter VSP tool is quite larger than the 5" diameter adjacent drill pipes (DP): the net extradiameter of the VSP tool was expected to provide animproved local contact with the formation and constitute avibration node right at the level of the geophone sensors. Two sources were actuated for both runs: a zero offset air-
gun in a shallow water pit and a truck mounted land air gunin an offset position above the horizontal drain (Fig. 47).Once the bit reached the total depth (TD 2370 ft), the drillstring was moved up every 15 m (half a 3 DP stand) for theVSP acquisition: 5 shots per level for each source, resultingin less than 5 min recording duration per level.
6.3 Processing
A standard VSP preprocessing was applied on the recordeddata, including: – edition of the few noisy traces;– vertical stack at each level for each source;
– orientation of (X- and Y-axes) by maximization of thedirect P-wave.On operational drilling sites, an easy and accurate way to
orient the 3C signals in a geographical system of coordinatesconsists in using the directional MWD measurements (toolface and well deviation and azimuth angles) made when theBHA rests in a still position at each VSP level, a proceduresuccessfully applied previously. On Figure 50, the tool faceangle is labeled “Relative bearing” (Rb) in reference to thesame angle denomination used in wireline logging.
Figure 50
Time picks of 3C VSP-WD versus TLC-VSP on direct P-wavearrivals. Same zero-offset/rig source for both VSP runs.
1400 1500 1600 1700 1800 1900 2000 2100 2200 2300
MD (ft)
P ti
me
(µs)
TLCVSP-WD
95 000
1 00000
105 000
11 0000
115 000
12 0000
397
0 93.7 106.5
3 DC6”1/2
3 DC6”1/2
VSP6”3/4
197.52
8’’1/
2
DPs5”
Bit
(ft)
0 34.22 128.4 141.2
8’’1/
2 1 DC6”1/2
1 stand5”
VSP6”3/4
DPs5”
Bit
(ft)
Figure 47
Well trajectory projection in azimuth N222°E.
Figure 48
Sketch of BHA1.
Figure 49
Sketch of BHA2.
0
200
400
600
800
1000
1200
1400
1600
-100 100 300 500 700 900
Ver
tical
dep
th (
ft)
Offset VSP source
Zero offsetSource
Logged zone
Horizontal distance (ft)
Oil & Gas Science and Technology – Rev. IFP, Vol. 59 (2004), No. 4
6.4 Results
6.4.1 Time Pick Comparison
The time picks of the direct P-wave of the VSP-WD proto-type versus a TLC tool used in the same drillstring with thesame source, but not at the same measured depth (MD) lev-els, are compared on Figure 50. The two curves are similarwithin less than 1 ms between MD 2000 and 2230 ft. Theseresults show the good accuracy of the seismic times, whichvalidates the EM synchronization technique versus the con-ventional wireline reference.
6.4.2 Reorientation Angle Comparison
If the DRU coupling to the formation is isotropic for the tworuns, the difference between relative bearing angles (RB)computed by maximization of the off-axis X and Y compo-nents of direct arrival signals on the offset source and rigsource should be equal for both runs at the same depth level.The difference of angle is limited to within about 5°, whichmeans that the two BHA architectures tested yield fair cou-pling conditions. Above MD 450 m, where the well is almostvertical, the dispersed values obtained on the BHA1 curve(Fig. 51) are due to the loose mechanical coupling in this partof the well.
6.4.3 3C Data Quality and Trace to Trace Coherency
Figures 52 to 54 show the oriented 3C data for BHA1,Figures 55 to 57 for BHA2 The oriented VSP-WD data showan excellent S/N ratio for both BHA architectures as thenoise before the first direct P-wave arrival is minimal.
Figure 51
Reorientation of (X, Y) by maximization of the direct arrival.
Figure 52
BHA1. Zwell component. Rig source collection.
Figs 52, 53 and 54: isotropic 3C displays, filtered (2, 65 Hz).Constant gain.Observation: components XV and YH do not show a goodtrace to trace coherency.
Figure 53
BHA1. XV component.
Depth (m)689 648 621 593 566 538 511 483 456
0
100
200
300
400
Depth (m)689
0
100
200
300
400
648 621 593 566 538 511 483 456
-50
-40
-30
-20
-10
0
10
20
30
40
50
400 450 500 550 600 650 700
Del
ta R
b (°
)
Zwell
Y
X
Xv
Yh
Rb
BHA1 Rb (offset source)-Rb (rig source)
BHA2 Rb (offset source)-Rb (rig source)
MD (m)
398
C Naville et al. / Seismic While Drilling (SWD) Techniques with Downhole Measurements 399
Depth (m)689 648 621 593 566 538 511 483 456
0
100
200
300
400
680 652 625 598 570 543Depth (m)
515 488 460 4330
100
200
300
400
680 652 625 598 570 543Depth (m)
515 488 460 4330
100
200
300
400
680 652 625 598 570 543 515 488 460 433Depth (m)
0
100
200
300
400
Figure 54
BHA1. YH component.
Figure 55
BHA2. Rig source - Zwell component-filtered (2, 65 Hz).Constant gain.
Figs 55, 56, 57: isotropic 3C displays, filtered (2, 65 Hz).Constant gain.Observation: components XV and YH show an execellenttrace to trace coherency, on P-wave peglegs (XV component)and on downgoing S-wave residuals (YH component).
Figure 56
BHA2. XV component.
Figure 57
BHA2. YH component.
Oil & Gas Science and Technology – Rev. IFP, Vol. 59 (2004), No. 4
However, after orientation of the off-well axis compo-nents X and Y, the 3 component wavefields are much moreconsistent trace to trace on BHA2 than on BHA1:– on component XV, the direct P-wave arrival and its
peglegs are more coherent on Figure 56 than on Figure 53; – on the transverse component YH, the weak downgoing
S-wavetrain is much more coherent on Figure 57 than onFigure 54. The P-wave direct arrival energy have beennicely minimized on component YH for both BHA’s, indi-cating a fair vector fidelity;
– on well axis component Zwell, the downgoing P-wavetrainis very consistent for both BHAs, which means that themechanical coupling to the formation is quite good in thewell axis for both BHA configurations, this result beingsimilar with wireline VSP tools. Therefore, the above tests show that a VSP-WD tool inte-
grated in a BHA has an improved vector fidelity of the over-all seismic response, thus isotropy of mechanical coupling,when the diameter of the VSP-WD tool is larger than thediameter of the adjacent BHA elements.
In conclusion, the 3C EM-VSP-WD prototype meets therequirements of the seismic measurement in terms of reliabil-ity, S/N ratio, 3C isotropy, and operational efficiency. Theacquisition is not limited only to a check-shot. The presenttest validates the EM-VSP-WD technique at least for the wellsites where the EM transmission works properly.
The next generation of EM-VSP-WD tool might need tobe built in the crown of the BHA, in order to clear the pas-sage inside the drill collars, in which case it will be easier toadd a hydrophone sensor.
7 DISCUSSION AND CONCLUSION
7.1 Drillbit-SWD Reverse Walkaway
The objective of the walkaway SWD method is to producea seismic image of the geological structure around the firstwell in order to confirm the target structure, or to indicate thedrilling targets of the following directional wells. Explorationand development drilling occurs sometimes in areas wherethe surface seismic quality is poor, or where the subsurfaceobjectives are very deep and difficult to illuminate with sur-face seismic: the drillbit SWD technique is expected to com-plement the surface exploration in the well vicinity in suchcircumstances.
In onshore areas where rough field conditions make it difficult to operate seismic sources, a reverse walkawaySWD survey might prove to be more economical than adirect walkaway survey recorded with surface source anddownhole string of receivers.
Onshore, conventional walkaway surveys can be difficultto acquire depending on the access conditions for the seismicsource: rugged terrain, forest and mountain areas, transition
zone, etc., which increases both the source cost and the rigimmobilization time necessary for the seismic acquisition. Incontrast, the drillbit EM-SWD technique of 3D reverse walk-away presents a definite advantage over the conventionaldirect wireline WSP technique in areas of difficult terrainconditions where only 2D surface seismic profiling is eco-nomically reasonable. The drillbit EM-SWD technique canbe more efficient than the conventional walkaway when deepreflections are sought for, with a large 3D surface seismicspread of geophones deployed around the well up to largedistances from the rig. The drillbit source can be listened tofor the whole drilling time in the depth interval of the survey,which generates large amounts of seismic energy andimproves the S/N quality, the image clarity and the penetra-tion ahead of the bit.
The EM-SWD reverse walkaway technique does not dis-turb the drilling process significantly. The main constraint ondrilling is to use a roller cone bit for one or two drilling runsaround mid depth objective and over a limited depth intervalwhere the rock formations are rather hard. The time delay forprocessing needs to be reduced in order to render the methodeven more attractive.
The real time availability of the downhole data obtainedby means of wired drill pipe technology is ideal for drillbitSWD since the surface data can be correlated by a real timecommercial correlator/stacker connected with the seismicrecorder. In practice, when the wireless EM-SWD technol-ogy is used, storing large amounts of data downhole and onsurface does not pose any technical problems nowadays, andthis recording procedure should not delay the data processingsignificantly if a modest seismic processing machine andcrew are brought in the immediate rig site proximity. In anycase, drillbit recording over a 100 to 300 m depth interval isnecessary to perform the full walkaway processing usingvelocity filters over all the recorded drillbit source interval.While acquiring the first drillbit run, many seismic prepro-cessing tasks and controls can be done, such as geometryacquisition, surface data reading and correlation by the sec-ondary reference accelerometer on top of the drillstring,labeling the geometry, labeling with the drilling parameters,etc. The complete QC control and processing can start onlywhen the first batch of downhole data is available, after thefirst EM-SWD drilling run.
Offshore, drillbit reverse SWD walkaways could beacquired using OBC receiver cables located on sea bottom,but this poses three problems: – roller cone bits are seldom used in offshore drilling as
formations are tender to medium hard;– the well seismic data are not available right away and
cannot be controlled in real time, in contrast with the conventional direct walkaway recorded with a long arrayof receivers in the well and an efficient seismic sourcemounted on a boat quickly accessing any desired shootinglocation;
400
C Naville et al. / Seismic While Drilling (SWD) Techniques with Downhole Measurements
– deep offshore installation of OBC’s might become diffi-cult in deep waters. For these reasons, the conventionalwireline technique remains very efficient for offshorewalkaway surveys.In conclusion (Fig. 58), the use of the drillbit SWD walka-
way method offers good perspectives for onshore areas withdifficult access conditions: this is an exploration-WD tech-nique particularly interesting in areas where the surface seis-mic illumination is poor. The method is not well suited forcontinuous monitoring of the drillbit: as a matter of fact, theemitted energy generated by the roller cone bit decreaseswith depth, diameter, and weight on bit, while it would bedesirable to have a more powerful source as the depthincreases.
The downhole technology to be developed for drillbitwalkaway SWD can be restrained to an electronic equipmentin central position inside the drill collars, the precision anddrift constrains on the downhole clock do not need to be veryhigh, which lead to reasonable equipment cost.
Figure 58
Conclusion.
7.2 Application Domain of VSP-SWD
The first objective of the VSP-WD method is to use thedirect arrivals only in order to locate the drill bit and well tra-jectory on the surface seismic section, as long as this latter isreadable, so as to help the drillers in making appropriate deci-sions mainly about the drilling program: overpressure detec-tion often lead the drillers to set the casings at sensitive andappropriate depths. Visualizing the well trajectory on theseismic section (in time) is essential to help the drilling teammanagement, in vertical, deviated or horizontal wells.Preferably, drillers like to visualize the well trajectory in thedomain, which necessitates updating the conversion of theseismic image into depth several times during drilling, ref.:MWDC® method (Migration While Drilling Continuously)and Dream Software (Drilling and REAl time Migration)introduced by ENI-Agip and Western-Atlas in 2000, and theDBSEIS® method of Schlumberger. In spite of considerableefforts engaged by major organizations such asSchlumberger, [20, 21], or OGS, Trieste, and ENI, Milan,Italy, [22-24], devoted to developing the drillbit SWD tech-nique applied continuously while drilling, and without down-hole reference measurement, the seismic signal-to-noise ratioof the drillbit signal is often too weak, thus impractical forsustained industrial use in all geographical areas worldwide.In contrast, the examples of VSP-WD given in [25-27] illus-trate how the recorded 3C geophone data can be promising,and now yield systematic excellent direct arrivals; however,the coupling quality and the vector fidelity of the 3Cresponse of VSP-WD tools still need to be improved in com-parison with the wireline VSP tools.
The second objective of the VSP-WD is to use the reflec-tion response and look ahead of the bit: in vertical wells,early detection of overpressure is always desirable; in devi-ated wells, the VSP is able to produce an image below thewell deviation, provided the mechanical coupling of the VSPto the borehole wall is excellent (this point needs to be inves-tigated and improved in the VSP-WD tools, which furtheradds to the technological challenge of VSP-WD tools). Inhorizontal wells, the direct arrival surface to downholeshould provide at least the well trajectory in seismic time, tobe drawn on the seismic section, so as to guide the drillingnavigation (see [26] for example).
The VSP-WD method looks quite appropriate to operate abasic well-tie operation while drilling. In the horizontal partof the wells, it looks like the only method to record VSP-typedata, since the drillers are extremely reluctant to reenter theborehole with the drillstring pushing a wireline VSP tool, forreasons of borehole wall instability and security.
In vertical wells, the coupling of the 3C geophones to theformation would be improved by adding to the VSP-WD toolan anchoring pad similar to the ones used on the fluid sam-pler tools-WD, which would further increase the complexityand rental price of the VSP-WD tool.
MAIN CONCLUSIONS
On the drillbit-SWD technique of reverse walkawayusing downhole reference measurements
Technical conditions preferred for application
of the drillbit-SWD technique
(in bold, specific innovative input brought by IFP)
• Roller cone drilling, bit with milled teeth or inserts
• Weight on bit > 10 t, rpm > 90 tr/min
• Shock ABSORBER in the BHA (near bit or above)
• Bit diameter preferred: 17 1/2", 12 1/4", 8 1/2"
• Formation under drilling medium to hard,preferably with P-wave velocity Vp > 2700m/s
• Downhole technology-MWD: memory recordersynchronized with surface clock or wired drill pipes
Where does thedrillbit-SWD techniqueapply with best chances of success?
• Vertical to low deviated wells, around mid-target depth
• Onshore areas with rugged surface conditions, in whichactivating a surface seismic source is costly
• Deep objectives in areas where surface layers arecomplex (foothills zones), or where shallow layers arevery attenuating for seismic waves (ex.: Middle-East).
401
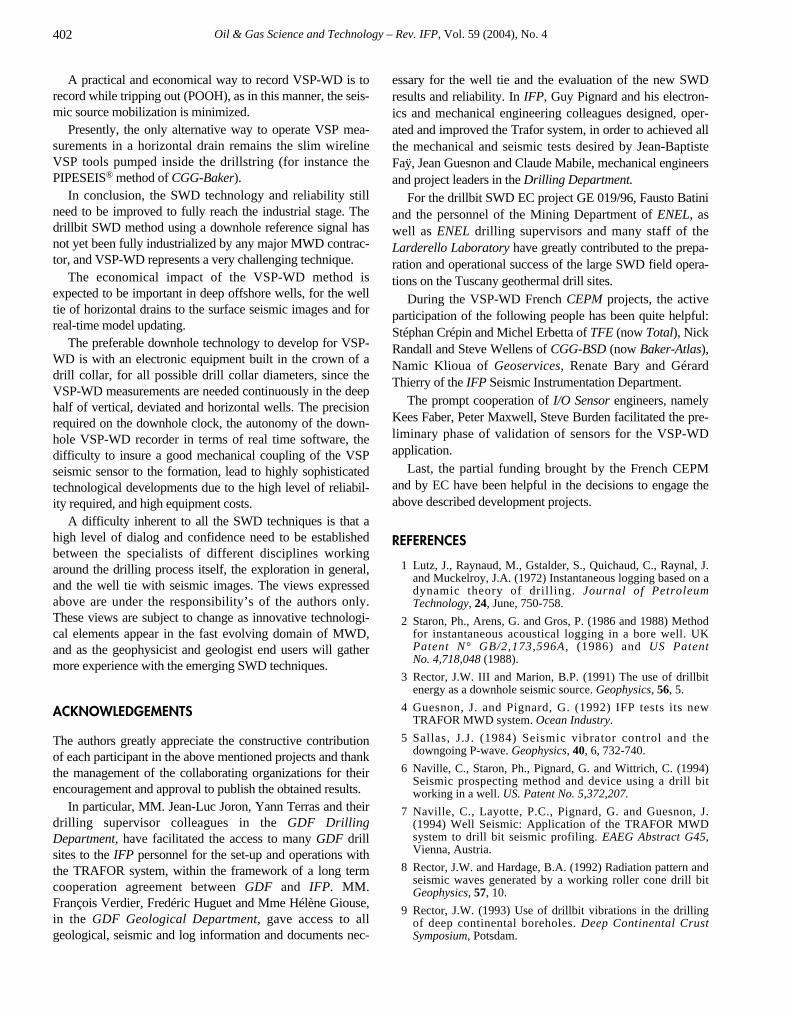
Oil & Gas Science and Technology – Rev. IFP, Vol. 59 (2004), No. 4
A practical and economical way to record VSP-WD is torecord while tripping out (POOH), as in this manner, the seis-mic source mobilization is minimized.
Presently, the only alternative way to operate VSP mea-surements in a horizontal drain remains the slim wirelineVSP tools pumped inside the drillstring (for instance thePIPESEIS® method of CGG-Baker).
In conclusion, the SWD technology and reliability stillneed to be improved to fully reach the industrial stage. Thedrillbit SWD method using a downhole reference signal hasnot yet been fully industrialized by any major MWD contrac-tor, and VSP-WD represents a very challenging technique.
The economical impact of the VSP-WD method isexpected to be important in deep offshore wells, for the welltie of horizontal drains to the surface seismic images and forreal-time model updating.
The preferable downhole technology to develop for VSP-WD is with an electronic equipment built in the crown of adrill collar, for all possible drill collar diameters, since theVSP-WD measurements are needed continuously in the deephalf of vertical, deviated and horizontal wells. The precisionrequired on the downhole clock, the autonomy of the down-hole VSP-WD recorder in terms of real time software, thedifficulty to insure a good mechanical coupling of the VSPseismic sensor to the formation, lead to highly sophisticatedtechnological developments due to the high level of reliabil-ity required, and high equipment costs.
A difficulty inherent to all the SWD techniques is that ahigh level of dialog and confidence need to be establishedbetween the specialists of different disciplines workingaround the drilling process itself, the exploration in general,and the well tie with seismic images. The views expressedabove are under the responsibility’s of the authors only.These views are subject to change as innovative technologi-cal elements appear in the fast evolving domain of MWD,and as the geophysicist and geologist end users will gathermore experience with the emerging SWD techniques.
ACKNOWLEDGEMENTS
The authors greatly appreciate the constructive contributionof each participant in the above mentioned projects and thankthe management of the collaborating organizations for theirencouragement and approval to publish the obtained results.
In particular, MM. Jean-Luc Joron, Yann Terras and theirdrilling supervisor colleagues in the GDF DrillingDepartment, have facilitated the access to many GDF drillsites to the IFP personnel for the set-up and operations withthe TRAFOR system, within the framework of a long termcooperation agreement between GDF and IFP. MM.François Verdier, Fredéric Huguet and Mme Hélène Giouse,in the GDF Geological Department, gave access to allgeological, seismic and log information and documents nec-
essary for the well tie and the evaluation of the new SWDresults and reliability. In IFP, Guy Pignard and his electron-ics and mechanical engineering colleagues designed, oper-ated and improved the Trafor system, in order to achieved allthe mechanical and seismic tests desired by Jean-BaptisteFaÿ, Jean Guesnon and Claude Mabile, mechanical engineersand project leaders in the Drilling Department.
For the drillbit SWD EC project GE 019/96, Fausto Batiniand the personnel of the Mining Department of ENEL, aswell as ENEL drilling supervisors and many staff of theLarderello Laboratory have greatly contributed to the prepa-ration and operational success of the large SWD field opera-tions on the Tuscany geothermal drill sites.
During the VSP-WD French CEPM projects, the activeparticipation of the following people has been quite helpful:Stéphan Crépin and Michel Erbetta of TFE (now Total), NickRandall and Steve Wellens of CGG-BSD (now Baker-Atlas),Namic Klioua of Geoservices, Renate Bary and GérardThierry of the IFP Seismic Instrumentation Department.
The prompt cooperation of I/O Sensor engineers, namelyKees Faber, Peter Maxwell, Steve Burden facilitated the pre-liminary phase of validation of sensors for the VSP-WDapplication.
Last, the partial funding brought by the French CEPM and by EC have been helpful in the decisions to engage theabove described development projects.
REFERENCES
1 Lutz, J., Raynaud, M., Gstalder, S., Quichaud, C., Raynal, J.and Muckelroy, J.A. (1972) Instantaneous logging based on adynamic theory of drilling. Journal of PetroleumTechnology, 24, June, 750-758.
2 Staron, Ph., Arens, G. and Gros, P. (1986 and 1988) Methodfor instantaneous acoustical logging in a bore well. UKPatent N° GB/2,173,596A, (1986) and US Patent No. 4,718,048 (1988).
3 Rector, J.W. III and Marion, B.P. (1991) The use of drillbitenergy as a downhole seismic source. Geophysics, 56, 5.
4 Guesnon, J. and Pignard, G. (1992) IFP tests its newTRAFOR MWD system. Ocean Industry.
5 Sallas, J.J. (1984) Seismic vibrator control and thedowngoing P-wave. Geophysics, 40, 6, 732-740.
6 Naville, C., Staron, Ph., Pignard, G. and Wittrich, C. (1994)Seismic prospecting method and device using a drill bitworking in a well. US. Patent No. 5,372,207.
7 Naville, C., Layotte, P.C., Pignard, G. and Guesnon, J.(1994) Well Seismic: Application of the TRAFOR MWDsystem to drill bit seismic profiling. EAEG Abstract G45,Vienna, Austria.
8 Rector, J.W. and Hardage, B.A. (1992) Radiation pattern andseismic waves generated by a working roller cone drill bitGeophysics, 57, 10.
9 Rector, J.W. (1993) Use of drillbit vibrations in the drillingof deep continental boreholes. Deep Continental CrustSymposium, Potsdam.
402
C Naville et al. / Seismic While Drilling (SWD) Techniques with Downhole Measurements
10 Naville, C., Guesnon, J. and Mabile, C. (1998) Loggingmethod and system for measuring mechanical parameters offormations crossed through by a borehole. US Patent No. 5,758,539.
11 Serbutoviez, S., Naville, C., Fay J.B., Verdier, F., Billet G.and Batini, F. (2001) Log of formation parameters whiledrilling. Poster Paper 3E, AAPG convention, Denver.
12 DRILCO (division of SMITH International, Inc.) (1986)Description of the Rubber spring SHOCK SUB® vibrationdampener. In: The Composite Catalog 1986-87, 1751-1753.
13 Parfitt, S.H.L. and Abbassian, F. (1995) A model for Shocksub performance qualification. SPE/IADC 29354, DrillingConference, Amsterdam.
14 Soulier, L. and Lemaître, M. (1993) EMWD datatransmission status and perspectives. SPE/IADC 25686,Amsterdam.
15 Batini, F., Dini, I., Certo M., Cola T., Cecconi, F., LouisSoulier, L., Naville, C. and Serbutoviez, S. (2000) Seismicwhile drilling measurements in Italian deep geothermalwells. World Geothermal Congress, Japan.
16 Naville, C., Serbutoviez, S., Throo, A., Batini, F. and Dini, I.(2000) Drillbit SWD reverse walkaway using downholereference signal. SPE 65115, EUROPEC Meeting, Paris,France.
17 Naville, C., Mabile, C., Guesnon, J. and Meynier, P. (2000)Method and device for the acquisition of signals whiledrilling. US Patent No. 6,023,444.
18 Cecconi, F. and Soulier, L. (2003) Device and method forseismic drill hole measuring. European Patent No. EP 1 130418 A1, US Patent No. 6,614,718 B2.
19 Naville, C., Serbutoviez, S., Bruneau, J., Japiot, H., Daures,R. and Gaborit, J.Y. (2001) "VSP-Dipmeter" from oriented 3component and isotropic processing. Poster Paper 7A, AAPGConvention, Denver.
20 Borland, W., Codazzi, D., Einchcomb, C., Hashem, M.,Hewett, V., Jackson, M., Meehan, R. and Tweedy, M. (1997)Real-time answers to well drilling and design questions.Schlumberger Oilfield Review, 9, 2, 2-15.
21 Armstrong, P., Nutt, L. and Minton, R. (2000) Drillingoptimization using drill-bit seismic in the deepwater Gulf ofMexico. IADC/SPE 59222, New Orleans, Louisiana, USA.
22 Poletto, F., Bertelli, L., Miranda, F. and Rocca, F. (1998)Design of SWD 3D RVSP using SEISBIT® Technology,EAGE 60th Conference, Paper 10-49, Leipzig, Germany.
23 Bertelli, L., Abramo, F., and Gatti, V. (1998) Seismic whileDrilling and geophysical monitoring in the SouthernApennine range, EAGE 60th Conference, Paper 10-50,Leipzig, Germany.
24 Malusa, M., Poletto, F., Mirande, F. and Bernasconi, G.(1998) SWD interpretation by modelling of pilot and seismicsignals, EAGE 60th Conference, Paper 10-51, Leipzig,Germany.
25 Underhill W., Esmersoy, C. and Hawthorn, A. (2001)Demonstration of real-time borehole seismic from an LWDtool. SPE 71365, New Orleans, Louisiana, USA, 30 Sept- 3 Oct.
26 King, P., Templeton, G., Reeder, M. and Bevali, S. (2002)Defining lateral velocity variations to improve reservoirmapping with new seismic measurements while drilling,Leadon field, UK. EAGE 64th Conference, Paper B-25.Florence, Italy.
27 Haldorsen, J.B.U., Krasovec, M., Raikes, S., Harrold, T.,Day, D.N. and Clippard, J.D. (2002) Comparison of fullwaveform seismic MWD and conventional VSP data fromthe South Caspian. EAGE 64th Conference, Paper B-26,Florence, Italy.
Final manuscript received in July 2004
403
Copyright © 2004, Institut français du pétrolePermission to make digital or hard copies of part or all of this work for personal or classroom use is granted without fee provided that copies are not madeor distributed for profit or commercial advantage and that copies bear this notice and the full citation on the first page. Copyrights for components of thiswork owned by others than IFP must be honored. Abstracting with credit is permitted. To copy otherwise, to republish, to post on servers, or to redistributeto lists, requires prior specific permission and/or a fee. Request permission from Documentation, Institut français du pétrole, fax. +33 1 47 52 70 78, or [email protected].