Embed Size (px)
Citation preview

SEISMIC HAZARD ZONE REPORT 063
SEISMIC HAZARD ZONE REPORT FOR THE CANADA GOBERNADORA 7.5-MINUTE
QUADRANGLE, ORANGE COUNTY, CALIFORNIA
2002
DEPARTMENT OF CONSERVATION California Geological Survey
STATE OF CALIFORNIA
GRAY DAVIS GOVERNOR
THE RESOURCES AGENCY MARY D. NICHOLS
SECRETARY FOR RESOURCES
DEPARTMENT OF CONSERVATION DARRYL YOUNG
DIRECTOR

CALIFORNIA GEOLOGICAL SURVEY
JAMES F. DAVIS, STATE GEOLOGIST
Copyright © 2002 by the California Department of Conservation. All rights reserved. No part of this publication may be reproduced without written consent of the Department of Conservation.
“The Department of Conservation makes no warrantees as to the suitability of this product for any particular purpose.”

SEISMIC HAZARD ZONE REPORT 063
SEISMIC HAZARD ZONE REPORT FOR THE CAÑADA GOBERNADORA 7.5-MINUTE
QUADRANGLE, ORNAGE COUNTY, CALIFORNIA
CALIFORNIA GEOLOGICAL SURVEY'S PUBLICATION SALES OFFICES:
Southern California Regional Office 888 South Figueroa Street, Suite 475 Los Angeles, CA 90017 (213) 239-0878
Publications and Information Office 801 K Street, MS 14-31 Sacramento, CA 95814-3531 (916) 445-5716
Bay Area Regional Office 345 Middlefield Road, MS 520 Menlo Park, CA 94025 (650) 688-6327

List of Revisions – Canada Gobernadora SHZR 63
6/3/05 BPS address correction, web link updates
10/10/05 Bay Area Regional Office and Southern California Regional Office addresses updated

2

CONTENTS
EXECUTIVE SUMMARY .......................................................................................................... vii
INTRODUCTION ...........................................................................................................................1
SECTION 1 LIQUEFACTION EVALUATION REPORT Liquefaction Zones in the Canada Gobernadora 7.5-Minute Quadrangle, Orange County, California .................................................3
PURPOSE....................................................................................................................................3
BACKGROUND .....................................................................................................................4
METHODS SUMMARY.........................................................................................................4
SCOPE AND LIMITATIONS.................................................................................................5
PART I .........................................................................................................................................5
PHYSIOGRAPHY...................................................................................................................5
GEOLOGY ..............................................................................................................................6
ENGINEERING GEOLOGY ..................................................................................................8
GROUND-WATER CONDITIONS .......................................................................................9
PART II......................................................................................................................................10
LIQUEFACTION POTENTIAL ...........................................................................................10
LIQUEFACTION SUSCEPTIBILITY..................................................................................10
LIQUEFACTION OPPORTUNITY .....................................................................................12
LIQUEFACTION ZONES ....................................................................................................14
ACKNOWLEDGMENTS .........................................................................................................15
REFERENCES ..........................................................................................................................16

SECTION 2 EARTHQUAKE-INDUCED LANDSLIDE EVALUATION REPORT Earthquake-Induced Landslide Zones in the Canada Gobernadora 7.5-Minute Quadrangle, Orange County, California.............................................................................................................19
PURPOSE..................................................................................................................................19
BACKGROUND ...................................................................................................................20
METHODS SUMMARY.......................................................................................................20
SCOPE AND LIMITATIONS...............................................................................................21
PART I .......................................................................................................................................22
PHYSIOGRAPHY.................................................................................................................22
GEOLOGY ............................................................................................................................23
ENGINEERING GEOLOGY ................................................................................................27
PART II......................................................................................................................................30
EARTHQUAKE-INDUCED LANDSLIDE HAZARD POTENTIAL.................................30
EARTHQUAKE-INDUCED LANDSLIDE HAZARD ZONE ............................................34
ACKNOWLEDGMENTS .........................................................................................................35
REFERENCES ..........................................................................................................................36
AIR PHOTOS ............................................................................................................................38
APPENDIX A Source of Rock Strength Data...........................................................................38
SECTION 3 GROUND SHAKING EVALUATION REPORT Potential Ground Shaking in the Canada Gobernadora 7.5-Minute Quadrangle, Orange County, California ............................39
PURPOSE..................................................................................................................................39
EARTHQUAKE HAZARD MODEL .......................................................................................40
APPLICATIONS FOR LIQUEFACTION AND LANDSLIDE HAZARD ASSESSMENTS 44
USE AND LIMITATIONS........................................................................................................47
REFERENCES ..........................................................................................................................48
iv

ILLUSTRATIONS
Figure 2.1. Yield Acceleration vs. Newmark Displacement for the USC Station # 14. ..............32
Figure 3.1. Canada Gobernadora 7.5-Minute Quadrangle and portions of adjacent quadrangles, 10% exceedance in 50 years peak ground acceleration (g)—Firm rock conditions..............41
Figure 3.2. Canada Gobernadora 7.5-Minute Quadrangle and portions of adjacent quadrangles, 10% exceedance in 50 years peak ground acceleration (g)—Soft rock conditions. ..............42
Figure 3.3. Canada Gobernadora 7.5-Minute Quadrangle and portions of adjacent quadrangles, 10% exceedance in 50 years peak ground acceleration (g)—Alluvium conditions. .............43
Figure 3.4. Canada Gobernadora 7.5-Minute Quadrangle and portions of adjacent quadrangles, 10% exceedance in 50 years peak ground acceleration—Predominant earthquake. .............45
Figure 3.5. Canada Gobernadora 7.5-Minute Quadrangle and portions of adjacent quadrangles, 10% exceedance in 50 years magnitude-weighted pseudo-peak acceleration for alluvium - Liquefaction opportunity .......................................................................................................46
Table 1.1. Units of the Southern California Areal Mapping Project (SCAMP) Nomenclature Used in the Canada Gobernadora Quadrangle.........................................................................9
Table 1.2. Quaternary Map Units Used in the Canada Gobernadora 7.5-Minute Quadrangle and Their Geotechnical Characteristics and Liquefaction Susceptibility.....................................14
Table 2.1. Summary of the Shear Strength Statistics for the Canada Gobernadora Quadrangle.29
Table 2.2. Summary of the Shear Strength Groups for the Canada Gobernadora Quadrangle. .30
Table 2.3. Hazard Potential Matrix for Earthquake-Induced Landslides in the Canada Gobernadora Quadrangle.. .....................................................................................................34
Plate 1.1. Quaternary geologic map of the Canada Gobernadora 7.5-Minute Quadrangle, California ...............................................................................................................................50
Plate 1.2. Depth to historically highest ground water and location of boreholes used in this study, Canada Gobernadora 7.5-Minute Quadrangle, California .........................................51
Plate 2.1. Landslide inventory, shear test sample locations, and areas of significant grading, Canada Gobernadora 7.5-Minute Quadrangle .......................................................................52


EXECUTIVE SUMMARY
This report summarizes the methods and sources of information used to prepare the Seismic Hazard Zone Map for the Canada Gobernadora 7.5-minute Quadrangle, Orange County, California. The map displays the boundaries of Zones of Required Investigation for liquefaction and earthquake-induced landslides over an area of approximately 51 square miles at a scale of 1 inch = 2,000 feet. In general, national forest land, parkland and areas within adjacent counties have not been zoned.
Nearly the entire Canada Gobernadora Quadrangle lies within southeastern Orange County. The Cleveland National Forest extends into the eastern and northeastern parts and Caspers Regional Park spreads across the central part. The remainder of the land in Orange County is unincorporated. The area lies on the western slope of the Santa Ana Mountains, which is characterized by rugged, mountainous terrain, dissected by several large north-south-trending canyons, such as Canada Gobernadora. The highest point, above 2,100 feet, is in the northeastern corner and the lowest point, below 200 feet, is in San Juan Creek at the western border of the map area. San Juan Creek is the major drainage course in the quadrangle. It has several large tributary canyons. Gently sloping to nearly level Plano Trabuco cuts across the northwestern corner. Ortega Highway (State Highway 74) provides primary access. Other localities can be reached via roads that intersect easternmost Oso Parkway near the western boundary or the Foothill Transportation Corridor (State Highway 241) to the north of the quadrangle. Residential development is underway in the unincorporated community of Coto de Caza at the northern end of Canada Gobernadora and to the west in Canada Chiquita.
The map is prepared by employing geographic information system (GIS) technology, which allows the manipulation of three-dimensional data. Information considered includes topography, surface and subsurface geology, borehole data, historical ground-water levels, existing landslide features, slope gradient, rock-strength measurements, geologic structure, and probabilistic earthquake shaking estimates. The shaking inputs are based upon probabilistic seismic hazard maps that depict peak ground acceleration, mode magnitude, and mode distance with a 10% probability of exceedance in 50 years.
In the Canada Gobernadora Quadrangle the liquefaction zone is restricted to the bottoms of canyons, especially San Juan Creek, Canada Chiquita, Canada Gobernadora and shorter segments of tributary canyons. The bedrock that rests upon crystalline basement in the quadrangle essentially consists of a homoclinal, westward-dipping sequence of marine and nonmarine strata. Several of the units have abundant landslides. The earthquake-induced landslide zone covers about 25 percent of the quadrangle.
vii

How to view or obtain the map
Seismic Hazard Zone Maps, Seismic Hazard Zone Reports and additional information on seismic hazard zone mapping in California are available on the California Geological Survey's Internet page: http://www.conservation.ca.gov/CGS/index.htm
Paper copies of Official Seismic Hazard Zone Maps, released by CGS, which depict zones of required investigation for liquefaction and/or earthquake-induced landslides, are available for purchase from:
BPS Reprographic Services 945 Bryant Street San Francisco, California 94105 (415) 512-6550
Seismic Hazard Zone Reports (SHZR) summarize the development of the hazard zone map for each area and contain background documentation for use by site investigators and local government reviewers. These reports are available for reference at CGS offices in Sacramento, San Francisco, and Los Angeles. NOTE: The reports are not available through BPS Reprographic Services.

INTRODUCTION
The Seismic Hazards Mapping Act (the Act) of 1990 (Public Resources Code, Chapter 7.8, Division 2) directs the California Department of Conservation (DOC), Division of Mines and Geology (DMG) [now called the California Geological Survey (CGS)] to delineate seismic hazard zones. The purpose of the Act is to reduce the threat to public health and safety and to minimize the loss of life and property by identifying and mitigating seismic hazards. Cities, counties, and state agencies are directed to use the seismic hazard zone maps in their land-use planning and permitting processes. They must withhold development permits for a site within a zone until the geologic and soil conditions of the project site are investigated and appropriate mitigation measures, if any, are incorporated into development plans. The Act also requires sellers (and their agents) of real property within a mapped hazard zone to disclose at the time of sale that the property lies within such a zone. Evaluation and mitigation of seismic hazards are to be conducted under guidelines adopted by the California State Mining and Geology Board (SMGB) (DOC, 1997). The text of this report is on the Internet at http://gmw.consrv.ca.gov/shmp/webdocs/sp117.pdf
The Act also directs SMGB to appoint and consult with the Seismic Hazards Mapping Act Advisory Committee (SHMAAC) in developing criteria for the preparation of the seismic hazard zone maps. SHMAAC consists of geologists, seismologists, civil and structural engineers, representatives of city and county governments, the state insurance commissioner and the insurance industry. In 1991 SMGB adopted initial criteria for delineating seismic hazard zones to promote uniform and effective statewide implementation of the Act. These initial criteria provide detailed standards for mapping regional liquefaction hazards. They also directed CGS to develop a set of probabilistic seismic maps for California and to research methods that might be appropriate for mapping earthquake-induced landslide hazards.
In 1996, working groups established by SHMAAC reviewed the prototype maps and the techniques used to create them. The reviews resulted in recommendations that 1) the process for zoning liquefaction hazards remain unchanged and 2) earthquake-induced landslide zones be delineated using a modified Newmark analysis.
This Seismic Hazard Zone Report summarizes the development of the hazard zone map. The process of zoning for liquefaction uses a combination of Quaternary geologic mapping, historical ground-water information, and subsurface geotechnical data. The process for zoning earthquake-induced landslides incorporates earthquake loading, existing landslide features, slope gradient, rock strength, and geologic structure. Probabilistic seismic hazard maps, which are the underpinning for delineating seismic hazard zones, have been prepared for peak ground acceleration, mode magnitude, and mode distance with a 10% probability of exceedance in 50 years (Petersen and others, 1996) in accordance with the mapping criteria.
1

This report summarizes seismic hazard zone mapping for potentially liquefiable soils and earthquake-induced landslides in the Canada Gobernadora 7.5-minute Quadrangle.

SECTION 1 LIQUEFACTION EVALUATION REPORT
Liquefaction Zones in the Canada Gobernadora 7.5-Minute Quadrangle,
Orange County, California
By Cynthia L. Pridmore
California Department of Conservation
California Geological Survey
PURPOSE
The Seismic Hazards Mapping Act (the Act) of 1990 (Public Resources Code, Chapter 7.8, Division 2) directs the California Department of Conservation (DOC), Division of Mines and Geology (DMG) [now called California Geological Survey (CGS)] to delineate Seismic Hazard Zones. The purpose of the Act is to reduce the threat to public health and safety and to minimize the loss of life and property by identifying and mitigating seismic hazards. Cities, counties, and state agencies are directed to use seismic hazard zone maps developed by CGS in their land-use planning and permitting processes. The Act requires that site-specific geotechnical investigations be performed prior to permitting most urban development projects within seismic hazard zones. Evaluation and mitigation of seismic hazards are to be conducted under guidelines adopted by the California State Mining and Geology Board (SMGB) (DOC, 1997). The text of this report is on the Internet at http://gmw.consrv.ca.gov/shmp/webdocs/sp117.pdf
Following the release of DMG Special Publication 117 (DOC, 1997), agencies in the Los Angeles metropolitan region sought more definitive guidance in the review of geotechnical investigations addressing liquefaction hazards. The agencies made their request through the Geotechnical Engineering Group of the Los Angeles Section of the American Society of Civil Engineers (ASCE). This group convened an implementation committee under the auspices of the Southern California Earthquake Center (SCEC).
3

CALIFORNIA GEOLOGICAL SURVEY SHZR 063 4
The committee, which consisted of practicing geotechnical engineers and engineering geologists, released an overview of the practice of liquefaction analysis, evaluation, and mitigation techniques (SCEC, 1999). This text is also on the Internet at: http://www.scec.org/
This section of the evaluation report summarizes seismic hazard zone mapping for potentially liquefiable soils in the Canada Gobernadora 7.5-minute Quadrangle. Section 2 (addressing earthquake-induced landslides) and Section 3 (addressing potential ground shaking), complete the report, which is one of a series that summarizes production of similar seismic hazard zone maps within the state (Smith, 1996). Additional information on seismic hazards zone mapping in California is on CGS’s Internet web page: http://www.conservation.ca.gov/CGS/index.htm
BACKGROUND
Liquefaction-induced ground failure historically has been a major cause of earthquake damage in southern California. During the 1971 San Fernando and 1994 Northridge earthquakes, significant damage to roads, utility pipelines, buildings, and other structures in the Los Angeles area was caused by liquefaction-induced ground displacement.
Localities most susceptible to liquefaction-induced damage are underlain by loose, water-saturated, granular sediment within 40 feet of the ground surface. These geological and ground-water conditions exist in parts of southern California, most notably in some densely populated valley regions and alluviated floodplains. In addition, the potential for strong earthquake ground shaking is high because of the many nearby active faults. The combination of these factors constitutes a significant seismic hazard in the southern California region in general, including areas in the Canada Gobernadora Quadrangle.
METHODS SUMMARY
Characterization of liquefaction hazard presented in this report requires preparation of maps that delineate areas underlain by potentially liquefiable sediment. The following were collected or generated for this evaluation:
• Existing geologic maps were used to provide an accurate representation of the spatial distribution of Quaternary deposits in the study area. Geologic units that generally are susceptible to liquefaction include late Quaternary alluvial and fluvial sedimentary deposits and artificial fill
• Construction of shallow ground-water maps showing the historically highest known ground-water levels
• Quantitative analysis of geotechnical data to evaluate liquefaction potential of deposits

• Information on potential ground shaking intensity based on CGS probabilistic shaking maps
The data collected for this evaluation were processed into a series of geographic information system (GIS) layers using commercially available software. The liquefaction zone map was derived from a synthesis of these data and according to criteria adopted by the SMGB (DOC, 2000).
SCOPE AND LIMITATIONS
Evaluation for potentially liquefiable soils generally is confined to areas covered by Quaternary (less than about 1.6 million years) sedimentary deposits. Such areas within the Canada Gobernadora Quadrangle consist mainly of alluviated valleys, floodplains, and canyons. CGS’s liquefaction hazard evaluations are based on information on earthquake ground shaking, surface and subsurface lithology, geotechnical soil properties, and ground-water depth, which is gathered from various sources. Although selection of data used in this evaluation was rigorous, the quality of the data used varies. The State of California and the Department of Conservation make no representations or warranties regarding the accuracy of the data obtained from outside sources.
Liquefaction zone maps are intended to prompt more detailed, site-specific geotechnical investigations, as required by the Act. As such, liquefaction zone maps identify areas where the potential for liquefaction is relatively high. They do not predict the amount or direction of liquefaction-related ground displacements, or the amount of damage to facilities that may result from liquefaction. Factors that control liquefaction-induced ground failure are the extent, depth, density, and thickness of liquefiable materials, depth to ground water, rate of drainage, slope gradient, proximity to free faces, and intensity and duration of ground shaking. These factors must be evaluated on a site-specific basis to assess the potential for ground failure at any given project site.
Information developed in the study is presented in two parts: physiographic, geologic, and hydrologic conditions in PART I, and liquefaction and zoning evaluations in PART II.
PART I
PHYSIOGRAPHY
Study Area Location and Physiography
The Canada Gobernadora Quadrangle covers an area of about 60 square miles in easternmost Orange County. Lands within the Cleveland National Forest extend into the
5

CALIFORNIA GEOLOGICAL SURVEY SHZR 063 6
easternmost edge and northeastern corner of the quadrangle. The Caspers Regional Park spreads across several square miles in the central part of the quadrangle. Small parts of Riverside and San Diego counties also extend into the southeastern corner of the quadrangle. The remainder of the quadrangle is unincorporated Orange County land. The area evaluated in the quadrangle, which is subject to development, is about 51 square miles.
The study area lies on the western slope of the Santa Ana Mountains in the Peninsular Ranges geomorphic province of southern California. Rugged, mountainous terrain, dissected by several large north-south-trending canyons, such as Canada Gobernadora, characterizes the topography within the quadrangle. The highest point, above 2,100 feet elevation, is in the northeastern corner of the quadrangle. The lowest point, below an elevation of 200 feet, is in San Juan Creek at the western border of the map. San Juan Creek is the major drainage course in the quadrangle. Creeks from a half dozen large tributary canyons join it. Gently sloping to nearly level land of Plano Trabuco cuts across the northwestern corner.
Access to the Canada Gobernadora Quadrangle is provided primarily by the Ortega Highway (State Highway 74), which crosses the entire area. Other localities can be reached via roads that intersect easternmost Oso Parkway near the western boundary or the Foothill Transportation Corridor (State Highway 241) to the north of the quadrangle. Residential development is underway in the unincorporated community of Coto de Caza at the northern end of Canada Gobernadora and to the west in Canada Chiquita. Large parts of the quadrangle are covered by parkland in the Caspers Wilderness Park, Riley Wilderness Park and the Starr Ranch Sanctuary of the National Aububon Society.
GEOLOGY
Bedrock and Surficial Geology
Geologic units generally susceptible to liquefaction include late Quaternary alluvial and fluvial sedimentary deposits and artificial fill. For this evaluation, the geologic map for the Canada Gobernadora Quadrangle was compiled and digitized by the Southern California Areal Mapping Project [SCAMP] (Morton and Kennedy, 1989) from 1:12,000-scale mapping (Morton, 1970; 1974). Nomenclature for the Quaternary geologic units follows that applied by SCAMP. Additional linework and nomenclature modifications were done by CGS. Plate 1.1 shows the generalized Quaternary geology of the Canada Gobernadora Quadrangle map that was used in combination with other data to evaluate liquefaction potential and develop the Seismic Hazard Zone Map.
Approximately 25 percent of the quadrangle is covered by alluvial deposits of Quaternary age. These Pleistocene through Holocene surficial deposits are summarized in Table 1.1 and discussed below. The remainder of the quadrangle consists of Jurassic through Cretaceous igneous and metamorphic bedrock overlain by marine and/or nonmarine

strata that range in age from Cretaceous to Pliocene (refer to the earthquake-induced landslide portion, Section 2, of this report for further details on the bedrock).
Older alluvial channel and valley fill deposits of early to middle Pleistocene age (Qvoa) and middle to late Pleistocene age (Qoa) are located above and adjacent to major drainages. The remaining younger alluvial units consist of channel deposits (Qya, Qya1, Qya2), slopewash and colluvial debris (Qc, Qcb), lacustrine (Ql), landslide debris, and artificial fill materials. Landslides are not shown on the generalized geologic map (Plate 1.1) but are specifically addressed in Section 2.
The late Pleistocene through Holocene channel deposits consist of active wash and alluvial valley deposits. They occur within all the major canyons and in the downstream portions of smaller drainages. Qya, Qya1, and Qya2 are composed essentially of the same materials, but where differentiated, Qya2 represents the most recently active channels that are affected currently by alluvial processes (Morton 1970; 1974). Qya1 represents materials exposed along the banks of the active channels. Qya is used where these materials are not subdivided. Colluvium, also known as slope wash, occurs in small drainages, upstream portions of major drainages, and along gentle to moderate slopes. This unit is gradational with other alluvial units. Where boulders dominate the colluvium, it is designated as Qcb. Colluvium ranges from late Pleistocene to Holocene. Within the Canada Gobernadora Quadrangle, areas mapped as Ql are considered to be sediments deposited in temporary lakes formed as a result of drainage disrupted by landslides, or possibly sluggish meandering stream deposits (Morton 1970; 1974). Artificial fills resulting from grading and construction activities are present within the study area but are not shown on Plate 1.1 due to the limits of scale.
Map Unit Environment of
Deposition Age
Qvoa channel/valley deposits
early to middle Pleistocene
Qoa channel/valley deposits
middle to late Pleistocene
Qya, Qya1, Qya2 channel/valley deposits
late Pleistocene and Holocene
Qc, Qcb Colluvium/ slopewash
late Pleistocene and Holocene
Ql Lacustrine late Pleistocene and Holocene
Table 1.1. Units of the Southern California Areal Mapping Project (SCAMP) Nomenclature Used in the Canada Gobernadora Quadrangle.

CALIFORNIA GEOLOGICAL SURVEY SHZR 063 8
Structural Geology
The Canada Gobernadora Quadrangle lies within the foothills of the southern Santa Ana Mountains, which are part of the Peninsular Ranges geomorphic province of southern California. This province is broken by several large regional northwest-trending faults. The study area lies within a block bound on the northeast by the Elsinore Fault and on the southwest by the offshore extension of the Newport-Inglewood Fault. Exposed in the area between the regional fault zone is a sequence of mostly west-dipping strata of Jurassic, Cretaceous, and Tertiary age. Relatively thin, flat-lying Quaternary terrace deposits occur adjacent to modern drainages, and as isolated remnants in upland areas. A more detailed discussion of the structural geology is presented in Section 2.
ENGINEERING GEOLOGY
CGS conducted a subsurface investigation of Quaternary sedimentary deposits in the Canada Gobernadora Quadrangle using borehole and trench logs from the files of the following agencies and organizations: Orange County Planning and Development; California Department of Transportation; California Department of Water Resources; Leighton and Associates; and Goffman, McCormick & Urban, Inc. The locations of the exploratory boreholes and trenches used in this investigation are shown on Plate 1.2.
Of approximately 250 logs that were collected and reviewed for this evaluation, data from 186 logs were entered into the CGS's GIS. This database allowed effective examination of subsurface geology through the construction of software-generated cross sections. Staff examined the nature and distribution of various depositional units in the subsurface, correlated soil types where feasible, extrapolated geotechnical data into outlying areas containing similar soils, and evaluated historical ground-water depths.
Eighty four of the 186 logs evaluated contained Standard Penetration Test (SPT) results or normalized SPT results that provided information on the density, or compactness, of Quaternary sedimentary layers penetrated by the borehole. This test, along with the results of other engineering tests (dry density, moisture content, sieve analysis, etc.) are used in the Seed-Idriss Simplified Procedure (Seed and Idriss, 1971) to evaluate liquefaction potential of a site (see Part II - Quantitative Liquefaction Analysis). The results of the liquefaction analysis performed on the geotechnical data were posted onto the cross sections and aided in the overall three-dimensional evaluation of the Quaternary deposits.
It is important to note that the Seed-Idriss Simplified Procedure was developed primarily for clean sand and silty sand, and results depend greatly on accurate measurement of in-situ soil density. However, the cross sections generated in this study show that some of the young Quaternary alluvial deposits contain a significant amount of gravel. In the past, gravelly soils were considered not to be susceptible to liquefaction because the high permeability of these soils presumably would allow the dissipation of pore pressures before liquefaction could occur. However, liquefaction in gravelly soils has been observed during earthquakes, and recent laboratory studies have shown that gravelly soils
9
are susceptible to liquefaction (Ishihara, 1985; Harder and Seed, 1986; Budiman and Mohammadi, 1995; Evans and Zhou, 1995; and Sy and others, 1995). SPT-derived density measurements in gravelly soils are unreliable and generally too high. They are likely to lead to overestimation of the density of the soil and, therefore, result in an underestimation of the liquefaction susceptibility. To identify potentially liquefiable units where the N values appear to have been affected by gravel content, correlations are made with boreholes in the same unit where the N (blow count) values do not appear to be affected by gravel.
GROUND-WATER CONDITIONS
Liquefaction hazard may exist in areas where depth to ground water is 40 feet or less. This is because saturated conditions in near-surface sediments reduce the effective normal stress thereby increasing the likelihood of earthquake-induced liquefaction (Youd, 1973). CGS liquefaction evaluations incorporate the historically highest known ground-water levels since depth to ground water during an earthquake cannot be anticipated because of the unpredictable fluctuations caused by natural processes and human activities. Thus, CGS develops a hypothetical ground-water table map within alluviated areas based on the estimated shallowest depths that have occurred during historic time. These maps differ from conventional ground-water contour maps that show the measured water table for a particular year or season.
The ground-water evaluation of the Canada Gobernadora Quadrangle was based on first-encountered water noted in geotechnical borehole logs. The depths to first-encountered water, free of piezometric influences, were evaluated by CGS to develop a map of the project area showing depths to historically shallowest ground water (Plate 1.2).
Borehole and water well data collected for this study indicate measured water levels that range from a few feet to more than 40 feet below the ground surface. Due to limited records in the canyon areas, historical high ground water was assumed to be from 0 to 10 feet based on the shallowest water encountered along the length of the drainage or adjacent drainages. These assumptions are considered reasonable based upon measured and expected seasonal variations in ground-water level. Morton (1974) noted that perennial ground-water underflow was present in the major canyons during the late 1960's. In Canada Gobernadora and Canada Chiquita, the low permeability of buried lake sediments creates perched-water conditions in areas where those deposits are overlain by younger valley sediments (Morton, 1974). For areas covered by older alluvium (Qoa), historical high ground-water depths were assigned values of 10 to 20 feet based on what was encountered in boreholes and trenches. Water was not encountered in the oldest (Qvoa) terrace sediments.

CALIFORNIA GEOLOGICAL SURVEY SHZR 063 10
PART II
LIQUEFACTION POTENTIAL
Liquefaction may occur in water-saturated sediment during moderate to great earthquakes. Liquefied sediment loses strength and may fail, causing damage to buildings, bridges, and other structures. Many methods for mapping liquefaction hazard have been proposed. Youd (1991) highlights the principal developments and notes some of the widely used criteria. Youd and Perkins (1978) demonstrate the use of geologic criteria as a qualitative characterization of liquefaction susceptibility and introduce the mapping technique of combining a liquefaction susceptibility map and a liquefaction opportunity map to produce a liquefaction potential map. Liquefaction susceptibility is a function of the capacity of sediment to resist liquefaction. Liquefaction opportunity is a function of the potential seismic ground shaking intensity.
The method applied in this study for evaluating liquefaction potential is similar to that of Tinsley and others (1985). Tinsley and others (1985) applied a combination of the techniques used by Seed and others (1983) and Youd and Perkins (1978) for their mapping of liquefaction hazards in the Los Angeles region. CGS’s method combines geotechnical analyses, geologic and hydrologic mapping, and probabilistic earthquake shaking estimates, but follows criteria adopted by the SMGB (DOC, 2000).
LIQUEFACTION SUSCEPTIBILITY
Liquefaction susceptibility reflects the relative resistance of a soil to loss of strength when subjected to ground shaking. Physical properties of soil such as sediment grain-size distribution, compaction, cementation, saturation, and depth govern the degree of resistance to liquefaction. Some of these properties can be correlated to a sediment’s geologic age and environment of deposition. With increasing age, relative density may increase through cementation of the particles or compaction caused by the weight of the overlying sediment.
Grain-size characteristics of a soil also influence susceptibility to liquefaction. Sand is more susceptible than silt or gravel, although silt of low plasticity is treated as liquefiable in this investigation. Cohesive soils generally are not considered susceptible to liquefaction. Such soils may be vulnerable to strength loss with remolding and represent a hazard that is not addressed in this investigation. Soil characteristics and processes that result in higher measured penetration resistances generally indicate lower liquefaction susceptibility. Thus, blow count and cone penetrometer values are useful indicators of liquefaction susceptibility.
Saturation is required for liquefaction, and the liquefaction susceptibility of a soil varies with the depth to ground water. Very shallow ground water increases the susceptibility to liquefaction (soil is more likely to liquefy). Soils that lack resistance (susceptible soils)
11
typically are saturated, loose and sandy. Soils resistant to liquefaction include all soil types that are dry, cohesive, or sufficiently dense. CGS’s map inventory of areas containing soils susceptible to liquefaction begins with evaluation of geologic maps and historical occurrences, cross-sections, geotechnical test data, geomorphology, and ground-water hydrology. Soil properties and soil conditions such as type, age, texture, color, and consistency, along with historical depths to ground water are used to identify, characterize, and correlate susceptible soils. Because Quaternary geologic mapping is based on similar soil observations, liquefaction susceptibility maps typically are similar to Quaternary geologic maps. CGS’s qualitative relations between geologic map unit and susceptibility are summarized in Table 1.2.
Discussion of Map Units
Most Holocene materials where water levels are within 30 feet of the ground surface have susceptibility assignments of high to very high. Although some Holocene units may be fine grained, many contain lenses of material with higher liquefaction susceptibility. Within the Canada Gobernadora Quadrangle the young channel/alluvial valley deposits (Qya, Qya1, and Qya2) are all considered highly susceptible. Borehole and trench logs for these materials generally encountered intervals of clean-sorted sands with intervals of gravelly, silty and clayey sand, silt and clay. Materials were generally loose to medium dense as recorded in both descriptions and blow-count data. In Canada Gobernadora and Canada Chiquita materials tend to be finer grained than in San Juan Canyon and the other secondary canyons. Logs indicate mostly sand and clayey sand and minor gravel lenses.
Throughout the Canada Gobernadora Quadrangle colluvium (Qc) is extensive. However for this study only the colluvial units mapped in canyons and swales were considered for liquefaction evaluation. Borehole and trench logs collected show that the colluvium within these areas is laterally and vertically transitional with, and sometimes indistinguishable from Qya deposits. Compositionally, colluvium is highly variable and reflects adjacent bedrock sources. Within the Canada Gobernadora Quadrangle, borehole logs within colluvium encountered loose to medium dense, gravel, sand, silt and clay. Liquefaction susceptibility for this unit is moderate to high. Where boulders predominate, colluvium (Qcb) is considered to have low susceptibility for liquefaction.
The lake deposits (Ql), which occur in Canada Gobernadora and Canada Chiquita, tend to be composed of fine- to coarse-grained, organic material-bearing, sandy clay alternating with and grading to clayey sand. Although this unit is predominately fine grained, it contains lenses and layers of coarser-grained materials that can potentially liquefy.
The composition of older alluvium (Qoa) is widely variable because of the diversity of source areas. In general, Qoa is composed of coarse- to fine-grained, permeable, silty sand, clayey sand and gravel. Borehole logs and trenches encountered medium-dense to dense clayey gravel, silty sand, silt and clay. Because of their age and subsurface characteristics, these units are considered not likely to be susceptible to liquefaction.

CALIFORNIA GEOLOGICAL SURVEY SHZR 063 12
In the Canada Gobernadora Quadrangle, relatively little geotechnical data was collected for the very old channel/alluvial valley deposits (Qvoa). Alluvial deposits of this age are generally considered not susceptible to liquefaction due largely to age-related processes that act to densify the materials. Logs penetrating this unit record materials consisting of dense to weakly cemented, clayey sand, silt, and gravel.
Subsurface data were not collected for any fill units. Artificial fill areas consist of engineered fill for elevated highways and small earthen dams. Since these fills are generally considered to be properly engineered, zoning for liquefaction in such areas depends on soil conditions in underlying strata.
Geologic Map Unit Sediment Type Consistency Age Susceptible to Liquefaction?*
Qvoa Gravel, sand, silt, clay Weakly cemented
early to middle Pleistocene
no
Qoa Gravel, sand, silt Medium to very dense
middle to late Pleistocene
not likely
Qya, Qya1, Qya2 Gravel, sand, silt, clay Loose to medium dense
late Pleistocene and Holocene
yes
Qc Gravel, sand, silt, clay Loose to medium dense
late Pleistocene and Holocene
yes
Qcb Boulder, gravel, sand, silt
Loose to medium dense
late Pleistocene and Holocene
not likely
Ql Silt, clay, sand Loose modern yes
Table 1.2. Quaternary Map Units Used in the Canada Gobernadora 7.5-Minute Quadrangle and Their Geotechnical Characteristics and Liquefaction Susceptibility (*when saturated).
LIQUEFACTION OPPORTUNITY
Liquefaction opportunity is a measure, expressed in probabilistic terms, of the potential for strong ground shaking. Analyses of in-situ liquefaction resistance require assessment of liquefaction opportunity. The minimum level of seismic excitation to be used for such purposes is the level of peak ground acceleration (PGA) with a 10% probability of exceedance over a 50-year period (DOC, 2000). The earthquake magnitude used in CGS’s analysis is the magnitude that contributes most to the calculated PGA for an area.

13
For the Canada Gobernadora Quadrangle, PGAs of 0.31 to 0.34g, resulting from an earthquake of magnitude 6.8 were used for liquefaction analyses. The PGA and magnitude values were based on de-aggregation of the probabilistic hazard at the 10% in 50-year hazard level (Petersen and others, 1996; Cramer and Petersen, 1996). See the ground motion portion (Section 3) of this report for further details.
Quantitative Liquefaction Analysis
CGS performs quantitative analysis of geotechnical data to evaluate liquefaction potential using the Seed-Idriss Simplified Procedure (Seed and Idriss, 1971; Seed and others, 1983; National Research Council, 1985; Seed and others, 1985; Seed and Harder, 1990; Youd and Idriss, 1997). Using the Seed-Idriss Simplified Procedure one can calculate soil resistance to liquefaction, expressed in terms of cyclic resistance ratio (CRR), based on SPT results, ground-water level, soil density, moisture content, soil type, and sample depth. CRR values are then compared to calculated earthquake-generated shear stresses expressed in terms of cyclic stress ratio (CSR).
The SPT involves recording the number of blows required to drive a 1.4-inch inside diameter split-spoon sampler one foot into the soil using a 140-pound hammer-weight dropped 30 inches. The test is conducted in compliance with American Society for Testing and Materials (ASTM) D1586 (ASTM, 1999). Of the 186 geotechnical borehole logs used in this study (Plate 1.2), 84 include blow-count data from SPTs or from penetration tests that allow reasonable blow count translations to SPT-equivalent values. Non-SPT values, such as those resulting from the use of 2-inch or 2½-inch inside-diameter ring samplers, were translated to SPT-equivalent values if reasonable factors could be used in conversion calculations. The reliability of the SPT-equivalent values varies. Therefore, they are weighted and used in a more qualitative manner. Few borehole logs, however, include all of the information (e.g. soil density, moisture content, sieve analysis, etc.) required for an ideal Seed-Idriss Simplified Procedure. For boreholes having acceptable penetration tests, liquefaction analysis is performed using recorded density, moisture, and sieve test values or using averaged test values of similar materials. The actual and converted SPT blow counts are normalized to a common reference effective overburden pressure of one atmosphere (approximately one ton per square foot) and a hammer efficiency of 60% using a method described by Seed and Idriss (1982) and Seed and others (1985). This normalized blow count is referred to as (N1)60.
The Seed-Idriss Simplified Procedure requires normalizing earthquake loading relative to a M7.5 event for the liquefaction analysis. To accomplish this, CGS’s analysis uses the Idriss magnitude-scaling factor (MSF) (Youd and Idriss, 1997). It is convenient to think in terms of a factor of safety (FS) relative to liquefaction, where: FS = (CRR / CSR) * MSF. FS, therefore, is a quantitative measure of liquefaction potential. CGS uses a factor of safety of 1.0 or less, where CSR equals or exceeds CRR, to indicate the presence of potentially liquefiable soil. While an FS of 1.0 is considered the “trigger” for liquefaction, for a site specific analysis an FS of as much as 1.5 may be appropriate depending on the vulnerability of the site and related structures.

CALIFORNIA GEOLOGICAL SURVEY SHZR 063 14
The CGS liquefaction analysis program calculates an FS for each geotechnical sample where blow counts were collected. Typically, multiple samples are collected for each borehole. The program then independently calculates an FS for each non-clay layer that includes at least one penetration test using the minimum (N1)60 value for that layer. The minimum FS value of the layers penetrated by the borehole is used to determine the liquefaction potential for each borehole location. The reliability of FS values varies according to the quality of the geotechnical data. FS, as well as other considerations such as slope, presence of free faces, and thickness and depth of potentially liquefiable soil, are evaluated in order to construct liquefaction potential maps, which are then used to make a map showing zones of required investigation.
LIQUEFACTION ZONES
Criteria for Zoning
Areas underlain by materials susceptible to liquefaction during an earthquake were included in liquefaction zones using criteria developed by the Seismic Hazards Mapping Act Advisory Committee and adopted by the SMGB (DOC, 2000). Under those guideline criteria, liquefaction zones are areas meeting one or more of the following:
1. Areas known to have experienced liquefaction during historical earthquakes
2. All areas of uncompacted artificial fill containing liquefaction-susceptible material that are saturated, nearly saturated, or may be expected to become saturated
3. Areas where sufficient existing geotechnical data and analyses indicate that the soils are potentially liquefiable
4. Areas where existing geotechnical data are insufficient
In areas of limited or no geotechnical data, susceptibility zones may be identified by geologic criteria as follows:
a) Areas containing soil deposits of late Holocene age (current river channels and their historic floodplains, marshes and estuaries), where the M7.5-weighted peak acceleration that has a 10% probability of being exceeded in 50 years is greater than or equal to 0.10 g and the water table is less than 40 feet below the ground surface; or
b) Areas containing soil deposits of Holocene age (less than 11,000 years), where the M7.5-weighted peak acceleration that has a 10% probability of being exceeded in 50 years is greater than or equal to 0.20 g and the historical high water table is less than or equal to 30 feet below the ground surface; or
c) Areas containing soil deposits of latest Pleistocene age (11,000 to 15,000 years), where the M7.5-weighted peak acceleration that has a 10% probability of being exceeded in 50 years is greater than or equal to 0.30 g and the historical high water table is less than or equal to 20 feet below the ground surface.

15
Application of SMGB criteria to liquefaction zoning in the Canada Gobernadora Quadrangle is summarized below.
Areas of Past Liquefaction
In the Canada Gobernadora Quadrangle, no areas of documented historical liquefaction are known. Areas showing evidence of paleoseismic liquefaction have not been reported.
Artificial Fills
In the Canada Gobernadora Quadrangle, artificial fill areas for elevated highways and small earthen dams were not shown at the scale of mapping. Since freeway and highway fills are considered to be properly engineered, zoning for liquefaction in such areas depends on soil conditions in underlying strata. Non-engineered fills are commonly loose and uncompacted and the material varies in size and type.
Areas with Sufficient Existing Geotechnical Data
Borehole logs that include penetration test data and sufficiently detailed lithologic descriptions were used to evaluate liquefaction potential. Areas with sufficient geotechnical data were evaluated for zoning based on the liquefaction potential determined by the Seed-Idriss Simplified Procedure. In Holocene alluvial deposits, most of the borehole logs that were analyzed using the Seed-Idriss Simplified Procedure contain sediment layers that may liquefy under the expected earthquake loading. Areas containing saturated potentially liquefiable material with corresponding depths as shown in Table 1.2 are included in the zone.
Areas with Insufficient Existing Geotechnical Data
Younger alluvium deposited in tributary canyon areas generally lacks adequate geotechnical borehole information. The soil characteristics and ground-water conditions within these deposits are assumed to be similar to deposits where subsurface information is available. Stream channel deposits in the Canada Gobernadora Quadrangle, therefore, are zoned for liquefaction for reasons presented in criteria item 4a above.
ACKNOWLEDGMENTS
The author thanks Beth Winnet and staff at Leighton and Associates; the California Department of Transportation (CALTRANS); Orange County Planning and Development; California Department of Water Resources; and Goffman, McCormick & Urban, Inc. Within the CGS, special thanks go to Barbara Wanish, Ross Martin, Terilee McGuire, Lee Wallinder, and Bob Moscovitz for many levels of GIS support. Data entry by Ellen Sander, Ian Penney, and Bryan Caldwell is greatly appreciated.

CALIFORNIA GEOLOGICAL SURVEY SHZR 063 16
REFERENCES
American Society for Testing and Materials, 1999, Standard test method for penetration test and split-barrel sampling of soils, Test Method D1586-99, in Annual Book of ASTM Standards, v. 4.08.
Budiman, J.S. and Mohammadi, Jamshid, 1995, Effect of large inclusions on liquefaction of sands, in Evans, M.D. and Fragaszy, R.J., editors, Static and Dynamic properties of Gravelly Soils: American Society of Civil Engineers Geotechnical Special Publication no. 56, p. 48-63.
California Department of Conservation, Division of Mines and Geology, 1997, Guidelines for evaluating and mitigating seismic hazards in California, Special Publication 117, 74 p.
California Department of Conservation, Division of Mines and Geology, 2000, Recommended criteria for delineating seismic hazard zones in California, Special Publication 118, 12 p.
Cramer, C.H. and Petersen, M.D., 1996, Predominant seismic source distance and magnitude maps for Los Angeles, Orange, and Ventura counties, California: Bulletin of Seismological Society of America, v. 86, no. 5, p. 1,645-1,649.
Evans, M.D. and Seed, H.B., 1987, Undrained cyclic triaxial testing of gravels: the effect of membrane compliance: Geotechnical Earthquake Engineering Research Report no. UCB/EERC-87/08, University of California Berkeley.
Evans, M.D. and Zhou, Shengping, 1995, Liquefaction behavior of sand-gravel composites: American Society of Civil Engineers, Journal of Geotechnical Engineering, v. 121, no. 3, p. 287-298.
Harder, L.F. and Seed, H.B., 1986, Determination of penetration resistance for coarse-grained soils using the Becker hammer drill: University of California at Berkeley, College of Engineering, Earthquake Engineering Research Center, report no. UCB/EERC-86/06, 126 p.
Ishihara, Kenji, 1985, Stability of natural deposits during earthquakes, in Proceedings of the Eleventh International Conference on Soil Mechanics and Foundation Engineering, San Francisco, v. 1, p. 321-376.
Morton, P.K., 1970, Geology of the NE ¼ and NW ¼ Canada Gobernadora Quadrangle, Orange County, California: California Division of Mines and Geology Preliminary Report 10, 3 plates, map scale 1:12,000.
Morton, P.K., 1974, Geology and engineering geologic aspects of the south half of the Canada Gobernadora Quadrangle, Orange County, California: California Division of Mines and Geology Special Report 111, 30 p., 1 plate, map scale 1: 12,000.

17
Morton, D.M. and Kennedy, M.P., 1989, A southern California digital 1:100,000-scale geologic map series: The Santa Ana Quadrangle, The first release: Geological Society of America Abstracts with Programs v. 21, no. 6, p. A107-A108.
National Research Council, 1985, Liquefaction of soils during earthquakes: National Research Council Special Publication, Committee on Earthquake Engineering, National Academy Press, Washington, D.C., 240 p.
Petersen, M.D., Bryant, W.A., Cramer, C.H., Cao, Tianqing, Reichle, M.S., Frankel, A.D., Lienkaemper, J.J., McCrory, P.A. and Schwartz, D.P., 1996, Probabilistic seismic hazard assessment for the State of California: California Department of Conservation, Division of Mines and Geology, Open File Report 96-08; U.S. Geological Survey Open File Report 96-706, 33 p.
Seed, H.B. and Idriss, I.M., 1971, Simplified procedure for evaluating soil liquefaction potential: Journal of the Soil Mechanics and Foundations Division of ASCE, v. 97: SM9, p. 1,249-1,273.
Seed, H.B. and Idriss, I.M., 1982, Ground motions and soil liquefaction during earthquakes: Monograph Series, Earthquake Engineering Research Institute, Berkeley, California, 134 p.
Seed, H.B., Idriss, I.M. and Arango, Ignacio, 1983, Evaluation of liquefaction potential using field performance data: Journal of Geotechnical Engineering, v. 109, no. 3, p. 458-482.
Seed, H.B., Tokimatsu, Kohji, Harder, L.F., and Chung, R.M., 1985, Influence of SPT procedures in soil liquefaction resistance evaluations: Journal of Geotechnical Engineering, ASCE, v. 111, no. 12, p. 1,425-1,445.
Seed, R.B. and Harder, L.F., 1990, SPT-based analysis of cyclic pore pressure generation and undrained residual strength: Proceedings of the H. Bolton Seed Memorial Symposium, v. 2, p. 351-376.
Smith, T.C., 1996, Preliminary maps of seismic hazard zones and draft guidelines for evaluating and mitigating seismic hazards: California Geology, v. 49, no. 6, p. 147-150.
Southern California Earthquake Center, 1999, Recommended procedures for implementation of DMG Special Publication 117 guidelines for analyzing and mitigating liquefaction in California: Southern California Earthquake Center, University of Southern California, 63 p.
Sy, Alex, Campanella, R.G. and Stewart, R.A., 1995, BPT-SPT correlations for evaluations of liquefaction resistance in gravelly soils, in Evans, M.D. and Fragaszy, R.J., editors, Static and Dynamic Properties of Gravelly Soils: American Society of Civil Engineers Geotechnical Special Publication no. 56, p. 1-19.

CALIFORNIA GEOLOGICAL SURVEY SHZR 063 18
Tinsley, J.C., Youd, T.L., Perkins, D.M. and Chen, A.T.F., 1985, Evaluating liquefaction potential, in Ziony, J.I., editor, Evaluating earthquake hazards in the Los Angeles region — An earth science perspective: U.S. Geological Survey Professional Paper 1360, p. 263-316.
Youd, T.L., 1973, Liquefaction, flow and associated ground failure: U.S. Geological Survey Circular 688, 12 p.
Youd, T.L., 1991, Mapping of earthquake-induced liquefaction for seismic zonation: Earthquake Engineering Research Institute, Proceedings, Fourth International Conference on Seismic Zonation, v. 1, p. 111-138.
Youd, T.L. and Idriss, I.M., 1997, editors, Proceedings of the NCEER workshop on evaluation of liquefaction resistance of soils: National Center for Earthquake Engineering Research Technical Report NCEER-97-0022, 276 p.
Youd, T.L. and Perkins, D.M., 1978, Mapping liquefaction-induced ground failure potential: Journal of Geotechnical Engineering, v. 104, p. 433-446.

19
SECTION 2 EARTHQUAKE-INDUCED LANDSLIDE
EVALUATION REPORT
Earthquake-Induced Landslide Zones in the Canada Gobernadora 7.5-Minute Quadrangle,
Orange County, California
By Rick I. Wilson, Kevin B. Clahan, Allan G. Barrows, and Timothy P.
McCrink
California Department of Conservation California Geological Survey
PURPOSE
The Seismic Hazards Mapping Act (the Act) of 1990 (Public Resources Code, Chapter 7.8, Division 2) directs the California Department of Conservation (DOC), Division of Mines and Geology (DMG) [now called California Geological Survey (CGS)] to delineate Seismic Hazard Zones. The purpose of the Act is to reduce the threat to public health and safety and to minimize the loss of life and property by identifying and mitigating seismic hazards. Cities, counties, and state agencies are directed to use seismic hazard zone maps prepared by CGS in their land-use planning and permitting processes. The Act requires that site-specific geotechnical investigations be performed prior to permitting most urban development projects within the hazard zones. Evaluation and mitigation of seismic hazards are to be conducted under guidelines established by the California State Mining and Geology Board (DOC, 1997). The text of this report is on the Internet at http://gmw.consrv.ca.gov/shmp/webdocs/sp117.pdf
Following the release of DMG Special Publication 117 (DOC, 1997), agencies in the Los Angeles metropolitan region sought more definitive guidance in the review of geotechnical investigations addressing landslide hazards. The agencies made their request through the Geotechnical Engineering Group of the Los Angeles Section of the

CALIFORNIA GEOLOGICAL SURVEY SHZR 063 20
American Society of Civil Engineers (ASCE). This group convened an implementation committee in 1998 under the auspices of the Southern California Earthquake Center (SCEC). The committee, which consisted of practicing geotechnical engineers and engineering geologists, released an overview of the practice of landslide analysis, evaluation, and mitigation techniques (SCEC, 2002). This text is also on the Internet at: http://www.scec.org/
This section of the evaluation report summarizes seismic hazard zone mapping for earthquake-induced landslides in the Canada Gobernadora 7.5-minute Quadrangle. Section 1 (addressing liquefaction) and Section 3 (addressing earthquake shaking), complete the report, which is one of a series that summarizes the preparation of seismic hazard zone maps within the state (Smith, 1996). Additional information on seismic hazard zone mapping in California can be accessed on the California Geological Survey's Internet page: http://www.conservation.ca.gov/CGS/index.htm
BACKGROUND
Landslides triggered by earthquakes historically have been a significant cause of earthquake damage. In California, large earthquakes such as the 1971 San Fernando, 1989 Loma Prieta, and 1994 Northridge earthquakes triggered landslides that were responsible for destroying or damaging numerous structures, blocking major transportation corridors, and damaging life-line infrastructure. Areas that are most susceptible to earthquake-induced landslides are steep slopes in poorly cemented or highly fractured rocks, areas underlain by loose, weak soils, and areas on or adjacent to existing landslide deposits. These geologic and terrain conditions exist in many parts of California, including numerous hillside areas that have already been developed or are likely to be developed in the future. The opportunity for strong earthquake ground shaking is high in many parts of California because of the presence of numerous active faults. The combination of these factors constitutes a significant seismic hazard throughout much of California, including the hillside areas of the Canada Gobernadora Quadrangle.
METHODS SUMMARY
The mapping of earthquake-induced landslide hazard zones presented in this report is based on the best available terrain, geologic, geotechnical, and seismological data. If unavailable or significantly outdated, new forms of these data were compiled or generated specifically for this project. The following were collected or generated for this evaluation:
• Digital terrain data were used to provide an up-to-date representation of slope gradient and slope aspect in the study area
• Geologic mapping was used to provide an accurate representation of the spatial distribution of geologic materials in the study area. In addition, a map of existing landslides, whether triggered by earthquakes or not, was prepared

21
• Geotechnical laboratory test data were collected and statistically analyzed to quantitatively characterize the strength properties and dynamic slope stability of geologic materials in the study area
• Seismological data in the form of CGS probabilistic shaking maps and catalogs of strong-motion records were used to characterize future earthquake shaking within the mapped area
The data collected for this evaluation were processed into a series of GIS layers using commercially available software. A slope stability analysis was performed using the Newmark method of analysis (Newmark, 1965), resulting in a map of landslide hazard potential. The earthquake-induced landslide hazard zone was derived from the landslide hazard potential map according to criteria developed in a CGS pilot study (McCrink and Real, 1996) and adopted by the State Mining and Geology Board (DOC, 2000).
SCOPE AND LIMITATIONS
The methodology used to make this map is based on earthquake ground-shaking estimates, geologic material-strength characteristics and slope gradient. These data are gathered from a variety of outside sources. Although the selection of data used in this evaluation was rigorous, the quality of the data is variable. The State of California and the Department of Conservation make no representations or warranties regarding the accuracy of the data gathered from outside sources.
Earthquake-induced landslide zone maps are intended to prompt more detailed, site-specific geotechnical investigations as required by the Act. As such, these zone maps identify areas where the potential for earthquake-induced landslides is relatively high. Due to limitations in methodology, it should be noted that these zone maps do not necessarily capture all potential earthquake-induced landslide hazards. Earthquake-induced ground failures that are not addressed by this map include those associated with ridge-top spreading and shattered ridges. It should also be noted that no attempt has been made to map potential run-out areas of triggered landslides. It is possible that such run-out areas may extend beyond the zone boundaries. The potential for ground failure resulting from liquefaction-induced lateral spreading of alluvial materials, considered by some to be a form of landsliding, is not specifically addressed by the earthquake-induced landslide zone or this report. See Section 1, Liquefaction Evaluation Report for the Canada Gobernadora Quadrangle, for more information on the delineation of liquefaction zones.
The remainder of this report describes in more detail the mapping data and processes used to prepare the earthquake-induced landslide zone map for the Canada Gobernadora Quadrangle. The information is presented in two parts. Part I covers physiographic, geologic and engineering geologic conditions in the study area. Part II covers the preparation of landslide hazard potential and landslide zone maps.

CALIFORNIA GEOLOGICAL SURVEY SHZR 063 22
PART I
PHYSIOGRAPHY
Study Area Location and Physiography
The Canada Gobernadora Quadrangle covers an area of about 60 square miles in easternmost Orange County. Lands within the Cleveland National Forest extend into the easternmost edge and northeastern corner of the quadrangle. The Caspers Regional Park spreads across several square miles in the central part of the quadrangle. Small parts of Riverside and San Diego counties also extend into the southeastern corner of the quadrangle. The remainder of the quadrangle is unincorporated Orange County land. The area evaluated in the quadrangle, which is subject to development, is about 51 square miles.
The study area lies on the western slope of the Santa Ana Mountains in the Peninsular Ranges geomorphic province of southern California. Rugged, mountainous terrain, dissected by several large north-south-trending canyons, such as Canada Gobernadora, characterizes the topography within the quadrangle. The highest point, above 2,100 feet elevation, is in the northeastern corner of the quadrangle. The lowest point, below an elevation of 200 feet, is in San Juan Creek at the western border of the map. San Juan Creek is the major drainage course in the quadrangle. Creeks from a half dozen large tributary canyons join it. Gently sloping to nearly level land of Plano Trabuco cuts across the northwestern corner.
Access to the Canada Gobernadora Quadrangle is provided primarily by the Ortega Highway (State Highway 74), which crosses the entire area. Other localities can be reached via roads that intersect easternmost Oso Parkway near the western boundary, or the Foothill Transportation Corridor (State Highway 241) to the north of the quadrangle. Residential development is underway in the unincorporated community of Coto de Caza at the northern end of Canada Gobernadora and to the west in Canada Chiquita. Large parts of the quadrangle are covered by parkland in the Caspers Wilderness Park, Riley Wilderness Park and the Starr Ranch Sanctuary of the National Aububon Society.
Digital Terrain Data
The calculation of slope gradient is an essential part of the evaluation of slope stability under earthquake conditions. To calculate slope gradient for the terrain within the Canada Gobernadora Quadrangle, a Level 2 digital elevation model (DEM) was obtained from the USGS (U.S. Geological Survey, 1993). This DEM, which was prepared from the 7.5-minute quadrangle topographic contours, based on 1968 topography, has a 10-meter horizontal resolution and a 7.5-meter vertical accuracy.
Areas that have undergone large-scale grading as a part of residential development in the hilly portions of the quadrangle, since 1968, were updated to reflect the new topography. A DEM reflecting this recent grading was obtained from an airborne interferometric radar

23
platform flown in 1998, with an estimated vertical accuracy of approximately two meters (Intermap Corporation, 2000). An interferometric radar DEM is prone to creating false topography where tall buildings, metal structures, or trees are present. Due to the low lying chaparral vegetation and relatively small-structure/residential construction types present, this type of DEM is appropriate for use in the Canada Gobernadora Quadrangle. Nevertheless, the final hazard zone map was checked for potential errors of this sort and corrected. Areas where the terrain data were updated for this project are shown on Plate 2.1.
A slope map was made from the DEM using a third-order, finite difference, center-weighted algorithm (Horn, 1981). The DEM was also used to make a slope aspect map. The manner in which the slope and aspect maps were used to prepare the zone map will be described in subsequent sections of this report.
GEOLOGY
Bedrock and Surficial Geology
The geologic map for the Canada Gobernadora Quadrangle was digitized by the Southern California Areal Mapping Project [SCAMP] (Morton and Kennedy, 1989) from 1:12,000-scale mapping (Morton, 1970; 1974). The mapping was modified during this project to reflect field observations and the most recent mapping in the area. In the field, observations were made of exposures, aspects of weathering, and general surface expression of the geologic units. In addition, the relation of the various geologic units to development and abundance of slope failures was noted. The geologic unit descriptions below for bedrock geology are taken from Morton (1970; 1974). SCAMP nomenclature is used for the Quaternary geology. The Quaternary geologic map of the Canada Gobernadora Quadrangle is reproduced as Plate 1.1.
According to Morton (1974, p.2) the bedrock units in the Canada Gobernadora Quadrangle are transitional between those of the Los Angeles Basin on the northwest and those of the coastal belt of San Diego County on the southeast.
The oldest rocks exposed in the Canada Gobernadora Quadrangle are Mesozoic in age, some of which are undifferentiated (Mzu). The oldest mappable unit is the Middle Jurassic Bedford Canyon Formation (Jbc), which consists of slightly metamorphosed argillite, thin to moderately thick, interbedded sandstone and shale of possible turbidite origin, and thick-bedded sandstone and conglomerate. This unit is exposed only in small areas near the eastern boundary of the quadrangle. Bedford Canyon Formation underlies much of the northern Santa Ana Mountains and is much more widespread in the Santiago Peak Quadrangle to the north. Another Mesozoic unit, the Santiago Peak Volcanics (Jsp, Jsv, Kvsp) of Upper Jurassic and Lower Cretaceous age, rest unconformably upon Bedford Canyon Formation rocks or are faulted against them in the eastern part of the quadrangle. The Santiago Peak Volcanics consist of a complex sequence of mildly metamorphosed, andesitic to dacitic, volcanic flows, flow breccia, tuff, volcanic sedimentary rocks and local intrusive bodies.

CALIFORNIA GEOLOGICAL SURVEY SHZR 063 24
Cretaceous intrusive rocks were mapped as “undivided” granitoid rocks (Kgd, Khg), located in the northeastern corner of the quadrangle. These crystalline rocks, which include granodiorite and tonalite, belong to the Peninsular Ranges batholithic series that intruded the Mesozoic sedimentary and volcanic rocks described above.
The Jurassic through Cretaceous igneous and metamorphic rocks form the bedrock complex of the Santa Ana Mountains. The ancient rocks are covered by an essentially homoclinal, westward-dipping sequence of marine and nonmarine strata that range from Cretaceous to Pliocene. The Trabuco Formation (Kt, Ktr) of Late Cretaceous age is the oldest of the sedimentary units. It consists primarily of a deeply weathered, reddish, bouldery, nonmarine fanglomerate. Trabuco Formation conglomerate extends across nearly the entire eastern part of the quadrangle where it is poorly exposed in brush-covered terrain.
Resting unconformably upon Trabuco Formation conglomerate are rocks of the Upper Cretaceous Ladd Formation (Kl, where undifferentiated). As mapped by Morton (1970) in the north half of the quadrangle, the Ladd Formation consists of the Baker Canyon Member (Klb), which is essentially a well-bedded fossiliferous sandstone and conglomeratic sandstone accompanied, locally, by a basal conglomerate (Klbc) that rests upon Trabuco Formation. Morton (1974) noted that conglomerate was not predominant in the southern half of the quadrangle. Higher in the section the Ladd Formation consists of marine, soft, silty, poorly bedded shale and minor limestone and conglomerate that belong to the Holz Shale Member (Klh, Klhs). Large landslides are associated with this member.
The Williams Formation, also of Late Cretaceous age, rests upon the Ladd Formation and is widely distributed in the eastern half of the quadrangle, east of the Mission Viejo Fault. The Williams Formation contains three members: the Starr Member (Kwst) composed of nonmarine conglomeratic sandstone; the Schulz Ranch Member (Kws, Kwsr) composed of marine (?) conglomeratic sandstone; and the Pleasants Sandstone Member (Kwp, Kwps) composed of marine siltstone and sandstone. In the southern half of the quadrangle Morton (1974) subdivided the Schulz Ranch member into several subunits: upper beds (Kwsu) of conglomeratic sandstone; lower beds (Kwsl) of gray siltstone; and a coarse-cobble conglomerate-fanglomerate facies (Kws2).
The oldest Tertiary unit, the Silverado Formation (Tsi) of Paleocene age, is exposed in Bell Canyon, west of the Mission Viejo Fault. It consists of a wide variety of nonmarine, interbedded, arkosic sandstone, pebble conglomerate, siltstone, distinctive multi-colored kaolinitic clay beds and a basal conglomerate (Tsic).
The Santiago Formation (Tsa) of Eocene age unconformably overlies the Silverado Formation. Morton (1970; 1974) subdivided the marine rocks of this formation into a lower unit (Tsal) of sandstone and “grit” and an upper unit (Tsau) of sandstone, siltstone and claystone. The Santiago Formation crosses the entire quadrangle in a broad swath on both sides of Canada Gobernadora and south of San Juan Creek.

25
West of Canada Gobernadora and east of the Cristianitos Fault is a large area underlain by Sespe Formation (Ts) in the northwestern quarter of the quadrangle. Sespe Formation, which extends across Plano Trabuco into the Santiago Peak Quadrangle to the north, is of late Eocene to early Miocene age. It rests gradationally upon the Santiago Formation and is composed of predominantly nonmarine, conglomeratic, coarse sandstone.
The return to marine conditions following the deposition of the Sespe Formation resulted in the accumulation of a mixture of sandstone, siltstone, coquina, and conglomerate that comprises the Vaqueros Formation (Tv) of Oligocene to early Miocene age. Small areas of Vaqueros Formation are present on both sides of Plano Trabuco and west of the Cristianitos Fault in the northwestern quarter of the quadrangle.
West of the main branch of the Cristianitos fault in the southwestern quarter of the quadrangle are small exposures of middle Miocene Topanga Formation (Tt) marine sandstone and conglomeratic pebbly sandstone with a mappable siltstone unit (Tts) in some areas. More common in this area between the main and west branch of the Cristianitos Fault is a sliver of San Onofre Breccia (Ttso, Tsob), which is a very distinctive, massive, very poorly sorted, coarse, angular-clast breccia that interfingers with other Topanga Formation strata.
Unconformably resting upon Topanga Formation is the Monterey Formation (Tm, Tmss) of late Miocene age. This marine unit is primarily white to yellowish-gray, thin-bedded, soft, diatomaceous siltstone and shale. It rests upon the San Onofre Breccia east of the west branch of the Cristianitos Fault and also occurs west of the west branch of the Cristianitos Fault in the southwestern quarter of the quadrangle. Monterey Formation is typically unstable and hosts abundant landslides.
Small patches of Capistrano Formation (Tc, Tcs) of late Miocene to early Pliocene age occur in the extreme southwestern corner of the quadrangle south of San Juan Creek. The Capistrano Formation, which is the youngest Tertiary bedrock unit in the quadrangle, consists of siltstone and sandstone that is characteristically weak and readily subject to slope failure.
Scattered across the Canada Gobernadora Quadrangle are Quaternary sediments, which include (according to SCAMP nomenclature): very old alluvial/terrace deposits (Qvoa), older alluvial deposits (Qoa), young colluvium/slopewash (Qc, Qcb), younger alluvial deposits (Qya, Qya1, Qya2), lacustrine deposits (Ql) landslide deposits (Qls), and artificial fill (af). A detailed discussion of Quaternary units can be found in Section 1.
Structural Geology
The structural framework of Orange County is one that reflects a broad regional crustal shortening from a southwest to northeast direction. Southern Orange County is bounded on the northeast by the Elsinore fault and on the south by the offshore Newport-Inglewood fault. Exposed in the area between these two northwest trending right-lateral strike-slip faults are a homoclinal sequence of mostly westerly dipping rocks of Jurassic, Cretaceous, and Tertiary age. The western margin of the homocline is gently warped into

CALIFORNIA GEOLOGICAL SURVEY SHZR 063 26
a north-trending broad syncline, comprised primarily of Tertiary sedimentary bedrock, generally referred to as the Capistrano syncline, which occurs just west of the Canada Gobernadora Quadrangle.
Significant structures within the quadrangle include the Mission Viejo and Cristianitos faults, which are north- to northwest-trending features that dip steeply to the west and appear to have normal displacements on the order of 1000- to 2500-feet, respectively (Morton, 1974). These faults interrupt the homoclinal sequence of Cretaceous to Tertiary sedimentary rocks that are superadjacent to the metamorphic and igneous rocks of the Upper Cretaceous and Jurassic.
Landslide Inventory
As a part of the geologic data compilation, an inventory of existing landslides in Canada Gobernadora Quadrangle was prepared by field reconnaissance, analysis of stereo-paired aerial photographs and a review of previously published landslide mapping, including Morton (1970; 1974). Stereo aerial photography from Robert J. Lung and Associates (1970) were used for landslide interpretation. Landslides were mapped and digitized at a scale of 1:24,000. For each landslide included on the map a number of characteristics (attributes) were compiled. These characteristics included the confidence of interpretation (definite, probable and questionable) and other properties, such as activity, thickness, and associated geologic unit(s). Landslides rated as definite and probable were carried into the slope stability analysis, and landslides rated as questionable were not carried into the slope stability analysis due to the uncertainty of their existence. The completed landslide map was scanned, digitized, and the attributes were compiled in a database. A version of this landslide inventory is included with Plate 2.1.
Mapped landslides vary greatly in concentration from one area to another in the Canada Gobernadora Quadrangle because of differing geologic conditions. Landslides occur extensively throughout the area adjacent to and along the Cristianitos fault zone that transects the southwestern portion of the quadrangle. Landslides cover more than one-third of this area and individual landslides are as great as one-half square-mile. By contrast, landslides cover less than one percent of the remaining area of the quadrangle.
In addition to a significant seismic/structural component contributing to the amount of landsliding in the southwestern portion of the quadrangle, the inherent weakness of the Tm, Tc, and Tsa formations is another significant factor affecting slope stability in this area. Approximately 80 percent of the mapped landslides in the quadrangle are within these formations. These slope failures are primarily classified as young to old rockslides ranging in thickness between 10 and greater than 50 feet with some slides being greater than 200 feet in thickness.
Slope failures east of the Cristianitos fault zone are mostly relatively small, moderately deep (10 to 50 feet) failures within the Santiago and Williams formations in the central and eastern area of the quadrangle. The Williams Formation contains numerous small rockslides in the southeastern area of the quadrangle that have mobilized into debris flows. Several old, very large landslides are mapped within the Williams Formation in
27
the north-central portion of the quadrangle. Several of these large landslides have been classified as questionable because many of the geomorphic features that indicate past slope failure have been removed by erosion.
Because it is not within the scope of the Act to review and monitor grading practices to ensure past slope failures have been properly mitigated, all documented slope failures, whether or not surface expression currently exists, are included in the landslide inventory.
ENGINEERING GEOLOGY
Geologic Material Strength
To evaluate the stability of geologic materials under earthquake conditions, the geologic map units described above were ranked and grouped on the basis of their shear strength. Generally, the primary source for shear-strength measurements is geotechnical reports prepared by consultants on file with local government permitting departments. Shear-strength data for the rock units identified on the geologic map were obtained from the Orange County Office of Planning and Development Services (see Appendix A). When available, shear tests from adjacent quadrangles were used to augment data for geologic formations that had little or no shear test information. These other quadrangles include the San Juan Capistrano, San Clemente, Santiago Peak, and El Toro quadrangles. The locations of rock and soil samples taken for shear testing in the Canada Gobernadora Quadrangle are shown on Plate 2.1.
Shear strength data gathered from the above sources were compiled for each geologic map unit. Geologic units were grouped on the basis of average angle of internal friction (average phi) and lithologic character. Average (mean and median) phi values for each geologic map unit and corresponding strength group are summarized in Table 2.1. For most of the geologic strength groups in the map area, a single shear strength value was assigned and used in our slope stability analysis. A geologic material strength map was made based on the groupings presented in Tables 2.1 and 2.2, and this map provides a spatial representation of material strength for use in the slope stability analysis.
Several geologic map units were subdivided further, as discussed below.
Adverse Bedding Conditions
Adverse bedding conditions are an important consideration in slope stability analyses. Adverse bedding conditions occur where the dip direction of bedded sedimentary rocks is roughly the same as the slope aspect, and where the dip magnitude is less than the slope gradient. Under these conditions, landslides can slip along bedding surfaces due to a lack of lateral support.
To account for adverse bedding in our slope stability evaluation, we used geologic structural data in combination with digital terrain data to identify areas with potentially adverse bedding, using methods similar to those of Brabb (1983). The structural data, derived from the geologic map database, was used to categorize areas of common

CALIFORNIA GEOLOGICAL SURVEY SHZR 063 28
bedding dip direction and magnitude. The dip direction was then compared to the slope aspect and, if the same, the dip magnitude and slope gradient categories were compared. If the dip magnitude category was less than or equal to the slope gradient category, but greater than 25% (4:1 slope), the area was marked as a potential adverse bedding area.
The formations that contain interbedded sandstone and shale were subdivided based on shear strength differences between coarse-grained (higher strength) and fine-grained (lower strength) lithologies. Shear strength values for the fine- and coarse-grained lithologies were then applied to areas of favorable and adverse bedding orientation, which were determined from structural and terrain data as discussed above. It was assumed that coarse-grained material strength dominates where bedding dips into a slope (favorable bedding) while fine-grained material strength dominates where bedding dips out of a slope (adverse bedding). The geologic material strength map was modified by assigning the lower, fine-grained shear strength values to areas where potential adverse bedding conditions were identified. The favorable and adverse bedding shear strength parameters for the Formations are included in Table 2.1.
Adverse bedding conditions were considered for the mapped units Klh, Klhs, Kws, Kwst, Kwp, Tsau, Tsal, Ts, Tv, Tsi, Tsic, Tsa, and Tt. Adverse bedding conditions were not considered for the Tc and Tm because they are predominantly fine-grained in texture (siltstone and shale). Over 90% of the test samples tallied for these formations, in quadrangles around the Canada Gobernadora Quadrangle, were of a fine-grained nature and, therefore, indicate relatively low shear strength values throughout this unit.
The results of the grouping of geologic materials in the Canada Gobernadora Quadrangle are in Tables 2.1 and 2.2.
Existing Landslides
The strength characteristics of existing landslides (Qls) must be based on tests of the materials along the landslide slip surface. Ideally, shear tests of slip surfaces formed in each mapped geologic unit would be used. However, this amount of information is rarely available, and for the preparation of the earthquake-induced landslide zone map it has been assumed that all landslides within the quadrangle have the same slip surface strength parameters. We collect and use primarily “residual” strength parameters from laboratory tests of slip surface materials tested in direct shear or ring shear test equipment. Back-calculated strength parameters, if the calculations appear to have been performed appropriately, have also been used. Within the Canada Gobernadora Quadrangle, four direct shear tests of landslide slip surface materials were obtained, and the results are summarized in Table 2.1.

E 29
C A N A D A G O B E R N A D O R A Q U A D R A N G L E SH E A R ST R E N G T H G R O U PS
F orm ation N um ber M ean/M edian M ean/M edian M ean/M edian N o D ata: Phi V aluesN am e T ests P hi G roup Phi G roup C Sim ilar U sed in Stability
(deg) (deg) (psf) L ithology A nalyses
G R O U P 1 T sau(fbc) 34 39/37 39/37 556/385 K gd, K hg 39
G R O U P 2 T sal(fbc) 2 34/34 34/35 189/160 M zu, Jsp , Jsv 34T s(fbc) 11 34/35 K vsp, K t, K tr, K lT v(fbc) 2 35/35 K lb, K lbc, K lh(fbc)
Q c 15 33/35 K lhs(fbc), K wst(fbc)af 3 35/35 K ws*(fbc), K wp(fbc)
T si(fbc), T sic(fbc)T sa(fbc), T t(fbc), T sobT tso , Q voa1a, Q vof1a
Q voaa, Q voa, Q vofQ oa, Q oaa, Q yaa
Q yc, Q ya1 , Q ya2, Q tQ ya, Q swb, Q swe
G R O U P 3 T sau(abc) 20 29/27 29/29 448/320 Jbc, K wst(abc) 29T s(abc) 4 28/29 K ws*(abc), K wp(abc)Q voaga 7 31/30 T si(abc), T sic(abc)
T sa(abc), T sal(abc)T t(abc), T ts, T c
T cs, Q vom a
G R O U P 4 K lh(abc) 3 23/25 23/25** 370/300 K lhs(abc), T m 25**T v(abc) 2 24/24 T m ss, Q cb, Q l
G R O U P 5 Q ls 4 18/17 18/17** 405/325 17**
F orm ational Subunits on M ap C om bined in A nalysis* K w s (W illiam s Form ation - Schulz R anch M em ber) = K w sr, K w s2, K w sl, and K w su.
** = T he m edian values for G R O U P 4 (25 degrees) and G R O U P 5 (17 degrees) w ere used for the stability analysis because their sam ple populations w ere too sm all to justify the use of the m ean values.
abc = adverse bedding condition , fine-grained m aterial strengthfbc = favorable bedding condition , coarse-grained m aterial strength
Table 2.1. Summary of the Shear Strength Statistics for the Canada Gobernadora Quadrangle.

CALIFORNIA GEOLOGICAL SURVEY SHZR 063 30
SHEAR STRENGTH GROUPS FOR THE CANADA GOBERNADORA 7.5-MINUTE QUADRANGLE
GROUP 1 GROUP 2 GROUP 3 GROUP 4 GROUP 5
Kgd Mzu, Jsp, Jsv Jbc, Kwst(abc) Klh(abc) QlsKhg Kvsp, Kt, Ktr, Kl Kws(abc), Kwsr(abc) Klhs(abc)
Tsau(fbc) Klb, Klbc, Klh(fbc) Kws2(abc), Kwsl(abc) Tv(abc)Klhs(fbc), Kwst(fbc) Kwsu(abc), Kwp(abc) Tm, TmssKws(fbc), Kwsr(fbc) Tsi(abc), Tsic(abc) QcbKws2(fbc), Kwsl(fbc) Tsau(abc), Tsa(abc) QlKwsu(fbc), Kwp(fbc) Tsal(abc), Ts(abc)
Tsi(fbc), Tsic(fbc) Tt(abc), Tts, Tc, TcsTsa(fbc), Tsal(fbc) Qvoa
Ts(fbc), Tv(fbc)Tt(fbc), Ttso, TsobQoa, Qya1, Qya2
Qya, Qc, af
Table 2.2. Summary of the Shear Strength Groups for the Canada Gobernadora Quadrangle.
PART II
EARTHQUAKE-INDUCED LANDSLIDE HAZARD POTENTIAL
Design Strong-Motion Record
To evaluate earthquake-induced landslide hazard potential in the study area, a method of dynamic slope stability analysis developed by Newmark (1965) was used. The Newmark method analyzes dynamic slope stability by calculating the cumulative down-slope displacement for a given earthquake strong-motion time history. As implemented for the preparation of earthquake-induced landslide zones, the Newmark method necessitates the selection of a design earthquake strong-motion record to provide the “ground shaking opportunity.” For the Canada Gobernadora Quadrangle, selection of a strong motion record was based on an estimation of probabilistic ground motion parameters for modal magnitude, modal distance, and peak ground acceleration (PGA). The parameters were estimated from maps prepared by CGS for a 10% probability of being exceeded in 50 years (Petersen and others, 1996; Cramer and Petersen, 1996). The parameters used in the record selection are:

31
Modal Magnitude: 6.80 to 6.82
Modal Distance: 15.3 to 27.4 km
PGA: 0.28 to 0.39 g
The strong-motion record selected for the slope stability analysis in the Canada Gobernadora Quadrangle was the USC-14 (Trifunac and others, 1994) record from the modal magnitude 6.7 1994 Northridge Earthquake. This record had a source to recording site distance of 8.5 km and peak ground acceleration (PGA) of 0.59g. Although the magnitude and PGA from the USC-14 record do not fall within the preliminary earthquake parameters, they were found sufficiently conservative to be used for our stability analysis. The selected strong-motion record was not scaled or otherwise modified prior to its use in the analysis.
Displacement Calculation
The design strong-motion record was used to develop a relationship between landslide displacement and yield acceleration (ay), defined as the earthquake horizontal ground acceleration above which landslide displacements take place. This relationship was prepared by integrating the design strong-motion record twice for a given acceleration value to find the corresponding displacement, and the process was repeated for a range of acceleration values (Jibson, 1993). The resulting curve in Figure 2.1 represents the full spectrum of displacements that can be expected for the design strong-motion record. This curve provides the required link between anticipated earthquake shaking and estimates of displacement for different combinations of geologic materials and slope gradient, as described in the Slope Stability Analysis section below.
The amount of displacement predicted by the Newmark analysis provides an indication of the relative amount of damage that could be caused by earthquake-induced landsliding. Displacements of 30, 15 and 5 cm were used as criteria for rating levels of earthquake-induced landslide hazard potential based on the work of Youd (1980), Wilson and Keefer (1983), and a CGS pilot study for earthquake-induced landslides (McCrink and Real, 1996). Applied to the curve in Figure 2.1, these displacements correspond to yield accelerations of 0.076, 0.129 and 0.232g. Because these yield acceleration values are derived from the design strong-motion record, they represent the ground shaking opportunity thresholds that are significant in the Canada Gobernadora Quadrangle.

CALIFORNIA GEOLOGICAL SURVEY SHZR 063 32
0.1
1.0
10.0
100.0
1000.0 D
ISP
LAC
EM
EN
T (c
m)
0.01 0.1 1 YIELD ACCELERATION (g)
NEWMARK DISPLACEMENTvs. YIELD ACCELERATION
30 cm
15 cm
5 cm
0.076
0.129
0.232
USC STATION #14 - Channel 3
Figure 2.1. Yield Acceleration vs. Newmark Displacement for the USC Station # 14.
Slope Stability Analysis
A slope stability analysis was performed for each geologic material strength group at slope increments of 1 degree. An infinite-slope failure model under unsaturated slope conditions was assumed. A factor of safety was calculated first, followed by the calculation of yield acceleration from Newmark’s equation:
ay = ( FS - 1 )g sin α
where FS is the Factor of Safety, g is the acceleration due to gravity, and α is the direction of movement of the slide mass, in degrees measured from the horizontal, when displacement is initiated (Newmark, 1965). For an infinite slope failure α is the same as the slope angle.

33
The yield accelerations resulting from Newmark’s equations represent the susceptibility to earthquake-induced failure of each geologic material strength group for a range of slope gradients. Based on the relationship between yield acceleration and Newmark displacement shown in Figure 2.1, hazard potentials were assigned as follows:
1. If the calculated yield acceleration was less than 0.076g, Newmark displacement greater than 30 cm is indicated, and a HIGH hazard potential was assigned (H on Table 2.3).
2. If the calculated yield acceleration fell between 0.076g and 0.129g, Newmark displacement between 15 cm and 30 cm is indicated, and a MODERATE hazard potential was assigned (M on Table 2.3).
3. If the calculated yield acceleration fell between 0.129g and 0.232g, Newmark displacement between 5 cm and 15 cm is indicated, and a LOW hazard potential was assigned (L on Table 2.3).
4. If the calculated yield acceleration was greater than 0.232g, Newmark displacement of less than 5 cm is indicated, and a VERY LOW potential was assigned (VL on Table 2.3).
Table 2.3 summarizes the results of the stability analyses. The earthquake-induced landslide hazard potential map was prepared by combining the geologic material-strength map and the slope map according to this table.
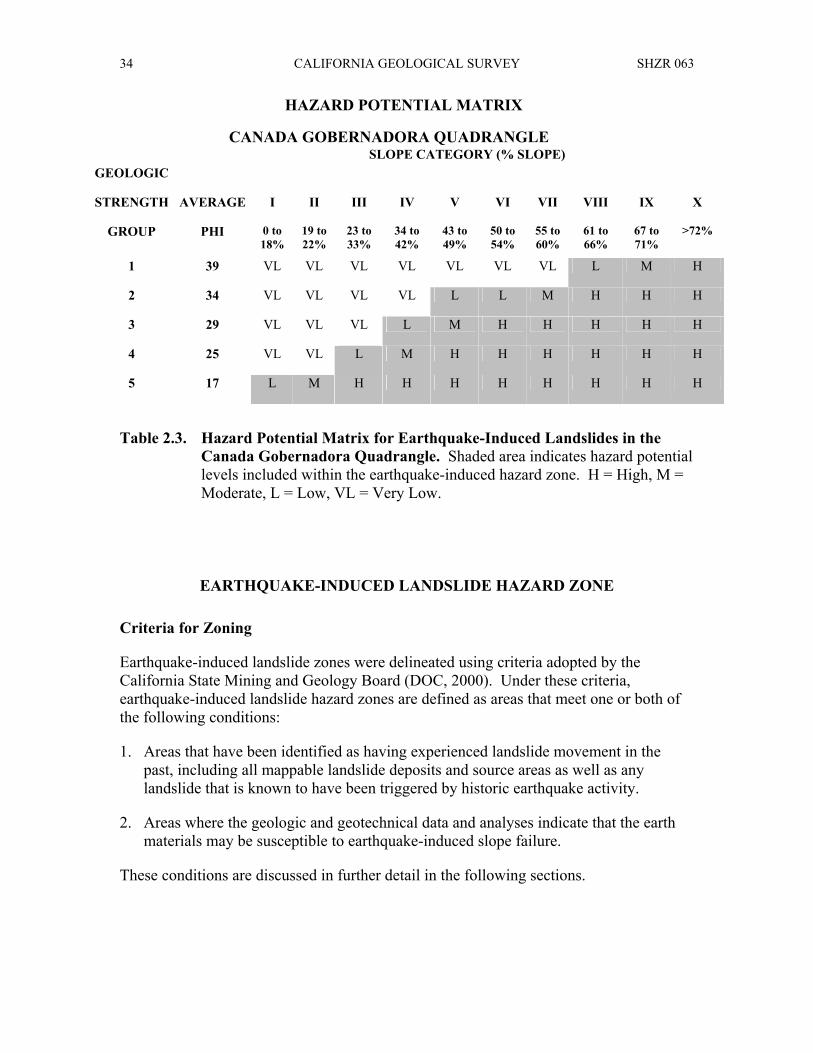
CALIFORNIA GEOLOGICAL SURVEY SHZR 063 34
HAZARD POTENTIAL MATRIX
CANADA GOBERNADORA QUADRANGLE SLOPE CATEGORY (% SLOPE)
GEOLOGIC
STRENGTH AVERAGE I II III IV V VI VII VIII IX X
GROUP PHI 0 to 18%
19 to 22%
23 to 33%
34 to 42%
43 to 49%
50 to 54%
55 to 60%
61 to 66%
67 to 71%
>72%
1 39 VL VL VL VL VL VL VL L M H
2 34 VL VL VL VL L L M H H H
3 29 VL VL VL L M H H H H H
4 25 VL VL L M H H H H H H
5 17 L M H H H H H H H H
Table 2.3. Hazard Potential Matrix for Earthquake-Induced Landslides in the Canada Gobernadora Quadrangle. Shaded area indicates hazard potential levels included within the earthquake-induced hazard zone. H = High, M = Moderate, L = Low, VL = Very Low.
EARTHQUAKE-INDUCED LANDSLIDE HAZARD ZONE
Criteria for Zoning
Earthquake-induced landslide zones were delineated using criteria adopted by the California State Mining and Geology Board (DOC, 2000). Under these criteria, earthquake-induced landslide hazard zones are defined as areas that meet one or both of the following conditions:
1. Areas that have been identified as having experienced landslide movement in the past, including all mappable landslide deposits and source areas as well as any landslide that is known to have been triggered by historic earthquake activity.
2. Areas where the geologic and geotechnical data and analyses indicate that the earth materials may be susceptible to earthquake-induced slope failure.
These conditions are discussed in further detail in the following sections.

35
Existing Landslides
Existing landslides typically consist of disrupted soils and rock materials that are generally weaker than adjacent undisturbed rock and soil materials. Previous studies indicate that existing landslides can be reactivated by earthquake movements (Keefer, 1984). Earthquake-triggered movement of existing landslides is most pronounced in steep head scarp areas and at the toe of existing landslide deposits. Although reactivation of deep-seated landslide deposits is less common (Keefer, 1984), a significant number of deep-seated landslide movements have occurred during, or soon after, several recent earthquakes. Based on these observations, all existing landslides with a definite or probable confidence rating are included within the earthquake-induced landslide hazard zone.
Geologic and Geotechnical Analysis
Based on the conclusions of a pilot study performed by CGS (McCrink and Real, 1996), it has been concluded that earthquake-induced landslide hazard zones should encompass all areas that have a High, Moderate or Low level of hazard potential (see Table 2.3). This would include all areas where the analyses indicate earthquake displacements of 5 centimeters or greater. Areas with a Very Low hazard potential, indicating less than 5 centimeters displacement, are excluded from the zone.
As summarized in Table 2.3, all areas characterized by the following geologic strength group and slope gradient conditions are included in the earthquake-induced landslide hazard zone:
1. Geologic Strength Group 5 is included for all slope gradient categories. (Note: Geologic Strength Group 5 includes all mappable landslides with a definite or probable confidence rating).
2. Geologic Strength Group 4 is included for all slopes steeper than 22 percent.
3. Geologic Strength Group 3 is included for all slopes steeper than 33 percent.
4. Geologic Strength Group 2 is included for all slopes steeper than 42 percent.
5. Geologic Strength Group 1 is included for all slopes greater than 54 percent.
This results in roughly 25% of the land in the Canada Gobernadora Quadrangle lying within the earthquake-induced landslide hazard zone.
ACKNOWLEDGMENTS
The authors would like to thank the following individuals and organizations for their assistance in obtaining the data necessary to complete this project. Jeanette Brone and Carolyn Uribe of the Orange County Planning and Development Services were helpful in

CALIFORNIA GEOLOGICAL SURVEY SHZR 063 36
the collection of shear strength data. Siang Tan and Florante Perez provided expert assistance in discussing geologic and landslide map issues in the field. Ellen Sander, Ian Penney, and Bryan Caldwell digitized borehole locations and entered shear test data into the database. Terilee McGuire, Lee Wallinder, and Bob Moscovitz provided GIS support. Barbara Wanish and Ross Martin prepared the final landslide hazard zone maps and the graphic displays for this report.
REFERENCES
Brabb, E.E., 1983, Map showing direction and amount of bedding dip of sedimentary rocks in San Mateo County, California: U.S. Geological Survey Miscellaneous Investigations Series Map I-1257C, 1 sheet, scale 1:62,500.
California Department of Conservation, Division of Mines and Geology, 1997, Guidelines for evaluating and mitigating seismic hazards in California: California Department of Conservation, Division of Mines and Geology, Special Publication 117, 74 p.
California Department of Conservation, Division of Mines and Geology, 2000, Recommended criteria for delineating seismic hazard zones: California Department of Conservation, Division of Mines and Geology, Special Publication 118, 12 p.
Cramer, C.H. and Petersen, M.D., 1996, Predominant seismic source distance and magnitude maps for Los Angeles, Orange and Ventura counties, California: Bulletin of the Seismological Society of America, v. 85, no. 5, pp. 1645-1649.
Horn, B.K.P., 1981, Hill shading and the reflectance map: Proceedings of the IEEE, v. 69, no. 1, p. 14-47.
Intermap Corporation, 2000, Interferometric radar digital elevation model for Canada Gobernadora Quadrangle, five-meter resolution.
Jibson, R.W., 1993, Predicting earthquake-induced landslide displacements using Newmark’s sliding block analysis: Transportation Research Board, National Research Council, Transportation Research Record 1411, 17 p.
Keefer, D.K., 1984, Landslides caused by earthquakes: Geological Society of America Bulletin, v. 95, no. 4, p. 406-421.
McCrink, T.P. and Real, C.R., 1996, Evaluation of the Newmark method for mapping earthquake-induced landslide hazards in the Laurel 7-1/2 minute Quadrangle, Santa Cruz County, California: California Division of Mines and Geology Final Technical Report for U.S. Geological Survey Contract 143-93-G-2334, U.S. Geological Survey, Reston, Virginia, 31 p.

37
Morton, P.K., 1970, Geology of the NE ¼ and NW ¼ Canada Gobernadora Quadrangle, Orange County, California: California Division of Mines and Geology Preliminary Report 10, 3 plates, map scale 1:12,000.
Morton, P.K., 1974, Geology and engineering geologic aspects of the south half of the Canada Gobernadora Quadrangle, Orange County, California: California Division of Mines and Geology Special Report 111, 30 p., 1 plate, map scale 1: 12,000.
Morton, D.M. and Kennedy, M.P., 1989, A southern California digital 1:100,000-scale geologic map series: The Santa Ana Quadrangle, The first release: Geological Society of America Abstracts with Programs v. 21, no. 6, p. A107-A108.
Newmark, N.M., 1965, Effects of earthquakes on dams and embankments: Geotechnique, v. 15, no. 2, p. 139-160.
Petersen, M.D., Bryant, W.A., Cramer, C.H., Cao. T., Reichle, M.S., Frankel, A.D., Lienkaemper, J.J., McCrory, P.A. and Schwartz, D.P., 1996, Probabilistic seismic hazard assessment for the State of California: California Department of Conservation, Division of Mines and Geology, Open File Report 96-08; U.S. Geological Survey Open File Report 96-706, 33 p.
Smith, T.C., 1996, Preliminary maps of seismic hazard zones and draft guidelines for evaluating and mitigating seismic hazards: California Geology, v. 49, no. 6, p. 147-150.
Southern California Earthquake Center, 2002, Recommended procedures for implementation of DMG Special Publication 117 guidelines for analyzing and mitigating landslide hazards in California: Southern California Earthquake Center, University of Southern California, 108 p.
Trifunac, M.D., Todorovska, M.I. and Ivanovic, S.S., 1994, A note on distribution of uncorrected peak ground accelerations during the Northridge, California earthquake of 17 January 1994: Soil Dynamics and Earthquake Engineering, v. 13, no. 3, p. 187-196.
U.S. Geological Survey, 1993, Digital Elevation Models: National Mapping Program, Technical Instructions, Data Users Guide 5, 48 p.
Wilson, R.C. and Keefer, D.K., 1983, Dynamic analysis of a slope failure from the 1979 Coyote Lake, California, earthquake: Bulletin of the Seismological Society of America, v. 73, p. 863-877.
Youd, T.L., 1980, Ground failure displacement and earthquake damage to buildings: American Society of Civil Engineers Conference on Civil Engineering and Nuclear Power, 2d, Knoxville, Tennessee, 1980, v. 2, p. 7-6-2 to 7-6-26.

CALIFORNIA GEOLOGICAL SURVEY SHZR 063 38
AIR PHOTOS
Robert J. Lung and Associates, dated August 8, 1970, Flight No. 29, Photo Nos. 4 - 9; Flight No. 30, Photo Nos. 3 - 11; Flight No. 31, Photo Nos. 1 - 13; Flight No. 32, Photo Nos. 2 - 15; Flight No. 33, Photo Nos. 1 - 15; Flight No. 34, Photo Nos. 4 – 15; Flight No. 35, Photo Nos. 7 – 14; Flight No. 36, Photo Nos. 9 – 13.
APPENDIX A SOURCE OF ROCK STRENGTH DATA
SOURCE NUMBER OF TESTS SELECTED ORANGE COUNTY PLANNING AND
DEVELOPMENT SERVICES 107

39
SECTION 3 GROUND SHAKING EVALUATION REPORT
Potential Ground Shaking in the
Canada Gobernadora 7.5-Minute Quadrangle, Orange County, California
By
Mark D. Petersen*, Chris H. Cramer*, Geoffrey A. Faneros, Charles R. Real, and Michael S. Reichle
California Department of Conservation
California Geological Survey *Formerly with CGS, now with U.S. Geological Survey
PURPOSE
The Seismic Hazards Mapping Act (the Act) of 1990 (Public Resources Code, Chapter 7.8, Division 2) directs the California Department of Conservation (DOC), Division of Mines and Geology (DMG) [now called California Geological Survey (CGS)] to delineate Seismic Hazard Zones. The purpose of the Act is to reduce the threat to public health and safety and to minimize the loss of life and property by identifying and mitigating seismic hazards. Cities, counties, and state agencies are directed to use the Seismic Hazard Zone Maps in their land-use planning and permitting processes. The Act requires that site-specific geotechnical investigations be performed prior to permitting most urban development projects within the hazard zones. Evaluation and mitigation of seismic hazards are to be conducted under guidelines established by the California State Mining and Geology Board (DOC, 1997. The text of this report is on the Internet at http://gmw.consrv.ca.gov/shmp/webdocs/sp117.pdf
This section of the evaluation report summarizes the ground motions used to evaluate liquefaction and earthquake-induced landslide potential for zoning purposes. Included are ground motion and related maps, a brief overview on how these maps were prepared, precautionary notes concerning their use, and related references. The maps provided

CALIFORNIA GEOLOGICAL SURVEY SHZR 063 40
herein are presented at a scale of approximately 1:150,000 (scale bar provided on maps), and show the full 7.5-minute quadrangle and portions of the adjacent eight quadrangles. They can be used to assist in the specification of earthquake loading conditions for the analysis of ground failure according to the “Simple Prescribed Parameter Value” method (SPPV) described in the site investigation guidelines (California Department of Conservation, 1997). Alternatively, they can be used as a basis for comparing levels of ground motion determined by other methods with the statewide standard.
This section and Sections 1 and 2 (addressing liquefaction and earthquake-induced landslide hazards) constitute a report series that summarizes development of seismic hazard zone maps in the state. Additional information on seismic hazard zone mapping in California can be accessed on the California Geological Survey's Internet page: http://www.conservation.ca.gov/CGS/index.htm
EARTHQUAKE HAZARD MODEL
The estimated ground shaking is derived from the statewide probabilistic seismic hazard evaluation released cooperatively by the California Department of Conservation, Division of Mines and Geology [California Geological Survey], and the U.S. Geological Survey (Petersen and others, 1996). That report documents an extensive 3-year effort to obtain consensus within the scientific community regarding fault parameters that characterize the seismic hazard in California. Fault sources included in the model were evaluated for long-term slip rate, maximum earthquake magnitude, and rupture geometry. These fault parameters, along with historical seismicity, were used to estimate return times of moderate to large earthquakes that contribute to the hazard.
The ground shaking levels are estimated for each of the sources included in the seismic source model using attenuation relations that relate earthquake shaking with magnitude, distance from the earthquake, and type of fault rupture (strike-slip, reverse, normal, or subduction). The published hazard evaluation of Petersen and others (1996) only considers uniform firm-rock site conditions. In this report, however, we extend the hazard analysis to include the hazard of exceeding peak horizontal ground acceleration (PGA) at 10% probability of exceedance in 50 years on spatially uniform conditions of rock, soft rock, and alluvium. These soil and rock conditions approximately correspond to site categories defined in Chapter 16 of the Uniform Building Code (ICBO, 1997), which are commonly found in California. We use the attenuation relations of Boore and others (1997), Campbell (1997), Sadigh and others (1997), and Youngs and others (1997) to calculate the ground motions.
The seismic hazard maps for ground shaking are produced by calculating the hazard at sites separated by about 5 km. Figures 3.1 through 3.3 show the hazard for PGA at 10% probability of exceedance in 50 years assuming the entire map area is firm rock, soft rock, or alluvial site conditions respectively. The sites where the hazard is calculated are represented as dots and ground motion contours as shaded regions. The quadrangle of interest is outlined by bold lines and centered on the map. Portions of the eight adjacent

((((((((( ((((((((( ((((((((( ((((((((( (((((((((
((((((((( ((((((((( ((((((((( ((((((((( (((((((((
((((((((( ((((((((( ((((((((( ((((((((( (((((((((
((((((((( ((((((((( ((((((((( ((((((((( (((((((((
(((((((((((((((((( ((((((((( ((((((((( (((((((((0.310.310.310.310.310.310.310.310.31 0.280.280.280.280.280.280.280.280.28 0.260.260.260.260.260.260.260.260.26 0.240.240.240.240.240.240.240.240.24 0.240.240.240.240.240.240.240.240.24 0.230.230.230.230.230.230.230.230.23
0.280.280.280.280.280.280.280.280.28 0.260.260.260.260.260.260.260.260.26 0.250.250.250.250.250.250.250.250.25 0.240.240.240.240.240.240.240.240.24 0.250.250.250.250.250.250.250.250.25 0.260.260.260.260.260.260.260.260.26
0.270.270.270.270.270.270.270.270.27 0.250.250.250.250.250.250.250.250.25 0.250.250.250.250.250.250.250.250.25 0.260.260.260.260.260.260.260.260.26 0.280.280.280.280.280.280.280.280.28 0.310.310.310.310.310.310.310.310.31
0.260.260.260.260.260.260.260.260.26 0.250.250.250.250.250.250.250.250.25 0.260.260.260.260.260.260.260.260.26 0.280.280.280.280.280.280.280.280.28 0.320.320.320.320.320.320.320.320.32 0.380.380.380.380.380.380.380.380.38
0.260.260.260.260.260.260.260.260.26 0.270.270.270.270.270.270.270.270.27 0.280.280.280.280.280.280.280.280.28 0.310.310.310.310.310.310.310.310.31 0.360.360.360.360.360.360.360.360.36 0.450.450.450.450.450.450.450.450.45
CANADA GOBERNADORA 7.5 MINUTE QUADRANGLE AND PORTIONS OFADJACENT QUADRANGLES
10% EXCEEDANCE IN 50 YEARS PEAK GROUND ACCELERATION (g)1998
FIRM ROCK CONDITIONS
Department of ConservationCalifornia Geological Survey
Figure 3.1
0 1.5
Miles
3
Base map modified from MapInfo StreetWorks © 1998 MapInfo Corporation
CALIFORNIA GEOLOGICAL SURVEY SHZR 06341

((((((((( ((((((((( ((((((((( ((((((((( (((((((((
(((((((((((((((((( ((((((((( ((((((((( (((((((((
((((((((( ((((((((( ((((((((( ((((((((( (((((((((
((((((((( ((((((((( ((((((((( ((((((((( (((((((((
((((((((( ((((((((( ((((((((( ((((((((( (((((((((
0.350.350.350.350.350.350.350.350.35 0.310.310.310.310.310.310.310.310.31 0.280.280.280.280.280.280.280.280.28 0.270.270.270.270.270.270.270.270.27 0.260.260.260.260.260.260.260.260.26 0.260.260.260.260.260.260.260.260.26
0.320.320.320.320.320.320.320.320.32 0.290.290.290.290.290.290.290.290.29 0.280.280.280.280.280.280.280.280.28 0.270.270.270.270.270.270.270.270.27 0.280.280.280.280.280.280.280.280.28 0.290.290.290.290.290.290.290.290.29
0.290.290.290.290.290.290.290.290.29 0.280.280.280.280.280.280.280.280.28 0.270.270.270.270.270.270.270.270.27 0.290.290.290.290.290.290.290.290.29 0.310.310.310.310.310.310.310.310.31 0.350.350.350.350.350.350.350.350.35
0.280.280.280.280.280.280.280.280.28 0.280.280.280.280.280.280.280.280.28 0.290.290.290.290.290.290.290.290.29 0.310.310.310.310.310.310.310.310.31 0.350.350.350.350.350.350.350.350.35 0.420.420.420.420.420.420.420.420.42
0.290.290.290.290.290.290.290.290.29 0.30.30.30.30.30.30.30.30.3 0.310.310.310.310.310.310.310.310.31 0.340.340.340.340.340.340.340.340.34 0.400.400.400.400.400.400.400.400.40 0.500.500.500.500.500.500.500.500.50
CANADA GOBERNADORA 7.5 MINUTE QUADRANGLE AND PORTIONS OFADJACENT QUADRANGLES
10% EXCEEDANCE IN 50 YEARS PEAK GROUND ACCELERATION (g)
1998SOFT ROCK CONDITIONS
Department of ConservationCalifornia Geological Survey
Figure 3.2
0 1.5
Miles
3
Base map modified from MapInfo StreetWorks © 1998 MapInfo Corporation
2002 SEISMIC HAZARD ZONE REPORT FOR THE CAÑADA GOBERNADORA QUADRANGLE 42

((((((((((((((((((((((((((((((((((((((((((((((((( ((((((((((((((((((((((((((((((((((((((((((((((((( ((((((((((((((((((((((((((((((((((((((((((((((((( ((((((((((((((((((((((((((((((((((((((((((((((((( (((((((((((((((((((((((((((((((((((((((((((((((((
((((((((((((((((((((((((((((((((((((((((((((((((( ((((((((((((((((((((((((((((((((((((((((((((((((( ((((((((((((((((((((((((((((((((((((((((((((((((( ((((((((((((((((((((((((((((((((((((((((((((((((( (((((((((((((((((((((((((((((((((((((((((((((((((
((((((((((((((((((((((((((((((((((((((((((((((((( ((((((((((((((((((((((((((((((((((((((((((((((((( ((((((((((((((((((((((((((((((((((((((((((((((((( ((((((((((((((((((((((((((((((((((((((((((((((((( (((((((((((((((((((((((((((((((((((((((((((((((((
(((((((((((((((((((((((((((((((((((((((((((((((((((((((((((((((((((((((((((((((((((((((((((((((((( ((((((((((((((((((((((((((((((((((((((((((((((((( ((((((((((((((((((((((((((((((((((((((((((((((((( (((((((((((((((((((((((((((((((((((((((((((((((((
((((((((((((((((((((((((((((((((((((((((((((((((( ((((((((((((((((((((((((((((((((((((((((((((((((( ((((((((((((((((((((((((((((((((((((((((((((((((( ((((((((((((((((((((((((((((((((((((((((((((((((( (((((((((((((((((((((((((((((((((((((((((((((((((
0.370.370.370.370.370.370.370.370.37 0.340.340.340.340.340.340.340.340.34 0.320.320.320.320.320.320.320.320.32 0.300.300.300.300.300.300.300.300.30 0.300.300.300.300.300.300.300.300.30 0.300.300.300.300.300.300.300.300.30
0.340.340.340.340.340.340.340.340.34 0.320.320.320.320.320.320.320.320.32 0.310.310.310.310.310.310.310.310.31 0.300.300.300.300.300.300.300.300.30 0.310.310.310.310.310.310.310.310.31 0.330.330.330.330.330.330.330.330.33
0.320.320.320.320.320.320.320.320.32 0.310.310.310.310.310.310.310.310.31 0.310.310.310.310.310.310.310.310.31 0.320.320.320.320.320.320.320.320.32 0.340.340.340.340.340.340.340.340.34 0.370.370.370.370.370.370.370.370.37
0.320.320.320.320.320.320.320.320.32 0.320.320.320.320.320.320.320.320.32 0.320.320.320.320.320.320.320.320.32 0.340.340.340.340.340.340.340.340.34 0.370.370.370.370.370.370.370.370.37 0.420.420.420.420.420.420.420.420.42
0.330.330.330.330.330.330.330.330.33 0.330.330.330.330.330.330.330.330.33 0.350.350.350.350.350.350.350.350.35 0.370.370.370.370.370.370.370.370.37 0.410.410.410.410.410.410.410.410.41 0.490.490.490.490.490.490.490.490.49
CANADA GOBERNADORA 7.5 MINUTE QUADRANGLE AND PORTIONS OFADJACENT QUADRANGLES
10% EXCEEDANCE IN 50 YEARS PEAK GROUND ACCELERATION (g)1998
ALLUVIUM CONDITIONS
Department of ConservationCalifornia Geological Survey
Figure 3.3
0 1.5
Miles
3
Base map modified from MapInfo Street Works © 1998 MapInfo Corporation
CALIFORNIA GEOLOGICAL SURVEY SHZR 06343

CALIFORNIA GEOLOGICAL SURVEY SHZR 063 44
quadrangles are also shown so that the trends in the ground motion may be more apparent. We recommend estimating ground motion values by selecting the map that matches the actual site conditions, and interpolating from the calculated values of PGA rather than the contours, since the points are more accurate.
APPLICATIONS FOR LIQUEFACTION AND LANDSLIDE HAZARD ASSESSMENTS
Deaggregation of the seismic hazard identifies the contribution of each of the earthquakes (various magnitudes and distances) in the model to the ground motion hazard for a particular exposure period (see Cramer and Petersen, 1996). The map in Figure 3.4 identifies the magnitude and the distance (value in parentheses) of the earthquake that contributes most to the hazard at 10% probability of exceedance in 50 years on alluvial site conditions (predominant earthquake). This information gives a rationale for selecting a seismic record or ground motion level in evaluating ground failure. However, it is important to keep in mind that more than one earthquake may contribute significantly to the hazard at a site, and those events can have markedly different magnitudes and distances. For liquefaction hazard the predominant earthquake magnitude from Figure 3.4 and PGA from Figure 3.3 (alluvium conditions) can be used with the Youd and Idriss (1997) approach to estimate cyclic stress ratio demand. For landslide hazard the predominant earthquake magnitude and distance can be used to select a seismic record that is consistent with the hazard for calculating the Newmark displacement (Wilson and Keefer, 1983). When selecting the predominant earthquake magnitude and distance, it is advisable to consider the range of values in the vicinity of the site and perform the ground failure analysis accordingly. This would yield a range in ground failure hazard from which recommendations appropriate to the specific project can be made. Grid values for predominant earthquake magnitude and distance should not be interpolated at the site location, because these parameters are not continuous functions.
A preferred method of using the probabilistic seismic hazard model and the “simplified Seed-Idriss method” of assessing liquefaction hazard is to apply magnitude scaling probabilistically while calculating peak ground acceleration for alluvium. The result is a “magnitude-weighted” ground motion (liquefaction opportunity) map that can be used directly in the calculation of the cyclic stress ratio threshold for liquefaction and for estimating the factor of safety against liquefaction (Youd and Idriss, 1997). This can provide a better estimate of liquefaction hazard than use of predominate magnitude described above, because all magnitudes contributing to the estimate are used to weight the probabilistic calculation of peak ground acceleration (Real and others, 2000). Thus, large distant earthquakes that occur less frequently but contribute more to the liquefaction hazard are appropriately accounted for.
Figure 3.5 shows the magnitude-weighted alluvial PGA based on Idriss’ weighting function (Youd and Idriss, 1997). It is important to note that the values obtained from this map are pseudo-accelerations and should be used in the formula for factor of safety without any magnitude-scaling (a factor of 1) applied.

((((((((((((((((((((((((((((((((((((((((((((((((( ((((((((((((((((((((((((((((((((((((((((((((((((( ((((((((((((((((((((((((((((((((((((((((((((((((( ((((((((((((((((((((((((((((((((((((((((((((((((( ((((((((((((((((((((((((((((((((((((((((((((((((( (((((((((((((((((((((((((((((((((((((((((((((((((
(((((((((((((((((((((((((((((((((((((((((((((((((((((((((((((((((((((((((((((((((((((((((((((((((( ((((((((((((((((((((((((((((((((((((((((((((((((( ((((((((((((((((((((((((((((((((((((((((((((((((( ((((((((((((((((((((((((((((((((((((((((((((((((( (((((((((((((((((((((((((((((((((((((((((((((((((
((((((((((((((((((((((((((((((((((((((((((((((((( ((((((((((((((((((((((((((((((((((((((((((((((((( ((((((((((((((((((((((((((((((((((((((((((((((((( ((((((((((((((((((((((((((((((((((((((((((((((((( ((((((((((((((((((((((((((((((((((((((((((((((((( (((((((((((((((((((((((((((((((((((((((((((((((((
((((((((((((((((((((((((((((((((((((((((((((((((( ((((((((((((((((((((((((((((((((((((((((((((((((( ((((((((((((((((((((((((((((((((((((((((((((((((( ((((((((((((((((((((((((((((((((((((((((((((((((( ((((((((((((((((((((((((((((((((((((((((((((((((( (((((((((((((((((((((((((((((((((((((((((((((((((
((((((((((((((((((((((((((((((((((((((((((((((((( ((((((((((((((((((((((((((((((((((((((((((((((((( ((((((((((((((((((((((((((((((((((((((((((((((((( ((((((((((((((((((((((((((((((((((((((((((((((((( ((((((((((((((((((((((((((((((((((((((((((((((((( (((((((((((((((((((((((((((((((((((((((((((((((((
6.96.96.96.96.96.96.96.96.9 6.96.96.96.96.96.96.96.96.9 6.96.96.96.96.96.96.96.96.9 6.86.86.86.86.86.86.86.86.8 6.86.86.86.86.86.86.86.86.8 6.86.86.86.86.86.86.86.86.8
6.96.96.96.96.96.96.96.96.9 6.96.96.96.96.96.96.96.96.9 6.86.86.86.86.86.86.86.86.8 6.86.86.86.86.86.86.86.86.8 6.86.86.86.86.86.86.86.86.8 6.86.86.86.86.86.86.86.86.8
6.96.96.96.96.96.96.96.96.9 6.96.96.96.96.96.96.96.96.9 6.86.86.86.86.86.86.86.86.8 6.86.86.86.86.86.86.86.86.8 6.86.86.86.86.86.86.86.86.8 6.86.86.86.86.86.86.86.86.8
6.86.86.86.86.86.86.86.86.8 6.86.86.86.86.86.86.86.86.8 6.86.86.86.86.86.86.86.86.8 6.86.86.86.86.86.86.86.86.8 6.86.86.86.86.86.86.86.86.8 6.86.86.86.86.86.86.86.86.8
6.86.86.86.86.86.86.86.86.8 6.86.86.86.86.86.86.86.86.8 6.86.86.86.86.86.86.86.86.8 6.86.86.86.86.86.86.86.86.8 6.86.86.86.86.86.86.86.86.8 6.86.86.86.86.86.86.86.86.8
(2)(2)(2)(2)(2)(2)(2)(2)(2) (7)(7)(7)(7)(7)(7)(7)(7)(7) (12)(12)(12)(12)(12)(12)(12)(12)(12) (27)(27)(27)(27)(27)(27)(27)(27)(27) (27)(27)(27)(27)(27)(27)(27)(27)(27) (22)(22)(22)(22)(22)(22)(22)(22)(22)
(7)(7)(7)(7)(7)(7)(7)(7)(7) (12)(12)(12)(12)(12)(12)(12)(12)(12) (27)(27)(27)(27)(27)(27)(27)(27)(27) (27)(27)(27)(27)(27)(27)(27)(27)(27) (22)(22)(22)(22)(22)(22)(22)(22)(22) (17)(17)(17)(17)(17)(17)(17)(17)(17)
(12)(12)(12)(12)(12)(12)(12)(12)(12) (12)(12)(12)(12)(12)(12)(12)(12)(12) (27)(27)(27)(27)(27)(27)(27)(27)(27) (22)(22)(22)(22)(22)(22)(22)(22)(22) (17)(17)(17)(17)(17)(17)(17)(17)(17) (12)(12)(12)(12)(12)(12)(12)(12)(12)
(27)(27)(27)(27)(27)(27)(27)(27)(27) (22)(22)(22)(22)(22)(22)(22)(22)(22) (17)(17)(17)(17)(17)(17)(17)(17)(17) (17)(17)(17)(17)(17)(17)(17)(17)(17) (17)(17)(17)(17)(17)(17)(17)(17)(17) (12)(12)(12)(12)(12)(12)(12)(12)(12)
(22)(22)(22)(22)(22)(22)(22)(22)(22) (17)(17)(17)(17)(17)(17)(17)(17)(17) (17)(17)(17)(17)(17)(17)(17)(17)(17) (12)(12)(12)(12)(12)(12)(12)(12)(12) (7)(7)(7)(7)(7)(7)(7)(7)(7) (7)(7)(7)(7)(7)(7)(7)(7)(7)
CANADA GOBERNADORA 7.5 MINUTE QUADRANGLE AND PORTIONS OFADJACENT QUADRANGLES
10% EXCEEDANCE IN 50 YEARS PEAK GROUND ACCELERATION
1998PREDOMINANT EARTHQUAKE Magnitude (Mw) (Distance (km))
Department of ConservationCalifornia Geological Survey0 1.5
Miles
3
Figure 3.4
Base map modified from MapInfo StreetWorks © 1998 MapInfo Corporation
CALIFORNIA GEOLOGICAL SURVEY SHZR 06345

(((((((((((((((((((((((((((((((((((((((((((((((((((((((((((((((((((((((((((((((((((((((((((((((((( ((((((((((((((((((((((((((((((((((((((((((((((((( ((((((((((((((((((((((((((((((((((((((((((((((((( ((((((((((((((((((((((((((((((((((((((((((((((((( (((((((((((((((((((((((((((((((((((((((((((((((((
((((((((((((((((((((((((((((((((((((((((((((((((( ((((((((((((((((((((((((((((((((((((((((((((((((( ((((((((((((((((((((((((((((((((((((((((((((((((( ((((((((((((((((((((((((((((((((((((((((((((((((( ((((((((((((((((((((((((((((((((((((((((((((((((( (((((((((((((((((((((((((((((((((((((((((((((((((
((((((((((((((((((((((((((((((((((((((((((((((((( ((((((((((((((((((((((((((((((((((((((((((((((((( ((((((((((((((((((((((((((((((((((((((((((((((((( ((((((((((((((((((((((((((((((((((((((((((((((((( ((((((((((((((((((((((((((((((((((((((((((((((((( (((((((((((((((((((((((((((((((((((((((((((((((((
((((((((((((((((((((((((((((((((((((((((((((((((( ((((((((((((((((((((((((((((((((((((((((((((((((( ((((((((((((((((((((((((((((((((((((((((((((((((( ((((((((((((((((((((((((((((((((((((((((((((((((( ((((((((((((((((((((((((((((((((((((((((((((((((( (((((((((((((((((((((((((((((((((((((((((((((((((
((((((((((((((((((((((((((((((((((((((((((((((((( ((((((((((((((((((((((((((((((((((((((((((((((((( ((((((((((((((((((((((((((((((((((((((((((((((((( ((((((((((((((((((((((((((((((((((((((((((((((((( ((((((((((((((((((((((((((((((((((((((((((((((((( (((((((((((((((((((((((((((((((((((((((((((((((((
(((((((((((((((((((((((((((((((((((((((((((((((((((((((((((((((((((((((((((((((((((((((((((((((((( ((((((((((((((((((((((((((((((((((((((((((((((((( ((((((((((((((((((((((((((((((((((((((((((((((((( ((((((((((((((((((((((((((((((((((((((((((((((((( (((((((((((((((((((((((((((((((((((((((((((((((((0.280.280.280.280.280.280.280.280.28 0.260.260.260.260.260.260.260.260.26 0.240.240.240.240.240.240.240.240.24 0.230.230.230.230.230.230.230.230.23 0.230.230.230.230.230.230.230.230.23 0.230.230.230.230.230.230.230.230.23
0.260.260.260.260.260.260.260.260.26 0.240.240.240.240.240.240.240.240.24 0.230.230.230.230.230.230.230.230.23 0.230.230.230.230.230.230.230.230.23 0.240.240.240.240.240.240.240.240.24 0.250.250.250.250.250.250.250.250.25
0.240.240.240.240.240.240.240.240.24 0.240.240.240.240.240.240.240.240.24 0.230.230.230.230.230.230.230.230.23 0.240.240.240.240.240.240.240.240.24 0.260.260.260.260.260.260.260.260.26 0.280.280.280.280.280.280.280.280.28
0.240.240.240.240.240.240.240.240.24 0.240.240.240.240.240.240.240.240.24 0.240.240.240.240.240.240.240.240.24 0.260.260.260.260.260.260.260.260.26 0.280.280.280.280.280.280.280.280.28 0.330.330.330.330.330.330.330.330.33
0.240.240.240.240.240.240.240.240.24 0.250.250.250.250.250.250.250.250.25 0.260.260.260.260.260.260.260.260.26 0.280.280.280.280.280.280.280.280.28 0.320.320.320.320.320.320.320.320.32 0.370.370.370.370.370.370.370.370.37
CANADA GOBERNADORA 7.5 MINUTE QUADRANGLE AND PORTIONS OF ADJACENT QUADRANGLES
10% EXCEEDANCE IN 50 YEARS MAGNITUDE-WEIGHTED PSEUDO-PEAK ACCELERATION (g) FOR ALLUVIUM
1998LIQUEFACTION OPPORTUNITY
Department of ConservationCalifornia Geological Survey
Figure 3.5
0 1.5
Miles
3
Base map modified from MapInfo StreetWorks © 1998 MapInfo Corporation
2002 SEISMIC HAZARD ZONE REPORT FOR THE CAÑADA GOBERNADORA QUADRANGLE 46

47
USE AND LIMITATIONS
The statewide map of seismic hazard has been developed using regional information and is not appropriate for site specific structural design applications. Use of the ground motion maps prepared at larger scale is limited to estimating earthquake loading conditions for preliminary assessment of ground failure at a specific location. We recommend consideration of site-specific analyses before deciding on the sole use of these maps for several reasons.
1. The seismogenic sources used to generate the peak ground accelerations were digitized from the 1:750,000-scale fault activity map of Jennings (1994). Uncertainties in fault location are estimated to be about 1 to 2 kilometers (Petersen and others, 1996). Therefore, differences in the location of calculated hazard values may also differ by a similar amount. At a specific location, however, the log-linear attenuation of ground motion with distance renders hazard estimates less sensitive to uncertainties in source location.
2. The hazard was calculated on a grid at sites separated by about 5 km (0.05 degrees). Therefore, the calculated hazard may be located a couple kilometers away from the site. We have provided shaded contours on the maps to indicate regional trends of the hazard model. However, the contours only show regional trends that may not be apparent from points on a single map. Differences of up to 2 km have been observed between contours and individual ground acceleration values. We recommend that the user interpolate PGA between the grid point values rather than simply using the shaded contours.
3. Uncertainties in the hazard values have been estimated to be about +/- 50% of the ground motion value at two standard deviations (Cramer and others, 1996).
4. Not all active faults in California are included in this model. For example, faults that do not have documented slip rates are not included in the source model. Scientific research may identify active faults that have not been previously recognized. Therefore, future versions of the hazard model may include other faults and omit faults that are currently considered.
5. A map of the predominant earthquake magnitude and distance is provided from the deaggregation of the probabilistic seismic hazard model. However, it is important to recognize that a site may have more than one earthquake that contributes significantly to the hazard. Therefore, in some cases earthquakes other than the predominant earthquake should also be considered.
Because of its simplicity, it is likely that the SPPV method (DOC, 1997) will be widely used to estimate earthquake shaking loading conditions for the evaluation of ground failure hazards. It should be kept in mind that ground motions at a given distance from an earthquake will vary depending on site-specific characteristics such as geology, soil properties, and topography, which may not have been adequately accounted for in the regional hazard analysis. Although this variance is represented to some degree by the

CALIFORNIA GEOLOGICAL SURVEY SHZR 063 48
recorded ground motions that form the basis of the hazard model used to produce Figures 3.1, 3.2, and 3.3, extreme deviations can occur. More sophisticated methods that take into account other factors that may be present at the site (site amplification, basin effects, near source effects, etc.) should be employed as warranted. The decision to use the SPPV method with ground motions derived from Figures 3.1, 3.2, or 3.3 should be based on careful consideration of the above limitations, the geotechnical and seismological aspects of the project setting, and the “importance” or sensitivity of the proposed building with regard to occupant safety.
REFERENCES
Boore, D.M., Joyner, W.B. and Fumal, T.E., 1997, Empirical near-source attenuation relationships for horizontal and vertical components of peak ground acceleration, peak ground velocity, and pseudo-absolute acceleration response spectra: Seismological Research Letters, v. 68, p. 154-179.
California Department of Conservation, Division of Mines and Geology, 1997, Guidelines for evaluating and mitigating seismic hazards in California: Special Publication 117, 74 p.
Campbell, K.W., 1997, Attenuation relationships for shallow crustal earthquakes based on California strong motion data: Seismological Research Letters, v. 68, p. 180-189.
Cramer, C.H. and Petersen, M.D., 1996, Predominant seismic source distance and magnitude maps for Los Angeles, Orange and Ventura counties, California: Bulletin of the Seismological Society of America, v. 85, no. 5, p. 1645-1649.
Cramer, C.H., Petersen, M.D. and Reichle, M.S., 1996, A Monte Carlo approach in estimating uncertainty for a seismic hazard assessment of Los Angeles, Ventura, and Orange counties, California: Bulletin of the Seismological Society of America, v. 86, p. 1681-1691.
International Conference of Building Officials (ICBO), 1997, Uniform Building Code: v. 2, Structural engineering and installation standards, 492 p.
Jennings, C.W., compiler, 1994, Fault activity map of California and adjacent areas: California Department of Conservation, Division of Mines and Geology, California Geologic Data Map Series, map no. 8.
Petersen, M.D., Bryant, W.A., Cramer, C.H., Cao, T., Reichle, M.S., Frankel, A.D., Lienkaemper, J.J., McCrory, P.A. and Schwartz, D.P., 1996, Probabilistic seismic hazard assessment for the State of California: California Department of Conservation, Division of Mines and Geology Open-File Report 96-08; also U.S. Geological Survey Open-File Report 96-706, 33 p.

49
Real, C.R., Petersen, M.D., McCrink, T.P. and Cramer, C.H., 2000, Seismic Hazard Deaggregation in zoning earthquake-induced ground failures in southern California: Proceedings of the Sixth International Conference on Seismic Zonation, November 12-15, Palm Springs, California, EERI, Oakland, CA.
Sadigh, K., Chang, C.-Y., Egan, J.A., Makdisi, F. and Youngs, R.R., 1997, SEA96- A new predictive relation for earthquake ground motions in extensional tectonic regimes: Seismological Research Letters, v. 68, p. 190-198.
Wilson, R.C. and Keefer, D.K., 1983, Dynamic analysis of a slope failure from the 1979 Coyote Lake, California, Earthquake: Bulletin of the Seismological Society of America, v. 73, p. 863-877.
Youd, T.L. and Idriss I.M., 1997, Proceedings of the NCEER workshop on evaluation of liquefaction resistance of soils: Technical Report NCEER-97-0022, 40 p.
Youngs, R.R., Chiou, S.-J., Silva, W.J. and Humphrey, J.R., 1997, Stochastic point-source modeling of ground motions in the Cascadia Region: Seismological Research Letters, v. 68, p. 74-85.