Embed Size (px)
Citation preview
SEISMIC HAZARD ZONE REPORT 110
SEISMIC HAZARD ZONE REPORT FOR THE LICK OBSERVATORY 7.5-MINUTE
QUADRANGLE, SANTA CLARA COUNTY, CALIFORNIA
2012
DEPARTMENT OF CONSERVATION
California Geological Survey
STATE OF CALIFORNIA EDMUND G. BROWN
GOVERNOR
THE NATURAL RESOURCES AGENCY
JOHN LAIRD SECRETARY FOR RESOURCES
DEPARTMENT OF CONSERVATION MARK NECHODOM
DIRECTOR
CALIFORNIA GEOLOGICAL SURVEY JOHN G. PARRISH, PH.D.
STATE GEOLOGIST
Copyright © [2011] by the California Department of Conservation. All rights reserved. No part of this publication may be reproduced without written consent of the Department of Conservation.
The Department of Conservation makes no warrantees as to the suitability of this product for any particular purpose.

How to view or obtain Seismic Hazard Zone maps Seismic Hazard Zone Maps, Seismic Hazard Zone Reports, and related information are available on the California Geological Survey’s (CGS) Internet page: http://www.consrv.ca.gov/cgs/shzp/Pages/Index.aspx.
The maps and reports are also available for reference at CGS offices in Sacramento, Menlo Park, and Los Angeles at the addresses presented below.
The Seismic Hazard Zone Report documents the methods and data used to construct the Seismic Hazard Zone Map for each 7.5-minute quadrangle evaluated by CGS. The information should be particularly helpful to site investigators and local government reviewers of geotechnical reports.
CALIFORNIA GEOLOGICAL SURVEY'S PUBLICATION SALES OFFICES: Publications and Information Office 801 K Street, MS 14-34 Sacramento, CA 95814-3531 (916) 445-5716
Bay Area Regional Office 345 Middlefield Road, MS-520 Menlo Park, CA 94025 (650) 688-6327
Reports and maps can be viewed at the CGS Southern California Regional Office at the following address:
888 S. Figueroa Street, Suite 475 Los Angeles, CA 90017 (213) 239-0878

SHZR 110 SEISMIC HAZARD ZONATION OF THE LICK OBSERVATORY QUADRANGLE
i
TABLE OF CONTENTS
EXECUTIVE SUMMARY ................................................................................................................................... v THE CALIFORNIA SEISMIC HAZARDS MAPPING PROGRAM .................................................................vi
SECTION 1: EVALUATION REPORT FOR LIQUEFACTION HAZARD ................................. 1
INTRODUCTION ............................................................................................................................................. 1 Purpose .......................................................................................................................................................... 1 Background .................................................................................................................................................... 2 Methodology .................................................................................................................................................. 2 Scope and Limitations ................................................................................................................................... 3
PART I: GEOGRAPHIC AND GEOLOGIC SETTING ...................................................................... 3 PHYSIOGRAPHY ............................................................................................................................................ 3
Location ......................................................................................................................................................... 3 Land Use ........................................................................................................................................................ 4
GEOLOGY ........................................................................................................................................................ 4 Bedrock Units ................................................................................................................................................ 5 Quaternary Sedimentary Deposits ................................................................................................................. 5
ENGINEERING GEOLOGY ............................................................................................................................ 7 Ground Water ................................................................................................................................................ 8
PART II: LIQUEFACTION HAZARD ASSESSMENT...................................................................... 9 MAPPING TECHNIQUES ............................................................................................................................... 9 LIQUEFACTION SUSCEPTIBILITY .............................................................................................................. 9 GROUND SHAKING OPPORTUNITY ......................................................................................................... 10 LIQUEFACTION ANALYSIS ....................................................................................................................... 10 ZONATION CRITERIA: LIQUEFACTION .................................................................................................. 11 DELINEATION OF SEISMIC HAZARD ZONES: LIQUEFACTION ......................................................... 12 ACKNOWLEDGMENTS ............................................................................................................................... 13 REFERENCES ................................................................................................................................................ 13
SECTION 2: EVALUATION REPORT FOR EARTHQUAKE-INDUCED LANDSLIDE HAZARD .................................................................................................................. 17
INTRODUCTION ........................................................................................................................................... 17 Purpose ........................................................................................................................................................ 17 Background .................................................................................................................................................. 18 Methodology ................................................................................................................................................ 18 Scope and Limitations ................................................................................................................................. 19
PART I: GEOGRAPHIC AND GEOLOGIC SETTING ..................................................................... 19 PHYSIOGRAPHY .......................................................................................................................................... 19
Location ....................................................................................................................................................... 19 Land Use ...................................................................................................................................................... 20 Topography .................................................................................................................................................. 20
GEOLOGY ...................................................................................................................................................... 21 Bedrock Units .............................................................................................................................................. 21 Geologic Structure ....................................................................................................................................... 23 Landslide Inventory ..................................................................................................................................... 24
ENGINEERING GEOLOGY .......................................................................................................................... 26 Geologic Material Strength .......................................................................................................................... 26
ii CALIFORNIA GEOLOGICAL SURVEY 2012
Existing Landslides ...................................................................................................................................... 26
PART II: EARTHQUAKE-INDUCED LANDSLIDE HAZARD ASSESSMENT .............................. 28 MAPPING TECHNIQUES ............................................................................................................................. 28 EARTHQUAKE-INDUCED LANDSLIDE SUSCEPTIBILITY ................................................................... 29 GROUND SHAKING OPPORTUNITY ......................................................................................................... 29 EARTHQUAKE-INDUCED LANDSLIDE HAZARD POTENTIAL ........................................................... 30 ZONATION CRITERIA: EARTHQUAKE-INDUCED LANDSLIDES........................................................ 30 DELINEATION OF SEISMIC HAZARD ZONES: EARTHQUAKE-INDUCED LANDSLIDES............... 31
Existing Landslides ...................................................................................................................................... 31 Hazard Potential Analysis ............................................................................................................................ 31
ACKNOWLEDGMENTS ............................................................................................................................... 31 REFERENCES ................................................................................................................................................ 32 APPENDIX A: Sources of Rock Strength Data ............................................................................................. 34
SECTION 3: GROUND SHAKING ASSESSMENT ..................................................................... 36
INTRODUCTION ........................................................................................................................................... 36 Purpose ........................................................................................................................................................ 36
2008 PROBABILISTIC SEISMIC HAZARD ANALYSIS MODEL ............................................................. 37 APPLICATION TO LIQUEFACTION AND LANDSLIDE HAZARD ASSESSMENT .............................. 37 REFERENCES ................................................................................................................................................ 38
SHZR 110 SEISMIC HAZARD ZONATION OF THE LICK OBSERVATORY QUADRANGLE
iii
TABLES
Table 1.1. Correlation of Quaternary Stratigraphic Nomenclatures Used in Previous Studies.................................... 7
Table 2.1. Summary of the shear strength statistics for the Lick Observatory Quadrangle. ....................................... 27
Table 2.2. Summary of shear strength groups for the Lick Observatory Quadrangle................................................. 28
PLATES Plate 1.1. Quaternary Geologic Materials Map, Lick Observatory 7.5-Minute Quadrangle.
Plate 2.1. Landslide Inventory and Shear Test Sample Locations, Lick Observatory 7.5-Minute Quadrangle.
iv CALIFORNIA GEOLOGICAL SURVEY 2012
Release and Revision History: Seismic Hazard Zone Map and Evaluation Report of the Lick Observatory Quadrangle,
SHZR 120 4/26/2012 Preliminary Zone Map Release
10/26/2012 Official Zone Map Release
SHZR 110 SEISMIC HAZARD ZONATION OF THE LICK OBSERVATORY QUADRANGLE
v
EXECUTIVE SUMMARY
This report summarizes the methods and sources of information used to prepare the Seismic Hazard Zone Map for the Lick Observatory 7.5-Minute Quadrangle, Santa Clara County, California. The topographic quadrangle map, which covers approximately 155 square kilometers (~60 square miles) at a scale of 1:24,000 (41.7 mm = 1,000 meters; 1 inch = 2,000 feet), displays the boundaries of preliminary Zones of Required Investigation for liquefaction and earthquake-induced landslides. The area subject to seismic hazard mapping includes part of the City of San Jose and the remaining area is unincorporated Santa Clara County. The map designates Zones of Required Investigation for liquefaction and earthquake-induced landslides only for the southwestern half of the quadrangle because mountainous terrain and projected land use in the northeastern half make urbanization unlikely.
Zones for liquefaction hazard within the Lick Observatory Quadrangle are generally limited to a few narrow canyon bottoms and stream valleys, such as Halls and San Felipe valleys, and where stream drainages enter Evergreen Valley along the western edge of the quadrangle. Zones for earthquake-induced landslides, however, cover much of the mapped southwest half of the quadrangle because of the predominance of existing landslides and steep slopes underlain by low strength rock.
Seismic hazard maps are prepared by the California Geological Survey (CGS) using geographic information system (GIS) technology, which allows the manipulation of three-dimensional data. Information analyzed in these studies includes topography, surface and subsurface geology, borehole log data, recorded groundwater levels, existing landslide features, slope gradient, rock-strength measurements, geologic structure, and probabilistic earthquake shaking estimates. Earthquake ground shaking inputs are based upon probabilistic seismic hazard maps that depict peak ground acceleration, mode magnitude, and mode distance with a 10 percent probability of exceedance in 50 years. Calculations used in the seismic hazard evaluation of the Lick Observatory Quadrangle were based on an earthquake of Moment Magnitude range of 6.2 to 7.1 with a Modal Distance range of 3 to 14 kilometers.
City, county, and state agencies are required by the California Seismic Hazards Mapping Act to use the seismic hazard zone maps in their land-use planning and permitting processes. They must withhold building permits for sites being developed within Zones of Required Investigation until the geologic and soil conditions of the project site are investigated and appropriate mitigation measures, if any, are incorporated into development plans. Guidelines for such investigation can be found at http://www.conservation.ca.gov/cgs/shzp/webdocs/sp117.pdf. The Act also requires sellers of real property within these zones to disclose that fact at the time such property is sold.
vi CALIFORNIA GEOLOGICAL SURVEY 2012
THE CALIFORNIA SEISMIC HAZARDS MAPPING PROGRAM The Seismic Hazards Mapping Act (the Act) of 1990 (Public Resources Code, Chapter 7.8, Division 2) directs the State Geologist to prepare maps that delineate seismic hazard zones. The purpose of the Act is to reduce the threat to public safety and to minimize the loss of life and property by identifying and mitigating seismic hazards. City, county, and state agencies are directed to use the seismic hazard zone maps in their land-use planning and permitting processes. They must withhold development permits for a site within a zone until the geologic and soil conditions of the project site are investigated and appropriate mitigation measures, if any, are incorporated into development plans. The Act also requires sellers (and their agents) of real property within a mapped hazard zone to disclose at the time of sale that the property lies within such a zone. Evaluation and mitigation of seismic hazards are to be conducted under guidelines adopted by the California State Mining and Geology Board (SMGB) (California Geological Survey, 2008). The text of this report is online at: http://www.conservation.ca.gov/cgs/shzp/webdocs/sp117.pdf.
The Act directs SMGB to appoint and consult with the Seismic Hazards Mapping Act Advisory Committee (SHMAAC) in developing criteria for the preparation of the seismic hazard zone maps. SHMAAC consists of geologists, seismologists, civil and structural engineers, representatives of city and county governments, the state insurance commissioner and the insurance industry. In 1991, the SMGB adopted initial criteria for delineating seismic hazard zones to promote uniform and effective statewide implementation of the Act. These initial criteria, which were published in 1992 as California Geological Survey (CGS) Special Publication 118, were revised in 2004. They provide detailed standards for mapping regional liquefaction and landslide hazards. The Act also directed the State Geologist to develop a set of probabilistic seismic maps for California and to research methods that might be appropriate for mapping earthquake-induced landslide hazards.
In 1996, working groups established by SHMAAC reviewed the prototype maps and the techniques used to create them. The reviews resulted in recommendations that 1) the process for zoning liquefaction hazards remain unchanged and 2) earthquake-induced landslide zones be delineated using a modified Newmark analysis. In April 2004, significant revisions of liquefaction zone mapping criteria relating to application of historically high groundwater level data in desert regions of the state were adopted by the SMGB. These modifications are reflected in the revised CGS Special Publication 118, which is available on online at: http://www.conservation.ca.gov/cgs/shzp/webdocs/sp118_revised.pdf.
This Seismic Hazard Zone Report summarizes the development of the Preliminary Seismic Hazard Zone Map for the Lick Observatory 7.5-Minute Quadrangle. The process of zonation for liquefaction hazard involves an evaluation of Quaternary geologic maps, groundwater level records, and subsurface geotechnical data. The process of zonation for earthquake-induced landslide hazard incorporates evaluations of earthquake loading, existing landslides, slope gradient, rock strength, and geologic structure. A statewide Earthquake Shaking Potential Map, based on probabilistic seismic hazard analysis (PSHA), has been prepared so that uniformly generated ground motion parameters (peak ground acceleration, mode magnitude, mode distance) are applied to all CGS liquefaction and earthquake-induced landslide hazard assessments.

SHZR 110 SEISMIC HAZARD ZONATION OF THE LICK OBSERVATORY QUADRANGLE
vii

SHZR 110 SEISMIC HAZARD ZONATION OF THE LICK OBSERVATORY QUADRANGLE
1
SECTION 1: EVALUATION REPORT FOR LIQUEFACTION HAZARD
in the
LICK OBSERVATORY 7.5-MINUTE QUADRANGLE, SANTA CLARA COUNTY, CALIFORNIA
by
Ralph Loyd P.G. 3629, C.E.G. 2158
DEPARTMENT OF CONSERVATION
CALIFORNIA GEOLOGICAL SURVEY
INTRODUCTION Purpose
The Seismic Hazards Mapping Act of 1990 (Public Resources Code, Chapter 7.8, Division 2) directs the California State Geologist to compile maps that identify Seismic Hazard Zones consistent with requirements and priorities established by the California State Mining and Geology Board (SMGB) (California Geological Survey, 2004). The text of this report is available online at: http://www.conservation.ca.gov/cgs/shzp/webdocs/sp118_revised.pdf. The Act requires that site-specific geotechnical investigations be performed for most urban development projects situated within seismic hazard zones before lead agencies can issue the building permit. The Act also requires sellers of real property within these zones to disclose that fact at the time such property is sold. Evaluation and mitigation of seismic hazards are to be conducted under guidelines adopted by the California SMGB (California Geological Survey, 2008). The text of this report is online at: http://www.conservation.ca.gov/cgs/shzp/webdocs/sp117.pdf.
Following the release of the SMGB Guidelines, local government agencies in the Los Angeles metropolitan region sought more definitive guidance in the review of geotechnical investigations addressing liquefaction hazard. The agencies made their request through the Geotechnical Engineering Group of the Los Angeles Section of the American Society of Civil Engineers (ASCE). This group convened an implementation committee under the auspices of the Southern California Earthquake Center (SCEC). The committee, which consisted of practicing geotechnical engineers and engineering geologists, released an overview of the practice of liquefaction analysis, evaluation, and mitigation techniques (Southern California Earthquake Center, 1999). This text is also online at: http://www.scec.org/.
This section of the evaluation report summarizes seismic hazard zone mapping for potentially liquefiable soils in the Lick Observatory 7.5-Minute Quadrangle. Section 2 (addressing earthquake-induced landslide hazard) and Section 3 (addressing ground shaking potential) complete the evaluation report, which is one of a series that summarizes seismic hazard zone mapping by California Geological Survey (CGS) in developing areas of the state where there is
2 CALIFORNIA GEOLOGICAL SURVEY 2012
potential for strong ground motion (Smith, 1996). Additional information on seismic hazards zone mapping in California can be accessed on CGS’s web page: http://www.conservation.ca.gov/cgs/shzp/ Background
Liquefaction-induced ground failure historically has been a major cause of earthquake damage in northern California. During the 1989 Loma Prieta and 1906 San Francisco earthquakes, significant damage to roads, utility pipelines, buildings, and other structures in the San Francisco Bay area was caused by liquefaction-induced ground displacement.
Localities most susceptible to liquefaction-induced damage are underlain by loose, water-saturated, granular sediment within 40 feet of the ground surface. These geological and groundwater conditions are widespread in the San Francisco Bay Area, most notably in some densely populated valley regions and alluviated floodplains. In addition, the potential for strong earthquake ground shaking is high because of the many nearby active faults. The combination of these factors constitutes a significant seismic hazard, including areas within the Lick Observatory Quadrangle. Methodology
CGS’s evaluation of liquefaction potential and preparation of seismic hazard zone maps require the collection, compilation, and analysis of various geotechnical information and map data. The data are processed into a series of geographic information system (GIS) layers using commercially available software. In brief, project geologists complete the following principal tasks to generate a seismic hazard zone map for liquefaction potential:
• Compile digital geologic maps to delineate the spatial distribution of Quaternary sedimentary deposits.
• Collect geotechnical borehole log data from public agencies and engineering geologic consultants.
• Enter boring log data into the GIS. • Generate digital cross sections to evaluate the vertical and lateral extent of Quaternary
deposits and their lithologic and engineering properties. • Evaluate and digitize historically highest groundwater levels in areas containing
Quaternary deposits. • Characterize expected earthquake ground motion, also referred to as ground-shaking
opportunity (see Section 3 of this report). • Perform quantitative analyses of geotechnical and ground motion data to assess the
liquefaction potential of Quaternary deposits. • Synthesize, analyze, and interpret above data to create maps delineating Zones of
Required Investigation according to criteria adopted by the SMGB (CGS, 2004).
SHZR 110 SEISMIC HAZARD ZONATION OF THE LICK OBSERVATORY QUADRANGLE
3
Scope and Limitations
Evaluation for potentially liquefiable soils is confined to areas covered by Quaternary (less than about 1.6 million years) sedimentary deposits. Such areas within the Lick Observatory Quadrangle consist mainly of alluviated valleys, floodplains, and canyons. CGS’s liquefaction hazard evaluations are based on information on earthquake ground shaking, surface and subsurface lithology, geotechnical soil properties, and groundwater depth, which is gathered from various sources. Although selection of data used in this evaluation was rigorous, the quality of the data used varies. The State of California and the Department of Conservation make no representations or warranties regarding the accuracy of the data obtained from outside sources.
Liquefaction zone maps are intended to prompt more detailed, site-specific geotechnical investigations, as required by the Act. As such, liquefaction zone maps identify areas where the potential for liquefaction is relatively high. They do not predict the amount or direction of liquefaction-related ground displacements, or the amount of damage to facilities that may result from liquefaction. Factors that control liquefaction-induced ground failure are the extent, depth, density, and thickness of liquefiable materials, depth to groundwater, rate of drainage, slope gradient, proximity to free faces, and intensity and duration of ground shaking. These factors must be evaluated on a site-specific basis to assess the potential for ground failure at any given project site.
This section of the report is presented in two parts. Part I addresses the geographic and geologic setting of the study area while Part II documents the data and parameters used to evaluate liquefaction hazard and to delineate Zones of Required Investigation in the Lick Observatory 7.5-Minute Quadrangle.
PART I: GEOGRAPHIC AND GEOLOGIC SETTING
PHYSIOGRAPHY Location
The Lick Observatory Quadrangle covers an area of approximately 155 square kilometers (60 square miles) in east-central Santa Clara County. The map area is within the central portion of the Coast Ranges Geomorphic Province of California. The center of the quadrangle is about 97 kilometers (60 miles) southeast of the City of San Francisco and about 24 kilometers (15 miles) east of the City of San Jose. Small fingers of the City of San Jose are within the southwest part of the map area and the remainder of the area is unincorporated Santa Clara County land. This evaluation report, and the accompanying Seismic Hazard Map that it describes, address only the southwest half of the quadrangle. Approximately 78 square kilometers (30 square miles) of area covering the northeast half of the quadrangle was not evaluated for zoning because of the low likelihood of large-scale or significant development in the near future.
4 CALIFORNIA GEOLOGICAL SURVEY 2012
The study area is dominated by rugged, mountainous terrain of the northwest-trending Diablo Range that occupies the central region of California’s Coast Ranges Geomorphic Province. Less than 8 square kilometers (~3 square miles) of flatland exist in the entire quadrangle, most of which is found in Halls Valley, San Felipe Valley, and two small embayments of Evergreen Valley, which is a sub-basin of the Santa Clara Valley. Major perennial streams within the quadrangle include San Felipe, Thomson, Sulfur, and Smith Creeks, along with Arroyo Aguague. Elevations in the map area range from slightly less than 159 meters (520 feet) above mean sea level in Evergreen Valley, to a little over 1332 meters (4,370 feet) on Copernicus Peak, in the northeastern quadrant of the map. Land Use
Small fingers of the City of San Jose cover about 8.8 square kilometers (3.4 square miles) of land along the southwest margin of the Lick Observatory Quadrangle. However, home development within this part of the city is concentrated in about 2.5 square kilometers (1 square mile) within Evergreen Valley. The remainder of the quadrangle encompasses unincorporated, generally undeveloped county land. The Lick Observatory complex, which occupies the top of Mt. Hamilton, lies outside of the quadrangle area subject to zone mapping. Joseph D. Grant County Park occupies the north-central portion of the quadrangle within the study area.
The primary transportation route in the study area is Mt. Hamilton Road (State Highway 130), which traverses the quadrangle from the northwest to Lick Observatory on Mt. Hamilton and continuing to the east as San Antonio Valley Road. Quimby Road joins Mt. Hamilton Road from the southwest at Joseph D. Grant County Park. San Felipe Road traverses the southwest corner of the quadrangle, and also provides access north into San Felipe Valley. Access to rural areas within the quadrangle is primarily by unpaved and private roads.
GEOLOGY Geologic units susceptible to liquefaction generally are late Quaternary alluvial and fluvial sedimentary deposits and artificial fill. To evaluate the areal and vertical distribution of Quaternary deposits in the Lick Observatory Quadrangle, geologic maps of the San Francisco Bay Area showing Quaternary deposits (Knudsen and others, 2000), bedrock units (Wentworth and others, 1999), and geology along the Calaveras Fault (Witter and others, 2003) were obtained from the U.S. Geological Survey in digital form. The GIS maps and layers covering the Lick Observatory Quadrangle were combined, with minor modifications along the bedrock/Quaternary contact, to form a single, 1:24,000-scale geologic materials map that displays map unit polygons only (i.e. no faults, fold axes, or point data). The distribution of Quaternary deposits on this map (summarized on Plate 1.1) was used in combination with other data, discussed below, to evaluate liquefaction susceptibility and prepare the Seismic Hazard Zone Map.
Air photos and limited field reconnaissance were used to validate minor modifications to bedrock/Quaternary contacts and to confirm the location of geologic contacts, observe properties of near-surface deposits, and characterize the surface expression of individual geologic units.
SHZR 110 SEISMIC HAZARD ZONATION OF THE LICK OBSERVATORY QUADRANGLE
5
Bedrock Units
Bedrock of the Diablo Range exposed in the Lick Observatory Quadrangle consists mainly of Cretaceous sedimentary strata of the Great Valley Sequence, rocks of the Franciscan Complex, serpentine-dominant rock units of the Coast Range Ophiolite, and Tertiary sedimentary strata (Wentworth and others, 1999). Bedrock units mapped in the Diablo Range are grouped by Wentworth and others (1999) and McLaughlin and others (2001) into distinct fault-bounded, elongate blocks that generally parallel the northwest-trending structural grain of the range. Four of these blocks, the Silver Creek, Coyote, Alum Rock, and Mt Hamilton blocks, are identified in the study area by Wentworth and others (1999).
The Silver Creek Block is exposed in the Yerba Buena Hills in the southwest corner of the Lick Observatory Quadrangle. Locally, rock exposures within this structural block are comprised primarily of serpentine of the Coast Range Ophiolite and the Plio-Pleistocene Packwood Gravel, along with small, isolated outcrops of Pliocene Silver Creek Gravel. Across the fault boundary to the east, and which in the study area occupies most of the lower west flank of the Diablo Range, lies the Alum Rock Block. This structural block is comprised of Cretaceous units, mainly sandstone and siltstone of the Great Valley Sequence, along with Miocene sandstone, siltstone, and shale of the Clairmont and Briones formations. The Coyote Block lies east of the Alum Rock Block only in the southern part of the quadrangle because it pinches out where the Madrone Springs Fault converges with the Calaveras Fault in the vicinity of San Felipe Valley. Locally, the Coyote block is characterized by Cretaceous sedimentary rocks of the Great Valley Sequence, along with brown-weathering mudstone of Eocene age and sandstone, siltstone, and shale of the Miocene Clairmont and Briones formations. East of the Calaveras Fault, more than half of the area within the bounds of the quadrangle is underlain by metamorphic rocks of the Mount Hamilton Block. These are mainly Jurassic-Cretaceous rocks assigned to various units of the Franciscan complex, which are exposed in the core of the Diablo Range. However, only a narrow band along the western boundary of the Mt Hamilton Block lies within the Lick Observatory Quadrangle.
More detailed descriptions of bedrock units exposed in the Lick Observatory Quadrangle are presented in Section 2 of this report: Earthquake-Induced Landslides. Refer to Wentworth and others (1999) for a regional geologic map showing bedrock units. Quaternary Sedimentary Deposits
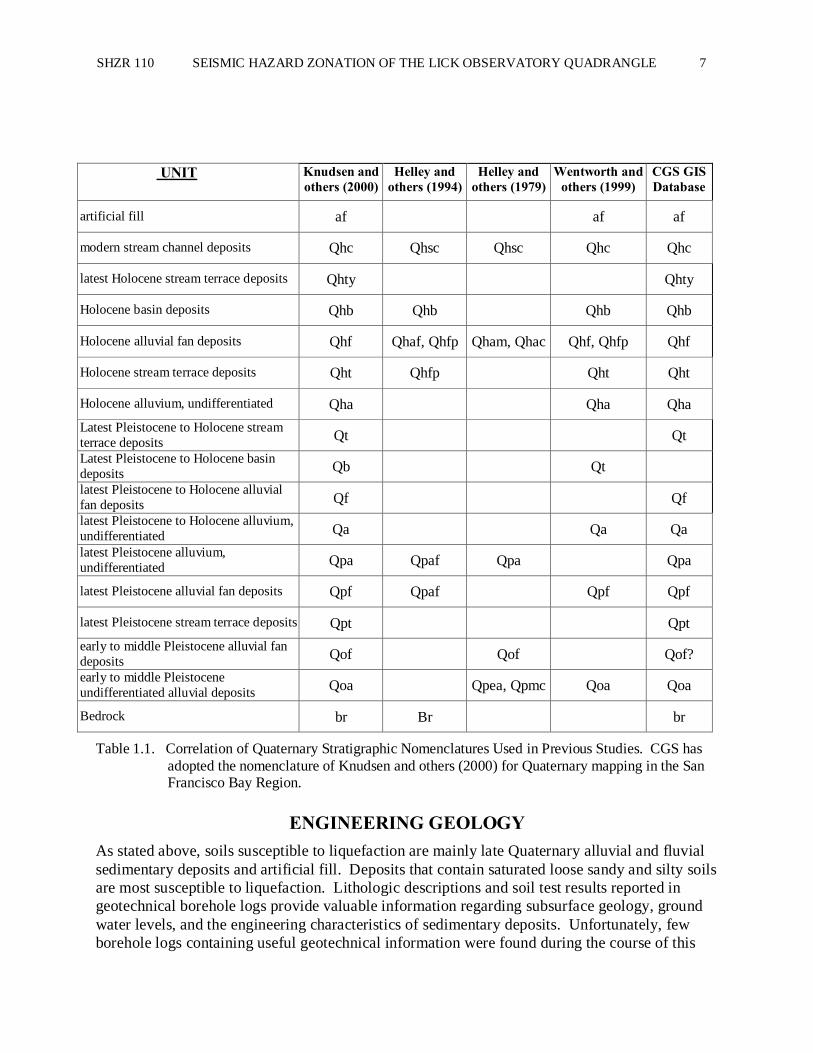
In total, Knudsen and others (2000) and Witter and others (2003) identify 15 Quaternary map units in the Lick Observatory Quadrangle (Plate 1.1). The Quaternary geologic mapping methods used are described in Knudsen and others (2000), which consist of interpretation of topographic maps, aerial photographs, and soil surveys, as well as compiled published and unpublished geologic maps. They estimate the ages of deposits using: landform shape, relative geomorphic position, cross-cutting relationships, superposition, depth and degree of surface dissection, and relative degree of soil profile development. Table 1.1 compares stratigraphic nomenclature used in Knudsen and others (2000) and the CGS GIS database with nomenclature used by several previous studies performed in northern California.
Only about 5 percent of the ground surface within the Lick Observatory Quadrangle is mapped as sedimentary deposits of Quaternary age. The most notable areas covered by such deposits are
6 CALIFORNIA GEOLOGICAL SURVEY 2012
Halls Valley, San Felipe Valley, and the southeastern margin of Evergreen Valley. Sediment deposited in these alluviated flatlands is derived from local bedrock sources, given the small-scale watersheds present in the Lick Observatory quadrangle. Bedrock in the southwest half of the quadrangle consists primarily of sandstone, siltstone, shale, and gravel. When eroded, much of the material from these rock units breaks down into clastic sediment that is transported short distances down San Felipe Creek, Thompson Creek, Arroyo Aguague, and their tributary creeks as channel deposits (Qhc) and then deposited in the local valleys as generally coarse-grained alluvial (Qha), basin (Qhb), and alluvial fan (Qhf) deposits. Along the creeks, Holocene and latest Holocene stream terrace deposits (Qht and Qhty) are inset into bedrock, undifferentiated alluvial deposits (Qha), and alluvial fan deposits (Qhf). One such Holocene alluvial fan deposit (Qhf) has developed where Thompson Creek canyon opens out onto Evergreen Valley on the southwest margin of the quadrangle. Just to the north of this fan, a latest Pleistocene to Holocene alluvial fan deposit (Qpf) has developed at the base of the foothills. Some stream terrace deposits of latest Pleistocene age (Qpt) and older Quaternary alluvial fan (Qpf, Oof) and undifferentiated older alluvium (Qoa) have been identified along San Felipe Creek along and to either side of the Calaveras Fault.
Structural Geology The structural framework of the Diablo Range is governed by a series of sub-parallel, generally northwest-trending faults ranging in age from Mesozoic (Coast Range Fault) to present time (Calaveras Fault) (Wentworth and others, 1999). The study area is within the active San Andreas Fault system, which distributes shearing across a complex system of primarily northwest-trending, right-lateral, strike-slip faults that include the San Andreas, Hayward, and Calaveras faults. The San Andreas Fault is located about 23 km (13.5 miles) southwest of the southwestern corner of the quadrangle. The Calaveras Fault extends through the quadrangle diagonally from the southeast quadrant through the northwest quadrant and represents the source for the greatest potential ground motions to the study area. Notably, movement along the Calaveras Fault in 1984 produced the magnitude 6.2 Morgan Hill Earthquake. The epicenter of this event was located within the study area, 1.6 km (1 mile) southwest of the Smith Creek Ranger Station, and surface manifestations of liquefaction were reported roughly 17 km (~10 miles) south of the Lick Observatory Quadrangle southern boundary. The Calaveras Fault has also “adopted” and incorporated the older Madrone Springs Fault in the south part of the quadrangle (Page, 1999). As shown on Plate 1.1, the southern terminus of the active Hayward Fault also lies within the study area. Other named faults in the study area include the Silver Creek, Evergreen, and Quimby (Plate 1.1).
SHZR 110 SEISMIC HAZARD ZONATION OF THE LICK OBSERVATORY QUADRANGLE
7
UNIT Knudsen and others (2000)
Helley and others (1994)
Helley and others (1979)
Wentworth and others (1999)
CGS GIS Database
artificial fill af af af
modern stream channel deposits Qhc Qhsc Qhsc Qhc Qhc
latest Holocene stream terrace deposits Qhty Qhty
Holocene basin deposits Qhb Qhb Qhb Qhb
Holocene alluvial fan deposits Qhf Qhaf, Qhfp Qham, Qhac Qhf, Qhfp Qhf
Holocene stream terrace deposits Qht Qhfp Qht Qht
Holocene alluvium, undifferentiated Qha Qha Qha Latest Pleistocene to Holocene stream terrace deposits Qt Qt Latest Pleistocene to Holocene basin deposits Qb Qt latest Pleistocene to Holocene alluvial fan deposits Qf Qf latest Pleistocene to Holocene alluvium, undifferentiated Qa Qa Qa latest Pleistocene alluvium, undifferentiated Qpa Qpaf Qpa Qpa
latest Pleistocene alluvial fan deposits Qpf Qpaf Qpf Qpf
latest Pleistocene stream terrace deposits Qpt Qpt early to middle Pleistocene alluvial fan deposits Qof Qof Qof? early to middle Pleistocene undifferentiated alluvial deposits Qoa Qpea, Qpmc Qoa Qoa
Bedrock br Br br
Table 1.1. Correlation of Quaternary Stratigraphic Nomenclatures Used in Previous Studies. CGS has adopted the nomenclature of Knudsen and others (2000) for Quaternary mapping in the San Francisco Bay Region.
ENGINEERING GEOLOGY As stated above, soils susceptible to liquefaction are mainly late Quaternary alluvial and fluvial sedimentary deposits and artificial fill. Deposits that contain saturated loose sandy and silty soils are most susceptible to liquefaction. Lithologic descriptions and soil test results reported in geotechnical borehole logs provide valuable information regarding subsurface geology, ground water levels, and the engineering characteristics of sedimentary deposits. Unfortunately, few borehole logs containing useful geotechnical information were found during the course of this

8 CALIFORNIA GEOLOGICAL SURVEY 2012
study, which is not surprising given the small combined area (less than 8 square kilometers) of mostly undeveloped land covered by Quaternary surficial deposits within the quadrangle.
Of particular value in liquefaction evaluations, when adequate borehole data are available, are logs that report the results of downhole standard penetration tests. Standard Penetration Tests (SPTs) provide a standardized measure of the penetration resistance of geologic deposits and are commonly used as an index of soil density. This in-field test consists of counting the number of blows required to drive a split-spoon sampler (1.375-inch inside diameter) one foot into the soil at the bottom of a borehole at chosen intervals while drilling. The driving force is provided by dropping a 140-pound hammer weight 30 inches. The SPT method is formally defined and specified by the American Society for Testing and Materials (ASTM) in test method D1586 (ASTM, 2004). Recorded blow counts for non-SPT geotechnical sampling where the sampler diameter, hammer weight or drop distance differs from that specified for an SPT (ASTM D1586), are converted to SPT-equivalent blow counts. The actual and converted SPT blow counts are normalized to a common-reference, effective-overburden pressure of 1 atmosphere (approximately 1 ton per square foot) and a hammer efficiency of 60 percent using a method described by Seed and Idriss (1982) and Seed and others (1985). This normalized blow count is referred to as (N1)60. CGS enters the (N1)60 values and other geotechnical information recorded in borehole logs into its database and applies it to computer generated quantitative analysis in order to evaluate liquefaction potential using a procedure developed by Seed and Idriss (1971). Ground Water
Saturation reduces the effective normal stress of near-surface sediment, thereby increasing the likelihood of earthquake-induced liquefaction (Youd, 1973). CGS compiles and interprets ground water data to identify areas characterized by, or anticipated to have in the future, near-surface saturated soils. For purposes of seismic hazard zonation, "near-surface" means at a depth less than 40 feet.
Natural hydrologic processes and human activities can cause ground water levels to fluctuate over time. Therefore, it is impossible to predict depths to saturated soils during future earthquakes. One method of addressing time-variable depth to saturated soils is to establish an anticipated high ground water level based on historical ground water data. In areas where ground water is either currently near-surface or could return to near-surface levels within a land-use planning interval of 50 years, CGS constructs regional contour maps that depict these levels. Plate 1.2 depicts areas characterized by present or anticipated shallow ground water within the Lick Observatory Quadrangle.
Ground water conditions are evaluated in the valley regions of areas subject to liquefaction zonation in order to estimate depths to saturated materials. These evaluations are based on first-encountered water noted in borehole and water well logs acquired from agencies such as the California Department of Water Resources, planning departments, and water districts. The depths to first-encountered unconfined ground water are plotted onto a map of the project area to constrain the estimate of historically shallowest ground water.
Although there are few water well and borehole logs available in the 8 square kilometers of flatland within the Lick Observatory Quadrangle, previous Seismic Hazard Zonation studies for liquefaction conducted by CGS in the Santa Clara Valley region indicate that ground water is currently at or near historical high levels (e.g. Clahan and others, 2000; Bott, 2004). Clahan and

SHZR 110 SEISMIC HAZARD ZONATION OF THE LICK OBSERVATORY QUADRANGLE
9
others (2000) indicated that most of Evergreen Valley, whose southern end extends into the Lick Observatory Quadrangle, is characterized by shallow ground water (<40 feet). Historical ground water levels in the alluviated stream valley and lowland areas within the foothills of the Diablo Range, such as Halls and San Felipe valleys, are commonly shallow, often within 5 to 10 feet of the surface during the wet seasons. Shallow ground water conditions commonly exist in these types of depositional environments because they tend to trap and accumulate heavy runoff and near-surface ground water derived from surrounding highlands.
PART II: LIQUEFACTION HAZARD ASSESSMENT
MAPPING TECHNIQUES Liquefaction may occur in water-saturated sediment during moderate to great earthquakes. When this occurs, sediment loses strength and may fail, causing damage to buildings, bridges, and other structures. Many methods for mapping liquefaction hazard have been proposed. Youd (1991) highlights the principal developments and notes some of the widely used criteria. Youd and Perkins (1978) demonstrate the use of geologic criteria as a qualitative characterization of liquefaction susceptibility and introduce the mapping technique of combining a liquefaction susceptibility map and a liquefaction opportunity map to produce a liquefaction potential map. Liquefaction susceptibility is a function of the capacity of sediment to resist liquefaction, whereas liquefaction opportunity is a function of potential seismic ground shaking intensity.
The method applied in this study to evaluate liquefaction potential is similar to that Tinsley and others (1985) used to map liquefaction hazards in the Los Angeles region. These investigators, in turn, applied a combination of the techniques developed by Seed and others (1983) and Youd and Perkins (1978). CGS’s method combines geotechnical analyses, geologic and hydrologic mapping, and probabilistic earthquake shaking estimates employing criteria adopted by the SMGB (CGS, 2004).
LIQUEFACTION SUSCEPTIBILITY Liquefaction susceptibility reflects the relative resistance of a soil to loss of strength when subjected to ground shaking. Physical properties of soil such as sediment grain-size distribution, compaction, cementation, saturation, and depth from the surface govern the degree of resistance to liquefaction. Some of these properties can be correlated to a deposit’s geologic age and environment of deposition. With increasing age, relative density may increase through cementation of the particles or compaction caused by the weight of the overlying sediment.
Grain-size characteristics of a soil also influence susceptibility to liquefaction. Sand is more susceptible than silt or gravel, although silt of low plasticity is treated as liquefiable in this investigation. Cohesive soils generally are not considered susceptible to liquefaction. Such soils may be vulnerable to strength loss with remolding and represent a hazard that is not specifically addressed in this investigation. Soil characteristics that result in higher measured penetration resistances generally indicate lower liquefaction susceptibility. In summary, soils that lack resistance (susceptible soils) typically are saturated, loose, and granular. Soils resistant to liquefaction include all soil types that are dry, cohesive, or sufficiently dense.
10 CALIFORNIA GEOLOGICAL SURVEY 2012
CGS’s inventory of areas containing soils susceptible to liquefaction begins with evaluation of geologic maps and historical occurrences, cross-sections, geotechnical test data, geomorphology, and groundwater hydrology. Soil properties and soil conditions such as type, age, texture, color, and consistency, along with historical depths to groundwater are used to identify, characterize, and correlate susceptible soils. Because Quaternary geologic mapping is based on observable similarities between soil units, liquefaction susceptibility maps typically are often similar to Quaternary geologic maps, depending on local groundwater levels. In the general area of Santa Clara Valley, most Holocene materials in areas where ground-water levels are within 30 feet of the ground surface have susceptibility assignments of high (H) to very high (VH). Such Holocene deposits in the Lick Observatory Quadrangle include stream channel (Qhc), stream terrace (Qhty, Qht, Qt), alluvium (Qha), some alluvial fan (Qhf) along San Felipe Creek, and some basin (Qhb) deposits within major drainages. Late Pleistocene to Holocene alluvial fan deposits (Qf) and Holocene alluvial fan deposits (Qhf) developed along the base of Diablo Range foothills are both assigned a low susceptibility in the Lick Observatory Quadrangle because these deposits, as indicated in Table 1.3 of Clahan and others (2000) are characterized by high clay. All Pleistocene and older deposits (Qoa, Qof) within the study area are assigned to the low (L) susceptibility category.
GROUND SHAKING OPPORTUNITY Ground shaking opportunity is a calculated measure of the intensity and duration of strong ground motion normally expressed in terms of peak horizontal ground acceleration (PGA). Ground motion calculations used by CGS exclusively for regional liquefaction zonation assessments are currently based on the Probabilistic Seismic Hazard Assessment (PSHA) Model developed by the USGS for the 2008 Update of the United States National Seismic Hazard Maps (Petersen and others, 2008). The model is set to calculate ground motion hazard at a 10 percent in 50 years exceedance level. CGS calculations incorporate additional programming that modifies probabilistic PGA by a scaling factor that is a function of magnitude and is weighted by each earthquake’s estimated ground shaking contribution. The result is a magnitude-weighted, pseudo-PGA that CGS refers to as Liquefaction Opportunity (LOP). This approach provides an improved estimate of liquefaction hazard in a probabilistic sense, ensuring that large, infrequent, distant earthquakes, as well as smaller, more frequent, nearby events are appropriately accounted for (Real and others, 2000). These firm-rock LOP values are adjusted to alluvium site conditions (Site Class D) by applying the NEHRP corrections (FEMA, 1994; Table 3.1), and are then used to calculate cyclic stress ratio (CSR), the seismic load imposed on a soil column at a particular site.
LIQUEFACTION ANALYSIS As mentioned in the Engineering Geology section of this report, few borehole logs containing useful geotechnical information were found during the course of this study. However, when borehole logs with adequate geotechnical soil-test data are available, CGS performs quantitative analysis of geotechnical data to evaluate liquefaction potential using the Seed-Idriss Simplified Procedure (Seed and Idriss, 1971; Seed and others, 1983; National Research Council, 1985; Seed and others, 1985; Seed and Harder, 1990; Youd and Idriss, 1997; Youd and others, 2001; Idriss
SHZR 110 SEISMIC HAZARD ZONATION OF THE LICK OBSERVATORY QUADRANGLE
11
and Boulanger, 2008). The procedure first calculates the resistance to liquefaction of each soil layer penetrated at a test-drilling site, expressed in terms of cyclic resistance ratio (CRR). The calculations are based on standard penetration test (SPT) results, groundwater level, soil density, grain-size analysis, moisture content, soil type, and sample depth. The procedure then estimates the factor of safety relative to liquefaction hazard for each of the soil layers logged at the site by dividing their calculated CRR by the LOP-derived CSR described in the previous section.
CGS uses a factor of safety (FS) of 1.0 or less, where CSR equals or exceeds CRR, to indicate the presence of potentially liquefiable soil layers. The liquefaction analysis program calculates an FS for each geotechnical sample where blow counts were collected. Typically, multiple samples are collected for each borehole. The program then independently calculates an FS for each non-clay layer that includes at least one penetration test using the minimum (N1)60 value for that layer. The minimum FS value of the layers penetrated by the borehole is used to determine the liquefaction potential for each borehole location. The reliability of FS values varies according to the quality of the geotechnical data. In addition to FS, consideration is given to the proximity to stream channels, which accounts in a general way for factors such as sloping ground or free face that contribute to severity of liquefaction-related ground deformation.
The Seed-Idriss Simplified Procedure for liquefaction evaluation was developed primarily for clean sand and silty sand. As described above, results depend greatly on accurate evaluation of in-situ soil density as measured by the number of soil penetration blow counts using an SPT sampler. However, many of the Holocene alluvial deposits in the study area contain a significant amount of gravel. In the past, gravelly soils were considered not to be susceptible to liquefaction because it was presumed that the high permeability of these soils would allow the dissipation of pore pressures before liquefaction could occur. However, liquefaction in gravelly soils has been observed during earthquakes, and recent laboratory studies have shown that gravelly soils are susceptible to liquefaction (Ishihara, 1985; Harder and Seed, 1986; Budiman and Mohammadi, 1995; Evans and Zhou, 1995; and Sy and others, 1995). SPT-derived density measurements in gravelly soils are unreliable and generally too high. They are likely to lead to overestimation of the density of the soil and, therefore, result in an underestimation of the liquefaction susceptibility. To identify potentially liquefiable units where the N values appear to have been affected by gravel content, correlations were made with boreholes in the same unit where the N values do not appear to have been affected by gravel content.
ZONATION CRITERIA: LIQUEFACTION Areas underlain by materials susceptible to liquefaction during an earthquake are included in liquefaction zones using criteria developed by the Seismic Hazards Mapping Act Advisory Committee and adopted by the SMGB (CGS, 2004). Under those guideline criteria, liquefaction zones are areas meeting one or more of the following:
1) Areas known to have experienced liquefaction during historical earthquakes
2) All areas of uncompacted artificial fill that are saturated, nearly saturated, or may be expected to become saturated
3) Areas where sufficient existing geotechnical data and analyses indicate that the soils are potentially liquefiable
12 CALIFORNIA GEOLOGICAL SURVEY 2012
4) Areas where existing subsurface data are not sufficient for quantitative evaluation of liquefaction hazard. Within such areas, zones may be delineated by geologic criteria as follows:
a) Areas containing soil deposits of late Holocene age (current river channels and their historic floodplains, marshes and estuaries), where the M7.5-weighted peak acceleration that has a 10 percent probability of being exceeded in 50 years is greater than or equal to 0.10 g and the anticipated depth to saturated soil is less than 40 feet; or
b) Areas containing soil deposits of Holocene age (less than 11,000 years), where the M7.5-weighted peak acceleration that has a 10 percent probability of being exceeded in 50 years is greater than or equal to 0.20 g and the anticipated depth to saturated soil is less than 30 feet; or
c) Areas containing soil deposits of latest Pleistocene age (11,000 to 15,000 years), where the M7.5-weighted peak acceleration that has a 10 percent probability of being exceeded in 50 years is greater than or equal to 0.30 g and the anticipated depth to saturated soil is less than 20 feet.
Application of the above criteria allows compilation of Zones of Required Investigation for liquefaction hazard, which are useful for preliminary evaluations, general land-use planning and delineation of special studies zones (Youd, 1991).
DELINEATION OF SEISMIC HAZARD ZONES: LIQUEFACTION Upon completion of a liquefaction hazard evaluation within a project quadrangle, CGS applies the above criteria to its findings in order to delineate Zones of Required Investigation. Following is a description of the criteria-based factors that governed the construction of the Seismic Hazard Zone map for the Lick Observatory Quadrangle.
Areas of Past Liquefaction Documented observations of historical liquefaction are not recorded for the area encompassed by the Lick Observatory Quadrangle, nor has evidence of paleoseismic liquefaction been reported.
Artificial Fills Artificial fill areas in the Lick Observatory Quadrangle large enough to show at the scale of project mapping (1:24,000) consist of probable non-engineered fill material used for construction of several embankments around a small, shallow reservoir in Halls Valley and along a short segment of a nearby ridge top, unpaved road. Non-engineered fills are commonly loose and uncompacted, and the material varies in size and type. The reservoir embankment is included within a Zone of Required Investigation.
Areas with Sufficient Existing Geotechnical Data Borehole logs that included penetration and associated geotechnical test data required to quantitatively analyze liquefaction potential of young Quaternary sedimentary deposits were not found during the data collection phase of this study. However, CGS did collect several useful logs of borings located on older Quaternary deposits that indicate low potential for liquefaction, which is characteristic of Pleistocene sediments.
SHZR 110 SEISMIC HAZARD ZONATION OF THE LICK OBSERVATORY QUADRANGLE
13
Areas with Insufficient Existing Geotechnical Data Quaternary sedimentary deposits mapped in the Lick Observatory Quadrangle were evaluated for seismic hazard zonation on the basis of geologic factors, few boring logs, extrapolation of known soil conditions in adjacent areas, and limited fieldwork. Based on the evaluation, about 3.4 square kilometers (1.3 square miles) of the approximately 8 square kilometers (3 square miles) of combined flatland in the quadrangle are designated Zones of Required Investigation. The zones encompass most of Halls Valley (119 hectare; 293 acres), San Felipe Valley (187 hectare; 462 acres), and several segments of land within and adjacent to local creeks. The remaining 5 square kilometers (~2 square miles) or so of flatland not included in the zones are clay-rich or older alluvial fan deposits along the southeastern margin of Evergreen Valley.
ACKNOWLEDGMENTS The California Geological Survey is grateful for the cooperation of the Santa Clara County Office of Development, the Santa Clara County Office of Planning, and the Santa Clara Valley Water District, especially for the assistance provided by Angelina Contreras and James Baker in the collection of borehole data. The author greatly appreciates GIS and database support provided by CGS staff members Diane Vaughan, Teri McGuire, Barbara Wanish, and Bob Moskovitz and the data collection efforts of my colleague Jackie Bott. Special thanks to Rui Chen, CGS, and Stephen Harmsen, USGS, for developing the 2008 model ground motion maps for this study.
REFERENCES American Society for Testing and Materials, 2004, Standard test method for penetration test and
split-barrel sampling of soils, Test Method D1586-99, in Annual Book of ASTM Standards, v. 4.08.
Bott, J.D.J., 2004, Liquefaction Zones in the Morgan Hill 7.5-Minute Quadrangle, Section 1 of Seismic Hazard Zone report for the Morgan Hill 7.5-Minute Quadrangle, Santa Clara County, California: California Geological Survey Seismic Hazard Zone Report 096, p. 3-28, 2 plates.
Budiman, J.S., and Mohammadi, J., 1995, Effect of large inclusions on liquefaction of sands, in Evans, M.D., and Fragaszy, R.J., editors, Static and Dynamic properties of Gravelly Soils: American Society of Civil Engineers Geotechnical Special Publication no. 56, p. 48-63.
California Geological Survey, 2008, Guidelines for evaluating and mitigating seismic hazards in California: California Geological Survey Special Publication 117a, 98 p. Available on-line at: http://www.conservation.ca.gov/cgs/shzp/webdocs/sp117.pdf.
California Geological Survey, 2004, Recommended criteria for delineating seismic hazard zones in California: California Geological Survey Special Publication 118, 12 p. Available on-line at: http://www.conservation.ca.gov/cgs/shzp/webdocs/sp118_revised.pdf.
14 CALIFORNIA GEOLOGICAL SURVEY 2012
Carpenter, D. W., Sweeney, J.J., Kasameyer, P.W., Purkland, N. R., Knauss, K.G., and Shlemon, R.J., 1984, Geology of the Lawrence Livermore national laboratory site and adjacent area: Springfield, Virginia, National Technical Information Service, 94 p.
Clahan, K. B., Mattison, E., and Knudsen, K.L., 2001, Liquefaction Zones in the San Jose East 7.5-Minute Quadrangle, Section 1 of Seismic Hazard Zone report for the San Jose East 7.5-Minute Quadrangle, Santa Clara County, California: California Geological Survey Seismic Hazard Zone Report 044, p. 3-24, 2 plates.
Evans, M.D., and Zhou, S., 1995, Liquefaction behaviour of sand-gravel composites: American Society of Civil Engineers, Journal of Geotechnical Engineering, v. 121, no. 3, p. 287-298.
FEMA, 1994, NEHRP Recommended Provisions for Seismic Regulations for New Buildings and Other Structures: Washington, D.C., FEMA 222A.
Harder, L.F., and Seed, H.B., 1986, Determination of penetration resistance for coarse-grained soils using the Becker hammer drill: University of California at Berkeley, College of Engineering, Earthquake Engineering Research Center, report no. UCB/EERC-86/06, 126 p.
Helley, E.J., Graymer, R.W., Phelps, G.A., Showalter, P.K. and Wentworth, C.M., 1994, Preliminary Quaternary geologic maps of Santa Clara Valley, Santa Clara, Alameda, and San Mateo Counties, California, a digital database: U.S. Geological Survey Open-File Report 94-231, 8 p.
Helley, E.J., LaJoie, K.R., Spangle, W.E. and Blair, M.L., 1979, Flatland deposits of the San Francisco Bay region, California—their geology and engineering properties, and their importance to comprehensive planning: U.S. Geological Survey Professional Paper 943, scale 1:125,000.
Idriss, I.M. and Boulanger, R.W., 2008, Soil liquefaction during earthquakes: Monograph Series, MNO-12, Earthquake Engineering Research Institute, Berkeley, California, 237p.
Ishihara, K., 1985, Stability of natural deposits during earthquakes, in Proceedings of the Eleventh International Conference on Soil Mechanics and Foundation Engineering, San Francisco, v. 1, p. 321-376.
Knudsen, K.L., Sowers, J.M., Witter, R.C., Wentworth, C.M., and Helley, E.J., 2000, Description of mapping of quaternary deposits and liquefaction susceptibility, nine-county San Francisco Bay region, California: U.S. Geological Survey Open-File Report 00-444.
McLaughlin, R. J., Clark, J.C., Brabb, E. E., Helley, E. J. and Colón, C. J., 2001, Geologic maps and structure sections of the southwestern Santa Clara Valley and southern Santa Cruz Mountains, Santa Clara and Santa Cruz counties, California: U.S. Geological Survey Miscellaneous Field Studies MF-2373.
National Research Council, 1985, Liquefaction of soils during earthquakes: National Research Council Special Publication, Committee on Earthquake Engineering, National Academy Press, Washington, D.C., 240 p.
Page, B.M., 1999, Geology of the Lick Observatory Quadrangle, California: International Geology Review, by V.H. Winston & Son, Inc., Vol. 41, p.355-367. Scale: 1:24,000.
SHZR 110 SEISMIC HAZARD ZONATION OF THE LICK OBSERVATORY QUADRANGLE
15
Petersen, M.D., Frankel, A.D., Harmsen, S.C., Mueller, C.S., Haller, K.M., Wheeler, R.L., Wesson, R.L., Zeng, Y., Boyd, O.S., Perkins, D.M., Luco, N., Field, E.H., Wills, C.J., and Rukstales, K.S., 2008, Documentation for the 2008 update of the United States National Seismic Hazard Maps: U.S. Geol. Survey Open-File Report 2008-1128, 60p.
Real, C.R., Petersen, M.D., McCrink, T.P., and Cramer, C.H., 2000, Seismic Hazard Deaggregation in zoning earthquake-induced ground failures in southern California: Proceedings of the Sixth International Conference on Seismic Zonation, November 12-15, Palm Springs, California, EERI, Oakland, CA.
Seed, H.B., and Idriss, I.M., 1971, Simplified procedure for evaluating soil liquefaction potential: Journal of the Soil Mechanics and Foundations Division of ASCE, v. 97: SM9, p. 1,249-1,273.
Seed, H.B., and Idriss, I.M., 1982, Ground motions and soil liquefaction during earthquakes: Monograph Series, MNO-5, Earthquake Engineering Research Institute, Berkeley, California, 134 p.
Seed, H.B., Idriss, I.M., and Arango, Ignacio, 1983, Evaluation of liquefaction potential using field performance data: Journal of Geotechnical Engineering, v. 109, no. 3, p. 458-482.
Seed, H.B., Tokimatsu, K., Harder, L.F., and Chung, R.M., 1985, Influence of SPT procedures in soil liquefaction resistance evaluations: Journal of Geotechnical Engineering, ASCE, v. 111, no. 12, p. 1,425-1,445.
Seed, R.B., and Harder, L.F., 1990, SPT-based analysis of cyclic pore pressure generation and undrained residual strength: Proceedings of the H. Bolton Seed Memorial Symposium, v. 2, p. 351-376.
Smith, T.C., 1996, Preliminary maps of seismic hazard zones and draft guidelines for evaluating and mitigating seismic hazards: California Geology, v. 49, no. 6, p. 147-150.
Southern California Earthquake Center, 2002, Recommended procedures for implementation of DMG Special Publication 117 guidelines for analyzing and mitigating liquefaction in California: Southern California Earthquake Center, University of Southern California, 63 p.
Sy, A., Campanella, R.G., and Stewart, R.A., 1995, BPT-SPT correlations for evaluations of liquefaction resistance in gravelly soils, in Evans, M.D., and Fragaszy, R.J., editors, Static and Dynamic Properties of Gravelly Soils: American Society of Civil Engineers Geotechnical Special Publication no. 56, p. 1-19.
Tinsley, J.C., Youd, T.L., Perkins, D.M., and Chen, A.T.F., 1985, Evaluating liquefaction potential, in Ziony, J.I., editor, Evaluating earthquake hazards in the Los Angeles region — An earth science perspective: U.S. Geological Survey Professional Paper 1360, p. 263-316.
Wentworth, C.M., Blake, M.C., Jr., McLaughlin, R.J. and Graymer, R.W., 1999, Preliminary geologic description of the San Jose 30 X 60 Minute Quadrangle, California: U. S. Geological Survey Open File Report 98-795, scale 1:100,000.
16 CALIFORNIA GEOLOGICAL SURVEY 2012
Witter, R.C., K.I. Kelson, A.D. Barron, and S.T. Sundermann, 2003, Map of active fault traces, geomorphic features and Quaternary surficial deposits along the central Calaveras fault, Santa Clara County, California: U.S. Geological Survey, National Earthquake Hazards Reduction Program Final Technical Report, [Grant award number 01HQGR0212], 32 p.
Youd, T.L., 1973, Liquefaction, flow and associated ground failure: U.S. Geological Survey Circular 688, 12 p.
Youd, T.L., 1987, Ground-failure damage and liquefaction near Morgan Hill: in, Hoose, S.N., editor, The Morgan Hill, California, Earthquake of April 24, 1984: U.S. Geological Survey Bulletin 1639, p. 89-92.
Youd, T.L., 1991, Mapping of earthquake-induced liquefaction for seismic zonation: Earthquake Engineering Research Institute, Proceedings, Fourth International Conference on Seismic Zonation, v. 1, p. 111-138.
Youd, T.L., and Idriss, I.M., 1997, editors, Proceedings of the NCEER workshop on evaluation of liquefaction resistance of soils: National Center for Earthquake Engineering Research Technical Report NCEER-97-0022, 276 p.
Youd, T.L., Idriss, I.M., Andrus, R.D., Arango, I., Castro, G., Christian, J.T., Dobry, R., Finn, W.D.L., Harder, L.F. Jr., Hynes, M.E., Ishihara, K., Koester, J.P., Liao, S.S.C., Marcusson, W.F., Martin, G.R., Mitchell, J.K., Moriwaki, Y., Power, M.S., Robertson, P.K., Seed, R.B., and Stokoe, K.H., 2001, Liquefaction resistance of soils; Summary report from the 1996 NCEER and 1998 NCEER/NSF workshops on evaluation of liquefaction resistance of soils: Journal of Geotechnical and Geoenvironmental Engineering, October 2001, p. 817-833.
Youd, T.L., and Perkins, D.M., 1978, Mapping liquefaction-induced ground failure potential: Journal of Geotechnical Engineering, v. 104, p. 433-446.

SHZR 110 SEISMIC HAZARD ZONATION OF THE LICK OBSERVATORY QUADRANGLE
17
SECTION 2: EVALUATION REPORT FOR EARTHQUAKE-INDUCED LANDSLIDE HAZARD
in the
LICK OBSERVATORY 7.5-MINUTE QUADRANGLE, SANTA CLARA COUNTY, CALIFORNIA
by
Michael A. Siva P.G. 4331, C.E.G. 2444
Wayne D. Haydon P.G. 4747, C.E.G. 1740
and
Timothy P. McCrink P.G. 4466, C.E.G 1549
DEPARTMENT OF CONSERVATION
CALIFORNIA GEOLOGICAL SURVEY
INTRODUCTION Purpose
The Seismic Hazards Mapping Act of 1990 (Public Resources Code, Chapter 7.8, Division 2) directs the California State Geologist to compile maps that identify Seismic Hazard Zones consistent with requirements and priorities established by the California State Mining and Geology Board (SMGB) (California Geological Survey, 2004). The text of this report is available online at: http://www.conservation.ca.gov/cgs/shzp/webdocs/sp118_revised.pdf. The Act requires that site-specific geotechnical investigations be performed for most urban development projects situated within seismic hazard zones before lead agencies can issue the building permit. The Act also requires sellers of real property within these zones to disclose that fact at the time such property is sold. Evaluation and mitigation of seismic hazards are to be conducted under guidelines adopted by the California SMGB (California Geological Survey, 2008). The text of this report is online at: http://www.conservation.ca.gov/cgs/shzp/webdocs/sp117.pdf.
Following the release of the SMGB Guidelines, local government agencies in the Los Angeles metropolitan region sought more definitive guidance in the review of geotechnical investigations addressing liquefaction hazard. The agencies made their request through the Geotechnical Engineering Group of the Los Angeles Section of the American Society of Civil Engineers (ASCE). This group convened an implementation committee under the auspices of the Southern California Earthquake Center (SCEC). The committee, which consisted of practicing geotechnical engineers and engineering geologists, released an overview of the practice of
18 CALIFORNIA GEOLOGICAL SURVEY 2012
liquefaction analysis, evaluation, and mitigation techniques (Southern California Earthquake Center, 2002). This text is also online at: http://www.scec.org/
This report is one of a series that summarizes the preparation of seismic hazard zone maps within the state (Smith, 1996). This particular part of the report, Section 2, summarizes seismic hazard zone mapping for earthquake-induced landslides in the Lick Observatory 7.5-minute Quadrangle. Section 1, which addresses liquefaction hazard, and Section 3, which addresses earthquake-shaking hazard, completes the report. Additional information on seismic hazard zone mapping in California can be accessed online at: http://www.conservation.ca.gov/cgs/shzp/. Background
Landslides triggered by earthquakes historically have been a significant cause of earthquake damage. In California, large earthquakes such as the 1971 San Fernando, 1989 Loma Prieta, and 1994 Northridge earthquakes triggered landslides that were responsible for destroying or damaging numerous structures, blocking major transportation corridors, and damaging lifeline infrastructure. Areas that are most susceptible to earthquake-induced landslides are steep slopes in poorly cemented or highly fractured rocks, sloped areas underlain by loose, weak soils, and areas on or adjacent to existing landslide deposits. These geologic and terrain conditions exist in many parts of California, including numerous hillside areas that have been developed or are likely to be developed in the future. The opportunity for strong earthquake ground shaking is high in many parts of California because of the presence of numerous active faults. The combination of these factors constitutes a significant seismic hazard throughout much of California, including the upland areas within the Lick Observatory Quadrangle. Methodology
The delineation of earthquake-induced landslide hazard zones presented in this report is based on the best available terrain, geologic, geotechnical, and seismological data. If unavailable or significantly outdated, new forms of these data were compiled or generated specifically for this project. The following were collected or generated for this evaluation:
• Digital terrain data were collected or generated to provide an up-to-date representation of slope gradient and slope aspect in the study area.
• Geologic mapping was compiled to provide an accurate representation of the spatial distribution of geologic materials in the study area. In addition, a map of existing landslides, whether or not triggered by earthquakes, was prepared.
• Geotechnical laboratory test data were collected and statistically analyzed to quantitatively characterize the strength properties and dynamic slope stability of geologic materials in the study area.
• Seismological data in the form of CGS probabilistic shaking maps and catalogs of strong-motion records were compiled and used to characterize future earthquake shaking within the mapped area.
The data collected for this evaluation were processed into a series of GIS layers using commercially available software. A slope stability analysis was performed using the Newmark method (Newmark, 1965), in order to generate a map showing landslide hazard potential. The earthquake-induced landslide hazard zone was derived from the landslide hazard potential map
SHZR 110 SEISMIC HAZARD ZONATION OF THE LICK OBSERVATORY QUADRANGLE
19
according to criteria developed in a CGS pilot study (McCrink and Real, 1996; McCrink, 2001) and subsequently adopted by the SMGB (CGS, 2004). Scope and Limitations
The methodology used to make this map is based on earthquake ground-shaking estimates, geologic material-strength characteristics and slope gradient. These data are gathered from a variety of outside sources. Although the selection of data used in this evaluation was rigorous, the quality of the data is variable. The State of California and the Department of Conservation make no representations or warranties regarding the accuracy of the data gathered from outside sources.
Earthquake-induced landslide zone maps are intended to prompt more detailed, site-specific geotechnical investigations as required by the Act. As such, these zone maps identify areas where the potential for earthquake-induced landslides is relatively high. Due to limitations in methodology, it should be noted that these zone maps do not necessarily capture all potential earthquake-induced landslide hazards. Earthquake-induced ground failures that are not addressed by this map include those associated with ridge-top spreading and shattered ridges. It should also be noted that no attempt has been made to map potential run-out areas of triggered landslides. It is possible that run out areas extend beyond the zone boundaries. The potential for ground failure resulting from liquefaction-induced lateral spreading of alluvial materials, considered by some to be a form of landsliding, is not specifically addressed by the earthquake-induced landslide zone or this report.
This section of the report is presented in two parts. Part I addresses the natural setting of the area covered by the Lick Observatory Quadrangle, namely the physiographic, geologic and engineering geology conditions. Part II covers the preparation of landslide hazard potential and landslide zone maps.
PART I: GEOGRAPHIC AND GEOLOGIC SETTING
PHYSIOGRAPHY Location
The Lick Observatory Quadrangle covers an area of approximately 155 square kilometers (60 square miles) in east-central Santa Clara County. The map area is within the central portion of the Coast Ranges Geomorphic Province of California. The center of the quadrangle is about 97 kilometers (60 miles) southeast of the City of San Francisco and about 24 kilometers (15 miles) east of the City of San Jose. Small fingers of the City of San Jose are within the southwest part of the map area and the remainder of the area is unincorporated Santa Clara County land. This evaluation report, and the accompanying Seismic Hazard Map that it describes, address only the southwest half of the quadrangle. Approximately 78 square kilometers (30 square miles) of area covering the northeast half of the quadrangle was not evaluated for zoning because of the low likelihood of significant development in the near future.
The study area is dominated by rugged, mountainous terrain of the northwest-trending Diablo Range that occupies the central region of California’s Coast Ranges Geomorphic Province. Less
20 CALIFORNIA GEOLOGICAL SURVEY 2012
than 8 square kilometers (~3 square miles) of flatland exist in the entire quadrangle, most of which is found in Halls Valley, San Felipe Valley, and two small embayments of Evergreen Valley, which is a sub-basin of the Santa Clara Valley. Major perennial streams within the quadrangle include San Felipe, Thomson, Sulfur, and Smith Creeks, along with Arroyo Aguague. Land Use
Most of the Lick Observatory Quadrangle is sparsely developed mountainous terrain. Current land uses include limited suburban residential developments, a golf course, farm and ranch land, parkland, Halls Valley Lake (a private reservoir), and the Lick Observatory facility located on Mt. Hamilton. Residential development is primarily confined to the foothills and valleys along the western edge of the map. Joseph D. Grant County Park occupies the north-central portion of the quadrangle.
The primary transportation route is Mt. Hamilton Road (State Highway 130), which traverses the northern half of the quadrangle from the northwest to Lick Observatory on Mt. Hamilton, where it then continues to the east as San Antonio Valley Road. Quimby Road joins Mt. Hamilton Road from the southwest in Joseph D. Grant County Park. San Felipe Road traverses the southwest corner of the quadrangle, and also provides access north into the San Felipe Valley. Access to rural areas within the quadrangle is primarily by unpaved and private roads. Topography
The Lick Observatory Quadrangle is characterized by mountainous and hilly terrain of the southwestern flank of the Diablo Range. Major topographic features in the map area include steep and rugged mountains in the northeast near Mt. Hamilton and Lick Observatory, northwest-trending, steeply to moderately sloping ridges and foothills in the west and southwest, and the intermountain valleys, and Halls and San Felipe valleys, which lie along the Calaveras Fault zone and divide the quadrangle diagonally from northwest to southeast. The southern end of Evergreen Valley, an extension of the Santa Clara Valley, lies along the western edge of the map. Elevations in the map area range from slightly less than 159 meters (520 feet) above mean sea level in Evergreen Valley, to a little over 1332 meters (4,370 feet) on Copernicus Peak, in the northeastern quadrant of the map.
Moderately sloping foothills in the western map area, between Masters Hill and Mt. Misery, are cut by numerous streams that flow westward into Santa Clara Valley. In the southwestern corner of the map, Thompson Creek and Silver Creek flow northwest through Evergreen Valley and Silver Creek Valley into Santa Clara Valley. In the northwest, Arroyo Aguague emanates from slopes north and east of Halls Valley and flows to the northwest beyond the map boundary, toward Upper Penitencia Creek and the Santa Clara Valley. Halls Valley drains into San Felipe Creek, which then flows southeastward through the San Felipe Valley and beyond the southern map boundary. Paralleling and west of San Felipe Creek, Las Animas Creek flows southeast out of the mapped area and eventually into Anderson Reservoir. In the northeast quarter of the map area near Mt. Hamilton, deeply incised streams from the mountainous terrain flow northward out of the map area into Arroyo Hondo, via Smith Creek and Isabel Creek.
SHZR 110 SEISMIC HAZARD ZONATION OF THE LICK OBSERVATORY QUADRANGLE
21
GEOLOGY The primary source of bedrock geologic mapping used in this slope stability evaluation was the digital geologic map database of Wentworth and others (1999), which covers the San Jose 30 by 60 minute Quadrangle and includes the Lick Observatory 7.5-minute Quadrangle. Sources of Quaternary surficial geology include Knudsen and others (2000), and Witter and others (2003). Quaternary surficial materials are discussed in more detail in Section 1 of this report and are summarized on Plate 1.1.
CGS geologists merged the Quaternary and bedrock geologic maps to prepare a map suitable for this study. Contacts between surficial and bedrock units were modified in some areas to resolve differences between the maps. Geologic reconnaissance was performed to assist in adjusting contacts and to review the lithology and structure of geologic units within the Lick Observatory Quadrangle. In addition, the relationship of the rock units to the development and abundance of landslides was noted. Bedrock Units
The geologic maps of Wentworth and others (1999) and McLaughlin and others (2001) identify a number of distinct stratigraphic assemblages that are exposed in fault-bounded, bedrock structural blocks in Santa Clara County. The concept of individual fault-bounded stratigraphic assemblages in the Bay Area was introduced by Jones and Curtis (1991) and further defined by Graymer and others (1994). Individual stratigraphic assemblages are considered to have originated in distinct and separated depositional basins, or within different parts of larger basins, which were later juxtaposed against one another by displacements on Tertiary strike-slip and dip-slip faults. Each fault-bounded stratigraphic assemblage contrasts with its neighbors in depositional and deformational history. Mapping individual stratigraphic assemblages in discrete bedrock structural blocks has been applied to the recent mapping compiled by the U.S. Geological Survey in the Bay Area (for example, Wentworth and others, 1999; McLaughlin and others, 2001).
Of the eight structural blocks identified by Wentworth and others (1999), four are exposed within the Lick Observatory Quadrangle: the Silver Creek Block, the Alum Rock Block, the Coyote Block, and the Mt. Hamilton Block. A fifth block, the New Almaden Block, underlies the Santa Clara Valley and portions of the southwestern flank of the Diablo Range, and is either beneath the other exposed blocks within the quadrangle or is outside the mapped area. The Silver Creek, Alum Rock, and Coyote, blocks are exposed on the southwestern half of the map while the Mount Hamilton block is exposed on the northeastern side of the quadrangle. The following sections describe bedrock units in each of the structural blocks that extend into the Lick Observatory Quadrangle. Discussion of the blocks proceeds from southwest to northeast. Unconsolidated Quaternary deposits overlie the bedrock units on the floor of the Santa Clara Valley and in smaller alluvial areas in Hall’s Valley and San Felipe Valley, and also on some hillside areas. Quaternary geologic units are briefly described here, and are discussed in more detail in Section 1, Liquefaction Evaluation Report.
Silver Creek Block
The Silver Creek Block is exposed in the very southwest corner of the mapped area. Basement rocks of the Silver Creek Block consist of Franciscan melange (fm), and serpentinite of the
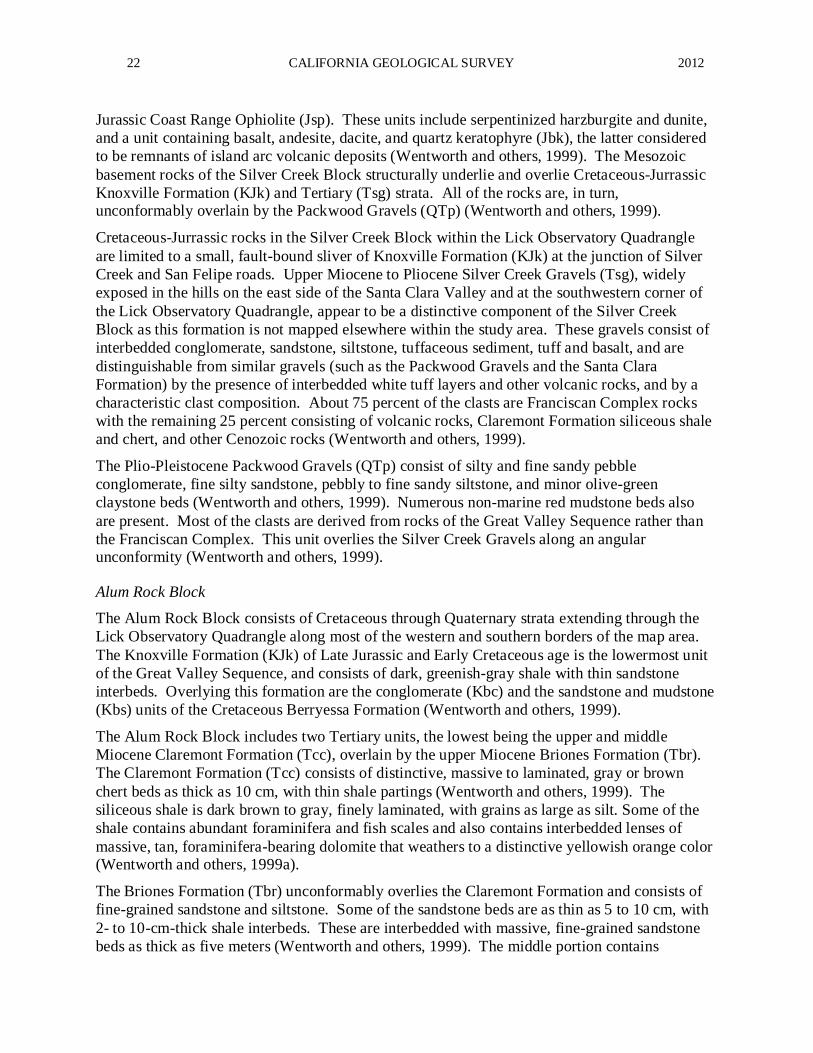
22 CALIFORNIA GEOLOGICAL SURVEY 2012
Jurassic Coast Range Ophiolite (Jsp). These units include serpentinized harzburgite and dunite, and a unit containing basalt, andesite, dacite, and quartz keratophyre (Jbk), the latter considered to be remnants of island arc volcanic deposits (Wentworth and others, 1999). The Mesozoic basement rocks of the Silver Creek Block structurally underlie and overlie Cretaceous-Jurrassic Knoxville Formation (KJk) and Tertiary (Tsg) strata. All of the rocks are, in turn, unconformably overlain by the Packwood Gravels (QTp) (Wentworth and others, 1999).
Cretaceous-Jurrassic rocks in the Silver Creek Block within the Lick Observatory Quadrangle are limited to a small, fault-bound sliver of Knoxville Formation (KJk) at the junction of Silver Creek and San Felipe roads. Upper Miocene to Pliocene Silver Creek Gravels (Tsg), widely exposed in the hills on the east side of the Santa Clara Valley and at the southwestern corner of the Lick Observatory Quadrangle, appear to be a distinctive component of the Silver Creek Block as this formation is not mapped elsewhere within the study area. These gravels consist of interbedded conglomerate, sandstone, siltstone, tuffaceous sediment, tuff and basalt, and are distinguishable from similar gravels (such as the Packwood Gravels and the Santa Clara Formation) by the presence of interbedded white tuff layers and other volcanic rocks, and by a characteristic clast composition. About 75 percent of the clasts are Franciscan Complex rocks with the remaining 25 percent consisting of volcanic rocks, Claremont Formation siliceous shale and chert, and other Cenozoic rocks (Wentworth and others, 1999).
The Plio-Pleistocene Packwood Gravels (QTp) consist of silty and fine sandy pebble conglomerate, fine silty sandstone, pebbly to fine sandy siltstone, and minor olive-green claystone beds (Wentworth and others, 1999). Numerous non-marine red mudstone beds also are present. Most of the clasts are derived from rocks of the Great Valley Sequence rather than the Franciscan Complex. This unit overlies the Silver Creek Gravels along an angular unconformity (Wentworth and others, 1999).
Alum Rock Block
The Alum Rock Block consists of Cretaceous through Quaternary strata extending through the Lick Observatory Quadrangle along most of the western and southern borders of the map area. The Knoxville Formation (KJk) of Late Jurassic and Early Cretaceous age is the lowermost unit of the Great Valley Sequence, and consists of dark, greenish-gray shale with thin sandstone interbeds. Overlying this formation are the conglomerate (Kbc) and the sandstone and mudstone (Kbs) units of the Cretaceous Berryessa Formation (Wentworth and others, 1999).
The Alum Rock Block includes two Tertiary units, the lowest being the upper and middle Miocene Claremont Formation (Tcc), overlain by the upper Miocene Briones Formation (Tbr). The Claremont Formation (Tcc) consists of distinctive, massive to laminated, gray or brown chert beds as thick as 10 cm, with thin shale partings (Wentworth and others, 1999). The siliceous shale is dark brown to gray, finely laminated, with grains as large as silt. Some of the shale contains abundant foraminifera and fish scales and also contains interbedded lenses of massive, tan, foraminifera-bearing dolomite that weathers to a distinctive yellowish orange color (Wentworth and others, 1999a).
The Briones Formation (Tbr) unconformably overlies the Claremont Formation and consists of fine-grained sandstone and siltstone. Some of the sandstone beds are as thin as 5 to 10 cm, with 2- to 10-cm-thick shale interbeds. These are interbedded with massive, fine-grained sandstone beds as thick as five meters (Wentworth and others, 1999). The middle portion contains
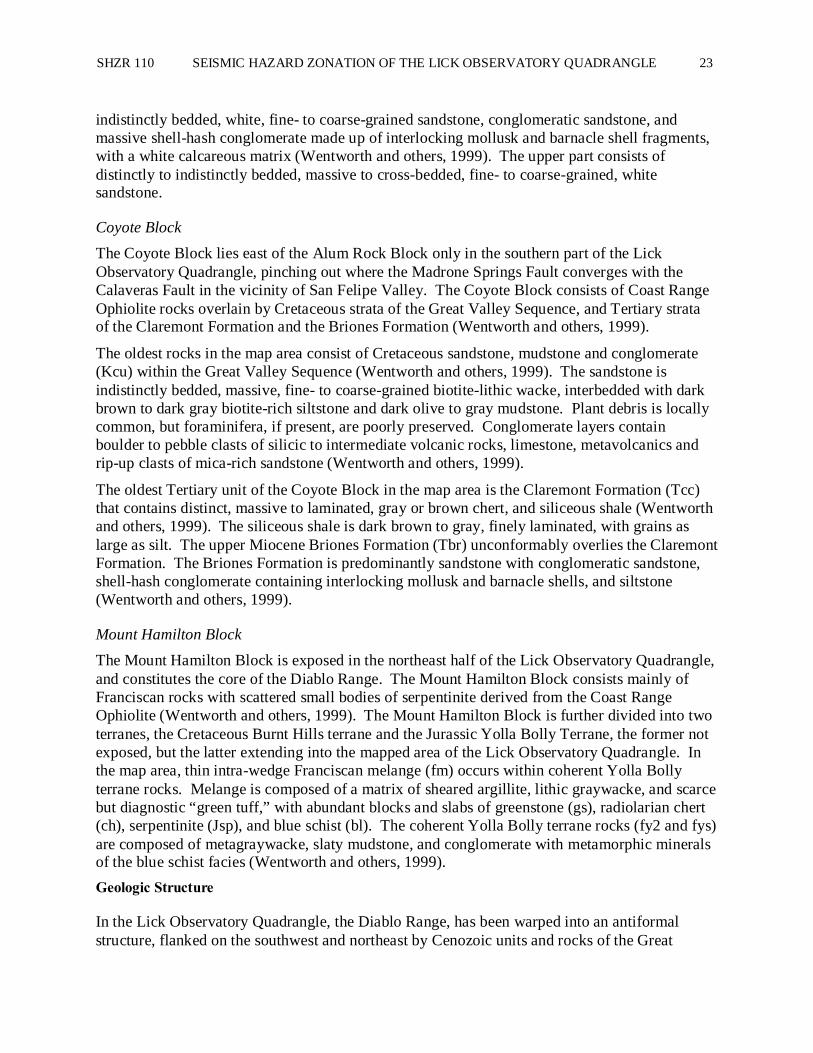
SHZR 110 SEISMIC HAZARD ZONATION OF THE LICK OBSERVATORY QUADRANGLE
23
indistinctly bedded, white, fine- to coarse-grained sandstone, conglomeratic sandstone, and massive shell-hash conglomerate made up of interlocking mollusk and barnacle shell fragments, with a white calcareous matrix (Wentworth and others, 1999). The upper part consists of distinctly to indistinctly bedded, massive to cross-bedded, fine- to coarse-grained, white sandstone.
Coyote Block The Coyote Block lies east of the Alum Rock Block only in the southern part of the Lick Observatory Quadrangle, pinching out where the Madrone Springs Fault converges with the Calaveras Fault in the vicinity of San Felipe Valley. The Coyote Block consists of Coast Range Ophiolite rocks overlain by Cretaceous strata of the Great Valley Sequence, and Tertiary strata of the Claremont Formation and the Briones Formation (Wentworth and others, 1999).
The oldest rocks in the map area consist of Cretaceous sandstone, mudstone and conglomerate (Kcu) within the Great Valley Sequence (Wentworth and others, 1999). The sandstone is indistinctly bedded, massive, fine- to coarse-grained biotite-lithic wacke, interbedded with dark brown to dark gray biotite-rich siltstone and dark olive to gray mudstone. Plant debris is locally common, but foraminifera, if present, are poorly preserved. Conglomerate layers contain boulder to pebble clasts of silicic to intermediate volcanic rocks, limestone, metavolcanics and rip-up clasts of mica-rich sandstone (Wentworth and others, 1999).
The oldest Tertiary unit of the Coyote Block in the map area is the Claremont Formation (Tcc) that contains distinct, massive to laminated, gray or brown chert, and siliceous shale (Wentworth and others, 1999). The siliceous shale is dark brown to gray, finely laminated, with grains as large as silt. The upper Miocene Briones Formation (Tbr) unconformably overlies the Claremont Formation. The Briones Formation is predominantly sandstone with conglomeratic sandstone, shell-hash conglomerate containing interlocking mollusk and barnacle shells, and siltstone (Wentworth and others, 1999).
Mount Hamilton Block The Mount Hamilton Block is exposed in the northeast half of the Lick Observatory Quadrangle, and constitutes the core of the Diablo Range. The Mount Hamilton Block consists mainly of Franciscan rocks with scattered small bodies of serpentinite derived from the Coast Range Ophiolite (Wentworth and others, 1999). The Mount Hamilton Block is further divided into two terranes, the Cretaceous Burnt Hills terrane and the Jurassic Yolla Bolly Terrane, the former not exposed, but the latter extending into the mapped area of the Lick Observatory Quadrangle. In the map area, thin intra-wedge Franciscan melange (fm) occurs within coherent Yolla Bolly terrane rocks. Melange is composed of a matrix of sheared argillite, lithic graywacke, and scarce but diagnostic “green tuff,” with abundant blocks and slabs of greenstone (gs), radiolarian chert (ch), serpentinite (Jsp), and blue schist (bl). The coherent Yolla Bolly terrane rocks (fy2 and fys) are composed of metagraywacke, slaty mudstone, and conglomerate with metamorphic minerals of the blue schist facies (Wentworth and others, 1999). Geologic Structure
In the Lick Observatory Quadrangle, the Diablo Range, has been warped into an antiformal structure, flanked on the southwest and northeast by Cenozoic units and rocks of the Great
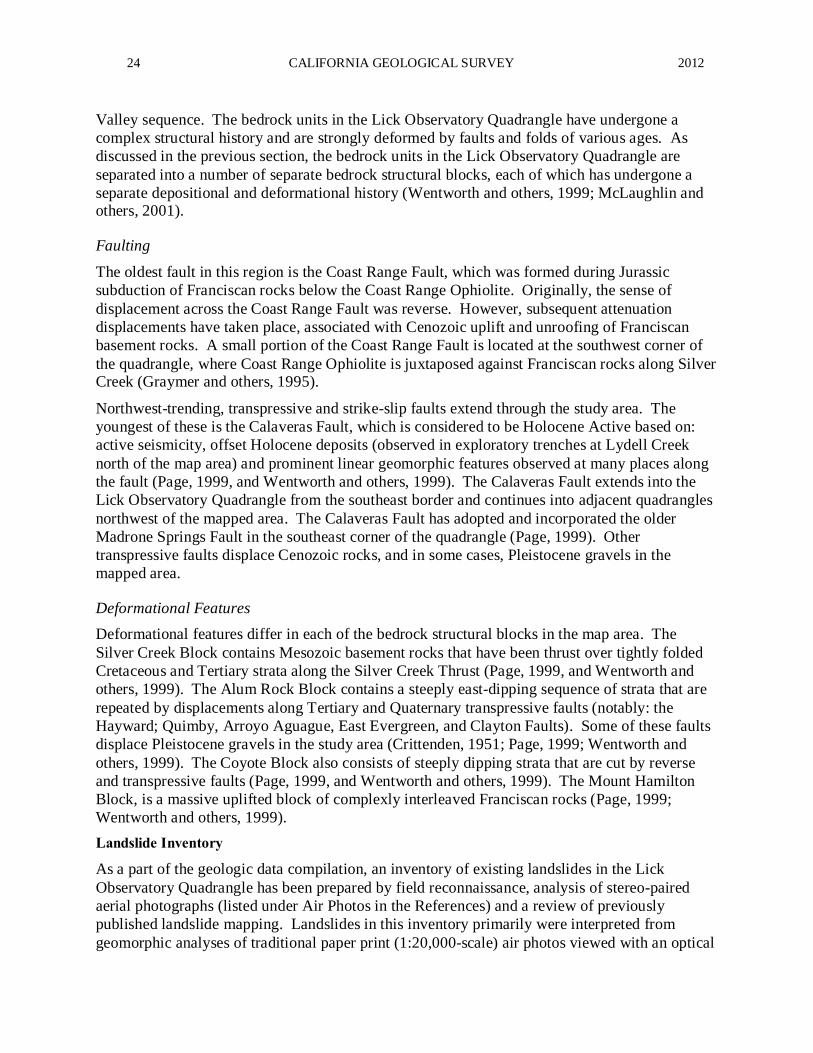
24 CALIFORNIA GEOLOGICAL SURVEY 2012
Valley sequence. The bedrock units in the Lick Observatory Quadrangle have undergone a complex structural history and are strongly deformed by faults and folds of various ages. As discussed in the previous section, the bedrock units in the Lick Observatory Quadrangle are separated into a number of separate bedrock structural blocks, each of which has undergone a separate depositional and deformational history (Wentworth and others, 1999; McLaughlin and others, 2001).
Faulting
The oldest fault in this region is the Coast Range Fault, which was formed during Jurassic subduction of Franciscan rocks below the Coast Range Ophiolite. Originally, the sense of displacement across the Coast Range Fault was reverse. However, subsequent attenuation displacements have taken place, associated with Cenozoic uplift and unroofing of Franciscan basement rocks. A small portion of the Coast Range Fault is located at the southwest corner of the quadrangle, where Coast Range Ophiolite is juxtaposed against Franciscan rocks along Silver Creek (Graymer and others, 1995).
Northwest-trending, transpressive and strike-slip faults extend through the study area. The youngest of these is the Calaveras Fault, which is considered to be Holocene Active based on: active seismicity, offset Holocene deposits (observed in exploratory trenches at Lydell Creek north of the map area) and prominent linear geomorphic features observed at many places along the fault (Page, 1999, and Wentworth and others, 1999). The Calaveras Fault extends into the Lick Observatory Quadrangle from the southeast border and continues into adjacent quadrangles northwest of the mapped area. The Calaveras Fault has adopted and incorporated the older Madrone Springs Fault in the southeast corner of the quadrangle (Page, 1999). Other transpressive faults displace Cenozoic rocks, and in some cases, Pleistocene gravels in the mapped area.
Deformational Features Deformational features differ in each of the bedrock structural blocks in the map area. The Silver Creek Block contains Mesozoic basement rocks that have been thrust over tightly folded Cretaceous and Tertiary strata along the Silver Creek Thrust (Page, 1999, and Wentworth and others, 1999). The Alum Rock Block contains a steeply east-dipping sequence of strata that are repeated by displacements along Tertiary and Quaternary transpressive faults (notably: the Hayward; Quimby, Arroyo Aguague, East Evergreen, and Clayton Faults). Some of these faults displace Pleistocene gravels in the study area (Crittenden, 1951; Page, 1999; Wentworth and others, 1999). The Coyote Block also consists of steeply dipping strata that are cut by reverse and transpressive faults (Page, 1999, and Wentworth and others, 1999). The Mount Hamilton Block, is a massive uplifted block of complexly interleaved Franciscan rocks (Page, 1999; Wentworth and others, 1999). Landslide Inventory
As a part of the geologic data compilation, an inventory of existing landslides in the Lick Observatory Quadrangle has been prepared by field reconnaissance, analysis of stereo-paired aerial photographs (listed under Air Photos in the References) and a review of previously published landslide mapping. Landslides in this inventory primarily were interpreted from geomorphic analyses of traditional paper print (1:20,000-scale) air photos viewed with an optical
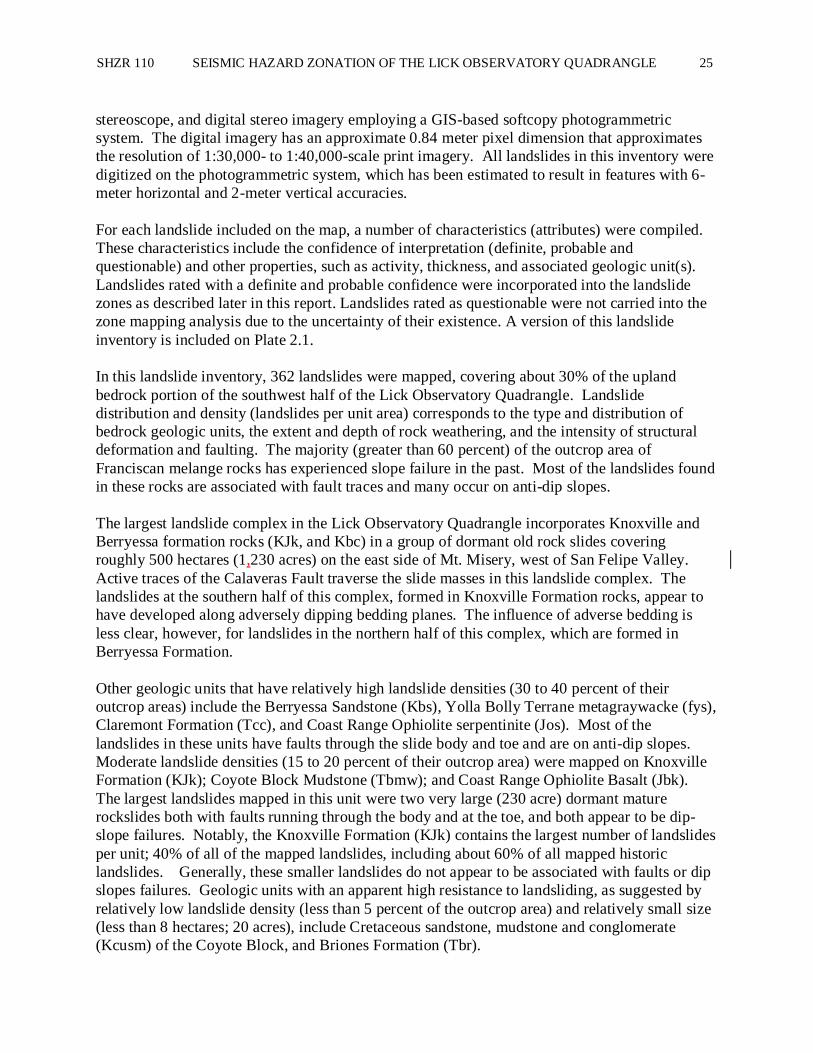
SHZR 110 SEISMIC HAZARD ZONATION OF THE LICK OBSERVATORY QUADRANGLE
25
stereoscope, and digital stereo imagery employing a GIS-based softcopy photogrammetric system. The digital imagery has an approximate 0.84 meter pixel dimension that approximates the resolution of 1:30,000- to 1:40,000-scale print imagery. All landslides in this inventory were digitized on the photogrammetric system, which has been estimated to result in features with 6-meter horizontal and 2-meter vertical accuracies. For each landslide included on the map, a number of characteristics (attributes) were compiled. These characteristics include the confidence of interpretation (definite, probable and questionable) and other properties, such as activity, thickness, and associated geologic unit(s). Landslides rated with a definite and probable confidence were incorporated into the landslide zones as described later in this report. Landslides rated as questionable were not carried into the zone mapping analysis due to the uncertainty of their existence. A version of this landslide inventory is included on Plate 2.1. In this landslide inventory, 362 landslides were mapped, covering about 30% of the upland bedrock portion of the southwest half of the Lick Observatory Quadrangle. Landslide distribution and density (landslides per unit area) corresponds to the type and distribution of bedrock geologic units, the extent and depth of rock weathering, and the intensity of structural deformation and faulting. The majority (greater than 60 percent) of the outcrop area of Franciscan melange rocks has experienced slope failure in the past. Most of the landslides found in these rocks are associated with fault traces and many occur on anti-dip slopes. The largest landslide complex in the Lick Observatory Quadrangle incorporates Knoxville and Berryessa formation rocks (KJk, and Kbc) in a group of dormant old rock slides covering roughly 500 hectares (1,230 acres) on the east side of Mt. Misery, west of San Felipe Valley. Active traces of the Calaveras Fault traverse the slide masses in this landslide complex. The landslides at the southern half of this complex, formed in Knoxville Formation rocks, appear to have developed along adversely dipping bedding planes. The influence of adverse bedding is less clear, however, for landslides in the northern half of this complex, which are formed in Berryessa Formation. Other geologic units that have relatively high landslide densities (30 to 40 percent of their outcrop areas) include the Berryessa Sandstone (Kbs), Yolla Bolly Terrane metagraywacke (fys), Claremont Formation (Tcc), and Coast Range Ophiolite serpentinite (Jos). Most of the landslides in these units have faults through the slide body and toe and are on anti-dip slopes. Moderate landslide densities (15 to 20 percent of their outcrop area) were mapped on Knoxville Formation (KJk); Coyote Block Mudstone (Tbmw); and Coast Range Ophiolite Basalt (Jbk). The largest landslides mapped in this unit were two very large (230 acre) dormant mature rockslides both with faults running through the body and at the toe, and both appear to be dip-slope failures. Notably, the Knoxville Formation (KJk) contains the largest number of landslides per unit; 40% of all of the mapped landslides, including about 60% of all mapped historic landslides. Generally, these smaller landslides do not appear to be associated with faults or dip slopes failures. Geologic units with an apparent high resistance to landsliding, as suggested by relatively low landslide density (less than 5 percent of the outcrop area) and relatively small size (less than 8 hectares; 20 acres), include Cretaceous sandstone, mudstone and conglomerate (Kcusm) of the Coyote Block, and Briones Formation (Tbr).
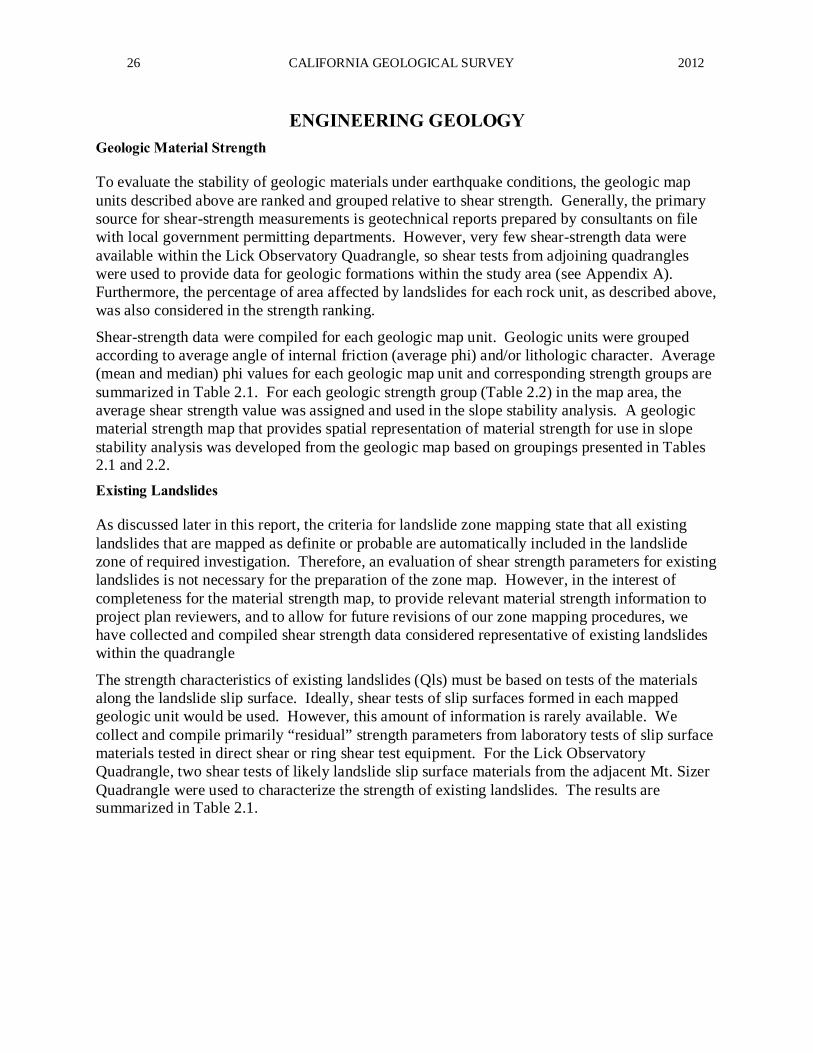
26 CALIFORNIA GEOLOGICAL SURVEY 2012
ENGINEERING GEOLOGY Geologic Material Strength
To evaluate the stability of geologic materials under earthquake conditions, the geologic map units described above are ranked and grouped relative to shear strength. Generally, the primary source for shear-strength measurements is geotechnical reports prepared by consultants on file with local government permitting departments. However, very few shear-strength data were available within the Lick Observatory Quadrangle, so shear tests from adjoining quadrangles were used to provide data for geologic formations within the study area (see Appendix A). Furthermore, the percentage of area affected by landslides for each rock unit, as described above, was also considered in the strength ranking.
Shear-strength data were compiled for each geologic map unit. Geologic units were grouped according to average angle of internal friction (average phi) and/or lithologic character. Average (mean and median) phi values for each geologic map unit and corresponding strength groups are summarized in Table 2.1. For each geologic strength group (Table 2.2) in the map area, the average shear strength value was assigned and used in the slope stability analysis. A geologic material strength map that provides spatial representation of material strength for use in slope stability analysis was developed from the geologic map based on groupings presented in Tables 2.1 and 2.2. Existing Landslides
As discussed later in this report, the criteria for landslide zone mapping state that all existing landslides that are mapped as definite or probable are automatically included in the landslide zone of required investigation. Therefore, an evaluation of shear strength parameters for existing landslides is not necessary for the preparation of the zone map. However, in the interest of completeness for the material strength map, to provide relevant material strength information to project plan reviewers, and to allow for future revisions of our zone mapping procedures, we have collected and compiled shear strength data considered representative of existing landslides within the quadrangle
The strength characteristics of existing landslides (Qls) must be based on tests of the materials along the landslide slip surface. Ideally, shear tests of slip surfaces formed in each mapped geologic unit would be used. However, this amount of information is rarely available. We collect and compile primarily “residual” strength parameters from laboratory tests of slip surface materials tested in direct shear or ring shear test equipment. For the Lick Observatory Quadrangle, two shear tests of likely landslide slip surface materials from the adjacent Mt. Sizer Quadrangle were used to characterize the strength of existing landslides. The results are summarized in Table 2.1.
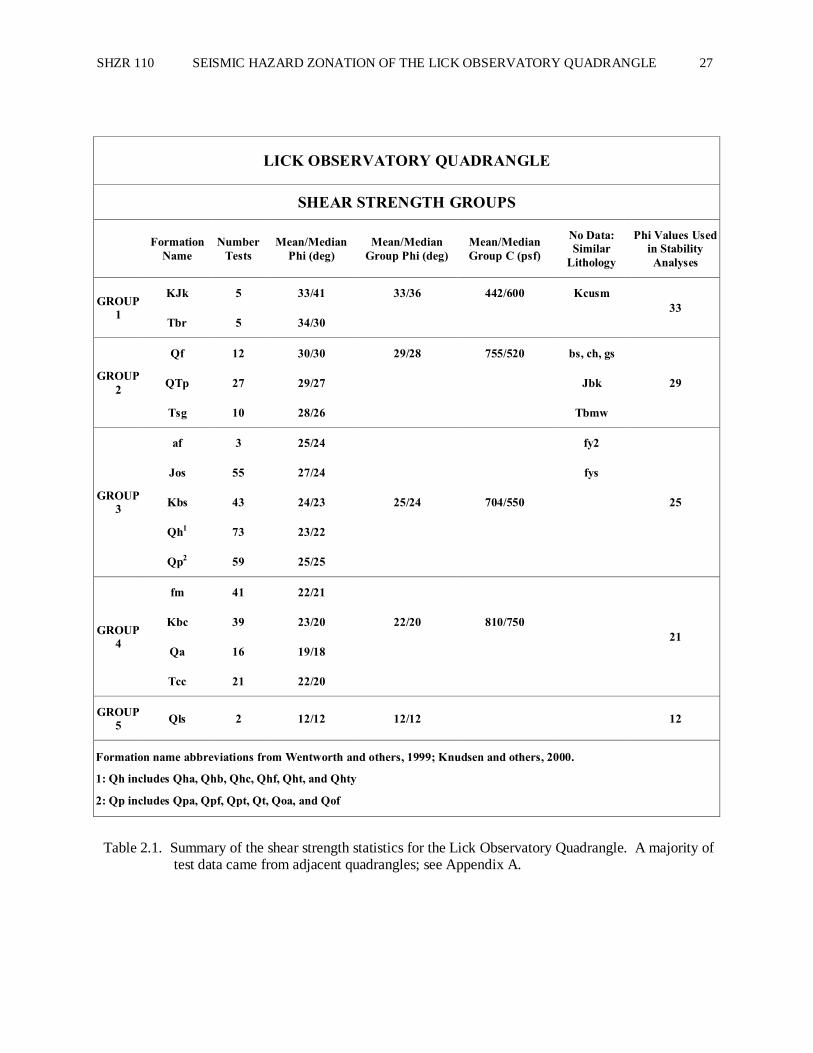
SHZR 110 SEISMIC HAZARD ZONATION OF THE LICK OBSERVATORY QUADRANGLE
27
LICK OBSERVATORY QUADRANGLE
SHEAR STRENGTH GROUPS
Formation Name
Number Tests
Mean/Median Phi (deg)
Mean/Median Group Phi (deg)
Mean/Median Group C (psf)
No Data: Similar
Lithology
Phi Values Used in Stability Analyses
GROUP 1
KJk 5 33/41 33/36 442/600 Kcusm 33
Tbr 5 34/30
GROUP 2
Qf 12 30/30 29/28 755/520 bs, ch, gs
29 QTp 27 29/27 Jbk
Tsg 10 28/26 Tbmw
GROUP 3
af 3 25/24 fy2
25
Jos 55 27/24 fys
Kbs 43 24/23 25/24 704/550
Qh1 73 23/22
Qp2 59 25/25
GROUP 4
fm 41 22/21
21 Kbc 39 23/20 22/20 810/750
Qa 16 19/18
Tcc 21 22/20
GROUP 5 Qls 2 12/12 12/12 12
Formation name abbreviations from Wentworth and others, 1999; Knudsen and others, 2000.
1: Qh includes Qha, Qhb, Qhc, Qhf, Qht, and Qhty
2: Qp includes Qpa, Qpf, Qpt, Qt, Qoa, and Qof
Table 2.1. Summary of the shear strength statistics for the Lick Observatory Quadrangle. A majority of
test data came from adjacent quadrangles; see Appendix A.
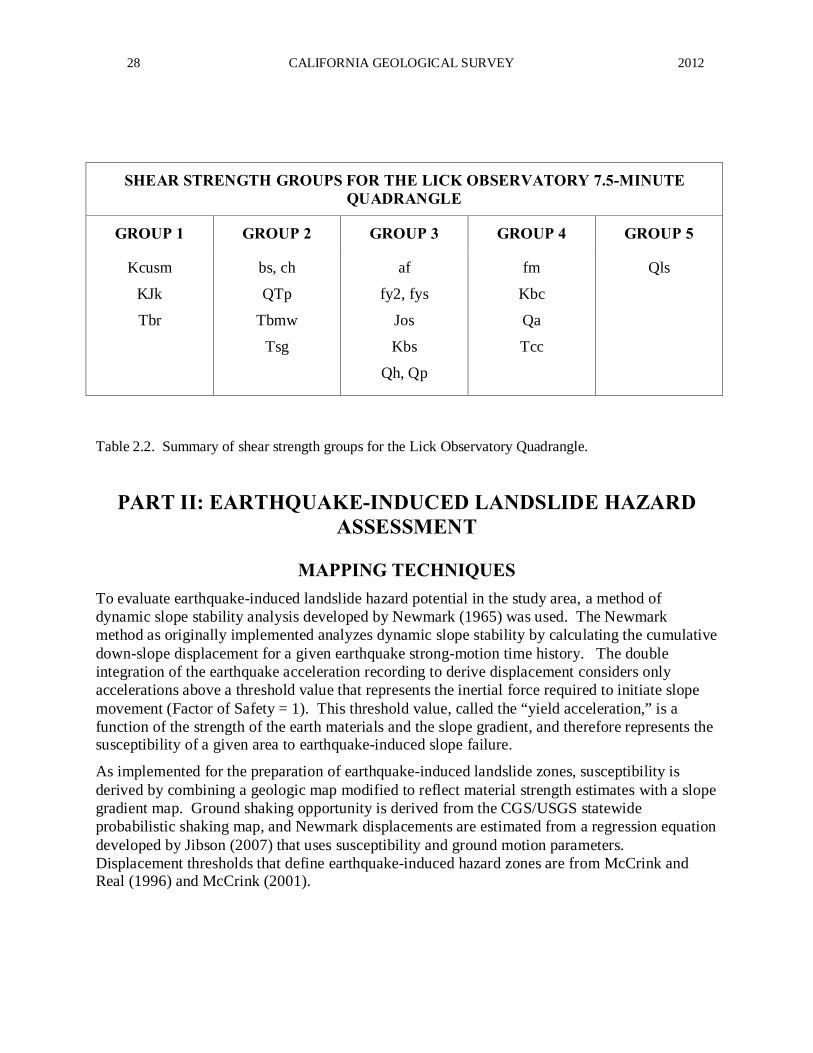
28 CALIFORNIA GEOLOGICAL SURVEY 2012
Table 2.2. Summary of shear strength groups for the Lick Observatory Quadrangle.
PART II: EARTHQUAKE-INDUCED LANDSLIDE HAZARD ASSESSMENT
MAPPING TECHNIQUES To evaluate earthquake-induced landslide hazard potential in the study area, a method of dynamic slope stability analysis developed by Newmark (1965) was used. The Newmark method as originally implemented analyzes dynamic slope stability by calculating the cumulative down-slope displacement for a given earthquake strong-motion time history. The double integration of the earthquake acceleration recording to derive displacement considers only accelerations above a threshold value that represents the inertial force required to initiate slope movement (Factor of Safety = 1). This threshold value, called the “yield acceleration,” is a function of the strength of the earth materials and the slope gradient, and therefore represents the susceptibility of a given area to earthquake-induced slope failure.
As implemented for the preparation of earthquake-induced landslide zones, susceptibility is derived by combining a geologic map modified to reflect material strength estimates with a slope gradient map. Ground shaking opportunity is derived from the CGS/USGS statewide probabilistic shaking map, and Newmark displacements are estimated from a regression equation developed by Jibson (2007) that uses susceptibility and ground motion parameters. Displacement thresholds that define earthquake-induced hazard zones are from McCrink and Real (1996) and McCrink (2001).
SHEAR STRENGTH GROUPS FOR THE LICK OBSERVATORY 7.5-MINUTE QUADRANGLE
GROUP 1 GROUP 2 GROUP 3 GROUP 4 GROUP 5
Kcusm
KJk
Tbr
bs, ch
QTp
Tbmw
Tsg
af
fy2, fys
Jos
Kbs
Qh, Qp
fm
Kbc
Qa
Tcc
Qls
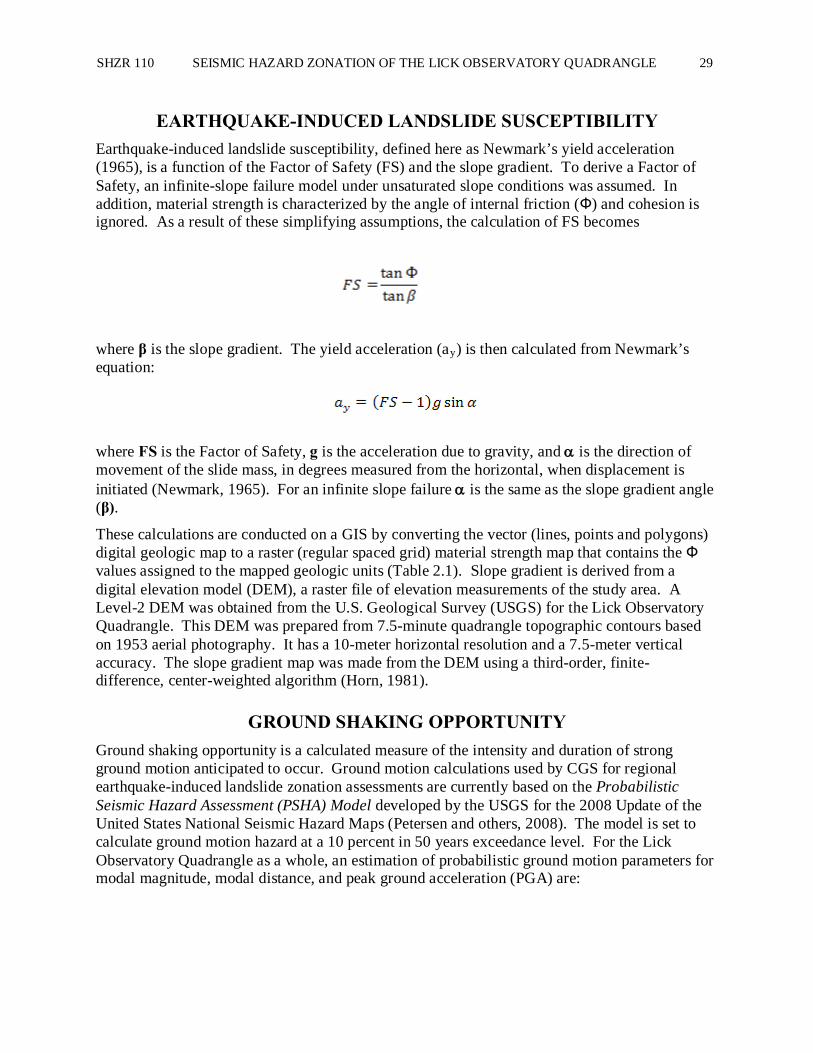
SHZR 110 SEISMIC HAZARD ZONATION OF THE LICK OBSERVATORY QUADRANGLE
29
EARTHQUAKE-INDUCED LANDSLIDE SUSCEPTIBILITY Earthquake-induced landslide susceptibility, defined here as Newmark’s yield acceleration (1965), is a function of the Factor of Safety (FS) and the slope gradient. To derive a Factor of Safety, an infinite-slope failure model under unsaturated slope conditions was assumed. In addition, material strength is characterized by the angle of internal friction (Ф) and cohesion is ignored. As a result of these simplifying assumptions, the calculation of FS becomes
where β is the slope gradient. The yield acceleration (ay) is then calculated from Newmark’s equation:
where FS is the Factor of Safety, g is the acceleration due to gravity, and α is the direction of movement of the slide mass, in degrees measured from the horizontal, when displacement is initiated (Newmark, 1965). For an infinite slope failure α is the same as the slope gradient angle (β).
These calculations are conducted on a GIS by converting the vector (lines, points and polygons) digital geologic map to a raster (regular spaced grid) material strength map that contains the Ф values assigned to the mapped geologic units (Table 2.1). Slope gradient is derived from a digital elevation model (DEM), a raster file of elevation measurements of the study area. A Level-2 DEM was obtained from the U.S. Geological Survey (USGS) for the Lick Observatory Quadrangle. This DEM was prepared from 7.5-minute quadrangle topographic contours based on 1953 aerial photography. It has a 10-meter horizontal resolution and a 7.5-meter vertical accuracy. The slope gradient map was made from the DEM using a third-order, finite-difference, center-weighted algorithm (Horn, 1981).
GROUND SHAKING OPPORTUNITY Ground shaking opportunity is a calculated measure of the intensity and duration of strong ground motion anticipated to occur. Ground motion calculations used by CGS for regional earthquake-induced landslide zonation assessments are currently based on the Probabilistic Seismic Hazard Assessment (PSHA) Model developed by the USGS for the 2008 Update of the United States National Seismic Hazard Maps (Petersen and others, 2008). The model is set to calculate ground motion hazard at a 10 percent in 50 years exceedance level. For the Lick Observatory Quadrangle as a whole, an estimation of probabilistic ground motion parameters for modal magnitude, modal distance, and peak ground acceleration (PGA) are:
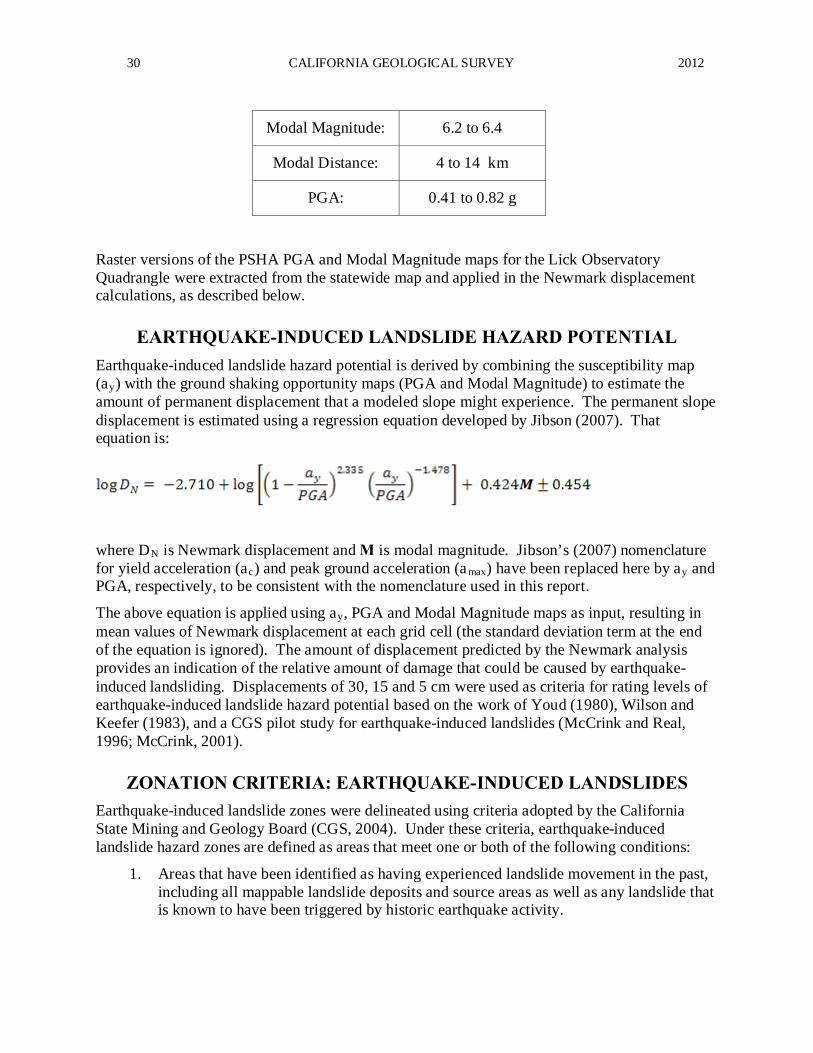
30 CALIFORNIA GEOLOGICAL SURVEY 2012
Modal Magnitude: 6.2 to 6.4
Modal Distance: 4 to 14 km
PGA: 0.41 to 0.82 g
Raster versions of the PSHA PGA and Modal Magnitude maps for the Lick Observatory Quadrangle were extracted from the statewide map and applied in the Newmark displacement calculations, as described below.
EARTHQUAKE-INDUCED LANDSLIDE HAZARD POTENTIAL Earthquake-induced landslide hazard potential is derived by combining the susceptibility map (ay) with the ground shaking opportunity maps (PGA and Modal Magnitude) to estimate the amount of permanent displacement that a modeled slope might experience. The permanent slope displacement is estimated using a regression equation developed by Jibson (2007). That equation is:
where DN is Newmark displacement and M is modal magnitude. Jibson’s (2007) nomenclature for yield acceleration (ac) and peak ground acceleration (a max) have been replaced here by ay and PGA, respectively, to be consistent with the nomenclature used in this report.
The above equation is applied using ay, PGA and Modal Magnitude maps as input, resulting in mean values of Newmark displacement at each grid cell (the standard deviation term at the end of the equation is ignored). The amount of displacement predicted by the Newmark analysis provides an indication of the relative amount of damage that could be caused by earthquake-induced landsliding. Displacements of 30, 15 and 5 cm were used as criteria for rating levels of earthquake-induced landslide hazard potential based on the work of Youd (1980), Wilson and Keefer (1983), and a CGS pilot study for earthquake-induced landslides (McCrink and Real, 1996; McCrink, 2001).
ZONATION CRITERIA: EARTHQUAKE-INDUCED LANDSLIDES Earthquake-induced landslide zones were delineated using criteria adopted by the California State Mining and Geology Board (CGS, 2004). Under these criteria, earthquake-induced landslide hazard zones are defined as areas that meet one or both of the following conditions:
1. Areas that have been identified as having experienced landslide movement in the past, including all mappable landslide deposits and source areas as well as any landslide that is known to have been triggered by historic earthquake activity.
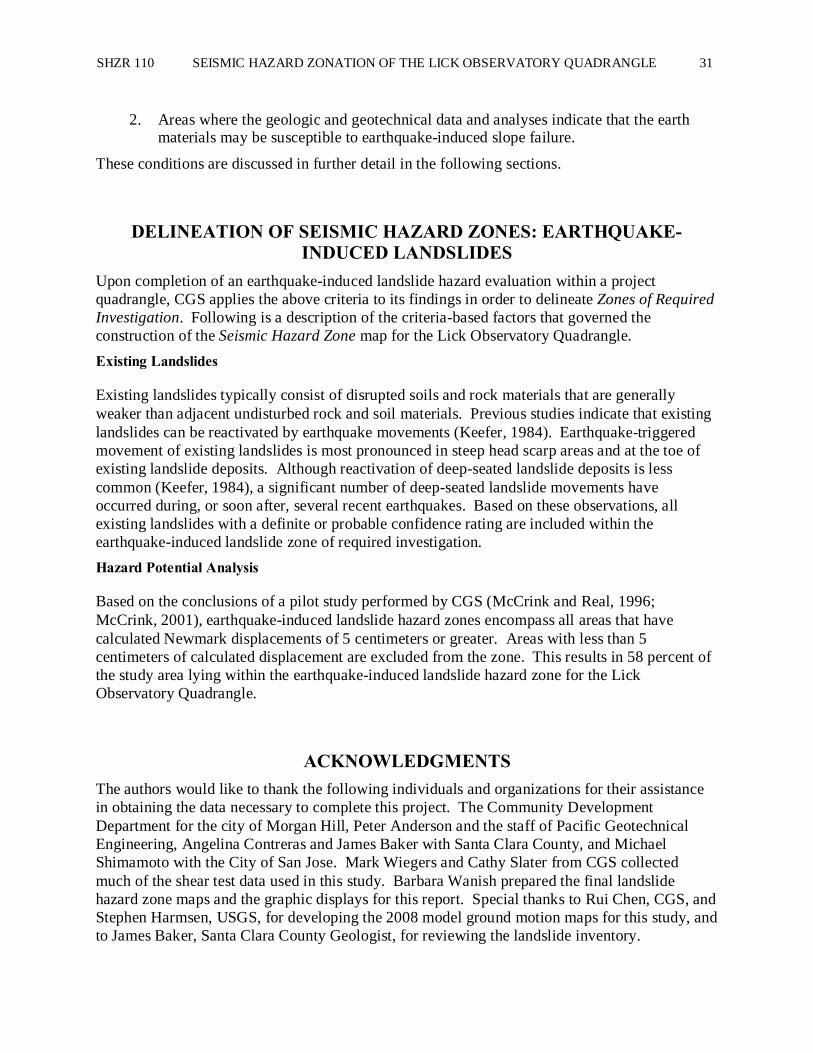
SHZR 110 SEISMIC HAZARD ZONATION OF THE LICK OBSERVATORY QUADRANGLE
31
2. Areas where the geologic and geotechnical data and analyses indicate that the earth materials may be susceptible to earthquake-induced slope failure.
These conditions are discussed in further detail in the following sections.
DELINEATION OF SEISMIC HAZARD ZONES: EARTHQUAKE-INDUCED LANDSLIDES
Upon completion of an earthquake-induced landslide hazard evaluation within a project quadrangle, CGS applies the above criteria to its findings in order to delineate Zones of Required Investigation. Following is a description of the criteria-based factors that governed the construction of the Seismic Hazard Zone map for the Lick Observatory Quadrangle. Existing Landslides
Existing landslides typically consist of disrupted soils and rock materials that are generally weaker than adjacent undisturbed rock and soil materials. Previous studies indicate that existing landslides can be reactivated by earthquake movements (Keefer, 1984). Earthquake-triggered movement of existing landslides is most pronounced in steep head scarp areas and at the toe of existing landslide deposits. Although reactivation of deep-seated landslide deposits is less common (Keefer, 1984), a significant number of deep-seated landslide movements have occurred during, or soon after, several recent earthquakes. Based on these observations, all existing landslides with a definite or probable confidence rating are included within the earthquake-induced landslide zone of required investigation. Hazard Potential Analysis
Based on the conclusions of a pilot study performed by CGS (McCrink and Real, 1996; McCrink, 2001), earthquake-induced landslide hazard zones encompass all areas that have calculated Newmark displacements of 5 centimeters or greater. Areas with less than 5 centimeters of calculated displacement are excluded from the zone. This results in 58 percent of the study area lying within the earthquake-induced landslide hazard zone for the Lick Observatory Quadrangle.
ACKNOWLEDGMENTS The authors would like to thank the following individuals and organizations for their assistance in obtaining the data necessary to complete this project. The Community Development Department for the city of Morgan Hill, Peter Anderson and the staff of Pacific Geotechnical Engineering, Angelina Contreras and James Baker with Santa Clara County, and Michael Shimamoto with the City of San Jose. Mark Wiegers and Cathy Slater from CGS collected much of the shear test data used in this study. Barbara Wanish prepared the final landslide hazard zone maps and the graphic displays for this report. Special thanks to Rui Chen, CGS, and Stephen Harmsen, USGS, for developing the 2008 model ground motion maps for this study, and to James Baker, Santa Clara County Geologist, for reviewing the landslide inventory.
32 CALIFORNIA GEOLOGICAL SURVEY 2012
REFERENCES
California Geological Survey, 2008, Guidelines for evaluating and mitigating seismic hazards in California: California Geological Survey Special Publication 117a, 98 p. Available on-line at: http://www.conservation.ca.gov/cgs/shzp/webdocs/sp117.pdf.
California Geological Survey, 2004, Recommended criteria for delineating seismic hazard zones in California: California Geological Survey Special Publication 118, 12 p. Available on-line at: http://www.conservation.ca.gov/cgs/shzp/webdocs/sp118_revised.pdf.
Cooper-Clark & Associates, 1975, Unpublished 1:24,000-scale mapping of seven 7.5-minute Lick Observatory Quadrangle.
Crittenden, M.D., Jr., 1951, Geology of the San Jose-Mount Hamilton Area, California, Department of Natural Resources, Division of Mines, Bulletin 157, 74 pages. Scale: 1:62,500.
Ellen, S.D., and Wentworth, C.M., 1995, Hillside Materials and Slopes of the San Francisco Bay Region, California: U.S. Geological Survey Professional Paper 1357, scale 1:125,000.
Graymer, R.W., Jones, D.L. and Brabb, E.E., 1994, Preliminary geologic map emphasizing bedrock formations in Contra Costa County, California; a digital database: U.S. Geological Survey Open-File Report 94-622. Scale: 1:750,000.
Graymer, R.W., Jones, D.L. and Brabb, E.E., 1995, Geologic map of the Hayward fault zone, Contra Costa, Alameda, and Santa Clara Counties, California; a digital database: U.S. Geological Survey Open-File Report 95-597. Scale: 1:50,000.
Horn, B.K.P., 1981, Hill shading and the reflectance map: Proceedings of the IEEE, v. 69, no. 1, p.14-47.
Jibson, R.W., 2007, Regression models for estimating coseismic landslide displacement: Engineering Geology, vol. 91, issue 2-4, p. 209-218.
Jones, D.L., and Curtis, G.H., 1991, Guide to the geology of the Berkeley Hills, central Coast Ranges, California, in Sloan, Doris, and Wagner, D.L., editors, Geologic Excursions in Northern California: San Francisco to the Sierra Nevada, California Division of Mines and Geology Special Publication 109.
Keefer, D.K., 1984, Landslides caused by earthquakes: Geological Society of America Bulletin, v. 95, no. 4, p. 406-421.
SHZR 110 SEISMIC HAZARD ZONATION OF THE LICK OBSERVATORY QUADRANGLE
33
Knudsen, K.L., Sowers, J.M., Witter, R.C., Wentworth, C.M., Helley, E.J., Nicholson, R.S., Wright, H.M. and Brown, K.H., 2000a, Preliminary maps of Quaternary deposits and liquefaction susceptibility, nine-county San Francisco Bay region, California; a digital database: U.S. Geological Survey Open-File Report 2000-444, scale 1:24,000.
McCrink, T.P., 2001, Mapping earthquake-induced landslide hazards in Santa Cruz County in Ferriz, H., and Anderson, R., editors, Engineering geology practice in northern California: California Geological Survey Bulletin 210 / Association of Engineering Geologists Special Publication 12, p. 77-94.
McCrink, T.P., and Real, C.R., 1996, Evaluation of the Newmark method for mapping earthquake-induced landslide hazards in the Laurel 7-1/2 minute Quadrangle, Santa Cruz County, California: California Division of Mines and Geology Final Technical Report for U.S. Geological Survey Contract 143-93-G-2334, U.S. Geological Survey, Reston, Virginia, 31 p.
McLaughlin, R.J., Clark, J.C., Brabb, E.E., Helley, E.J., and Colon, C.J., 2001, Geologic maps and structure sections of the southwestern Santa Clara Valley and southern Santa Cruz Mountains, Santa Clara and Santa Cruz Counties, California: U.S. Geological Survey Miscellaneous Field Studies Map MF-2373, 8 sheets, scale 1:24,000.
Newmark, N.M., 1965, Effects of earthquakes on dams and embankments: Geotechnique, v. 15, no. 2, p. 139-160.
Page, B.M., 1999, Geology of the Lick Observatory Quadrangle, California: International Geology Review, by V.H. Winston & Son, Inc., Vol. 41, p.355-367. Scale: 1:24,000.
Petersen, M.D., Frankel, A.D., Harmsen, S.C., Mueller, C.S., Haller, K.M., Wheeler, R.L., Wesson, R.L., Zeng, Y., Boyd, O.S., Perkins, D.M., Luco, N., Field, E.H., Wills, C.J., and Rukstales, K.S., 2008, Documentation for the 2008 update of the United States National Seismic Hazard Maps: U.S. Geol. Survey Open-File Report 2008-1128, 60p.
Smith, T.C., 1996, Preliminary maps of seismic hazard zones and draft guidelines for evaluating and mitigating seismic hazards: California Geology, v. 49, no. 6, p. 147-150.
Southern California Earthquake Center, 2002, Recommended procedures for implementation of DMG Special Publication 117 guidelines for analyzing and mitigating landslide hazards in California: T.F. Blake, R.A. Hollingsworth, and J.P. Stewart, editors, Southern California Earthquake Center, University of Southern California, 108 p.
U.S. Geological Survey, 1993, Digital Elevation Models: National Mapping Program, Technical Instructions, Data Users Guide 5, 48 p.
Wentworth, C.M., Blake, M.C., Jr., McLaughlin, R.J. and Graymer, R.W., 1999, Preliminary geologic map of the San Jose 30 X 60 Quadrangle, California: a digital database: U.S. Geological Survey Open-File Report 98-795. Scale: 1:100,000.
Wilson, R.C., and Keefer, D.K., 1983, Dynamic analysis of a slope failure from the 1979 Coyote Lake, California, earthquake: Bulletin of the Seismological Society of America, v. 73, p. 863-877
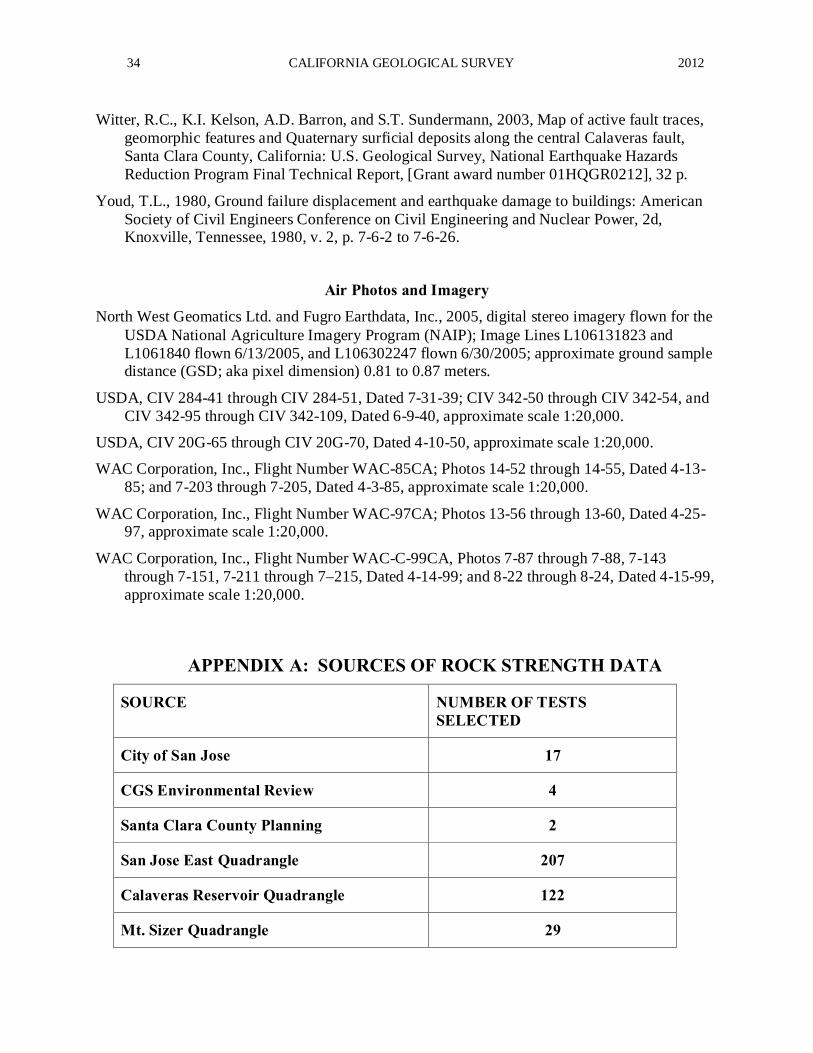
34 CALIFORNIA GEOLOGICAL SURVEY 2012
Witter, R.C., K.I. Kelson, A.D. Barron, and S.T. Sundermann, 2003, Map of active fault traces, geomorphic features and Quaternary surficial deposits along the central Calaveras fault, Santa Clara County, California: U.S. Geological Survey, National Earthquake Hazards Reduction Program Final Technical Report, [Grant award number 01HQGR0212], 32 p.
Youd, T.L., 1980, Ground failure displacement and earthquake damage to buildings: American Society of Civil Engineers Conference on Civil Engineering and Nuclear Power, 2d, Knoxville, Tennessee, 1980, v. 2, p. 7-6-2 to 7-6-26.
Air Photos and Imagery
North West Geomatics Ltd. and Fugro Earthdata, Inc., 2005, digital stereo imagery flown for the USDA National Agriculture Imagery Program (NAIP); Image Lines L106131823 and L1061840 flown 6/13/2005, and L106302247 flown 6/30/2005; approximate ground sample distance (GSD; aka pixel dimension) 0.81 to 0.87 meters.
USDA, CIV 284-41 through CIV 284-51, Dated 7-31-39; CIV 342-50 through CIV 342-54, and CIV 342-95 through CIV 342-109, Dated 6-9-40, approximate scale 1:20,000.
USDA, CIV 20G-65 through CIV 20G-70, Dated 4-10-50, approximate scale 1:20,000.
WAC Corporation, Inc., Flight Number WAC-85CA; Photos 14-52 through 14-55, Dated 4-13-85; and 7-203 through 7-205, Dated 4-3-85, approximate scale 1:20,000.
WAC Corporation, Inc., Flight Number WAC-97CA; Photos 13-56 through 13-60, Dated 4-25-97, approximate scale 1:20,000.
WAC Corporation, Inc., Flight Number WAC-C-99CA, Photos 7-87 through 7-88, 7-143 through 7-151, 7-211 through 7–215, Dated 4-14-99; and 8-22 through 8-24, Dated 4-15-99, approximate scale 1:20,000.
APPENDIX A: SOURCES OF ROCK STRENGTH DATA
SOURCE NUMBER OF TESTS SELECTED
City of San Jose 17
CGS Environmental Review 4
Santa Clara County Planning 2
San Jose East Quadrangle 207
Calaveras Reservoir Quadrangle 122
Mt. Sizer Quadrangle 29
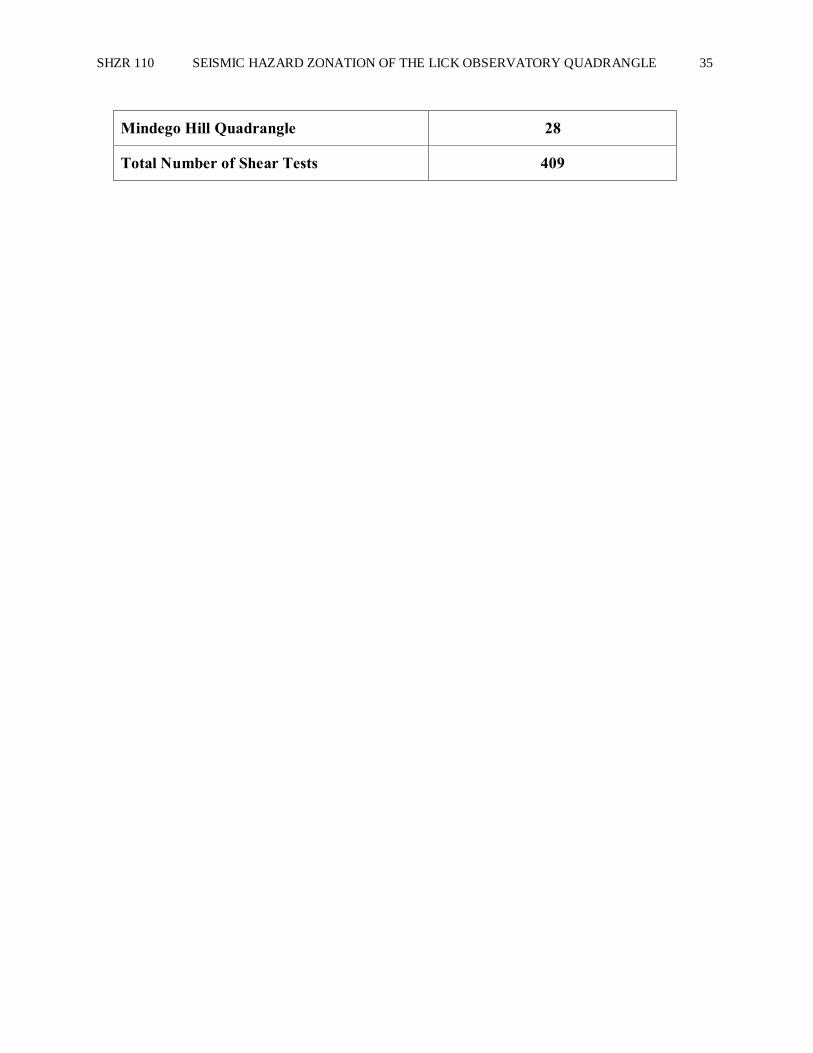
SHZR 110 SEISMIC HAZARD ZONATION OF THE LICK OBSERVATORY QUADRANGLE
35
Mindego Hill Quadrangle 28
Total Number of Shear Tests 409
36 CALIFORNIA GEOLOGICAL SURVEY 2012
SECTION 3: GROUND SHAKING ASSESSMENT for the
LICK OBSERVATORY 7.5-MINUTE QUADRANGLE, SANTA CLARA COUNTY, CALIFORNIA
using the
2008 Probabilistic Seismic Hazard Assessment Model by
Charles R. Real G.P. 968
and
Rui Chen P.G. 8598
DEPARTMENT OF CONSERVATION
CALIFORNIA GEOLOGICAL SURVEY
INTRODUCTION Purpose
The Seismic Hazards Mapping Act of 1990 (Public Resources Code, Chapter 7.8, Division 2) directs the California State Geologist to compile maps that identify Seismic Hazard Zones consistent with requirements and priorities established by the California State Mining and Geology Board (SMGB) (California Geological Survey, 2004). The text of this report is available online at: http://www.conservation.ca.gov/cgs/shzp/webdocs/sp118_revised.pdf. The Act requires that site-specific geotechnical investigations be performed for most urban development projects situated within seismic hazard zones before lead agencies can issue the building permit. The Act also requires sellers of real property within these zones to disclose that fact at the time such property is sold. Evaluation and mitigation of seismic hazards are to be conducted under guidelines adopted by the California SMGB (California Geological Survey, 2008). The text of this report is online at: http://www.conservation.ca.gov/cgs/shzp/webdocs/sp117.pdf.
This section of the evaluation report summarizes the ground motions used to evaluate liquefaction and earthquake-induced landslide potential for zoning purposes. The site ground motion levels from the 2008 seismic hazard model are available interactively online:
https://geohazards.usgs.gov/deaggint/2008/ This section and Sections 1 and 2, which address liquefaction and earthquake-induced landslide hazards, constitute a report series that summarizes development of seismic hazard zone maps in the state. Additional information on seismic hazard zone mapping in California can be accessed on the California Geological Survey's Internet page: http://conservation.ca.gov/CGS/shzp.
SHZR 110 SEISMIC HAZARD ZONATION OF THE LICK OBSERVATORY QUADRANGLE
37
2008 PROBABILISTIC SEISMIC HAZARD ANALYSIS MODEL The estimated ground shaking is derived using the revised Probabilistic Seismic Hazard Analysis (PSHA) model developed by the U.S. Geological Survey for the 2008 Update of the United States National Seismic Hazard Maps (Petersen and others, 2008). This model replaces the previous ground-motion model of Frankel and others (2002), Cao and others (2003) and Peterson and others (1996) used in previous Official Seismic Hazard Zone Maps. Like the previous model, the 2008 model is the product of an extensive effort to obtain consensus within the scientific and engineering communities regarding fault parameters that characterize the seismic hazard in California. Fault sources included in the model were evaluated for long-term slip rate, maximum earthquake magnitude, and rupture geometry. These fault parameters, along with historical seismicity, were used to estimate return times of moderate to large earthquakes that contribute to the hazard. The 2008 model incorporates improvements to the California fault sources, based on new information from the Working Group on California Earthquake Probabilities (Field and others, 2008), and uses ground motion prediction equations from the Pacific Earthquake Engineering Research Center (PEER) Next Generation Attenuation Relation Project (NGA) (Power and others, 2008) .
Ground shaking levels are estimated for each of the sources included in the seismic source model using attenuation relations that relate earthquake shaking with magnitude, distance from the earthquake and type of fault rupture (strike-slip, reverse, normal, or subduction). The current PSHA model considers only uniform firm-rock site conditions (the boundary between NEHRP site classes B and C with an average shear wave velocity in the upper 30 meters of the earth of 760 m/s. In a separate post-PSHA step, we apply the NEHRP soil profile type D factor for PGA (FEMA, 1994) to adjust for alluvial soil conditions. See Petersen and others (2008) for more details on changes in the new PSHA model.
APPLICATION TO LIQUEFACTION AND LANDSLIDE HAZARD ASSESSMENT
Deaggregation of the seismic hazard identifies the contribution of each earthquake source (various magnitudes and distances) in the model to the ground motion hazard for a particular exposure period (Cramer and Petersen, 1996). This information provides the rationale for selecting a ground motion level for evaluating ground failure potential. For zoning earthquake-induced landslide hazard, the probabilistic peak ground acceleration and predominant earthquake magnitude are used to estimate cumulative Newmark displacement for a given rock strength and slope gradient condition using a regression equation, described more fully in Section 2 of this report.
For purposes of zoning liquefaction hazard, the probabilistic PGA is scaled by a factor of magnitude and is weighted by each earthquake’s estimated ground shaking contribution. The magnitude-dependant function is simply the inverse of the liquefaction threshold-scaling factor recommended by Youd and others (2001). The result is a “magnitude-weighted” ground motion that is then adjusted for NEHRP alluvial conditions and use directly in the calculation of the induced cyclic stress ratio demand and thus the estimate of the factor of safety against liquefaction. Unlike the predominant–earthquake approach described previously, this approach
38 CALIFORNIA GEOLOGICAL SURVEY 2012
provides an improved estimate of liquefaction hazard in a probabilistic sense. All magnitudes contributing to the hazard estimate are used to weight the probabilistic calculation of peak ground acceleration, effectively causing the cyclic stress ratio liquefaction threshold curves to be scaled probabilistically when computing factor of safety. This procedure ensures that large, distant earthquakes that occur less frequently but contribute more, and smaller, more frequent events that contribute less to the liquefaction hazard are appropriately accounted for (Real and others, 2000).
REFERENCES California Geological Survey, 2008, Guidelines for evaluating and mitigating seismic hazards in
California: California Geological Survey Special Publication 117a, 98 p. Available on-line at: http://www.conservation.ca.gov/cgs/shzp/webdocs/sp117.pdf.
California Geological Survey, 2004, Recommended criteria for delineating seismic hazard zones in California: California Geological Survey Special Publication 118, 12 p. Available on-line at: http://www.conservation.ca.gov/cgs/shzp/webdocs/sp118_revised.pdf.
Cao, T., Petersen, M.D., and Frankel, A.D., 2005, Model uncertainties of the 2002 update of California seismic hazard maps: Bulletin of the Seismological Society of America, vol. 95, p. 2040-2057.
Cao, T., Bryant, W.A., Rowshandel, B., Branum, D. and Wills, C.J., 2003, The Revised 2002 California Probabilistic Seismic Hazard Maps. California Geological Survey, Online Report: http://www.consrv.ca.gov/cgs/rghm/psha/fault_parameters/pdf/2002_CA_Hazard_Maps.pdf.
Cramer, C.H. and Petersen, M.D., 1996, Predominant seismic source distance and magnitude maps for Los Angeles, Orange and Ventura counties, California: Bulletin of the Seismological Society of America, vol. 85, no. 5, p. 1645-1649.
Cramer, C.H., Petersen, M.D. and Reichle, M.S., 1996, A Monte Carlo approach in estimating uncertainty for a seismic hazard assessment of Los Angeles, Ventura, and Orange counties, California: Bulletin of the Seismological Society of America, vol. 86, p. 1681-1691.
Field, E., Dawson, T., Ellsworth, W., Felzer, V., Frankel, A., Gupta, V., Jordan, T., Parsons, T., Petersen, M., Stein, R., Weldon, R., and Wills, C., 2008, The uniform California earthquake rupture forcast, version 2 (UCERF-2): U.S. Geological Survey Open-File Report 2007-1437 and California Geological Survey Special Report 203, 97 p.
Frankel, A.D., Petersen, M.D., Muller, C.S., Haller, K.M., Wheeler, R.L., Layendecker, E.V., Wesson, R.L., Harmsen, S.C., Cramer, C.H., Perkins, D.M., and Rukstales, K.S., 2002, Documentation for the 2002 Update of the National Seismic Hazard Maps: U.S. Geological Survey, Open-File Report 02-420, 33 p.
Jennings, C.W., compiler, 1994, Fault activity map of California and adjacent areas: California Department of Conservation, Division of Mines and Geology, California Geologic Data Map Series, map no. 8.
SHZR 110 SEISMIC HAZARD ZONATION OF THE LICK OBSERVATORY QUADRANGLE
39
FEMA, 1994, NEHRP Recommended Provisions for Seismic Regulations for New Buildings and Other Structures: Washington, D.C., FEMA 222A.
Petersen, M.D., Bryant, W.A., Cramer, C.H., Cao, T., Reichle, M.S., Frankel, A.D., Lienkaemper, J.J., McCrory, P.A. and Schwartz, D.P., 1996, Probabilistic seismic hazard assessment for the State of California: California Department of Conservation, Division of Mines and Geology Open-File Report 96-08; also U.S. Geological Survey Open-File Report 96-706, 33 p.
Petersen, M.D., Frankel, A.D., Harmsen, S.C., Mueller, C.S., Haller, K.M., Wheeler, R.L., Wesson, R.L., Zeng, Y., Boyd, O.S., Perkins, D.M., Luco, N., Field, E.H., Wills, C.J., and Rukstales, K.S., 2008, Documentation for the 2008 update of the United States National Seismic Hazard Maps: U.S. Geol. Survey Open-File Report 2008-1128, 60p.
Power, M., Chiou, B., Abrahamson, N., Bozorgnia, Y., Shantz, T., and Roblee, C., 2008, An overview of the NGA Project: Earthquake Spectra, v. 24, no. 1, p. 3-21
Real, C.R., Petersen, M.D., McCrink, T.P. and Cramer, C.H., 2000, Seismic Hazard Deaggregation in zoning earthquake-induced ground failures in southern California: Proceedings of the Sixth International Conference on Seismic Zonation, November 12-15, Palm Springs, California, EERI, Oakland, CA.
Youd, T.L., Idriss, I.M., Andrus, R.D., Arango, I., Castro, G., Christian, J.T., Dobry, R., Finn, W.D., Harder Jr., L.F., Hynes, M.E., Ishihara, K., Koester, J.P., Liao, S.S., Marcuson III, W.F., Martin, G.R., Mitchell, J.K., Moriwaki, Y., Power, M.S., Robertson, P.K., Seed, R.B., and Stokoe II, K.H., 2001, Liquefaction Resistance of Soils: Summary Report From the 1996 NCEER and 1998 NCEER/NSF Workshops on Evaluation of Liquefaction Resistance of Soils: Journal of Geotechnical and Geoenvironmental Engineering, vol. 127, p. 817-827.
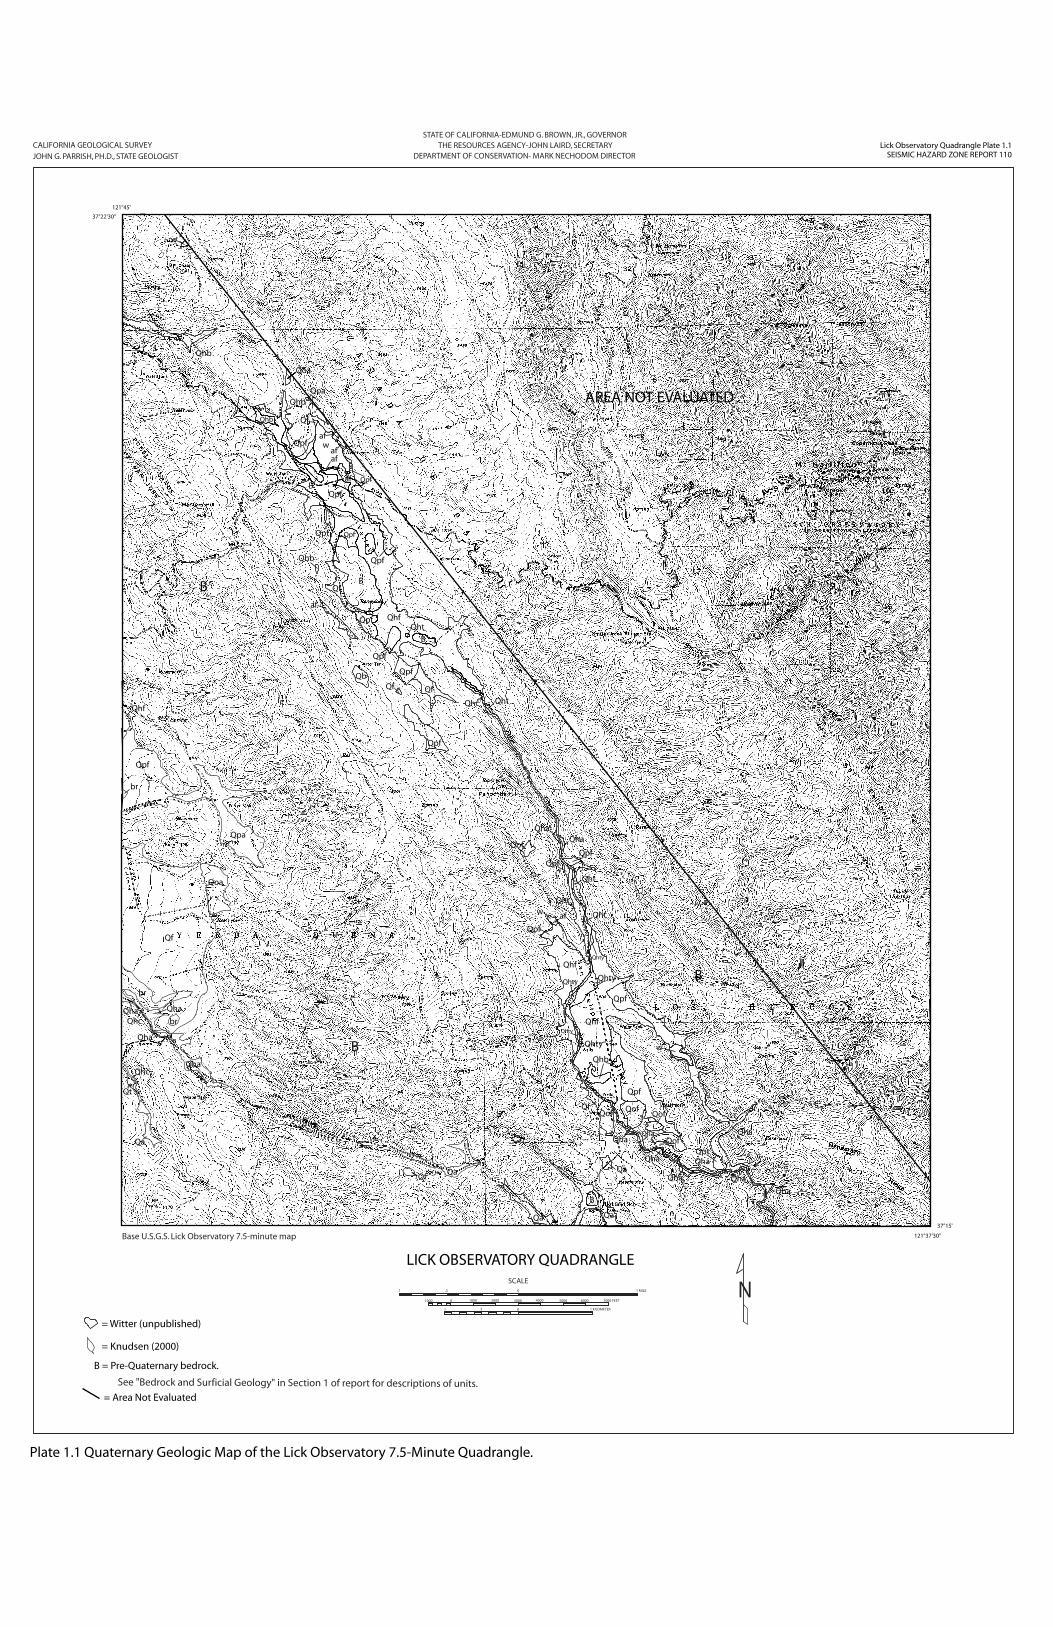
Base U.S.G.S. Lick Observatory 7.5-minute map
Plate 1.1 Quaternary Geologic Map of the Lick Observatory 7.5-Minute Quadrangle.
N1 0
0
0
1
1000 1000 2000 3000 4000 5000 6000 7000 FEET
1 MILE
1 KILOMETER.5
.5
SCALE
121°37'30"
121°45'
37°22'30”
37°15'
= Witter (unpublished)
= Knudsen (2000)
= Area Not Evaluated
B = Pre-Quaternary bedrock.
See "Bedrock and Surficial Geology" in Section 1 of report for descriptions of units.
SEISMIC HAZARD ZONE REPORT 110
LICK OBSERVATORY QUADRANGLE
CALIFORNIA GEOLOGICAL SURVEY
JOHN G. PARRISH, PH.D., STATE GEOLOGIST
STATE OF CALIFORNIA-EDMUND G. BROWN, JR., GOVERNORTHE RESOURCES AGENCY-JOHN LAIRD, SECRETARY
DEPARTMENT OF CONSERVATION- MARK NECHODOM DIRECTORLick Observatory Quadrangle Plate 1.1
AREA NOT EVALUATED
QaQa
w
B
QbQf
w
w
B
w
Qhb
Qoa
Qhb
QhbQoa
Qf
Qpfaf
QpfB
af
af
af
Qpf
Qhf
Qpf Qpf
Qpf
Qf
Qhb
af
B
Qht
Qpf
Qpf
Qpf
Qf
Qpf
Qhc Qht
Qhf
Qpf
af
Qhty Qhty
Qhf
Qpf
QhaQha
Qpf
Qht
Qpf
Qht
Qht
Qhty
Qhb
QofQofQof
Qf
Qhty
Qhty
Qpt
QaQha
QhaQha
Qha
Qha
Qha
Qha
Qha
B
Qof
Qpf
Qof
B
B
Qhc
Qha
Qhc
br
Qf
Qha
Qpf
br
Qhf
Qt
Qa
Qha
Qha
br
Qpa
Qoa
Qf Qa
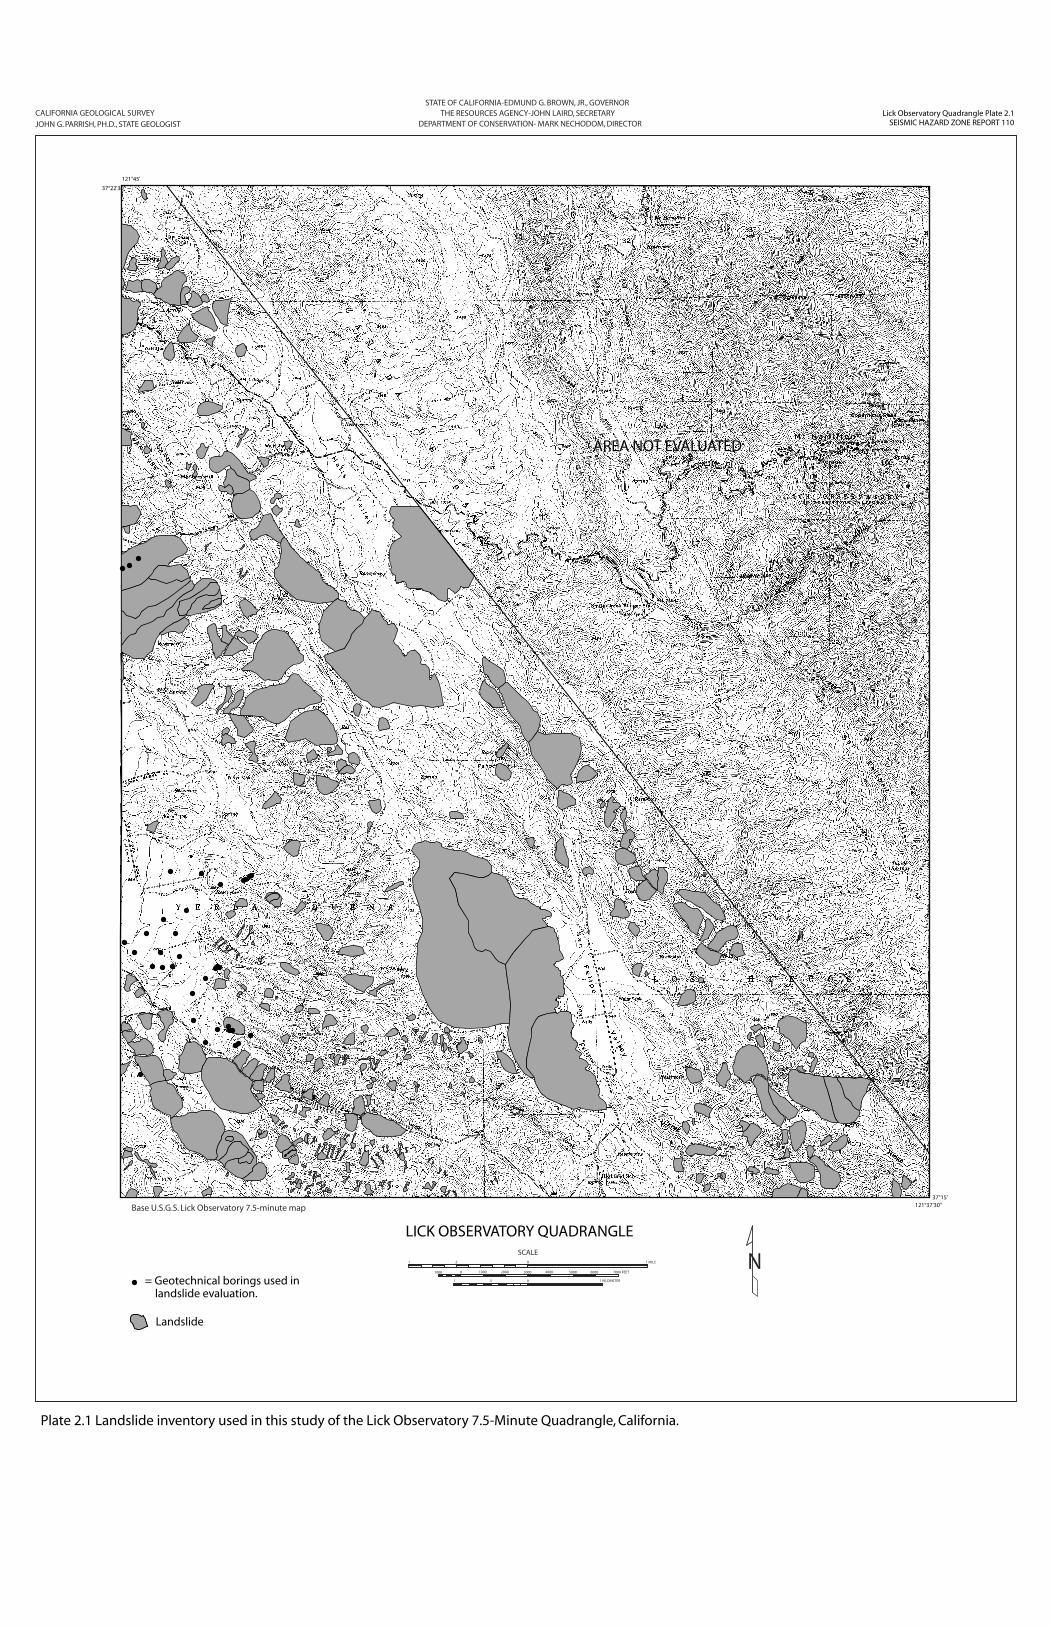
Base U.S.G.S. Lick Observatory 7.5-minute map
Plate 2.1 Landslide inventory used in this study of the Lick Observatory 7.5-Minute Quadrangle, California.
N1 0
0
0
1
1000 1000 2000 3000 4000 5000 6000 7000 FEET
1 MILE
1 KILOMETER.5
.5
SCALE
121°37'30"
121°45'
37°22'30”
37°15'
Landslide
= Geotechnical borings used in landslide evaluation.
SEISMIC HAZARD ZONE REPORT 110
LICK OBSERVATORY QUADRANGLE
CALIFORNIA GEOLOGICAL SURVEY
JOHN G. PARRISH, PH.D., STATE GEOLOGIST
STATE OF CALIFORNIA-EDMUND G. BROWN, JR., GOVERNORTHE RESOURCES AGENCY-JOHN LAIRD, SECRETARY
DEPARTMENT OF CONSERVATION- MARK NECHODOM, DIRECTORLick Observatory Quadrangle Plate 2.1
AREA NOT EVALUATED