Embed Size (px)
Citation preview

13th World Conference on Earthquake Engineering Vancouver, B.C., Canada
August 1-6, 2004 Paper No. 3243
SEISMIC BEHAVIOUR OF R/C WALLS SUBJECTED TO MULTI-DIRECTIONAL SEISMIC LOADING
Nicolae ILE1, Jean-Marie REYNOUARD2
SUMMARY
This paper studies the performance of a lightly reinforced concrete wall specimen, tested under bi-directional seismic excitations. To investigate the simplifying assumptions made in design, a 3-D refined non-linear analysis is conducted. Due to the out-of-plane excitation, high variation of axial force results in smaller bending capacity. Since seismic response is reasonably predicted, the model is used in the case when only one directional excitation is applied, or when vertical component is added to the other two horizontal components. In case of three directional excitations, lower ultimate moments and larger curvatures are obtained at failure than in the bi-directional case.
INTRODUCTION Within the French CAMUS, Bisch [1], and European TMR (Training and Mobility of Researchers) projects (www.cordis.lu/tmr/home.html) shaking table tests on lightly RC wall structures in different situations (fixed or not to the shaking table, placed on a layer of sand, with different reinforcement ratio,.. ) have been performed. The data provided by these experimental programs have been used not only to validate numerical models integrated on FE codes, Mazars [12], Faria [6], Fischinger [7], but also to improve existing design methods. During the current conversion of Eurocode 8 into a standard (EN1998-1: Design of structures for earthquake resistance) “large lightly reinforced walls” have been introduced along with the ductile walls present in the ENV (prestandard) version of EC 8, Fardis [5]. It is to be noted, that in these research programs only loadings in one direction (in the plane of the walls) were applied. In real structures, such walls are likely to be loaded in the out-of-plane direction as well and the question arises, how such walls behave under combined in-plane and out-of-plane loading. Moreover, no exhaustive studies have been conducted so far for this combination of loadings that can be extremely severe for wall structures. A new research programme CAMUS 2000 was launched in 1998 with the aim of evaluating the effects of torsion and the behaviour of lightly reinforced walls subjected to bi-directional motions. As a part of the
1 Research Engineer, INSA-Lyon, France. Email: [email protected] 2 Professor, INSA-Lyon, France. Email: [email protected]

program, two scaled (1/3) models representative of 5 storeys reinforced concrete buildings have been tested on the major Azalee shaking table of Commissariat à l’Energie Atomique CEA (France) in the Saclay Nuclear Centre. The first structure (CAMUS 2000-1) has been subjected to horizontal bi-directional excitations. Two identical shear walls in one direction and a steel bracing system in the orthogonal direction provided structural stiffness. For the second test (CAMUS 2000-2), an in-plane excitation was applied , Combescure [3]. A torsion response was caused by the fact that the two walls have different lengths. The objective of this work is to verify the design assumptions and to obtain more detailed information about the behaviour of walls with limited reinforcement when subjected to bi-directional earthquake motions. A first step consists in the 3-D numerical analysis of the seismic response of the CAMUS 2000-1 specimen. By comparing experimental and non-linear analysis results, the accuracy and efficiency of the computational tool is verified under bi-directional horizontal seismic loading. In further analyses the numerical model is used to predict the seismic response when only one in-plane horizontal excitation is applied, or when vertical component is added to the other two horizontal components.
DESIGN OF THE TEST SPECIMEN One of the objectives of the CAMUS 2000 research has been that of examination the influence of bi-directional seismic excitations on the inelastic behaviour of in-plane regular wall structures. Due to the acceleration perpendicular to the wall plane, simultaneous to the in-plane acceleration, more damage is to be expected at cracks closure. Owing to the very low reinforcement ratio and to the reinforcement yielding, steel-reinforcing bars may rapidly lose the capability of maintaining adjacent wall elements (i.e. separated by a crack) in a plane movement at load reversal. To study these effects, the test specimen has been designed as lightly reinforced and has been submitted to two horizontal un-correlated accelerograms in the X and Y directions (Figure 2). Since the research is more oriented towards the knowledge of the behaviour of lightly reinforced walls, there was no need to deduce the dimensions of the specimens directly from a reference building. However, it was considered as necessary that the general characteristics of the specimen can be deduced from elements, which can be found in a real building, in order to ensure a reasonable representativeness. So, five stories have been considered as representative of the current situation in France, and a scale factor of 1/3 has been chosen. For the definition of the maximum seismic action, due consideration has been given to the specimen’s strength in the perpendicular direction of the walls. As a matter of fact, this strength is that of the composite steel – concrete bracing system in the Y direction, which has been defined at the beginning of the previous CAMUS research programs, Bisch [1]. With a PS92 [14] specified seismic action defined by the NICE S1 PS92 design spectrum, the specimen has been designed for a peak ground acceleration (PGA) of about 0.51g and to a behaviour factor q = 3.73, Bisch [2]. The flexural reinforcement has been determined considering the existence of possible higher values for the tensile and compressive axial force in each wall, due to the out-of-plane loading effect. To enforce a predominantly flexural behaviour with nearly horizontal cracking all along the walls height, the flexural reinforcement has been optimised in each quarter of each level. Figure 1 indicates the flexural reinforcement distribution as well as the reinforcement ratio at the base of each storey. Verification under shear force indicated that the amplified designed shear is less than the design shear strength without reinforcement, so the specimen has no horizontal shear reinforcement. The specimen is composed of two parallel 5-floor RC walls without openings, linked together by 6 square floors, the reinforced concrete footing being anchored to the shaking table (Figure 1). The walls are each 5.10 m height, 1.70 m long and 6 cm thick. They were cast in order to reproduce the construction joints at the level of each floor. All the floors are 1.70 m long 1.70 m wide and 21 cm thick. The wall footing is 2.10 m, 0.60 m height and 10 cm thick. Additional mass was added to the upper and lower part of each floor (excepting the first floor) as well as on the walls at mid-height of each level, to simulate the gravity

load compatible with the vertical stress values commonly found at the base of this type of structure (about 1.6 MPa). The steel bracing system stabilising the structure in the direction perpendicular to the walls is shown in (Figure 2). It is designed in such a way that the two walls carry the entire vertical load. Only four steel bars acting in traction and compression connect the lateral bracing system of two different stories.
Side view Front view Reinforcement
Figure 1: General scheme of the CAMUS 2000-1 specimen (Dimensions in meters).
Front view Section 1 - 1
Figure 2: Steel bracing system for CAMUS 2000-1 specimen (Dimensions in centimeters).
Symmetrical reinforcement 6 HA 4.5
1 HA 4.5
1 HA 4.5
1 HA 4.5
1 HA 4.5
1 HA 4.5
1 HA 4.5
Ties at each floor
ρ = 0.094%
ρ = 0.062%
ρ = 0.031%
ρ = 0.016%
Symmetrical reinforcement 6 HA 4.5
1 HA 4.5
1 HA 4.5
1 HA 4.5
1 HA 4.5
1 HA 4.5
1 HA 4.5
Ties at each floor
ρ = 0.094%
ρ = 0.062%
ρ = 0.031%
ρ = 0.016%
1.70
2.10
0.60
0.90
0.90
0.90
0.90
0.90
2.10
6
10
21
1.70
X
Y
1 1
X
Y
X
Y
1 1
SEISMIC ACTION
The specimen was tested on the AZALEE shaking table, in the CEA facilities, which allows for testing 100 tons models under three directional excitations. During the shaking table tests the specimen was subjected to increasing horizontal artificial accelerations along the direction parallel and perpendicular to the walls plane. The following PGA levels of the uncorrelated input signals were applied during the test in both directions: 0.15g, 0.40g, 0.55g and 0.65g. The input signals have been derived from the French PS92 [14] spectrum S1, with a PGA of 2.5 m/s2.
BEHAVIOUR OF THE SPECIMEN Axial force Previous experimental and numerical studies on lightly reinforced walls subjected to in-plane uni-directional loading, Bisch [1], Ile [11] have underlined the importance of the variation of the dynamic axial force. A first cause of this phenomenon is the extension mode due to bending: at maximum horizontal deflection, the neutral axis is at its maximum distance from the centre of the wall cross-section, the raising of masses is maximum and the dynamic variation of the axial force is a tensile force; the frequency of this vertical motion is two times that of the horizontal movement. The second reason of this phenomenon relies on the excitation of the first natural vertical mode of the system: at cracks closure, when concrete recovers its stiffness, compression forces strongly increase and these shocks excite the vertical vibration mode of the system (shaking table+specimen). It is to be noted that the variation of the axial force affects the value of the maximum bending moment, as these two parameters act together to determine the ultimate state of strain in the wall. Therefore, axial force variation has to be taken into account in design. In conclusion of the previous CAMUS research, Fouré [8], the following principle has been proposed in order to introduce the axial force in design:
- in a first phase the design is made with the static value of the axial force N0 and the corresponding value of the ultimate bending moment Mult. The extreme strains at the section level are εa and εb, where εa stands for the tensile steel strain and εb for the compressive concrete strain. At least one of these two strains represents an ultimate strain corresponding to a limit state of the reinforced concrete section. For lightly reinforced walls with low axial compression, this limit state generally corresponds to εau = 10 x 10-3.
- in a second phase, the variation ±∆N of the axial force is considered. With the assumption that the
curvature is constant, a new limit state is found, corresponding to M’ult = Mult + ∆M and to the
extreme strains εa + ∆ εa and εb + ∆ εb. If the compressive strain in concrete is excessive ( > 3.5x10⁻³), either the width of the wall is increased, or the concrete is confined. If the tensile strain in the steel bars is excessive, the reinforcement area has to be increased.
The range of variation of the axial force is difficult to be known a priori because it depends on the vertical response of the structure and mainly on the soil-structure interaction. However, until further information from extensive parametric studies is available, the following formula for estimating the axial force variation has been proposed and accepted in the prestandard version of EC 8 (pr EN 1998-1, final project team, December 2001): ∆Nmax = ± λN0,
where, λ depends on the soil type, and on the ratio TA/0.5TF, TA, being the horizontal vibration period and TF the vertical vibration period of the structure.
Since the CAMUS 2000-1 specimen is subjected to bi-directional loading, the overturning moment perpendicular to the walls induces a complementary axial force in one wall and a tensile axial force in the other. The total axial force variation in each wall is then given by the superposition of the dynamic axial force due to the in-plane bending and of the axial force due to the out-of-plane loading. Based on previous experimental results on lightly reinforced walls, and taking into account the uncertainty of the dynamic axial force variation, design has assumed λ = 0.8. According to the two design combinations rules Sx + 0.3Sy and Sy + 0.3Sx, the maximum axial force (Nr) due to the out-of-plane loading in each wall has been calculated. Its design value is equal to ±192KN. The total variation of the axial force in each wall is then given by: ∆Nmax = ± λN0 ± Nr = ± 343KN , (N0 = 180.7 KN). This large variation (almost the double of the permanent load) indicates that different states of cracking from one wall to another are to be expected, leading to different lengthening of their neutral axis and asymmetric behaviour of the specimen. Torsional stiffness of the floors Due to the out-of-plane loading, also the torsional mode is expected to be excited as soon as inelastic behaviour is observed. At each level of the construction, the rotations of the wall sections are not the same and torsion of the floors is involved in the behaviour. At each level, the floors are then able to transfer a bending moment from one wall to the other. It is to be noted however, that in the case of CAMUS 2000-1 specimen, the thickness of the floors (21cm) was determined in order to provide the necessary floor strength under additional masses weight. This value is much higher than in a real construction. Since the usual thickness of floors is about 18 cm in a normal building, tacking into account a scale factor of 3, the thickness of the specimens’ floors should have been 6 cm. Hence, the torsional stiffness of the floors is much higher in the specimen than in a normal building and the twist rotation is expected to be much lower than in a real situation. Considering also the fact that the two perpendicular excitations are uncorrelated and maximum action effects do not generally occur at the same instant of time, the horizontal top displacements of the two walls should be similar. However, the vertical displacement of the two walls should be different, because the out-of-plane loading creates unequal axial forces in the two walls. It is clear that axial force effects as well as re-distribution of forces due to the evolution of stiffness of the walls are completely non linear and cannot be adequately represented in a standard linear elastic model. One aim of the non linear time history analysis is to verify these design assumptions and to obtain more detailed information about the behaviour of the specimen.
MODELLING APPROACH The numerical analyses have been performed using the general-purpose finite element program CASTEM 2000. To predict the inelastic seismic response with sufficient accuracy, due care has been given to create detailed model of the specimen, taking into account the necessary geometric characteristics, construction details and boundary conditions. An example of the 3-D finite element mesh used in the analyses is reported in Figure 3. Due to the direction of the applied loading, in-plane as well as out-of-plane behaviour of the walls need to be analysed. Therefore, layered thin shell discrete Kirchoff triangles (DKT) are used to represent the two walls and the slabs. The shaking table is modelled with solid eight-node brick elements, while four-node shell elements are used to model the steel I-shaped bracing system. A discrete modelling

is adopted to represent the reinforcement through the use of two-node truss-bar elements. The structure is assumed fully restrained at all nodes along the base of the shear wall. During previous tests on CAMUS specimens, Sollogoub [15], it was observed that the specimen oscillation have induced vertical and rocking displacements on the shacking table, leading to significant reductions of the corresponding natural frequencies. In these conditions, the shaking table itself in terms of mass and their external supports in terms of stiffness had to be included into the numerical model. Owing to its high stiffness the finite elements representing the shaking-table were assumed to remain elastic and almost infinitely rigid. The total mass of the shaking-table - 25 000 kg, was uniformly distributed to these finite elements. The vertical rods supporting the shaking-table were simulated with four elastic vertical bars, the axial stiffness of each bar being equal to 215 MN/m, as suggested by experimenters. Perfect bond was assumed to exist between concrete and reinforcement. The possibility of non-linear material behaviour was specified for all wall concrete and reinforcing bar-elements, while the behaviour of the foundation and bracing system was considered as elastic. Assuming a 2.5% critical damping factor (close to the measured damping value) for the first and second vibration mode, the damping parameters α and β were calculated and used subsequently to form the Rayleigh damping matrix [C] = α[M] + β[K], M and K being the mass and stiffness matrix. Despite the fact that a modal characterisation is theoretically correct only for linear elastic systems, the damping matrix [C] obtained in this way is assumed to remain constant throughout the loading cycle. To solve the non-linear equilibrium equations, a modified Newton-Raphson iteration solution scheme was used.
Figure 3: 3-D finite element mesh of the CAMUS 2000-1 specimen
CONSTITUTIVE MODELS AND MATERIAL PARAMETERS In order to achieve a good compromise between simplicity and accuracy a biaxial concrete model that provides acceptable representation of the cyclic inelastic behaviour of reinforced concrete under cyclic loading was used. This model adopts the concept of a smeared crack approach with a possible double cracking only at 90°. It is based upon the plasticity theory for uncracked concrete with isotropic hardening and associated flow rule. Two distinct criteria describe the failure surface: Nadai in compression and bi-compression and Rankine in tension. Hardening is isotropic and an associated flow rule is used. When the ultimate surface is reached in tension, a crack is created perpendicularly to the principal direction of maximum tensile stress, and its orientation is considered as fixed subsequently. Each direction is then processed independently by a cyclic uniaxial law, and the stress tensor in the local co-ordinate system

defined by the direction of the cracks is completed by the shear stress, elastically calculated with a reduced shear modulus modulus Gµ , (with 0 < µ < 1, and µ being a function of the crack opening strain) to account for the effect of interface shear transfer: µ = 0.4 ……………………..if εcr- εres- εtm = 2 εtm
µ = 0 ……………………….if εcr- εres- εtm = 2 εtm
µ = 0 and σ12 = 0…………...if εcr- εres- εtm = 4 εtm where: εcr - total strain εres - residual strain after unloading in compression εtm - crack opening strain σ12 – shear stress The behaviour of a point initially under tension, which completely cracks prior to undergoing a reverse loading in compression, is illustrated in Figure 4. Similar laws describe the case of an initial compressed point or that of a point, which has not totally cracked under a reverse loading. The model has been described in detail and verified elsewhere. Its validity has been demonstrated by using it to predict the behaviour of shear walls with different span-to-height ratio under monotonic, cyclic and dynamic loading conditions for which experimental observation was available, Ile [10].
10
E
f t
E0
εcm
2
9
45
1STRAIN
STRESSfc
-fc
E2
-ft
PF
11
12
1εtm
7
8E3
6 3
1 - Elastic tension2 - Crack opening3, 8 Crack closing4 - Nonlinear compression5, 11 - Damaged unloading, E2 ≠ E0
6 - Damaged unloading. Modulus = E1
7 - Reopening of crack9 - Reloading: Linear compression10 - Softening behaviour in compression12 - Elastic tension with resistance f’c < ft
Figure 4: Uniaxial model: point initially in tension For steel, a cyclic model that can take into account the Bauschinger effect and buckling of reinforcing bars has been adopted (Figure 5). The monotonic branch is characterised by an initial linear branch followed by a plateau and hardening up to failure. The cyclic behaviour is described by the formulation proposed by Giuffré and Pinto and implemented by Menegoto and Pinto [13]. A detailed description of the steel constitutive law can be found in Guedes [9].
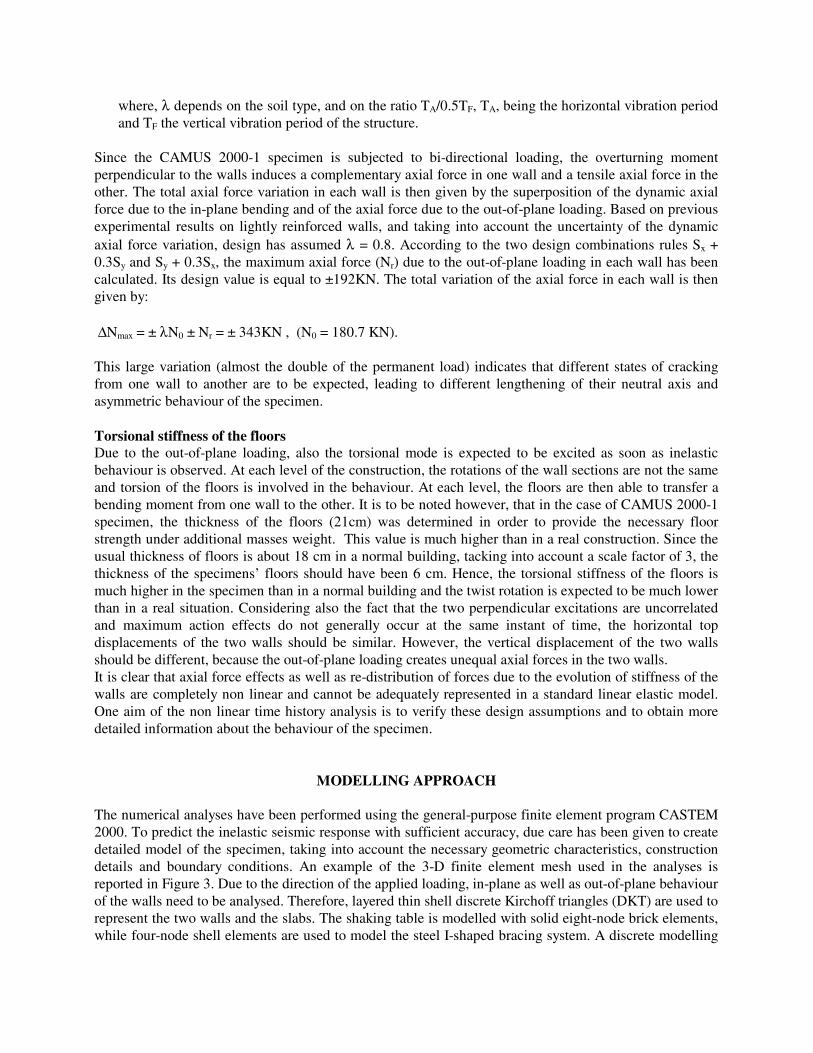
a) cyclic behaviour without buckling b) cyclic behaviour with buckling
Figure 5: Numerical model for steel under cyclic loading
The evaluation of steel parameters was quite simple, the measured elasticity modulus – 200000 MPa, yield stress - 664 MPa, failure stress - 733 MPa and strain at failure - 2.2%, being directly used. For concrete, the material properties were generally as provided by the CAMUS 2000-1 experimental data and design codes: Ec = 23000 MPa for the initial elastic modulus, 34 MPa for the compressive strength and 2.6 MPa for the tensile strength. An initial value of 0.40 for the post-cracking parameter µ was assumed in the analysis. In order to calibrate the first two experimentally observed natural frequencies (5.8 Hz in the out-of-plane direction and 6.25 Hz in the direction parallel to the walls) it was necessary to adopt a reduced elastic modulus for the footing (Ec/3.0). BI-DIRECTIONAL (XY) EXCITATION. COMPARISON WITH EXPERIMENTAL RESULTS.
Due to the fact that the structure is hyperstatic the experimental internal forces in each wall were difficult to be estimated. The experiment could not indicate the values of the bending moment in each wall, which are however, important. Since the numerical model can indicate individual bending moment at specified locations in each wall, its usefulness in investigating the wall behaviour is obvious. In the numerical analysis, all the seismic signals applied to the specimen were considered in chronological order. Both numerical and experimental results showed that the relative top in-plane horizontal displacements of the two walls were similar, due to the high torsional stiffness of the floors. Therefore, comparison of relative displacements in X direction concerns only average time history values of the two walls. First comparisons presented in Figure 6 to 8 concerns relative horizontal displacements in X (in-plane) and Y (out-of-plane) directions. As can be seen, the correlation between analysis and experiment is generally very satisfactory, even for very high transient input motions. It should be noted however, that for PGA = 0.65g the amplitude and frequency of the relative out-of-plane displacement is underestimated by the numerical model. Actually, during this last test, the failure of the connection of the bracing system with the slab was obtained, one branch of the bracing system being completely dislocated from the slab. This was probably due to a higher out-of-plane shear force than anticipated in design. Since the behaviour of this connection was considered as elastic in the analysis, the observed discrepancies between experimental results and analysis seem normal. The analysis predicted failure of the specimen by rupture of one reinforcing bar for a relative horizontal in-plane displacement of about 3.0 cm, the maximum recorded relative displacement being around 3.50 cm. A complete analytical time-history response is not provided in Figure 8, because analysis was stopped after the rupture of the steel bar due to the difficulties in obtaining the convergence at this stage. Local results as obtained from the dynamic analysis are seen in Figure 9. This figure depicts the damage distribution
ξ0 . (ε0−ερ)2
ξ1 . (ε0−ερ)1
(εr , σr)1
(ε0 , σ0)1 (εr , σr)0 (εr , σr)2
(ε0 , σ0)2
(ε0 , σ0)0
E0 E0
Eh
Eh
σ
ε
R(ξ1)
R(ξ2) σ = f(ε)
E
b x E
σ
ε
σ = f(ε)
Er
ε0ε5
γsbc x E
ξ0 . (ε0−ερ)2
ξ1 . (ε0−ερ)1
(εr , σr)1
(ε0 , σ0)1 (εr , σr)0 (εr , σr)2
(ε0 , σ0)2
(ε0 , σ0)0
E0 E0
Eh
Eh
σ
ε
R(ξ1)
R(ξ2) σ = f(ε)
E
b x E
σ
ε
σ = f(ε)σ = f(ε)
Er
ε0ε5
γsbc x E

obtained just after one of the steel bars of the left wall has broken in tension. The analysis results indicate that damage is almost entirely concentrated just under the 2nd floor level and highlights the fact that crack opening is larger for the wall which is in tension as compared to the wall which is in compression. This seems to be in reasonable agreement with what was experimentally observed: at failure a wide crack opens under the 2nd floor level and inspection after the test show that the steel bars are broken at this level (see Figure 9).
Figure 6: Comparison between calculated and measured horizontal relative top displacements for
PGA = 0.40g: A) in-plane displacement; B) out-of-plane displacement.
Figure 7: Comparison between calculated and Figure 8: Comparison between calculated and measured horizontal relative displacements: measured horizontal relative displacements: A) in-plane displacement A) in-plane displacement B) out-of-plane displacement. B) out-of-plane displacement.

right wall left wall
Vertical concrete strain contours at failure Crack pattern at the end of the test
Figure 9: Comparison between test and analysis at failure.
Figure 10 to 12 present numerical results in terms of bending moment – axial force interaction diagrams at one critical section (base of the 2nd storey), together with the variation of axial load and moment. The differences between these two last tests concern only the displacements and strains and the behaviour of the specimen is very similar to that of a ductile structure, the value of the PGA to be resisted by the structure being a function of the maximum strain attained in the constitutive materials. It is also to be noted that two plastic hinges tend to form at two critical sections (base of the 1st and 2nd storey) and this aspect confirms the design intention, which aimed at distributing the damage over the height of the structure. However, the fact that the analysis predicted failure only at one critical section (the base of the 2nd storey) indicates that it is almost impossible to attain simultaneously the ultimate strains in all potential plastic hinges. It is to note that the design method was able to give good results in terms of ultimate PGA, because failure of the specimen was obtained for a higher PGA (0.65g) than assumed in design (0.51g). It is also worthily to be mentioned that no lateral sliding have appeared during the shaking table tests and the specimen was still able to sustain the vertical load at the end of the tests. The overly conservative design can be explained by the following facts:
- during seismic response, the torsional stiffness of the floors may have a favourable effect on the ultimate strength of the structure, by redistributing forces between the two walls.
- the actual reinforcing steel yield strength (664 MPa) is higher than that assumed in design (500
MPa).
- design has assumed λ = 0.8. This leads to a much higher value of the axial force variation as compared to the test and numerical analysis results.

All these aspects indicate that the design method is adequate, but the λ value assumed for the CAMUS 2000-1 specimen seems somehow too high. Based on numerical analysis results (also confirmed by test results) it is believed that if, for this particular case, a value of λ between 0.5-0.6 have been adopted, it would have led to a more realistic estimation of the ultimate design PGA. It is to be remarked that the 3-D non linear analysis have predicted very consistent results in terms of axial force variation, hence design has to be based on non linear analysis. However, since these results correspond to a specific case, systematic parametric studies considering a wider variety of geometric configurations and boundary conditions are still needed, in order to provide realistic bounds for the variation of the axial force to be taken into account in design.
Figure 10: Bending moment – Axial force interaction diagrams and variation of bending moment and axial force at the base of the 2nd storey (PGA = 0.40g).
Figure 11: Bending moment – Axial force interaction diagrams and variation of bending moment
and axial force at the base of the 2nd storey (PGA = 0.55g).
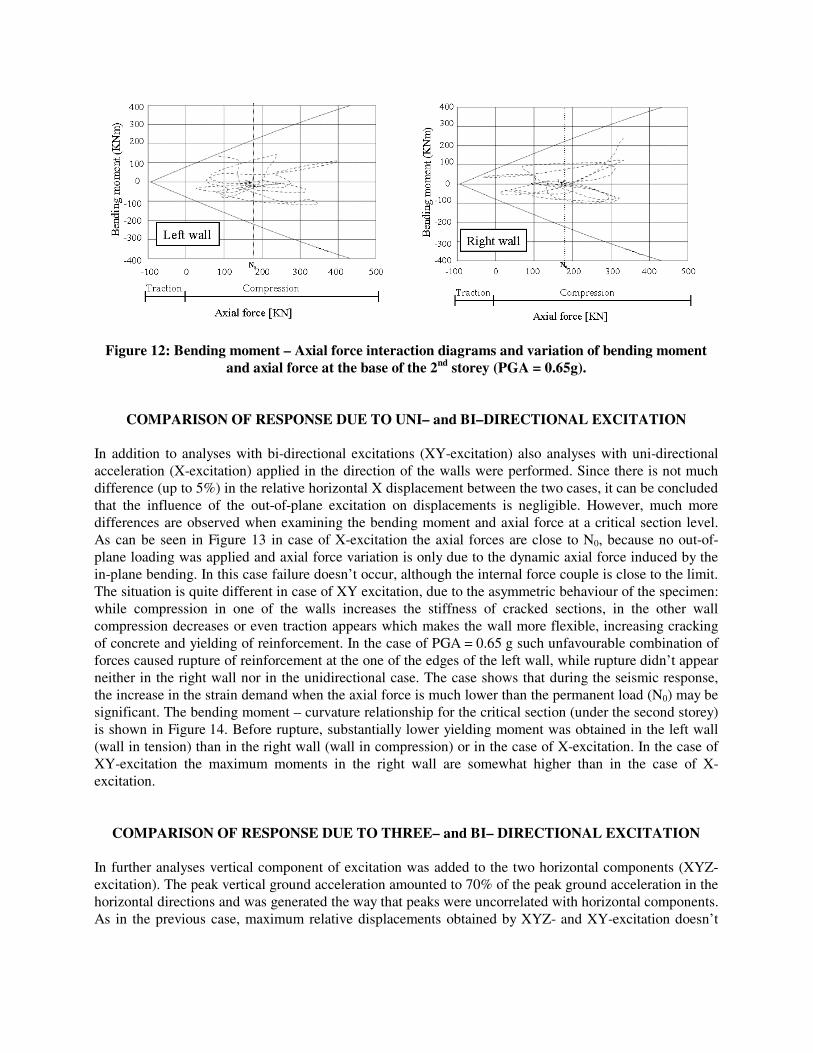
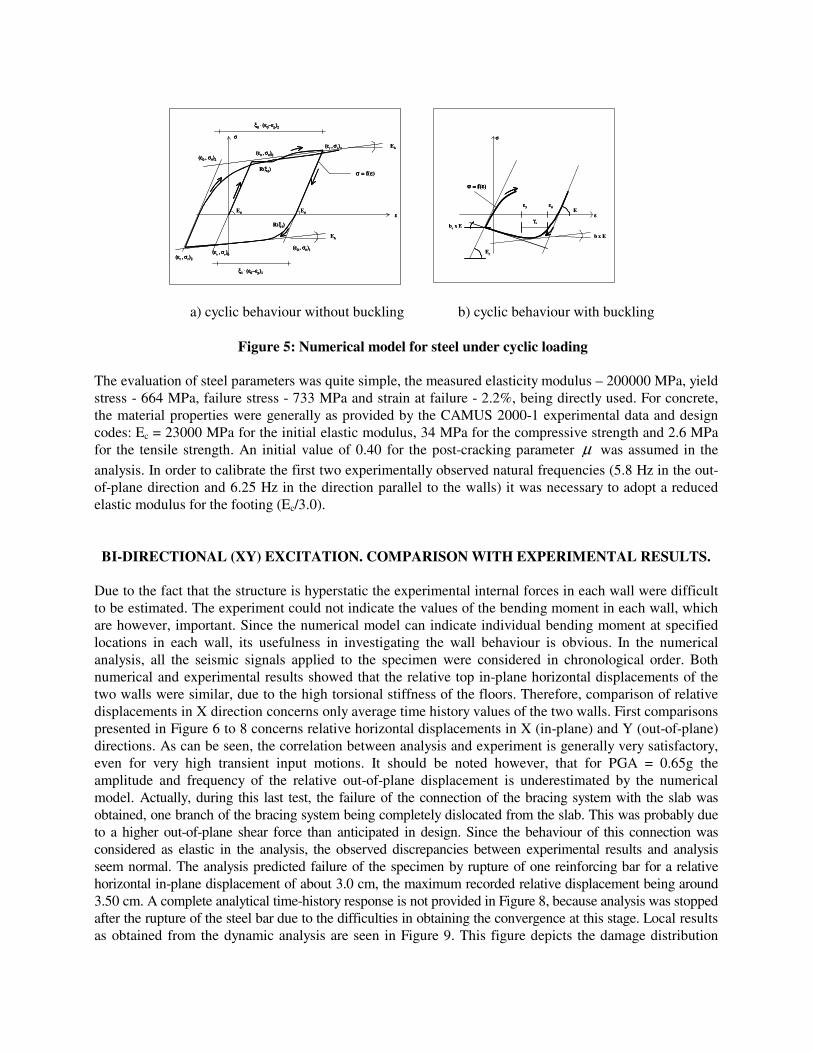
Figure 12: Bending moment – Axial force interaction diagrams and variation of bending moment
and axial force at the base of the 2nd storey (PGA = 0.65g).
COMPARISON OF RESPONSE DUE TO UNI– and BI–DIRECTIONAL EXCITATION In addition to analyses with bi-directional excitations (XY-excitation) also analyses with uni-directional acceleration (X-excitation) applied in the direction of the walls were performed. Since there is not much difference (up to 5%) in the relative horizontal X displacement between the two cases, it can be concluded that the influence of the out-of-plane excitation on displacements is negligible. However, much more differences are observed when examining the bending moment and axial force at a critical section level. As can be seen in Figure 13 in case of X-excitation the axial forces are close to N0, because no out-of-plane loading was applied and axial force variation is only due to the dynamic axial force induced by the in-plane bending. In this case failure doesn’t occur, although the internal force couple is close to the limit. The situation is quite different in case of XY excitation, due to the asymmetric behaviour of the specimen: while compression in one of the walls increases the stiffness of cracked sections, in the other wall compression decreases or even traction appears which makes the wall more flexible, increasing cracking of concrete and yielding of reinforcement. In the case of PGA = 0.65 g such unfavourable combination of forces caused rupture of reinforcement at the one of the edges of the left wall, while rupture didn’t appear neither in the right wall nor in the unidirectional case. The case shows that during the seismic response, the increase in the strain demand when the axial force is much lower than the permanent load (N0) may be significant. The bending moment – curvature relationship for the critical section (under the second storey) is shown in Figure 14. Before rupture, substantially lower yielding moment was obtained in the left wall (wall in tension) than in the right wall (wall in compression) or in the case of X-excitation. In the case of XY-excitation the maximum moments in the right wall are somewhat higher than in the case of X-excitation.
COMPARISON OF RESPONSE DUE TO THREE– and BI– DIRECTIONAL EXCITATION In further analyses vertical component of excitation was added to the two horizontal components (XYZ-excitation). The peak vertical ground acceleration amounted to 70% of the peak ground acceleration in the horizontal directions and was generated the way that peaks were uncorrelated with horizontal components. As in the previous case, maximum relative displacements obtained by XYZ- and XY-excitation doesn’t

show much difference (up to 4%). The damage pattern is almost the same and rupture occurs at the same reinforcement bar and practically at the same time instant. There are however larger differences in the axial forces, because in the case of XYZ-excitation the axial force at failure is close to 0, while in the bi-directional case the axial force is a compression equal to about 83 KN (Figure 13). Therefore, in the case of XYZ-excitation somewhat lower ultimate moments and larger curvatures were obtained at failure than in the case of XY-excitation (Figure 14). In assessing the above results it should be noted that this limited study is not intended to suggest any range of variation of the axial force to be considered in design, in recognition of the presence of vertical ground motion. The work is rather intended to highlight the significance of the vertical input for lightly reinforced walls, which has thus far been neglected. The fact that the increase in axial load variation may have a detrimental effect on the bending moment and possibly on the shear capacity suggests, at the very least, that further study is required.
Figure 13: Bending moment – axial force interaction diagrams and variation of axial force and bending moment at the base of the 2nd storey (PGA = 0.65g).

Figure 14: Bending moment–curvature relationship at the base of the 2nd storey (PGA = 0.65g).
CONCLUSIONS This paper describes the seismic behaviour of a lightly reinforced wall specimen under bi-directional loading. The significant effect of the wall degradation on the stiffness and strength of the wall suggests that it is always important to base design from analytical modelling and experimental observations. This is due to the fact that axial force effects as well as re-distribution of forces due to the evolution of stiffness of the walls are completely non linear and cannot be adequately represented in a standard linear elastic model. The experimental analytical comparisons not only demonstrate the accuracy of the time-history analysis model, but also allow obtaining more detailed information about the behaviour of the specimen when it is subjected to different loading conditions. With regard to the uni-directional excitation, bi-directional excitation can importantly increase the strain demand of reinforced concrete walls with limited reinforcement, mainly because of increasing the variation of the axial force. In the case when in addition to both horizontal directions, the excitation was introduced also in vertical direction, additional variation of the axial force is to be expected. Since this study was concerned with a particular case, it is clear that more systematic and parametric studies considering a wider variety of geometric configurations and boundary conditions, will be required to establish definite criteria for efficient design of lightly reinforced walls. Based on the results obtained in this study, it appears to be possible to investigate behaviour trends for a wider variety of configurations than is practically possible to study experimentally.
AKNOWLEDGEMENT This research was financed by the Civil Works Program (French Ministries of Equipment and National Education), CEA (French Atomic Energy Commission), FFB (French National Federation of Housing), EDF (French Electricity Utility) and EC (European Commission).
REFERENCES 1. Bisch P, Coin A. “The CAMUS research”, Proccedings of the 11th European Conference on Earthquake Engineering, Paris, CD-ROM, Vol. 2, 1998, 13p. 2. Bisch P, Coin A. “The “CAMUS 2000” research.” Proccedings of the 12th European Conference on Earthquake Engineering, London, CD-ROM, 9-13 September, 2002, 10p. 3. Combescure D, Queval JC, Chaudat T, Sollogoub P. “ Seismic Behaviour of Non Symmetric R/C Bearing Walls Specimen with Torsion. Experimental Results and Non Linear Numerical Modelling.”, Proccedings of the 12th European Conference on Earthquake Engineering, London, CD-ROM, 9-13 September, 2002, 9p. 4. EUROCODE 8. “Structures in seismic regions, Design, Part 1, General and Building”, Report EUR 12266 EN, Bruxelles: Office for official publications of the european communities, 1998, 327p. 5. Fardis MN. “Eurocode 8 – Present state, pre-normative and co-normative research needs (including design seismic action),” Proceedings of the Workshop: Mitigation of Seismic Risk Support to Recently Affected European Countries, European Commission-JRC Nov.27-28, Belgirate (VB), Italy, 2000, 10p. 6. Faria R, Pouca NV, Delgado R. “Seismic Behaviour of a R/C Wall: Numerical Simulation and Experimental Validation,” Journal of Earthquake Engineering, Vol. 6, No 4, 2002, pp. 473-498. 7. Fischinger M, Isacovic T, Kante P. “CAMUS 3 International Benchmark, Report on numerical modeling, blind prediction and post-experimental calibrations,” IKPIR Report EE – 1/02, University of Ljubljana, ISBN 951-6167-45-6, 2002, 118p. 8. Fouré B, Vié D. “CAMUS 2000 Project – CAMUS 2000 project, Final report, Vol. 12, Section 5, Document 2, Study on the Dynamic Aial Force”, Report No. R112-9-348, CEBTP, November, (in French), 2002, 47p. 9. Guedes J, Pégon P, Pinto AV. “A Fibre/Timoshenko Beam Element in CASTEM 2000”, Special Publication Nr. I.94.31, Joint Research Centre, 1994, July, 55p. 10. Ile N, Reynouard J-M. “Non-linear analysis of reinforced concrete shear wall under earthquake loading”, Journal of Earthquake Engineering, Vol. 4, No 2, 2000, pp. 183-213. 11. Ile N, Reynouard J-M, Georgin J-F. “Non-linear Response and Modelling of RC Walls Subjected to Seismic Loading”, ISET Journal of Earthquake Technology, Vol. 39, No. 1-2, March-June, 2002, 20p. 12. Mazars J. “French advanced research on structural walls: An overview on recent seismic programs” Proceedings of the 11th European Conference on Earthquake Engineering, Invited Lectures, Paris, 1998, pp 21-41. 13. Menegoto M, Pinto P. “Method of analysis of cyclically loaded reinforced concrete plane frames including changes in geometry and non-elastic behaviour of elements under combined normal force and bending,” IABSE Symposium on resistance and ultimate deformability of structures acted on by well-defined repeated loads, Final report, Lisbon, 1973, 328p. 14. REGLES PS 92. “Règles de construction parasismique, Règles PS applicables aux bâtiments, dites Règles PS 92”, norme française, AFNOR, 1995, 217p. 15. Sollogoub P, Combescure D, Queval J-C, Chaudat T. “In Plane Seismic Behaviour of Several 1/3rd Scaled R/C Bearing Walls – Testing and Interpretation Using Non-Linear Numerical Modelling”, Proceedings of the 12WCEE Conference, Auckland, 2000, 9p.