Embed Size (px)
Citation preview
Richards D.J. et al. Geotechnique {http://dx.doi.org/10.1680/jgeot.14.P.121}
Manuscript received 1 July 2014; revised manuscript accepted 6 November 2015. Discussion on this paper welcomed by the editor.
*Faculty of Engineering and the Environment, University of Southampton, Southampton, U.K.
Seepage and pore pressures around
contiguous pile retaining walls
D.J. Richards*, C.A. Wiggan* and W. Powrie*
Faculty of Engineering and the Environment, University of Southampton, Southampton SO17 1BJ,
United Kingdom
ABSTRACT. Diaphragm and bored pile retaining walls are often used for the construction of
basements, metro station boxes and cut-and-cover tunnels in urban areas. While diaphragm and secant
pile walls are generally intended (and assumed in analysis) to be effectively impermeable, contiguous
piles may allow through-the-wall seepage even when preventative measures have been undertaken.
Provided the flowrates can be tolerated or dealt with, through-the-wall seepage should result in a
reduction in pore water pressures behind the retaining wall compared with an impermeable construction,
giving the potential for reductions in the depth of embedment and wall thickness, hence cost. However,
this potential is rarely realised owing to the difficulty in quantifying with sufficient confidence the
hydraulic regime associated with a leaky retaining wall. This paper reports the results of laboratory
investigations and numerical analyses carried out to assess the effect of the inter-pile gaps on the pore
pressure distribution around a contiguous pile retaining wall. The results show that the pore pressures
behind the piles reduce significantly as the pile spacing is increased. Long-term field monitoring
confirms that the pore water pressures are much lower than would be expected for an impermeable
retaining wall in similar soil. The applicability of a simple expression linking the pile diameter, pile
spacing and the effective permeability of an equivalent uniform wall is demonstrated.
KEYWORDS: Pore pressures 1; retaining walls 2; seepage 3; contiguous piles 4;
INTRODUCTION
Pore water pressures around retaining walls
In analyses, embedded retaining walls are generally treated as impermeable, with long term pore water
pressures taken to correspond to steady-state seepage from the groundwater level behind the wall to the
excavated surface in front. Although a diaphragm or secant pile wall might reasonably be regarded as
impermeable, a contiguous pile wall will allow flow to occur through it unless the gaps between the
piles are adequately sealed.
Investigations into the hydraulic conditions around tunnels with segmented linings have shown that the
pore pressures in the surrounding soil reduce significantly when the tunnel linings are permeable (Ward
and Pender, 1981; Shin et al.,, 2002; Gourvenec et al.,, 2005; Bobet and Nam, 2007; Yoo et al.,, 2008;
Arjnoi et al.,, 2009 and Shin, 2010). The benefits of allowing flow through segmented tunnel linings,
as shown by numerical analyses, include reductions in hoop stresses and axial forces of up to 25%
(Arjnoi et al.,, 2009), 30% (Schweiger et al.,, 1991) and possibly as much as 70% (Lee et al., 2003: Lee
& Nam, 2006).
Although research into the impact of through-the-wall seepage for retaining walls is limited (e.g.
Zradkovic et al.,, 2007), field evidence suggests that the long-term pore pressures and horizontal total
stresses behind contiguous pile retaining walls through which flow is allowed (i.e., where an internal
water-retaining lining is not installed) are considerably less than behind truly impermeable walls.
Richards et al., (2007) reported a reduction in the pore water pressures behind a contiguous pile
retaining wall forming one side of a retained cut in overconsolidated clay on High Speed 1 (HS1, the
Channel Tunnel Rail Link) at Ashford over the period following construction. A corresponding decrease
in total horizontal stresses over the same period was also observed. The reduction in pore pressures
behind the contiguous piles was attributed at the time to drainage of the Atherfield Clay into the
Richards D.J. et al. Geotechnique {http://dx.doi.org/10.1680/jgeot.14.P.121}
Manuscript received 1 July 2014; revised manuscript accepted 6 November 2015. Discussion on this paper welcomed by the editor.
*Faculty of Engineering and the Environment, University of Southampton, Southampton, U.K.
underlying more permeable Weald Clay and, despite measures to seal the pile gaps, seepage evident
through the semi-permeable contiguous pile wall.
Powrie et al., (1999) and Carder et al., (1999) also reported reduced long-term pore pressures behind
retaining walls formed from contiguous piles in overconsolidated clays at Woodford, East London. This
reduction in pore pressures was attributed to underdrainage to a more permeable stratum, but through-
the-wall seepage could also have had an effect.
These observations for contiguous pile walls are in contrast to data from the secant pile retaining walls
forming the tunnels at Bell Common reported by Hubbard et al., (1984). In that case, the water levels
measured in the Claygate Beds behind the secant piles varied seasonally between 3.5m and 4.5m below
ground level during the autumn and remained close to ground level during the spring, despite the
presence of a 3m deep drain behind the retaining wall. The piezometric levels in the London Clay
remained constant at approximately 7m below ground level.
Gaba et al., (2003) comment on the potential economic benefits of designing a retaining wall on the
basis of through-the-wall seepage as a result of reduced pore pressures in the retained soil. However,
flow through the gaps between the piles in a contiguous pile wall is a three-dimensional problem, and
there is little guidance available to designers to relate the geometry of the wall (pile diameter and
spacing) to the reductions in pore pressure that might ensue.
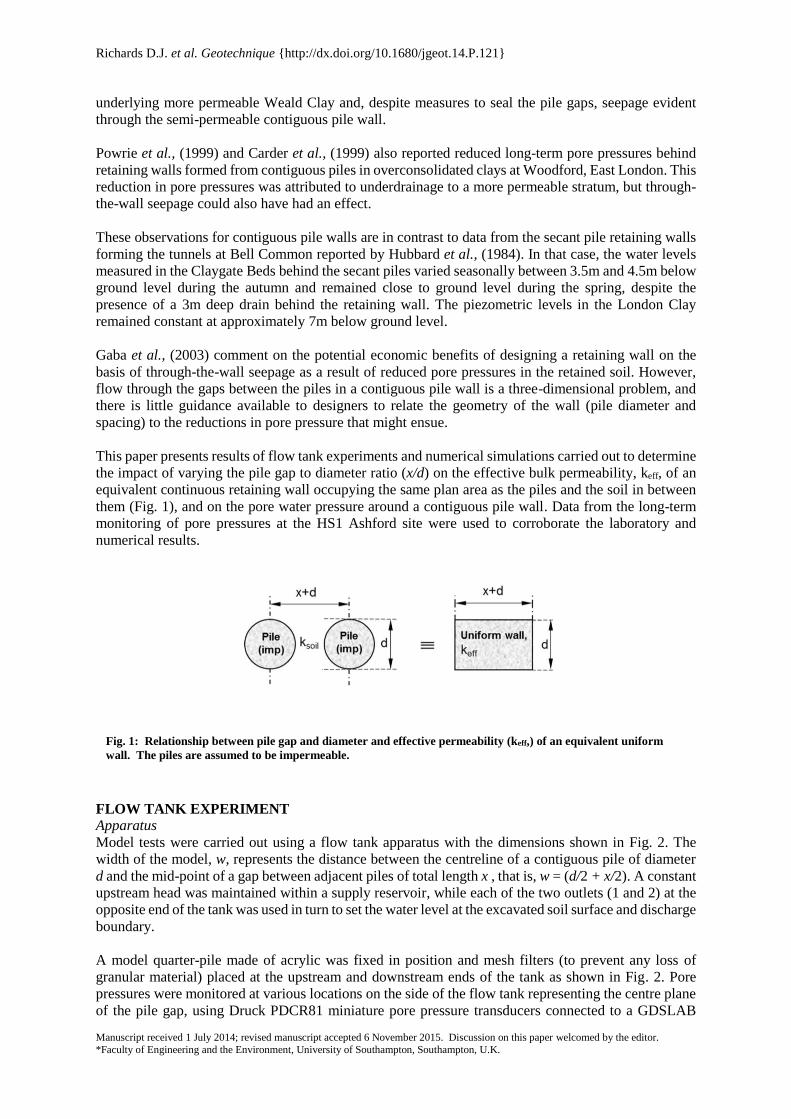
This paper presents results of flow tank experiments and numerical simulations carried out to determine
the impact of varying the pile gap to diameter ratio (x/d) on the effective bulk permeability, keff, of an
equivalent continuous retaining wall occupying the same plan area as the piles and the soil in between
them (Fig. 1), and on the pore water pressure around a contiguous pile wall. Data from the long-term
monitoring of pore pressures at the HS1 Ashford site were used to corroborate the laboratory and
numerical results.
FLOW TANK EXPERIMENT
Apparatus
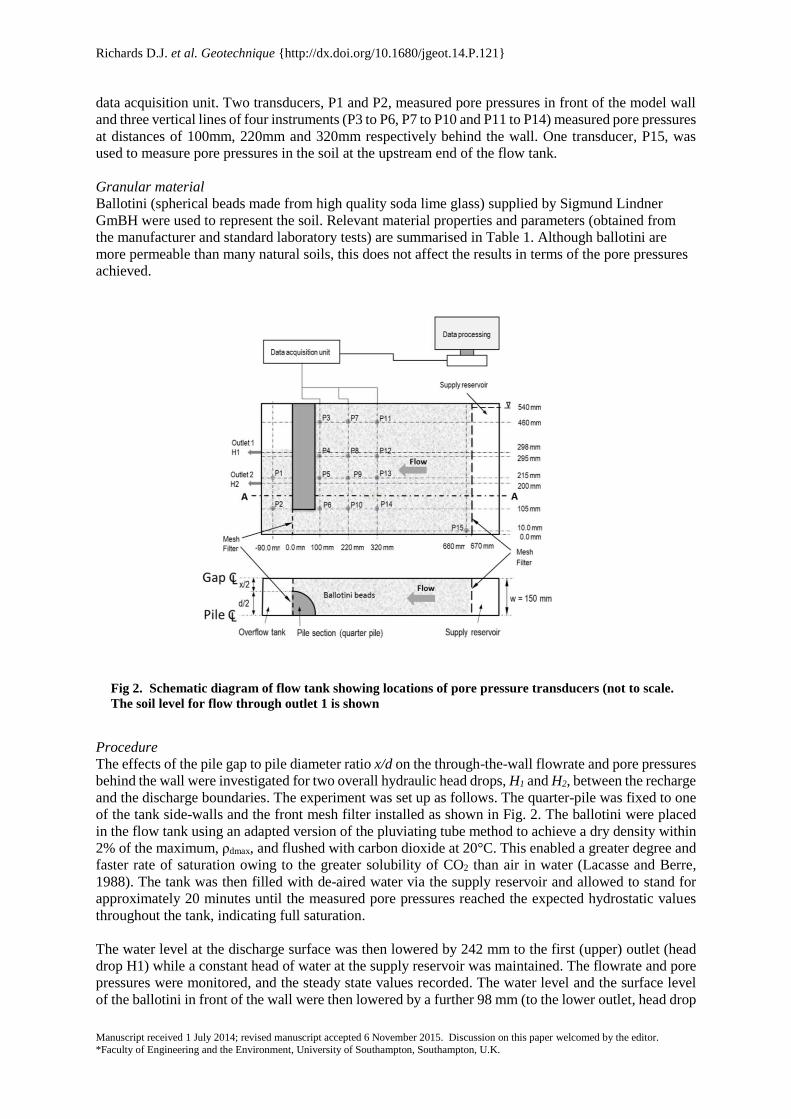
Model tests were carried out using a flow tank apparatus with the dimensions shown in Fig. 2. The
width of the model, w, represents the distance between the centreline of a contiguous pile of diameter
d and the mid-point of a gap between adjacent piles of total length x , that is, w = (d/2 + x/2). A constant
upstream head was maintained within a supply reservoir, while each of the two outlets (1 and 2) at the
opposite end of the tank was used in turn to set the water level at the excavated soil surface and discharge
boundary.
A model quarter-pile made of acrylic was fixed in position and mesh filters (to prevent any loss of
granular material) placed at the upstream and downstream ends of the tank as shown in Fig. 2. Pore
pressures were monitored at various locations on the side of the flow tank representing the centre plane
of the pile gap, using Druck PDCR81 miniature pore pressure transducers connected to a GDSLAB
Fig. 1: Relationship between pile gap and diameter and effective permeability (keff,) of an equivalent uniform
wall. The piles are assumed to be impermeable.
Richards D.J. et al. Geotechnique {http://dx.doi.org/10.1680/jgeot.14.P.121}
Manuscript received 1 July 2014; revised manuscript accepted 6 November 2015. Discussion on this paper welcomed by the editor.
*Faculty of Engineering and the Environment, University of Southampton, Southampton, U.K.
data acquisition unit. Two transducers, P1 and P2, measured pore pressures in front of the model wall
and three vertical lines of four instruments (P3 to P6, P7 to P10 and P11 to P14) measured pore pressures
at distances of 100mm, 220mm and 320mm respectively behind the wall. One transducer, P15, was
used to measure pore pressures in the soil at the upstream end of the flow tank.
Granular material
Ballotini (spherical beads made from high quality soda lime glass) supplied by Sigmund Lindner
GmBH were used to represent the soil. Relevant material properties and parameters (obtained from
the manufacturer and standard laboratory tests) are summarised in Table 1. Although ballotini are
more permeable than many natural soils, this does not affect the results in terms of the pore pressures
achieved.
Procedure
The effects of the pile gap to pile diameter ratio x/d on the through-the-wall flowrate and pore pressures
behind the wall were investigated for two overall hydraulic head drops, H1 and H2, between the recharge
and the discharge boundaries. The experiment was set up as follows. The quarter-pile was fixed to one
of the tank side-walls and the front mesh filter installed as shown in Fig. 2. The ballotini were placed
in the flow tank using an adapted version of the pluviating tube method to achieve a dry density within
2% of the maximum, ρdmax, and flushed with carbon dioxide at 20°C. This enabled a greater degree and
faster rate of saturation owing to the greater solubility of CO2 than air in water (Lacasse and Berre,
1988). The tank was then filled with de-aired water via the supply reservoir and allowed to stand for
approximately 20 minutes until the measured pore pressures reached the expected hydrostatic values
throughout the tank, indicating full saturation.
The water level at the discharge surface was then lowered by 242 mm to the first (upper) outlet (head
drop H1) while a constant head of water at the supply reservoir was maintained. The flowrate and pore
pressures were monitored, and the steady state values recorded. The water level and the surface level
of the ballotini in front of the wall were then lowered by a further 98 mm (to the lower outlet, head drop
Fig 2. Schematic diagram of flow tank showing locations of pore pressure transducers (not to scale.
The soil level for flow through outlet 1 is shown
Richards D.J. et al. Geotechnique {http://dx.doi.org/10.1680/jgeot.14.P.121}
Manuscript received 1 July 2014; revised manuscript accepted 6 November 2015. Discussion on this paper welcomed by the editor.
*Faculty of Engineering and the Environment, University of Southampton, Southampton, U.K.
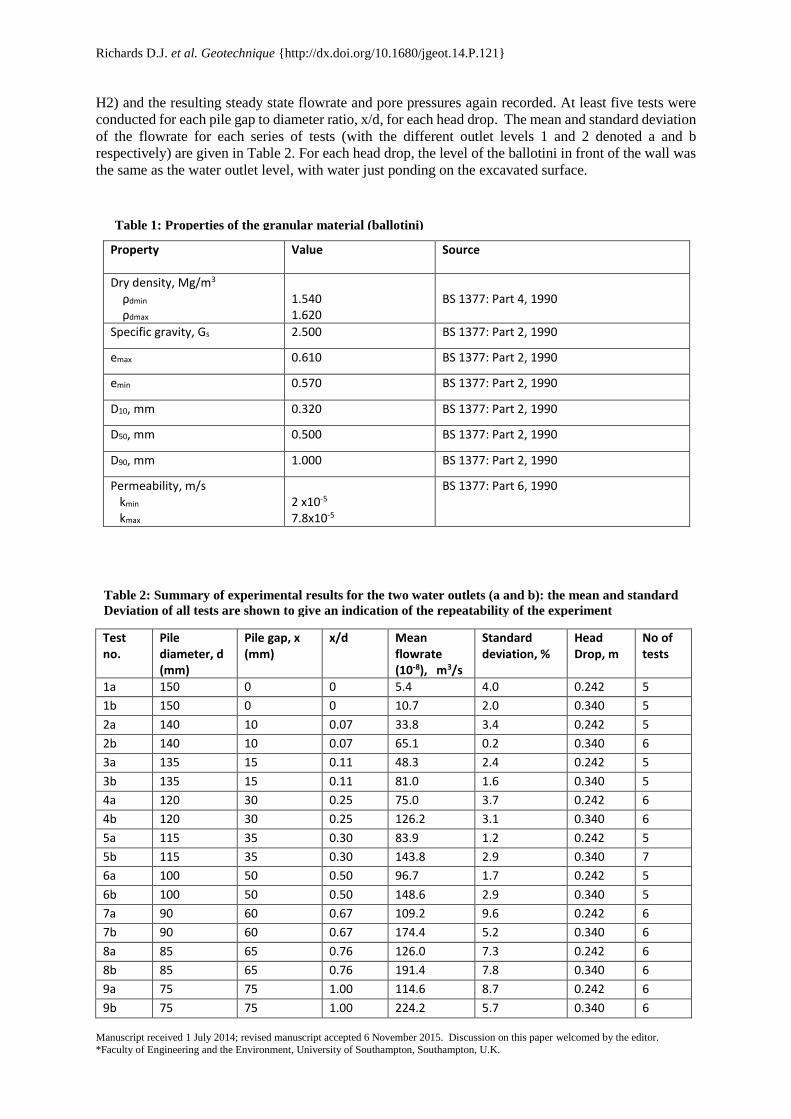
H2) and the resulting steady state flowrate and pore pressures again recorded. At least five tests were
conducted for each pile gap to diameter ratio, x/d, for each head drop. The mean and standard deviation
of the flowrate for each series of tests (with the different outlet levels 1 and 2 denoted a and b
respectively) are given in Table 2. For each head drop, the level of the ballotini in front of the wall was
the same as the water outlet level, with water just ponding on the excavated surface.
Property Value Source
Dry density, Mg/m3 ρdmin ρdmax
1.540 1.620
BS 1377: Part 4, 1990
Specific gravity, Gs 2.500 BS 1377: Part 2, 1990
emax 0.610 BS 1377: Part 2, 1990
emin 0.570 BS 1377: Part 2, 1990
D10, mm 0.320 BS 1377: Part 2, 1990
D50, mm 0.500 BS 1377: Part 2, 1990
D90, mm 1.000 BS 1377: Part 2, 1990
Permeability, m/s kmin kmax
2 x10⁻⁵ 7.8x10⁻⁵
BS 1377: Part 6, 1990
Test no.
Pile diameter, d (mm)
Pile gap, x (mm)
x/d Mean flowrate (10-8), m3/s
Standard deviation, %
Head Drop, m
No of tests
1a 150 0 0 5.4 4.0 0.242 5
1b 150 0 0 10.7 2.0 0.340 5
2a 140 10 0.07 33.8 3.4 0.242 5
2b 140 10 0.07 65.1 0.2 0.340 6
3a 135 15 0.11 48.3 2.4 0.242 5
3b 135 15 0.11 81.0 1.6 0.340 5
4a 120 30 0.25 75.0 3.7 0.242 6
4b 120 30 0.25 126.2 3.1 0.340 6
5a 115 35 0.30 83.9 1.2 0.242 5
5b 115 35 0.30 143.8 2.9 0.340 7
6a 100 50 0.50 96.7 1.7 0.242 5
6b 100 50 0.50 148.6 2.9 0.340 5
7a 90 60 0.67 109.2 9.6 0.242 6
7b 90 60 0.67 174.4 5.2 0.340 6
8a 85 65 0.76 126.0 7.3 0.242 6
8b 85 65 0.76 191.4 7.8 0.340 6
9a 75 75 1.00 114.6 8.7 0.242 6
9b 75 75 1.00 224.2 5.7 0.340 6
Table 1: Properties of the granular material (ballotini)
Table 2: Summary of experimental results for the two water outlets (a and b): the mean and standard
Deviation of all tests are shown to give an indication of the repeatability of the experiment
Richards D.J. et al. Geotechnique {http://dx.doi.org/10.1680/jgeot.14.P.121}
Manuscript received 1 July 2014; revised manuscript accepted 6 November 2015. Discussion on this paper welcomed by the editor.
*Faculty of Engineering and the Environment, University of Southampton, Southampton, U.K.
10a 69 81 1.18 136.2 6.8 0.242 6
10b 69 81 1.18 213.4 18.6 0.340 6
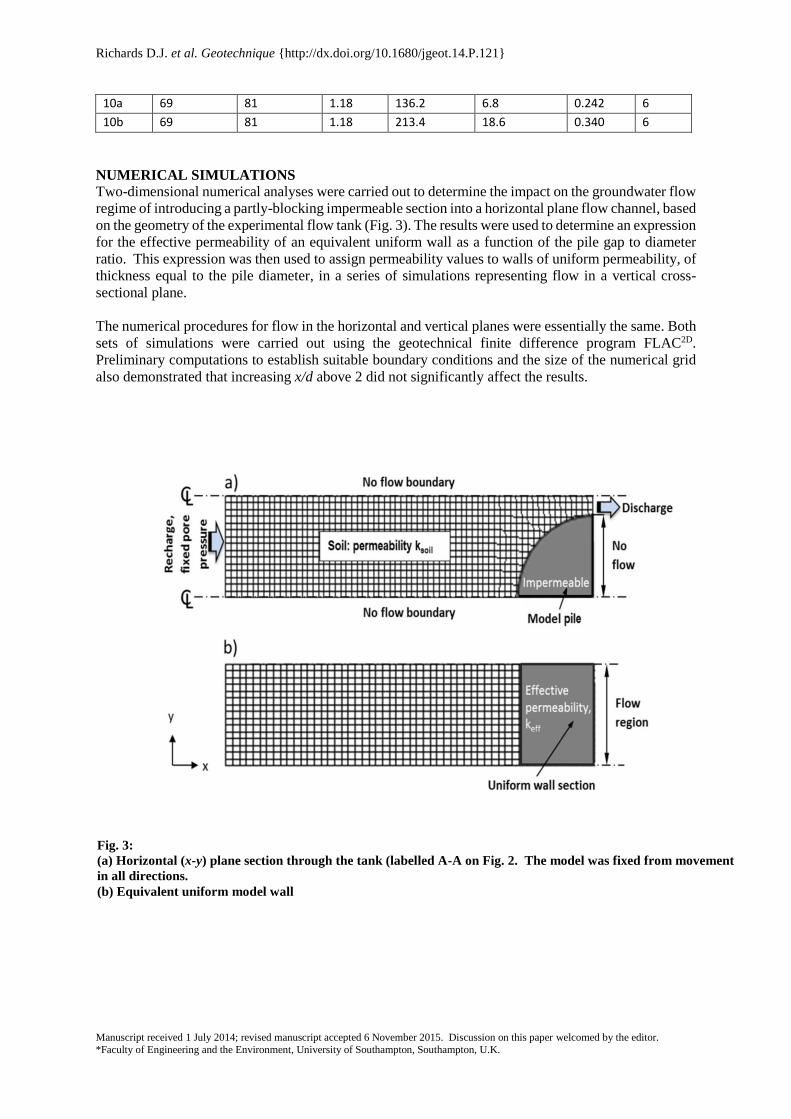
NUMERICAL SIMULATIONS
Two-dimensional numerical analyses were carried out to determine the impact on the groundwater flow
regime of introducing a partly-blocking impermeable section into a horizontal plane flow channel, based
on the geometry of the experimental flow tank (Fig. 3). The results were used to determine an expression
for the effective permeability of an equivalent uniform wall as a function of the pile gap to diameter
ratio. This expression was then used to assign permeability values to walls of uniform permeability, of
thickness equal to the pile diameter, in a series of simulations representing flow in a vertical cross-
sectional plane.
The numerical procedures for flow in the horizontal and vertical planes were essentially the same. Both
sets of simulations were carried out using the geotechnical finite difference program FLAC2D.
Preliminary computations to establish suitable boundary conditions and the size of the numerical grid
also demonstrated that increasing x/d above 2 did not significantly affect the results.
Fig. 3:
(a) Horizontal (x-y) plane section through the tank (labelled A-A on Fig. 2. The model was fixed from movement
in all directions.
(b) Equivalent uniform model wall
Richards D.J. et al. Geotechnique {http://dx.doi.org/10.1680/jgeot.14.P.121}
Manuscript received 1 July 2014; revised manuscript accepted 6 November 2015. Discussion on this paper welcomed by the editor.
*Faculty of Engineering and the Environment, University of Southampton, Southampton, U.K.
Properties of the soil and model wall used for numerical analyses
For both the horizontal and vertical plane analyses, the soil (ballotini) was represented as a
homogeneous and isotropic, elastic-perfectly plastic material. This was considered sufficient for an
investigation in which soil movements were not a focus, although the natural anisotropy of most real
soils would be expected to enhance the importance of lateral flow to and through the wall.
For simplicity, the stiffness parameters represented by the bulk (K) and shear (G) moduli were assumed
to be constant with depth, and the ratio of in situ horizontal to vertical effective stresses, K0, was set to
1. The soil and the pile in the horizontal plane, and the soil and the wall in the vertical plane analyses
were represented by grid elements or zones to which the material properties given in Table 3 were
assigned. The grid elements representing the pile or wall were attached directly to those representing
the soil to allow flow of groundwater across the element boundaries, as recommended by ITASCA
(2012). Both the horizontal and the vertical plane analyses started with the piles already in place.
Numerical procedures
In the horizontal plane analyses, equal pore water pressures of 5.4 kPa, representative of hydrostatic
conditions below a full height groundwater level at a depth of 0.54 m (i.e., at the bottom of the flow
tank), were initially applied at both ends and the model brought to equilibrium as described by
Wiggan et al., (2013). The pore pressures at the discharge boundary were then reduced by either 2.42
kPa or 3.4 kPa, to represent the water level being lowered to the position of the first (upper) or the
second (lower) outlet respectively, while maintaining the initial pressure of 5.4 kPa at the upstream
end. The resulting steady state pore pressures (u) and volumetric flowrates (Q) were recorded.
The procedure was repeated for different pile gap to diameter ratios (x/d), for each of the two different
water outlet levels in the physical experiment. The resulting effective bulk permeability values, keff, of
an equivalent uniform wall of thickness d, were then calculated for different x/d using Darcy’s Law
(Equation 1):
Q = (x+d)
2keff
(ha−hb)
d2⁄
→ 𝑘𝑒𝑓𝑓 =𝑑
𝑥+𝑑.
𝑄
(ℎ𝑎−ℎ𝑏)
Equation 1
where Q is the flowrate (per unit thickness); ha and hb are the hydraulic heads at the intersection of the
gap centreline and lines running along the wall tangential to the back of the pile and along the centreline
of the piles respectively, obtained from the numerical simulations (at different values of x/d); and d/2
is the distance between the points at which ha and hb are calculated, as shown in Fig. 4. (Note this
Properties Model pile/wall Soil
Dry density (ρdry), Mg/m3 2.50 1.60
Bulk modulus, (K) MPa 1524 417
Shear modulus, (G) MPa 1391 192
Poisson’s ratio (v) 0.15 0.3
Table 3: Soil and model pile properties used in the numerical simulations
Richards D.J. et al. Geotechnique {http://dx.doi.org/10.1680/jgeot.14.P.121}
Manuscript received 1 July 2014; revised manuscript accepted 6 November 2015. Discussion on this paper welcomed by the editor.
*Faculty of Engineering and the Environment, University of Southampton, Southampton, U.K.
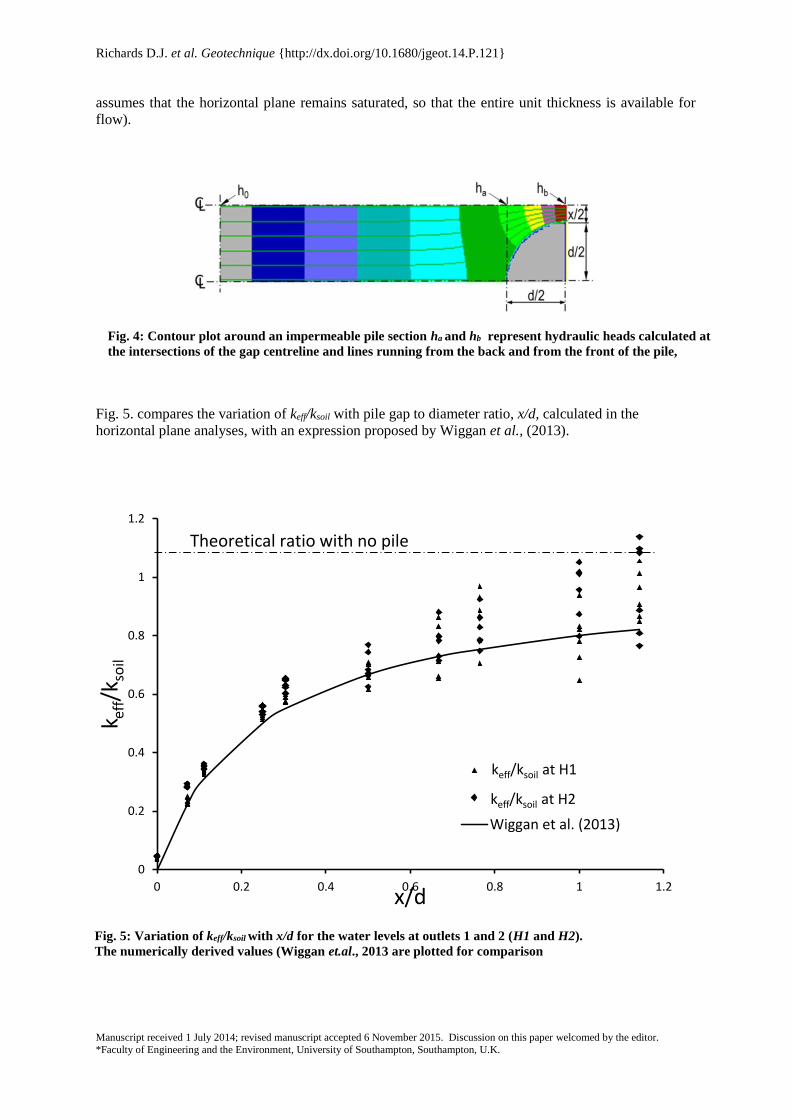
assumes that the horizontal plane remains saturated, so that the entire unit thickness is available for
flow).
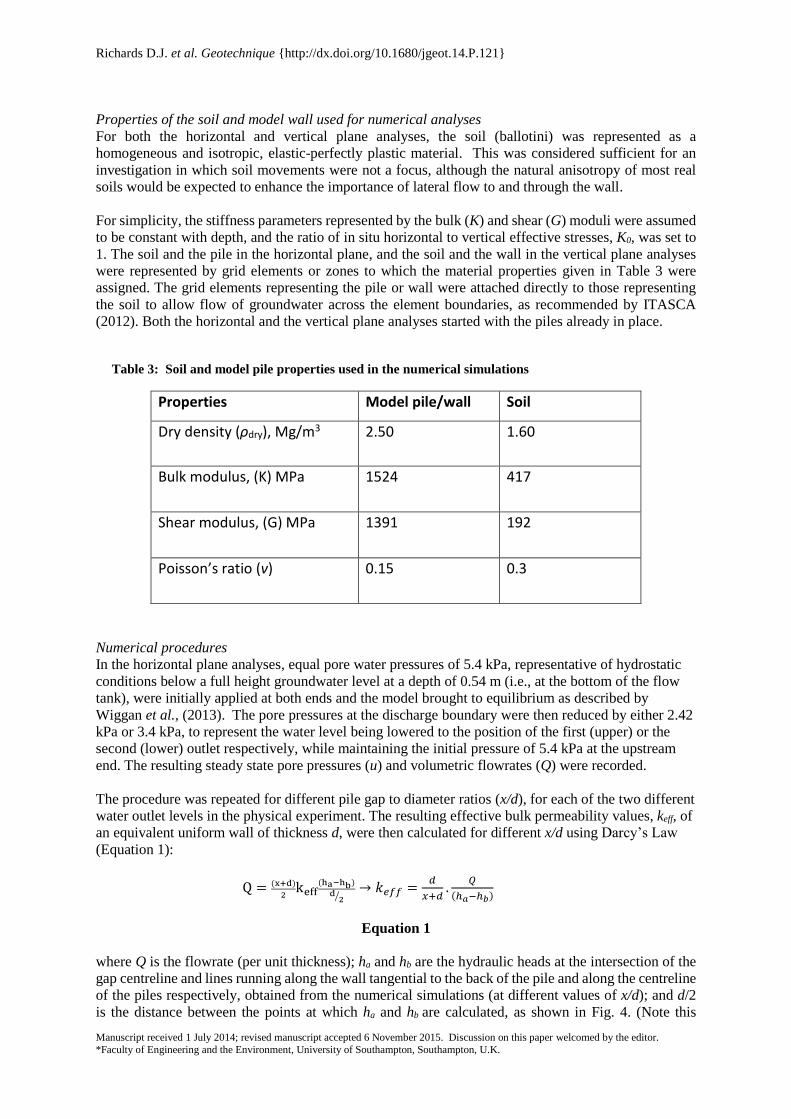
Fig. 5. compares the variation of keff/ksoil with pile gap to diameter ratio, x/d, calculated in the
horizontal plane analyses, with an expression proposed by Wiggan et al., (2013).
Fig. 4: Contour plot around an impermeable pile section ha and hb represent hydraulic heads calculated at
the intersections of the gap centreline and lines running from the back and from the front of the pile,
respectively.
0
0.2
0.4
0.6
0.8
1
1.2
0 0.2 0.4 0.6 0.8 1 1.2
k eff/
k soil
x/d
keff/ksoil at H1
keff/ksoil at H2
Wiggan et al. (2013)
Theoretical ratio with no pile
keff/ksoil at H1
keff/ksoil at H2
Fig. 5: Variation of keff/ksoil with x/d for the water levels at outlets 1 and 2 (H1 and H2).
The numerically derived values (Wiggan et.al., 2013 are plotted for comparison
Richards D.J. et al. Geotechnique {http://dx.doi.org/10.1680/jgeot.14.P.121}
Manuscript received 1 July 2014; revised manuscript accepted 6 November 2015. Discussion on this paper welcomed by the editor.
*Faculty of Engineering and the Environment, University of Southampton, Southampton, U.K.
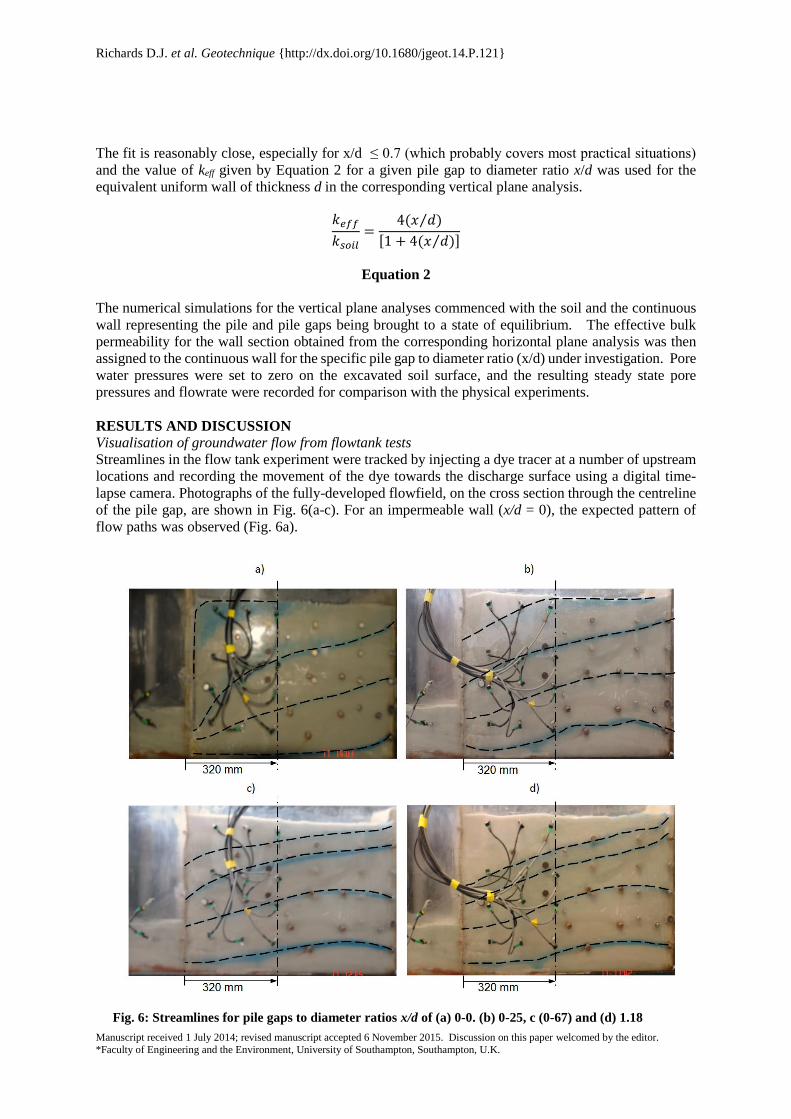
Fig. 6: Streamlines for pile gaps to diameter ratios x/d of (a) 0-0. (b) 0-25, c (0-67) and (d) 1.18
The fit is reasonably close, especially for x/d ≤ 0.7 (which probably covers most practical situations)
and the value of keff given by Equation 2 for a given pile gap to diameter ratio x/d was used for the
equivalent uniform wall of thickness d in the corresponding vertical plane analysis.
𝑘𝑒𝑓𝑓
𝑘𝑠𝑜𝑖𝑙=
4(𝑥 𝑑)⁄
[1 + 4(𝑥 𝑑)⁄ ]
Equation 2
The numerical simulations for the vertical plane analyses commenced with the soil and the continuous
wall representing the pile and pile gaps being brought to a state of equilibrium. The effective bulk
permeability for the wall section obtained from the corresponding horizontal plane analysis was then
assigned to the continuous wall for the specific pile gap to diameter ratio (x/d) under investigation. Pore
water pressures were set to zero on the excavated soil surface, and the resulting steady state pore
pressures and flowrate were recorded for comparison with the physical experiments.
RESULTS AND DISCUSSION
Visualisation of groundwater flow from flowtank tests
Streamlines in the flow tank experiment were tracked by injecting a dye tracer at a number of upstream
locations and recording the movement of the dye towards the discharge surface using a digital time-
lapse camera. Photographs of the fully-developed flowfield, on the cross section through the centreline
of the pile gap, are shown in Fig. 6(a-c). For an impermeable wall (x/d = 0), the expected pattern of
flow paths was observed (Fig. 6a).
Richards D.J. et al. Geotechnique {http://dx.doi.org/10.1680/jgeot.14.P.121}
Manuscript received 1 July 2014; revised manuscript accepted 6 November 2015. Discussion on this paper welcomed by the editor.
*Faculty of Engineering and the Environment, University of Southampton, Southampton, U.K.
As x/d was increased, the part of the topmost streamline (the phreatic surface) closest to the pile moved
down into the retained soil (Figs. 6b-d). Beyond a distance of approximately 320 mm from the front
face of the wall, once through-wall seepage was allowed, the directions of the flowlines at depth below
the phreatic surface were substantially unaffected by increasing the size of the pile gap (x), although the
pore pressure regime was affected by the increasing drawdown of the phreatic surface. Near the back
of the wall, there was a clear transition from essentially downward to near-horizontal flow, which was
substantially complete once x/d had increased to 0.25. Horizontal flow implies a hydrostatic increase in
pore pressure with depth.
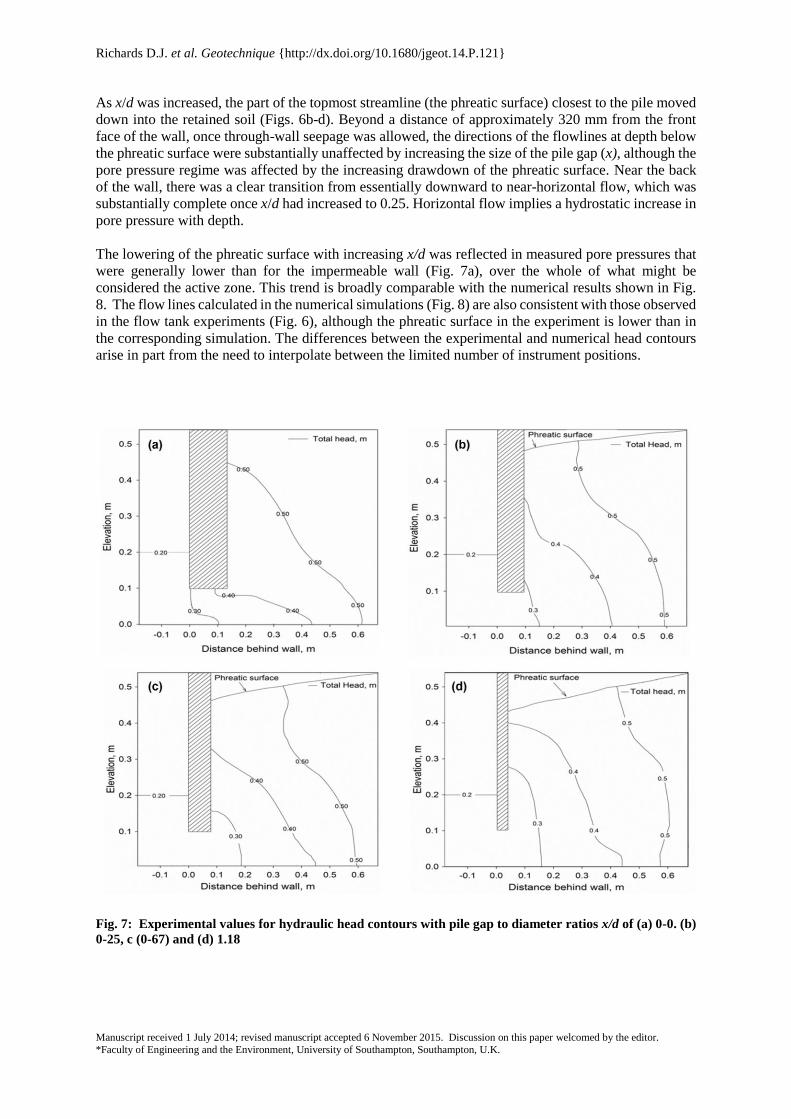
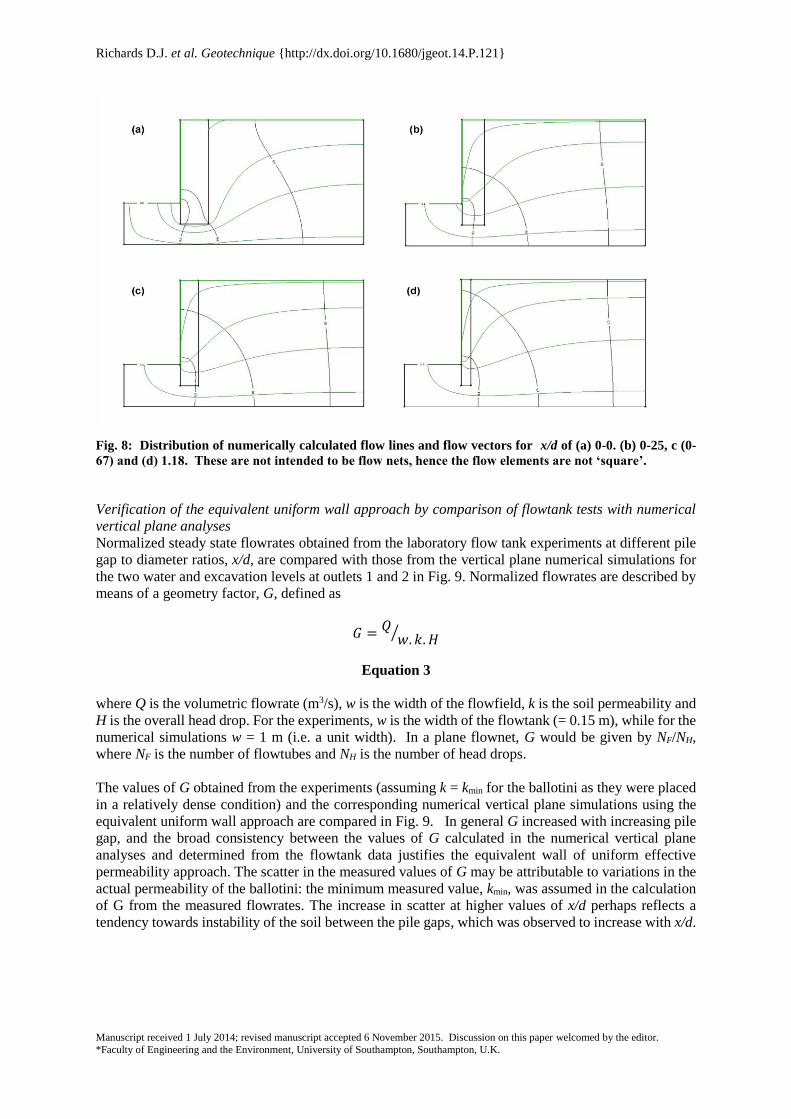
The lowering of the phreatic surface with increasing x/d was reflected in measured pore pressures that
were generally lower than for the impermeable wall (Fig. 7a), over the whole of what might be
considered the active zone. This trend is broadly comparable with the numerical results shown in Fig.
8. The flow lines calculated in the numerical simulations (Fig. 8) are also consistent with those observed
in the flow tank experiments (Fig. 6), although the phreatic surface in the experiment is lower than in
the corresponding simulation. The differences between the experimental and numerical head contours
arise in part from the need to interpolate between the limited number of instrument positions.
Fig. 7: Experimental values for hydraulic head contours with pile gap to diameter ratios x/d of (a) 0-0. (b)
0-25, c (0-67) and (d) 1.18
Richards D.J. et al. Geotechnique {http://dx.doi.org/10.1680/jgeot.14.P.121}
Manuscript received 1 July 2014; revised manuscript accepted 6 November 2015. Discussion on this paper welcomed by the editor.
*Faculty of Engineering and the Environment, University of Southampton, Southampton, U.K.
Fig. 8: Distribution of numerically calculated flow lines and flow vectors for x/d of (a) 0-0. (b) 0-25, c (0-
67) and (d) 1.18. These are not intended to be flow nets, hence the flow elements are not ‘square’.
Verification of the equivalent uniform wall approach by comparison of flowtank tests with numerical
vertical plane analyses
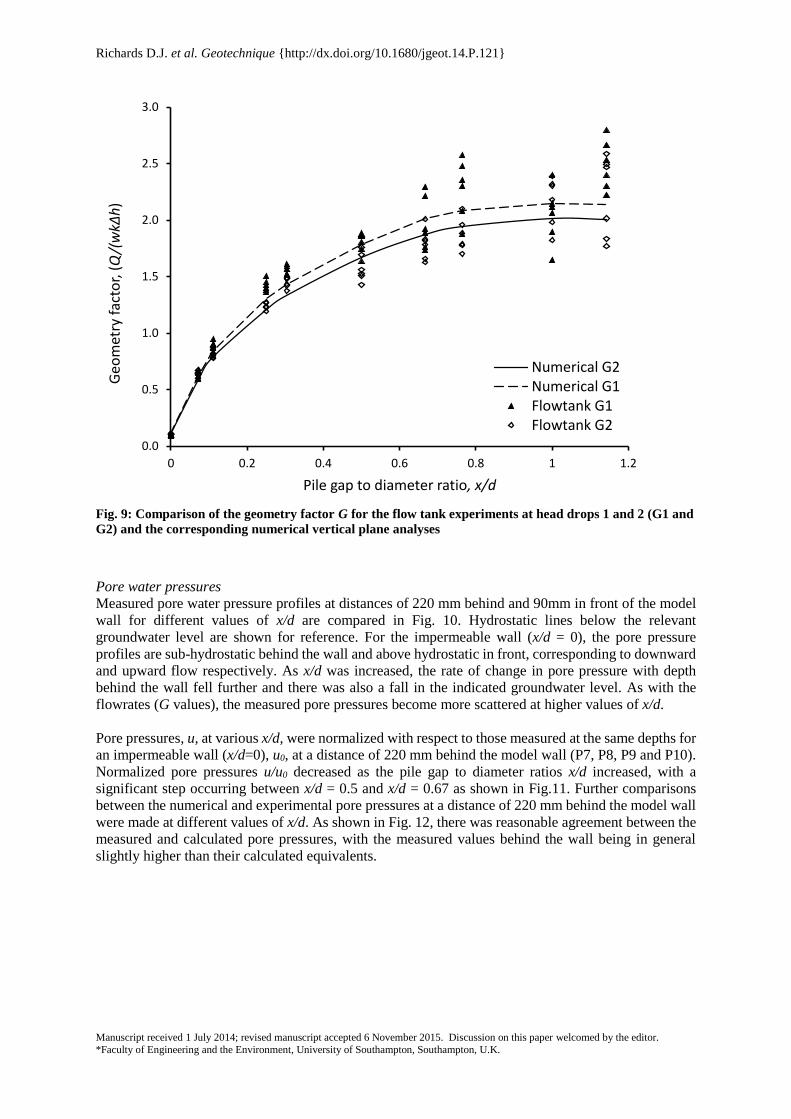
Normalized steady state flowrates obtained from the laboratory flow tank experiments at different pile
gap to diameter ratios, x/d, are compared with those from the vertical plane numerical simulations for
the two water and excavation levels at outlets 1 and 2 in Fig. 9. Normalized flowrates are described by
means of a geometry factor, G, defined as
𝐺 = 𝑄𝑤. 𝑘. 𝐻⁄
Equation 3
where Q is the volumetric flowrate (m3/s), w is the width of the flowfield, k is the soil permeability and
H is the overall head drop. For the experiments, w is the width of the flowtank (= 0.15 m), while for the
numerical simulations w = 1 m (i.e. a unit width). In a plane flownet, G would be given by NF/NH,
where NF is the number of flowtubes and NH is the number of head drops.
The values of G obtained from the experiments (assuming k = kmin for the ballotini as they were placed
in a relatively dense condition) and the corresponding numerical vertical plane simulations using the
equivalent uniform wall approach are compared in Fig. 9. In general G increased with increasing pile
gap, and the broad consistency between the values of G calculated in the numerical vertical plane
analyses and determined from the flowtank data justifies the equivalent wall of uniform effective
permeability approach. The scatter in the measured values of G may be attributable to variations in the
actual permeability of the ballotini: the minimum measured value, kmin, was assumed in the calculation
of G from the measured flowrates. The increase in scatter at higher values of x/d perhaps reflects a
tendency towards instability of the soil between the pile gaps, which was observed to increase with x/d.
Richards D.J. et al. Geotechnique {http://dx.doi.org/10.1680/jgeot.14.P.121}
Manuscript received 1 July 2014; revised manuscript accepted 6 November 2015. Discussion on this paper welcomed by the editor.
*Faculty of Engineering and the Environment, University of Southampton, Southampton, U.K.
Fig. 9: Comparison of the geometry factor G for the flow tank experiments at head drops 1 and 2 (G1 and
G2) and the corresponding numerical vertical plane analyses
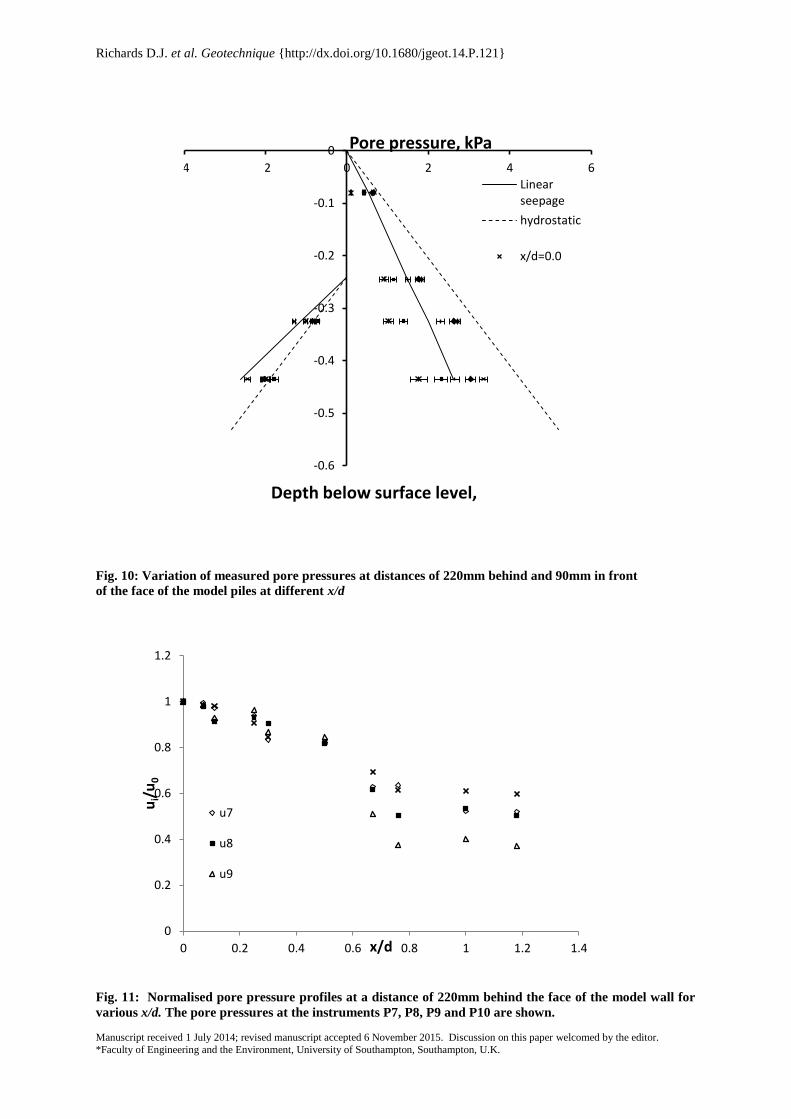
Pore water pressures
Measured pore water pressure profiles at distances of 220 mm behind and 90mm in front of the model
wall for different values of x/d are compared in Fig. 10. Hydrostatic lines below the relevant
groundwater level are shown for reference. For the impermeable wall (x/d = 0), the pore pressure
profiles are sub-hydrostatic behind the wall and above hydrostatic in front, corresponding to downward
and upward flow respectively. As x/d was increased, the rate of change in pore pressure with depth
behind the wall fell further and there was also a fall in the indicated groundwater level. As with the
flowrates (G values), the measured pore pressures become more scattered at higher values of x/d.
Pore pressures, u, at various x/d, were normalized with respect to those measured at the same depths for
an impermeable wall (x/d=0), u0, at a distance of 220 mm behind the model wall (P7, P8, P9 and P10).
Normalized pore pressures u/u0 decreased as the pile gap to diameter ratios x/d increased, with a
significant step occurring between x/d = 0.5 and x/d = 0.67 as shown in Fig.11. Further comparisons
between the numerical and experimental pore pressures at a distance of 220 mm behind the model wall
were made at different values of x/d. As shown in Fig. 12, there was reasonable agreement between the
measured and calculated pore pressures, with the measured values behind the wall being in general
slightly higher than their calculated equivalents.
0.0
0.5
1.0
1.5
2.0
2.5
3.0
0 0.2 0.4 0.6 0.8 1 1.2
Geo
met
ry f
acto
r, (Q/(wk∆
h)
Pile gap to diameter ratio, x/d
Numerical G2Numerical G1Flowtank G1Flowtank G2
Richards D.J. et al. Geotechnique {http://dx.doi.org/10.1680/jgeot.14.P.121}
Manuscript received 1 July 2014; revised manuscript accepted 6 November 2015. Discussion on this paper welcomed by the editor.
*Faculty of Engineering and the Environment, University of Southampton, Southampton, U.K.
Fig. 11: Normalised pore pressure profiles at a distance of 220mm behind the face of the model wall for
various x/d. The pore pressures at the instruments P7, P8, P9 and P10 are shown.
Fig. 10: Variation of measured pore pressures at distances of 220mm behind and 90mm in front
of the face of the model piles at different x/d
-0.6
-0.5
-0.4
-0.3
-0.2
-0.1
0
-4 -2 0 2 4 6
Pore pressure, kPa
Linearseepage
hydrostatic
x/d=0.0
Depth below surface level,
0
0.2
0.4
0.6
0.8
1
1.2
0 0.2 0.4 0.6 0.8 1 1.2 1.4
ui/
u0
x/d
u7
u8
u9
Richards D.J. et al. Geotechnique {http://dx.doi.org/10.1680/jgeot.14.P.121}
Manuscript received 1 July 2014; revised manuscript accepted 6 November 2015. Discussion on this paper welcomed by the editor.
*Faculty of Engineering and the Environment, University of Southampton, Southampton, U.K.
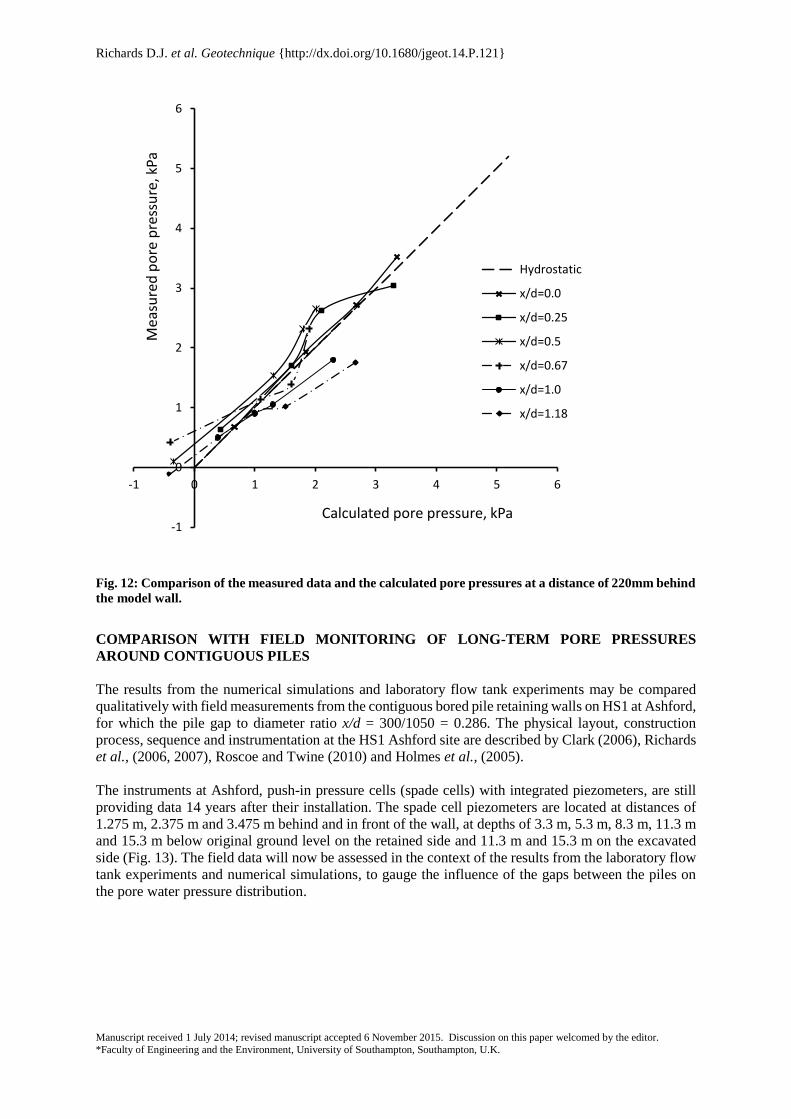
Fig. 12: Comparison of the measured data and the calculated pore pressures at a distance of 220mm behind
the model wall.
COMPARISON WITH FIELD MONITORING OF LONG-TERM PORE PRESSURES
AROUND CONTIGUOUS PILES
The results from the numerical simulations and laboratory flow tank experiments may be compared
qualitatively with field measurements from the contiguous bored pile retaining walls on HS1 at Ashford,
for which the pile gap to diameter ratio x/d = 300/1050 = 0.286. The physical layout, construction
process, sequence and instrumentation at the HS1 Ashford site are described by Clark (2006), Richards
et al., (2006, 2007), Roscoe and Twine (2010) and Holmes et al., (2005).
The instruments at Ashford, push-in pressure cells (spade cells) with integrated piezometers, are still
providing data 14 years after their installation. The spade cell piezometers are located at distances of
1.275 m, 2.375 m and 3.475 m behind and in front of the wall, at depths of 3.3 m, 5.3 m, 8.3 m, 11.3 m
and 15.3 m below original ground level on the retained side and 11.3 m and 15.3 m on the excavated
side (Fig. 13). The field data will now be assessed in the context of the results from the laboratory flow
tank experiments and numerical simulations, to gauge the influence of the gaps between the piles on
the pore water pressure distribution.
-1
0
1
2
3
4
5
6
-1 0 1 2 3 4 5 6
Mea
sure
d p
ore
pre
ssu
re, k
Pa
Calculated pore pressure, kPa
Hydrostatic
x/d=0.0
x/d=0.25
x/d=0.5
x/d=0.67
x/d=1.0
x/d=1.18
Richards D.J. et al. Geotechnique {http://dx.doi.org/10.1680/jgeot.14.P.121}
Manuscript received 1 July 2014; revised manuscript accepted 6 November 2015. Discussion on this paper welcomed by the editor.
*Faculty of Engineering and the Environment, University of Southampton, Southampton, U.K.
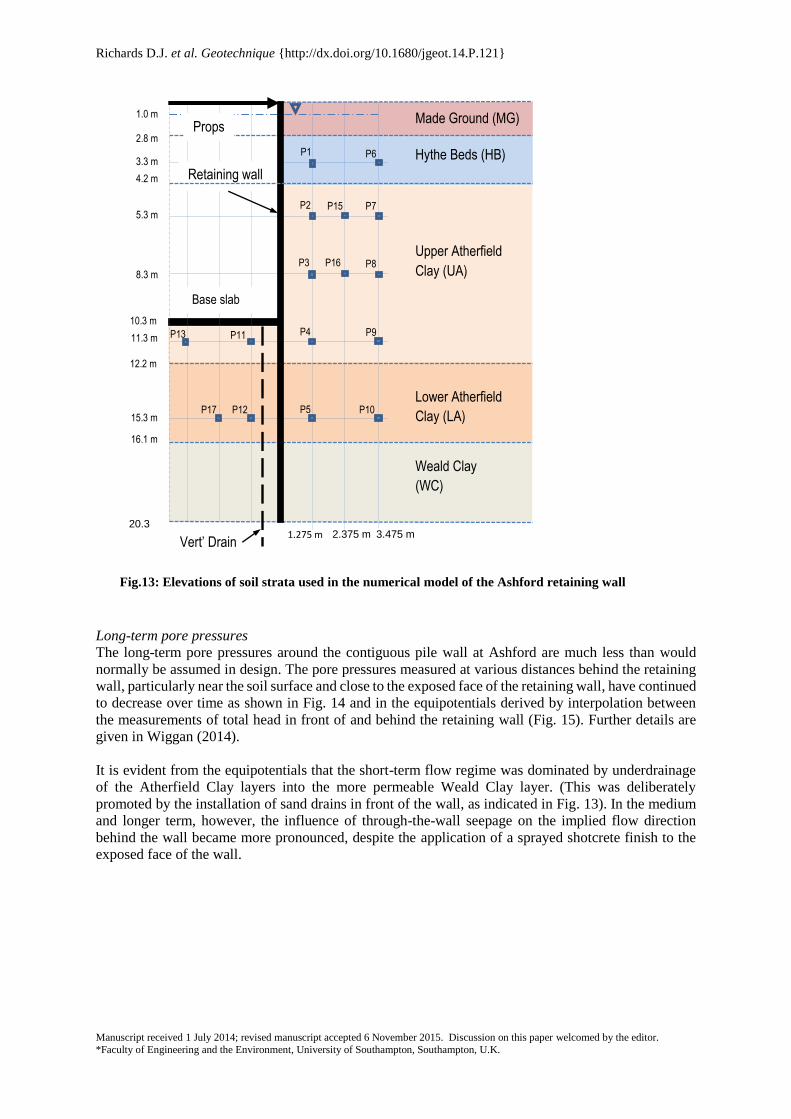
Long-term pore pressures
The long-term pore pressures around the contiguous pile wall at Ashford are much less than would
normally be assumed in design. The pore pressures measured at various distances behind the retaining
wall, particularly near the soil surface and close to the exposed face of the retaining wall, have continued
to decrease over time as shown in Fig. 14 and in the equipotentials derived by interpolation between
the measurements of total head in front of and behind the retaining wall (Fig. 15). Further details are
given in Wiggan (2014).
It is evident from the equipotentials that the short-term flow regime was dominated by underdrainage
of the Atherfield Clay layers into the more permeable Weald Clay layer. (This was deliberately
promoted by the installation of sand drains in front of the wall, as indicated in Fig. 13). In the medium
and longer term, however, the influence of through-the-wall seepage on the implied flow direction
behind the wall became more pronounced, despite the application of a sprayed shotcrete finish to the
exposed face of the wall.
2.8 m
1.0 m
3.3 m
4.2 m
5.3 m
8.3 m
10.3 m
11.3 m
15.3 m
16.1 m
Made Ground (MG)
P1
P2
P3
P4
P15
P5
P6
P8
P7
P12 P10
P9 P13
P17
P11
12.2 m
Hythe Beds (HB)
Upper Atherfield
Clay (UA)
Lower Atherfield
Clay (LA)
Weald Clay
(WC)
20.3 m
Base slab
Vert’ Drain
Retaining wall
P16
2.375 m 3.475 m 1.275 m
Props
Fig.13: Elevations of soil strata used in the numerical model of the Ashford retaining wall
Richards D.J. et al. Geotechnique {http://dx.doi.org/10.1680/jgeot.14.P.121}
Manuscript received 1 July 2014; revised manuscript accepted 6 November 2015. Discussion on this paper welcomed by the editor.
*Faculty of Engineering and the Environment, University of Southampton, Southampton, U.K.
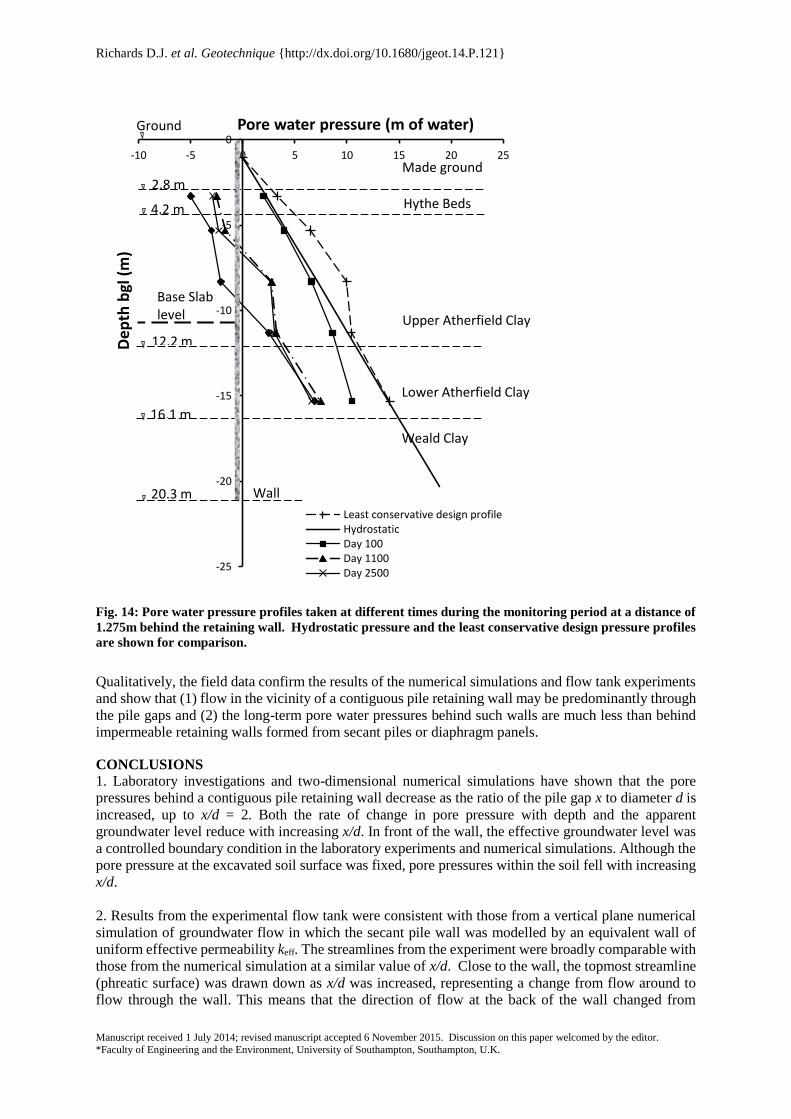
Fig. 14: Pore water pressure profiles taken at different times during the monitoring period at a distance of
1.275m behind the retaining wall. Hydrostatic pressure and the least conservative design pressure profiles
are shown for comparison.
Qualitatively, the field data confirm the results of the numerical simulations and flow tank experiments
and show that (1) flow in the vicinity of a contiguous pile retaining wall may be predominantly through
the pile gaps and (2) the long-term pore water pressures behind such walls are much less than behind
impermeable retaining walls formed from secant piles or diaphragm panels.
CONCLUSIONS
1. Laboratory investigations and two-dimensional numerical simulations have shown that the pore
pressures behind a contiguous pile retaining wall decrease as the ratio of the pile gap x to diameter d is
increased, up to x/d = 2. Both the rate of change in pore pressure with depth and the apparent
groundwater level reduce with increasing x/d. In front of the wall, the effective groundwater level was
a controlled boundary condition in the laboratory experiments and numerical simulations. Although the
pore pressure at the excavated soil surface was fixed, pore pressures within the soil fell with increasing
x/d.
2. Results from the experimental flow tank were consistent with those from a vertical plane numerical
simulation of groundwater flow in which the secant pile wall was modelled by an equivalent wall of
uniform effective permeability keff. The streamlines from the experiment were broadly comparable with
those from the numerical simulation at a similar value of x/d. Close to the wall, the topmost streamline
(phreatic surface) was drawn down as x/d was increased, representing a change from flow around to
flow through the wall. This means that the direction of flow at the back of the wall changed from
-25
-20
-15
-10
-5
0
-10 -5 0 5 10 15 20 25
Dep
th b
gl (
m)
Pore water pressure (m of water)
Least conservative design profileHydrostaticDay 100Day 1100Day 2500
Made ground
Hythe Beds
Weald Clay
Lower Atherfield Clay
Upper Atherfield Clay
Ground
2.8 m
4.2 m
12.2 m
16.1 m
20.3 m
Base Slab level
Wall
Richards D.J. et al. Geotechnique {http://dx.doi.org/10.1680/jgeot.14.P.121}
Manuscript received 1 July 2014; revised manuscript accepted 6 November 2015. Discussion on this paper welcomed by the editor.
*Faculty of Engineering and the Environment, University of Southampton, Southampton, U.K.
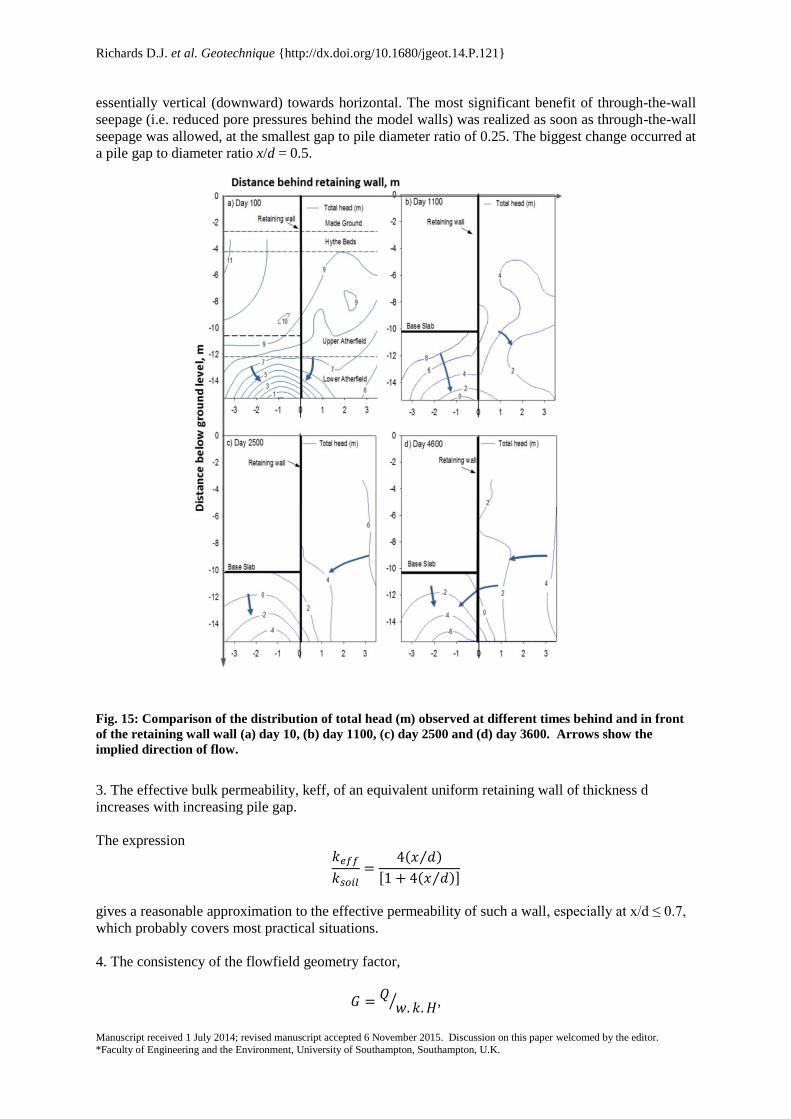
essentially vertical (downward) towards horizontal. The most significant benefit of through-the-wall
seepage (i.e. reduced pore pressures behind the model walls) was realized as soon as through-the-wall
seepage was allowed, at the smallest gap to pile diameter ratio of 0.25. The biggest change occurred at
a pile gap to diameter ratio x/d = 0.5.
Fig. 15: Comparison of the distribution of total head (m) observed at different times behind and in front
of the retaining wall wall (a) day 10, (b) day 1100, (c) day 2500 and (d) day 3600. Arrows show the
implied direction of flow.
3. The effective bulk permeability, keff, of an equivalent uniform retaining wall of thickness d
increases with increasing pile gap.
The expression 𝑘𝑒𝑓𝑓
𝑘𝑠𝑜𝑖𝑙=
4(𝑥 𝑑⁄ )
[1 + 4(𝑥 𝑑⁄ )]
gives a reasonable approximation to the effective permeability of such a wall, especially at x/d ≤ 0.7,
which probably covers most practical situations.
4. The consistency of the flowfield geometry factor,
𝐺 = 𝑄𝑤. 𝑘. 𝐻⁄ ,
Richards D.J. et al. Geotechnique {http://dx.doi.org/10.1680/jgeot.14.P.121}
Manuscript received 1 July 2014; revised manuscript accepted 6 November 2015. Discussion on this paper welcomed by the editor.
*Faculty of Engineering and the Environment, University of Southampton, Southampton, U.K.
between flowtank experiments and corresponding numerical vertical plane flow simulations using an
equivalent wall of uniform effective permeability calculated using this expression, demonstrates the
validity of the approach.
5. Field measurements over a period of 14 years around a contiguous pile retaining wall on HS1 at
Ashford have confirmed qualitatively the numerical and experimental results. The pore pressures
measured behind the contiguous pile wall were much less than those assumed in design and less than
those observed behind secant pile retaining walls in similar soils. The measured pore pressures are still
decreasing, particularly near the soil surface and close to the exposed face of the retaining wall.
ACKNOWLEDGEMENTS
Funding for this research was provided by the Engineering and Physical Sciences Research Council,
(EPSRC) grant number EP/F063482.
References
Arjnoi, P., Jeong, J.H., Kim, C.Y., and Park, K.H. 2009. Effect of drainage conditions on porewater
pressure distributions and lining stresses in drained tunnels. Tunnelling and Underground Space
Technology, 24, (4) 376-389.
Bobet, A. and Nam, S.W. 2007. Stresses around pressure tunnels with semi-permeable liners. Rock
Mechanics and Rock Engineering, 40, (3) 287-315.
BS 1377: Part 4 1990. British Standard Methods of Tests for Soils of Civil Engineering, Part 4:
Classification Tests. British Standard Institution.
BS 1377: Part 6. British Standard Methods of Tests for Soils for Civil Engineering, Part 6:
Consolidation and Permeability Tests in hydraulic cells and with pore pressure measurement. 1990.
British Standard Institution.
Carder, D.R., Watson, G.V.R., Chandler, R.J., and Powrie, W. 1999. Long-term performance of an
embedded retaining wall with a stabilizing base slab. Proceedings of the Institution of Civil Engineers-
Geotechnical Engineering, 137, (2) 63-74. 1
Clark, J. 2006. Perfromance of a propped retaining wall at the Channel Tunnel Rail Link, Ashford. PhD
Thesis, University of Southampton. June 2006.
Gaba, A. R., Simpson, B., Powrie, W., and Beadman, D. R. 2003, Embedded retaining walls: Guidance
for economic design, Construction Industry Research and Information Association.
Gourvenec, S.M., Mair, R.J., Bolton, M.D., and Soga, K. 2005. Ground conditions around an old tunnel
in London Clay. Proceedings of the Institution of Civil Engineers-Geotechnical Engineering, 158, (1)
25-33.
Holmes, G., Roscoe, H., and Chodorowski, A. 2005. Construction monitoring of cut and cover tunnels.
Proceedings of the ICE, Geotechnical Engineering, 4, (158).
Hubbard, H.W., Potts, D.M., and Miller, D. 1984. Design of the retaining walls for the M25 cut and
cover tunnel at Bell Common. Geotechnique, 34, (4) 495-512.
ITASCA., 2012. Fast Langrangian Analysis of Continua in 2 Dimensions. User Manual. Itasca
Consulting Group (7.0). Minneapolis, USA.
Lacasse, S. and Berre, T. 1988, "Triaxial testing methods for soils," In Advanced Triaxial Testing of
Soil and Rock, ASTM STP 977, pp. 264-289.
Lee, I. M. and Nam, S. W. 2006, Seepage Force Considerations in Tunnelling, In International
Symposium on Underground Excavation and Tunnelling.
Lee, K.M., Nam, S.W., and Ahn, J.H. 2003. Effect of seepage forces on tunnel face stability. Canadian
Geotechnical Journal, 40, (2) 342-350.
Powrie, W., Chandler, R.J., Carder, D.R., and Watson, G.V.R. 1999. Back-analysis of an embedded
retaining wall with a stabilizing base slab. Proceedings of the Institution of Civil Engineers-
Geotechnical Engineering, 137, (2) 75-86.
Richards D.J. et al. Geotechnique {http://dx.doi.org/10.1680/jgeot.14.P.121}
Manuscript received 1 July 2014; revised manuscript accepted 6 November 2015. Discussion on this paper welcomed by the editor.
*Faculty of Engineering and the Environment, University of Southampton, Southampton, U.K.
Richards, D.J., Clark, J. and Powrie, W. 2006. Installation efects of a bored pile wall in overconsolidated
clay. Geotechnique, 56, (6) 411-425.
Richards, D.J., Powrie, W., Roscoe, H., and Clark, J. 2007. Pore water pressure and horizontal stress
changes measured during construction of a contiguous bored pile multi-propped retaining wall in Lower
Cretaceous clays. Geotechnique, 57, (2) 197-205.
Roscoe, H. and Twine, D. 2010. Design and performance of retaining walls. Proceedings of the
Institution of Civil Engineers-Geotechnical Engineering, 163, (5) 279-290.
Schweiger, H., Pottler, T.K., and Steiner, H. 1991. Effect of seepage forces on the shotcrete lining of a
large undersea cavern. Computer Methods and Advances in Geomechanics, 1503-1508.
Shin, J.H. 2010. Analytical and combined numerical methods evaluating pore water pressure on tunnels.
Geotechnique, 60, (2) 141-145.
Shin, J.H., Addenbrooke, T.I., and Potts, D.M. 2002. A numerical study of the effect of groundwater
movement on long-term tunnel behaviour. Geotechnique, 52, (6) 391-403.
Ward, W. H. and Pender, M. J.1981. Tunnelling in soft ground: General report, In 10th International
Conference on Soil Mechanics and Foundation Engineering, pp. 261-275.
Wiggan, C.A. 2014. Long-term Pore Water Pressure Changes around Subsurface Structures. PhD
Thesis University of Southampton.
Wiggan, C. A., Richards, D. J., and Powrie, W.2013. Numerical modelling of groundwater flow around
contiguous pile retaining walls, In Challenges and Innovations in Geotechnics, P. Delage et al.,, eds.,
Paris: pp. 2127-2130.
Yoo, C., Kim, S. B., and Kim, J. T. 2008, Influencing factors on groundwater drawdown induced
settlement during tunnelling, In World Tunnelling Congress, New Delhi, India: Central Board of
Irrigation and Power, pp. 863-871.
Zdravkovic, L., Tsiarnpousi, A., and Potts, D.M., 2007. Effect of wall and soil permeability on the
long-term ground movements adjacent to a deep excavation. Numerical Models in Geomechanics:
Numog X 589-594.
Notation
�̅� normalized flowrate
�̅�1,�̅�2 normalized flowrates corresponding to the water level at Outlets H1 and H2
∆h head difference
∆l distance between the points where h1 and h2 are measured
A flow area
Ave average flow area
CTRL Channel Tunnel Rail Link
d pile diameter
D50 soil grain diameter 50% finer
E Young’s modulus
emax maximum void ratio
emin minimum void ratio
G shear modulus
Gs specific gravity
h0 head at the upstream end
H1 difference in water level between supply reservoir and outlet 1
Ha head at the intersection of the gap centreline and a line tangential to the back of the pile
H2 difference in water level between supply reservoir and outlet 2
Hb head at the intersection of the gap centreline and a line running from the front of the
wall
HS1 High Speed One
I second moment of area
K bulk modulus

Richards D.J. et al. Geotechnique {http://dx.doi.org/10.1680/jgeot.14.P.121}
Manuscript received 1 July 2014; revised manuscript accepted 6 November 2015. Discussion on this paper welcomed by the editor.
*Faculty of Engineering and the Environment, University of Southampton, Southampton, U.K.
K0 coefficient of earth pressure at rest
keff effective bulk permeability
ksoil soil permeability
Q volumetric flowrate
u pore pressure
u0 pore pressures for an impermeable retaining wall
v Poisson’s ratio
w pile gap plus pile diameter
x pile gap
ρdmax maximum dry density
ρdmin minimum dry density