Embed Size (px)
Citation preview
Seeking growth What will drive US natural gas demand?
2
Phoenix rising | The oilfield services sector transforms again
Executive summary 3
Ten years on, shale gas continues to shape the domestic energy landscape 4
Power generation demand will likely be driven by fuel switching 7
Industrial demand more likely to increase, but response may be muted 9
Transport could play a small role in gas demand in the near term, but has more long-term potential 12
Major export growth will likely be needed to balance US production 14
Low prices and stable demand paint a challenging picture for the natural gas supply chain 15
The outlook for natural gas remains positive despite uncertainty 18
Endnotes 19
Let’s talk 21
Contents
3
Seeking growth | What will drive US natural gas demand?
Executive summary
During the past 10 years, US natural gas production has grown remarkably even as prices dropped to near 20-year lows. Largely unforeseen, this drop stems mainly from hydraulic fracturing successes in the Barnett shale and across the country, including the prolific Marcellus formation in the Appalachian basin. The low prices seem to have spurred demand, propelling growth across the board—including electricity generation, industrial demand, and nascent transport sectors, as well as exports. However, it is unclear if this tremendous consumption growth is sustainable.
This report discusses the drivers of potential increases (and decreases) in gas demand in three key sectors, as well as the opportunities for increasing exports. It further drills down into the impacts and implications for the entire natural gas value chain—including upstream producers, the midstream infrastructure system, and downstream consumers.
Looking at the US supply and disposition of natural gas sector by sector, we conclude:
• Power generators that have benefited from low-cost gas are unlikely to be a large part of future demand growth. The potential rise in gas prices is likely to reduce opportunities for further fuel switching from coal, particulary given significant uncertainty around future emission regulations and limited electricity demand growth.
• Economic growth, both in the United States and abroad, could drive industrial consumption growth. Petrochemical plants might be the most visible source of growth, but there are a number of other gas-intensive industries that might also contribute.
• Converting transport from liquid hydrocarbons to natural gas will likely be an uphill battle. But the environmental profile of natural gas may play a big role in its future, with a potentially large market to capture—notably in marine bunkering and rail.
• Liquefied natural gas (LNG) exports are on a trajectory to grow over 8 billion cubic feet a day if utilization can be maximized. However, global competition has stiffened and exports could be highly cost-sensitive, challenging both existing and unsanctioned projects.
• Over the next five-plus years, growth in the natural gas market is expected to rely on prudent infrastructure build-out combined with increasing production efficiencies as producers drill out new acreage in the unconventional gas plays.
Seeking growth | What will drive US natural gas demand?
4
0
100
Indu
stria
l gas
con
sum
ptio
n (b
cfd)
2007 2008 2009 2010 2011 2012 2013 2014 2015 2016
US natural gas production
Monthly Henry Hub price
Henry Hub rolling 12-month average
75
50
25
15
10
5
0
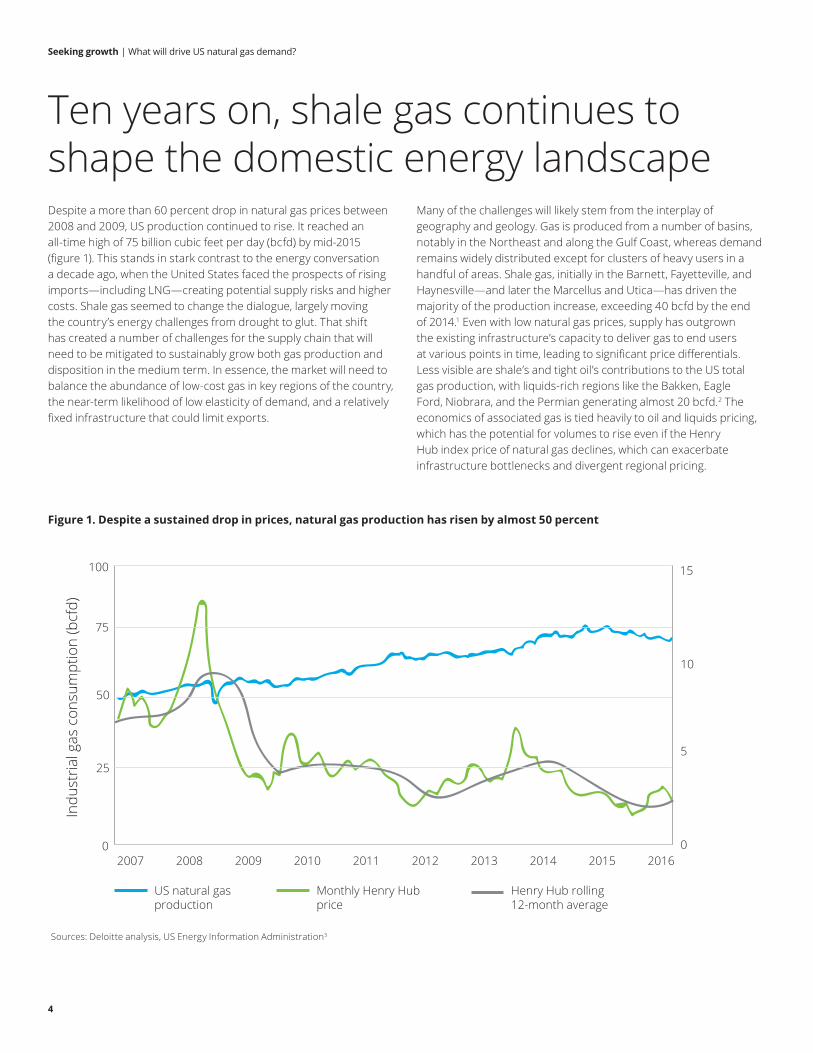
Ten years on, shale gas continues to shape the domestic energy landscapeDespite a more than 60 percent drop in natural gas prices between 2008 and 2009, US production continued to rise. It reached an all-time high of 75 billion cubic feet per day (bcfd) by mid-2015 (figure 1). This stands in stark contrast to the energy conversation a decade ago, when the United States faced the prospects of rising imports—including LNG—creating potential supply risks and higher costs. Shale gas seemed to change the dialogue, largely moving the country’s energy challenges from drought to glut. That shift has created a number of challenges for the supply chain that will need to be mitigated to sustainably grow both gas production and disposition in the medium term. In essence, the market will need to balance the abundance of low-cost gas in key regions of the country, the near-term likelihood of low elasticity of demand, and a relatively fixed infrastructure that could limit exports.
Many of the challenges will likely stem from the interplay of geography and geology. Gas is produced from a number of basins, notably in the Northeast and along the Gulf Coast, whereas demand remains widely distributed except for clusters of heavy users in a handful of areas. Shale gas, initially in the Barnett, Fayetteville, and Haynesville—and later the Marcellus and Utica—has driven the majority of the production increase, exceeding 40 bcfd by the end of 2014.1 Even with low natural gas prices, supply has outgrown the existing infrastructure’s capacity to deliver gas to end users at various points in time, leading to significant price differentials. Less visible are shale’s and tight oil’s contributions to the US total gas production, with liquids-rich regions like the Bakken, Eagle Ford, Niobrara, and the Permian generating almost 20 bcfd.2 The economics of associated gas is tied heavily to oil and liquids pricing, which has the potential for volumes to rise even if the Henry Hub index price of natural gas declines, which can exacerbate infrastructure bottlenecks and divergent regional pricing.
Figure 1. Despite a sustained drop in prices, natural gas production has risen by almost 50 percent
Sources: Deloitte analysis, US Energy Information Administration3
Seeking growth | What will drive US natural gas demand?
5
Another challenge, however, is simply the absolute level of demand. With expected low-to-moderate economic growth, slowing population growth, and an increase in energy efficiency, domestic energy consumption will likely grow more slowly than in the past, and potentially even decline.4 While exports via pipelines to Mexico or as LNG to other markets will likely become a larger share of the US gas disposition, a saturated global gas market and lower spot prices could limit the exportable volumes for the next 5 to 10 years.5
The longer-term picture remains positive. Sustained economic growth across a number of geographically diverse developing countries will likely drive large increases in power consumption, provided in part by natural gas-fired generation. With potential to export via the Atlantic and Pacific basins, US natural gas is well positioned for a longer-term, secular increase in LNG demand. Building export capacity in the next few years could be key to accessing those future markets.
In short, there will likely be continued record levels of production combined with historically low prices for the near-to-medium term. The potential for decades of low-cost energy (and affordable feedstock for petrochemicals) via natural gas might transform the domestic natural gas-linked industries, creating demand to meet
the rising supply. However, long-term potential may not translate into short-term demand growth since a number of potential petrochemical projects currently proposed could take the better part of a decade to build and operate. That could mean low prices, but uncertain demand growth in the next few years. Upstream producers, gathering and pipeline operators, and large-scale end users will all need to adapt to this new normal.
This report covers current trends in US production and disposition of natural gas in general terms, and subsequently drills down into changes in large-scale end users such as the power generation and industrial sectors, along with potentially rapidly growing niche markets like transport. Based on these likely shifts in consumption and production, the report outlines how they will likely impact business strategy along the value chain—not just upstream oil companies or major utilities, but also midstream service providers and smaller-scale buyers.
Broadly speaking, power generation and industrial production consume two-thirds of the natural gas produced in the United States that is not exported. The residential and commercial sectors consume much of the balance; the remaining 10 percent being used for lease operations and powering pipelines, with trace amounts going toward the nascent transportation sector.6 Increasing domestic consumption will likely depend on sustained growth of one or more of these sectors, all with different potential impact, size, and timing.
Power generation consumption is relatively straightforward. Plants burning natural gas to generate steam or directly operate a turbine, thus generating power by converting chemical and mechanical energy into electricity. Natural gas-fired power plants are dispatchable—unlike intermittent power from solar and wind—making the former a complement for the latter. Moreover, natural gas has relatively low emissions7 and current low prices make it competitive with other generation sources. Near-term growth will likely be dependent on natural gas pricing relative to coal, with the medium-to-long-term picture more impacted by the fate or degree of enforcement of regulations like the federal Clean Power Plan, Mercury and Air Toxics Standards, and Production and Investment Tax Credits for wind and solar. The increasingly competitive costs of wind, solar, and electricity storage technologies, and state renewable portfolio standards are also likely to contribute.
Industrial end users consume natural gas as petrochemical feedstock (e.g., for methanol or gas-to-liquids production) or in boilers, steam plants, and other types of process heating. Lower prices would positively impact the sector, but a number of other factors should be considered. For one, the chemical processing industry and other heavy industries like manufacturing are not just energy intensive, but also capital intensive. Reducing input costs like natural gas
improves competitiveness at the margin, but sustained low prices and security of supply are likely needed for future project sanctions. Even excluding the fixed costs, natural gas prices are still only part of the marginal profit picture. The pricing of other inputs like natural gas liquids and oil, and outputs like methanol or polyethylene can be just as, if not more important when facing a competitive global market.
Residential and commercial uses are straightforward, with combustion providing space or water heating, or used for applications like cooking. While numerous factors impact consumption—including weather, population growth, and the number and energy efficiency of households and businesses—the consumption from both sectors has been flat over the past two decades, with gains in commercial use offset by declining residential consumption.8 Combined consumption is unlikely to grow materially and could, in fact, decline modestly with increasingly efficient technology and the potential of future programs like the Residential Energy Efficient Property Credit.9
For the most part, other uses like lease, pipeline, and liquefaction plant fuel consumption comprise a small but significant portion of domestic disposition. They will likely scale more or less in line with production remaining roughly 7 to 10 percent of the total.10
Transportation use, however, could be a source of new demand, although it currently represents less than one-fifth of 1 percent of production. Abundant, low-cost natural gas will likely incentivize the development of compressed natural gas (CNG) and LNG trains, trucks, and ships. In the case of the latter, LNG bunkering is one solution to tightening emissions regulations governing international shipping. Of all sectors, transport seems the most likely for rapid, disruptive growth affecting both the integrated oil and natural gas value chains, with gas displacing in some portion diesel and fuel oil—and perhaps, to a lesser extent, gasoline.
Traditional sources of demand for natural gas will likely drive future growth
Seeking growth | What will drive US natural gas demand?
6

Seeking growth | What will drive US natural gas demand?
7
Power generation demand will likely be driven by fuel switchingConsumption of natural gas by the electricity generation sector has increased substantially. It has risen from 18.7 bcfd in 2007 to 20.7 in 2011, and 27.4 in 2016—or roughly 4 percent per year—and in line with US production growth. In the process, natural gas has overtaken coal-fired generation as the No. 1 fuel source for electricity generation.11 As noted earlier, a number of factors will impact power generation sector consumption, notably regulations, the cost of competing generation sources, power plant retirements, and subsidies. With slow electric generation growth projected, the relative merits of natural gas would play an outsized role in demand growth as it competes for an increasing share of a relatively flat market.
In the case of power generation’s costs, natural gas is typically cheaper than coal and competitive with unsubsidized renewables on a full-cycle basis (i.e., leveled cost of energy including capital, operating, and fuel costs). Lazard estimates that a gas-combined cycle plant costs roughly $48 to $78 per megawatt hour generated, compared to a range of $60 to $143 for coal.12 Those averaged costs combined with future regulatory uncertainty will likely limit interest in building new coal-fired power plants, favoring natural gas by default as the most cost-effective, dispatchable energy source for replacing retiring capacity and meeting future needs.
Looking at short-term costs, however, the picture becomes more complicated due to operational and geographical considerations. These, unlike levelized comparisons, could have a strong impact in the near term, rather than the long term. Coal is cheap, with delivered costs averaging roughly $2.15 per million
British thermal units (Btu) over the last decade compared to $5.60 for gas.13 Therefore, while gas prices have declined precipitously in the last decade as shale gas production increased—and efficiencies for gas-fired plants have continued to increase—coal is still 25 percent cheaper on average, even after considering the higher heat rate of natural gas.14 However, the averages mask an underlying heterogeneity in natural gas pricing. Looking state by state, 2016 natural gas prices ranged from under $1.25 per million Btu to over $12, whereas coal was between $1.30 and $4.15 over the same period.15 That difference means that while coal may be price advantaged on a macro scale, shifts in natural gas prices can drive fuel switching on the margins.
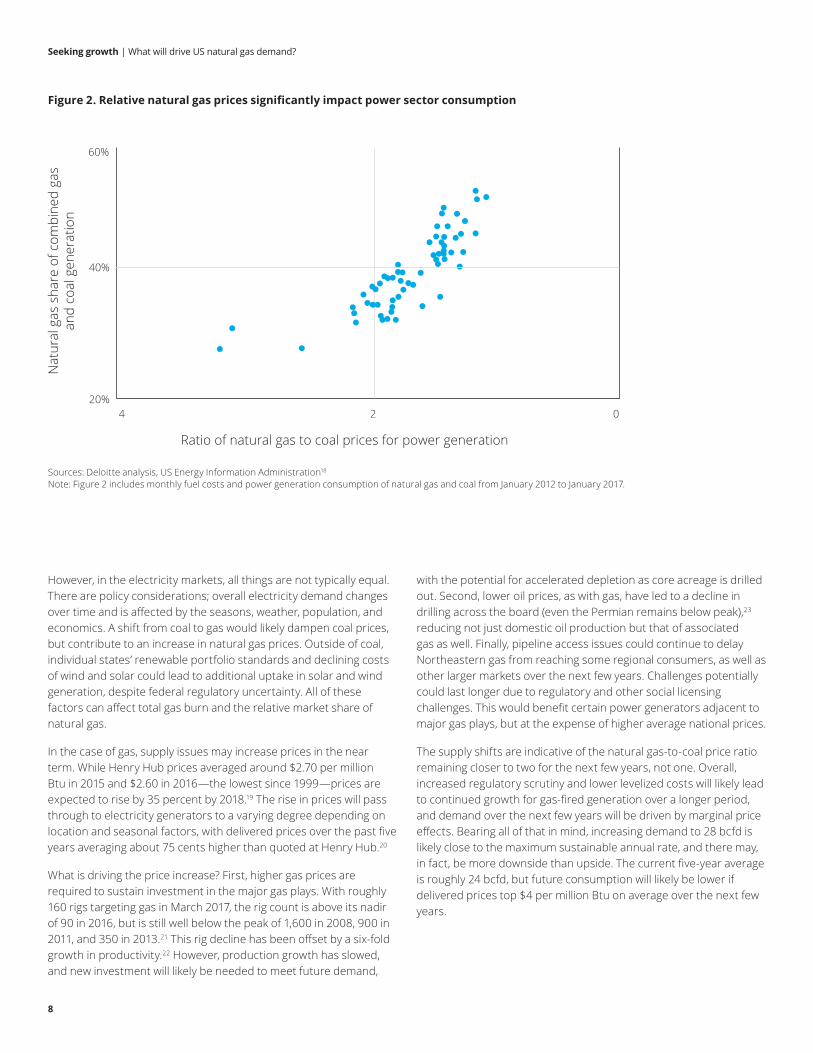
One way to illustrate the potential impact of fuel switching is comparing the relative market share in power generation of natural gas and coal to the price ratio of natural gas to coal (figure 2). As coal prices remained relatively flat, the relative cost of the two fuels has been driven by natural gas price volatility from year to year, as well as on a seasonal basis. At the beginning of 2017,16 the price ratio was close to two, with a natural gas share of 36 percent—roughly 21 bcfd.17 If that cost ratio declined to one—the lowest point in the past five years—natural gas share could increase to north of 50 percent. Holding all else equal, that would roughly translate to power sector consumption rising to 28 bcfd.
Seeking growth | What will drive US natural gas demand?
8
However, in the electricity markets, all things are not typically equal. There are policy considerations; overall electricity demand changes over time and is affected by the seasons, weather, population, and economics. A shift from coal to gas would likely dampen coal prices, but contribute to an increase in natural gas prices. Outside of coal, individual states’ renewable portfolio standards and declining costs of wind and solar could lead to additional uptake in solar and wind generation, despite federal regulatory uncertainty. All of these factors can affect total gas burn and the relative market share of natural gas.
In the case of gas, supply issues may increase prices in the near term. While Henry Hub prices averaged around $2.70 per million Btu in 2015 and $2.60 in 2016—the lowest since 1999—prices are expected to rise by 35 percent by 2018.19 The rise in prices will pass through to electricity generators to a varying degree depending on location and seasonal factors, with delivered prices over the past five years averaging about 75 cents higher than quoted at Henry Hub.20
What is driving the price increase? First, higher gas prices are required to sustain investment in the major gas plays. With roughly 160 rigs targeting gas in March 2017, the rig count is above its nadir of 90 in 2016, but is still well below the peak of 1,600 in 2008, 900 in 2011, and 350 in 2013.21 This rig decline has been offset by a six-fold growth in productivity.22 However, production growth has slowed, and new investment will likely be needed to meet future demand,
Figure 2. Relative natural gas prices significantly impact power sector consumption
Sources: Deloitte analysis, US Energy Information Administration18 Note: Figure 2 includes monthly fuel costs and power generation consumption of natural gas and coal from January 2012 to January 2017.
with the potential for accelerated depletion as core acreage is drilled out. Second, lower oil prices, as with gas, have led to a decline in drilling across the board (even the Permian remains below peak),23 reducing not just domestic oil production but that of associated gas as well. Finally, pipeline access issues could continue to delay Northeastern gas from reaching some regional consumers, as well as other larger markets over the next few years. Challenges potentially could last longer due to regulatory and other social licensing challenges. This would benefit certain power generators adjacent to major gas plays, but at the expense of higher average national prices.
The supply shifts are indicative of the natural gas-to-coal price ratio remaining closer to two for the next few years, not one. Overall, increased regulatory scrutiny and lower levelized costs will likely lead to continued growth for gas-fired generation over a longer period, and demand over the next few years will be driven by marginal price effects. Bearing all of that in mind, increasing demand to 28 bcfd is likely close to the maximum sustainable annual rate, and there may, in fact, be more downside than upside. The current five-year average is roughly 24 bcfd, but future consumption will likely be lower if delivered prices top $4 per million Btu on average over the next few years.
Nat
ural
gas
sha
re o
f com
bine
d ga
s an
d co
al g
ener
atio
n
4 2 0
Ratio of natural gas to coal prices for power generation
60%
40%
20%
Seeking growth | What will drive US natural gas demand?
9
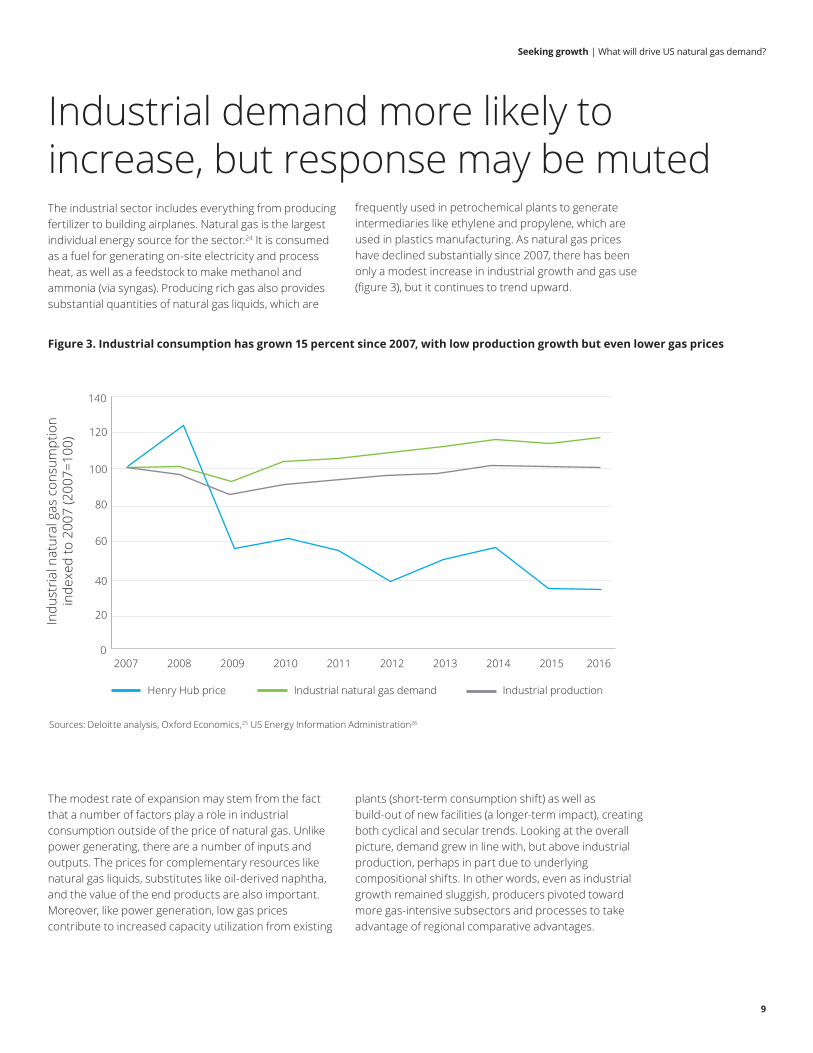
Industrial demand more likely to increase, but response may be mutedThe industrial sector includes everything from producing fertilizer to building airplanes. Natural gas is the largest individual energy source for the sector.24 It is consumed as a fuel for generating on-site electricity and process heat, as well as a feedstock to make methanol and ammonia (via syngas). Producing rich gas also provides substantial quantities of natural gas liquids, which are
frequently used in petrochemical plants to generate intermediaries like ethylene and propylene, which are used in plastics manufacturing. As natural gas prices have declined substantially since 2007, there has been only a modest increase in industrial growth and gas use (figure 3), but it continues to trend upward.
Figure 3. Industrial consumption has grown 15 percent since 2007, with low production growth but even lower gas prices
Sources: Deloitte analysis, Oxford Economics,25 US Energy Information Administration26
The modest rate of expansion may stem from the fact that a number of factors play a role in industrial consumption outside of the price of natural gas. Unlike power generating, there are a number of inputs and outputs. The prices for complementary resources like natural gas liquids, substitutes like oil-derived naphtha, and the value of the end products are also important. Moreover, like power generation, low gas prices contribute to increased capacity utilization from existing
plants (short-term consumption shift) as well as build-out of new facilities (a longer-term impact), creating both cyclical and secular trends. Looking at the overall picture, demand grew in line with, but above industrial production, perhaps in part due to underlying compositional shifts. In other words, even as industrial growth remained sluggish, producers pivoted toward more gas-intensive subsectors and processes to take advantage of regional comparative advantages.
0
140
2007 2008 2009 2010 2011 2012 2013 2014 2015 2016
Henry Hub price Industrial natural gas demand Industrial production
120
100
80
60
40
20Indu
stria
l nat
ural
gas
con
sum
ptio
n in
dexe
d to
200
7 (2
007=
100)
Seeking growth | What will drive US natural gas demand?
10
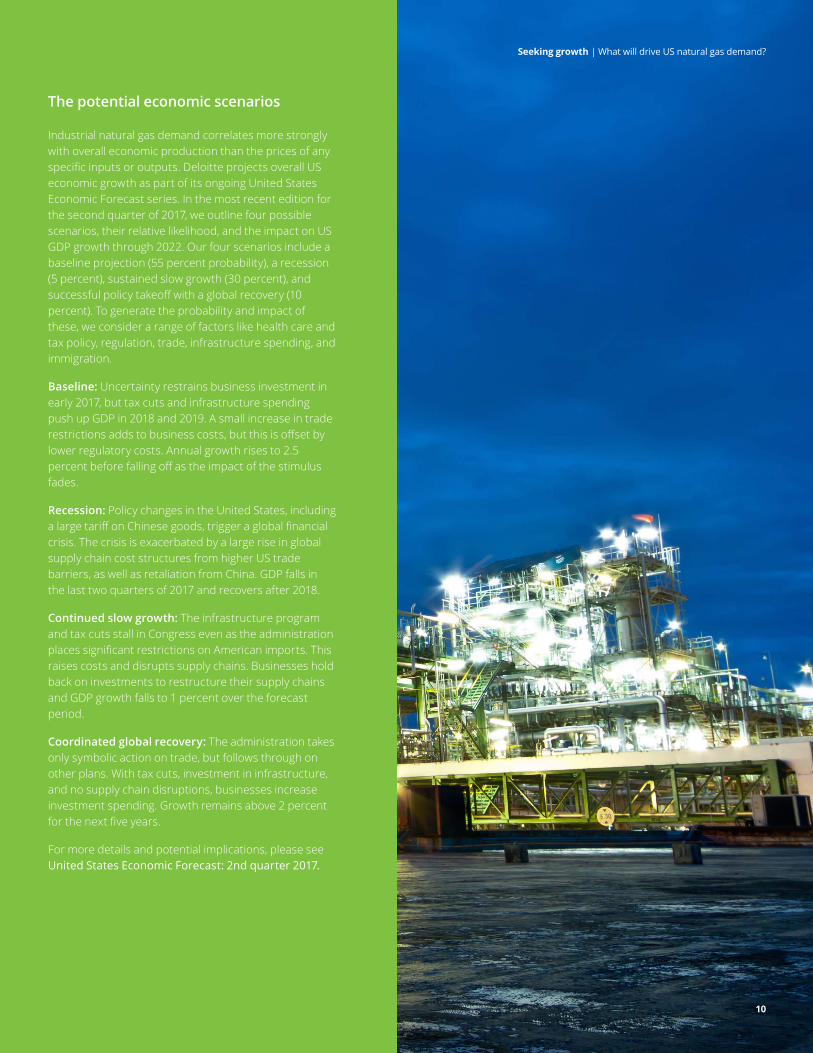
Industrial natural gas demand correlates more strongly with overall economic production than the prices of any specific inputs or outputs. Deloitte projects overall US economic growth as part of its ongoing United States Economic Forecast series. In the most recent edition for the second quarter of 2017, we outline four possible scenarios, their relative likelihood, and the impact on US GDP growth through 2022. Our four scenarios include a baseline projection (55 percent probability), a recession (5 percent), sustained slow growth (30 percent), and successful policy takeoff with a global recovery (10 percent). To generate the probability and impact of these, we consider a range of factors like health care and tax policy, regulation, trade, infrastructure spending, and immigration.
Baseline: Uncertainty restrains business investment in early 2017, but tax cuts and infrastructure spending push up GDP in 2018 and 2019. A small increase in trade restrictions adds to business costs, but this is offset by lower regulatory costs. Annual growth rises to 2.5 percent before falling off as the impact of the stimulus fades.
Recession: Policy changes in the United States, including a large tariff on Chinese goods, trigger a global financial crisis. The crisis is exacerbated by a large rise in global supply chain cost structures from higher US trade barriers, as well as retaliation from China. GDP falls in the last two quarters of 2017 and recovers after 2018.
Continued slow growth: The infrastructure program and tax cuts stall in Congress even as the administration places significant restrictions on American imports. This raises costs and disrupts supply chains. Businesses hold back on investments to restructure their supply chains and GDP growth falls to 1 percent over the forecast period.
Coordinated global recovery: The administration takes only symbolic action on trade, but follows through on other plans. With tax cuts, investment in infrastructure, and no supply chain disruptions, businesses increase investment spending. Growth remains above 2 percent for the next five years.
For more details and potential implications, please see United States Economic Forecast: 2nd quarter 2017.
The potential economic scenarios
Seeking growth | What will drive US natural gas demand?
10
Seeking growth | What will drive US natural gas demand?
11
Current consumption levels (bcfde)
Residual fuel oil sales for marine
Distillate fuel oil sales for rail and marine
Distillate fuel oil sales for highway
5 10 15
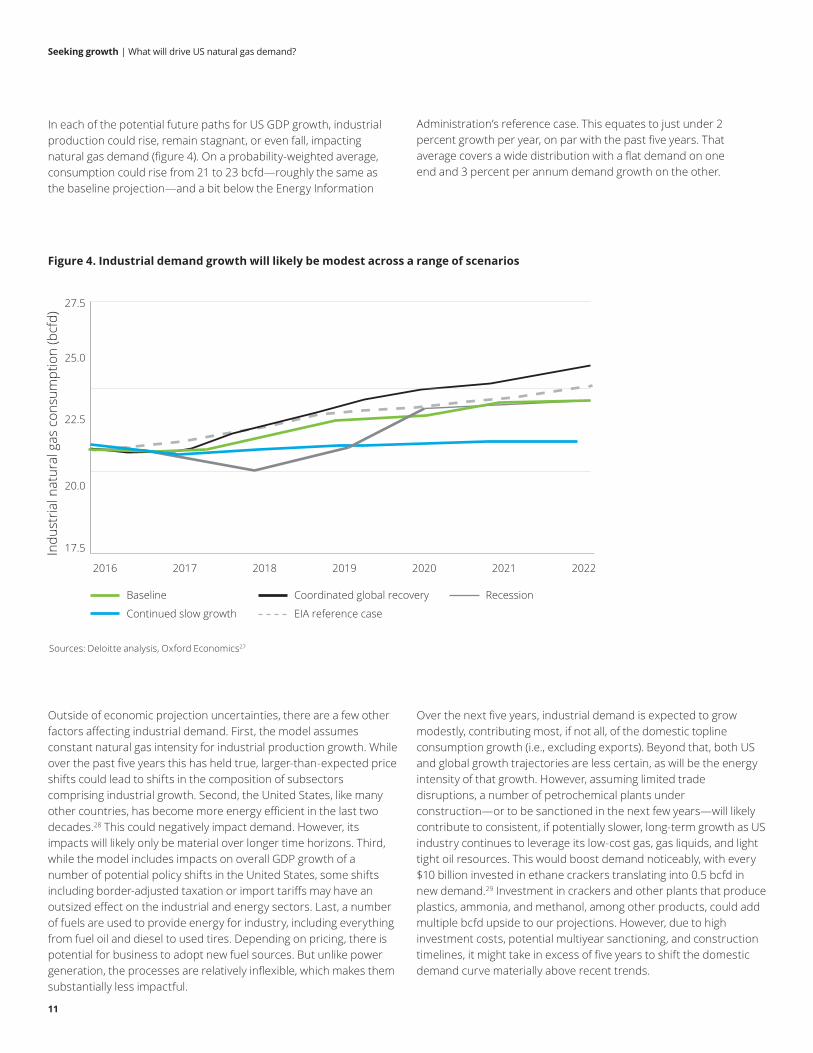
Figure 4. Industrial demand growth will likely be modest across a range of scenarios
Sources: Deloitte analysis, Oxford Economics27
Outside of economic projection uncertainties, there are a few other factors affecting industrial demand. First, the model assumes constant natural gas intensity for industrial production growth. While over the past five years this has held true, larger-than-expected price shifts could lead to shifts in the composition of subsectors comprising industrial growth. Second, the United States, like many other countries, has become more energy efficient in the last two decades.28 This could negatively impact demand. However, its impacts will likely only be material over longer time horizons. Third, while the model includes impacts on overall GDP growth of a number of potential policy shifts in the United States, some shifts including border-adjusted taxation or import tariffs may have an outsized effect on the industrial and energy sectors. Last, a number of fuels are used to provide energy for industry, including everything from fuel oil and diesel to used tires. Depending on pricing, there is potential for business to adopt new fuel sources. But unlike power generation, the processes are relatively inflexible, which makes them substantially less impactful.
Over the next five years, industrial demand is expected to grow modestly, contributing most, if not all, of the domestic topline consumption growth (i.e., excluding exports). Beyond that, both US and global growth trajectories are less certain, as will be the energy intensity of that growth. However, assuming limited trade disruptions, a number of petrochemical plants under construction—or to be sanctioned in the next few years—will likely contribute to consistent, if potentially slower, long-term growth as US industry continues to leverage its low-cost gas, gas liquids, and light tight oil resources. This would boost demand noticeably, with every $10 billion invested in ethane crackers translating into 0.5 bcfd in new demand.29 Investment in crackers and other plants that produce plastics, ammonia, and methanol, among other products, could add multiple bcfd upside to our projections. However, due to high investment costs, potential multiyear sanctioning, and construction timelines, it might take in excess of five years to shift the domestic demand curve materially above recent trends.
20.0
17.5
22.5
25.0
27.5
Indu
stria
l nat
ural
gas
con
sum
ptio
n (b
cfd)
2016 2017 2018 2019 2020 2021 2022
Baseline
Continued slow growth
Coordinated global recovery Recession
EIA reference case
In each of the potential future paths for US GDP growth, industrial production could rise, remain stagnant, or even fall, impacting natural gas demand (figure 4). On a probability-weighted average, consumption could rise from 21 to 23 bcfd—roughly the same as the baseline projection—and a bit below the Energy Information
Administration’s reference case. This equates to just under 2 percent growth per year, on par with the past five years. That average covers a wide distribution with a flat demand on one end and 3 percent per annum demand growth on the other.
Seeking growth | What will drive US natural gas demand?
12
Current consumption levels (bcfde)
Residual fuel oil sales for marine
Distillate fuel oil sales for rail and marine
Distillate fuel oil sales for highway
5 10 15
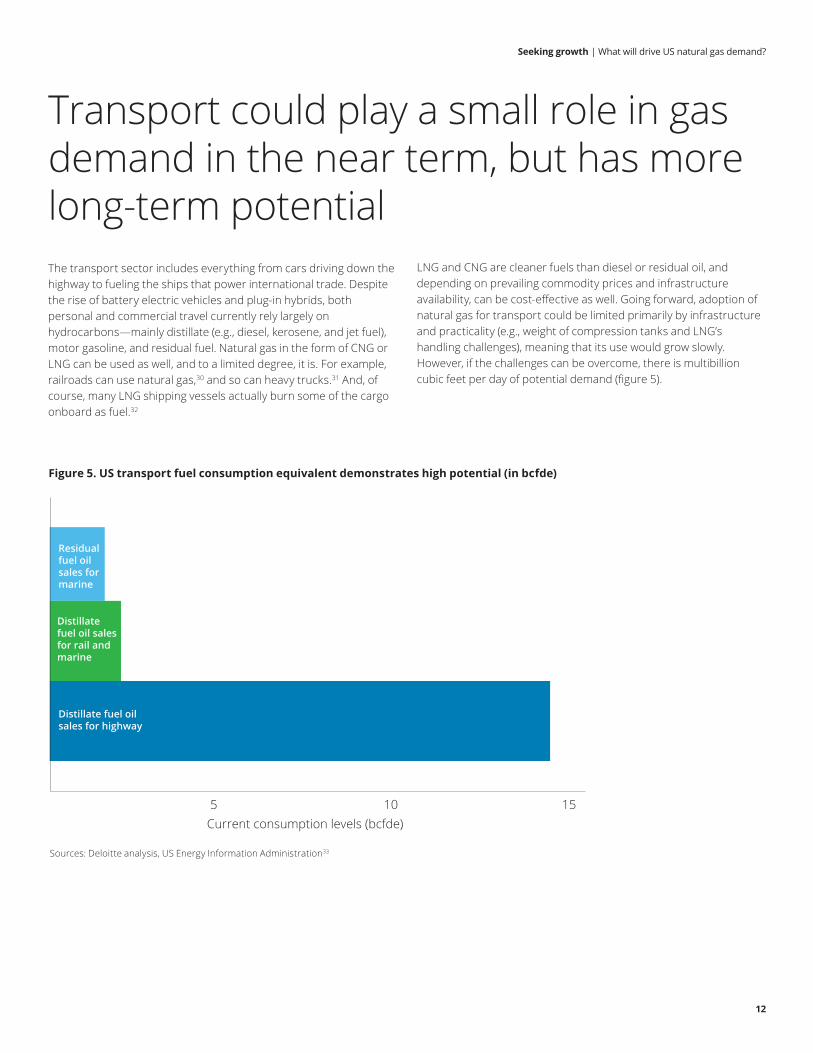
Transport could play a small role in gas demand in the near term, but has more long-term potentialThe transport sector includes everything from cars driving down the highway to fueling the ships that power international trade. Despite the rise of battery electric vehicles and plug-in hybrids, both personal and commercial travel currently rely largely on hydrocarbons—mainly distillate (e.g., diesel, kerosene, and jet fuel), motor gasoline, and residual fuel. Natural gas in the form of CNG or LNG can be used as well, and to a limited degree, it is. For example, railroads can use natural gas,30 and so can heavy trucks.31 And, of course, many LNG shipping vessels actually burn some of the cargo onboard as fuel.32
LNG and CNG are cleaner fuels than diesel or residual oil, and depending on prevailing commodity prices and infrastructure availability, can be cost-effective as well. Going forward, adoption of natural gas for transport could be limited primarily by infrastructure and practicality (e.g., weight of compression tanks and LNG’s handling challenges), meaning that its use would grow slowly. However, if the challenges can be overcome, there is multibillion cubic feet per day of potential demand (figure 5).
Figure 5. US transport fuel consumption equivalent demonstrates high potential (in bcfde)
Sources: Deloitte analysis, US Energy Information Administration33
Seeking growth | What will drive US natural gas demand?
13
Natural gas over a longer-term horizon has the potential to replace substantial portions of residual fuel oil and diesel use for marine bunkering. Rail use remains more speculative, and the largest potential demand source—widespread highway consumption—remains unlikely. But like much of the energy industry, there is a need to balance practicality and costs with regulatory goals, mainly regarding emissions, and that could provide opportunities.
Natural gas has environmental attributes that work in its favor. For example, the International Maritime Organization set a January 2020 deadline to reduce sulfur emissions from shipping.34 While shippers can take a number of approaches to meet future requirements—including using pollution control equipment and switching to lower sulfur liquid fuels—LNG could prove cheaper.35 Interest in reducing sulfur emissions, along with nitrogen and carbon oxides, could lead to increased scrutiny across the transportation sector, both internationally and in the United States. Considering transportation contributes almost 15 percent of greenhouse gas emissions globally,36 this could become a higher priority as countries move to meet reduction targets outlined in the Paris Accords in 2015. The United States’ recent decision to withdraw from the current agreement serves as a reminder of the limitations of nonbinding agreements and the overall regulatory uncertainty. However, the trend both globally and domestically seems to be toward a less carbon-intensive transport industry.
A challenge will be infrastructure build-out. With rail’s fixed routes, creating LNG storage and fueling capacity could cost significant time and money, though it is otherwise straightforward. However, in the case of trucking and shipping, with a large number of routes and destinations, the lack of infrastructure poses problems that will likely be harder to tackle. There are more than 150,000 fueling stations of some kind in the United States, with about half of them selling diesel.37 There are only 1,000 stations selling either CNG or LNG.38 About 99 percent of the world’s sea trade moves through 835 ports, stretching from Albania to Yemen,39 but only a handful provide LNG bunkering capacity.40 Clearly much more fueling capacity will be needed.
Network effects will be highly relevant for the future, with an increase in LNG fueling capacity leading to increased usage, and thus more interest in building additional fueling infrastructure. Absent a regulatory push, natural gas fueling might prove to be a multidecade effort, and potentially muted by the deployment of new technologies, like low-cost batteries. That being said, a complete shift from distillate to natural gas for highway use would increase demand by a factor of more than a hundred compared to today,41 so even incremental gains would greatly increase transport consumption of natural gas.
Seeking growth | What will drive US natural gas demand?
14
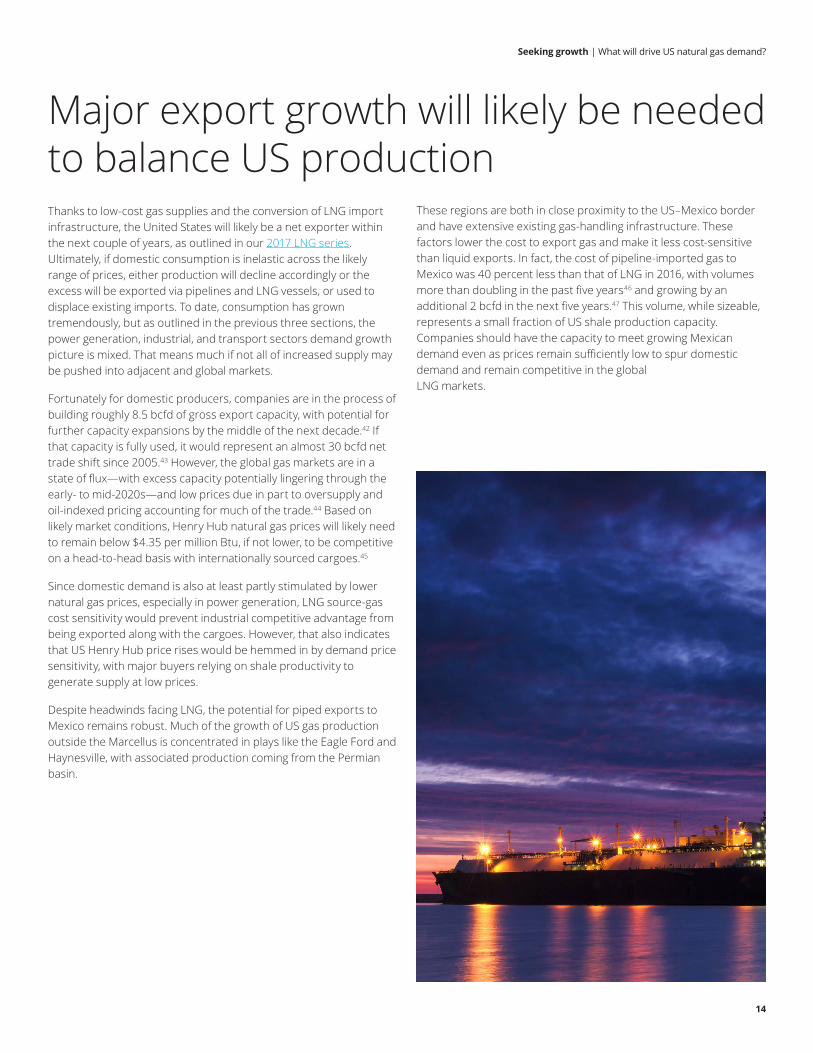
Major export growth will likely be needed to balance US production Thanks to low-cost gas supplies and the conversion of LNG import infrastructure, the United States will likely be a net exporter within the next couple of years, as outlined in our 2017 LNG series. Ultimately, if domestic consumption is inelastic across the likely range of prices, either production will decline accordingly or the excess will be exported via pipelines and LNG vessels, or used to displace existing imports. To date, consumption has grown tremendously, but as outlined in the previous three sections, the power generation, industrial, and transport sectors demand growth picture is mixed. That means much if not all of increased supply may be pushed into adjacent and global markets.
Fortunately for domestic producers, companies are in the process of building roughly 8.5 bcfd of gross export capacity, with potential for further capacity expansions by the middle of the next decade.42 If that capacity is fully used, it would represent an almost 30 bcfd net trade shift since 2005.43 However, the global gas markets are in a state of flux—with excess capacity potentially lingering through the early- to mid-2020s—and low prices due in part to oversupply and oil-indexed pricing accounting for much of the trade.44 Based on likely market conditions, Henry Hub natural gas prices will likely need to remain below $4.35 per million Btu, if not lower, to be competitive on a head-to-head basis with internationally sourced cargoes.45
Since domestic demand is also at least partly stimulated by lower natural gas prices, especially in power generation, LNG source-gas cost sensitivity would prevent industrial competitive advantage from being exported along with the cargoes. However, that also indicates that US Henry Hub price rises would be hemmed in by demand price sensitivity, with major buyers relying on shale productivity to generate supply at low prices.
Despite headwinds facing LNG, the potential for piped exports to Mexico remains robust. Much of the growth of US gas production outside the Marcellus is concentrated in plays like the Eagle Ford and Haynesville, with associated production coming from the Permian basin.
These regions are both in close proximity to the US–Mexico border and have extensive existing gas-handling infrastructure. These factors lower the cost to export gas and make it less cost-sensitive than liquid exports. In fact, the cost of pipeline-imported gas to Mexico was 40 percent less than that of LNG in 2016, with volumes more than doubling in the past five years46 and growing by an additional 2 bcfd in the next five years.47 This volume, while sizeable, represents a small fraction of US shale production capacity. Companies should have the capacity to meet growing Mexican demand even as prices remain sufficiently low to spur domestic demand and remain competitive in the global LNG markets.
Seeking growth | What will drive US natural gas demand?
15
Topline consumption numbers will likely prove misleading. Due to the difficulty in transporting natural gas cost effectively outside of pipelines, the market consists of an integrated hub and spoke model, connecting producers to downstream consumers. These networks have restrictions in total flow; certain regions produce a lot of gas, others consume a fair bit, and, notably, places like the Gulf Coast manage to do both. Since demand is seasonal, storage constraints can have large effects as well. To analyze how demand growth will affect the industry, it helps to break out market segments and likely scenarios—in this case, as a three-by-three grid where the three scenarios reflect the uncertainty for consumption growth and the three segments reflect the traditional upstream-downstream dichotomy (figure 6).
Low prices and stable demand paint a challenging picture for the natural gas supply chainDuring the past 10 years, upstream producers have shown remarkable resilience by increasing production, cutting costs, building infrastructure, and developing new acreage. Today, the outlook is not as clear. While low prices have spurred demand growth across a number of sectors, prices are unlikely to sustainably drop much further. Nor is there a new large domestic demand center entering the picture in the next five years. Exports will certainly drive growth. To a lesser extent, so will industry, with some smaller potential from electricity producers and alternative fuel transport.
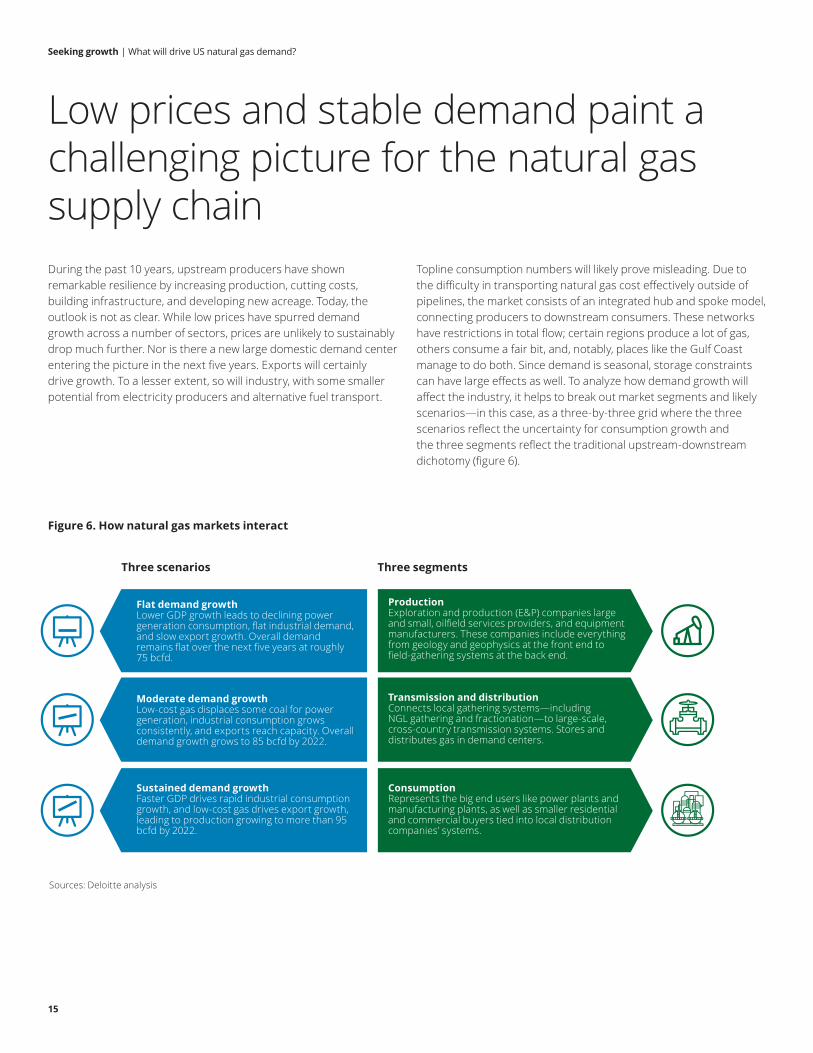
Figure 6. How natural gas markets interact
Sources: Deloitte analysis
Flat demand growthLower GDP growth leads to declining power generation consumption, flat industrial demand, and slow export growth. Overall demand remains flat over the next five years at roughly 75 bcfd.
ProductionExploration and production (E&P) companies large and small, oilfield services providers, and equipment manufacturers. These companies include everything from geology and geophysics at the front end to field-gathering systems at the back end.
Transmission and distributionConnects local gathering systems—including NGL gathering and fractionation—to large-scale, cross-country transmission systems. Stores and distributes gas in demand centers.
ConsumptionRepresents the big end users like power plants and manufacturing plants, as well as smaller residential and commercial buyers tied into local distribution companies’ systems.
Moderate demand growthLow-cost gas displaces some coal for power generation, industrial consumption grows consistently, and exports reach capacity. Overall demand growth grows to 85 bcfd by 2022.
Sustained demand growthFaster GDP drives rapid industrial consumption growth, and low-cost gas drives export growth, leading to production growing to more than 95 bcfd by 2022.
Three scenarios Three segments
Seeking growth | What will drive US natural gas demand?
16
In a flat demand growth scenario—where global growth remains anemic and shale gas resource extraction costs rise—natural gas net consumption remains roughly 75 bcfd, with the lack of growth primarily caused by higher prices. More expensive gas, relatively cheap coal, and continued renewable investment cause a decline in power generation demand. Rising energy costs incentivize new efficiency measures, cutting down demand. And higher domestic prices translate into low net exports.
The second scenario (moderate demand growth)—which is more or less business as usual—relies on modest, but sustained economic growth with a moderate increase in Henry Hub prices. While electric generators do not increase gas burn significantly, they also do not switch to coal or renewable generation either. Moderate industrial consumption growth, on the order of 2 to 3 bcfd, continues in line with historical energy demand and modest GDP growth. While no new LNG projects are sanctioned and brownfield expansions are pushed past the next five years, existing liquefaction and pipeline capacity is fully used. This scenario increases demand from 75 to 85 bcfd by 2022.
The third scenario (sustained demand growth) relies on US gas prices rising relatively slowly—even as global economic growth increases—leading to a boost in domestic consumption and exports.
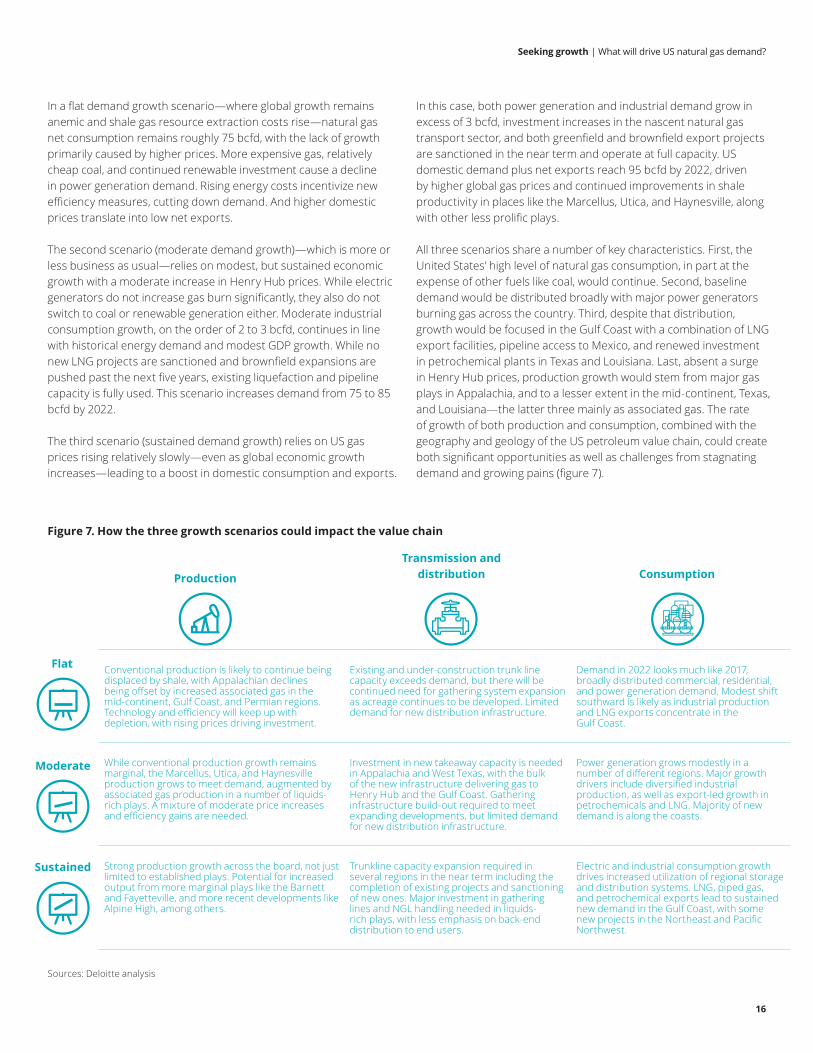
Figure 7. How the three growth scenarios could impact the value chain
Sources: Deloitte analysis
In this case, both power generation and industrial demand grow in excess of 3 bcfd, investment increases in the nascent natural gas transport sector, and both greenfield and brownfield export projects are sanctioned in the near term and operate at full capacity. US domestic demand plus net exports reach 95 bcfd by 2022, driven by higher global gas prices and continued improvements in shale productivity in places like the Marcellus, Utica, and Haynesville, along with other less prolific plays.
All three scenarios share a number of key characteristics. First, the United States’ high level of natural gas consumption, in part at the expense of other fuels like coal, would continue. Second, baseline demand would be distributed broadly with major power generators burning gas across the country. Third, despite that distribution, growth would be focused in the Gulf Coast with a combination of LNG export facilities, pipeline access to Mexico, and renewed investment in petrochemical plants in Texas and Louisiana. Last, absent a surge in Henry Hub prices, production growth would stem from major gas plays in Appalachia, and to a lesser extent in the mid-continent, Texas, and Louisiana—the latter three mainly as associated gas. The rate of growth of both production and consumption, combined with the geography and geology of the US petroleum value chain, could create both significant opportunities as well as challenges from stagnating demand and growing pains (figure 7).
Conventional production is likely to continue being displaced by shale, with Appalachian declines being offset by increased associated gas in the mid-continent, Gulf Coast, and Permian regions. Technology and efficiency will keep up with depletion, with rising prices driving investment.
Existing and under-construction trunk line capacity exceeds demand, but there will be continued need for gathering system expansion as acreage continues to be developed. Limited demand for new distribution infrastructure.
Demand in 2022 looks much like 2017, broadly distributed commercial, residential, and power generation demand. Modest shift southward is likely as industrial production and LNG exports concentrate in the Gulf Coast.
While conventional production growth remains marginal, the Marcellus, Utica, and Haynesville production grows to meet demand, augmented by associated gas production in a number of liquids-rich plays. A mixture of moderate price increases and efficiency gains are needed.
Investment in new takeaway capacity is needed in Appalachia and West Texas, with the bulk of the new infrastructure delivering gas to Henry Hub and the Gulf Coast. Gathering infrastructure build-out required to meet expanding developments, but limited demand for new distribution infrastructure.
Power generation grows modestly in a number of different regions. Major growth drivers include diversified industrial production, as well as export-led growth in petrochemicals and LNG. Majority of new demand is along the coasts.
Strong production growth across the board, not just limited to established plays. Potential for increased output from more marginal plays like the Barnett and Fayetteville, and more recent developments like Alpine High, among others.
Trunkline capacity expansion required in several regions in the near term including the completion of existing projects and sanctioning of new ones. Major investment in gathering lines and NGL handling needed in liquids-rich plays, with less emphasis on back-end distribution to end users.
Electric and industrial consumption growth drives increased utilization of regional storage and distribution systems. LNG, piped gas, and petrochemical exports lead to sustained new demand in the Gulf Coast, with some new projects in the Northeast and Pacific Northwest.
Production ConsumptionTransmission and
distribution
Flat
Moderate
Sustained

Seeking growth | What will drive US natural gas demand?
17
The midstream sector would bear the brunt of the impact in the flat demand growth scenario. Infrastructure is currently under construction with additional expansions under consideration. With long lead times for sanctioning, permitting, and construction, underwhelming growth could lead to underutilization of capacity and limited revenue upsides from other services like gas storage and NGL handling.
Some upstream and downstream companies may see trimmed growth trajectories in a flat world, but for many it would look much like business as usual. For E&Ps, even flat demand would require continuing investment, and increasing Henry Hub prices would be well received. For example, many Marcellus wells decline in excess of 50 percent in the first year alone48 and companies have a large number of undrilled remaining locations to keep up production levels, necessitating significant spend. Similarly for end users, flat demand would include some growth in certain advantaged subsectors like petrochemicals—which would offset declines elsewhere—but the 30,000-foot view would look more or less the same.
The moderate and sustained demand scenarios have similar implications, differing mainly in the scale and details of investment, but not in the general trend. Growth in demand from domestic end users and exporters would necessitate significant upstream investment not just to offset declining production in places like the Marcellus, but to add rigs in more marginal plays including the Haynesville, and potentially the Barnett or Fayetteville—with the latter depending on relative efficiency and shale well productivity gains.
Demand growth would also require brownfield expansion at existing manufacturing plants and LNG export facilities, and if sufficiently large, the build-out of new ones. In both cases, the limiting factor likely would be demand, not opportunities, with billions of dollars of potential petrochemical49 and LNG capacity under consideration.50 Moreover, the difference between a moderate and sustained
scenario would primarily be the rate of investment. Globally competitive resource costs (e.g., light oil, NGLs, natural gas, etc.) and the flexibility to export both raw materials and finished products provides significant flexibility for both the upstream and downstream sectors—reducing strategic, commodity, and counterparty risks. The total size and timing of investments may shift, but the long-term fundamentals are likely sound.
For midstream companies, the rate of change could play a much larger role in business planning. Unlike petrochemicals that can be shipped to a number of buyers, pipelines have fixed gathering and delivery points. Overbuilding, delays, and sudden shifts in commodity prices can lead (and have) to mismatched supply and demand of transport, as well as auxiliary services. Balancing risks between a more modest and sustained growth scenario could be key. There are more than 30 potential gas transmission pipeline projects with planned in-service dates between 2017 and 2020. Some are already partially operational, while others have not finished permitting, or are on hold.51 Most connect the Northeast and Midwest to the Gulf Coast, although there are a number of potential laterals to reach major demand centers and expand takeaway capacity in the Permian.52
These projects face a number of challenges, notably environmental and legal opposition.53 In the past, transport constraints have led to wide regional gas price differentials,54 representing a missed opportunity for midstream revenue. Future delays in these projects could lead to déjà vu. Absent delays, and in light of more modest natural gas demand growth, overbuilding transmission capacity could cause lower utilization. If lower demand translates into businesses exiting either side of the pipeline, this could also cause potential contractual or counterparty risk. Much of the same can be said of the gathering, NGL handling, storage, and distribution sides of the business.
Both risk planning and project execution will likely be key in the next few years—for midstream players to a much greater degree than either upstream or downstream companies.
Seeking growth | What will drive US natural gas demand?
18
The outlook for natural gas remains positive despite uncertainty
Few things can be said of the domestic gas market with any certainty, but some stylized facts bound the conversation. For starters, it will likely be larger than it was 10 years ago. Prices are expected to remain at a fraction of what they were a decade ago. Perhaps more debatable is the rate of domestic consumption growth, which may be lower over the next five years than in the preceding five. Last, growing net exports will probably be needed to generate both production growth and rising prices. Otherwise the United States would either face a shortfall in capital to invest in the upstream sector, or local demand would be insufficient to fully take advantage of the low-cost resource base. Exports should be competitive, with some uncertainty around the US cost of supply and the price for competitive cargoes in the international markets.
The domestic power sector perhaps has the most potential as a source of swing consumption, although at current prices there is more downside than upside potential. Industrial growth is more likely to remain positive. Global economic growth and its impact on US GDP could play an outsized role, as opposed to natural gas prices per se. Transport could provide a large, sustained boost to demand as well, and unlike power generation, the opportunities to displace
other fuels is untapped. Infrastructure build-out and domestic regulatory incentives will be needed for that sector to take off in the near term, even as agreements like the Paris Accords provide longer-term global incentives—particularly since the latter faces political uncertainty.
Ultimately, modest demand growth in the United States, along with both pipeline and LNG exports, would generate opportunities for the natural gas value chain. There will need to be continued investment in developing shale acreage, along with the infrastructure to take gas to market. However, identifying growing downstream users and balancing the risks of under- and over-building infrastructure remain vital to sustained midstream growth.
Seeking growth | What will drive US natural gas demand?
19
Endnotes1. “Natural gas weekly update,” US Energy Information Administration, February 9, 2017, https://www.eia.gov/naturalgas/weekly/, accessed February 14,
2017.2. “Drilling productivity report,” US Information Administration, February 13, 2017, http://www.eia.gov/petroleum/drilling/, accessed February 14, 2017.3. US dry natural gas production, US Energy Information Administration, https://www.eia.gov/dnav/ng/hist/n9070us2M.htm, accessed February 15, 2017;
Henry Hub natural gas spot price, US Energy Information Administration, https://www.eia.gov/dnav/ng/hist/rngwhhdm.htm, accessed February 15, 2017.
4. “Annual Energy Outlook 2017,” US Energy Information Administration, January 5, 2017, http://www.eia.gov/outlooks/aeo/, accessed February 14, 2017.5. Jason Bordoff and Akos Losz, “If you build it, will they come? The competitiveness of US LNG in overseas markets,” Columbia University, Center on
Global Energy Policy, November 22, 2016, http://energypolicy.columbia.edu/sites/default/files/energy/Competitiveness%20of%20US%20LNG%20in%20Overseas%20Markets.pdf, accessed February 14, 2017.
6. “Annual Energy Outlook 2017,” US Energy Information Administration.7. “How much carbon dioxide is produced when different fuels are burned?” US Energy Information Administration, June 14, 2016, https://www.eia.gov/
tools/faqs/faq.cfm?id=73&t=11, accessed February 14, 2017.8. Natural gas consumption by end use, Energy Information Administration, http://www.eia.gov/dnav/ng/ng_cons_sum_dcu_nus_a.htm, accessed
February 15, 2017.9. “Residential Energy Efficient Property Credit (Section 25D) at a glance,” US Internal Revenue Service, https://www.irs.gov/credits-deductions/
individuals/residential-energy-efficient-property-credit, accessed February 15, 2017.10. Natural gas consumption by end use, Energy Information Administration, http://www.eia.gov/dnav/ng/ng_cons_sum_dcu_nus_a.htm. 11. US natural gas deliveries to electric power consumers, US Energy Information Administration, https://www.eia.gov/dnav/ng/hist/n3045us2a.htm,
accessed March 1, 2017.12. “Levelized cost of energy analysis, version 10.0,” Lazard, December 2016, https://www.lazard.com/media/438038/levelized-cost-of-energy-v100.pdf,
accessed March 23, 2017.13. “Weighted average cost of fossil fuels for the electric power industry, 2005 through 2015,” US Energy Information Administration, November 21, 2016,
https://www.eia.gov/electricity/annual/html/epa_07_04.html, accessed March 23, 2017.14. Ibid; Assuming heat rate of 10,500 and 7,900 Btu per kilowatt-hour for coal and natural gas, respectively, based on “Average operating heat rate for
selected energy source,” US Energy Information Administration, November 21, 2016, https://www.eia.gov/electricity/annual/html/epa_08_01.html, accessed March 23, 2017.
15. Average cost of fossil fuels by state for electricity generation for coal and natural gas on a monthly basis, based on “Electricity data browser,” US Energy Information Administration, November 21, 2016, https://www.eia.gov/electricity/data.cfm, accessed March 23, 2017.
16. Ibid.17. Natural gas and coal consumption for electricity generation (Btu) market share, based on “Electricity data browser,” US Energy Information
Administration, November 21, 2016, https://www.eia.gov/electricity/data.cfm, accessed March 28, 2017.18. Average cost of fossil fuels by state for electricity generation for coal and natural gas on a monthly basis in thousand cubic feet, thousand tons,
and million Btu, and natural gas and coal consumption for electricity generation (Btu) market share, based on “Electricity data browser,” US Energy Information Administration.
19. “Henry Hub sport price by year, converted from dollars per thousand cubic feet to dollars per million British thermal unit, “Short-term energy outlook,” US Energy Information Administration, March 7, 2017, https://www.eia.gov/outlooks/steo/report/natgas.cfm, accessed March 23, 2017.
20. Comparison of Henry Hub and average delivered natural gas monthly prices, US Energy Information Administration.21. US rig count split by oil, gas, and miscellaneous, Baker Hughes, March 17, 2017, http://phx.corporate-ir.net/phoenix.zhtml?c=79687&p=irol-
reportsother, accessed March 23, 2017.22. Drilling productivity report, Marcellus region, US Energy Information Administration, April 17, 2017, https://www.eia.gov/petroleum/drilling/pdf/
marcellus.pdf, accessed May 9, 2017.23. Ibid.24. “Preliminary estimates show that U.S. manufacturing energy consumption increased between 2010 and 2014,” US Energy Information Administration,
October 13, 2016, https://www.eia.gov/consumption/manufacturing/reports/2014/pre_estimates/?src=%E2%80%B9%20Consumption%20%20%20%20%20%20Manufacturing%20Energy%20Consumption%20Survey%20(MECS)-f1, accessed March 29, 2017.
25. Industrial production index, 2007-2016, Oxford Economics and Haver Analytics historical data.26. Annual Henry Hub natural gas spot price, US Energy Information Administration, https://www.eia.gov/dnav/ng/hist/rngwhhdA.htm, accessed April 13,
2017; Annual industrial consumption as part of natural gas consumption by end use, US Energy Information Administration, https://www.eia.gov/dnav/ng/ng_cons_sum_dcu_nus_a.htm, accessed April 13, 2017.
27. Deloitte projections based on Oxford Economics’ Global Economic Model, using OECD, Haver Analytics, and US government agency data.28. Energy intensity level of primary energy (MJ/$2011 PPP GDP), The World Bank, http://data.worldbank.org/indicator/EG.EGY.PRIM.
PP.KD?end=2012&locations=US&start=1990, accessed April 13, 2017.29. Ethylene plant construction cost estimates, “Infographic: US ethane cracker construction costs rise 1-2% year on year,” Petrochemical Update, April
7, 2016, http://analysis.petchem-update.com/engineering-and-construction/infographic-us-ethane-cracker-construction-costs-rise-1-2-year-year, accessed May 9, 2017; Ethylene production natural gas consumption estimates, Gurcan Gulen, Xinya Zhang and Michel Foss, “Outlook on industrial sector demand for natural gas,” June 2015, http://www.beg.utexas.edu/energyecon/thinkcorner/CEE_Research_Note-Outlooks_on_Industrial_Sector_Gas_Demand-Jun15.pdf, accessed May 9, 2017.
Seeking growth | What will drive US natural gas demand?
20
30. William Vantuono, “Locomotives: Is LNG the next generation?” Railway Age, September 10, 2014, http://www.railwayage.com/index.php/mechanical/locomotives/locomotives-is-lng-the-next-generation.html, accessed April 14, 2017.
31. “Shell grows LNG truck fueling network in the US, adding a second site in California,” Shell, December 1, 2015, http://www.shell.com/energy-and-innovation/natural-gas/lng-for-transport/news-and-media-releases/shell-grows-lng-truck-fuelling-network-in-the-united-states.html, accessed April 14, 2017.
32. “Propulsion trends in LNG carriers,” MAN Diesel and Turbo, http://marine.man.eu/docs/librariesprovider6/technical-papers/propulsion-trends-in-lng-carriers.pdf?sfvrsn=16, accessed April 14, 2017.
33. Sales of residual fuel oil by end use, adjusted sales of distillate fuel oil by end use, US Energy Information Administration, https://www.eia.gov/petroleum/data.php#consumption, accessed April 14, 2017.
34. “IMO sets 2020 date for ships to comply with low sulfur fuel oil requirement,” International Maritime Organization, October 10, 2016, http://www.imo.org/en/mediacentre/pressbriefings/pages/mepc-70-2020sulphur.aspx, accessed April 14, 2017.
35. Comparing monthly fuel prices of LNG, heavy fuel oil, and marine gas oil, “Cost and benefits of LNG as a ship fuel for container vessels,” MAN Diesel and Turbo, http://marine.man.eu/docs/librariesprovider6/technical-papers/costs-and-benefits-of-lng.pdf?sfvrsn=16, accessed April 14, 2017.
36. As per 2010 data, as per 2014 Intergovernmental Panel on Climate Change report, “Global greenhouse gas emissions data,” US Environmental Protection Agency, https://www.epa.gov/ghgemissions/global-greenhouse-gas-emissions-data, accessed April 17, 2017.
37. “The US petroleum industry: Statistics, definitions,” National Association for Convenience and Fuel Retailing, http://www.nacsonline.com/YourBusiness/FuelsReports/GasPrices_2013/Pages/Statistics-and-Definitions.aspx, accessed April 14, 2017.
38. CNG and LNG stations as reported by the US Department of Energy’s Alternative Fuels Data Center, http://www.afdc.energy.gov/locator/stations/, accessed April 14, 2017.
39. “Seaports of the world by country,” Export Virginia, http://exportvirginia.org/wp-content/uploads/2014/04/Seaports-of-the-World.pdf, accessed April 14, 2017.
40. Map of LNG bunkering ports, World Ports Climate Initiative, http://www.lngbunkering.org/lng/map/node, accessed April 14, 2017.41. Natural gas consumption by end use, vehicle fuel, US Energy Information Administration, https://www.eia.gov/dnav/ng/ng_cons_sum_dcu_nus_a.htm,
accessed April 14, 2017.42. “Liquefied natural gas exports expected to drive growth in U.S. natural gas trade,” US Energy Information Administration, February 22, 2017, https://
www.eia.gov/todayinenergy/detail.php?id=30052, accessed April 14, 2017.43. Ibid.44. “LNG at the crossroads: Identifying key drivers and questions for an industry in flux,” Deloitte Center for Energy Solutions, March 10, 2016, https://
www2.deloitte.com/content/dam/Deloitte/us/Documents/energy-resources/us-er-og-lng-at-the-crossroads.pdf, accessed April 14, 2017.45. “Building an industry: Can the United States sustainably export LNG at competitive prices?” Deloitte Center for Energy Solutions, August 24, 2016,
https://www2.deloitte.com/content/dam/Deloitte/us/Documents/energy-resources/us-er-lng-update-part-three.pdf, accessed April 14, 2017.46. “US natural gas exports and re-exports by point of exit: Total to Mexico,” US Energy Information Administration, April 28, 2017, https://www.eia.gov/
dnav/ng/ng_move_poe2_dcu_nus-nmx_a.htm, accessed May 9, 2017.47. Natural gas imports and exports, “Annual Energy Outlook 2007,” US Energy Information Administration, https://www.eia.gov/outlooks/aeo/, accessed
May 9, 2017.48. Enno Peters, “Marcellus (PA) – update through October 2016,” Visual US shale oil production, December 29, 2016, https://shaleprofile.com/index.
php/2016/12/29/marcellus-pa-update-through-october-2016/, accessed April 17, 2017.49. Jordan Blum, “ExxonMobil to decide soon on $10 billion Texas petrochemical plant,” Houston Chronicle, FuelFix blog, March 22, 2017, http://fuelfix.com/
blog/2017/03/22/exxon-mobil-to-decide-soon-on-10b-texas-petrochemical-plant/, accessed April 17, 2017.50. Fred Hutchison, “US. LNG export projects—Part 2 (projects near development),” Central Europe Energy Partners, October 26, 2016, http://www.ceep.
be/lng-export-projects-2/, accessed April 17, 2017.51. Including new build, expansion, and reversals projects, “Pending natural gas pipeline projects,” RBN Energy, https://rbnenergy.com/midi/gas-projects,
accessed April 17, 2017.52. Ibid.53. Jamison Cocklin, “Constitution Pipeline suffers another blow with federal court ruling,” Natural Gas Intelligence, March 2017, http://www.naturalgasintel.
com/articles/109820-constitution-pipeline-suffers-another-blow-with-federal-court-ruling, accessed April 17, 2017.54. “Spread between Henry Hub, Marcellus natural gas prices narrow as pipeline capacity grows,” US Energy Information Administration, January 27, 2017,
https://www.eia.gov/todayinenergy/detail.php?id=24712#, accessed April 17, 2017.

Seeking growth | What will drive US natural gas demand?
21
Let's talkJohn EnglandUS Energy & Resources Leader Deloitte [email protected]+1 713 982 2556@JohnWEngland
Key contributors
Andrew SlaughterExecutive Director Deloitte Center for Energy Solutions Deloitte Services LP [email protected] +1 713 982 3526
Thomas Shattuck Lead Analyst, Market Insights Deloitte Services LP
About DeloitteDeloitte refers to one or more of Deloitte Touche Tohmatsu Limited, a UK private company limited by guarantee (“DTTL”), its network of member firms, and their related entities. DTTL and each of its member firms are legally separate and independent entities. DTTL (also referred to as “Deloitte Global”) does not provide services to clients. In the United States, Deloitte refers to one or more of the US member firms of DTTL, their related entities that operate using the “Deloitte” name in the United States and their respective affiliates. Certain services may not be available to attest clients under the rules and regulations of public accounting. Please see www.deloitte.com/about to learn more about our global network of member firms.
Copyright © 2017 Deloitte Development LLC. All rights reserved.
This publication contains general information only and Deloitte is not, by means of this publication, rendering business, financial, investment, legal, tax, or other professional advice or services. This publication is not a substitute for such professional advice or services, nor should it be used as a basis for any decision or action that may affect your business. Before making any decision or taking any action that may affect your business, you should consult a qualified professional adviser. Deloitte shall not be responsible for any loss sustained by any person who relies on this publication.
The Deloitte Center for Energy Solutions (the “Center”) provides a forum for innovation, thought leadership, groundbreaking research, and industry collaboration to help companies solve the most complex energy challenges.
Through the Center, Deloitte’s Energy & Resources group leads the debate on critical topics on the minds of executives—from the impact of legislative and regulatory policy, to operational efficiency, to sustainable and profitable growth. We provide comprehensive solutions through a global network of specialists and thought leaders.
With locations in Houston and Washington, DC, the Center offers interaction through seminars, roundtables, and other forms of engagement, where established and growing companies can come together to learn, discuss, and debate.
www.deloitte.com/us/energysolutions
@Deloitte4Energy