Embed Size (px)
Citation preview
This article was downloaded by: [University of Wisconsin - Madison]On: 12 June 2014, At: 20:25Publisher: Taylor & FrancisInforma Ltd Registered in England and Wales Registered Number: 1072954 Registeredoffice: Mortimer House, 37-41 Mortimer Street, London W1T 3JH, UK
Journal of Transportation Safety &SecurityPublication details, including instructions for authors andsubscription information:http://www.tandfonline.com/loi/utss20
Comprehensive Safety Evaluation ofRoundabouts in WisconsinXiao Qin a , Ghazan Khan b , Andrea Bill b & David A. Noyce ba Department of Civil and Environmental Engineering , South DakotaState University , Brookings, South Dakotab Traffic Operations and Safety Laboratory , University of Wisconsin-Madison , Madison, WisconsinAccepted author version posted online: 14 Oct 2011.Publishedonline: 07 Dec 2011.
To cite this article: Xiao Qin , Ghazan Khan , Andrea Bill & David A. Noyce (2011) ComprehensiveSafety Evaluation of Roundabouts in Wisconsin, Journal of Transportation Safety & Security, 3:4,289-303, DOI: 10.1080/19439962.2011.624290
To link to this article: http://dx.doi.org/10.1080/19439962.2011.624290
PLEASE SCROLL DOWN FOR ARTICLE
Taylor & Francis makes every effort to ensure the accuracy of all the information (the“Content”) contained in the publications on our platform. However, Taylor & Francis,our agents, and our licensors make no representations or warranties whatsoever as tothe accuracy, completeness, or suitability for any purpose of the Content. Any opinionsand views expressed in this publication are the opinions and views of the authors,and are not the views of or endorsed by Taylor & Francis. The accuracy of the Contentshould not be relied upon and should be independently verified with primary sourcesof information. Taylor and Francis shall not be liable for any losses, actions, claims,proceedings, demands, costs, expenses, damages, and other liabilities whatsoever orhowsoever caused arising directly or indirectly in connection with, in relation to or arisingout of the use of the Content.
This article may be used for research, teaching, and private study purposes. Anysubstantial or systematic reproduction, redistribution, reselling, loan, sub-licensing,systematic supply, or distribution in any form to anyone is expressly forbidden. Terms &Conditions of access and use can be found at http://www.tandfonline.com/page/terms-and-conditions
Journal of Transportation Safety & Security, 3:289–303, 2011Copyright © Taylor & Francis Group, LLC and The University of TennesseeISSN: 1943-9962 print / 1943-9970 onlineDOI: 10.1080/19439962.2011.624290
Comprehensive Safety Evaluation of Roundaboutsin Wisconsin
XIAO QIN,1 GHAZAN KHAN,2 ANDREA BILL,2
AND DAVID A. NOYCE2
1Department of Civil and Environmental Engineering, South Dakota StateUniversity, Brookings, South Dakota2Traffic Operations and Safety Laboratory, University of Wisconsin-Madison,Madison, Wisconsin
The modern roundabouts are proliferating rapidly in the United States and Wisconsin isno exception to this trend. The growing number of U.S.-specific research has played animportant role in their acceptance in the United States. However, as new data becomeavailable, there is a need to continue the research to better understand roundaboutsafety in the United States. Moreover, the growing data sets also warrant the creation oflocalized models to better reflect ground conditions. The objectives of this research wereto continue and enhance research efforts on the roundabout safety using current datasets. The aim was to analyze roundabout crash trend and patterns to further evaluatetheir performance under varying situations and develop crash prediction models. Theresults showed interesting observations as far as crash patterns at roundabouts wereconcerned. Even though crash severity was reduced, it is not the same situation forcrash frequencies. Further research is required to assess the safety effectiveness ofroundabouts in Wisconsin. The crash prediction models from this research would help inquantifying roundabout safety, especially when selecting which locations to be convertedto roundabouts.
Keywords roundabout safety, crash prediction model, crash pattern, novelty effect,negative binomial models
1. Background and Problem Statement
1.1. Background
Although modern roundabouts were first designed in the United Kingdom in the 1960s,their prevalence in the United States did not begin until the 1990s (Rodegerdts, Blogg,Wemple, Myers, Kyte, Dixon et al., 2007). Since then the construction of modern round-abouts is proliferating rapidly. There were approximately 2,500 roundabouts operating
Address correspondence to Xiao Qin, PhD, PE, Assistant Professor, Department of Civil andEnvironmental Engineering, South Dakota State University, CEH 148, Box 2219, Brookings, SD,57007. E-mail: [email protected]
289
Dow
nloa
ded
by [
Uni
vers
ity o
f W
isco
nsin
- M
adis
on]
at 2
0:25
12
June
201
4
290 X. Qin et al.
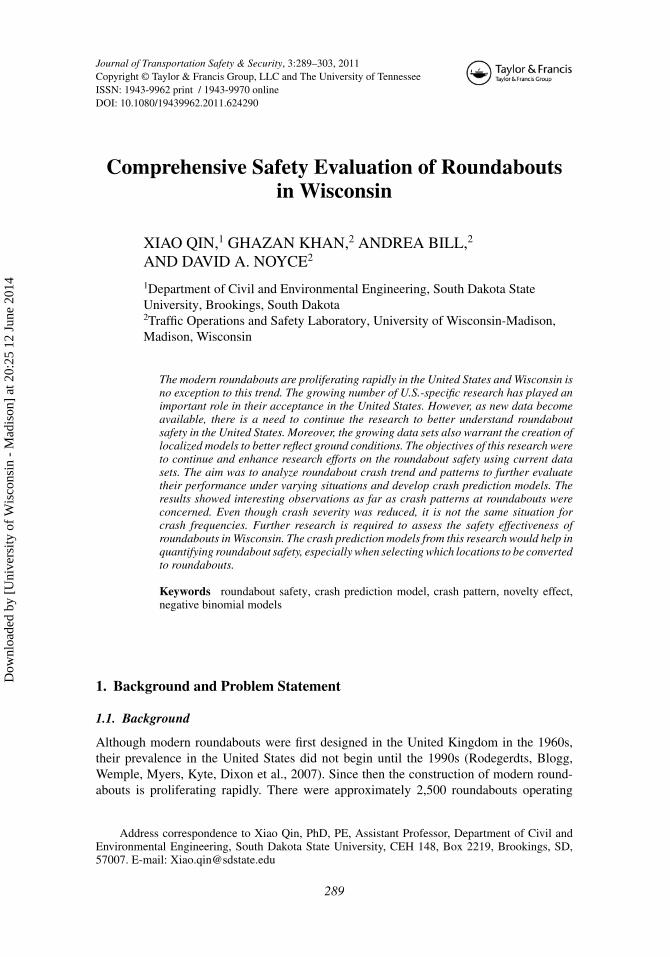
Figure 1. Number of roundabouts constructed in Wisconsin. (Color figure available online).
in the United States according to (Baranowski) whereas by the end of 2010, there willbe approximately 150 roundabouts in Wisconsin alone with another 210 planned, whichindicates how fast the numbers are increasing. The first roundabout in Wisconsin was builtand opened to traffic in 1999. Currently, there are more than 100 roundabouts on the statetrunk and local roads network. Figure 1 provides a breakdown of roundabout numbers inWisconsin and shows how the numbers have increased in the recent years.
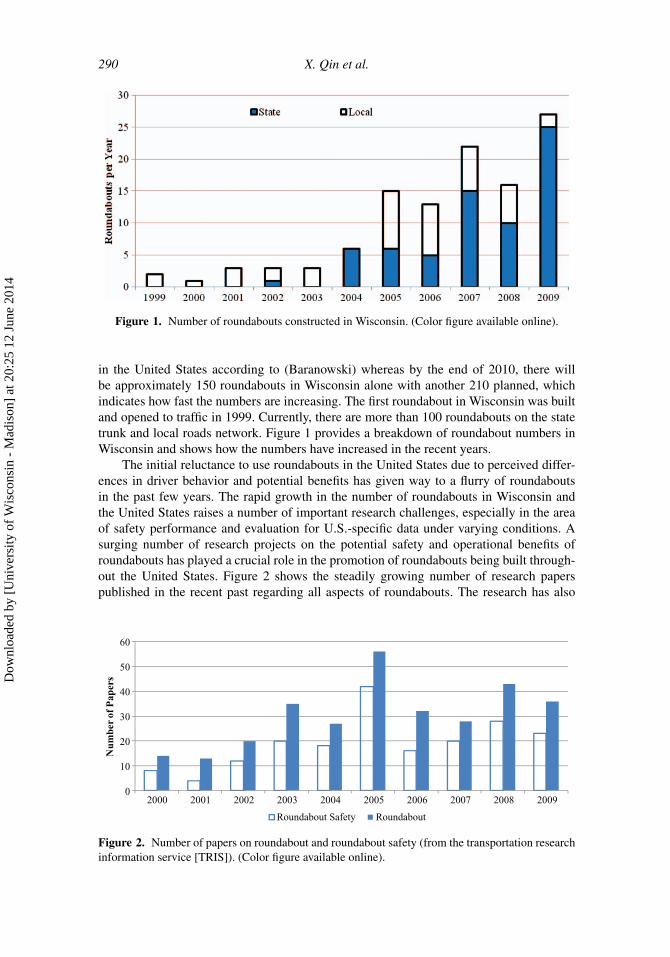
The initial reluctance to use roundabouts in the United States due to perceived differ-ences in driver behavior and potential benefits has given way to a flurry of roundaboutsin the past few years. The rapid growth in the number of roundabouts in Wisconsin andthe United States raises a number of important research challenges, especially in the areaof safety performance and evaluation for U.S.-specific data under varying conditions. Asurging number of research projects on the potential safety and operational benefits ofroundabouts has played a crucial role in the promotion of roundabouts being built through-out the United States. Figure 2 shows the steadily growing number of research paperspublished in the recent past regarding all aspects of roundabouts. The research has also
0
10
20
30
40
50
60
2000 2001 2002 2003 2004 2005 2006 2007 2008 2009
Nu
mb
er o
f Pap
ers
Roundabout Safety Roundabout
Figure 2. Number of papers on roundabout and roundabout safety (from the transportation researchinformation service [TRIS]). (Color figure available online).
Dow
nloa
ded
by [
Uni
vers
ity o
f W
isco
nsin
- M
adis
on]
at 2
0:25
12
June
201
4
Safety Evaluation of Roundabouts in WI 291
been beneficial in displacing some of the initial reluctance to roundabouts due to the lackof U.S.-specific research. However, further research efforts are essential as the increasingnumber of roundabouts provide a larger sample size to conduct more robust analyses.
On the other hand, more localized analyses are also important in developing regionspecific safety performance functions to accurately reflect local conditions and driverbehavior. Such efforts will further enhance the understanding of roundabout safety andoperation in the United States and promote their acceptance not only by practitioners butthe general public as well.
Roundabouts are generally considered to be safer than other forms of traffic controlproviding the good balance between safety and mobility (Johnson & Isebrands, 2009). Anumber of research studies (Rodegerdts, Blogg, Wemple, Myers, Kyte, Dixon et al., 2007)have shown that roundabouts are successful in not only reducing the frequency of crashesbut also the injury severity of those crashes. However, there is a continuing need to studyand evaluate roundabouts as new data become available. There is also a continuing need tostudy the various conditions, factors, and issues associated with building new roundaboutsor converting existing intersections to roundabouts.
1.2. Research Motivation
The aforementioned research challenges provided the motivation for conducting this re-search, especially as Wisconsin has been one of the leading states in accepting and con-structing roundabouts. The idea was to further the understanding of roundabout safetythrough the newly available data set. There was a need to conduct formal evaluation andstudy the performance of roundabouts in Wisconsin given their growing numbers withinthe state. This would establish their true effectiveness and provide better indication of theircrash reduction potential under varying conditions leading to better practices in terms ofsite selection and roundabout geometry.
Another important issue that served as a motivation for this research was the perceptionamong some roundabout engineers as to the diminishing novelty effect of roundabouts insome areas. As drivers become used to roundabouts and their operations, some of the largecrash reductions at roundabout locations seem to diminish over time. This phenomenon iscomplex and has not been established through research as of yet. This research aimed toexplore this issue to gain an understanding of this novelty effect.
There was also the need for analyzing a local data set to generate specific safetymodels, especially as Wisconsin moves toward an implementation of Federal HighwayAdministration’s (FHWA) SafetyAnalyst software (n.d.). SafetyAnalyst is a comprehensivesuite of road safety analysis software that incorporates state-of-the-art statistical methodsto analyze macroscopic and microscopic road safety on a statewide level. One of the mostimportant challenges and operational requirement of SafetyAnalyst implementation is theneed for localized safety models and safety performance functions. Although NHCRPReport 572 (Rodegerdts, Blogg, Wemple, Myers, Kyte, Dixon et al., 2007) provided safetymodels based on nationwide data, ideally states should have their own models to reflectthe intricacies specific to different areas. This provided an additional motivation for thisresearch to be conducted based on statewide data.
1.3. Objectives
In view of the aforementioned research challenges and requirements, the objectives of thisresearch were to
Dow
nloa
ded
by [
Uni
vers
ity o
f W
isco
nsin
- M
adis
on]
at 2
0:25
12
June
201
4
292 X. Qin et al.
1. Design and create a roundabout inventory database to monitor roundabout safetyperformance
2. Analyze patterns of crashes at roundabouts to better understand their performanceunder varying conditions
3. Develop localized safety prediction models for use with SafetyAnalyst and otherlocal level analyses
4. Identify key factors affecting roundabout safety to support the decision of round-about conversion.
2. Literature Review
A literature review of the safety models for roundabouts was conducted as part of thisresearch to gain an understanding of the state of research in this area. Some of the maincontributions towards roundabout safety have come from countries like the United Kingdomand Australia who have had roundabouts as part of their highway systems for many decadesnow. In the 1980s the Transportation Research group at the University of Southampton,UK, conducted a study on more than 80 four-arm roundabouts to establish safety modelsconsidering traffic volume and roundabout geometry (Maycock & Hall, 1984). The studyused generalized linear models to calculate crash frequency and severity models. Relation-ships were also established between the various geometric features of roundabouts andtheir effects on crash occurrences.
Similar studies were conducted in Australia by Arndt for single-vehicles crashesat roundabouts. The first research developed linear regression models for single-vehiclecrashes at roundabouts using traffic volume, speed, and geometric data as dependent vari-ables (Arndt, 1994). A follow-up study used more sophisticated nonlinear Poisson-basedregression models that were found to be more accurate in establishing crash frequencymodels for roundabouts (Arndt, 1994). However, as mentioned before, these studies us-ing data from outside of the United States make their applicability to U.S. conditionsquestionable.
A review of before-and-after studies was also conducted as part of the literaturereview to gain knowledge of the state-of-practice in this area. Although there were sev-eral examples of non-U.S. research in this area, the emphasis was on U.S.-based studiesfor aforementioned reasons. A study conducted in seven U.S. states—Colorado, Florida,Kansas, Maine, Maryland, South Carolina, and Vermont—where a total of 23 intersec-tions were converted to roundabouts, used state-of-the-art empirical Bayes analysis toconduct before-and-after studies (Persaud, Retting, Garder, & Lord, 2001). The resultsrevealed a 40% reduction in all crash severities and an overall reduction of 90% in injurycrashes.
The most definitive guide on roundabout safety in the US has been the National Co-operative Highway Research Program (NCHRP) Report 572: Roundabouts in the UnitedStates (NCHRP 572). This research conducted an extensive review of the safety and opera-tional aspects of roundabouts in the United States based on available nationwide data. Theresults recommended crash prediction models and other relationships between roundaboutcharacteristics and their crash potential. Even though the results of this research providethe most comprehensive review of roundabouts in the United States, the use of modelsbased on nationwide data are not the optimum solution for individual states and local areas.Hence there is a need for more localized models based on newly available data, which wasthe fundamental basis for this research.
Dow
nloa
ded
by [
Uni
vers
ity o
f W
isco
nsin
- M
adis
on]
at 2
0:25
12
June
201
4
Safety Evaluation of Roundabouts in WI 293
3. Data Collection and Processing
In light of the need for continuing research and understanding of roundabouts and the needfor local-level analysis, an extensive data collection effort was conducted in Wisconsin.Roundabout construction in Wisconsin has experienced significant growth especially inthe last 3 to 5 years. As of October 2009, 68 roundabouts had been constructed on statehighways and 43 on local roads. Additionally, 165 roundabouts are planned for constructionon state highways and many more on local roads, distributed all over the state. The designand operations of roundabouts in Wisconsin differ from each other to accommodate varyingtraffic demand, resulting in distinct safety performances. Hence, there was a need to selecta sample of representative roundabouts with a statistically valid crash history. Under theguidance of the Wisconsin Department of Transportation (WisDOT), the research teamselected a total of 41 roundabouts representing various configurations, layouts, designfeatures, previous traffic control, and traffic volumes. During the site selection process,attention was paid to maintain a good balance between single- and multilane roundabouts;with regards to geographic distribution in the state and previous traffic control of theintersections before conversion to a roundabout. The characteristics of the 41 roundaboutsare listed in Table 1.
3.1. Geometric Data
A significant amount of effort went into the data collection process that not only providedsafety and operational information, but also helped establish a comprehensive Wisconsinroundabout site inventory that would facilitate long-term performance monitoring.
Table 1Characteristics of modern roundabouts in the scope of the study
Characteristics Number Percentage
Number of legs3 7 17.074 33 80.495 1 2.44
Number of circulating lanes1 18 43.902 23 56.10
Previous intersection traffic controlNo control 5 12.19Two-way stop 23 56.1All-way stop 5 12.20Signal 8 19.51Geographic location
NC 2 4.88NE 18 43.90NW 6 14.63SE 9 21.95SW 6 14.63
NC = North Central; NE = Northeast; NW = Northwest; SE = Southeast; SW = Southwest.
Dow
nloa
ded
by [
Uni
vers
ity o
f W
isco
nsin
- M
adis
on]
at 2
0:25
12
June
201
4

294 X. Qin et al.
Important data elements were identified for creating the site inventory, including geometricparameters, traffic volume, and crash data. The data collection was particularly challengingbecause roundabout data were stored at different places and maintained by different agenciesbased on jurisdiction. WisDOT maintained some (design) documents for the selected round-abouts that were used to extract detailed geometric data from the construction plans. Forother locations, construction plans were requested from either the consulting firms that haddesigned the roundabouts or the municipal engineers overseeing the projects. Some designvariables were the same for all the roundabouts such as the inscribed circle diameter (ICD)and the center island diameter (CID). Others parameters varied by approach.
Realizing that the design of each approach may be different, roundabouts were dividedinto three, four, or five quadrants, depending upon the number of approaches. Quadrantswere numbered in accordance with the cardinal directions. For each quadrant, the entryangle, entry width, flare length, turning radius, ICD, CID, number of circulatory lanes,number of entering lanes, and the number of exiting lanes were measured. Moreover, thetraffic control type before the roundabout conversion was also collected by contactingregional or city traffic engineers who had knowledge of the intersection traffic controls.
3.2. Traffic Volume Data
The total average annual daily traffic (AADT) at a roundabout was defined as the sum ofAADT on each approach entering the roundabout. Traffic volume information was mainlycollected from the Wisconsin Highway Traffic Volume Data published by WisDOT everyyear. For the roundabouts with missing AADT, individual traffic counts were conducted tofill the gaps.
In general, it was observed that in the data set, the three-legged roundabouts carriedless traffic than the four-legged ones, but not for all. The three-legged roundabouts hadan AADT range of 5,850 to 23,300 vehicles per day (vpd) with an average of 14,200 vpdwhereas the four-legged ones had a range of 4,100 to 48,100 vpd with an average of 17,565vpd.
Similarly, single-lane roundabouts had lower traffic volume than multilane ones. Inthe sample, the AADT for the single-lane roundabouts ranged from 6,000 to 21,900 vpdwith an average of 12,595 vpd. For the multilane roundabouts, AADT ranged from 4,100to 48,100 vpd with an average of 20,170 vpd.
Although the traffic demand seems to be a critical factor in deciding the number oflegs and lanes, it is not the only one. The roundabout layout is also affected by the lane use,available right of way, and so on. The area setting is determined following the descriptionin the WisDOT Facilities Development Manual (FDM; 2010) such as the curb and gutterpresence for urban areas, etc.
3.3. Crash Data
Crash data for the sample of roundabouts studied in this research were collected fromthe Wisconsin Crash Database. A substantial effort was required to ascertain that crashesoccurring at roundabouts were related to the roundabouts, not some other unrelated factorssuch as deer-related, driveway crashes in the proximity, and so on. Crash data were initiallyretrieved based on their location description and then followed by a detailed review ofthe narratives and diagrams in the police report forms, the Wisconsin crash report forms(MV4000). One of the most challenging tasks was to distinguish crashes occurring betweentwo interchange ramp roundabouts.
Dow
nloa
ded
by [
Uni
vers
ity o
f W
isco
nsin
- M
adis
on]
at 2
0:25
12
June
201
4
Safety Evaluation of Roundabouts in WI 295
Table 2Summary of detailed data used for safety analysis
Variables Minimum Maximum M SD
Central island diameter (ft) 29 90 49.62 11.06Inscribed circle diameter (ft) 90 280 146.32 31.99All roundabouts AADT 4,103 39,000 15,416 7,867Three-legged roundabout
AADT5,850 23,300 14,200 6,831
Four-legged roundaboutAADT
4,100 48,100 17,565 8,311
Before period totalcrashes/year (5-year period)
0 21 4.25 4.09
After period total crashes/year(varying periods)
0.5 27.5 4.73 5.82
AADT = Average Annual Daily Traffic.
Crash data were collected for before-and-after periods of a roundabout construction.In the sample data set, the before period started from 1994 to the year of construction,and the after period was between the construction year and December 31, 2009. Crashesoccurring during the construction year were excluded from the study to minimize the effectsof construction activities, driver unfamiliarity with the conditions, and other complicationssuch as the partially open to traffic during the construction. All 41 roundabouts had asufficient before period with at least 5 years of crash history; however, the duration of theafter period varied for each one which is described below:
• 11 roundabouts with 1-year after period crash data• 13 roundabouts with 2-year after period crash data• 5 roundabouts with 3-year after period crash data• 5 roundabouts with 4-year after period crash data• 6 roundabouts with 5-year after period crash data• 1 roundabout with 7-year after period crash data.
Crash location is defined not only by the address but also by the police definition as“intersection related,” that is, a crash is caused by the activity related to the operationsof the intersection. Not limited to the intersection junction or circulatory area, the datacollection allows crash occurring on roundabout approaches due to speeding or suddenstop or slowing down to be collected. A detailed manual review of the Wisconsin crashreport forms (MV4000) was also conducted for all queried crash data using the narrativesand diagrams sections to decide whether or not crashes were truly roundabout crashes orrelated to roundabout operations. An overall summary of detailed roundabout data in thesample is provided in Table 2.
4. Roundabout Crash Trend and Patterns
The first step in roundabout safety analysis was to study the temporal patterns of crashesin the before-and-after periods of a roundabout. The idea was to gain an understandingof the number and nature of crashes occurring before and after the roundabouts had been
Dow
nloa
ded
by [
Uni
vers
ity o
f W
isco
nsin
- M
adis
on]
at 2
0:25
12
June
201
4

296 X. Qin et al.
constructed. Crash data for each roundabout location were reviewed for the before-and-after periods excluding the construction year. A close examination of the data showed thatcrash trends varied among the studied roundabout locations. Some roundabout locationsshowed an increase in crashes in the after period (after conversion of the intersection toa roundabout); some roundabout locations showed a decrease in the number of crashesin the after period; and at some roundabout locations, the number of crashes remainedthe same with no increase or decrease. This was quite surprising given that previousstudies have shown that almost all roundabout locations display at least some kind of crashreduction.
To effectively validate the inconsistent temporal crash patterns, eight of the roundaboutswere removed from the pattern analysis due to no prior crash history (new constructions orroadway realignment) or extremely low number of crashes before the roundabout construc-tion. The remaining 33 roundabout locations were then grouped by crash temporal trendsinto three distinct categories:
• Increase (showing increase in crashes after roundabout construction), 13 roundabouts• Decrease (showing decrease in crashes after roundabout construction), 12 round-
abouts• Oscillation (showing neither clear increasing or decreasing trends), 8 roundabouts.
The crashes per year at each of the roundabout locations in the resulting three categorieswere then plotted to show the trends as illustrated in Figure 3. A simple linear regressionmodel was fitted to each data set to quantify the trend and variation. High R2 valuesfor “increase” and “decrease” groups indicated a very strong temporal effect of increaseor decrease in the number of crashes per year. For the oscillation group, very low R2
suggested that the crash count fluctuates around the average, irrespective to the change overtime.
y = 1.4657x + 1.8089R² = 0.8998
y = -0.0943x + 3.1133R² = 0.0626
y = -0.7861x + 7.7276R² = 0.8021
0.0
2.0
4.0
6.0
8.0
10.0
12.0
14.0
-3 -2 -1 0 1 2
Cra
shes
/Yea
r
Year Before and After Roundabout Construction
Increase
Oscillation
Decrease
Figure 3. Three temporal trends of roundabout crashes. (Color figure available online).
Dow
nloa
ded
by [
Uni
vers
ity o
f W
isco
nsin
- M
adis
on]
at 2
0:25
12
June
201
4
Safety Evaluation of Roundabouts in WI 297
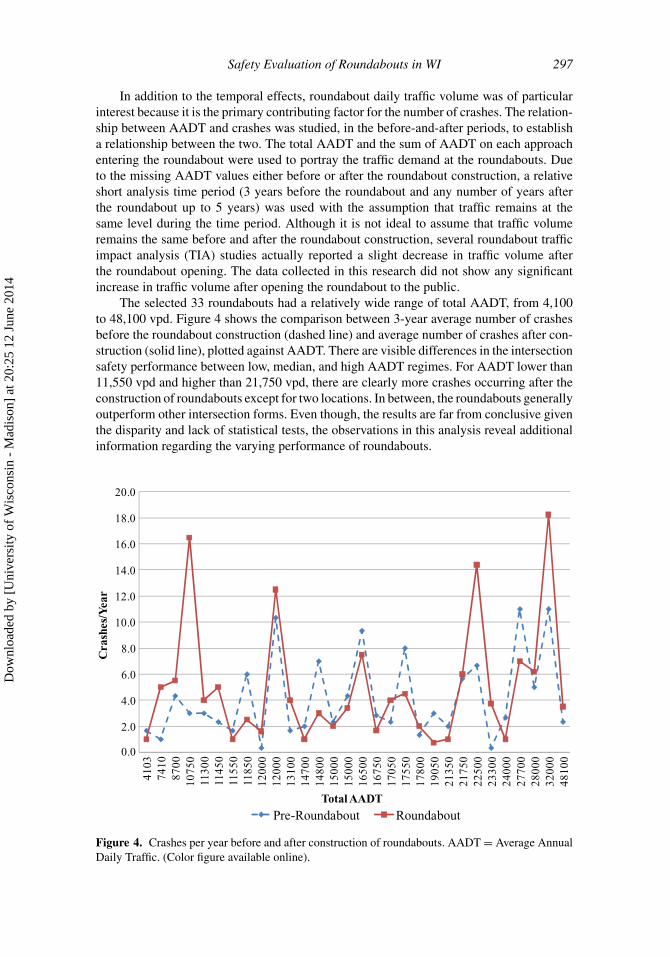
In addition to the temporal effects, roundabout daily traffic volume was of particularinterest because it is the primary contributing factor for the number of crashes. The relation-ship between AADT and crashes was studied, in the before-and-after periods, to establisha relationship between the two. The total AADT and the sum of AADT on each approachentering the roundabout were used to portray the traffic demand at the roundabouts. Dueto the missing AADT values either before or after the roundabout construction, a relativeshort analysis time period (3 years before the roundabout and any number of years afterthe roundabout up to 5 years) was used with the assumption that traffic remains at thesame level during the time period. Although it is not ideal to assume that traffic volumeremains the same before and after the roundabout construction, several roundabout trafficimpact analysis (TIA) studies actually reported a slight decrease in traffic volume afterthe roundabout opening. The data collected in this research did not show any significantincrease in traffic volume after opening the roundabout to the public.
The selected 33 roundabouts had a relatively wide range of total AADT, from 4,100to 48,100 vpd. Figure 4 shows the comparison between 3-year average number of crashesbefore the roundabout construction (dashed line) and average number of crashes after con-struction (solid line), plotted against AADT. There are visible differences in the intersectionsafety performance between low, median, and high AADT regimes. For AADT lower than11,550 vpd and higher than 21,750 vpd, there are clearly more crashes occurring after theconstruction of roundabouts except for two locations. In between, the roundabouts generallyoutperform other intersection forms. Even though, the results are far from conclusive giventhe disparity and lack of statistical tests, the observations in this analysis reveal additionalinformation regarding the varying performance of roundabouts.
0.0
2.0
4.0
6.0
8.0
10.0
12.0
14.0
16.0
18.0
20.0
4103
7410
8700
1075
011
300
1145
011
550
1185
012
000
1200
013
100
1470
014
800
1500
015
000
1650
016
750
1705
017
550
1780
019
050
2135
021
750
2250
023
300
2400
027
700
2800
032
000
4810
0
Cra
shes
/Yea
r
Total AADT
Pre-Roundabout Roundabout
Figure 4. Crashes per year before and after construction of roundabouts. AADT = Average AnnualDaily Traffic. (Color figure available online).
Dow
nloa
ded
by [
Uni
vers
ity o
f W
isco
nsin
- M
adis
on]
at 2
0:25
12
June
201
4
298 X. Qin et al.
0.0
1.0
2.0
3.0
4.0
5.0
6.0
4103
7410
8700
1075
0
1130
0
1145
0
1155
0
1185
0
1200
0
1200
0
1310
0
1470
0
1480
0
1500
0
1500
0
1650
0
1675
0
1705
0
1755
0
1780
0
1905
0
2135
0
2175
0
2250
0
2330
0
2400
0
2770
0
2800
0
3200
0
4810
0
Inju
ry/F
atal
Cra
shes
/Yea
r
Total AADTPre-Roundabout Roundabout
Figure 5. Injury crashes per year before and after construction of roundabouts. AADT = AverageAnnual Daily Traffic. (Color figure available online).
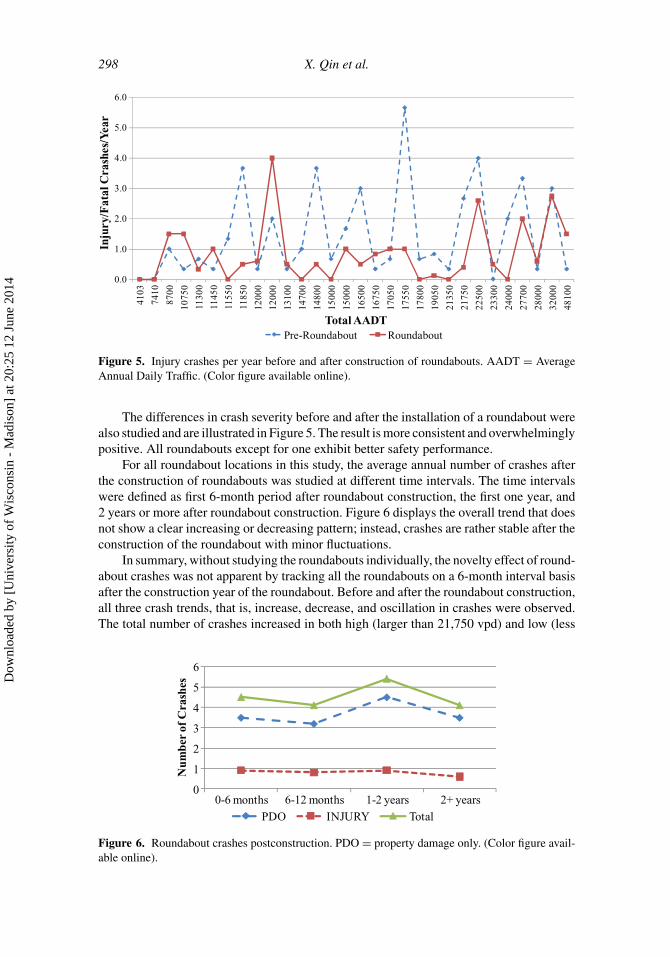
The differences in crash severity before and after the installation of a roundabout werealso studied and are illustrated in Figure 5. The result is more consistent and overwhelminglypositive. All roundabouts except for one exhibit better safety performance.
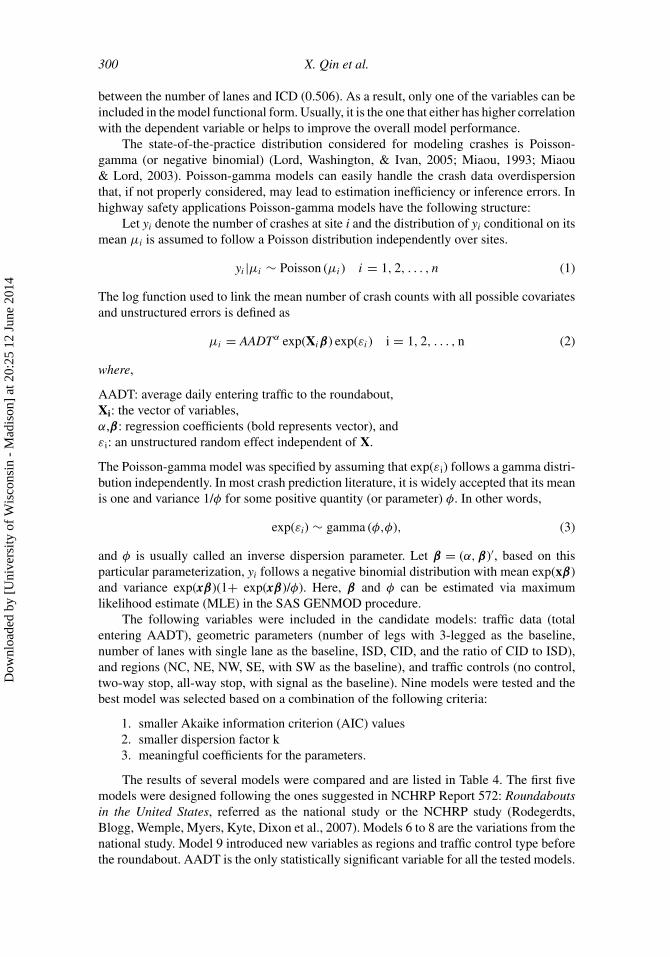
For all roundabout locations in this study, the average annual number of crashes afterthe construction of roundabouts was studied at different time intervals. The time intervalswere defined as first 6-month period after roundabout construction, the first one year, and2 years or more after roundabout construction. Figure 6 displays the overall trend that doesnot show a clear increasing or decreasing pattern; instead, crashes are rather stable after theconstruction of the roundabout with minor fluctuations.
In summary, without studying the roundabouts individually, the novelty effect of round-about crashes was not apparent by tracking all the roundabouts on a 6-month interval basisafter the construction year of the roundabout. Before and after the roundabout construction,all three crash trends, that is, increase, decrease, and oscillation in crashes were observed.The total number of crashes increased in both high (larger than 21,750 vpd) and low (less
0
1
2
3
4
5
6
0-6 months 6-12 months 1-2 years 2+ years
Nu
mb
er o
f C
rash
es
PDO INJURY Total
Figure 6. Roundabout crashes postconstruction. PDO = property damage only. (Color figure avail-able online).
Dow
nloa
ded
by [
Uni
vers
ity o
f W
isco
nsin
- M
adis
on]
at 2
0:25
12
June
201
4

Safety Evaluation of Roundabouts in WI 299
than 11,550 vpd) AADT regimes, but crash severities were drastically reduced in almostall AADT regimes.
5. Intersection-Level Crash Prediction Models
To further enhance the research on roundabout safety, the objective of this research wasto calculate an intersection-level crash prediction model for roundabouts. The aim was tocreate a model based on the latest available data that is more localized to better reflect theconditions in Wisconsin. The model development will be leveraged with other modelingeffort made at the national level. The comparison is expected to shed light on appropriatemodel functional from and transferability.
The objective in the modeling process was to use the most basic variables available toengineers in the project planning stage. Safety evaluations may be based on the expectednumber of crashes among candidate forms of intersections and intersection traffic controlstrategies. Given the data requirements in the planning stage, the variables chosen fordeveloping the model may be AADT, existing traffic control, the number of legs, thenumber of lanes, etc. A regional effect was also considered because in Wisconsin, Southeast(SE) and Northeast (NE) regions built roundabouts many years ago and now have moreroundabouts than any other regions combined. It is anticipated that the drivers in the tworegions must have more driving experience with roundabouts.
Many design features of a roundabout are affected and driven by the traffic demand,that is, AADT, resulting in correlated parameters. For example, ICD is the sum of CIDand the width of all circulatory lanes (circulatory lane width times the number of lanes).Including correlated variables in the model may lead to instable and inefficient estimates forthe coefficients. Also, it will be difficult to explain individual effects of variables if they aredependent. To identify correlated variables, a Pearson-correlation test was performed for allthe variables considered in the models. In Table 3, Pearson-correlation coefficients clearlyshow the extremely high correlation (0.931) between CID and ICD and high correlation
Table 3Pearson-correlation coefficientsa of model variables
AADT Leg Lane CID ICD
AADT 1.000 0.105 0.407 0.348 0.442(0.514) (0.008) (0.038) (0.007)
Leg 0.105 1.000 –0.140 −0.053 –0.036(0.514) (0.382) (0.757) (0.834)
Lane 0.407 –0.140 1.000 0.344 0.506(0.008) (0.382) (0.040) (0.002)
CID 0.348 –0.053 0.344 1.000 0.931(0.038) (0.757) (0.040) (<.0001)
ICD 0.442 –0.036 0.506 0.931 1.000(0.007) (0.834) (0.002) (<.0001)
AADT = Average Annual Daily Traffic; CID = central island diameter; ICD = inscribed circlediameter.
aThe lower value in each cell is the p value.
Dow
nloa
ded
by [
Uni
vers
ity o
f W
isco
nsin
- M
adis
on]
at 2
0:25
12
June
201
4
300 X. Qin et al.
between the number of lanes and ICD (0.506). As a result, only one of the variables can beincluded in the model functional form. Usually, it is the one that either has higher correlationwith the dependent variable or helps to improve the overall model performance.
The state-of-the-practice distribution considered for modeling crashes is Poisson-gamma (or negative binomial) (Lord, Washington, & Ivan, 2005; Miaou, 1993; Miaou& Lord, 2003). Poisson-gamma models can easily handle the crash data overdispersionthat, if not properly considered, may lead to estimation inefficiency or inference errors. Inhighway safety applications Poisson-gamma models have the following structure:
Let yi denote the number of crashes at site i and the distribution of yi conditional on itsmean µi is assumed to follow a Poisson distribution independently over sites.
yi |µi ∼ Poisson (µi) i = 1, 2, . . . , n (1)
The log function used to link the mean number of crash counts with all possible covariatesand unstructured errors is defined as
µi = AADTα exp(Xiβ) exp(εi) i = 1, 2, . . . , n (2)
where,
AADT: average daily entering traffic to the roundabout,Xi: the vector of variables,α,β: regression coefficients (bold represents vector), andεi: an unstructured random effect independent of X.
The Poisson-gamma model was specified by assuming that exp(εi) follows a gamma distri-bution independently. In most crash prediction literature, it is widely accepted that its meanis one and variance 1/φ for some positive quantity (or parameter) φ. In other words,
exp(εi) ∼ gamma (φ,φ), (3)
and φ is usually called an inverse dispersion parameter. Let β = (α,β)′, based on thisparticular parameterization, yi follows a negative binomial distribution with mean exp(xβ)and variance exp(xβ)(1+ exp(xβ)/φ). Here, β and φ can be estimated via maximumlikelihood estimate (MLE) in the SAS GENMOD procedure.
The following variables were included in the candidate models: traffic data (totalentering AADT), geometric parameters (number of legs with 3-legged as the baseline,number of lanes with single lane as the baseline, ISD, CID, and the ratio of CID to ISD),and regions (NC, NE, NW, SE, with SW as the baseline), and traffic controls (no control,two-way stop, all-way stop, with signal as the baseline). Nine models were tested and thebest model was selected based on a combination of the following criteria:
1. smaller Akaike information criterion (AIC) values2. smaller dispersion factor k3. meaningful coefficients for the parameters.
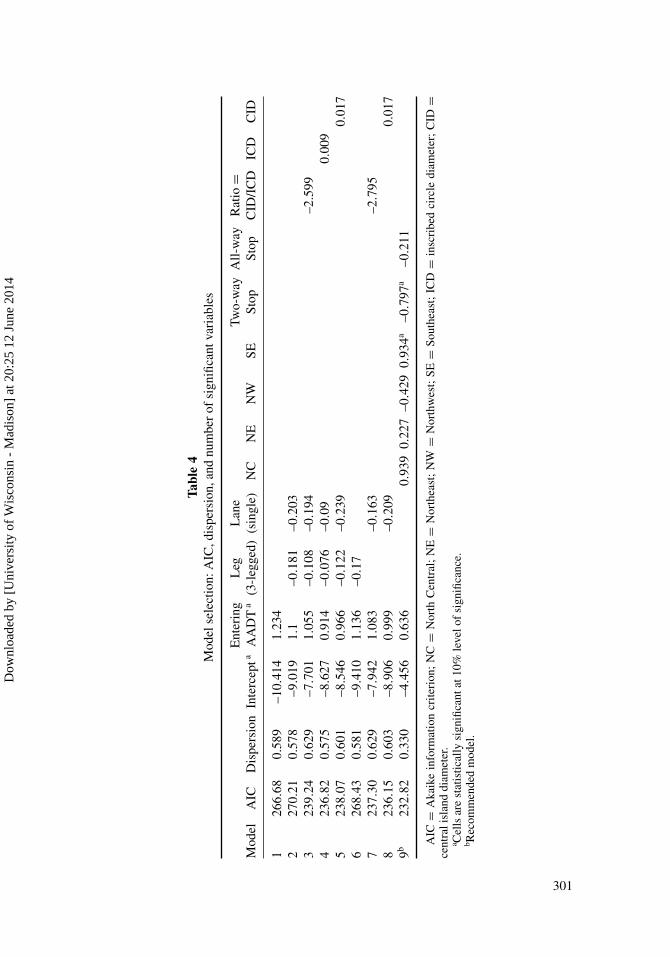
The results of several models were compared and are listed in Table 4. The first fivemodels were designed following the ones suggested in NCHRP Report 572: Roundaboutsin the United States, referred as the national study or the NCHRP study (Rodegerdts,Blogg, Wemple, Myers, Kyte, Dixon et al., 2007). Models 6 to 8 are the variations from thenational study. Model 9 introduced new variables as regions and traffic control type beforethe roundabout. AADT is the only statistically significant variable for all the tested models.
Dow
nloa
ded
by [
Uni
vers
ity o
f W
isco
nsin
- M
adis
on]
at 2
0:25
12
June
201
4
Tabl
e4
Mod
else
lect
ion:
AIC
,dis
pers
ion,
and
num
ber
ofsi
gnifi
cant
vari
able
s
Ent
erin
gL
egL
ane
Two-
way
All-
way
Rat
io=
Mod
elA
ICD
ispe
rsio
nIn
terc
epta
AA
DT
a(3
-leg
ged)
(sin
gle)
NC
NE
NW
SESt
opSt
opC
ID/I
CD
ICD
CID
126
6.68
0.58
9–1
0.41
41.
234
227
0.21
0.57
8–9
.019
1.1
–0.1
81–0
.203
323
9.24
0.62
9–7
.701
1.05
5–0
.108
–0.1
94–2
.599
423
6.82
0.57
5–8
.627
0.91
4–0
.076
–0.0
90.
009
523
8.07
0.60
1–8
.546
0.96
6–0
.122
–0.2
390.
017
626
8.43
0.58
1–9
.410
1.13
6–0
.17
723
7.30
0.62
9–7
.942
1.08
3–0
.163
–2.7
958
236.
150.
603
–8.9
060.
999
–0.2
090.
017
9b23
2.82
0.33
0–4
.456
0.63
60.
939
0.22
7–0
.429
0.93
4a–0
.797
a–0
.211
AIC
=A
kaik
ein
form
atio
ncr
iteri
on;
NC
=N
orth
Cen
tral
;N
E=
Nor
thea
st;
NW
=N
orth
wes
t;SE
=So
uthe
ast;
ICD
=in
scri
bed
circ
ledi
amet
er;
CID
=ce
ntra
lisl
and
diam
eter
.a C
ells
are
stat
istic
ally
sign
ifica
ntat
10%
leve
lof
sign
ifica
nce.
b Rec
omm
ende
dm
odel
.
301
Dow
nloa
ded
by [
Uni
vers
ity o
f W
isco
nsin
- M
adis
on]
at 2
0:25
12
June
201
4
302 X. Qin et al.
The coefficient for AADT is close to one in all models except for Model 9, indicating a nearlinear relationship between the crash count and AADT. On the other hand, the coefficientestimates for AADT in the national study range from 0.5 to 0.7. The value dispersionparameter k is smaller as compared to the NCHRP study, suggesting a more homogeneousdataset because the NCHRP study used roundabouts from different states.
Although most signs for the estimated coefficients of the variables are consistentwith the national study, they are not statistically significant in this study at 10% level ofsignificance. Interestingly, both newly introduced variables (region and previous trafficcontrol) in Model 9 were statistically significant. NW region seemed to have the lowestnumber of roundabout crashes, followed by SW, NE, SE, and NC. Compared with signalizedintersections, converting from two-way stop or all-way stop seemed to reduce more crasheswith two-way stop showing larger safety benefits. No control was eventually excludedfrom both models to avoid the bias because these roundabout locations are either newintersections or realignment projects. Model 9 outperformed others with the smallest AICvalue, smallest dispersion parameter k while having more meaningful and statisticallysignificant variables at a level of at least 10%.
6. Conclusions and Recommendation
As Wisconsin and the United States move ahead with building greater numbers of round-abouts, there is a need to continually study their safety impacts as newer data are available.With these goals in mind, this research found some interesting results based on Wisconsin’sdata. Crash pattern analysis at 41 different roundabout locations provided inconclusive re-sults as far as reducing crash frequency was concerned. However, there was no doubt aboutthe reduction in crash severity at roundabout locations. Crash severity was reduced in allcrashes for all crash types. Further research and more data are required to better understandthe safety effectiveness of roundabouts in Wisconsin. Furthermore, there is also the needto study the individual roundabout locations to thoroughly evaluate the safety performanceat those locations.
One of the interesting findings of this research was the study of the novelty effectof roundabouts as perceived by some safety engineers. This research shows that withoutstudying the roundabouts individually, the novelty effect of roundabout crashes was notapparent by tracking all the roundabouts on a 6-month interval basis after the constructionyear of the roundabout.
The crash prediction models from this research may play an important role in thesuccessful implementation and expansion of SafetyAnalyst. SafetyAnalyst software is idealwhen used with state-specific safety performance functions. As the number of roundaboutsgrows, the need for more localized and roundabout specific crash prediction models willbecome more critical. However, due to the limited number of sites, the crash predictionmodels developed in this study should be used with caution. Moreover, the models werestrictly developed with the crash data and roundabouts in Wisconsin. A calibration withlocal crash data is recommended before being implemented anywhere else. Nevertheless theresults of this research will provide the first steps in better safety evaluations in Wisconsin.Again, future research in this area is also essential as new data are available to create moreaccurate models. The issues studied in this research are crucial to better understandingroundabout safety, especially when selecting which locations to convert to roundabouts.The results of this research may provide additional information for other states in evaluatingroundabout safety.
Dow
nloa
ded
by [
Uni
vers
ity o
f W
isco
nsin
- M
adis
on]
at 2
0:25
12
June
201
4

Safety Evaluation of Roundabouts in WI 303
Acknowledgment
The authors gratefully acknowledge the support of the Wisconsin Department of Trans-portation under the supervision of Rebecca Szymkowski for this study. Dr. Madhav Chitturi,Dongxi Zheng, and Josh Wolfe from the University of Wisconsin Traffic Operations andSafety Laboratory are also recognized for their help with data collection.
References
Arndt, O. K. (1994). Relationship between roundabout geometry and accident rates (Unpublishedmaster’s thesis). Queensland University of Technology, Brisbane, Queensland, Australia.
Baranowski, B. (2011). Welcome to Roundabouts USA. Retrieved from http://www.roundaboutsusa.com.
Johnson, M. T., & Isebrands, H. N. (2009). Access management considerations for high capacity multi-lane roundabout design and implementation. Retrieved from http://www.accessmanagement.info/AM08/AM0804Johnson/AM0804Johnson.pdf.
Maycock, G., & Hall, R. D. (1984). Accidents at 4-arm roundabouts (Report LR 1120). Crowthorne,Berkshire, UK: Transport and Road Research Laboratory.
Miaou, S. (1993). The relationship between truck accidents and geometric design of road sections:Poisson versus negative binomial regressions. Accident Analysis and Prevention, 26(4), 471–482.
Miaou, S.-P., & Lord, D. (2003). Modeling traffic crash-flow relationships for intersections: Dispersionparameter, functional form, and Bayes versus empirical Bayes methods. Transportation ResearchRecord, 1840, 31–40.
Lord, D., Washington, S., & Ivan, J. (2005). Poisson-gamma and zero-inflated regression models ofmotor vehicle crashes: Balancing statistical fit and theory. Accident Analysis and Prevention,37, 35–46.
Rodegerdts, L., Blogg, M., Wemple, E., Myers, E., Kyte, M., Dixon, M., List, G., Flannery, A.,Troutbeck, R., Brilon, W., Wu, N., Persaud, B., Lyon, C., Harkey, D., & Carter, D. (2007).Roundabouts in the United States. National Cooperative Highway Research Program (NCHRP)Report 572: Washington, DC: Transportation Research Board.
Persaud, B. N., Retting, R. A., Garder, P. E., & Lord, D. (2001). Observational before-after study of thesafety effect of U.S. roundabout conversions using the empirical Bayes method. TransportationResearch Record, 1751, 1–8.
SafetyAnalyst (Federal Highway Administration SafetyAnalyst software). (n.d.) Retrieved fromhttp://www.safetyanalyst.org/.
Wisconsin Department of Transportation. (2010). Facilities Development Manual (FDM). Retrievedfrom http://roadwaystandards.dot.wi.gov/standards/fdm/.
Dow
nloa
ded
by [
Uni
vers
ity o
f W
isco
nsin
- M
adis
on]
at 2
0:25
12
June
201
4