Embed Size (px)
Citation preview
Journal of Air Transportation
VOLUME 10, NUMBER 2 – 2005
ISSN: 1544-6980
Library of Congress Catalog Number HE9761.1 J68
Journal of Air Transportation Volume 10, Number 2 – 2005 Brent D. Bowen, Editor ©2005, Aviation Institute, University of Nebraska at Omaha Published by:
Aviation Institute University of Nebraska at Omaha 6001 Dodge Street Omaha, Nebraska 68182-0508 USA Phone: (402) 554-3424 Fax: (402) 554-3781 E-mail: [email protected] World Wide Web: http://jat.unomaha.edu
Printed by: University of Nebraska Medical Center Printing Services Published as a not-for-profit service of the Aviation Institute. Funded in part by a grant from the NASA Space Grant College and Fellowship Program. The University of Nebraska is an Affirmative Action/Equal Opportunity institution.
© 2005, Aviation Institute, University of Nebraska at Omaha
About the Journal of Air Transportation The mission of the Journal of Air Transportation (JAT) is to provide the
global community immediate key resource information in all areas of air transportation. The goal of the Journal is to be recognized as the preeminent scholarly journal in the aeronautical aspects of transportation. As an international and interdisciplinary journal, the JAT will provide a forum for peer-reviewed articles in all areas of aviation and space transportation research, policy, theory, case study, practice, and issues. While maintaining a broad scope, a focal point of the journal will be in the area of aviation administration and policy.
Development: The JAT was conceptualized to fulfill an international void of scholarly
publications in this area as identified by the primary organizers. It is envisioned that aviation leaders will utilize the JAT as a key decision-making tool. Scholarly rigor and standards will be uncompromised with regular evaluation by the Editorial Board and Panel of Reviewers.
Scope: The JAT accepts manuscripts on all topics that relate to air
transportation, both technical and non-technical. The Panel of Reviewers represents the interdisciplinary nature of air transportation to ensure review by recognized experts. Broad categories of appropriate topics include, but are not limited to: Aviation Administration: Management, Economics, Policy, Fixed Based Operations, Employment & Internships, Marketing; Airport Planning, Design & Development: Capacity & Delay, Small Aircraft Transportation Systems (SATA), Air Transportation Systems—Domestic & International; Aviation Law: Air Traffic Control, Regulation Process, Privatization; Airlines & Cargo: Logistics, Transport Operations, Air Carrier Training, Low Cost Airlines, Intermodal Transportation; Education & Training: Aviation Education, Cognitive Factors & Learning Styles, Instructional Techniques, Distance Learning, Aviation/Aerospace Psychology & Safety, Human Factors & Crew Resource Management; Technology: Engineering, Aerospace Structures, Propulsion & Performance, Avionics, Geographic Information Systems, Simulation, Electronic Signal Processing, Electronic Markets & Internet, Meteorology & Weather Services; Future Advancements: Space Transportation & Flight, General Aviation, Forecasting.
Dissemination: The JAT is catalogued at key research libraries world wide, including
the U.S. Library of Congress. It is also indexed in Aviation Tradescan, EBSCO Online, ProQuest Information and Learning Online, the National Research Council TRIS Index, and ERIC Resources in Education. In
The JAT is available on-line at the National Transportation Library at the Bureau of Transportation Statistics, U.S. Department of Transportation.
About the Journal of Air Transportation
addition, the JAT is available through inter-library loan at the University of Nebraska at Omaha and the Transport and Telecommunications Institute in Latvia via accessing the global OCLC inter-library loan network. A permanent archive is maintained at the University of Nebraska at Omaha. Annual subscriptions are available on CD-ROM for $35 for individuals and $99 for institutions. Hard copies may be available pending special request. Add $20 for subscriptions outside the U.S.A. Payments may be made by check or purchase order to the UNO Aviation Institute.
Host Organization: University of Nebraska at Omaha (UNO)–Nancy Belck, Chancellor; John
Christensen, Vice Chancellor for Academic and Student Affairs
Co-Sponsor Organizations: American Society for Public Administration–Wendy Haynes, Chair,
Transportation Section Air Transport Research Society–Tae Oum, Chair NASA Nebraska Space Grant Consortium–Brent Bowen, Director NASA Space Grant College and Fellowship Program–Diane DeTroye,
Interim Program Director Transport and Telecommunications Institute, Latvia–Eugenye Kopitov,
Rector
Supporting Organizations: Aviation Institute, UNO–Brent Bowen, Director Center for Public Affairs Research, UNO–Jerome Deichert, Director College of Public Affairs and Community Service, UNO–B.J. Reed, Dean School of Public Administration, UNO–Russell Smith, Chair University Library, UNO–Janice Boyer, Dean
JAT Personnel: Executive Editor: Brent Bowen, Aviation Institute, UNO (AI-UNO) Co-Editor: Igor Kabashkin, Transport & Telecommunications Institute,
Latvia Assistant Editor: Sarah Lucas, AI-UNO Manager, Technology-Based Educational Systems: Scott Vlasek, AI-UNO Library Liaisons/Advisors: John Reidelbach, University Library, UNO Publication Specialist: Melanie Kiper, Layout and Copy Editor, Center for
Public Affairs Research, UNO
Panel of Reviewers Reviewers are appointed by the Editor to represent all elements of
aviation and space transportation scholarship and practice. An appointment to the Panel of Reviewers recognizes professional and academic achievement. Appointments are for a three-year term with the option of renewal. For membership consideration, submit a curriculum vita or industry resumé to Dr. Brent Bowen, Executive Editor.
Anthony Adamski Eastern Michigan University
Julio Aguilar Solvciones en Regulaciones y Mercados, Mexico
Andreas Antoniou Commonwealth Secretariat, England
Deak Arch Ohio University
Herbert Armstrong College of Aeronautics
Kenneth Barnard Kansas State University
John Bertrand Middle Tennessee State University
Dispasis Bhadra CAASD/The Mitre Corporation
Jon L. Bryan Bridgewater State College
Gerald Chubb Ohio State University
David M. Conway Southeastern Oklahoma State University
Gerald N. Cook Spirit Airlines
Milford L. Coor International Aviation Law Consultant
James Crehan South Dakota State University
Khalid Durani Karachi, Pakistan
Bassel El-Kasaby University of Nebraska at Omaha
Steve Erb United States Department of Transportation
Respicio A. Espirito Santo Jr. Federal University of Rio de Janeiro
Jay Evans National Business Aircraft Association
Mary Fink NASA Nebraska Space Grant & EPSCoR
E. Terence Foster University of Nebraska at Lincoln
Kevin Garrity Utah State University
Terry Gibbs University of Nebraska at Kearney
Allen Hamilton Federal Express
Fred Hansen Oklahoma State University
John W. Horine Central Missouri State University
Sajjad Jasimuddin University of South Hampton
Randy Johnson Auburn University
Alexander Kalmykov SABRE Airline Solutions
Craig A. Kanske Sky Views, LLC.
John M. C. King Aviation & Tourism Management, Australia
Valery Kutev Transport and Telecommunications Institute, Latvia
John S. Lainos Athens, Greece
Mike Larson University of Nebraska at Omaha

About the Journal of Air Transportation
Thomas Lawton Imperial College, University of London, England
Chien-Tsung Lu Central Missouri State University
Jacqueline Luedtke Embry-Riddle Aeronautical University
Rebecca Lutte University of Nebraska at Omaha
William McCurry Arizona State University
Patrick J. McKinzie Minnesota State University
Juan Merkt Ohio University
Keith A. Mew California State University at Los Angeles
Terry Michmerhuizen Duncan Aviation
Boris Misnevs Transport and Telecommunications Institute, Latvia
Massoum Moussavi University of Nebraska at Lincoln
Patrick O’Neil University of Nebraska at Omaha
Dale Oderman Purdue University
Manoj Patankar Parks College of Engineering and Aviation
Michael W. Pearson Arizona State University
Anthony Perl University of Calgary
Stephen Quilty Bowling Green State University
Dawna Rhoades Embry-Riddle Aeronautical University
Robert Ripley Auburn University
Jose R. Ruiz Southern Illinois University, Carbondale
Stephen Rutner Georgia Southern University
Mary Sandy Old Dominion University
Michaela Schaaf University of Nebraska at Omaha
Greg Schwab Indiana State University
Mark Sherman Ohio University
Mary M. Snow Embry-Riddle Aeronautical University
Kim Jeffrey Stevens Aeronautics Division of ADOT
Vadim Stroitelev Air Navigation Service, Latvia
Yoshinon Suzuki Iowa State University
K. Victor Ujimoto University of Western Ohio
Bijan Vasigh Embry-Riddle Aeronautical University
Timothy Vowles Victoria University of Wellington, New Zealand
Elizabeth Ward NASA Langley Research Center
Thomas R. Weitzel Embry-Riddle Aeronautical University
Marc Wilson AMES Consulting, Inc.
Michael R. Witiw Certified Consulting Meteorologist
Irina Yatskiv Transport and Telecommunications Institute, Latvia
Malcolm Yeo Edith Cowan University, Australia
Shelley Yeo Curtin University of Technology, Australia
Jule Zumwalt Museum of Flight, Seattle, WA
© 2005, Aviation Institute, University of Nebraska at Omaha
Table of Contents Volume 10, Number 2 – 2005
Guest Editor Introduction .............................................................................. 1
Articles Aviation Transportation Research Society
Mitigation Alternatives for Carbon Dioxide Emissions by the Air Transport Industry in Brazil ................................................ 4
André Felipe Simões, Roberto Schaeffer, and Respicio A. Espírito Santo, Jr.
Air Transport Regulation Under Transformation: The Case of Switzerland ...................................................................... 20
Matthias Finger and Michel Piers
An Estimation of Aircraft Emissions at Turkish Airports ............ 33 Uğur Kesgin
Guide to the Implementation of Iso 14401 at Airports ................. 49 Vildan Korul
The Impact of Constrained Future Scenarios on Aviation and Emissions ............................................................................... 69
Ralf Berghof
Journal of Air Transportation The Immediate Financial Impact of Transportation
Deregulation on the Stockholders of the Airline Industry ............ 83 Joe B. Hanna, Robert A. Kunkel, Gregory A.
Kuhlemeyer, and Randy Johnson
Aviation Related Airport Marketing in an Overlapping Metropolitan Catchment Area: The Case of Milan’s Three Airports ......................................................................................... 96 David Jarach
Airport Pricing Systems and Airport Deregulation Effects on Welfare ....................................................................................... 109
Cristina Barbot
Index of Past Issues ................................................................................. 127
Guidelines for Manuscript Submission ................................................. 128
Order Form ............................................................................................. 131
The Editors
BRENT D. BOWEN
Dr. Brent Bowen is Director and Distinguished Professor, Aviation Institute, School of Public Administration, University of Nebraska at Omaha, and the University’s Director of Aviation and Transportation Policy and Research. Bowen attained his doctorate in Higher Education and Aviation from Oklahoma State University and a Master of Business Administration degree from Oklahoma City University. His Federal Aviation Administration certifications include Airline Transport Pilot, Certified Flight Instructor (Gold Seal), Advanced Instrument Ground Instructor, Aviation Safety Counselor, and Aerospace Education Counselor. Dr. Bowen’s research on the development of the national Airline Quality Rating is regularly featured in numerous national and international media, as well as refereed academic publications. Dr. Bowen has in excess of 300 publications, papers, and program appearances to his credit. His research interests focus on aviation applications of public productivity enhancement and marketing in the areas of service quality evaluation, forecasting, and student recruitment/retention in collegiate aviation programs. He is also well published in areas related to effective teaching and has pioneered new pedagogical techniques. Dr. Bowen has been recognized with awards of achievement and commendation from the American Marketing Association, American Institute of Aeronautics and Astronautics, Federal Aviation Administration, Embry-Riddle Aeronautical University, W. Frank Barton School of Business, Travel and Transportation Research Association, World Aerospace Education Association and others.
IGOR KABASHKIN
Dr. Igor Kabashkin is Vice Rector of the Transport and Telecommunications Institute, Latvia and a Professor in the Aviation Department of the European Commission for Cooperation in the Field of Scientific and Technical Research. Kabashkin received his Doctor Degree in Aviation from Moscow Civil Engineering Institute, a High Doctor Degree in Aviation from Moscow Aviation Institute, and a Doctor Habilitus Degree in Engineering from Riga Aviation University and Latvian Academy of Science. His research interests include analysis and modeling of complex technical systems, information technology applications, reliability of technical systems, radio and telecommunication systems, and information and quality control systems. Dr. Kabashkin has published over 274 scientific papers, 19 scientific and teaching books, and holds 67 patents and certificates of invention.
Journal of Air Transportation Vol. 10, No. 2 - 2005
© 2005, Aviation Institute, University of Nebraska at Omaha
Air Transport and the Environment
“In 2020, aircraft are cleaner and quieter and the aeronautics sector’s contribution to a sustainable environment is widely understood and appreciated… Aircraft noise is no longer a political and social issue. It has ceased to be a nuisance to people living close to airports thanks to a concerted effort to develop quieter engines, optimise operational procedures and improve land planning and use around airports.” (ACARE, 2000, p. 14). These are words extracted from the so called Vision 2020 for European aeronautics that sets goals pertaining to several objectives including environment and safety: 1) 50% reduction in perceived aircraft noise; 2) 50% cut in carbon dioxide (CO2) emissions per passenger kilometre, thus halving of fuel consumption; 3) 80% cut in nitrogen oxides (NOx); and 4) five-fold reduction in accidents. The report states a vision for the European air traffic system capable of handling 16 million1 flights per year with 24-hour operation of airports, more comfort for passengers, 99% flight punctuality and continuous reduction of travel charges.
Europe has a special problem due to the fragmentation of the ATM system that has 34 different providers of air navigation, in comparison to the US that has one. It is estimated that there are over 250 thousand unnecessary flying hours per year in the European airspace besides airport delays (IATA-ATAG, 2003). This is not only an issue of system efficiency and environmental impact but also safety. The current capacity of the European air traffic system is approximately 8.5 million flights per annum, an increase of over 80 percent since 1990 (Eurocontrol, 2004). In 2004 over 40 percent of all flights were delayed on departure in Europe. Thus, a target of 99 percent on time departures in 2020 means 160 thousand late flights opposed to 6.4 million if little is done to reduce delays over the next two decades.
Vision 2020 is a daring objective for the industry and by no means contained to Europe. These objectives if reached will not only benefit Europe but every airline, every airport that has ties with her through service connections or product acquisition. The changes will in no doubt be marked and obvious as new generation of aircraft enter service, new concepts for ATM are implemented and the drive for a sustainable future based on the Kyoto Protocol2 continues. Given the past these aims are by no means unrealistic but require increasing effort from all stakeholders as performance returns to costs diminish.
To give an idea of past accomplishments we can name examples such as Heathrow airport in the UK, where flights have increased by over 60 percent
1 100 percent increase over year 2000. 2 The Kyoto Protocol entered into force on February 16th, 2005.
2 Journal of Air Transportation
since the 1970s, yet the number of people disturbed by noise has dropped by 80 percent (ATAG, 2000). How has this been achieved? Aircraft today are on the average 20 decibels quieter than thirty years ago a 75 percent reduction in noise annoyance (EPNDB) around airports. Aircraft noise footprints of today have been reduced to approximately 10 percent of what they used to be for a typical aircraft of the 1970’s. To achieve similar results in the coming decades many facets of environmental improvements must be tackled besides aircraft engines alone: the airframe, ATC/M and operational procedures. Taking all of these measures together it is estimated that the net gain will be approximately 2 percent improvement in fuel efficiency per annum until 2020 (Arthur D.Little, 2000). Another important achievement has been the reduction of CO2 emissions by 50 percent over the last 30 years at the same time that fuel burn has been reduced by 70 percent. NOx emissions have trade-offs with emissions such as noise and carbon dioxide production. This trade-off can in some circumstances be substantial or over 90 percent increase in smoke if NOx is reduced by 25 percent (IATA, 2004). Efforts to overcome trade-offs of this nature require concerted efforts by research establishments world-wide. A safe ATC/M system, airport ground operations and reliable aircraft systems can systematically reduce accident rates. Accident rates are today about one fatality per million flights a reduction of over 50 percent over the last 20 years (IATA, 2003). Cutting these rates five fold means a mere 0.2 fatalities per million flights.
We have the pleasure of presenting 5 papers in this Special ATRS Issue. All of these papers were presented at the 2004 ATRS Conference at the Istanbul Technical University, Istanbul, Turkey. Four of the papers deal with air transport environmental issues and one with safety. The papers range from implementation of ISO14001 in airports to future scenarios on aviation emissions. The safety paper deals with the transformation of air transport regulation governing safety in the Swiss ATM system.
Simões, Schaeffer and Santo in their paper, Mitigation Alternatives for Carbon Dioxide Emissions by the Air Transport Industry in Brazil, discuss the contribution of Brazilian air transport to global climate change and possible alternative energy sources for mitigating CO2 emissions. This paper is particularly interesting in the context of suggesting the use of vegetable oils as energy source for aircraft. The authors point also to the importance of an efficient ATM system to reduce CO2 emissions. Given these measures suggested by the authors as well as foreseeable emission improvement in new generation of jet engines, Brazil has important concepts to offer in the domain of sustainable air transport.
Finger and Piers in their paper, Air Transport Regulation under Transformation: The Case of Switzerland, argue for the conceptual framework on which recommendations for institutional and organizational changes to transform Swiss aviation safety regulation. The Dutch Airspace
Journal of Air Transportation 3
Laboratory (NLR) was commissioned to give an external evaluation of safety due to several accidents and an increase of nearmisses in the airspace. The authors point out important recommendations of the NLR in the restructuring of the Swiss safety regulation and organizational structure. The strength of the article is the insight it provides on national organizational regulatory restructuring to enhance safety in air transport.
Kesgin in his paper, An Estimation of Aircraft Emissions at Turkish Airports, uses an empirical approach to predict future emissions at Turkish airports. He demonstrates that a percentage change in the LTO cycle (landing and takeoff) would cause a proportionally larger percentage rise in emissions. However, reduction in taxiing time by mere 2 minutes would reduce emissions by 6 percent.
Korul in her paper, Guide to the Implementation of the ISO14001 at Airports, demonstrates how an environmental quality management system can be implemented at airports. The paper is important by showing a specific approach for airports to reach environmental responsiveness in a programmed way.
Berghof in his paper, The Impact of Constrained Future Scenarios on Aviation and Emissions, argues that infrastructure enhancements and lower noise emissions are better attained through landing charges rather than a fuel tax or leap changes in aircraft technology such as hydrogen powered aircraft due to the profitability impacts on the industry. The methodology applied in the paper is a scenario analysis and quantification through a state of the art model.
Mehmet Fevzi Ünal Faculty of Aeronautics and Astronautics
Istanbul Technical University
Sveinn Vidar Gudmundsson Department Strategy and CERMAS Research Centre
Toulouse Business School
Journal of Air Transportation Vol. 10, No. 2 - 2005
© 2005, Aviation Institute, University of Nebraska at Omaha
MITIGATION ALTERNATIVES FOR CARBON DIOXIDE
EMISSIONS BY THE AIR TRANSPORT INDUSTRY IN
BRAZIL
André Felipe Simões Federal University of Rio de Janeiro
Roberto Schaeffer
Federal University of Rio de Janeiro
Respicio A. Espírito Santo, Jr. Federal University of Rio de Janeiro
Rio de Janeiro, Brazil
ABSTRACT
Environmental issues are increasingly high priority when drawing up government policies for transportation in both industrialized and developing nations. Carbon dioxide (CO2) emissions generated by the sector has caused much concern, mainly due to the fast growing rate of these emissions, now accounting for approximately 13% of global warming. Since the early 1990s, some of the highest growth rates of transportation emissions have been recorded for air transportation, which currently accounts for around 3.5% of total anthropogenic carbon dioxide emissions. This increase is particular in the industrial-based developing countries, such as Brazil, where demand for air transportation has increased rapidly. In view of this, the main purpose of this paper is to discuss the contribution of Brazilian air transportation to global climate change and to present more environmentally friendly energy sources for mitigating CO2 emissions from this sector. The paper presents an inventory of CO2 emissions caused by the air transportation sector in Brazil, a set of trend forecasts through to the year 2023, indicating the progression of these emissions, with several possible improvement alternatives.
_____________________________________________________________ Dr. Simões holds a Doctor Science degree in Energy Planning from the Federal University of Rio de Janeiro (UFRJ). His research focuses on the air transportation sector in the context of global climate change. He is a senior researcher at UFRJ, working in projects related with the energy and environment planning area. Dr. Simões thanks the partial financial support from the CAPES research agency (Brazilian Ministry of Education) to develop this work. Roberto Schaeffer holds a Ph.D. in Energy Management and Policy from the University of Pennsylvania and he is Associate Professor at the Energy Planning Program of the Federal University of Rio de Janeiro. Professor Schaeffer is also Associate-Editor of Energy-The International Journal. Professor Schaeffer, and along with Professor Espírito Santo, Jr., wish to thank the partial financial support from the CNPq research agency (Brazilian Ministry of Science and Technology) to develop this work.
Simões, Schaeffer, and Espírito Santo, Jr. 5
ENERGY CONSUMPTION BY THE AIR TRANSPORT SECTOR IN
BRAZIL
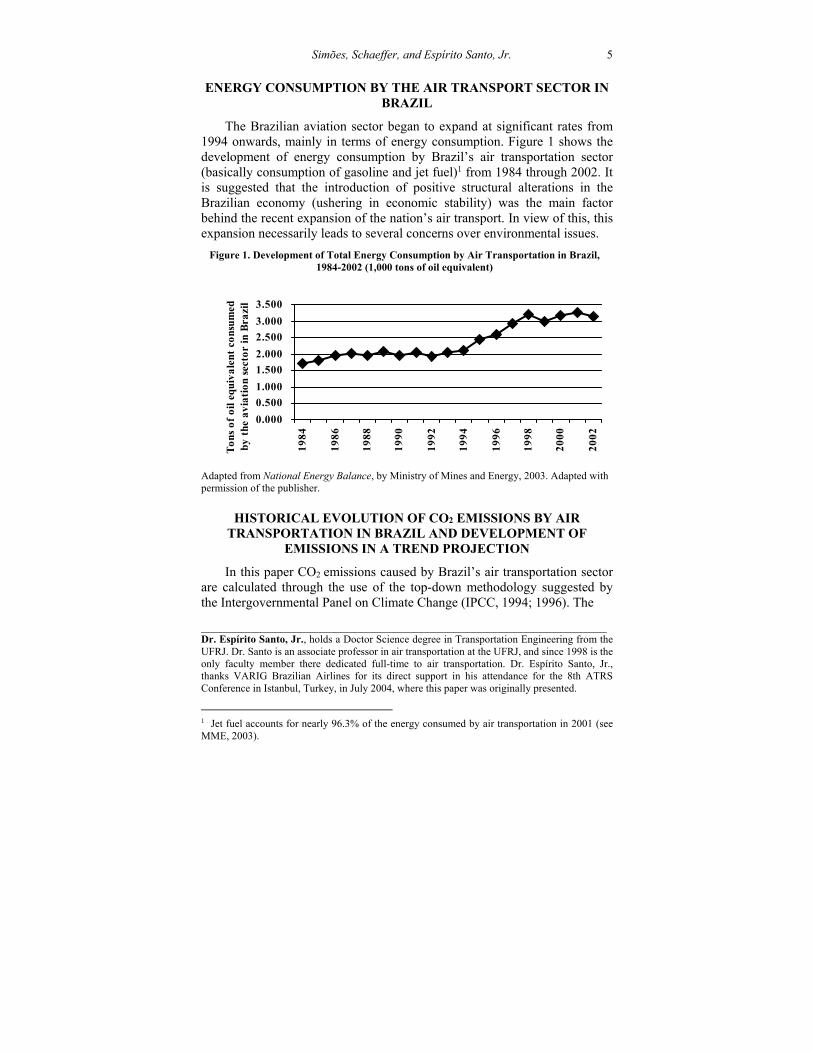
The Brazilian aviation sector began to expand at significant rates from 1994 onwards, mainly in terms of energy consumption. Figure 1 shows the development of energy consumption by Brazil’s air transportation sector (basically consumption of gasoline and jet fuel)1 from 1984 through 2002. It is suggested that the introduction of positive structural alterations in the Brazilian economy (ushering in economic stability) was the main factor behind the recent expansion of the nation’s air transport. In view of this, this expansion necessarily leads to several concerns over environmental issues.
Figure 1. Development of Total Energy Consumption by Air Transportation in Brazil, 1984-2002 (1,000 tons of oil equivalent)
0.000
0.500
1.000
1.500
2.000
2.500
3.000
3.50019
84
1986
1988
1990
1992
1994
1996
1998
2000
2002
Ton
s of
oil
equi
vale
nt c
onsu
med
by
the
avi
atio
n se
ctor
in B
razi
l
Adapted from National Energy Balance, by Ministry of Mines and Energy, 2003. Adapted with permission of the publisher.
HISTORICAL EVOLUTION OF CO2 EMISSIONS BY AIR TRANSPORTATION IN BRAZIL AND DEVELOPMENT OF
EMISSIONS IN A TREND PROJECTION
In this paper CO2 emissions caused by Brazil’s air transportation sector are calculated through the use of the top-down methodology suggested by the Intergovernmental Panel on Climate Change (IPCC, 1994; 1996). The
_____________________________________________________________Dr. Espírito Santo, Jr., holds a Doctor Science degree in Transportation Engineering from the UFRJ. Dr. Santo is an associate professor in air transportation at the UFRJ, and since 1998 is the only faculty member there dedicated full-time to air transportation. Dr. Espírito Santo, Jr., thanks VARIG Brazilian Airlines for its direct support in his attendance for the 8th ATRS Conference in Istanbul, Turkey, in July 2004, where this paper was originally presented.
1 Jet fuel accounts for nearly 96.3% of the energy consumed by air transportation in 2001 (see MME, 2003).
6 Journal of Air Transportation
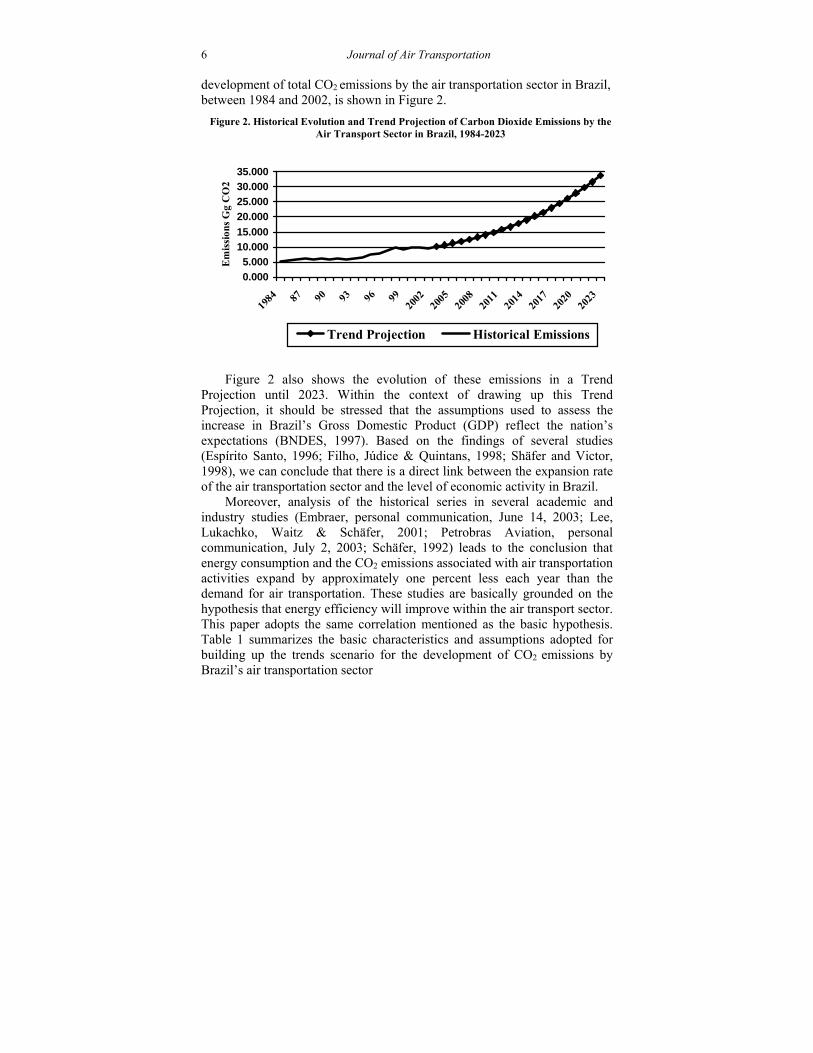
development of total CO2 emissions by the air transportation sector in Brazil, between 1984 and 2002, is shown in Figure 2.
Figure 2. Historical Evolution and Trend Projection of Carbon Dioxide Emissions by the Air Transport Sector in Brazil, 1984-2023
0.000
5.000
10.000
15.000
20.000
25.000
30.000
35.000
1984 87 90 93 96 99
2002
2005
2008
2011
2014
2017
2020
2023
Em
issi
ons
Gg
CO
2
Trend Projection Historical Emissions
Figure 2 also shows the evolution of these emissions in a Trend
Projection until 2023. Within the context of drawing up this Trend Projection, it should be stressed that the assumptions used to assess the increase in Brazil’s Gross Domestic Product (GDP) reflect the nation’s expectations (BNDES, 1997). Based on the findings of several studies (Espírito Santo, 1996; Filho, Júdice & Quintans, 1998; Shäfer and Victor, 1998), we can conclude that there is a direct link between the expansion rate of the air transportation sector and the level of economic activity in Brazil.
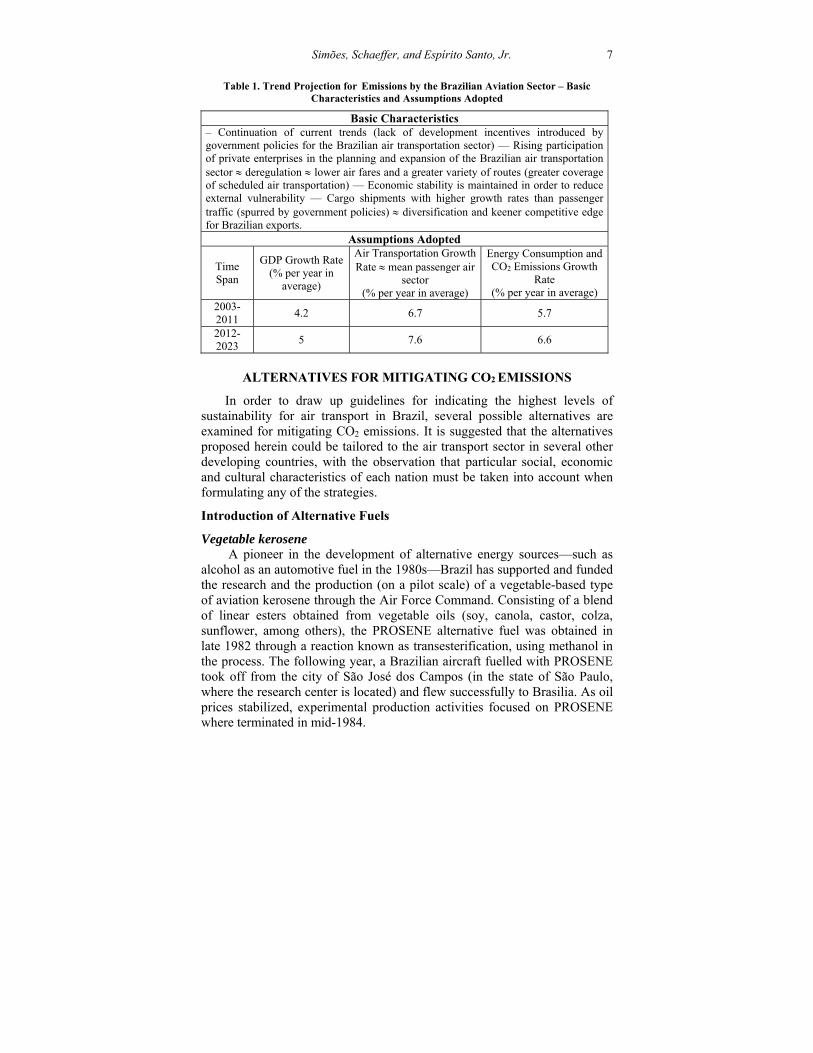
Moreover, analysis of the historical series in several academic and industry studies (Embraer, personal communication, June 14, 2003; Lee, Lukachko, Waitz & Schäfer, 2001; Petrobras Aviation, personal communication, July 2, 2003; Schäfer, 1992) leads to the conclusion that energy consumption and the CO2 emissions associated with air transportation activities expand by approximately one percent less each year than the demand for air transportation. These studies are basically grounded on the hypothesis that energy efficiency will improve within the air transport sector. This paper adopts the same correlation mentioned as the basic hypothesis. Table 1 summarizes the basic characteristics and assumptions adopted for building up the trends scenario for the development of CO2 emissions by Brazil’s air transportation sector
Simões, Schaeffer, and Espírito Santo, Jr. 7
Table 1. Trend Projection for Emissions by the Brazilian Aviation Sector – Basic
Characteristics and Assumptions Adopted
ALTERNATIVES FOR MITIGATING CO2 EMISSIONS
In order to draw up guidelines for indicating the highest levels of sustainability for air transport in Brazil, several possible alternatives are examined for mitigating CO2 emissions. It is suggested that the alternatives proposed herein could be tailored to the air transport sector in several other developing countries, with the observation that particular social, economic and cultural characteristics of each nation must be taken into account when formulating any of the strategies.
Introduction of Alternative Fuels
Vegetable kerosene A pioneer in the development of alternative energy sources—such as
alcohol as an automotive fuel in the 1980s—Brazil has supported and funded the research and the production (on a pilot scale) of a vegetable-based type of aviation kerosene through the Air Force Command. Consisting of a blend of linear esters obtained from vegetable oils (soy, canola, castor, colza, sunflower, among others), the PROSENE alternative fuel was obtained in late 1982 through a reaction known as transesterification, using methanol in the process. The following year, a Brazilian aircraft fuelled with PROSENE took off from the city of São José dos Campos (in the state of São Paulo, where the research center is located) and flew successfully to Brasilia. As oil prices stabilized, experimental production activities focused on PROSENE where terminated in mid-1984.
Basic Characteristics – Continuation of current trends (lack of development incentives introduced by government policies for the Brazilian air transportation sector) — Rising participation of private enterprises in the planning and expansion of the Brazilian air transportation sector deregulation lower air fares and a greater variety of routes (greater coverage of scheduled air transportation) — Economic stability is maintained in order to reduce external vulnerability — Cargo shipments with higher growth rates than passenger traffic (spurred by government policies) diversification and keener competitive edge for Brazilian exports.
Assumptions Adopted
Time Span
GDP Growth Rate (% per year in
average)
Air Transportation Growth Rate mean passenger air
sector (% per year in average)
Energy Consumption and CO2 Emissions Growth
Rate (% per year in average)
2003-2011
4.2 6.7 5.7
2012-2023
5 7.6 6.6
8 Journal of Air Transportation When comparing PROSENE with aviation kerosene, researchers from
the Centro Técnico Aeroespacial (CTA) [Air Force Aerospace Technical Center] noticed a small reduction in engine power when running on the new kerosene (of the order of some 10% due to the fact that it is a fuel with a lower energy content). Another issue addressed by the CTA was the thermal stability of PROSENE (CTA, personal communication, October 25, 2002). This latter problem, however, had been solved already, before the end of the PROSENE Project (CTA, personal communication, October 25, 2002).
The reduction in pollutant emissions through the use of PROSENE is well documented, as compared to conventional jet fuel emission. In 1983, the CTA observed that the reduction of CO2 emissions from a Bandeirante aircraft, using a blend of 90% jet fuel with 10% PROSENE, could reach 7.8 % per year (in average) comparing with the same aircraft flying the same envelope with conventional jet fuel. (CTA, personal communication, October 25, 2002).
Within this context, this paper suggests that Brazil should study the possibilities of re-funding and re-launching the PROSENE Project. It is estimated that this alternative alone could result in a reduction in CO2 emissions by Brazil’s air transportation sector of nearly 7.8% a year (compared to the Trend Projection, should the blend used be the already tested and approved 90% jet fuel plus 10% PROSENE). Based on interviews by the authors with several CTA professionals and aviation experts in the country, if re-adopted within a short period of time it is estimated that PROSENE could be certificated and fully operational for commercial use by the country’s airlines fleet of airplanes by 2018 (CTA, personal communication, October 25, 2002).
Hydrated alcohol The project to develop an alcohol-fuelled aircraft in Brazil began in the
mid-1980s at the CTA in São José dos Campos, when the alcohol fuel program for automotive use was flourishing. As this later program was gradually put aside, its aviation counterpart was also severely delayed. Nowadays, spurred by worldwide concern over minimizing the effects of climate change, and with constant upward variations in international jet fuel prices, re-launching this project may seem an interesting option, from both the environmental and economic aspects. Within this context, on October 10, 2002, the Neiva aircraft company (an Embraer subsidiary headquartered in the city of Botucatu, also in the state of São Paulo) successfully tested the first aircraft fuelled by hydrated alcohol in Brazil (the testbed, an EMB–202 Ipanema, is a piston-engine aircraft developed in the 1970s for agricultural purposes).
The advantages of the alcohol-powered engine are basically lower operating costs and less environmental pollution. Although burning a higher
Simões, Schaeffer, and Espírito Santo, Jr. 9
amount of fuel than a conventional aircraft flying on aviation gasoline (avgas), lower alcohol prices in the country strongly counterbalance the difference in fuel consumption. The main disadvantages rely in the fact that alcohol has only about one-half or two-thirds the energy density per unit volume compared to avgas. In view of this, the operating range and/or loitering time of the aircraft is reduced, thus requiring a higher fuel burn for take-off and climbing. In turn, this would require either a larger and heavier fuel system (mainly a larger fuel tank) or more take-off and landings to cover the same operations flown by avgas-burning aircraft.
From the environmental viewpoint, the use of alcohol offers a key benefit: it does not increase the greenhouse effect when burned, as the amount of carbon emitted to the atmosphere corresponds to a similar amount fixed in the soil through the sugar-cane growth process (CTA, personal communication, October 25, 2002; Macedo, 1992). Within this context, the replacement of aviation gasoline by hydrated alcohol would result in a 100% drop in CO2 emissions, in an initial analysis.
Accepting a future hypothetical one-to-one replacement of avgas-burning aircraft with alcohol-burning aircraft as crop-dusters operating in the country, and assuming that the 100% theoretical reduction could be applied to the entire fleet, this would mean that the abatement in CO2 emissions could reach nearly 26 gigagrams (Gg) of CO2, an equivalent to 0.3% of the total CO2 emissions by aviation activities in Brazil in 2001. This assumption is obviously an utopian, highly improbable scenario (in energy and economical terms), where the entire fleet of almost 420 crop-dusters operating in the country would fly solely on alcohol, and that this fuel replacement could be done within a very short timeframe.
However, introducing hydrated alcohol as an aviation fuel for agricultural applications and general aviation use could (and should) be phased in gradually. Embraer (personal communication, June 14, 2003) estimates that a period from eight to ten years would be required. Based on this Embraer scenario, the entire Brazilian crop-duster fleet could be flying on alcohol by 2011/2012, at the earliest, and this would only happen if the program were re-launched in the present year (2004). Due to the introduction of the CO2 emissions mitigation strategy, this is the year when it will be possible to detect an abatement of around 0.3% in total CO2 emissions due to aviation activities in Brazil, compared to the hypothesis described for 2001.
The widespread commercial use of alcohol as a fuel, even still hypothetically, could be in such dimension that it would gradually replace avgas for the entire Brazilian fleet of aircraft fitted with piston engines, which in 2002 accounted for 3.7% of all energy consumed by the Brazilian
10 Journal of Air Transportation
aviation sector2. It is estimated that the steady introduction of alcohol into Brazilian civil aviation activities after 2011 would account for the following reductions in CO2 emissions (compared to the trend scenario): 0.3% in 2011; 0.6% in 2012; 0.9% in 2013; 1.2% in 2014; 1.5% in 2015; 1.8% in 2016; 2.1% in 2017; 2.4% in 2018; 2.7% in 2019; 3.0% in 2020; 3.3% in 2021; 3.6% in 2022; and 3.7% in 2023.
INTRODUCTION OF A BROAD-RANGING INTEGRATED AIR TRAFFIC CONTROL SYSTEM
Based on the success of the Air Traffic Flow Management (ATFM) system in the U.S., Brazil has been developing its own version, called Gerenciamento de Fluxo de Tráfego Aéreo (GTFA). Through sophisticated computerized methods for processing data, this can also result in a more efficient and much better usage of both jet fuel and avgas. Consequently, an important aspect of this system is the generation of data on ideal flight altitudes from the standpoint of ensuring the most efficient, optimum fuel burning performance.
Basically, the initiative for developing this system is justified by shorter flying times, as well as briefer turnaround times, in addition to fuel savings that would reach some 10% per annum by 2008, according to the Ministry of Aeronautics (Air Force Command), equivalent to some 3 million liters of jet fuel (nearly the equivalent of 24,000 trips between Rio de Janeiro and Paris) (Filho et al., 1996). In addition to fuel savings and the resulting reduction in CO2 emissions, the GTFA system has other objectives, such as reducing delays, cutting waiting times and enhancing flight safety.
Based on the percentage estimated by the Air Force Command, of 10% CO2 emission reductions due to the introduction of a broad-based, integrated air traffic control system (the GFTA and its developments) would reach around 10% per annum, compared to the Trend Projection from 2005 through to 2023.
Jet Fuel Taxes in Brazil Levies, surcharges and other taxes are measures that are being
introduced by governments in some European countries (especially in Sweden, Norway and UK as well as in the U.S.) in order to tentatively soften the aggressive relationship between the air transportation sector and the environment. These economic tools are designed to imbue the air transportation sector with a greater awareness of associated environmental factors. 2 Due to the interconnectivity of the global aircraft system, some problems may arise from the use of alcohol for aviation in Brazil. However, these problems could be greatly reduced if the strategy were to focus on regional aviation, where the majority of the aircraft in service is from the Brazilian manufacturer Embraer.
Simões, Schaeffer, and Espírito Santo, Jr. 11
Based on the international examples and taking into consideration the
crises affecting major Brazilian airlines, together with the characteristics of the nation’s air transportation sector, it is suggested that Brazil should study the adoption of a tax similar to the air passenger duty (APD) in the UK, which is included in air fares and where its value would vary by the distance covered (i.e., the longer the flight, the higher the value of the tax, following the principle that those who pollute more should pay more). The proposed tax might well be called the air tax for sustainable development (ATSD), which would be based on the jet fuel burn for each flight segment covered by Brazilian carriers, either domestic or international.
As a reference base for the amount of this ATSD tax, a figure of US$0.0005 3 per liter of jet fuel burnt could be used as a starting point of study and analysis. In this context, a passenger flying from São Paulo to Paris, where approximately 174,000 liters of jet fuel are burnt (Geipot, 2001), would pay nearly an extra US$87.00 in her or his ticket for the total ATSD tax (in an approximate calculation).
Based on the characteristics of Brazil’s commercial aviation sector (Geipot, 2001), while maintaining all present social and economic variables, and considering the analysis conducted by the European Federation for Transport and Environment (T&E; Anastasiadis, 1999), we estimated that the ATSD tax could result in a drop in the demand for airline services in Brazil of around 2.5% between 2005 and 2023. It is also assumed that this percentage in the reduction of demand due to the ATSD tax would be reflected in a certain reduction in energy consumption, with lower CO2 emissions due to air transportation in Brazil. It should be stressed that the probable amount of the energy consumption and CO2 emissions reductions are not a trivial matter, as there is not a clear direct relationship between the demand for airline services and the parameters in question. Consequently, this paper does not attempt to estimate this reduction with any accuracy. Even so, it is felt that this reduction would not be negligible, as a drop in energy consumption and CO2 emissions of around one percent a year from 2005 through 2023 would be quite feasible, or at least within the possible value margins.
3 To reach the figure of US$0.0005, the following data was used: 5,600 liters as the amount of jet fuel burnt in a flight between Rio de Janeiro and São Paulo, being US$100.00 the average one-way fare for this segment, as of late 2003 (Gario, 2003). And based on the APD tax evaluation methodology (Anastasiadis, 1999), it was assumed that the ATSD calculation basis would be equivalent to 3% of the average value of an air ticket between Rio de Janeiro and São Paulo, namely US$3.00.
12 Journal of Air Transportation
Modal Choices between the two Largest and Most Important Cities in Brazil: Rio de Janeiro and São Paulo
The shuttle between Rio de Janeiro and São Paulo (373 kilometers flight distance) is among the five busiest routes worldwide in terms of passenger traffic. Within the Brazilian context it is by far the busiest route, carrying more than two million passengers and 30,000 tons each year (Gario, personal communication, May 19, 2003). All this heavy traffic results in a high-energy consumption: some 170 million liters of jet fuel were consumed by the shuttle flights in 2000 (Geipot, 2001). In terms of energy consumption (fuel) and passenger-kilometers, the percentage for this route compared to the total figures (within the Brazilian context) is similar, at around 8% (Geipot, 2001).
For all these reasons, as well as the geographical characteristic between Rio de Janeiro and São Paulo, some kind of alternative transportation modes have always been under consideration, for example, high speed trains (HST), as a mean of reducing fossil fuel consumption and greenhouse gases emissions. In fact, over a similar distance, a HST4 produces just about one-third of the emissions of a commercial aircraft, while being able to carry much more passengers and cargo, with the major drawback of not covering the distance in the same 45 minute period (Aviation Environment Federation, 1997).
If just considering specific alternatives that could lead to major reductions of CO2 emissions from the civil aviation sector in Brazil, the implementation of a HST between Rio de Janeiro and São Paulo could imply, between 2012 (which is assumed to be the first year of operation of the HST, if ever put into service) and 2023, in a reduction in the demand for air transport services by 40 to 50%.5 This reduction alone would imply a decrease of the same proportion in the share of fuel consumption for aviation in Brazil. In other words, the introduction of a reliable, efficient and economically viable alternative high-speed transport system in the Rio de Janeiro – São Paulo link could implicate a 4% reduction on total CO2 emissions by the aviation sector in Brazil (as compared to the trend scenario presented in Figure 2), between 2012 and 2023. Considering the multiple uncertainties associated with this estimation, a conservative reduction of 2% (on total CO2 emissions from aviation in Brazil) will be adopted in the present study.
The total investments required to implement the HST system between Rio de Janeiro and São Paulo could reach US$4 billion (Ferraz and Gualda, 1993). As a result, this project is not likely to be implemented by the
4 High speed trains are electrical-powered, while one of its most advanced technological concepts achieve its high speeds through the use of silicon superconductors along the train’s body and the railroad tracks. 5 This percentage is adopted based on results provided by Ferraz and Gualda (1993).
Simões, Schaeffer, and Espírito Santo, Jr. 13
Brazilian government or even by any local private groups. However, due to the objectives in view, its feasibility might well be underpinned to a certain extent through deploying the clean development mechanism (CDM) and based on in-depth studies focused on assessments of the emission reduction certificates (ERC) it becomes far more feasible.
Preliminary Examination of Other Alternatives
Lower average flight speeds The aerodynamic friction of an aircraft increases by the square factor of
its speed (Anastasiadis, 1999). This indicates that substantial fuel savings (and consequently lower CO2 emissions) may be achieved through lower speeds in high altitude. In fact, the key issue for this CO2 mitigation strategy is flight altitude, with its success depending on how airlines could implement lower cruising speeds at high altitudes (above 10,000 meters), as technical constraints regarding reducing speed on flights below this altitude may even increase fuel consumption (Anastasiadis, 1999; Fransen & Pepper, 1984).
According to engineers at the Brazilian Instituto de Aviação Civil (IAC) [Civil Aviation Institute] a reduction of around 12% in the average speed of commercial aircraft operating in Brazil (cruising above 10,000 meters) could result in fuel savings of nearly 20 million liters of jet fuel or approximately 1% of the total consumption registered in 2000 (IAC, personal communication, December 3, 2003). Taking the analysis drawn up by the IAC engineers as a starting point, it is estimated that jet fuel consumption could be cut by 1% a year through the implementation of the mitigation strategy in this section, with CO2 emissions reduced in a similar level.
Higher load-factor According to the IPCC, a basic way of mitigating the problem of
anthropogenic increases in the greenhouse effect is to increase the load-factor on all types of transportation (Petrobras Aviation, personal communication, July 2, 2003). This philosophy is very simple, yet not so simple to achieve in the practical daily activities of an airline, for instance: the higher the load-factor, the lower the carbon emissions by passenger-kilometer. This results in a better use of the energy content of the fuel used by any specific mode of transportation, boosting its energy efficiency. Although simple in theory, achieving constant rates of high load-factors is not simple at all for airlines.
Studies indicate that a global occupancy rate of around 75-80% worldwide could be achieved by 2015, which would boost the energy efficiency of air transportation by around 12%, compared to 2001 (IPCC, 1999). In Brazil today, this occupancy rate hovers around 54% (Geipot, 2001). Assuming that airlines and other players in the Brazilian air transportation sector could work together in order to achieve always-
14 Journal of Air Transportation
optimum load-factors (assuming it at approximately 80%), it is possible that a considerable reduction in energy consumption could be achieved. As a direct result, we could experience lower CO2 emissions.
At the time of writing, the authors were unable to assess reliable data regarding calculating this reduction with a significant degree of accuracy. Consequently, a conservative reduction of around 1% a year is assumed here from 2015 onwards for CO2 emissions (compared to the Trend Projection), through the introduction of the aforementioned mitigation strategy.
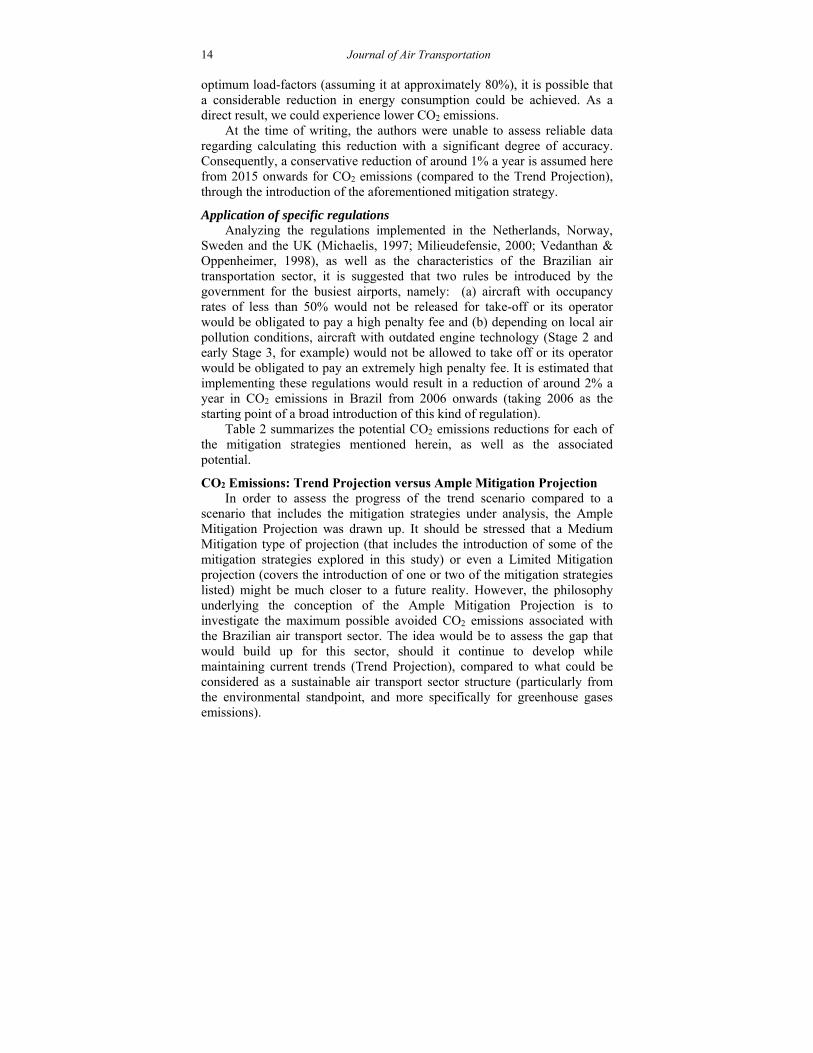
Application of specific regulations Analyzing the regulations implemented in the Netherlands, Norway,
Sweden and the UK (Michaelis, 1997; Milieudefensie, 2000; Vedanthan & Oppenheimer, 1998), as well as the characteristics of the Brazilian air transportation sector, it is suggested that two rules be introduced by the government for the busiest airports, namely: (a) aircraft with occupancy rates of less than 50% would not be released for take-off or its operator would be obligated to pay a high penalty fee and (b) depending on local air pollution conditions, aircraft with outdated engine technology (Stage 2 and early Stage 3, for example) would not be allowed to take off or its operator would be obligated to pay an extremely high penalty fee. It is estimated that implementing these regulations would result in a reduction of around 2% a year in CO2 emissions in Brazil from 2006 onwards (taking 2006 as the starting point of a broad introduction of this kind of regulation).
Table 2 summarizes the potential CO2 emissions reductions for each of the mitigation strategies mentioned herein, as well as the associated potential.
CO2 Emissions: Trend Projection versus Ample Mitigation Projection In order to assess the progress of the trend scenario compared to a
scenario that includes the mitigation strategies under analysis, the Ample Mitigation Projection was drawn up. It should be stressed that a Medium Mitigation type of projection (that includes the introduction of some of the mitigation strategies explored in this study) or even a Limited Mitigation projection (covers the introduction of one or two of the mitigation strategies listed) might be much closer to a future reality. However, the philosophy underlying the conception of the Ample Mitigation Projection is to investigate the maximum possible avoided CO2 emissions associated with the Brazilian air transport sector. The idea would be to assess the gap that would build up for this sector, should it continue to develop while maintaining current trends (Trend Projection), compared to what could be considered as a sustainable air transport sector structure (particularly from the environmental standpoint, and more specifically for greenhouse gases emissions).
Simões, Schaeffer, and Espírito Santo, Jr. 15
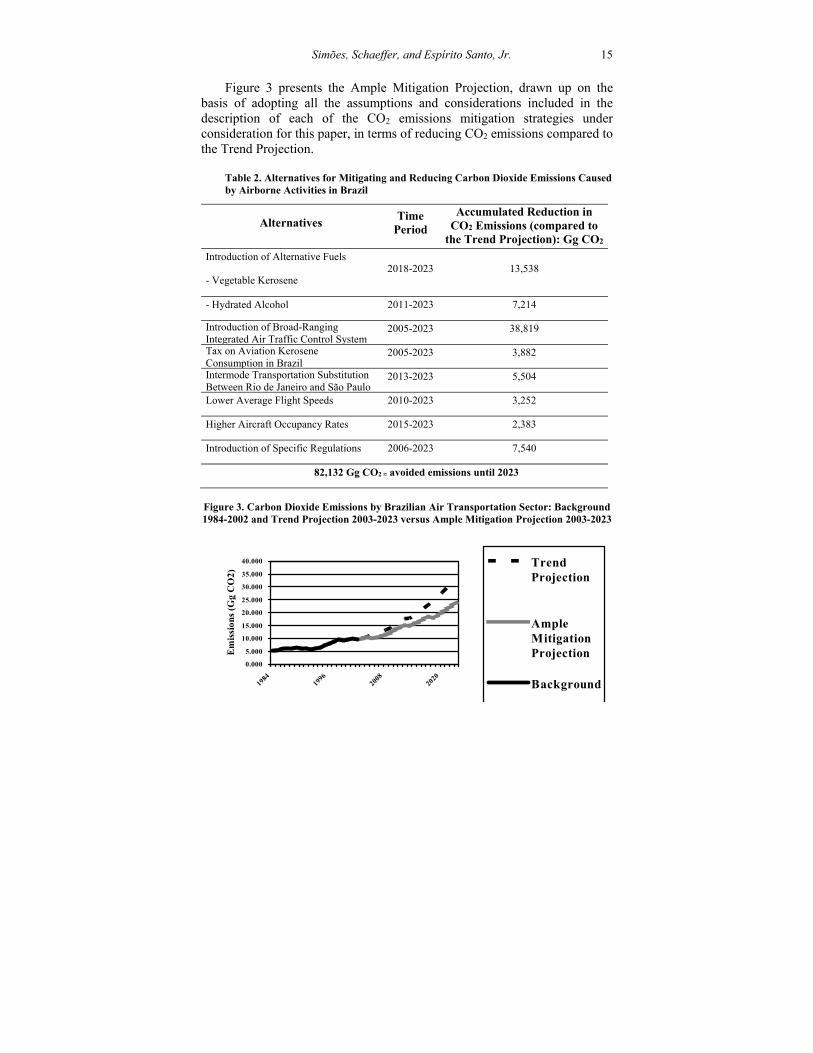
Figure 3 presents the Ample Mitigation Projection, drawn up on the
basis of adopting all the assumptions and considerations included in the description of each of the CO2 emissions mitigation strategies under consideration for this paper, in terms of reducing CO2 emissions compared to the Trend Projection.
Table 2. Alternatives for Mitigating and Reducing Carbon Dioxide Emissions Caused by Airborne Activities in Brazil
Alternatives Time
Period
Accumulated Reduction in CO2 Emissions (compared to
the Trend Projection): Gg CO2
Introduction of Alternative Fuels 2018-2023 13,538
- Vegetable Kerosene
- Hydrated Alcohol 2011-2023 7,214
Introduction of Broad-Ranging Integrated Air Traffic Control System
2005-2023 38,819
Tax on Aviation Kerosene Consumption in Brazil
2005-2023 3,882
Intermode Transportation Substitution Between Rio de Janeiro and São Paulo
2013-2023 5,504
Lower Average Flight Speeds 2010-2023 3,252
Higher Aircraft Occupancy Rates 2015-2023 2,383
Introduction of Specific Regulations 2006-2023 7,540
82,132 Gg CO2 ≈ avoided emissions until 2023
Figure 3. Carbon Dioxide Emissions by Brazilian Air Transportation Sector: Background 1984-2002 and Trend Projection 2003-2023 versus Ample Mitigation Projection 2003-2023
0.000
5.000
10.000
15.000
20.000
25.000
30.000
35.000
40.000
1984
1996
2008
2020
Em
issi
ons
(Gg
CO
2) Trend
Projection
AmpleMitigationProjection
Background
16 Journal of Air Transportation
FINAL REMARKS AND RECOMMENDATIONS
An exercise of building energy consumption (or CO2 emissions) projections over the medium and long terms (over 10 years) for the Brazilian air transport sector opens up wide possibilities of variation, associated particularly with technological changes and the effects of other energy sources. Nevertheless, despite uncertainties of this type and acknowledging the non-renewable nature of oil reserves, prospects may well be built up for Brazil’s air transport sector that are less environmentally aggressive and degrading over the medium and long terms. Within this context, the Ample Mitigation Projection was drawn up, which covers the joint implementation of the mitigation alternatives for CO2 emissions examined in this paper.
Comparing the Ample Mitigation Projection with the Trend Projection, the percentage reduction in CO2 emissions varies from 11% in 2005 (when the mitigation strategies begin to take effect) to 28.5% in 2023. It is also noted that the accumulated reduction prompted by the joint implementation of the mitigation strategies analyzed from 2002 through 2023 reaches 82,132 Gg CO2—equivalent to the total CO2 emissions by Brazil’s air transport sector over a period of ten years (1992–2002).
It should be noted that the majority of the data shown in the tables and figures were generated from scenarios based on a variety of assumptions, hypotheses and considerations, therefore the precise numerical values should not be assumed, in order to ensure coherence. However, the difference—at times significant from the standpoint of CO2 emissions—between the figures for the Trend Projection and the Ample Mitigation Projection, and among the mitigation alternatives provides significant indication that could provide valid input for consistent analysis.
Within this context and examining each of the proposed mitigation alternatives, it becomes clear that some of them tend to generate more significant reductions in CO2 emissions: the implementation of the integrated air traffic control system; the commercial use of vegetable kerosene; and the introduction of specific regulations. However, when based solely on the estimated potential reduction in CO2 emissions, suggesting or recommending the introduction of a given mitigation strategy could result in misguided results. In fact the indirect benefits of each alternative should be taken into consideration, in addition to the efforts that are necessary to overcome the several limitations for ensuring the feasibility of implementing the corresponding alternative (for example, from the financial, technological or political standpoints), and hence, generation of more jobs through the introduction of hydrated alcohol (through sugar cane crops, which is the raw material for alcohol production) and vegetable kerosene (through agro-businesses of the vegetable oils) as aircraft fuels; absorption of outside environmental factors and the possibility of assigning income brought in
Simões, Schaeffer, and Espírito Santo, Jr. 17
through jet fuel taxes to projects on minimizing environmental impacts caused by air transport activities; reduced local pollution conditions around airports through implementing specific regulations; and fuel savings with fewer delays and shorter waiting times at airports achieved through a broad-range integrated air traffic control system.
It is estimated that the alternatives of introducing specific regulations, boosting airline load-factors, and implementing the broad-range integrated air traffic control system would be the most appropriate and achievable options, as they largely depend on appropriate strategic airline marketing, management, and planning and/or government decisions, rather than on technological progress or heavy capital inputs, which would be the case, for instance, of the HST alternative.
It should be noted that there are factors specifically relating to Brazil that will tend to provide leverage for aviation demands, which are already expanding. These factors include: in the medium term, a foreseeable economic growth with a much better distribution of income (meaning that more people will have access to air travel); heavy repressed demand; a country with continental dimensions; and a good airport infrastructure. The IPCC itself forecasts a boom in demand for air services in developing countries with industrialized bases, such as Brazil, from 2015 onwards (IPCC, 1999). Within this context, it is essential to implement alternatives that can lead to lower CO2 emissions in Brazil, helping to avoid any worsening of environmental problems at the global level. However, the estimated reduction of 28.5% of CO2 emissions by Brazil’s air transport sector by 2023 (compared to the Trend Projection) generated by the mitigation alternatives under consideration herein shows that the issue is very relevant and must be studied in great detail.
There is no doubt that one of the main challenges facing Brazil, as well as the worldwide air transport sector during the twenty-first century, will be dealing with the inevitable upsurge in demand while minimizing air pollution. In the case of Brazil (and other developing countries), this challenge is even greater. After all, core environmental issues—protecting Earth’s atmosphere, for example—may not be ranked as top priority by the government as more pressing problems—such as meeting the basic needs of much of the population that is still not properly cared for—certainly warrant more urgent attention.
REFERENCES
Aviation Environment Federation. (1997). Flying green. Retrieved from www.aef.org.uk/aefinfo/publications.htm
18 Journal of Air Transportation
BNDES. (1997). Macrocenários econômicos [Economics Macro-scenarios]. Brazil: Banco Nacional de Desenvolvimento Econômico e Social [National Economic and Social Development Bank].
Espírito Santo, Jr., R. A. (1996). Estudo de Cenários Alternativos para a
Aviação Comercial Brasileira: Transporte Regular de Passageiros [Study of alternative scenarios for the Brazilian commercial aviation sector: Regular passenger transportation]. Brazil: M.Sc. Dissertation, Catholic University of Rio de Janeiro.
Ferraz, R. & Gualda, N. (1993). Air connection between Rio de Janeiro and
São Paulo: Demand analyses by Delphi’s methodology. Brazil: Transport Engineering Department, Polytechnic School of the University of São Paulo.
Filho, R. C., Júdice, C. E. C., & Quintans, L. A. (1996). Gerenciamento do
fluxo de tráfego aéreo [Management of the air traffic flow]. Book Review of the VI Congresso Brasileiro de Energia [Brazilian Energy Congress], 3, 988-993.
Filho, P., Allemander, J., Ramos, R. F., Carvalho, R. B., Silveira, J. A., &
Burman, P. K. (1998). Formulação dos Modelos de Demanda por Transporte Aéreo [Formulation of the Models for the Air Transportation Demand]. In: Ministério da Aeronáutica (Ed.), Demanda Global do Transporte Aére [Air Transportation Global Demand, first edition] (pp. 3-1 – 3-55). Rio de Janeiro: Ministério da Aeronáutica, Departamento de Aviação Civil [Ministry of Aeronautic, Civil Aviation Department].
Fransen, W. & Pepper, J. (1984). Atmospheric effects of high-flying sub-
sonic air traffic on operational measures to mitigate these effects. The Netherlands: UK, Ministry of transport, public works and water management, Directorat General of Civil Aviation.
Geipot. (2001). Transport statistic annual, 2001. Distrito Federal, Brasil:
Empresa Brasileira de Planejamento de Transportes [Brazilian Enterprise of Transport Planning, Ministry of the Transports].
IPCC. (1994).Guidelines for national greenhouse gas inventories.
Cambridge, UK: Cambridge University Press.
Simões, Schaeffer, and Espírito Santo, Jr. 19
IPCC. (1996). Greenhouse gas inventory reporting instructions—IPCC
Guidelines for national greenhouse gas inventories. London: Intergovernmental Panel on Climate Change.
IPCC. (1999). Aviation and the global atmosphere—A special report of
IPCC working groups I and III. Cambridge, UK: Cambridge University Press.
Lee, J., Lukachko, S., Waitz, I., & Schafer, A. (2001). Historical and future
trends in aircraft performance, cost and emissions: Annual reviews. Energy & the Environment, 26, 167-200.
Macedo, I. C. (1992). The sugar cane agro-industry: Its contribution to
reducing CO2 emission in Brazil. Biomass & Bioenergy, 3/2, 77-80. Michaelis, L. (1997). Policies and measures for common action. Working
Paper 12 of the Annex I expert group on the UN FCCC. Paris: OECD,.
Milieudefensie. (2000). The right price for air travel. The Netherlands.
Retrieved from http://www.milieudefensie.nl/airtravel MME. (2003). National Energy Balance (base year: 2002). Portugal.
Ministry of Mines and Energy. Retrieved October 2004 from http://www.mme.gov.br
Schäfer, A. & Victor, D. G. (1998). Global passenger travel: Implications for
carbon dioxide emissions. Energy, 24, 657-679. Schäfer, A. (1992). Carbon emissions in the passenger transport and
alternative fuels. Working Paper. Luxembourg: International Institute for Applied Systems Analysis.
Anastasiadis, S. (1999). Aviation and its impact on the environment.
Brussels: European Federation for Transport and Environment. Vedanthan, A. & Oppenheimer, M. (1998). Long term scenarios for aviation:
Demand and Emissions of CO2 and NOX. Energy Policy, 26, 625-641.
Journal of Air Transportation Vol. 10, No. 2 - 2005
© 2005, Aviation Institute, University of Nebraska at Omaha
AIR TRANSPORT REGULATION UNDER
TRANSFORMATION: THE CASE OF SWITZERLAND
Matthias Finger Swiss Federal Institute of Technology
Lausanne, Switzerland
Michel Piers National Aerospace Laboratory NLR
Amsterdam, The Netherlands
ABSTRACT
Over the past five years, the Swiss air transport sector has witnessed an unprecedented number of accidents and incidents, leading to an independent analysis ordered by the government. The resulting report of 2003 identified significant regulatory and institutional deficiencies with direct implications for safety. The challenges to Switzerland’s institutional regulatory framework were further exacerbated because of the bankruptcy of the Swiss national flag carrier (Swissair in 2002) and the pressure on Zurich Unique airport resulting from of a new over flight regime in Germany in 2003. On the basis of this report, the government has ordered a profound transformation of the Swiss institutional regulatory framework, among which the transformation of the Swiss Federal Office of Civil Aviation (FOCA) into a regulator, whose predominant concern must be safety. This paper presents and critically analyzes the current transformation of the Swiss institutional regulatory regime against both regulation theory and safety performance criteria.
INTRODUCTION
The Swiss air transport sector has been struck, since the late 1990s, by a series of severe accidents. One may recall the crash of an MD-11 Swissair near Halifax in September 1998, the fatal accident of a Crossair Saab 340 in January 2000 and of another Crossair Avro 146 RJ, both near Zürich Airport, as well as most recently the mid-air collision on July 1, 2002, near Überlingen (Germany) over Swiss air space. Simultaneously, the Swiss National Bureau of Accident Investigation (AAIB) had reported various cases of near misses, as well as shortcomings in air traffic control (ATC) equipment. _____________________________________________________________________________ Matthias Finger, PhD in political science, University of Geneva, has taught at Syracuse University (New York) and Columbia University (New York), and currently is Dean and Professor at the Swiss Federal Institute of Technology. Michel Piers holds a masters degree in engineering and is currently a manager at the National Aerospace Laboratory in Amsterdam.
Finger and Piers 21
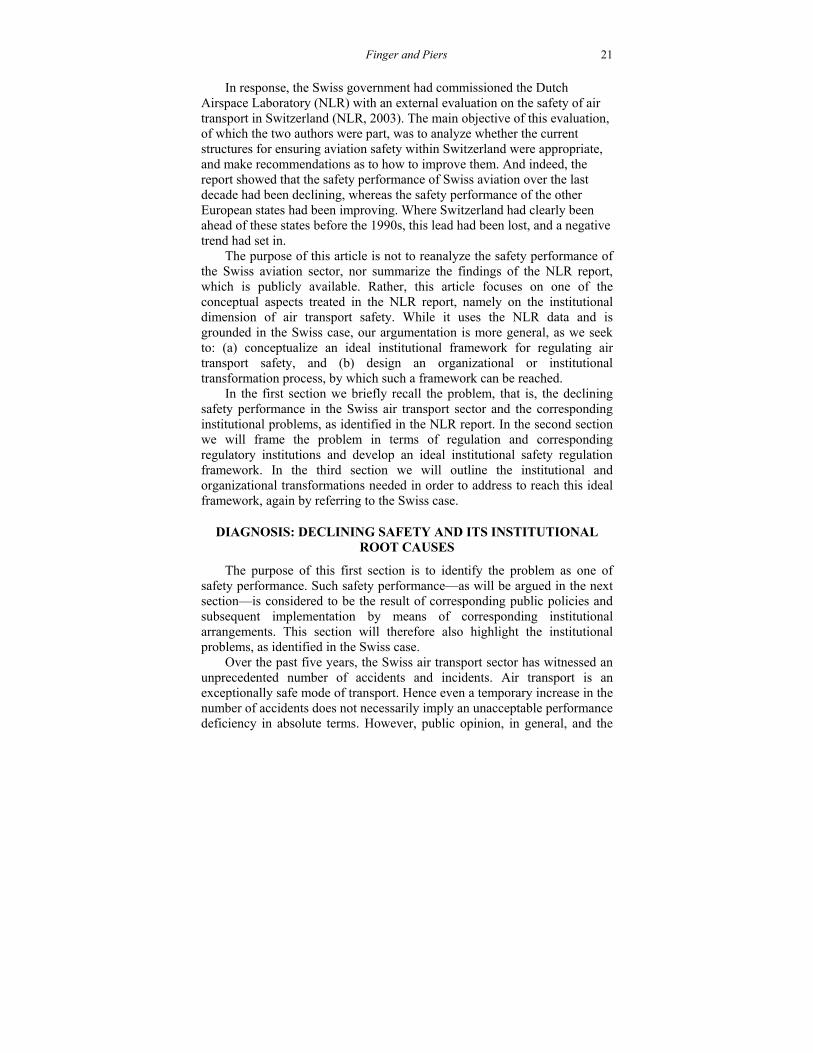
In response, the Swiss government had commissioned the Dutch
Airspace Laboratory (NLR) with an external evaluation on the safety of air transport in Switzerland (NLR, 2003). The main objective of this evaluation, of which the two authors were part, was to analyze whether the current structures for ensuring aviation safety within Switzerland were appropriate, and make recommendations as to how to improve them. And indeed, the report showed that the safety performance of Swiss aviation over the last decade had been declining, whereas the safety performance of the other European states had been improving. Where Switzerland had clearly been ahead of these states before the 1990s, this lead had been lost, and a negative trend had set in.
The purpose of this article is not to reanalyze the safety performance of the Swiss aviation sector, nor summarize the findings of the NLR report, which is publicly available. Rather, this article focuses on one of the conceptual aspects treated in the NLR report, namely on the institutional dimension of air transport safety. While it uses the NLR data and is grounded in the Swiss case, our argumentation is more general, as we seek to: (a) conceptualize an ideal institutional framework for regulating air transport safety, and (b) design an organizational or institutional transformation process, by which such a framework can be reached.
In the first section we briefly recall the problem, that is, the declining safety performance in the Swiss air transport sector and the corresponding institutional problems, as identified in the NLR report. In the second section we will frame the problem in terms of regulation and corresponding regulatory institutions and develop an ideal institutional safety regulation framework. In the third section we will outline the institutional and organizational transformations needed in order to address to reach this ideal framework, again by referring to the Swiss case.
DIAGNOSIS: DECLINING SAFETY AND ITS INSTITUTIONAL ROOT CAUSES
The purpose of this first section is to identify the problem as one of safety performance. Such safety performance—as will be argued in the next section—is considered to be the result of corresponding public policies and subsequent implementation by means of corresponding institutional arrangements. This section will therefore also highlight the institutional problems, as identified in the Swiss case.
Over the past five years, the Swiss air transport sector has witnessed an unprecedented number of accidents and incidents. Air transport is an exceptionally safe mode of transport. Hence even a temporary increase in the number of accidents does not necessarily imply an unacceptable performance deficiency in absolute terms. However, public opinion, in general, and the
22 Journal of Air Transportation
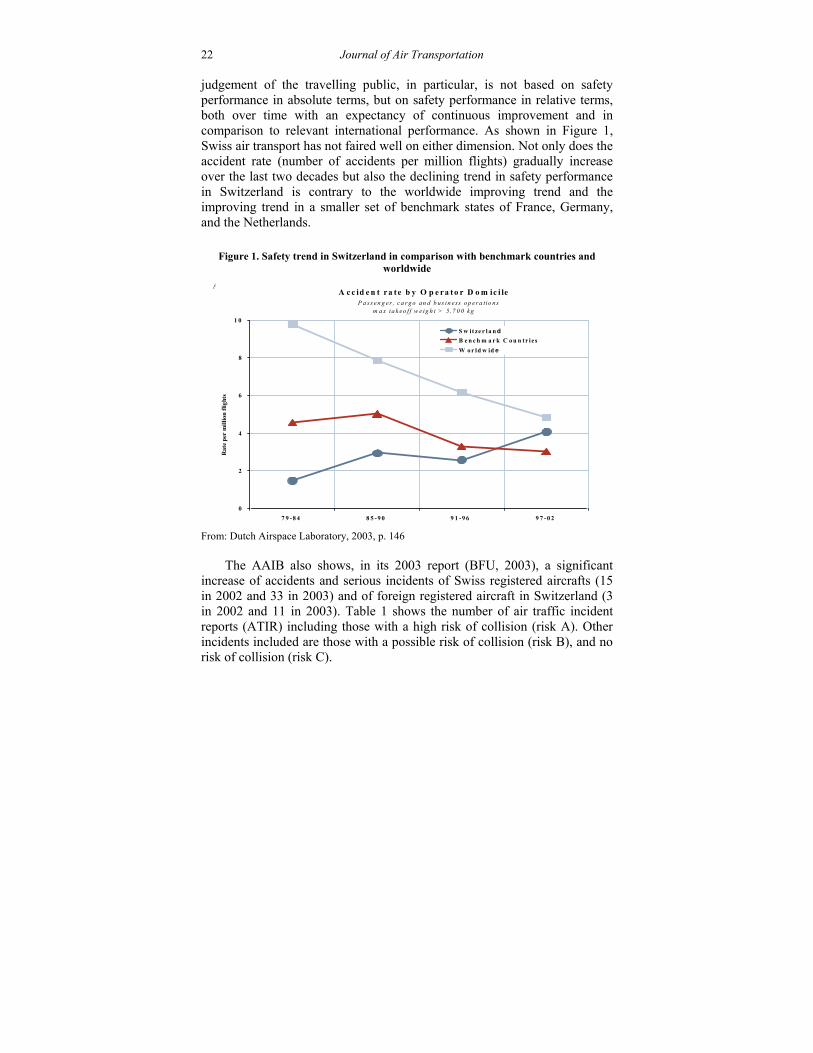
judgement of the travelling public, in particular, is not based on safety performance in absolute terms, but on safety performance in relative terms, both over time with an expectancy of continuous improvement and in comparison to relevant international performance. As shown in Figure 1, Swiss air transport has not faired well on either dimension. Not only does the accident rate (number of accidents per million flights) gradually increase over the last two decades but also the declining trend in safety performance in Switzerland is contrary to the worldwide improving trend and the improving trend in a smaller set of benchmark states of France, Germany, and the Netherlands.
Figure 1. Safety trend in Switzerland in comparison with benchmark countries and worldwide
A A c c id e n t r a te b y O p e ra t o r D o m ic i le
P a s s e n g e r , c a r g o a n d b u s in e ss o p e r a tio n s m a x ta k e o f f w e ig h t > 5 ,7 0 0 k g
0
2
4
6
8
1 0
7 9 -8 4 8 5 -9 0 9 1 - 9 6 9 7 -0 2
Rat
e p
er m
illio
n fl
ight
s
S w it ze r la n d B e n c h m a r k C o u n tr ies
W o r ld w id e
From: Dutch Airspace Laboratory, 2003, p. 146
The AAIB also shows, in its 2003 report (BFU, 2003), a significant
increase of accidents and serious incidents of Swiss registered aircrafts (15 in 2002 and 33 in 2003) and of foreign registered aircraft in Switzerland (3 in 2002 and 11 in 2003). Table 1 shows the number of air traffic incident reports (ATIR) including those with a high risk of collision (risk A). Other incidents included are those with a possible risk of collision (risk B), and no risk of collision (risk C).
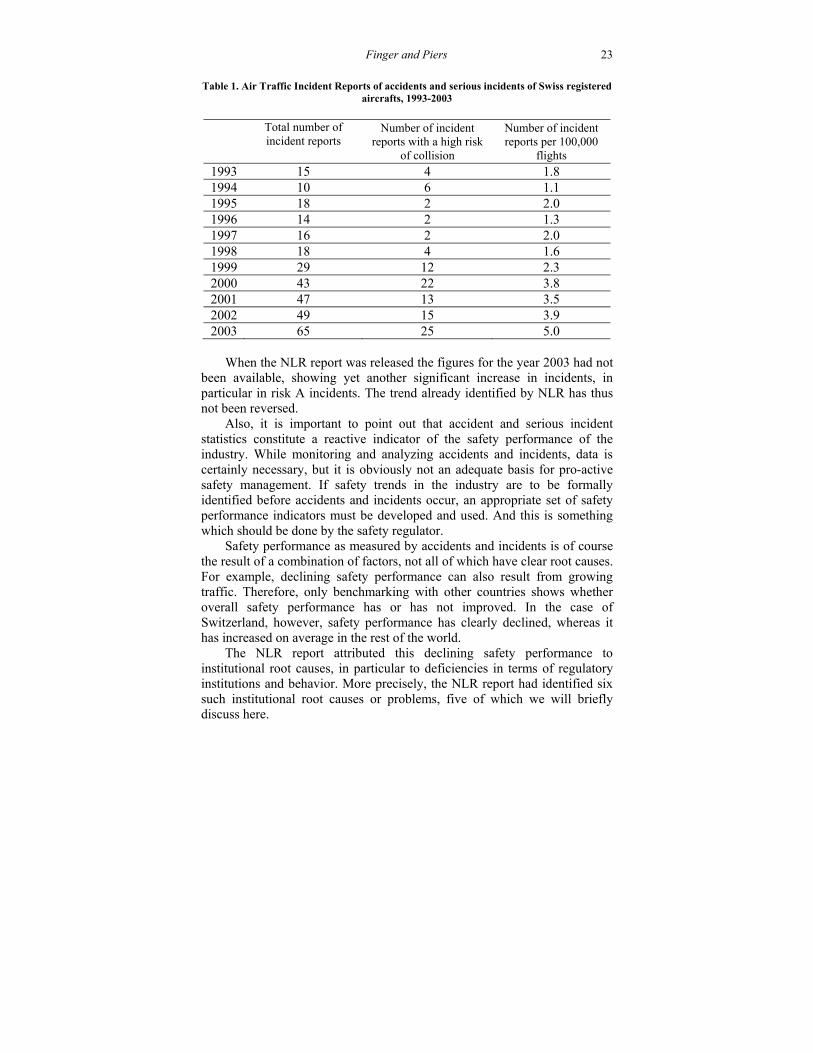
Finger and Piers 23
Table 1. Air Traffic Incident Reports of accidents and serious incidents of Swiss registered
aircrafts, 1993-2003
Total number of incident reports
Number of incident reports with a high risk
of collision
Number of incident reports per 100,000
flights 1993 15 4 1.8 1994 10 6 1.1 1995 18 2 2.0 1996 14 2 1.3 1997 16 2 2.0 1998 18 4 1.6 1999 29 12 2.3 2000 43 22 3.8 2001 47 13 3.5 2002 49 15 3.9 2003 65 25 5.0
When the NLR report was released the figures for the year 2003 had not
been available, showing yet another significant increase in incidents, in particular in risk A incidents. The trend already identified by NLR has thus not been reversed.
Also, it is important to point out that accident and serious incident statistics constitute a reactive indicator of the safety performance of the industry. While monitoring and analyzing accidents and incidents, data is certainly necessary, but it is obviously not an adequate basis for pro-active safety management. If safety trends in the industry are to be formally identified before accidents and incidents occur, an appropriate set of safety performance indicators must be developed and used. And this is something which should be done by the safety regulator.
Safety performance as measured by accidents and incidents is of course the result of a combination of factors, not all of which have clear root causes. For example, declining safety performance can also result from growing traffic. Therefore, only benchmarking with other countries shows whether overall safety performance has or has not improved. In the case of Switzerland, however, safety performance has clearly declined, whereas it has increased on average in the rest of the world.
The NLR report attributed this declining safety performance to institutional root causes, in particular to deficiencies in terms of regulatory institutions and behavior. More precisely, the NLR report had identified six such institutional root causes or problems, five of which we will briefly discuss here.
24 Journal of Air Transportation 1. There is an absence of a national aviation safety policy and
corresponding action plan, which would define clear targets in terms of safety performance and attribute corresponding institutional responsibilities for implementing it. From a public policy perspective, this is of course the primary root cause. However, we will not address this issue further, as our primary interest is on institutional aspects. A national aviation safety policy, if it were to be developed, should simply take these institutional aspects into account.
2. There is an absence of a clear supervision of FOCA by the Ministry and corresponding responsibility. Indeed, it appeared that FOCA was neither properly instructed, nor controlled by the Ministry. This is an aspect we will discuss in more depth later.
3. There is an absence of a clear separation or a clear identification of safety related issues and corresponding responsibilities within FOCA. Indeed, it appears that safety was pervasive all throughout FOCA without however clearly identifying an overall responsibility for safety and safety performance. We will discuss this aspect in further detail as well.
4. The existence of a federal accident investigation commission (called EFUG) on top of the AAIB significantly delays recommendations by the AAIB and dilutes responsibilities. This is an institutional root cause, which will briefly be addressed later.
5. There is a dysfunctional reporting structure and process, whereby the AAIB reports exclusively to FOCA, rather than to the Ministry. This is related to the fact that the recommendations did not legally oblige the concerned actor to take the AAIB recommendation into consideration. This is an institutional and legal problem, which will briefly be addressed later.
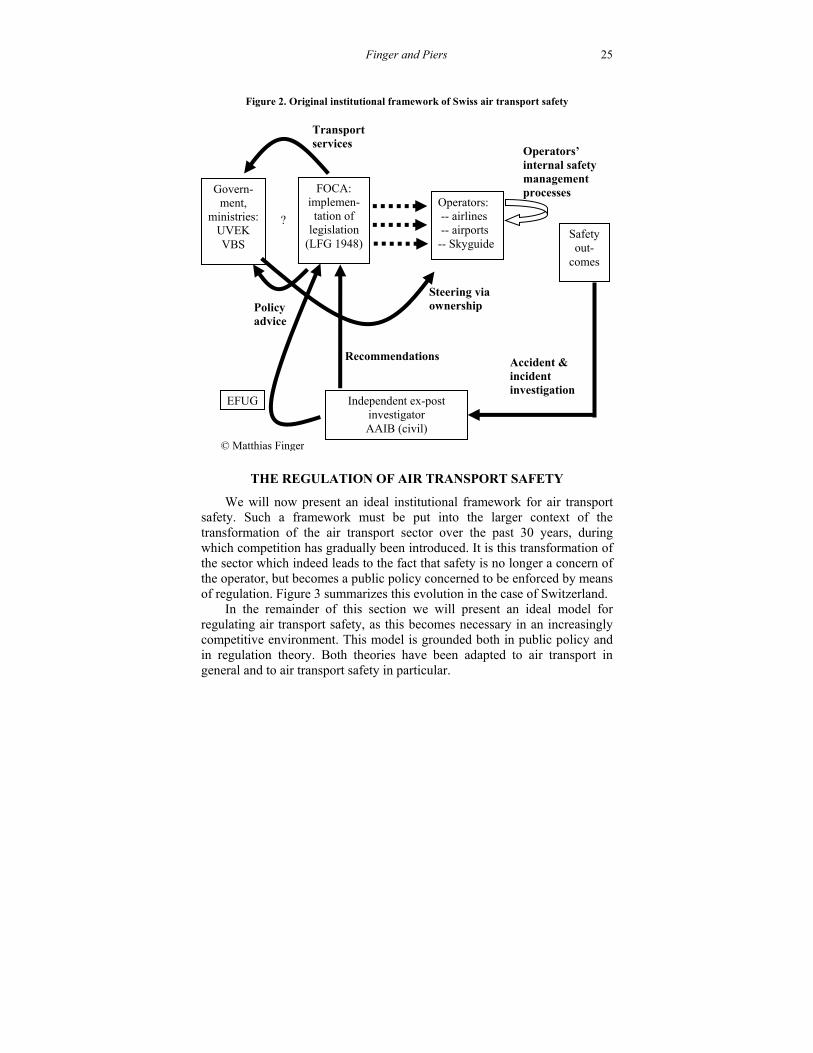
Figure 2 summarizes the original institutional framework of Swiss air
transport safety, as identified at the time of the NLR report. We have summarized the safety performance problems of the Swiss air
transport sector and the corresponding institutional and organizational root causes as they were identified by the NLR report. Now we will discuss the conceptual framework linking safety performance to regulatory institutions.
Finger and Piers 25
Figure 2. Original institutional framework of Swiss air transport safety
THE REGULATION OF AIR TRANSPORT SAFETY
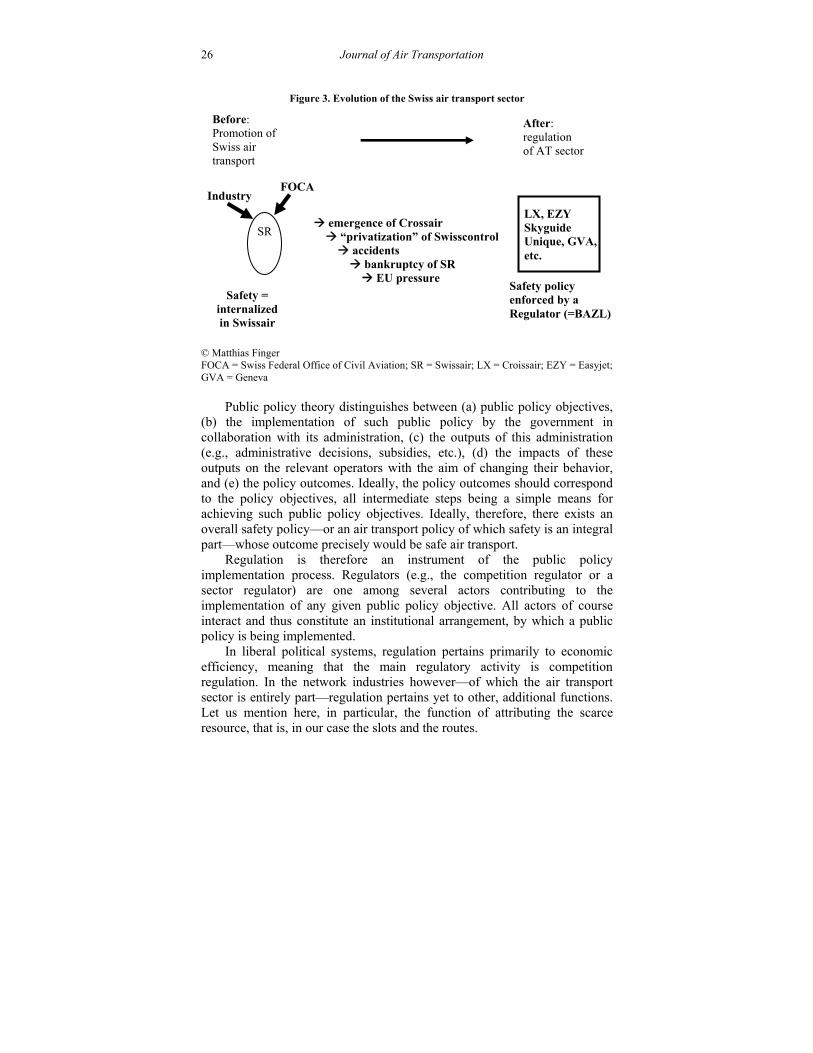
We will now present an ideal institutional framework for air transport safety. Such a framework must be put into the larger context of the transformation of the air transport sector over the past 30 years, during which competition has gradually been introduced. It is this transformation of the sector which indeed leads to the fact that safety is no longer a concern of the operator, but becomes a public policy concerned to be enforced by means of regulation. Figure 3 summarizes this evolution in the case of Switzerland.
In the remainder of this section we will present an ideal model for regulating air transport safety, as this becomes necessary in an increasingly competitive environment. This model is grounded both in public policy and in regulation theory. Both theories have been adapted to air transport in general and to air transport safety in particular.
Operators: -- airlines -- airports -- Skyguide
Govern- ment,
ministries: UVEK VBS
Safety out-
comes
Independent ex-post investigator AAIB (civil)
Policy advice
Operators’ internal safety management processes
Accident & incident investigation
Recommendations
© Matthias Finger
FOCA: implemen- tation of
legislation (LFG 1948)
Steering viaownership
EFUG
Transportservices
?
26 Journal of Air Transportation
Figure 3. Evolution of the Swiss air transport sector
© Matthias Finger FOCA = Swiss Federal Office of Civil Aviation; SR = Swissair; LX = Croissair; EZY = Easyjet; GVA = Geneva
Public policy theory distinguishes between (a) public policy objectives,
(b) the implementation of such public policy by the government in collaboration with its administration, (c) the outputs of this administration (e.g., administrative decisions, subsidies, etc.), (d) the impacts of these outputs on the relevant operators with the aim of changing their behavior, and (e) the policy outcomes. Ideally, the policy outcomes should correspond to the policy objectives, all intermediate steps being a simple means for achieving such public policy objectives. Ideally, therefore, there exists an overall safety policy—or an air transport policy of which safety is an integral part—whose outcome precisely would be safe air transport.
Regulation is therefore an instrument of the public policy implementation process. Regulators (e.g., the competition regulator or a sector regulator) are one among several actors contributing to the implementation of any given public policy objective. All actors of course interact and thus constitute an institutional arrangement, by which a public policy is being implemented.
In liberal political systems, regulation pertains primarily to economic efficiency, meaning that the main regulatory activity is competition regulation. In the network industries however—of which the air transport sector is entirely part—regulation pertains yet to other, additional functions. Let us mention here, in particular, the function of attributing the scarce resource, that is, in our case the slots and the routes.
SR
Before: Promotion of Swiss air transport
Safety = internalized in Swissair
FOCA Industry
After: regulation of AT sector
LX, EZY Skyguide Unique, GVA, etc.
Safety policy enforced by a Regulator (=BAZL)
emergence of Crossair “privatization” of Swisscontrol accidents bankruptcy of SR EU pressure
Finger and Piers 27
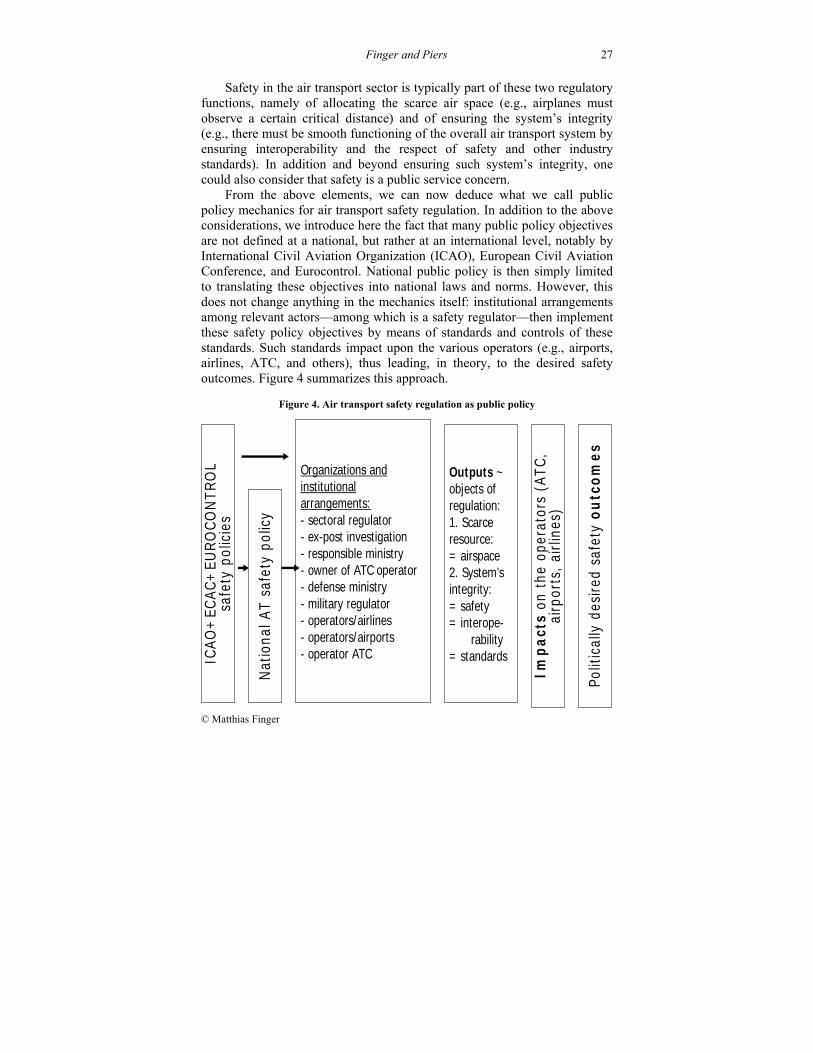
Safety in the air transport sector is typically part of these two regulatory
functions, namely of allocating the scarce air space (e.g., airplanes must observe a certain critical distance) and of ensuring the system’s integrity (e.g., there must be smooth functioning of the overall air transport system by ensuring interoperability and the respect of safety and other industry standards). In addition and beyond ensuring such system’s integrity, one could also consider that safety is a public service concern.
From the above elements, we can now deduce what we call public policy mechanics for air transport safety regulation. In addition to the above considerations, we introduce here the fact that many public policy objectives are not defined at a national, but rather at an international level, notably by International Civil Aviation Organization (ICAO), European Civil Aviation Conference, and Eurocontrol. National public policy is then simply limited to translating these objectives into national laws and norms. However, this does not change anything in the mechanics itself: institutional arrangements among relevant actors—among which is a safety regulator—then implement these safety policy objectives by means of standards and controls of these standards. Such standards impact upon the various operators (e.g., airports, airlines, ATC, and others), thus leading, in theory, to the desired safety outcomes. Figure 4 summarizes this approach.
Figure 4. Air transport safety regulation as public policy
© Matthias Finger
ICAO
+EC
AC+
EURO
CON
TRO
Lsa
fety
pol
icie
s
Nat
iona
l AT
safe
ty p
olic
y
Organizations andinstitutionalarrangements:- sectoral regulator- ex-post investigation- responsible ministry- owner of ATC operator- defense ministry- military regulator- operators/airlines - operators/airports- operator ATC
Outputs ~ objects of regulation:1. Scarce resource:= airspace2. System’sintegrity:= safety= interope-
rability= standards
Polit
ical
ly d
esire
d sa
fety
out
com
es
Impa
cts
on t
he o
pera
tors
(AT
C,ai
rpor
ts, a
irlin
es)
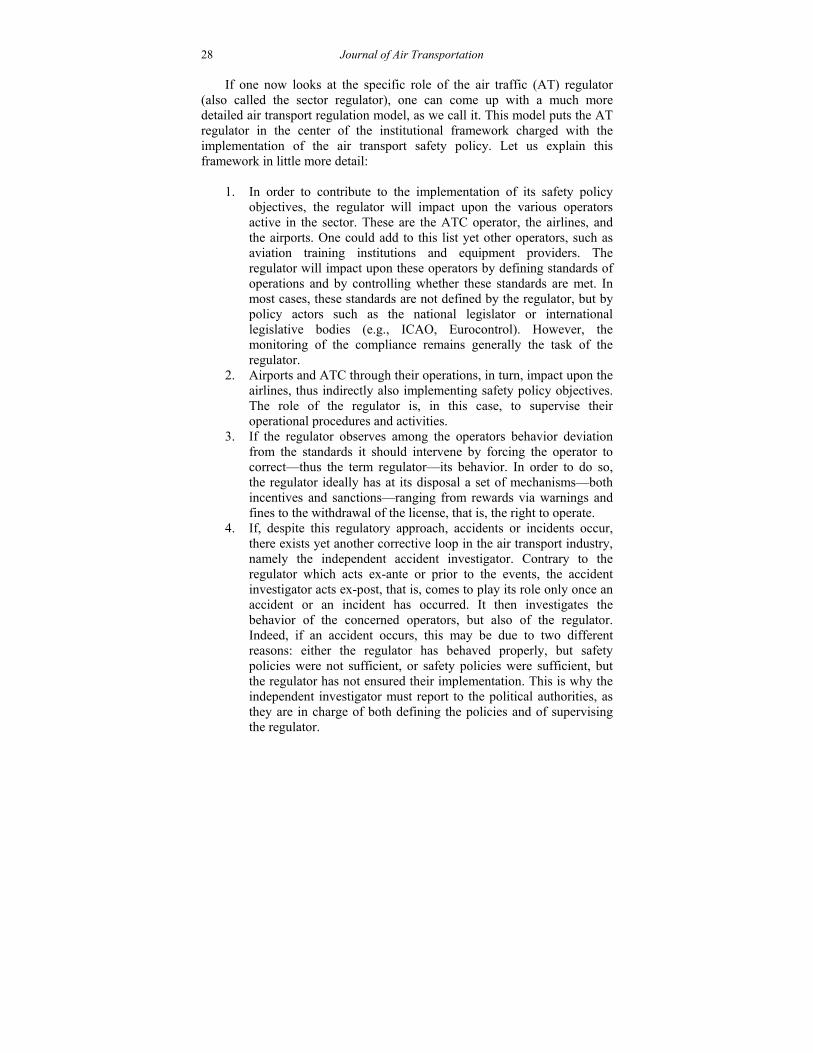
28 Journal of Air Transportation If one now looks at the specific role of the air traffic (AT) regulator
(also called the sector regulator), one can come up with a much more detailed air transport regulation model, as we call it. This model puts the AT regulator in the center of the institutional framework charged with the implementation of the air transport safety policy. Let us explain this framework in little more detail:
1. In order to contribute to the implementation of its safety policy objectives, the regulator will impact upon the various operators active in the sector. These are the ATC operator, the airlines, and the airports. One could add to this list yet other operators, such as aviation training institutions and equipment providers. The regulator will impact upon these operators by defining standards of operations and by controlling whether these standards are met. In most cases, these standards are not defined by the regulator, but by policy actors such as the national legislator or international legislative bodies (e.g., ICAO, Eurocontrol). However, the monitoring of the compliance remains generally the task of the regulator.
2. Airports and ATC through their operations, in turn, impact upon the airlines, thus indirectly also implementing safety policy objectives. The role of the regulator is, in this case, to supervise their operational procedures and activities.
3. If the regulator observes among the operators behavior deviation from the standards it should intervene by forcing the operator to correct—thus the term regulator—its behavior. In order to do so, the regulator ideally has at its disposal a set of mechanisms—both incentives and sanctions—ranging from rewards via warnings and fines to the withdrawal of the license, that is, the right to operate.
4. If, despite this regulatory approach, accidents or incidents occur, there exists yet another corrective loop in the air transport industry, namely the independent accident investigator. Contrary to the regulator which acts ex-ante or prior to the events, the accident investigator acts ex-post, that is, comes to play its role only once an accident or an incident has occurred. It then investigates the behavior of the concerned operators, but also of the regulator. Indeed, if an accident occurs, this may be due to two different reasons: either the regulator has behaved properly, but safety policies were not sufficient, or safety policies were sufficient, but the regulator has not ensured their implementation. This is why the independent investigator must report to the political authorities, as they are in charge of both defining the policies and of supervising the regulator.
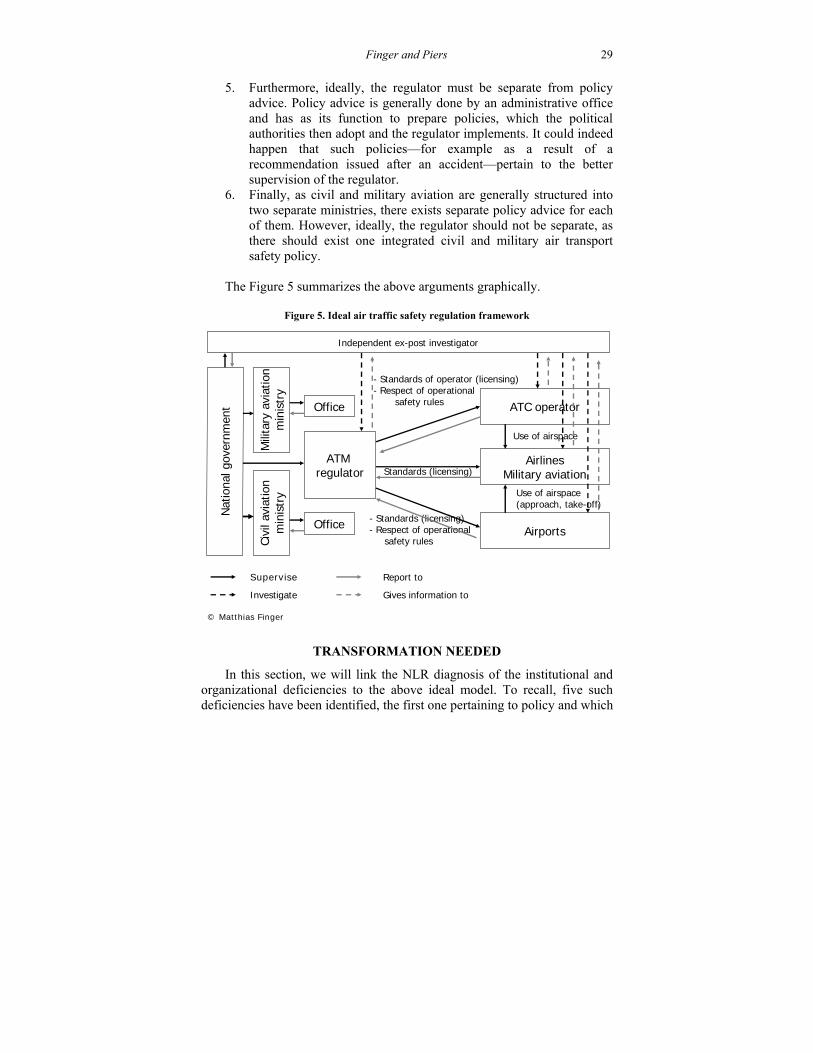
Finger and Piers 29
5. Furthermore, ideally, the regulator must be separate from policy
advice. Policy advice is generally done by an administrative office and has as its function to prepare policies, which the political authorities then adopt and the regulator implements. It could indeed happen that such policies—for example as a result of a recommendation issued after an accident—pertain to the better supervision of the regulator.
6. Finally, as civil and military aviation are generally structured into two separate ministries, there exists separate policy advice for each of them. However, ideally, the regulator should not be separate, as there should exist one integrated civil and military air transport safety policy.
The Figure 5 summarizes the above arguments graphically.
Figure 5. Ideal air traffic safety regulation framework
TRANSFORMATION NEEDED
In this section, we will link the NLR diagnosis of the institutional and organizational deficiencies to the above ideal model. To recall, five such deficiencies have been identified, the first one pertaining to policy and which
ATC operator
AirlinesMilitary aviation
Airports
ATM regulator
Civi
l avi
ati o
nm
inis
t ry
Mili
tar y
av i
atio
nm
inis
t ry
Nat
iona
l gov
ernm
ent
Use of airspace
Use of airspace(approach, take-off)
- Standards (licensing)- Respect of operational
safety rules
Standards (licensing)
- Standards of operator (licensing)- Respect of operational
safety rules
Independent ex-post investigator
Office
Office
Investigate
Report to
Gives information to
© Matthias Finger
Supervise
30 Journal of Air Transportation
has been discussed in the previous section, three pertaining to institutional relations and one pertaining to the organization of FOCA.
Institutional Relations As for institutional relations, the following three deficiencies had been
identified by the NLR report. We will recall them here and outline the remedies, which were then reflected in NLR’s recommendations.
1. Let us mention here first the dysfunctional reporting structure and process, whereby the AAIB reports exclusively to FOCA, rather than to the Ministry. Subsequently, the so-made recommendations did not legally oblige the concerned actor to take the AAIB recommendation into consideration. Quite logically, and in line with the above ideal institutional framework, NLR recommended to change the Ordinance on accident investigation so that the AAIB formally reports to the Minister of Transport instead of to FOCA, and that a legal obligation rests upon the actor addressed in an AAIB recommendation to take the recommendation into consideration and to report back to the Minister of Transport.
2. Let us mention second the absence of a clear supervision of FOCA by the Ministry and corresponding responsibility. To recall, FOCA was neither properly instructed, nor controlled by the Ministry. Quite logically then the NLR again recommended to establish a position within the Ministry of Transport to monitor the performance of FOCA, to act on behalf of the Swiss government in aviation policy matters, and to act as the delegated accountable manager of the Minister with regard to the implementation of the recommendations of the AAIB.
3. Let us finally mention the existence of a federal accident investigation commission on top of the AAIB, which significantly delayed the recommendations made by the AAIB and diluted the responsibilities. Here, NLR simply recommended to discontinue the recourse process.
Organizational Dimension As for the organizational dimension, let us recall the main deficiency
identified by the NLR report, namely the absence of a clear separation or a clear identification of safety related issues and corresponding responsibilities within FOCA. Indeed, one could expect that it is important for an organization like FOCA, which has safety as the primary objective, that the organization somehow reflects that. This is, however, not the case, as safety was not identified anywhere in the organization chart. Safety was considered everybody's job and not the responsibility of a particular individual. Basically, the act of regulation was and perhaps still is considered a form of
Finger and Piers 31
safety management since the purpose of regulation is to ensure safety. This approach is, however, a reflection of the old way of achieving safety through administrative compliance. Today's high levels of safety in the very complex and rapidly growing aviation industry cannot be sustained unless a proper safety management approach is adopted. The associated changes in processes should also be reflected in changes in the organizations of the government agency overseeing aviation (i.e., FOCA). While there is merit in making every employee aware of his or her personal responsibility for the safety aspects for the job, the effectiveness of such statements is limited unless it is administered in an organization where safety is the product and top-level management is accountable for that.
FOCA is currently charged with both the promotion of aviation and safety. However, as long as these objectives remain subject to an implicit consideration at the level of the director of FOCA, the manager who is solely accountable for safety cannot be identified in the organization. Indeed, the total integration of these duties, as is currently the case in FOCA, presents serious risks in combination with the lack of a clear safety policy, accountability and culture. The integration means that the considerations and trade-offs around safety and economy are now made at the level of the individual employee. NLR therefore recommended a substantial organizational transformation process by which FOCA should develop separate units for Safety Regulation and Aviation. It could be admissible that both units report to an overall director of FOCA, but each of these two units should have their own director.
From an international perspective, this organizational structure of FOCA is also rather unique (see Briand & Kelvin, 1998). Indeed, the organization charts of most other regulators reflect the primary regulatory tasks. In the UK, for example, the Safety Regulation Group and the Economic Regulation Group, each with own director, together form the Civil Aviation Authority (CAA). The flow of information between these two group is tightly controlled and regulated. In the Netherlands, the safety regulator and the policy group have been physically separated into different units reporting to different Directors General of the Ministry of Transport. While this provides a clear separation between safety regulation and policy, it has disadvantages too, mainly with regard to the application of domain knowledge in policy development. The Australian authority also underwent significant change in the area of safety regulation in the mid-1990s in response to the perceived need to clearly separate Safety Regulation from the other tasks of the Aviation Authority (Civil Aviation Safety Authority, 2001). The Australian Authority was at that time under strong pressure to become a smaller and more efficient government agency and at the same time a number of fatal accidents occurred in which the role of the safety regulator was implicated in the causal factors of the accidents. As a consequence, the resources of the
32 Journal of Air Transportation
Australina Authority were slashed by 50% over a five year period, and the safety regulation activities, which were initially already a Division of the CAA, went through considerable change. Safety Regulation staff were reduced from 736 in the beginning of 1991 to 490 by the end of 1992. CAA management rejected a recommendation from one of a range of investigations and inquiries to the effect of setting up a separate Safety Regulation Directorate within the CAA. Public scrutiny however led to the demand upon the CAA to formally confirm that safety has primacy in CAA’s work and the establishment of a Directorate of Aviation Safety Regulation. A further fatal accident in which the oversight of the CAA was implicated prompted the government to take further action and led to the decision to establish a separate Aviation Safety Agency within the CAA. Another accident led to the removal of the director of the Safety Regulation Division and the decision to set up a new and separate Aviation Safety Agency, and to considerably increase funding for safety regulation. This agency became today’s Civil Aviation Safety Authority (CASA).
CONCLUSION
This article did not have as an objective to assess the institutional and organizational transformation process of Swiss aviation safety regulation. Rather, its aim was to present and argue for the conceptual framework underpinning the recommendations that were made by the NLR report in institutional and organizational terms. We think that this conceptual framework is a solid one and that it is furthermore confirmed by examples of other countries.
REFERENCES
BFU. (2003). Statistics concerning accidents and serious incidents involving Swiss-registered aircraft in Switzerland and abroad and foreign-registered aircraft in Switzerland. Available at www.bfu.admin.ch.
Briand, S. & Kelvin, A. (1998). Assessment of the regulatory reform in the
European airlines. International Journal of Transport Economics, 25(1), 3-17.
Civil Aviation Safety Authority. (2001). Review of regulatory reform
program. Australia. NLR. (2003). Aviation safety management in Switzerland. Recovering from
the myth of perfection. Amsterdam: National Aerospace Laboratory.
Journal of Air Transportation Vol. 10, No. 2 - 2005
© 2005, Aviation Institute, University of Nebraska at Omaha
AN ESTIMATION OF AIRCRAFT EMISSIONS AT
TURKISH AIRPORTS
Uğur Kesgin Yildiz Technical University
Istanbul, Turkey
ABSTRACT
We present the first estimates for aircraft landing and take-off (LTO) emissions at 40 Turkish airports in 2001, including the biggest airports: Ataturk International Airport in Istanbul (AIA), Antalya Airport in Antalya and Esenboga Airport in Ankara. The calculation model is based on flight data recorded by the State Airports Authority. The flight data include the type and number of aircraft, number of passengers, and cargo volume by date and time. For the emission calculations, we used the International Civil Aviation Organization (ICAO) Engine Exhaust Emissions Data Bank, which includes minimum and maximum values for both fuel flow rates and emissions factors. Total LTO emissions at Turkish airports are estimated to be between 7614 and 8338 tons per year. These results are comparable with U.S. airports on the average. Approximately half of the LTO emissions are, however, produced at the AIA. To predict future emissions, we estimated that an increase of 25% in LTO cycles might cause a rise of between 31% and 33% in emissions. The estimations show that a decrease of 2 minutes in taxiing time results in a decrease of 6% in LTO emissions. The model developed in this study was shown to perform well for airport environmental planning and expansion in the Turkish case.
INTRODUCTION
The exhaust emissions from an aircraft are carbon dioxide (CO2), water vapour (H2O), nitrogen oxides (NOX), various sulphur oxides (SOX), carbon monoxide (CO), various non-methane (NM) hydrocarbons (HC), and other gases and particles. Aircraft engines produce such emissions in a sensitive area of the atmosphere within and above the troposphere. Emissions from aircrafts are important from an environmental point of view. Not only because of environmental aspects but also for health reasons, it becomes increasingly important to know the types and amounts of emissions from aircrafts. Near airports, for example, the produced SOX and NOX may _____________________________________________________________________________ Ugur Kesgin is an Associate Professor at Yildiz Technical University in Istanbul, Turkey. He completed his BSc and MSc degrees in marine engineering studies at Yildiz University and received his PhD degree from the Institute for Internal Combustion Engines and Thermodynamics at the Technical University Graz, Austria. The author thanks the State Airports Authority in Istanbul for their help in obtaining the statistics and other official documentation.
34 Journal of Air Transportation
contribute to smog, while CO is toxic and some HC and soot are suspected of being carcinogenic (Doeppelheuer, 2000). Smog and ozone formation in the vicinity of airports were the main environmental concern in the seventies and early eighties. Consequently, the emissions of unburned hydrocarbons (UHC) of aircraft engines were regulated. Emissions of NOX were also controlled by similar standards (Westerberg, 2000).
Aircraft engines have two quite different requirements. The first is for very high combustion efficiency at low power, because of the large amounts of fuel burned during taxiing and ground manoeuvring. The primary problem here is the reduction of UHC. The main concern of the second requirement mentioned above is NOX at take-off power, climb and cruise. ICAO sets standards on a worldwide basis, for both landing and take-off (LTO) cycles and also for cruise at high altitude; the first is concerned with air quality in the vicinity of airports and the second with ozone depletion in the upper atmosphere. It has been shown that for a modern twin-engine transport operating over an 800 kilometre range, approximately 25% of the emissions is produced during the LTO cycle, with the remainder during climb, cruise and descent; approximately 86% of the total emissions is NOX
(Saravanamuttoo, Rogers & Cohen, 2001). At present, exhaust emissions from aircrafts are small compared to
anthropogenic surface emissions. Nearly 6% of all petrol products are burned as aviation fuel. Relative to the total anthropogenic emissions of CO2, aviation contributes about 2.6%. With respect to NOX the contributions from aviation is about 3% of all anthropogenic sources. Nevertheless, the unique location of aircraft emissions in the upper atmosphere and the predicted growth of air traffic require that particular attention is given to the effects of these emissions (Schumann, 2000).
Aircraft emissions are likely to have their greatest effect upon the atmosphere and climate when discharged near the junction of the troposphere and stratosphere. Research related to the atmospheric effects of aircraft emissions has become increasingly important and several experimental studies have been performed on contamination of the atmosphere by emissions from aircraft engines in cruise flight conditions, to establish and improve models of the physical and chemical processes which take place in the aircraft wake and in the general zone of air traffic corridors (Dedesh, Leut & Boris, 2001; Kjellström, Feichter, Sausen & Hein, 1999; Lee, Dilosquer, Singh & Rycoft, 1996; Schumann et al., 1998).
There are several studies to estimate the aircraft emissions at airports. In a study of airport-related emissions in the U.S., airports are estimated with a projection to the year 2010 (EPA, 1999). Perl, Patterson and Perez (1997) estimate the cost of air pollution from aviation at Lyon-Satolas airport for the years 1987, 1990 and 2015 by linking environmental assessment techniques that yield an emission inventory for aircraft operations with economic cost
Kesgin 35
evaluations of air pollution from ground based sources in Lyon. Stefanou and Haralambopoulos (1998) used an inventory calculation system for air traffic to determine annual fuel consumption and emissions. They used airline data on routes, hours of flights, density of traffic, fleet mix, and ratings of engine manufacturers for an airline company in Greece. They calculated annual environmental loads and showed that significant amounts of pollutants are received in areas around airports. In a previous study based on data from the State Airport Authority (DHMI) environmental effects of aircraft engine exhaust gases around Ataturk International Airport was studied by Sen (1997).
Studies estimating present and future aircraft emissions have been performed recently. Dameris et al. (1998) present a global three-dimensional dynamic-chemical model to estimate present and future subsonic and supersonic aircraft NOX emissions on ozone. Grooss, Bruehl and Peter (1998) performed a study investigating the impact of air-traffic-induced NOX
and H20 emissions on the chemical composition of the global troposphere and stratosphere for 1991 and a future scenario for 2015. Kalivoda and Kudrna (1997) present a study on the future development of air traffic and the expected changes and improvements in specific fuel consumption and air pollutant emissions for 2010 and 2020. Vedantham and Oppenheimer (1998) give long term scenarios for aviation through to the year 2100.
This paper deals with estimating aircraft LTO emissions at 40 Turkish airports in 2001 including the biggest airports: AIA in Istanbul, Antalya Airport in Antalya and Esenboga Airport in Ankara. The calculation model is based on flight data recorded by State Airports Authority. The flight data includes type and number of aircraft, number of passengers, and amount of cargo by day, time of day and date as recorded by the State Airport Authority (DHMI, 2002). For the emission calculations the ICAO Engine Exhaust Emissions Data Bank is used. Additionally, the effect of taxiing time on the aircraft emissions is estimated. Finally, the future aircraft emissions are estimated using peak day emissions at the AIA.
CALCULATING AIRCRAFT EMISSIONS
Aircraft emissions at airports are calculated for the LTO cycle consisting of four operation modes: approach, taxi, take-off and climb. A typical LTO cycle described by ICAO is shown in Figure 1 (Penner, Lister, Griggs, Dokken & McFarland, 1999). ICAO defines the climbing as the interval between the end of take-off and the moment the plane exits the atmospheric boundary layer (ABL). ICAO’s norms therefore take air traffic emissions into account from the surface to the top of the ABL, whose height is defined to be 915 meters (3000 feet) by default.
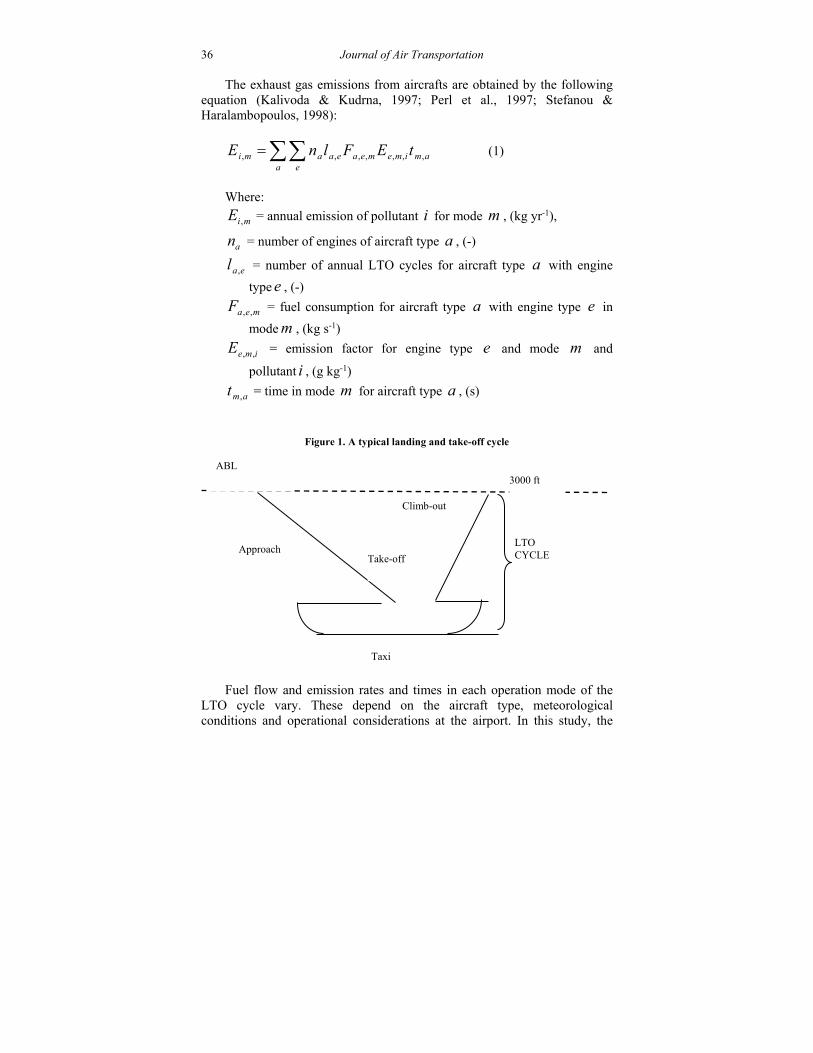
36 Journal of Air Transportation The exhaust gas emissions from aircrafts are obtained by the following
equation (Kalivoda & Kudrna, 1997; Perl et al., 1997; Stefanou & Haralambopoulos, 1998):
amimemeaeaa e
ami tEFlnE ,,,,,,, (1)
Where:
miE , = annual emission of pollutant i for mode m , (kg yr-1),
an = number of engines of aircraft type a , (-)
eal , = number of annual LTO cycles for aircraft type a with engine
type e , (-)
meaF ,, = fuel consumption for aircraft type a with engine type e in
mode m , (kg s-1)
imeE ,, = emission factor for engine type e and mode m and
pollutant i , (g kg-1)
amt , = time in mode m for aircraft type a , (s)
Figure 1. A typical landing and take-off cycle
Fuel flow and emission rates and times in each operation mode of the
LTO cycle vary. These depend on the aircraft type, meteorological conditions and operational considerations at the airport. In this study, the
Climb-out
3000 ft
LTO CYCLE Take-off
Taxi
Approach
ABL
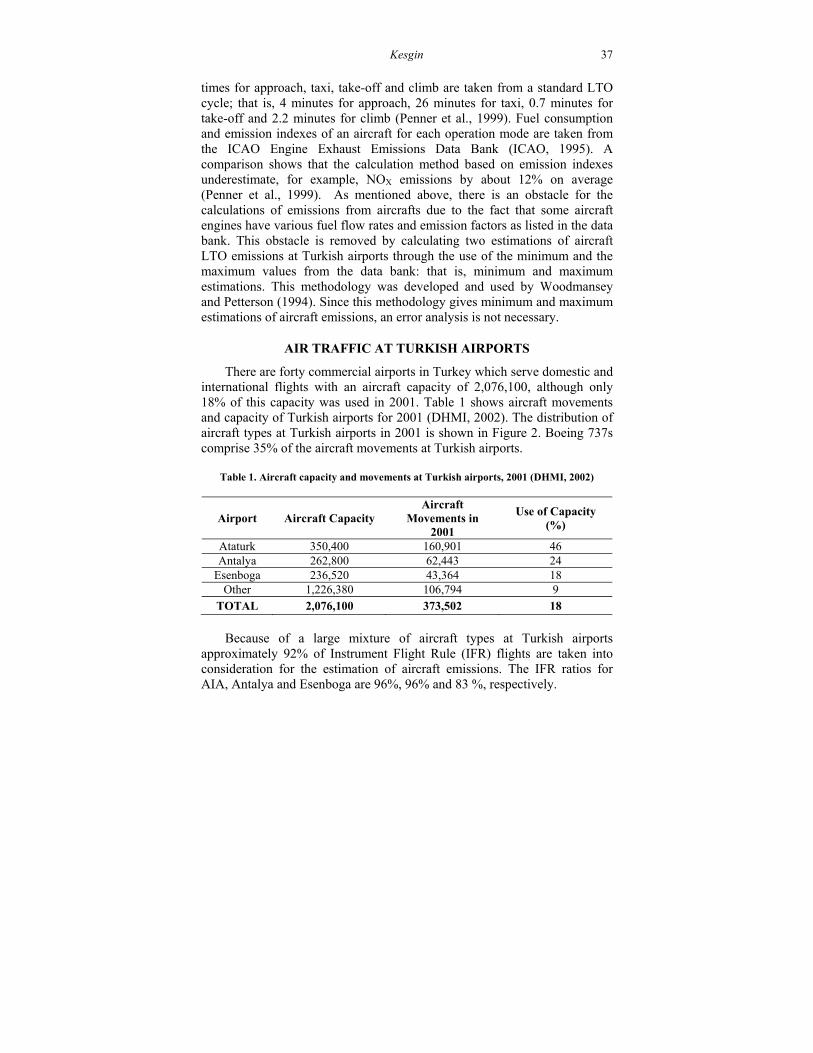
Kesgin 37
times for approach, taxi, take-off and climb are taken from a standard LTO cycle; that is, 4 minutes for approach, 26 minutes for taxi, 0.7 minutes for take-off and 2.2 minutes for climb (Penner et al., 1999). Fuel consumption and emission indexes of an aircraft for each operation mode are taken from the ICAO Engine Exhaust Emissions Data Bank (ICAO, 1995). A comparison shows that the calculation method based on emission indexes underestimate, for example, NOX emissions by about 12% on average (Penner et al., 1999). As mentioned above, there is an obstacle for the calculations of emissions from aircrafts due to the fact that some aircraft engines have various fuel flow rates and emission factors as listed in the data bank. This obstacle is removed by calculating two estimations of aircraft LTO emissions at Turkish airports through the use of the minimum and the maximum values from the data bank: that is, minimum and maximum estimations. This methodology was developed and used by Woodmansey and Petterson (1994). Since this methodology gives minimum and maximum estimations of aircraft emissions, an error analysis is not necessary.
AIR TRAFFIC AT TURKISH AIRPORTS
There are forty commercial airports in Turkey which serve domestic and international flights with an aircraft capacity of 2,076,100, although only 18% of this capacity was used in 2001. Table 1 shows aircraft movements and capacity of Turkish airports for 2001 (DHMI, 2002). The distribution of aircraft types at Turkish airports in 2001 is shown in Figure 2. Boeing 737s comprise 35% of the aircraft movements at Turkish airports.
Table 1. Aircraft capacity and movements at Turkish airports, 2001 (DHMI, 2002)
Airport Aircraft Capacity Aircraft
Movements in 2001
Use of Capacity (%)
Ataturk 350,400 160,901 46 Antalya 262,800 62,443 24
Esenboga 236,520 43,364 18 Other 1,226,380 106,794 9
TOTAL 2,076,100 373,502 18
Because of a large mixture of aircraft types at Turkish airports
approximately 92% of Instrument Flight Rule (IFR) flights are taken into consideration for the estimation of aircraft emissions. The IFR ratios for AIA, Antalya and Esenboga are 96%, 96% and 83 %, respectively.
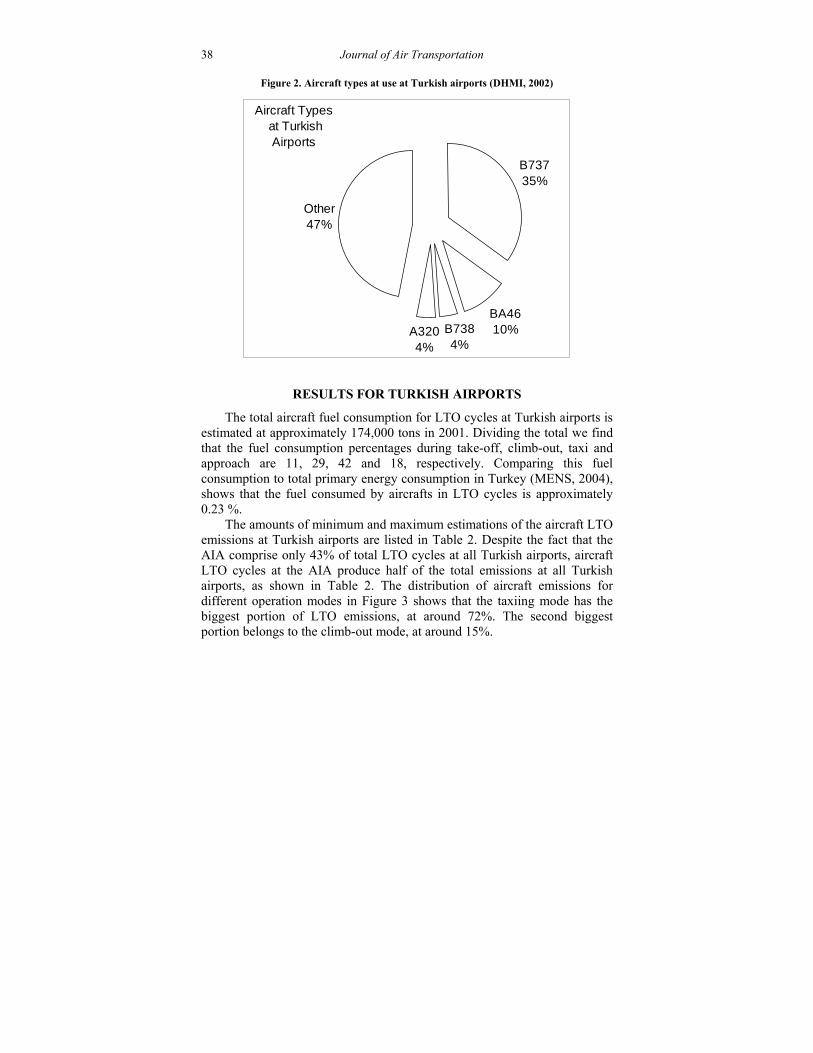
38 Journal of Air Transportation
Figure 2. Aircraft types at use at Turkish airports (DHMI, 2002)
Aircraft Types at Turkish Airports
B73735%
BA4610%B738
4%A3204%
Other47%
RESULTS FOR TURKISH AIRPORTS
The total aircraft fuel consumption for LTO cycles at Turkish airports is estimated at approximately 174,000 tons in 2001. Dividing the total we find that the fuel consumption percentages during take-off, climb-out, taxi and approach are 11, 29, 42 and 18, respectively. Comparing this fuel consumption to total primary energy consumption in Turkey (MENS, 2004), shows that the fuel consumed by aircrafts in LTO cycles is approximately 0.23 %.
The amounts of minimum and maximum estimations of the aircraft LTO emissions at Turkish airports are listed in Table 2. Despite the fact that the AIA comprise only 43% of total LTO cycles at all Turkish airports, aircraft LTO cycles at the AIA produce half of the total emissions at all Turkish airports, as shown in Table 2. The distribution of aircraft emissions for different operation modes in Figure 3 shows that the taxiing mode has the biggest portion of LTO emissions, at around 72%. The second biggest portion belongs to the climb-out mode, at around 15%.
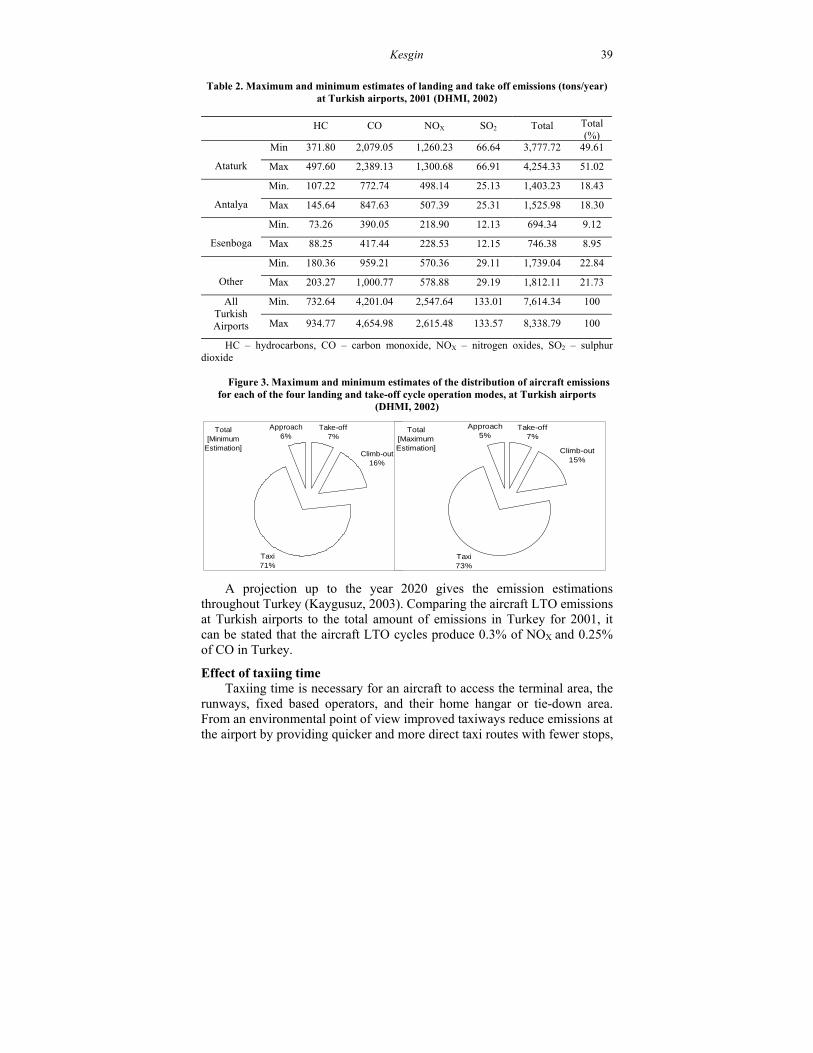
Kesgin 39
Table 2. Maximum and minimum estimates of landing and take off emissions (tons/year)
at Turkish airports, 2001 (DHMI, 2002)
HC CO NOX SO2 Total Total (%)
Ataturk
Min 371.80 2,079.05 1,260.23 66.64 3,777.72 49.61
Max 497.60 2,389.13 1,300.68 66.91 4,254.33 51.02
Antalya
Min. 107.22 772.74 498.14 25.13 1,403.23 18.43
Max 145.64 847.63 507.39 25.31 1,525.98 18.30
Esenboga
Min. 73.26 390.05 218.90 12.13 694.34 9.12
Max 88.25 417.44 228.53 12.15 746.38 8.95
Other
Min. 180.36 959.21 570.36 29.11 1,739.04 22.84
Max 203.27 1,000.77 578.88 29.19 1,812.11 21.73
All Turkish Airports
Min. 732.64 4,201.04 2,547.64 133.01 7,614.34 100
Max 934.77 4,654.98 2,615.48 133.57 8,338.79 100
HC – hydrocarbons, CO – carbon monoxide, NOX – nitrogen oxides, SO2 – sulphur dioxide
Figure 3. Maximum and minimum estimates of the distribution of aircraft emissions for each of the four landing and take-off cycle operation modes, at Turkish airports
(DHMI, 2002)
A projection up to the year 2020 gives the emission estimations throughout Turkey (Kaygusuz, 2003). Comparing the aircraft LTO emissions at Turkish airports to the total amount of emissions in Turkey for 2001, it can be stated that the aircraft LTO cycles produce 0.3% of NOX and 0.25% of CO in Turkey.
Effect of taxiing time Taxiing time is necessary for an aircraft to access the terminal area, the
runways, fixed based operators, and their home hangar or tie-down area. From an environmental point of view improved taxiways reduce emissions at the airport by providing quicker and more direct taxi routes with fewer stops,
Total[Minimum
Estimation]
Take-off7%
Climb-out16%
Taxi71%
Approach6%
Total[MaximumEstimation]
Take-off7%
Climb-out15%
Taxi73%
Approach5%
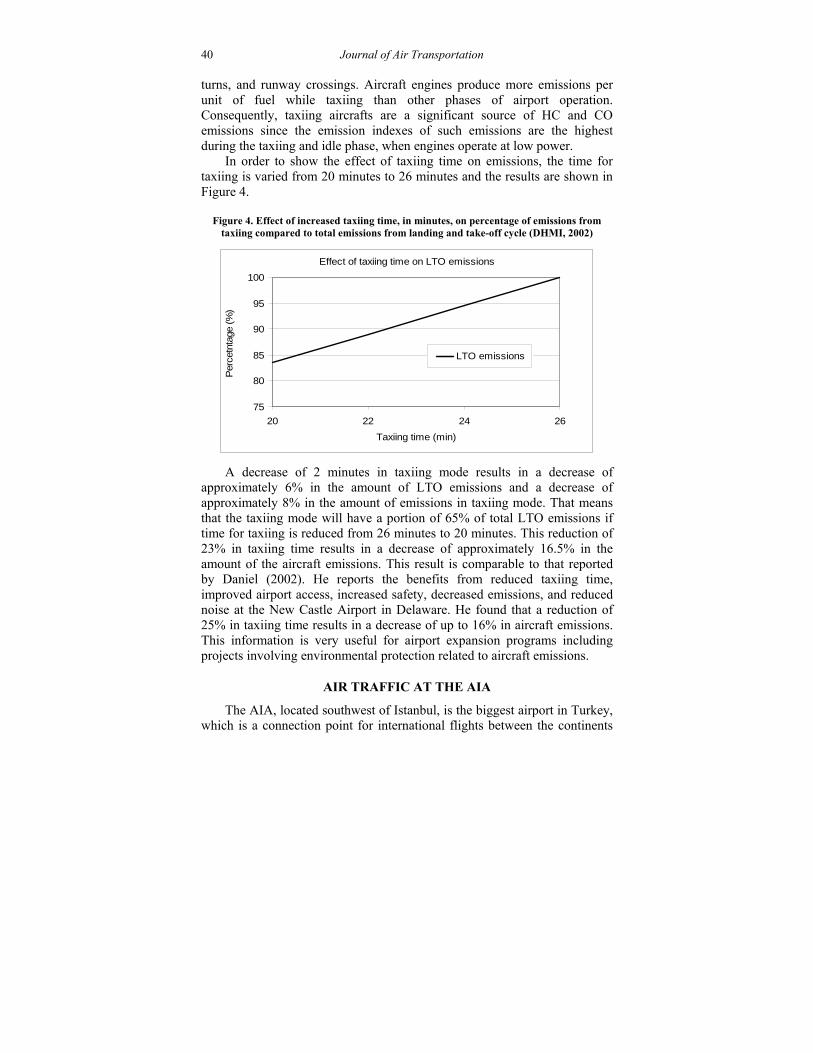
40 Journal of Air Transportation
turns, and runway crossings. Aircraft engines produce more emissions per unit of fuel while taxiing than other phases of airport operation. Consequently, taxiing aircrafts are a significant source of HC and CO emissions since the emission indexes of such emissions are the highest during the taxiing and idle phase, when engines operate at low power.
In order to show the effect of taxiing time on emissions, the time for taxiing is varied from 20 minutes to 26 minutes and the results are shown in Figure 4.
Figure 4. Effect of increased taxiing time, in minutes, on percentage of emissions from
taxiing compared to total emissions from landing and take-off cycle (DHMI, 2002)
Effect of taxiing time on LTO emissions
75
80
85
90
95
100
20 22 24 26
Taxiing time (min)
Per
cetn
tage
(%
)
LTO emissions
A decrease of 2 minutes in taxiing mode results in a decrease of
approximately 6% in the amount of LTO emissions and a decrease of approximately 8% in the amount of emissions in taxiing mode. That means that the taxiing mode will have a portion of 65% of total LTO emissions if time for taxiing is reduced from 26 minutes to 20 minutes. This reduction of 23% in taxiing time results in a decrease of approximately 16.5% in the amount of the aircraft emissions. This result is comparable to that reported by Daniel (2002). He reports the benefits from reduced taxiing time, improved airport access, increased safety, decreased emissions, and reduced noise at the New Castle Airport in Delaware. He found that a reduction of 25% in taxiing time results in a decrease of up to 16% in aircraft emissions. This information is very useful for airport expansion programs including projects involving environmental protection related to aircraft emissions.
AIR TRAFFIC AT THE AIA
The AIA, located southwest of Istanbul, is the biggest airport in Turkey, which is a connection point for international flights between the continents
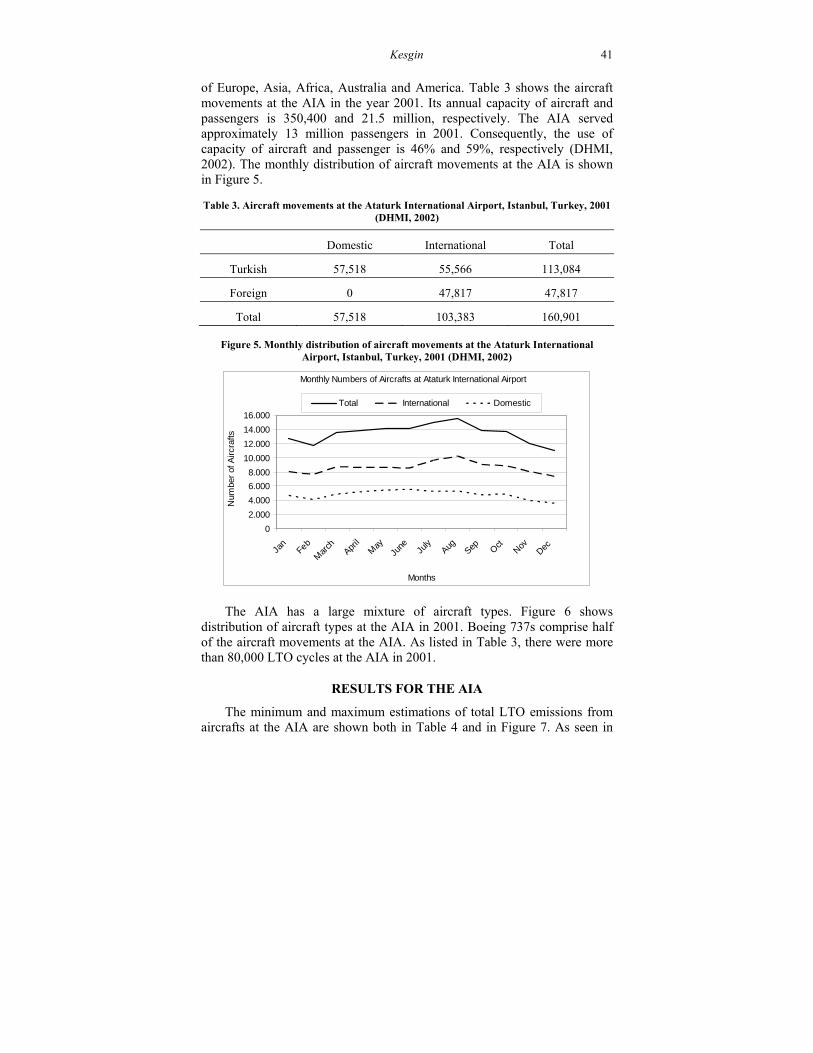
Kesgin 41
of Europe, Asia, Africa, Australia and America. Table 3 shows the aircraft movements at the AIA in the year 2001. Its annual capacity of aircraft and passengers is 350,400 and 21.5 million, respectively. The AIA served approximately 13 million passengers in 2001. Consequently, the use of capacity of aircraft and passenger is 46% and 59%, respectively (DHMI, 2002). The monthly distribution of aircraft movements at the AIA is shown in Figure 5. Table 3. Aircraft movements at the Ataturk International Airport, Istanbul, Turkey, 2001
(DHMI, 2002)
Domestic International Total
Turkish 57,518 55,566 113,084
Foreign 0 47,817 47,817
Total 57,518 103,383 160,901
Figure 5. Monthly distribution of aircraft movements at the Ataturk International Airport, Istanbul, Turkey, 2001 (DHMI, 2002)
Monthly Numbers of Aircrafts at Ataturk International Airport
0
2.000
4.000
6.000
8.000
10.000
12.000
14.000
16.000
Jan
Feb
Mar
chApr
ilM
ayJu
ne July
Aug Sep Oct
NovDec
Months
Num
ber
of A
ircra
fts
Total International Domestic
The AIA has a large mixture of aircraft types. Figure 6 shows
distribution of aircraft types at the AIA in 2001. Boeing 737s comprise half of the aircraft movements at the AIA. As listed in Table 3, there were more than 80,000 LTO cycles at the AIA in 2001.
RESULTS FOR THE AIA
The minimum and maximum estimations of total LTO emissions from aircrafts at the AIA are shown both in Table 4 and in Figure 7. As seen in
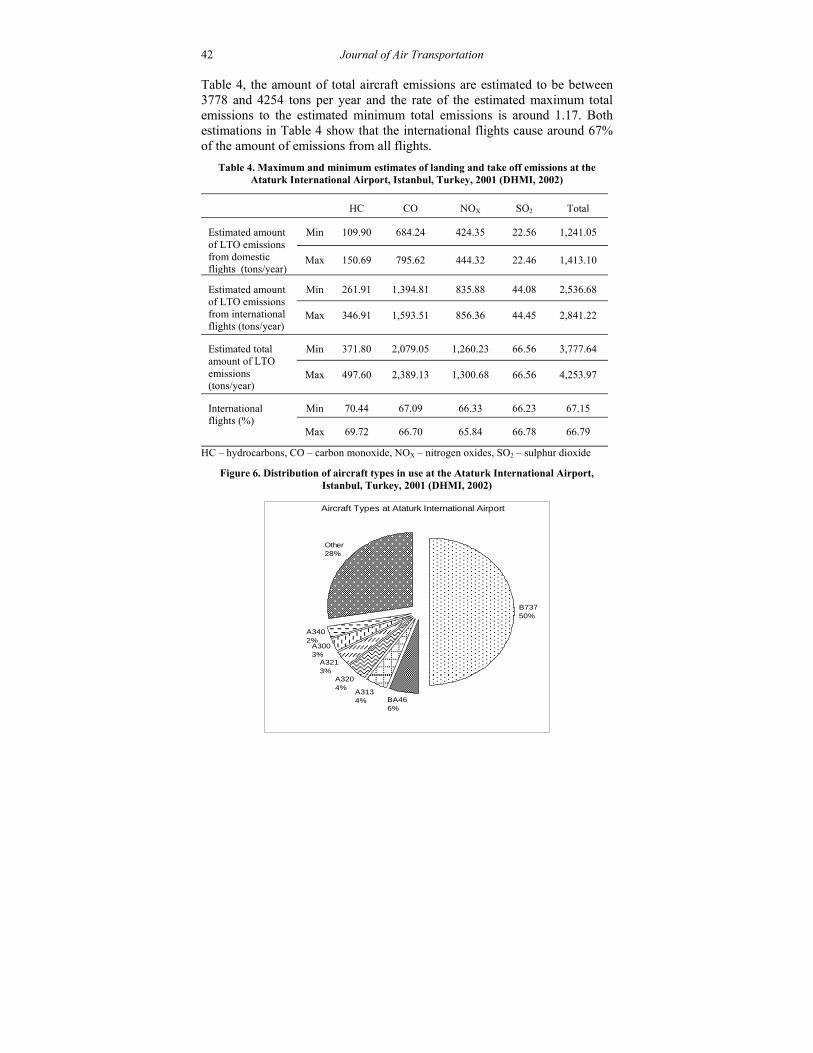
42 Journal of Air Transportation
Table 4, the amount of total aircraft emissions are estimated to be between 3778 and 4254 tons per year and the rate of the estimated maximum total emissions to the estimated minimum total emissions is around 1.17. Both estimations in Table 4 show that the international flights cause around 67% of the amount of emissions from all flights.
Table 4. Maximum and minimum estimates of landing and take off emissions at the Ataturk International Airport, Istanbul, Turkey, 2001 (DHMI, 2002)
HC CO NOX SO2 Total
Estimated amount of LTO emissions from domestic flights (tons/year)
Min 109.90 684.24 424.35 22.56 1,241.05
Max 150.69 795.62 444.32 22.46 1,413.10
Estimated amount of LTO emissions from international flights (tons/year)
Min 261.91 1,394.81 835.88 44.08 2,536.68
Max 346.91 1,593.51 856.36 44.45 2,841.22
Estimated total amount of LTO emissions (tons/year)
Min 371.80 2,079.05 1,260.23 66.56 3,777.64
Max 497.60 2,389.13 1,300.68 66.56 4,253.97
International flights (%)
Min 70.44 67.09 66.33 66.23 67.15
Max 69.72 66.70 65.84 66.78 66.79
HC – hydrocarbons, CO – carbon monoxide, NOX – nitrogen oxides, SO2 – sulphur dioxide
Figure 6. Distribution of aircraft types in use at the Ataturk International Airport, Istanbul, Turkey, 2001 (DHMI, 2002)
Aircraft Types at Ataturk International Airport
B73750%
BA466%
A3134%
A3204%
A3213%
A3003%
A3402%
Other28%
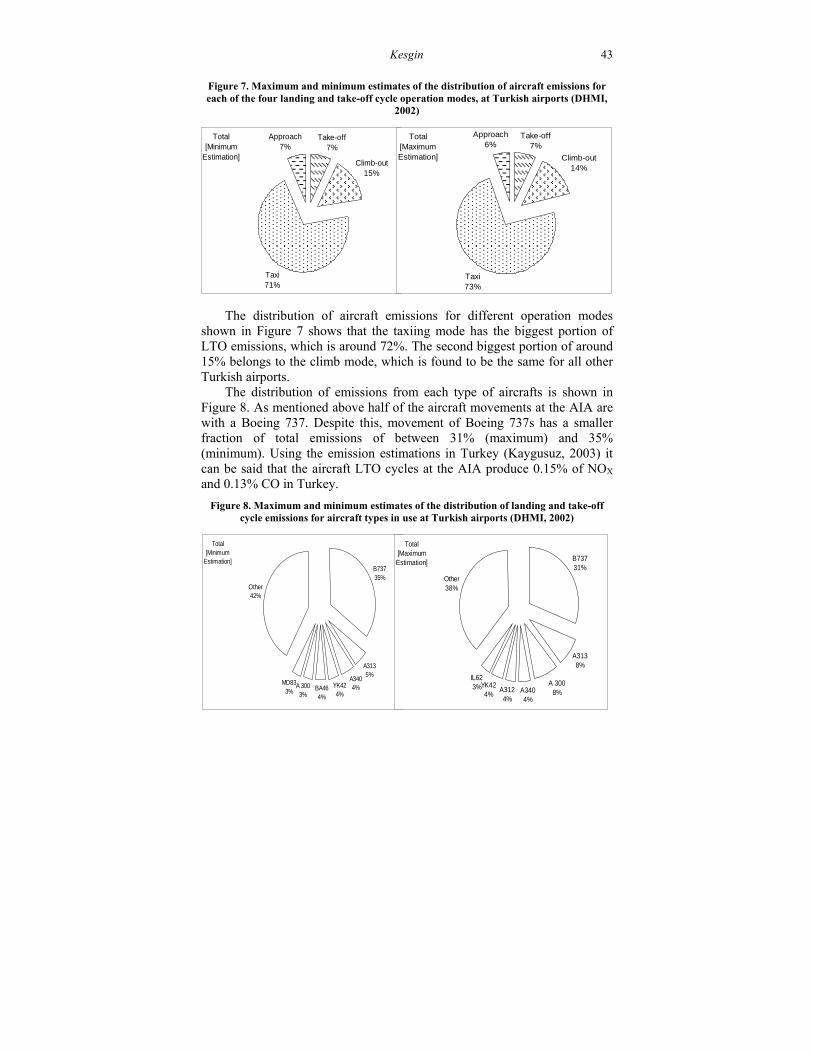
Kesgin 43
Figure 7. Maximum and minimum estimates of the distribution of aircraft emissions for each of the four landing and take-off cycle operation modes, at Turkish airports (DHMI,
2002)
The distribution of aircraft emissions for different operation modes shown in Figure 7 shows that the taxiing mode has the biggest portion of LTO emissions, which is around 72%. The second biggest portion of around 15% belongs to the climb mode, which is found to be the same for all other Turkish airports.
The distribution of emissions from each type of aircrafts is shown in Figure 8. As mentioned above half of the aircraft movements at the AIA are with a Boeing 737. Despite this, movement of Boeing 737s has a smaller fraction of total emissions of between 31% (maximum) and 35% (minimum). Using the emission estimations in Turkey (Kaygusuz, 2003) it can be said that the aircraft LTO cycles at the AIA produce 0.15% of NOX and 0.13% CO in Turkey.
Figure 8. Maximum and minimum estimates of the distribution of landing and take-off cycle emissions for aircraft types in use at Turkish airports (DHMI, 2002)
Total[Minimum
Estimation]
Take-off7%
Climb-out15%
Taxi71%
Approach7%
Total[MaximumEstimation]
Take-off7%
Climb-out14%
Taxi73%
Approach6%
Total[Minimum
Estimation]B73735%
A3135%
A3404%YK42
4%BA464%
A 3003%
MD833%
Other42%
Total[MaximumEstimation]
B73731%
A3138%
A 3008%A340
4%A3124%
YK424%
IL623%
Other38%
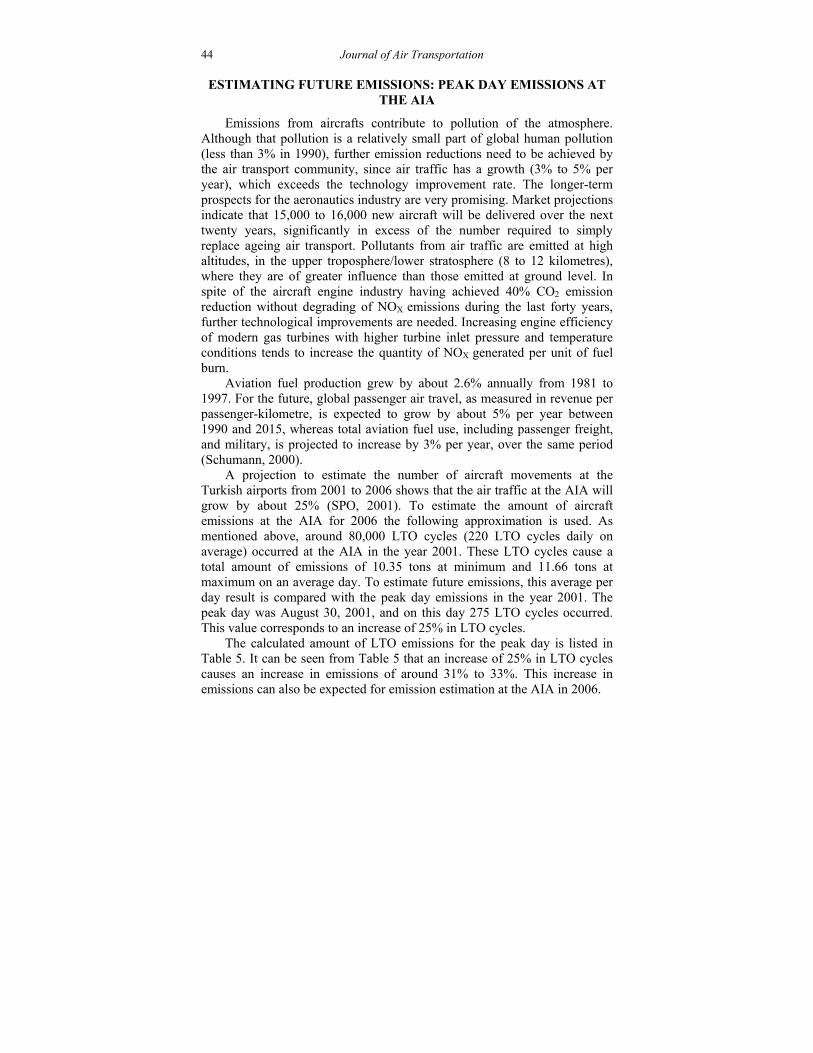
44 Journal of Air Transportation
ESTIMATING FUTURE EMISSIONS: PEAK DAY EMISSIONS AT THE AIA
Emissions from aircrafts contribute to pollution of the atmosphere. Although that pollution is a relatively small part of global human pollution (less than 3% in 1990), further emission reductions need to be achieved by the air transport community, since air traffic has a growth (3% to 5% per year), which exceeds the technology improvement rate. The longer-term prospects for the aeronautics industry are very promising. Market projections indicate that 15,000 to 16,000 new aircraft will be delivered over the next twenty years, significantly in excess of the number required to simply replace ageing air transport. Pollutants from air traffic are emitted at high altitudes, in the upper troposphere/lower stratosphere (8 to 12 kilometres), where they are of greater influence than those emitted at ground level. In spite of the aircraft engine industry having achieved 40% CO2 emission reduction without degrading of NOX emissions during the last forty years, further technological improvements are needed. Increasing engine efficiency of modern gas turbines with higher turbine inlet pressure and temperature conditions tends to increase the quantity of NOX generated per unit of fuel burn.
Aviation fuel production grew by about 2.6% annually from 1981 to 1997. For the future, global passenger air travel, as measured in revenue per passenger-kilometre, is expected to grow by about 5% per year between 1990 and 2015, whereas total aviation fuel use, including passenger freight, and military, is projected to increase by 3% per year, over the same period (Schumann, 2000).
A projection to estimate the number of aircraft movements at the Turkish airports from 2001 to 2006 shows that the air traffic at the AIA will grow by about 25% (SPO, 2001). To estimate the amount of aircraft emissions at the AIA for 2006 the following approximation is used. As mentioned above, around 80,000 LTO cycles (220 LTO cycles daily on average) occurred at the AIA in the year 2001. These LTO cycles cause a total amount of emissions of 10.35 tons at minimum and 11.66 tons at maximum on an average day. To estimate future emissions, this average per day result is compared with the peak day emissions in the year 2001. The peak day was August 30, 2001, and on this day 275 LTO cycles occurred. This value corresponds to an increase of 25% in LTO cycles.
The calculated amount of LTO emissions for the peak day is listed in Table 5. It can be seen from Table 5 that an increase of 25% in LTO cycles causes an increase in emissions of around 31% to 33%. This increase in emissions can also be expected for emission estimation at the AIA in 2006.
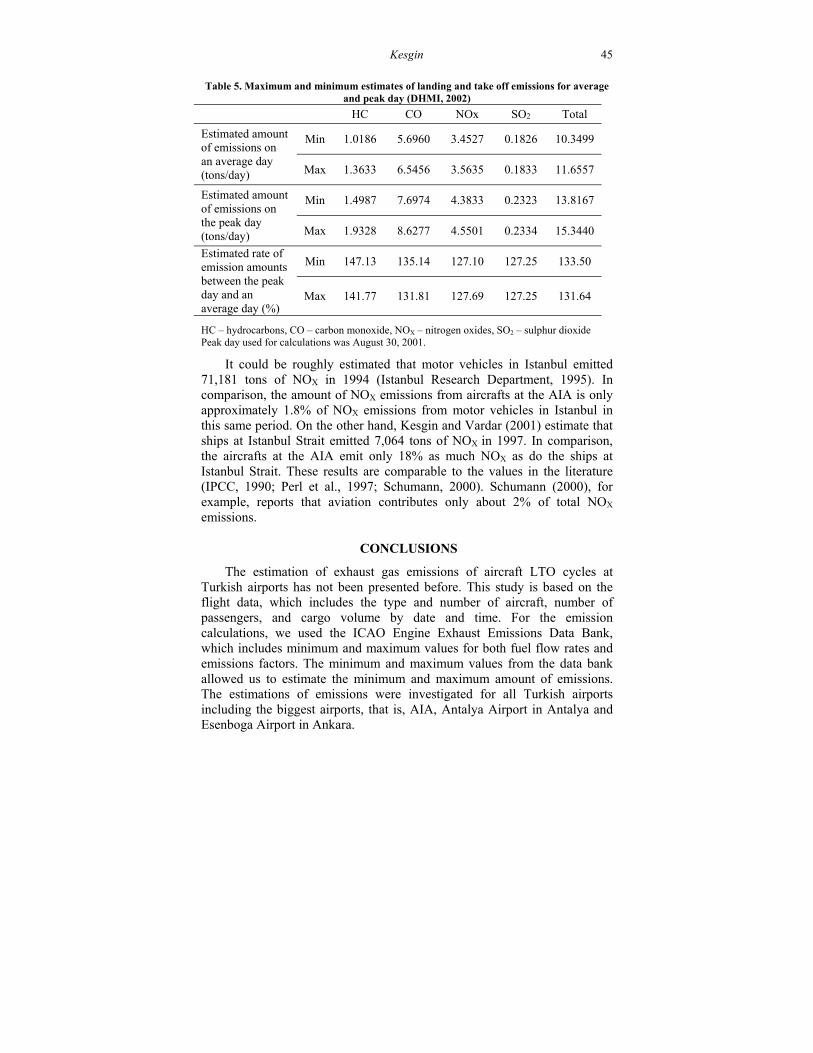
Kesgin 45
Table 5. Maximum and minimum estimates of landing and take off emissions for average
and peak day (DHMI, 2002)
HC CO NOx SO2 Total
Estimated amount of emissions on an average day (tons/day)
Min 1.0186 5.6960 3.4527 0.1826 10.3499
Max 1.3633 6.5456 3.5635 0.1833 11.6557
Estimated amount of emissions on the peak day (tons/day)
Min 1.4987 7.6974 4.3833 0.2323 13.8167
Max 1.9328 8.6277 4.5501 0.2334 15.3440
Estimated rate of emission amounts between the peak day and an average day (%)
Min 147.13 135.14 127.10 127.25 133.50
Max 141.77 131.81 127.69 127.25 131.64
HC – hydrocarbons, CO – carbon monoxide, NOX – nitrogen oxides, SO2 – sulphur dioxide Peak day used for calculations was August 30, 2001.
It could be roughly estimated that motor vehicles in Istanbul emitted 71,181 tons of NOX in 1994 (Istanbul Research Department, 1995). In comparison, the amount of NOX emissions from aircrafts at the AIA is only approximately 1.8% of NOX emissions from motor vehicles in Istanbul in this same period. On the other hand, Kesgin and Vardar (2001) estimate that ships at Istanbul Strait emitted 7,064 tons of NOX in 1997. In comparison, the aircrafts at the AIA emit only 18% as much NOX as do the ships at Istanbul Strait. These results are comparable to the values in the literature (IPCC, 1990; Perl et al., 1997; Schumann, 2000). Schumann (2000), for example, reports that aviation contributes only about 2% of total NOX emissions.
CONCLUSIONS
The estimation of exhaust gas emissions of aircraft LTO cycles at Turkish airports has not been presented before. This study is based on the flight data, which includes the type and number of aircraft, number of passengers, and cargo volume by date and time. For the emission calculations, we used the ICAO Engine Exhaust Emissions Data Bank, which includes minimum and maximum values for both fuel flow rates and emissions factors. The minimum and maximum values from the data bank allowed us to estimate the minimum and maximum amount of emissions. The estimations of emissions were investigated for all Turkish airports including the biggest airports, that is, AIA, Antalya Airport in Antalya and Esenboga Airport in Ankara.
46 Journal of Air Transportation As a result, we draw the following conclusions from this study: 1. Total LTO emissions from aircrafts at Turkish airports are
estimated to be between 7,614 and 8,338 tons per year. Approximately half of these amounts will be produced at the AIA.
2. Total aircraft LTO emissions at the AIA are estimated to be between 3,778 and 4,254 tons per year.
3. International flights at the AIA emit 67% of total LTO emissions from aircraft.
4. A decrease of 2 minutes in taxiing time results in a decrease of approximately 6% of LTO emissions.
5. It has been estimated that an increase of 25% in LTO cycles might cause 31 to 33% more emissions.
REFERENCES
Dameris, M., Grewe, V., Koehler, I., Sausen, R., Bruehl, C., Grooss, J. U., & Steil, B. (1998). Impact of aircraft emissions on tropospheric and stratospheric ozone. Part II: 3-D model results. Atmospheric Environment, 32(18), 3185-3199.
Daniel, J. I. (2002). Benefit-cost analysis of airport infrastructure: The case
of taxiways. Journal of Air Transport Management, 8, 149-164. Dedesh, V., Leut, A., & Boris, S. (2001). Aircraft emission research within
ISTC project. Air & Space Europe, 3(3-4), 244-246. DHMI (State Airports Authority). (2002). Istatistik Yilligi 2001 [Annual
Statistics for 2001]. Yesilkoy, Istanbul: Devlet Hava Meydanları Isletmesi Genel Mudurlugu.
Doeppelheuer, A. (2000). Aircraft Emission Parameter Modelling. Air &
Space Europe, 2(3), 34-37. EPA (Environmental Protection Agency). (1999). Evaluation of air pollutant
emissions from subsonic commercial jet aircraft: Final report. Report no. EPA A420-R-99-013. Ann Arbor, MI, USA: Engine Programs and Compliance Division, U.S. Environmental Protection Agency.
Grooss, J. U., Bruehl, C., & Peter, T. (1998). Impact of aircraft emissions on
tropospheric and stratospheric ozone. Part I: Chemistry and 2-D model results. Atmospheric Environment, 32(18), 3173-3184.
Kesgin 47
ICAO (1995). Engine exhaust emissions data bank. Document no. 9646-
AN/943. Montreal, CA. Instanbul Research Department. (1995). Cevre Raporu [Report of
Environment]. Istanbul: Municipality of Istanbul, Research Department.
IPCC. (1990). IPCC first assessment report. Vol. 3: WGIII Formulation of
response option strategies. Washington, D.C. Kalivoda, M. T. & Kudrna, M. (1997). Methodologies for estimating
emissions from air traffic: Future emissions. Report no. MEET Project ST-96-SC.204. Vienna, Austria: Perchtoldsdorf-Vienna.
Kaygusuz, K. (2003). Energy policy and climate change in Turkey. Energy
Conversion and Management, 44, 1671-1688. Kesgin, U. & Vardar, N. (2001). A study on exhaust gas emissions from
ships in Turkish Straits, Atmospheric Environment, 35, 1863-1870. Kjellström, E., Feichter, J., Sausen, R. & Hein, R. (1999). The contribution
of aircraft emissions to the atmospheric sulphur budget. Atmospheric Environment, 33, 3455-3465.
Lee, H., Dilosquer, M. L., Singh, R., & Rycoft, M. J. (1996). Further
considerations of engine emissions from subsonic aircraft at cruise altitude. Atmospheric Environment, 30(22), 3689-3695.
MENS (Ministry of Energy and Natural Sources). (2004). 1990-2001 Yillari
icin Birincil Enerji Tuketimi [Primary energy consumption for 1990-2001]. Ankara, Turkey. Available: http://www.enerji.gov.tr/birincilenerjituketimi.asp
Penner, J., Lister, D. H., Griggs, D. J., Dokken, D. J., & Farland, M.(1999).
Aviation and the global atmosphere: A special report of the intergovernmental panel on climate change. Cambridge: Cambridge University Press.
Perl, A., Patterson, J., & Perez, M. (1997). Pricing aircraft emissions at
Lyon-Satolas Airport. Transportation Research Part D, 2(2), 89-105.
48 Journal of Air Transportation
Saravanamuttoo, H. I. H., Rogers. G. F. C., & Cohen, H. (2001). Gas Turbine Theory. Harlow: Prentice Hall.
Schumann, U. (2000). Effects of aircraft emissions on ozone, cirrus clouds,
and environmental climate. Air & Space Europe, 2(3), 29-33. Schumann, U., Schlager, H., Arnold, F., Baumann, R., Haschberger, P., &
Klemm, O. (1998). Dilution of aircraft exhaust plumes at cruise altitudes. Atmospheric Environment, 32(18), 3097-3103.
Sen, O., (1997). The effect of aircraft engine exhaust gases on the
environment. Int. J. Environmental and Pollution, Vol. 8, No. ½, 148-157.
SPO (State Planning Organization). (2001). Ulaştırma Özel Ihtisas
Komisyonu Raporu, Hava Yolu Ulaştırması Alt Komisyon Raporu [Eight Five-Year Development Plan: Transportation special impression commission report, air transportation sub-commission report]. Report no. DPT:2585-OIK:596. Ankara, Turkey: Devlet Planlama Teşkilatı. Available: http://www.ekutup.dpt.gov.tr
Stefanou, P. & Haralambopoulos, D. (1998). Energy demand and
environmental pressures due to the operation of Olympic airways in Greece. Energy, 23(2), 125-136.
Vedantham, A. & Oppenheimer, M. (1998). Long-term scenarios for
aviation: Demand and emissions of CO2 and NOX. Energy Policy, 26(8), 625-641.
Westerberg, J. (2000). Air transport system sensibilities. Air & Space
Europe, 2(3), 38-40. Woodmansey, B. & Petterson, J. (1994). New methodology for modelling
annual aircraft emissions at airports. Transportation Engineering, 120, 339-357
Journal of Air Transportation Vol. 10, No. 2 - 2005
© 2005, Aviation Institute, University of Nebraska at Omaha
GUIDE TO THE IMPLEMENTATION OF ISO
14001 AT AIRPORTS
Vildan Korul Anadolu University Eskişehir, Turkey
ABSTRACT
Today, many companies are subject to environmental regulations. A growing awareness of the impact of activities on the environment has created a greater need to take into account environmental factors in air transport. For that reason, an increasing number of corporations around the world are certifying their environmental management systems (EMS) by the ISO 14000 series standards.
Improving the environmental performance of corporations is one way of limiting the environmental damage. EMS provide a framework for organizations that wish to effectively manage their environmental affairs. Implementing an EMS that conforms to the ISO 14001 standard may help businesses to integrate environmental values into their operations.
This paper is intended to provide guidance to airports for the development and implementation of an EMS and assistance in meeting the requirements of ISO 14001. We show that improving the environmental performance of airports through ISO 14001 can reduce the negative environmental effects. To achieve a more environmentally friendly business practice, airports must develop internal management processes that integrate environmental objectives into day-to-day operations.
INTRODUCTION
This study intends to stress the increasing worldwide awareness of the environmental impacts of air transportation. As a first step, a survey, questioning the goals and capabilities of environmental studies, was sent to international airports in Turkey. The results show that environmental issues at airports are not regarded as an important concern in Turkey. This paper intends to guide airports to prepare their own environmental management system (EMS) for the sustainability of aviation.
_____________________________________________________________________________ Vildan Korul has an MA degree in Management and Organization and a PhD degree in the Civil Aviation Management from Anadolu University, Turkey. Her research interests include airport management, airport efficiency and privatization, environmental management systems, and sustainable development at airports.
50 Journal of Air Transportation
ISO 14000
The adoption of EMS as frameworks for integrating corporate environmental protection policies, programs, and practices is growing among domestic and multinational companies around the world. Many multinational corporations have designed, certified, and implemented EMS under ISO 14001 because it provides a harmonized standard for managing a corporation’s environmental impacts. ISO 14001 is a set of guidelines by which a facility—a single plant or a whole organization—can establish or strengthen its environmental policy, identify environmental aspects of its operations, define environmental objectives and targets, implement a program to attain environmental performance goals, monitor and measure effectiveness, correct deficiencies problems and review its management systems to promote continuous improvement.
ISO 14000 embodies a new approach to environmental protection. It challenges each organization to take stock of its environmental aspects, establish its own objectives and targets, commit itself to effective, and reliable processes and continual improvement, and bring all employees and managers into a system of shared and enlightened awareness and personal responsibility for the environmental performance of the organization (Cascio, Woodside & Mitchell, 1996).
ISO 14001, the foundation of the entire ISO 14000 series, is a proactive environmental protection strategy in which regulatory compliance is one of the elements of a more inclusive and all-encompassing approach. ISO 14001, the EMS standard, provides a framework to direct the use of organizational resources to full breadth of actual and potential environmental impacts through reliable management processes and a base of educated and committed employees.
The globalization of environmental problems and rise of sustainable development has focused attention on environmental degradation outward from the developed to the developing regions of the world. These two issues have also contributed to the increased pace of adopting ISO 1000 and systematic EMS policies (Mohamed, 2001).
The ISO 14000 standards are voluntary standards created by the International Organization for Standardization (ISO). ISO has over 100 member countries represented mainly by industry and government standards groups (SAIC, 2003). ISO got its start just after World War II and is a non-governmental, international organization based in Geneva.
The term iso is a Greek word meaning equal. The term is well suited for the organization, since its main focus is to provide standardization on an international level. ISO focuses almost exclusively on product and safety standards. These technical standards have a great value over the years and have enhanced international commerce, product uniformity, and
Korul 51
interconnectivity. All the standards that ISO develop are voluntary. Since ISO is non-governmental, it has no authority to impose its standards on any country or organization (Cascio et al., 1996).
During the 1980s, ISO embarked on a task to standardize one aspect of organizational management—quality management. This was the first time that ISO had ventured to create standards that were not essentially technically based and/or scientifically based. Technical Committee 176 was given the challenge to develop these quality management standards. The ISO 9000 series were completed in 1987. These standards have been adopted and recognized worldwide as adding value to organizations’ quality management programs. During the same period, ozone depletion, global warming, deforestation, and other environmental issues were being viewed as global problems. Additional factors beyond the success of its ISO 9000 standards came into play in ISO’s decision to develop environmental management standards.
In 1991, the United Nations (UN) announced its Conference on Environment and Development (UNCED), commonly known as the Earth Summit, to be held in June 1992 in Rio de Janeiro. Conference representatives asked ISO to participate and make a commitment at the UNCED to create international environmental standards. In mid-1991, on the basis of this request, ISO formed an advisory group named the Strategic Advisory Group on the Environment (SAGE) (Cascio et al., 1996).
ISO 14000 is a set of international standards for improving the environmental performance of organizations. It includes the new standard for EMS called ISO 14001. This standard was published in 1996, so it is new on the international scene. Some countries and companies are quickly embracing it, while others are waiting to see if it becomes a requirement for doing international business and if there are benefits to adopting it (Haklik, 2003).
ISO 14000 can be divided into two separate areas. The first deals with organizations’ management and evaluation systems; and the second with environmental tools for product evaluation. In the former; Environmental Management System-ISO 14001, Environmental Auditing-ISO 14010, and Environmental Performance Evaluation-ISO 14031 are the standards used for organization evaluation; whereas, in the latter; Environmental Aspects in Product Standards-ISO 14060, Environmental Labeling-ISO 14020, and Life Cycle Assessment-ISO 14040 which correspond to the product evaluation (Cascio et al., 1996).
ISO 14000 standard series can be considered as a double-edged tool providing tangible and intangible benefits to the government/regulatory agencies—such as the Environmental Protection Agency—and the organizations themselves. The standard aim of ISO 14000 is to assist ISO
52 Journal of Air Transportation
itself and organizations in procuring objectives such as the following (Zutshi and Sohal, 2002):
1. Reduce waste, resource depletion and environmental pollution; 2. Design products for minimizing environmental impact in product
use and disposal; 3. Control environmental impact of raw material sourcing and new
product development; 4. Promote environmental awareness among employees and within the
community; 5. Provide a platform for companies to demonstrate their commitment
to environmental protection; 6. Help management pursue continual improvement in environmental
performance; 7. Provide a worldwide focus on environmental management; 8. Harmonize national environmental rules, labels, and methods; 9. Demonstrate a commitment to moving beyond regulatory
compliance; and 10. Improve global environmental management and promote
sustainable development through trade and minimize environmental trade barriers.
ISO 14001
Environmental management in the context of ISO 14000 means what an organization does to minimize harmful effects on the environment caused by its activities. It is a stated objective of the ISO to support the objective of sustainable development that emerged from the UNCED (Ball, 2002). The first of the ISO 14000 series of standards—ISO 14001—was issued in September 1996 (Bansal & Bogner, 2002) and is a voluntary international standard that establishes the requirements for an EMS. The objective is for an organization to establish an EMS that is integrated with its core business. An EMS is a comprehensive process to identify, prioritize, and manage an organization’s environmental aspects and impacts. A successful EMS improves environmental protection, reduces total costs of environmental management, and improves productivity (SAIC, 2003). On November 15th, the ISO published ISO 14001:2004. ISO 14001:2004 EMS specifications with guidance for use outlines requirements for an EMS that controls the impact of an organization’s activities. This replaces the current version, ISO 14001:1996, which will expire on May 15, 2006, allowing organizations18 months to complete the transition. (TUVAMERICA, 2005)
Some firms are using ISO 14000 guidelines to develop new EMS, or to adopt their environmental practices to the international standard, without
Korul 53
formally certifying them. Other corporations, government agencies and environmental interest groups are skeptical about the real impacts of ISO 14000 certification and either ignore the guidelines or question their effectiveness in improving environmental performance. But increasing number of corporations are, through external registrars, formally certifying their EMS based on ISO 14000 standards or the European Eco-Management and Audit Scheme (Rondinelli & Vastag, 2000).
An EMS dictates requirements for the organization’s structure, responsibilities, practices, procedures, processes and resources, so that responsible corporate environmental management is institutionalized in the organization. Currently, there are several certifiable EMS, including a British standard (BS7750) and European standard (Eco-Management and Audit Scheme-EMAS).
ISO 140001 has the widest geographical and industry coverage of any EMS certification system. Generally speaking, the wider the application of the standard, the more flexible and the less stringent its requirements are. For example, EMAS requires that the environmental policy programs be made public; whereas, ISO 14001 only requires disclosure of the firm’s environmental policy (Bansal & Bogner, 2002).
In brief, ISO 14001 and EMAS have different aims. ISO 14001 provides guidelines to be implemented by almost any type of organization in any country and it was designed primarily to improve management. EMAS on the other hand, is designed to bring about changes in environmental performance (Morrow & Rondinelli, 2002).
ISO 14001 does not set performance standards. Instead, ISO 14001 focuses on management processes rather than specific environmental outcomes. If the firm meets the management system requirements dictated by the standard then it can register its conformance with a third party (Bansal & Bogner, 2002).
To crystallize the concept of an EMS, the following lists summarize several different definitions that have been used to describe them. An EMS is (Yarnell, 1999):
1. An organizational rather than a technical approach to environmental
management; 2. A complement to government regulations; 3. Part of the larger management system of an organization; and 4. Formally structured and rigorous.
EMSs are concerned with:
1. The environmental management of individual organizations; and 2. An ongoing attempt to consistently achieve high standards of
environmental performance and to improve upon them.
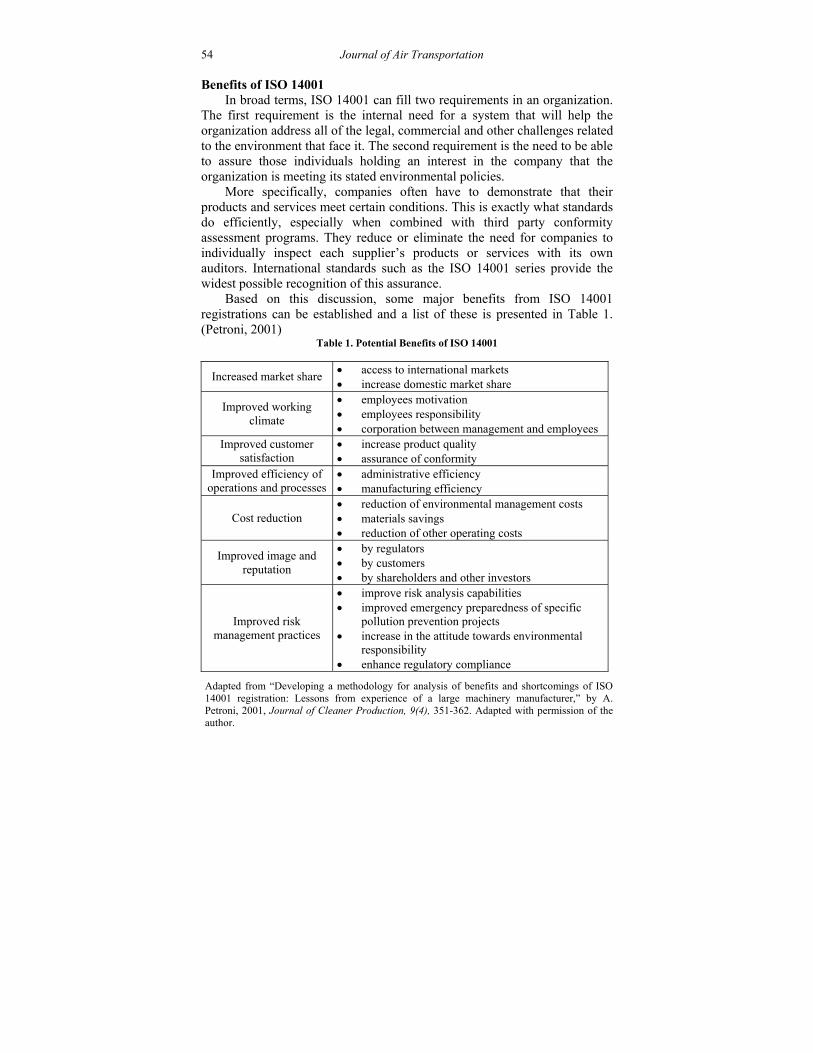
54 Journal of Air Transportation
Benefits of ISO 14001 In broad terms, ISO 14001 can fill two requirements in an organization.
The first requirement is the internal need for a system that will help the organization address all of the legal, commercial and other challenges related to the environment that face it. The second requirement is the need to be able to assure those individuals holding an interest in the company that the organization is meeting its stated environmental policies.
More specifically, companies often have to demonstrate that their products and services meet certain conditions. This is exactly what standards do efficiently, especially when combined with third party conformity assessment programs. They reduce or eliminate the need for companies to individually inspect each supplier’s products or services with its own auditors. International standards such as the ISO 14001 series provide the widest possible recognition of this assurance.
Based on this discussion, some major benefits from ISO 14001 registrations can be established and a list of these is presented in Table 1. (Petroni, 2001)
Table 1. Potential Benefits of ISO 14001
Increased market share access to international markets increase domestic market share
Improved working climate
employees motivation employees responsibility corporation between management and employees
Improved customer satisfaction
increase product quality assurance of conformity
Improved efficiency of operations and processes
administrative efficiency manufacturing efficiency
Cost reduction reduction of environmental management costs materials savings reduction of other operating costs
Improved image and reputation
by regulators by customers by shareholders and other investors
Improved risk management practices
improve risk analysis capabilities improved emergency preparedness of specific
pollution prevention projects increase in the attitude towards environmental
responsibility enhance regulatory compliance
Adapted from “Developing a methodology for analysis of benefits and shortcomings of ISO 14001 registration: Lessons from experience of a large machinery manufacturer,” by A. Petroni, 2001, Journal of Cleaner Production, 9(4), 351-362. Adapted with permission of the author.
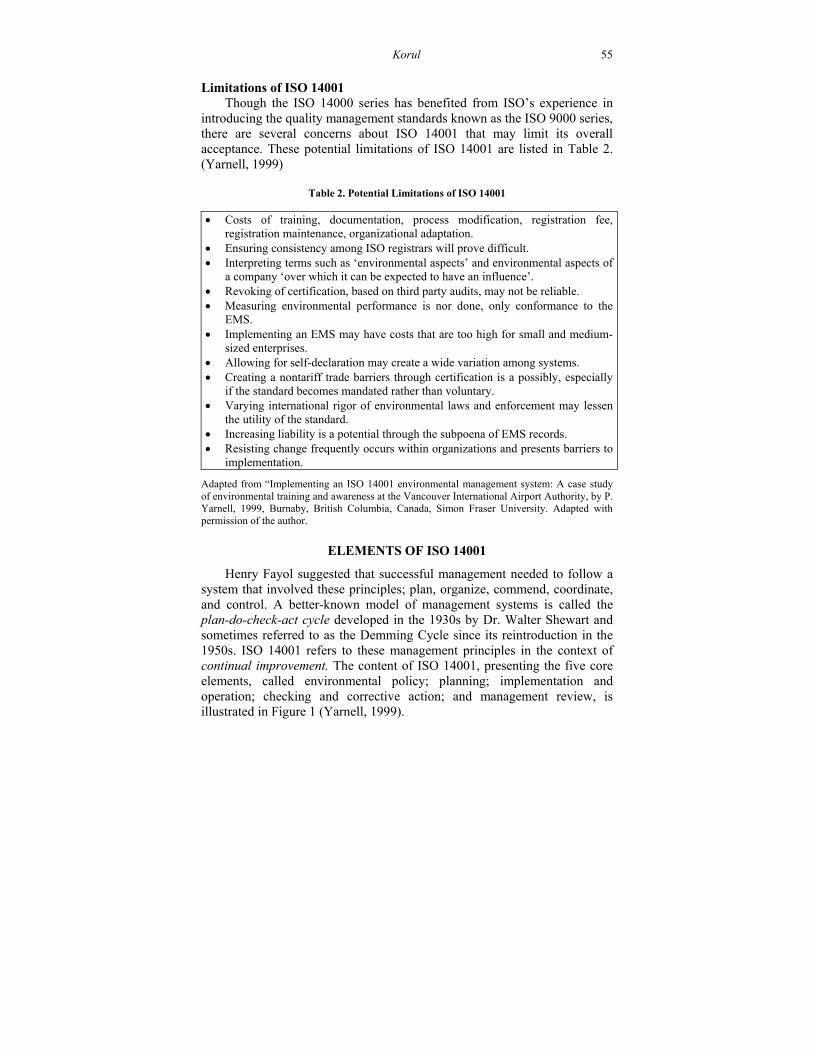
Korul 55
Limitations of ISO 14001
Though the ISO 14000 series has benefited from ISO’s experience in introducing the quality management standards known as the ISO 9000 series, there are several concerns about ISO 14001 that may limit its overall acceptance. These potential limitations of ISO 14001 are listed in Table 2. (Yarnell, 1999)
Table 2. Potential Limitations of ISO 14001
Costs of training, documentation, process modification, registration fee, registration maintenance, organizational adaptation.
Ensuring consistency among ISO registrars will prove difficult. Interpreting terms such as ‘environmental aspects’ and environmental aspects of
a company ‘over which it can be expected to have an influence’. Revoking of certification, based on third party audits, may not be reliable. Measuring environmental performance is nor done, only conformance to the
EMS. Implementing an EMS may have costs that are too high for small and medium-
sized enterprises. Allowing for self-declaration may create a wide variation among systems. Creating a nontariff trade barriers through certification is a possibly, especially
if the standard becomes mandated rather than voluntary. Varying international rigor of environmental laws and enforcement may lessen
the utility of the standard. Increasing liability is a potential through the subpoena of EMS records. Resisting change frequently occurs within organizations and presents barriers to
implementation.
Adapted from “Implementing an ISO 14001 environmental management system: A case study of environmental training and awareness at the Vancouver International Airport Authority, by P. Yarnell, 1999, Burnaby, British Columbia, Canada, Simon Fraser University. Adapted with permission of the author.
ELEMENTS OF ISO 14001
Henry Fayol suggested that successful management needed to follow a system that involved these principles; plan, organize, commend, coordinate, and control. A better-known model of management systems is called the plan-do-check-act cycle developed in the 1930s by Dr. Walter Shewart and sometimes referred to as the Demming Cycle since its reintroduction in the 1950s. ISO 14001 refers to these management principles in the context of continual improvement. The content of ISO 14001, presenting the five core elements, called environmental policy; planning; implementation and operation; checking and corrective action; and management review, is illustrated in Figure 1 (Yarnell, 1999).
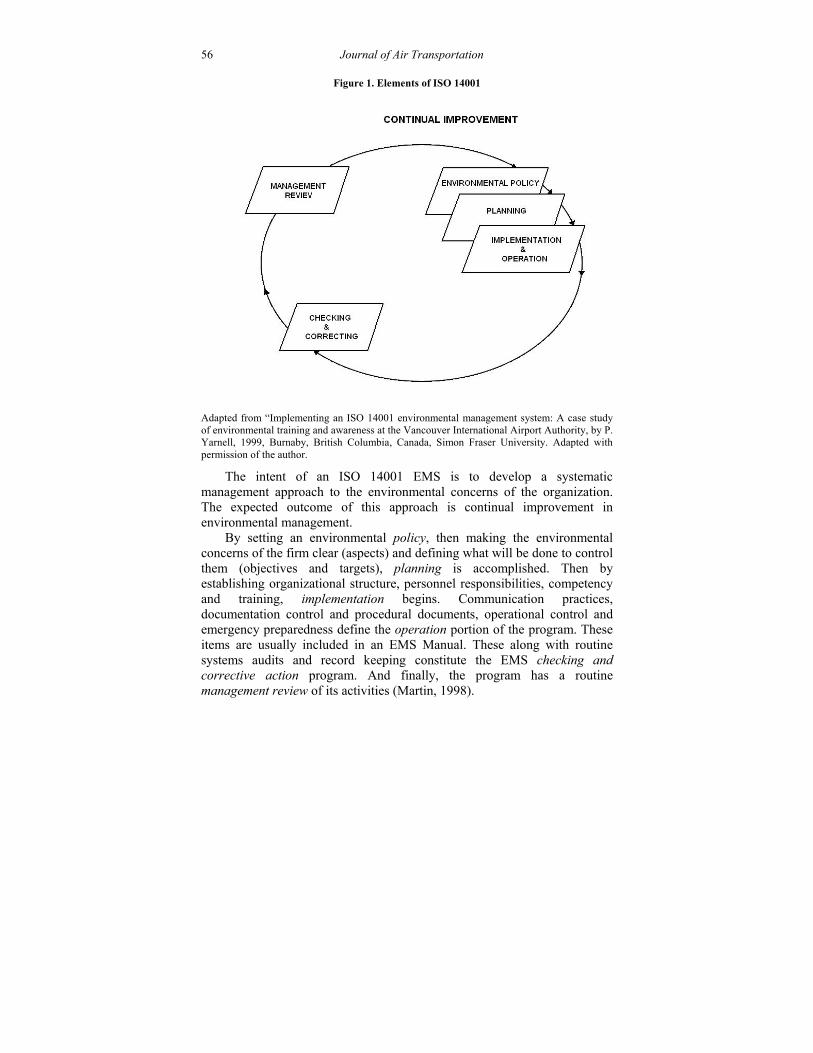
56 Journal of Air Transportation
Figure 1. Elements of ISO 14001
Adapted from “Implementing an ISO 14001 environmental management system: A case study of environmental training and awareness at the Vancouver International Airport Authority, by P. Yarnell, 1999, Burnaby, British Columbia, Canada, Simon Fraser University. Adapted with permission of the author.
The intent of an ISO 14001 EMS is to develop a systematic management approach to the environmental concerns of the organization. The expected outcome of this approach is continual improvement in environmental management.
By setting an environmental policy, then making the environmental concerns of the firm clear (aspects) and defining what will be done to control them (objectives and targets), planning is accomplished. Then by establishing organizational structure, personnel responsibilities, competency and training, implementation begins. Communication practices, documentation control and procedural documents, operational control and emergency preparedness define the operation portion of the program. These items are usually included in an EMS Manual. These along with routine systems audits and record keeping constitute the EMS checking and corrective action program. And finally, the program has a routine management review of its activities (Martin, 1998).
Korul 57
Environmental Policy
Environmental Policy is the starting point for setting the organization’s EMS objectives and targets. The environmental policy is the documented statement of commitment from top management. This policy sets the overall EMS intentions of the organization and contains a commitment to the prevention of pollution and to continuous improvement. Each environmental policy is unique to an organization, is communicated to all employees and is made available to the public. (MGMT, 2004)
Planning Planning is the stage where the requirements that an organization must
meet are determined, the objectives and targets are set, and the programs to achieve the targets and objectives are developed.
Environmental aspects An organization needs to review its operations, activities, products and
services to identify those that may have an interaction with the environment. This identification of the environmental aspects includes those that occur during normal business operations, abnormal conditions, incidents and future activities. When the aspects are identified, the organizations need to determine which aspects have or can have a significant impact on the environment.
Legal and other requirements The organization must identify and have access to legal and other
requirements that apply to the organization’s environmental aspects.
Objectives and targets Environmental objectives and targets need to be developed,
documented and communicated through the organization. Objectives are long-term goals, such as “we will reduce solid waste to landfill,” and targets are short-term goals, such as “we will reduce non-hazardous waste by 50% and reduce waste by 80% this year.” Targets will generally vary throughout the various functions in an organization depending on the activities, products and services.
Environmental management programs One or more programs are needed by the organization for achieving
objectives and targets. These programs assign responsibility throughout the organization for achieving objectives and targets, and specify the means and time frame by which they will be achieved. (MGMT, 2004)
Implementation and Operation For effective implementation, an organization should develop the
capabilities and support mechanism necessary to achieve its environmental policy, objectives and targets (DENIX, 2005).
58 Journal of Air Transportation
Structure and responsibility Roles, responsibilities and authorities of personnel whose activities
have or may have an impact on the environment need to be defined, documented and communicated throughout the organization. The organization must provide adequate resources for the implementation and maintenance of the EMS. One or more individuals need to be appointed by top management as the management representative(s). Irrespective of other responsibilities, the management representatives are given the responsibility for ensuring that the EMS complies with ISO 14001 and for reporting the performance of the EMS to the top management.
Training, awareness and competence The organization needs to identify training requirements of personnel
whose work may create a significant impact upon the environment and ensure that these personnel have received appropriate training. Awareness is required for all personnel throughout the organization of the environmental policy, the EMS program and procedures, and the actual or potential impact of their activities on the environment.
Communication The relevant information on environmental aspects and the EMS
requirements must be communicated throughout the organization including communication between different functions and levels of the organization, and externally interested parties.
EMS documentation Information must be developed and maintained to describe basics of the
EMS, the interaction of the EMS, and to provide direction to related documentation. This information may be paper-based, electronic or other media.
Document control EMS documentation needs to be controlled to ensure that the current
versions of the documents are available wherever the work activities or tasks are to be performed. The documents must be reviewed on a regular basis, revised as needed and approved before issuing or reissuing. Obsolete documents must be removed or otherwise safeguarded against inadvertent use. Documents may be in paper-based, electronic or using other media.
Operational control Processes and activities that can have a significant impact on the
environment and that are relevant to the organization’s policy; objectives and targets need to be identified. The organization must ensure that these operations are conducted as intended by planning these activities to ensure
Korul 59
that they are carried out under controlled conditions. Controlled conditions may include documented procedures containing operating criteria.
Emergency preparedness and response The organization needs to identify its potential for accidents and
emergency situations. The organization must have procedures for the appropriate response to accidents and emergency situations, which include the prevention and mitigation associated with the environmental impact. Emergency plans and procedures need to be developed, communicated and tested to help the organization in ensuring that internal and external personnel effectively respond to any unexpected incidents. (MGMT, 2004)
Checking and Corrective Action An organization should measure, monitor and evaluate its environmental
performance to ensure continuous improvements (DENIX, 2005).
Monitoring and measuring Characteristics of operations and activities, which can have a significant
impact on the environment, need to be monitored and measured regularly. Records of monitoring and measurement information are required to track performance, to prove that operating controls were effective and to demonstrate conformance with objectives and targets. Monitoring and measurements results need to be compared to the legal and other requirements to determine compliance. Any equipment used for monitoring and measurement must be capable of the accuracy required and calibrated on a regular basis.
Nonconformance and corrective/preventive action Responsibility and authority needs to be defined for dealing with
nonconformance found in the EMS including the actions to be taken to mitigate any impact caused and to initiate corrective and preventive action. Corrective and preventive action taken must be proportional to the magnitude of the actual or potential nonconformance.
Records Records relating to the EMS must be identified, collected, stored and
maintained to provide objective evidence of conformance to the ISO 14001 standard, and to legal and other requirements. These records include training records, EMS audit results, management review records and the result of monitoring and measurement.
EMS audit Audits of the EMS are required on a periodic basis to provide assurance
to the organization of EMS implementation, to determine if the EMS is operating as planned, to provide information for management review and to
60 Journal of Air Transportation
determine the capability of the EMS in achieving the organizations environmental objectives and targets. (MGMT, 2004)
Management Review Management review is the check, by senior management, that the
system is operating effectively and provides the opportunity to address changes that may be required to the EMS. Changes to policies, EMS, objectives or targets may be required due to changes in stakeholders’ expectations, altering business operations, advances in technology, results in audits, or for continual improvement (Tibor & Feldman, 2003).
IMPLEMENTATION OF ISO 14001 AT AIRPORTS
The aviation industry has not seen heightened environmental scrutiny and regulation to the same degree that many other industries have experienced. This is due to a number of reasons, including: critical safety issues, the cost of aircraft technology, and the complexity of the global aviation industry, especially as related to the national and international control of regulations. It may also be due to a general reluctance to burden the industry with expensive and time-consuming environmental programs because of the key role that aviation plays in the infrastructure of modern society. Also, the aviation industry has not had a critical environmental disaster.
Air travel is growing rapidly and many major airports are planning physical and operational expansions. Airports have considerable effects on natural environment, and large numbers of people live in close proximity to airports. Airport operations can adversely affect their neighboring communities with the generation of noise and air pollution as well as through water contamination. Airports occupy relatively large areas of land and may detrimentally affect competing land uses, such as: other commercial uses, agriculture, fisheries and wildlife habitat, including endangered species, and recreation.
Most large airports in the world show some commitment to environmental management and also have some environmental experts on staff. In recent years airport managers have been considering whether to implement EMS that would satisfy the specifications of ISO 14001. This may be due to the increased presence of standards like ISO 14001 and the increased public and regulatory scrutiny that airports are receiving (Yarnell, 1999).
Initial Environmental Review
Top management support The successful development and implementation of an EMS is
predicated on top management’s support, commitment, and foresight.
Korul 61
Significant investment in the airport’s human, financial, and technological resources will be required to complete the EMS development and implementation and to realize the benefits. Top management’s support must not end with the provision of resources. They must take an active role in developing EMS and supporting and reviewing the implementation of activities.
EMS boundaries Before starting the process of EMS development and implementation,
the airport must define the scope of its EMS. For airports, the scope of the EMS should be defined, at minimum, in terms of physical (geographical) boundaries and organizational boundaries. The physical boundaries of the EMS should be set to include all lands and buildings owned and/or managed by the airport, and may include off-site areas that are associated with significant environmental aspects, such as nearby wetlands and water sources, nearby bird habitats, and the noise template. Organizational boundaries should be set to include all of the airport organization itself, such that all activities, products, and services under the direct management of the airport will be subject to the EMS. The boundaries may also extend to include airport users, tenants, contractors, suppliers and other organizations sharing the facilities.
Consultation with other parties The objective of consultation with interested parties is to identify any of
their concerns that may influence the design of the EMS. Interested parties, individuals or groups concerned with or affected by the performance of an organization, may include government agencies, neighbors, the public, lenders, insurers, industrial associations, tenants, and suppliers (CSA, 1999).
Review of past environmental performance The objective of the review of past environmental performance is to
identify areas of strength and weakness in existing environmental management programs. This information will help when developing or modifying environmental management programs to meet the requirements of ISO 14001. The information will also be useful when developing the airport’s environmental policy (CSA, 1999).
EMS gap analysis A gap analysis allows for a quick but comprehensive assessment of the
existing environmental management practices and procedures and also compares them with requirements of the standards (Martin, 1998). A gap analysis illustrates how far the airport’s operations are from achieving ISO 14001 certification. A gap analysis is a good way to introduce EMS to the employees (SAIC, 2003).
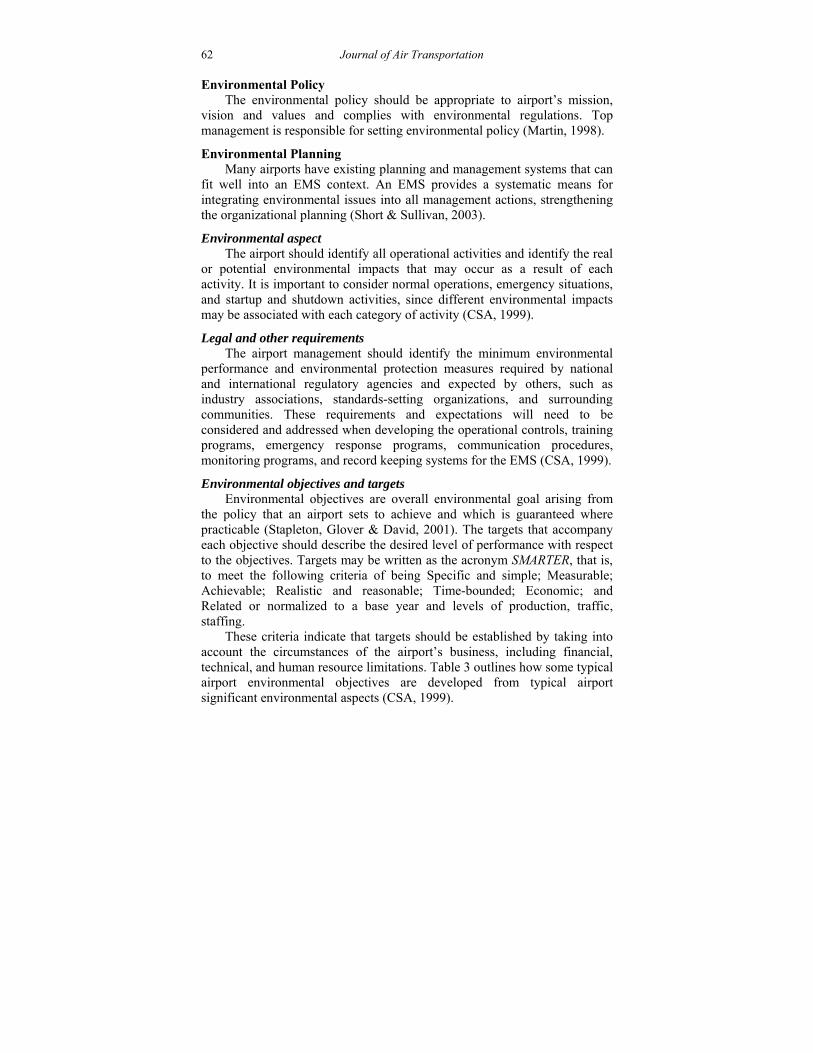
62 Journal of Air Transportation
Environmental Policy The environmental policy should be appropriate to airport’s mission,
vision and values and complies with environmental regulations. Top management is responsible for setting environmental policy (Martin, 1998).
Environmental Planning Many airports have existing planning and management systems that can
fit well into an EMS context. An EMS provides a systematic means for integrating environmental issues into all management actions, strengthening the organizational planning (Short & Sullivan, 2003).
Environmental aspect The airport should identify all operational activities and identify the real
or potential environmental impacts that may occur as a result of each activity. It is important to consider normal operations, emergency situations, and startup and shutdown activities, since different environmental impacts may be associated with each category of activity (CSA, 1999).
Legal and other requirements The airport management should identify the minimum environmental
performance and environmental protection measures required by national and international regulatory agencies and expected by others, such as industry associations, standards-setting organizations, and surrounding communities. These requirements and expectations will need to be considered and addressed when developing the operational controls, training programs, emergency response programs, communication procedures, monitoring programs, and record keeping systems for the EMS (CSA, 1999).
Environmental objectives and targets Environmental objectives are overall environmental goal arising from
the policy that an airport sets to achieve and which is guaranteed where practicable (Stapleton, Glover & David, 2001). The targets that accompany each objective should describe the desired level of performance with respect to the objectives. Targets may be written as the acronym SMARTER, that is, to meet the following criteria of being Specific and simple; Measurable; Achievable; Realistic and reasonable; Time-bounded; Economic; and Related or normalized to a base year and levels of production, traffic, staffing.
These criteria indicate that targets should be established by taking into account the circumstances of the airport’s business, including financial, technical, and human resource limitations. Table 3 outlines how some typical airport environmental objectives are developed from typical airport significant environmental aspects (CSA, 1999).
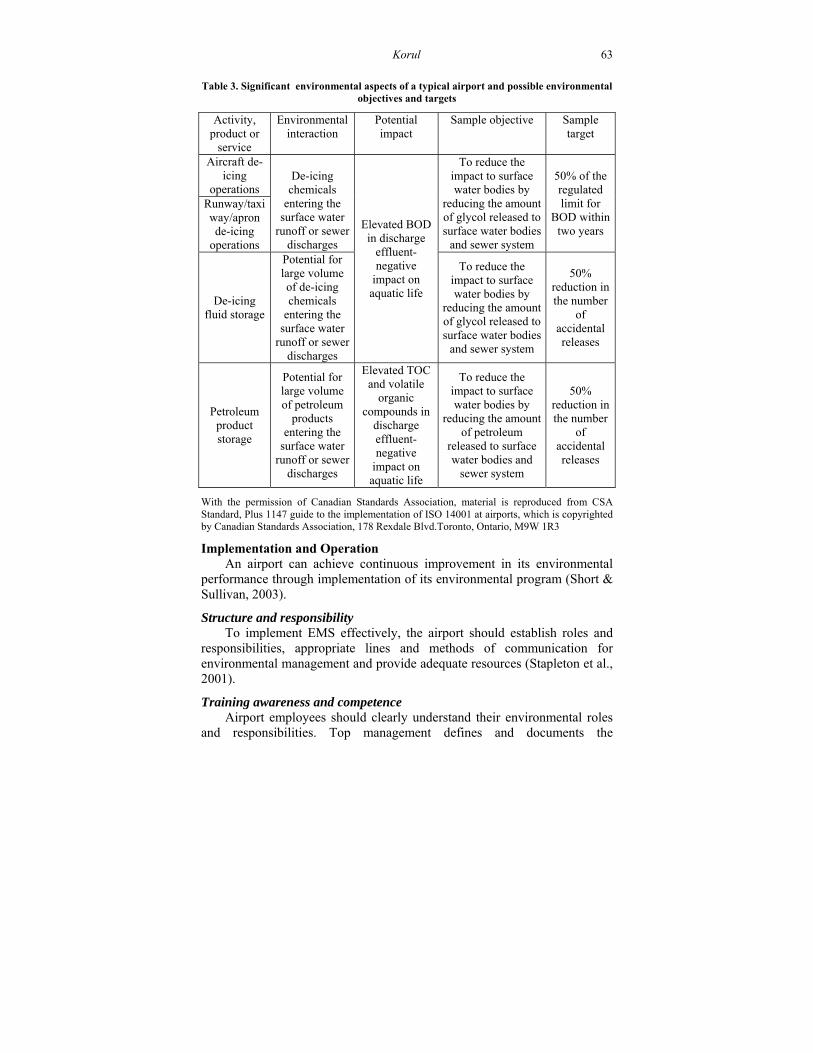
Korul 63
Table 3. Significant environmental aspects of a typical airport and possible environmental
objectives and targets
Activity, product or
service
Environmental interaction
Potential impact
Sample objective Sample target
Aircraft de-icing
operations
De-icing
chemicals entering the
surface water runoff or sewer
discharges
Elevated BOD in discharge
effluent-negative
impact on aquatic life
To reduce the impact to surface water bodies by
reducing the amount of glycol released to surface water bodies
and sewer system
50% of the regulated limit for
BOD within two years
Runway/taxiway/apron de-icing
operations
De-icing fluid storage
Potential for large volume of de-icing chemicals
entering the surface water
runoff or sewer discharges
To reduce the impact to surface water bodies by
reducing the amount of glycol released to surface water bodies
and sewer system
50% reduction in the number
of accidental releases
Petroleum product storage
Potential for large volume of petroleum
products entering the
surface water runoff or sewer
discharges
Elevated TOC and volatile
organic compounds in
discharge effluent- negative
impact on aquatic life
To reduce the impact to surface water bodies by
reducing the amount of petroleum
released to surface water bodies and
sewer system
50% reduction in the number
of accidental releases
With the permission of Canadian Standards Association, material is reproduced from CSA Standard, Plus 1147 guide to the implementation of ISO 14001 at airports, which is copyrighted by Canadian Standards Association, 178 Rexdale Blvd.Toronto, Ontario, M9W 1R3
Implementation and Operation An airport can achieve continuous improvement in its environmental
performance through implementation of its environmental program (Short & Sullivan, 2003).
Structure and responsibility To implement EMS effectively, the airport should establish roles and
responsibilities, appropriate lines and methods of communication for environmental management and provide adequate resources (Stapleton et al., 2001).
Training awareness and competence Airport employees should clearly understand their environmental roles
and responsibilities. Top management defines and documents the
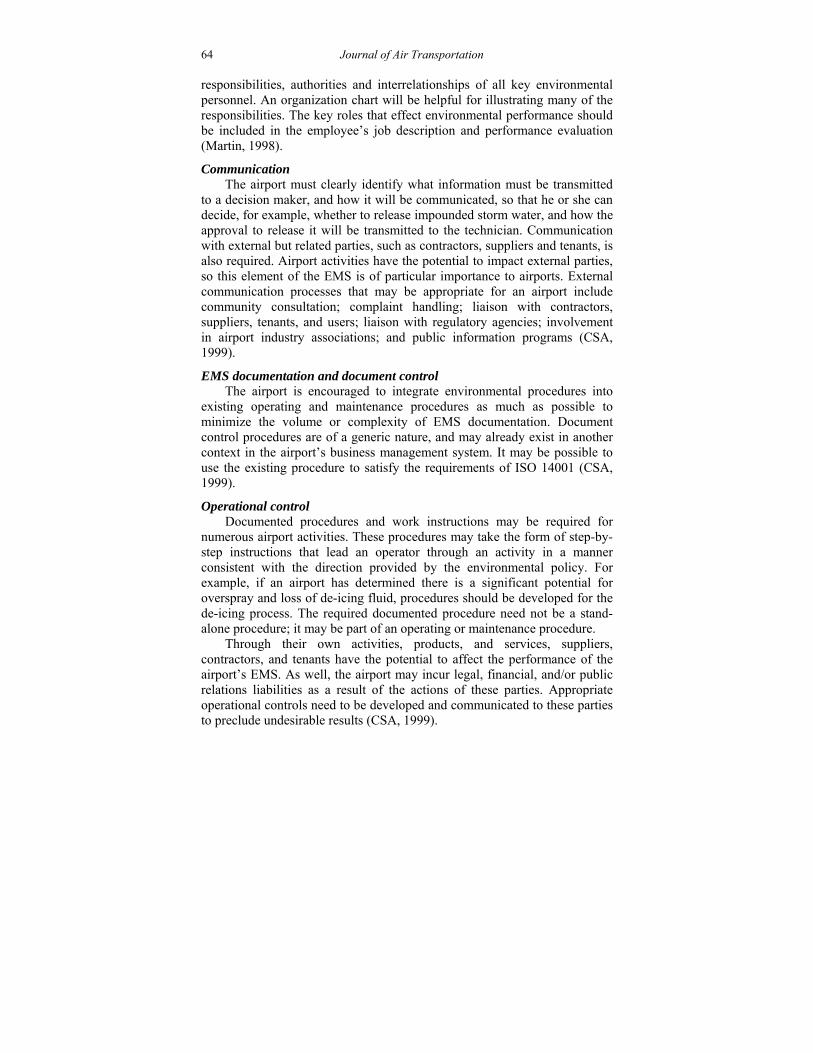
64 Journal of Air Transportation
responsibilities, authorities and interrelationships of all key environmental personnel. An organization chart will be helpful for illustrating many of the responsibilities. The key roles that effect environmental performance should be included in the employee’s job description and performance evaluation (Martin, 1998).
Communication The airport must clearly identify what information must be transmitted
to a decision maker, and how it will be communicated, so that he or she can decide, for example, whether to release impounded storm water, and how the approval to release it will be transmitted to the technician. Communication with external but related parties, such as contractors, suppliers and tenants, is also required. Airport activities have the potential to impact external parties, so this element of the EMS is of particular importance to airports. External communication processes that may be appropriate for an airport include community consultation; complaint handling; liaison with contractors, suppliers, tenants, and users; liaison with regulatory agencies; involvement in airport industry associations; and public information programs (CSA, 1999).
EMS documentation and document control The airport is encouraged to integrate environmental procedures into
existing operating and maintenance procedures as much as possible to minimize the volume or complexity of EMS documentation. Document control procedures are of a generic nature, and may already exist in another context in the airport’s business management system. It may be possible to use the existing procedure to satisfy the requirements of ISO 14001 (CSA, 1999).
Operational control Documented procedures and work instructions may be required for
numerous airport activities. These procedures may take the form of step-by-step instructions that lead an operator through an activity in a manner consistent with the direction provided by the environmental policy. For example, if an airport has determined there is a significant potential for overspray and loss of de-icing fluid, procedures should be developed for the de-icing process. The required documented procedure need not be a stand-alone procedure; it may be part of an operating or maintenance procedure.
Through their own activities, products, and services, suppliers, contractors, and tenants have the potential to affect the performance of the airport’s EMS. As well, the airport may incur legal, financial, and/or public relations liabilities as a result of the actions of these parties. Appropriate operational controls need to be developed and communicated to these parties to preclude undesirable results (CSA, 1999).
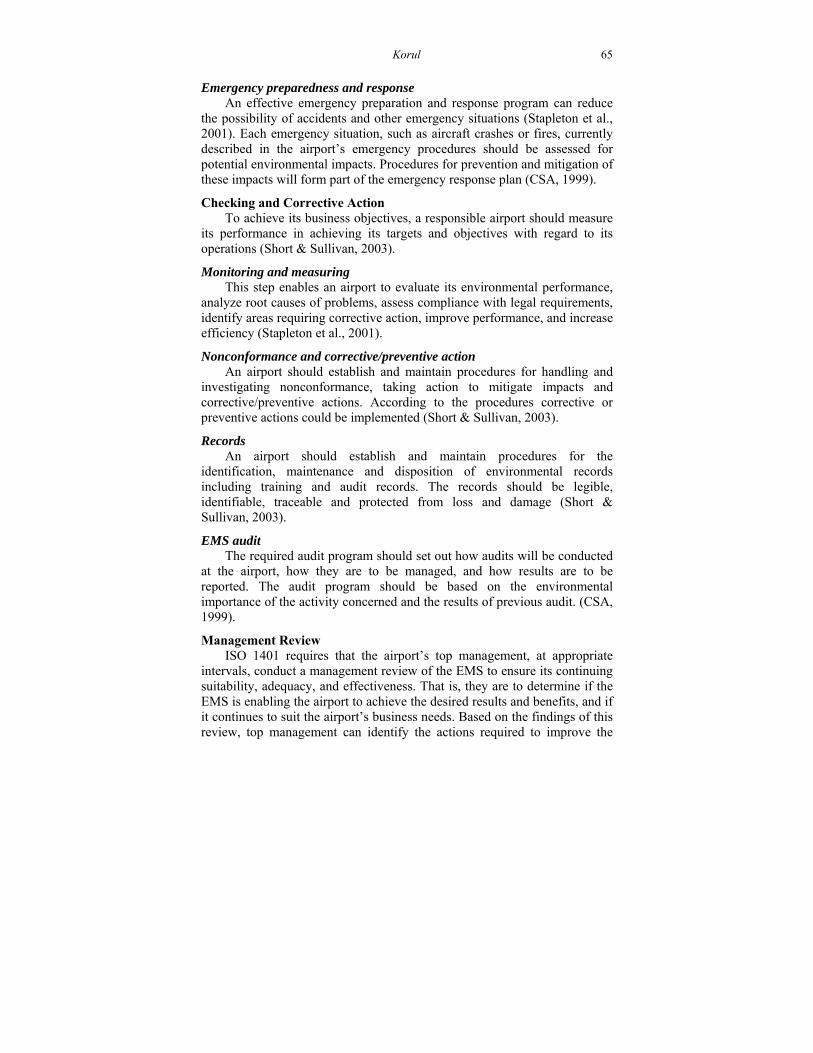
Korul 65
Emergency preparedness and response
An effective emergency preparation and response program can reduce the possibility of accidents and other emergency situations (Stapleton et al., 2001). Each emergency situation, such as aircraft crashes or fires, currently described in the airport’s emergency procedures should be assessed for potential environmental impacts. Procedures for prevention and mitigation of these impacts will form part of the emergency response plan (CSA, 1999).
Checking and Corrective Action To achieve its business objectives, a responsible airport should measure
its performance in achieving its targets and objectives with regard to its operations (Short & Sullivan, 2003).
Monitoring and measuring This step enables an airport to evaluate its environmental performance,
analyze root causes of problems, assess compliance with legal requirements, identify areas requiring corrective action, improve performance, and increase efficiency (Stapleton et al., 2001).
Nonconformance and corrective/preventive action An airport should establish and maintain procedures for handling and
investigating nonconformance, taking action to mitigate impacts and corrective/preventive actions. According to the procedures corrective or preventive actions could be implemented (Short & Sullivan, 2003).
Records An airport should establish and maintain procedures for the
identification, maintenance and disposition of environmental records including training and audit records. The records should be legible, identifiable, traceable and protected from loss and damage (Short & Sullivan, 2003).
EMS audit The required audit program should set out how audits will be conducted
at the airport, how they are to be managed, and how results are to be reported. The audit program should be based on the environmental importance of the activity concerned and the results of previous audit. (CSA, 1999).
Management Review ISO 1401 requires that the airport’s top management, at appropriate
intervals, conduct a management review of the EMS to ensure its continuing suitability, adequacy, and effectiveness. That is, they are to determine if the EMS is enabling the airport to achieve the desired results and benefits, and if it continues to suit the airport’s business needs. Based on the findings of this review, top management can identify the actions required to improve the
66 Journal of Air Transportation
EMS to meet the airport’s environmental policy and commitment to continual improvement. ISO 14001 does not stipulate a frequency for management reviews. However given the high level of environmental risk associated with airport activities and services, it may be appropriate to conduct management reviews at least annually and as often as quarterly. Management reviews may also be conducted after a significant change in airport operations, a significant event or incident, or a particularly major nonconformance, to discuss the results, implications, and potential impacts on the airport’s environmental performance (CSA, 1999).
CONCLUSION
The impacts of local and regional environmental problems on the global environment attract great attention today. EMS implementation and certification do help companies to integrate their environmental, health and safety management systems and in some cases their environmental and quality management systems. Among companies operating in international markets ISO 14001certification is an indicator of environmental responsibility and is often seen as a way of developing competitive advantage.
With so many different companies and interests involved in the day-to-day operation of airports, environmental management at an airport is a complex activity. Airlines, retailers and others who use its facilities create the main environmental impacts at an airport. Many airports are now introducing EMS to help manage this complexity and develop greater involvement by users and tenants.
Much of what an organization must do in an ISO 14001 EMS is probably already implemented to an extent since no airport can operate without some environmental programs in place. These programs may need modification to comply with the ISO 14001 standard, but they serve as a good starting point to begin the construction of an ISO compliant EMS. A good EMS will do two things. First, it will allow the firm to uncover ways in which they can reduce its environmental impacts while simultaneously reducing costs or increasing productivity. Second, it will coordinate their environmental activities to achieve greater organizational efficiency and effectiveness.
The purpose of the ISO 14000 family is the integration of better environmental management practices into the business. It fosters self-organization and self-regulation, which represents the groundwork from which continuous improvement of environmental performance can be sustained.
Korul 67
This paper has been prepared to assist airports in the development of an
EMS that is consistent with the ISO 140001 standard, and in the improvement of the overall environmental performance of airports.
REFERENCES
Ball, J. (2002). Can ISO 14000 and eco-labeling turn the construction industry green? Building and Environment, 37(4), 421-428.
Bansal, P. & Bogner, W. C. (June 2002). Deciding on ISO 14001: Economics, institutions, and context. Long Range Planning, 35(3), 269-290.
Cascio, J., Woodside, G., & Mitchell, P. (1996). ISO 14000 guide the new international environmental management standards. New York: McGraw Hill.
CSA. (1999). Plus 1147 guide to the implementation of ISO 14001 at airports, Toronto: CSA International. With the permission of Canadian Standards Association, material is reproduced from CSA Standard,Plus 1147 guide to the implementation of ISO 14001 at airports, which is copyrighted by Canadian Standards Association, 178 Rexdale Blvd.Toronto, Ontario, M9W 1R3
DENIX. (2005). ISO 14001-essential elements. Retrieved May 24, 2005, fromwww.denix.osd.mil/denix/Public/Library/EMS/Documents/elements.html
Haklik, J. E. (2003). ISO 14000 environmental management: Benefiting companies, saving the environment. Retrieved June 19, 2003, from www.trst.com/article-haklik-1.htm
Martin, R. (1998). ISO 14001 guidance manual. Technical Report NCEDR/98-06. Knoxville: National Center for Environmental Decision-Making Research, University of Tennessee.
MGMT. (2004). The ISO 14001 Pizza. Retrieved February 8, 2004, from www.mgmt14k.com/014kpizza.htm
Mohamed, S. T. (July 2001). The impact of ISO 14000 on developing world businesses. Renewable Energy, 23(3/4), 579-584.
Morrow, D. & Rondinelli, D. (April 2002). Adopting corporate environmental management systems: Motivations and results of ISO 14001 and EMAS certification. European Management Journal, 20(2), 159-171.
Petroni, A. (2001). Developing a methodology for analysis of benefits and shortcomings of ISO 14001 registration: Lessons from experience of a large machinery manufacturer. Journal of Cleaner Production, 9(4), 351-364.
68 Journal of Air Transportation
Rondinelli, D. & Vastag, G. (October 2000). Panacea, common sense, or just a label? The value of ISO 14001 environmental management systems. European Management Journal, 18(5), 499-510.
SAIC. (2003). Environmental management system/ISO 14000 services. Retrieved August 11, 2003, from www.saic.com/environ/success/ISO-14000.pdf
Short, J. J. & Sullivan N. (2003). Managing airfield bird hazards using an environmental management system. Warsaw: International Bird Strike Committee.
Stapleton, P. J., Glover, M. A., & Davis, S. P. (2001). An implementation guide for small and medium-sized organizations. Ann Harbor, MI: NSF International Publications.
Tibor, T. & Feldman, I. (2003). ISO 14000 a guide to the new environmental management standards: International institute for sustainable development. Retrieved August 10, 2003, from http://www.iso14000.com
TUVAMERICA. (2005). Retrieved May 23, 2005, from http://www.tuvamerica.com/tuvnews/hotnews/pressdetails.cfm?id-919
Yarnell, P. (1999). Implementing an ISO 14001 environmental management system: A case study of environmental training and awareness at the Vancouver International Airport Authority. Burnaby, British Columbia, Canada: Simon Fraser University.
Zutshi, A. & Sohal, A. (2002). Environmental management system adoption by Australasian organizations: Part 1: Reasons, benefits and impediments. Technovation, September.
Journal of Air Transportation Vol. 10, No. 2 - 2005
© 2005, Aviation Institute, University of Nebraska at Omaha
THE IMPACT OF CONSTRAINED FUTURE
SCENARIOS ON AVIATION AND EMISSIONS
Ralf Berghof German Aerospace Center
Cologne, Germany
ABSTRACT
This paper presents results of research, whose main objective is the quantification of four scenarios for long-term development in aviation and related emissions. The research placed special emphasis on constraints relating to infrastructure, regulation and assumptions of technology development. Overall scenario results show that infrastructure enhancements and noise emissions could be successfully targeted with landing charges while a reduction of emissions via fuel tax or a quick introduction of hydrogen powered aircraft reduces strongly the profitability of the aviation industry.
INTRODUCTION
Attempts to establish future world developments which could limit aviation growth is a hotly debated but crucial issue for the aerospace industry which is characterised by very long planning cycles (Gudmundsson, 2004). One method that has been utilised for this purpose is the scenario approach (Shell, 2001; 2002) that has been reported useful to establish different strategic options according to different future world pictures (Raskin et al., 1998; 2002; The Millennium Project, 2002). For the aviation industry several projects have been completed that use the scenario approach in different contexts: Jarach (2004) used a marketing based scenario approach to assess trends in the airline industry; Eelman, Schmitt, Becker and Granzeier (2004) used scenarios to establish blended wing-body user configurations; and Urbatzka and Wilken (2004) used a scenario approach to assess future airport capacity utilization in Germany. In addition to this work a growing body of research using scenario approaches has been funded through _____________________________________________________________ Ralf Berghof has master degrees in Political Science, Philosophy, and Public Administration. Since 1988 he has been employed by the German Aerospace Center with a focus on transport system analysis, potentials for emission reduction, sustainable mobility and scenarios of global air transport development.
70 Journal of Air Transportation
the European Research Frameworks1 and stakeholder associations such as Eurocontrol (ACARE, 2002; Eurocontrol, 2004). The diverse areas of these research projects and ground breaking nature, in some respects, necessitate at some stage collective or comparative approaches. Hence, the objective of the research presented here was to investigate global and aviation specific scenarios (i.e., ACARE, 2002; Eurocontrol, 2004; Penner, Lister, Griggs, Dokken & McFarland, 1999) to identify drivers and shaping factors; to establish possible constraints, future social trends, technology trends and other necessary inputs required for quantification; to perform a questionnaire survey of aviation experts and stakeholders; and to quantify impacts of constraints and amount of emissions for the scenarios with the AERO model2 (AERO, 2000; Hancox & Lowe, 2000; NLR, 2000).
The paper that follows presents some of the results of the research project, which is funded by the European Community under the title Constrained Scenarios on Aviation and Emissions with quantifications up to the year 2050 (CONSAVE 2050).
SCENARIO DEVELOPMENT
The CONSAVE long term scenarios explore how the global aviation system may change over the first half of this century. They consider alternative paths focussing on different challenges like infrastructure impacts, ecological pressure, fractured markets and low demand. These paths are influenced by shaping factors like population and economic growth; and drivers like energy availability, consumption, price, technologies, policy regulations, citizen preferences and customers values. To develop the CONSAVE scenarios, several scenario workshops were held but using the same values for gross domestic product (GDP), population and income per capita as established by the Intergovernmental Panel on Climate Change (IPCC) SRES scenarios (Nakicenovic, N. and R. J. Swart (eds.), 2000). The reason was to include some reviewed numbers about external drivers of aviation which are important for quantification but not necessitating a need of an additional review of basic assumptions.
The first high growth scenario called Unlimited Skies (ULS) deals with the infrastructure constraints of airports and runways. The second high growth scenario called Regulatory Push & Pull (RPP) assumes climate problems and environmental regulations. One low growth scenario called Fractured World (FW) assumes a worldwide fragmentation, dealing with
1 The European Community funds research in various areas in accordance to so called Research Frameworks that run over several years. The present Framework is the 6th with the upcoming 7th spanning from 2006 to 2010. 2 The AERO model is the result of the AERO Project, initiated by the Dutch Civil Aviation Authority, to analyse engine emissions on a global scale (see AERO, 2000).
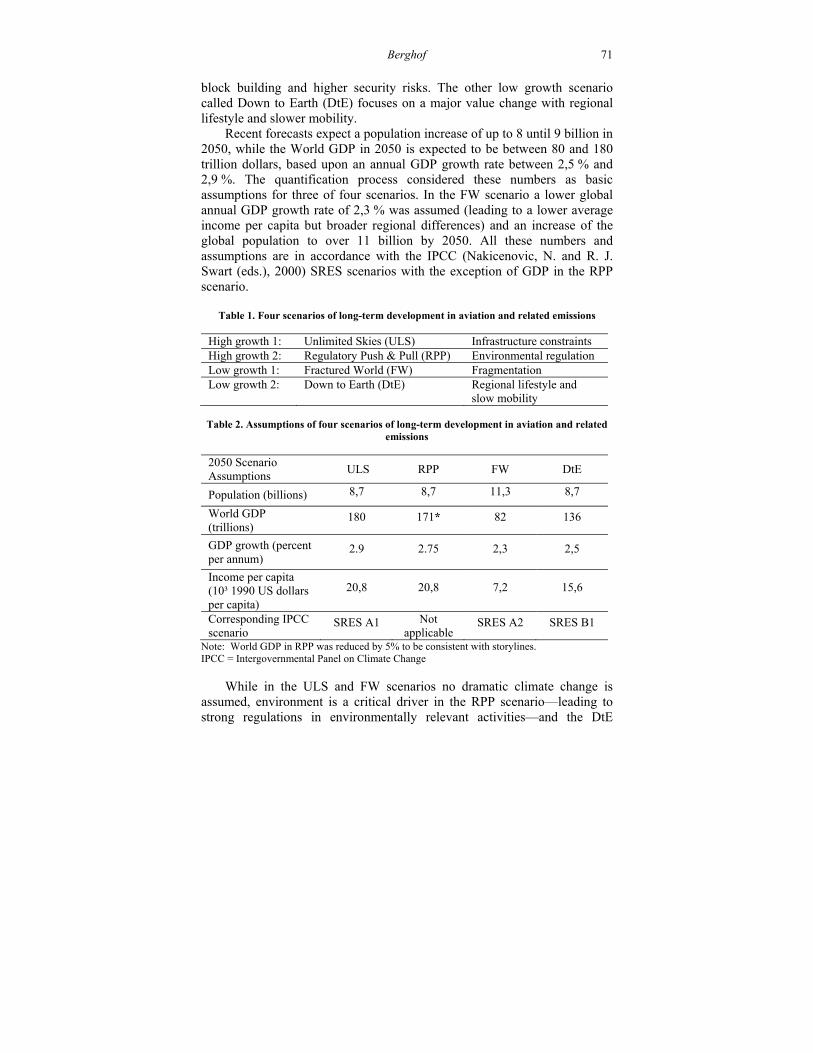
Berghof 71
block building and higher security risks. The other low growth scenario called Down to Earth (DtE) focuses on a major value change with regional lifestyle and slower mobility.
Recent forecasts expect a population increase of up to 8 until 9 billion in 2050, while the World GDP in 2050 is expected to be between 80 and 180 trillion dollars, based upon an annual GDP growth rate between 2,5 % and 2,9 %. The quantification process considered these numbers as basic assumptions for three of four scenarios. In the FW scenario a lower global annual GDP growth rate of 2,3 % was assumed (leading to a lower average income per capita but broader regional differences) and an increase of the global population to over 11 billion by 2050. All these numbers and assumptions are in accordance with the IPCC (Nakicenovic, N. and R. J. Swart (eds.), 2000) SRES scenarios with the exception of GDP in the RPP scenario.
Table 1. Four scenarios of long-term development in aviation and related emissions
High growth 1: Unlimited Skies (ULS) Infrastructure constraints High growth 2: Regulatory Push & Pull (RPP) Environmental regulation Low growth 1: Fractured World (FW) Fragmentation Low growth 2: Down to Earth (DtE) Regional lifestyle and
slow mobility
Table 2. Assumptions of four scenarios of long-term development in aviation and related emissions
2050 Scenario Assumptions
ULS RPP FW DtE
Population (billions) 8,7 8,7 11,3 8,7
World GDP (trillions)
180 171* 82 136
GDP growth (percent per annum)
2.9 2.75 2,3 2,5
Income per capita (10³ 1990 US dollars per capita)
20,8 20,8 7,2 15,6
Corresponding IPCC scenario
SRES A1 Not applicable
SRES A2 SRES B1
Note: World GDP in RPP was reduced by 5% to be consistent with storylines. IPCC = Intergovernmental Panel on Climate Change
While in the ULS and FW scenarios no dramatic climate change is assumed, environment is a critical driver in the RPP scenario—leading to strong regulations in environmentally relevant activities—and the DtE
72 Journal of Air Transportation
scenario—where environmental concerns lead to a strong change of social values and behaviour.
Energy scarcities are not expected until 2050 on the global level. However, in the FW scenario resources are distributed unequally and every region has to take care for their own future energy supply, leading to different regional technologies (Asia: synthetic fuels from coal; North and South America: unconventional oil; Africa: biomass; Mid-East: oil and gas; Eurasia: electricity and hydrogen) and comparably to the other scenarios high energy costs in the global average. The overall energy consumption for all scenarios in 2050 is in line with the recent Shell (2001) scenarios except for the ULS scenario where an optimistic (scenario) assumption was chosen for the future availability of oil.
Technological innovations are expected in all scenarios, but with different main characteristic features. Within the ULS scenario there are high challenges to develop new technologies to enable the very high level of air transport and to meet the respective requirements especially on the effectiveness of airports and air traffic movement (ATM); the availability of energy; the reduction of noise; and the level of safety. Most typical for the RPP scenario will be a push and pull from policy especially for innovative environmental technologies. In the FW scenario technologies are driven by regional concepts and resources. Common for all blocks, high security level technologies will be essential. In the DtE scenario we assume a rapid diffusion of post-fossil technologies, driven by a change of values and preferences in the light of a strong movement towards sustainable development and innovations to ensure high safety and security standards.
Policy as a Consequence of Circumstances Representing a market philosophy in ULS, policy is soft: liberalisation if
possible, and compensation of negative impacts if necessary, combined with pragmatic choice of effective solutions. In RPP environmental pressure leads to limits of fossil fuel consumption and noise plus support of non-fossil technologies. In FW regions, blocks and nations are fending for themselves, decreasing chances for global policy approaches. In DtE citizens and customers with post-industrial lifestyle and values are playing a major role for policy, so that any pollution sources are tightly controlled.
Depending to the potentials, goals and threats people have different preferences and values in the four scenarios, leading to different challenges, constraints, travel patterns and demand in the aviation system. In ULS their focus lies on fast and convenient intercontinental travel. In RPP mobility is more limited because of higher costs and environmental restrictions. In FW with confrontations between regions, terrorist activities increase as well as security concerns cutting down the traffic between blocks. In DtE people
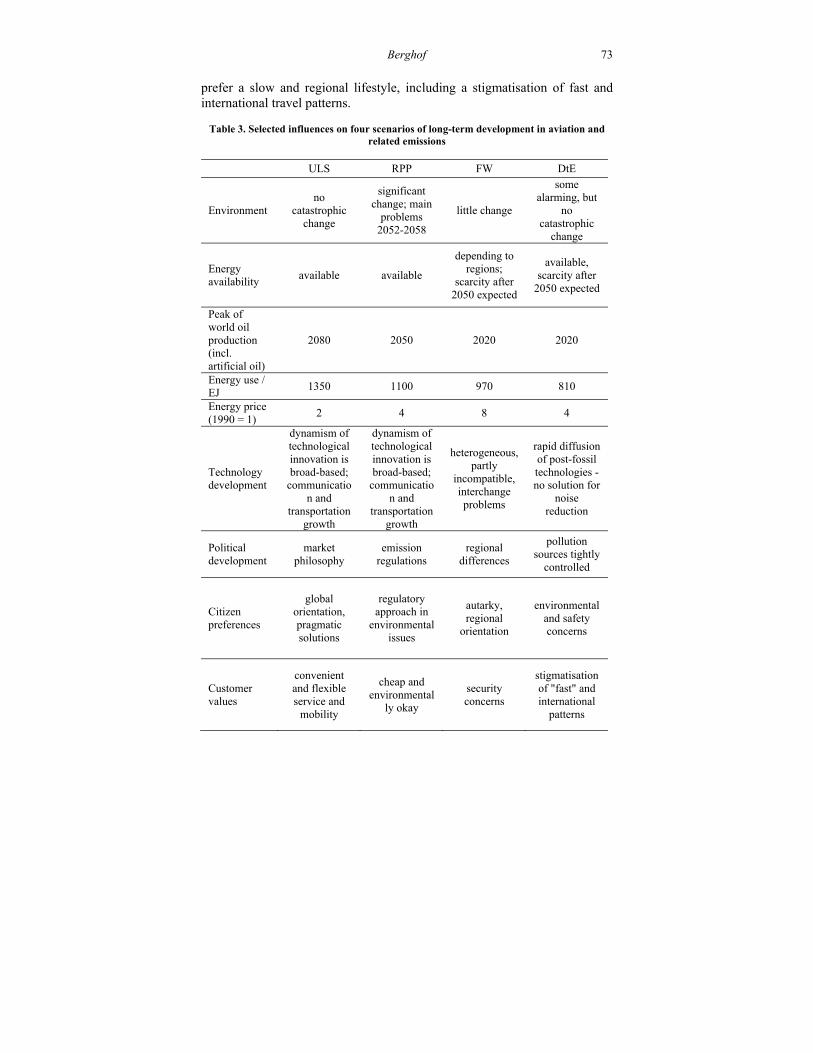
Berghof 73
prefer a slow and regional lifestyle, including a stigmatisation of fast and international travel patterns.
Table 3. Selected influences on four scenarios of long-term development in aviation and
related emissions
ULS RPP FW DtE
Environment no
catastrophic change
significant change; main
problems 2052-2058
little change
some alarming, but
no catastrophic
change
Energy availability
available available
depending to regions;
scarcity after 2050 expected
available, scarcity after
2050 expected
Peak of world oil production (incl. artificial oil)
2080 2050 2020 2020
Energy use / EJ
1350 1100 970 810
Energy price (1990 = 1)
2 4 8 4
Technology development
dynamism of technological innovation is broad-based;
communication and
transportation growth
dynamism of technological innovation is broad-based;
communication and
transportation growth
heterogeneous, partly
incompatible, interchange problems
rapid diffusion of post-fossil technologies - no solution for
noise reduction
Political development
market philosophy
emission regulations
regional differences
pollution sources tightly
controlled
Citizen preferences
global orientation, pragmatic solutions
regulatory approach in
environmental issues
autarky, regional
orientation
environmental and safety concerns
Customer values
convenient and flexible service and
mobility
cheap and environmental
ly okay
security concerns
stigmatisation of "fast" and international
patterns
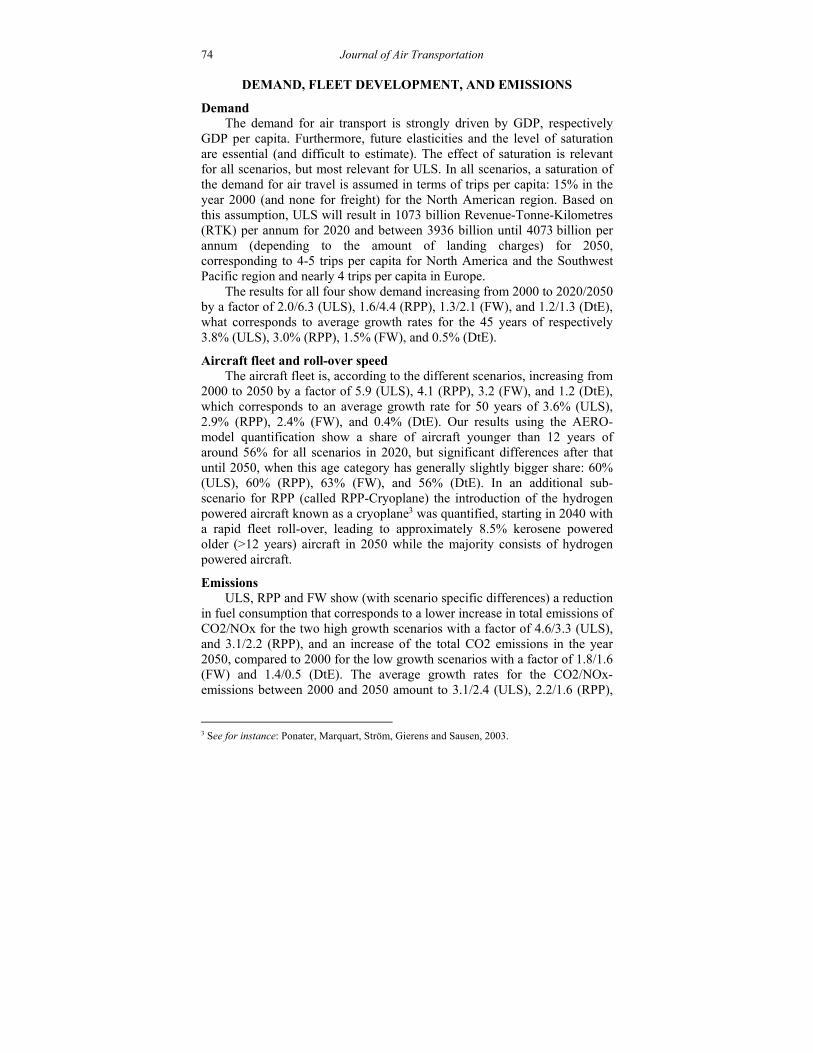
74 Journal of Air Transportation
DEMAND, FLEET DEVELOPMENT, AND EMISSIONS
Demand The demand for air transport is strongly driven by GDP, respectively
GDP per capita. Furthermore, future elasticities and the level of saturation are essential (and difficult to estimate). The effect of saturation is relevant for all scenarios, but most relevant for ULS. In all scenarios, a saturation of the demand for air travel is assumed in terms of trips per capita: 15% in the year 2000 (and none for freight) for the North American region. Based on this assumption, ULS will result in 1073 billion Revenue-Tonne-Kilometres (RTK) per annum for 2020 and between 3936 billion until 4073 billion per annum (depending to the amount of landing charges) for 2050, corresponding to 4-5 trips per capita for North America and the Southwest Pacific region and nearly 4 trips per capita in Europe.
The results for all four show demand increasing from 2000 to 2020/2050 by a factor of 2.0/6.3 (ULS), 1.6/4.4 (RPP), 1.3/2.1 (FW), and 1.2/1.3 (DtE), what corresponds to average growth rates for the 45 years of respectively 3.8% (ULS), 3.0% (RPP), 1.5% (FW), and 0.5% (DtE).
Aircraft fleet and roll-over speed The aircraft fleet is, according to the different scenarios, increasing from
2000 to 2050 by a factor of 5.9 (ULS), 4.1 (RPP), 3.2 (FW), and 1.2 (DtE), which corresponds to an average growth rate for 50 years of 3.6% (ULS), 2.9% (RPP), 2.4% (FW), and 0.4% (DtE). Our results using the AERO-model quantification show a share of aircraft younger than 12 years of around 56% for all scenarios in 2020, but significant differences after that until 2050, when this age category has generally slightly bigger share: 60% (ULS), 60% (RPP), 63% (FW), and 56% (DtE). In an additional sub-scenario for RPP (called RPP-Cryoplane) the introduction of the hydrogen powered aircraft known as a cryoplane3 was quantified, starting in 2040 with a rapid fleet roll-over, leading to approximately 8.5% kerosene powered older (>12 years) aircraft in 2050 while the majority consists of hydrogen powered aircraft.
Emissions ULS, RPP and FW show (with scenario specific differences) a reduction
in fuel consumption that corresponds to a lower increase in total emissions of CO2/NOx for the two high growth scenarios with a factor of 4.6/3.3 (ULS), and 3.1/2.2 (RPP), and an increase of the total CO2 emissions in the year 2050, compared to 2000 for the low growth scenarios with a factor of 1.8/1.6 (FW) and 1.4/0.5 (DtE). The average growth rates for the CO2/NOx-emissions between 2000 and 2050 amount to 3.1/2.4 (ULS), 2.2/1.6 (RPP),
3 See for instance: Ponater, Marquart, Ström, Gierens and Sausen, 2003.
Berghof 75
1.0/0.9 (FW) and 0.3/-1.4 (DtE). The values reflect that in DtE strong emphasis is given to the reduction of NOx. In the sub-scenario RPP-Cryoplane the CO2/NOx emissions could be reduced in 2050 to 14.3/62 of to the 2000 level, while water-vapour emissions, emitted during flight, increase by a factor of 3.4
IMPACT OF CONSTRAINTS
The main goal of the study was to consider constraints and challenges which could turn out as possible limits to growth for aviation. Consequently the needs and impacts related to constraints were quantified depending on each scenario.
Needed Infrastructure in a High Growth Scenario In the highest growth scenario ULS, the expanding aviation activity may
lead to a shortage of infrastructure, in particular at airports. In this respect the infrastructure becomes a challenge or in other words a constraint to aviation development.
Figure 1. Additional runway requirements in 2020 and 2050 for the Unlimited Skies
scenario of long-term development in aviation and related emissions
Elaborated during the CONSAVE 2050 project by NLR
Compliant to the storyline, it is assumed that the aviation sector
generates the required funding for additional infrastructure by itself. To
4 Presently the impact of water emissions from Cryoplane use on the atmosphere and the resulting formation of contrails and/or cirrus clouds is still uncertain.
76 Journal of Air Transportation
investigate to what extent the infrastructure needs expansion (especially in the EU and North American regions) landing charges are increased by different levels (based on public data on costs for new airports and the associated increase in capacity). The quantification considered and assumed, that:
1. Demand will be lowered because airlines pass on the additional costs to ticket prices;
2. Airlines move to relatively larger aircraft to minimise the additional landing costs; and
3. The extra landing charges collected are used to build additional runways.
The number of additional runways needed to accommodate all flights is
based on:
1. The aircraft movements in 2050 compared to 2000 by (major and aggregated minor) airports;
2. An inventory of airports and number of runways available in 2000; and
3. The effective level of runway capacity used in 2000.
Several landing charge increases were tested to study the effect on yields for financing additional infrastructure and additional landing/takeoff capacity, and changes in demand for trips through ticket pricing. The results indicated that an increase of landing charges by a factor of 10 is required to finance additional infrastructure to accommodate ULS air traffic in the U.S. and EU. Within these tests only the cost levels are considered. The availability of the required space in term of land use is not assessed. One condition for the acceptance of new airports will be to ensure that noise nuisance and decline in air quality will be limited. Within the scenario storyline financial compensation for remaining nuisance is assumed.
Accelerated Kerosene to Hydrogen Fleet Rollover Another interesting aspect is to quantify the effects of a quick fleet
rollover from a kerosene fleet to aircraft using alternative fuels (hydrogen or bio-fuels), a change enhanced by environmental pressure.
A transition from kerosene to bio-fuel is expected to have an impact limited to the production side with only very limited impact on the aviation industry. Aircraft probably do not need replacement, minor modifications to engines and systems will do. In addition, airport infrastructure will probably not need much adjustment either. In case the fleet roll-over is of the order of an average aircraft lifetime, costs and effects will be considerably lower.
Berghof 77
A contrary scenario assumes a switch from kerosene to hydrogen
necessitating a complete change of infrastructure, aircraft and operational procedures. Therefore in the sub-scenario RPP-Cryoplane a fast introduction of hydrogen powered aircraft was assumed and the perspective of an European manufacturer was considered, with the assumption that aviation could not support a permanent dual infrastructure or a production of two technologies at the same time and the transition from an all kerosene to a 95% hydrogen powered fleet should be done a very short time (within 10 years).
New aircraft need to be designed with increased technological risks and development costs and—if a complete fleet rollover is intended—certified for virtually all aircraft sizes and ranges. Production facilities need to be transformed by closing down the kerosene aircraft production, causing an early write-off of capital costs. New production lines will be set up for the hydrogen powered aircraft that will need considerable investment. A typical rate of transition is 8 years for an all new generation of aircraft with the following impacts:
1. Older kerosene powered aircraft need to be phased out early,
without the opportunity to use them somewhere else; 2. New hydrogen aircraft (cryoplane) need to be bought in a hectic
market with relatively low production volumes; and 3. The existing airport fuel installations need replacement by hydrogen
ones, causing early write-off of kerosene installations.
Results showed that under these circumstances there would be a very high challenge for the aircraft manufacturers to produce the needed number of new aircraft.
Another question arises about who will pay for the necessary infrastructure. The RPP-Cryoplane scenario is based on the assumption that the government and society have a stake in reducing emissions and that the aviation sector (airline, aircraft and engine industries) is successful in negotiating a significant contribution to transition costs by the government. Thus, the costs of scrapping the kerosene-powered aircraft will be compensated fully by the government (buying the kerosene powered aircraft at residual, market prices). The capital investment of acquiring new hydrogen powered aircraft will be financed by the airlines and passed on as much as possible to the passengers. �The new fuel infrastructure capital costs and early write-off of the kerosene fuel installations is recouped in fuel prices. Consequently, this leads to higher ticket prices and decrease in demand, compared to the RPP-All Kerosene scenario, by 8.0% in 2050.
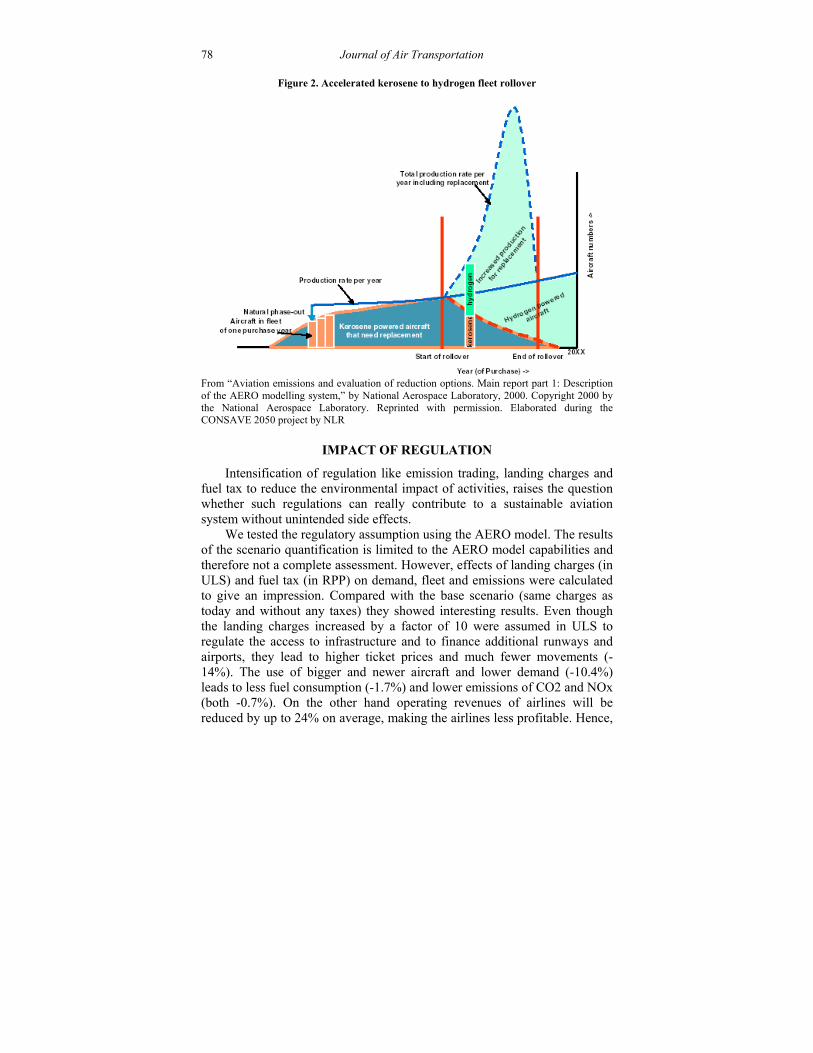
78 Journal of Air Transportation
Figure 2. Accelerated kerosene to hydrogen fleet rollover
From “Aviation emissions and evaluation of reduction options. Main report part 1: Description of the AERO modelling system,” by National Aerospace Laboratory, 2000. Copyright 2000 by the National Aerospace Laboratory. Reprinted with permission. Elaborated during the CONSAVE 2050 project by NLR
IMPACT OF REGULATION
Intensification of regulation like emission trading, landing charges and fuel tax to reduce the environmental impact of activities, raises the question whether such regulations can really contribute to a sustainable aviation system without unintended side effects.
We tested the regulatory assumption using the AERO model. The results of the scenario quantification is limited to the AERO model capabilities and therefore not a complete assessment. However, effects of landing charges (in ULS) and fuel tax (in RPP) on demand, fleet and emissions were calculated to give an impression. Compared with the base scenario (same charges as today and without any taxes) they showed interesting results. Even though the landing charges increased by a factor of 10 were assumed in ULS to regulate the access to infrastructure and to finance additional runways and airports, they lead to higher ticket prices and much fewer movements (-14%). The use of bigger and newer aircraft and lower demand (-10.4%) leads to less fuel consumption (-1.7%) and lower emissions of CO2 and NOx (both -0.7%). On the other hand operating revenues of airlines will be reduced by up to 24% on average, making the airlines less profitable. Hence,
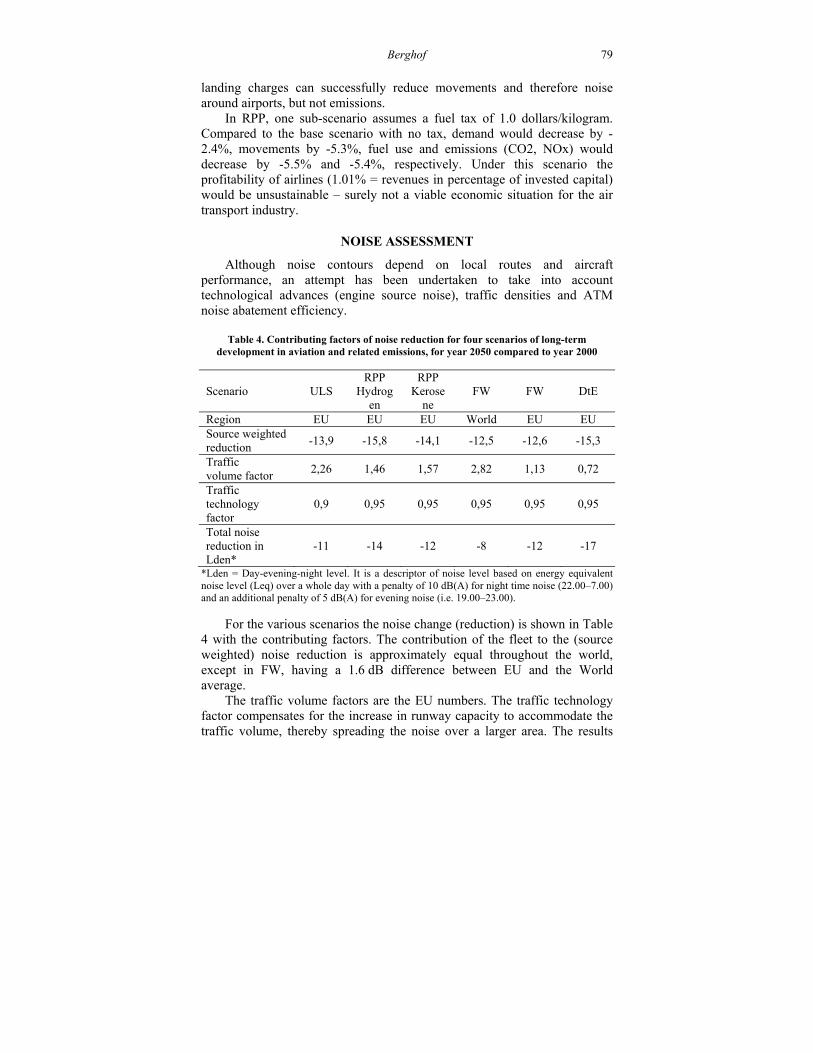
Berghof 79
landing charges can successfully reduce movements and therefore noise around airports, but not emissions.
In RPP, one sub-scenario assumes a fuel tax of 1.0 dollars/kilogram. Compared to the base scenario with no tax, demand would decrease by -2.4%, movements by -5.3%, fuel use and emissions (CO2, NOx) would decrease by -5.5% and -5.4%, respectively. Under this scenario the profitability of airlines (1.01% = revenues in percentage of invested capital) would be unsustainable – surely not a viable economic situation for the air transport industry.
NOISE ASSESSMENT
Although noise contours depend on local routes and aircraft performance, an attempt has been undertaken to take into account technological advances (engine source noise), traffic densities and ATM noise abatement efficiency.
Table 4. Contributing factors of noise reduction for four scenarios of long-term
development in aviation and related emissions, for year 2050 compared to year 2000
Scenario ULS RPP
Hydrogen
RPP Kerose
ne FW FW DtE
Region EU EU EU World EU EU Source weighted reduction
-13,9 -15,8 -14,1 -12,5 -12,6 -15,3
Traffic volume factor
2,26 1,46 1,57 2,82 1,13 0,72
Traffic technology factor
0,9 0,95 0,95 0,95 0,95 0,95
Total noise reduction in Lden*
-11 -14 -12 -8 -12 -17
*Lden = Day-evening-night level. It is a descriptor of noise level based on energy equivalent noise level (Leq) over a whole day with a penalty of 10 dB(A) for night time noise (22.00–7.00) and an additional penalty of 5 dB(A) for evening noise (i.e. 19.00–23.00).
For the various scenarios the noise change (reduction) is shown in Table 4 with the contributing factors. The contribution of the fleet to the (source weighted) noise reduction is approximately equal throughout the world, except in FW, having a 1.6 dB difference between EU and the World average.
The traffic volume factors are the EU numbers. The traffic technology factor compensates for the increase in runway capacity to accommodate the traffic volume, thereby spreading the noise over a larger area. The results
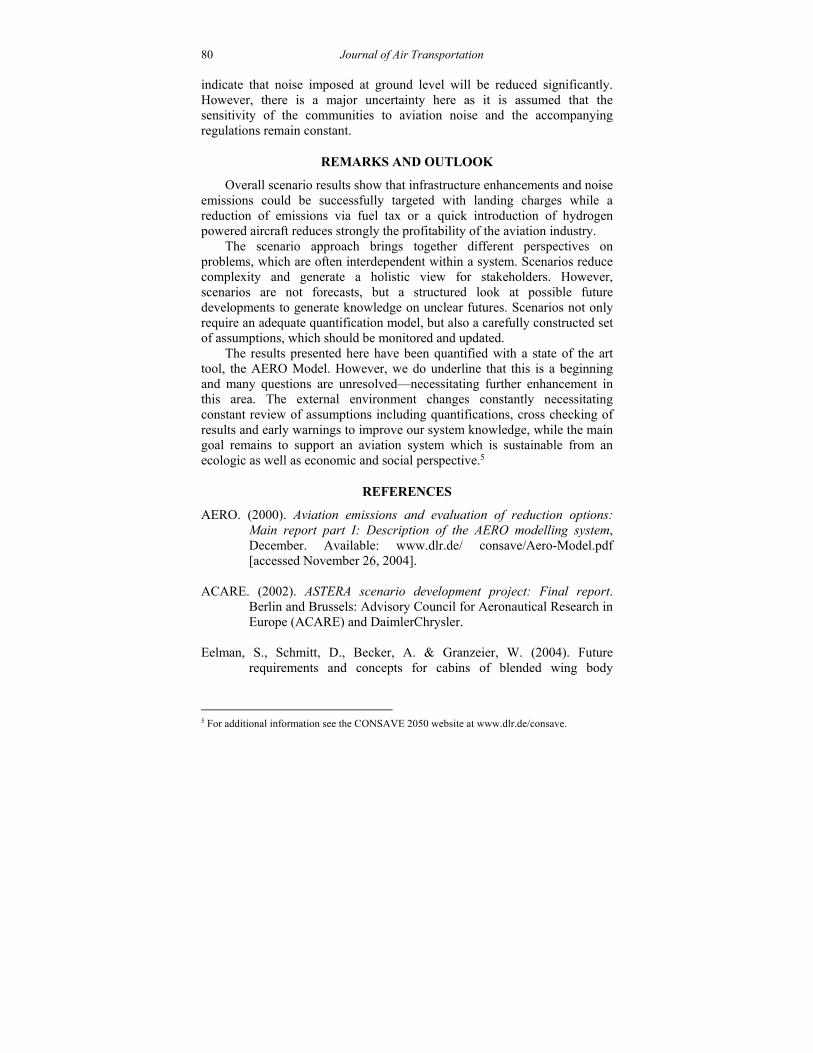
80 Journal of Air Transportation
indicate that noise imposed at ground level will be reduced significantly. However, there is a major uncertainty here as it is assumed that the sensitivity of the communities to aviation noise and the accompanying regulations remain constant.
REMARKS AND OUTLOOK
Overall scenario results show that infrastructure enhancements and noise emissions could be successfully targeted with landing charges while a reduction of emissions via fuel tax or a quick introduction of hydrogen powered aircraft reduces strongly the profitability of the aviation industry.
The scenario approach brings together different perspectives on problems, which are often interdependent within a system. Scenarios reduce complexity and generate a holistic view for stakeholders. However, scenarios are not forecasts, but a structured look at possible future developments to generate knowledge on unclear futures. Scenarios not only require an adequate quantification model, but also a carefully constructed set of assumptions, which should be monitored and updated.
The results presented here have been quantified with a state of the art tool, the AERO Model. However, we do underline that this is a beginning and many questions are unresolved—necessitating further enhancement in this area. The external environment changes constantly necessitating constant review of assumptions including quantifications, cross checking of results and early warnings to improve our system knowledge, while the main goal remains to support an aviation system which is sustainable from an ecologic as well as economic and social perspective.5
REFERENCES
AERO. (2000). Aviation emissions and evaluation of reduction options: Main report part I: Description of the AERO modelling system, December. Available: www.dlr.de/ consave/Aero-Model.pdf [accessed November 26, 2004].
ACARE. (2002). ASTERA scenario development project: Final report.
Berlin and Brussels: Advisory Council for Aeronautical Research in Europe (ACARE) and DaimlerChrysler.
Eelman, S., Schmitt, D., Becker, A. & Granzeier, W. (2004). Future
requirements and concepts for cabins of blended wing body
5 For additional information see the CONSAVE 2050 website at www.dlr.de/consave.
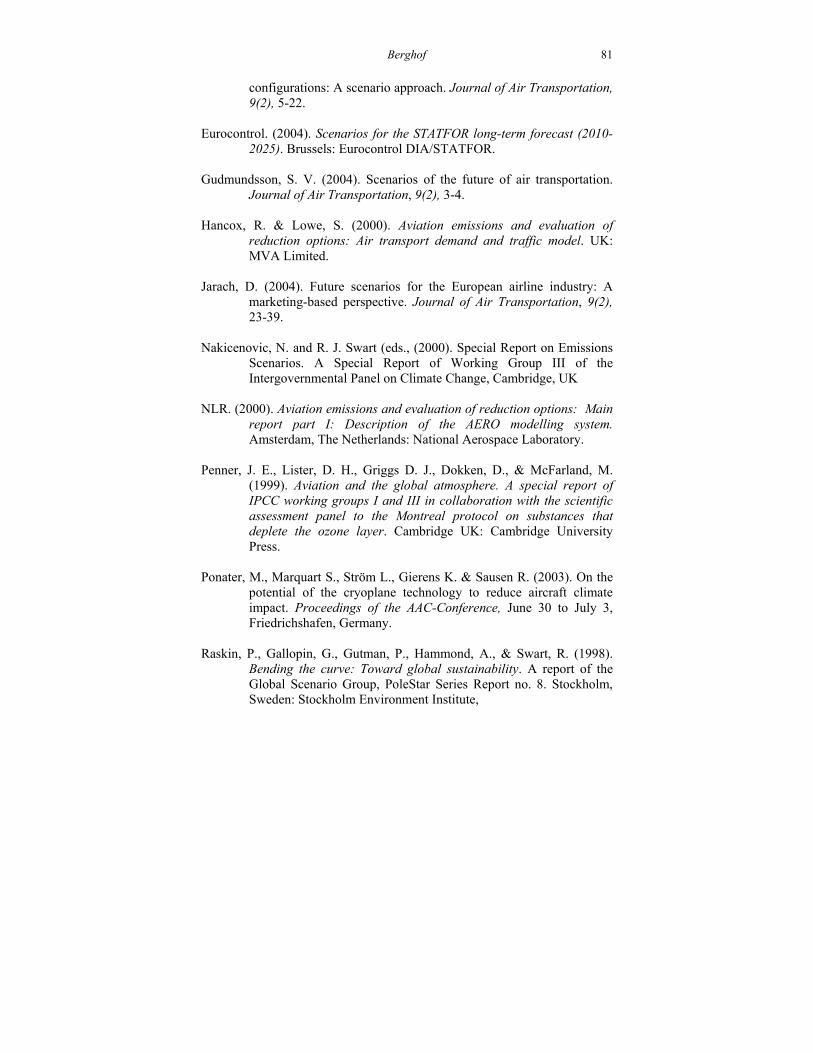
Berghof 81
configurations: A scenario approach. Journal of Air Transportation, 9(2), 5-22.
Eurocontrol. (2004). Scenarios for the STATFOR long-term forecast (2010-
2025). Brussels: Eurocontrol DIA/STATFOR. Gudmundsson, S. V. (2004). Scenarios of the future of air transportation.
Journal of Air Transportation, 9(2), 3-4. Hancox, R. & Lowe, S. (2000). Aviation emissions and evaluation of
reduction options: Air transport demand and traffic model. UK: MVA Limited.
Jarach, D. (2004). Future scenarios for the European airline industry: A
marketing-based perspective. Journal of Air Transportation, 9(2), 23-39.
Nakicenovic, N. and R. J. Swart (eds., (2000). Special Report on Emissions
Scenarios. A Special Report of Working Group III of the Intergovernmental Panel on Climate Change, Cambridge, UK
NLR. (2000). Aviation emissions and evaluation of reduction options: Main
report part I: Description of the AERO modelling system. Amsterdam, The Netherlands: National Aerospace Laboratory.
Penner, J. E., Lister, D. H., Griggs D. J., Dokken, D., & McFarland, M.
(1999). Aviation and the global atmosphere. A special report of IPCC working groups I and III in collaboration with the scientific assessment panel to the Montreal protocol on substances that deplete the ozone layer. Cambridge UK: Cambridge University Press.
Ponater, M., Marquart S., Ström L., Gierens K. & Sausen R. (2003). On the
potential of the cryoplane technology to reduce aircraft climate impact. Proceedings of the AAC-Conference, June 30 to July 3, Friedrichshafen, Germany.
Raskin, P., Gallopin, G., Gutman, P., Hammond, A., & Swart, R. (1998).
Bending the curve: Toward global sustainability. A report of the Global Scenario Group, PoleStar Series Report no. 8. Stockholm, Sweden: Stockholm Environment Institute,
82 Journal of Air Transportation
Raskin, P., Banuri, T., Gallopin, G., Gutman, P., Hammond, A., & Kates R. (2002). Great transition: The promise and lure of the times ahead. A report of the Global Scenario Group, PoleStar Series Report no. 10. Boston, MA: Stockholm Environment Institute.
Shell. (2001). Energy needs, choices and possibilities: Scenarios to 2050.
London, UK: Shell International Limited. Shell. (2002). People and connections: Global scenarios to 2020. London,
UK: Shell International Limited. The Millennium Project. (2002). Global exploratory scenarios. Available:
www.acunu.org/millennium/scenarios/explor-s.html [accessed June, 20 2002].
Urbatzka, E. & Wilken, D. (2004). Future airport capacity utilization in
Germany: Peaked congestion and/or idle capacity. Journal of Air Transportation, 9(2), 111-132.
Journal of Air Transportation Vol. 10, No. 2 - 2005
© 2005, Aviation Institute, University of Nebraska at Omaha
THE IMMEDIATE FINANCIAL IMPACT OF
TRANSPORTATION DEREGULATION ON THE
STOCKHOLDERS OF THE AIRLINE INDUSTRY
Joe B. Hanna Auburn University Auburn, Alabama
Robert A. Kunkel
University of Wisconsin Oshkosh Oshkosh, Wisconsin
Gregory A. Kuhlemeyer
Carroll College Waukesha, Wisconsin
Randy Johnson
Auburn University Auburn, Alabama
ABSTRACT
This paper is an empirical study to analyze how a policy of deregulation aimed at one segment of the transportation industry (surface transportation) may indirectly impact the stockholders of another segment of the industry (airlines). The U.S. government eliminated the Interstate Commerce Commission (ICC) effective January 1, 1996. Previous research has shown termination of the ICC benefited surface transportation providers. However, what is unclear is whether or not the trend towards transportation deregulation impacts segments of the industry not directly targeted by the deregulation. The current study shows that, while airlines received a short-term, indirect positive financial impact from termination of the ICC, the impact was not statistically significant. Results show that transportation deregulation legislation must be specifically targeted to a particular segment of an industry and no carry over effect into other segments of the transportation industry appears to occur.
_____________________________________________________________________________ Joe B. Hanna, PhD. New Mexico State University, is an Associate Professor of Logistics in the Department of Aviation Management and Logistics, College of Business, Auburn University. He has published in numerous logistics and business journals and has co-authored or contributed to several logistics and supply chain textbooks.
84 Journal of Air Transportation
INTRODUCTION
Published research in the last dozen years has shown a growing interest in issues surrounding the liberalization of air cargo services (Dresner & Tretheway, 1992; Maillebiau & Hansen, 1995; Marin, 1995; Schipper, Rietveld, & Nijkamp, 2001; Zhang & Zhang, 2002). One driving factor enhancing interest levels in air cargo deregulation has been the recent growth in aviation cargo volume due in large part to an increasingly global marketplace and an increase in the need for expedited and time sensitive shipments. These factors have contributed to an increase in the demand for international airline cargo services, and have intensified the search for a more efficient trade regime (Zhang & Zhang, 2002).
It has been proposed that air cargo rights be separated from air passenger rights when negotiating new international bi-lateral airline service agreements. However, the negotiation of passenger rights might not be easily separated from the negotiation of air cargo rights, especially in the cases of carriers who rely on cargo business for a substantial share of their revenue. In fact, there are still many aviation markets where no specific air cargo rights have been negotiated and carriers are content not to separate passenger and cargo privileges. How should policy experts and bi-lateral airline service agreement negotiators approach the cargo versus passenger debate? Should policy makers approach general deregulation of an industry with broad policy changes, or should they focus on targeted, segment specific policy alterations? The current research builds on prior event study research in transportation to help determine the most prudent approach to transportation deregulation policies.
INDUSTRY GROWTH AND ECONOMIC POLICY ALTERNATIVES
Air cargo is a quickly growing segment of the transportation market when measured in terms of the annual percentage increase of total value of cargo shipped per year (Larson, 1998). As a result, it is becoming increasingly important to understand the impact of regulatory or deregulatory actions on the entire transportation industry and, more _____________________________________________________________________________ Robert A. Kunkel, PhD. University of Tennessee is Associate Professor of Finance, University of Wisconsin Oshkosh. He has published in numerous journals including The Financial Review, Journal of Economics and Finance, and Journal of Financial and Strategic Decisions. Gregory A. Kuhlemeyer , PhD. University of Tennessee, is Associate Professor of Business Administration, Carroll College. He has published in numerous journals including Financial Services Review, Financial Practice and Education, and The Managerial Finance. Randy Johnson, PhD. Ohio University, is Assistant Professor of Aviation Management, Auburn University. Randy is an active researcher and educator, having published several articles dealing with aviation safety and operations while also teaching both college and executive education courses.
Hanna, Kunkel, Kuhlemeyer, and Johnson 85
specifically, on the aviation segment of the industry. Past research has examined the impact on aviation of the Domestic All-Cargo Deregulation Statute of 1977 or the 1979 amendments to the Federal Aviation Act which deregulated domestic cargo air service in the United States (Zhang & Zhang, 2002). These studies have show that directly removing government control over aviation rates and routes has promoted lower rates and improved service to shippers using air cargo transportation (Larson, 1998).
Some research has been performed on the long-term impact of U.S. deregulation specifically aimed at the aviation segment of the transportation industry. However, research has failed to examine the immediate short-term economic impact of a general trend of transportation industry deregulation on an industry segment not directly targeted by a deregulatory policy. This research attempts to determine if transportation industry deregulation aimed at one segment of the industry (surface transportation) has indirectly yielded a positive impact on a segment of the industry (the aviation segment) not directly targeted by the deregulatory policy.
Obtaining a thorough understanding of the positive and negative impacts of regulatory authorities pursuing a general policy of transportation deregulation is of paramount importance to the continued financial health and prosperity of the industry. As the U.S. proceeds into the early twenty-first century, policy makers and industry leaders face the crucial decision of whether or not to deregulate entire industries or industry segments. The dilemma facing policymakers is that there are opposing views as to whether deregulation is beneficial for consumers.
Demsetz (1973) and Peltzman (1977) support the efficient-structure hypothesis and believe that deregulation benefits consumers because it makes the industry more efficient, which in turn results in more products and services for consumers at lower costs. These individuals point to improved competition, lower costs, and improved service to help lobby the U.S. government for continued deregulation. Conversely, others support the structure-performance hypothesis and believe that regulation is necessary to protect consumers by assuring fair prices and ensuring industry stability. Proponents of this view cite a tremendous number of bankruptcies, general destabilization of the workforce, and high concentration levels as primary reasons why additional deregulation of the industry may not be warranted.
Another important issue regarding deregulation is to determine its effects on the owners of companies, and specifically company shareholders. Since managers have a fiduciary responsibility to maximize stockholders wealth, managers need to know whether or not deregulation is beneficial to their stockholders. In other words, if a deregulated business environment is viewed favorably (unfavorably) and leads to an increase (decrease) in stockholders wealth, then managers have a responsibility to support (resist) efforts to further deregulate the industry.
86 Journal of Air Transportation As a result of the above questions, this paper attempts to determine
investor impressions of a general policy trend of transportation deregulation. Specifically, this research examines the carry over effects of deregulation by looking at the impact on one segment of the transportation industry (airline) when deregulation aimed primarily at another segment of the industry (surface transportation) is signed into law. This research differs from past deregulation research in two ways. First, the authors adopt a unique methodology to examine the immediate financial impact of deregulation. Unlike most previous studies that have focused on long-term financial performance, this project isolates the immediate financial impact of general transportation deregulation on the airline industry. Second, most deregulation research focuses solely on the mode(s) of transportation directly targeted by the specific regulatory adjustment. This research examines how a general trend towards industry deregulation in one area of transportation (surface transportation) may be positively perceived by investors and indirectly impact other modes of transportation (Airlines) not directly targeted for deregulation. More specifically, the research question examined is whether the Interstate Commerce Commission (ICC) Termination Act was viewed as favorable by all transportation industry investors or just those investing in the surface transportation companies.
DEVELOPMENT OF RESEARCH HYPOTHESIS
One target area of deregulation has been the elimination of the ICC, America’s oldest regulatory agency, created in 1887 to regulate the railroads. At the time railroads were made up of monopolies and characterized by monopolistic behavior. By the 1990s, the primary responsibility of the ICC was to monitor surface transportation providers to determine whether they complied with federal regulations. But as Congress worked to shrink the federal budget deficit and to further deregulate the transportation industry, the ICC and its $45 million plus budget was soon viewed as expendable and targeted for elimination. Despite opposition from many groups such as unions and railroads, President Clinton signed the ICC Termination Act of 1995, thereby terminating the ICC effective January 1, 1996. The expected impact of the ICC Termination Act was to reduce the federal budget deficit, to allow transportation firms to operate in a freer and more competitive market environment, and to eliminate government red-tape and restrictions. Key provisions of the act included eliminating restrictions on contract carriers, reducing tariff filing requirements, and having less regulation on rates charged.
For the stockholders of all transportation firms, this move could be viewed as positive or negative. For example, one might argue the reduced regulation should reduce operating expenses and increase profits.
Hanna, Kunkel, Kuhlemeyer, and Johnson 87
Conversely, some believe that regulation can serve as a barrier to entry in the market for new firms, enhancing the opportunity for current market participants to enhance their profits in the marketplace. Previous research examining how deregulation has affected the profitability of transportation firms has focused on the long-term financial performance of the targeted industry segment following deregulation (Smith & Grimm, 1987; Corsi & Grimm, 1989; and Winston, Corsi, Grimm, & Evans, 1990). While this approach has provided valuable insight to managers, there is great uncertainty as to whether the change in financial performance can truly be attributed to deregulation. Over time, other events such as changes in interest rates, changes in oil prices, terrorist attacks, or a major conflict like the Gulf war can significantly affect the financial performance of the transportation industry. Thus, there is a need to determine the immediate financial impact of deregulation on the stockholders of transportation firms.
Past research (Hanna, Kunkel, & Kuhlemeyer, 1999) has shown that the ICC Termination Act was perceived to be positive by shareholders of surface transportation providers. What is not clear is whether termination of the ICC was viewed as a positive move towards deregulation by investors of all segments of the transportation industry or just those in the surface transportation segments of the industry. Researchers believe that if termination of the ICC positively impacts non-surface transportation providers (e.g., the airline industry), then a general trend of transportation deregulation in one segment of the industry (surface transportation) may appear to have carry over effects on all segments of the transportation industry.
This paper examines if ICC termination was viewed as a positive development in the airline industry as denoted by increased stockholders’ wealth or, conversely, was it viewed as unfavorable, thereby decreasing stockholders’ wealth. If the stockholders’ wealth increased, then the stock prices of publicly traded airline firms would have increased when it was publicly announced that President Clinton had signed the ICC Termination Act. The results of this research allow for a determination of the response of the stock market to specific mid-1990 deregulation and to provide information on its financial impact on the airline industry.
DESCRIPTION OF RESEARCH METHOD
We formed a sample of transportation firms that included twenty-four airlines. To be included in the sample, a firm must have met four requirements. One, the firm’s primary SIC code must have been 451 (airlines). Two, the firm must have been publicly traded on the New York Stock Exchange (NYSE), the American Stock Exchange (AMEX), or the NASDAQ stock market. Three, the firm must have had daily returns over an
88 Journal of Air Transportation
eleven-day event period.1 Four, the firm must not have had any major news announcement reported in the Wall Street Journal Index during the eleven-day event period. Additionally, we checked the Wall Street Journal Index for any major industry announcements that would have contaminated the stock returns for all companies in that industry.
We used an event study methodology (c.f., Brown & Warner, 1980; 1985; Peterson, 1989) to determine the immediate impact of the ICC Termination Act of 1995 on the stock prices of airline firms. It is possible to isolate the immediate impact of an event on stock prices because of two unique characteristics of stock prices. One, stock prices are a function of the firm’s expected future earnings. Two, stock prices react quickly and efficiently to an announcement of an event that impacts the firm’s expected future earnings. Thus, the announcement of an event such as deregulation that is perceived by investors to increase (decrease) the future expected earnings of a firm will result in an immediate stock price increase (decrease). This means that managers can immediately gauge the expected economic impact on their firm or industry by examining the firm’s stock price reaction to an event via an event study methodology.
The event study methodology subdivides a stock price change (or stock return) into two components. The first component of the stock return is attributed to a general stock market movement. The second component of the stock return is attributed to an informational event. In this study the ICC Termination Act served as the informational event. We defined an event period that was centered on the announcement date that we called day zero (t = 0). The announcement date was December 29, 1995, which was the date that the Wall Street Journal reported that President Clinton signed the ICC Termination Act into law.2 To capture how the event affected stock prices, an eleven-day event period centered on and surrounding the announcement date was used. Day plus one, (t = 1), was one trading day after the announcement, and so forth with day plus five, (t = 5) being five trading days after the announcement. Day minus one, (t = -1), was one trading day before the announcement, and so forth with day minus five, (t = -5), being five trading days before the announcement.
After identifying the eleven-day event period, we calculated the predicted (or normal) return for each firm for each day in the event period. The predicted return was what we would expect if no event took place.
1 The sample is obtained from the Center for Research in Security Prices (CRSP). All daily stock returns, S&P 500 Index returns, and market value of firms are obtained from CRSP. 2 Although the House of Representatives and Senate had passed their versions of the bill in June 1995 and November 1995, respectively, President Clinton opposed the ICC Termination Act and threatened to veto the bill according to the December 21, 1995, Wall Street Journal. Thus, there was a good chance that the bill would not become law. However, Clinton reversed his position and signed the bill into law the following week.
Hanna, Kunkel, Kuhlemeyer, and Johnson 89
Since the market return is often used as the predicted return, we used the S&P 500 Index as a proxy for the market return.3 Next we calculated the daily excess return for each airline stock for each day over the eleven-day event period. The daily excess return for each firm i on day t, ERit, was defined as:
ERit = Rit - Rmt (1)
where Rit is the return on the stock of firm i on day t and Rmt is the return on the market index (S&P 500 Index) on day t. The daily excess return represents the return not predicted by the market index and is an estimate of the change in the stock price on that day due to the event.
We calculated the average excess return by summing the daily excess returns of the firms each day. The average excess return can then be viewed as a diversified portfolio of airline stocks. This diversified portfolio technique enabled us to use the portfolio to eliminate unique individual stock returns by offsetting random positive stock returns with random negative stock returns. Thus, the average excess return, AERt, captures only the characteristics of the ICC Termination Act and is defined as:
N AERt = [ ERit] / N (2)
i =1
where N is the number of firms in the sample, and ERit is the daily excess return for firm i on day t. Now if the ICC Termination Act did not affect the future returns of airline firms, then the AERt should not be significantly different from zero.
As Masulis (1980) and Dann (1981) explain, it is also necessary to analyze the cumulative average excess returns because in many cases the market reaction to the announcement of an event may be spread over several days. For example, information regarding an event may be leaked to the financial market prior to the event’s announcement. Likewise, it may take analysts and investors several days to completely digest the impact of the event upon future expected earnings. Thus, the cumulative average excess return is an estimate of the stock return that is caused by the event over a period of time. For robustness and completeness, we examined the cumulative average excess returns, CAER-1,t, over several different intervals and defined it as: T
CAER-1,t = AERt (3) t =1
3 The S&P 500 Index is a value weighted market index of 500 large domestic corporations whose market capitalization represents approximately 75 percent of the market capitalization value of all publicly traded corporations in the U.S. Hence, the S&P 500 return is a good proxy for the overall equity market return.
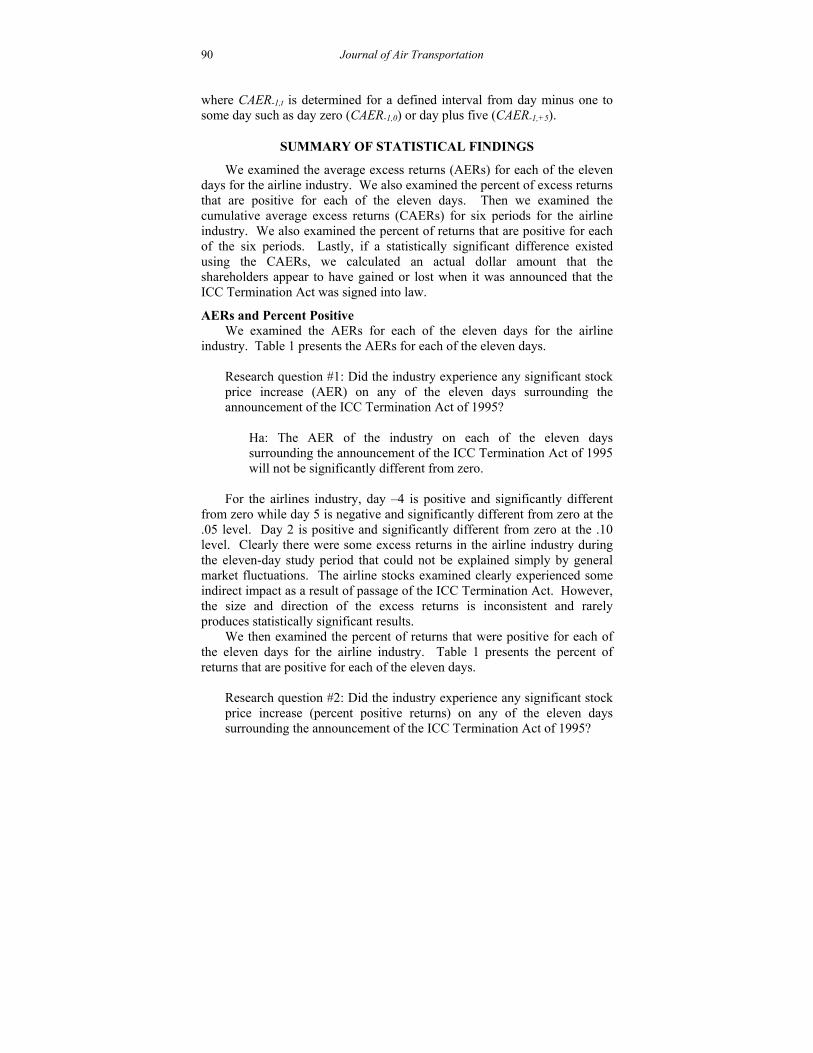
90 Journal of Air Transportation
where CAER-1,t is determined for a defined interval from day minus one to some day such as day zero (CAER-1,0) or day plus five (CAER-1,+5).
SUMMARY OF STATISTICAL FINDINGS
We examined the average excess returns (AERs) for each of the eleven days for the airline industry. We also examined the percent of excess returns that are positive for each of the eleven days. Then we examined the cumulative average excess returns (CAERs) for six periods for the airline industry. We also examined the percent of returns that are positive for each of the six periods. Lastly, if a statistically significant difference existed using the CAERs, we calculated an actual dollar amount that the shareholders appear to have gained or lost when it was announced that the ICC Termination Act was signed into law.
AERs and Percent Positive We examined the AERs for each of the eleven days for the airline
industry. Table 1 presents the AERs for each of the eleven days. Research question #1: Did the industry experience any significant stock price increase (AER) on any of the eleven days surrounding the announcement of the ICC Termination Act of 1995?
Ha: The AER of the industry on each of the eleven days surrounding the announcement of the ICC Termination Act of 1995 will not be significantly different from zero.
For the airlines industry, day –4 is positive and significantly different from zero while day 5 is negative and significantly different from zero at the .05 level. Day 2 is positive and significantly different from zero at the .10 level. Clearly there were some excess returns in the airline industry during the eleven-day study period that could not be explained simply by general market fluctuations. The airline stocks examined clearly experienced some indirect impact as a result of passage of the ICC Termination Act. However, the size and direction of the excess returns is inconsistent and rarely produces statistically significant results.
We then examined the percent of returns that were positive for each of the eleven days for the airline industry. Table 1 presents the percent of returns that are positive for each of the eleven days.
Research question #2: Did the industry experience any significant stock price increase (percent positive returns) on any of the eleven days surrounding the announcement of the ICC Termination Act of 1995?
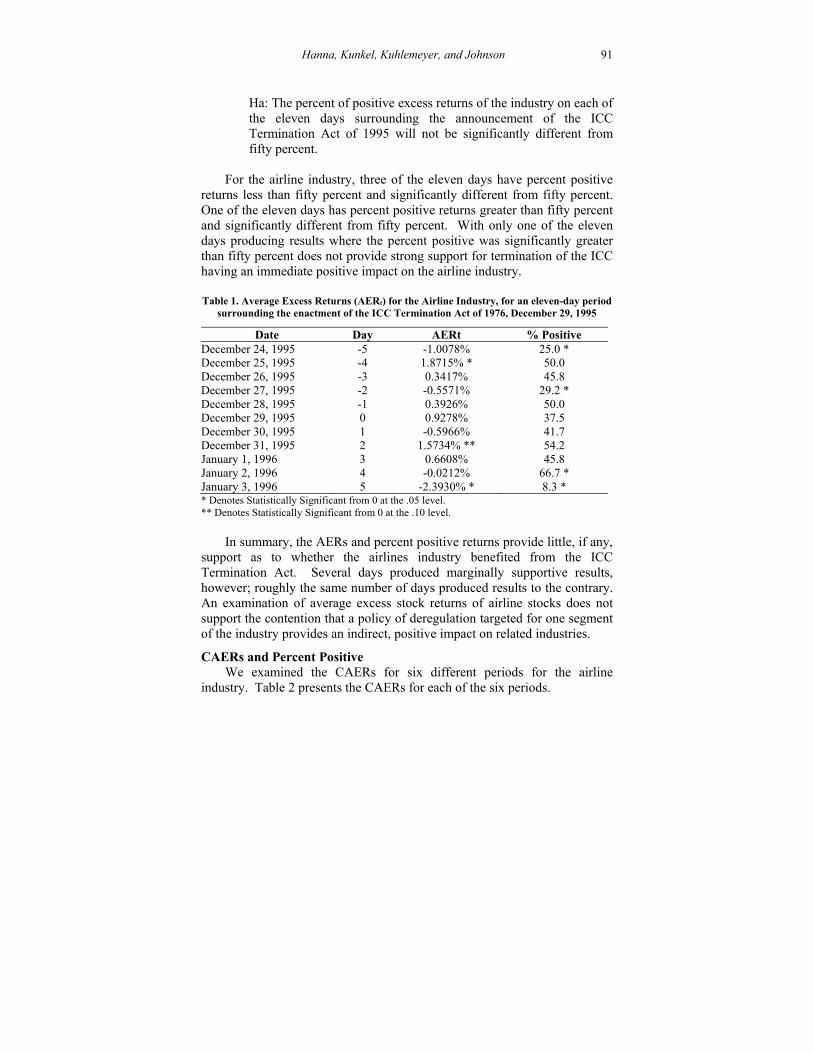
Hanna, Kunkel, Kuhlemeyer, and Johnson 91
Ha: The percent of positive excess returns of the industry on each of the eleven days surrounding the announcement of the ICC Termination Act of 1995 will not be significantly different from fifty percent.
For the airline industry, three of the eleven days have percent positive
returns less than fifty percent and significantly different from fifty percent. One of the eleven days has percent positive returns greater than fifty percent and significantly different from fifty percent. With only one of the eleven days producing results where the percent positive was significantly greater than fifty percent does not provide strong support for termination of the ICC having an immediate positive impact on the airline industry.
Table 1. Average Excess Returns (AERt) for the Airline Industry, for an eleven-day period surrounding the enactment of the ICC Termination Act of 1976, December 29, 1995
Date Day AERt % Positive December 24, 1995 -5 -1.0078% 25.0 * December 25, 1995 -4 1.8715% * 50.0 December 26, 1995 -3 0.3417% 45.8 December 27, 1995 -2 -0.5571% 29.2 * December 28, 1995 -1 0.3926% 50.0 December 29, 1995 0 0.9278% 37.5 December 30, 1995 1 -0.5966% 41.7 December 31, 1995 2 1.5734% ** 54.2 January 1, 1996 3 0.6608% 45.8 January 2, 1996 4 -0.0212% 66.7 * January 3, 1996 5 -2.3930% * 8.3 * * Denotes Statistically Significant from 0 at the .05 level. ** Denotes Statistically Significant from 0 at the .10 level.
In summary, the AERs and percent positive returns provide little, if any,
support as to whether the airlines industry benefited from the ICC Termination Act. Several days produced marginally supportive results, however; roughly the same number of days produced results to the contrary. An examination of average excess stock returns of airline stocks does not support the contention that a policy of deregulation targeted for one segment of the industry provides an indirect, positive impact on related industries.
CAERs and Percent Positive We examined the CAERs for six different periods for the airline
industry. Table 2 presents the CAERs for each of the six periods.
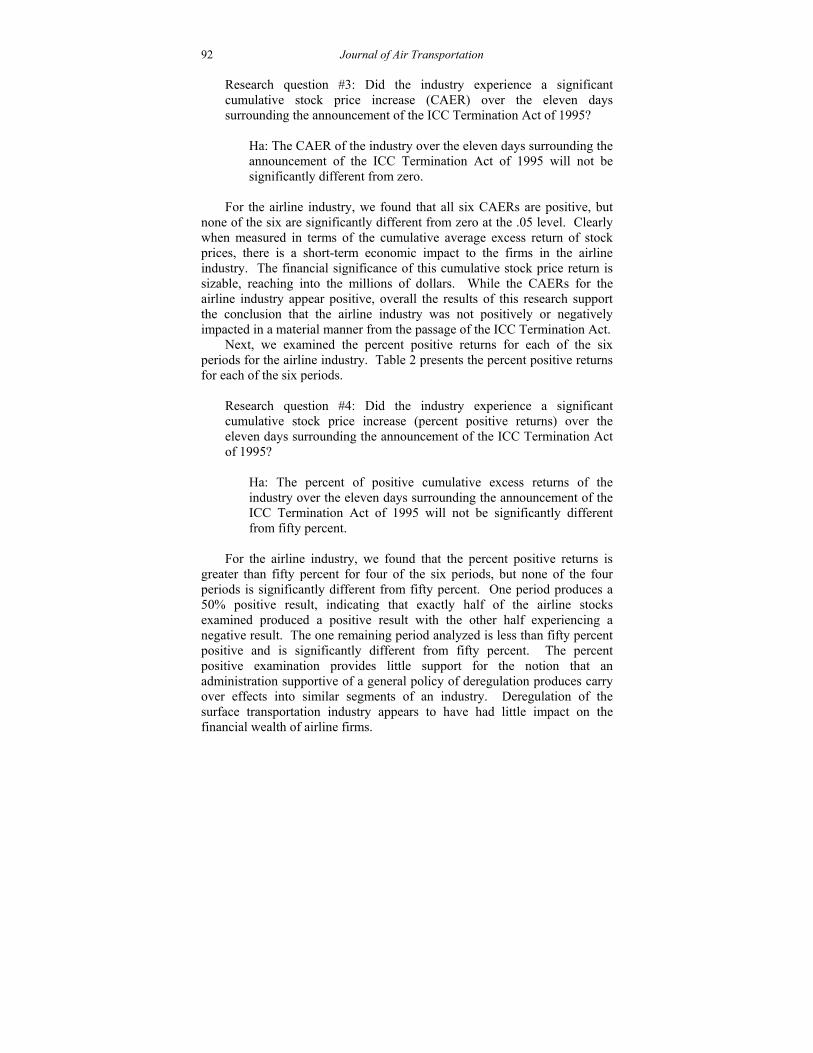
92 Journal of Air Transportation Research question #3: Did the industry experience a significant cumulative stock price increase (CAER) over the eleven days surrounding the announcement of the ICC Termination Act of 1995?
Ha: The CAER of the industry over the eleven days surrounding the announcement of the ICC Termination Act of 1995 will not be significantly different from zero.
For the airline industry, we found that all six CAERs are positive, but
none of the six are significantly different from zero at the .05 level. Clearly when measured in terms of the cumulative average excess return of stock prices, there is a short-term economic impact to the firms in the airline industry. The financial significance of this cumulative stock price return is sizable, reaching into the millions of dollars. While the CAERs for the airline industry appear positive, overall the results of this research support the conclusion that the airline industry was not positively or negatively impacted in a material manner from the passage of the ICC Termination Act.
Next, we examined the percent positive returns for each of the six periods for the airline industry. Table 2 presents the percent positive returns for each of the six periods.
Research question #4: Did the industry experience a significant cumulative stock price increase (percent positive returns) over the eleven days surrounding the announcement of the ICC Termination Act of 1995?
Ha: The percent of positive cumulative excess returns of the industry over the eleven days surrounding the announcement of the ICC Termination Act of 1995 will not be significantly different from fifty percent.
For the airline industry, we found that the percent positive returns is greater than fifty percent for four of the six periods, but none of the four periods is significantly different from fifty percent. One period produces a 50% positive result, indicating that exactly half of the airline stocks examined produced a positive result with the other half experiencing a negative result. The one remaining period analyzed is less than fifty percent positive and is significantly different from fifty percent. The percent positive examination provides little support for the notion that an administration supportive of a general policy of deregulation produces carry over effects into similar segments of an industry. Deregulation of the surface transportation industry appears to have had little impact on the financial wealth of airline firms.
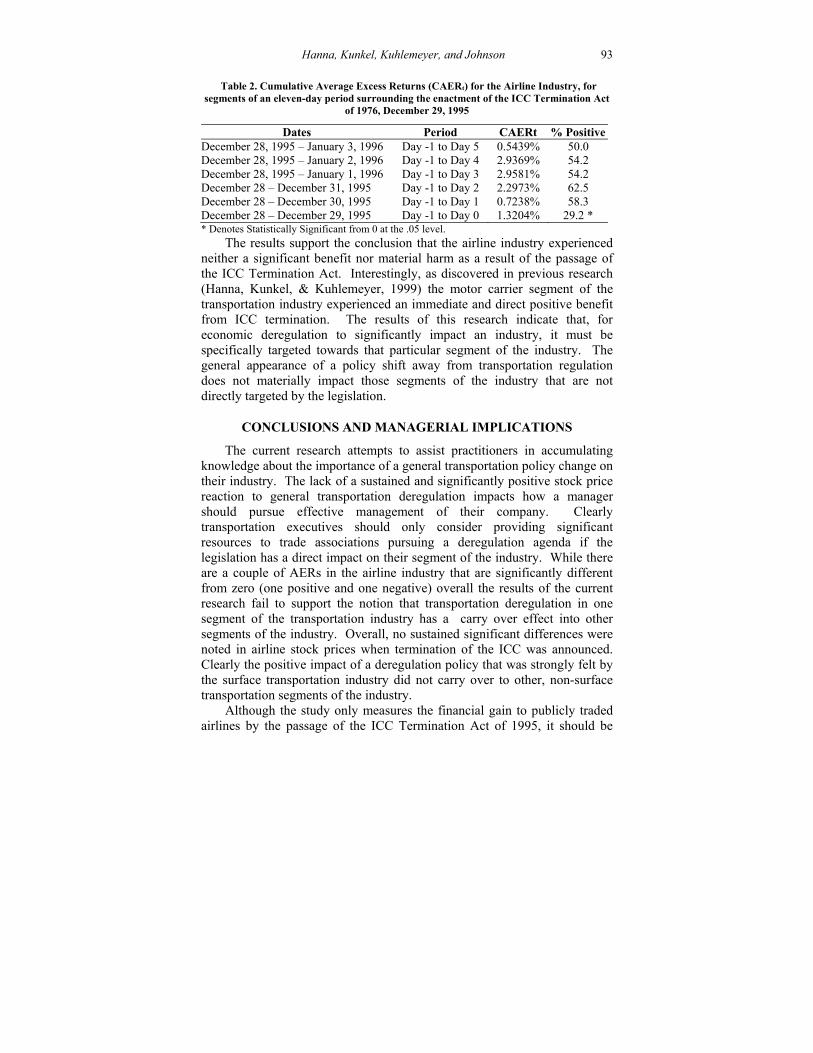
Hanna, Kunkel, Kuhlemeyer, and Johnson 93
Table 2. Cumulative Average Excess Returns (CAERt) for the Airline Industry, for
segments of an eleven-day period surrounding the enactment of the ICC Termination Act of 1976, December 29, 1995
Dates Period CAERt % Positive December 28, 1995 – January 3, 1996 Day -1 to Day 5 0.5439% 50.0 December 28, 1995 – January 2, 1996 Day -1 to Day 4 2.9369% 54.2 December 28, 1995 – January 1, 1996 Day -1 to Day 3 2.9581% 54.2 December 28 – December 31, 1995 Day -1 to Day 2 2.2973% 62.5 December 28 – December 30, 1995 Day -1 to Day 1 0.7238% 58.3 December 28 – December 29, 1995 Day -1 to Day 0 1.3204% 29.2 * * Denotes Statistically Significant from 0 at the .05 level.
The results support the conclusion that the airline industry experienced neither a significant benefit nor material harm as a result of the passage of the ICC Termination Act. Interestingly, as discovered in previous research (Hanna, Kunkel, & Kuhlemeyer, 1999) the motor carrier segment of the transportation industry experienced an immediate and direct positive benefit from ICC termination. The results of this research indicate that, for economic deregulation to significantly impact an industry, it must be specifically targeted towards that particular segment of the industry. The general appearance of a policy shift away from transportation regulation does not materially impact those segments of the industry that are not directly targeted by the legislation.
CONCLUSIONS AND MANAGERIAL IMPLICATIONS
The current research attempts to assist practitioners in accumulating knowledge about the importance of a general transportation policy change on their industry. The lack of a sustained and significantly positive stock price reaction to general transportation deregulation impacts how a manager should pursue effective management of their company. Clearly transportation executives should only consider providing significant resources to trade associations pursuing a deregulation agenda if the legislation has a direct impact on their segment of the industry. While there are a couple of AERs in the airline industry that are significantly different from zero (one positive and one negative) overall the results of the current research fail to support the notion that transportation deregulation in one segment of the transportation industry has a carry over effect into other segments of the industry. Overall, no sustained significant differences were noted in airline stock prices when termination of the ICC was announced. Clearly the positive impact of a deregulation policy that was strongly felt by the surface transportation industry did not carry over to other, non-surface transportation segments of the industry.
Although the study only measures the financial gain to publicly traded airlines by the passage of the ICC Termination Act of 1995, it should be
94 Journal of Air Transportation
pointed out that deregulation also produces financial gains for other stakeholders including taxpayers, shippers, and consumers. Taxpayers who do not have to pay the cost of operating unnecessary government agencies (e.g., ICC) realize a financial benefit since they are no longer required to fund the agency through federal tax dollars. Customers (e.g., shippers and consumers) also benefit financially since deregulation tends to increase competition in the industry, oftentimes increasing service levels and decreasing costs. The result is a better overall value for the many customers of the industry.
While carry over effects from one segment of the industry to another appear not to be statistically significant, there is a short-term positive financial impact felt by the airline industry. Furthermore, clearly there is a positive financial impact felt by the segment of the industry that is directly impacted by deregulation. Occasionally managers of one segment of the transportation industry will argue that their business will be negatively impacted if another segment of the industry experiences deregulation. Current research indicates that, while the segment of the industry targeted by deregulation experiences a positive benefit, other segments of the industry are not harmed in a significant manner. Therefore, in general terms, it appears economic deregulation yields positive short-term economic benefits to the industry when examined in its entirety.
The current research illustrates that a general trend of transportation deregulation by the government does not sufficiently impact all segments of the industry. If regulators are to achieve the positive economic impacts desired from deregulation, they must study each market segment thoroughly and then implement policies aimed at altering economic operating conditions in that segment. Successful deregulatory policies will only be achieved if regulatory bodies avoid a broad, general trend towards deregulation in favor of targeting each segment individually and implement specific, targeted policies as opposed to a broad, general deregulatory policy.
REFERENCES
Brown, S. J. & Warner, J. B. (1980). Measuring security price performance. Journal of Financial Economics, 8, 205-258.
Brown, S. J. & Warner, J. B. (1985). Using daily stock returns: The case of event studies. Journal of Financial Economics, 14, 3-32.
Corsi, T. M. & Grimm, C. M. (1989). Strategies and performance in the truckload general freight segment before and after deregulation. Journal of Transportation Research, 30(1), 92-97.
Dann, L.Y. (1981). Common stock repurchases. Journal of Financial Economics, 9, 113-138.
Hanna, Kunkel, Kuhlemeyer, and Johnson 95
Demsetz, H. (1973). Industry structure, market rivalry, and public policy.
Journal of Law and Economics, 16, 1-9.
Dresner, M. & Tretheway, M. W. (1992). Modeling and testing the effect of market structure on price: The case of international air transport. Journal of Transport Economics and Policy, 26(2), 171–184.
Hanna, J. B., Kunkel, R. A., & Kuhlemeyer G. A. (1999). A financial analysis of the Interstate Commerce Commission Termination Act of 1995 on the motor carrier industry. Journal of Transportation Management, 11, 23-36.
Larson, P. (1998). Air cargo deregulation and JIT: Two 20th anniversaries in American logistics. Transportation Quarterly, 52(2), 49–60.
Maillebiau, E. & Hansen, M. (1995). Demand and consumer welfare impacts of International airline liberalization: The case of the North Atlantic. Journal of Transport Economics and Policy, 29(2), 115–136.
Marin, P. L. (1995). Competition in European aviation: Pricing policy and market structure. Journal of Industrial Economics, 43(2), 141–159.
Masulis, R. W. (1980). The effect of capital structure change on security prices. Journal of Financial Economics, 8, 139-178.
Peltzman, S. (1977). The gains and losses from industrial concentration. Journal of Law and Economics, 20, 229-263.
Peterson, P. P. (1989). Event studies: A review of issues and methodology, Quarterly Journal of Business and Economics, 36-66.
Schipper Y., Rietveld, P., & Nijkamp, P. (2002). European airline reform: An empirical welfare analysis. Journal of Transport Economics and Policy, (36), 2, 189-199.
Smith, K. G. & Grimm, C. M. (1987). Environmental variation, strategic change and firm performance: A study of railroad deregulation. Strategic Management Journal, 8(1), 363-376.
Winston, C., Corsi, T. M., Grimm, C. M., & Evans, C.A. (1990). The economic effects of surface freight deregulation. Washington D.C.: Brookings Institution.
Zhang, A. & Zhang, Y. (2002). A Model of Air Cargo Liberalization: Passenger vs. All-Cargo Carriers, Transportation Research Part E: Logistics and Transportation Review, Vol. 38E, Iss. 3 & 4, p. 175.
Journal of Air Transportation Vol. 10, No. 2 - 2005
© 2005, Aviation Institute, University of Nebraska at Omaha
AVIATION-RELATED AIRPORT MARKETING
IN AN OVERLAPPING METROPOLITAN
CATCHMENT AREA: THE CASE OF MILAN’S
THREE AIRPORTS
David Jarach SDA Bocconi Graduate School of Business
Milan, Italy
ABSTRACT
Milan is the third richest catchment area in Europe, just behind London and Paris, in terms of individual gross domestic product. Nevertheless, airport operations in Milan have not had the same degree of development that one would expect in such a wealthy area. The main reason is due to the existence of three airports located within in the same metropolitan area, which creates a negative offer fragmentation and doesn’t allow for airlines, and especially the hub carrier, to achieve significant returns on investment from improved outputs. Moreover, this situation, in the absence of a market-driven regulatory regime of flight activities able to split operations between the three sites in correlation with their technical, geographical and vocational characteristics, naturally tends to create overlapping and cross-cannibalization. Recent proposals to solve these problems have proved to be short-minded remedies. This paper aims to analyze the current situation of Milan’s metropolitan area for airport operations and propose some innovative regulatory solutions that are needed to make Milan airports more marketable and, thus, create a platform for their distinctive strategic marketing positioning within the European airport scenario.
COMPETITION IN THE AIRPORT BUSINESS: THE NEED FOR A DISTINCTIVE MARKET POSITIONING
Competition in the air transport pipeline is rapidly migrating from airlines to other value chain operators. One of the most dynamic contexts is the one represented by the airport industry.
Here deregulation effects are putting pressure on old patterns of conduct and forcing incumbents and newcomers as well to face new evolutionary strategies. Greenfield sites, or former military sites which are being reconverted to civil operations, are multiplying the number, scope and _____________________________________________________________________________ David Jarach is a Professor of International Marketing at Bocconi University, Milan, a Professor of Air Transportation Marketing at Bocconi’s Graduate School of Business and visiting Professor at Toulouse Business School’s Aerospace MBA and at ESIC, Madrid. He also acts as top advisor for air transport companies.
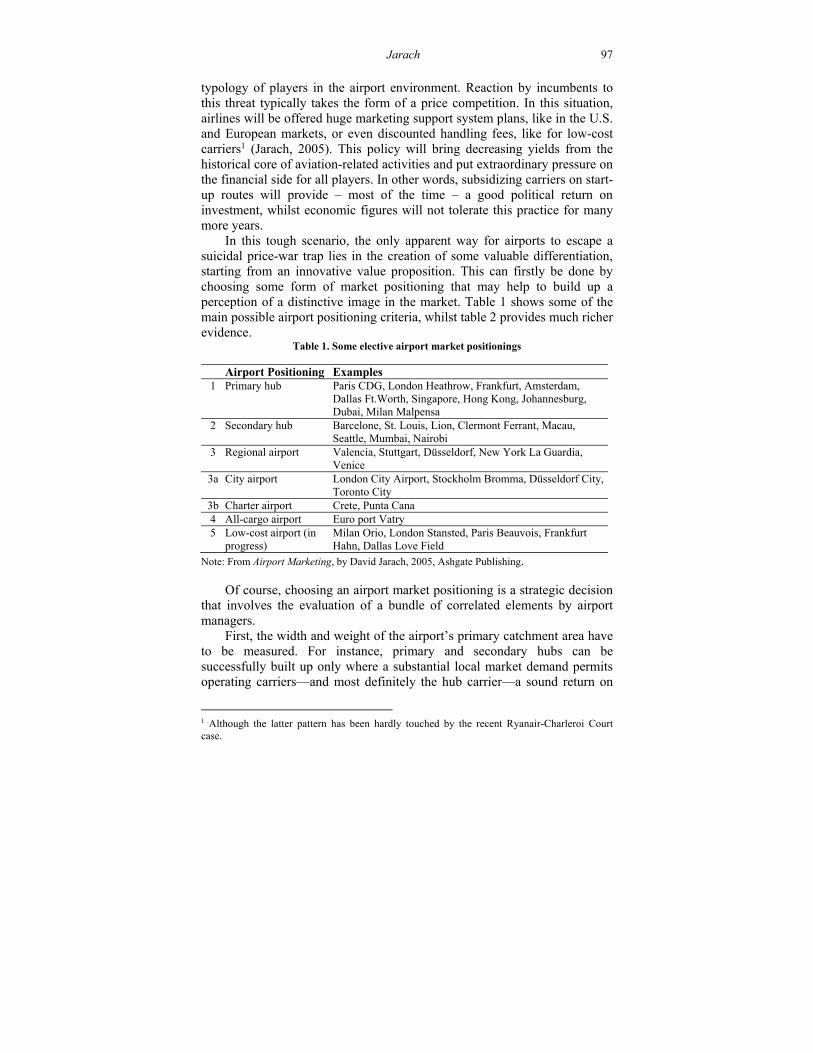
Jarach 97
typology of players in the airport environment. Reaction by incumbents to this threat typically takes the form of a price competition. In this situation, airlines will be offered huge marketing support system plans, like in the U.S. and European markets, or even discounted handling fees, like for low-cost carriers1 (Jarach, 2005). This policy will bring decreasing yields from the historical core of aviation-related activities and put extraordinary pressure on the financial side for all players. In other words, subsidizing carriers on start-up routes will provide – most of the time – a good political return on investment, whilst economic figures will not tolerate this practice for many more years.
In this tough scenario, the only apparent way for airports to escape a suicidal price-war trap lies in the creation of some valuable differentiation, starting from an innovative value proposition. This can firstly be done by choosing some form of market positioning that may help to build up a perception of a distinctive image in the market. Table 1 shows some of the main possible airport positioning criteria, whilst table 2 provides much richer evidence.
Table 1. Some elective airport market positionings
Airport Positioning Examples 1 Primary hub Paris CDG, London Heathrow, Frankfurt, Amsterdam,
Dallas Ft.Worth, Singapore, Hong Kong, Johannesburg, Dubai, Milan Malpensa
2 Secondary hub Barcelone, St. Louis, Lion, Clermont Ferrant, Macau, Seattle, Mumbai, Nairobi
3 Regional airport Valencia, Stuttgart, Düsseldorf, New York La Guardia, Venice
3a City airport London City Airport, Stockholm Bromma, Düsseldorf City, Toronto City
3b Charter airport Crete, Punta Cana 4 All-cargo airport Euro port Vatry 5 Low-cost airport (in
progress) Milan Orio, London Stansted, Paris Beauvois, Frankfurt Hahn, Dallas Love Field
Note: From Airport Marketing, by David Jarach, 2005, Ashgate Publishing. Of course, choosing an airport market positioning is a strategic decision
that involves the evaluation of a bundle of correlated elements by airport managers.
First, the width and weight of the airport’s primary catchment area have to be measured. For instance, primary and secondary hubs can be successfully built up only where a substantial local market demand permits operating carriers—and most definitely the hub carrier—a sound return on
1 Although the latter pattern has been hardly touched by the recent Ryanair-Charleroi Court case.
98 Journal of Air Transportation
investment from these flight operations2. In addition to local, Origin & Destination traffics, Connecting & Transfer (C&T) fluxes are added to raise load factors and achieve some sort of cost economies3 that can improve the hub carrier’s economic viability. The value of a primary catchment area4 will be related to some key factors like the number of living inhabitants, their annual flight propensity, the pace of industrial instalments and, eventually, the strategic role played by the city, like in the case of a State’s capital in which most administrative practices are located.
Second, the package of available multimodal infrastructures—rail, road or even sea—will play a crucial role in extending the airport’s secondary catchment areas5. For instance, high-speed train connections will be a strong multiplier effect of airport traffics, as shown at Paris Charles de Gaulle (CDG) or Frankfurt.
Third, competitive positioning chosen by other airport players will have to be taken into serious account. For instance, geographic proximity between two sites showing significant product portfolio’s similarities will have a highly negative impact on the chances of market success of both players. Moreover, an identical positioning with the one of a neighbouring site will damage an airport’s commercial visibility, especially in the case of grandfather-clause airports that are historically operating in a certain context and, thus, recognised by customers. In this case, a start-up airport will have to adapt a radical innovation in its own positioning to get some chances to survive economically.
Fourth, market positioning options can also be dictated by governmental decisions or restrictions to operations. This is quite common for airports located within metropolitan areas, where noise pollution and gas emissions may emerge as primary issues and force local governments to limit in some way an airport’s operations. Or it could also be the case of a multi-airport condition, where the presence of a number of airports requires that public authorities pose a limit on cross-cannibalization. In the latter case, the built-up of a distinctive market positioning really becomes a must, especially if the ownership of the various airports is the same and is public, too. This is exactly the case of Milan’s metropolitan area, where three airports, namely
2 Typically the average yield from Origin/Destination traffic is much higher than one which is related to transfer traffic. This has a sense, given the fact that transfer passengers have to stopover at an intermediate airport before reaching the end destination, this implying a longer travel time and additional hassles, especially in the post-September 11 scenario. 3 Which sounds like coming from additional revenues from the mixture of local and connecting traffics, on the one hand, and from the achievement of significant economies of scope, density and scale from the hub platform, on the other hand. 4 The dimension of a primary catchment area can typically be calculated by measuring 1-hour drive time in terms of distance from the airport location. 5 A secondary catchment area is the one that usually exceeds the 1-hour drive time area.
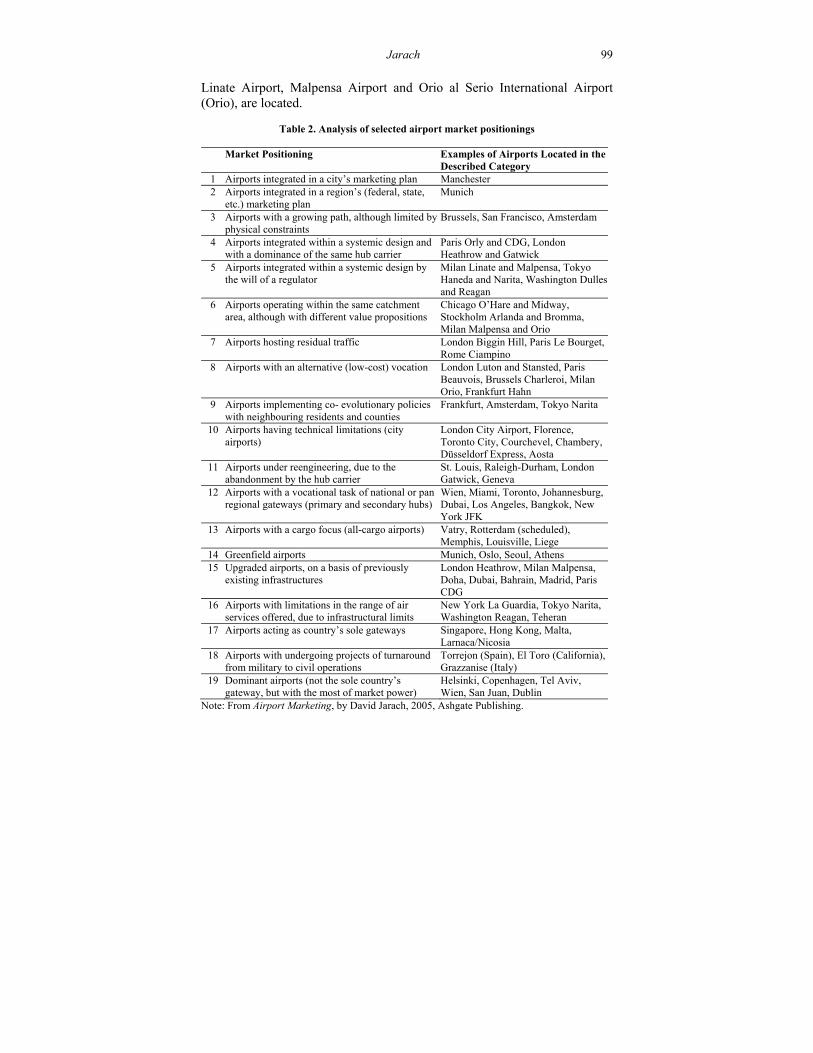
Jarach 99
Linate Airport, Malpensa Airport and Orio al Serio International Airport (Orio), are located.
Table 2. Analysis of selected airport market positionings
Market Positioning Examples of Airports Located in the
Described Category 1 Airports integrated in a city’s marketing plan Manchester 2 Airports integrated in a region’s (federal, state,
etc.) marketing plan Munich
3 Airports with a growing path, although limited by physical constraints
Brussels, San Francisco, Amsterdam
4 Airports integrated within a systemic design and with a dominance of the same hub carrier
Paris Orly and CDG, London Heathrow and Gatwick
5 Airports integrated within a systemic design by the will of a regulator
Milan Linate and Malpensa, Tokyo Haneda and Narita, Washington Dulles and Reagan
6 Airports operating within the same catchment area, although with different value propositions
Chicago O’Hare and Midway, Stockholm Arlanda and Bromma, Milan Malpensa and Orio
7 Airports hosting residual traffic London Biggin Hill, Paris Le Bourget, Rome Ciampino
8 Airports with an alternative (low-cost) vocation London Luton and Stansted, Paris Beauvois, Brussels Charleroi, Milan Orio, Frankfurt Hahn
9 Airports implementing co- evolutionary policies with neighbouring residents and counties
Frankfurt, Amsterdam, Tokyo Narita
10 Airports having technical limitations (city airports)
London City Airport, Florence, Toronto City, Courchevel, Chambery, Düsseldorf Express, Aosta
11 Airports under reengineering, due to the abandonment by the hub carrier
St. Louis, Raleigh-Durham, London Gatwick, Geneva
12 Airports with a vocational task of national or pan regional gateways (primary and secondary hubs)
Wien, Miami, Toronto, Johannesburg, Dubai, Los Angeles, Bangkok, New York JFK
13 Airports with a cargo focus (all-cargo airports) Vatry, Rotterdam (scheduled), Memphis, Louisville, Liege
14 Greenfield airports Munich, Oslo, Seoul, Athens 15 Upgraded airports, on a basis of previously
existing infrastructures London Heathrow, Milan Malpensa, Doha, Dubai, Bahrain, Madrid, Paris CDG
16 Airports with limitations in the range of air services offered, due to infrastructural limits
New York La Guardia, Tokyo Narita, Washington Reagan, Teheran
17 Airports acting as country’s sole gateways Singapore, Hong Kong, Malta, Larnaca/Nicosia
18 Airports with undergoing projects of turnaround from military to civil operations
Torrejon (Spain), El Toro (California), Grazzanise (Italy)
19 Dominant airports (not the sole country’s gateway, but with the most of market power)
Helsinki, Copenhagen, Tel Aviv, Wien, San Juan, Dublin
Note: From Airport Marketing, by David Jarach, 2005, Ashgate Publishing.
100 Journal of Air Transportation MILAN’S LINATE AND MALPENSA AIRPORTS: CROSS-
CANNIBALIZ
According to all economic studies, the Milan area is the third richest in Europe, after London and Paris, in terms of individual gross domestic product. Moreover, Milan is the main industrial and trade centre in Italy, with many multinationals’ headquarters located in its suburbs and with strong local industrial and service platforms, too. This condition creates a basis for strong inbound and outbound traffic that is exacerbated by two other significant aspects: a strong fashion district located in Milan downtown (Milan is considered the world’s capital of ready to wear fashions) and a buoyant fair business that has recently reinforced its own visibility in the international market thanks to additional available exhibition spaces. In addition, a strong outgoing leisure demand, typically concentrated during Christmas and Easter periods and in July-August, originates from Milan’s primary catchment area that hosts more than 5 million inhabitants.
After the Second World War, local governments decided to develop an airport at Linate, an airfield located just 7 kilometres from downtown Milan. On the contrary, an existing airfield at Malpensa, 50 kilometres northbound from Milan and actually closer to Varese, was considered a secondary site with only a few intercontinental point-to-point services and since the 1980s all charter services were located there. Finally, a third site was being developed at Orio al Serio, 60 kilometres eastbound of Milan in the Bergamo province.
The late 1970s and early 1980s saw a dramatic increase in passenger numbers for Linate, which started to face tough congestion, due to the fact that there was actually no space for the airport’s expansion, as its own boundaries were completely surrounded by factories and houses. Moreover, its main6 runway was only 2,440 kilometers long, preventing intercontinental services to be started. Extemporary solutions, like the mentioned transfer of charters to Malpensa, did not solve the situation, as all 34 parking spaces available on tarmac were constantly occupied by daily operations. Some carriers, like Alitalia, British Airways and Iberia started to use wide-bodied aircraft to improve their capacity given slot constraints, but, once again, this option still did not mitigate the massive increase in air travel demand. In fact, given the absence of direct intercontinental services from Linate, most European carriers were targeting the Milan area to attract extra long-haul passengers to their hubs. The chance to exploit these so-called sixth freedom rights was mainly in the hands of foreign carriers. The domestic operator, Alitalia was experiencing a lower power of attraction due to its thinner hub at Rome Fiumicino.
6 Linate has another parallel runway, but it is only 700 meters long and scarcely used for general aviation movements.
Jarach 101
At those times, thus, SEA, the airport operator for both Linate and
Malpensa, decided to launch a substantial upgrade of Malpensa facilities dubbing it the Malpensa 2000 project. This consisted of construction of a new three-pier terminal, a cargo city, a light railway link with downtown Milan, plus a complete renovation of the two existing 4,000 meters runways. SEA’s goal was to substantially improve Milan’s airport capacity and, as a consequence, promote wider air accessibility to the area. In the end, the transfer of most of Linate’s air services would have created such a critical mass as to establish a new primary hub in Malpensa. This project was clearly welcomed by Alitalia, both due to its role as flagship and State-owned carrier and to the fact that more than 70% of Italian air traffic was originating in the Northern part of Italy and, thus, significant chances to compact it on Malpensa were in sight.
Although Malpensa’s upgrade was kicked off in the early 1980s, the official inauguration came only in 1998. A lot of problems, like delays in the financing procedures by European bodies7 and investigations on bribes paid to politicians by engineering companies, may explain the delay. The official opening of the new Malpensa 2000, actually, came when only two-thirds of the infrastructure was built and while no cargo city and railway link were yet on the field.
An initial governmental decree, named Burlando Decree, imposed that all flights, except Milan-Rome ones, would be transferred to Linate. However, lobbying activities by sixth freedom holders—notably Lufthansa and British Airways—sought a reverse and then a block of the decree. A number of other decrees were then promulgated and each time Malpensa was losing flights that were coming back to Linate. The last one, known as Bersani-Two Decree,8 put into action in 2001 and still in practice, establishes that all-intra European connections with States’ capitals or Zone 1 areas9 be operated from Linate, although with limitations in both frequency and capacity. Table 3 illustrates the traffic dynamics between Linate and Malpensa for the last years, where the cannibalization effect is evident between the two airports, with Linate growing and Malpensa losing traffic.
After an initial supremacy of Malpensa over Linate, due to massive flight transfers, Linate has constantly increased its passenger share since 2001 whilst Malpensa has progressively reduced its traffic. This ex cathedra traffic allocation, thus, made Linate strongly reemphasise itself as a primary catalyser in the airport business and Malpensa to abandon its ambitions to acquire a status of primary hub, due to the decrease both in connecting
7 Basically through European Investment Bank. 8 Bersani and Burlando are the surname of the two ruling Ministers of Transportation at those times. 9 The European Union includes in Zone 1 or Objective 1 areas those less-developed territories, like Portugal or Sicily, for instance.

102 Journal of Air Transportation
flights and in intercontinental services.10 This latter condition is highly correlated to the former one, as a lower online and interline feedering comes to be produced. For instance, all U.S. carriers, expect Delta,11 have closed their Milan services and also Alitalia has been forced to abandon many long-haul services,12 with post-September 11, 2001, market conditions simply exacerbating this downward spiral for Malpensa. Only from 2003, with start-up of some low-cost and full service operations, does the situation seem to be improving. On the contrary, Linate is rapidly reaching its saturation point—estimated around 9 million passengers although the airport has managed in the past to accommodate up to 14 million passengers.13
Table 3. Traffic between Linate and Malpensa airports, 2000-2004, passenger numbers
Jan-Dec 00 Jan-Dec 01 Jan-Dec 02 Jan-Dec 03 Jan-Mar 04
Linate (LIN)
6,026,342 7,136,337 7,815,316 8,757,038 2,102,971
Malpensa (MXP)
20,716,815 18,570,494 17,441,250 17,621,585 3,872,918
Delta increase at LIN over past year
(9.1) 18.4 9.5 12.0 5.3
Delta increase at MXP over past year
22.1 (10.4) (6.1) (1.0) (3.1)
Note: Assaeroporti (Italian association of airports) database.
ORIO’S EVOLUTION
The third airport within Milan’s metropolitan area, Orio, has played a minor role for decades. Its main traffic has consisted for years of diverted movements from Linate in case of poor visibility,14 some summer charter flights to provide additional unplanned capacity and, eventually courier flights. In fact, Orio has acquired over the years the status of primary gateway for the Northern Italian market for DHL, UPS and TNT, although
10 Moreover, premium high-yield traffic is intercepted by Linate, whilst Malpensa mainly receive less significant tourist and visual flight rules traffic. 11 Delta Air Lines is a member of the Skyteam alliance that includes Alitalia, too. 12 From 2001 Alitalia has progressively cut services from Milan to San Francisco, Los Angeles, Bangkok, Hong Kong, Beijing, Nairobi, Addis Ababa, Johannesburg, Rio de Janeiro, Santiago del Chile, Sydney, and Singapore. 13 That is before the opening of Malpensa 2000. 14 In the winter season, the Milan area may prove to be problematic in terms of visibility due to fog.
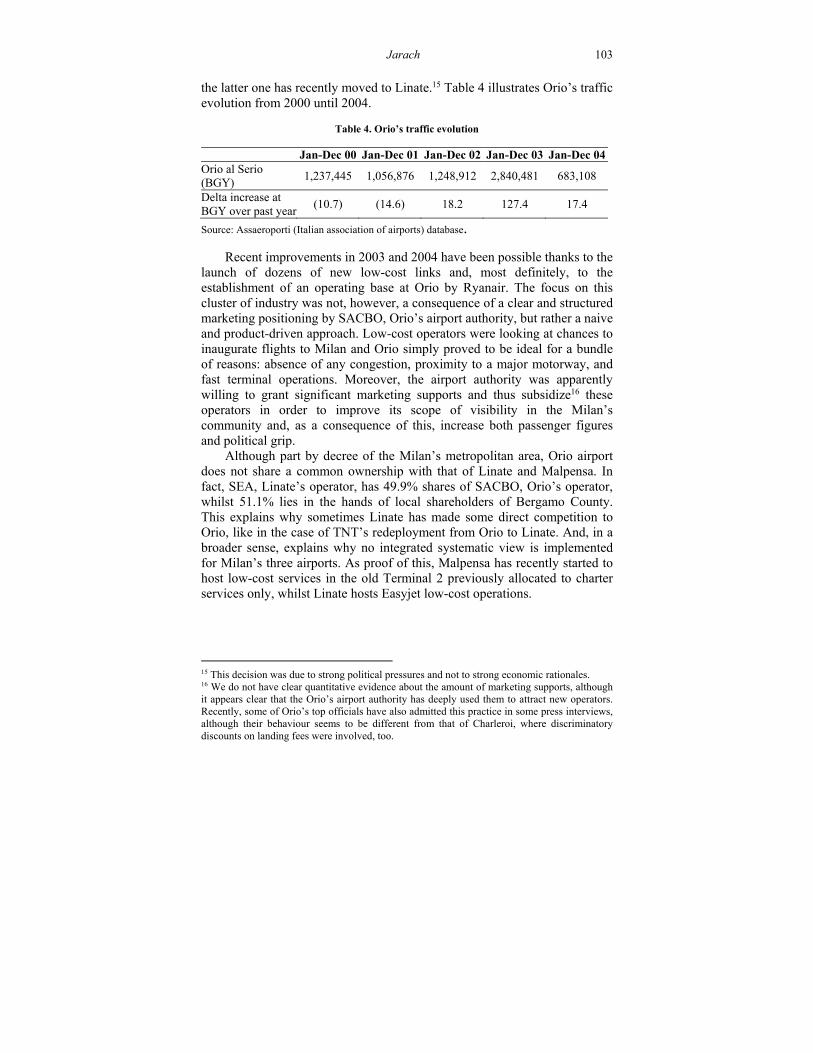
Jarach 103
the latter one has recently moved to Linate.15 Table 4 illustrates Orio’s traffic evolution from 2000 until 2004.
Table 4. Orio’s traffic evolution
Jan-Dec 00 Jan-Dec 01 Jan-Dec 02 Jan-Dec 03 Jan-Dec 04 Orio al Serio (BGY)
1,237,445 1,056,876 1,248,912 2,840,481 683,108
Delta increase at BGY over past year
(10.7) (14.6) 18.2 127.4 17.4
Source: Assaeroporti (Italian association of airports) database.
Recent improvements in 2003 and 2004 have been possible thanks to the launch of dozens of new low-cost links and, most definitely, to the establishment of an operating base at Orio by Ryanair. The focus on this cluster of industry was not, however, a consequence of a clear and structured marketing positioning by SACBO, Orio’s airport authority, but rather a naive and product-driven approach. Low-cost operators were looking at chances to inaugurate flights to Milan and Orio simply proved to be ideal for a bundle of reasons: absence of any congestion, proximity to a major motorway, and fast terminal operations. Moreover, the airport authority was apparently willing to grant significant marketing supports and thus subsidize16 these operators in order to improve its scope of visibility in the Milan’s community and, as a consequence of this, increase both passenger figures and political grip.
Although part by decree of the Milan’s metropolitan area, Orio airport does not share a common ownership with that of Linate and Malpensa. In fact, SEA, Linate’s operator, has 49.9% shares of SACBO, Orio’s operator, whilst 51.1% lies in the hands of local shareholders of Bergamo County. This explains why sometimes Linate has made some direct competition to Orio, like in the case of TNT’s redeployment from Orio to Linate. And, in a broader sense, explains why no integrated systematic view is implemented for Milan’s three airports. As proof of this, Malpensa has recently started to host low-cost services in the old Terminal 2 previously allocated to charter services only, whilst Linate hosts Easyjet low-cost operations.
15 This decision was due to strong political pressures and not to strong economic rationales. 16 We do not have clear quantitative evidence about the amount of marketing supports, although it appears clear that the Orio’s airport authority has deeply used them to attract new operators. Recently, some of Orio’s top officials have also admitted this practice in some press interviews, although their behaviour seems to be different from that of Charleroi, where discriminatory discounts on landing fees were involved, too.
104 Journal of Air Transportation
LINATE, MALPENSA, AND ORIO: TECHNICAL AND INFRASTRUCTURAL LIMITS
All three of Milan’s airport has some technical and infrastructural gaps that limit their growth path and, consequently, diminish their market appealing.
Linate’s proximity to downtown creates some natural limit to expansion, due to absence of space and noise and environmental issues. Moreover, the mixture between general and commercial aviation, both existing on the same, single runway, may be a source of danger, as tragically shown in October 2001 in the fatal crash between a SAS MD80 and a Cessna, where more than 100 people died. In addition, Linate has no fast links with the city’s centre. No underground reaches Linate and only one bus links the airport with the city, which takes more than 40 minutes. This condition is mainly due to strong lobbyist pressures by some categories (notably taxi drivers) that have defended their privileges for year.17 Actually, one underground line touches a small suburb only 2 kilometres from Linate.
Malpensa shares inferior accessibility with Linate, this condition being exacerbated by the longer distance that divides Milan from Malpensa. The existing motorway is highly congested at all hours of the day, whilst the light railway service is operated just twice per hour and takes approximately 40 minutes. No high-speed rail services stop at Malpensa, as it happens, instead it stops at Paris CDG. This means that the airport naturally loses chances to acquire some extra multimodal feedering and defeedering from other Northern Italian destinations, like Turin, Verona or Venice, or from Southern Switzerland, especially after the collapse of Swissair and massive capacity reductions operated by the Swiss at Lugano. Finally, the number of hourly aircraft movements at Malpensa is limited at roughly 70 per hour due to the interference between the two runways that may prevent simultaneous operations and require aircraft landing on the right runway to cross the left one before reaching the terminal building, with some clear risk of unauthorised runway incursions.18 Some military interference, due to the proximity of Cameri Air Force Base and Venegono, home of Aermacchi, may seldom be in practice, too.
Orio is constrained in its potential growth due to the absence of any kind of project for a light railways connection. Moreover, the airport’s accessibility lies entirely on the A4 motorway, which is number one in Italy for truck movements and highly congested, too. This kind of uncertainty in the amount of time it takes to reach the nearest town, Bergamo, threatens its
17 This privilege still today consists in an extra-surcharge that taxis put on their fares for all Milan to Linate services. 18 Some intrusions on a runway where an aircraft was taking off have been already happened. Luckily, no tragic consequence has been provoked.
Jarach 105
expansion towards Milan’s eastern metropolitan area, with its primary catchment area impacted in its overall dimensions.19
CURRENT TRAFFIC SPLIT BETWEEN MILAN’S THREE AIRPORTS
When the Malpensa 2000 project eventually became reality, politicians and technicians started to think about some methods that could create a critical mass for a primary hub on Malpensa, on the one hand, and limit Linate and Malpensa cross-cannibalization, on the other hand.
Some Governmental decisions were adopted. They include the following.
1. All charter and extra-European Union traffic had only to be
operated from Malpensa. As a consequence of this, for instance, Swissair had to immediately transfer its Zurich-Milan feeder flights to Malpensa, reducing its power of competitive attraction, whilst Lufthansa, BA, Air France, KLM and Iberia were able to maintain operations on Linate.
2. Only single-aisled aircraft were allowed to operate at Linate, whilst no limits were imposed on Malpensa.
3. An 18 per hour limit on the number of ground movements was imposed on Linate. Slots were only partly allocated by applying the grandfather clause rule, as some of them were devoted to favour the start-up service of new comers.
4. A maximum number of frequencies per day were imposed on services from Linate (for instance, no more than three per airline towards Paris), the magnitude of frequencies being decided on the basis of previous passenger movements.
5. As a consequence of the mentioned capacity and frequency limitations, Alitalia20 lost its dominant position at Linate, whilst other carriers maintained most of their rights.
6. Services from Linate to all European Union’s capitals plus links to and from Zone 1 areas were allowed.
7. Code-sharing was tolerated, with some carriers inviting partner airlines to get slot rights at Linate to improve their market coverage,
19 A basic criterion of definition for a primary catchment area lies on the so-called one-hour drive time method. Traffic congestion naturally impacts adversely on the amount of distance that can be included in this calculation. 20 Alitalia was clearly penalised from the distribution of slots to new comers, as the Italian flag carrier was not able to let its dominant past market position be working again in this evolved scenario as it was in the previous regulatory environment. Given the fact that high-yield traffic was concentrating on Linate, this partly explains the worsening economic and financial results provided by Alitalia since 2001 to current days.
106 Journal of Air Transportation
as in the Alitalia-Eurofly, Alitalia-Alitalia Express and Lufthansa-Air Dolomiti cases.
8. This kind of traffic regulation was to be considered as transitional and subject to review in the coming years.
This review has never come into practice, actually. Periodically,
proposals from various stakeholders (notably from Alitalia) apply pressure for it to be done. These kind of suggested modifications are about, for instance, moving all flights that do not exceed 700,000 or 1,000,000 passengers per year to Malpensa, thus leaving some primary destinations only to Linate.
No limits were imposed on Orio. Regulators were thinking about the intent of some carriers to move to Orio instead of to Malpensa if willing to comply with lower congestion level of tarmac operations.
OUR PROPOSALS FOR A SOLUTION: A CHANGE IN THE AIRPORT REGULATION TO MAKE AIRPORTS MORE
MARKETABLE
The problem with the threshold method21 is that this kind of proposal actually would provide only a short-term solution to the chronic cross-cannibalization between Linate and Malpensa. For instance, if Milan-Frankfurt flights were transferred to Malpensa,22 Lufthansa could well encourage Germanwings, its low-cost affiliate,23 to start services on that route and sell tickets even below cost with the only goals to improve city-pair traffic levels and, thus, to come back to Linate. Thus, this condition would simply create a temporary situation, with all major foreign carriers developing some strategies to reacquire downtown operations.
Our own suggested solutions, instead, looks for a final solution to the problem, that envisions Malpensa growing to a primary hub status thanks to increasing feedering traffic, on the one hand, and Linate positioned as the city airport—much like the London City Airport, Stockholm Bromma and Düsseldorf Moenchengladbach—on the other hand.
Therefore, our possible solutions are the following.
1. Impose a restriction on flight operations due to pollution. Linate’s proximity to downtown could well be exploited by the regulator to
21 This method, as shown before, implies the determination of a traffic limit, usually in terms of passenger, for each destination. The current traffic figure will give a final answer if the flight has to be operated from one airport or from another one. 22 Because of traffic figures being fewer than 700,000 passengers per year, for instance. 23 Germanwings is a fully-owned subsidiary of Eurowings, which is 49, 9% owned by Lufthansa.
Jarach 107
impose an overall cut of daily aircraft movements, in order to reduce acoustic and environmental pollution. This decision could be taken in accordance with recent European Union directives on airports compliancy with environmental limits that puts a mandatory limit to noise emissions to be accomplished by 2005. Thus, overall daily slots on Linate could be cut (from, say, 300 to 150) and then reallocated in the same percentage to incumbent carriers. The additional capacity would then naturally move to Malpensa and Orio.
2. Transfer all low-cost operations from Linate to Malpensa. This decision would be only a minor contribution to the problem, as low-cost operations count only for 8% of Linate’s movements. However, this decision would be effective in improving Linate’s positioning as a city airport that usually has no discount carriers operate since the targeted traffic is business traffic.
3. Impose a limit on Maximum Take-Off Weight (MTOW). Putting a limit on MTOW would naturally let Linate’s operations be much more costly for operating carriers, as fewer seats and less cargo could be boarded. This situation would then force carriers to move flight operations to non-limited airports or implement a radical price discrimination that only business traffic could support. All the other clusters would then look at Malpensa or Orio for their travel needs.
4. Impose a limit on the type of aircraft allowed at Linate. Imposing that only regional jets could operate on Linate could provide to be a multi-tier bonanza. First, pollution and noise issues would be immediately solved. Second, less capacity at Linate would definitely impose the city airport model and let Malpensa grow. Eventually, lower risks, due to possible general aviation or single-aisled aircraft intrusions, could be achieved, with an inherent benefit in terms of higher safety standards.
The modification of the current regulatory regime by means of one of
the suggested criteria would certainly impact on the three airports’ marketing path, creating new spaces for their growth in both their positioning and, as a consequence of that, in the commercial practices.
THE FUTURE FOR MILAN’S METROPOLITAN AREA: RAPID NEED FOR CHANGE
It is now time for politicians and regulators to take a sound and final decision on the future of Milan’s three airports. The current condition penalises all of them, as no clear positioning is achieved. Nevertheless, local interests between counties and political parties or broader competitive
108 Journal of Air Transportation
battles, such as the one between Alitalia and its industry’s counterparts, are totally blocking any kind of choice.
The longer the stakeholders take to understand the need for a systematic approach to solve this problem, the higher the risks for Milan’s airports to be marginalised on the European map. For example, a great opportunity was lost when Swissair went bankrupt. Malpensa’s and Zurich’s primary catchment areas overlap. However, most of the Swiss market was acquired by Munich and not Malpensa, especially after the recent takeover of Swiss by Lufthansa. Better multimodal connections and a greater scale of long-haul destinations proved to be critical factors in Munich succeeding.
Of course, the Milan’s business case and its proposed solutions may prove helpful for many other international practices where technical and infrastructural overlapping may be solved by choosing a proactive and marketing-oriented strategy. In other words, the airport business is becoming fully global and open and this new scenario no longer tolerates political-driven decisions that are typically short-minded in an economical sense. In today’s world, regulators have to put airports in the right market status and let them acquire a distinctive visibility if they want them to produce some sort of return on investment. Otherwise, the industry will have to be subsidized in the coming years, and this latter choice seems hardly implemental in a budget-constrained situation for many States.
REFERENCES
Assaeroporti. (various dates). Data Di Traffico. Retrieved from http://www.assaeroporti.it/fin.asp.
Jarach, D. (2002). Marketing aeroportuale. Milan: EGEA. Jarach, D. (2005). Airport marketing. Aldershot: Ashgate Publishing.
Journal of Air Transportation Vol. 10, No. 2 - 2005
© 2005, Aviation Institute, University of Nebraska at Omaha
AIRPORT PRICING SYSTEMS AND AIRPORT
DEREGULATION EFFECTS ON WELFARE
Cristina Barbot University of Porto
Porto, Portugal
ABSTRACT
This paper analyses the effects of airport’s pricing systems on welfare, comparing peak load with uniform pricing. It introduces a model with three firms—two airlines and one airport—in a two-stage game that solves the airlines’ duopoly problem in a Bertrand competition setting and the airport’s profit maximization problem. Conclusions are different from others in previous research, which stress the importance of putting all firms together in the game. Mainly, results show that welfare does not always increase with peak load prices, and that the low quality airline and the airport increase their profits while the high quality airline loses profits. As an extension of the paper, airport deregulation is applied to the model and effects are found to be different from those of deregulating other utilities. In particular results point out that congested airports’ deregulation will have better results for welfare than uncongested airports.
INTRODUCTION
The air travel industry has reached high levels of growth in the last decades. Airbus (2003) illustrates this fact with data such as annual growth rates (in number of passengers) of 5.8% between 1980 and 1997 and of 7.1% between 1991 and 2000. For the period 2000-2020 the same source forecasts annual growth rates of 4.7% for world air travel and of 6.1% for Europe alone.
As an industry in expansion air transport certainly creates many opportunities but also serious bottlenecks where urgent adjustments and new solutions are needed. One of them is in airport congestion. As the number of flights grows airports’ capacities for landing and taking off become scarce. But expanding airports’ capacities is a slow and difficult process. Besides its high cost, urban and environmental considerations are important constraints to capacity expansion.
______________________________________________________________________________Cristina Barbot is an Associate Professor at the Faculty of Economics, University of Porto, Portugal. Her research is on industrial economics, namely on regulation issues and lately on air transport. She is a member of European Association for Research in Industrial Economics and of Air Transport Research Society. The author gratefully acknowledges the financial support from Fundação para a Ciência e Tecnologia.
110 Journal of Air Transportation Also, airlines adjust schedules as much as possible in order to meet the
passengers’ preferences by flying at more convenient times. The result is that all the available slots are taken by flagship airlines at their base airports at the passenger’s most convenient times while during other periods of the day these airports have idle capacity.
Some airports have tried to mitigate this problem with the policy of peak load pricing. This means that the charges airlines pay for facilities like landing and taking off, luggage and passengers handling, aircraft parking and others are differentiated, with higher prices at peak load hours and lower prices at off-peak periods. In Europe this system is practiced in London airports (Heathrow and Gatwick) as well as in Dublin, among others. Conversely, in busy and congested airports like Frankfurt, Paris Orly and Charles de Gaulle (CDG), charges vary according to aircrafts’ maximum take-off weight (MTOW). From the practical point of view the application of peak load pricing is not widely followed, which suggests that its effects may be a controversial matter that is worth investigating.
Data shown in Table 1 for summer 2003 enables a comparison of both pricing systems by means of a single variable, charge per passenger. The number of passengers was computed for five aircrafts of different sizes. To find a uniform number of seats per aircraft Lufthansa average patterns were used, with a 100% load factor.1 Charges include movements (take-off or landing), aircraft handling, parking (up to one hour), and noise charges. Directly paid passenger fees are excluded.
The selected airports have different pricing systems. Frankfurt, Paris Orly/CDG, Lisbon and Porto practice only a MTOW price while Dublin applies both systems but with a much wider differentiation according to the time of the day than according to aircrafts’ weighs. Landing and taking off charges together with handling charges are the most important ones. For instance, at Frankfurt airport they represent 92% of the total aeronautical fees while noise charges account only for 7% for a Boeing 747 and 3% for an Airbus 340. These percentages do not differ much in the other airports.
At Frankfurt, Porto, Lisbon, and Paris Orly/CDG airport fees are clearly differentiated according to the weight of the aircraft. Average deviations are respectively of 2.4, 2.1 and 3.4 euros, much higher than the same value for Dublin (1.4 euros peak and 0.5 euros off-peak). Dublin airport practices a strong differentiation between standard and off-peak times but exhibits a low level of MTOW charging differential. The average for all aircraft charges per passenger at peak load times exceeds charges at off-peak hours by 300%. This margin comes close to the ones existing in other busy airports. For instance, in Heathrow peak fees exceed off-peak ones by 230%, while in
1 A 100% load factor is not realistic. But the average fare per passenger is used only for comparison. Then, a more reasonable load factor (say, 70%) would give the same results.
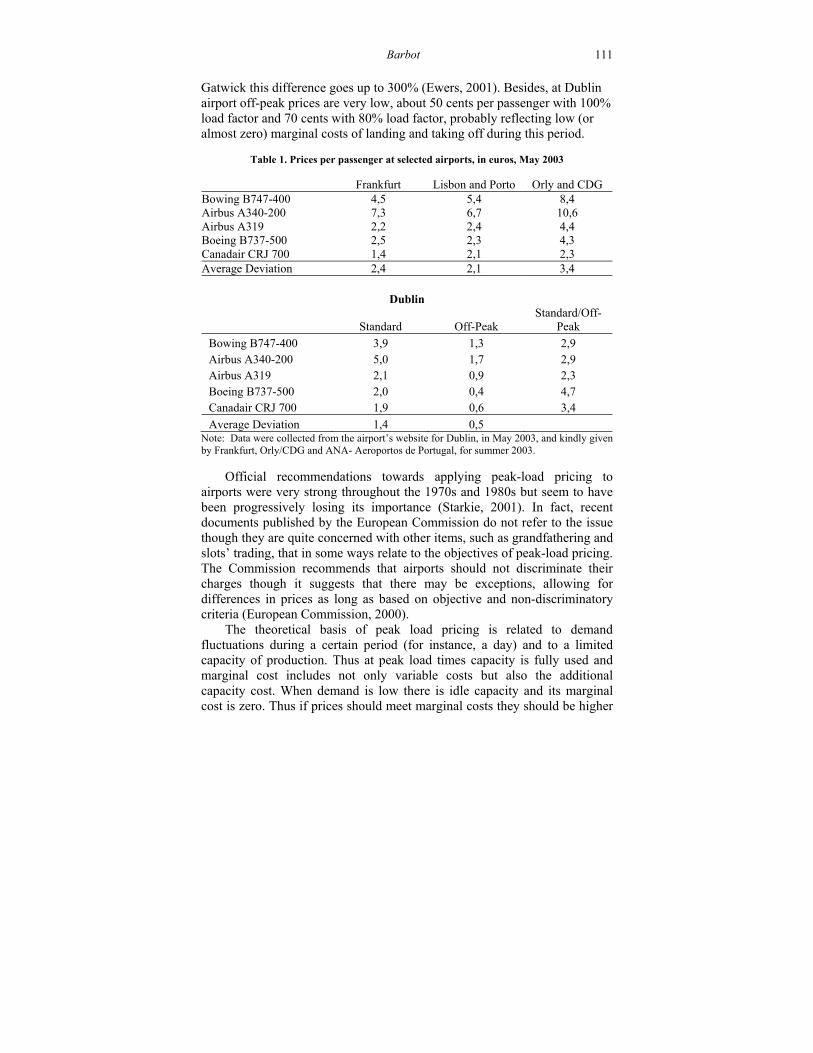
Barbot 111
Gatwick this difference goes up to 300% (Ewers, 2001). Besides, at Dublin airport off-peak prices are very low, about 50 cents per passenger with 100% load factor and 70 cents with 80% load factor, probably reflecting low (or almost zero) marginal costs of landing and taking off during this period.
Table 1. Prices per passenger at selected airports, in euros, May 2003
Frankfurt Lisbon and Porto Orly and CDG Bowing B747-400 4,5 5,4 8,4 Airbus A340-200 7,3 6,7 10,6 Airbus A319 2,2 2,4 4,4 Boeing B737-500 2,5 2,3 4,3 Canadair CRJ 700 1,4 2,1 2,3 Average Deviation 2,4 2,1 3,4
Dublin
Standard Off-Peak Standard/Off-
Peak
Bowing B747-400 3,9 1,3 2,9 Airbus A340-200 5,0 1,7 2,9 Airbus A319 2,1 0,9 2,3 Boeing B737-500 2,0 0,4 4,7 Canadair CRJ 700 1,9 0,6 3,4
Average Deviation 1,4 0,5 Note: Data were collected from the airport’s website for Dublin, in May 2003, and kindly given by Frankfurt, Orly/CDG and ANA- Aeroportos de Portugal, for summer 2003.
Official recommendations towards applying peak-load pricing to airports were very strong throughout the 1970s and 1980s but seem to have been progressively losing its importance (Starkie, 2001). In fact, recent documents published by the European Commission do not refer to the issue though they are quite concerned with other items, such as grandfathering and slots’ trading, that in some ways relate to the objectives of peak-load pricing. The Commission recommends that airports should not discriminate their charges though it suggests that there may be exceptions, allowing for differences in prices as long as based on objective and non-discriminatory criteria (European Commission, 2000).
The theoretical basis of peak load pricing is related to demand fluctuations during a certain period (for instance, a day) and to a limited capacity of production. Thus at peak load times capacity is fully used and marginal cost includes not only variable costs but also the additional capacity cost. When demand is low there is idle capacity and its marginal cost is zero. Thus if prices should meet marginal costs they should be higher
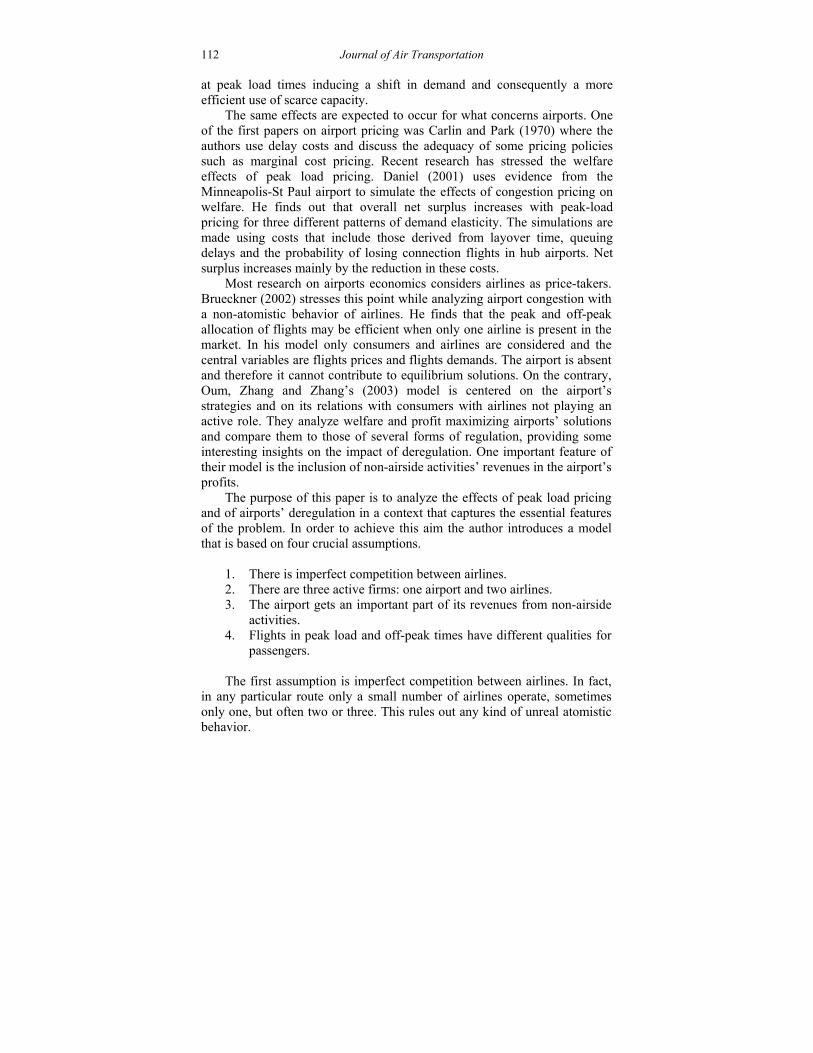
112 Journal of Air Transportation
at peak load times inducing a shift in demand and consequently a more efficient use of scarce capacity.
The same effects are expected to occur for what concerns airports. One of the first papers on airport pricing was Carlin and Park (1970) where the authors use delay costs and discuss the adequacy of some pricing policies such as marginal cost pricing. Recent research has stressed the welfare effects of peak load pricing. Daniel (2001) uses evidence from the Minneapolis-St Paul airport to simulate the effects of congestion pricing on welfare. He finds out that overall net surplus increases with peak-load pricing for three different patterns of demand elasticity. The simulations are made using costs that include those derived from layover time, queuing delays and the probability of losing connection flights in hub airports. Net surplus increases mainly by the reduction in these costs.
Most research on airports economics considers airlines as price-takers. Brueckner (2002) stresses this point while analyzing airport congestion with a non-atomistic behavior of airlines. He finds that the peak and off-peak allocation of flights may be efficient when only one airline is present in the market. In his model only consumers and airlines are considered and the central variables are flights prices and flights demands. The airport is absent and therefore it cannot contribute to equilibrium solutions. On the contrary, Oum, Zhang and Zhang’s (2003) model is centered on the airport’s strategies and on its relations with consumers with airlines not playing an active role. They analyze welfare and profit maximizing airports’ solutions and compare them to those of several forms of regulation, providing some interesting insights on the impact of deregulation. One important feature of their model is the inclusion of non-airside activities’ revenues in the airport’s profits.
The purpose of this paper is to analyze the effects of peak load pricing and of airports’ deregulation in a context that captures the essential features of the problem. In order to achieve this aim the author introduces a model that is based on four crucial assumptions.
1. There is imperfect competition between airlines. 2. There are three active firms: one airport and two airlines. 3. The airport gets an important part of its revenues from non-airside
activities. 4. Flights in peak load and off-peak times have different qualities for
passengers. The first assumption is imperfect competition between airlines. In fact,
in any particular route only a small number of airlines operate, sometimes only one, but often two or three. This rules out any kind of unreal atomistic behavior.
Barbot 113
The second one relates to the need of including both airlines and the
airport in a three-firm model where all of them play an active role in a two-stage game. Thus both flight prices and airport charges are central variables. The model includes one airline operating in each period of time where the flagship airline operates at peak load times and the other airline operates the same route at off-peak times. The number of active airlines in each period could be extended up to a certain limit, preserving imperfect competition. Having only two airlines operate in the model is a simplifying assumption.
Third, it is essential to integrate in the model the revenues of non-airside activities which are a significant part of airports’ revenues. Non-airside (or concession) activities generated from 40% to 80% of all revenues in 50 major world airports in 1999 (Oum et al., 2003). At Heathrow and Gatwick they account for about 60% of all airport revenues (Starkie, 2001). As reported by Oum et al. (2003), these activities had an operating margin of 64% in BAA’s airports in 1999, while the same margin for airside activities was 7%.
The last assumption is the existence of product vertical differentiation. This means that passengers are not buying tickets for flights that are homogeneous from their point of view. In this paper it is supposed that all passengers prefer to fly at peak load hours. This assumption has consistency, in the sense that peak load hours are the most suitable timetables. If they were not the periods preferred by passengers and when demand is higher, flights would be more uniformly distributed along the day. When flying during these periods passengers may take return flights on the same day, not having to stay overnight and consequently they spend more money for accommodations and food. They also may get faster connections to other airports. In this sense, peak load times’ flights are considered by consumers as a high quality product. Flights departing or arriving at off-peak periods have all these inconveniences and therefore consumers view them as a lower quality product. Thus, vertical differentiation theory provides a basis for flights’ demand in the present model. Brueckner (2002) uses a similar kind of demand though there is not an explicit reference to vertical differentiation. He accounts for passengers’ benefits but also for congestion costs of traveling at peak load times.
Airlines charge higher fares2 for higher quality, or peak load, flights. Table 2 displays a few examples of price differentials, according to fares of Lufthansa and British Airways from Frankfurt and London, respectively, to some European cities. In this small sample of prices, the differences among
2 Airlines fares are assumed to be identical for the same flight. This is a simplifying assumption, which is not realistic. It is well known that airlines charge different prices for the same seats, according to quotas of seats, and to tickets restrictions.
114 Journal of Air Transportation
peak load and off-peak prices vary from 688% to 24%. These differences also depend on the destination and on each airline’s strategy.
As an extension of peak load pricing analysis, the same model is used to assess the effects of airports’ deregulation. Though much has been written on airline deregulation the implementation of such policy to airports deserves some more theoretical work on it.3
Table 2. Fares from Frankfurt and London to other European cities, in euros, 2004
Peak Load Price Off-Peak Price Difference (%)
Frankfurt-Vienna 707,7 289,2 145%
Frankfurt-Amsterdam 650,2 312,2 108%
Frankfurt-Madrid 425,4 325,4 31%
Frankfurt-Rome 409,6 294,6 39%
Frankfurt-Brussels 362,1 292,1 24%
London-Vienna 196,2 79,1 148%
London-Brussels 171,3 26,4 550%
London-Amsterdam 196,2 24,9 688%
London-Madrid 106,9 48,3 121%
London-Rome 297,2 76,1 290% Notes: Data for peak load and off-peak prices was taken for the two flag airlines of the departing countries, Lufthansa and British Airways, for return flights on the same weekday, with departures on the 1st of March and returns on the 5th of April 2004. Source: British Airways (2004, February 2) and Lufthansa Airlines (2004, February 2).
The second section of this article presents the model and its assumptions. The third and fourth sections develop the cases of single pricing and peak load pricing with conclusions about the effects of changing from the first system to the second, respectively. An analysis of the effects of deregulation is presented in the fifth section.
THE MODEL
The model should be simple enough in order to allow comparisons but it should capture the essential features of the airports’ and airlines’ services markets. First, firms and their products are defined. The product consists of a certain number, y, of flights with the same departing and arriving airport. The aircrafts are supposed to be the same for all flights and to have identical capacity. However, some flights are supplied in peak load times, where
3 The paper of Oum et al. (2003) is quite interesting on this matter.
Barbot 115
congestion is possible, and others at off-peak times. The number of these flights is denoted respectively by y2 and y1, respectively. Flights operating during peak load times offer a better quality, which may be denoted by q2, as passengers prefer to fly at more convenient times. Off-peak time flights have a lower quality, which can be expressed by q1. As qualities are perfectly defined and cannot be changed, q1 may be set equal to the unity and q2 equal to a parameter a that expresses the quality differential. Peak load time flights are subject to congestion problems, such as delays in taking off and landing with consequent losses of connections and other inconveniences. However, passengers are supposed to be optimistic and do not anticipate these losses of utility. It is quite plausible that when a consumer chooses a flight he or she will not think that there will be delays or other problems. Decisions are taken independently of possible inconveniences that are not forecast by passengers. However these losses of utility represent a congestion externality that must be included in the model and are accounted for by the parameter k that denotes the loss of utility per passenger flying during peak load periods. The exact meaning of the parameter k is the loss of utility that an average passenger suffers on account of an unexpected waste of time for delayed flights or connections. In this sense, k is an opportunity cost. It could be, for example, the money that a passenger does not earn for not being able to attend a meeting, or to sign a valuable contract. Or it could be the loss of utility for arriving one day late to a certain holiday destiny. Parameter k does not influence passengers’ decisions but does influence consumer surplus. There are two airlines operating in the model. Their market shares and consequent market power are not very different. This is truly the case in Europe when two airlines compete in the same line. Lisbon airport has a share of 50% for TAP and 50% for Portugália in departures from Lisbon to Porto, the second largest town in Portugal. At Heathrow the shares of British Airways and British Midlands are 57% and 43%, respectively, in the London- Manchester line, and of 54% and 46%, respectively, on flights from London to Edinburgh. Airline 2 operates during the congested period and airline 1 in the off-peak period. This is typical of congested airports where national companies have chosen their flight times first on account of grandfathering rights and newcomers had to take the remaining timetables. An illustration of this fact is the pattern of slots use at Frankfurt airport. Lufthansa and Star Alliance use 79% of slots at peak load hours, and 32% at off-peak hours.4 Of course 4 Data was gathered from Frankfurt airport’ website for Monday, December 15, 2003 for flights’ departures. Peak load and off-peak times defined according to the website of Flughafen Koordination Deutchland.
116 Journal of Air Transportation
the remaining 21% of peak load time slots may be (and is) used by other airlines. Reality shows that flagship airlines use most of the peak load time slots, and other airlines use the remaining ones. The model uses this fact with the simplifying assumption that each type of airline operates only in each different period of time, peak load and off-peak.
The third firm is the airport, which is assumed to be a privately owned and unregulated firm and maximizes its profits without constraints. This may not be the most usual pattern in Europe where some airports are publicly owned. Some have already been privatized (like Fiumicino in Rome and London’s Heathrow and Gatwick) but they operate under regulation. However, privatization and deregulation are important issues at the moment and are in the agenda of EU authorities.5 The effects of deregulation within the context of this model will be analyzed in the fifth section.
The airport’s revenues are originated both by the so-called airside activities and by retail, restaurant, car hire and other activities. Other firms, under a concession by the airport, usually operate these latter and they are often called concession activities.
Charges like fees added to passengers’ tickets are excluded as they are not part of airlines’ costs but are directly paid to airports. Their inclusion would only strengthen the results of the model as it would be one extra source of revenues for the airport. This point will be understood through the development of the model. There are two kinds of demand functions in the model. Demand for flights is a direct demand from passengers to airlines. Ticket’s prices are p1 for off-peak flights and p2 peak load flights. The demand for airport activities is derived from the demand for flights. As flights have different qualities, vertical differentiation theory should be an adequate source to find the demand functions. This theoretical framework is described by Gabszewicz and Thisse (1979), and Shaked and Sutton (1982). A brief explanation is provided for those who are unfamiliar with it. Passengers are consumers who either buy one unit of the good or do not buy one unit of the good. They are uniformly distributed according to a certain parameter v, with unit density. The value of v is set between 0and 1 and expresses the utility derived from the consumption of one unit of quality. The consumer who is indifferent between buying and not buying one ticket is denoted by (v0 - p1) = 0, as the lower quality was set equal to the unit. For the consumer indifferent between buying a ticket to airline 1 or a ticket to airline 2 this equation will be (v1 - p1) = (v1a - p2), as the higher quality is normalized to
5 It is interesting to quote Civil Aviation Authority (CAA) (2001, p. 17), “The CAA has long believed that the interests of passengers will be better protected by liberalisation and an actively competitive market, rather than by regulation.” Also for the United Kingdom, Jones and Viehoff (1993) state that the rationale for applying regulation to airports is highly dubious on account of BAA’s strong market position. For a modelling approach, see Barbot (2003).
Barbot 117
the parameter a, and consumers do not anticipate inconveniences due to congestion. Demand for off-peak flights (y1) is v1 - v0, and demand for peak load flights (y2) is 1 - v1, so that after solving the above equations demand functions may be written as the following:
y1 = (p2 - p1) / (a - 1) - p1 y2 = 1 - (p2 - p1) / (a - 1)
The airport’s demand will then be of y = y1 + y2 passengers. These passengers generate two kinds of revenues, one derived from what airlines pay for facilities and another from concession activities. In order to avoid the introduction of too many variables each passenger is supposed to buy one unit of retail and other concessions and their price is normalized to one euro. The normalization leads to the assumption that concession activities are price takers though this is a questionable point. Most items supplied by retail or car hiring can also be bought outside the airport. Concession activities’ market power derive from the fact that passengers cannot leave the airport or that they had no time to buy gifts or other items in similar shops outside the airport.
Concession revenues are then y1 + y2, and the whole airport’s revenue is P (y1 + y2) + y1 + y2.
Quality costs are equal to zero as qualities are only derived from flying at peak load or off-peak hours and this is cost free. Airline 2 has no extra cost for flying at the best timetable because it had first choice of this period and is protected by grandfathering rules. Quantity costs from flying (fuel, staff, aircraft leasing fees or depreciation) are omitted in the model for simplicity. This omission does not make much difference, as these costs would be identical for both airlines. Both airlines bear a cost for buying the airport facilities, which equals a price per passenger for those facilities, P, times the number of passengers they carry. Besides, and because it flies at peak load hours, airline 2 has a congestion cost of t per passenger due to several kind of losses, such as less passengers in connections, compensations paid to consumers, inefficient allocation of aircrafts or changes of planned schedules.
Thus the model includes two sources of congestion costs, one for consumers, with the value of k per passenger, and one for airlines, expressed by t per passenger. Readers should notice that these costs are different. The cost k is an opportunity cost while t is a measurable cost.
The airport is supposed to have only a fixed cost, C. Capacity expansion in airports is a very slow process on account of land, environmental and financial constraints therefore it seems more reasonable to limit the airport’s behavior to a short term analysis.
Finally, the values of a, t and k do have some restrictions.
118 Journal of Air Transportation
1. a > t + 1. This is necessary so that the model’s variables are all positive. If a < t + 1 some of the firms would not be active. With a - 1 > t the difference between qualities is higher than unitary congestion costs.
2. t > k. This means that congestion costs are higher for firms than for passengers. As passengers receive monetary compensations for congestion inconveniences, which are costs to airlines, this hypothesis is plausible.
The game is developed in two stages. In the first stage the airport chooses the price P. In the second stage airlines choose their tickets’ prices competing in a Bertrand setting.
SINGLE PRICING
In this case the airport charges airlines a single price. Then, as airlines use similar aircrafts the airport’s charge per passenger is identical whether they fly in peak load or off-peak times. The airlines’ profits, 1 and 2, respectively for airlines 1 and 2, can be expressed as the following:
1 = (p1 - P) ((p2 - p1) / (a - 1) - p1) 2 = (p2 - P - t) ((1- (p2 - p1) / (a - 1))
In the second stage both firms maximize profits in prices leading to two best reply functions. Solving these functions, first stage demands and prices may be computed and are as follows.
p1 = (2aP + a - 1 + P + t) / (4a - 1) p2 = a (2a - 2 + 3P + 2t) / (4a - 1) y1 = a (2P - 1 + a + t - 2aP) / (4a - 1) (a - 1) y2 = (2a2 - 2a - aP + P + t -2at) / (4a- 1) (a - 1)
The airport’s profit is easily derived from the demand functions and according to the above considerations: A = P (y1 + y2) + ( y1 + y2) - C. Maximization of this profit in P yields the first stage solution for the airport’s price:
P = (a - t - 1) / 2 (2a + 1)
P depends on the congestion cost t and dP / dt < 0 which means that with a lower congestion cost the airport would charge a higher P as demand would not be so restricted by the rise in p2. Here it should be stressed that the airport’s strategy relies heavily on not decreasing its demand and revenues, accounting for the importance of non-airside revenues. If these revenues
Barbot 119
were not included in the computation of the airport’s profits P would be higher, indeed equal to (3a - t) / 2 (2a + 1). A higher P would decrease passengers’ demand for flights through higher ticket’s prices. The presence of concession revenues softens the effects of congestion costs on demand and therefore on consumers’ surplus. The solution for P allows for the computation of the values of p1, p2, y1, y2, a, 1, and 2 depending only on a and t, which are parameters of the model. A common measure of welfare was used, equal to the sum of consumer surplus and the three firms’ profits. Consumer surplus, CS, is expressed as the following:
In the computation of consumer surplus the parameter k that represents the loss of utility due to congestion inconveniences to passengers was included.6 These values do not have an important meaning by themselves but they were computed in order to be compared with the results of the case in the next section.
Using these results it can be easily shown that 2 / t < 0 and A / t < 0 but 1 / t > 0. The heavier the congestion is at an airport then the lower are airline 2’s profits, as would be expected, and the lower are the airport’s profits. The high quality airline transfers some of its losses from congestion to the airport. And even without setting peak load prices the airport loses profit with heavier traffic. But the low quality airline benefits from congestion both because its demand is higher and because when p2 rises with t, it also makes p1 rise.
PEAK LOAD PRICING
Now suppose that the airport opts for charging peak load prices, P1 to airline 1 and P2 to airline 2, where P1 < P2.
The process is identical to the one in the last section. The airline’s second stage profits are now expressed as the following:
1 = (p1 - P1) ((p2 - p1) / (a - 1) - p1) 2 = (p2 - P2 - t) (1 - (p2 - p1) / (a - 1))
6 Second order conditions where checked and proved all solutions to be maximal. Calculus was done with the program Scientific Workplace, version 4.1. The expressions of variables are long and therefore not included in the text. Calculus sheets may be requested to the author.
120 Journal of Air Transportation Profit maximization in the second stage leads to solutions for the flights’
prices and demands.
p1 = (2aP1 + a - 1 + P2 + t) / (4a - 1) p2 = a (2a - 2 + P2 + 2t + P1) / (4a - 1) y1 = a (a - 1 + P2 + P1 + t - 2aP1) / (4a - 1) (a - 1) y2 = (2a2 - 2a + aP1 + P2 + t - 2at - 2aP2) / (4a - 1) (a - 1)
Where y1 + y2 is the airport’s first stage derived demand. Maximizing its profits by forecasting this demand, in the first stage the airport comes to a unique solution for each one of P1
and P2.
P1 = 0 P2 = (a - 1 - t) / 2
The off-peak price is zero and equal to the airport’s marginal cost since at off-peak times an extra arrival or departure has no additional capacity costs for the airport. If operating costs were included in the model, P would equal the marginal operating cost. Setting a low off-peak price is part of the airport’s strategy. By forecasting higher flight prices it realizes there will be a reduction in demand but this will affect both airlines’ demand for landing and taking-off facilities and passengers’ demand for retail and other activities, which are so important to the airport’s revenues. Because capacity is fixed the airport can only base its strategy on revenues and prefers not to lose demand. The result is an option for a higher price (in fact higher than P in the last section) for peak load times and a zero price at off-peak times.7
In the second stage, and having watched the airport’s strategy, airlines set their prices. Airline 1 has lower costs (in fact, zero costs). Airline 2 registers now higher costs so it is expected that p2 increases and y2 diminishes. According to reaction functions, p1 should increase too, but on account of lower costs it should decrease. Balancing these two conditions airline 1 keeps p1 with the same value and because of the rise in p2 it faces now a higher demand. And the whole demand is the same as before.
All this can be verified by computing the values of all variables, depending on a and t, and also on k for consumer surplus and welfare. The shift in demand that is predicted by the theory effectively occurs but is balanced by the airport’s active role. If the airport’s strategy was not included in the model with its need to keep revenues, mainly those derived from retail activities, the fall in P1 would have a smaller magnitude and the
7 This is not so far from some airport’s practices. For example, Dublin airport charges from 1.3 to 0.4 euros per passenger at off-peak times depending on the size of the aircraft (see table 1). These are very low prices.
Barbot 121
rise in P2 would be larger. This would mean higher flight prices and less demand in spite of the shift.
As y2 becomes smaller, congestion costs are lower and more passengers fly at off-peak time. Less consumers face congestion inconveniences but more of them have to fly at inadequate hours. The question then becomes, who benefits and who loses with peak load prices.
It is expected that along with the shift in demand there is a shift in airlines’ profits. This effectively happens according to the model’s results. With peak load prices airline 1 gets a higher demand, lower costs and the same flights’ price so 1 increases. Conversely, for airline 2 profits are lower as both the price cost margin and the number of passengers decreases.
The airport faces the same demand and the same retail revenues. Simple computation shows that airside facilities revenues are higher with congestion pricing. The airport benefits with this pricing system and, as a profit maximizing firm, it would of course choose it.
To check how consumers’ utility changes when shifting from uniform pricing to peak load pricing, consider the following for utility:
Differentiating this expression in p2 while keeping p1 constant, as its
value does not change with peak load pricing results in the following:
U / p2 = (k + p1 - p2) / (a - 1)
The derivative is negative if p2 - k > p1, and positive in the opposite case. The condition p2 - k > p1 means that the price of high quality flights discounted of their congestion inconveniences is higher than the price of low quality flights. If this happens an increase in p2 keeping p1 constant decreases consumers’ utility. When these losses exist it must happen that k < p2 - p1 so that there is a decrease in utility.
Total welfare can be written as W = CS +A . In other words, welfare is the sum of the difference between utility and the flights’ revenues, plus the difference between the flights’ revenues and the flights’ non-congestion costs plus the difference between the airport’s revenues and the airport’s cost. Putting it more simply, welfare is equal to utility minus the airport’s costs and congestion costs. Solving demand equations to find inverse demands and changing the limits of the integrals accordingly results in the following:
122 Journal of Air Transportation
As y is kept constant with the change in the pricing system the
derivative of W will be the following:
W / y2 = y2 - 1 - ay2 + a - k - t
Substituting y2 for the expression of its demand function, it may be shown that the derivative is negative for k + t < p2 - p1 or that welfare is only higher with peak load prices under this condition. To interpret the condition note that if consumers accounted for congestion inconveniences the value of v1, the utility of each unit of quality of the consumer who is indifferent between the two qualities, would be the following:
v1 = (p2 - k - p1) / (a - 1) or v1a - v1 = p2 - k - p1
The condition above can be changed for t + k < v1a - v1. So that society may be better off with peak load prices, unitary congestion costs must be lower than the difference between the utility of high quality flights and low quality ones. Thus, according to this model, the effects of applying a peak load pricing policy to reduce congestion depend much on the parameters t and a, as it must happen that t < v1 (a - 1). Unless congestion costs are high and/or capacity small when compared to the airports’ traffic and the quality differential small enough, it will be worth using congestion prices. We could think this happens in large hub airports with heavy traffic where congestion is serious. But probably passengers in these airports are mainly business travelers who highly value flying at convenient times.
EXTENSIONS: PUBLIC AIRPORT AND AIRPORT DEREGULATION
In the precedent analysis the airport was considered as a profit maximizing privately owned firm. Though most of these airports are regulated, deregulation is an important issue at the moment. It is interesting to check what insights this model provides on public airports’ behavior and on airport deregulation.
A public airport would maximize welfare. However, in the context of the present model welfare maximization constrained by zero profits for the public airport is not a feasible situation as it results in a negative value for P. The result of a negative value for P is due to the fact that the public airport bears more congestion costs than a profit maximizing one. When maximizing welfare, the airport is constrained both by passengers’ losses of
Barbot 123
utility due to congestion and by firm 2’s congestion costs. Airside losses are covered by means of profits from concession activities.
The analysis is developed with single pricing. Airlines maximize profits in the second stage and the airport maximizes welfare subject to the constraint A = 0 in the first stage.
Price capping and rate of return (ROR) are the most frequent regulation systems in Europe. As the present model does not allow for analyzing ROR regulation without introducing new variables the analysis will be developed with a price cap regulation. Price is set equal to marginal cost and so P = 0, meaning that the airport covers its depreciation costs by means of concession activities revenues. Airlines’ profits are now expressed as the following:
1 = (p1 (p2 - ap1)) / (a - 1) 2 = (p2 - t) ((a-1- p2 - p1) / (a - 1))
The game involves only one stage as the second stage problem is solved by price capping P. Airlines maximize profits in a Bertrand price competition and the results are the following:
p1 = (a – 1 + t) / (4a - 1) p2 = 2a (a - 1 + t) / (4a - 1) y1 = a (a - 1 + t) / (4a - 1) (a - 1) y2 = (2a2 - 2a + t - 2at) / (4a - 1) (a - 1) y = (3a - t) / (4a - 1)
The airport’s profits are now:
A = y - C = (3a-t) / (4a-1) -C
The airlines’ profits are:
1 = a (a - 1 + t)2 / (4a - 1)2 (a - 1) 2 = (2a2 - 2a + t - 2at)2 / (4a - 1) (a - 1)2
By computing the differences between these results and those in the third section it is possible to analyze the impact of deregulation using the present model. With deregulation less consumers fly at both peak load and off-peak periods therefore congestion is smaller and its costs are lower. The airport gets higher profits as expected. Costs are the same but the reduction in demand affects both kinds of revenues. However, the existence of airside activities revenues offsets the decrease in demand, which lowers concession revenues.
These results are common to almost all cases of deregulation. It is also expected that consumers are worse off with it. But here consumer surplus
124 Journal of Air Transportation
will have a small decrease because of airlines’ market power. If airlines were price takers with deregulated they would increase their prices by P. In a Bertrand competition both flights’ prices raise by less than P. Airline 1 charges higher flights prices but its unitary costs are higher too and their demands decrease. Consequently, airline 1 has a reduction of profits.
Airline 2’s prices also become higher with deregulation, but demand is reduced. Moreover, congestion costs are diminished but airport charges have increased. The effects on the high quality airline’s profits depend on the magnitude all these effects. Computation of the difference in profits shows that 2 increases with deregulation under the condition: t > (a - 1)(16a2 + 7a + 1) / (16a3 - a - 3). If t is high enough the fall in congestion costs countervails the effect on the demand side. For a low value of t the opposite happens.
The interesting point here is that airlines do not always lose with deregulation. The low quality airline will be worse off while the high quality firm may (or may not) be better off, according to the relation between the parameters a and t. Part of consumer’ loss of surplus is transferred to airlines.
A smaller number of passengers will buy tickets at higher prices. But a smaller number of them will be affected by congestion inconveniences. Computation of the difference of this variable with and without regulation makes it impossible to establish conditions that are clearly understandable. But it is easy to see that only when unitary congestion damages for passengers (k) are very high so that they offset the other benefits, will consumers be better off with deregulation. The same applies to welfare. As in the precedent section, W can be written as the following:
W = U + y - ty2 - C
The decrease in demand has a negative effect in the airport’s retail revenues but positive effects both on firm 2’s congestion costs and on consumers’ loss of utility due to congestion. Again, the net effect on welfare depends on the magnitude of congestion costs compared to demands’ reductions and consequently to prices’ increases.
Conclusions of this section stress the importance of airlines’ demand elasticity and of congestion costs when analyzing deregulation policies for airports. Airlines may be interested in airport regulation as it lowers its costs but for the airline flying at peak load time this depends on the degree of congestion and on the consequences for its costs. If congestion is very intense deregulation may benefit consumers and society as a whole. So there is a point for a priority of deregulation in highly congested airports.
Barbot 125
CONCLUDING REMARKS
The most important result of this model is that in the airport’s case congestion pricing does not always improve welfare. It all depends on the magnitude of unitary congestion costs compared to the relative preference of flying at peak load periods net of congestion inconveniences. Put in another way, it depends on the costs congestion causes to firm 2 (which are partially transferred to the airport) and to consumers, balanced with the quality differential of flights. Brueckner (2002) showed that this might happen with peak load pricing of airlines’ flights. Here the two pricing systems apply only to airports as flight prices are always differentiated according to their quality for passengers. But in the present model it is possible to determine who benefits from peak load pricing (the airport and the low quality airline), and who loses (airline 2 and, under some conditions, passengers and society as a whole). Besides the model provides insights on all of the firms’ strategies that account for these results.
Deregulation brings out some expected effects such as a reduction is demand and a rise in all prices, but welfare and the high quality airline’s profits do not always increase. Welfare will decrease less (or increase) the higher congestion becomes. The model suggests that deregulation is a more adequate policy for highly congested airports.
REFERENCES
Airbus. (2003). Airbus vision of the future. The 7th ATRS World Conference. Toulouse, France.
Barbot, C. (2003, June). Does airport regulation benefit consumers? International Journal of Transport Economics, 103-114.
British Airways. (2004). Retrieved February 2, 2004, from www.britishairways.com
Brueckner, J. K. (2002). Airport congestion when carriers have market power. American Economic Review, 92, 1357-1375.
Civil Aviation Authority. (2001). The future of aviation. London.
Carlin, A. & Park, R.E. (1970). Marginal cost pricing of airport runway capacity. American Economic Review, 60 (3), 310-319.
Danial, J.I. (2001). Distributional consequences of airport congestion prices. Journal of Urban Economics, 50, 230-258.
European Commission. (2000). Aéroports de Paris. Alpha Flight Services, 128/98.
126 Journal of Air Transportation
Ewers, H.J. (2001). Possibilities for the better use of airport slots in Germany and the EU: A practical approach. Berlin: Wirtschafts und Infrastruktur Politik.
Gabszewicz, J. & Thisse, J. F. (1979). Price competition, quality, and income disparities. Journal of Economic Theory, 20, 340-359.
Jones, I. & Viehoff, I. (1993). The economics of airport slots. London: National Economic Research Associates.
Lufthansa Airlines. (2004). Retrieved February 2, 2004, from www.lufthansa.com
Oum, T.H., Zhang, A., & Zhang, Y. (2003). Concession profit and its efficiency implications on alternative forms of economic regulation of airports. The 7th ATRS World Conference. Toulouse, France.
Shaked, A. & Sutton, J. (1982). Relaxing price competition through product differentiation. Review of Economic Studies, 49, 3-13.
Starkie, D. (2001). A new deal for airports. In Colin Robinson (Ed.), Regulating utilities-New issues (pp 145-165). London: Edward Elgar Publishing.
Journal of Air Transportation 127
Index of Past Issues Journal of Air Transportation
Volume 10
Number 1 (2005) pp. 1-133
Articles
FLEMING, K., see, Vasigh, B.
FLOURIS, T., “Confidence in Airline Performance in Difficult Market Conditions: An Analysis of JetBlue’s Financial Market Results,” 38
HANSEN, F.D., “System Safety in Early Manned Space Program: A Case Study of NASA and Project Mercury,” 104
I LEE, P., “Air Carrier Safety and Culture: An Investigation of Taiwan’s Adaptation to Western Incident Reporting Programs,” 20
PITTS, D., see Hansen, F.D.
REYNOLDS, R., see Rhoades, D.L.
RHOADES, D.L., “The Effect of Line Maintenance Activity on Airline Safety Quality,” 58
SCHWAB, G.L., “An Examination of the Indiana State University Aerospace Administration Program,” 72
VASIGH, B., “A Total Factor Productivity Based Structure for Tactical Cluster Assessment: Empirical Investigation in the Airline Industry,” 3
WAGUESPACK, B., JR., see Rhoades, D.L.
WALKER, T., see Flouris, T.
WEITZEL, T.R., see I Lee, P.
WILLIAMS, M., see Rhoades, D.L.
128 Journal of Air Transportation
Guidelines for Manuscript Submission Instructions to Authors
Authors wishing to submit original manuscripts for consideration should send one double-spaced paper copy and one electronic copy either on an IBM compatible three and one-half inch diskette to the address below or via e-mail to [email protected].
Authors submitting manuscripts to the Journal should not simultaneously submit them to another journal, nor should manuscripts have been published elsewhere in substantially similar form or with substantially similar content. Authors in doubt about what constitutes a prior publication should consult the executive editor. Manuscripts will not be returned.
Aviation Institute/JAT University of Nebraska at Omaha Allwine Hall 422 6001 Dodge Street Omaha, NE 68182-0508 U.S.A.
Format: All papers must be written in the English language. Use a 12 point font and allow for a one-inch margin on all sides. Double-space all material, including quotations, the abstract, notes, and references. All figures and tables should be on a separate page at the end of the text. Include the figure name and filename on the bottom of the page. Please proofread all article submission for punctuation, spelling, and format errors.
The cover page should include the title of the manuscript, the author’s name(s), shipping and e-mail addresses, telephone number, and a short biographical statement summarizing the author’s education and current affiliation. Please note the primary contact person. The second page should contain an abstract of the manuscript. The abstract should include a concise description of the contents of the paper, the research method used, and the results. Abstracts should generally be kept to about 100 words.
Figures and Tables: Figures and tables should appear at the end of the paper with each item on a separate page. Indicate in the text the approximate location where each figure and table should be placed. Figures, tables, and the text should each be saved as a separate file name at the bottom of the page for each figure and table. Figures and tables must be camera-ready, printed in black ink only and must fit within a four-inch by seven-inch area.
Reference Style: Due to the international participation, rigid referencing style criteria are not mandated. Acceptable reference style of the author’s country will apply. For the U.S.A., the most recent edition of the American Psychological Association (APA) Manual of Style is preferred. Ensure all references are cited and all citations are referenced.
Journal of Air Transportation 129
Review Process: A rigorous, double-blind review will be conducted be
the JAT Panel of Reviewers. Additionally, a member of the Editorial Board will conduct a third review. If revisions are necessary, the editor will determine when a revised manuscript is in compliance with reviewer recommendations. Authors must make revisions to original documents and resubmit them to JAT on disk in Word or Word Perfect format or via e-mail. All revisions must be original, not previously published, nor under consideration for another journal while undergoing review by the JAT.
Copyrights: Copyrights are retained by the authors and the JAT. Permission to duplicate and distribute for educational purposes at no charge is granted.
Additional Information: Additional information is available on the JAT web site or by contacting the JAT directly.
JAT Home Page
http://jat.unomaha.edu/ For questions or comments contact the JAT at [email protected]
Guidelines for Book Reviews Books chosen for review by the Journal of Air Transportation will focus
on areas of interest to its readership. These subjects include topics related to aviation and/or space transportation, both technical and non-technical. An article should be written in a concise and sufficiently non-technical language to be intelligible to both aeronautics generalists and to specialists in other fields.
Individuals wishing to nominate a book for review or who are interested in reviewing books for JAT should notify the assistant editor at the below address. Also, authors or publishers wishing to have a book considered for assessment should send a review copy to this address:
Aviation Institute University of Nebraska at Omaha 6001 Dodge Street Omaha, NE 68182-0508 U.S.A.
E-mail other correspondence concerning reviews to [email protected]
Review criteria and format information for book reviews are available at the JAT web site: http://jat.unomaha.edu/. Please consider this information prior to submitting a book review.
130 Journal of Air Transportation
Journal of Air Transportation 131