Embed Size (px)
Citation preview

SECURITIES AND EXCHANGE COMMISSIONWashington, D.C. 20549
FORM 10-K
ANNUAL REPORT PURSUANT TO SECTION 13 OR 15(d) OF THESECURITIES EXCHANGE ACT OF 1934
FOR THE FISCAL YEAR ENDED MAY 30, 2004
Commission File Number 1-1185
GENERAL MILLS, INC.Delaware
(State or other jurisdictionof incorporation or organization)
41-0274440(IRS Employer
Identification No.)
Number One General Mills BoulevardMinneapolis, MN
(Mail: P.O. Box 1113)(Address of principal executive offices)
55426(Mail: 55440)
(Zip Code)
(763) 764-7600(Registrant’s telephone number, including area code)
Securities registered pursuant to Section 12(b) of the Act:
Title of each className of each exchange
on which registered
Common Stock, $.10 par value New York Stock Exchange
Securities registered pursuant to Section 12(g) of the Act: None
Indicate by check mark whether the Registrant (1) has filed all reports required to be filed by Section 13 or 15(d) of theSecurities Exchange Act of 1934 during the preceding 12 months (or for such shorter period that the Registrant wasrequired to file such reports), and (2) has been subject to such filing requirements for the past 90 days. Yes A No u
Indicate by check mark if disclosure of delinquent filers pursuant to Item 405 of Regulation S-K is not contained herein,and will not be contained, to the best of Registrant’s knowledge, in definitive proxy or information statements incorpo-rated by Reference in Part III of this Form 10-K or any amendment to this Form 10-K. A
Indicate by check mark whether the Registrant is an accelerated filer (as defined in Rule 12b-2 of the Act). Yes A No u
Aggregate market value of Common Stock held by non-affiliates of the Registrant, based on the closing price of $44.43per share as reported on the New York Stock Exchange on November 21, 2003 (the last business day of Registrant’s mostrecently completed second fiscal quarter): $13,066 million.
Number of shares of Common Stock outstanding as of July 20, 2004: 380,188,241 (including shares set aside for theexchange of shares of Ralcorp Holdings, Inc. and excluding 122,118,423 shares held in the treasury).
DOCUMENTS INCORPORATED BY REFERENCE
Portions of Registrant’s Proxy Statement for its 2004 Annual Meeting of Stockholders are incorporated by reference intoPart III.

TABLE OF CONTENTS
Page
Part I
Item 1. Business . . . . . . . . . . . . . . . . . . . . . . . . . . . . . . . . . . . . . . . . . . . . . . . . . . . . . . . . . . . . . . . . . . . . . . . . . . 1
Item 2. Properties . . . . . . . . . . . . . . . . . . . . . . . . . . . . . . . . . . . . . . . . . . . . . . . . . . . . . . . . . . . . . . . . . . . . . . . . . 7
Item 3. Legal Proceedings . . . . . . . . . . . . . . . . . . . . . . . . . . . . . . . . . . . . . . . . . . . . . . . . . . . . . . . . . . . . . . . . . . . 8
Item 4. Submission of Matters to a Vote of Security Holders . . . . . . . . . . . . . . . . . . . . . . . . . . . . . . . . . . . . . . 8
Part II
Item 5. Market for Registrant’s Common Equity and Related Stockholder Matters . . . . . . . . . . . . . . . . . . . . 8
Item 6. Selected Financial Data . . . . . . . . . . . . . . . . . . . . . . . . . . . . . . . . . . . . . . . . . . . . . . . . . . . . . . . . . . . . . . 9
Item 7. Management’s Discussion and Analysis of Financial Condition and Results of Operation . . . . . . . . 9
Item 7A. Quantitative and Qualitative Disclosures About Market Risk . . . . . . . . . . . . . . . . . . . . . . . . . . . . . . . 19
Item 8. Financial Statements and Supplementary Data . . . . . . . . . . . . . . . . . . . . . . . . . . . . . . . . . . . . . . . . . . . 20
Item 9. Changes in and Disagreements with Accountants on Accounting and Financial Disclosure . . . . . . . 48
Item 9A. Controls and Procedures . . . . . . . . . . . . . . . . . . . . . . . . . . . . . . . . . . . . . . . . . . . . . . . . . . . . . . . . . . . . . 48
Part III
Item 10. Directors and Executive Officers of the Registrant . . . . . . . . . . . . . . . . . . . . . . . . . . . . . . . . . . . . . . . . 48
Item 11. Executive Compensation . . . . . . . . . . . . . . . . . . . . . . . . . . . . . . . . . . . . . . . . . . . . . . . . . . . . . . . . . . . . . 48
Item 12. Security Ownership of Certain Beneficial Owners and Management and RelatedStockholder Matters . . . . . . . . . . . . . . . . . . . . . . . . . . . . . . . . . . . . . . . . . . . . . . . . . . . . . . . . . . . . . . 48
Item 13. Certain Relationships and Related Transactions . . . . . . . . . . . . . . . . . . . . . . . . . . . . . . . . . . . . . . . . . . 49
Item 14. Principal Accounting Fees and Services . . . . . . . . . . . . . . . . . . . . . . . . . . . . . . . . . . . . . . . . . . . . . . . . . 49
Part IV
Item 15. Exhibits, Financial Statement Schedules and Reports on Form 8-K . . . . . . . . . . . . . . . . . . . . . . . . . . . 50
Signatures. . . . . . . . . . . . . . . . . . . . . . . . . . . . . . . . . . . . . . . . . . . . . . . . . . . . . . . . . . . . . . . . . . . . . . . . . . . . . . . . . . . . . . . . . . . . . . . 54

PART I
ITEM 1 — Business.
COMPANY OVERVIEW
General Mills, Inc. was incorporated in Delaware in 1928.The terms “General Mills,” “Company” and “Registrant”mean General Mills, Inc. and its subsidiaries unless thecontext indicates otherwise.
General Mills is a leading producer of packaged consumerfoods and operates exclusively in the consumer foodsindustry. The Company’s businesses are divided into threereportable segments:
• U.S. Retail;
• Bakeries and Foodservice; and
• International.
The Company’s operating segments are organized generallyby product categories. U.S. Retail consists of cereals, meals,refrigerated and frozen dough products, baking products,snacks, yogurt and organic foods. The Bakeries and Food-service segment consists of products marketed to retail andwholesale bakeries and offered to the commercial andnoncommercial foodservice sectors throughout the UnitedStates and Canada, such as restaurants and business andschool cafeterias. The International segment is made up ofretail business outside the United States and foodservicebusiness outside of the United States and Canada. A moredetailed description of the product categories for eachreportable segment is set forth below.
On October 31, 2001, General Mills completed the acquisi-tion of the worldwide businesses of The Pillsbury Companyfrom Diageo plc (“Diageo”). With the Pillsbury acquisition,the Company added established, market-leading brands toits U.S. retail business, more than doubled its foodservicebusiness, significantly increased its international presenceand created opportunities for productivity improvement andcost synergies. For a more detailed description of thePillsbury acquisition, please see Note Two to the Consoli-dated Financial Statements appearing on page 28 in ItemEight of this report.
BUSINESS SEGMENTS
U.S. RETAIL. In the United States, General Mills marketsits retail products primarily through its own sales organi-zation, supported by advertising and other promotionalactivities. These products primarily are distributed directlyto retail food chains, cooperatives, membership stores andwholesalers. Certain food products are also sold through
distributors and brokers. The Company’s principal productcategories in the U.S. Retail segment are as follows:
Big G Cereals. General Mills produces and sells a numberof ready-to-eat cereals, including such brands as: Cheerios,Honey Nut Cheerios, Frosted Cheerios, Apple Cinnamon Cheerios,MultiGrain Cheerios, Berry Burst Cheerios, Team Cheerios,Wheaties, Wheaties Energy Crunch, Lucky Charms, Total CornFlakes, Whole Grain Total, Total Raisin Bran, Brown Sugar andOat Total, Trix, Golden Grahams, Wheat Chex, Corn Chex, RiceChex, Multi-Bran Chex, Honey Nut Chex, Kix, Berry Berry Kix,Fiber One, Reese’s Puffs, Cocoa Puffs, Cookie Crisp, CinnamonToast Crunch, French Toast Crunch, Peanut Butter Toast Crunch,Clusters, Oatmeal Crisp, Basic 4, and Raisin Nut Bran.
Meals. General Mills manufactures and sells several linesof convenient dinner products, including Betty Crocker drypackaged dinner mixes under the Hamburger Helper, TunaHelper, Chicken Helper and Pork Helper trademarks, Old El PasoMexican foods and dinner kits, Progresso soups and ingre-dients, Green Giant canned and frozen vegetables and mealstarters, and a line of refrigerated barbeque products underthe Lloyd’s Barbeque name. Also under the Betty Crocker trade-mark, the Company sells dry packaged specialty potatoes,Potato Buds instant mashed potatoes, Suddenly Salad andBac*O’s salad topping. The Company also manufactures andmarkets shelf stable microwave meals under the Betty CrockerBowl Appetit! trademark and packaged meals under the BettyCrocker Complete Meals trademark.
Pillsbury USA. General Mills manufactures and sellsrefrigerated and frozen dough products, frozen breakfastproducts, and frozen pizza and snack products. Refrigerateddough products marketed under the Pillsbury brand includeGrands! biscuits and sweet rolls, Golden Layers biscuits,Pillsbury Ready To Bake! and Big Deluxe Classics cookies, andPillsbury rolls, biscuits, cookies, breads and pie crust. Frozendough product offerings include Home Baked Classics biscuits,rolls and other bakery goods. Breakfast products sold underthe Pillsbury trademark include Toaster Strudel pastries,Toaster Scrambles pastries and Pillsbury frozen pancakes,waffles and waffle sticks. All the breakfast and refrigeratedand frozen dough products incorporate the well-knownDoughboy logo. Frozen pizza and snack products aremarketed under the Totino’s and Jeno’s trademarks.
Baking Products. General Mills makes and sells a line ofdessert mixes under the Betty Crocker trademark, includingSuperMoist cake mixes, Rich & Creamy and Soft Whippedready-to-spread frostings, Supreme brownie and dessert barmixes, muffin mixes and other mixes used to prepare dessertand baking items. The Company markets a variety of bakingmixes under the Bisquick trademark, sells pouch mixes underthe Betty Crocker name, and produces family flour under theGold Medal brand introduced in 1880.
1

Snacks. General Mills markets Milk n’Cereal bars;Pop•Secret microwave popcorn; a line of grain snacksincluding Nature Valley granola bars; a line of fruit snacksincluding Fruit Roll-Ups, Fruit By The Foot and Gushers; a lineof snack mix products including Chex Mix and Gardetto’ssnack mix; savory snacks marketed under the name Bugles;and carbohydrate management bars marketed under thename Momentum.
Yoplait-Colombo. General Mills manufactures and sellsyogurt products, including Yoplait Original, Yoplait Light,Custard Style, Trix, Yumsters, Go-GURT — yogurt-in-a-tube,Yoplait Whips! — a mousse-like yogurt, Yoplait Nouriche — ameal replacement yogurt drink, and Yoplait Ultra — a yogurtwith fewer carbohydrates than regular low-fat yogurt. TheCompany also manufactures and sells a variety of refriger-ated cup yogurt products under the Colombo brand name.
Organic. General Mills markets organic frozen fruits andvegetables, meals and entrees, a wide variety of cannedtomato products including tomatoes and spaghetti sauce,frozen juice concentrates, fruit spreads, frozen desserts andcereal under its Cascadian Farm and Muir Glen trademarks.
BAKERIES AND FOODSERVICE. General Millsmarkets mixes and unbaked, par-baked and fully bakedfrozen dough products to retail, supermarket and wholesalebakeries under the Pillsbury and Gold Medal trademarks. Inaddition, the Company sells flour to bakery, foodservice andmanufacturing customers. The Company also marketsfrozen dough products, branded baking mixes, cereals,snacks, dinner and side dish products, refrigerated and soft-serve frozen yogurt, and custom food items to quick servechains and other restaurants, business and school cafeterias,convenience stores and vending companies.
INTERNATIONAL. General Mills’ international busi-nesses consist of operations and sales in Canada, LatinAmerica, Europe and the Asia/Pacific region. Outside theU.S., the Company manufactures its products in 15 coun-tries and distributes them in over 100 countries. In Canada,the Company markets products in many categories,including cereals, meals, refrigerated dough products, bakingproducts and snacks. Outside of North America, theCompany offers numerous local brands in addition to suchinternationally recognized brands as Häagen-Dazs ice cream,Old El Paso Mexican foods, Green Giant vegetables, Pillsburydough products and mixes, Betty Crocker mixes and Buglessnacks. The Company also sells mixes and dough productsto bakery and foodservice customers outside of the UnitedStates and Canada. These international businesses aremanaged through wholly owned subsidiaries and jointventures with sales and marketing organizations in33 countries.
For additional geographic information please see NoteEighteen to the Consolidated Financial Statementsappearing on pages 46 through 47 in Item Eight ofthis report.
FINANCIAL INFORMATION ABOUT REPORTABLE SEGMENTS
The following tables set forth the percentage of net salesand operating profit from each reportable segment:
Percent of Net Sales
For Fiscal Years Ended May 2004 2003 2002
U.S. Retail 70% 71% 74%Bakeries and Foodservice 16 17 16International 14 12 10
Total 100% 100% 100%
Percent of Operating Profit
For Fiscal Years Ended May 2004 2003 2002
U.S. Retail 88% 88% 84%Bakeries and Foodservice 6 8 12International 6 4 4
Total 100% 100% 100%
Financial information for the Company’s reportable businesssegments is set forth in Note Eighteen to the ConsolidatedFinancial Statements appearing on pages 46 through 47 inItem Eight of this report.
JOINT VENTURES
In addition to its consolidated operations, the Companymanufactures and sells products through several jointventures.
DOMESTIC JOINT VENTURE. The Company has a50 percent equity interest in 8th Continent, LLC, a jointventure formed with DuPont to develop and marketsoy-based products. This venture began marketing a line of8th Continent soymilk to limited markets in July 2001 andnationally in June 2003.
INTERNATIONAL JOINT VENTURES. The Companyhas a 50 percent equity interest in Cereal Partners World-wide (CPW), a joint venture with Nestlé S.A., thatdistributes products in more than 130 countries and repub-lics. The cereal products marketed by CPW under theumbrella Nestlé trademark in fiscal 2004 included: Chocapic,Corn Flakes, Crunch, Fitness, Fitness and Fruit, Honey NutCheerios, Cheerios, Nesquik, Shredded Wheat, and Shreddies.CPW also markets cereal bars in several European countriesand manufactures private label cereals for customers in theUnited Kingdom.
2

Snack Ventures Europe (SVE), the Company’s joint venturewith PepsiCo, Inc., manufactures and sells snack foods inHolland, France, Belgium, Spain, Portugal, Greece, theBaltics, Hungary and Russia. The Company has a40.5 percent equity interest in SVE. The products marketedby SVE in fiscal 2004 included: 3-Ds, Bugles, Doritos, Fritos,Hamka’s, Lay’s, Ruffles and Dippas.
The Company has a 50 percent interest in each of fourjoint ventures for the manufacture, distribution andmarketing of Häagen-Dazs frozen ice cream products andnovelties in Japan, Korea, Thailand and the Philippines. TheCompany also has a 50 percent interest in Seretram, a jointventure with Co-op de Pau for the production of Green Giantcanned corn in France.
See Note Four to the Consolidated Financial Statementsappearing on page 31 in Item Eight of this report.
COMPETITION
The consumer foods market is highly competitive, withnumerous manufacturers of varying sizes in the UnitedStates and throughout the world. The Company’s principalstrategies for competing in each of its segments includesuperior product quality, innovative advertising, productpromotion, product innovations and price. In most productcategories, the Company competes not only with otherwidely advertised branded products of major companies, butalso with generic products and private label products, whichare generally sold at lower prices. Internationally, theCompany primarily competes with local manufacturers, andeach country includes a unique group of competitors.
CUSTOMERS
During fiscal 2004, one customer, Wal-Mart Stores, Inc.,accounted for approximately 14 percent of the Company’sconsolidated net sales and 19 percent of the Company’ssales in the U.S. Retail segment. No other customeraccounted for 10 percent or more of the Company’sconsolidated net sales. The top five customers of our U.S.Retail segment accounted for approximately 43 percentof the segment’s fiscal 2004 net sales. For the Bakeries andFoodservice segment, the top five customers accounted forapproximately 34 percent of the segment’s fiscal 2004net sales.
SEASONALITY
In general, demand for the Company’s products is evenlybalanced throughout the year. However, demand for theCompany’s refrigerated dough, frozen baked goods andbaking products is stronger in the fourth calendar quarter.Demand for Progresso soup is higher during the fall andwinter months. Internationally, demand for Häagen-Dazs ice
cream is higher during the summer months and demand forthe baking mix and dough products increases during wintermonths. Due to the offsetting impact of these demandtrends, as well as the different seasons in the northern andsouthern hemispheres, the Company’s international netsales are generally evenly balanced throughout the year.
GENERAL INFORMATION
Trademarks and Patents. Trademarks and service marksare vital to the Company’s businesses. The Company’s prod-ucts are marketed under trademarks and service marks thatare owned by or licensed to the Company. The most signifi-cant trademarks and service marks used in the Company’sbusinesses are set forth in italics in the business discussionsabove. These marks include the trademarks used in ourinternational joint ventures that are owned by or licensed tothe joint ventures. In addition, some of the Company’sproducts are marketed under or in combination with trade-marks that have been licensed from others, including Yoplaityogurt, Reese’s Puffs cereal, Hershey’s chocolate included witha variety of products, and a variety of characters and brandsused on fruit snacks, including Sunkist, Shrek, and variousWarner Bros. and Sesame Workshop characters.
As part of the fiscal 2002 sale to International MultifoodsCorporation (IMC) of certain Pillsbury dessert and specialtyproduct businesses, IMC received an exclusive royalty-freelicense to use the Doughboy trademark and Pillsbury brand inthe desserts and baking mix categories. The licenses arerenewable without cost in 20-year increments at IMC’sdiscretion. In June 2004, J. M. Smucker Company acquiredIMC and now has the right to use the marks under theterms of the licenses.
The Company considers the collective rights under itsvarious patents, which expire from time to time, a valuableasset, but the Company does not believe that its businessesare materially dependent upon any single patent or group ofrelated patents.
Raw Materials and Supplies. The principal raw materialsused by General Mills are cereal grains, sugar, dairy prod-ucts, vegetables, fruits, meats, other agricultural products,vegetable oils, plastic and paper packaging materials, oper-ating supplies and energy. The Company has some long-termfixed price contracts, but the majority of such raw materialsare purchased on the open market. The Company believesthat it will be able to obtain an adequate supply of neededingredients and packaging materials. Occasionally and wherepossible, the Company makes advance purchases of itemssignificant to its business in order to ensure continuity ofoperations. The Company’s objective is to procure materialsmeeting both the company’s quality standards and itsproduction needs at the lowest total cost to the Company.
3

The Company’s strategy is to buy these materials at pricelevels that allow a targeted profit margin. Since commoditiesgenerally represent the largest variable cost in manufacturingthe Company’s products, to the extent possible, theCompany hedges the risk associated with adverse pricemovements using exchange-traded futures and options,forward cash contracts and over-the-counter hedging mecha-nisms. These tools enable the Company to manage therelated commodity price risk over periods of time thatexceed the period of time in which the physical commodityis available. Accordingly, the Company uses these hedgingtools to mitigate the risks associated with adverse pricemovements and not to speculate in the marketplace. Seealso Note Seven to the Consolidated Financial Statementsappearing on pages 34 through 35 in Item Eight of thisreport and the “Market Risk Management” section ofManagement’s Discussion and Analysis of FinancialCondition and Results of Operation appearing on page 19 inItem Seven of this report.
Capital Expenditures. During the fiscal year endedMay 30, 2004, General Mills’ aggregate capital expendituresfor fixed assets and intangibles amounted to $653 million,including construction costs to consolidate the Company’sheadquarters and expenditures associated with the acquisi-tion and integration of Pillsbury. The Company expects tospend approximately $450-500 million for capital projects infiscal 2005, primarily for fixed assets to support furthergrowth and increase supply chain productivity.
Research and Development. Major research anddevelopment facilities are located at the Riverside TechnicalCenter in Minneapolis, Minnesota and the James Ford BellTechnical Center in Golden Valley (suburban Minneapolis),Minnesota. General Mills’ research and developmentresources are focused on new product development, productimprovement, process design and improvement, packaging,and exploratory research in new business areas. Researchand development expenditures amounted to $158 million infiscal 2004, $149 million in fiscal 2003 and $131 million infiscal 2002.
Employees. At May 30, 2004, General Mills had approxi-mately 27,580 employees.
Food Quality and Safety Regulation. The manufactureand sale of consumer food products is highly regulated. Inthe United States, the Company’s activities are subject toregulation by various government agencies, including theFood and Drug Administration, United States Departmentof Agriculture, Federal Trade Commission and Departmentof Commerce, as well as various state and local agencies.The Company’s business is also regulated by similar agenciesoutside of the United States.
Environmental Matters. As of June 2004, General Millswas involved with the following active cleanup sitesassociated with the alleged release or threatened release ofhazardous substances or wastes:
Site Chemical of Concern
Central Steel Drum,Newark, NJ
No single hazardousmaterial specified
East Hennepin,Minneapolis, MN
Trichloroethylene
GBF/Pittsburgh, Antioch,CA
No single hazardousmaterial specified
Gloucester, MA Petroleum fuel products
King’s Road Landfill,Toledo, OH
No single hazardousmaterial specified
Kipp, KS Carbon tetrachloride
Lorentz Barrel, San Jose, CA No single hazardousmaterial specified
NL Industries, Granite City,IL
Lead
Northside Sanitary Landfill,Zionsville, IN
No single hazardousmaterial specified
Operating Industries, LosAngeles, CA
No single hazardousmaterial specified
Pennsauken Landfill,Pennsauken, NJ
No single hazardousmaterial specified
PET, St. Louis, MO Tetrachloroethylene
Sauget Landfill, Sauget, IL No single hazardousmaterial specified
Shafer Metal Recycling,Minneapolis, MN
Lead
Safer Textiles, Moonachie,NJ
Tetrachloroethylene
Stuckey’s, Doolittle, MO Petroleum fuel products
These matters involve several different actions, includinglitigation initiated by governmental authorities and/orprivate parties, administrative proceedings commenced byregulatory agencies, and demand letters issued by regulatoryagencies and/or private parties. Of the 16 matters in thetable above, the Company is a party to current litigationrelated to two cleanup sites:
• Pennsauken Solid Waste Management Authority, et al. v. Stateof New Jersey, et al., Defendants — Quick-way, Inc., Defendantand Third-party Plaintiff, v. A-1 Accoustical Ceiling, Inc. et al.involves a State of New Jersey superfund site where aformer subsidiary of the Company has been sued as athird-party defendant. The Company is defending this
4

action under the terms of an indemnification agreement.The amount of the cleanup liability has not beendetermined.
• West Coast Home Builders, Inc. v. Ashland Inc., et al. involvesa claim for an unspecified amount of damages for thediminished value of property adjacent to a State ofCalifornia superfund site. The cleanup of the site iscovered by an existing settlement agreement between theState of California and a group of the potentially respon-sible parties, including the Company. A tolling agreementhas expired and, as a result, the complaint has beenre-filed by the plaintiff, but not yet served on theCompany. In addition, the potentially responsible partieshave an insurance policy that covers the costs of cleanupin excess of amounts already paid, including third partyclaims related to the site. We believe the claims arecovered by the insurance policy and that the Companydoes not have any financial exposure as a result ofthis litigation.
• SPPI-Sommerville Inc., et al v. TRC Companies, Inc. et al.involves a claim for an unspecified amount of damages forthe diminished value of another parcel of property adja-cent to the same State of California superfund site as theWest Coast Home Builders claim. This claim has beenfiled with the court but has not yet been served on theCompany. As with the West Coast Home Builders claim,the potentially responsible parties have an insurancepolicy that covers the costs of cleanup in excess ofamounts already paid, including third party claims relatedto the site. The Company believes the claims are coveredby the insurance policy and that the Company does nothave any financial exposure as a result of this litigation.
The Company recognizes that its potential exposure withrespect to any of these sites may be joint and several, buthas concluded that its probable aggregate exposure is notmaterial. This conclusion is based upon, among otherthings, the Company’s payments and/or accruals withrespect to each site; the number, ranking, and financialstrength of other potentially responsible parties identified ateach of the sites; the status of the proceedings, includingvarious settlement agreements, consent decrees or courtorders; allocations of volumetric waste contributions andallocations of relative responsibility among potentiallyresponsible parties developed by regulatory agencies and byprivate parties; remediation cost estimates prepared bygovernmental authorities or private technical consultants;and the Company’s historical experience in negotiating andsettling disputes with respect to similar sites.
The Company’s operations are subject to the Clean Air Act,Clean Water Act, Resource Conservation and Recovery Act,
Comprehensive Environmental Response, Compensationand Liability Act, and the Federal Insecticide, Fungicide andRodenticide Act, and all similar state environmental lawsapplicable to the jurisdictions in which we operate.
Based on current facts and circumstances, the Companybelieves that neither the results of its environmentalproceedings nor its compliance in general with environ-mental laws or regulations will have a material adverse effectupon the capital expenditures, earnings or competitive posi-tion of the Company.
EXECUTIVE OFFICERS OF THE REGISTRANT
The section below summarizes the executive officers ofGeneral Mills, together with their ages and businessexperience:
Randy G. Darcy, age 53, is Senior Vice President, ChiefTechnical Officer with responsibilities for Supply Chain,Research and Development, and Quality and RegulatoryOperations. Mr. Darcy joined the Company in 1987,was named Vice President, Director of Manufacturing,Technology and Operations in 1989, served as Senior VicePresident, Supply Chain from 1994 to 2003 and was namedto his present position in 2003. Mr. Darcy was employedby Procter & Gamble from 1973 to 1987, serving in avariety of management positions. Mr. Darcy is a director ofNorthWestern Corporation.
Rory A. M. Delaney, age 59, is Senior Vice President,Strategic Technology Development. Mr. Delaney joined theCompany in this position in 2001 from The PillsburyCompany where he spent a total of eight years, last servingas Senior Vice President of Technology, responsible for thedevelopment and application of food technologies forPillsbury’s global operations. Prior to joining The PillsburyCompany, Mr. Delaney spent 18 years with PepsiCo, lastserving as Senior Vice President of Technology for Frito-LayNorth America.
Stephen R. Demeritt, age 60, is Vice Chairman of theCompany, with responsibility for Big G Cereals, Snacks,Yoplait-Colombo, General Mills Canada, Consumer Insightsand Advertising, Small Planet Foods, and the 8th Continent,Cereal Partners Worldwide and Snack Ventures Europe jointventures. He has served as Vice Chairman since October1999. Mr. Demeritt joined General Mills in 1969 andserved in a variety of consumer food marketing positions.He was President of International Foods from 1991 to 1993and from 1993 to 1999 was Chief Executive Officer ofCereal Partners Worldwide, our global cereal joint venturewith Nestlé. Mr. Demeritt is a director of EastmanChemical Company.
5

James A. Lawrence, age 51, is Executive Vice President,Chief Financial Officer, with additional responsibility forinternational operations. Mr. Lawrence joined the Companyas Chief Financial Officer in 1998 from Northwest Airlineswhere he was Executive Vice President, Chief FinancialOfficer. Prior to joining Northwest Airlines in 1996, he wasat Pepsi-Cola International, serving initially as ExecutiveVice President and subsequently as President and ChiefExecutive Officer for its operations in Asia, the Middle Eastand Africa. Mr. Lawrence is a director of St. Paul TravelersCompanies and Avnet, Inc.
Siri S. Marshall, age 56, is Senior Vice President,Corporate Affairs, General Counsel and Secretary.Ms. Marshall joined the Company in 1994 as SeniorVice President, General Counsel and Secretary from AvonProducts, Inc. where she spent 15 years, last serving asSenior Vice President, General Counsel and Secretary.
Michael A. Peel, age 54, is Senior Vice President, HumanResources and Corporate Services. Mr. Peel joined theCompany in this position in 1991 from PepsiCo where hespent 14 years, last serving as Senior Vice President, HumanResources, responsible for PepsiCo Worldwide Foods.Mr. Peel is a director of Select Comfort Corporation.
Jeffrey J. Rotsch, age 54, is Senior Vice President,President, Consumer Foods Sales. Mr. Rotsch joined theCompany in 1974 and served as the president of severaldivisions, including Betty Crocker and Big G cereals. He waselected Senior Vice President in 1993 and named President,Consumer Foods Sales, in November 1997.
Stephen W. Sanger, age 58, has been Chairman of theBoard and Chief Executive Officer of General Mills since1995. Mr. Sanger joined the Company in 1974 and servedas the head of several business units, including Yoplait USAand Big G cereals. He was elected a Senior Vice President in1989, an Executive Vice President in 1991, Vice Chairmanin 1992 and President in 1993. He is a director of TargetCorporation, Wells Fargo & Company and GroceryManufacturers of America.
Kenneth L. Thome, age 56, is Senior Vice President,Financial Operations. Mr. Thome joined the Company in1969 and was named Vice President, Controller forConvenience and International Foods Group in 1985, VicePresident, Controller for International Foods in 1989, VicePresident, Director of Information Systems in 1991 and waselected to his present position in 1993.
Raymond G. Viault, age 59, is Vice Chairman of theCompany with responsibility for the Meals, BakingProducts, Pillsbury USA and Bakeries and Foodservicebusinesses. Mr. Viault joined the Company as ViceChairman in 1996 from Philip Morris, where he had been
based in Zurich, Switzerland, serving since 1990 asPresident of Kraft Jacobs Suchard. Mr. Viault was with KraftGeneral Foods a total of 20 years, serving in a variety ofmajor marketing and general management positions. Mr.Viault has announced his intention to retire from theCompany on October 1, 2004. Mr. Viault is a director of VFCorporation and Newell Rubbermaid Inc.
AVAILABLE INFORMATION
Availability of Reports. General Mills is a reportingcompany under the Securities Exchange Act of 1934, asamended (the 1934 Act), and files reports, proxy statementsand other information with the Securities and ExchangeCommission (the SEC). The public may read and copy anyCompany filings at the SEC’s Public Reference Room at 450Fifth Street N.W., Washington, D.C. 20549. You may obtaininformation on the operation of the Public Reference Roomby calling the SEC at 1-800-SEC-0330. Because theCompany makes filings to the SEC electronically, you mayaccess this information at the SEC’s internet site:www.sec.gov. This site contains reports, proxies and informa-tion statements and other information regarding issuers thatfile electronically with the SEC.
Web Site Access. Our internet Web site address iswww.generalmills.com. We make available, free of charge at the“Investor Information” portion of this Web site, annualreports on Form 10-K, quarterly reports on Form 10-Q,current reports on Form 8-K, and amendments to thosereports filed or furnished pursuant to Section 13(a) or 15(d)of the 1934 Act as soon as reasonably practicable after weelectronically file such material with, or furnish it to, theSEC. Reports of beneficial ownership filed pursuant toSection 16(a) of the 1934 Act are also available on ourWeb site.
CAUTIONARY STATEMENT RELEVANT TO FORWARD-LOOKING INFORMATION FOR THE PURPOSE OF “SAFEHARBOR” PROVISIONS OF THE PRIVATE SECURITIESLITIGATION REFORM ACT OF 1995
This Report contains or incorporates by reference forward-looking statements with respect to annual or long-termgoals of the Company. The Company and its representativesalso may from time to time make written or oral forward-looking statements, including statements contained in theCompany’s filings with the Commission and in its reportsto stockholders.
The words or phrases “will likely result,” “are expected to,”“will continue,” “is anticipated,” “estimate,” “project” orsimilar expressions identify “forward-looking statements”within the meaning of the Private Securities Litigation
6

Reform Act of 1995. Such statements are subject to certainrisks and uncertainties that could cause actual results todiffer materially from historical earnings and those presentlyanticipated or projected. The Company wishes to cautionreaders not to place undue reliance on any such forward-looking statements, which speak only as of the date made.
In connection with the “safe harbor” provisions of thePrivate Securities Litigation Reform Act of 1995, theCompany is identifying important factors that could affectthe Company’s financial performance and could causethe Company’s actual results for future periods to differmaterially from any opinions or statements expressed withrespect to future periods in any current statements.
The Company’s future results could be affected by a varietyof factors, such as:
• competitive dynamics in the consumer foods industry andthe markets for our products, including new productintroductions, advertising activities, pricing actions andpromotional activities of our competitors;
• actions of competitors other than as described above;
• economic conditions, including changes in inflation rates,interest rates or tax rates;
• product development and innovation;
• consumer acceptance of new products and productimprovements;
• consumer reaction to pricing actions and changes inpromotion levels;
• acquisitions or dispositions of businesses or assets;
• changes in capital structure;
• changes in laws and regulations, including changes inaccounting standards;
• changes in customer demand for our products;
• effectiveness of advertising, marketing and promotionalprograms;
• changes in consumer behavior, trends and preferences,including weight loss trends;
• consumer perception of health-related issues, includingobesity;
• changes in purchasing and inventory levels of significantcustomers;
• fluctuations in the cost and availability of supply chainresources, including raw materials, packaging and energy;
• benefit plan expenses due to changes in plan asset valuesand/or discount rates used to determine plan liabilities;
• foreign economic conditions, including currency ratefluctuations; and
• political unrest in foreign markets and economicuncertainty due to terrorism or war.
The Company’s predictions about future debt reductioncould be affected by a variety of factors, including itemslisted above that could impact future earnings. The debtreduction goals could also be affected by changes ineconomic conditions or capital market conditions, includinginterest rates, laws and regulations. The Company specifi-cally declines to undertake any obligation to publicly reviseany forward-looking statements that have been made toreflect events or circumstances after the date of thosestatements or to reflect the occurrence of anticipated orunanticipated events.
The Company’s debt securities are rated by rating organiza-tions. Investors should note that a security rating is not arecommendation to buy, sell or hold securities, that it issubject to revision or withdrawal at any time by theassigning rating agency, and that each rating should beevaluated independently of any other rating.
ITEM 2 — Properties.
General Mills’ principal executive offices and main researchfacilities are Company-owned, and are located in theMinneapolis, Minnesota metropolitan area. The Companyowns and operates numerous manufacturing facilities, andmaintains many sales and administrative offices and ware-houses, mainly in the United States. Other facilities areoperated in Canada and elsewhere around the world.
As of May 2004, General Mills operated 63 facilities for theproduction of a wide variety of food products. Of theseplants, 36 are located in the United States, nine inAsia/Pacific, seven in Canada and Mexico, six in Europe,four in Latin America and one in South Africa.
The Company owns flour mills at eight locations: Avon,Iowa; Buffalo, New York; Great Falls, Montana; Kansas City,Missouri; Minneapolis, Minnesota (2); Vallejo, California;and Vernon, California. The Company operates seventerminal grain elevators and has country grain elevators ineight locations, plus additional seasonal elevators, primarilyin Idaho.
The Company also owns or leases warehouse spaceaggregating approximately 10,500,000 square feet, ofwhich approximately 8,600,000 square feet are leased.A number of sales and administrative offices are maintainedby the Company in the United States, Canada, andelsewhere around the world, totaling approximately3,000,000 square feet.
7

ITEM 3 — Legal Proceedings.
In management’s opinion, there were no claims or litigationpending as of May 30, 2004, that could have a materialadverse effect on the consolidated financial position orresults of operations of the Company. See the informationcontained under the section entitled “EnvironmentalMatters,” on pages 4 and 5 of this report, for a discussion ofenvironmental matters in which the Company is involved.
On October 15, 2003, the Company announced that theSecurities and Exchange Commission (SEC) had issued aformal request for information concerning the Company’ssales practices and related accounting. On February 3, 2004,the Company announced that the Staff of the SEC hadissued a Wells notice reflecting the Staff ’s intention torecommend that the SEC bring a civil action against theCompany, its Chief Executive Officer, and its ChiefFinancial Officer.
The Staff indicated to the Company that its intendedrecommendation focused on at least two disclosure issuesrelated to the U.S. Retail division. First, the Staff believedthat the Company does not adequately disclose the practiceof “loading” at the end of fiscal quarters to help meetinternal sales targets or the impact of such quarter-end“loading” on current and future period results of operations.The Company understands the term “loading” in thiscontext to mean the use of discounts or other promotionalprograms to encourage retailers and wholesalers to increasetheir purchases of Company products. Second, the Staffbelieved that the Company had misstated its policy onproduct returns. The Staff also informed the Company thatits investigation is ongoing.
The Company, its Chief Executive Officer, and its ChiefFinancial Officer responded to the Wells notice with awritten submission explaining the factual and legal bases forthe Company’s belief that its sales practices comply with allapplicable regulations. The SEC subsequently issued aformal request for additional information in connection withits investigation. At this time, it is not possible to predicthow long the investigation will continue or whether the SECwill bring any legal action against the Company.
ITEM 4 — Submission of Matters to a Vote of SecurityHolders.
No matters require disclosure here.
PART II
ITEM 5 — Market for Registrant’s Common Equity andRelated Stockholder Matters.
The Company’s common stock is listed on the New YorkStock Exchange. On July 20, 2004, there were approxi-mately 37,013 record holders of the Company’s commonstock. Information regarding the market prices for theCompany’s common stock and dividend payments for thetwo most recent fiscal years is set forth in Note Nineteen tothe Consolidated Financial Statements on page 47 in ItemEight of this report.
The following table sets forth information with respect toshares of common stock of the Company purchased by theCompany during the three fiscal months ended May 30,2004.
Period
TotalNumber
of SharesPurchased(a)
AveragePrice PaidPer Share
Total Numberof Shares
Purchased asPart of aPublicly
AnnouncedProgram
ApproximateDollar Value
of Shares thatmay yet bePurchasedunder theProgram
February 23,2004 throughMarch 28,2004 203,514 $46.76 – –
March 29, 2004throughApril 25, 2004 5,100 $46.92 – –
April 26, 2004throughMay 30, 2004 30,550 $45.73 – –
Total 239,164 $46.63 – –
(a) The total number of shares purchased includes: (i) 204,800shares purchased from the ESOP fund of the Company 401(k)savings plan, (ii) 30,000 shares purchased by the trust forthe Company 401(k) savings plan, and (iii) 4,364 shares ofrestricted stock withheld for the payment of withholding taxesupon vesting of restricted stock.
8

ITEM 6 — Selected Financial Data.
In Millions, ExceptPer Share Data
May 30,2004
May 25,2003
May 26,2002
May 27,2001
May 28,2000
Earnings pershare – basic $ 2.82 $ 2.49 $ 1.38 $ 2.34 $ 2.05
Earnings pershare – diluted 2.75 2.43 1.34 2.28 2.00
Net sales 11,070 10,506 7,949 5,450 5,173Net earnings 1,055 917 458 665 614Total assets 18,448 18,227 16,540 5,091 4,574Long-term debt,
excludingcurrent portion 7,410 7,516 5,591 2,221 1,760
Dividends pershare 1.10 1.10 1.10 1.10 1.10
The acquisition of Pillsbury, on October 31, 2001,significantly affected our financial condition and results ofoperations beginning in fiscal 2002. See Note Two to theconsolidated financial statements on page 28 in Item Eightof this report.
ITEM 7 — Management’s Discussion and Analysis ofFinancial Condition and Results of Operation.
EXECUTIVE OVERVIEW
General Mills is a global consumer foods company. Wedevelop differentiated food products and market thesevalue-added products under unique brand names. Wework continuously on product innovation to improve ourestablished brands and to create new products that meetconsumers’ evolving needs and preferences. In addition,we build the equity of our brands over time with strongconsumer-directed marketing and innovative merchandising.We believe our brand-building strategy is the key to winningand sustaining leading share positions in markets aroundthe globe.
Our businesses are organized into three segments. Our U.S.Retail segment accounted for approximately 70 percent ofour fiscal 2004 net sales, and reflects business with a widevariety of grocery stores, specialty stores, drug and discountchains, and mass merchandisers operating throughout theUnited States. Our major product categories in this businesssegment are ready-to-eat cereals, meals, refrigerated andfrozen dough products, baking products, snacks, yogurt andorganic foods. Our Bakeries and Foodservice segment gener-ated approximately 16 percent of fiscal 2004 net sales. Thisbusiness segment consists of products marketed to retail andwholesale bakeries, and to commercial and noncommercialfoodservice distributors and operators throughout theUnited States and Canada. The remaining 14 percent of ourfiscal 2004 net sales was generated by our consolidatedInternational businesses. These include a retail business in
Canada that largely mirrors our U.S. retail product mix,along with retail and foodservice businesses competingin key markets in Europe, Latin America and theAsia/Pacific region.
In addition to these consolidated operations, we participatein several joint ventures. We record our proportionate shareof after-tax earnings or losses from these ventures. In fiscal2004, joint ventures accounted for $74 million of ourafter-tax earnings.
Our fundamental business goal is to generate superiorreturns for our shareholders over the long term by deliveringconsistent growth in sales and earnings, coupled with anattractive dividend yield. We have met this objective overthe most recent five-year period (fiscal 1999 to 2004), asGeneral Mills’ total return to shareholders has averaged5 percent while the S&P 500 Index has posted a negative2 percent average annual return over this period. However,in the most recent fiscal year the 22 percent return of theS&P 500 Index outperformed our 1 percent return.
We achieved good sales and earnings gains in fiscal 2004,which included the benefit of an extra week. For the53-week period ended May 30, 2004, our net sales grew5 percent and diluted earnings per share grew 13 percent.Details of our financial results are provided in the Results ofOperations section below. Our cash flow in 2004 was strong,enabling us to pay out almost 40 percent of earnings asdividends, make significant fixed asset investments tosupport future growth and productivity, and reduce thebalance of our adjusted debt plus minority interests by$572 million (see definition of adjusted debt on page 14 ofthis report). We have prioritized debt repayment as a use ofcash for the three-year period through fiscal 2006. Our goalis to reduce the balance of our adjusted debt plus minorityinterests by a cumulative $2 billion by the end of 2006, andthereby improve our fixed charge coverage to the levels wedemonstrated prior to our acquisition of Pillsbury inOctober 2001.
While our earnings results in 2004 were good overall, theyfell short of our initial expectations for the year due to threeprincipal factors. First, higher commodity costs reduced ourgross margin. Second, the recent popularity oflow-carbohydrate diets slowed sales in several of our majorproduct categories. And finally, our Bakeries and Foodservicebusiness fell well short of targeted results, due in part to thelow-carbohydrate trend and higher supply chain costs. Theseresults also reflect disruption caused by our own manufac-turing realignment actions and decisions to eliminatelow-margin product lines in a number of customer catego-ries.
In fiscal 2005, we face several challenges that will hinderearnings growth. The first obvious hurdle is the fact that we
9

will have one less week of business in 2005 going up against53-week results in 2004. But beyond that, commodity pricescontinue to rise — our 2005 business plan assumes asignificant increase in commodity costs compared to our2004 expense. Energy costs and our salary and benefitexpense are expected to be higher. And from an operationsperspective, we need to stabilize trends in our Bakeries andFoodservice segment.
To partially offset the higher input costs we are experiencing,we have increased list prices on certain product lines. Wealso plan to increase merchandised price points for certainproducts. However, these actions won’t entirely cover ourincreased costs. We plan to capture additional supply chainproductivity during 2005, and we will continue to controladministrative costs companywide. We also have identifiedopportunities to reconfigure certain manufacturing activitiesto improve our cost structure.
We believe the key driver of our results in 2005 will be thesuccess of our product innovation, which is critical toachieving unit volume growth. Our business plans includenew product activity and innovations that respond toconsumers’ interest in health and nutrition, convenience andnew flavor varieties.
RESULTS OF OPERATIONS — 2004 vs. 2003
Net sales for the company increased 5 percent for the yearcompared to sales in fiscal 2003. Excluding the effect of the53rd week, net sales increased 4 percent. The components ofnet sales growth are shown in the following table:
Components of Net Sales GrowthFiscal 2004 vs. Fiscal 2003
Unit Volume Growth:52 vs. 52-week Basis (as if fiscal 2004
contained 52 weeks) +2 pts53rd week +1 pt
Price/Product Mix/Foreign Currency Exchange +3 ptsTrade and Coupon Promotion Expense –1 ptNet Sales Growth +5%
The unit volume growth in fiscal 2004 contributed approxi-mately $130 million in gross margin improvement (net salesless cost of sales) over fiscal 2003. However, gross marginincreased by only $89 million. Increased cost of sales, drivenprimarily by more than $100 million in commodity costincreases, could not be fully covered by net pricing realiza-tion. As a result, gross margin as a percent of net salesdecreased from 42 percent in fiscal 2003 to 41 percent infiscal 2004.
Selling, general and administrative costs decreased by$29 million from fiscal 2003 to fiscal 2004, driven by a
$36 million decrease in merger-related costs. These merger-related costs are infrequently occurring items related to theplanning and execution of the integration of Pillsbury,including consulting, system conversions, relocation, trainingand communications.
Net interest expense decreased 7 percent from $547 millionin fiscal 2003 to $508 million in fiscal 2004, primarily dueto favorable interest rates. We have in place a net amount ofinterest rate swaps that convert $79 million of floating ratedebt to fixed rates. Our portfolio of interest rate swaps hasan average life of 4.0 years and has an average fixed rate of5.3 percent. Taking into account the effect of all of ourinterest rate swaps, the average interest rate on our totaloutstanding debt as of May 30, 2004 was approximately5.8 percent.
Restructuring and other exit costs were $26 million in fiscal2004, as described in more detail in Note Three to theconsolidated financial statements. Approximately$11 million was related to plant closures in the Netherlands,Brazil and California. We recorded an additional $7 millionprimarily related to adjustments of costs associated withpreviously announced closures of manufacturing facilities. Inaddition, we recorded $8 million for severance, primarilyrelated to realignment actions in our Bakeries and Food-service organization. Our fiscal 2003 results includedrestructuring and other exit costs of $62 million. These costsalso are discussed in Note Three.
Our effective income tax rate was 35 percent in fiscal 2004and 2003.
After-tax earnings from joint venture operations grew21 percent to reach $74 million in fiscal 2004, comparedwith $61 million reported a year earlier. Profits for CerealPartners Worldwide (CPW), our joint venture with Nestlé,and Snack Ventures Europe (SVE), our joint venture withPepsiCo, together grew to $58 million, 29 percent higherthan last year’s profits. Häagen-Dazs joint ventures profitswere partially offset by continued marketing investment for8th Continent, the Company’s soy products joint venturewith DuPont. These two ventures combined for $16 millionof profit. General Mills’ proportionate share of joint venturenet sales grew to $1.2 billion, compared to $1.0 billion infiscal 2003.
Average diluted shares outstanding were 384 million infiscal 2004, up 2 percent from 378 million in fiscal 2003primarily due to stock option exercises.
Net income increased to $1,055 million in fiscal 2004, from$917 million in 2003. Net income per diluted share of$2.75 in 2004 was up 13 percent from $2.43 in 2003 as aresult of the increased income from operations. We exceededour debt reduction goal for the year, retiring $572 million of
10

adjusted debt plus minority interests, a key internal measurethat we define in our Capital Structure table on page 14.
Operating Segment Results
U.S. Retail Segment
Net sales for our U.S. Retail operations totaled $7.76 billionin fiscal 2004, compared to $7.41 billion in fiscal 2003. Thecomponents of net sales growth are shown in the followingtable:
Components of U.S. Retail Net Sales GrowthFiscal 2004 vs. Fiscal 2003
Unit Volume Growth:52 vs. 52-week Basis (as if fiscal 2004
contained 52 weeks) +2 pts53rd week +2 pts
Price/Product Mix +2 ptsTrade and Coupon Promotion Expense –1 ptNet Sales Growth +5%
Unit volume grew 4 percent versus fiscal 2003 fueled by anincrease in product and marketing innovation. Without the53rd week, unit volume grew 2 percent. All of our U.S.Retail divisions experienced volume growth for the year:
U.S. Retail Unit Volume GrowthFiscal 2004 vs. Fiscal 2003
Yoplait +10%Snacks +5Baking Products +4Meals +3Pillsbury USA +2Big G Cereals +2Total U.S. Retail +4%
52 vs. 52-week Basis (as if fiscal 2004 contained52 weeks) +2%
Big G cereal volume grew 2 percent in 2004, with contribu-tions from new products including Berry Burst Cheerios, andgains by several key established brands such as Honey NutCheerios and Reese’s Puffs. Yoplait yogurt volume increased10 percent with continued growth from established linesplus contributions from Yoplait Nouriche yogurt beverages.Snacks division volume was up 5 percent, led by growth infruit snacks and granola bars. Meals division unit volumerose 3 percent with contributions from the line of ProgressoRich & Hearty soups introduced during the year, and fromBetty Crocker dinner mixes. Unit volume growth of 2 percentfor Pillsbury USA reflected gains for Totino’s pizza and hot
snacks, frozen breakfast items (toaster strudel, waffles) andfrozen baked goods. Baking Products division unit volumewas up 4 percent.
Retail dollar sales for the Company’s major brands also grew2 percent overall on a 52 vs. 52-week basis as measured byACNielsen plus projections for Wal-Mart:
Retail Dollar Sales Growth (52 vs. 52-week Basis)Fiscal 2004 vs. Fiscal 2003
General MillsRetail Sales
GrowthComposite Retail Sales +2%
Major Product Lines:Grain Snacks +12%Ready-to-serve Soup +12Refrigerated Yogurt +6Dessert Mixes +4Dry Dinners +3Fruit Snacks +2Ready-to-eat Cereals –2Refrigerated Dough –3
Source: ACNielsen plus Wal-Mart Projections
The unit volume growth in fiscal 2004 contributed approxi-mately $125 million in gross margin improvement over fiscal2003, but gross margin increased by only $54 million.Increased cost of sales, driven primarily by more than$90 million in commodity cost increases, could not be fullycovered by net pricing realization. As a result, gross marginas a percent of net sales decreased from 48 percent in fiscal2003 to 46 percent in fiscal 2004.
Selling, general and administrative costs decreased by$1 million from fiscal 2003 to fiscal 2004.
Operating profits grew to $1.81 billion, up from$1.75 billion in fiscal 2003.
11
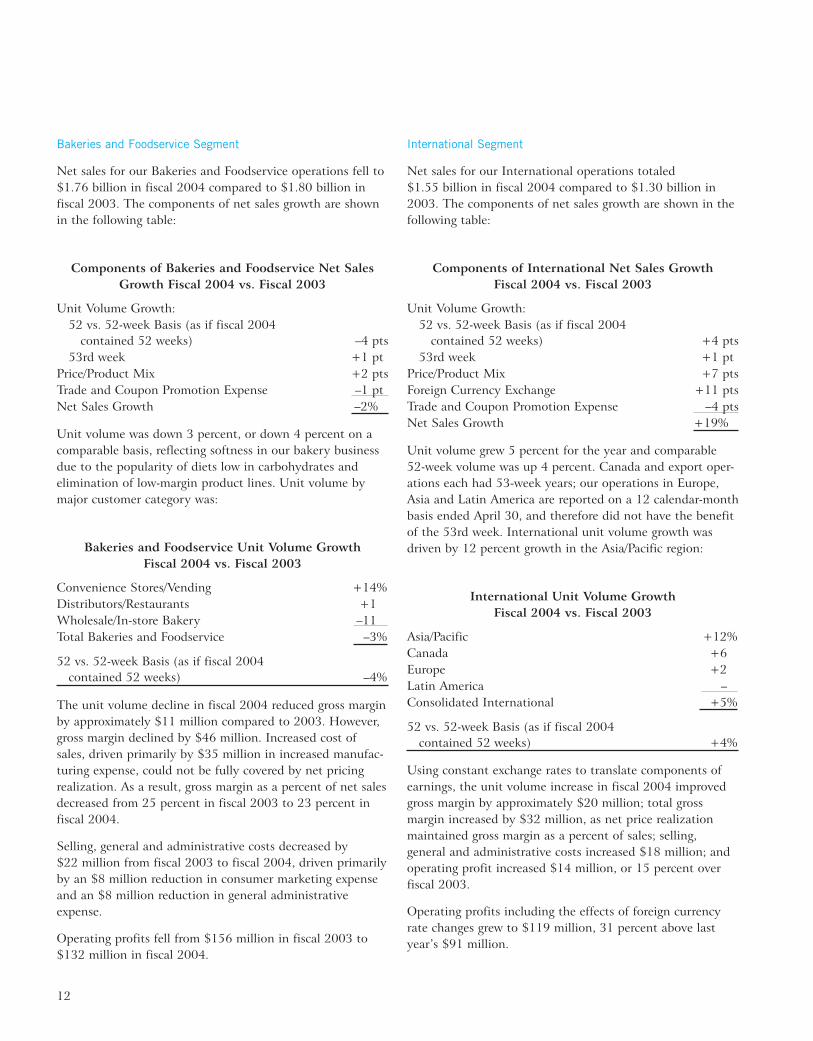
Bakeries and Foodservice Segment
Net sales for our Bakeries and Foodservice operations fell to$1.76 billion in fiscal 2004 compared to $1.80 billion infiscal 2003. The components of net sales growth are shownin the following table:
Components of Bakeries and Foodservice Net SalesGrowth Fiscal 2004 vs. Fiscal 2003
Unit Volume Growth:52 vs. 52-week Basis (as if fiscal 2004
contained 52 weeks) –4 pts53rd week +1 pt
Price/Product Mix +2 ptsTrade and Coupon Promotion Expense –1 ptNet Sales Growth –2%
Unit volume was down 3 percent, or down 4 percent on acomparable basis, reflecting softness in our bakery businessdue to the popularity of diets low in carbohydrates andelimination of low-margin product lines. Unit volume bymajor customer category was:
Bakeries and Foodservice Unit Volume GrowthFiscal 2004 vs. Fiscal 2003
Convenience Stores/Vending +14%Distributors/Restaurants +1Wholesale/In-store Bakery –11Total Bakeries and Foodservice –3%
52 vs. 52-week Basis (as if fiscal 2004contained 52 weeks) –4%
The unit volume decline in fiscal 2004 reduced gross marginby approximately $11 million compared to 2003. However,gross margin declined by $46 million. Increased cost ofsales, driven primarily by $35 million in increased manufac-turing expense, could not be fully covered by net pricingrealization. As a result, gross margin as a percent of net salesdecreased from 25 percent in fiscal 2003 to 23 percent infiscal 2004.
Selling, general and administrative costs decreased by$22 million from fiscal 2003 to fiscal 2004, driven primarilyby an $8 million reduction in consumer marketing expenseand an $8 million reduction in general administrativeexpense.
Operating profits fell from $156 million in fiscal 2003 to$132 million in fiscal 2004.
International Segment
Net sales for our International operations totaled$1.55 billion in fiscal 2004 compared to $1.30 billion in2003. The components of net sales growth are shown in thefollowing table:
Components of International Net Sales GrowthFiscal 2004 vs. Fiscal 2003
Unit Volume Growth:52 vs. 52-week Basis (as if fiscal 2004
contained 52 weeks) +4 pts53rd week +1 pt
Price/Product Mix +7 ptsForeign Currency Exchange +11 ptsTrade and Coupon Promotion Expense –4 ptsNet Sales Growth +19%
Unit volume grew 5 percent for the year and comparable52-week volume was up 4 percent. Canada and export oper-ations each had 53-week years; our operations in Europe,Asia and Latin America are reported on a 12 calendar-monthbasis ended April 30, and therefore did not have the benefitof the 53rd week. International unit volume growth wasdriven by 12 percent growth in the Asia/Pacific region:
International Unit Volume GrowthFiscal 2004 vs. Fiscal 2003
Asia/Pacific +12%Canada +6Europe +2Latin America –Consolidated International +5%
52 vs. 52-week Basis (as if fiscal 2004contained 52 weeks) +4%
Using constant exchange rates to translate components ofearnings, the unit volume increase in fiscal 2004 improvedgross margin by approximately $20 million; total grossmargin increased by $32 million, as net price realizationmaintained gross margin as a percent of sales; selling,general and administrative costs increased $18 million; andoperating profit increased $14 million, or 15 percent overfiscal 2003.
Operating profits including the effects of foreign currencyrate changes grew to $119 million, 31 percent above lastyear’s $91 million.
12

Unallocated Corporate Expense
Unallocated corporate expense decreased from $76 millionin fiscal 2003 to $17 million in fiscal 2004, driven primarilyby a $36 million decrease in merger-related costs as theintegration of Pillsbury was completed during the year.
Joint Ventures
Our share of after-tax joint venture earnings increased from$61 million in fiscal 2003 to $74 million in fiscal 2004,primarily due to unit volume gains, as follows:
Joint Ventures Unit Volume GrowthFiscal 2004 vs. Fiscal 2003
CPW +9%SVE +4Häagen-Dazs +38th Continent NMTotal Joint Ventures +8%
Our joint ventures do not share our fiscal year, and thereforedid not have the benefit of a 53rd week in fiscal 2004.
RESULTS OF OPERATIONS — 2003 vs. 2002
The acquisition of Pillsbury, on Oct. 31, 2001, significantlyaffected fiscal 2003 comparisons for our results of opera-tions, as our fiscal 2002 results include only seven monthsof ownership of the Pillsbury businesses. Net earnings(including cumulative effect of change in accounting prin-ciple, adopted in fiscal 2002, as described in more detail inthe section below titled “New Accounting Rules”) were$917 million, up 100 percent from fiscal 2002. Dilutedearnings per share were $2.43 compared to $1.34 in fiscal2002. Annual net sales rose 32 percent, to $10.5 billion,driven by a 30 percent increase in worldwide unit volumefor fiscal 2003. The balance of the net sales growth wasprimarily attributable to promotional efficiencies. On acomparable basis, as if General Mills had owned Pillsburyfor all of fiscal 2002, worldwide unit volume grew 3 percent.This performance reflected improvement in our U.S. Retailsegment, but was constrained by economic factors limitinggrowth in our Bakeries and Foodservice segment and LatinAmerican operations in our International segment.
U.S. Retail unit volume comparable for Pillsbury grew4 percent in fiscal 2003. All of our U.S. Retail divisionsexperienced volume growth except Baking Products, whichdeclined due to significant competitive promotional activity.Net sales for these operations totaled $7.41 billion in fiscal2003, compared to $5.91 billion in fiscal 2002. Operatingprofits totaled $1.75 billion, up 66 percent from theprior year.
Bakeries and Foodservice results in fiscal 2003 included unitvolume comparable for Pillsbury that was essentiallyunchanged from fiscal 2002, reflecting overall weak foodser-vice industry trends. Net sales reached $1.80 billion in fiscal2003 compared to $1.26 billion in fiscal 2002, while oper-ating profit was $156 million, up only 1 percent from theprior year in spite of the inclusion of twelve months of Pills-bury results in fiscal 2003 compared to seven months ofresults included in fiscal 2002.
International unit volume comparable for Pillsbury declined1 percent in fiscal 2003, driven by a 20 percent decline inLatin America that was nearly offset by volume growth inCanada, Europe and Asia. Net sales totaled $1.30 billion infiscal 2003 compared to $778 million in 2002, and oper-ating profits grew to $91 million, more than double theprior year’s $45 million total.
IMPACT OF INFLATION
It is our view that changes in the general rate of inflationhave not had a significant effect on profitability over thethree most recent years other than as noted above related tocommodities. We attempt to minimize the effects of infla-tion through appropriate planning and operating practices.Our market risk management practices are discussed later inthis section.
CASH FLOWS
Sources and uses of cash in the past three years are shownin the following table. Over the most recent three-yearperiod, General Mills’ operations have generated $4.0 billionin cash. In 2004, cash flow from operations totaled nearly$1.5 billion. That was down from the previous year as a$218 million increase in operating earnings before deprecia-tion, amortization, deferred income taxes and restructuringand other exit costs was more than offset by an increase inworking capital of $186 million in 2004 versus a decrease of$246 million in 2003. The increase in the use of workingcapital in fiscal 2004 was due primarily to three factors. Oneof the factors was that the accounts payable balance as ofMay 30, 2004 was $158 million below last year’s balanceprimarily due to lower accrued liabilities, such as tradepromotion liabilities, driven by faster cash payments. Asecond factor was a reduction in miscellaneous other currentliabilities of $119 million due primarily to payments againstintegration and restructuring liabilities. The third factor wasnet income tax payments in 2004 of $225 million versus netpayments of $139 million in 2003.
13

Cash Sources (Uses)
Fiscal Year(In Millions) 2004 2003 2002
From continuing operations $1,461 $1,631 $ 916From discontinued
operations — — (3)Purchases of land, buildings
and equipment, net (592) (697) (485)Investments in businesses,
intangibles and affiliates, net (2) (261) (3,688)Change in marketable
securities 122 (6) 24Proceeds from disposition of
businesses — — 939Other investments, net 2 (54) (61)Increase (decrease) in
outstanding debt, net (695) (616) 5,746Proceeds from minority
investors — 148 150Common stock issued 192 96 139Treasury stock purchases (24) (29) (2,436)Dividends paid (413) (406) (358)Other (3) (78) 28Increase (decrease) in cash
and cash equivalents $ 48 $ (272) $ 911
In fiscal 2004, capital investment for land, buildings andequipment, and intangibles fell to $653 million from$750 million last year, and included expenditures for thecompletion of new facilities at our Minneapolis headquarterscampus and expenditures associated with the acquisitionand integration of Pillsbury. We expect capital expendituresto decrease further in fiscal 2005, to between $450 and$500 million.
Dividends in 2004 totaled $1.10 per share, a payout of40 percent of diluted earnings per share. The board ofdirectors announced a 13 percent increase in dividends to anannual rate of $1.24 per share, effective with the dividendpayable on Aug. 2, 2004.
We did not repurchase a significant number of shares infiscal 2004, nor do we expect to repurchase a significantnumber of shares in fiscal 2005.
FINANCIAL CONDITION
Our notes payable and total long-term debt totaled$8.2 billion as of May 30, 2004. We also consider our leasesand deferred income taxes related to tax leases as part of ourdebt structure, and we use a measurement of “adjusted debtplus minority interests,” as shown in the table below. Thisadjusted debt plus minority interests declined by$572 million, to $8.4 billion, and our stockholders’ equitygrew to $5.2 billion. The market value of General Millsstockholders’ equity increased as well, as an increase inshares outstanding was partially offset by a slight decline inshare price. As of May 30, 2004, our equity market capitali-zation was $17.5 billion, based on a price of $46.05 pershare and 379 million basic shares outstanding. Our totalmarket capitalization, including adjusted debt, minorityinterests and equity capital, fell from $26.2 billion as ofMay 25, 2003 to $25.9 billion as of May 30, 2004.
Capital Structure
(In Millions)May 30,2004
May 25,2003
Notes payable $ 583 $ 1,236Current portion of long-term debt 233 105Long-term debt 7,410 7,516Total debt $ 8,226 $ 8,857Debt adjustments:
Deferred income taxes — tax leases 66 68Leases — debt equivalent 600 550Certain cash and cash equivalents (699) (623)Marketable investments, at cost (54) (142)
Adjusted debt $ 8,139 $ 8,710Minority interests 299 300Adjusted debt plus minority interests $ 8,438 $ 9,010Stockholders’ equity 5,248 4,175Total capital $13,686 $13,185
In fiscal 2004 we refinanced $575 million of our short-termdebt through the following issuances: $500 million of25⁄8 percent 3-year notes that were subsequently swapped to1-month LIBOR plus 11 basis points, and a $75 million5-year term loan at 1-month LIBOR plus 15 basis points.
We consider our leases and deferred income taxes related totax leases as part of our fixed-rate obligations. The nexttable, when reviewed in conjunction with the capital struc-ture table, shows the composition of our debt structureincluding the impact of using derivative instruments.
14

Debt Structure
(In Millions) May 30, 2004 May 25, 2003
Floating-rate $1,169 14% $ 985 11%Fixed-rate 6,603 78 7,407 82Leases — debt
equivalent 600 7 550 6Deferred income taxes
— tax leases 66 1 68 1Adjusted debt plus
minority interests $8,438 100% $9,010 100%
At the end of fiscal 2004, approximately 85 percent of ouradjusted debt plus minority interests was long-term.
Commercial paper is a continuing source of short-termfinancing. We can issue commercial paper in the UnitedStates and Canada, as well as in Europe, through a programestablished in fiscal 1999. Our commercial paper borrowingsare supported by $1.85 billion in committed credit lines.Currently, we have no outstanding borrowings under thesecredit lines. The following table details the fee-paid creditlines we had available as of May 30, 2004.
Committed Credit Facilities
Amount Expiration
Core Facilities $0.75 billion January 2009$1.10 billion January 2006
Total Credit Lines $1.85 billion
On June 23, 2004, we filed a Universal Shelf RegistrationStatement (the shelf) with the Securities and ExchangeCommission covering the sale of up to $5.943 billion ofdebt securities, common stock, preference stock, depositoryshares, securities warrants, purchase contracts, purchaseunits and units (all described in the shelf). In addition, theshelf covers resales of an aggregate of 49,907,680 shares ofour common stock owned by an affiliate of Diageo plc.When the shelf becomes effective, our existing shelf registra-tion will be incorporated therein.
We believe that two important measures of financialstrength are the ratios of fixed charge coverage and cash flowto adjusted debt plus minority interests. Our fixed chargecoverage in fiscal 2004 was 3.8 times compared to 3.2 timesin fiscal 2003, and cash flow to adjusted debt plus minorityinterests was 20 percent compared to 15 percent in fiscal2003. We expect to pay down at least $625 million ofadjusted debt plus minority interests in fiscal 2005, as partof a cumulative $2.0 billion reduction in adjusted debt plusminority interests planned over the three-year period endingin fiscal 2006. Our goal is to return to a mid single-A rating
for our long-term debt, and to the top tier short-term rating,where we were prior to our announcement of the Pillsburyacquisition.
Currently, Standard and Poor’s Corporation has ratings of“BBB+” on our publicly held long-term debt and “A-2” onour commercial paper. Moody’s Investors Services, Inc. hasratings of “Baa2” for our long-term debt and “P-2” for ourcommercial paper. Fitch Ratings, Inc. rates our long-termdebt “BBB+” and our commercial paper “F-2.” DominionBond Rating Service in Canada currently rates General Millsas “A-low.”
OFF-BALANCE SHEET ARRANGEMENTS AND CONTRACTUALOBLIGATIONS
It is not our general business practice to enter intooff-balance sheet arrangements nor is it our policy to issueguarantees to third parties. We have, however, issued guar-antees of approximately $199 million for the debt and otherobligations of unconsolidated affiliates, primarily CPW andSVE. In addition, off-balance sheet arrangements are gener-ally limited to the future payments under noncancelableoperating leases, which totaled approximately $435 millionat May 30, 2004.
The following table summarizes our future estimated cashpayments under existing contractual obligations, includingpayments due by period. The majority of the purchase obli-gations represent commitments for projected raw materialand packaging needs to be utilized in the normal course ofbusiness and for consumer-directed marketing commitmentsthat support our brands. Information concerning other long-term liabilities that consist primarily of retirement and otherpostretirement benefits and the fair value of outstandinginterest hedges has been provided in Note Fourteen andNote Seven, respectively.
In Millions,Payments Dueby Fiscal Year Total 2005 2006-07 2008-09
2010and
ThereafterLong-term debt
(includingcurrentportion) $7,643 $ 233 $2,095 $723 $4,592
Operating leases 435 79 134 112 110Purchase
obligations 1,855 1,578 172 78 27Total $9,933 $1,890 $2,401 $913 $4,729
CRITICAL ACCOUNTING POLICIES
For a complete description of our significant accountingpolicies, please see Note One to the consolidated financialstatements. Our critical accounting policies are those thathave meaningful impact on the reporting of our financialcondition and results, and that may require significantmanagement judgment and estimates. These policies include
15

our accounting for trade and consumer promotion activities;asset impairments; income taxes; and pension and post-retirement liabilities.
Trade and Consumer Promotion Activities
We report sales net of certain coupon and trade promotioncosts. The trade promotion costs include payments tocustomers to perform merchandising activities on our behalf,such as advertising or in-store displays, discounts to our listprices to lower retail shelf prices, and payments to gaindistribution of new products.
The amount and timing of expense recognition for trade andconsumer promotion activities involve management judg-ment related to estimated participation and performancelevels. The vast majority of year-end liabilities associatedwith these activities are resolved within the following fiscalyear and therefore do not require highly uncertain long-termestimates. For interim reporting, we estimate the annualtrade promotion expense and recognize pro rata periodexpense generally in proportion to revenue, adjusted for esti-mated year-to-date expenditures if greater than the pro rataamount. Certain trade and consumer promotion expensesare recorded as reductions of net sales.
Promotional funds for our retail businesses are initiallyestablished at the beginning of each year, and paid out overthe course of the year based on the customer’s performanceof agreed-upon merchandising activity. During the year,additional funds may also be used in response to competi-tive activities, as a result of changes in the mix of ourmarketing support, or to help achieve interim unitvolume targets.
We set annual sales objectives and interim targets as aregular practice to manage our business. Our salesemployees are salaried, and are eligible for annual cashincentives based on performance against objectives set at thestart of the year. These objectives include goals for unitvolume and the trade promotion cost per unit required toachieve the unit volume goal. Our sales employees havediscretion to plan and adjust the timing of merchandisingactivity over the course of the year, and they also have somediscretion to adjust the level of trade promotion fundingapplied to a particular event.
Our unit volume in the last week of each quarter is consis-tently higher than the average for the preceding weeks ofthe quarter. In comparison to the average daily shipments inthe first 12 weeks of a quarter, the final week of eachquarter has approximately two to four days’ worth of incre-mental shipments (based on a five-day week), reflectingincreased promotional activity at the end of the quarter.This increased activity includes promotions to assure thatour customers have sufficient inventory on hand to supportmajor marketing events or increased seasonal demand early
in the next quarter, as well as promotions intended to helpachieve interim unit volume targets. This increased salesactivity results in shipments that are in direct response toorders from customers or authorized pursuant topre-arranged inventory-management agreements, andaccordingly are recognized as revenue within that quarter.The two to four day range of increased unit volume in thelast week of each quarter has been generally consistent fromquarter to quarter over the last three years.
As part of our effort to assess the results of our promotionalactivities, we regularly estimate the amount of “retailerinventory” in the system — defined as product that we haveshipped to our customers that has not yet been purchasedfrom our customers by the end-consumer. While it is notpossible for us to measure the absolute level of inventory, weare able to estimate the change that occurs each month bycomparing our shipments to retail customers with their salesto end-consumers (“takeaway”) as reported by ACNielsen.Our estimate indicates inventory levels peak in Novemberwhen retailers have increased inventories to meet seasonaldemand for products like refrigerated dough and ready-to-serve soup. This seasonal trend is generally consistent fromyear to year, even as retailers have taken actions to reducetheir ongoing inventory levels.
We also assess the effectiveness of our promotional activitiesby evaluating the end-consumer purchases of our productssubsequent to the reporting period. If, due to quarter-endpromotions or other reasons, our customers purchase moreproduct in any reporting period than end-consumer demandwill require in future periods, then our sales level in futurereporting periods would be adversely affected.
As part of our ongoing evaluation of sales, we also monitorcustomer returns. We generally do not allow a right ofreturn on our products. However, on a limited case-by-casebasis with prior approval, we may allow customers to returnproducts in saleable condition for redistribution to othercustomers or outlets. These returns are recorded as reduc-tions of net sales in the period of the return. Monthlyreturns are consistently below 1 percent of sales, and haveaveraged approximately 0.5 percent of total monthly ship-ments over the last three years.
Asset Impairments
We are required to evaluate our long-lived assets, includinggoodwill, for impairment and write down the value of anyassets when they are determined to be impaired. Evaluatingthe impairment of long-lived assets involves managementjudgment in estimating the fair values and future cash flowsrelated to these assets. Although the predictability of long-term cash flows may be uncertain, our evaluations indicatefair values for our long-lived assets and goodwill that aresignificantly in excess of stated book values. Therefore, webelieve the risk of unrecognized impairment is low.
16

Income Taxes
Income tax expense involves management judgment as tothe ultimate resolution of any tax issues. Historically, ourassessments of the ultimate resolution of tax issues havebeen reasonably accurate. The current open tax issues arenot dissimilar in size or substance from historical items.
Pension Accounting
The accounting for pension and other postretirement liabili-ties requires the estimation of several critical factors. Asdetailed in Note Fourteen to the consolidated financialstatements, key assumptions that determine this incomeinclude the discount rate and expected rate of return onplan assets.
Our discount rate assumption is determined annually basedon the interest rate for long-term high-quality corporatebonds. The discount rate used to determine the pensionand other postretirement obligations as of the balance sheetdate is the rate in effect as of that measurement date. Thatsame discount rate also is used to determine pension andother postretirement income or expense for the followingfiscal year.
Our expected rate of return on plan assets is determined byour asset allocation, our historical long-term investmentperformance, our estimate of future long-term returns byasset class (using input from our actuaries, investmentservices and investment managers), and long-term inflationassumptions.
In addition to our assumptions about the discount rate andthe expected rate of return on plan assets, we base our deter-mination of pension expense or income on a market-relatedvaluation of assets which reduces year-to-year volatility inaccordance with SFAS No. 87, “Employers’ Accounting forPensions.” This market-related valuation recognizes invest-ment gains or losses over a five-year period from the year inwhich they occur. Investment gains or losses for this purposeare the difference between the expected return calculatedusing the market-related value of assets and the actualreturn based on the market-related value of assets. Since themarket-related value of assets recognizes gains or losses overa five-year period, the future value of assets will be impactedas previously deferred gains or losses are recorded. As ofMay 30, 2004, we had cumulative losses of approximately$770 million on our pension plans and $307 million on ourpostretirement plans. These unrecognized net actuariallosses will result in decreases in our future pension incomeand increases in postretirement expense since they currentlyexceed the corridors defined by SFAS No. 87 and SFASNo. 106.
In fiscal 2004, we recorded net pension and postretirementexpense of $5 million compared to $42 million of income in
fiscal 2003, net of $6 million of curtailments. The discountrates used in our pension and other postretirement assump-tions were 7.5 percent for the obligation as of May 26, 2002and for our fiscal 2003 income and expense estimate, and6.0 percent for the obligation as of May 25, 2003 and forour fiscal 2004 income and expense estimate. For fiscal2003 we assumed a rate of return of 10.4 percent on ourpension plan assets and 10.0 percent on our other postre-tirement plan assets. For fiscal 2004 we reduced our rate ofreturn assumptions to 9.6 percent for assets in both plans.
For our fiscal 2005 pension and other postretirementincome and expense estimate, we have increased thediscount rate to 6.65 percent, based on interest rates as ofMay 30, 2004. The expected rate of return on plan assetsremains 9.6 percent. Based on these rates and various otherassumptions including the amortization of unrecognized netactuarial losses, we estimate that our net pension andpostretirement expense, exclusive of curtailments, if any, willapproximate $20 million in fiscal 2005 compared to expenseof $5 million, exclusive of curtailments, in fiscal 2004.Actual future net pension and postretirement income orexpense will depend on future investment performance,changes in future discount rates and various other factorsrelated to the populations participating in our pension andpostretirement plans.
Lowering the expected long-term rate of return on assetsby 50 basis points would increase our net pension and post-retirement expense for fiscal 2005 by approximately$18 million. Lowering the discount rate by 50 basis pointswould increase our net pension and postretirement expensefor fiscal 2005 by approximately $23 million.
NEW ACCOUNTING RULES
On the first day of fiscal 2002, we adopted Statement ofFinancial Accounting Standards (SFAS) No. 133,“Accounting for Derivative Instruments and HedgingActivities,” which requires all derivatives to be recorded atfair value on the balance sheet and establishes newaccounting rules for hedging. We recorded the cumulativeeffect of adopting this accounting change in fiscal 2002, asfollows:
In Millions, Except Per Share DataIncluded In
Earnings
Included inAccumulated
OtherComprehensive
Income
Pretax $ (5) $(251)Income tax effects 2 93
Total $ (3) $(158)Effect on Diluted Earnings
Per Share $(.01)
17

This cumulative effect was primarily associated with theimpact of lower interest rates on the fair-value calculationfor delayed-starting interest rate swaps we entered into inanticipation of our Pillsbury acquisition and other financingrequirements. Refer to Note Seven and Note Ten for moreinformation.
On the first day of fiscal 2002, we also adopted SFAS No.141, “Business Combinations,” which requires use of thepurchase method of accounting for all business combina-tions initiated after June 30, 2001.
The third Statement we adopted at the start of fiscal 2002was SFAS No. 142, “Goodwill and Intangible Assets.” ThisStatement eliminates the amortization of goodwill andinstead requires that goodwill be tested annually for impair-ment. Transitional impairment tests of our goodwill did notrequire adjustment to any of our goodwill carrying values.
In the fourth quarter of fiscal 2002, we adopted the Finan-cial Accounting Standards Board’s Emerging Issues TaskForce (EITF) Issue 01-09, “Accounting for ConsiderationGiven by a Vendor to a Customer or a Reseller of theVendor’s Products,” which requires recording certain couponand trade promotion expenses as reductions of revenues.Since adopting this requirement resulted only in thereclassification of certain expenses from selling, generaland administrative expense to a reduction of net sales, itdid not affect our financial position or net earnings.
Effective the first quarter of fiscal 2003, we adopted SFASNo. 144, “Accounting for the Impairment or Disposal ofLong-Lived Assets.” The adoption of SFAS No. 144 did nothave a material impact on the Company’s consolidatedfinancial statements.
In November 2002, the Financial Accounting StandardsBoard (FASB) issued FASB Interpretation Number 45 (FIN45), “Guarantor’s Accounting and Disclosure Requirementsfor Guarantees of Indebtedness of Others.” FIN 45 elabo-rates on the disclosure requirements of guarantees, as well asrequiring the recording of certain guarantees issued or modi-fied after December 31, 2002. The adoption of FIN 45 didnot require any material change in our guarantee disclosures(see Note Seventeen).
In July 2002, the FASB issued SFAS No. 146, “Accountingfor Costs Associated with Exit or Disposal Activities.” SFASNo. 146 requires companies to recognize costs associatedwith exit or disposal activities when they are incurred ratherthan at the date of a commitment to an exit or disposalplan. The adoption of this Standard affected the timing ofthe recognition of exit or disposal costs for disposal activitiesinitiated after December 31, 2002.
In December 2002, the FASB issued SFAS No. 148,“Accounting for Stock-Based Compensation — Transition
and Disclosure.” SFAS No. 148 provides companies withalternative methods of transition to the fair value basedmethod of accounting for stock-based employee compensa-tion. We have not elected the fair value based method ofaccounting. SFAS No. 148 also amends the disclosure aboutthe effects on reported net income of an entity’s accountingpolicy decisions with respect to stock-based employeecompensation, as reflected in Note One (L) to the consoli-dated financial statements.
In May 2003, the FASB issued Statement of FinancialAccounting Standards (SFAS) No. 150, “Accounting forCertain Financial Instruments with Characteristics of bothLiabilities and Equity.” SFAS No. 150 establishes standardsfor how an issuer classifies and measures certain financialinstruments with characteristics of both liabilities andequity. SFAS No. 150 requires that an issuer classify a finan-cial instrument that is within its scope as a liability, or as anasset in some circumstances. SFAS No. 150 was effective forfinancial instruments entered into or modified after May 31,2003, and otherwise was effective at the beginning of thefirst interim period beginning after June 15, 2003. SFAS No.150 was implemented in our second quarter of fiscal 2004and did not have an effect on our consolidated financialstatements.
In December 2003, the FASB issued FASB InterpretationNo. 46, “Consolidation of Variable Interest Entities,” (FIN46). FIN 46 requires that interests in variable interestentities that are considered to be special purpose entities beincluded in the financial statements for the year endedMay 30, 2004. FIN 46 was implemented in our fourthquarter of fiscal 2004 and did not have a material effect onour consolidated financial statements.
In December 2003, the FASB revised SFAS No. 132,“Employers’ Disclosures about Pensions and Other Postre-tirement Benefits.” The revision to SFAS No. 132 requiresadditional disclosures for pension and other postretirementbenefits plans, which are presented in Note Fourteen —Retirement And Other Postretirement Benefit Plans.
The Medicare Prescription Drug Improvement andModernization Act of 2003 (Act) was signed into law onDecember 8, 2003. The Act introduced a federal subsidyto sponsors of retiree health care benefit plans that provide aprescription drug benefit that is at least actuarially equiva-lent to Medicare. Financial Accounting Standards BoardStaff Position 106-2 (FSP 106-2) provides accounting guid-ance related to the Act. We adopted FSP 106-2 at thebeginning of our fourth quarter of fiscal 2004 and it did nothave a material effect on our consolidated financial state-ments. See Note Fourteen — Retirement and OtherPostretirement Benefit Plans.
18
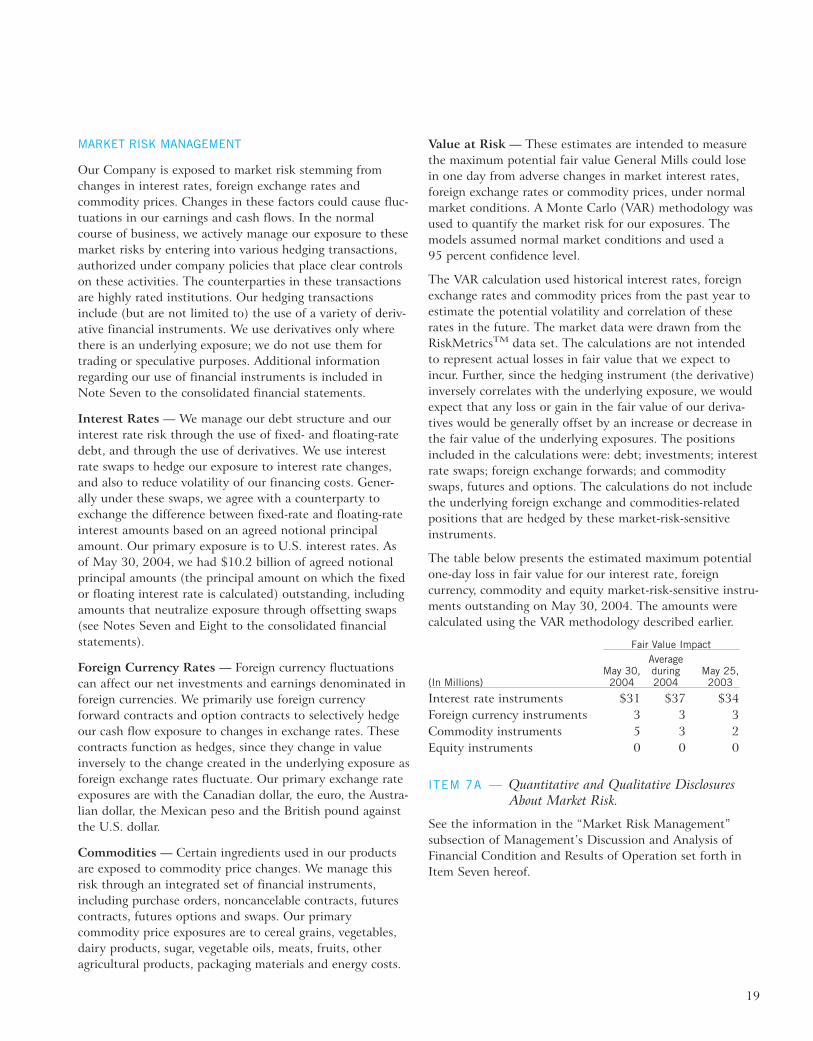
MARKET RISK MANAGEMENT
Our Company is exposed to market risk stemming fromchanges in interest rates, foreign exchange rates andcommodity prices. Changes in these factors could cause fluc-tuations in our earnings and cash flows. In the normalcourse of business, we actively manage our exposure to thesemarket risks by entering into various hedging transactions,authorized under company policies that place clear controlson these activities. The counterparties in these transactionsare highly rated institutions. Our hedging transactionsinclude (but are not limited to) the use of a variety of deriv-ative financial instruments. We use derivatives only wherethere is an underlying exposure; we do not use them fortrading or speculative purposes. Additional informationregarding our use of financial instruments is included inNote Seven to the consolidated financial statements.
Interest Rates — We manage our debt structure and ourinterest rate risk through the use of fixed- and floating-ratedebt, and through the use of derivatives. We use interestrate swaps to hedge our exposure to interest rate changes,and also to reduce volatility of our financing costs. Gener-ally under these swaps, we agree with a counterparty toexchange the difference between fixed-rate and floating-rateinterest amounts based on an agreed notional principalamount. Our primary exposure is to U.S. interest rates. Asof May 30, 2004, we had $10.2 billion of agreed notionalprincipal amounts (the principal amount on which the fixedor floating interest rate is calculated) outstanding, includingamounts that neutralize exposure through offsetting swaps(see Notes Seven and Eight to the consolidated financialstatements).
Foreign Currency Rates — Foreign currency fluctuationscan affect our net investments and earnings denominated inforeign currencies. We primarily use foreign currencyforward contracts and option contracts to selectively hedgeour cash flow exposure to changes in exchange rates. Thesecontracts function as hedges, since they change in valueinversely to the change created in the underlying exposure asforeign exchange rates fluctuate. Our primary exchange rateexposures are with the Canadian dollar, the euro, the Austra-lian dollar, the Mexican peso and the British pound againstthe U.S. dollar.
Commodities — Certain ingredients used in our productsare exposed to commodity price changes. We manage thisrisk through an integrated set of financial instruments,including purchase orders, noncancelable contracts, futurescontracts, futures options and swaps. Our primarycommodity price exposures are to cereal grains, vegetables,dairy products, sugar, vegetable oils, meats, fruits, otheragricultural products, packaging materials and energy costs.
Value at Risk — These estimates are intended to measurethe maximum potential fair value General Mills could losein one day from adverse changes in market interest rates,foreign exchange rates or commodity prices, under normalmarket conditions. A Monte Carlo (VAR) methodology wasused to quantify the market risk for our exposures. Themodels assumed normal market conditions and used a95 percent confidence level.
The VAR calculation used historical interest rates, foreignexchange rates and commodity prices from the past year toestimate the potential volatility and correlation of theserates in the future. The market data were drawn from theRiskMetricsTM data set. The calculations are not intendedto represent actual losses in fair value that we expect toincur. Further, since the hedging instrument (the derivative)inversely correlates with the underlying exposure, we wouldexpect that any loss or gain in the fair value of our deriva-tives would be generally offset by an increase or decrease inthe fair value of the underlying exposures. The positionsincluded in the calculations were: debt; investments; interestrate swaps; foreign exchange forwards; and commodityswaps, futures and options. The calculations do not includethe underlying foreign exchange and commodities-relatedpositions that are hedged by these market-risk-sensitiveinstruments.
The table below presents the estimated maximum potentialone-day loss in fair value for our interest rate, foreigncurrency, commodity and equity market-risk-sensitive instru-ments outstanding on May 30, 2004. The amounts werecalculated using the VAR methodology described earlier.
Fair Value Impact
(In Millions)May 30,2004
Averageduring2004
May 25,2003
Interest rate instruments $31 $37 $34Foreign currency instruments 3 3 3Commodity instruments 5 3 2Equity instruments 0 0 0
ITEM 7A — Quantitative and Qualitative DisclosuresAbout Market Risk.
See the information in the “Market Risk Management”subsection of Management’s Discussion and Analysis ofFinancial Condition and Results of Operation set forth inItem Seven hereof.
19

ITEM 8 — Financial Statements and Supplementary Data.
REPORT OF MANAGEMENT RESPONSIBILITIES
The management of General Mills, Inc. is responsible for thefairness and accuracy of the consolidated financial state-ments. The statements have been prepared in accordancewith accounting principles that are generally accepted in theUnited States, using management’s best estimates andjudgments where appropriate. The financial informationthroughout this Annual Report on Form 10-K is consistentwith our consolidated financial statements.
Management has established a system of internal controlsthat provides reasonable assurance that assets are adequatelysafeguarded and transactions are recorded accurately in allmaterial respects, in accordance with management’s auth-orization. We maintain a strong audit program thatindependently evaluates the adequacy and effectiveness ofinternal controls. Our internal controls provide for appro-priate separation of duties and responsibilities, and there aredocumented policies regarding use of Company assets andproper financial reporting. These formally stated and regu-larly communicated policies demand highly ethical conductfrom all employees.
The Audit Committee of the Board of Directors meets regu-larly with management, internal auditors and independentauditors to review internal control, auditing and financialreporting matters. The independent auditors, internal audi-tors and employees have full and free access to the AuditCommittee at any time.
The independent auditors, KPMG LLP, were retained toaudit our consolidated financial statements. Their reportfollows.
S. W. SangerChairman of the Board andChief Executive Officer
J. A. LawrenceExecutive Vice President andChief Financial Officer
July 29, 2004
REPORT OF INDEPENDENT REGISTERED PUBLICACCOUNTING FIRM
The Stockholders and the Board of DirectorsGeneral Mills, Inc.:
We have audited the accompanying consolidated balancesheets of General Mills, Inc. and subsidiaries as of May 30,2004 and May 25, 2003, and the related consolidated state-ments of earnings, stockholders’ equity and cash flows foreach of the fiscal years in the three-year period endedMay 30, 2004. Our audits also included the financial state-ment schedule listed in Item 15(a)2. These consolidatedfinancial statements are the responsibility of the Company’smanagement. Our responsibility is to express an opinion onthese consolidated financial statements based on our audits.
We conducted our audits in accordance with the standardsof the Public Company Accounting Oversight Board (UnitedStates). Those standards require that we plan and performthe audit to obtain reasonable assurance about whether thefinancial statements are free of material misstatement. Anaudit includes examining, on a test basis, evidencesupporting the amounts and disclosures in the financialstatements. An audit also includes assessing the accountingprinciples used and significant estimates made by manage-ment, as well as evaluating the overall financial statementpresentation. We believe that our audits provide a reason-able basis for our opinion.
In our opinion, the consolidated financial statementsreferred to above present fairly, in all material respects, thefinancial position of General Mills, Inc. and subsidiaries asof May 30, 2004 and May 25, 2003, and the results of theiroperations and their cash flows for each of the fiscal years inthe three-year period ended May 30, 2004 in conformitywith accounting principles generally accepted in the UnitedStates of America. Also, in our opinion, the related financialstatement schedule, when considered in relation to the basicconsolidated financial statements taken as a whole, presentsfairly, in all material respects, the information set forththerein.
Minneapolis, MinnesotaJune 29, 2004
20

Fiscal Year Ended May 30, 2004 May 25, 2003 May 26, 2002
Net Sales $11,070 $10,506 $7,949Costs and Expenses:
Cost of sales 6,584 6,109 4,662Selling, general and administrative 2,443 2,472 2,070Interest, net 508 547 416Restructuring and other exit costs 26 62 134
Total Costs and Expenses 9,561 9,190 7,282Earnings before Taxes and Earnings from Joint Ventures 1,509 1,316 667Income Taxes 528 460 239Earnings from Joint Ventures 74 61 33Earnings before Cumulative Effect of Change in Accounting Principle 1,055 917 461Cumulative Effect of Change in Accounting Principle – – (3)Net Earnings $ 1,055 $ 917 $ 458Earnings per Share – Basic:
Earnings before cumulative effect of change in accounting principle $ 2.82 $ 2.49 $ 1.39Cumulative effect of change in accounting principle – – (.01)
Earnings per Share – Basic $ 2.82 $ 2.49 $ 1.38
Average Number of Common Shares 375 369 331
Earnings per Share – Diluted:Earnings before cumulative effect of change in accounting principle $ 2.75 $ 2.43 $ 1.35Cumulative effect of change in accounting principle – – (.01)
Earnings per Share – Diluted $ 2.75 $ 2.43 $ 1.34
Average Number of Common Shares – Assuming Dilution 384 378 342
See accompanying notes to consolidated financial statements.
GENERAL MILLS, INC.CONSOLIDATED STATEMENTS OF EARNINGSIn Millions, Except Per Share Data
21
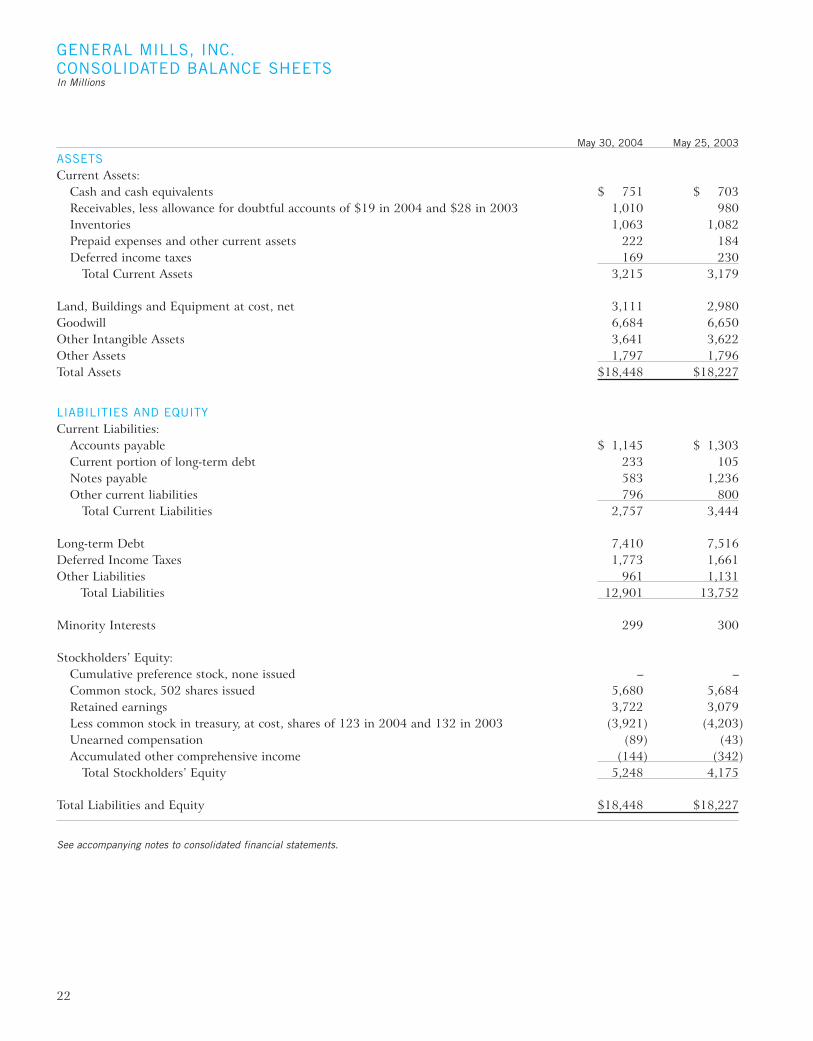
May 30, 2004 May 25, 2003
ASSETSCurrent Assets:
Cash and cash equivalents $ 751 $ 703Receivables, less allowance for doubtful accounts of $19 in 2004 and $28 in 2003 1,010 980Inventories 1,063 1,082Prepaid expenses and other current assets 222 184Deferred income taxes 169 230
Total Current Assets 3,215 3,179
Land, Buildings and Equipment at cost, net 3,111 2,980Goodwill 6,684 6,650Other Intangible Assets 3,641 3,622Other Assets 1,797 1,796Total Assets $18,448 $18,227
LIABILITIES AND EQUITYCurrent Liabilities:
Accounts payable $ 1,145 $ 1,303Current portion of long-term debt 233 105Notes payable 583 1,236Other current liabilities 796 800
Total Current Liabilities 2,757 3,444
Long-term Debt 7,410 7,516Deferred Income Taxes 1,773 1,661Other Liabilities 961 1,131
Total Liabilities 12,901 13,752
Minority Interests 299 300
Stockholders’ Equity:Cumulative preference stock, none issued – –Common stock, 502 shares issued 5,680 5,684Retained earnings 3,722 3,079Less common stock in treasury, at cost, shares of 123 in 2004 and 132 in 2003 (3,921) (4,203)Unearned compensation (89) (43)Accumulated other comprehensive income (144) (342)
Total Stockholders’ Equity 5,248 4,175
Total Liabilities and Equity $18,448 $18,227
See accompanying notes to consolidated financial statements.
GENERAL MILLS, INC.CONSOLIDATED BALANCE SHEETSIn Millions
22

Fiscal Year Ended May 30, 2004 May 25, 2003 May 26, 2002
Cash Flows – Operating Activities:Net earnings $ 1,055 $ 917 $ 458Adjustments to reconcile net earnings to cash flow:
Depreciation and amortization 399 365 296Deferred income taxes 109 27 93Changes in current assets and liabilities, excluding effects from
businesses acquired (186) 246 37Tax benefit on exercised options 63 21 46Cumulative effect of change in accounting principle – – 3Pension and other postretirement activity (21) (56) (105)Restructuring and other exit costs 26 62 134Other, net 16 49 (46)
Cash provided by continuing operations 1,461 1,631 916Cash used by discontinued operations – – (3)
Net Cash Provided by Operating Activities 1,461 1,631 913Cash Flows – Investment Activities:
Purchases of land, buildings and equipment (628) (711) (506)Investments in businesses, intangibles and affiliates, net of
investment returns and dividends (2) (261) (3,688)Purchases of marketable securities (7) (63) (46)Proceeds from sale of marketable securities 129 57 70Proceeds from disposal of land, buildings
and equipment 36 14 21Proceeds from disposition of businesses – – 939Other, net 2 (54) (61)
Net Cash Used by Investment Activities (470) (1,018) (3,271)Cash Flows – Financing Activities:
Change in notes payable (1,023) (2,330) 2,688Issuance of long-term debt 576 2,048 3,485Payment of long-term debt (248) (334) (427)Proceeds from minority interest investors – 148 150Common stock issued 192 96 139Purchases of common stock for treasury (24) (29) (2,436)Dividends paid (413) (406) (358)Other, net (3) (78) 28
Net Cash (Used) Provided by Financing Activities (943) (885) 3,269Increase (Decrease) in Cash and Cash Equivalents 48 (272) 911Cash and Cash Equivalents – Beginning of Year 703 975 64Cash and Cash Equivalents – End of Year $ 751 $ 703 $ 975
Cash Flow from Changes in Current Assets and Liabilities,Excluding Effects from Businesses Acquired:Receivables $ (22) $ 31 $ 265Inventories 24 (20) (12)Prepaid expenses and other current assets (15) (28) 12Accounts payable (167) 67 (90)Other current liabilities (6) 196 (138)
Changes in Current Assets and Liabilities $ (186) $ 246 $ 37
See accompanying notes to consolidated financial statements.
GENERAL MILLS, INC.CONSOLIDATED STATEMENTS OF CASH FLOWSIn Millions
23

$.10 Par Value Common Stock(One Billion Shares Authorized)Issued Treasury
Shares Amount Shares AmountRetainedEarnings
UnearnedCompen-
sation
AccumulatedOther
Compre-hensiveIncome Total
Balance at May 27, 2001 408 $ 745 (123) $ (3,014) $ 2,468 $(54) $ (93) $ 52Comprehensive Income:
Net earnings 458 458Other comprehensive income, net of tax:
Cumulative effect of adopting SFASNo. 133 (158) (158)
Net change on hedge derivatives (114) (114)Net change on securities (11) (11)Foreign currency translation (4) (4)Minimum pension liability adjustment 4 4
Other comprehensive income (283) (283)Total comprehensive income 175Cash dividends declared ($1.10 per share),
net of income taxes of $1 (358) (358)Shares issued for acquisition 94 4,902 40 992 5,894Shares repurchased from Diageo (55) (2,318) (2,318)Stock compensation plans (includes income
tax benefits of $53) – 46 6 176 222Shares purchased (3) (119) (119)Put and call option premiums/settlements, net – 40 – (9) 31Unearned compensation related to
restricted stock awards (29) (29)Earned compensation and other 26 26Balance at May 26, 2002 502 $5,733 (135) $(4,292) $2,568 $(57) $(376) $ 3,576Comprehensive Income:
Net earnings 917 917Other comprehensive income, net of tax:
Net change on hedge derivatives (4) (4)Net change on securities (5) (5)Foreign currency translation 98 98Minimum pension liability adjustment (55) (55)
Other comprehensive income 34 34Total comprehensive income 951Cash dividends declared ($1.10 per share),
net of income taxes of less than $1 (406) (406)Stock compensation plans (includes income
tax benefits of $21) – 25 4 118 143Shares purchased (1) (29) (29)Put and call option premiums/settlements, net – (74) – – (74)Unearned compensation related to
restricted stock awards (11) (11)Earned compensation and other 25 25Balance at May 25, 2003 502 $5,684 (132) $(4,203) $3,079 $(43) $(342) $ 4,175Comprehensive Income:
Net earnings 1,055 1,055Other comprehensive income, net of tax:
Net change on hedge derivatives 101 101Net change on securities (10) (10)Foreign currency translation 75 75Minimum pension liability adjustment 32 32
Other comprehensive income 198 198Total comprehensive income 1,253Cash dividends declared ($1.10 per share),
net of income taxes of less than $1 (412) (412)Stock compensation plans (includes income
tax benefits of $5) – (4) 10 306 302Shares purchased (1) (24) (24)Unearned compensation related to
restricted stock awards (77) (77)Earned compensation and other 31 31Balance at May 30, 2004 502 $5,680 (123) $(3,921) $3,722 $(89) $(144) $ 5,248
See accompanying notes to consolidated financial statements.
GENERAL MILLS, INC.CONSOLIDATED STATEMENTS OF STOCKHOLDERS’ EQUITYIn Millions, Except Per Share Data
24

1. SUMMARY OF SIGNIFICANT ACCOUNTING POLICIES
Preparing our consolidated financial statements inconformity with accounting principles generally acceptedin the United States requires us to make estimates andassumptions that affect reported amounts of assets, liabili-ties, disclosures of contingent assets and liabilities at thedate of the financial statements, and the reported amountsof revenues and expenses during the reporting period.Actual results could differ from our estimates.
(A) PRINCIPLES OF CONSOLIDATION – Ourconsolidated financial statements include parent companyoperations and majority-owned subsidiaries as well asGeneral Mills’ investment in and share of net earnings orlosses of 20- to 50-percent-owned companies, which arerecorded on an equity basis.
Our fiscal year ends on the last Sunday in May. Fiscal year2004 consisted of 53 weeks, and fiscal 2003 and 2002 eachconsisted of 52 weeks. Our wholly owned internationaloperations, with the exception of Canada and our exportoperations, are reported for the 12 calendar months endedApril 30. The results of the acquired Pillsbury operationsare reflected from November 1, 2001.
(B) LAND, BUILDINGS, EQUIPMENT ANDDEPRECIATION – Buildings and equipment aredepreciated over estimated useful lives, primarily using thestraight-line method. Buildings are usually depreciated over40 to 50 years, and equipment is depreciated over three to15 years. Depreciation charges for fiscal 2004, 2003 and2002 were $376 million, $347 million and $283 million,respectively. Accelerated depreciation methods generally areused for income tax purposes. When an item is sold orretired, the accounts are relieved of its cost and relatedaccumulated depreciation; the resulting gains and losses, ifany, are recognized.
(C) INVENTORIES – Inventories are valued at the lowerof cost or market. We generally use the LIFO method ofvaluing inventory because we believe that it is a bettermatch with current revenues. However, FIFO is used formost foreign operations, where LIFO is not recognized forstatutory purposes.
(D) INTANGIBLE ASSETS – Goodwill represents thedifference between the purchase prices of acquired compa-nies and the related fair values of net assets acquired andaccounted for by the purchase method of accounting. OnMay 28, 2001, we adopted Statement of FinancialAccounting Standards (SFAS) No. 142, “Goodwill andIntangible Assets.” This Statement eliminated the amortiza-tion of goodwill and intangibles with indefinite lives,primarily acquired brand intangibles, and instead requiresthat they be tested annually for impairment. See Note One
(O) for the effects of this adoption. We capitalize the costsof software internally developed or externally purchased forinternal use. The costs of patents, copyrights and otheramortizable intangible assets are amortized evenly overtheir estimated useful lives.
(E) RECOVERABILITY OF LONG-LIVED ASSETS –We review long-lived assets, including identifiable intangi-bles and goodwill, for impairment when events or changesin circumstances indicate that the carrying amount of anasset may not be recoverable. An asset is deemed impairedand written down to its fair value if estimated related futurecash flows are less than its carrying amount.
(F) FOREIGN CURRENCY TRANSLATION – For mostof our foreign operations, local currencies are considered thefunctional currency. Assets and liabilities are translatedusing exchange rates in effect at the balance sheet date.Results of operations are translated using the averageexchange rates during the period. Translation effects areclassified within Accumulated Other ComprehensiveIncome in Stockholders’ Equity.
(G) FINANCIAL INSTRUMENTS – See Note One(O) for a description of our adoption of SFAS No. 133,“Accounting for Derivative Instruments and HedgingActivities.” We use interest rate swaps, currency swaps, andforward and option contracts to manage risks generallyassociated with foreign exchange rate, interest rate andcommodity market volatility. All hedging instruments aredesignated and effective as hedges. If the underlying hedgedtransaction ceases to exist or if the hedge becomes ineffec-tive, all changes in fair value of the related derivatives thathave not been settled are recognized in current earnings.Instruments that do not qualify for hedge accounting aremarked to market with changes recognized in current earn-ings. We do not hold or issue derivative financialinstruments for trading purposes and we are not a party toleveraged derivatives. See Note Seven for additional infor-mation related to our financial instruments.
(H) REVENUE RECOGNITION – We recognize salesupon shipment to our customers. Reported sales are net ofcertain coupon and trade promotion costs. Coupons areexpensed when distributed based on estimated redemptions.Trade promotions are expensed based on estimatedparticipation and performance levels for offered programs.We generally do not allow a right of return. However, on alimited case-by-case basis with prior approval, we may allowcustomers to return product in saleable condition forredistribution to other customers or outlets. These returnsare recorded as reductions of net sales in the period ofthe return.
(I) SHIPPING AND HANDLING – Shipping andhandling costs associated with internal movements of
GENERAL MILLS, INC.NOTES TO CONSOLIDATED FINANCIAL STATEMENTS
25

inventories are recorded as cost of sales and recognizedwhen the related finished product is shipped to thecustomer. Shipping costs associated with the distribution offinished product to our customers are recorded as selling,general and administrative expense and are recognized whenthe related finished product is shipped to the customer. Theamount recorded in selling, general and administrativeexpense was $352 million, $345 million and $243 millionin fiscal 2004, 2003 and 2002, respectively.
(J) RESEARCH AND DEVELOPMENT – All expendi-tures for research and development are charged againstearnings in the year incurred. The charges for fiscal 2004,2003 and 2002 were $158 million, $149 million and $131million, respectively.
(K) ADVERTISING COSTS – Advertising expenses(including production and communication costs) for fiscal2004, 2003 and 2002 were $512 million, $519 millionand $489 million, respectively. Prepaid advertising costs(including syndication properties) of $25 million and$31 million were reported as assets at May 30, 2004,and May 25, 2003, respectively. We expense the productioncosts of advertising the first time that the advertisingtakes place.
(L) STOCK-BASED COMPENSATION – We use theintrinsic value method for measuring the cost of compensa-tion paid in Company common stock. This method definesour cost as the excess of the stock’s market value at thetime of the grant over the amount that the employee isrequired to pay. Our stock option plans require that theemployee’s payment (i.e., exercise price) be the marketvalue as of the grant date. The following table illustrates thepro forma effect on net earnings and earnings per share ifthe company had applied the fair value recognition provi-sions of SFAS No. 123, “Accounting for Stock-BasedCompensation,” to stock-based employee compensation.
In Millions, Except Per Share Data,Fiscal Year 2004 2003 2002
Net earnings, as reported $1,055 $ 917 $ 458
Add: Stock-based employeecompensation expenseincluded in reported netearnings, net of related taxeffects 17 13 10
Deduct: Total stock-basedemployee compensationexpense determined underfair value based method forall awards, net of related taxeffects (67) (68) (84)
Pro forma net earnings $1,005 $ 862 $ 384Earnings per share:
Basic – as reported $ 2.82 $2.49 $1.38Basic – pro forma $ 2.68 $2.34 $1.16
Diluted – as reported $ 2.75 $2.43 $1.34Diluted – pro forma $ 2.62 $2.29 $1.13
The weighted average fair values at grant date of theoptions granted in fiscal 2004, 2003 and 2002 were esti-mated as $8.54, $8.24 and $11.77, respectively, using theBlack-Scholes option-pricing model with the followingweighted average assumptions:
Fiscal Year 2004 2003 2002
Risk-free interest rate 3.9% 3.8% 5.1%Expected life 7 years 7 years 7 yearsExpected volatility 21% 21% 20%Expected dividend
growth rate 10% 9% 8%
The Black-Scholes model requires the input of certain keyassumptions, does not give effect to restrictions that areplaced on employee stock options, and therefore may notprovide a reliable measure of fair value.
(M) EARNINGS PER SHARE – Basic Earnings perShare (EPS) is computed by dividing net earnings by theweighted average number of common shares outstanding.Diluted EPS includes the effect of all dilutive potentialcommon shares (primarily related to outstanding in-the-money stock options).
(N) CASH AND CASH EQUIVALENTS – We considerall investments purchased with an original maturity of threemonths or less to be cash equivalents. Cash and cash equiv-alents totaling $117 million and $211 million at May 30,2004 and May 25, 2003, respectively, are designated ascollateral for certain derivative liabilities.
26

(O) NEW ACCOUNTING STANDARDS – On the firstday of fiscal 2002, we adopted Statement of FinancialAccounting Standards (SFAS) No. 133, “Accounting forDerivative Instruments and Hedging Activities,” whichrequires all derivatives to be recorded at fair value on thebalance sheet and establishes new accounting rules forhedging. We recorded the cumulative effect of adopting thisaccounting change in fiscal 2002, as follows:
In Millions, Except Per Share DataIncluded In
Earnings
Included inAccumulated
OtherComprehensive
Income
Pretax $ (5) $(251)Income tax effects 2 93
Total $ (3) $(158)Effect on Diluted Earnings Per
Share $(.01)
This cumulative effect was primarily associated with theimpact of lower interest rates on the fair-value calculationfor delayed-starting interest rate swaps we entered into inanticipation of our financing requirements. Refer to NoteSeven and Note Ten for more information.
On the first day of fiscal 2002, we also adopted SFASNo. 141, “Business Combinations,” which requires useof the purchase method of accounting for all businesscombinations initiated after June 30, 2001.
The third Statement we adopted at the start of fiscal 2002was SFAS No. 142, “Goodwill and Intangible Assets.” ThisStatement eliminates the amortization of goodwill andinstead requires that goodwill be tested annually for impair-ment. Transitional impairment tests of our goodwill did notrequire adjustment to any of our goodwill carrying values.
In the fourth quarter of fiscal 2002, we adopted theFinancial Accounting Standards Board’s EmergingIssues Task Force (EITF) Issue 01-09, “Accounting forConsideration Given by a Vendor to a Customer or aReseller of the Vendor’s Products,” which requires recordingcertain coupon and trade promotion expenses as reductionsof revenues. Since adopting this requirement resulted onlyin the reclassification of certain expenses from selling,general and administrative expense to a reduction of netsales, it did not affect our financial position or net earnings.
Effective the first quarter of fiscal 2003, we adopted SFASNo. 144, “Accounting for the Impairment or Disposal ofLong-Lived Assets.” The adoption of SFAS No. 144 did nothave a material impact on the Company’s consolidatedfinancial statements.
In November 2002, the Financial Accounting StandardsBoard (FASB) issued FASB Interpretation No. 45 (FIN 45),
“Guarantor’s Accounting and Disclosure Requirements forGuarantees of Indebtedness of Others.” FIN 45 elaborateson the disclosure requirements of guarantees, as well asrequiring the recording of certain guarantees issued or modi-fied after December 31, 2002. The adoption of FIN 45 didnot require any material change in our guarantee disclosures(see Note Seventeen).
In July 2002, the FASB issued SFAS No. 146, “Accountingfor Costs Associated with Exit or Disposal Activities.” SFASNo. 146 requires companies to recognize costs associatedwith exit or disposal activities when they are incurred ratherthan at the date of a commitment to an exit or disposalplan. The adoption of this Standard affected the timingof the recognition of exit or disposal costs for disposalactivities initiated after December 31, 2002.
In December 2002, the FASB issued SFAS No. 148,“Accounting for Stock-Based Compensation – Transitionand Disclosure.” SFAS No. 148 provides companies withalternative methods of transition to the fair value basedmethod of accounting for stock-based employee compensa-tion. We have not elected the fair value based method ofaccounting. SFAS No. 148 also amends the disclosure aboutthe effects on reported net income of an entity’s accountingpolicy decisions with respect to stock-based employeecompensation, as reflected in Note One (L) to the consoli-dated financial statements.
In May 2003, the FASB issued SFAS No. 150, “Accountingfor Certain Financial Instruments with Characteristics ofboth Liabilities and Equity.” SFAS No. 150 establishes stan-dards for how an issuer classifies and measures certainfinancial instruments with characteristics of both liabilitiesand equity. SFAS No. 150 requires that an issuer classify afinancial instrument that is within its scope as a liability, oras an asset in some circumstances. SFAS No. 150 was effec-tive for financial instruments entered into or modified afterMay 31, 2003, and otherwise was effective at the beginningof the first interim period beginning after June 15, 2003.SFAS No. 150 was implemented in our second quarter offiscal 2004 and did not have an effect on our consolidatedfinancial statements.
In December 2003, the FASB issued FASB InterpretationNo. 46, “Consolidation of Variable Interest Entities,” (FIN46). FIN 46 requires that interests in variable interestentities that are considered to be special purpose entities beincluded in the financial statements for the year endedMay 30, 2004. FIN 46 was implemented in our fourthquarter of fiscal 2004 and did not have a material effect onour consolidated financial statements.
In December 2003, the FASB revised SFAS No. 132,“Employers’ Disclosures about Pensions and Other
27

Postretirement Benefits.” The revision to SFAS No. 132requires additional disclosures for pension and otherpostretirement benefits plans, which are presented inNote Fourteen − Retirement And Other PostretirementBenefit Plans.
The Medicare Prescription Drug Improvement and Modern-ization Act of 2003 (Act) was signed into law onDecember 8, 2003. The Act introduced a federal subsidy tosponsors of retiree health care benefit plans that provide aprescription drug benefit that is at least actuarially equiva-lent to Medicare. Financial Accounting Standards BoardStaff Position 106-2 (FSP 106-2) provides accountingguidance related to the Act. We adopted FSP 106-2 at thebeginning of our fourth quarter of fiscal 2004 and it did nothave a material effect on our consolidated financial state-ments. See Note Fourteen – Retirement and OtherPostretirement Benefit Plans.
2. ACQUISITIONS
On October 31, 2001, we acquired the worldwide Pillsburyoperations from Diageo plc (Diageo). Pillsbury, based inMinneapolis, Minnesota, built a portfolio of leading foodbrands, such as Pillsbury refrigerated dough, Green Giant,Old El Paso, Progresso and Totino’s. Pillsbury had sales of$6.1 billion (before EITF Issue 01-09 reclassification) inits fiscal year ended June 30, 2001, including businessessubsequently divested.
The transaction was accounted for as a purchase. Underterms of the agreement between General Mills and Diageo,we acquired Pillsbury in a stock and cash transaction.Consideration to Diageo included 134 million General Millscommon shares. Under a stockholders’ agreement, Diageohad a put option to sell directly to us 55 million shares ofGeneral Mills common stock at a price of $42.14 per share,which Diageo exercised on November 1, 2001. Therefore,those 55 million shares were valued at a total of $2,318million. The 79 million shares of General Mills commonstock retained by Diageo were valued at $3,576 millionbased on the three-day average trading price prior to theclosing of $45.27 per share. Therefore, the total stockconsideration was $5,894 million. The cash paid to Diageoand assumed debt of Pillsbury on October 31, 2001 totaled$3,830 million. Under terms of the agreement, Diageo heldcontingent value rights that required payment to Diageo onApril 30, 2003, of $273 million based on the average priceof General Mills stock of $45.55 per share for the 20trading days prior to that date and the 79 million sharesDiageo held. As a result, the total acquisition consideration(exclusive of direct acquisition costs) was $9,997 million.
In order to obtain regulatory clearance for the acquisition ofPillsbury, we arranged to divest certain dessert and specialty
products businesses on November 13, 2001, for $316million. On December 26, 2001, Nestlé USA exercised itsright to buy the 50 percent stake that it did not alreadyown in Ice Cream Partners USA LLC, a joint venture, for$641 million. Net proceeds from these transactions wereused to reduce our debt level.
The stockholders’ agreement between General Mills andDiageo, as amended, includes a standstill provision, underwhich Diageo is precluded from buying additional shares inGeneral Mills for a 20-year period following the close of thetransaction, or for three years following the date on whichDiageo owns less than 5 percent of General Mills’outstanding shares, whichever is earlier. The agreement alsogenerally requires pass-through voting by Diageo, so itsshares will be voted in the same proportion as the otherGeneral Mills shares are voted.
The allocation of the purchase price was completed infiscal 2003. Intangible assets included in the final allocationof the purchase price were acquired brands totaling$3.5 billion and goodwill of $5.8 billion. Deferred incometaxes of $1.3 billion, associated with the brand intangibles,were also recorded.
Presented below is a condensed balance sheet disclosing thefinal purchase price allocation with the amounts assigned tomajor asset and liability captions of the acquired Pillsburybusiness at the date of acquisition (in millions):
Current Assets $ 1,245Land, Buildings and Equipment 1,002Investments and Assets to be Sold 1,006Other Noncurrent Assets 263Brand Intangibles 3,516Goodwill 5,836
Total Assets 12,868Current Liabilities (1,328)Deferred Income Taxes (1,087)Other Noncurrent Liabilities (456)
Total Liabilities (2,871)Purchase Consideration $ 9,997
3. RESTRUCTURING AND OTHER EXIT COSTS
In fiscal 2004, we recorded restructuring and other exitcosts of $26 million pursuant to approved plans. In theNetherlands, $6 million was related primarily to a severancecharge for 142 employees being terminated as a resultof a plant closure. Approximately $2 million was relatedprimarily to a plant closure in Brazil. Of this amount,approximately $1 million was related to a severance chargefor 201 employees. Approximately $3 million was for theclosure of our tomato canning facility in Atwater, California.
28

This charge includes severance costs of approximately$1 million for 47 employees. We recorded an additional$7 million charge, related primarily to adjustments of costsassociated with previously announced closures of manufac-turing facilities. In addition, we recorded a severance chargeof $8 million for 132 employees, related primarily toactions in our Bakeries and Foodservice organization. Theabove charges include the write-down of $3 million ofassets. The carrying value of the assets written down was$3 million.
In fiscal 2003, we recorded restructuring and other exitcosts totaling $62 million pursuant to approved plansrelated to the acquisition of Pillsbury. These costs consistedof $41 million of charges associated with the closure of ourSt. Charles, Illinois plant, $13 million of expense relating toexiting production at former Pillsbury facilities being closed,and $8 million for flour mill, grain and otherrestructuring/closing charges. These fiscal 2003 costsinclude severance related to 264 St. Charles plantemployees and the write-down of $31 million of productionassets, primarily the St. Charles facility. The carrying valueof the assets written down was $36 million.
In fiscal 2002, we recorded restructuring and other exitcosts totaling $134 million pursuant to approved plans,related primarily to the acquisition of Pillsbury. These costsconsisted of $87 million for severance and asset write-downcosts related to the reconfiguration of cereal production toobtain regulatory clearance for the acquisition of Pillsbury,$38 million for severance costs related to sales organizationand headquarters department realignment, and $9 millionfor two flour mill restructuring/closing charges. The cerealreconfiguration charges were necessitated by the sale of ourToledo, Ohio plant as required to obtain regulatory clear-ance for the acquisition of Pillsbury. The severance costsrelated to 1,078 employees. These employees included alllevels and a variety of areas within the Company, includingmanagement, supervisory, technical and productionpersonnel. The restructuring and other exit costs alsoincluded the write-down of $52 million of cereal productionassets and $6 million of flour production assets. Thecarrying value of these assets was $58 million, net ofamounts transferred to other facilities.
The analysis of our restructuring and other exit costsactivity is as follows:
In Millions SeveranceAsset
Write-down
Pension andPostretirement
Curtailment Cost Other TotalManufacturing/Distribution Streamlining
Reserve balance at May 27, 2001 $ 1 $ – $ – $ 4 $ 5Utilized in 2002 – (2) – (2) (4)
Reserve balance at May 26, 2002 1 (2) – 2 1Utilized and reclassified in 2003 (1) 2 – (2) (1)
Reserve balance at May 25, 2003 $ – $ – $ – $ – $ –
Squeezit Business Exit
Reserve balance at May 27, 2001 $ – $ 4 $ – $ – $ 42002 Charges, net of credits 4 (4) – – –Utilized in 2002 (4) – – – (4)
Reserve balance at May 26, 2002 $ – $ – $ – $ – $ –
Cereal Reconfiguration
2002 Charges $ 24 $ 52 $ 11 $ – $ 87Utilized in 2002 (3) (5) (11) – (19)
Reserve balance at May 26, 2002 21 47 – – 682003 Charges 2 2 – – 4Utilized in 2003 (22) (49) – – (71)
Reserve balance at May 25, 2003 1 – – – 12004 Charges 1 – – – 1Utilized in 2004 (2) – – – (2)
Reserve balance at May 30, 2004 $ – $ – $ – $ – $ –
29

In Millions SeveranceAsset
Write-down
Pension andPostretirement
Curtailment Cost Other Total
Flour Mill Consolidation
2002 Charges $ 2 $ 6 $ – $ 1 $ 9Utilized in 2002 – – – (1) (1)
Reserve balance at May 26, 2002 2 6 – – 82003 Charges – – – 1 1Utilized and reclassified in 2003 (2) (6) – (1) (9)
Reserve balance at May 25, 2003 $ – $ – $ – $ – $ –
Sales, Bakeries and Foodservice, andHeadquarters Severance
2002 Charges $ 38 $ – $ – $ – $ 38Utilized in 2002 (8) – – – (8)
Reserve balance at May 26, 2002 30 – – – 302003 Charges 2 – – – 2Utilized in 2003 (25) – – – (25)
Reserve balance at May 25, 2003 7 – – – 72004 Charges 7 – – 1 8Utilized in 2004 (6) – – – (6)
Reserve balance at May 30, 2004 $ 8 $ – $ – $ 1 $ 9
St. Charles Shutdown
2003 Charges $ 5 $ 27 $ 5 $ 4 $ 41Utilized and reclassified in 2003 (4) (13) (5) (4) (26)
Reserve balance at May 25, 2003 1 14 – – 152004 Charges – 1 – – 1Utilized in 2004 (1) (15) – – (16)
Reserve balance at May 30, 2004 $ – $ – $ – $ – $ –
International Restructurings
2004 Charges $ 7 $ 1 $ – $ – $ 8Utilized in 2004 (2) – – – (2)
Reserve balance at May 30, 2004 $ 5 $ 1 $ – $ – $ 6
Other Restructurings
2003 Charges $ 1 $ 2 $ – $11 $ 14Utilized in 2003 – – – – –
Reserve balance at May 25, 2003 1 2 – 11 142004 Charges 1 2 – 5 8Utilized and reclassified in 2004 (2) (3) – (9) (14)
Reserve balance at May 30, 2004 $ – $ 1 $ – $ 7 $ 8
Consolidated
Reserve balance at May 27, 2001 $ 1 $ 4 $ – $ 4 $ 92002 Charges, net of credits 68 54 11 1 134Utilized in 2002 (15) (7) (11) (3) (36)
Reserve balance at May 26, 2002 54 51 – 2 1072003 Charges 10 31 5 16 62Utilized and reclassified in 2003 (54) (66) (5) (7) (132)
Reserve balance at May 25, 2003 10 16 – 11 372004 Charges 16 4 – 6 26Utilized and reclassified in 2004 (13) (18) – (9) (40)
Reserve balance at May 30, 2004 $ 13 $ 2 $ – $ 8 $ 23
30

4. INVESTMENTS IN JOINT VENTURES
We have a 50 percent equity interest in Cereal PartnersWorldwide (CPW), a joint venture with Nestlé that manu-factures and markets ready-to-eat cereals outside the UnitedStates and Canada. We have a 40.5 percent equity interestin Snack Ventures Europe (SVE), a joint venture withPepsiCo that manufactures and markets snack foods incontinental Europe. We have a 50 percent equity interest in8th Continent, LLC, a domestic joint venture with DuPontto develop and market soy foods and beverages. As a resultof the Pillsbury acquisition, we have 50 percent interests inthe following joint ventures for the manufacture, distribu-tion and marketing of Häagen-Dazs frozen ice creamproducts and novelties: Häagen-Dazs Japan K.K., Häagen-Dazs Korea Company Limited, Häagen-Dazs Distributors(Thailand) Company Limited, and Häagen-Dazs Marketing& Distribution (Philippines) Inc. We also have a 50 percentinterest in Seretram, a joint venture with Co-op de Pau forthe production of Green Giant canned corn in France.
The joint ventures are reflected in our consolidated finan-cial statements on an equity accounting basis. We recordour share of the earnings or losses of these joint ventures.We also receive royalty income from certain joint ventures,incur various expenses (primarily research and develop-ment) and record the tax impact of certain joint ventureoperations that are structured as partnerships.
Our cumulative investment in these joint ventures(including our share of earnings and losses) was$434 million, $372 million and $326 million at the endof fiscal 2004, 2003 and 2002, respectively. We madeaggregate investments in the joint ventures of $31 million,$17 million and $38 million in fiscal 2004, 2003 and 2002,respectively. We received aggregate dividends from the jointventures of $60 million, $95 million and $17 million infiscal 2004, 2003 and 2002, respectively.
Summary combined financial information for the jointventures on a 100 percent basis follows. Since we recordour share of CPW results on a two-month lag, CPWinformation is included as of and for the 12 months endedMarch 31. The Häagen-Dazs and Seretram joint venturesare reported as of and for the 12 months ended April 30,2004 and April 30, 2003, and for the six months endedApril 30, 2002. The SVE and 8th Continent information isconsistent with our May year-end.
Combined Financial Information – Joint Ventures100 Percent Basis
In Millions, Fiscal Year 2004 2003 2002
Net Sales $2,625 $2,159 $1,693Gross Profit 1,180 952 755Earnings before Taxes 205 178 94Earnings after Taxes 153 125 78
In Millions, Fiscal Year Ended 2004 2003
Current Assets $ 852 $ 681Noncurrent Assets 972 868Current Liabilities 865 679Noncurrent Liabilities 14 9
Our proportionate share of joint venture net sales was$1,212 million, $997 million and $777 million for fiscal2004, 2003 and 2002, respectively.
31

5. BALANCE SHEET INFORMATION
The components of certain balance sheet accounts are as follows:
In Millions May 30, 2004 May 25, 2003
Land, Buildings and Equipment:Land $ 53 $ 55Buildings 1,290 1,180Equipment 3,419 3,005Construction in progress 557 689
Total land, buildings and equipment 5,319 4,929Less accumulated depreciation (2,208) (1,949)
Net land, buildings and equipment $ 3,111 $ 2,980
Goodwill:Total goodwill $ 6,770 $ 6,736Less accumulated amortization (86) (86)
Goodwill $ 6,684 $ 6,650
Other Intangible Assets:Intangible assets not subject to amortization
Brands $ 3,516 $ 3,516Pension intangible 6 7Intangible assets not subject to amortization 3,522 3,523
Intangible assets subject to amortization, primarily capitalized software $ 197 $ 154Less accumulated amortization (78) (55)
Intangible assets subject to amortization 119 99Total other intangible assets $ 3,641 $ 3,622
Other Assets:Prepaid pension $ 1,148 $ 1,084Marketable securities, at market 30 160Investments in and advances to affiliates 422 362Miscellaneous 197 190
Total other assets $ 1,797 $ 1,796
Other Current Liabilities:Accrued payroll $ 230 $ 243Accrued interest 186 178Accrued taxes 249 129Miscellaneous 131 250
Total other current liabilities $ 796 $ 800
32

The changes in the carrying amount of goodwill for fiscal 2002, 2003 and 2004 are as follows:
In Millions U.S. RetailBakeries andFoodservice International
PillsburyUnallocated
ExcessPurchase Price Total
Balance at May 27, 2001 $ 745 $ 59 $ – $ – $ 804Pillsbury transaction – – – 7,669 7,669
Balance at May 26, 2002 $ 745 $ 59 $ – $ 7,669 $ 8,473Activity including translation – – 10 (1,833) (1,823)Allocation to segments 4,279 1,146 411 (5,836) –
Balance at May 25, 2003 $5,024 $1,205 $421 $ – $ 6,650Activity including translation – – 34 – 34
Balance at May 30, 2004 $5,024 $1,205 $455 $ – $ 6,684
The Pillsbury acquisition valuation and purchase priceallocation was completed in fiscal 2003. The activityduring fiscal 2003 primarily reflects the allocation of thepurchase price to brand intangibles, net of tax, and thecontingent value rights payment to Diageo (see NoteTwo, “Acquisitions”).
Intangible asset amortization expense was $23 million,$18 million and $13 million for fiscal 2004, 2003 and2002, respectively. Estimated amortization expense for thenext five fiscal years (in millions) is as follows: $23 in 2005,$21 in 2006, $16 in 2007, $12 in 2008 and $12 in 2009.
As of May 30, 2004, a comparison of cost and marketvalues of our marketable securities (which are debt andequity securities) was as follows:
In Millions CostMarketValue
GrossGain
GrossLoss
Held to maturity:Debt securities $ – $ – $– $ –Equity securities 2 2 – –
Total $ 2 $ 2 $– $ –Available for sale:
Debt securities $48 $48 $– $ –Equity securities 4 6 2 –
Total $52 $54 $2 $ –
As of May 30, 2004 and May 25, 2003, respectively,$25 million and $53 million was designated as collateral forcertain derivative liabilities.
Realized gains from sales of marketable securities were$20 million, $14 million and $15 million in fiscal 2004,2003 and 2002, respectively. The aggregate unrealized gainsand losses on available-for-sale securities, net of tax effects,are classified in Accumulated Other Comprehensive Incomewithin Stockholders’ Equity.
Scheduled maturities of our marketable securities are asfollows:
Held to Maturity Available for Sale
In Millions CostMarketValue Cost
MarketValue
Under one year(current) $– $– $26 $26
From 1 to 3 years – – 3 3From 4 to 7 years – – 5 5Over 7 years – – 14 14Equity securities 2 2 4 6
Totals $2 $2 $52 $54
6. INVENTORIES
The components of inventories are as follows:
In MillionsMay 30,2004
May 25,2003
Raw materials, work in process andsupplies $ 234 $ 221
Finished goods 793 818Grain 77 70Reserve for LIFO valuation method (41) (27)Total Inventories $1,063 $1,082
At May 30, 2004, and May 25, 2003, respectively,inventories of $765 million and $767 million were valuedat LIFO. LIFO accounting decreased fiscal 2004 earnings by$.02 per share and had a negligible impact on fiscal 2003and 2002 earnings. Results of operations were notmaterially affected by a liquidation of LIFO inventory.The difference between replacement cost and the statedLIFO inventory value is not materially different from thereserve for LIFO valuation method.
33

7. FINANCIAL INSTRUMENTS AND RISK MANAGEMENT
The carrying amounts and fair values of our financialinstruments (based on market quotes and interest rates atthe balance sheet dates) were as follows:
May 30, 2004 May 25, 2003
In MillionsCarryingAmount
FairValue
CarryingAmount
FairValue
Assets:Cash and cash
equivalents $ 751 $ 751 $ 703 $ 703Receivables 1,010 1,010 980 980Marketable
securities 56 56 160 160Liabilities:
Accounts payable 1,145 1,145 1,303 1,303Debt 8,226 8,508 8,857 9,569
Derivatives relating to:Debt (323) (323) (446) (446)Commodities 4 4 4 4Foreign currencies 2 2 (18) (18)
The Company is exposed to certain market risks as a part ofits ongoing business operations and uses derivative financialand commodity instruments, where appropriate, to managethese risks. Derivatives are financial instruments whosevalue is derived from one or more underlying financialinstruments. Examples of underlying instruments arecurrencies, equities, commodities and interest rates. Ingeneral, instruments used as hedges must be effective atreducing the risk associated with the exposure being hedged,and must be designated as a hedge at the inception ofthe contract.
With the adoption of SFAS No. 133, “Accounting forDerivative Instruments and Hedging Activities,” as ofMay 28, 2001, we record the fair value of all outstandingderivatives in receivables or other liabilities. Gains andlosses related to the ineffective portion of any hedge arerecorded in various costs and expenses, depending on thenature of the derivative.
Each derivative transaction we enter into is designated atinception as a hedge of risks associated with specific assets,liabilities or future commitments, and is monitored to deter-mine if it remains an effective hedge. Effectiveness is basedon changes in the derivative’s market value or cash flowsbeing highly correlated with changes in market value orcash flows of the underlying hedged item. We do not enterinto or hold derivatives for trading or speculative purposes.None of our derivative instruments is excluded from ourassessment of hedge effectiveness.
We use derivative instruments to reduce financial risk inthree areas: interest rates, foreign currency and commodi-
ties. The notional amounts of derivatives do not representactual amounts exchanged by the parties and, thus, are nota measure of the Company’s exposure through its use ofderivatives. We enter into interest rate swap, foreignexchange, and commodity swap agreements with a diversi-fied group of highly rated counterparties. We enter intocommodity futures transactions through various regulatedexchanges. These transactions may expose the Company tocredit risk to the extent that the instruments have a positivefair value, but we have not experienced any material lossesnor do we anticipate any losses. The Company does nothave a significant concentration of risk with any singleparty or group of parties in any of its financial instruments.
Qualifying derivatives are reported as part of hedge arrange-ments as follows:
CASH FLOW HEDGES – Gains and losses on theseinstruments are recorded in Other Comprehensive Incomeuntil the underlying transaction is recorded in earnings.When the hedged item is realized, gains or losses arereclassified from Accumulated Other ComprehensiveIncome to the Consolidated Statements of Earnings onthe same line item as the underlying transaction risk. Whenwe issue fixed rate debt, the corresponding interest rateswaps are dedesignated as hedges and the amount related tothose swaps within Accumulated Other ComprehensiveIncome is reclassified into earnings over the life of theinterest rate swaps.
FOREIGN EXCHANGE TRANSACTION RISK – TheCompany is exposed to fluctuations in foreign currency cashflows related primarily to third-party purchases, intercom-pany product shipments, and intercompany loans. Forwardcontracts of generally less than 12 months duration areused to hedge some of these risks. Effectiveness is assessedbased on changes in forward rates.
INTEREST RATE RISK – The Company is exposed tointerest rate volatility with regard to existing variable-ratedebt and planned future issuances of fixed-rate debt. TheCompany uses interest rate swaps, including forward-starting swaps, to reduce interest rate volatility, and toachieve a desired proportion of variable vs. fixed-rate debt,based on current and projected market conditions.
Variable-to-fixed interest rate swaps are accounted for ascash flow hedges, with effectiveness assessed based oneither the hypothetical derivative method or changes in thepresent value of interest payments on the underlying debt.The amount of hedge ineffectiveness was less than$1 million in fiscal 2004, 2003 and 2002.
PRICE RISK – The Company is exposed to price fluctua-tions primarily as a result of anticipated purchases ofingredient and packaging materials. The Company uses a
34

combination of long cash positions with suppliers,exchange-traded futures and option contracts and over-the-counter hedging mechanisms to reduce price fluctuations ina desired percentage of forecasted purchases over a period ofgenerally less than one year. Commodity contracts areaccounted for as cash flow hedges, with effectivenessassessed based on changes in futures prices. The amount ofhedge ineffectiveness was $1 million or less in fiscal 2004,2003 and 2002. Losses of $2 million were reclassified intoearnings as a result of the discontinuance of commoditycash flow hedges in fiscal 2003.
We use a grain merchandising operation to provide usefficient access to and more informed knowledge of variouscommodities markets. This operation uses futures andoptions to hedge its net inventory position to minimizemarket exposure. As of May 30, 2004, our grain merchan-dising operation had futures and options contracts thatessentially hedged its net inventory position. None of thecontracts extended beyond May 2005. All futures contractsand futures options are exchange-based instruments withready liquidity and determinable market values. Neitherresults of operations nor the year-end positions of our grainmerchandising operation were material to the Company’soverall results.
Unrealized losses from cash flow hedges recorded in Accu-mulated Other Comprehensive Income as of May 30, 2004,totaled $279 million, primarily related to interest rateswaps we entered into in contemplation of future borrow-ings and other financing requirements (primarily related tothe Pillsbury acquisition), which are being reclassified intointerest expense over the life of the interest rate hedge (seeNote Eight regarding swaps settled or neutralized). The esti-mated net amount of the existing gains and losses inAccumulated Other Comprehensive Income as of May 30,2004 that is expected to be reclassified into earnings withinthe next twelve months is $87 million pretax expense.
FAIR VALUE HEDGES – Fair value hedges involverecognized assets, liabilities or firm commitments as thehedged risks.
FOREIGN EXCHANGE TRANSLATION RISK – TheCompany is exposed to fluctuations in the value of foreigncurrency investments in subsidiaries and cash flows relatedprimarily to repatriation of these investments. Forwardcontracts, generally less than 12 months duration, are usedto hedge some of these risks. Effectiveness is assessed basedon changes in forward rates. Effective gains and losses onthese instruments are recorded as a foreign currency transla-tion adjustment in Other Comprehensive Income.
Our net balance sheet exposure consists of the net invest-ment in foreign operations, translated using the exchange
rates in effect at the balance sheet date and amounted toapproximately $1,100 million at May 30, 2004 and approx-imately $700 million May 25, 2003.
INTEREST RATE RISK – The Company currently usesinterest rate swaps to reduce volatility of funding costsassociated with certain debt issues and to achieve a desiredproportion of variable vs. fixed-rate debt, based on currentand projected market conditions.
Fixed-to-variable interest rate swaps are accounted for asfair value hedges with effectiveness assessed based onchanges in the fair value of the underlying debt, usingincremental borrowing rates currently available on loanswith similar terms and maturities. Effective gains and losseson these derivatives and the underlying hedged items arerecorded as interest expense.
The following table indicates the types of swaps used tohedge various assets and liabilities, and their weightedaverage interest rates. Average variable rates are based onrates as of the end of the reporting period. The swapcontracts mature during time periods ranging from2005 to 2014.
May 30, 2004 May 25, 2003In Millions Asset Liability Asset Liability
Pay floating swaps –notional amount – $5,071 – $4,609Average receive rate – 4.2% – 4.4%Average pay rate – 1.1% – 1.3%
Pay fixed swaps –notional amount – $5,150 – $5,900Average receive rate – 1.1% – 1.3%Average pay rate – 6.4% – 6.3%
The interest rate differential on interest rate swaps used tohedge existing assets and liabilities is recognized as anadjustment of interest expense or income over the term ofthe agreement.
35

8. DEBT
NOTES PAYABLE – The components of notes payable andtheir respective weighted average interest rates at the end ofthe periods were as follows:
May 30, 2004 May 25, 2003
In Millions Notes PayableWeighted Average
Interest Rate Notes PayableWeighted Average
Interest Rate
U.S. commercial paper $ 441 1.2% $ 1,415 1.4%Canadian commercial paper 159 2.1 28 3.3Euro commercial paper 499 2.1 527 1.5Financial institutions 234 6.7 366 1.4Amounts reclassified to long-term debt (750) – (1,100) –
Total Notes Payable $ 583 $ 1,236
See Note Seven for a description of related interest-ratederivative instruments.
To ensure availability of funds, we maintain bank creditlines sufficient to cover our outstanding short-term borrow-ings. As of May 30, 2004, we had $1.85 billion incommitted lines and $264 million in uncommitted lines.
In the third quarter of fiscal 2004, we entered into anagreement for a new $750 million credit facility, expiring inJanuary 2009. That facility replaced a $1.1 billion, 364-dayfacility, which expired January 22, 2004. The new creditfacility, along with our existing $1.1 billion multi-yearfacility that expires January 2006, brings our totalcommitted back-up credit amount to $1.85 billion. Theserevolving credit agreements provide us with the ability torefinance short-term borrowings on a long-term basis;accordingly, a portion of our notes payable has beenreclassified to long-term debt.
LONG-TERM DEBT – On August 11, 2003, we enteredinto a $75 million five year term (callable after two years)bank borrowing agreement. The floating rate coupon is onemonth LIBOR plus 15 basis points and interest is payableon a monthly basis. This borrowing did not utilize any ofour existing shelf registration.
On September 24, 2003, we sold $500 million of 25⁄8%fixed-rate notes due October 24, 2006. Interest on thesenotes is payable semiannually on April 24 and October 24,beginning April 24, 2004. Concurrently, we entered into aninterest rate swap for $500 million notional amount wherewe receive 25⁄8% fixed interest and pay LIBOR plus 11 basispoints. As of May 30, 2004, approximately $3.5 billionremained available under our existing shelf registrationstatement for future use.
On October 28, 2002, we completed a private placement ofzero coupon convertible debentures with a face value ofapproximately $2.23 billion for gross proceeds of approxi-
mately $1.50 billion. The issue price of the debentures was$671.65 for each $1,000 in face value, which represents ayield to maturity of 2.00%. The debentures cannot becalled by General Mills for three years after issuance andwill mature in 20 years. Holders of the debentures canrequire the Company to repurchase the notes on the third,fifth, tenth and fifteenth anniversaries of the issuance. Wehave the option to pay the repurchase price in cash or instock. The debentures are convertible into General Millscommon stock at a rate of 13.0259 shares for each $1,000debenture. This results in an initial conversion price ofapproximately $51.56 per share and represents a premiumof 25 percent over the closing sale price of $41.25 per shareon October 22, 2002. The conversion price will increasewith the accretion of the original issue discount on thedebentures. Generally, except upon the occurrence of speci-fied events, holders of the debentures are not entitled toexercise their conversion rights until the Company’s stockprice is greater than a specified percentage (beginning at125 percent and declining by 0.25 percent each six months)of the accreted conversion price per share.
On November 20, 2002, we sold $350 million of 37⁄8%fixed-rate notes and $135 million of 3.901% fixed-ratenotes due November 30, 2007. Interest for these notes ispayable semiannually on May 30 and November 30,beginning May 30, 2003.
In anticipation of the Pillsbury acquisition and otherfinancing needs, we entered into interest rate swapcontracts during fiscal 2001 and fiscal 2002 totaling$7.1 billion to attempt to lock in our interest rate onassociated debt. In September 2001, $100 million of theseswaps expired. In connection with the $3.5 billion notesoffering in February 2002, we closed out $3.5 billion ofthese swaps. A portion was settled for cash, and theremainder was neutralized with offsetting swaps. Thenotional amount of swaps settled for cash totaled$1.1 billion and the net cash payment was $13 million. The
36

notional amount of the swaps that were neutralized withoffsetting swaps totaled $2.4 billion. During fiscal 2003, weclosed out $1.985 billion of swaps due to the $1.5 billionconvertible debentures offering in October 2002 and the$485 million of notes offering in November 2002. All ofthese swaps had been designated as cash flow hedges.Therefore, the mark-to-market value for these swaps hasbeen recorded in Other Comprehensive Income. As ofMay 30, 2004, the amount recorded in Accumulated OtherComprehensive Income ($279 million) will be reclassified tointerest expense over the remaining lives of the swapcontracts (ranging from one to nine years).
A summary of our long-term debt is as follows:
In MillionsMay 30,2004
May 25,2003
6% notes due 2012 $2,000 $2,00051⁄8% notes due 2007 1,500 1,500Zero coupon convertible debentures
yield 2.0%, $2,233 due 2022 1,548 1,51737⁄8% notes due 2007 350 3503.901% notes due 2007 135 135Medium-term notes, 4.8% to 9.1%,
due 2004 to 2078 437 591Core Notes, 2.75% to 5.20%, due
2006 to 2010 7 727.0% notes due Sept. 15, 2004 150 150Zero coupon notes, yield 11.1%,
$261 due Aug. 15, 2013 97 87Zero coupon notes, yield 11.7%, $54
due Aug. 15, 2004 53 478.2% ESOP loan guaranty, due
through June 30, 2007 11 162.625% notes due 2006 500 –Bank term loan due 2008 75 –Notes payable, reclassified 750 1,100Other 30 56
7,643 7,621Less amounts due within one year (233) (105)
Total Long-term Debt $7,410 $7,516
See Note Seven for a description of related interest-ratederivative instruments.
The Company has guaranteed the debt of the EmployeeStock Ownership Plan; therefore, the loan is reflected onour consolidated balance sheets as long-term debt with arelated offset in Unearned Compensation in Stockholders’Equity.
The sinking fund and principal payments due on long-termdebt are (in millions) $233, $58, $2,037, $551 and $172 infiscal 2005, 2006, 2007, 2008 and 2009, respectively. The
fiscal 2005 and 2006 amounts are exclusive of $1 millionand $3 million, respectively, of interest yet to be accretedon zero coupon notes. The notes payable that are reclassi-fied under our revolving credit agreement are not includedin these principal payments.
9. MINORITY INTERESTS
In April 2002, the Company and certain of its whollyowned subsidiaries contributed assets with an aggregate fairmarket value of approximately $4 billion to another whollyowned subsidiary, General Mills Cereals, LLC (GMC), alimited liability company. GMC is a separate and distinctlegal entity from the Company and its subsidiaries, and hasseparate assets, liabilities, businesses and operations. Thecontributed assets consist primarily of manufacturing assetsand intellectual property associated with the productionand retail sale of Big G ready-to-eat cereals, Progresso soupsand Old El Paso products. In exchange for the contributionof these assets, GMC issued the managing membershipinterest and Class A and Class B preferred membershipinterests to wholly owned subsidiaries of the Company. Themanaging member directs the business activities and opera-tions of GMC and has fiduciary responsibilities to GMCand its members. Other than rights to vote on certainmatters, holders of the Class A and Class B interests haveno right to direct the management of GMC.
In May 2002, GMC sold approximately 30 percent of theClass A interests to an unrelated third-party investor inexchange for $150 million. The Class A interests receivequarterly preferred distributions at a floating rate equal tothe three-month LIBOR plus 90 basis points. The GMClimited liability company agreement requires that the rateof the preferred distributions for the Class A interests bereset by agreement between the third-party investors andGMC every five years, beginning in May 2007. If GMCand the investors fail to mutually agree on a new rate ofpreferred distributions, GMC must remarket the securities.Upon a failed remarketing, the rate over LIBOR will beincreased by 75 basis points (up to a maximum total of 300basis points following a scheduled reset date). In the eventof four consecutive failed remarketings, the third-partyinvestors can force a liquidation and winding up of GMC.
GMC, through the managing member, may elect to redeemall of the Class A interests held by third-party investors atany time for an amount equal to the investors’ capitalaccounts, plus an optional retirement premium if suchretirement occurs prior to June 2007. Under certain circum-stances, GMC also may be dissolved and liquidated,including, without limitation, the bankruptcy of GMC orits subsidiaries, failure to deliver the preferred quarterlyreturn, failure to comply with portfolio requirements,
37

breaches of certain covenants, and four consecutive failedattempts to remarket the Class A interests. In the event of aliquidation of GMC, the third-party investors that hold theClass A interests would be entitled to repayment from theproceeds of liquidation prior to the subsidiaries of theCompany that are members of GMC. The managingmember may avoid liquidation in most circumstances byexercising an option to purchase the preferred interests. Anelection to redeem the preferred membership interests couldimpact the Company’s liquidity by requiring the Companyto refinance the redemption price or liquidate a portion ofGMC assets.
Currently, all of the Class B interests are held by asubsidiary of the Company. The Company may offer theClass B interests and the remaining, unsold Class Ainterests to third-party investors on terms and conditionsto be determined.
For financial reporting purposes, the assets, liabilities,results of operations, and cash flows of GMC are includedin the Company’s consolidated financial statements. Thethird-party investor’s Class A interest in GMC is reflectedas a minority interest on the consolidated balance sheet ofthe Company, and the return to the third party investor isreflected as interest expense in the consolidated statementsof earnings.
In fiscal 2003, General Mills Capital, Inc. (GM Capital), awholly owned subsidiary, sold $150 million of its Series Apreferred stock to an unrelated third-party investor. GMCapital regularly enters into transactions with the Companyto purchase receivables of the Company. These receivablesare included in the consolidated balance sheet and the$150 million purchase price for the Series A preferred stockis reflected as minority interest on the balance sheet. Theproceeds from the issuance of the preferred stock were usedto reduce short-term debt. The return to the third-partyinvestor is reflected as interest expense in the consolidatedstatements of earnings.
10. STOCKHOLDERS’ EQUITY
Cumulative preference stock of 5 million shares, withoutpar value, is authorized but unissued.
We have a shareholder rights plan that entitles eachoutstanding share of common stock to one right. Each rightentitles the holder to purchase one two-hundredths of ashare of cumulative preference stock (or, in certain circum-stances, common stock or other securities), exercisable uponthe occurrence of certain events. The rights are not transfer-able apart from the common stock until a person or grouphas acquired 20 percent or more, or makes a tender offer for20 percent or more, of the common stock. Then each rightwill entitle the holder (other than the acquirer) to receive,upon exercise, common stock of either the Company or theacquiring company having a market value equal to twotimes the exercise price of the right. The initial exerciseprice is $120 per right. The rights are redeemable by theBoard of Directors at any time prior to the acquisition of20 percent or more of the outstanding common stock. Theshareholder rights plan was specifically amended so that thePillsbury transaction described in Note Two did not triggerthe exercisability of the rights. The rights expire onFebruary 1, 2006. At May 30, 2004, there were 379 millionrights issued and outstanding.
The Board of Directors has authorized the repurchase,from time to time, of common stock for our treasury,provided that the number of treasury shares shall notexceed 170 million.
Through private transactions in fiscal 2003 as part of ourstock repurchase program, we issued put options for lessthan 1 million shares for $1 million in premiums paid tothe Company. As of May 30, 2004, no put optionsremained outstanding. On October 31, 2002, we purchasedcall options from Diageo plc on approximately 29 millionshares that Diageo currently owns. The premiums paid forthe call options totaled $89 million. The options areexercisable in whole or in part from time to time, subject tocertain limitations, during a three-year period from the dateof the purchase of the calls. As of May 30, 2004, these calloptions for 29 million shares remained outstanding at anexercise price of $51.56 per share with a final exercise dateof October 28, 2005.
38

The following table provides details of OtherComprehensive Income:
In MillionsPretaxChange
Tax(Expense)Benefit
OtherCompre-hensiveIncome
Fiscal 2002Foreign currency translation $ (4) $ – $ (4)Minimum pension liability 7 (3) 4Other fair value changes:
Securities (3) 1 (2)Hedge derivatives (343) 127 (216)
Reclassification to earnings:Securities (15) 6 (9)Hedge derivatives 163 (61) 102
Cumulative effect ofadopting SFAS No. 133 (251) 93 (158)
Other Comprehensive Income $(446) $163 $(283)
Fiscal 2003Foreign currency translation $ 98 $ – $ 98Minimum pension liability (88) 33 (55)Other fair value changes:
Securities 7 (3) 4Hedge derivatives (168) 63 (105)
Reclassification to earnings:Securities (14) 5 (9)Hedge derivatives 161 (60) 101
Other Comprehensive Income $ (4) $ 38 $ 34
Fiscal 2004Foreign currency translation $ 75 $ – $ 75Minimum pension liability 51 (19) 32Other fair value changes:
Securities 5 (2) 3Hedge derivatives 24 (9) 15
Reclassification to earnings:Securities (20) 7 (13)Hedge derivatives 136 (50) 86
Other Comprehensive Income $ 271 $ (73) $ 198
Except for reclassification to earnings, changes in OtherComprehensive Income are primarily noncash items.
Accumulated Other Comprehensive Income balances, net oftax effects, were as follows:
In MillionsMay 30,2004
May 25,2003
Foreign currency translationadjustments $ 60 $ (15)
Unrealized gain (loss) from:Securities 1 11Hedge derivatives (175) (276)
Pension plan minimum liability (30) (62)Accumulated Other Comprehensive
Income $(144) $(342)
11. STOCK PLANS
The Company uses broad-based stock plans to help ensurealignment with stockholders’ interests. The 2003 StockCompensation Plan (“2003 Plan”) was approved by share-holders in September 2003, increased the use of restrictedstock and reduced the Company’s reliance on stock optionsas its principal form of long-term compensation. A total of9,710,278 shares are available for grant under the 2003Plan through December 31, 2005, the 2001 Director Planthrough September 30, 2006, and the Executive IncentivePlan through December 31, 2025. Shares available for grantare reduced by shares issued, net of shares surrendered tothe Company in stock-for-stock exercises. Options may bepriced only at 100 percent of the fair market value at thedate of grant. No options now outstanding have beenre-priced since the original date of grant. Options nowoutstanding include some granted under the 1988, 1990,1993, 1995, 1998 senior management and 1998 employeeoption plans, under which no further rights may be granted.All options expire within 10 years and one month after thedate of grant. The stock plans provide for full vesting ofoptions upon completion of specified service periods, or inthe event of a change of control.
Stock subject to a restricted period and a purchase price, ifany (as determined by the Compensation Committee of theBoard of Directors), may be granted to key employeesunder the 2003 Plan. Restricted stock, up to 50 percent ofthe value of an individual’s cash incentive award, may begranted through the Executive Incentive Plan. Certainrestricted stock awards require the employee to depositpersonally owned shares (on a one-for-one basis) with theCompany during the restricted period. The 2001 DirectorPlan allows each nonemployee director to annually receive1,000 restricted stock units convertible to common stock ata date of the director’s choosing following his or herone-year term. In fiscal 2004, 2003 and 2002, grants of1,738,581, 345,889 and 691,115 shares of restricted stockor units were made to employees and directors with
39

weighted average values at grant of $46.35, $44.13 and$46.93 per share, respectively. On May 30, 2004, a total of3,113,279 restricted shares and units were outstandingunder all plans.
The following table contains information on stock optionactivity:
OptionsExercisable(Thousands)
Weighted AverageExercise Price
per Share
OptionsOutstanding(Thousands)
Weighted AverageExercise Price
per Share
Balance at May 27, 2001 27,724 $27.79 63,498 $32.40Granted 14,567 48.17Exercised (6,569) 27.64Expired (421) 39.44
Balance at May 26, 2002 30,149 $29.18 71,075 $36.03Granted 7,890 43.90Exercised (3,492) 29.39Expired (1,113) 43.76
Balance at May 25, 2003 37,743 $31.61 74,360 $37.07Granted 5,180 46.12Exercised (9,316) 27.27Expired (1,111) 43.06
Balance at May 30, 2004 37,191 $33.73 69,113 $38.97
The following table provides information regarding options exercisable and outstanding as of May 30, 2004:
Range of Exercise Price per Share
OptionsExercisable(Thousands)
Weighted AverageExercise Price
per Share
OptionsOutstanding(Thousands)
Weighted AverageExercise Price
per Share
Weighted AverageRemaining
Contractual Life(Years)
Under $25 1,707 $22.79 1,707 $22.79 .35$25–$30 6,017 26.43 6,017 26.43 1.50$30–$35 16,763 33.18 17,645 33.25 4.61$35–$40 7,201 37.38 7,578 37.43 4.24$40–$45 5,398 41.88 19,337 42.28 7.16Over $45 105 48.24 16,829 47.98 8.27
37,191 $33.73 69,113 $38.97 5.80
SFAS No. 123 allows either a fair value based method or anintrinsic value based method of accounting for stock-basedcompensation plans. We use the intrinsic value basedmethod. Stock-based compensation expense related torestricted stock for fiscal 2004, 2003 and 2002 was$27 million, $21 million and $16 million, respectively.Stock-based compensation expense for stock options is notreflected in net earnings, as all options granted under thoseplans had an exercise price equal to the market value of theunderlying common stock on the date of the grant. SeeNote One (L) for additional details.
12. EARNINGS PER SHARE
Basic and diluted earnings per share (EPS) were calculatedusing the following:
In Millions, Fiscal Year 2004 2003 2002
Net earnings $1,055 $917 $458Average number of
common shares – basicEPS 375 369 331
Incremental share effectfrom:Stock options 8 9 11Restricted stock, stock
rights and puts 1 – –Average number of
common shares –diluted EPS 384 378 342
The diluted EPS calculation does not include 12 million,13 million and 4 million average anti-dilutive stock optionsin fiscal 2004, 2003 and 2002, respectively, nor does it
40

include 3 million and 13 million average anti-dilutive putoptions in fiscal 2003 and 2002, respectively.
13. INTEREST EXPENSE
The components of net interest expense are as follows:
In Millions, Fiscal Year 2004 2003 2002
Interest expense $537 $589 $445Capitalized interest (8) (8) (3)Interest income (21) (34) (26)
Interest, net $508 $547 $416
During fiscal 2004, 2003 and 2002, we paid interest (net ofamount capitalized) of $490 million, $502 million and$346 million, respectively.
14. RETIREMENT AND OTHER POSTRETIREMENTBENEFIT PLANS
DEFINED-BENEFIT PLANS – We have defined-benefitretirement plans covering most employees. Benefits forsalaried employees are based on length of service and finalaverage compensation. The hourly plans include variousmonthly amounts for each year of credited service. Our
funding policy is consistent with the requirements of federallaw. Our principal retirement plan covering salariedemployees has a provision that any excess pension assetswould vest in plan participants if the plan is terminatedwithin five years of a change in control.
We sponsor plans that provide health-care benefits to themajority of our retirees. The salaried health-care benefitplan is contributory, with retiree contributions based onyears of service. We fund related trusts for certainemployees and retirees on an annual basis. The MedicarePrescription Drug Improvement and Modernization Act of2003 (Act) was signed into law on December 8, 2003.Financial Accounting Standards Board Staff Position 106-2(FSP 106-2) provides accounting guidance related to theAct. We adopted FSP 106-2 effective as of the Act’s enact-ment date, December 8, 2003. The reduction in theaccumulated postretirement benefit obligation for the Actsubsidy related to past services was $54 million. The effectof the subsidy on postretirement cost for fiscal 2004 was areduction of approximately $3 million.
We use our fiscal year-end as a measurement date forsubstantially all of our pension and postretirementbenefit plans.
41

OBLIGATIONS AND FUNDED STATUS – Reconciliation of the funded status of these plans and the amounts included inthe balance sheet are as follows:
Pension Plans Postretirement Benefit PlansIn Millions, Fiscal Year End 2004 2003 2004 2003
Fair Value of Plan AssetsBeginning fair value $2,541 $2,671 $ 202 $ 233Actual return on assets 451 (6) 34 2Company contributions 5 9 20 2Plan participant contributions 1 – 8 6Benefits paid from plan assets (148) (133) (45) (41)
Ending Fair Value $2,850 $2,541 $ 219 $ 202Projected Benefit Obligation
Beginning obligations $2,765 $2,100 $ 814 $ 611Service cost 70 46 16 12Interest cost 160 162 47 46Plan amendment 5 – – –Curtailment – 5 – –Plan participant contributions 1 – 8 8Actuarial loss (gain) (275) 585 (12) 179Actual benefits paid (148) (133) (47) (42)
Ending Obligations $2,578 $2,765 $ 826 $ 814Funded Status of Plans $ 272 $ (224) $(607) $(612)
Unrecognized actuarial loss 770 1,214 307 343Unrecognized prior service costs (credits) 48 48 (13) (14)
Net Amount Recognized $1,090 $1,038 $(313) $(283)Amounts Recognized on Balance Sheets
Prepaid asset $1,148 $1,084 $ – $ –Accrued liability (113) (153) (313) (283)Intangible asset 6 7 – –Minimum liability adjustment in equity 49 100 – –
Net Amount Recognized $1,090 $1,038 $(313) $(283)
The accumulated benefit obligation for all defined-benefit plans was $2,415 million and $2,640 million at May 30, 2004and May 25, 2003, respectively.
Plans with accumulated benefit obligations in excess of plan assets are as follows:
Pension Plans Postretirement Benefit PlansIn Millions, Fiscal Year End 2004 2003 2004 2003
Projected benefit obligation $291 $345 N/A N/AAccumulated benefit obligation 282 329 $826 $814Plan assets at fair value 167 173 219 202
42

COMPONENTS OF COSTS – Components of net benefit (income) or expense each fiscal year are as follows:
Pension Plans Postretirement Benefit PlansIn Millions, Fiscal Year 2004 2003 2002 2004 2003 2002
Service cost $ 70 $ 46 $ 34 $ 16 $ 12 $ 11Interest cost 160 162 122 47 46 33Expected return on plan assets (300) (300) (241) (22) (22) (23)Amortization of transition asset – (3) (15) – – –Amortization of losses 18 2 2 13 5 3Amortization of prior service costs
(credits) 5 6 4 (2) (2) (1)Settlement or curtailment losses – 5 9 – 1 2
Net (income) expense $ (47) $ (82) $ (85) $ 52 $ 40 $ 25
ASSUMPTIONS – Assumptions used to determine benefit obligations are:
Pension Plans Postretirement Benefit PlansFiscal Year End 2004 2003 2004 2003
Discount rate 6.65% 6.00% 6.65% 6.00%Rate of salary increases 4.4 4.4 – –
Assumptions used to determine net periodic benefit costs are:
Pension Plans Postretirement Benefit PlansFiscal Year 2004 2003 2002 2004 2003 2002
Discount rate 6.00% 7.50% 7.75% 6.00% 7.50% 7.75%Expected long-term rate of return on
plan assets 9.6 10.4 10.4 9.6 10.0 10.0Rate of salary increases 4.4 4.4 4.4 – – –
Assumed health care cost trend rates are as follows:
Fiscal Year End 2004 2003
Health care cost trend rate for nextyear 9.0% 8.3%
Rate to which the cost trend rate isassumed to decline (ultimate rate) 5.2 5.2
Year that the rate reaches the ultimatetrend rate 2009 2008
Assumed trend rates for health-care costs have an importanteffect on the amounts reported for the postretirementbenefit plans. If the health-care cost trend rate increased by1 percentage point in each future year, the aggregate of theservice and interest cost components of postretirementexpense would increase for fiscal 2004 by $7 million, andthe postretirement accumulated benefit obligation as ofMay 30, 2004, would increase by $78 million. If the health-care cost trend rate decreased by 1 percentage point in eachfuture year, the aggregate of the service and interest costcomponents of postretirement expense would decrease forfiscal 2004 by $6 million, and the postretirement accumu-lated benefit obligation as of May 30, 2004, would decreaseby $69 million.
PLAN ASSETS – Our weighted-average asset allocations forthe past two fiscal years for our pension plans and ourpostretirement benefit plans are as follows:
Pension PlansPostretirementBenefit Plans
Fiscal Year 2004 2003 2004 2003
Asset CategoryU.S. equities 38% 39% 38% 38%International equities 17 16 16 13Private equities 7 6 4 2Fixed income 27 28 32 38Real assets 11 11 10 9
Total 100% 100% 100% 100%
The investment objective for the U.S. pension and postre-tirement medical plans is to secure the benefit obligationsto participants at a reasonable cost to the Company. Thegoal is to optimize the long-term return on plan assets at amoderate level of risk. The pension and postretirementportfolios are broadly diversified across asset classes. Withinasset classes, the portfolios are further diversified acrossinvestment styles and investment organizations. For the
43

pension and postretirement plans, the long-term invest-ment policy allocations are: 35 percent to U.S. equities,15 percent to international equities, 10 percent to privateequities, 30 percent to fixed income and 10 percent toreal assets (real estate, energy and timber). The actualallocations to these asset classes may vary tactically aroundthe long-term policy allocations based on relative marketvaluations.
Our expected rate of return on plan assets is determined byour asset allocation, our historical long-term investmentperformance, our estimate of future long-term returns byasset class (using input from our actuaries, investmentservices and investment managers), and long-term inflationassumptions.
CONTRIBUTIONS AND FUTURE BENEFIT PAYMENTSWe expect to contribute $13 million to our pension plansand $21 million to our other postretirement benefit plans infiscal 2005.
Certain international operations have defined-benefitpension plans that are not presented in the tables above.These international operations have prepaid pension assetsof less than $1 million at the end of fiscal 2004 and 2003,and they have accrued pension plan liabilities of $5 millionat the end of fiscal 2004 and $4 million as of the end offiscal 2003. Pension expense associated with these planswas $3 million for fiscal 2004 and 2003.
DEFINED-CONTRIBUTION PLANS – The Company’stotal expense related to defined-contribution plans recog-nized in fiscal 2004, 2003 and 2002 was $20 million,$30 million and $9 million, respectively. The General MillsSavings Plan is a defined contribution plan that coverssalaried and nonunion employees. It had net assets of$1,668 million as of May 30, 2004, and $1,597 million asof May 25, 2003. This plan is a 401(k) savings plan thatincludes a number of investment funds and an EmployeeStock Ownership Plan (ESOP). The ESOP’s only assets areCompany common stock and temporary cash balances. TheESOP’s share of the total defined contribution expense was$15 million, $26 million and $3 million in fiscal 2004,2003 and 2002, respectively. The ESOP’s expense iscalculated by the “shares allocated” method.
The ESOP uses Company common stock to convey benefitsto employees and, through increased stock ownership, tofurther align employee interests with those of shareholders.The Company matches a percentage of employee contribu-tions to the ESOP with a base match plus a variableyear-end match that depends on annual results. Employeesreceive the Company match in the form of common stock.
The ESOP originally purchased Company common stockprincipally with funds borrowed from third parties (and
guaranteed by the Company). The ESOP shares areincluded in net shares outstanding for the purposes ofcalculating earnings per share. The ESOP’s third-party debtis described in Note Eight.
The Company treats cash dividends paid to the ESOP thesame as other dividends. Dividends received on leveragedshares (i.e., all shares originally purchased with the debtproceeds) are used for debt service, while dividends receivedon unleveraged shares are passed through to participants.
The Company’s cash contribution to the ESOP is calculatedso as to pay off enough debt to release sufficient shares tomake the Company match. The ESOP uses the Company’scash contributions to the plan, plus the dividends receivedon the ESOP’s leveraged shares, to make principal andinterest payments on the ESOP’s debt. As loan paymentsare made, shares become unencumbered by debt and arecommitted to be allocated. The ESOP allocates shares toindividual employee accounts on the basis of the match ofemployee payroll savings (contributions), plus reinvesteddividends received on previously allocated shares. In fiscal2004, 2003 and 2002, the ESOP incurred interest expenseof $1 million, $1 million and $2 million, respectively.The ESOP used dividends of $5 million, $6 million and$8 million in the respective years, along with Companycontributions of less than $1 million in fiscal 2004 andfiscal 2003 and $3 million in fiscal 2002 to make interestand principal payments.
The number of shares of Company common stock in theESOP is summarized as follows:
Number of Shares, in ThousandsMay 30,2004
May 25,2003
Unreleased shares 599 844Committed to be allocated 5 12Allocated to participants 5,438 5,788
Total shares 6,042 6,644
15. PROFIT-SHARING PLAN
The Executive Incentive Plan provides incentives to keyemployees who have the greatest potential to contribute tocurrent earnings and successful future operations. Allemployees at the level of vice president and above partici-pate in the plan. These awards are approved by theCompensation Committee of the Board of Directors, whichconsists solely of independent, outside directors. Awards arebased on performance against pre-established goalsapproved by the Committee. Profit-sharing expense was$16 million, $19 million and $11 million in fiscal 2004,2003 and 2002, respectively.
44

16. INCOME TAXES
The components of earnings before income taxes and earn-ings of joint ventures and the corresponding income taxesthereon are as follows:
In Millions, Fiscal Year 2004 2003 2002
Earnings before incometaxes:U.S. $1,408 $1,272 $653Foreign 101 44 14
Total earningsbefore incometaxes $1,509 $1,316 $667
Income taxes:Current:
Federal $ 366 $ 384 $127State and local 31 24 8Foreign 22 25 11
Total current 419 433 146Deferred:
Federal 85 30 84State and local 7 5 15Foreign 17 (8) (6)
Total deferred 109 27 93Total Income
Taxes $ 528 $ 460 $239
In fiscal 1982 and 1983 we purchased certain income taxitems from other companies through tax lease transactions.Total current income taxes charged to earnings reflect theamounts attributable to operations and have not beenmaterially affected by these tax leases. Actual current taxespayable relating to fiscal 2004, 2003 and 2002 operationswere increased by approximately $2 million, $6 million and$3 million, respectively, due to the current effect of taxleases. These tax payments do not affect taxes for statementof earnings purposes since they repay tax benefits realizedin prior years.
The following table reconciles the U.S. statutory income taxrate with the effective income tax rate:
Fiscal Year 2004 2003 2002
U.S. statutory rate 35.0% 35.0% 35.0%State and local income taxes,
net of federal tax benefits 1.6 1.5 2.3Other, net (1.6) (1.5) (1.5)
Effective Income Tax Rate 35.0% 35.0% 35.8%
The tax effects of temporary differences that give rise todeferred tax assets and liabilities are as follows:
In MillionsMay 30,2004
May 25,2003
Accrued liabilities $ 136 $ 122Restructuring/disposition charges 18 100Compensation and employee benefits 272 245Unrealized hedge losses 104 172Unrealized capital or related losses 797 781Tax credit carry forwards 46 69Other 43 8
Gross deferred tax assets 1,416 1,497Brands 1,322 1,322Depreciation 241 225Prepaid pension asset 429 407Intangible assets 40 52Tax lease transactions 66 68Zero coupon convertible debentures 44 7Other 69 56
Gross deferred tax liabilities 2,211 2,137Valuation allowance 809 791
Net Deferred Tax Liability $1,604 $1,431
Of the total valuation allowance, $765 million relates to adeferred tax asset for unrealized capital or related lossesrecorded as part of the Pillsbury acquisition. In the future,if tax benefits are realized related to these losses, the reduc-tion in the valuation allowance will be allocated to reducegoodwill. The other $44 million of the valuation allowancerelates to foreign operating losses, capital losses and taxcredits. In the future, if tax benefits are realized related tothese losses or credits, the reduction in the valuationallowance will reduce tax expense.
We have not recognized a deferred tax liability forunremitted earnings of $845 million from our foreign oper-ations because we do not expect those earnings to becometaxable to us in the foreseeable future and because a deter-mination of the potential liability is not practicable. If aportion were to be remitted, we believe income tax creditswould substantially offset any resulting tax liability.
We have capital loss carryforwards of approximately$259 million, a majority of which will expire in 2007.Foreign operating loss carryforwards of approximately$89 million expire beginning in 2007, but the vast majoritydo not expire until 2018 or later.
In fiscal 2004, we paid income taxes of $225 million. Infiscal 2003, we paid income taxes of $248 million andreceived a $109 million refund of fiscal 2002 tax overpay-ments. During fiscal 2002, we paid income taxes of$196 million.
45

17. LEASES AND OTHER COMMITMENTS
An analysis of rent expense by property leased follows:
In Millions, Fiscal Year 2004 2003 2002
Warehouse space $42 $30 $26Equipment 20 29 23Other 34 29 19
Total Rent Expense $96 $88 $68
Some leases require payment of property taxes, insuranceand maintenance costs in addition to the rent payments.Contingent and escalation rent in excess of minimum rentpayments and sublease income netted in rent expense wereinsignificant.
Noncancelable future lease commitments (in millions) are:$79 in fiscal 2005, $70 in fiscal 2006, $64 in fiscal 2007,$57 in fiscal 2008, $55 in fiscal 2009 and $110 after fiscal2009, with a cumulative total of $435. These future leasecommitments will be partially offset by expected futuresublease receipts of $56 million.
We are contingently liable under guarantees and comfortletters for $199 million. The guarantees and comfort lettersare principally issued to support borrowing arrangements,primarily for our joint ventures.
The Company is involved in various claims, includingenvironmental matters, arising in the ordinary course ofbusiness. In the opinion of management, the ultimatedisposition of these matters, either individually or inaggregate, will not have a material adverse effect on theCompany’s financial position or results of operations.
18. BUSINESS SEGMENT AND GEOGRAPHICINFORMATION
We operate exclusively in the consumer foods industry, withmultiple operating segments organized generally byproduct categories.
We aggregate our operating segments into three reportablesegments: 1) U.S. Retail; 2) Bakeries and Foodservice; and3) International. Our U.S. Retail segment accounted forapproximately 70 percent of our fiscal 2004 net sales, andreflects business with a wide variety of grocery stores,specialty stores, drug and discount chains, and massmerchandisers operating throughout the United States. Ourmajor product categories in this business segment are ready-to-eat cereals, meals, refrigerated and frozen doughproducts, baking products, snacks, yogurt and organicfoods. Our Bakeries and Foodservice segment generatedapproximately 16 percent of fiscal 2004 net sales. This busi-ness segment consists of products marketed to retail andwholesale bakeries, and to commercial and noncommercial
foodservice distributors and operators throughout theUnited States and Canada. The remaining 14 percent ofour fiscal 2004 net sales was generated by our consolidatedInternational businesses. These include a retail business inCanada that largely mirrors our U.S. retail product mix,along with retail and foodservice businesses competing inkey markets in Europe, Latin America and the Asia/Pacificregion. At the beginning of fiscal 2003, the Lloyd’s foodser-vice and the bakery flour businesses were realigned from theU.S. Retail segment to the Bakeries and Foodservicesegment. All prior year amounts are restated for compara-tive purposes.
During fiscal 2004, one customer, Wal-Mart Stores, Inc.,accounted for approximately 14 percent of the Company’sconsolidated net sales and 19 percent of the Company’ssales in the U.S. Retail segment. No other customeraccounted for 10 percent or more of the Company’sconsolidated net sales. In the U.S. Retail and Bakeries andFoodservice segments, the top five customers accounted forapproximately 43 percent and 34 percent of fiscal 2004 netsales, respectively.
Management reviews operating results to evaluate segmentperformance. Operating profit for the reportable segmentsexcludes general corporate items, restructuring and otherexit costs, merger-related costs, interest expense and incometaxes, as they are centrally managed at the corporate leveland are excluded from the measure of segment profitabilityreviewed by the Company’s management. Under our supplychain organization, our manufacturing, warehouse, distribu-tion and sales activities are substantially integrated acrossour operations in order to maximize efficiency and produc-tivity. As a result, fixed assets, capital expenditures for long-lived assets, and depreciation and amortization expenses arenot maintained nor available by operating segment.
46
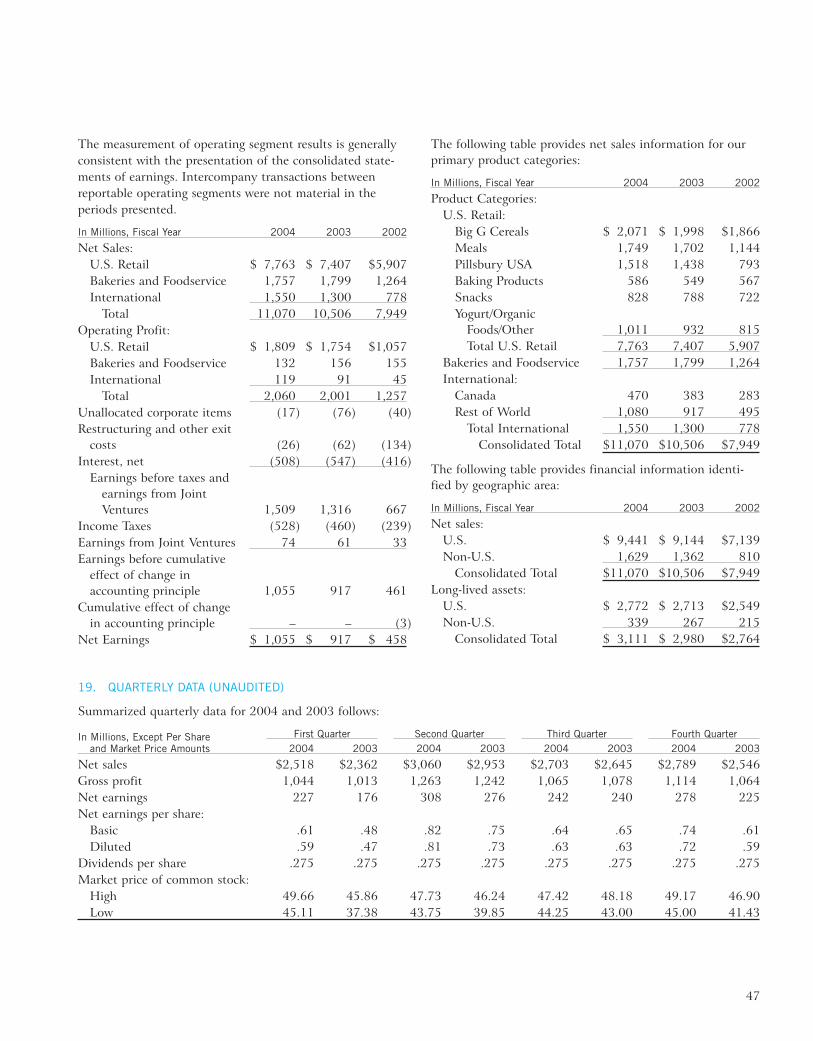
The measurement of operating segment results is generallyconsistent with the presentation of the consolidated state-ments of earnings. Intercompany transactions betweenreportable operating segments were not material in theperiods presented.
In Millions, Fiscal Year 2004 2003 2002
Net Sales:U.S. Retail $ 7,763 $ 7,407 $5,907Bakeries and Foodservice 1,757 1,799 1,264International 1,550 1,300 778
Total 11,070 10,506 7,949Operating Profit:
U.S. Retail $ 1,809 $ 1,754 $1,057Bakeries and Foodservice 132 156 155International 119 91 45
Total 2,060 2,001 1,257Unallocated corporate items (17) (76) (40)Restructuring and other exit
costs (26) (62) (134)Interest, net (508) (547) (416)
Earnings before taxes andearnings from JointVentures 1,509 1,316 667
Income Taxes (528) (460) (239)Earnings from Joint Ventures 74 61 33Earnings before cumulative
effect of change inaccounting principle 1,055 917 461
Cumulative effect of changein accounting principle – – (3)
Net Earnings $ 1,055 $ 917 $ 458
The following table provides net sales information for ourprimary product categories:
In Millions, Fiscal Year 2004 2003 2002
Product Categories:U.S. Retail:
Big G Cereals $ 2,071 $ 1,998 $1,866Meals 1,749 1,702 1,144Pillsbury USA 1,518 1,438 793Baking Products 586 549 567Snacks 828 788 722Yogurt/Organic
Foods/Other 1,011 932 815Total U.S. Retail 7,763 7,407 5,907
Bakeries and Foodservice 1,757 1,799 1,264International:
Canada 470 383 283Rest of World 1,080 917 495
Total International 1,550 1,300 778Consolidated Total $11,070 $10,506 $7,949
The following table provides financial information identi-fied by geographic area:
In Millions, Fiscal Year 2004 2003 2002
Net sales:U.S. $ 9,441 $ 9,144 $7,139Non-U.S. 1,629 1,362 810
Consolidated Total $11,070 $10,506 $7,949Long-lived assets:
U.S. $ 2,772 $ 2,713 $2,549Non-U.S. 339 267 215
Consolidated Total $ 3,111 $ 2,980 $2,764
19. QUARTERLY DATA (UNAUDITED)
Summarized quarterly data for 2004 and 2003 follows:
In Millions, Except Per Shareand Market Price Amounts
First Quarter Second Quarter Third Quarter Fourth Quarter2004 2003 2004 2003 2004 2003 2004 2003
Net sales $2,518 $2,362 $3,060 $2,953 $2,703 $2,645 $2,789 $2,546Gross profit 1,044 1,013 1,263 1,242 1,065 1,078 1,114 1,064Net earnings 227 176 308 276 242 240 278 225Net earnings per share:
Basic .61 .48 .82 .75 .64 .65 .74 .61Diluted .59 .47 .81 .73 .63 .63 .72 .59
Dividends per share .275 .275 .275 .275 .275 .275 .275 .275Market price of common stock:
High 49.66 45.86 47.73 46.24 47.42 48.18 49.17 46.90Low 45.11 37.38 43.75 39.85 44.25 43.00 45.00 41.43
47

ITEM 9 — Changes in and Disagreements with Accoun-tants on Accounting and Financial Disclosure.
No matters require disclosure here.
ITEM 9A — Controls and Procedures.
The Company, under the supervision and with the partici-pation of the Company’s management, including theCompany’s Chief Executive Officer and Chief FinancialOfficer, has evaluated the effectiveness of the design andoperation of the Company’s disclosure controls andprocedures. Based on that evaluation, the Chief ExecutiveOfficer and Chief Financial Officer have concluded that theCompany’s disclosure controls and procedures were effectiveas of May 30, 2004 to ensure that information requiredto be disclosed by the Company in reports that it filesor submits under the 1934 Act is recorded, processed,summarized and reported within the time periods specifiedin Securities and Exchange Commission rules and forms.
There were no changes in the Company’s internal controlover financial reporting during the Company’s fiscal fourthquarter ended May 30, 2004 that have materially affected,or are reasonably likely to materially affect, the Company’sinternal control over financial reporting.
PART II I
ITEM 10 — Directors and Executive Officers of the Registrant.
The information contained in the sections entitled“Nominees For the Board of Directors” and “Section 16(a):Beneficial Ownership Reporting Compliance” contained inCompany’s definitive Proxy Statement for its 2004 AnnualMeeting of Stockholders is incorporated herein by reference.
Information regarding the Company’s executive officers isset forth on page 5 through 6 of this report.
The information regarding the Company’s audit committee,including the members of the audit committee and auditcommittee financial experts, set forth in the section entitled“Board Committees and Their Functions” contained in theCompany’s definitive Proxy Statement for its 2004 AnnualMeeting of Stockholders is incorporated herein by reference.
On April 25, 2003, the Company adopted a Code ofConduct applicable to all employees, including the principalexecutive officer, principal financial officer and principalaccounting officer. A copy of the Code of Conduct is avail-able on the Company’s Web site at www.generalmills.com. TheCompany intends to post on its Web site any amendmentsto its Code of Conduct within two days of any such amend-ment and to post waivers from its Code of Conduct forprincipal officers within two days of any such waiver.
The Company’s Corporate Governance Principles, DirectorCode of Conduct and charters of the committees of theBoard of Directors are available on the Company’s Web siteat www.generalmills.com. Printed copies of such information isalso available to stockholders who request a copy by writingto: Company Secretary, General Mills, Inc., P.O. Box 1113,Minneapolis, MN 55440.
ITEM 11 — Executive Compensation.
The information contained in the sections entitled “Execu-tive Compensation” and “Director Compensation andBenefits” in the Registrant’s definitive Proxy Statement forits 2004 Annual Meeting of Stockholders is incorporatedherein by reference. The information appearing under theheading “Report of Compensation Committee on ExecutiveCompensation” is not incorporated herein.
ITEM 12 — Security Ownership of Certain BeneficialOwners and Management and RelatedStockholder Matters.
The information contained in the section entitled “StockOwnership of General Mills Directors, Officers and CertainBeneficial Owners” in the Registrant’s definitive Proxy State-ment for its 2004 Annual Meeting of Stockholders isincorporated herein by reference.
The following table provides information about GeneralMills common stock that may be issued upon the exercise ofstock options and vesting of stock units under all of theGeneral Mills’ equity compensation plans in effect as ofMay 30, 2004.
Plan category
Number ofsecurities to be
issued uponexercise ofoutstanding
options,warrants and
rights(a)
Weighted-averageexercise price of
outstandingoptions, warrants
and rights(b)
Number ofsecuritiesremaining
available forfuture issuance
under equitycompensation
plans(excludingsecurities
reflected in thefirst column)
(c)Equity
compensationplans approved bysecurity holders(1) 47,663,557 $36.12 9,710,278
Equitycompensationplans notapproved bysecurity holders(2) 23,005,894 $42.44 0
Total 70,669,451 $38.97 9,710,278
(1) Includes stock options and stock units granted under thefollowing shareholder-approved plans: 2003 Stock Compensa-
48

tion Plan, Executive Incentive Plan and 2001 CompensationPlan for Non-Employee Directors, and the followingshareholder-approved plans, which have been discontinued:Stock Option and Long-Term Incentive Plan of 1988, 1990Stock Plan for Non-Employee Directors, 1990 Salary Replace-ment Stock Option Plan, Stock Option and Long-TermIncentive Plan of 1993, 1995 Salary Replacement StockOption Plan, 1996 Compensation Plan for Non-EmployeeDirectors and 1998 Senior Management Stock Plan. Noawards may be granted under any of the discontinued plans.Column (a) includes 570,101 stock units granted to keyemployees under the following plans: 2003 Stock Compensa-tion Plan, Executive Incentive Plan and Stock Option andLong-Term Incentive Plan of 1993. Weighted average exerciseprices identified in column (b) do not take into accountrestricted stock units. Column (c) excludes restricted stockunits to be awarded under the Executive Incentive Plan. Theseamounts are tied to the amount of an executive’s incentiveaward, which is based on Company and individual perfor-mance. The Plan imposes a limit on the amount of anexecutive’s annual incentive award.
(2) Column (a) includes all employee stock option grants made toa broad group of employees in 1999 and 2002 as well as173,652 stock units granted to or deferred by employeesunder the 1998 Employee Stock Plan, which was discontinuedin September 2003. No future awards may be granted underthe 1998 Plan. Also includes stock units, less stock distribu-tions, which are attributable to (1) reinvested dividendequivalents paid on the stock units, (2) restricted stockgranted under various stock plans and deferred under theDeferred Compensation Plan, and (3) the Company’smatching contributions credited on deferred stock units, whichare equal to the value of the Company’s matching contribu-tions that would have otherwise been made to an employee’s401(k) Savings Plan account if the employee had not deferredreceipt of the Company’s common stock under the DeferredCompensation Plan.
1998 Employee Stock Plan. The 1998 Employee StockPlan became effective September 28, 1998 and was discon-tinued in September 2003. All employees of the Companywere eligible to receive grants of stock options, restrictedstock or restricted stock units under the Plan. Non-qualifiedstock options were available for grant under the Plan at anoption price that is 100% of the fair market value on thedate the option is granted. Stock options expire within10 years and one month following the grant date and gener-ally become exercisable in four years. Awards of restrictedstock and restricted stock units under the Plan were limitedto 15 percent of the authorized shares. The Plan containsprovisions covering the treatment of stock options, restrictedstock and stock units upon an employee’s resignation, retire-ment, or death, or in the event of a change of control of the
Company. Twenty-eight million shares were authorized forissuance under the Plan. The 2003 Stock CompensationPlan, which was approved by stockholders in September2003, replaced the 1998 Employee Stock Plan.
Deferred Compensation Plan. The Company’s DeferredCompensation Plan was approved by the CompensationCommittee of the Board of Directors and became effectiveon May 1, 1984. The Plan is a non-qualified compensationplan that provides for the deferral of cash incentives,common stock, restricted stock and restricted stock unitsissued under the Company’s stock plans. An employee canelect to defer up to 100 percent of annual incentivecompensation, receipt of shares of common stock resultingfrom a stock-for-stock exercise of stock options under theCompany’s stock option plans and shares of common stockattributable to nonvested restricted stock or restricted stockunits under the Company’s restricted stock plans. Certainkey and highly compensated management employees of theCompany are eligible to participate in the Plan.
Deferred Cash or Stock Unit Account. A deferredaccount is established for each participant making anelection to defer compensation whether based on cash orcommon stock. A participant’s deferred cash account iscredited monthly with a rate of return based on the invest-ment performance of participant-selected 401(k) SavingsPlan funds for the prior month. Dividend equivalentamounts can be paid out to the employee or credited to anemployee’s account to reflect dividends paid on theCompany’s common stock, based on the number of stockunits deferred and credited to an employee’s deferredaccount. The Company credits the deferred account of eachparticipant in the Plan with an additional amount, or in thecase of a stock unit account additional stock units, equal tothe value of the employer matching contributions that theCompany would have otherwise made to the participant’s401(k) Savings Plan account if the employee had notdeferred compensation under the Plan.
ITEM 13 — Certain Relationships and RelatedTransactions.
The information set forth in the section entitled “CertainRelationships and Transactions with Management”contained in the Registrant’s definitive Proxy Statement forits 2004 Annual Meeting of Stockholders is incorporatedherein by reference.
ITEM 14. — Principal Accounting Fees and Services.
The information contained in the section entitled“Independent Auditor Fees” in the Registrant’s definitiveProxy Statement for its 2004 Annual Meeting ofStockholders is incorporated herein by reference.
49
The Company’s Annual Report on Form 10-K for the fiscalyear ended May 30, 2004, at the time of its filing with theSecurities and Exchange Commission, shall modify andsupersede all prior documents filed pursuant to Sections 13,14 and 15(d) of the 1934 Act for purposes of any offers orsales of any securities after the date of such filing pursuantto any Registration Statement or Prospectus filed pursuantto the Securities Act of 1933 which incorporates byreference such Annual Report on Form 10-K.
PART IV
ITEM 15 — Exhibits, Financial Statement Schedules andReports on Form 8-K.
(a) 1. Financial Statements:
The following financial statements are included inthis report under Item 8:
Consolidated Statements of Earnings for the FiscalYears Ended May 30, 2004, May 25, 2003 andMay 26, 2002.
Consolidated Balance Sheets at May 30, 2004,and May 25, 2003.
Consolidated Statements of Cash Flows for theFiscal Years Ended May 30, 2004, May 25, 2003and May 26, 2002.
Consolidated Statements of Stockholders’ Equityfor the Fiscal Years Ended May 30, 2004, May 25,2003 and May 26, 2002.
Notes to Consolidated Financial Statements.
Report of Independent Registered PublicAccounting Firm.
2. Financial Statement Schedules:
For the Fiscal Years Ended May 30, 2004, May 25,2003 and May 26, 2002:
II – Valuation and Qualifying Accounts
3. Exhibits:
EXHIBITNO. DESCRIPTION
2.1 Agreement and Plan of Merger, dated as ofJuly 16, 2000, by and among the Registrant,General Mills North American Businesses, Inc.,Diageo plc and The Pillsbury Company(incorporated herein by reference to Exhibit10.1 to Registrant’s Report on Form 8-K filedJuly 20, 2000).
2.2 First Amendment, dated as of April 12, 2001, toAgreement and Plan of Merger, dated as ofJuly 16, 2000, by and among the Registrant,General Mills North American Businesses, Inc.,Diageo plc and The Pillsbury Company(incorporated herein by reference to Exhibit10.1 to Registrant’s Report on Form 8-K filedApril 13, 2001).
2.3 Second Amendment, dated as of October 31,2001, to Agreement and Plan of Merger, datedas of July 16, 2000, by and among theRegistrant, General Mills North AmericanBusinesses, Inc., Diageo plc and The PillsburyCompany (incorporated herein by reference toExhibit 10.1 to Registrant’s Report on Form8-K filed November 2, 2001).
3.1 Registrant’s Restated Certificate of Incor-poration, as amended to date (incorporatedherein by reference to Exhibit 3.1 toRegistrant’s Annual Report on Form 10-K filedfor the fiscal year ended May 26, 2002).
3.2 Registrant’s By-Laws, as amended to date.
4.1 Indenture between Registrant and U.S. BankTrust National Association (f.k.a. ContinentalIllinois National Bank and Trust Company ofChicago), as amended to date, by SupplementalIndentures Nos. 1 through 8 (incorporatedherein by reference to Exhibit 4.1 toRegistrant’s Annual Report on Form 10-K filedfor the fiscal year ended May 26, 2002).
4.2 Rights Agreement, dated as of December 11,1995, between Registrant and Wells FargoBank Minnesota, N.A. (f.k.a. Norwest BankMinnesota, N.A.) (incorporated herein byreference to Exhibit 1 to Registrant’sRegistration Statement on Form 8-A filedJanuary 2, 1996).
50

EXHIBITNO. DESCRIPTION
4.3 Indenture between Registrant and U.S. BankTrust National Association (f.k.a. First Trust ofIllinois, National Association) datedFebruary 1, 1996 (incorporated herein byreference to Exhibit 4.1 to Registrant’sRegistration Statement on Form S-3 effectiveFebruary 23, 1996).
4.4 Indenture between Ralcorp Holdings, Inc. andThe First National Bank of Chicago, assupplemented to date by the FirstSupplemental Indenture among RalcorpHoldings, Inc., Registrant and The FirstNational Bank of Chicago (incorporated hereinby reference to Exhibit 4.4 to Registrant’sAnnual Report on Form 10-K filed for the fiscalyear ended May 26, 2002).
4.5 Amendment No. 1, dated as of July 16, 2000, tothe Rights Agreement, dated as ofDecember 11, 1995, between Registrant andWells Fargo Bank Minnesota, N.A. (f.k.a.Norwest Bank Minnesota, N.A.) (incorporatedby reference to Exhibit 1 to Registrant’s Reporton Form 8-A/A dated July 25, 2000).
4.6 Indenture, dated as of October 28, 2002,between the Registrant and BNY MidwestTrust Company, as Trustee (incorporated hereinby reference to Exhibit 4.2 to Registrant’sReport on Form 8-K filed November 12, 2002).
4.7 Resale Registration Rights Agreement, datedOctober 28, 2002, among the Registrant, Bancof America Securities LLC and Morgan Stanley& Co. Incorporated, as Representatives of theseveral Initial Purchasers (incorporated hereinby reference to Exhibit 4.3 to Registrant’sReport on Form 8-K filed November 12, 2002).
4.8 Call Option Agreement, dated as of October 23,2002, by and between the Registrant andDiageo Midwest B.V. (incorporated herein byreference to Exhibit 4.4 to Registrant’s Reporton Form 8-K filed November 12, 2002).
4.9 Call Option Agreement, dated as of October 28,2002, by and between the Registrant andDiageo Midwest, B.V. (incorporated herein byreference to Exhibit 4.5 to Registrant’s Reporton Form 8-K filed November 12, 2002).
EXHIBITNO. DESCRIPTION
4.10 Form of 51⁄8% Note due 2007 (incorporatedherein by reference to Exhibit 4.1 toRegistrant’s Report on Form 8-K filedFebruary 21, 2002).
4.11 Form of 6% Note due 2012 (incorporated hereinby reference to Exhibit 4.2 to Registrant’sReport on Form 8-K filed February 21, 2002).
4.12 Form of Zero Coupon Convertible Debenturedue 2022 (incorporated herein by reference toExhibit 4.1 to Registrant’s Report on Form 8-Kfiled November 12, 2002).
10.1* Stock Option and Long-Term Incentive Plan of1988, as amended to date (incorporated hereinby reference to Exhibit 10.1 to Registrant’sAnnual Report on Form 10-K for the fiscal yearended May 30, 1999).
10.2 Addendum No. 3, effective as of March 15,1993, to Protocol of Cereal Partners Worldwide(incorporated herein by reference to Exhibit10.2 to Registrant’s Annual Report on Form10-K for the fiscal year ended May 28, 2000).
10.3* 1998 Employee Stock Plan, as amended to date(incorporated herein by reference to Exhibit10.3 to Registrant’s Annual Report on Form10-K filed for the fiscal year ended May 26,2002).
10.4* Amended and Restated Executive Incentive Plan,as amended to date (incorporated herein byreference to Exhibit 10.4 to Registrant’s AnnualReport on Form 10-K for the fiscal year endedMay 25, 2003).
10.5* Management Continuity Agreement, as amendedto date (incorporated herein by reference toExhibit 10.5 to Registrant’s Annual Report onForm 10-K for the fiscal year ended May 27,2001).
10.6* Supplemental Retirement Plan, as amended todate (incorporated herein by reference toExhibit 10.6 to Registrant’s Annual Report onForm 10-K for the fiscal year ended May 28,2000).
10.7* Executive Survivor Income Plan, as amended todate (incorporated herein by reference toExhibit 10.7 to Registrant’s Annual Report onForm 10-K for the fiscal year ended May 30,1999).
51

EXHIBITNO. DESCRIPTION
10.8* Executive Health Plan, as amended to date(incorporated herein by reference to Exhibit10.1 to Registrant’s Report on Form 10-Q forthe period ended February 24, 2002).
10.9* Supplemental Savings Plan, as amended to date(incorporated herein by reference to Exhibit10.9 to Registrant’s Annual Report on Form10-K for the fiscal year ended May 28, 2000).
10.10* 1996 Compensation Plan for Non-EmployeeDirectors, as amended to date (incorporatedherein by reference to Exhibit 10.10 toRegistrant’s Annual Report on Form 10-K forthe fiscal year ended May 30, 1999).
10.11* General Mills, Inc. 1995 Salary ReplacementStock Option Plan, as amended to date(incorporated herein by reference to Exhibit10.11 to Registrant’s Annual Report on Form10-K for the fiscal year ended May 28, 2000).
10.12* General Mills, Inc. Deferred Compensation Plan,as amended to date (incorporated herein byreference to Exhibit 10.12 to Registrant’sAnnual Report on Form 10-K for the fiscal yearended May 25, 2003).
10.13* Supplemental Benefits Trust Agreement, datedFebruary 9, 1987, as amended and restated asof September 26, 1988 (incorporated herein byreference to Exhibit 10.13 to Registrant’sAnnual Report on Form 10-K for the fiscal yearended May 30, 1999).
10.14* Supplemental Benefits Trust Agreement, datedSeptember 26, 1988 (incorporated herein byreference to Exhibit 10.14 to Registrant’sAnnual Report on Form 10-K for the fiscal yearended May 30, 1999).
10.15 Agreements, dated November 29, 1989, by andbetween General Mills, Inc. and Nestlé S.A.(incorporated herein by reference to Exhibit10.15 to Registrant’s Annual Report on Form10-K for the fiscal year ended May 28, 2000).
10.16 Protocol and Addendum No. 1 to Protocol ofCereal Partners Worldwide, datedNovember 21, 1989 (incorporated herein byreference to Exhibit 10.16 to Registrant’sAnnual Report on Form 10-K for the fiscal yearended May 27, 2001).
EXHIBITNO. DESCRIPTION
10.17* 1990 Salary Replacement Stock Option Plan, asamended to date (incorporated herein byreference to Exhibit 10.17 to Registrant’sAnnual Report on Form 10-K for the fiscal yearended May 30, 1999).
10.18 Addendum No. 2, dated March 16, 1993, toProtocol of Cereal Partners Worldwide.
10.19 Agreement, dated July 31, 1992, by and betweenGeneral Mills, Inc. and PepsiCo, Inc.
10.20* Stock Option and Long-Term Incentive Plan of1993, as amended to date (incorporated hereinby reference to Exhibit 10.20 to Registrant’sAnnual Report on Form 10-K for the fiscal yearended May 28, 2000).
10.21 Standstill Agreement with CPC International,Inc. dated October 17, 1994 (incorporatedherein by reference to Exhibit 10.21 toRegistrant’s Annual Report on Form 10-K forthe fiscal year ended May 28, 2000).
10.22* 1998 Senior Management Stock Plan, asamended to date (incorporated herein byreference to Exhibit 10.22 to Registrant’sAnnual Report on Form 10-K for the fiscal yearended May 25, 2003).
10.23* 2001 Compensation Plan for Non-employeeDirectors, as amended to date (incorporatedherein by reference to Exhibit 10.23 toRegistrant’s Annual Report on Form 10-K forthe fiscal year ended May 25, 2003).
10.24 Stockholders Agreement, dated as ofOctober 31, 2001, by and among theRegistrant, Diageo plc and Gramet HoldingsCorp. (incorporated herein by reference toExhibit 10.2 to Registrant’s Report on Form8-K filed November 2, 2001).
10.25 First Amendment to Stockholders Agreement,dated as of October 28, 2002, among theRegistrant, Gramet Holdings Corp. and Diageoplc (incorporated herein by reference to Exhibit10.1 to Registrant’s Report on Form 8-K filedNovember 12, 2002).
10.26 Second Amendment to Stockholders Agreement,dated as of June 23, 2004, among theRegistrant, Diageo plc and Diageo AtlanticHolding B.V. (incorporated herein by referenceto Exhibit 99.2 to Registrant’s Report on Form8-K filed June 23, 2004).
52

EXHIBITNO. DESCRIPTION
10.27 Supplemental Marketing Agreement and Waiver,dated as of June 23, 2004, among theRegistrant, Diageo plc and Diageo AtlanticHolding B.V. (incorporated herein by referenceto Exhibit 4.8 to Registrant’s Form S-3Registration Statement filed June 23, 2004(File no. 333-116779)).
10.28* 2003 Stock Compensation Plan (incorporatedherein by reference to Exhibit 4 to Registrant’sForm S-8 Registration Statement (File no.333-109050)).
12 Statement of Ratio of Earnings to Fixed Charges.
21 List of Subsidiaries of General Mills, Inc.
23 Consent of Independent Registered PublicAccounting Firm.
31.1 Certification of Chief Executive Officer requiredby Securities and Exchange Commission Rule13a-14(a) or 15d-14(a).
31.2 Certification of Chief Financial Officer requiredby Securities and Exchange Commission Rule13a-14(a) or 15d-14(a).
32.1 Certification of Chief Executive Officer pursuantto Section 906 of the Sarbanes-Oxley Act of2002, 18 U.S.C. Section 1350.
32.2 Certification of Chief Financial Officer pursuantto Section 906 of the Sarbanes-Oxley Act of2002, 18 U.S.C. Section 1350.
99.1 Five-Year Credit Agreement, dated as ofJanuary 24, 2001, among the Registrant, TheChase Manhattan Bank, as AdministrativeAgent, and the other financial institutionsparty hereto (incorporated by reference toExhibit 99.2 to Registrant’s Quarterly Reporton Form 10-Q for the period endedFebruary 25, 2001).
99.2 Amendment No. 1, dated as of October 31,2001, to Five-Year Credit Agreement, dated asof January 24, 2001, among the Registrant,The Chase Manhattan Bank, as AdministrativeAgent, and the other financial institutionsparty thereto (incorporated herein by referenceto Exhibit 99.3 to Registrant’s Report on Form8-K filed February 4, 2002).
EXHIBITNO. DESCRIPTION
99.3 Amendment No. 2, dated August 26, 2002, toFive-Year Credit Agreement, dated January 24,2001, among the Company, JPMorgan ChaseBank (successor to The Chase ManhattanBank), as Administrative Agent, and the otherfinancial institutions party thereto(incorporated herein by reference to Exhibit99.1 to Registrant’s Quarterly Report on Form10-Q for the period ended August 25, 2002).
99.4 Amendment No. 3, dated as of January 16,2004, to Five-Year Credit Agreement, dated asof January 24, 2001, among the Company,JPMorgan Chase Bank, as AdministrativeAgent, and the other financial institutionsparty thereto (incorporated herein by referenceto Exhibit 99.1 to Registrant’s Report on Form8-K filed February 12, 2004).
99.5 Five-Year Credit Agreement, dated as ofJanuary 20, 2004, among the Registrant,JPMorgan Chase Bank, as AdministrativeAgent, and the other financial institutionsparty thereto (incorporated by reference toExhibit 99.2 to Registrant’s Report on Form8-K filed February 12, 2004).
*Items that are management contracts or compensatory plans orarrangements required to be filed as exhibits pursuant to Item 15(c)of Form 10-K.
The Registrant agrees to furnish copies of any instrumentsdefining the rights of holders of long-term debt of the Regis-trant and its consolidated subsidiaries to the Securities andExchange Commission upon request.
(b) Reports on Form 8-K.
On March 16, 2004, the Registrant furnished a Report onForm 8-K attaching a press release announcing its financialresults for the third quarter ended February 22, 2004.
On April 9, 2004, the Registrant filed a Report on Form 8-Kattaching a press release regarding a “mini-tender” offer forits shares.
53

SIGNATURES
Pursuant to the requirements of Section 13 or 15(d) of the Securities Exchange Act of 1934, the Registrant has duly causedthis report to be signed on its behalf by the undersigned, thereunto duly authorized.
GENERAL MILLS, INC.
Dated: July 29, 2004
By: /s/ S. S. MARSHALLS. S. MarshallSenior Vice President, Corporate Affairs,General Counsel and Secretary
Pursuant to the requirements of the Securities Exchange Act of 1934, this report has been signed below by the followingpersons on behalf of the Registrant and in the capacities and on the dates indicated.
Signature Title Date
/s/ STEPHEN R. DEMERITT(Stephen R. Demeritt)
DirectorVice Chairman
July 23, 2004
/s/ L. DE SIMONE(Livio D. DeSimone)
Director July 28, 2004
/s/ W.T. ESREY(William T. Esrey)
Director July 26, 2004
/s/ R.V. GILMARTIN(Raymond V. Gilmartin)
Director July 27, 2004
/s/ JUDITH RICHARDS HOPE(Judith R. Hope)
Director July 24, 2004
/s/ ROBERT L. JOHNSON(Robert L. Johnson)
Director July 26, 2004
/s/ HEIDI G. MILLER(Heidi G. Miller)
Director July 29, 2004
/s/ HILDAOCHOA-BRILLEMBOURG(Hilda Ochoa-Brillembourg)
Director July 23, 2004
/s/ MICHAEL D. ROSE(Michael D. Rose)
Director July 29, 2004
/s/ S.W. SANGER(Stephen W. Sanger)
Chairman of the Board and Chief Executive Officer(Principal Executive Officer)
July 22, 2004
/s/ A. MICHAEL SPENCE(A. Michael Spence)
Director July 24, 2004
54

Signature Title Date
/s/ DOROTHY A. TERRELL(Dorothy A. Terrell)
Director July 29, 2004
/s/ R.G. VIAULT(Raymond G. Viault)
DirectorVice Chairman
July 27, 2004
/s/ JAMES A. LAWRENCE(James A. Lawrence)
Executive Vice President, Chief Financial Officer(Principal Financial Officer)
July 28, 2004
/s/ KENNETH L. THOME(Kenneth L. Thome)
Senior Vice President, Financial Operations(Principal Accounting Officer)
July 29, 2004
55

GENERAL MILLS, INC.SCHEDULE IIVALUATION AND QUALIFYING ACCOUNTS(in millions)
Year endedMay 30,2004
May 25,2003
May 26,2002
Allowance for possible losses on accounts receivable:Balance at beginning of year $ 28 $ 21 $ 6Additions charged to expense 3 8 3Additions from acquisitions – – 15Bad debt write-offs (13) (6) (2)Other adjustments and reclassifications 1 5 (1)Balance at end of year $ 19 $ 28 $ 21
Valuation allowance for deferred tax assets:Balance at beginning of year $791 $ 10 $ 3Additions charged to expense and deferred tax asset 34 – 7Additions from acquisitions – 781 –Adjustments to acquisition amounts (16) — —Balance at end of year $809 $ 791 $ 10
Reserve for restructuring and other exit charges:Balance at beginning of year $ 37 $ 107 $ 9Additions charged to expense 26 62 134Net amounts utilized for restructuring activities (40) (132) (36)Balance at end of year $ 23 $ 37 $107
Reserve for LIFO valuationBalance at beginning of year $ 27 $ 31 $ 30Increment (Decrement) 14 (4) 1Balance at end of year $ 41 $ 27 $ 31
56
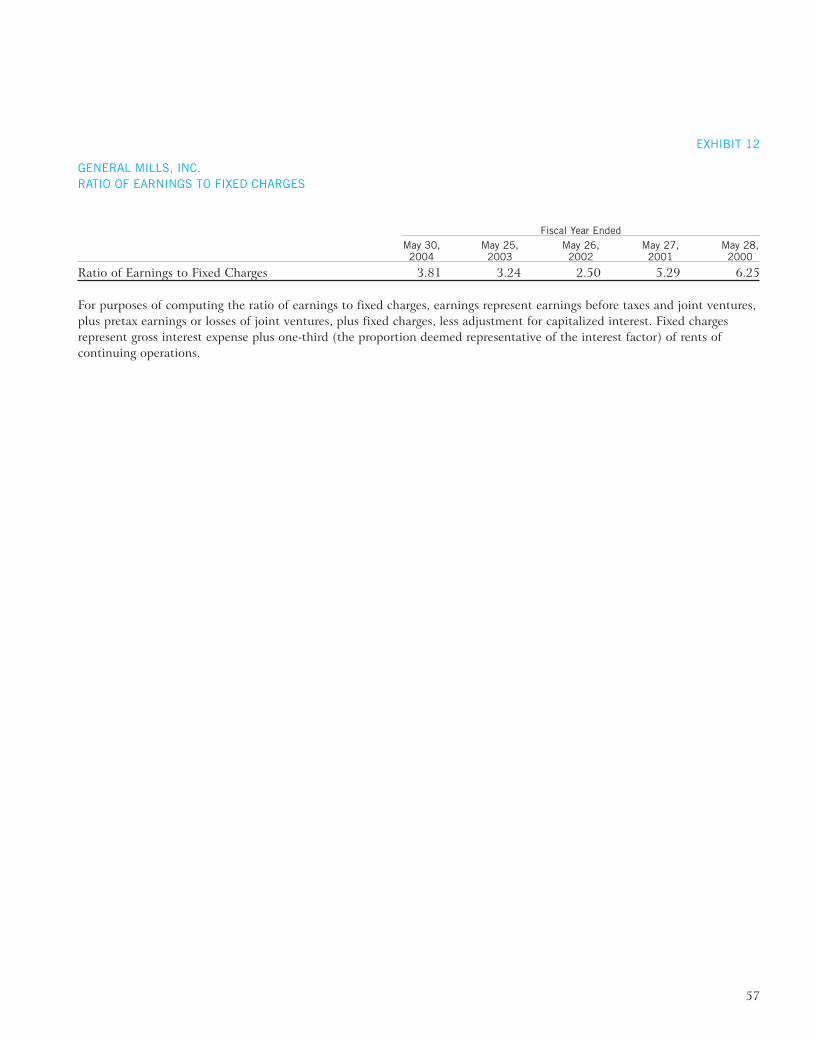
EXHIBIT 12
GENERAL MILLS, INC.RATIO OF EARNINGS TO FIXED CHARGES
Fiscal Year EndedMay 30,2004
May 25,2003
May 26,2002
May 27,2001
May 28,2000
Ratio of Earnings to Fixed Charges 3.81 3.24 2.50 5.29 6.25
For purposes of computing the ratio of earnings to fixed charges, earnings represent earnings before taxes and joint ventures,plus pretax earnings or losses of joint ventures, plus fixed charges, less adjustment for capitalized interest. Fixed chargesrepresent gross interest expense plus one-third (the proportion deemed representative of the interest factor) of rents ofcontinuing operations.
57
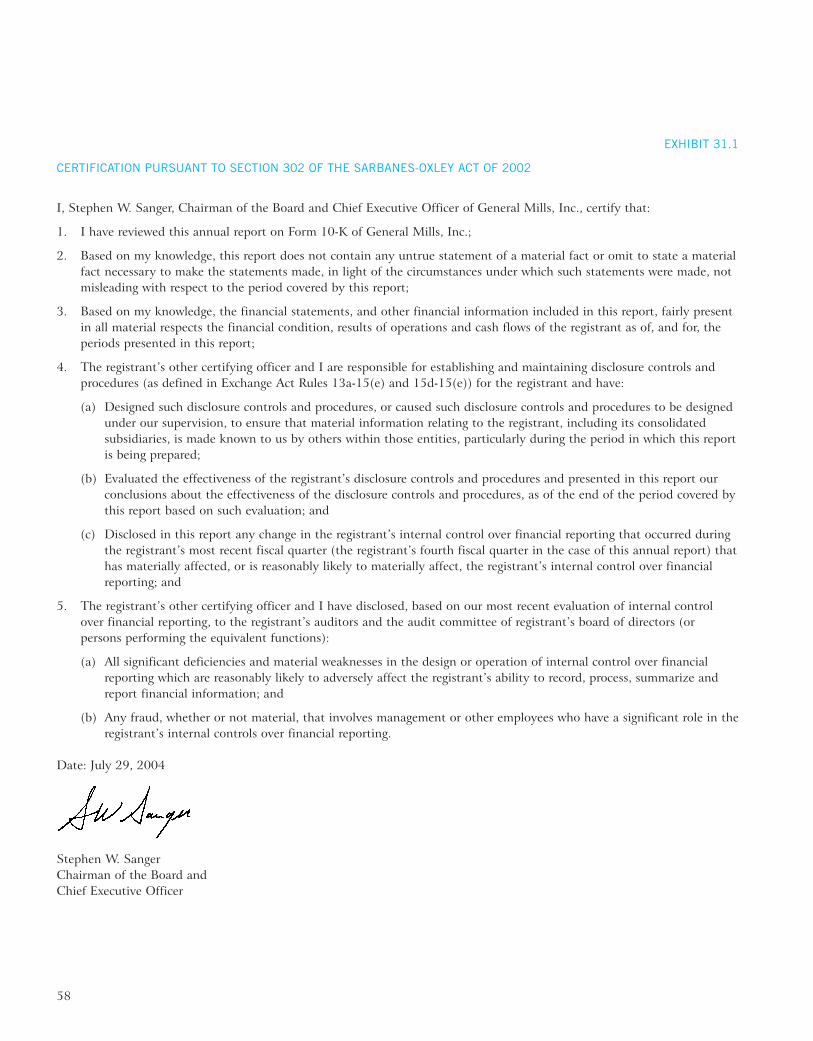
EXHIBIT 31.1
CERTIFICATION PURSUANT TO SECTION 302 OF THE SARBANES-OXLEY ACT OF 2002
I, Stephen W. Sanger, Chairman of the Board and Chief Executive Officer of General Mills, Inc., certify that:
1. I have reviewed this annual report on Form 10-K of General Mills, Inc.;
2. Based on my knowledge, this report does not contain any untrue statement of a material fact or omit to state a materialfact necessary to make the statements made, in light of the circumstances under which such statements were made, notmisleading with respect to the period covered by this report;
3. Based on my knowledge, the financial statements, and other financial information included in this report, fairly presentin all material respects the financial condition, results of operations and cash flows of the registrant as of, and for, theperiods presented in this report;
4. The registrant’s other certifying officer and I are responsible for establishing and maintaining disclosure controls andprocedures (as defined in Exchange Act Rules 13a-15(e) and 15d-15(e)) for the registrant and have:
(a) Designed such disclosure controls and procedures, or caused such disclosure controls and procedures to be designedunder our supervision, to ensure that material information relating to the registrant, including its consolidatedsubsidiaries, is made known to us by others within those entities, particularly during the period in which this reportis being prepared;
(b) Evaluated the effectiveness of the registrant’s disclosure controls and procedures and presented in this report ourconclusions about the effectiveness of the disclosure controls and procedures, as of the end of the period covered bythis report based on such evaluation; and
(c) Disclosed in this report any change in the registrant’s internal control over financial reporting that occurred duringthe registrant’s most recent fiscal quarter (the registrant’s fourth fiscal quarter in the case of this annual report) thathas materially affected, or is reasonably likely to materially affect, the registrant’s internal control over financialreporting; and
5. The registrant’s other certifying officer and I have disclosed, based on our most recent evaluation of internal controlover financial reporting, to the registrant’s auditors and the audit committee of registrant’s board of directors (orpersons performing the equivalent functions):
(a) All significant deficiencies and material weaknesses in the design or operation of internal control over financialreporting which are reasonably likely to adversely affect the registrant’s ability to record, process, summarize andreport financial information; and
(b) Any fraud, whether or not material, that involves management or other employees who have a significant role in theregistrant’s internal controls over financial reporting.
Date: July 29, 2004
Stephen W. SangerChairman of the Board andChief Executive Officer
58

EXHIBIT 31.2
CERTIFICATION PURSUANT TO SECTION 302 OF THE SARBANES-OXLEY ACT OF 2002
I, James A. Lawrence, Chief Financial Officer of General Mills, Inc., certify that:
1. I have reviewed this annual report on Form 10-K of General Mills, Inc.;
2. Based on my knowledge, this report does not contain any untrue statement of a material fact or omit to state a materialfact necessary to make the statements made, in light of the circumstances under which such statements were made, notmisleading with respect to the period covered by this report;
3. Based on my knowledge, the financial statements, and other financial information included in this report, fairly presentin all material respects the financial condition, results of operations and cash flows of the registrant as of, and for, theperiods presented in this report;
4. The registrant’s other certifying officer and I are responsible for establishing and maintaining disclosure controls andprocedures (as defined in Exchange Act Rules 13a-15(e) and 15d-15(e)) for the registrant and have:
(a) Designed such disclosure controls and procedures, or caused such disclosure controls and procedures to be designedunder our supervision, to ensure that material information relating to the registrant, including its consolidatedsubsidiaries, is made known to us by others within those entities, particularly during the period in which this reportis being prepared;
(b) Evaluated the effectiveness of the registrant’s disclosure controls and procedures and presented in this report ourconclusions about the effectiveness of the disclosure controls and procedures, as of the end of the period covered bythis report based on such evaluation; and
(c) Disclosed in this report any change in the registrant’s internal control over financial reporting that occurred duringthe registrant’s most recent fiscal quarter (the registrant’s fourth fiscal quarter in the case of this annual report) thathas materially affected, or is reasonably likely to materially affect, the registrant’s internal control over financialreporting; and
5. The registrant’s other certifying officer and I have disclosed, based on our most recent evaluation of internal controlover financial reporting, to the registrant’s auditors and the audit committee of registrant’s board of directors (orpersons performing the equivalent functions):
(a) All significant deficiencies and material weaknesses in the design or operation of internal control over financialreporting which are reasonably likely to adversely affect the registrant’s ability to record, process, summarize andreport financial information; and
(b) Any fraud, whether or not material, that involves management or other employees who have a significant role in theregistrant’s internal controls over financial reporting.
Date: July 29, 2004
James A. LawrenceChief Financial Officer
59

EXHIBIT 32.1
CERTIFICATION OF PERIODIC REPORT
I, Stephen W. Sanger, Chairman of the Board and Chief Executive Officer of General Mills, Inc. (the “Company”), certify,pursuant to Section 906 of the Sarbanes-Oxley Act of 2002, 18 U.S.C. Section 1350, that:
(1) the Annual Report on Form 10-K of the Company for the fiscal year ended May 30, 2004 (the “Report”) fullycomplies with the requirements of Section 13(a) or 15(d) of the Securities Exchange Act of 1934 (15 U.S.C. 78m or78o(d)); and
(2) the information contained in the Report fairly presents, in all material respects, the financial condition and results ofoperations of the Company.
Dated: July 29, 2004
Stephen W. SangerChairman of the Board andChief Executive Officer
EXHIBIT 32.2
CERTIFICATION OF PERIODIC REPORT
I, James A. Lawrence, Chief Financial Officer of General Mills, Inc. (the “Company”), certify, pursuant to Section 906 of theSarbanes-Oxley Act of 2002, 18 U.S.C. Section 1350, that:
(1) the Annual Report on Form 10-K of the Company for the fiscal year ended May 30, 2004 (the “Report”) fullycomplies with the requirements of Section 13(a) or 15(d) of the Securities Exchange Act of 1934 (15 U.S.C. 78m or78o(d)); and
(2) the information contained in the Report fairly presents, in all material respects, the financial condition and results ofoperations of the Company.
Dated: July 29, 2004
James A. LawrenceChief Financial Officer
60