Embed Size (px)
Citation preview

Secure Income REIT Plc
Interim Results Presentation
7 September 2018
www.SecureIncomeREIT.co.uk

2
Secure Income REIT Plc is a specialist UK REIT, investing in key operating real
estate assets that provide long term rental income with inflation protection.
It owns a 177 property, £2.3 billion portfolio at 30 June 2018 external valuation.
High quality assets are let to financially strong businesses in defensive
sectors on leases with a 21.4 year weighted average unexpired term.
The company has a highly experienced Board and a management team with
very close shareholder alignment through one of the largest shareholdings in
the sector.
An investment in the Company offers secure, growing income streams and
strong foundations for sustainable capital growth, while continuing to deliver
attractive risk adjusted returns for shareholders over the long term.

1. Introduction
2. June 2018 interim results
3. Portfolio update and market outlook
4. Q&A
Warwick Castle
4
Highlights for the Six Months to 30 June 2018
Operating highlights:
▪ £436m acquisition of two off market portfolios during the period:
▪ £212m hotels portfolio – completed 24 April 2018
▪ £224m leisure portfolio – completed 2 July 2018
▪ financed by £315.5m equity issue (365p/share) and £128.7m new secured debt facilities at c. 30% LTC
▪ Annualised dividend yield (post acquisitions) on EPRA NAV up from 3.9% to 4.1%
▪ Continuing to deliver strong returns with EPRA NAV per share up 3.2%: TAR at 4.9% and TSR at 8.1% over the
six month period
▪ Portfolio further diversified from 81 assets to 177 assets and from valuation of £1.8bn to £2.3bn
▪ WAULT remains one of the longest in the sector at 21.4 years with no breaks
▪ Predictable long term growth prospects underpinned by long leases with upward only uplifts: 48% fixed uplifts,
52% RPI
▪ LTV continues to reduce – net LTV 44.4% (down from 49.6%), continuing downwards trajectory
Well placed to continue to deliver attractive returns & still ambitious for further returns enhancing growth

30 June 2018 Financial Highlights
5
30 June 2018 31 December 2017 % change
• Net Assets £1,218.9m £860.6m ↑ 41.6%
• EPRA Net Asset Value £1,229.8m £870.8m ↑ 41.2%
• EPRA Net Asset Value per share 382.4p 370.4p ↑ 3.2%
• Net LTV 1 44.4% 49.6% ↓ 10.5%
• Portfolio net initial yield 5.2% 5.1%
30 June 2018 30 June 2017 % change
• Annualised passing rent £124.5m £95.2m ↑ 30.8%
• Adjusted EPRA EPS2
6.2p 6.7p ↓ 7.5%2
• Dividends per share 2 6.0p 6.6p ↓ 9.1%2
• Latest DPS annualised as a percentage of
EPRA NAV4.1% 3.9% ↑ 5.1%
1 Pro forma adjusted for the 2 July 2018 completion of the £224m leisure portfolio
2 The reduction in EPS and DPS in the period reflects three months between the placing to raise £315.5m following exchange of contracts and full
deployment of funds on 2 July on completion of the acquisitions.

EPRA NAV progression
6
Oversubscribed
placing to raise
£315.5m

EPRA NAV per share progression
7
0TAR: 4.9%
TSR: 8.1%
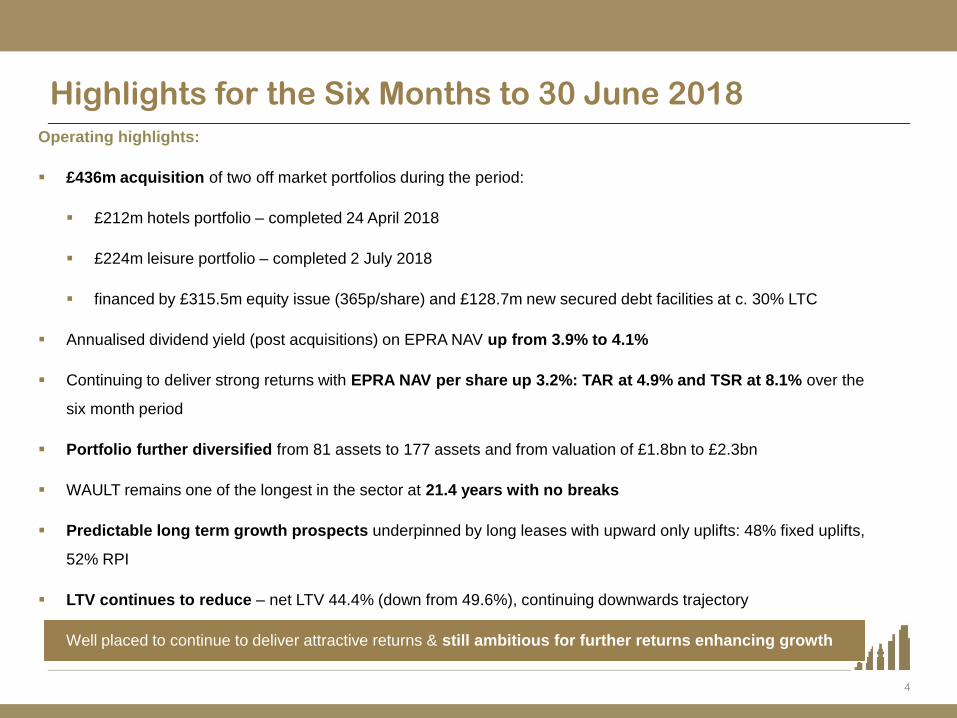
Adjusted EPRA Earnings
8
Six months to June 2018 Six months to June 2017
£m Pence £m Pence
Net rent:
Like for like portfolio 47.9 17.1 46.5 20.3
April 2018 Hotels portfolio 2.4 0.7 - -
Net finance costs
Like for like portfolio (25.0) (8.8) (25.2) (10.9)
£59.2m new hotels facility (0.4) (0.1) - -
Admin & corporate costs (7.3) (2.6) (5.7) (2.5)
Tax (0.3) (0.2) (0.2) (0.1)
Incentive fee accrual - - (3.5) (1.5)
Adjusted EPRA Earnings 17.3 6.2 * 15.3 6.7
* Impact of c. 3 months between completion of placing and full deployment of equity issue reflected in
modest dilution of results in the period. All earnings from new acquisitions fully on stream in second
half
▪ 2.4% rental uplifts on portfolio held through the period
▪ Positive contribution from acquisition to continue in second half reflecting full deployment of funds
▪ Fully covered quarterly dividends driven by rents with in-built uplifts providing inflation protection

▪ Reduction in net LTV from 49.6% to 44.4% over the period
▪ Six ring fenced facilities with substantial headroom & flexibility on financial covenants
▪ valuation headroom on default tests in all cases >32% and ICR default headroom > 31%
▪ all facilities have cash cure rights: c.£60m uncommitted cash available for cures if needed
▪ Weighted average term to debt maturity 5.9 years from 30 June 2018 – first expiry in four years’ time
▪ Weighted average cost c. 4.85% p.a.
▪ Interest cover 2.4x1 up from 2.0x1 at 31 December 2017
▪ On base case assumptions2 net LTV expected to further reduce to c. 38% at June 2023
Financing
9
Illustrative Portfolio Valuation and Net LTV at Constant Valuation Yield 2
1 calculated as current passing rent divided by annualised interest cost as at the balance sheet date
2 See assumptions on page 22
There is no certainty that these illustrative projections will be achieved
2,253.5
2,612.0
44.4%
37.8%37 %
38 %
39 %
40 %
41 %
42 %
43 %
44 %
45 %
1,6001,7001,8001,9002,0002,1002,2002,3002,4002,5002,6002,700
Jun-18 Jun-19 Jun-20 Jun-21 Jun-22 Jun-23
% L
TV
£m
Gro
ss A
sse
t V
alu
e
Portfolio Valuation (£m) Net LTV (%)

3
10
Thorpe Park
Portfolio Update and Market Outlook
11
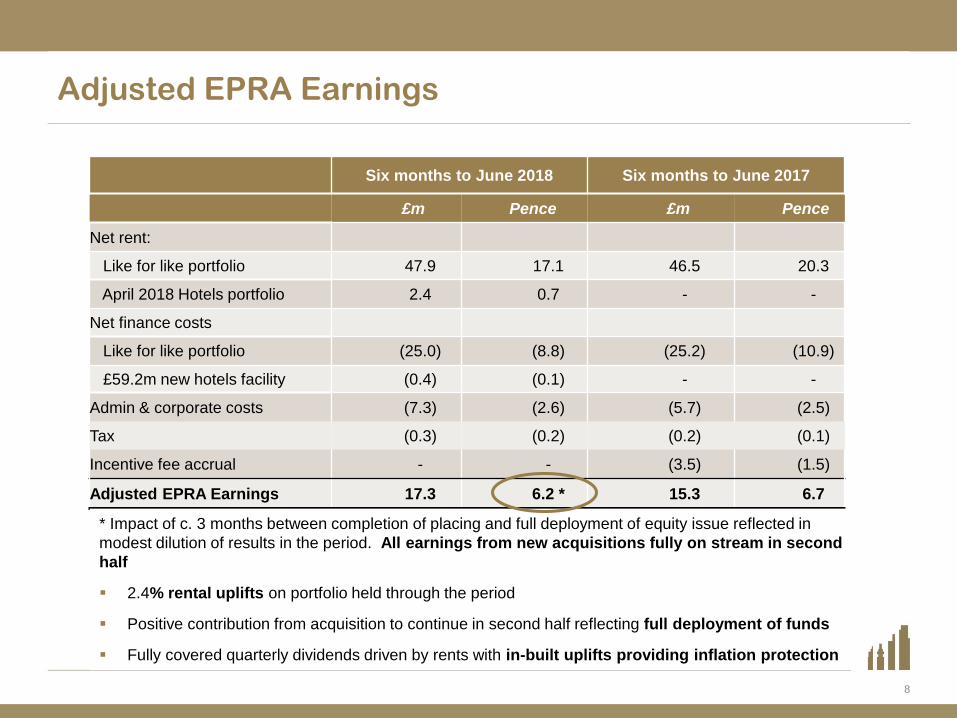
27% Increase in Investment Property
The Arena
Martin House – Part Basement
Manchester Victoria Station Car Park
5.1% Net Initial Yield 5.2%
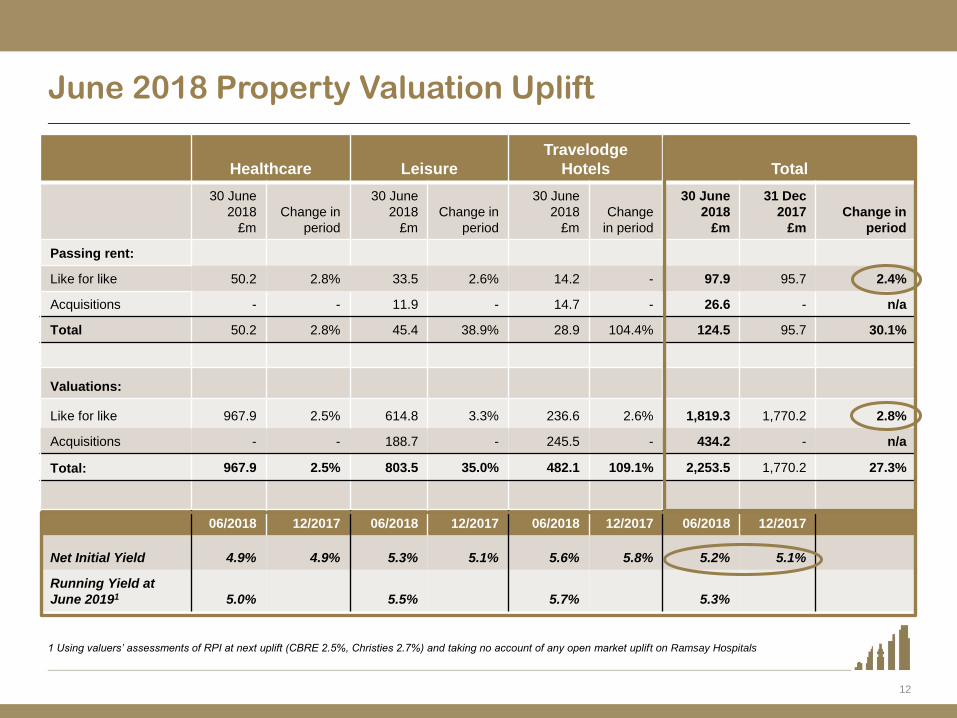
June 2018 Property Valuation Uplift
12
Healthcare Leisure
Travelodge
Hotels Total
30 June
2018
£m
Change in
period
30 June
2018
£m
Change in
period
30 June
2018
£m
Change
in period
30 June
2018
£m
31 Dec
2017
£m
Change in
period
Passing rent:
Like for like 50.2 2.8% 33.5 2.6% 14.2 - 97.9 95.7 2.4%
Acquisitions - - 11.9 - 14.7 - 26.6 - n/a
Total 50.2 2.8% 45.4 38.9% 28.9 104.4% 124.5 95.7 30.1%
Valuations:
Like for like 967.9 2.5% 614.8 3.3% 236.6 2.6% 1,819.3 1,770.2 2.8%
Acquisitions - - 188.7 - 245.5 - 434.2 - n/a
Total: 967.9 2.5% 803.5 35.0% 482.1 109.1% 2,253.5 1,770.2 27.3%
06/2018 12/2017 06/2018 12/2017 06/2018 12/2017 06/2018 12/2017
Net Initial Yield 4.9% 4.9% 5.3% 5.1% 5.6% 5.8% 5.2% 5.1%
Running Yield at
June 20191 5.0% 5.5% 5.7% 5.3%
1 Using valuers’ assessments of RPI at next uplift (CBRE 2.5%, Christies 2.7%) and taking no account of any open market uplift on Ramsay Hospitals

13
Healthcare: £968m, 43% of total portfolio value
◼ 19 private hospitals valued at £918.3m at 30 June 2018
generating £48.2m of passing rent
◼ Let on individual fully repairing and insuring leases with a
term to expiry of 18.9 years at June 2018 without break
clauses
◼ Rent increases by at least 2.75% p.a. throughout the lease term
in May each year
◼ Guaranteed by Ramsay Health Care Limited, one of the top
five private hospital operators in the world, an ASX 50 company
with a market capitalisation of £6.2bn
Ramsay
Healthcare Portfolio Net Initial Yield of 4.9% as at
30 June 2018
◼ Let to a UK subsidiary of Groupe Sinoué on a fully repairing
and insuring lease for 26.1 years
◼ Central London’s only private psychiatric hospital – located in
Lisson Grove, near Marylebone station
◼ Rent increase of 3.0% in May each year
◼ Valued at £49.7m at 30 June 2018 generating £2.0m of
passing rent
◼ Guaranteed by Orpea SA, mental health and aged care
specialists, listed on Euronext with £6.7bn market capitalisation
Nightingale Hospital, London
Location (by value)
South East56%
North West12%
South West11%
Midlands9%
North8%
West Midlands4%

14
Leisure: £803m, 36% of total portfolio value
◼ Valued at £803.5m1
at 30 June 2018 valuation generating £45.4m
of passing rent2.
• Merlin Theme Parks
• Manchester Arena complex
• The Brewery, Chiswell Street
• 18 Stonegate Pubs
◼ Individual fully repairing and insuring leases with weighted
average unexpired lease term of 22.5 years
◼ Merlin – Theme Parks
• 74% (£33.5m) of leisure portfolio rent - guaranteed by Merlin
Entertainments Plc: FTSE 250 company with £3.9bn market
capitalisation
• Second largest visitor attractions company in the world and
largest in Europe
• Alton Towers Park and Hotel, Thorpe Park, Warwick Castle
and Heide Park and Hotel
◼ SMG – Manchester Arena
• 8% (£3.8m) of leisure portfolio rent - guaranteed by SMG, the
worlds largest venue management company with 239 venues
globally and 16m annual ticket sales
• 25 years of uninterrupted EBITDA growth averaging 8% p.a.
1 Includes £111.0m of German assets valued in Euros and translated at €1 : £0.8843
2 Includes £6.3m of rent from German assets denominated in Euros and translated at €1 : £0.8843
Leisure Portfolio Net Initial Yield of 5.3% as at 30 June 2018
Sub-sector (by value)
Theme Parks63%
Theme Park
Hotels13%
Manchester Arena13%
The Brewery
7%
Pubs4%
Rent review profile (by rent)
RPI -annual68%
Fixed Uplifts21%
RPI - 5 yearly7%
RPI - 3 yearly3%
OMR1%

Hotels: £482m, 21% of total portfolio value
15
Location (by value) ◼ Valued at £482.1m at 30 June 2018 valuation generating £28.9m of
passing rent
▪ 131 Hotels with 6,891 rooms
− Top three assets in Manchester, Oxford & Edinburgh:
average lot size £22.5m
− Remaining 128 properties: average lot size £3.2m
− Average rent of £4,179 per room including City Centre sites
◼ 23.9 year weighted average unexpired lease term
− no unexpired lease shorter than 20 years
− no break clauses
◼ Five yearly upwards only uncapped RPI rent reviews
◼ Each hotel let to Travelodge Hotels Ltd – one of the UK’s leading hotel
brands with c. 19m customers. Trading in the UK, Ireland and Spain with
564 hotels and over 42,000 rooms.
◼ Travelodge results to 27 June 2018 for H1 2018
• Revenue up 8% to £317.2m
• EBITDAR up £1.3m to £43.3m
• LFL RevPar up 3.1%
• LFL Occupancy up 2.1%
Hotel Portfolio Net Initial Yield of 5.6% as at 30 June 2018
South East32%
South West14%
Scotland & Wales14%
North West12%
East Midlands
9%
West Midlands
9%
North6%
East4%
Tenure (by value)
Freehold or Virtual
Freehold69%
Leasehold16%
Short Leasehold*
15%
* Leases with sub 80 years unexpired

RPI-linked reviews
52%
Fixed Uplifts48%
Review Type by Rent
16
Portfolio Data
The Arena
Martin House – Part Basement
Manchester Victoria Station Car Park
RPI-linked reviews:
Hotels 23%
UK Theme Parks 22%
Arena 5%
Pubs 2%
Fixed reviews:
Hospitals 40%
German Theme Parks 5%
The Brewery 3%
Ramsay Health Care
Limited39%
Merlin Entertainments Plc
27%
Travelodge Hotels Limited
23%
Other6%
SMG3%
Orpea SA2%
Covenant by Rent

17
LIMITED STOCK AVAILABILITY
ONLY 5% OF NEW LEASES ARE GRANTED
FOR MORE THAN 15 YEARS
STRONG COVENANTS CAN RAISE MONEY
MORE CHEAPLY VIA THE BOND MARKET
WEAKER COVENANTS CAN SECURE LOWER
YIELDS VIA GROUND LEASE DEALS
EXISTING OWNERS ARE RELUCTANT TO SELL
GIVEN THE DIFFICULTY OF REPLACING
STOCK
STRONG INVESTOR DEMAND
YIELD PREMIUM OVER GILTS, INDEX-LINKED
GILTS AND COST OF DEBT REMAINS
ATTRACTIVE
INSTITUTIONAL INVESTORS WISH TO MATCH
THEIR LIABILITIES WITH LONG-DATED INDEX-
LINKED CASHFLOWS
DEDICATED LONG-INCOME FUNDS HAVE
SIGNIFICANT UNMET DEMAND WITH
INVESTOR WAITING LISTS
UK INSTITUTIONS CONTINUE TO REBALANCE
PROPERTY PORTFOLIOS SELLING RETAIL &
LONDON OFFICES AND BUYING SHEDS &
ALTERNATIVES
STRONG MARKET FUNDAMENTALS ARE UNCHANGED
IN 2017 ALTERNATIVES HAD A 34% INVESTMENT MARKET SHARE -
GREATER THAN THE COMBINED MARKET SHARE OF RETAIL AND INDUSTRIAL

18
Illustrative Distribution Outlook
▪ Pay-out ratio of 1x Adjusted EPRA EPS
▪ Dividend annualised at 15.7p per share (Q3 2018 dividend 3.9325p per share) on base case assumption
▪ Current dividend yield of c. 4.1% on EPRA NAV and c.4.3% on Placing Price of 365.0p
▪ Illustrative 5 year dividend growth CAGR (2018 to 2023) on base case assumptions of 5.8% p.a.1
1 See assumptions on page 22 - There is no certainty that these illustrative projections will be achieved
5 year CAGR
6.5%
10
12
14
16
18
20
22
Jun-18 Jun-19 Jun-20 Jun-21 Jun-22 Jun-23
Dis
trib
uti
on
s p
er
sh
are
(p
en
ce
)
RPI Swap Curve + 100 bps
RPI Swap Curve
Zero RPI growth
Post acquisition dividend
uplift to 15.7p annualised
5.8%
3.7%

Total Return Outlook
19
EPRA NAV plus Dividends on Base Case1
1 See assumptions on page 22 - There is no certainty that these illustrative projections will be achieved
382.4 400.5 414.1440.4
469.2493.8
15.7 32.5
50.2
69.5
90.3
44.4% 43.2% 42.2% 40.6% 39.0% 37.8%
Jun-18 Jun-19 Jun-20 Jun-21 Jun-22 Jun-23
0
100
200
300
400
500
600
Net LTV
Pe
nc
e p
er
sh
are
EPRA NAV per share (pence) Accumulated dividends (pence)

20
Delivering Strong Total Returns
Total Accounting Return
Dividends and DPS ǂ
▪ NAV per share up 120%
▪ Total accounting return CAGR 22%
Adjusted EPRA EPS ǂ
▪ Net LTV down from 80% to 44%
▪ Annualised DPS 15.7p per share (4.1% on June 2019
EPRA NAV)
Net Loan to Value
1
* pro forma adjusted for 2 July 2018 completion of leisure portfolio acquisition
ǂ the reduction in EPS and DPS in June 2018 reflects the three month period between the issue of new shares to raise £315.5m gross and the full
deployment of proceeds on 2 July 2018
Performance since listing in June 20141
84
.5p
25
8.5
p
27
5.3
p
28
2.8
p
30
0.2
p
32
3.6
p
35
5.5
p
37
0.4
p
38
2.4
p
-175p
25p
225p
425p
Jun-14 Dec-14 Jun-15 Dec-15 Jun-16 Dec-16 Jun-17 Dec-17 Jun-18
EPRA NAV per share Dividends per share
5.9p7.0p6.6p
6.0p
69.7%61.0%
53.5% 49.6%44.4%
Dec-14 Dec-15 Dec-16 Dec-17 Jun-18 *
-0.3p
2.9p
5.4p 5.9p6.7p 6.9p
6.0p
£5
.3m
£6
.7m
£7
.6m
£7
.6m
£8
.1m
£8
.1m
£8
.1m
£8
.1m
£1
2.6
m
11.8p
15.7p
10.0p14.0p14.0p14.0p13.1p13.3p11.8p

Appendices
Travelodge Manchester Central

Assumptions
1. Employs RPI swap curve at 4 September 2018, averaging inflation increases of 3.3% p.a.
compound over the period
2. Constant property valuation yield at 30 June 2018 external net valuation yields
3. Ignores potential for further uplifts from Ramsay open market reviews
4. No purchases or sales of properties or lease variations
5. 30 June 2018 exchange rate (€1:£0.8843) used throughout illustrative periods (Euro
denominated EPRA net assets amount to c.4% of the whole at 30 June 2018)
6. The five year dividend growth CAGRs on page 17 reflect growth from the annualised 15.7p per
share annualised dividend as at Q3 2018
7. The investment advisory agreement between SIR and Prestbury expires in June 2022 with no
renewal rights on either side. The returns illustrations assume that the existing arrangements
continue unchanged beyond that date
8. In October 2022 the existing leisure loan facility matures. At that time the loan principal will be
£372.7m at 30 June 2018 Euro exchange rate and the base case property valuation as at 30
June 2018 valuation yield and Euro exchange rate is estimated at £700.1m. The illustrative
returns assume that the existing loan continues on the same terms.
22

Glossary
23
DPS Dividends per share
EPRA European Public Real Estate Association
EPRA EPS A measure of EPS designed by EPRA to present underlying earnings from core operating activities
EPRA NAV A measure of NAV designed by EPRA to present the fair value of a company on a long term basis by
excluding items such as interest rate derivatives held for long term benefit, net of deferred tax
EPS Earnings per share, calculated as the earnings over a period, after tax, attributable to members of the
parent company divided by the weighted average number of shares in issue over the period
Loan To Value or
LTV
The outstanding amount of a loan expressed as a percentage of property value
NAV Net asset value
Net Initial Yield Annualised net rents on investment properties expressed as a percentage of the investment property
valuation, less purchasers’ costs
Net LTV LTV calculated on the gross loan amount and any other secured liabilities, less cash balances
Prestbury Prestbury Investments LLP, the investment adviser to the company
RevPAR Revenue per available room
Running yield The anticipated Net Initial Yield at a future date, taking account of any rent reviews in the intervening
period, Existing Portfolio at 31 December 2017 independent valuation and acquisition at cost
TAR Total Accounting Return: the movement in EPRA NAV over a period plus distributions paid in the period,
expressed as a percentage of EPRA NAV at the start of the period
TSR Total Shareholder Return: the movement in share price over a period plus distributions paid in the period,
expressed as a percentage of the share price at the start of the period
WAULT Weighted average unexpired lease term

Financing: debt portfolio details
24
Gross debt
No of
properties
Max annual
interest rate
Rate
protection
Annual cash
amortisation
Maturity
date
Merlin leisure
£380.2m 6 5.68% Fixed
£3.8m years
6 & 7 Oct 2022
Hotels 2£68.7m 76 3.35%
76% fixed 24%
capped None Apr 2023
Leisure 2£60.0m 20 3.20%
83% fixed 17%
capped None June 2023
Hotels 1 £60.0m 55 2.71% Fixed None Oct 2023
Healthcare 1 £217.3m 9 4.29% Fixed £1.0m Sept 2025
Healthcare 2 £307.5m 11 5.30% Fixed £3.2m Oct 2025
£1,093.7m 177 4.85%

25
LONG LEASES, STRONG COVENANTS & INDEXED RENTAL UPLIFTS
KEY OPERATING ASSETS
DEFENSIVE SECTORS
HIGH BARRIERS TO ENTRY
PROPERTIES THAT ARE ESSENTIAL FOR
THE TENANT TO CARRY OUT ITS
BUSINESS
MORE RESILIENT TO ONLINE DISRUPTION
AND ECONOMIC DOWNTURNS
DIFFICULT TO REPLACE STOCK DUE TO
PLANNING CHALLENGES OR HIGH COST
STRINGENT SELECTION CRITERIA
ENDURING TENANTS MORE LIKELY TO RENEW AND EXTEND LEASES

Disclaimer
The information contained in these slides and communicated verbally to you, including the speech(es) of the presenter(s) and any materials distributed at or in
connection therewith (together, the “Presentation”) is confidential. Reliance upon the Presentation for the purpose of engaging in any investment activity may
expose an individual to a significant risk of losing all of the property or other assets invested. If any person is in any doubt as to the contents of the Presentation,
they should seek independent advice from a person who is authorised for the purposes of the Financial Services and Markets Act 2000, as amended (the
“FSMA”) or otherwise suitably authorised if in another jurisdiction and who specialises in advising on investments of this kind. Any investment decision should not
be made based on the content of the Presentation but be made solely on the basis of the final announcement to be published by Secure Income REIT Plc (the
“Company”). The contents of the Presentation shall not be taken as any form of commitment on the part of any person to proceed with any transaction.
The Presentation has been prepared by, and is the sole responsibility of, the Company. No undertaking, representation, warranty or other assurance, expressed or
implied, is made or given by or on behalf of Stifel Nicolaus Europe Limited (“Stifel”), the Company or Prestbury Investments LLP (the “Investment Adviser”) or
any of their respective shareholders, directors, employees, advisers, agents or affiliates or any other person as to the fairness, accuracy or the completeness of
the information or opinions contained herein, and to the extent permitted by law, no responsibility or liability is accepted by any of them for any such information or
opinions. Notwithstanding the aforesaid, nothing in this paragraph shall limit or exclude liability for any representation or warranty made fraudulently.
The Presentation has not been approved by the Financial Conduct Authority (the “FCA”) and does not constitute, or form part of, an admission document, listing
particulars, a prospectus or a circular relating to the Company, nor does it constitute, or form part of, any offer or invitation to sell or issue, or any solicitation of any
offer to purchase or subscribe for any ordinary shares in the Company (the “Ordinary Shares”). Further, neither the Presentation nor any part of it, or the fact of its
distribution, shall form the basis of, or be relied upon in connection with, or act as any inducement to enter into, any contract for Ordinary Shares. Any investment
in Ordinary Shares should only be made on the basis of definitive documentation in final form.
The Presentation may not be copied, reproduced or further distributed, in whole or in part, to any other person, or published, in whole or in part, for any purpose
without the prior written consent of the Company.
This Presentation is being distributed by the Company in the United Kingdom in accordance with Article 69 of the Financial Services and Markets Act 2000
(Financial Promotion) Order 2005 (the “Financial Promotion Order”) made pursuant to section 21(5) of the FSMA. In addition, this Presentation is being
distributed in the United Kingdom only to, and is directed only at, those persons falling within the following articles of the Financial Promotion Order: Investment
Professionals (as defined in Article 19(5)); and High Net Worth Companies (as defined in Article 49(2)). Persons who do not fall within either of these definitions
should not rely on the Presentation nor take any action based upon it but should instead return it immediately to the Company. The Presentation is exempt from
the general restriction in section 21 of the FSMA relating to the communication of invitations or inducements to engage in investment activity on the grounds that it
is made only to certain categories of persons.
The distribution of the Presentation in jurisdictions other than the United Kingdom may be restricted by law and persons into whose possession the Presentation
comes should inform themselves about and observe any such restrictions. In particular, neither the Presentation nor any copy of it should be distributed, directly or
indirectly, by any means (including electronic transmission) to any persons in Australia, Canada, Japan or the Republic of South Africa. This Presentation should
not be distributed in or into the United States of America (or any of its territories or possessions) (together, the “US”) other than to “qualified institutional buyers”
(“QIBs”) as such term is defined in Rule 144A under the United States Securities Act of 1933, as amended (the “Securities Act”).
The Ordinary Shares have not been, and will not be, registered under the Securities Act or under the securities laws of any other jurisdiction, and are not being
offered or sold (i) directly or indirectly, within or into the US, Australia, Canada, Japan or the Republic of South Africa or (ii) to, or for the account or benefit of, any
US persons or any national, citizen or resident of the US, Australia, Canada, Japan or the Republic of South Africa, unless such offer or sale would qualify for an
exemption from registration under the Securities Act and/or any other applicable securities laws.
26

27
Disclaimer
Solely for the purposes of the product governance requirements contained within: (a) EU Directive 2014/65/EU on markets in financial instruments, as amended
(“MiFID II”); (b) Articles 9 and 10 of Commission Delegated Directive (EU) 2017/593 supplementing MiFID II; and (c) local implementing measures (together, the
“MiFID II Product Governance Requirements”), and disclaiming all and any liability, whether arising in tort, contract or otherwise, which any “manufacturer” (for the
purposes of the MiFID II Product Governance Requirements) may otherwise have with respect thereto, the Ordinary Shares have been subject to a product approval
process, which has determined that the Ordinary Shares to be issued pursuant to the Placing are: (i) compatible with an end target market of retail investors and
investors who meet the criteria of professional clients and eligible counterparties, each as defined in MiFID II; and (ii) eligible for distribution through all distribution
channels as are permitted by MiFID II (the “Target Market Assessment”).
Notwithstanding the Target Market Assessment, distributors should note that: the price of the Ordinary Shares may decline and investors could lose all or part of their
investment; the Ordinary Shares offer no guaranteed income and no capital protection; and an investment in the Ordinary Shares is compatible only with investors
who do not need a guaranteed income or capital protection, who (either alone or in conjunction with an appropriate financial or other adviser) are capable of
evaluating the merits and risks of such an investment and who have sufficient resources to be able to bear any losses that may result therefrom. The Target Market
Assessment is without prejudice to the requirements of any contractual, legal or regulatory selling restrictions in relation to the Placing. Furthermore, it is noted that,
notwithstanding the Target Market Assessment, Stifel will only procure investors who meet the criteria of professional clients and eligible counterparties.
For the avoidance of doubt, the Target Market Assessment does not constitute: (a) an assessment of suitability or appropriateness for the purposes of MiFID II; or (b)
a recommendation to any investor or group of investors to invest in, or purchase, or take any other action whatsoever with respect to the Ordinary Shares.
Each distributor is responsible for undertaking its own target market assessment in respect of the Ordinary Shares and determining appropriate distribution channels.
The Company is under no obligation to update or keep current the information contained in this Presentation or to correct any inaccuracies which may become
apparent, and any opinions expressed in it are subject to change without notice. Neither the Company nor any of its directors, officers, employees or advisers accept
any liability whatsoever for any loss howsoever arising from any use of this Presentation or its contents or otherwise arising in connection therewith.
The Presentation contains forward-looking statements. These statements relate to the future prospects, developments and business strategies of the Company.
Forward-looking statements are identified by the use of such terms as "believe", "could", "envisage", "estimate", "potential", "intend", "may", "plan", "will" or variations
or similar expressions, or the negative thereof. The forward-looking statements contained in the Presentation are based on current expectations and are subject to
risks and uncertainties that could cause actual results to differ materially from those expressed or implied by those statements. If one or more of these risks or
uncertainties materialise, or if any underlying assumptions prove incorrect, the Company's actual results may vary materially from those expected, estimated or
projected. Given these risks and uncertainties, certain of which are beyond the Company's control, potential investors should not place any reliance on forward-
looking statements. These forward-looking statements speak only as at the date of the Presentation. Except as required by law, the Company undertakes no
obligation to publicly release any update or revisions to the forward-looking statements contained in the Presentation to reflect any change in events, conditions or
circumstances on which any such statements are based after the time they are made.
Stifel, which is authorised and regulated in the United Kingdom by the FCA, is acting as bookrunner and nominated adviser connection with the matters referred to
herein, and will not be responsible to anyone other than the Company for providing the protections afforded to its clients, nor for providing advice in relation to the
contents of the Presentation or any transaction or arrangement referred to herein.
Apart from the responsibilities and liabilities, if any, which may be imposed on Stifel by the FSMA or the regulatory regime established thereunder, Stifel accepts no
responsibility whatsoever, and makes no representation or warranty, express or implied, in relation to the contents of the Presentation, including its accuracy,
completeness or verification or for any other statement made or purported to be made by it, or on behalf of it, the Company, the directors, the Investment Adviser or
any other person in connection with the Company, the Ordinary Shares or the matters referred to herein, and nothing in the Presentation is or shall be relied upon as
a promise or representation in this respect, whether as to the past or future. Stifel accordingly disclaims all and any liabi lity whether arising in tort, contract or
otherwise (save as referred to above), which it might otherwise have in respect of the Presentation or any such statement.