Embed Size (px)
Citation preview

Company Headroom Analysis
Water Resource Management Plan 2019
2 November 2017
South Staffs Water

387731 03 F https://mottmac.sharepoint.com/teams/pj-b3756/do/Reports/SSW Headroom Report -
South Staffs Rev F.docx Mott MacDonald
Mott MacDonald 22 Station Road Cambridge CB1 2JD United Kingdom T +44 (0)1223 463500 F +44 (0)1223 461007 mottmac.com
South Staffs Water Green Lane Walsall WS2 7PD
Company Headroom Analysis
Water Resource Management Plan 2019
2 November 2017
Mott MacDonald Limited. Registered in England and Wales no. 1243967. Registered office: Mott MacDonald House, 8-10 Sydenham Road, Croydon CR0 2EE, United Kingdom
South Staffs Water


Mott MacDonald | Company Headroom Analysis Water Resource Management Plan 2019
387731 | 03 | F | 2 November 2017 https://mottmac.sharepoint.com/teams/pj-b3756/do/Reports/SSW Headroom Report - South Staffs Rev F.docx
Issue and Revision Record
Revision Date Originator Checker Approver Description
A R MacDonald Working Draft Issue
B R MacDonald Working Draft Issue
C 8/9/17 R MacDonald S Pike P Chadwick First Draft Issue
D 22/9/17 R MacDonald S Pike P Chadwick Updated Draft Issue
E 13/10/17 R MacDonald S Pike P Chadwick Final Draft Issue
F 2/10/17 R MacDonald S Pike P Chadwick Final Issue
Document reference: 387731 | 03 | F
Information class: Standard
This document is issued for the party which commissioned it and for specific purposes connected with the above-
captioned project only. It should not be relied upon by any other party or used for any other purpose.
We accept no responsibility for the consequences of this document being relied upon by any other party, or being used
for any other purpose, or containing any error or omission which is due to an error or omission in data supplied to us by
other parties.
This document contains confidential information and proprietary intellectual property. It should not be shown to other
parties without consent from us and from the party which commissioned it.
This report has been pr epared sol el y for use by the party which commissi oned it (the ‘Client’) i n connecti on with the capti oned proj ect. It should not be used for any other purpose. N o person other than the Client or any party who has expressl y agreed ter ms of r eliance with us (the ‘Reci pient(s)’) may rel y on the content, i nformati on or any vi ews expressed i n the repor t. We accept no duty of care, responsi bility or liability to any other r eci pient of thi s document. T his r eport is confi denti al and contains pr opri etar y intell ectual property.
Contents

Mott MacDonald | Company Headroom Analysis 1Water Resource Management Plan 2019
387731 | 03 | F | 2 November 2017 https://mottmac.sharepoint.com/teams/pj-b3756/do/Reports/SSW Headroom Report - South Staffs Rev F.docx
Executive summary 2
1 Introduction and background 3
1.1 Objectives and scope of work 3
1.2 Background to Target Headroom 3
1.2.1 Why assess Target Headroom 3
1.2.2 Headroom in the Supply Demand Balance and Accepted Definitions 4
1.3 Environment Agency Water Resources Planning Guidance 5
2 Methodology 6
2.1 Overview 6
2.2 Components of Headroom Uncertainty 6
2.2.1 Supply Side Components 6
2.2.2 Demand Side Components 7
2.3 Probability Distributions and Monte Carlo Simulation 8
2.3.1 Software and simulations 9
3 Headroom Components 10
3.1 Supply Components 10
3.1.1 S1.1 Vulnerable Surface Water Licences 10
3.1.2 S2.1 Vulnerable Groundwater Licences 10
3.1.3 S3.1 Time-limited Licences 10
3.1.4 S4 Bulk Supplies 11
3.1.5 S5 Gradual Groundwater Pollution 11
3.1.6 S6 Accuracy of Supply-side Data: Groundwater 13
3.1.7 Accuracy of data for surface water yields 16
3.1.8 S8 Uncertainty of Climate Change on Deployable Output 17
3.1.9 S9 Uncertain output of new resource developments 18
3.2 Demand Components 18
3.2.1 D1/1 Accuracy of sub-component data 18
3.2.2 D2/1 Demand Forecasting Uncertainty 19
3.2.3 Uncertainty of impact of Climate Change on Demand 20
3.3 Analysing the data 21
4 Results and conclusions 22
4.1 Target Headroom Results 22
4.1.1 DYAA 22
4.1.2 DYCP 23
4.2 Chosen Risk Profile 25
4.3 Risk Profile Sensitivity 27
Appendices 28
A. Target Headroom Uncertainty Results Tables 29

Mott MacDonald | Company Headroom Analysis 2Water Resource Management Plan 2019
387731 | 03 | F | 2 November 2017 https://mottmac.sharepoint.com/teams/pj-b3756/do/Reports/SSW Headroom Report - South Staffs Rev F.docx
Executive summary
This document summarises the target headroom assessment carried out for the Company
Water Resource Zone, forming part of the South Staffs Water WRMP19 planning process.
Target Headroom is defined as the minimum buffer that a prudent water utility should introduce
into the annual supply-demand balance to ensure that the Water Utility's chosen level of service
can be achieved. Target Headroom is calculated according to a standard methodology
developed and published by UKWIR (An Improved Methodology for Assessing Headroom,
UKWIR, 2002). All components of target headroom uncertainty have been assessed and
reviewed by South Staffs Water, with time series of uncertainty distributions defined from 2018
to 2045 for each component, reflective of dry year annual average (DYAA) and dry year critical
period (DYCP) conditions.
The distributions were uploaded into a tailor-made spreadsheet headroom model using @Risk
Monte Carlo analysis. 10,000 iterations of the model were run to determine a comprehensive
percentile distribution of headroom time series for both DYAA and DYCP conditions. A risk
profile was selected in line with the WRMP guidelines and used to output target headroom
values for supply demand balance modelling of the Water Resource Zone.
DYAA Target headroom starts at 3.5 Ml/d in 2018, increasing steadily along the 95th percentile
profile to a maximum of 7.9 Ml/d in 2030. The increase in risk acceptance beyond 2030 means
that target headroom decreases slowly thereafter to 5.8 Ml/d by 2045. DYCP Target headroom
starts at 8.8 Ml/d in 2017, increasing steadily along the 95th percentile profile to a maximum of
12.1 Ml/d in 2030. The increase in risk acceptance beyond 2030 means that target headroom
fluctuates slightly thereafter, finishing at 12.4 Ml/d by 2045.

Mott MacDonald | Company Headroom Analysis 3Water Resource Management Plan 2019
387731 | 03 | F | 2 November 2017 https://mottmac.sharepoint.com/teams/pj-b3756/do/Reports/SSW Headroom Report - South Staffs Rev F.docx
1 Introduction and background
Water Companies in England and Wales have a statutory duty to prepare and submit Water
Resources Management Plans (WRMP), including Supply Demand Balance (SDB), to the
Environment Agency (EA) and Ofwat. A key component of these WRMPs is Target Headroom.
Target Headroom is defined as the minimum buffer that a prudent water utility should introduce
into the annual supply-demand balance to ensure that the Water Utility's chosen level of service
can be achieved. Target Headroom is calculated according to a standard methodology
developed and published by UKWIR (An Improved Methodology for Assessing Headroom,
UKWIR, 2002).
Mott MacDonald (MM) has been engaged by South Staffordshire Water to assess Target
Headroom for the 2017 Draft WRMP.
1.1 Objectives and scope of work
The objectives of the project are:
● to review and analyse data provided by South Staffordshire Water, to evaluate uncertainty in
headroom components and produce appropriate probability distributions for each
component; and
● to assess South Staffordshire Water’s Target Headroom under average and peak
conditions.
In addition, the scope of work includes the actions below:
1. Update the analysis for uncertainty of impacts of climate change on demand;
2. Review the uncertainty in deployable output associated with changing nitrate concentration
and make recommendation for an appropriate headroom allowance
3. Produce summaries of the headroom results by component;
4. Produce a report outlining the methodology and assumptions used and presenting the
results of the analysis.
1.2 Background to Target Headroom
1.2.1 Why assess Target Headroom
A variety of components of the supply/demand balance are subject to uncertainty, both their
present values and forecast future trends.
It is therefore important that water companies make sufficient allowance in their water resource
planning for such uncertainty to ensure that, for each resource zone, the risk of a supply-
demand deficit in critical periods is eliminated or reduced to an acceptable level. This is done by
calculating and incorporating in the supply-demand balance a target headroom allowance.
Water companies must show evidence that they have taken this into account when they submit
their WRMPs as part of the periodic review process. The last WRMPs were submitted to the
Environment Agency in 2014 and 2015 and these also formed the companies’ supply-demand
balance submissions to the Office of Water Services (Ofwat) as part of PR14. These plans take
a long-term view and demonstrate how the company intends to maintain an acceptable balance
of supply and demand into the future. The last plans considered the planning period 2012 to
2040 whilst the PR19 planning period will cover the years 2017 to 2045.

Mott MacDonald | Company Headroom Analysis 4Water Resource Management Plan 2019
387731 | 03 | F | 2 November 2017 https://mottmac.sharepoint.com/teams/pj-b3756/do/Reports/SSW Headroom Report - South Staffs Rev F.docx
1.2.2 Headroom in the Supply Demand Balance and Accepted Definitions
The Supply Demand Balance is calculated as the difference between Water Available for Use
(including imported water if applicable) and demand at any given point in time by comparing
deployable output (D.O.) with water demand, after allowing for outage and target headroom.
In assessing the supply demand balance, the following equations are normally adopted:
1. Water Available for Use (WAFU) = Deployable Output (DO) – Outage
2. Available Headroom = WAFU – demand
3. Available Headroom ≥ Target Headroom needed to satisfy given standards of service
Definitions for the terms used in the equations are given in Box 1 below. These are taken from the Environment Agency Water Resources Planning Guidelines (2012), and may vary slightly from other references. No change to definition is presented in the 2016 guidelines.
Table 1: Definitions
Quantity Definition
Water Available for Use The value calculated by deducting allowable outages and planning allowances from deployable output in a resource zone
Available Headroom The difference (in Ml/d or percent) between water available for use (including imported water) and demand at any given point in time
Target Headroom A buffer between supply and demand designed to cater for specified uncertainties.
Source: EA Water Resource Planning Guidelines, June 2012
Deployable Output is generally considered to be the output of a source allowing for all
constraints, whether physical, licence or environmental, for a given level of service. As such it is
the volume of water that can be deployed into supply. Outage is defined at its simplest as a
temporary loss of deployable output.
Target Headroom is defined as the minimum buffer that a prudent water utility should introduce
into the annual supply-demand balance to ensure that the water utility's chosen level of service
can be achieved. It is the margin between water available for use (WAFU) and demand required
for planning purposes to cater for uncertainties (except for those due to outages) in the overall
supply-demand balance.
Available Headroom is defined as the margin between Water Available for Use (WAFU) and
demand at a given point in time and in theory is a measurable quantity of water. Target
Headroom is a derived value which represents the minimum acceptable Headroom required for
planning purposes to cater for uncertainties (excluding outages) in the overall supply-demand
balance.
The issue of headroom came to prominence as a result of the 1995/96 Yorkshire drought where
the independent commission of inquiry chaired by Professor Uff concluded that the Yorkshire
Water supply system had an insufficient margin of resource over demand. This led to the
concept of headroom uncertainty being introduced in the Environment Agency (EA) 1997 Water
Resources Planning Guideline and the United Kingdom Water Industry Research (UKWIR)
project that developed the 1998 Headroom Methodology. In 2002, UKWIR issued an improved
risk based methodology for assessing headroom uncertainty (the 2002 UKWIR Headroom
Methodology) which has been widely adopted and is considered to be the “best practice”
methodology.
Mott MacDonald | Company Headroom Analysis 5Water Resource Management Plan 2019
387731 | 03 | F | 2 November 2017 https://mottmac.sharepoint.com/teams/pj-b3756/do/Reports/SSW Headroom Report - South Staffs Rev F.docx
1.3 Environment Agency Water Resources Planning Guidance
The Environment Agency issued in May 2016 the Water Resource Planning Guidelines for the
2018 Water Resource Plans. The report states the following.
You may assess individual components of uncertainty and variability using risk-based planning
techniques, through your decision-making tool or assess uncertainty separately from individual
components using the target headroom approach. The following documents set out different
approaches to assessing uncertainty:
• UKWIR (2016) WRMP19 Methods – Risk Based Planning
• UKWIR (2016) WRMP19 Methods – Decision Making Process
• UKWIR (2002) An Improved Methodology for Assessing Headroom
• UKWIR (1998) A Practical Method for Converting Uncertainty into Headroom
If you use the older target headroom guidance you should justify why it is appropriate.
If you use risk-based planning tools or a decision-making tool to assess uncertainty and
variability you may not need to calculate target headroom, or you may need to exclude some
target headroom components. If so, you will need to explain the methods and assumptions you
have used and demonstrate that you have not double counted or omitted uncertainties.
If you use target headroom to provide a buffer for uncertainties, you need to consider the
appropriate level of risk for your plan. If target headroom is too large it may drive unnecessary
expenditure, if too little you may be unable to meet your planned level of service. You should
also accept a higher level of risk further into future than in the early years (first 5 years) because
as time progresses the uncertainties for which headroom allows will reduce and you will be able
to adapt to any changes.
You should provide a clear justification of the assumptions and information used to assess your
uncertainties. You should assess the relative contributions clearly showing which uncertainties
have the biggest impact in each WRZ. You should communicate this in a clear manner for
customers and interested parties to understand easily. You should consider options for reducing
uncertainty during the planning period.
South Staffs Water has opted to use the 2002 UKWIR Headroom Methodology for target
headroom to assess uncertainty in its South Staffs zone, rather than using risk-based planning
or decision-making tools, so there is no risk of double counting uncertainties.
Mott MacDonald | Company Headroom Analysis 6Water Resource Management Plan 2019
387731 | 03 | F | 2 November 2017 https://mottmac.sharepoint.com/teams/pj-b3756/do/Reports/SSW Headroom Report - South Staffs Rev F.docx
2 Methodology
The methodology for this headroom analysis follows the best practice guidance set out in the
2002 UKWIR “Improved Methodology for Assessing Headroom”. It builds on the headroom
analysis models used by South Staffs Water to calculate their target headroom for previous
WRMPs.
2.1 Overview
In 2002, UKWIR published its improved methodology for the calculation of headroom
allowances. This advocates the use of a probabilistic approach, based on Monte Carlo analysis.
The analysis involves defining probability distributions for magnitude of headroom components
and combining these to give an overall probability distribution for the target headroom
allowance. A “lotus notes”-based spreadsheet with an add-in Monte Carlo analysis tool called
@RISK was produced as part of the project.
2.2 Components of Headroom Uncertainty
The 2002 UKWIR methodology Headroom is divided into the following supply side and demand
side components:
Table 2.1: Supply and Demand Side Headroom Categories
Supply Side Headroom Categories Demand Side Headroom Categories
S1 – Vulnerable surface water licences D1 – Accuracy of sub-component data
S2 – Vulnerable groundwater licences D2 – Demand forecast variation
S3 – Time limited licences D3 – Uncertainty of climate change on demand
S4 – Bulk transfers D4 – Uncertainty of demand management solutions
S5 – Gradual pollution causing a reduction in abstraction
S6 – Accuracy of supply side data
S8 – Uncertainty of climate change on yield
S9 – Uncertain output of new resource developments
Source: UKWIR
The 2002 UKWIR methodology removed issue S7 (single source dominance and critical
periods) as it was considered to be an outage issue and already included in the supply demand
balance. The following two headroom components were added:
� S9 Uncertain output of new resource developments
� D4 Uncertain outcome of demand management measures
Each of the above components has been considered by South Staffordshire Water for its
Company water resource zone and the headroom uncertainty issues associated with each
component have been identified. For some of the components listed above, more than one
issue has been included.
2.2.1 Supply Side Components
S1-S3 (vulnerable licences): Uncertainty over future reductions in abstraction licensing have
been updated to include the latest deployable output and abstraction licence values (S1-S3 are
only used for sensitivity analysis and are not included in target headroom).
Mott MacDonald | Company Headroom Analysis 7Water Resource Management Plan 2019
387731 | 03 | F | 2 November 2017 https://mottmac.sharepoint.com/teams/pj-b3756/do/Reports/SSW Headroom Report - South Staffs Rev F.docx
An allowance for S4, bulk transfers, has been introduced at PR19, after better understanding of
the uncertainty in company bulk exports.
S5, gradual pollution of groundwater sources, is applied to allow for uncertainty associated with
deterioration, rehabilitation and replacement of boreholes, uncertainty in future long-term trends
in nitrate pollution, and uncertainty over coalfield mine water pollution at Moors Gorse.
Temporary losses of DO relating to these factors are quantified and accounted for in the Outage
allowance.
S6 comprises uncertainty in the accuracy of supply-side data. For every groundwater source,
the constraining factor for DO is identified: abstraction licence, infrastructure, pumping water
level (potential yield), treatment capacity or water quality. For abstraction licences, the
uncertainty relates to meter reading reliability. To avoid double-counting, only meters measuring
abstraction separately to distribution input are included here. Infrastructure constraints carry
uncertainty in pump outputs, yield constraints are subject to a number of uncertainties in the
“source reliable output” method, but no such sources exist for South Staffs. There are
uncertainties in a number of treatment processes, and water quality can limit deployable output
subject to uncertainty in existing conditions (primarily sand ingress here). Trend uncertainty is
covered under S5. Surface water yield uncertainty is due to imperfect climate and hydrological
historical data records and variability in surface water yield models.
Uncertainty of climate change on source yield (S8), is quantified using Aquator modelling of
climate change scenarios on the DO of surface water sources. No groundwater sources are
constrained by potential yield, such that there is no risk of climate change impacting
groundwater source yield.
No new options are planned for completion in the near future, such that in S9, only final
preferred options need be considered. These should not feature in baseline target headroom,
but uncertainty in their output could be determined as necessary for any options selected in the
final preferred balance.
Supply side components have been updated to include the latest deployable output values
reviewed for the draft WRMP.
Sign convention for supply-side headroom follows that of UKWIR 2002, that is:
• Data uncertainty that leads to a loss of Deployable Output = negative Headroom
• Data uncertainty that leads to an increase in Demand = positive Headroom
2.2.2 Demand Side Components
D1 accounts for uncertainty in the accuracy of sub-component data. As for S6, this reflects the
reliability of meter readings, which could impact the accuracy of the demand forecast. To avoid
double-counting, only meters measuring distribution input separately to abstraction are included
here.
D2 comprises uncertainty in population growth, change in size of households, measured and
unmeasured consumption, non-household consumption, dry-year correction, and peak period
adjustment. These are input as time series of % uncertainty to the model.
D3, uncertainty of impact of climate change on demand has been determined according to the
UKWIR methodology, Impact of Climate Change on Water Demand (2013), with time series of
% uncertainty applied to household consumption.
Mott MacDonald | Company Headroom Analysis 8Water Resource Management Plan 2019
387731 | 03 | F | 2 November 2017 https://mottmac.sharepoint.com/teams/pj-b3756/do/Reports/SSW Headroom Report - South Staffs Rev F.docx
D4, uncertainty of demand management solutions, has not been included in baseline target
headroom. Should demand management solutions be required to maintain the supply demand
balance to 2045, an allowance will be made in final preferred target headroom for D4.
Sign convention for demand-side headroom follows that of UKWIR 2002, that is:
• Data uncertainty that leads to a decrease in Demand = negative Headroom
• Data uncertainty that leads to an increase in Demand = positive Headroom
Each of the components of headroom is described in more detail in the following sections.
2.3 Probability Distributions and Monte Carlo Simulation
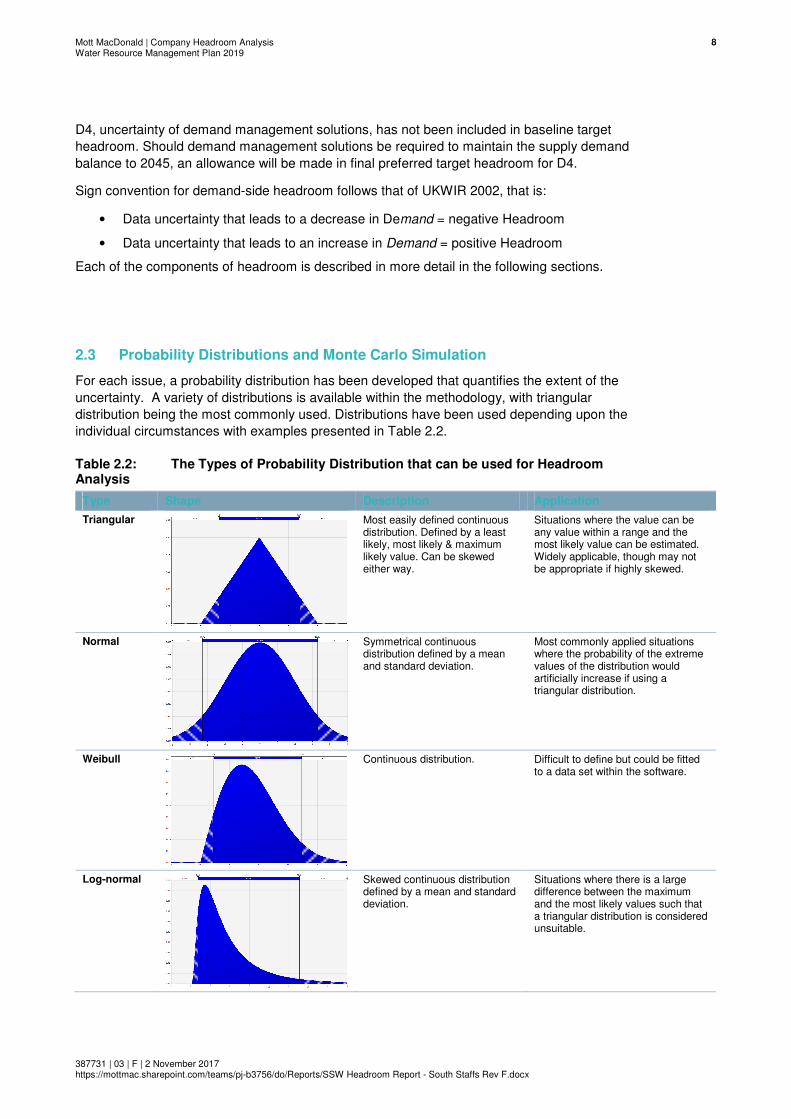
For each issue, a probability distribution has been developed that quantifies the extent of the
uncertainty. A variety of distributions is available within the methodology, with triangular
distribution being the most commonly used. Distributions have been used depending upon the
individual circumstances with examples presented in Table 2.2.
Table 2.2: The Types of Probability Distribution that can be used for Headroom Analysis
Type Shape Description Application
Triangular
Most easily defined continuous distribution. Defined by a least likely, most likely & maximum likely value. Can be skewed either way.
Situations where the value can be any value within a range and the most likely value can be estimated. Widely applicable, though may not be appropriate if highly skewed.
Normal
Symmetrical continuous distribution defined by a mean and standard deviation.
Most commonly applied situations where the probability of the extreme values of the distribution would artificially increase if using a triangular distribution.
Weibull
Continuous distribution. Difficult to define but could be fitted to a data set within the software.
Log-normal
Skewed continuous distribution defined by a mean and standard deviation.
Situations where there is a large difference between the maximum and the most likely values such that a triangular distribution is considered unsuitable.
Mott MacDonald | Company Headroom Analysis 9Water Resource Management Plan 2019
387731 | 03 | F | 2 November 2017 https://mottmac.sharepoint.com/teams/pj-b3756/do/Reports/SSW Headroom Report - South Staffs Rev F.docx
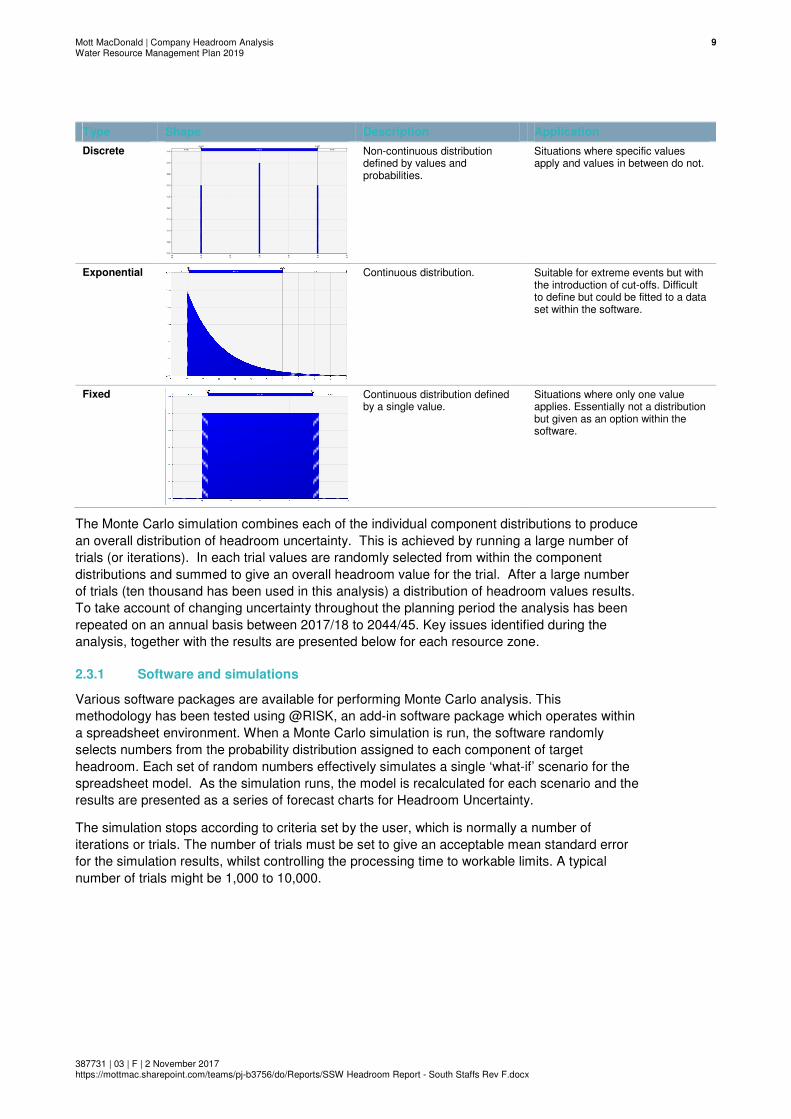
Type Shape Description Application
Discrete
Non-continuous distribution defined by values and probabilities.
Situations where specific values apply and values in between do not.
Exponential
Continuous distribution. Suitable for extreme events but with the introduction of cut-offs. Difficult to define but could be fitted to a data set within the software.
Fixed
Continuous distribution defined by a single value.
Situations where only one value applies. Essentially not a distribution but given as an option within the software.
The Monte Carlo simulation combines each of the individual component distributions to produce
an overall distribution of headroom uncertainty. This is achieved by running a large number of
trials (or iterations). In each trial values are randomly selected from within the component
distributions and summed to give an overall headroom value for the trial. After a large number
of trials (ten thousand has been used in this analysis) a distribution of headroom values results.
To take account of changing uncertainty throughout the planning period the analysis has been
repeated on an annual basis between 2017/18 to 2044/45. Key issues identified during the
analysis, together with the results are presented below for each resource zone.
2.3.1 Software and simulations
Various software packages are available for performing Monte Carlo analysis. This
methodology has been tested using @RISK, an add-in software package which operates within
a spreadsheet environment. When a Monte Carlo simulation is run, the software randomly
selects numbers from the probability distribution assigned to each component of target
headroom. Each set of random numbers effectively simulates a single ‘what-if’ scenario for the
spreadsheet model. As the simulation runs, the model is recalculated for each scenario and the
results are presented as a series of forecast charts for Headroom Uncertainty.
The simulation stops according to criteria set by the user, which is normally a number of
iterations or trials. The number of trials must be set to give an acceptable mean standard error
for the simulation results, whilst controlling the processing time to workable limits. A typical
number of trials might be 1,000 to 10,000.

Mott MacDonald | Company Headroom Analysis 10Water Resource Management Plan 2019
387731 | 03 | F | 2 November 2017 https://mottmac.sharepoint.com/teams/pj-b3756/do/Reports/SSW Headroom Report - South Staffs Rev F.docx
3 Headroom Components
The South Staffs Water headroom model has been developed following the best-practice
UKWIR methodology, and builds on previous iterations used for WRMP14 and WRMP09.
3.1 Supply Components
3.1.1 S1.1 Vulnerable Surface Water Licences
Headroom uncertainty associated with vulnerable surface water licences arises from concerns
over the sustainability of abstractions at the licensed rates and the likelihood that licences may
be modified (reduced). Where appropriate, this has been considered under scenario modelling
for the draft plan.
3.1.2 S2.1 Vulnerable Groundwater Licences
The EA has an aspiration to reduce groundwater abstraction licences in many catchments as
part of their Restoring Sustainable Abstraction Programme. For many catchments the licence
clawback has now been quantified through the CAMS process, and this has resulted in a
significantly lower licensable resource (with much greater potential licence reductions). The
driver in future for clawing back licences will be the Water Framework Directive, however there
are no quantitative numbers available yet. This has been considered under scenario modelling
for the draft plan.
3.1.3 S3.1 Time-limited Licences
The Company has three time-limited licences:
Table 3: Time-limited licence quantities and dates
Licence Time Limited Quantity (Annual Average Ml/d)
Time Limit Date
River Severn (18/54/2/584/S) 11 31st March 2034
3/28/6/84/S and 3/28/6/99/S
50 30th March 2018
Blakedown 3
(18/54/6/140/G)
2 (0) 31st March 2021
Part of the River Severn Works licence (No. 584) is time limited to 2034 (11 Ml/d). This
abstraction is from the River Severn. The River Blithe Pumpback licence is scheduled to alter
abstracted volumes in 2018, however new licenced volumes will still exceed infrastructure
capacity. This means the licence change after 2018 has no impact on peak transfer capacities.
However, the deployable output is strongly linked to a clause allowing use of the River Trent
licence to maintain River Blithe flows above the Hands-Off Flow for the River Blithe.
Abstraction from the Blakedown 3 borehole is for the purpose of augmenting water levels in the
nearby pools and rivers and is neither used for public water supply nor affects the operation of
other boreholes
Overall, no allowance for time-limited licence is to be made in headroom. These are all to be
assessed in scenarios.

Mott MacDonald | Company Headroom Analysis 11Water Resource Management Plan 2019
387731 | 03 | F | 2 November 2017 https://mottmac.sharepoint.com/teams/pj-b3756/do/Reports/SSW Headroom Report - South Staffs Rev F.docx
3.1.4 S4 Bulk Supplies
The Company operates around 30 potable water connections at the boundaries of its supply
area which together constitute a net export of potable water. The majority of these are small in
nature and are known collectively as the Minor Exports. There is a much larger export to
Severn Trent Water in the Wolverhampton area which arises from the joint ownership by South
Staffs Water and Severn Trent Work of the River Severn abstraction.
The capacity of Minor Exports is up to 5 Ml/d but average usage has been consistently around 1
Ml/d and is largely independent of seasonal demands. Nevertheless, volumes have increased
on occasion to 2 Ml/d during the peak demand months. As a consequence, a positive
headroom value of 1 Ml/d is proposed.
The contractual entitlement for the Wolverhampton Export is 40.6 Ml/d at average and 48 Ml/d
at peak and has been adopted for the Company’s deployable output calculations. Whilst the
peak capacity is proven and has been assumed by Severn Trent Water in its planning
assumptions, the annual average volume is not taken and Severn Trent have indicated that
their modelling assumptions only allow for 36 Ml/d. Accordingly, a negative headroom
allowance of 4 Ml/d is proposed.
Table 4: SSW Bulk Supply Agreements and Uncertainty
Annual Average (Ml/d)
Peak Week (Ml/d)
Minimum Uncertainty (Ml/d)
Maximum Uncertainty (Ml/d)
Minor Exports 1.0 1.0 Triangular Avg 0.0
Peak 0.0
Avg 0.0
Peak +1.0
Wolverhampton Export
40.6 48.0 Triangular Avg 0.0
Peak 0.0
Avg -4.0
Peak +0.0
3.1.5 S5 Gradual Groundwater Pollution
The effects of a gradual or sudden pollution event can have a significant impact on deployable
output. Where this results in a long-term loss of deployable output then this should be included
in headroom. Three areas of uncertainty have been identified by South Staffs Water under this
category.
3.1.5.1 Physical Deterioration of Boreholes
The asset condition and performance of each borehole has been regularly undertaken since
PR09. This assessment has underpinned significant increases in investment under asset
maintenance in the Company’s groundwater sites. The average age of the Company’s
boreholes is more than 75 years and without this investment, significant borehole failures are
likely, resulting in a reduction in deployable output. Whilst it is assumed that sufficient capital
maintenance work will be funded and carried out to maintain stable serviceability, experience
has shown that losses in deployable output arise in two ways:
• Asset performance, as measured by water quality (sand and turbidity), will decline to
such an extent that outputs are cut back. Whilst short term reductions in output are accounted
for in the Company’s outage allowance, a significant reduction in permanent output may be
incurred for a number of years pending site enabling works. Moreover, when re-drilling is
required, there may be further delays for the drilling, testing and licencing process; and also, the
requirement to construct new pump houses and connecting pipelines to existing treatment and
network.
Mott MacDonald | Company Headroom Analysis 12Water Resource Management Plan 2019
387731 | 03 | F | 2 November 2017 https://mottmac.sharepoint.com/teams/pj-b3756/do/Reports/SSW Headroom Report - South Staffs Rev F.docx
• Where remedial or replacement work is undertaken, there is a risk that yields will be
lower or water quality may be different, with a resulting impact on deployable output.
Factors, Likelihood and Magnitude
The available evidence at SSW suggests that physical deterioration of boreholes can be divided
into three main categories, and each remedial option is associated with some risk.
1. Deterioration of solid casing causing ingress of poor quality water. Subsequent relining
can cause additional drawdown and a reduction in yield, or relining may not be practical causing
a reduction in source output if the borehole is filled
2. Chemical and/or biological encrustation & clogging of slotted casing and open-hole
sections, causing increased drawdown or water quality problems, with potential loss of yield.
Chemical or mechanical treatment may cause deterioration in raw water quality.
3. Collapse and/or erosion of sandstone borehole walls, causing turbidity and requiring a
drop in pumping rate, with potential loss of yield. Re-drilling or relining can cause additional
drawdown and a reduction in yield. Re-drilling can however allow an increase in yield,
particularly at peak.
The following assumptions have been used in evaluating the risk from borehole works in
headroom:
• The maximum groundwater deployable output that currently could be affected is 140
Ml/d (80% of peak total groundwater D.O.).
• When each source is relined or replaced, there is a 10% chance that the yield will be
reduced by 10%.
• When the borehole is replaced, there is a 5% chance that peak DO is increased by
20%.
• Over the first 20 years this represents a 10% chance of a total loss of 14 Ml/d offset by
a 5% chance of a total increase of 28 Ml/d (peak). This level of investment and hence
risk is assumed to continue over the remainder of the planning period.
The following discrete distribution was applied for each year for both annual average and peak
week:
Table 5: Physical Deterioration of Boreholes: Headroom distributions
Average Peak
Minimum Loss -1.4 Ml/d 0 Ml/d
Median Loss 0 Ml/d 0 Ml/d
Maximum Loss 0.67 Ml/d 0.7 Ml/d
Probability 1 5%
Probability 2 85% 90%
Probability 3 10% 10%
3.1.5.2 S5/2 Nitrate, Pesticide and Solvent contamination
From the point of view of headroom, uncertainty in future long-term trends in nitrate and other
groundwater contaminants has the potential to impact D.O. through a need for additional
treatment and associated losses. Any output failures due to short term or seasonal peaks in
nitrate are captured in company outage allowance.
Mott MacDonald | Company Headroom Analysis 13Water Resource Management Plan 2019
387731 | 03 | F | 2 November 2017 https://mottmac.sharepoint.com/teams/pj-b3756/do/Reports/SSW Headroom Report - South Staffs Rev F.docx
Based on nitrate trends, the Company has identified a risk that some sources and existing
blends (e.g. ASPW, CHPW1 and KIPW1) may exceed the nitrate limit during and after AMP7.
The potential D.O. loss is based on the following assumptions.
Only a small proportion of the output of each station would be treated to a sufficiently low nitrate
level to allow this to blend with the remainder of the source output, to bring the overall nitrate
level below the required standard. There will be 2% losses associated with the treated
component.
A triangular distribution has been applied to both annual average and peak week headroom, as
the treatment plant would treat the same amount of water under both scenarios. The risk
increases incrementally over time.
Table 6: Nitrate and other groundwater contamination: annual increases in headroom components from 2020
Average Peak Week
Minimum Loss 0 Ml/d 0 Ml/d
Most Likely 0.05 Ml/d 0.1 Ml/d
Maximum Loss 0.15 Ml/d 0.25 Ml/d
The uncertainty around nitrate treatment has been added with a starting point of 2020 in the
headroom model.
3.1.5.3 S5/3 Mine waters
Available evidence suggests that there is a small risk that the MGPW groundwater source could
be contaminated by rising mine water, following the cessation of remedial pumping from the
underlying coalfield.
Factors, Likelihood and Magnitude
Following the review of groundwater deployable outputs for the FWRMP, the dry year
deployable output of MGPW source for the purposes of the headroom model is 2.7 Ml/d at
average and peak based on likely NEP outcomes. A discrete distribution has been applied to
these values, which assumes a small probability (5%) that the total deployable output from the
source will be lost.
Table 7: Mine water headroom distributions
For annual average
For peak week
Volume Ml/d Probability Volume Ml/d Probability
Minimum Loss 0 95% 0 95%
Maximum Loss 2.7 5% 2.7 5%
3.1.6 S6 Accuracy of Supply-side Data: Groundwater
Data inaccuracy or lack of information can be a significant source of uncertainty around the
calculation of deployable output. We have examined the constraining factors which define the
Company’s deployable output figures and assessed the range of uncertainty around each of
these.
Mott MacDonald | Company Headroom Analysis 14Water Resource Management Plan 2019
387731 | 03 | F | 2 November 2017 https://mottmac.sharepoint.com/teams/pj-b3756/do/Reports/SSW Headroom Report - South Staffs Rev F.docx
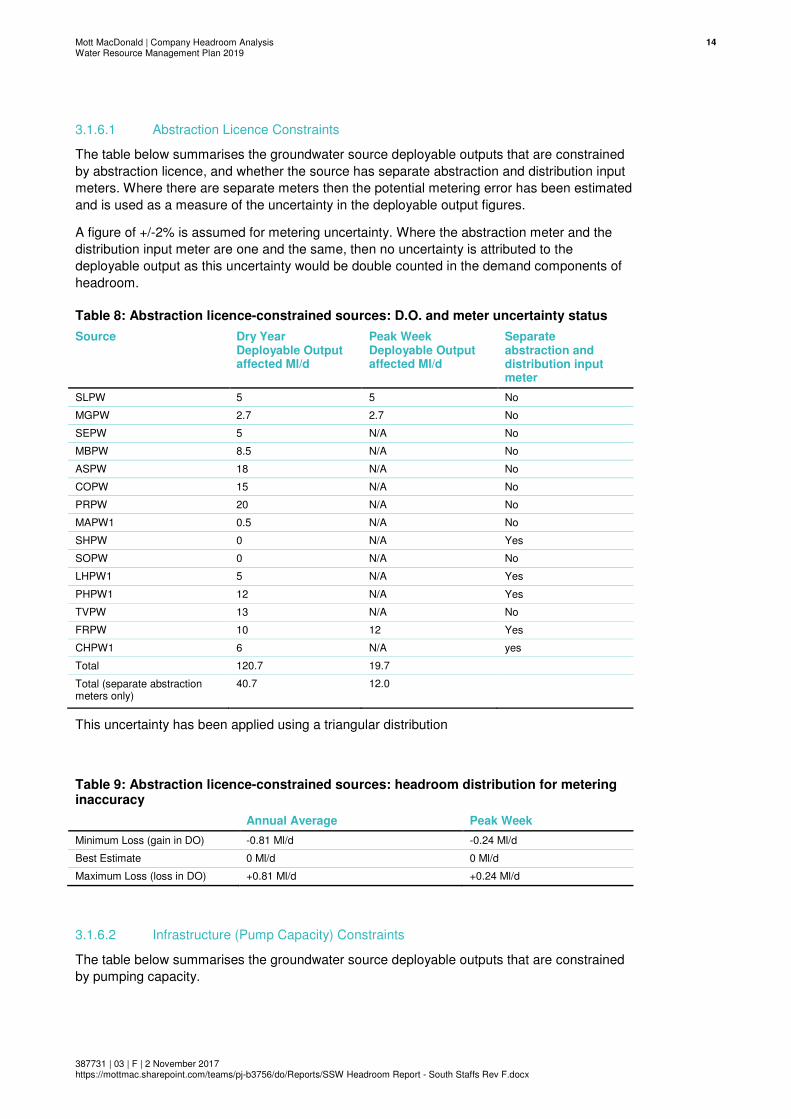
3.1.6.1 Abstraction Licence Constraints
The table below summarises the groundwater source deployable outputs that are constrained
by abstraction licence, and whether the source has separate abstraction and distribution input
meters. Where there are separate meters then the potential metering error has been estimated
and is used as a measure of the uncertainty in the deployable output figures.
A figure of +/-2% is assumed for metering uncertainty. Where the abstraction meter and the
distribution input meter are one and the same, then no uncertainty is attributed to the
deployable output as this uncertainty would be double counted in the demand components of
headroom.
Table 8: Abstraction licence-constrained sources: D.O. and meter uncertainty status
Source Dry Year Deployable Output affected Ml/d
Peak Week Deployable Output affected Ml/d
Separate abstraction and distribution input meter
SLPW 5 5 No
MGPW 2.7 2.7 No
SEPW 5 N/A No
MBPW 8.5 N/A No
ASPW 18 N/A No
COPW 15 N/A No
PRPW 20 N/A No
MAPW1 0.5 N/A No
SHPW 0 N/A Yes
SOPW 0 N/A No
LHPW1 5 N/A Yes
PHPW1 12 N/A Yes
TVPW 13 N/A No
FRPW 10 12 Yes
CHPW1 6 N/A yes
Total 120.7 19.7
Total (separate abstraction meters only)
40.7
12.0
This uncertainty has been applied using a triangular distribution
Table 9: Abstraction licence-constrained sources: headroom distribution for metering inaccuracy
Annual Average Peak Week
Minimum Loss (gain in DO) -0.81 Ml/d -0.24 Ml/d
Best Estimate 0 Ml/d 0 Ml/d
Maximum Loss (loss in DO) +0.81 Ml/d +0.24 Ml/d
3.1.6.2 Infrastructure (Pump Capacity) Constraints
The table below summarises the groundwater source deployable outputs that are constrained
by pumping capacity.

Mott MacDonald | Company Headroom Analysis 15Water Resource Management Plan 2019
387731 | 03 | F | 2 November 2017 https://mottmac.sharepoint.com/teams/pj-b3756/do/Reports/SSW Headroom Report - South Staffs Rev F.docx
Table 10: Infrastructure (pump capacity)-constrained sources D.O.
Source Average Deployable Output affected Ml/d
Peak Week Deployable Output affected
Ml/d
COPW N/A 18.0
ASPW N/A 18.0
MAPW1 N/A 0.52
Total 0.0 36.5
An overall uncertainty around pumping capacity has been derived from the detailed breakdown.
This is +/- 5%. This uncertainty has been applied using a triangular distribution
Table 11: Infrastructure (pump capacity)-constrained sources: headroom distribution
Annual Average Peak Week
Minimum Loss (gain in DO) 0 Ml/d -1.83 Ml/d
Best Estimate 0 Ml/d 0 Ml/d
Maximum Loss (loss in DO) 0 Ml/d +1.83 Ml/d
3.1.6.3 Pumping Water Level
No sources are constrained by potential yield.
3.1.6.4 Treatment Capacity
The following sources are constrained by treatment works capacity:
Table 12: Treatment-constrained sources D.O.
Source Average Deployable Output affected
Ml/d
Peak Week Deployable Output affected
Ml/d
GW PRPW1 N/A 20.08
GW HIPW 5.0 5.0
GW LHPW1 N/A 5.0
PHPW N/A 12.0
CCPW1 N/A 6.0
SW Central WTW N/A 110.0
SW River Severn WTW N/A 207.8
Total GW 5.0
SW 0.0
GW 48.0
SW 317.8
Operational staff have confirmed that the range of uncertainty around groundwater treatment
processes is small and so the Company has assumed a +/- 2% figure in headroom. The
following range of uncertainty proposed is based on a triangular distribution:
Table 13: Treatment-constrained sources: headroom distribution
Groundwater Annual Average Peak Week
Minimum Loss (gain in DO) -0.10 Ml/d -0.96 Ml/d
Best Estimate 0 Ml/d 0 Ml/d
Maximum Loss (loss in DO) +0.10 Ml/d +0.96 Ml/d
Mott MacDonald | Company Headroom Analysis 16Water Resource Management Plan 2019
387731 | 03 | F | 2 November 2017 https://mottmac.sharepoint.com/teams/pj-b3756/do/Reports/SSW Headroom Report - South Staffs Rev F.docx
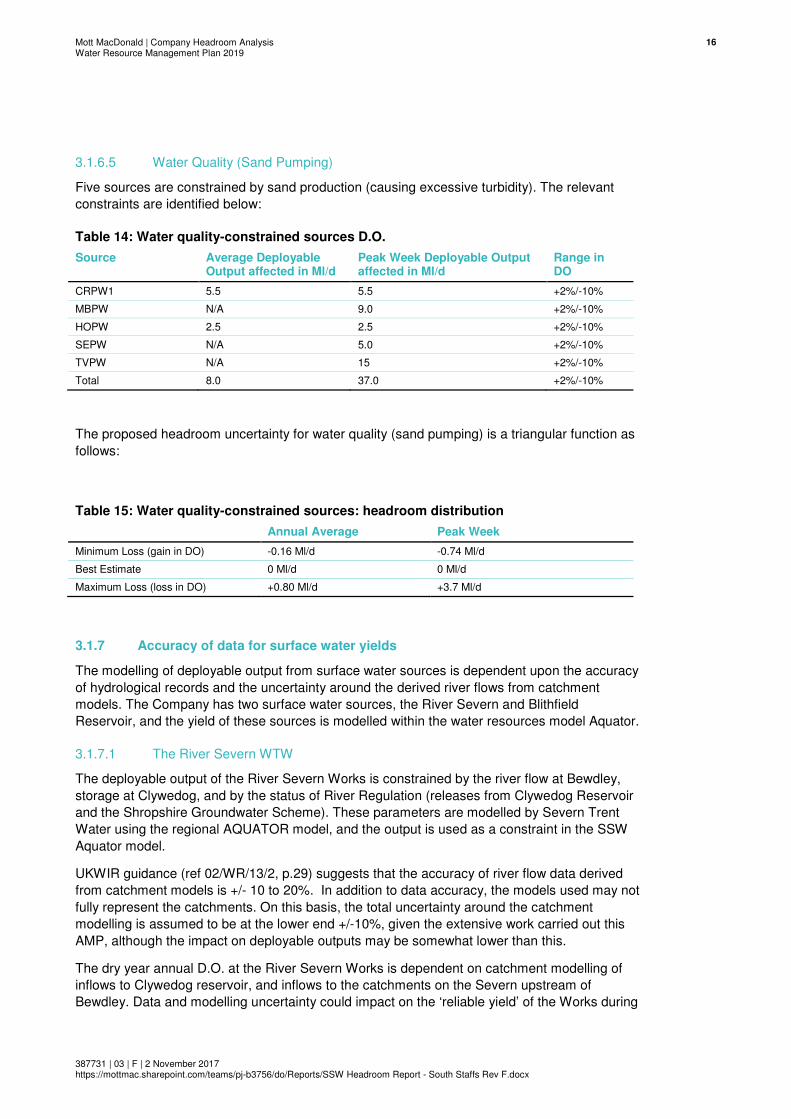
3.1.6.5 Water Quality (Sand Pumping)
Five sources are constrained by sand production (causing excessive turbidity). The relevant
constraints are identified below:
Table 14: Water quality-constrained sources D.O.
Source Average Deployable Output affected in Ml/d
Peak Week Deployable Output affected in Ml/d
Range in DO
CRPW1 5.5 5.5 +2%/-10%
MBPW N/A 9.0 +2%/-10%
HOPW 2.5 2.5 +2%/-10%
SEPW N/A 5.0 +2%/-10%
TVPW N/A 15 +2%/-10%
Total 8.0 37.0 +2%/-10%
The proposed headroom uncertainty for water quality (sand pumping) is a triangular function as
follows:
Table 15: Water quality-constrained sources: headroom distribution
Annual Average Peak Week
Minimum Loss (gain in DO) -0.16 Ml/d -0.74 Ml/d
Best Estimate 0 Ml/d 0 Ml/d
Maximum Loss (loss in DO) +0.80 Ml/d +3.7 Ml/d
3.1.7 Accuracy of data for surface water yields
The modelling of deployable output from surface water sources is dependent upon the accuracy
of hydrological records and the uncertainty around the derived river flows from catchment
models. The Company has two surface water sources, the River Severn and Blithfield
Reservoir, and the yield of these sources is modelled within the water resources model Aquator.
3.1.7.1 The River Severn WTW
The deployable output of the River Severn Works is constrained by the river flow at Bewdley,
storage at Clywedog, and by the status of River Regulation (releases from Clywedog Reservoir
and the Shropshire Groundwater Scheme). These parameters are modelled by Severn Trent
Water using the regional AQUATOR model, and the output is used as a constraint in the SSW
Aquator model.
UKWIR guidance (ref 02/WR/13/2, p.29) suggests that the accuracy of river flow data derived
from catchment models is +/- 10 to 20%. In addition to data accuracy, the models used may not
fully represent the catchments. On this basis, the total uncertainty around the catchment
modelling is assumed to be at the lower end +/-10%, given the extensive work carried out this
AMP, although the impact on deployable outputs may be somewhat lower than this.
The dry year annual D.O. at the River Severn Works is dependent on catchment modelling of
inflows to Clywedog reservoir, and inflows to the catchments on the Severn upstream of
Bewdley. Data and modelling uncertainty could impact on the ‘reliable yield’ of the Works during
Mott MacDonald | Company Headroom Analysis 17Water Resource Management Plan 2019
387731 | 03 | F | 2 November 2017 https://mottmac.sharepoint.com/teams/pj-b3756/do/Reports/SSW Headroom Report - South Staffs Rev F.docx
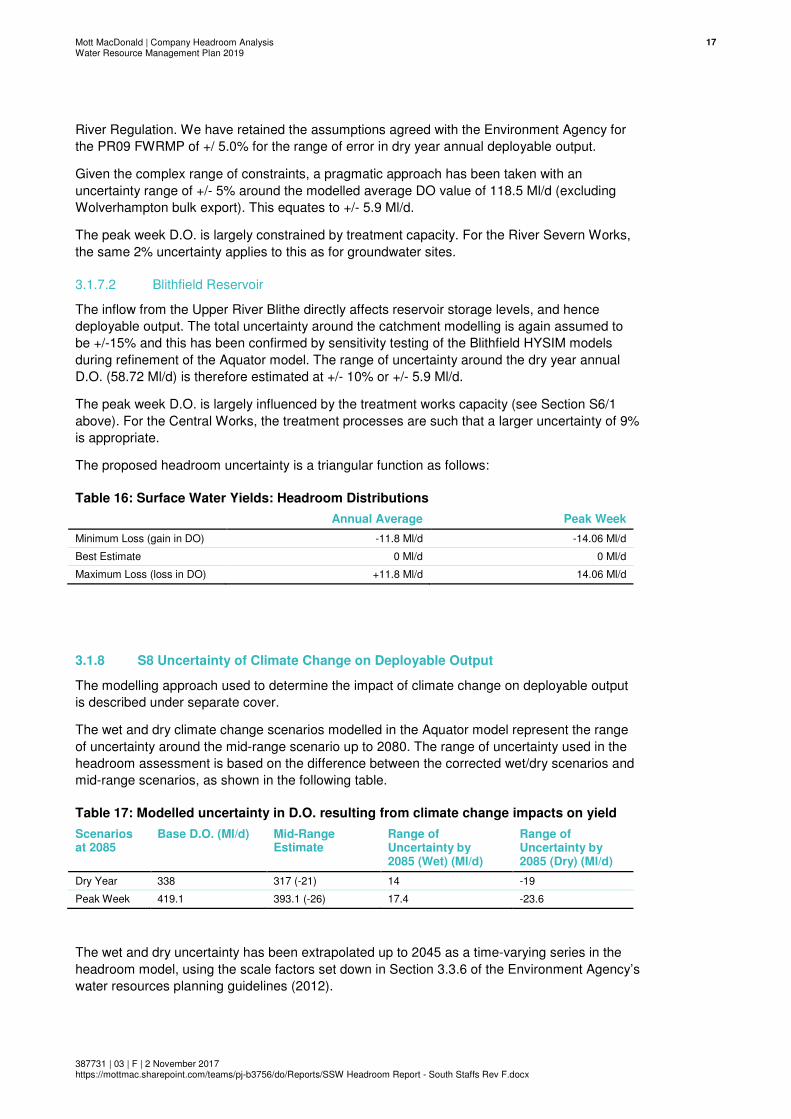
River Regulation. We have retained the assumptions agreed with the Environment Agency for
the PR09 FWRMP of +/ 5.0% for the range of error in dry year annual deployable output.
Given the complex range of constraints, a pragmatic approach has been taken with an
uncertainty range of +/- 5% around the modelled average DO value of 118.5 Ml/d (excluding
Wolverhampton bulk export). This equates to +/- 5.9 Ml/d.
The peak week D.O. is largely constrained by treatment capacity. For the River Severn Works,
the same 2% uncertainty applies to this as for groundwater sites.
3.1.7.2 Blithfield Reservoir
The inflow from the Upper River Blithe directly affects reservoir storage levels, and hence
deployable output. The total uncertainty around the catchment modelling is again assumed to
be +/-15% and this has been confirmed by sensitivity testing of the Blithfield HYSIM models
during refinement of the Aquator model. The range of uncertainty around the dry year annual
D.O. (58.72 Ml/d) is therefore estimated at +/- 10% or +/- 5.9 Ml/d.
The peak week D.O. is largely influenced by the treatment works capacity (see Section S6/1
above). For the Central Works, the treatment processes are such that a larger uncertainty of 9%
is appropriate.
The proposed headroom uncertainty is a triangular function as follows:
Table 16: Surface Water Yields: Headroom Distributions
Annual Average Peak Week
Minimum Loss (gain in DO) -11.8 Ml/d -14.06 Ml/d
Best Estimate 0 Ml/d 0 Ml/d
Maximum Loss (loss in DO) +11.8 Ml/d 14.06 Ml/d
3.1.8 S8 Uncertainty of Climate Change on Deployable Output
The modelling approach used to determine the impact of climate change on deployable output
is described under separate cover.
The wet and dry climate change scenarios modelled in the Aquator model represent the range
of uncertainty around the mid-range scenario up to 2080. The range of uncertainty used in the
headroom assessment is based on the difference between the corrected wet/dry scenarios and
mid-range scenarios, as shown in the following table.
Table 17: Modelled uncertainty in D.O. resulting from climate change impacts on yield
Scenarios at 2085
Base D.O. (Ml/d) Mid-Range Estimate
Range of Uncertainty by 2085 (Wet) (Ml/d)
Range of Uncertainty by 2085 (Dry) (Ml/d)
Dry Year 338 317 (-21) 14 -19
Peak Week 419.1 393.1 (-26) 17.4 -23.6
The wet and dry uncertainty has been extrapolated up to 2045 as a time-varying series in the
headroom model, using the scale factors set down in Section 3.3.6 of the Environment Agency’s
water resources planning guidelines (2012).

Mott MacDonald | Company Headroom Analysis 18Water Resource Management Plan 2019
387731 | 03 | F | 2 November 2017 https://mottmac.sharepoint.com/teams/pj-b3756/do/Reports/SSW Headroom Report - South Staffs Rev F.docx
Table 18: Climate Change Uncertainty in Deployable Output
Scenarios at 2045
Base D.O. (Ml/d) Mid-Range Estimate
Range of Uncertainty by 2045
(Wet) (Ml/d)
Range of Uncertainty by
2045 (Dry) (Ml/d)
Dry Year 338 328.5 (-9.5) 6.3 -8.6
Peak Week 419.1 407.3 (-11.8) 7.8 -10.7
This uncertainty range has been incorporated into both dry year annual average and peak week
headroom by assuming a triangular distribution with the upper and lower limits defined by the
wet and dry scenario results. The mid-range estimate is assumed to be zero but the correction
is incorporated within the baseline forecast. As the wet year case produces an increase in DO it
is treated as negative headroom and the dry year case vice versa.
3.1.9 S9 Uncertain output of new resource developments
South Staffs Water have no new resources due to be commissioned in their baseline
supply/demand forecast. Any new resources selected as options in the preferred plan will have
an uncertainty allowance in DO assigned to the final preferred headroom values.
3.2 Demand Components
3.2.1 D1/1 Accuracy of sub-component data
Potential errors in the measurement of distribution input are an important component of
headroom and are accounted for here. Only errors on meters which measure distribution input
separately to abstraction are accounted for, otherwise there would be a double count because
abstraction (metering) error is identified under S6/1.
The Company has assumed an equal accuracy measurement of +/- 2% over the planning
period. This will not be altered by subsequent meter replacements. Those distribution input
meters that are separate from the source meters are listed in the following table.
Table 19: Source Deployable Output and Distribution Input Meter Status
SOURCE NAME PR14 Annual Average D.O. (Ml/d)
PR14 Peak Week D.O. (Ml/d)
Separate Distribution input meter
SMPW 5.0 5.0 Yes
MGPW 2.7 2.7 Yes
SEPW 5.0 5.0 Yes
MBPW 8.5 9.0 No
CRPW1 5.5 5.5 Yes
CHPW1 10.0 10.0 No
COPW 15.0 18.0 No
KIPW1 9.0 9.0 No
PRPW1 20.0 20.0 No
ASPW 18.0 18.0 No
HIPW 5.6 5.6 No
MAPW1 0.52 0.52 No
HOPW 2.45 2.45 No
SHPW 0.0 0.0 Yes
SOPW 0.0 0.0 Yes
BVPW 4.8 4.8 No
Mott MacDonald | Company Headroom Analysis 19Water Resource Management Plan 2019
387731 | 03 | F | 2 November 2017 https://mottmac.sharepoint.com/teams/pj-b3756/do/Reports/SSW Headroom Report - South Staffs Rev F.docx
SOURCE NAME PR14 Annual Average D.O. (Ml/d)
PR14 Peak Week D.O. (Ml/d)
Separate Distribution input meter
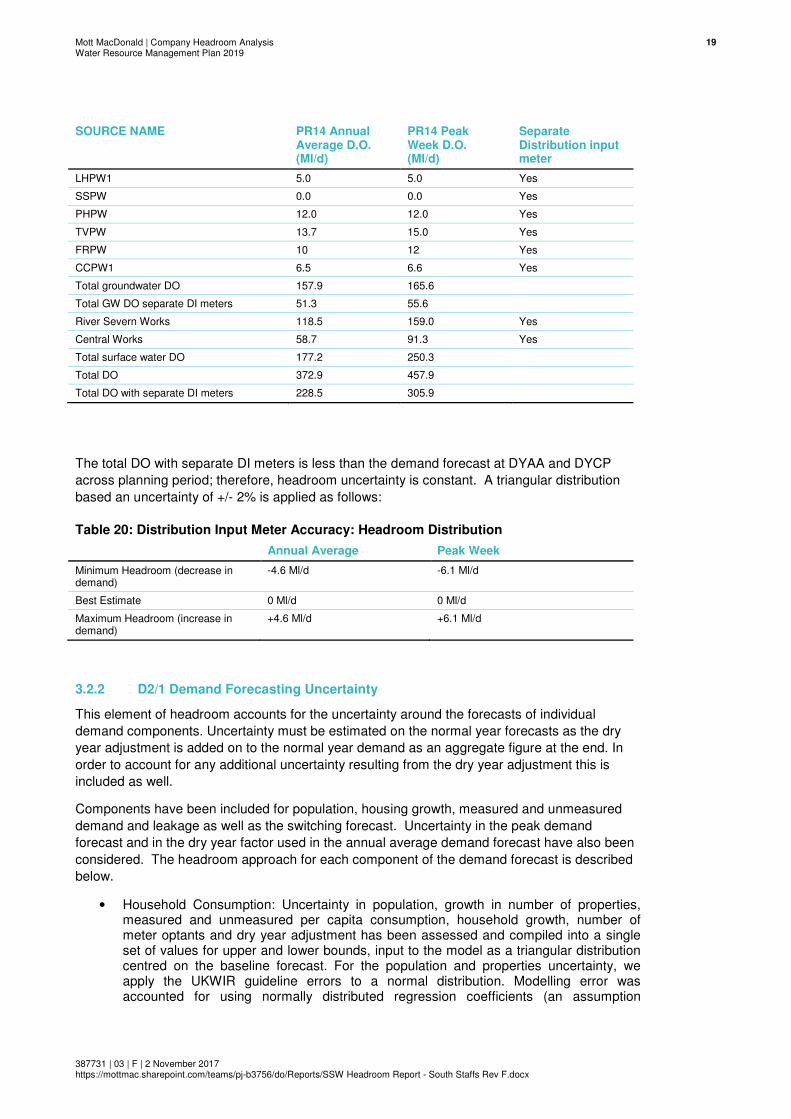
LHPW1 5.0 5.0 Yes
SSPW 0.0 0.0 Yes
PHPW 12.0 12.0 Yes
TVPW 13.7 15.0 Yes
FRPW 10 12 Yes
CCPW1 6.5 6.6 Yes
Total groundwater DO 157.9 165.6
Total GW DO separate DI meters 51.3 55.6
River Severn Works 118.5 159.0 Yes
Central Works 58.7 91.3 Yes
Total surface water DO 177.2 250.3
Total DO 372.9 457.9
Total DO with separate DI meters 228.5 305.9
The total DO with separate DI meters is less than the demand forecast at DYAA and DYCP
across planning period; therefore, headroom uncertainty is constant. A triangular distribution
based an uncertainty of +/- 2% is applied as follows:
Table 20: Distribution Input Meter Accuracy: Headroom Distribution
Annual Average Peak Week
Minimum Headroom (decrease in demand)
-4.6 Ml/d -6.1 Ml/d
Best Estimate 0 Ml/d 0 Ml/d
Maximum Headroom (increase in demand)
+4.6 Ml/d +6.1 Ml/d
3.2.2 D2/1 Demand Forecasting Uncertainty
This element of headroom accounts for the uncertainty around the forecasts of individual
demand components. Uncertainty must be estimated on the normal year forecasts as the dry
year adjustment is added on to the normal year demand as an aggregate figure at the end. In
order to account for any additional uncertainty resulting from the dry year adjustment this is
included as well.
Components have been included for population, housing growth, measured and unmeasured
demand and leakage as well as the switching forecast. Uncertainty in the peak demand
forecast and in the dry year factor used in the annual average demand forecast have also been
considered. The headroom approach for each component of the demand forecast is described
below.
• Household Consumption: Uncertainty in population, growth in number of properties, measured and unmeasured per capita consumption, household growth, number of meter optants and dry year adjustment has been assessed and compiled into a single set of values for upper and lower bounds, input to the model as a triangular distribution centred on the baseline forecast. For the population and properties uncertainty, we apply the UKWIR guideline errors to a normal distribution. Modelling error was accounted for using normally distributed regression coefficients (an assumption
Mott MacDonald | Company Headroom Analysis 20Water Resource Management Plan 2019
387731 | 03 | F | 2 November 2017 https://mottmac.sharepoint.com/teams/pj-b3756/do/Reports/SSW Headroom Report - South Staffs Rev F.docx
consistent with using ordinary least squares as the best linear unbiased estimator). The overall Household Consumption uncertainty is +/-13.22 Ml/d by 2045 for DYAA conditions, and +18 Ml/d to -19.1 Ml/d by 2045 for DYCP conditions.1
• Non-Household Consumption: Uncertainty around non-household consumption is estimated to be +/-5.06 Ml/d by 2045. This range was determined by looking at the range of different forecasts that were derived from different trend analyses and or linear models (with economic variables) and taking the mean/median and standard deviation of the distribution of these forecasts.2
• Leakage: Uncertainty around leakage has been determined as +/-5% of target leakage. This equates to +/-3.4 Ml/d in 2017, decreasing to +/-2.9 Ml/d by 2045: a triangular distribution has been used accordingly. This is consistent with work on SELL for the business plan.
• There are also uncertainties surrounding predicted peak consumption volumes used in the supply demand balance. This is because dry years do not occur regularly and the predicted demands do not always coincide with supply shortfalls. Review of historic data was used to define a triangular distribution between +/- 10 Ml/d for uncertainty in critical period uplift factor.
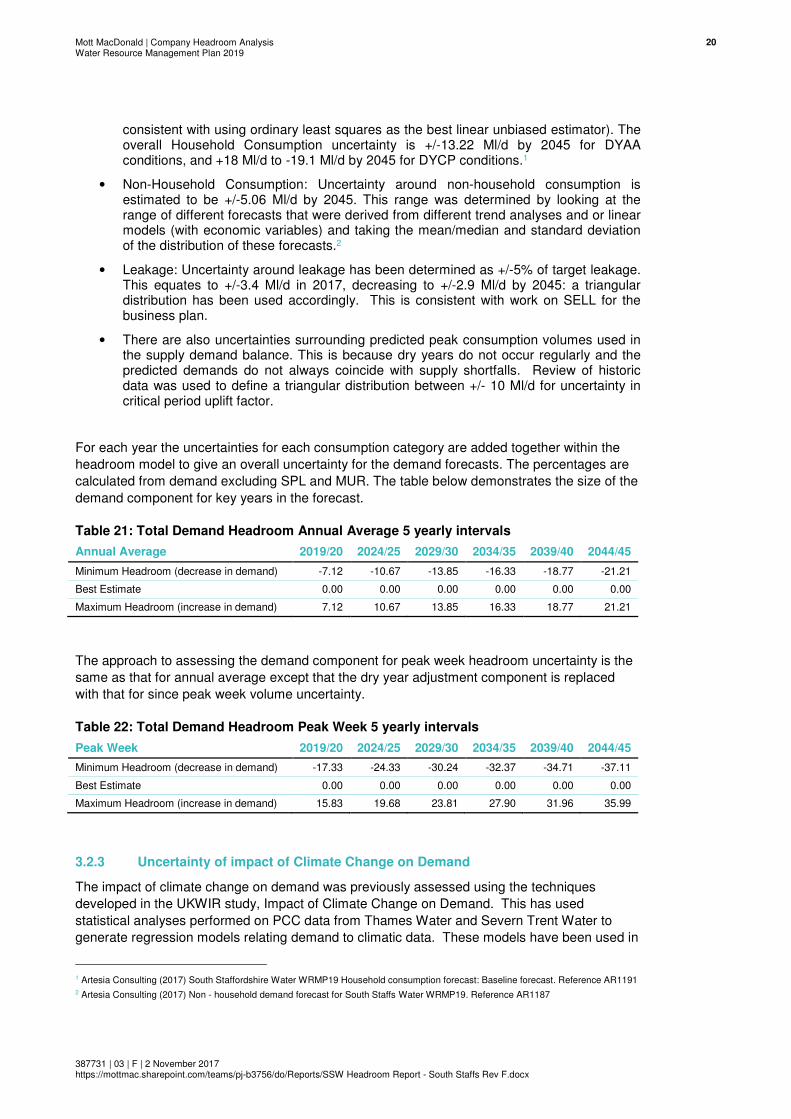
For each year the uncertainties for each consumption category are added together within the
headroom model to give an overall uncertainty for the demand forecasts. The percentages are
calculated from demand excluding SPL and MUR. The table below demonstrates the size of the
demand component for key years in the forecast.
Table 21: Total Demand Headroom Annual Average 5 yearly intervals
Annual Average 2019/20 2024/25 2029/30 2034/35 2039/40 2044/45
Minimum Headroom (decrease in demand) -7.12 -10.67 -13.85 -16.33 -18.77 -21.21
Best Estimate 0.00 0.00 0.00 0.00 0.00 0.00
Maximum Headroom (increase in demand) 7.12 10.67 13.85 16.33 18.77 21.21
The approach to assessing the demand component for peak week headroom uncertainty is the
same as that for annual average except that the dry year adjustment component is replaced
with that for since peak week volume uncertainty.
Table 22: Total Demand Headroom Peak Week 5 yearly intervals
Peak Week 2019/20 2024/25 2029/30 2034/35 2039/40 2044/45
Minimum Headroom (decrease in demand) -17.33 -24.33 -30.24 -32.37 -34.71 -37.11
Best Estimate 0.00 0.00 0.00 0.00 0.00 0.00
Maximum Headroom (increase in demand) 15.83 19.68 23.81 27.90 31.96 35.99
3.2.3 Uncertainty of impact of Climate Change on Demand
The impact of climate change on demand was previously assessed using the techniques
developed in the UKWIR study, Impact of Climate Change on Demand. This has used
statistical analyses performed on PCC data from Thames Water and Severn Trent Water to
generate regression models relating demand to climatic data. These models have been used in
1 Artesia Consulting (2017) South Staffordshire Water WRMP19 Household consumption forecast: Baseline forecast. Reference AR1191
2 Artesia Consulting (2017) Non - household demand forecast for South Staffs Water WRMP19. Reference AR1187

Mott MacDonald | Company Headroom Analysis 21Water Resource Management Plan 2019
387731 | 03 | F | 2 November 2017 https://mottmac.sharepoint.com/teams/pj-b3756/do/Reports/SSW Headroom Report - South Staffs Rev F.docx
combination with UKCP09 climate projections to derive algorithms and look-up tables for each
UK region.
The Company has selected the Severn Trent water model as it better simulates the water using
behaviour of the South Staffs customer base. It has used probability data on increase in
demand in the South Humber region as this geographically matches the majority of its supply
area. The data tables contain forecast values for the percentage increase in household
consumption and these have been directly applied using Company average PCC values on an
annual basis.
The table below shows the range of uncertainty associated with the forecast annual average
impact of climate change on demand. All impacts are scaled to a mid-value of zero to avoid
double counting the base CC demand impacts (which are included in baseline demand).
Probability data have been used to produce a triangular distribution.
Table 23: Climate Change Demand Uncertainty Annual Average: 5 yearly Headroom
Annual Average 2019/20 2024/25 2029/30 2034/35 2039/40 2044/45
P10 Headroom Ml/d 0.12 0.36 0.58 0.83 1.08 1.32
P50 Headroom Ml/d 0.00 0.00 0.00 0.00 0.00 0.00
P90 Headroom Ml/d -0.11 -0.27 -0.47 -0.64 -0.83 -1.01
Table 24: Climate Change Demand Uncertainty Peak Week: 5 yearly Headroom
Peak Week 2019/20 2024/25 2029/30 2034/35 2039/40 2044/45
P10 Headroom Ml/d 0.36 0.97 1.61 2.29 2.99 3.68
P50 Headroom Ml/d 0.00 0.00 0.00 0.00 0.00 0.00
P90 Headroom Ml/d -0.49 -1.38 -2.31 -3.25 -4.19 -5.16
3.3 Analysing the data
Once the distributions are selected, they are built into the @Risk model. The model is then run
for 10,000 iterations to produce the combined headroom. The in-built sensitivity functions are
used to analyse which inputs have the greatest impact on the result.
Mott MacDonald | Company Headroom Analysis 22Water Resource Management Plan 2019
387731 | 03 | F | 2 November 2017 https://mottmac.sharepoint.com/teams/pj-b3756/do/Reports/SSW Headroom Report - South Staffs Rev F.docx
4 Results and conclusions
4.1 Target Headroom Results
4.1.1 DYAA
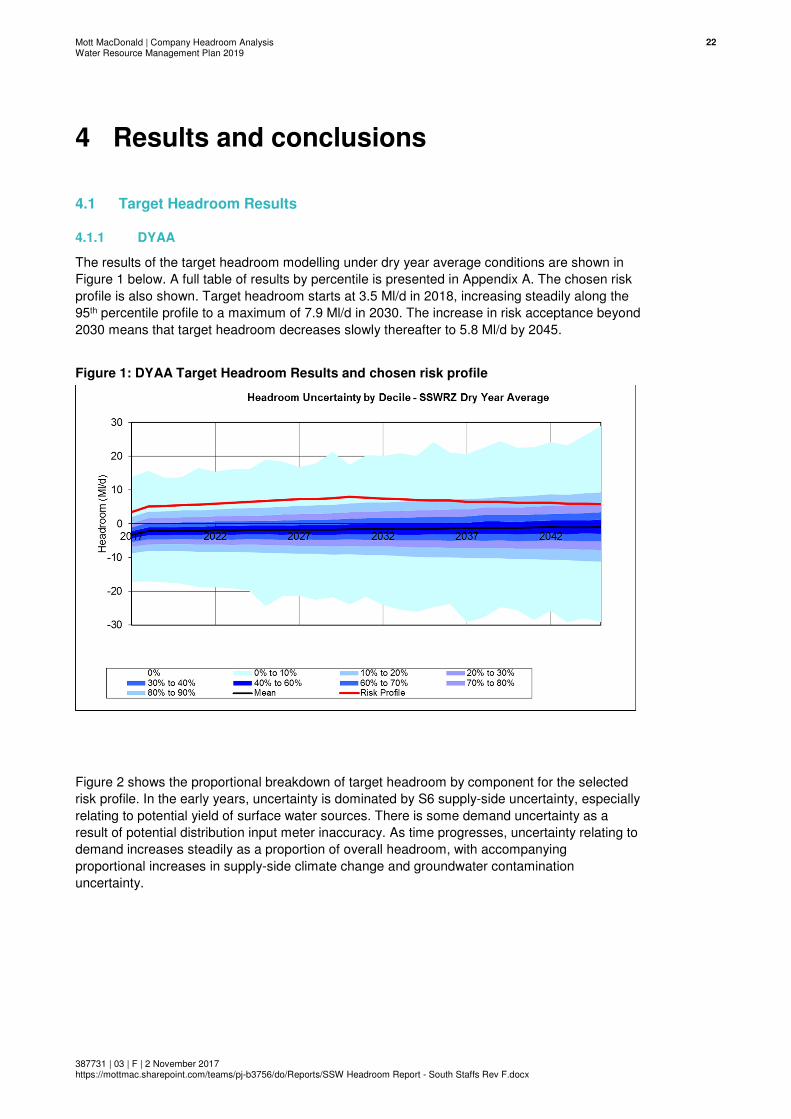
The results of the target headroom modelling under dry year average conditions are shown in
Figure 1 below. A full table of results by percentile is presented in Appendix A. The chosen risk
profile is also shown. Target headroom starts at 3.5 Ml/d in 2018, increasing steadily along the
95th percentile profile to a maximum of 7.9 Ml/d in 2030. The increase in risk acceptance beyond
2030 means that target headroom decreases slowly thereafter to 5.8 Ml/d by 2045.
Figure 1: DYAA Target Headroom Results and chosen risk profile
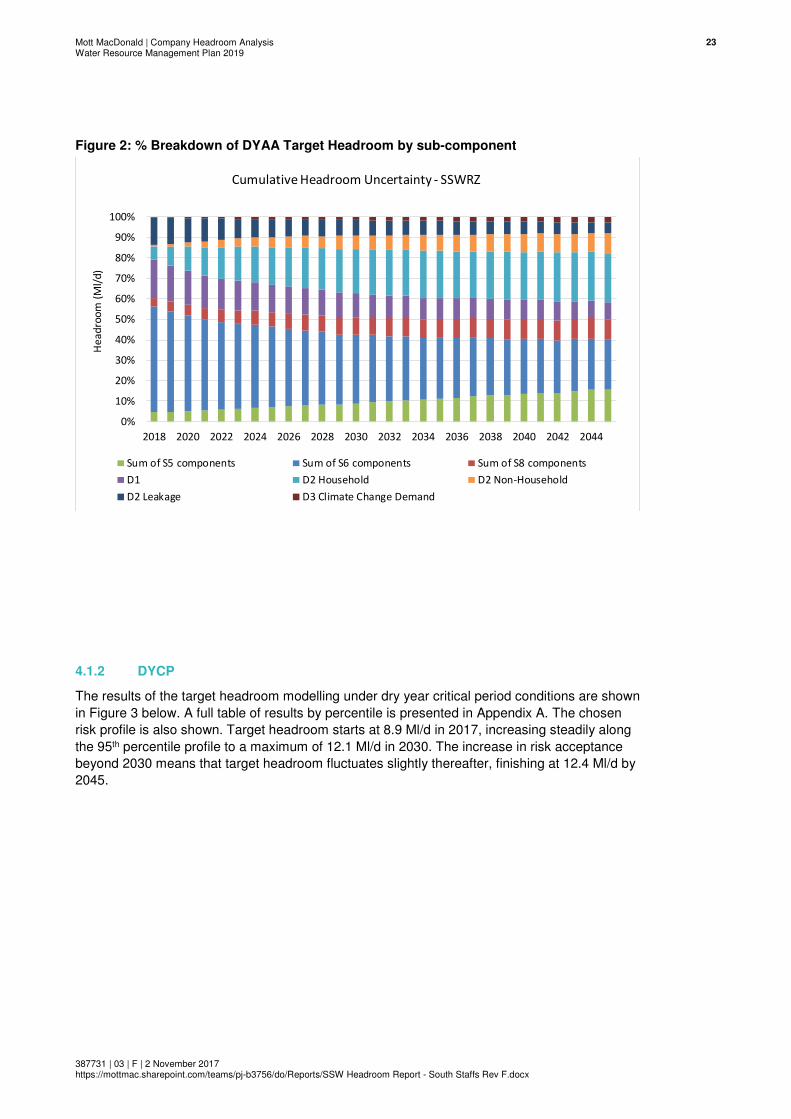
Figure 2 shows the proportional breakdown of target headroom by component for the selected
risk profile. In the early years, uncertainty is dominated by S6 supply-side uncertainty, especially
relating to potential yield of surface water sources. There is some demand uncertainty as a
result of potential distribution input meter inaccuracy. As time progresses, uncertainty relating to
demand increases steadily as a proportion of overall headroom, with accompanying
proportional increases in supply-side climate change and groundwater contamination
uncertainty.
Mott MacDonald | Company Headroom Analysis 23Water Resource Management Plan 2019
387731 | 03 | F | 2 November 2017 https://mottmac.sharepoint.com/teams/pj-b3756/do/Reports/SSW Headroom Report - South Staffs Rev F.docx
Figure 2: % Breakdown of DYAA Target Headroom by sub-component
4.1.2 DYCP
The results of the target headroom modelling under dry year critical period conditions are shown
in Figure 3 below. A full table of results by percentile is presented in Appendix A. The chosen
risk profile is also shown. Target headroom starts at 8.9 Ml/d in 2017, increasing steadily along
the 95th percentile profile to a maximum of 12.1 Ml/d in 2030. The increase in risk acceptance
beyond 2030 means that target headroom fluctuates slightly thereafter, finishing at 12.4 Ml/d by
2045.
0%
10%
20%
30%
40%
50%
60%
70%
80%
90%
100%
2018 2020 2022 2024 2026 2028 2030 2032 2034 2036 2038 2040 2042 2044
He
ad
roo
m (
Ml/
d)
Cumulative Headroom Uncertainty - SSWRZ
Sum of S5 components Sum of S6 components Sum of S8 components
D1 D2 Household D2 Non-Household
D2 Leakage D3 Climate Change Demand

Mott MacDonald | Company Headroom Analysis 24Water Resource Management Plan 2019
387731 | 03 | F | 2 November 2017 https://mottmac.sharepoint.com/teams/pj-b3756/do/Reports/SSW Headroom Report - South Staffs Rev F.docx
Figure 3: DYCP Target Headroom Results and chosen risk profile
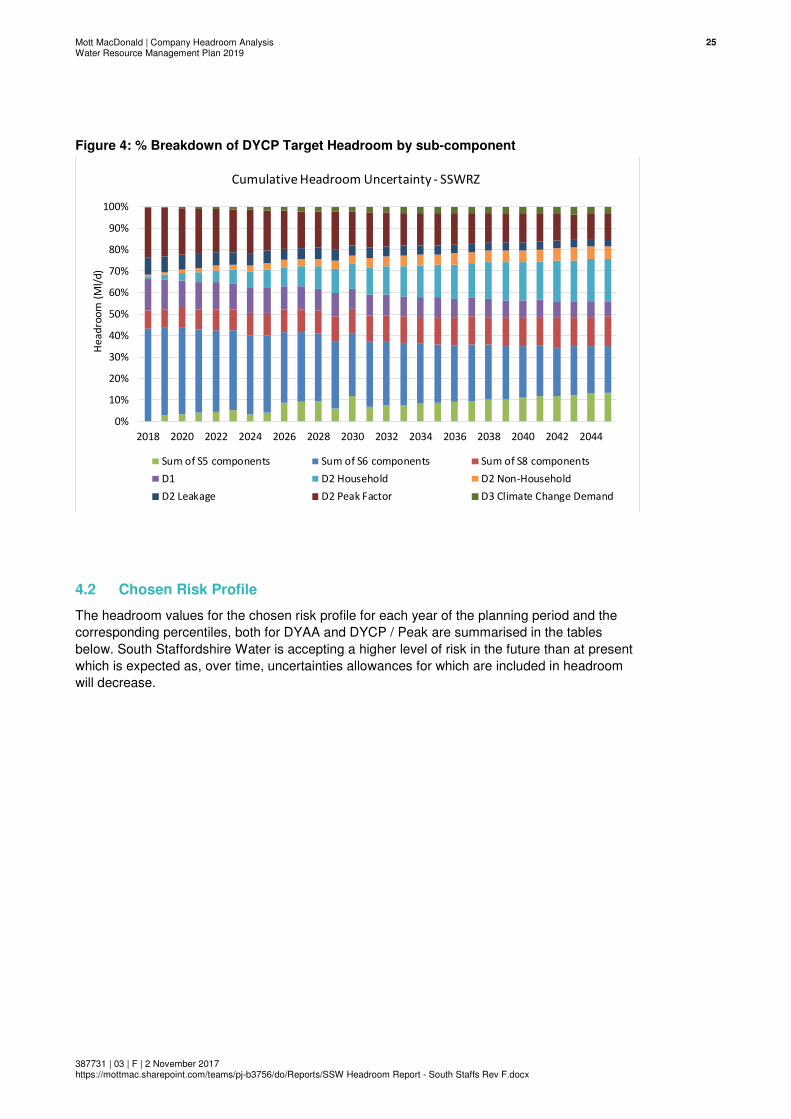
Figure 4 shows the proportional breakdown of target headroom by component for the selected
risk profile. In the early years, uncertainty is dominated by S6 supply-side uncertainty, especially
relating to potential yield of surface water sources. There is some demand uncertainty as a
result of potential distribution input meter inaccuracy. As time progresses, uncertainty relating to
demand increases steadily as a proportion of overall headroom, with accompanying
proportional increases in supply-side climate change and groundwater contamination
uncertainty.
Mott MacDonald | Company Headroom Analysis 25Water Resource Management Plan 2019
387731 | 03 | F | 2 November 2017 https://mottmac.sharepoint.com/teams/pj-b3756/do/Reports/SSW Headroom Report - South Staffs Rev F.docx
Figure 4: % Breakdown of DYCP Target Headroom by sub-component
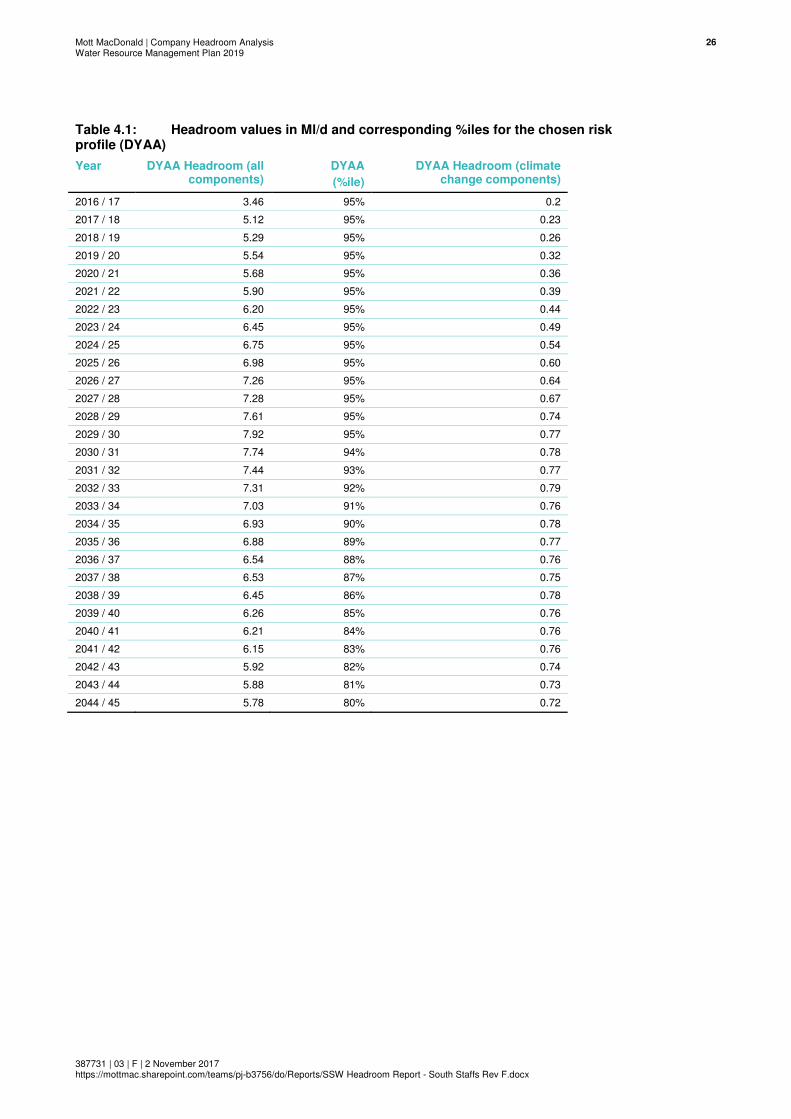
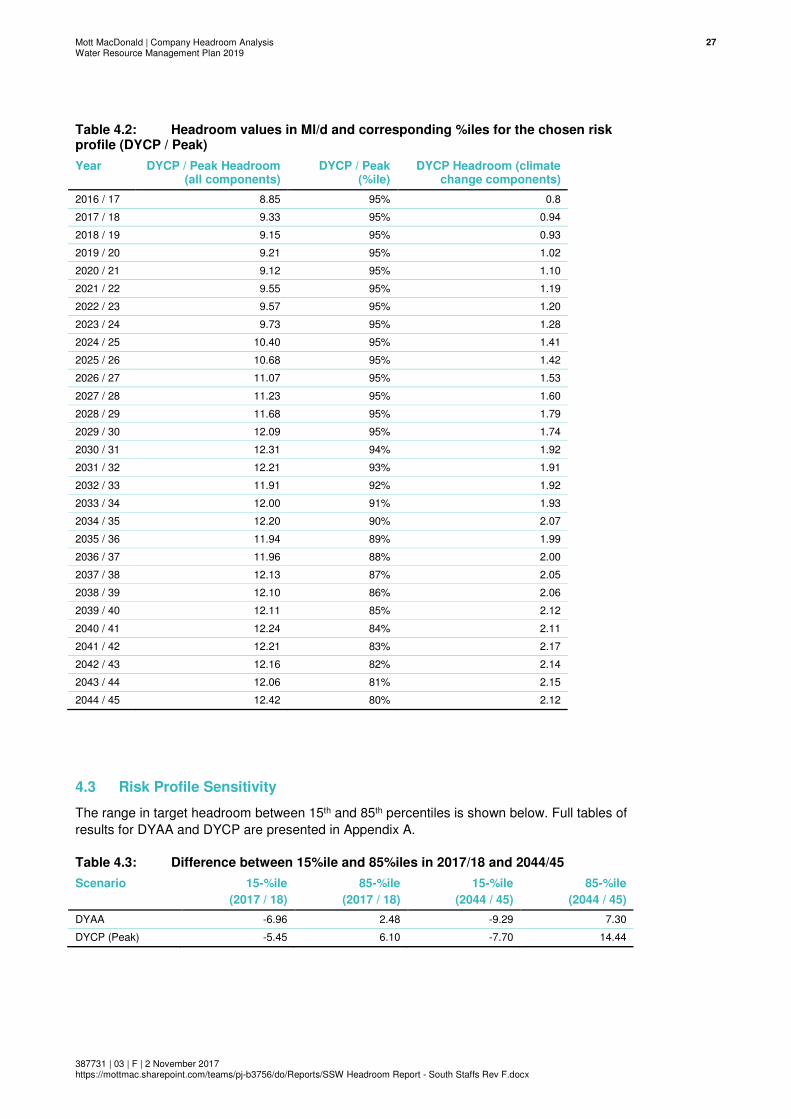
4.2 Chosen Risk Profile
The headroom values for the chosen risk profile for each year of the planning period and the
corresponding percentiles, both for DYAA and DYCP / Peak are summarised in the tables
below. South Staffordshire Water is accepting a higher level of risk in the future than at present
which is expected as, over time, uncertainties allowances for which are included in headroom
will decrease.
0%
10%
20%
30%
40%
50%
60%
70%
80%
90%
100%
2018 2020 2022 2024 2026 2028 2030 2032 2034 2036 2038 2040 2042 2044
He
ad
roo
m (
Ml/
d)
Cumulative Headroom Uncertainty - SSWRZ
Sum of S5 components Sum of S6 components Sum of S8 components
D1 D2 Household D2 Non-Household
D2 Leakage D2 Peak Factor D3 Climate Change Demand
Mott MacDonald | Company Headroom Analysis 26Water Resource Management Plan 2019
387731 | 03 | F | 2 November 2017 https://mottmac.sharepoint.com/teams/pj-b3756/do/Reports/SSW Headroom Report - South Staffs Rev F.docx
Table 4.1: Headroom values in Ml/d and corresponding %iles for the chosen risk profile (DYAA)
Year DYAA Headroom (all components)
DYAA
(%ile)
DYAA Headroom (climate change components)
2016 / 17 3.46 95% 0.2
2017 / 18 5.12 95% 0.23
2018 / 19 5.29 95% 0.26
2019 / 20 5.54 95% 0.32
2020 / 21 5.68 95% 0.36
2021 / 22 5.90 95% 0.39
2022 / 23 6.20 95% 0.44
2023 / 24 6.45 95% 0.49
2024 / 25 6.75 95% 0.54
2025 / 26 6.98 95% 0.60
2026 / 27 7.26 95% 0.64
2027 / 28 7.28 95% 0.67
2028 / 29 7.61 95% 0.74
2029 / 30 7.92 95% 0.77
2030 / 31 7.74 94% 0.78
2031 / 32 7.44 93% 0.77
2032 / 33 7.31 92% 0.79
2033 / 34 7.03 91% 0.76
2034 / 35 6.93 90% 0.78
2035 / 36 6.88 89% 0.77
2036 / 37 6.54 88% 0.76
2037 / 38 6.53 87% 0.75
2038 / 39 6.45 86% 0.78
2039 / 40 6.26 85% 0.76
2040 / 41 6.21 84% 0.76
2041 / 42 6.15 83% 0.76
2042 / 43 5.92 82% 0.74
2043 / 44 5.88 81% 0.73
2044 / 45 5.78 80% 0.72
Mott MacDonald | Company Headroom Analysis 27Water Resource Management Plan 2019
387731 | 03 | F | 2 November 2017 https://mottmac.sharepoint.com/teams/pj-b3756/do/Reports/SSW Headroom Report - South Staffs Rev F.docx
Table 4.2: Headroom values in Ml/d and corresponding %iles for the chosen risk profile (DYCP / Peak)
Year DYCP / Peak Headroom (all components)
DYCP / Peak (%ile)
DYCP Headroom (climate change components)
2016 / 17 8.85 95% 0.8
2017 / 18 9.33 95% 0.94
2018 / 19 9.15 95% 0.93
2019 / 20 9.21 95% 1.02
2020 / 21 9.12 95% 1.10
2021 / 22 9.55 95% 1.19
2022 / 23 9.57 95% 1.20
2023 / 24 9.73 95% 1.28
2024 / 25 10.40 95% 1.41
2025 / 26 10.68 95% 1.42
2026 / 27 11.07 95% 1.53
2027 / 28 11.23 95% 1.60
2028 / 29 11.68 95% 1.79
2029 / 30 12.09 95% 1.74
2030 / 31 12.31 94% 1.92
2031 / 32 12.21 93% 1.91
2032 / 33 11.91 92% 1.92
2033 / 34 12.00 91% 1.93
2034 / 35 12.20 90% 2.07
2035 / 36 11.94 89% 1.99
2036 / 37 11.96 88% 2.00
2037 / 38 12.13 87% 2.05
2038 / 39 12.10 86% 2.06
2039 / 40 12.11 85% 2.12
2040 / 41 12.24 84% 2.11
2041 / 42 12.21 83% 2.17
2042 / 43 12.16 82% 2.14
2043 / 44 12.06 81% 2.15
2044 / 45 12.42 80% 2.12
4.3 Risk Profile Sensitivity
The range in target headroom between 15th and 85th percentiles is shown below. Full tables of
results for DYAA and DYCP are presented in Appendix A.
Table 4.3: Difference between 15%ile and 85%iles in 2017/18 and 2044/45
Scenario 15-%ile
(2017 / 18)
85-%ile
(2017 / 18)
15-%ile
(2044 / 45)
85-%ile
(2044 / 45)
DYAA -6.96 2.48 -9.29 7.30
DYCP (Peak) -5.45 6.10 -7.70 14.44

Mott MacDonald | Company Headroom Analysis 28Water Resource Management Plan 2019
387731 | 03 | F | 2 November 2017 https://mottmac.sharepoint.com/teams/pj-b3756/do/Reports/SSW Headroom Report - South Staffs Rev F.docx
Appendices
A. Target Headroom Uncertainty Results Tables 29

Mott MacDonald | Company Headroom Analysis 29Water Resource Management Plan 2019
387731 | 03 | F | 2 November 2017 https://mottmac.sharepoint.com/teams/pj-b3756/do/Reports/SSW Headroom Report - South Staffs Rev F.docx
A. Target Headroom Uncertainty Results
Tables

Mott MacDonald | Company Headroom Analysis 1Water Resource Management Plan 2019
387731 | 03 | F | 2 November 2017 https://mottmac.sharepoint.com/teams/pj-b3756/do/Reports/SSW Headroom Report - South Staffs Rev F.docx
Table 4: DYAA Target Headroom Percentiles by Year
Percentiles 0 2017 0 2018 0 2019 0 2020 0 2021 0 2022 0 2023 0 2024 0 2025 0 2026 2027 2028 2029 2030 2031 2032 2033 2034 2035 2036 2037 2038 2039 2040 2041 2042 2043 2044 2045
0% -17.14 -17.03 -17.30 -17.79 -18.72 -18.84 -19.11 -19.79 -24.41 -21.47 -21.36 -22.56 -21.74 -23.83 -21.55 -24.07 -25.44 -26.05 -24.71 -23.72 -29.01 -27.76 -24.65 -25.54 -28.46 -25.85 -29.22 -27.99 -29.06
1% -12.96 -12.54 -12.61 -12.52 -13.17 -13.15 -13.57 -13.49 -13.70 -14.04 -14.24 -14.23 -14.79 -15.25 -15.15 -15.70 -15.86 -16.24 -16.55 -16.45 -16.57 -17.15 -17.21 -17.38 -17.86 -18.24 -18.79 -18.67 -18.97
2% -11.83 -11.40 -11.47 -11.36 -11.96 -11.95 -12.11 -12.29 -12.31 -12.64 -12.87 -12.91 -13.51 -13.44 -13.55 -14.24 -14.23 -14.87 -14.85 -14.68 -14.99 -15.32 -15.56 -15.87 -15.86 -16.26 -16.74 -17.06 -16.99
3% -11.11 -10.66 -10.68 -10.59 -11.24 -11.03 -11.35 -11.40 -11.53 -11.71 -12.05 -12.15 -12.31 -12.55 -12.60 -13.12 -13.11 -13.80 -13.73 -13.69 -13.87 -14.27 -14.27 -14.78 -14.63 -15.04 -15.32 -15.64 -15.75
4% -10.56 -10.11 -10.04 -10.07 -10.53 -10.52 -10.58 -10.78 -10.81 -11.09 -11.36 -11.44 -11.66 -11.82 -11.99 -12.32 -12.41 -12.94 -12.91 -12.81 -13.07 -13.41 -13.39 -13.89 -13.79 -14.04 -14.34 -14.80 -14.92
5% -10.05 -9.56 -9.60 -9.62 -9.98 -9.95 -10.14 -10.23 -10.35 -10.60 -10.75 -10.92 -11.16 -11.14 -11.40 -11.55 -11.84 -12.32 -12.23 -12.25 -12.35 -12.77 -12.64 -13.27 -13.03 -13.30 -13.64 -13.96 -14.13
6% -9.75 -9.19 -9.22 -9.20 -9.61 -9.59 -9.69 -9.83 -9.97 -10.17 -10.24 -10.43 -10.71 -10.64 -10.77 -10.94 -11.32 -11.73 -11.69 -11.71 -11.78 -12.15 -12.11 -12.66 -12.44 -12.72 -12.92 -13.18 -13.40
7% -9.46 -8.90 -8.90 -8.89 -9.23 -9.19 -9.31 -9.46 -9.59 -9.74 -9.82 -10.02 -10.34 -10.10 -10.39 -10.38 -10.82 -11.25 -11.18 -11.18 -11.28 -11.59 -11.66 -12.04 -11.92 -12.14 -12.25 -12.61 -12.71
8% -9.25 -8.63 -8.58 -8.59 -8.89 -8.88 -8.96 -9.11 -9.23 -9.39 -9.48 -9.60 -9.90 -9.65 -10.00 -9.94 -10.39 -10.73 -10.71 -10.75 -10.79 -11.13 -11.15 -11.52 -11.44 -11.57 -11.80 -12.06 -12.10
9% -8.97 -8.35 -8.28 -8.35 -8.61 -8.58 -8.67 -8.75 -8.86 -9.06 -9.20 -9.23 -9.55 -9.31 -9.62 -9.60 -9.99 -10.29 -10.36 -10.38 -10.44 -10.65 -10.67 -11.01 -10.97 -11.10 -11.35 -11.64 -11.59
10% -8.70 -8.11 -8.00 -8.07 -8.31 -8.31 -8.37 -8.49 -8.54 -8.78 -8.89 -8.93 -9.17 -9.02 -9.26 -9.26 -9.60 -9.88 -9.98 -9.98 -10.06 -10.27 -10.22 -10.56 -10.56 -10.69 -10.85 -11.13 -11.20
11% -8.46 -7.87 -7.77 -7.77 -8.05 -8.06 -8.11 -8.22 -8.28 -8.50 -8.57 -8.65 -8.85 -8.73 -8.97 -8.98 -9.30 -9.52 -9.62 -9.64 -9.70 -9.93 -9.87 -10.14 -10.20 -10.32 -10.46 -10.76 -10.81
12% -8.26 -7.63 -7.56 -7.52 -7.81 -7.78 -7.87 -7.92 -7.99 -8.24 -8.25 -8.32 -8.55 -8.46 -8.60 -8.68 -8.98 -9.21 -9.28 -9.31 -9.36 -9.56 -9.48 -9.78 -9.84 -9.97 -10.05 -10.31 -10.41
13% -8.07 -7.40 -7.36 -7.29 -7.55 -7.55 -7.66 -7.66 -7.74 -7.96 -8.01 -8.05 -8.28 -8.23 -8.31 -8.42 -8.63 -8.94 -9.00 -8.99 -9.01 -9.27 -9.17 -9.46 -9.45 -9.60 -9.71 -9.92 -10.02
14% -7.86 -7.17 -7.15 -7.10 -7.33 -7.31 -7.44 -7.43 -7.49 -7.70 -7.79 -7.84 -8.02 -7.90 -8.01 -8.12 -8.36 -8.62 -8.67 -8.72 -8.70 -8.91 -8.80 -9.15 -9.06 -9.30 -9.40 -9.55 -9.67
15% -7.65 -6.96 -6.96 -6.87 -7.11 -7.10 -7.23 -7.18 -7.26 -7.48 -7.59 -7.60 -7.76 -7.64 -7.79 -7.86 -8.10 -8.35 -8.40 -8.38 -8.37 -8.58 -8.47 -8.83 -8.75 -8.97 -9.07 -9.19 -9.29
16% -7.47 -6.78 -6.77 -6.70 -6.91 -6.90 -7.02 -6.99 -7.07 -7.25 -7.35 -7.41 -7.52 -7.41 -7.56 -7.64 -7.84 -8.03 -8.12 -8.09 -8.07 -8.27 -8.20 -8.56 -8.48 -8.59 -8.78 -8.83 -8.90
17% -7.29 -6.60 -6.59 -6.51 -6.69 -6.70 -6.86 -6.75 -6.86 -7.05 -7.13 -7.16 -7.33 -7.22 -7.29 -7.40 -7.59 -7.77 -7.78 -7.84 -7.85 -8.00 -7.90 -8.27 -8.14 -8.24 -8.45 -8.53 -8.58
18% -7.14 -6.43 -6.38 -6.33 -6.50 -6.51 -6.69 -6.55 -6.68 -6.82 -6.89 -6.97 -7.12 -6.98 -7.07 -7.18 -7.35 -7.52 -7.52 -7.58 -7.61 -7.75 -7.65 -7.98 -7.87 -7.95 -8.14 -8.20 -8.31
19% -6.98 -6.28 -6.23 -6.17 -6.31 -6.32 -6.50 -6.32 -6.50 -6.66 -6.68 -6.77 -6.94 -6.73 -6.88 -6.97 -7.09 -7.28 -7.26 -7.38 -7.38 -7.46 -7.40 -7.72 -7.63 -7.64 -7.84 -7.91 -7.99
20% -6.79 -6.08 -6.06 -6.00 -6.15 -6.14 -6.34 -6.13 -6.30 -6.47 -6.52 -6.56 -6.69 -6.55 -6.67 -6.73 -6.86 -7.03 -7.01 -7.11 -7.10 -7.20 -7.14 -7.43 -7.36 -7.36 -7.57 -7.65 -7.74
21% -6.64 -5.92 -5.89 -5.82 -5.96 -5.96 -6.16 -5.97 -6.11 -6.26 -6.30 -6.32 -6.50 -6.34 -6.44 -6.50 -6.68 -6.79 -6.74 -6.89 -6.90 -6.97 -6.88 -7.16 -7.06 -7.08 -7.31 -7.40 -7.46
22% -6.49 -5.79 -5.72 -5.68 -5.81 -5.80 -5.99 -5.77 -5.94 -6.11 -6.10 -6.17 -6.30 -6.14 -6.24 -6.25 -6.44 -6.57 -6.55 -6.64 -6.67 -6.72 -6.64 -6.90 -6.80 -6.84 -7.03 -7.14 -7.15
23% -6.35 -5.63 -5.58 -5.51 -5.65 -5.63 -5.83 -5.59 -5.75 -5.94 -5.90 -5.98 -6.10 -5.92 -6.07 -6.03 -6.24 -6.36 -6.30 -6.43 -6.43 -6.52 -6.41 -6.65 -6.56 -6.55 -6.78 -6.88 -6.90
24% -6.21 -5.47 -5.43 -5.36 -5.49 -5.47 -5.66 -5.43 -5.59 -5.77 -5.70 -5.79 -5.91 -5.74 -5.88 -5.83 -6.01 -6.12 -6.11 -6.21 -6.21 -6.28 -6.17 -6.42 -6.34 -6.29 -6.53 -6.64 -6.59
25% -6.07 -5.35 -5.27 -5.20 -5.35 -5.31 -5.49 -5.31 -5.42 -5.57 -5.50 -5.60 -5.73 -5.57 -5.71 -5.65 -5.85 -5.90 -5.86 -6.02 -5.98 -6.04 -5.93 -6.22 -6.13 -6.04 -6.24 -6.41 -6.36
26% -5.93 -5.23 -5.15 -5.04 -5.18 -5.15 -5.31 -5.14 -5.25 -5.42 -5.34 -5.43 -5.55 -5.38 -5.54 -5.45 -5.67 -5.69 -5.66 -5.84 -5.79 -5.82 -5.70 -5.98 -5.92 -5.82 -6.04 -6.14 -6.13
27% -5.80 -5.08 -5.01 -4.91 -5.02 -5.00 -5.15 -5.00 -5.09 -5.23 -5.14 -5.27 -5.36 -5.18 -5.33 -5.25 -5.47 -5.52 -5.51 -5.65 -5.57 -5.63 -5.49 -5.73 -5.70 -5.62 -5.81 -5.90 -5.89
28% -5.70 -4.93 -4.91 -4.75 -4.90 -4.86 -5.02 -4.83 -4.93 -5.08 -4.97 -5.12 -5.16 -5.02 -5.16 -5.07 -5.27 -5.32 -5.33 -5.44 -5.36 -5.43 -5.29 -5.51 -5.49 -5.38 -5.58 -5.62 -5.67
29% -5.57 -4.81 -4.79 -4.60 -4.75 -4.72 -4.89 -4.67 -4.76 -4.94 -4.82 -4.94 -5.01 -4.85 -4.99 -4.91 -5.09 -5.13 -5.12 -5.23 -5.13 -5.24 -5.08 -5.35 -5.28 -5.17 -5.39 -5.39 -5.40
30% -5.45 -4.69 -4.68 -4.49 -4.61 -4.57 -4.74 -4.54 -4.60 -4.78 -4.67 -4.75 -4.84 -4.67 -4.80 -4.74 -4.91 -4.94 -4.94 -5.01 -4.91 -5.01 -4.87 -5.14 -5.06 -4.94 -5.10 -5.16 -5.19
31% -5.32 -4.56 -4.53 -4.36 -4.47 -4.43 -4.59 -4.38 -4.48 -4.66 -4.51 -4.59 -4.66 -4.54 -4.64 -4.55 -4.73 -4.75 -4.75 -4.78 -4.72 -4.78 -4.67 -4.96 -4.83 -4.75 -4.89 -4.94 -4.97
32% -5.18 -4.46 -4.41 -4.26 -4.34 -4.29 -4.45 -4.26 -4.32 -4.51 -4.35 -4.44 -4.47 -4.39 -4.44 -4.39 -4.59 -4.55 -4.54 -4.60 -4.52 -4.56 -4.44 -4.78 -4.61 -4.53 -4.67 -4.74 -4.74
33% -5.07 -4.30 -4.28 -4.14 -4.20 -4.15 -4.32 -4.12 -4.16 -4.33 -4.21 -4.26 -4.32 -4.23 -4.28 -4.20 -4.44 -4.39 -4.35 -4.39 -4.30 -4.39 -4.25 -4.53 -4.42 -4.34 -4.48 -4.54 -4.55
34% -4.96 -4.16 -4.16 -4.02 -4.08 -4.01 -4.18 -3.97 -4.01 -4.20 -4.07 -4.11 -4.18 -4.08 -4.10 -4.03 -4.29 -4.21 -4.17 -4.21 -4.14 -4.23 -4.08 -4.33 -4.22 -4.12 -4.25 -4.29 -4.30
35% -4.85 -4.04 -4.04 -3.88 -3.96 -3.87 -4.04 -3.84 -3.85 -4.04 -3.92 -3.98 -4.01 -3.91 -3.95 -3.87 -4.09 -4.04 -3.99 -4.03 -3.99 -4.02 -3.89 -4.16 -4.02 -3.93 -4.03 -4.08 -4.11
36% -4.75 -3.92 -3.91 -3.75 -3.81 -3.73 -3.87 -3.70 -3.71 -3.91 -3.76 -3.84 -3.86 -3.73 -3.81 -3.72 -3.95 -3.89 -3.83 -3.88 -3.84 -3.79 -3.70 -3.95 -3.80 -3.75 -3.86 -3.85 -3.89
37% -4.64 -3.79 -3.78 -3.60 -3.70 -3.62 -3.74 -3.56 -3.58 -3.77 -3.61 -3.69 -3.69 -3.59 -3.67 -3.55 -3.75 -3.71 -3.65 -3.70 -3.66 -3.60 -3.52 -3.74 -3.58 -3.50 -3.67 -3.63 -3.66
38% -4.53 -3.65 -3.64 -3.49 -3.57 -3.48 -3.58 -3.44 -3.41 -3.62 -3.46 -3.53 -3.54 -3.44 -3.50 -3.38 -3.58 -3.55 -3.46 -3.53 -3.48 -3.41 -3.33 -3.54 -3.40 -3.30 -3.49 -3.44 -3.43
39% -4.44 -3.53 -3.51 -3.37 -3.44 -3.34 -3.45 -3.29 -3.30 -3.47 -3.31 -3.38 -3.39 -3.30 -3.34 -3.21 -3.41 -3.40 -3.29 -3.36 -3.29 -3.19 -3.13 -3.33 -3.24 -3.08 -3.31 -3.19 -3.21
40% -4.32 -3.40 -3.40 -3.26 -3.32 -3.21 -3.32 -3.14 -3.16 -3.33 -3.17 -3.23 -3.24 -3.15 -3.15 -3.04 -3.26 -3.25 -3.12 -3.19 -3.09 -3.00 -2.98 -3.16 -3.05 -2.89 -3.12 -2.93 -2.99
41% -4.21 -3.28 -3.27 -3.14 -3.20 -3.07 -3.18 -3.02 -3.04 -3.19 -3.04 -3.10 -3.07 -2.98 -2.99 -2.90 -3.09 -3.09 -2.93 -3.03 -2.92 -2.83 -2.80 -2.96 -2.87 -2.69 -2.88 -2.73 -2.77
42% -4.10 -3.17 -3.16 -3.02 -3.08 -2.95 -3.04 -2.87 -2.90 -3.04 -2.87 -2.93 -2.93 -2.84 -2.86 -2.73 -2.95 -2.91 -2.77 -2.84 -2.76 -2.67 -2.61 -2.80 -2.68 -2.51 -2.69 -2.52 -2.56
43% -4.01 -3.06 -3.03 -2.91 -2.95 -2.83 -2.91 -2.73 -2.75 -2.88 -2.71 -2.81 -2.78 -2.71 -2.67 -2.60 -2.77 -2.71 -2.62 -2.68 -2.60 -2.49 -2.43 -2.61 -2.47 -2.32 -2.49 -2.33 -2.36
44% -3.90 -2.93 -2.92 -2.79 -2.84 -2.70 -2.79 -2.58 -2.61 -2.77 -2.57 -2.66 -2.63 -2.55 -2.51 -2.43 -2.59 -2.54 -2.49 -2.51 -2.44 -2.30 -2.25 -2.39 -2.27 -2.12 -2.28 -2.15 -2.14
45% -3.79 -2.79 -2.79 -2.64 -2.71 -2.57 -2.65 -2.46 -2.47 -2.62 -2.45 -2.51 -2.48 -2.40 -2.36 -2.26 -2.42 -2.37 -2.34 -2.36 -2.26 -2.11 -2.08 -2.20 -2.06 -1.93 -2.06 -1.97 -1.93
46% -3.70 -2.66 -2.67 -2.52 -2.59 -2.45 -2.52 -2.33 -2.35 -2.48 -2.30 -2.37 -2.34 -2.26 -2.17 -2.09 -2.28 -2.21 -2.19 -2.18 -2.08 -1.93 -1.88 -2.02 -1.86 -1.72 -1.86 -1.76 -1.74
47% -3.59 -2.55 -2.58 -2.39 -2.48 -2.32 -2.38 -2.21 -2.22 -2.35 -2.18 -2.24 -2.21 -2.13 -2.01 -1.92 -2.12 -2.02 -2.01 -2.00 -1.88 -1.73 -1.70 -1.84 -1.71 -1.52 -1.66 -1.57 -1.55
48% -3.48 -2.45 -2.48 -2.29 -2.34 -2.19 -2.25 -2.10 -2.11 -2.24 -2.05 -2.11 -2.06 -1.99 -1.86 -1.78 -1.94 -1.87 -1.81 -1.84 -1.69 -1.56 -1.56 -1.67 -1.53 -1.36 -1.43 -1.37 -1.34
49% -3.37 -2.35 -2.37 -2.18 -2.20 -2.08 -2.10 -1.96 -1.98 -2.09 -1.93 -1.97 -1.91 -1.85 -1.71 -1.63 -1.79 -1.72 -1.64 -1.67 -1.52 -1.38 -1.40 -1.48 -1.35 -1.16 -1.21 -1.19 -1.13
50% -3.27 -2.23 -2.26 -2.08 -2.09 -1.95 -1.99 -1.85 -1.85 -1.94 -1.78 -1.83 -1.77 -1.70 -1.56 -1.49 -1.62 -1.56 -1.50 -1.50 -1.35 -1.17 -1.25 -1.31 -1.15 -1.01 -0.99 -1.01 -0.93
51% -3.17 -2.13 -2.16 -1.94 -2.00 -1.82 -1.84 -1.72 -1.73 -1.80 -1.65 -1.68 -1.63 -1.57 -1.41 -1.36 -1.47 -1.40 -1.36 -1.34 -1.18 -1.02 -1.06 -1.14 -0.97 -0.83 -0.80 -0.81 -0.76
52% -3.09 -2.00 -2.04 -1.84 -1.89 -1.70 -1.72 -1.61 -1.59 -1.65 -1.52 -1.53 -1.49 -1.38 -1.26 -1.19 -1.29 -1.23 -1.19 -1.18 -1.03 -0.82 -0.84 -0.97 -0.75 -0.64 -0.57 -0.63 -0.55
53% -2.96 -1.89 -1.91 -1.73 -1.78 -1.59 -1.58 -1.49 -1.46 -1.52 -1.40 -1.40 -1.36 -1.25 -1.10 -1.06 -1.14 -1.07 -1.03 -1.00 -0.87 -0.64 -0.64 -0.81 -0.54 -0.41 -0.39 -0.44 -0.33
54% -2.85 -1.75 -1.81 -1.62 -1.66 -1.46 -1.44 -1.35 -1.35 -1.37 -1.26 -1.26 -1.22 -1.10 -0.93 -0.90 -0.97 -0.91 -0.85 -0.82 -0.73 -0.47 -0.53 -0.65 -0.38 -0.24 -0.22 -0.24 -0.14
55% -2.75 -1.63 -1.70 -1.49 -1.54 -1.32 -1.32 -1.23 -1.20 -1.22 -1.13 -1.11 -1.08 -0.94 -0.78 -0.77 -0.80 -0.73 -0.69 -0.67 -0.57 -0.31 -0.33 -0.46 -0.17 0.00 -0.03 0.00 0.14
56% -2.64 -1.53 -1.58 -1.40 -1.42 -1.19 -1.20 -1.11 -1.05 -1.07 -0.99 -0.97 -0.93 -0.79 -0.63 -0.61 -0.66 -0.59 -0.53 -0.49 -0.41 -0.09 -0.13 -0.27 0.04 0.20 0.14 0.20 0.36
57% -2.53 -1.42 -1.46 -1.27 -1.30 -1.06 -1.07 -0.99 -0.93 -0.93 -0.85 -0.82 -0.77 -0.64 -0.47 -0.44 -0.49 -0.43 -0.38 -0.32 -0.23 0.10 0.06 -0.10 0.22 0.39 0.34 0.42 0.53
58% -2.40 -1.30 -1.34 -1.15 -1.19 -0.94 -0.95 -0.85 -0.80 -0.82 -0.72 -0.69 -0.60 -0.47 -0.27 -0.29 -0.32 -0.23 -0.21 -0.15 -0.01 0.30 0.27 0.10 0.39 0.58 0.54 0.61 0.79
59% -2.30 -1.17 -1.20 -1.03 -1.05 -0.82 -0.81 -0.73 -0.67 -0.69 -0.57 -0.55 -0.48 -0.30 -0.14 -0.15 -0.17 -0.07 -0.04 0.02 0.16 0.46 0.45 0.30 0.58 0.74 0.70 0.81 0.98
60% -2.21 -1.06 -1.09 -0.91 -0.93 -0.68 -0.68 -0.61 -0.53 -0.54 -0.42 -0.41 -0.35 -0.15 0.00 0.02 -0.01 0.09 0.14 0.19 0.31 0.61 0.62 0.49 0.78 0.95 0.91 1.00 1.20
61% -2.11 -0.94 -0.98 -0.80 -0.80 -0.55 -0.55 -0.48 -0.39 -0.40 -0.28 -0.27 -0.19 -0.01 0.17 0.20 0.17 0.25 0.30 0.40 0.48 0.77 0.80 0.65 0.97 1.15 1.10 1.17 1.41
62% -1.98 -0.81 -0.86 -0.69 -0.66 -0.42 -0.40 -0.35 -0.24 -0.26 -0.12 -0.12 -0.04 0.14 0.31 0.37 0.32 0.43 0.51 0.57 0.68 0.94 0.98 0.84 1.19 1.32 1.29 1.39 1.66
63% -1.89 -0.69 -0.74 -0.57 -0.51 -0.29 -0.27 -0.20 -0.12 -0.12 0.01 0.05 0.11 0.31 0.45 0.52 0.51 0.58 0.69 0.76 0.86 1.13 1.16 1.05 1.39 1.52 1.51 1.61 1.85
64% -1.79 -0.59 -0.64 -0.42 -0.39 -0.14 -0.13 -0.06 0.01 0.04 0.16 0.21 0.27 0.47 0.60 0.67 0.69 0.77 0.86 0.96 1.04 1.31 1.33 1.27 1.59 1.71 1.71 1.83 2.07
65% -1.70 -0.45 -0.50 -0.27 -0.28 -0.01 0.02 0.09 0.15 0.20 0.35 0.32 0.42 0.63 0.72 0.85 0.83 0.93 1.06 1.15 1.21 1.50 1.52 1.48 1.80 1.89 1.87 2.04 2.29
66% -1.59 -0.33 -0.36 -0.13 -0.16 0.12 0.15 0.23 0.27 0.32 0.49 0.46 0.58 0.80 0.88 1.00 1.02 1.10 1.22 1.32 1.39 1.71 1.73 1.69 1.99 2.06 2.07 2.25 2.51
67% -1.48 -0.19 -0.22 -0.02 -0.03 0.25 0.25 0.38 0.41 0.47 0.64 0.61 0.76 0.95 1.06 1.18 1.20 1.28 1.40 1.50 1.56 1.89 1.93 1.91 2.16 2.24 2.31 2.47 2.71
68% -1.36 -0.06 -0.09 0.16 0.09 0.38 0.41 0.50 0.55 0.63 0.78 0.76 0.96 1.11 1.24 1.34 1.34 1.45 1.58 1.69 1.72 2.11 2.13 2.11 2.38 2.45 2.52 2.71 2.92
69% -1.24 0.07 0.05 0.28 0.24 0.52 0.54 0.66 0.69 0.78 0.95 0.91 1.11 1.25 1.42 1.51 1.53 1.68 1.77 1.87 1.92 2.34 2.35 2.34 2.55 2.66 2.71 2.97 3.14
70% -1.13 0.21 0.19 0.40 0.40 0.67 0.68 0.81 0.85 0.96 1.11 1.11 1.29 1.43 1.61 1.70 1.73 1.91 1.98 2.09 2.12 2.53 2.56 2.53 2.78 2.88 2.93 3.19 3.35
71% -1.01 0.37 0.35 0.55 0.55 0.80 0.85 0.95 1.01 1.12 1.26 1.27 1.46 1.63 1.80 1.85 1.93 2.13 2.15 2.28 2.32 2.72 2.75 2.76 3.00 3.12 3.13 3.41 3.57
72% -0.88 0.49 0.50 0.69 0.67 0.94 0.97 1.10 1.17 1.29 1.43 1.45 1.61 1.81 2.02 2.07 2.11 2.34 2.36 2.48 2.54 2.95 2.92 2.92 3.20 3.34 3.37 3.59 3.81
73% -0.76 0.61 0.68 0.82 0.82 1.09 1.12 1.23 1.32 1.45 1.59 1.63 1.77 1.96 2.18 2.25 2.29 2.55 2.56 2.69 2.72 3.14 3.15 3.14 3.41 3.56 3.58 3.82 4.03
74% -0.64 0.74 0.82 0.96 0.95 1.23 1.31 1.40 1.50 1.61 1.71 1.79 1.93 2.14 2.38 2.49 2.52 2.73 2.73 2.90 2.91 3.33 3.36 3.36 3.66 3.83 3.81 4.04 4.24
75% -0.50 0.87 0.98 1.11 1.13 1.37 1.45 1.55 1.67 1.78 1.91 1.97 2.13 2.35 2.53 2.64 2.71 2.92 2.92 3.14 3.14 3.53 3.59 3.62 3.87 4.08 4.09 4.29 4.49
76% -0.37 1.02 1.10 1.27 1.29 1.53 1.61 1.69 1.83 1.94 2.09 2.13 2.29 2.55 2.75 2.82 2.89 3.12 3.18 3.36 3.42 3.75 3.86 3.83 4.11 4.31 4.38 4.53 4.72
77% -0.22 1.17 1.27 1.43 1.47 1.67 1.76 1.86 1.99 2.12 2.27 2.31 2.50 2.74 2.94 3.00 3.10 3.31 3.39 3.56 3.60 3.98 4.11 4.06 4.33 4.55 4.62 4.76 4.97
78% -0.09 1.32 1.43 1.58 1.65 1.82 1.94 2.02 2.16 2.30 2.44 2.50 2.70 2.96 3.12 3.18 3.31 3.50 3.63 3.79 3.82 4.20 4.35 4.28 4.55 4.81 4.86 5.00 5.23
79% 0.03 1.48 1.57 1.77 1.82 1.97 2.12 2.18 2.31 2.52 2.63 2.67 2.90 3.20 3.32 3.44 3.55 3.70 3.86 4.06 4.05 4.44 4.54 4.54 4.80 5.07 5.15 5.33 5.51
80% 0.19 1.63 1.71 1.91 1.98 2.16 2.27 2.34 2.52 2.69 2.85 2.90 3.09 3.41 3.54 3.67 3.75 3.89 4.13 4.29 4.26 4.70 4.77 4.80 5.06 5.33 5.39 5.62 5.78
81% 0.33 1.82 1.89 2.09 2.17 2.37 2.44 2.54 2.72 2.88 3.05 3.11 3.30 3.63 3.77 3.89 3.97 4.14 4.36 4.55 4.50 4.96 5.02 5.06 5.32 5.60 5.63 5.88 6.06
82% 0.48 1.97 2.06 2.29 2.34 2.56 2.64 2.76 2.95 3.09 3.25 3.31 3.52 3.86 4.01 4.09 4.20 4.41 4.57 4.79 4.73 5.16 5.27 5.34 5.55 5.88 5.92 6.16 6.36
83% 0.65 2.14 2.23 2.47 2.51 2.74 2.86 2.94 3.14 3.29 3.47 3.53 3.72 4.04 4.23 4.30 4.44 4.67 4.83 5.05 5.01 5.41 5.52 5.65 5.91 6.15 6.21 6.42 6.64
84% 0.83 2.31 2.41 2.69 2.68 2.94 3.08 3.13 3.35 3.48 3.70 3.83 3.96 4.27 4.45 4.54 4.70 4.94 5.09 5.29 5.31 5.64 5.85 5.93 6.21 6.47 6.55 6.80 7.00
85% 1.00 2.48 2.59 2.88 2.87 3.12 3.30 3.37 3.53 3.68 3.91 4.03 4.20 4.50 4.70 4.83 4.97 5.22 5.35 5.59 5.60 5.92 6.16 6.26 6.56 6.76 6.89 7.14 7.30
86% 1.16 2.68 2.80 3.05 3.05 3.31 3.51 3.55 3.79 3.93 4.15 4.25 4.44 4.74 4.96 5.19 5.21 5.46 5.66 5.89 5.87 6.22 6.45 6.58 6.88 7.06 7.25 7.46 7.67
87% 1.31 2.88 3.03 3.23 3.24 3.54 3.72 3.80 3.99 4.16 4.38 4.50 4.70 5.03 5.24 5.45 5.52 5.73 5.96 6.23 6.20 6.53 6.80 6.90 7.19 7.40 7.60 7.82 8.04
88% 1.54 3.11 3.27 3.46 3.43 3.77 3.98 4.04 4.23 4.41 4.66 4.80 5.00 5.36 5.59 5.73 5.79 6.00 6.28 6.52 6.54 6.85 7.10 7.26 7.49 7.82 7.97 8.15 8.41
89% 1.74 3.32 3.48 3.71 3.64 4.02 4.22 4.31 4.50 4.69 4.98 5.09 5.30 5.64 5.89 6.01 6.13 6.35 6.58 6.88 6.94 7.20 7.47 7.64 7.87 8.21 8.28 8.57 8.86
90% 2.00 3.59 3.74 3.94 3.90 4.25 4.49 4.59 4.79 4.98 5.29 5.44 5.62 5.97 6.21 6.31 6.50 6.65 6.93 7.22 7.31 7.55 7.91 8.09 8.29 8.67 8.65 8.95 9.28
91% 2.21 3.86 4.02 4.21 4.16 4.50 4.78 4.92 5.13 5.33 5.63 5.69 5.98 6.30 6.55 6.68 6.88 7.03 7.29 7.54 7.72 7.94 8.31 8.50 8.80 9.07 9.15 9.43 9.71
92% 2.47 4.14 4.29 4.49 4.52 4.84 5.15 5.24 5.50 5.67 6.01 6.10 6.26 6.63 6.96 7.03 7.31 7.42 7.71 7.91 8.08 8.36 8.72 8.93 9.35 9.55 9.61 9.80 10.18
93% 2.77 4.43 4.58 4.79 4.88 5.17 5.52 5.58 5.82 6.05 6.44 6.46 6.66 7.02 7.37 7.44 7.81 7.80 8.13 8.36 8.50 8.81 9.20 9.39 9.85 10.02 10.21 10.33 10.72
94% 3.06 4.73 4.90 5.16 5.23 5.50 5.85 6.02 6.28 6.43 6.83 6.89 7.11 7.41 7.74 7.94 8.28 8.25 8.67 8.92 9.08 9.33 9.72 10.06 10.45 10.59 10.84 10.89 11.24
95% 3.46 5.12 5.29 5.54 5.68 5.90 6.20 6.45 6.75 6.98 7.26 7.28 7.61 7.92 8.22 8.49 8.84 8.85 9.20 9.48 9.64 9.90 10.35 10.60 11.03 11.15 11.37 11.53 11.86
96% 3.86 5.50 5.79 5.90 6.20 6.37 6.70 6.94 7.27 7.54 7.77 7.78 8.18 8.48 8.84 9.25 9.47 9.52 9.84 10.21 10.28 10.70 11.07 11.51 11.72 11.97 12.08 12.28 12.67
97% 4.30 6.06 6.42 6.43 6.77 6.95 7.38 7.55 8.01 8.30 8.40 8.54 8.85 9.24 9.57 10.05 10.23 10.41 10.66 11.17 11.20 11.51 12.12 12.34 12.61 12.94 13.02 13.16 13.64
98% 5.13 6.78 7.18 7.19 7.57 7.89 8.16 8.49 8.84 9.18 9.41 9.47 9.66 10.25 10.53 10.91 11.24 11.45 11.76 12.31 12.36 12.68 13.10 13.37 13.72 14.08 14.22 14.60 14.95
99% 6.06 7.93 8.27 8.32 8.81 9.38 9.51 9.69 10.09 10.57 10.74 10.99 11.50 11.94 12.03 12.56 12.74 13.12 13.26 14.01 13.68 14.38 14.75 15.44 15.37 15.90 15.87 16.46 16.73
100% 13.74 15.75 13.47 13.76 16.54 15.39 16.12 16.11 18.95 18.37 16.79 17.81 21.34 17.52 20.36 20.09 20.82 20.03 24.16 21.04 20.65 22.45 24.38 22.53 22.70 24.08 23.22 26.06 28.98

Mott MacDonald | Company Headroom Analysis 2Water Resource Management Plan 2019
387731 | 03 | F | 2 November 2017 https://mottmac.sharepoint.com/teams/pj-b3756/do/Reports/SSW Headroom Report - South Staffs Rev F.docx
Table 5: DYCP Target Headroom Percentiles by Year
Percentiles 2017 2018 2019 2020 2021 2022 2023 2024 2025 2026 2027 2028 2029 2030 2031 2032 2033 0 2034 0 2035 0 2036 0 2037 0 2038 0 2039 0 2040 0 2041 0 2042 0 2043 0 2044 0 2045
0% -19.63 -17.85 -17.60 -19.54 -18.70 -24.33 -23.39 -22.60 -23.85 -27.31 -24.28 -26.63 -24.43 -27.48 -25.89 -31.45 -26.44 -31.76 -27.00 -28.11 -30.45 -34.50 -33.24 -34.46 -29.56 -29.75 -28.88 -33.67 -29.52
1% -11.37 -11.78 -12.48 -12.64 -13.18 -13.51 -14.07 -15.14 -15.29 -15.99 -16.91 -16.78 -17.33 -17.83 -18.48 -18.19 -18.03 -19.00 -18.57 -18.84 -18.50 -19.05 -19.70 -19.44 -19.44 -20.21 -19.78 -20.21 -19.68
2% -10.01 -10.49 -11.18 -11.29 -11.62 -12.06 -12.63 -13.27 -13.71 -14.23 -15.20 -14.99 -15.79 -16.13 -16.80 -16.04 -16.13 -16.78 -16.36 -16.59 -16.44 -16.83 -17.44 -17.39 -17.22 -17.86 -17.49 -17.41 -17.79
3% -9.21 -9.71 -10.37 -10.53 -10.73 -11.22 -11.67 -12.23 -12.47 -13.09 -13.79 -13.82 -14.68 -14.85 -15.37 -14.83 -14.82 -15.20 -15.10 -14.98 -15.04 -15.37 -15.54 -15.70 -15.76 -16.29 -16.19 -15.88 -16.37
4% -8.59 -9.10 -9.64 -9.81 -10.14 -10.58 -11.02 -11.45 -11.66 -12.30 -12.83 -12.95 -13.68 -13.76 -14.13 -13.65 -13.87 -14.27 -14.08 -13.88 -14.11 -14.49 -14.38 -14.51 -14.54 -15.17 -14.95 -14.81 -14.99
5% -8.11 -8.64 -9.07 -9.33 -9.50 -10.05 -10.41 -10.79 -11.02 -11.69 -11.98 -12.18 -12.78 -13.00 -13.27 -12.85 -13.08 -13.21 -13.16 -13.02 -13.19 -13.51 -13.52 -13.44 -13.54 -14.12 -14.07 -13.76 -14.01
6% -7.63 -8.22 -8.54 -8.87 -9.06 -9.46 -9.91 -10.21 -10.47 -11.15 -11.28 -11.61 -12.04 -12.38 -12.57 -12.21 -12.44 -12.38 -12.46 -12.19 -12.35 -12.64 -12.72 -12.55 -12.70 -13.08 -13.18 -12.93 -13.15
7% -7.27 -7.82 -8.15 -8.46 -8.63 -8.98 -9.47 -9.76 -9.96 -10.59 -10.79 -11.03 -11.46 -11.82 -11.97 -11.66 -11.88 -11.77 -11.67 -11.43 -11.71 -11.97 -12.01 -11.87 -11.94 -12.45 -12.29 -12.05 -12.39
8% -6.96 -7.41 -7.77 -8.03 -8.22 -8.57 -8.99 -9.31 -9.46 -10.14 -10.30 -10.47 -10.86 -11.27 -11.30 -11.13 -11.28 -11.20 -11.01 -10.85 -11.19 -11.28 -11.42 -11.12 -11.27 -11.75 -11.71 -11.47 -11.64
9% -6.66 -7.13 -7.43 -7.63 -7.84 -8.22 -8.56 -8.91 -9.04 -9.70 -9.81 -9.97 -10.41 -10.71 -10.75 -10.59 -10.73 -10.63 -10.40 -10.41 -10.67 -10.75 -10.86 -10.44 -10.68 -11.14 -10.94 -10.81 -10.98
10% -6.38 -6.80 -7.08 -7.30 -7.53 -7.88 -8.15 -8.52 -8.70 -9.30 -9.50 -9.52 -9.96 -10.26 -10.29 -10.13 -10.22 -10.14 -9.91 -9.95 -10.11 -10.18 -10.32 -9.89 -10.14 -10.43 -10.35 -10.17 -10.39
11% -6.08 -6.51 -6.76 -7.00 -7.25 -7.48 -7.85 -8.19 -8.31 -8.94 -9.09 -9.12 -9.58 -9.81 -9.82 -9.70 -9.79 -9.67 -9.51 -9.49 -9.59 -9.59 -9.86 -9.40 -9.62 -9.88 -9.73 -9.50 -9.80
12% -5.87 -6.23 -6.51 -6.71 -6.98 -7.19 -7.52 -7.92 -8.01 -8.63 -8.72 -8.75 -9.18 -9.42 -9.43 -9.27 -9.29 -9.20 -9.04 -9.06 -9.08 -9.15 -9.40 -8.90 -9.05 -9.39 -9.18 -8.98 -9.26
13% -5.60 -5.99 -6.23 -6.44 -6.71 -6.89 -7.22 -7.68 -7.69 -8.23 -8.37 -8.37 -8.80 -9.04 -9.01 -8.92 -8.83 -8.82 -8.66 -8.67 -8.60 -8.67 -8.94 -8.44 -8.56 -8.93 -8.68 -8.53 -8.75
14% -5.39 -5.71 -6.01 -6.17 -6.40 -6.60 -6.92 -7.40 -7.38 -7.86 -8.08 -7.98 -8.49 -8.66 -8.63 -8.51 -8.46 -8.44 -8.29 -8.34 -8.19 -8.30 -8.52 -8.06 -8.17 -8.37 -8.21 -8.07 -8.21
15% -5.16 -5.45 -5.80 -5.95 -6.18 -6.35 -6.67 -7.16 -7.09 -7.55 -7.78 -7.67 -8.17 -8.38 -8.24 -8.14 -8.10 -8.12 -7.95 -7.97 -7.80 -7.94 -8.12 -7.64 -7.79 -7.82 -7.76 -7.64 -7.70
16% -4.95 -5.23 -5.56 -5.68 -5.93 -6.12 -6.41 -6.85 -6.83 -7.24 -7.49 -7.35 -7.86 -8.02 -7.90 -7.78 -7.79 -7.79 -7.64 -7.61 -7.36 -7.55 -7.72 -7.25 -7.35 -7.38 -7.30 -7.16 -7.28
17% -4.76 -4.97 -5.32 -5.45 -5.68 -5.87 -6.15 -6.62 -6.56 -6.94 -7.21 -7.07 -7.53 -7.74 -7.57 -7.41 -7.50 -7.42 -7.30 -7.19 -7.06 -7.19 -7.26 -6.93 -7.00 -6.98 -6.81 -6.76 -6.89
18% -4.55 -4.73 -5.11 -5.23 -5.44 -5.65 -5.96 -6.32 -6.31 -6.67 -6.92 -6.83 -7.23 -7.41 -7.26 -7.10 -7.22 -7.08 -6.96 -6.84 -6.74 -6.87 -6.91 -6.55 -6.59 -6.58 -6.46 -6.35 -6.54
19% -4.34 -4.50 -4.91 -5.03 -5.25 -5.43 -5.69 -6.10 -6.08 -6.43 -6.66 -6.58 -6.87 -7.12 -6.96 -6.77 -6.91 -6.67 -6.65 -6.54 -6.37 -6.54 -6.52 -6.23 -6.18 -6.17 -6.06 -5.99 -6.13
20% -4.17 -4.29 -4.68 -4.83 -5.05 -5.22 -5.51 -5.87 -5.84 -6.16 -6.44 -6.33 -6.64 -6.81 -6.64 -6.45 -6.60 -6.35 -6.36 -6.16 -6.05 -6.24 -6.15 -5.89 -5.83 -5.79 -5.72 -5.56 -5.83
21% -3.97 -4.09 -4.50 -4.63 -4.82 -4.97 -5.32 -5.61 -5.65 -5.92 -6.19 -6.11 -6.37 -6.50 -6.36 -6.22 -6.28 -5.98 -6.06 -5.92 -5.73 -5.93 -5.78 -5.58 -5.53 -5.37 -5.36 -5.20 -5.45
22% -3.75 -3.89 -4.31 -4.47 -4.62 -4.77 -5.14 -5.34 -5.40 -5.69 -5.99 -5.88 -6.14 -6.26 -6.07 -5.90 -6.00 -5.65 -5.76 -5.63 -5.45 -5.58 -5.49 -5.22 -5.18 -5.05 -5.09 -4.84 -5.10
23% -3.59 -3.68 -4.10 -4.27 -4.44 -4.55 -4.90 -5.10 -5.19 -5.46 -5.77 -5.65 -5.96 -6.02 -5.82 -5.68 -5.69 -5.40 -5.44 -5.34 -5.13 -5.28 -5.18 -4.89 -4.83 -4.77 -4.73 -4.54 -4.76
24% -3.41 -3.54 -3.89 -4.08 -4.30 -4.37 -4.68 -4.84 -4.99 -5.25 -5.54 -5.42 -5.70 -5.75 -5.57 -5.40 -5.43 -5.11 -5.18 -5.07 -4.82 -4.95 -4.88 -4.60 -4.50 -4.46 -4.36 -4.25 -4.36
25% -3.25 -3.37 -3.75 -3.88 -4.09 -4.18 -4.50 -4.64 -4.73 -5.03 -5.28 -5.24 -5.43 -5.54 -5.34 -5.15 -5.16 -4.83 -4.93 -4.78 -4.57 -4.57 -4.57 -4.26 -4.20 -4.18 -4.05 -3.96 -4.01
26% -3.07 -3.18 -3.59 -3.69 -3.91 -3.97 -4.29 -4.41 -4.51 -4.86 -5.04 -5.00 -5.17 -5.33 -5.07 -4.96 -4.91 -4.56 -4.65 -4.46 -4.31 -4.28 -4.28 -4.00 -3.90 -3.83 -3.69 -3.66 -3.69
27% -2.91 -3.01 -3.41 -3.52 -3.70 -3.81 -4.10 -4.24 -4.33 -4.62 -4.83 -4.76 -4.92 -5.11 -4.78 -4.73 -4.68 -4.28 -4.35 -4.19 -4.03 -3.96 -3.91 -3.72 -3.59 -3.54 -3.40 -3.37 -3.36
28% -2.74 -2.85 -3.23 -3.32 -3.55 -3.63 -3.94 -4.04 -4.10 -4.41 -4.62 -4.53 -4.68 -4.87 -4.56 -4.46 -4.42 -4.01 -4.11 -3.97 -3.74 -3.71 -3.65 -3.45 -3.30 -3.20 -3.13 -3.10 -3.03
29% -2.58 -2.69 -3.06 -3.15 -3.39 -3.49 -3.77 -3.83 -3.90 -4.19 -4.44 -4.32 -4.43 -4.65 -4.36 -4.22 -4.21 -3.76 -3.85 -3.71 -3.51 -3.43 -3.37 -3.19 -3.03 -2.87 -2.74 -2.78 -2.73
30% -2.41 -2.56 -2.95 -2.98 -3.19 -3.30 -3.57 -3.66 -3.69 -3.99 -4.22 -4.11 -4.24 -4.40 -4.13 -3.95 -3.96 -3.51 -3.62 -3.46 -3.23 -3.16 -3.08 -2.92 -2.76 -2.58 -2.45 -2.52 -2.43
31% -2.26 -2.39 -2.78 -2.82 -3.03 -3.16 -3.37 -3.50 -3.50 -3.81 -4.00 -3.92 -4.05 -4.16 -3.85 -3.66 -3.78 -3.24 -3.37 -3.23 -2.96 -2.93 -2.81 -2.66 -2.44 -2.26 -2.18 -2.26 -2.08
32% -2.10 -2.25 -2.63 -2.66 -2.86 -2.97 -3.21 -3.33 -3.35 -3.60 -3.82 -3.69 -3.86 -3.92 -3.63 -3.46 -3.57 -3.02 -3.08 -2.99 -2.69 -2.64 -2.54 -2.42 -2.14 -2.00 -1.85 -1.98 -1.82
33% -1.96 -2.10 -2.48 -2.49 -2.70 -2.80 -3.06 -3.18 -3.17 -3.41 -3.63 -3.46 -3.62 -3.70 -3.34 -3.18 -3.33 -2.79 -2.85 -2.69 -2.47 -2.36 -2.32 -2.15 -1.85 -1.67 -1.63 -1.71 -1.53
34% -1.81 -1.94 -2.32 -2.35 -2.54 -2.65 -2.89 -3.02 -2.98 -3.17 -3.44 -3.26 -3.43 -3.49 -3.15 -2.97 -3.11 -2.58 -2.60 -2.42 -2.22 -2.09 -2.08 -1.92 -1.63 -1.38 -1.34 -1.40 -1.23
35% -1.68 -1.78 -2.18 -2.18 -2.41 -2.50 -2.72 -2.86 -2.78 -2.97 -3.23 -3.05 -3.21 -3.29 -2.95 -2.75 -2.88 -2.36 -2.37 -2.19 -1.97 -1.82 -1.79 -1.65 -1.40 -1.10 -1.05 -1.13 -0.93
36% -1.55 -1.63 -2.02 -2.06 -2.27 -2.32 -2.55 -2.70 -2.61 -2.76 -3.07 -2.84 -3.04 -3.07 -2.74 -2.53 -2.66 -2.17 -2.11 -1.94 -1.71 -1.58 -1.54 -1.43 -1.13 -0.84 -0.73 -0.79 -0.66
37% -1.41 -1.50 -1.90 -1.90 -2.12 -2.17 -2.38 -2.53 -2.46 -2.56 -2.86 -2.67 -2.84 -2.88 -2.54 -2.31 -2.45 -1.95 -1.92 -1.71 -1.45 -1.36 -1.29 -1.20 -0.87 -0.59 -0.45 -0.51 -0.34
38% -1.27 -1.36 -1.74 -1.77 -2.00 -2.00 -2.22 -2.34 -2.31 -2.40 -2.69 -2.50 -2.68 -2.69 -2.29 -2.08 -2.22 -1.73 -1.66 -1.46 -1.23 -1.15 -1.05 -0.93 -0.59 -0.33 -0.20 -0.26 -0.07
39% -1.09 -1.25 -1.60 -1.63 -1.86 -1.85 -2.03 -2.18 -2.14 -2.22 -2.52 -2.35 -2.45 -2.47 -2.07 -1.88 -2.01 -1.49 -1.46 -1.23 -0.99 -0.91 -0.78 -0.69 -0.33 -0.09 0.07 -0.01 0.21
40% -0.95 -1.10 -1.45 -1.47 -1.70 -1.67 -1.90 -1.97 -1.93 -2.04 -2.28 -2.17 -2.28 -2.25 -1.87 -1.67 -1.76 -1.27 -1.23 -0.95 -0.74 -0.65 -0.55 -0.46 -0.03 0.19 0.33 0.21 0.48
41% -0.80 -0.97 -1.31 -1.31 -1.55 -1.53 -1.73 -1.80 -1.75 -1.88 -2.08 -1.99 -2.10 -2.02 -1.66 -1.46 -1.55 -1.05 -1.00 -0.69 -0.48 -0.40 -0.35 -0.21 0.24 0.48 0.56 0.51 0.75
42% -0.68 -0.83 -1.16 -1.16 -1.42 -1.36 -1.55 -1.63 -1.59 -1.69 -1.90 -1.78 -1.91 -1.82 -1.48 -1.21 -1.33 -0.79 -0.75 -0.46 -0.21 -0.15 -0.11 0.07 0.53 0.73 0.86 0.77 1.02
43% -0.54 -0.71 -1.02 -1.02 -1.28 -1.22 -1.39 -1.46 -1.44 -1.54 -1.74 -1.59 -1.72 -1.58 -1.26 -1.02 -1.10 -0.52 -0.53 -0.23 0.00 0.06 0.16 0.31 0.77 1.00 1.15 1.03 1.35
44% -0.41 -0.55 -0.88 -0.85 -1.12 -1.07 -1.23 -1.27 -1.28 -1.35 -1.57 -1.42 -1.51 -1.42 -1.10 -0.83 -0.87 -0.31 -0.32 -0.01 0.21 0.30 0.39 0.60 1.06 1.25 1.45 1.31 1.60
45% -0.27 -0.38 -0.76 -0.72 -0.96 -0.93 -1.10 -1.12 -1.10 -1.16 -1.35 -1.24 -1.33 -1.24 -0.88 -0.61 -0.72 -0.13 -0.10 0.17 0.47 0.54 0.68 0.85 1.37 1.52 1.71 1.57 1.83
46% -0.14 -0.25 -0.61 -0.58 -0.83 -0.78 -0.93 -0.96 -0.92 -1.01 -1.15 -1.04 -1.12 -1.04 -0.67 -0.42 -0.48 0.07 0.12 0.43 0.69 0.75 0.90 1.16 1.65 1.76 1.98 1.81 2.12
47% 0.03 -0.13 -0.47 -0.44 -0.67 -0.64 -0.75 -0.81 -0.75 -0.84 -0.95 -0.87 -0.92 -0.85 -0.45 -0.25 -0.29 0.29 0.33 0.63 1.00 0.96 1.11 1.39 1.89 2.00 2.23 2.05 2.37
48% 0.18 0.00 -0.32 -0.27 -0.50 -0.48 -0.61 -0.67 -0.58 -0.66 -0.77 -0.68 -0.76 -0.64 -0.21 -0.08 -0.05 0.52 0.52 0.87 1.20 1.20 1.36 1.64 2.13 2.22 2.49 2.33 2.59
49% 0.31 0.15 -0.18 -0.14 -0.37 -0.34 -0.47 -0.51 -0.42 -0.47 -0.59 -0.50 -0.58 -0.42 -0.03 0.15 0.17 0.71 0.75 1.08 1.45 1.42 1.63 1.88 2.35 2.48 2.75 2.62 2.85
50% 0.45 0.27 -0.05 -0.01 -0.19 -0.16 -0.31 -0.34 -0.29 -0.31 -0.42 -0.30 -0.37 -0.23 0.15 0.37 0.42 0.97 1.04 1.31 1.70 1.65 1.92 2.14 2.59 2.73 3.06 2.88 3.17
51% 0.59 0.41 0.10 0.14 -0.06 -0.03 -0.12 -0.16 -0.14 -0.16 -0.21 -0.15 -0.18 -0.01 0.36 0.55 0.59 1.18 1.25 1.51 1.91 1.92 2.13 2.37 2.81 2.95 3.32 3.13 3.49
52% 0.71 0.55 0.24 0.28 0.07 0.09 0.07 0.00 0.04 0.02 -0.04 0.02 0.03 0.19 0.57 0.73 0.82 1.41 1.52 1.75 2.17 2.14 2.38 2.65 3.07 3.19 3.59 3.41 3.79
53% 0.84 0.71 0.40 0.43 0.22 0.22 0.18 0.14 0.19 0.20 0.16 0.22 0.20 0.39 0.76 0.95 1.02 1.61 1.72 2.01 2.40 2.35 2.62 2.90 3.31 3.44 3.83 3.66 4.08
54% 0.97 0.87 0.54 0.57 0.36 0.38 0.36 0.26 0.39 0.36 0.32 0.38 0.38 0.61 0.92 1.11 1.24 1.82 1.94 2.20 2.59 2.56 2.88 3.15 3.57 3.71 4.09 3.92 4.35
55% 1.10 1.02 0.66 0.73 0.54 0.51 0.50 0.42 0.56 0.51 0.49 0.56 0.60 0.80 1.12 1.28 1.48 2.03 2.13 2.41 2.84 2.82 3.07 3.35 3.80 3.98 4.38 4.22 4.61
56% 1.24 1.16 0.81 0.88 0.71 0.69 0.66 0.58 0.74 0.68 0.67 0.71 0.77 1.02 1.30 1.51 1.70 2.23 2.38 2.60 3.06 3.08 3.33 3.57 4.07 4.27 4.61 4.47 4.85
57% 1.37 1.31 0.97 1.02 0.85 0.84 0.81 0.72 0.91 0.85 0.82 0.92 0.97 1.23 1.47 1.71 1.89 2.45 2.57 2.82 3.26 3.33 3.58 3.83 4.27 4.49 4.85 4.77 5.14
58% 1.51 1.47 1.12 1.19 1.00 0.94 1.01 0.86 1.09 1.05 1.01 1.09 1.16 1.42 1.71 1.89 2.07 2.63 2.76 3.05 3.48 3.62 3.82 4.09 4.54 4.76 5.10 5.02 5.41
59% 1.64 1.61 1.31 1.34 1.14 1.09 1.17 1.00 1.27 1.22 1.23 1.29 1.36 1.59 1.92 2.16 2.29 2.84 3.01 3.26 3.70 3.91 4.02 4.31 4.80 5.02 5.36 5.27 5.70
60% 1.76 1.78 1.49 1.48 1.29 1.23 1.34 1.16 1.45 1.39 1.42 1.47 1.59 1.79 2.14 2.39 2.48 3.09 3.19 3.51 3.92 4.15 4.30 4.58 5.06 5.29 5.65 5.56 5.95
61% 1.93 1.93 1.61 1.62 1.45 1.40 1.51 1.29 1.65 1.54 1.58 1.66 1.76 2.01 2.33 2.59 2.69 3.30 3.43 3.76 4.13 4.42 4.54 4.80 5.31 5.56 5.90 5.84 6.29
62% 2.06 2.09 1.76 1.76 1.62 1.56 1.66 1.45 1.82 1.73 1.78 1.85 1.96 2.21 2.53 2.81 2.91 3.55 3.68 3.98 4.37 4.71 4.83 5.07 5.57 5.87 6.16 6.07 6.57
63% 2.20 2.23 1.88 1.91 1.76 1.73 1.83 1.65 2.01 1.91 1.98 2.02 2.17 2.40 2.71 3.04 3.11 3.76 3.93 4.20 4.59 4.95 5.07 5.36 5.80 6.10 6.43 6.35 6.84
64% 2.36 2.35 2.02 2.06 1.93 1.92 1.99 1.81 2.18 2.12 2.19 2.20 2.34 2.64 2.95 3.24 3.35 3.95 4.20 4.46 4.81 5.20 5.31 5.63 6.08 6.39 6.69 6.59 7.12
65% 2.50 2.50 2.18 2.19 2.07 2.09 2.18 1.95 2.36 2.28 2.42 2.39 2.50 2.84 3.17 3.45 3.57 4.21 4.42 4.65 5.01 5.44 5.62 5.88 6.42 6.66 6.94 6.94 7.42
66% 2.64 2.66 2.32 2.34 2.21 2.23 2.34 2.09 2.52 2.46 2.60 2.60 2.71 3.02 3.43 3.71 3.77 4.41 4.66 4.93 5.26 5.69 5.87 6.18 6.66 6.91 7.22 7.21 7.70
67% 2.77 2.82 2.47 2.48 2.37 2.40 2.47 2.25 2.73 2.64 2.78 2.78 2.93 3.22 3.66 3.90 3.99 4.67 4.88 5.15 5.49 5.96 6.17 6.46 6.97 7.15 7.50 7.49 8.01
68% 2.90 3.00 2.63 2.65 2.53 2.57 2.66 2.42 2.94 2.84 2.96 2.94 3.15 3.43 3.90 4.13 4.24 4.90 5.14 5.36 5.76 6.15 6.43 6.74 7.25 7.43 7.79 7.80 8.31
69% 3.04 3.15 2.80 2.79 2.72 2.72 2.84 2.62 3.12 3.02 3.19 3.19 3.37 3.65 4.11 4.35 4.52 5.15 5.33 5.56 6.01 6.40 6.69 7.00 7.50 7.73 8.07 8.06 8.61
70% 3.18 3.29 2.98 2.94 2.90 2.89 3.00 2.84 3.31 3.22 3.39 3.38 3.59 3.84 4.32 4.61 4.77 5.38 5.58 5.81 6.25 6.67 6.93 7.31 7.80 8.00 8.32 8.34 8.90
71% 3.32 3.48 3.13 3.11 3.04 3.05 3.17 3.04 3.49 3.42 3.58 3.58 3.85 4.06 4.55 4.90 5.02 5.61 5.82 6.10 6.51 6.93 7.18 7.59 8.14 8.29 8.64 8.61 9.22
72% 3.50 3.64 3.29 3.31 3.21 3.22 3.34 3.25 3.68 3.61 3.82 3.79 4.07 4.27 4.78 5.11 5.24 5.83 6.08 6.40 6.80 7.19 7.46 7.88 8.39 8.59 8.96 8.91 9.52
73% 3.68 3.80 3.50 3.49 3.39 3.38 3.53 3.44 3.89 3.81 4.04 4.05 4.32 4.50 5.03 5.32 5.47 6.08 6.31 6.65 7.07 7.44 7.74 8.13 8.64 8.96 9.22 9.23 9.84
74% 3.83 3.96 3.69 3.69 3.58 3.57 3.71 3.66 4.08 4.01 4.23 4.24 4.56 4.75 5.24 5.58 5.73 6.33 6.59 6.93 7.33 7.71 8.06 8.41 8.89 9.23 9.64 9.57 10.19
75% 3.97 4.16 3.87 3.84 3.75 3.78 3.88 3.85 4.24 4.22 4.45 4.45 4.78 4.95 5.45 5.89 6.07 6.60 6.84 7.21 7.60 7.98 8.27 8.74 9.20 9.56 9.92 9.91 10.53
76% 4.14 4.31 4.03 4.06 3.93 3.95 4.04 4.04 4.45 4.43 4.65 4.68 5.02 5.20 5.71 6.11 6.29 6.89 7.09 7.47 7.86 8.30 8.57 9.00 9.47 9.87 10.24 10.22 10.91
77% 4.31 4.49 4.22 4.24 4.11 4.12 4.27 4.25 4.68 4.65 4.86 4.90 5.25 5.45 5.96 6.31 6.59 7.14 7.38 7.76 8.19 8.57 8.83 9.32 9.76 10.14 10.54 10.56 11.27
78% 4.49 4.65 4.44 4.42 4.30 4.31 4.54 4.41 4.88 4.86 5.11 5.11 5.47 5.70 6.26 6.56 6.93 7.46 7.69 8.03 8.44 8.88 9.18 9.61 10.11 10.43 10.85 10.93 11.63
79% 4.68 4.86 4.59 4.63 4.48 4.53 4.78 4.60 5.09 5.12 5.34 5.36 5.73 6.00 6.50 6.84 7.19 7.74 7.95 8.33 8.75 9.22 9.51 9.89 10.47 10.83 11.21 11.29 12.00
80% 4.86 5.06 4.80 4.83 4.67 4.73 5.00 4.84 5.32 5.38 5.57 5.66 5.97 6.26 6.74 7.14 7.48 8.04 8.32 8.65 9.01 9.55 9.82 10.24 10.78 11.15 11.50 11.70 12.42
81% 5.03 5.27 5.00 5.08 4.88 4.97 5.20 5.07 5.55 5.63 5.84 5.92 6.24 6.50 7.01 7.44 7.77 8.34 8.66 8.95 9.36 9.79 10.16 10.59 11.10 11.49 11.81 12.06 12.76
82% 5.23 5.46 5.22 5.29 5.06 5.20 5.44 5.31 5.76 5.89 6.12 6.17 6.52 6.81 7.30 7.77 8.06 8.70 8.95 9.26 9.76 10.10 10.50 10.92 11.45 11.84 12.16 12.46 13.11
83% 5.45 5.64 5.45 5.54 5.32 5.38 5.66 5.51 6.05 6.18 6.37 6.47 6.82 7.08 7.61 8.13 8.41 8.98 9.30 9.62 10.09 10.52 10.92 11.31 11.85 12.21 12.56 12.87 13.51
84% 5.68 5.85 5.63 5.78 5.54 5.63 5.87 5.80 6.29 6.46 6.63 6.74 7.13 7.42 7.94 8.44 8.74 9.29 9.63 9.96 10.45 10.88 11.26 11.73 12.24 12.60 12.94 13.27 13.97
85% 5.87 6.10 5.82 6.01 5.77 5.89 6.12 6.06 6.59 6.69 6.93 7.00 7.43 7.75 8.30 8.73 9.07 9.65 10.00 10.31 10.84 11.33 11.64 12.11 12.66 13.01 13.39 13.72 14.44
86% 6.05 6.34 6.05 6.28 6.01 6.16 6.35 6.33 6.88 6.99 7.26 7.32 7.70 8.08 8.64 9.04 9.42 9.95 10.37 10.74 11.20 11.70 12.10 12.56 13.11 13.43 13.84 14.17 14.91
87% 6.27 6.62 6.31 6.56 6.28 6.39 6.65 6.62 7.21 7.28 7.60 7.63 8.05 8.39 8.96 9.45 9.77 10.36 10.82 11.08 11.54 12.13 12.46 13.08 13.59 13.85 14.25 14.59 15.39
88% 6.53 6.87 6.60 6.79 6.59 6.70 6.88 6.90 7.58 7.55 7.91 7.95 8.44 8.73 9.32 9.84 10.23 10.73 11.29 11.48 11.96 12.58 12.92 13.57 14.02 14.33 14.78 15.12 15.85
89% 6.80 7.16 6.91 7.10 6.84 7.01 7.17 7.21 7.91 7.89 8.31 8.32 8.81 9.12 9.68 10.30 10.66 11.14 11.73 11.94 12.36 13.07 13.37 14.08 14.56 14.95 15.25 15.67 16.30
90% 7.11 7.50 7.19 7.36 7.11 7.35 7.45 7.51 8.27 8.26 8.67 8.70 9.21 9.56 10.15 10.74 11.07 11.57 12.20 12.45 12.84 13.54 13.85 14.55 15.07 15.42 15.80 16.18 16.86
91% 7.42 7.80 7.54 7.73 7.49 7.71 7.75 7.88 8.60 8.62 9.06 9.17 9.65 10.07 10.54 11.21 11.51 12.00 12.78 12.93 13.26 14.08 14.44 15.11 15.67 16.00 16.38 16.85 17.48
92% 7.73 8.09 7.90 8.00 7.83 8.09 8.21 8.28 8.98 9.06 9.48 9.61 10.12 10.54 11.10 11.68 11.91 12.51 13.26 13.49 13.81 14.66 15.09 15.67 16.22 16.58 17.05 17.56 18.17
93% 8.06 8.48 8.24 8.39 8.26 8.55 8.65 8.75 9.44 9.57 9.90 10.07 10.54 11.01 11.70 12.21 12.48 13.16 13.86 14.16 14.43 15.29 15.69 16.30 16.84 17.23 17.64 18.28 18.89
94% 8.41 8.87 8.73 8.80 8.70 9.05 9.04 9.22 9.86 10.07 10.35 10.66 11.01 11.58 12.31 12.78 13.06 13.71 14.45 14.87 15.09 16.00 16.36 16.97 17.70 17.91 18.37 19.03 19.86
95% 8.85 9.33 9.15 9.21 9.12 9.55 9.57 9.73 10.40 10.68 11.07 11.23 11.68 12.09 12.94 13.44 13.69 14.44 15.32 15.57 15.80 16.81 17.23 17.86 18.52 18.76 19.29 19.92 20.97
96% 9.41 9.87 9.73 9.75 9.77 10.16 10.24 10.42 11.01 11.33 11.70 11.96 12.47 12.93 13.70 14.20 14.52 15.16 16.07 16.53 16.82 17.70 18.25 18.73 19.43 19.83 20.43 20.88 21.93
97% 10.05 10.40 10.35 10.35 10.50 10.84 11.06 11.15 11.78 12.29 12.48 12.81 13.36 13.91 14.68 15.31 15.56 16.18 17.24 17.65 17.90 18.91 19.42 20.02 20.72 21.07 21.68 22.18 23.09
98% 10.83 11.34 11.29 11.09 11.47 11.76 12.14 12.19 12.98 13.28 13.70 14.02 14.50 15.20 15.85 16.75 17.01 17.47 18.74 19.10 19.33 20.60 20.80 21.59 22.29 22.66 23.30 23.80 24.65
99% 12.20 12.73 12.52 12.47 12.96 13.25 13.52 13.57 14.54 14.92 15.23 15.92 16.25 16.94 17.80 18.49 19.03 19.48 20.75 21.24 21.77 23.23 23.34 24.01 25.04 25.14 25.66 25.99 27.49
100% 16.35 19.16 19.20 18.12 22.35 21.16 19.48 21.23 21.24 30.19 24.71 29.61 24.48 25.83 25.71 27.81 30.91 29.13 28.63 32.14 31.04 36.10 36.89 39.23 35.08 38.01 37.93 37.65 43.64

Mott MacDonald | Company Headroom Analysis 1Water Resource Management Plan 2019
387731 | 03 | F | 2 November 2017 https://mottmac.sharepoint.com/teams/pj-b3756/do/Reports/SSW Headroom Report - South Staffs Rev F.docx

Mott MacDonald | Company Headroom Analysis 2Water Resource Management Plan 2019
387731 | 03 | F | 2 November 2017 https://mottmac.sharepoint.com/teams/pj-b3756/do/Reports/SSW Headroom Report - South Staffs Rev F.docx
mottmac.com