Embed Size (px)
Citation preview
Sector Thematic
Autos
Where are we on the ‘S’ curve?
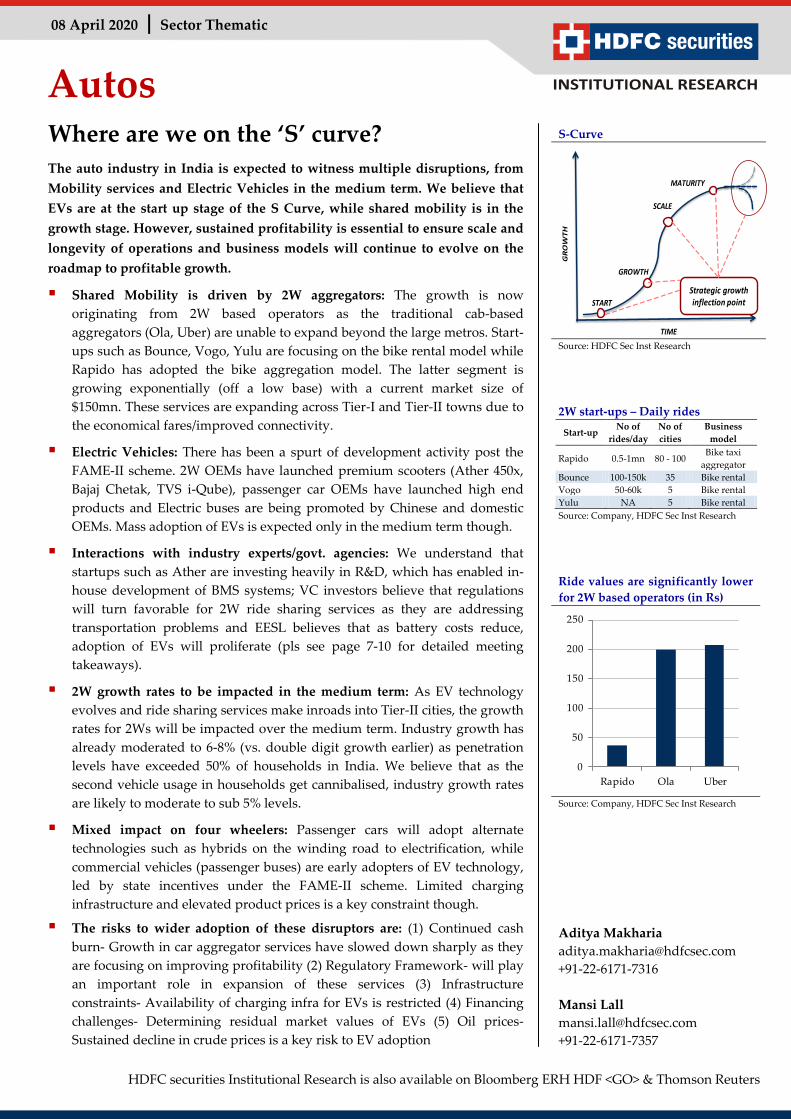
The auto industry in India is expected to witness multiple disruptions, from
Mobility services and Electric Vehicles in the medium term. We believe that EVs are
at the start up stage of the S Curve, while shared mobility is in the growth stage.
However, sustained profitability is essential to ensure scale and longevity of
operations and business models will continue to evolve on the roadmap to
profitable growth.
Aditya Makharia Analyst – Autos, Transportation & Logistics
+91-22-6171-7316
Mansi Lall Associate - Autos, Transportation & Logistics
+91-22-6171-7357
HDFC securities Institutional Research is also available on Bloomberg ERH HDF <GO> & Thomson Reuters
08 April 2020 Sector Thematic
Autos
Where are we on the ‘S’ curve?
The auto industry in India is expected to witness multiple disruptions, from
Mobility services and Electric Vehicles in the medium term. We believe that
EVs are at the start up stage of the S Curve, while shared mobility is in the
growth stage. However, sustained profitability is essential to ensure scale and
longevity of operations and business models will continue to evolve on the
roadmap to profitable growth.
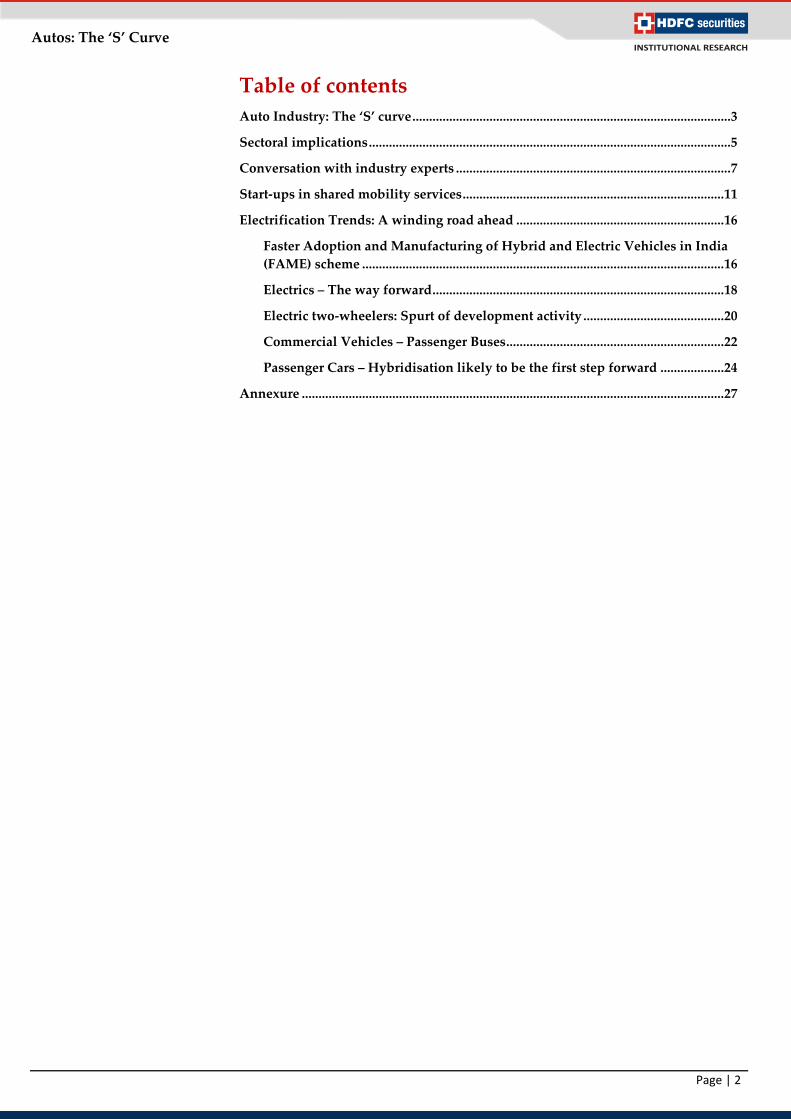
Shared Mobility is driven by 2W aggregators: The growth is now
originating from 2W based operators as the traditional cab-based
aggregators (Ola, Uber) are unable to expand beyond the large metros. Start-
ups such as Bounce, Vogo, Yulu are focusing on the bike rental model while
Rapido has adopted the bike aggregation model. The latter segment is
growing exponentially (off a low base) with a current market size of
$150mn. These services are expanding across Tier-I and Tier-II towns due to
the economical fares/improved connectivity.
Electric Vehicles: There has been a spurt of development activity post the
FAME-II scheme. 2W OEMs have launched premium scooters (Ather 450x,
Bajaj Chetak, TVS i-Qube), passenger car OEMs have launched high end
products and Electric buses are being promoted by Chinese and domestic
OEMs. Mass adoption of EVs is expected only in the medium term though.
Interactions with industry experts/govt. agencies: We understand that
startups such as Ather are investing heavily in R&D, which has enabled in-
house development of BMS systems; VC investors believe that regulations
will turn favorable for 2W ride sharing services as they are addressing
transportation problems and EESL believes that as battery costs reduce,
adoption of EVs will proliferate (pls see page 7-10 for detailed meeting
takeaways).
2W growth rates to be impacted in the medium term: As EV technology
evolves and ride sharing services make inroads into Tier-II cities, the growth
rates for 2Ws will be impacted over the medium term. Industry growth has
already moderated to 6-8% (vs. double digit growth earlier) as penetration
levels have exceeded 50% of households in India. We believe that as the
second vehicle usage in households get cannibalised, industry growth rates
are likely to moderate to sub 5% levels.
Mixed impact on four wheelers: Passenger cars will adopt alternate
technologies such as hybrids on the winding road to electrification, while
commercial vehicles (passenger buses) are early adopters of EV technology,
led by state incentives under the FAME-II scheme. Limited charging
infrastructure and elevated product prices is a key constraint though.
The risks to wider adoption of these disruptors are: (1) Continued cash
burn- Growth in car aggregator services have slowed down sharply as they
are focusing on improving profitability (2) Regulatory Framework- will play
an important role in expansion of these services (3) Infrastructure
constraints- Availability of charging infra for EVs is restricted (4) Financing
challenges- Determining residual market values of EVs (5) Oil prices-
Sustained decline in crude prices is a key risk to EV adoption
S-Curve
Source: HDFC Sec Inst Research
2W start-ups – Daily rides
Start-up No of
rides/day
No of
cities
Business
model
Rapido 0.5-1mn 80 - 100 Bike taxi
aggregator
Bounce 100-150k 35 Bike rental
Vogo 50-60k 5 Bike rental
Yulu NA 5 Bike rental
Source: Company, HDFC Sec Inst Research
Ride values are significantly lower
for 2W based operators (in Rs)
Source: Company, HDFC Sec Inst Research
Aditya Makharia
+91-22-6171-7316
Mansi Lall
+91-22-6171-7357
START
GROWTH
SCALE
MATURITY
GR
OW
TH
TIME
Strategic growth inflection point
0
50
100
150
200
250
Rapido Ola Uber
Page | 2
Autos: The ‘S’ Curve
Table of contents
Auto Industry: The ‘S’ curve ............................................................................................... 3
Sectoral implications ............................................................................................................ 5
Conversation with industry experts .................................................................................. 7
Start-ups in shared mobility services .............................................................................. 11
Electrification Trends: A winding road ahead .............................................................. 16
Faster Adoption and Manufacturing of Hybrid and Electric Vehicles in India
(FAME) scheme ............................................................................................................ 16
Electrics – The way forward ....................................................................................... 18
Electric two-wheelers: Spurt of development activity .......................................... 20
Commercial Vehicles – Passenger Buses ................................................................. 22
Passenger Cars – Hybridisation likely to be the first step forward ................... 24
Annexure .............................................................................................................................. 27
Page | 3
Autos: The ‘S’ Curve
Auto Industry: The ‘S’ curve of disruption
Where are we on the ‘S’ curve? The auto industry in India is expected to witness
multiple disruptions, from Mobility services and Electric Vehicles in the medium
term. We believe that EVs are at the start up stage of the S Curve, while shared
mobility is in the growth stage. While these alternate business models are in the
early stage of growth, sustained profitability is essential to ensure scale and
longevity of operations as once the core economics of a certain service is better
than the incumbent service or product, the adoption is exponential.
S-Curve for the Auto Industry in India
Source: Industry, HDFC sec Inst Research
As these start-ups are in the investing stage, the business models will continue
to evolve on the roadmap to profitability. We have interacted with several
industry participants, policy makers, OEMs, start-ups, VCs, experts as well as
financiers to assess these evolving trends in the auto industry. The business
models are continuing to evolve – for instance shared mobility is now driven by
two-wheeler based aggregators while the EV technology for 2Ws is developing
with OEMs investing in BMS and related components.
Start-ups in the two-wheeler segment are attempting to alter the traditional ICE
ecosystem with the launch of EV products. The emergence of ride mobility
solutions will provide improved connectivity across urban and semi urban areas.
The growth in ride sharing is now originating from 2W operators as the cab-
based aggregators (Ola, Uber) are unable to expand beyond the large metros. The
bike aggregators/rental based services are expanding across Tier-I and Tier-II
towns due to the economical fares and ease of use.
Venture capital investors have invested in the early stage (Series A, B funding) in
these companies (Ather, Bounce and Rapido, etc.) with the combined fund
raising of start-ups exceeding $350mn.
2W start-ups
Start-ups Daily rides Cities Business model Reach
Rapido 0.5-1mn 80-100 Bike taxi aggregator Tier-I/II
Bounce 100K-150K 35 Bike rental Tier-I
Vogo 50-60K 5 Bike rental Tier-I
Yulu NA 5 Bike rental Tier-I
Ather NA 10 EV start up Tier-I
Source: Industry, HDFC sec Inst Research
START
GROWTH
SCALE
MATURITY
GR
OW
TH
TIME
Electric vehicles in India
Ride sharing & mobilityservices
Achieveing profitabilty is important to ensure scalabilty of these alternate business
Strategic growth inflection point
Path of sustainedmomentum
Path of obsolescence
Path of plateau
We believe that EVs are
at the start up stage of
the S Curve, while shared
mobility is in the growth
stage
2Ws will increasingly
face risks from ride
sharing start-ups as well
as from EV products in
the medium term
The emergence of ride
mobility solutions will
provide improved
connectivity across urban
and semi urban areas

Page | 4
Autos: The ‘S’ Curve
Electric Vehicles – A winding road ahead: The transition to EV is more suitable
for commercial applications rather than personal mobility at this stage in India.
Passenger buses are being adopted by various STUs due to the FAME incentives
as well as ability to set up charging infrastructure. For passenger cars, adoption is
a while away due to infrastructure limitations as well as elevated product costs.
Alternate technologies such as hybrids are a go between.
Within 2Ws, the technology is progressing with mainstream OEMs and start-ups
such as Ather introducing high end products. For 3Ws, the market leader is yet to
roll out a vehicle in this segment even as lead acid-based products have emerged
as an alternate segment with annual volumes of 600,000 units p.a.
Potential impact on segments due to the disruptors
EV impact Ride share
CVs Bus segment is early adopter NA
2Ws Limited adoption Could impact 2nd vehicle ownership
Cars Early adoption could be through hybrids Model not scalable beyond large metros
Source: HDFC sec Inst Research
Key risks to wider adoption of these disruptors are (1) Continued cash burn: The
growth in rides for car aggregators has slowed down sharply as they focus on
profitability and reducing the incentive structure (2) Regulatory Framework: The
regulations have been lacking and will play an important role in proliferation of
these services. Any cap on fares or age of vehicles will impact business models
(3) Infrastructure constraints: Availability of charging stations and reliable
availability of power will have to be provided by the government. It is easier to
facilitate this in the metros and hence penetration will increase in these areas
initially (4) Financing challenges: Determining residual market values of EVs’
battery life continues to be a key challenge. This restricts financing options for
2W EVs (5) Oil prices: A sustained decline in crude prices is a key risk to EV
adoption
The transition to EV is
more suitable for
commercial applications
rather than personal
mobility at this stage in
India.
Page | 5
Autos: The ‘S’ Curve
Sectoral implications
2W growth rates to be impacted in the medium term: We believe that as EV
technology proliferates and ride sharing services make inroads into Tier-II and
smaller centers, the growth rates for 2Ws will be impacted over the medium
term.
2Ws will face multiple risks as the shared mobility start-ups are increasing focus
on this segment, after incorporating learning’s from the car ride sharing segment.
The eco system for 2Ws, be it bike rentals or bike aggregators, is less capital
intensive and is scalable to the smaller metros as well. Further, EV technology is
already making inroads with several OEMs launching premium products.
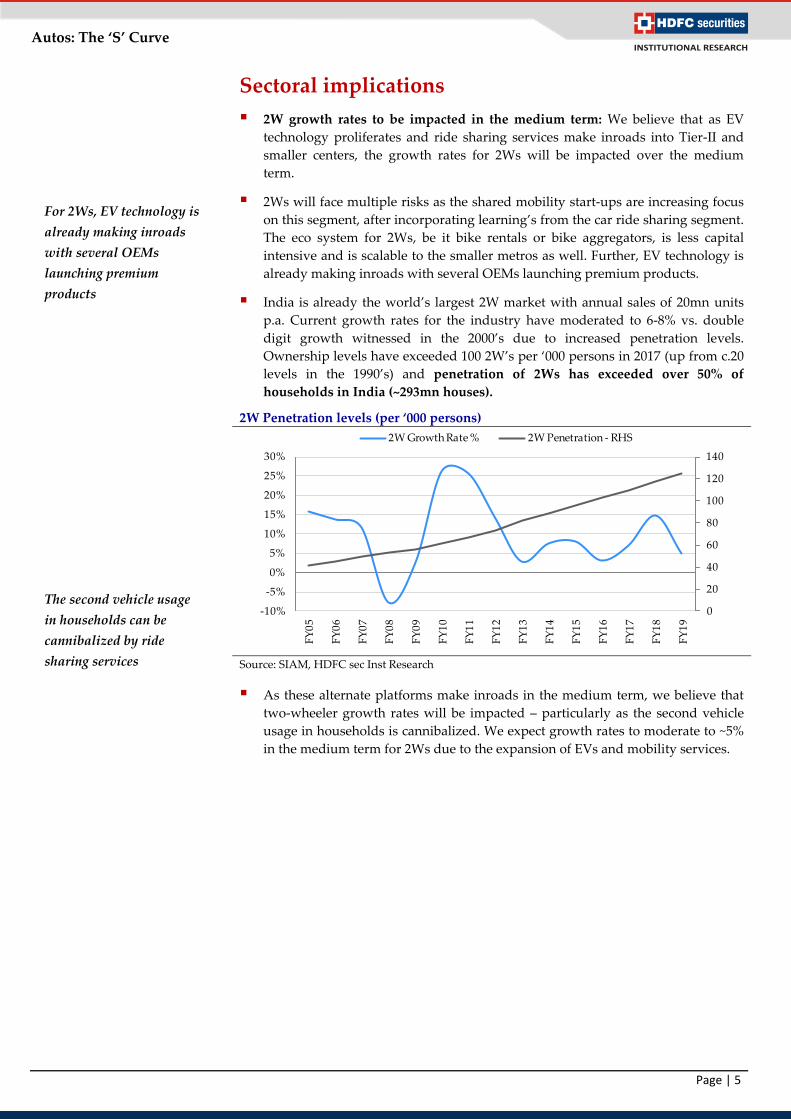
India is already the world’s largest 2W market with annual sales of 20mn units
p.a. Current growth rates for the industry have moderated to 6-8% vs. double
digit growth witnessed in the 2000’s due to increased penetration levels.
Ownership levels have exceeded 100 2W’s per ‘000 persons in 2017 (up from c.20
levels in the 1990’s) and penetration of 2Ws has exceeded over 50% of
households in India (~293mn houses).
2W Penetration levels (per ‘000 persons)
Source: SIAM, HDFC sec Inst Research
As these alternate platforms make inroads in the medium term, we believe that
two-wheeler growth rates will be impacted – particularly as the second vehicle
usage in households is cannibalized. We expect growth rates to moderate to ~5%
in the medium term for 2Ws due to the expansion of EVs and mobility services.
For 2Ws, EV technology is
already making inroads
with several OEMs
launching premium
products
The second vehicle usage
in households can be
cannibalized by ride
sharing services
0
20
40
60
80
100
120
140
-10%
-5%
0%
5%
10%
15%
20%
25%
30%
FY
05
FY
06
FY
07
FY
08
FY
09
FY
10
FY
11
FY
12
FY
13
FY
14
FY
15
FY
16
FY
17
FY
18
FY
19
2W Growth Rate % 2W Penetration - RHS
Page | 6
Autos: The ‘S’ Curve
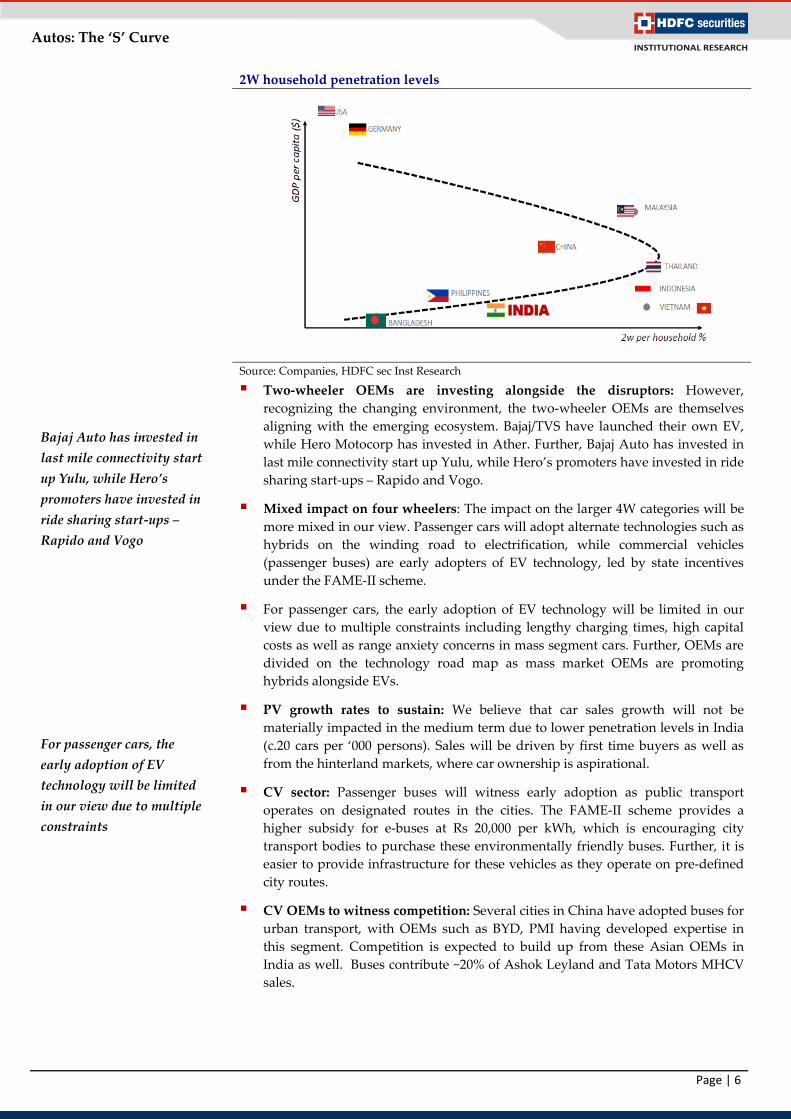
2W household penetration levels
Source: Companies, HDFC sec Inst Research
Two-wheeler OEMs are investing alongside the disruptors: However,
recognizing the changing environment, the two-wheeler OEMs are themselves
aligning with the emerging ecosystem. Bajaj/TVS have launched their own EV,
while Hero Motocorp has invested in Ather. Further, Bajaj Auto has invested in
last mile connectivity start up Yulu, while Hero’s promoters have invested in ride
sharing start-ups – Rapido and Vogo.
Mixed impact on four wheelers: The impact on the larger 4W categories will be
more mixed in our view. Passenger cars will adopt alternate technologies such as
hybrids on the winding road to electrification, while commercial vehicles
(passenger buses) are early adopters of EV technology, led by state incentives
under the FAME-II scheme.
For passenger cars, the early adoption of EV technology will be limited in our
view due to multiple constraints including lengthy charging times, high capital
costs as well as range anxiety concerns in mass segment cars. Further, OEMs are
divided on the technology road map as mass market OEMs are promoting
hybrids alongside EVs.
PV growth rates to sustain: We believe that car sales growth will not be
materially impacted in the medium term due to lower penetration levels in India
(c.20 cars per ‘000 persons). Sales will be driven by first time buyers as well as
from the hinterland markets, where car ownership is aspirational.
CV sector: Passenger buses will witness early adoption as public transport
operates on designated routes in the cities. The FAME-II scheme provides a
higher subsidy for e-buses at Rs 20,000 per kWh, which is encouraging city
transport bodies to purchase these environmentally friendly buses. Further, it is
easier to provide infrastructure for these vehicles as they operate on pre-defined
city routes.
CV OEMs to witness competition: Several cities in China have adopted buses for
urban transport, with OEMs such as BYD, PMI having developed expertise in
this segment. Competition is expected to build up from these Asian OEMs in
India as well. Buses contribute ~20% of Ashok Leyland and Tata Motors MHCV
sales.
Bajaj Auto has invested in
last mile connectivity start
up Yulu, while Hero’s
promoters have invested in
ride sharing start-ups –
Rapido and Vogo
For passenger cars, the
early adoption of EV
technology will be limited
in our view due to multiple
constraints
Page | 7
Autos: The ‘S’ Curve
In conversation with industry experts
We have interacted with several industry participants, policy makers, OEMs, start-
ups, VCs, experts as well as financiers to assess the transition in the auto industry.
We have highlighted excerpts from conversations with the various associated
partners in the mobility/EV universe. Further, we test drove the Tata Nexon as well
as to understand the business dynamics for EVs.
Interaction with Tarun Mehta, founder of Ather Energy:
Ather has developed India's fastest 2W in the sub 125cc category: The
management highlights that Ather has built its own battery management system
as well as it has light weighted the scooter with a steel aluminum hybrid chassis.
Resultantly, the Ather 450X is one of the quickest scooters across petrol/EV
models with acceleration from 0-60kmph in 6.5sec. (almost 1 sec quicker than the
fastest petrol-powered 125cc scooters; however, the EVs top speed is capped at
80kmph). The model is priced at a premium to the offerings by Bajaj Chetak &
TVS i-Qube due to its superior performance.
Ather is investing heavily in R&D: R&D plays an important role in developing
Electric vehicles. At Ather, we have invested heavily in this function over the
past few years, with over half the staff engaged in this role. This has enabled
Ather to develop their own BMS and softwares, which allow updates on real time
basis. As much as 70% of the IPs (intellectual property) in the scooter are
controlled by Ather. It has designed and developed key components such as
battery packs (only 30%, mainly the cells, are imported), dash board, software,
vehicle frame, amongst others. It also partnered with over 70 vendors, including
Google for navigation and Sanmina Corporation for electronics—that never
worked with auto companies earlier.
In 2015, out of its team of 100 employees, 95 were engineers. Today, half of its 700
employees work in R&D.
Improvements to the 450x: The upgraded scooter has a bigger battery which is
more power dense. The installed battery capacity is 2.9kWh (up from 2.71kWh in
the 450) and that translates to an improved battery range, from 75km to 85km in
Eco mode. The motor, develops a peak output of 6kW (up from 5.4kW). More
importantly, the peak torque has gone up from 20.5Nm to 26Nm. It takes about
5hr 45min to charge the battery using a standard home-charging point.
On business strategy: Ather is now expanding pan India after testing the
product in Bangalore and Chennai. The favorable response to the product has
encouraged the OEM to expand to northern / western India as well.
On charging infrastructure: The company believes that setting up battery
charging infrastructure is easier for two wheelers as it requires a standard 5AMP
plug point. Ather is collaborating with malls, cafes etc. for setting up these
facilities at their own cost.
Our view: Ather’s focus on R&D has highlighted the importance of developing
local expertise to manufacture EVs, rather than relying on commoditized Chinese
imports. The superior product performance will improve the acceptance of the
product amongst consumers.
Ather has developed
India's fastest 2W in the
sub 125cc category
As much as 70% of the IPs
(intellectual property) in
the 450 are controlled by
Ather.
Setting up battery
charging infrastructure is
easier for two wheelers as
it requires a standard
5AMP plug point.

Page | 8
Autos: The ‘S’ Curve
Interaction with Mr. Saurabh Kumar, MD at EESL (Energy
Efficiency Services Limited):
Electrics – The way forward: He believes that the process of electrification has
already started and is led by 3Ws. Annual sales of e-3Ws are ~600K annually and
the vehicle park will be in excess of 3mn. However, the current vehicles are lead
acid based. The users will have to switch over to lithium-ion batteries. 2Ws are
also expected to witness a natural shift towards electric.
The electrification of passenger cars is more complex. The longer charging times
and higher cost of the vehicle makes it a difficult proposition to become main
stream. The tender for e-powered vehicles for government bureaucrats has not
achieved the desired response. Thus, EESL has now collaborated with EV start-
ups in the NCR region for shared mobility-based services.
Battery costs remain elevated: The battery prices though continue to remain high
at over $200 kWh. While several studies suggest that the prices are expected to
correct, the adoption will accelerate as battery costs fall.
Government favors electrics over hybrids: The government has differentiated
between hybrids and electrics by charging 28% GST on hybrids vs just 5% on
electrics. Their intent is to promote EVs as the Indian passenger car industry is
still at the early stages of penetration (car sales are at ~20 cars per ‘000 persons).
The FAME scheme launched by the government continues to be tweaked in-line
with the changing industry landscape. The current scheme has been introduced
after exhaustive consultation with the industry.
Our View: The government is actively promoting the adoption of Electric
Vehicles and agencies such as EESL are promoting their usage. The intent is to
develop an enabling environment for manufacturing these vehicles indigenously.
Interaction with a leading venture capital firm on investing in
start-ups:
VCs which have invested in two-wheeler start-ups believe that the 2W sharing
economy solves social problems such as reduce traffic congestion, provide
employment and reduce pollution. Thus, they are comfortable that ride sharing
will witness regulatory support over time.
Similar models (Grab, Gojek) have evolved in South East Asian countries.
India will likely have 1-2 such unicorns.
To back asset light business models over the ownership model is also an
important consideration.
Our view: Venture capital firms are replicating investment strategies in India
based on similar evolution of business models in emerging markets such as
Indonesia. These companies have 20mn active weekly users, reflecting the
potential for the Indian market.
600K lead acid based 3Ws
were sold in FY19
The electrification of
passenger cars is more
complex
VCs which have invested in
two-wheeler start-ups
believe that ride sharing
will witness regulatory
support over time as it
solves congestion issues.
Page | 9
Autos: The ‘S’ Curve
In conversation with Vikas Jain of Welectric – Enabling
adoption and building a financing ecosystem for e-2Ws
A good lease rental solution addresses most of the issues that have been
inhibiting E2W adoption like (1) Higher capex compared to IC 2Ws (20-35%), (2)
Lack of sales and after sale service infrastructure, (3) limited and unattractive
finance options, (4) low resale value (due to low volumes and lack of awareness)
and (5) lack of understanding of subsequent capex on battery replacement,
among others.
B2B segment is more amenable for E2W adoption as economics are viable due
to the high daily usage of the vehicles. The biggest advantage of an E2W is the
lower cost of fuel (around 1/10th of an IC 2W) and maintenance (at least half of
that of an IC 2W). Further, in a lease rental scenario, users benefit from lower
cost of ownership upfront.
Corporates have adopted the E2Ws for their last mile delivery operations. There
are various companies such as Ninjacart, Licious, Rebel Foods, Big Basket
among others that have already taken steps to use E2Ws for their last mile
delivery operations.
A typical B2B lease rental offers customers the following: (1) Lease rental
tenure of around 24 months with monthly payment of lease rentals (2) No need
to invest capital & no requirement to capitalize assets/depreciate them. Further,
Lease rental will give better tax benefits compared to depreciation (3) All
compliances like registration and insurance taken care of and all preventive and
corrective maintenance services are taken care of at the work location. (4) IOT
device provides complete analytics of the vehicle - live tracking, trip history,
remote immobilization, geofencing etc. UPIs can be integrated to client systems
(5) Reduce carbon footprint and improve brand image
Risks to electrification: Welectric believes that the base case for E2W adoption in
India is 25% of new sales in the medium term. The two factors that can constrain
this are (1) In case the lithium batteries imported/assembled in India are sub-
standard from quality & safety perspective and (2) Inability of OEMs (both
traditional and new players) to scale up E2W manufacturing capacity in India.
Not to mention, that it would be critical that government regulations & incentives
are supportive. Further, global oil prices do not have a negative impact on the
industry in the medium term.
Our View: It is important to develop an ecosystem for electric vehicles. Leasing
options will facilitate the early adoption of EVs as the asset will not be on the
consumers books and the risks regarding residual life, etc. will be borne by the
lessor.
Views from BYD: BYD believes in mass transportation, states
are showing early adoption
Chinese OEM – BYD believes that adoption of electric technology for mass
transport is the way forward. Learning by their experience in China, the OEM is
aggressively investing in EV bus technology in India. For instance, in Shenzhen,
China, where BYD is based, 100% of public buses are electric. The OEM
believes that India can follow the Chinese model, where electrification of mass
transport has made inroads. As public buses operate on pre-defined routes and
have charging infrastructure at the depots, the business model is viable.
Leasing addresses the
issues that inhibit
adoption of electric 2Ws
In Shenzhen, China,
where BYD is based,
100% of public buses are
electric.
Page | 10
Autos: The ‘S’ Curve
Views from Shashank Srivastava, Maruti
Maruti Suzuki believes that hybrids will play a key role as an intermediate
step as electrification is a longer journey - both on affordability as well on
infrastructure constrains. In the medium term, of the 1mn eco-friendly vehicles
that MSIL is targeting, 0.5mn will come from mild (48V smart hybrids) and
parallel hybrids. The mild hybrids are already present on their vehicles, while the
parallel hybrids launch is to be firmed up as it requires higher localization. A
commercial launch of the Swift hybrid (strong) is awaited. Maruti has set up a
lithium ion battery plant for producing batteries for hybrids (along with Toshiba
and Denso).
Views from Mahesh Babu, Mahindra & Mahindra
Mahindra & Mahindra believes in electrification at the point of first and last
mile connectivity. The company sees an opportunity in large cities that have
metro-rail infrastructure. These vehicles would be comfortable and convenient
alternatives to auto-rickshaws connecting metro stations to people’s homes.
Mahindra has acquired a 55% stake in radio-operated cab service provider, Meru
in September last year. Meru has its niche focus segment and would not compete
with Ola. This association would give Mahindra access to push its electric vehicle
fleet into Meru cabs. Vehicles such as the e-KUV100 can be considered by the cab
segment because of their low operational costs.
As per Maruti, Hybrids
will be a near term
solution to India’s EV
transition
Page | 11
Autos: The ‘S’ Curve
Start-ups in shared mobility services
The growth in aggregator services is emerging from 2W based start-ups, which
are proliferating through bike rental services as well as bike aggregator services.
These services are meant for first and last mile mobility, where the driving range
is typically between 1-10kms. While the bike rental model is suitable for Tier-I
metro cities, where congestion and last mile transport from metro stations/drop-
off points is limited, the bike aggregation model is more scalable pan India,
where availability of public transport is limited. Start-ups such as Bounce, Vogo,
Yulu are focusing on the bike rental model while Rapido has adopted the bike
aggregation model.
Business dynamics of 2W start-ups
Start-up No of rides/day No of cities Business model Reach
Rapido 0.5-1mn 80-100 Bike taxi aggregator Tier-I/II
Bounce 100K-150K 35 Bike rental Tier-I
Vogo 50-60K 5 Bike rental Tier-I
Yulu NA 5 Bike rental Tier-I
Source: Industry, HDFC sec Inst Research
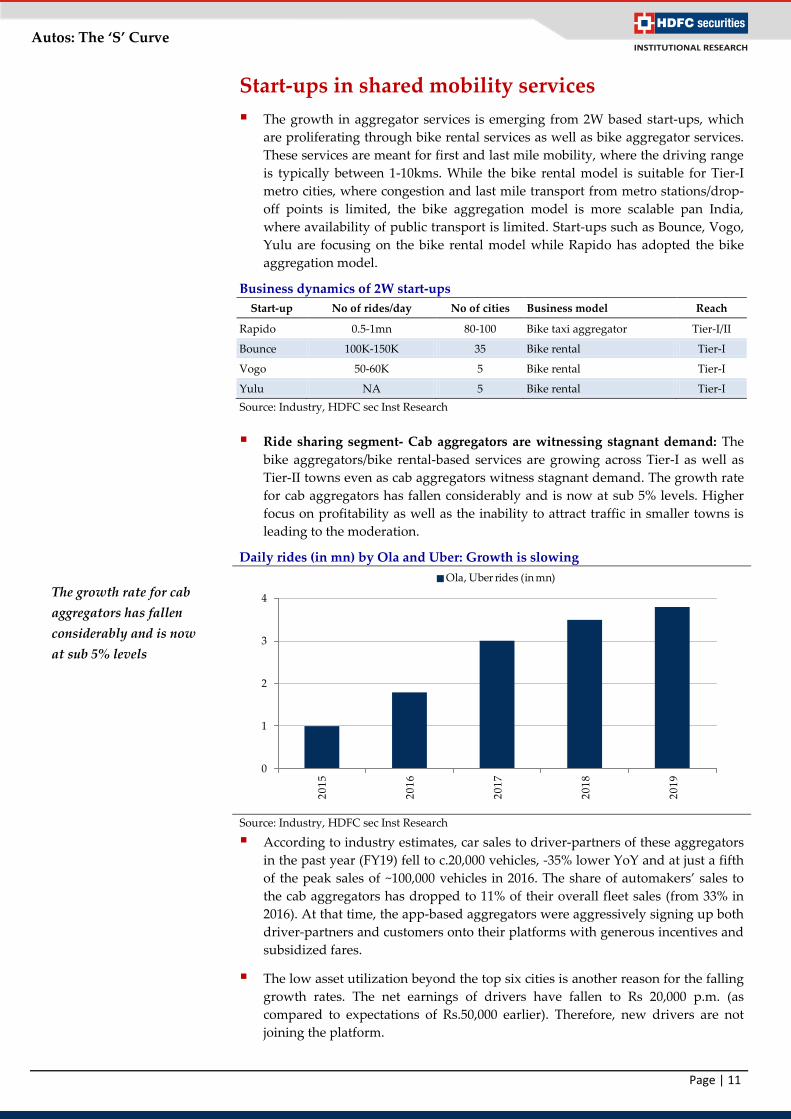
Ride sharing segment- Cab aggregators are witnessing stagnant demand: The
bike aggregators/bike rental-based services are growing across Tier-I as well as
Tier-II towns even as cab aggregators witness stagnant demand. The growth rate
for cab aggregators has fallen considerably and is now at sub 5% levels. Higher
focus on profitability as well as the inability to attract traffic in smaller towns is
leading to the moderation.
Daily rides (in mn) by Ola and Uber: Growth is slowing
Source: Industry, HDFC sec Inst Research
According to industry estimates, car sales to driver-partners of these aggregators
in the past year (FY19) fell to c.20,000 vehicles, -35% lower YoY and at just a fifth
of the peak sales of ~100,000 vehicles in 2016. The share of automakers’ sales to
the cab aggregators has dropped to 11% of their overall fleet sales (from 33% in
2016). At that time, the app-based aggregators were aggressively signing up both
driver-partners and customers onto their platforms with generous incentives and
subsidized fares.
The low asset utilization beyond the top six cities is another reason for the falling
growth rates. The net earnings of drivers have fallen to Rs 20,000 p.m. (as
compared to expectations of Rs.50,000 earlier). Therefore, new drivers are not
joining the platform.
0
1
2
3
4
20
15
20
16
20
17
20
18
20
19
Ola, Uber rides (in mn)
The growth rate for cab
aggregators has fallen
considerably and is now
at sub 5% levels
Page | 12
Autos: The ‘S’ Curve
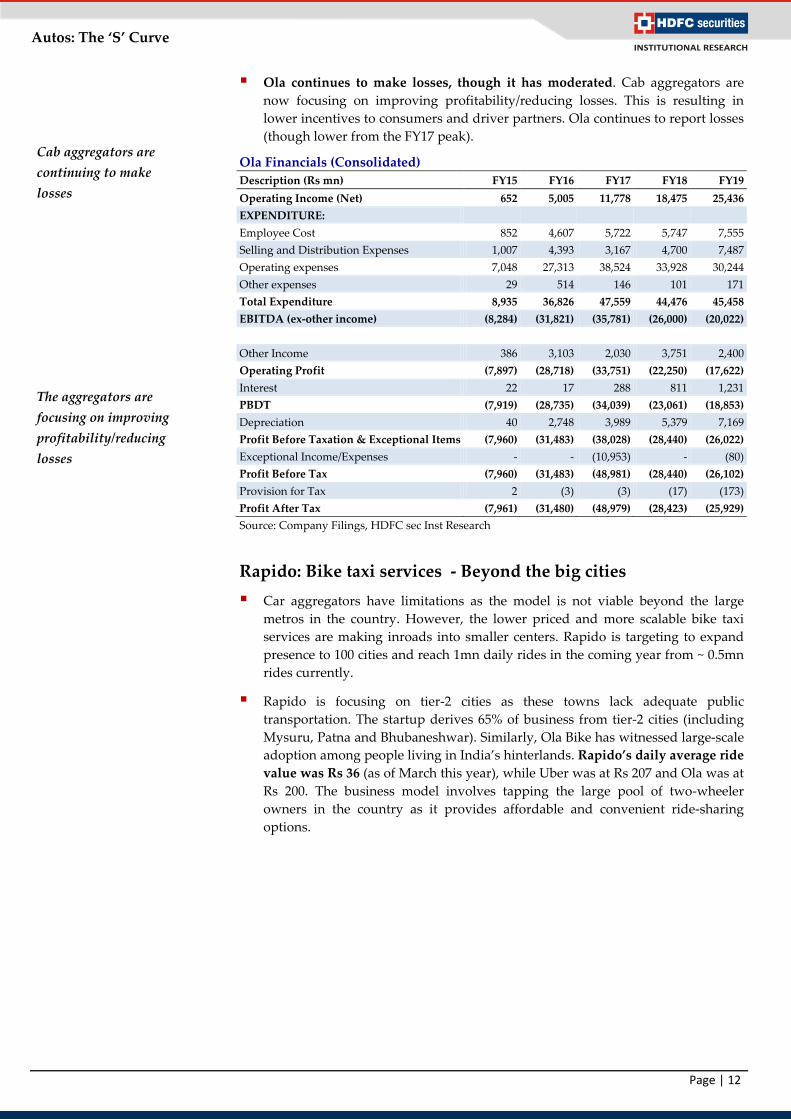
Ola continues to make losses, though it has moderated. Cab aggregators are
now focusing on improving profitability/reducing losses. This is resulting in
lower incentives to consumers and driver partners. Ola continues to report losses
(though lower from the FY17 peak).
Ola Financials (Consolidated)
Description (Rs mn) FY15 FY16 FY17 FY18 FY19
Operating Income (Net) 652 5,005 11,778 18,475 25,436
EXPENDITURE:
Employee Cost 852 4,607 5,722 5,747 7,555
Selling and Distribution Expenses 1,007 4,393 3,167 4,700 7,487
Operating expenses 7,048 27,313 38,524 33,928 30,244
Other expenses 29 514 146 101 171
Total Expenditure 8,935 36,826 47,559 44,476 45,458
EBITDA (ex-other income) (8,284) (31,821) (35,781) (26,000) (20,022)
Other Income 386 3,103 2,030 3,751 2,400
Operating Profit (7,897) (28,718) (33,751) (22,250) (17,622)
Interest 22 17 288 811 1,231
PBDT (7,919) (28,735) (34,039) (23,061) (18,853)
Depreciation 40 2,748 3,989 5,379 7,169
Profit Before Taxation & Exceptional Items (7,960) (31,483) (38,028) (28,440) (26,022)
Exceptional Income/Expenses - - (10,953) - (80)
Profit Before Tax (7,960) (31,483) (48,981) (28,440) (26,102)
Provision for Tax 2 (3) (3) (17) (173)
Profit After Tax (7,961) (31,480) (48,979) (28,423) (25,929)
Source: Company Filings, HDFC sec Inst Research
Rapido: Bike taxi services - Beyond the big cities
Car aggregators have limitations as the model is not viable beyond the large
metros in the country. However, the lower priced and more scalable bike taxi
services are making inroads into smaller centers. Rapido is targeting to expand
presence to 100 cities and reach 1mn daily rides in the coming year from ~ 0.5mn
rides currently.
Rapido is focusing on tier-2 cities as these towns lack adequate public
transportation. The startup derives 65% of business from tier-2 cities (including
Mysuru, Patna and Bhubaneshwar). Similarly, Ola Bike has witnessed large-scale
adoption among people living in India’s hinterlands. Rapido’s daily average ride
value was Rs 36 (as of March this year), while Uber was at Rs 207 and Ola was at
Rs 200. The business model involves tapping the large pool of two-wheeler
owners in the country as it provides affordable and convenient ride-sharing
options.
Cab aggregators are
continuing to make
losses
The aggregators are
focusing on improving
profitability/reducing
losses

Page | 13
Autos: The ‘S’ Curve
Ride value are significantly lower for 2Ws (in Rs)
Source: Industry, HDFC Sec Inst Research
The bike taxi service is now a $150m revenue market, growing at 20% month-
over-month. The growth has been attributed to the consumer’s need for
affordable means of transportation. Bike taxis are a convenient, reliable,
affordable and safe first/last mile solution for riders in metro cities – typically
between metro stations to their office/residence. Also, despite the fact that 60-70%
of customers in smaller centers have never experienced ride-sharing previously,
they are accepting the service due to its utility function.
Rapido was the first to introduce bike taxis in India back in 2015, followed by Ola
in 2016. Rapido is the largest operator in this market with 50% share, while Ola
Bike commands c.25% share and UberMoto and other players share the rest. The
market leader has around 500,000 service providers on its network and the
startup claims to be serving over 10 million customers. Similarly, Ola Bikes has
partnered with over 300,000 bike partners.
Ride sharing market share
Source: Industry, HDFC Sec Inst Research
Rapido has raised ~Rs 4bn in its last round of funding and the company’s post-
money valuation has risen to Rs 10bn ($150mn) following the last round of
investments. Marquee investors include Westbridge capital, Bace capital and Mr.
Pawan Munjal, amongst others.
Rapido is the largest
operator in the bike taxi
market with 50% share,
while Ola Bike
commands ~25% share
0
50
100
150
200
250
Rapido Ola Uber
Rapido, 50%
Ola Bike, 25%
Others, 25%
Page | 14
Autos: The ‘S’ Curve
Bike rental services
This service provides two wheelers on a dockless mode or on per hour rental
basis. The scooters have to be picked up and dropped at the designated locations,
which are spread across convenient spots in the cities. These services are targeted
at congested cities with an aim of easing traffic congestion.
There are multiple service providers such as Bounce, Vogo, etc which are
operating in this segment. The industry leader Bounce is doing 100,000 rides per
day while the others are scaling up the business. These companies use gasoline
scooters currently though they are evaluating the usage of EVs.
Yulu is encouraging the usage of electric bikes, which have a top speed of 25
km/h. These services are used for last mile connectivity. Bajaj Auto has invested
$8mn in this start up in Nov-19. The OEM has invested in this early stage start
up, to understand the evolving eco system.
Risks:
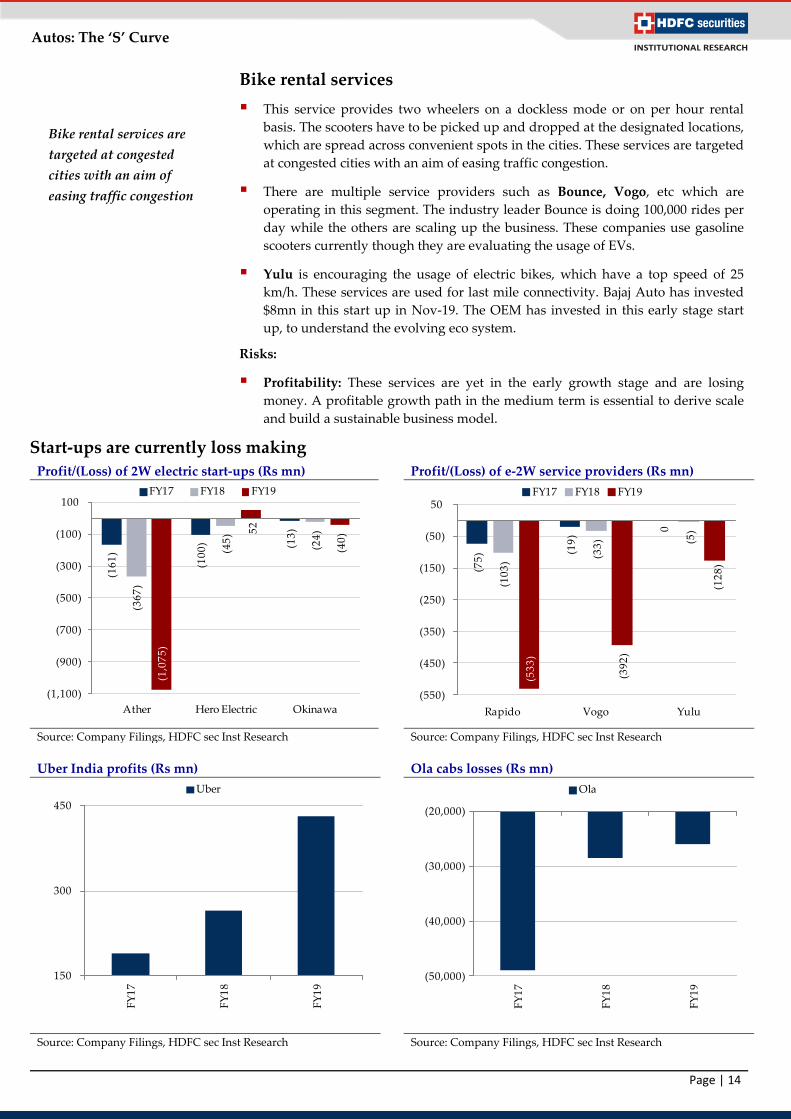
Profitability: These services are yet in the early growth stage and are losing
money. A profitable growth path in the medium term is essential to derive scale
and build a sustainable business model.
Start-ups are currently loss making
Profit/(Loss) of 2W electric start-ups (Rs mn) Profit/(Loss) of e-2W service providers (Rs mn)
Source: Company Filings, HDFC sec Inst Research Source: Company Filings, HDFC sec Inst Research
Uber India profits (Rs mn) Ola cabs losses (Rs mn)
Source: Company Filings, HDFC sec Inst Research Source: Company Filings, HDFC sec Inst Research
(16
1)
(10
0) (1
3)
(36
7)
(45
)
(24
)
(1,0
75
)
52
(40
)
(1,100)
(900)
(700)
(500)
(300)
(100)
100
Ather Hero Electric Okinawa
FY17 FY18 FY19
(75
) (19
)
0
(10
3)
(33
) (5)
(53
3)
(39
2)
(12
8)
(550)
(450)
(350)
(250)
(150)
(50)
50
Rapido Vogo Yulu
FY17 FY18 FY19
150
300
450
FY
17
FY
18
FY
19
Uber
(50,000)
(40,000)
(30,000)
(20,000)
FY
17
FY
18
FY
19
Ola
Bike rental services are
targeted at congested
cities with an aim of
easing traffic congestion
Page | 15
Autos: The ‘S’ Curve
Evolving regulations to determine profitability/growth of ride share services:
Policy framework for the aggregator segment is under consideration by the
various state governments. Regulations will determine the profitability as well as
the growth of the services, in our view. For instance, the Maharashtra
government has proposed that cab taxi aggregators to put a cap on surge pricing
up to a maximum of 3x the fares charged by regular taxis in Mumbai. Further,
normal taxis will also be allowed to charge telescopic fares i.e. on longer
distances, the fares will be reduced as distance increases. The panel had
recommended regular fare for up to 8-km distance, a 15% drop in fare for 8.1-
12km distance, and 20% drop for distances beyond 12 km. These measures will
provide a more level playing field between the aggregators as well as the
conventional taxi services. Such regulations could have an impact on the
business model of aggregators.
Are authorities taking a favorable approach? Learning from the e-rickshaw
example, these lead-acid based 3Ws had started off in a similar unregulated
manner. However, regulators have allowed these vehicles to operate to ease
congestion in cities as well to provide increased mobility. Thus, if a service
proliferates/reduces congestion and pollution in cities, regulators take a favorable
position.
Even though the 2W bike taxis are plying across cities, regulations for this service
are still unclear in several states in India, which limits their expansion. While
Telangana, Rajasthan, Uttar Pradesh and Haryana have notified rules around
bike taxis, a few other states have followed the central government’s draft
guidelines on allowing such services.
The legalities around insurance are missing as there are separate categories of
licenses for commercial and personal vehicles. A bike with a personal number
plate offering commercial services might not be eligible for insurance in case of
an accident.
Page | 16
Autos: The ‘S’ Curve
Electrification Trends: A winding road ahead
We believe that India is in the early stage of EV adoption. The government is
encouraging the move towards the alternate vehicle technology with the introduction
of the FAME-II scheme in Mar-19. The transition to electrics is more suitable for
commercial applications rather than personal mobility at this stage in India. For
passenger cars, adoption is a while away due to infrastructure limitations as well as
elevated product costs. Alternate technologies such as hybrids are a go between.
Passenger buses on the other hand are being adopted by various STUs due to the
FAME incentives as well as ability to set up charging infrastructure. Within 2Ws, the
technology is progressing with mainstream OEMs and start-ups such as Ather
introducing high end products. For 3Ws, the market leader is yet to roll out vehicles
in this segment even as lead acid-based products have emerged as an alternate
segment with annual volumes of 600,000 units p.a.
Faster Adoption and Manufacturing of Hybrid and Electric
Vehicles in India (FAME) scheme:
The government is making continuous efforts to boost electric mobility. In Mar-19,
the Ministry of Heavy Industry and Public Enterprise laid out the eligibility
criteria for electric buses, passenger vehicles, 2- and 3-wheelers to avail the FAME-
II incentives.
FAME-II subsidies are significantly higher than FAME-I
While FAME-I scheme (1st April, 2015-31st March, 2019) was launched with a
limited outlay of Rs 8.95bn, this increased ~10 fold to Rs 100bn under FAME-II,
which is being implemented from April, 2019 (for a period of 3 years).
FAME-II scheme is being implemented considering factors including demand
incentives, establishments of charging stations, publicity and information,
education & communication activities. ~85% of the outlay would be towards
demand incentives for EV buses, 4Ws (Electric and Plug-in Hybrids), 3Ws and
2Ws.
FAME II is promoting lithium batteries, which provides longer range: Under
FAME-I, the incentives were provided to all EVs including those that run on lead
acid batteries, irrespective of the battery capacity. This has been discontinued.
Considering that cost of the batteries is one of the major factors in the price of an
EV, the demand incentives are based on the battery capacity. Currently, the
initial proposal for such incentives is Rs 10,000/- per kWh for all vehicles except
buses (Rs 20,000/- per kWh).
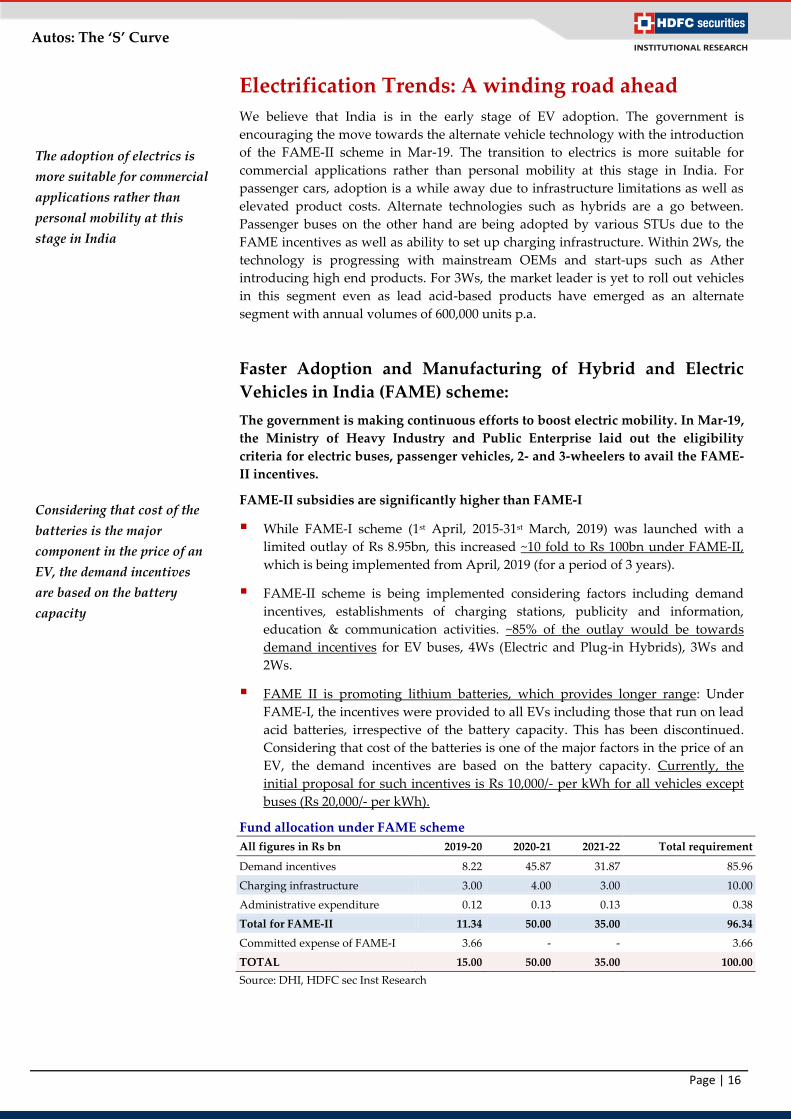
Fund allocation under FAME scheme
All figures in Rs bn 2019-20 2020-21 2021-22 Total requirement
Demand incentives 8.22 45.87 31.87 85.96
Charging infrastructure 3.00 4.00 3.00 10.00
Administrative expenditure 0.12 0.13 0.13 0.38
Total for FAME-II 11.34 50.00 35.00 96.34
Committed expense of FAME-I 3.66 - - 3.66
TOTAL 15.00 50.00 35.00 100.00
Source: DHI, HDFC sec Inst Research
The adoption of electrics is
more suitable for commercial
applications rather than
personal mobility at this
stage in India
Considering that cost of the
batteries is the major
component in the price of an
EV, the demand incentives
are based on the battery
capacity
Page | 17
Autos: The ‘S’ Curve
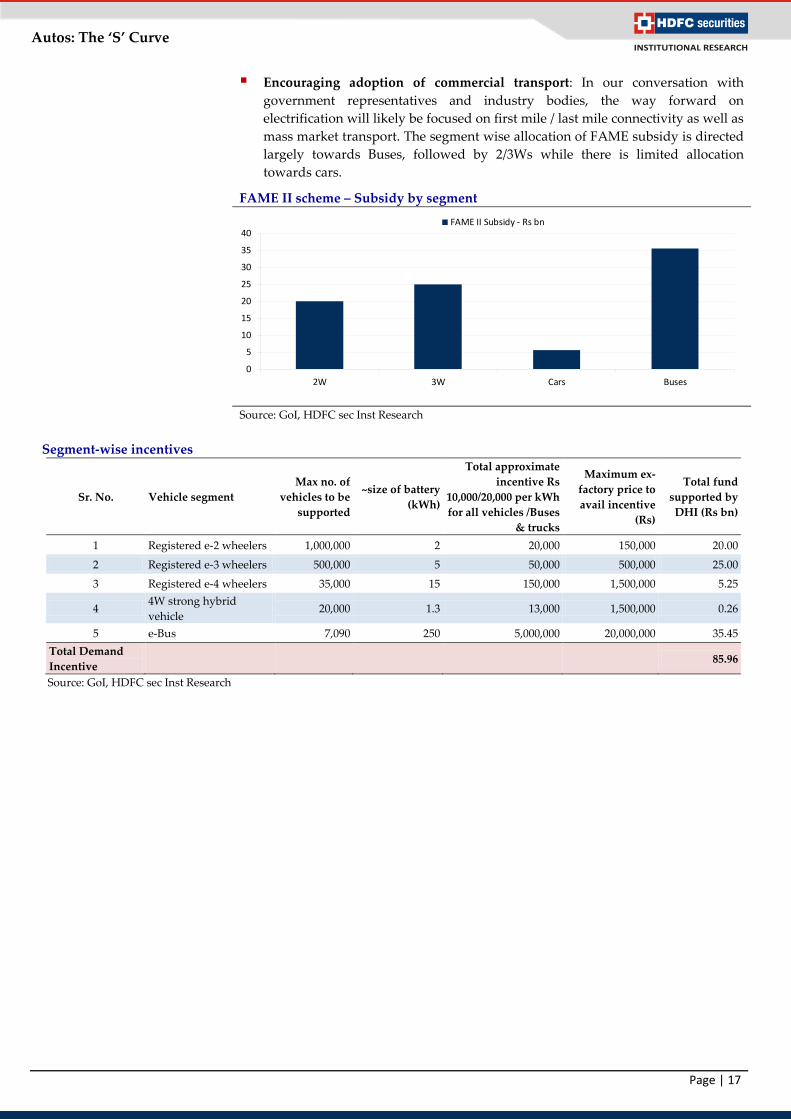
Encouraging adoption of commercial transport: In our conversation with
government representatives and industry bodies, the way forward on
electrification will likely be focused on first mile / last mile connectivity as well as
mass market transport. The segment wise allocation of FAME subsidy is directed
largely towards Buses, followed by 2/3Ws while there is limited allocation
towards cars.
FAME II scheme – Subsidy by segment
Source: GoI, HDFC sec Inst Research
Segment-wise incentives
Sr. No. Vehicle segment
Max no. of
vehicles to be
supported
~size of battery
(kWh)
Total approximate
incentive Rs
10,000/20,000 per kWh
for all vehicles /Buses
& trucks
Maximum ex-
factory price to
avail incentive
(Rs)
Total fund
supported by
DHI (Rs bn)
1 Registered e-2 wheelers 1,000,000 2 20,000 150,000 20.00
2 Registered e-3 wheelers 500,000 5 50,000 500,000 25.00
3 Registered e-4 wheelers 35,000 15 150,000 1,500,000 5.25
4 4W strong hybrid
vehicle 20,000 1.3 13,000 1,500,000 0.26
5 e-Bus 7,090 250 5,000,000 20,000,000 35.45
Total Demand
Incentive 85.96
Source: GoI, HDFC sec Inst Research
0
5
10
15
20
25
30
35
40
2W 3W Cars Buses
FAME II Subsidy - Rs bn
Page | 18
Autos: The ‘S’ Curve
Electrics – The way forward
The industry has catapulted its launches in the EV segment, across four wheelers
and two wheelers, post the introduction of the FAME II scheme.
Three wheelers have driven the change: The usage of battery-operated vehicles
proliferated with the use of the e-rickshaws that started getting used as last mile
connectivity vehicles. The annual sales of e-3Ws are ~600K annually and the
vehicle park will be in excess of 3mn. However, these autos are lead acid based.
To avail incentives under FAME-II, the users will have to switch over to lithium-
ion batteries.
Electric buses are witnessing early adoption: Electric passenger buses are being
adopted by state STUs such as BEST. It is easier to provide infrastructure for
these vehicles as they operate on pre-defined city routes. Further, the FAME
subsidy is higher for e-buses at Rs 20,000 per kwh.
2Ws to witness a gradual migration towards electric: The smaller battery size of
2-3kwh for 2Ws enables faster charging time of between 3-5 hours. The shorter
charging cycles will facilitate a shift towards EVs. To embrace this technology,
Bajaj and TVS Motors have already launched electric scooters while Hero backed
Ather has launched a premium scooter – the 450x. Besides, there is an increase of
smaller sized lithium battery-based products from manufacturers including Hero
Electric, Okinawa, etc.
The electrification of passenger cars is more complex: The longer charging
times and higher upfront cost of the vehicle is preventing early adoption of the
products. Thus, instead of focusing on personal mobility usage, the government
is promoting commercial usage of cars. Further, cab aggregators are willing to
experiment with these vehicles as it will drive cost savings.
Government favors electrics over hybrids: The government has differentiated
between hybrids and electrics by charging 28% GST on hybrids vs just 5% on
electrics. Their intent is to promote EVs as the Indian passenger car industry is
still at the early stages of penetration (car sales are at ~20 cars per ‘000 persons).
Any shift at this stage will transform the industry.
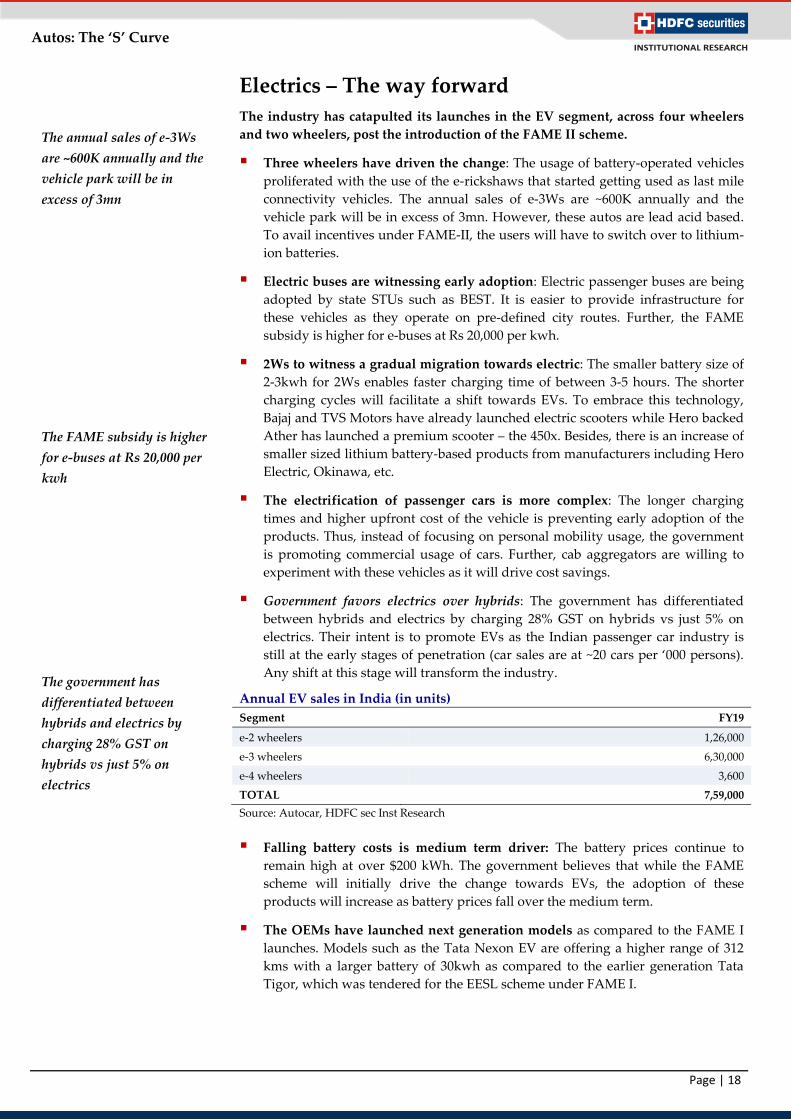
Annual EV sales in India (in units)
Segment FY19
e-2 wheelers 1,26,000
e-3 wheelers 6,30,000
e-4 wheelers 3,600
TOTAL 7,59,000
Source: Autocar, HDFC sec Inst Research
Falling battery costs is medium term driver: The battery prices continue to
remain high at over $200 kWh. The government believes that while the FAME
scheme will initially drive the change towards EVs, the adoption of these
products will increase as battery prices fall over the medium term.
The OEMs have launched next generation models as compared to the FAME I
launches. Models such as the Tata Nexon EV are offering a higher range of 312
kms with a larger battery of 30kwh as compared to the earlier generation Tata
Tigor, which was tendered for the EESL scheme under FAME I.
The annual sales of e-3Ws
are ~600K annually and the
vehicle park will be in
excess of 3mn
The FAME subsidy is higher
for e-buses at Rs 20,000 per
kwh
The government has
differentiated between
hybrids and electrics by
charging 28% GST on
hybrids vs just 5% on
electrics
Page | 19
Autos: The ‘S’ Curve
Electric passenger cars
Models Tata Nexon EV Tata Tigor EV Mahindra e-Verito
Price Range (Rs
lakhs) 13.99-15.99 9.54-9.85 9.75-10.0
Range/charge (kms) 312 213 180
Regular charging 10% to 90% in 8.5 hrs 0% to 100% in 11.5 hrs 0% to 100% in 11.5 hrs
Fast charging 0% to 80% in 60 mins 0% to 80% in 120 mins 0% to 100% in 1.5 hrs
Battery 30.2 kWh Li-ion 21.5 kWh Li-ion 21.2 kWh Li-ion
Top speed (kmph) 120 80 80
Battery pack motor
warranty 8 Year or 1,60,000 km 3 Year or 1,25,000 km 3 Year or 1,25,000 km
Vehicle warranty 3 Year or 1,25,000 km 3 Year or 1,25,000 km 3 Year or 1,25,000 km
Source: Company, HDFC sec Inst Research
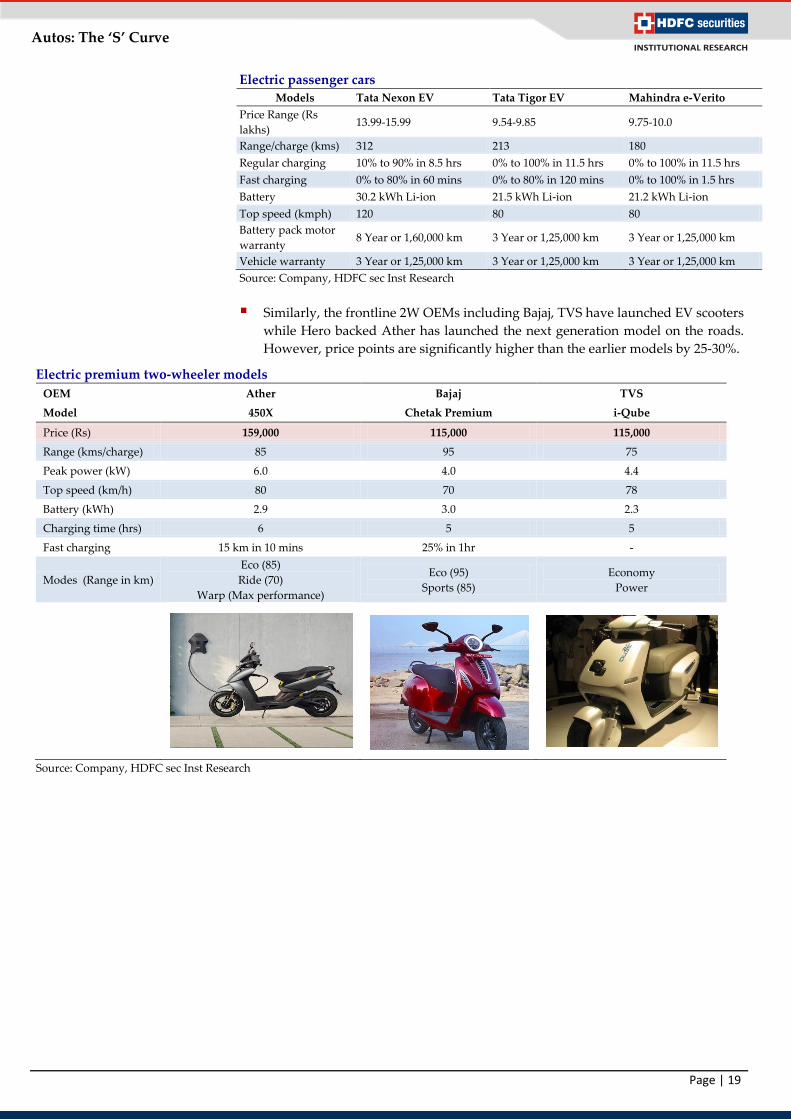
Similarly, the frontline 2W OEMs including Bajaj, TVS have launched EV scooters
while Hero backed Ather has launched the next generation model on the roads.
However, price points are significantly higher than the earlier models by 25-30%.
Electric premium two-wheeler models
OEM Ather Bajaj TVS
Model 450X Chetak Premium i-Qube
Price (Rs) 159,000 115,000 115,000
Range (kms/charge) 85 95 75
Peak power (kW) 6.0 4.0 4.4
Top speed (km/h) 80 70 78
Battery (kWh) 2.9 3.0 2.3
Charging time (hrs) 6 5 5
Fast charging 15 km in 10 mins 25% in 1hr -
Modes (Range in km)
Eco (85)
Ride (70)
Warp (Max performance)
Eco (95)
Sports (85)
Economy
Power
Source: Company, HDFC sec Inst Research
Page | 20
Autos: The ‘S’ Curve
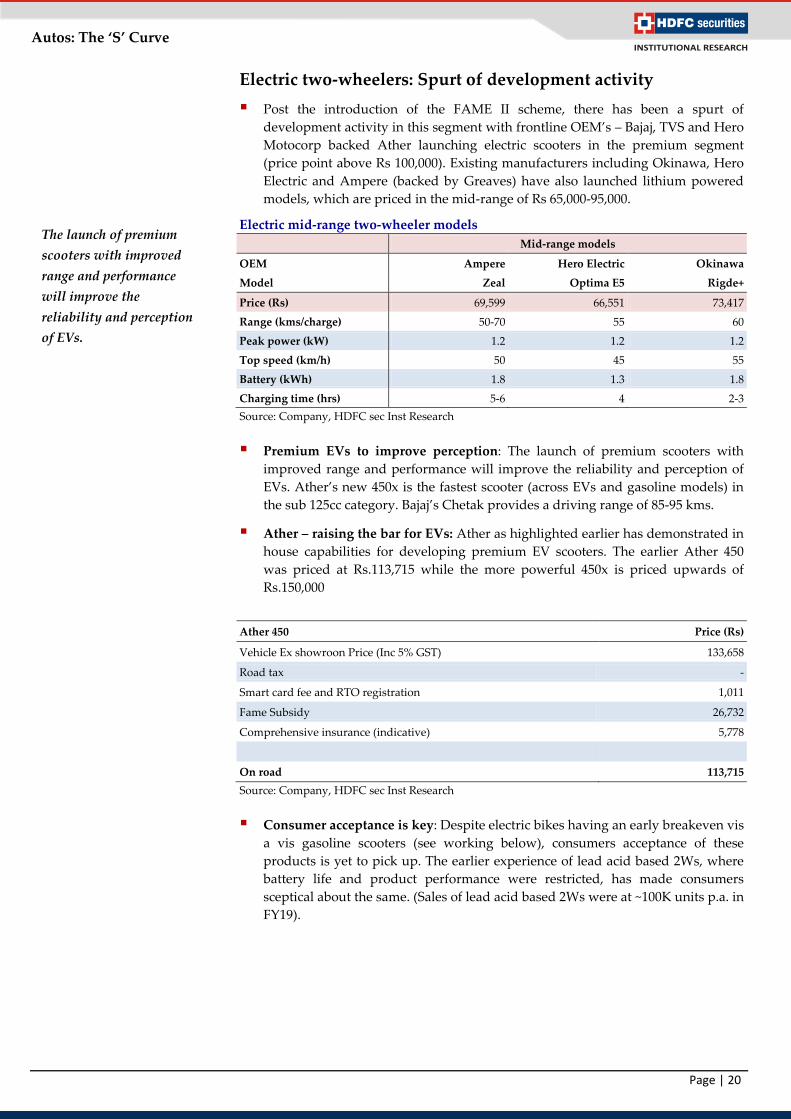
Electric two-wheelers: Spurt of development activity
Post the introduction of the FAME II scheme, there has been a spurt of
development activity in this segment with frontline OEM’s – Bajaj, TVS and Hero
Motocorp backed Ather launching electric scooters in the premium segment
(price point above Rs 100,000). Existing manufacturers including Okinawa, Hero
Electric and Ampere (backed by Greaves) have also launched lithium powered
models, which are priced in the mid-range of Rs 65,000-95,000.
Electric mid-range two-wheeler models
Mid-range models
OEM Ampere Hero Electric Okinawa
Model Zeal Optima E5 Rigde+
Price (Rs) 69,599 66,551 73,417
Range (kms/charge) 50-70 55 60
Peak power (kW) 1.2 1.2 1.2
Top speed (km/h) 50 45 55
Battery (kWh) 1.8 1.3 1.8
Charging time (hrs) 5-6 4 2-3
Source: Company, HDFC sec Inst Research
Premium EVs to improve perception: The launch of premium scooters with
improved range and performance will improve the reliability and perception of
EVs. Ather’s new 450x is the fastest scooter (across EVs and gasoline models) in
the sub 125cc category. Bajaj’s Chetak provides a driving range of 85-95 kms.
Ather – raising the bar for EVs: Ather as highlighted earlier has demonstrated in
house capabilities for developing premium EV scooters. The earlier Ather 450
was priced at Rs.113,715 while the more powerful 450x is priced upwards of
Rs.150,000
Ather 450 Price (Rs)
Vehicle Ex showroon Price (Inc 5% GST) 133,658
Road tax -
Smart card fee and RTO registration 1,011
Fame Subsidy 26,732
Comprehensive insurance (indicative) 5,778
On road 113,715
Source: Company, HDFC sec Inst Research
Consumer acceptance is key: Despite electric bikes having an early breakeven vis
a vis gasoline scooters (see working below), consumers acceptance of these
products is yet to pick up. The earlier experience of lead acid based 2Ws, where
battery life and product performance were restricted, has made consumers
sceptical about the same. (Sales of lead acid based 2Ws were at ~100K units p.a. in
FY19).
The launch of premium
scooters with improved
range and performance
will improve the
reliability and perception
of EVs.
Page | 21
Autos: The ‘S’ Curve
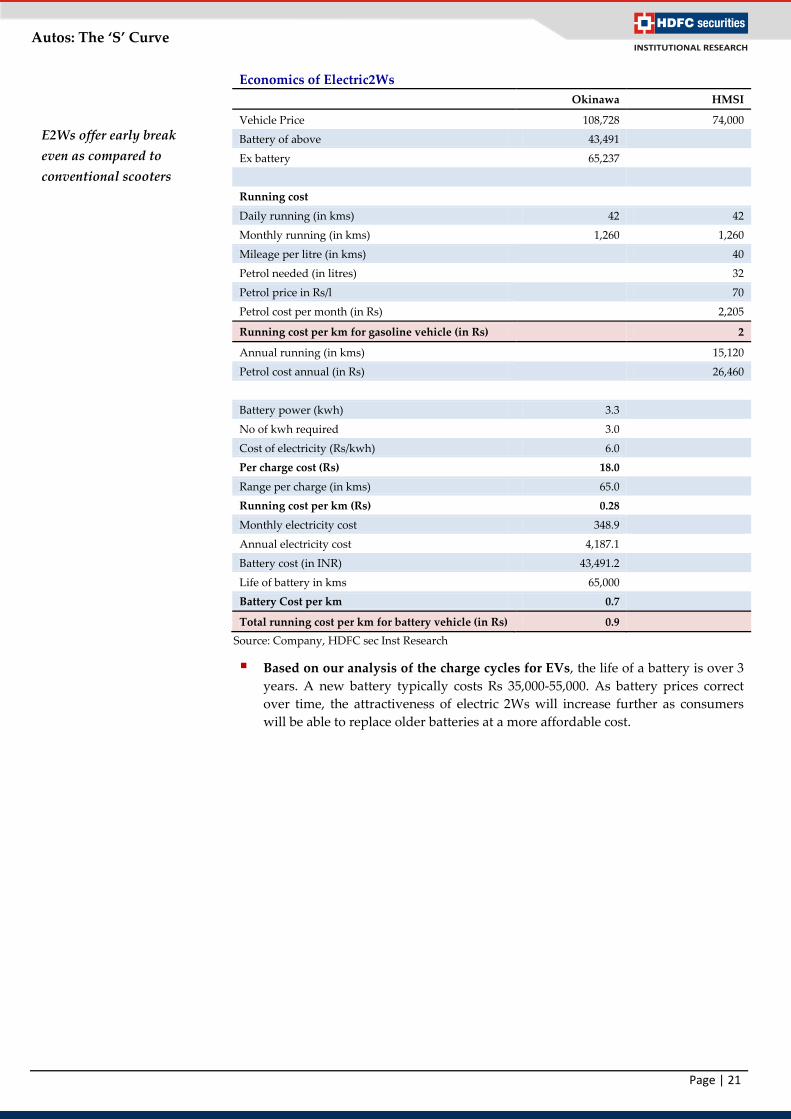
Economics of Electric2Ws
Okinawa HMSI
Vehicle Price 108,728 74,000
Battery of above 43,491
Ex battery 65,237
Running cost
Daily running (in kms) 42 42
Monthly running (in kms) 1,260 1,260
Mileage per litre (in kms)
40
Petrol needed (in litres)
32
Petrol price in Rs/l
70
Petrol cost per month (in Rs)
2,205
Running cost per km for gasoline vehicle (in Rs)
2
Annual running (in kms)
15,120
Petrol cost annual (in Rs)
26,460
Battery power (kwh) 3.3
No of kwh required 3.0
Cost of electricity (Rs/kwh) 6.0
Per charge cost (Rs) 18.0
Range per charge (in kms) 65.0
Running cost per km (Rs) 0.28
Monthly electricity cost 348.9
Annual electricity cost 4,187.1
Battery cost (in INR) 43,491.2
Life of battery in kms 65,000
Battery Cost per km 0.7
Total running cost per km for battery vehicle (in Rs) 0.9
Source: Company, HDFC sec Inst Research
Based on our analysis of the charge cycles for EVs, the life of a battery is over 3
years. A new battery typically costs Rs 35,000-55,000. As battery prices correct
over time, the attractiveness of electric 2Ws will increase further as consumers
will be able to replace older batteries at a more affordable cost.
E2Ws offer early break
even as compared to
conventional scooters

Page | 22
Autos: The ‘S’ Curve
Battery Lifecycle Analysis
Battery lifecycle analysis
No of charge cycles per month 25
No of charge cycles annually 302
Life of battery in charge cycles 1,000
Life of battery in years 3.31
Source: Company, HDFC sec Inst Research
Charging infra for smaller powered vehicles: It is easier and more economical
to set up charging stations for 2Ws as they require a standard 5AMP plug point.
Several companies are tying up with malls and other public places to set up
charging infrastructure. Typically, scooters have a limited driving range of 20-
30kms per day, which makes electrification of these vehicles possible.
Our view: While two-wheeler OEMs have launched an electric scooter, the
industry is expected to gradually shift towards EVs. The OEMs are however
getting prepared for the longer-term changes in product technology, by investing
early in this segment. While there are upfront investments in this segment, scale
will be achieved once industry volumes exceed 1m units p.a.
Bajaj has been investing in EV technology over the past few years. The OEM has
benefitted from its linkages with its global partners such as KTM, Husqvarna,
amongst others. After the launch of the Chetak, the management will gauge the
response to the product, before decided its future strategy. Hero is already
present in this segment via its stake in Ather Energy and the OEM is expected to
roll out its own EV scooter in the near term.
Commercial Vehicles – Passenger Buses
Demand incentives of up to Rs 5.5m for long electric buses, Rs 4.5m for midi
buses and Rs 3.5m for mini buses are being offered under FAME-II. This is
encouraging transport undertakings to adopt EV technology for public transport.
Various states are rolling out tenders for electric buses.
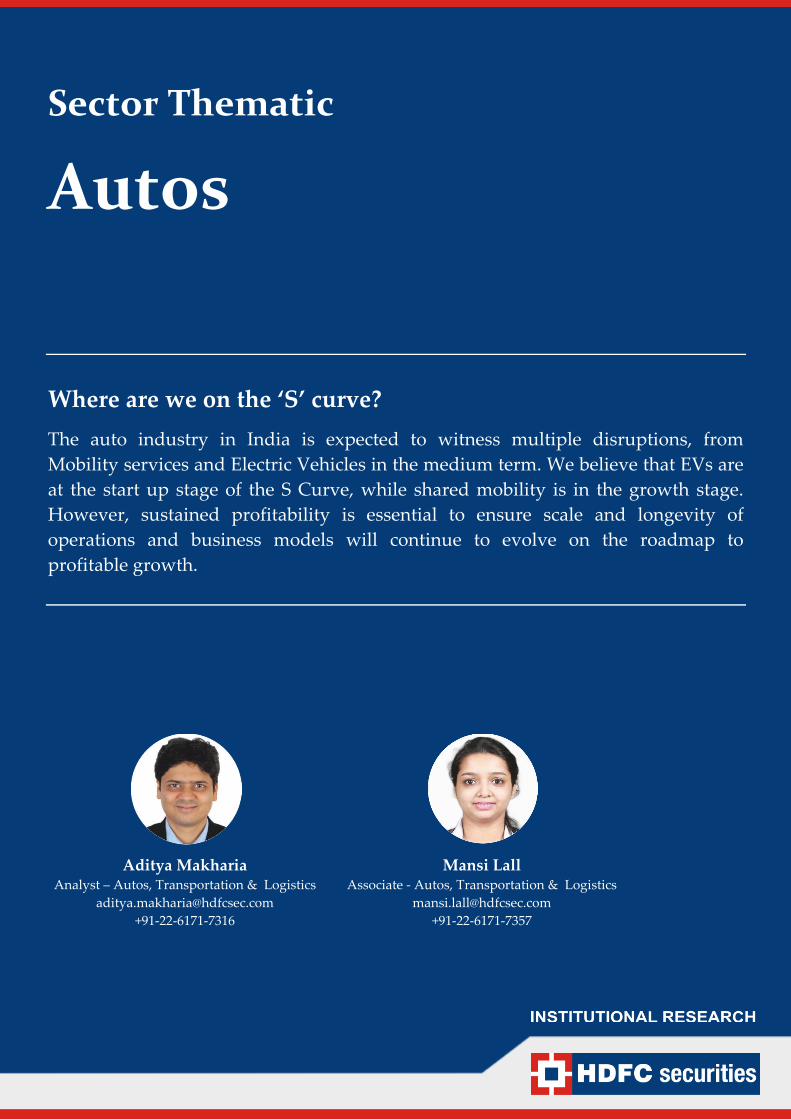
Passenger buses account for ~15% of total MHCV sales, with sales of ~35,000
units p.a. The subsidy being provided for 5,095 electric buses will account for
20% of the annual sales (though these orders will be rolled out over the next 3
years).
Passenger Buses as % of MHCV
Source: SIAM, HDFC sec Inst Research *Sales from Apr18 to Feb20
As battery prices correct
over time, the
attractiveness of electric
2Ws will increase
The industry is expected
to gradually shift
towards EVs
Passenger buses account
for ~15% of total MHCV
sales
8%
12%
16%
20%
30,000
34,000
38,000
42,000
46,000
50,000
FY14 FY15 FY16 FY17 FY18 FY19 FY20E*
Buses (in units) Buses as % of MHCV - RHS
Page | 23
Autos: The ‘S’ Curve
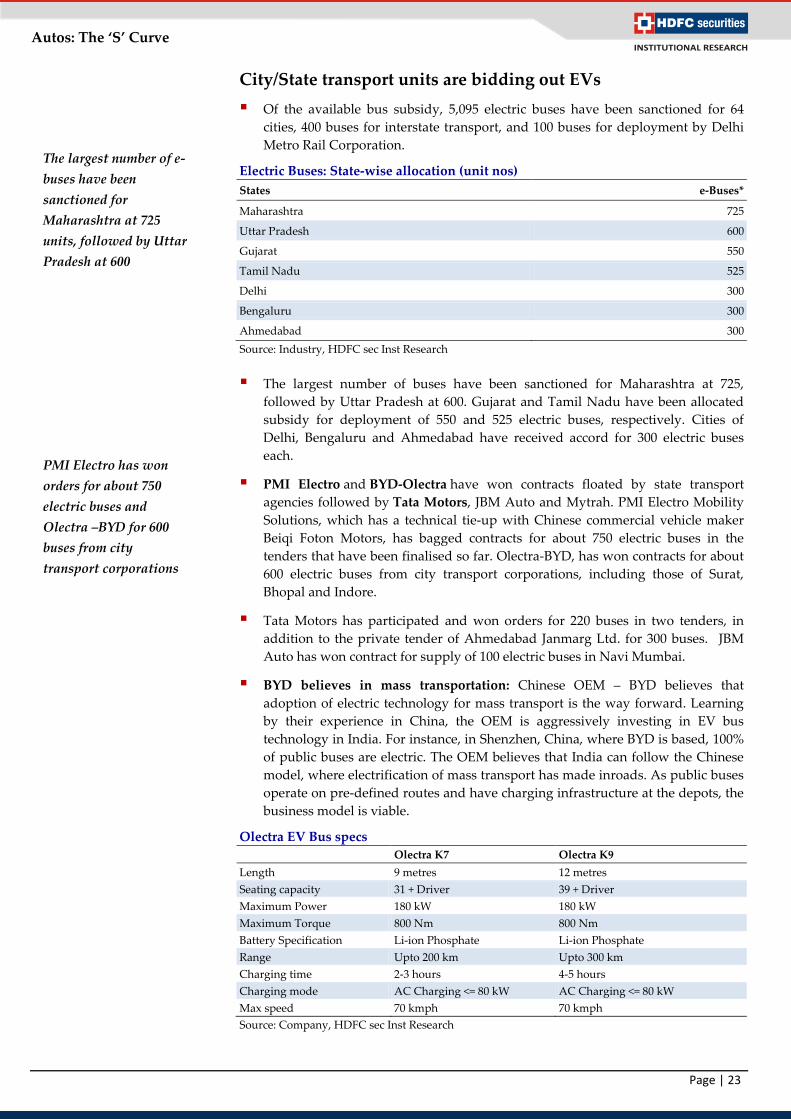
City/State transport units are bidding out EVs
Of the available bus subsidy, 5,095 electric buses have been sanctioned for 64
cities, 400 buses for interstate transport, and 100 buses for deployment by Delhi
Metro Rail Corporation.
Electric Buses: State-wise allocation (unit nos)
States e-Buses*
Maharashtra 725
Uttar Pradesh 600
Gujarat 550
Tamil Nadu 525
Delhi 300
Bengaluru 300
Ahmedabad 300
Source: Industry, HDFC sec Inst Research
The largest number of buses have been sanctioned for Maharashtra at 725,
followed by Uttar Pradesh at 600. Gujarat and Tamil Nadu have been allocated
subsidy for deployment of 550 and 525 electric buses, respectively. Cities of
Delhi, Bengaluru and Ahmedabad have received accord for 300 electric buses
each.
PMI Electro and BYD-Olectra have won contracts floated by state transport
agencies followed by Tata Motors, JBM Auto and Mytrah. PMI Electro Mobility
Solutions, which has a technical tie-up with Chinese commercial vehicle maker
Beiqi Foton Motors, has bagged contracts for about 750 electric buses in the
tenders that have been finalised so far. Olectra-BYD, has won contracts for about
600 electric buses from city transport corporations, including those of Surat,
Bhopal and Indore.
Tata Motors has participated and won orders for 220 buses in two tenders, in
addition to the private tender of Ahmedabad Janmarg Ltd. for 300 buses. JBM
Auto has won contract for supply of 100 electric buses in Navi Mumbai.
BYD believes in mass transportation: Chinese OEM – BYD believes that
adoption of electric technology for mass transport is the way forward. Learning
by their experience in China, the OEM is aggressively investing in EV bus
technology in India. For instance, in Shenzhen, China, where BYD is based, 100%
of public buses are electric. The OEM believes that India can follow the Chinese
model, where electrification of mass transport has made inroads. As public buses
operate on pre-defined routes and have charging infrastructure at the depots, the
business model is viable.
Olectra EV Bus specs
Olectra K7 Olectra K9
Length 9 metres 12 metres
Seating capacity 31 + Driver 39 + Driver
Maximum Power 180 kW 180 kW
Maximum Torque 800 Nm 800 Nm
Battery Specification Li-ion Phosphate Li-ion Phosphate
Range Upto 200 km Upto 300 km
Charging time 2-3 hours 4-5 hours
Charging mode AC Charging <= 80 kW AC Charging <= 80 kW
Max speed 70 kmph 70 kmph
Source: Company, HDFC sec Inst Research
The largest number of e-
buses have been
sanctioned for
Maharashtra at 725
units, followed by Uttar
Pradesh at 600
PMI Electro has won
orders for about 750
electric buses and
Olectra –BYD for 600
buses from city
transport corporations
Page | 24
Autos: The ‘S’ Curve
These low floor buses can travel up to 200 KMs in a single charge based on traffic
conditions. The high-power fast AC charging system enables the battery to get
fully charged within 2-3 hours. It has a capacity of 31+1 (Driver) seats with an
electronically controlled air suspension to ensure passenger ride comfort.
Olectra has the largest market share in Electric Buses commercially operating on
India roads.
Tata will supply Urban 9/9 Electric model of buses which will run in
Ahmedabad’s BRTS corridor. These buses will be deployed under the OPEX
model and Tata Motors will be setting up the required infrastructure including
fast charging and support system as well.
Experience of BEST (Bombay): BEST has deployed 10 electric buses of 9-Meter
(eBuzz K7) procured from Olectra-BYD, as part of its 40 AC & non-AC bus order
on Gross Cost Contract basis. The deployment of these buses follows the
successful trial deployment of 6 electric buses of 9-meter length in November
2017 by BEST, under the FAME 1 scheme.
Post the deployment of all the 46 eBuses, BEST will transport ~1 Million
passengers p.m. in this zero-emission based public transport. In addition to these,
BEST is also planning to procure 250 more electric buses over the medium term.
Our view: The adoption of e buses will be subject to continued state and central
support. The timely allocation of funds to procure new buses will determine the
pace of adoption. If the acceptance of these vehicles were to increase, it will result
in higher competition for the incumbents (Tata, Ashok Leyland), particularly
from the Chinese OEMs
Passenger Cars – Hybridisation likely to be the first step
forward
Maruti Suzuki’s management believes that hybrids will play an important role
in the near term. Hybrids will address the issues of affordability as well as lack
of charging infrastructure. In the medium term, of the 1mn eco-friendly vehicles
that MSIL is targeting, 0.5mn will come from mild (48V smart hybrids) and
parallel hybrids. Maruti has set up a lithium ion battery plant for producing
batteries for hybrids (along with Toshiba and Denso) in Gujarat at an investment
of Rs 1.1bn. The mild hybrids are already present on their higher end vehicles,
while the parallel hybrids launch is undecided as it requires higher localisation
levels to bring costs under check. A commercial launch of the Swift hybrid
(strong) is awaited.
Challenges to adoption of electric vehicles: (1) Battery technology is expensive
with the battery costing ~50% of the vehicle cost (2) Mass adoption is a challenge
due to limited charging infrastructure (3) Range anxiety is a key concern due to
the above. Also, the range of the battery is impacted under different driving
conditions.
OEMs have introduced EV vehicles incentivized by the FAME scheme as well as
to gain the early mover advantage. However, the vehicles remain expensive with
prices for the Hyundai Kona and MG ZS upwards of Rs.1.5mn. The more
affordable Tata Nexon is available at a starting price of ~Rs.1.4mn.
Post the deployment of all
the 46 eBuses, BEST will
transport ~1 Million
passengers p.m. in this
zero-emission based public
transport
Hybrid vehicles will
address the issues of
affordability as well as
lack of charging
infrastructure
Page | 25
Autos: The ‘S’ Curve
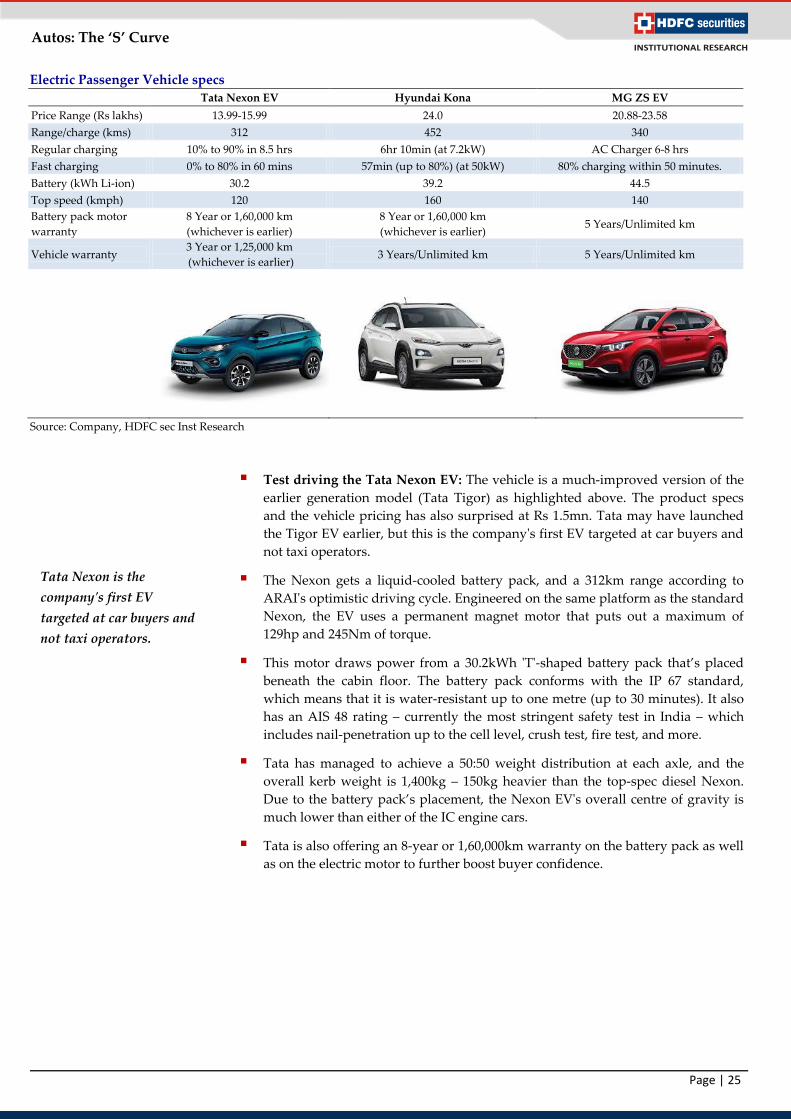
Electric Passenger Vehicle specs
Tata Nexon EV Hyundai Kona MG ZS EV
Price Range (Rs lakhs) 13.99-15.99 24.0 20.88-23.58
Range/charge (kms) 312 452 340
Regular charging 10% to 90% in 8.5 hrs 6hr 10min (at 7.2kW) AC Charger 6-8 hrs
Fast charging 0% to 80% in 60 mins 57min (up to 80%) (at 50kW) 80% charging within 50 minutes.
Battery (kWh Li-ion) 30.2 39.2 44.5
Top speed (kmph) 120 160 140
Battery pack motor
warranty
8 Year or 1,60,000 km
(whichever is earlier)
8 Year or 1,60,000 km
(whichever is earlier) 5 Years/Unlimited km
Vehicle warranty 3 Year or 1,25,000 km
(whichever is earlier) 3 Years/Unlimited km 5 Years/Unlimited km
Source: Company, HDFC sec Inst Research
Test driving the Tata Nexon EV: The vehicle is a much-improved version of the
earlier generation model (Tata Tigor) as highlighted above. The product specs
and the vehicle pricing has also surprised at Rs 1.5mn. Tata may have launched
the Tigor EV earlier, but this is the company's first EV targeted at car buyers and
not taxi operators.
The Nexon gets a liquid-cooled battery pack, and a 312km range according to
ARAI's optimistic driving cycle. Engineered on the same platform as the standard
Nexon, the EV uses a permanent magnet motor that puts out a maximum of
129hp and 245Nm of torque.
This motor draws power from a 30.2kWh 'T'-shaped battery pack that’s placed
beneath the cabin floor. The battery pack conforms with the IP 67 standard,
which means that it is water-resistant up to one metre (up to 30 minutes). It also
has an AIS 48 rating – currently the most stringent safety test in India – which
includes nail-penetration up to the cell level, crush test, fire test, and more.
Tata has managed to achieve a 50:50 weight distribution at each axle, and the
overall kerb weight is 1,400kg – 150kg heavier than the top-spec diesel Nexon.
Due to the battery pack’s placement, the Nexon EV's overall centre of gravity is
much lower than either of the IC engine cars.
Tata is also offering an 8-year or 1,60,000km warranty on the battery pack as well
as on the electric motor to further boost buyer confidence.
Tata Nexon is the
company's first EV
targeted at car buyers and
not taxi operators.
Page | 26
Autos: The ‘S’ Curve
Mahindra & Mahindra believes in electrification at the point of
first and last mile connectivity
The company sees an opportunity in last-mile and first-mile connectivity in large
cities that have metro-rail infrastructure. These vehicles would be comfortable
and convenient alternatives to auto-rickshaws connecting metro stations to
people’s homes. Mahindra has acquired a 55% stake in radio-operated cab service
provider, Meru in September last year. Meru has its niche focus segment and
would not compete with Ola. This association would give Mahindra access to
push its electric vehicle fleet into Meru cabs. Vehicles such as the e-KUV100 can
be considered by the cab segment because of their low operational costs.
Our view: As price points for EVs are elevated (despite the subsidy), we believe
consumers will only gradually adopt these models. Further, constraints around
charging infrastructure will limit the adoption of EVs. Hybrid models, which are
expected to be more affordable will likely witness more consumer acceptance, in
our view.
Maruti Suzuki is well positioned to meet the technology transition post its
collaboration with Toyota. Tata Motors and Mahindra are seeking partnerships
with global OEMs to enhance their R&D / technology in the EV segment.
Page | 27
Autos: The ‘S’ Curve
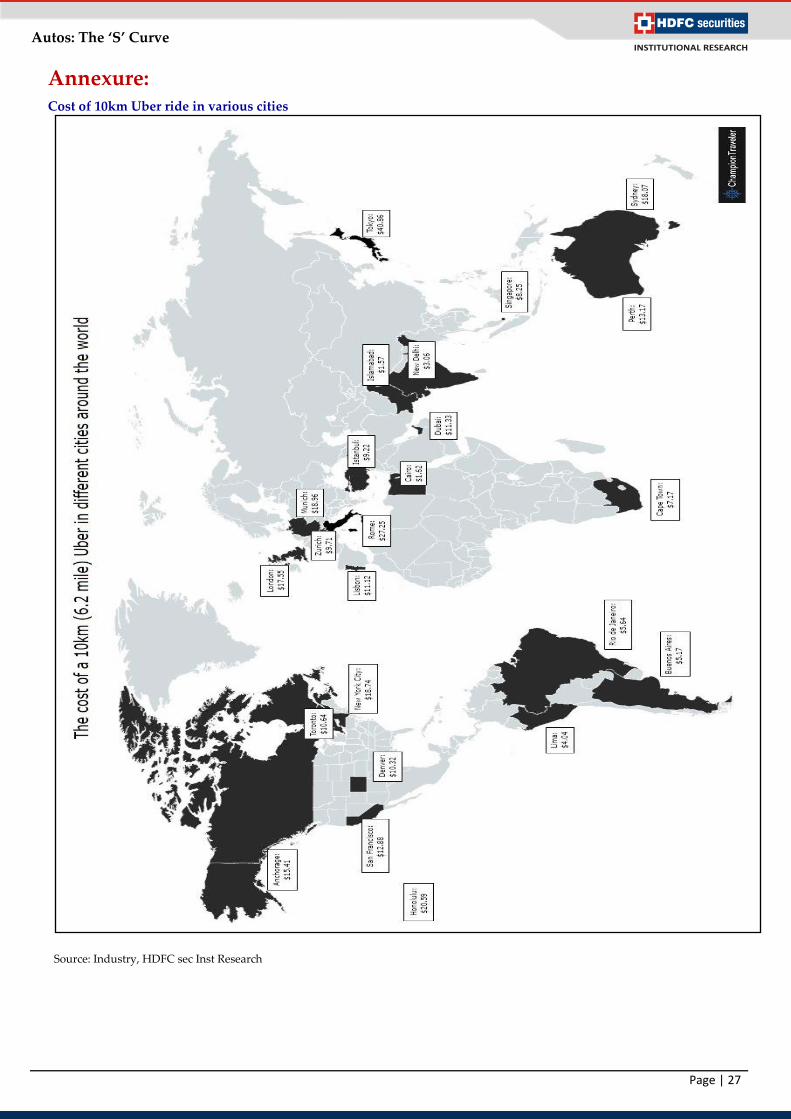
Annexure: Cost of 10km Uber ride in various cities
Source: Industry, HDFC sec Inst Research
Page | 28
Autos: The ‘S’ Curve
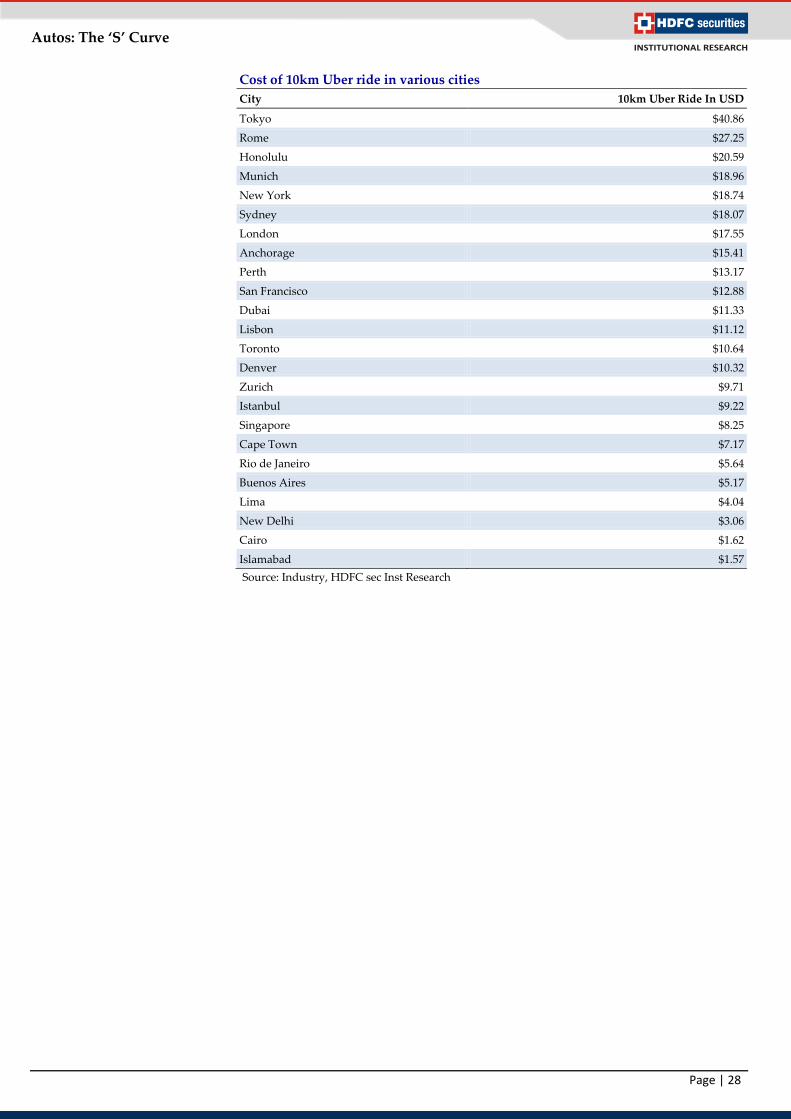
Cost of 10km Uber ride in various cities
City 10km Uber Ride In USD
Tokyo $40.86
Rome $27.25
Honolulu $20.59
Munich $18.96
New York $18.74
Sydney $18.07
London $17.55
Anchorage $15.41
Perth $13.17
San Francisco $12.88
Dubai $11.33
Lisbon $11.12
Toronto $10.64
Denver $10.32
Zurich $9.71
Istanbul $9.22
Singapore $8.25
Cape Town $7.17
Rio de Janeiro $5.64
Buenos Aires $5.17
Lima $4.04
New Delhi $3.06
Cairo $1.62
Islamabad $1.57
Source: Industry, HDFC sec Inst Research
Page | 29
Autos: The ‘S’ Curve
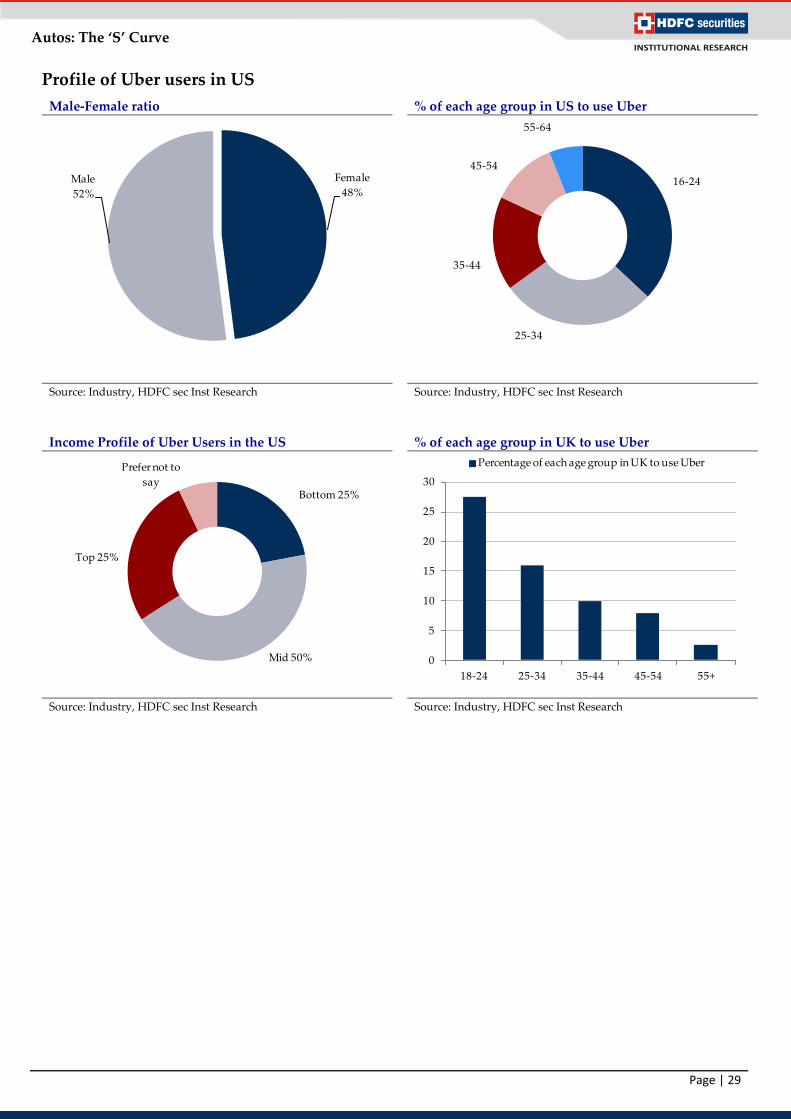
Profile of Uber users in US
Male-Female ratio % of each age group in US to use Uber
Source: Industry, HDFC sec Inst Research Source: Industry, HDFC sec Inst Research
Income Profile of Uber Users in the US % of each age group in UK to use Uber
Source: Industry, HDFC sec Inst Research Source: Industry, HDFC sec Inst Research
Female
48%Male
52%16-24
25-34
35-44
45-54
55-64
Bottom 25%
Mid 50%
Top 25%
Prefer not to
say
0
5
10
15
20
25
30
18-24 25-34 35-44 45-54 55+
Percentage of each age group in UK to use Uber
Page | 30
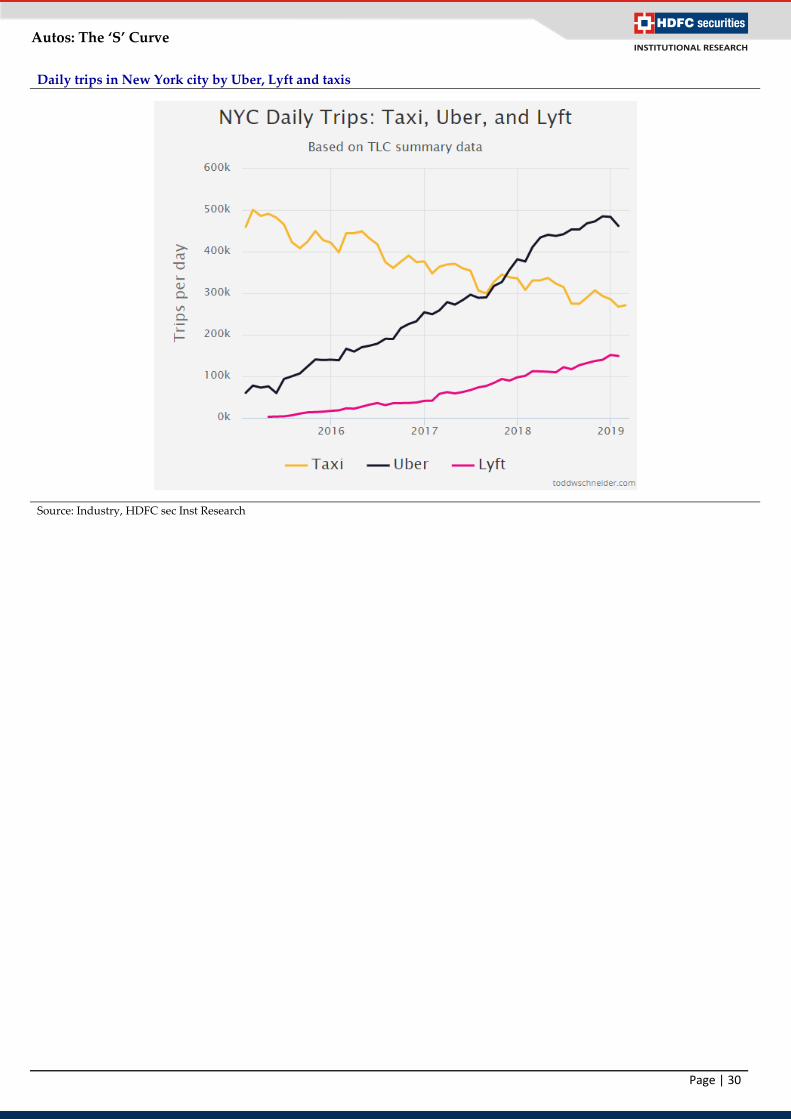
Autos: The ‘S’ Curve
Daily trips in New York city by Uber, Lyft and taxis
Source: Industry, HDFC sec Inst Research
Page | 31
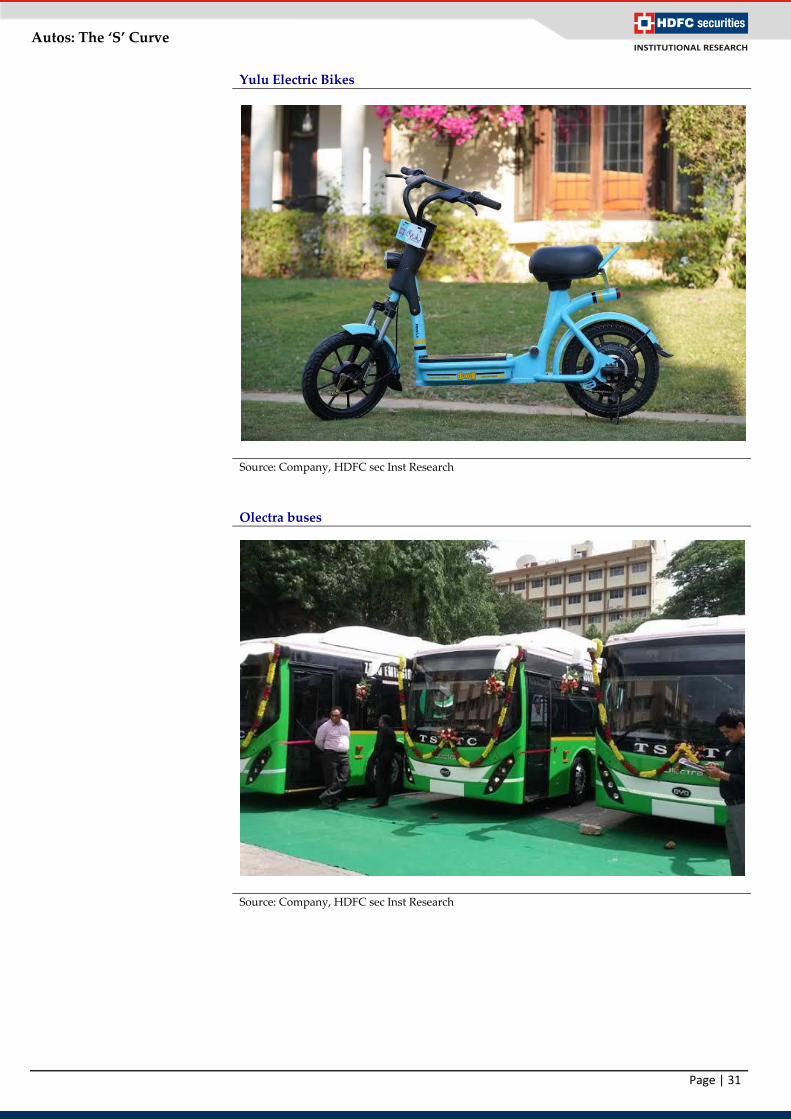
Autos: The ‘S’ Curve
Yulu Electric Bikes
Source: Company, HDFC sec Inst Research
Olectra buses
Source: Company, HDFC sec Inst Research

Page | 32
Autos: The ‘S’ Curve
HDFC securities
Institutional Equities
Unit No. 1602, 16th Floor, Tower A, Peninsula Business Park,
Senapati Bapat Marg, Lower Parel, Mumbai - 400 013
Board: +91-22-6171-7330 www.hdfcsec.com
Disclosure:
We, Aditya Makharia, CA & Mansi Lall, MBA, authors and the names subscribed to this report, hereby certify that all of the views expressed in this research
report accurately reflect our views about the subject issuer(s) or securities. HSL has no material adverse disciplinary history as on the date of publication of this
report. We also certify that no part of our compensation was, is, or will be directly or indirectly related to the specific recommendation(s) or view(s) in this
report.
Research Analyst or his/her relative or HDFC Securities Ltd. does not have any financial interest in the subject company. Also Research Analyst or his relative
or HDFC Securities Ltd. or its Associate may have beneficial ownership of 1% or more in the subject company at the end of the month immediately preceding
the date of publication of the Research Report. Further Research Analyst or his relative or HDFC Securities Ltd. or its associate does not have any material
conflict of interest.
Any holding in stock –No
HDFC Securities Limited (HSL) is a SEBI Registered Research Analyst having registration no. INH000002475.
Disclaimer:
This report has been prepared by HDFC Securities Ltd and is solely for information of the recipient only. The report must not be used as a singular basis of any
investment decision. The views herein are of a general nature and do not consider the risk appetite or the particular circumstances of an individual investor;
readers are requested to take professional advice before investing. Nothing in this document should be construed as investment advice. Each recipient of this
document should make such investigations as they deem necessary to arrive at an independent evaluation of an investment in securities of the companies
referred to in this document (including merits and risks) and should consult their own advisors to determine merits and risks of such investment. The
information and opinions contained herein have been compiled or arrived at, based upon information obtained in good faith from sources believed to be
reliable. Such information has not been independently verified and no guaranty, representation of warranty, express or implied, is made as to its accuracy,
completeness or correctness. All such information and opinions are subject to change without notice. Descriptions of any company or companies or their
securities mentioned herein are not intended to be complete. HSL is not obliged to update this report for such changes. HSL has the right to make changes and
modifications at any time.
This report is not directed to, or intended for display, downloading, printing, reproducing or for distribution to or use by, any person or entity who is a citizen
or resident or located in any locality, state, country or other jurisdiction where such distribution, publication, reproduction, availability or use would be
contrary to law or regulation or what would subject HSL or its affiliates to any registration or licensing requirement within such jurisdiction.
If this report is inadvertently sent or has reached any person in such country, especially, United States of America, the same should be ignored and brought to
the attention of the sender. This document may not be reproduced, distributed or published in whole or in part, directly or indirectly, for any purposes or in
any manner.
Foreign currencies denominated securities, wherever mentioned, are subject to exchange rate fluctuations, which could have an adverse effect on their value or
price, or the income derived from them. In addition, investors in securities such as ADRs, the values of which are influenced by foreign currencies effectively
assume currency risk. It should not be considered to be taken as an offer to sell or a solicitation to buy any security.
This document is not, and should not, be construed as an offer or solicitation of an offer, to buy or sell any securities or other financial instruments. This report
should not be construed as an invitation or solicitation to do business with HSL. HSL may from time to time solicit from, or perform broking, or other services
for, any company mentioned in this mail and/or its attachments.
HSL and its affiliated company(ies), their directors and employees may; (a) from time to time, have a long or short position in, and buy or sell the securities of
the company(ies) mentioned herein or (b) be engaged in any other transaction involving such securities and earn brokerage or other compensation or act as a
market maker in the financial instruments of the company(ies) discussed herein or act as an advisor or lender/borrower to such company(ies) or may have any
other potential conflict of interests with respect to any recommendation and other related information and opinions.
HSL, its directors, analysts or employees do not take any responsibility, financial or otherwise, of the losses or the damages sustained due to the investments
made or any action taken on basis of this report, including but not restricted to, fluctuation in the prices of shares and bonds, changes in the currency rates,
diminution in the NAVs, reduction in the dividend or income, etc.
HSL and other group companies, its directors, associates, employees may have various positions in any of the stocks, securities and financial instruments dealt
in the report, or may make sell or purchase or other deals in these securities from time to time or may deal in other securities of the companies / organizations
described in this report.
HSL or its associates might have managed or co-managed public offering of securities for the subject company or might have been mandated by the subject
company for any other assignment in the past twelve months.
HSL or its associates might have received any compensation from the companies mentioned in the report during the period preceding twelve months from t
date of this report for services in respect of managing or co-managing public offerings, corporate finance, investment banking or merchant banking, brokerage
services or other advisory service in a merger or specific transaction in the normal course of business.
HSL or its analysts did not receive any compensation or other benefits from the companies mentioned in the report or third party in connection with
preparation of the research report. Accordingly, neither HSL nor Research Analysts have any material conflict of interest at the time of publication of this
report. Compensation of our Research Analysts is not based on any specific merchant banking, investment banking or brokerage service transactions. HSL may
have issued other reports that are inconsistent with and reach different conclusion from the information presented in this report.
Research entity has not been engaged in market making activity for the subject company. Research analyst has not served as an officer, director or employee of
the subject company. We have not received any compensation/benefits from the subject company or third party in connection with the Research Report.
HDFC securities Limited, I Think Techno Campus, Building - B, "Alpha", Office Floor 8, Near Kanjurmarg Station, Opp. Crompton Greaves, Kanjurmarg
(East), Mumbai 400 042 Phone: (022) 3075 3400 Fax: (022) 2496 5066 Compliance Officer: Binkle R. Oza Email: [email protected] Phone: (022)
3045 3600 HDFC Securities Limited, SEBI Reg. No.: NSE, BSE, MSEI, MCX: INZ000186937; AMFI Reg. No. ARN: 13549; PFRDA Reg. No. POP: 11092018;
IRDA Corporate Agent License No.: CA0062; SEBI Research Analyst Reg. No.: INH000002475; SEBI Investment Adviser Reg. No.: INA000011538; CIN -
U67120MH2000PLC152193