Embed Size (px)
Citation preview

Sector Thematic
Logistics
Indian Railways - getting aggressive
The Indian Railways (IR) is targeting to increase its market share from the current
~28% to 44% in the longer term (FY51) as per the National Rail Plan (NRP)
document released recently. The IR has set near-term targets of 33% in 2026, 39% in
2031, 43% in 2041 and 44% in 2051. We believe that the IR has carried out detailed
work in assessing these market share targets (which was released in their 1,178
pages document). Under the base case of the railways, it proposes to double the
speed of trains to 50kmph gradually and reduce tariff on selected commodity items
by 30%. IR is projecting Container tonnage to increase from 54MT to 234MT over
FY18-31 (CAGR of 12%). We believe that this would be positive for companies such
as CONCOR and Gateway Rail, while roadways will be impacted, which could
impact demand for new trucks in the medium term.
Aditya Makharia Autos, Transportation & Logistics
+91-22-6171-7316
Mansi Lall Autos, Transportation & Logistics
+91-22-6171-7357

15 January 2021 Sector Thematic
Logistics
HSIE Research is also available on Bloomberg ERH HDF <GO> & Thomson Reuters
Indian Railways - getting aggressive The Indian Railways (IR) is targeting to increase its market share from the
current ~28% to 44% in the longer term (FY51) as per the National Rail Plan
(NRP) document released recently. The IR has set near-term targets of 33% in
2026, 39% in 2031, 43% in 2041 and 44% in 2051. We believe that the IR has
carried out detailed work in assessing these market share targets (which was
released in their 1,178 pages document). Under the base case of the railways, it
proposes to double the speed of trains to 50kmph gradually and reduce tariff
on selected commodity items by 30%. IR is projecting Container tonnage to
increase from 54MT to 234MT over FY18-31 (CAGR of 12%). We believe that
this would be positive for companies such as CONCOR and Gateway Rail,
while roadways will be impacted, which could impact demand for new trucks
in the medium term.
Railways have lost market share due to capacity constraints and restricted
speeds. It is pertinent to note that share of Rail in freight movement having
leads beyond 300 km has fallen from 51.5% (765 MT) in FY08 to 32.4% (727
MT) in FY19. While the quantum of freight movement has remained the
same by IR, the share has fallen due to limited capacity amidst an overall
increase in freight generation. Railways can gain share in the long lead
segments as capacity increases. For instance, while the average leads for
containers is 624kms, that of the rail-based is significantly higher at 885kms.
Market share gain potential: The projected potential growth of freight
traffic indicates that railways has the potential for almost 2.5x growth over
the next decade subject to improved logistics performance of IR. The
quantity transported by rail is targeted at 3,167MT by FY31 (1,226MT in
FY19). This implies a market share of 39% in FY31 (up from 28%).
Calibrated strategy: IR intends to increase the rail coefficient for cargo
where it traditionally has a limited presence, i.e. high-value commodities
and non-conventional commodities. Railways believes that the share of
conventional freight (traditional bulk traffic) will reduce from 40% of total
freight carried in 2019 to 33% in 2051. It intends to reduce tariff by up to 30%
on select commodities including BOG, Cement, Containers, Food Grains and
RM for Steel. Through price cuts and reduced travel time, it intends to raise
rail coefficient - Balance other goods (BOG) from 4% to 16%, cement from
37% to 50%, Containers from 24% to 43% and food grains from 16% to 31%.
Containers – aggressive strategy: The IR expects container tonnage to
increase from 54MT to 234MT over FY18-31 (CAGR of 12%). The
commissioning of the DFC will play an important part in the same. As
savings from double stacking of containers will be ~20% - the cost-savings
coupled with timetabled trains will add to the overall growth in rail share.
The container coefficient is thus targeted to increase to 43% (from 24%).
Price targets: We raise our TP on CONCOR (ADD) to Rs 500 and Gateway
Distriparks (BUY) to Rs 160. We raise our FY22/23E EPS by 8% for both the
companies and roll forward our TP timeframe to Mar-22 (from Sep-21). We
also increase our multiple on Gateway from 8.5x EV/EBITDA to 9x to factor
in the improved demand environment and the company’s restructuring
initiatives.
Companies CMP*
(Rs) Reco
Container
Corporation 439 ADD
Gateway
Distriparks 122 BUY
Ashok
Leyland 122 REDUCE
Tata Motors 242 BUY
*CMP as of 13th Jan-21
Improved logistics performance shall
catalyze growth in rail freight traffic
(in mn tonnes)
Source: Ministry of Railways, HSIE Research
Rail containers’ rail-coefficient to
increase
Source: Ministry of Railways, HSIE Research
Aditya Makharia
+91-22-6171-7316
Mansi Lall
+91-22-6171-7357
-
500
1,000
1,500
2,000
2,500
3,000
3,500
FY19 (Actuals) FY31 (Projected)
24%
43%
0%
10%
20%
30%
40%
50%
Rail coefficient
2019
Expected modal
share 2031

Page | 2
Logistics: Sector Thematic
Table of contents
Aggressive market share targets ..........................................................................................3
Derivation of railway’s market share targets .....................................................................7
Railways can increase share in the long-distance lead segments ....................................9
Impact on road logistics ...................................................................................................... 11
Price targets and outlook .................................................................................................... 12
Annexure ............................................................................................................................... 14
Page | 3
Logistics: Sector Thematic
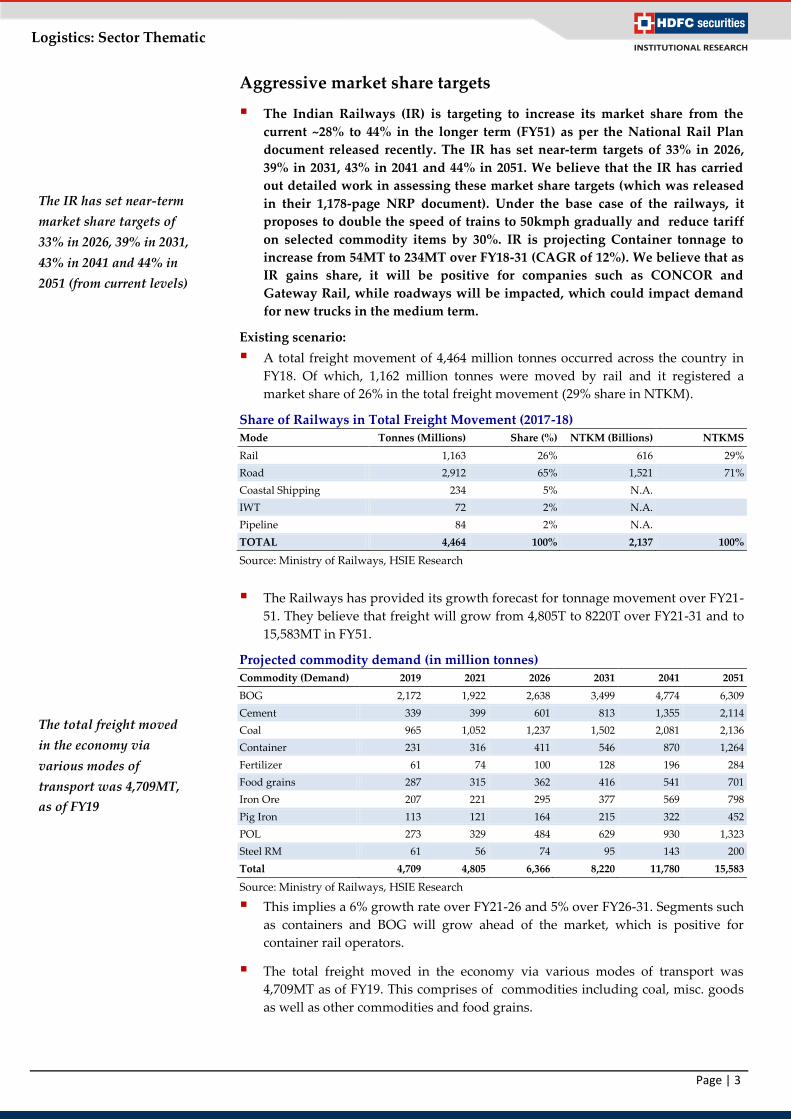
Aggressive market share targets
The Indian Railways (IR) is targeting to increase its market share from the
current ~28% to 44% in the longer term (FY51) as per the National Rail Plan
document released recently. The IR has set near-term targets of 33% in 2026,
39% in 2031, 43% in 2041 and 44% in 2051. We believe that the IR has carried
out detailed work in assessing these market share targets (which was released
in their 1,178-page NRP document). Under the base case of the railways, it
proposes to double the speed of trains to 50kmph gradually and reduce tariff
on selected commodity items by 30%. IR is projecting Container tonnage to
increase from 54MT to 234MT over FY18-31 (CAGR of 12%). We believe that as
IR gains share, it will be positive for companies such as CONCOR and
Gateway Rail, while roadways will be impacted, which could impact demand
for new trucks in the medium term.
Existing scenario:
A total freight movement of 4,464 million tonnes occurred across the country in
FY18. Of which, 1,162 million tonnes were moved by rail and it registered a
market share of 26% in the total freight movement (29% share in NTKM).
Share of Railways in Total Freight Movement (2017-18)
Mode Tonnes (Millions) Share (%) NTKM (Billions) NTKMS
Rail 1,163 26% 616 29%
Road 2,912 65% 1,521 71%
Coastal Shipping 234 5% N.A.
IWT 72 2% N.A.
Pipeline 84 2% N.A.
TOTAL 4,464 100% 2,137 100%
Source: Ministry of Railways, HSIE Research
The Railways has provided its growth forecast for tonnage movement over FY21-
51. They believe that freight will grow from 4,805T to 8220T over FY21-31 and to
15,583MT in FY51.
Projected commodity demand (in million tonnes)
Commodity (Demand) 2019 2021 2026 2031 2041 2051
BOG 2,172 1,922 2,638 3,499 4,774 6,309
Cement 339 399 601 813 1,355 2,114
Coal 965 1,052 1,237 1,502 2,081 2,136
Container 231 316 411 546 870 1,264
Fertilizer 61 74 100 128 196 284
Food grains 287 315 362 416 541 701
Iron Ore 207 221 295 377 569 798
Pig Iron 113 121 164 215 322 452
POL 273 329 484 629 930 1,323
Steel RM 61 56 74 95 143 200
Total 4,709 4,805 6,366 8,220 11,780 15,583
Source: Ministry of Railways, HSIE Research
This implies a 6% growth rate over FY21-26 and 5% over FY26-31. Segments such
as containers and BOG will grow ahead of the market, which is positive for
container rail operators.
The total freight moved in the economy via various modes of transport was
4,709MT as of FY19. This comprises of commodities including coal, misc. goods
as well as other commodities and food grains.
The IR has set near-term
market share targets of
33% in 2026, 39% in 2031,
43% in 2041 and 44% in
2051 (from current levels)
The total freight moved
in the economy via
various modes of
transport was 4,709MT,
as of FY19

Page | 4
Logistics: Sector Thematic
National freight ecosystem (in million tonnes)
Source: Ministry of Railways, HSIE Research
Indian Railways is now targeting to increase its market share to 44% by FY51
based on its new initiatives, including capacity enhancement, lower freight rates
on select commodities as well as faster movement of trains.
Rail modal share under different scenario runs of Logit Model
Source: Ministry of Railways, HSIE Research
IR intends to increase the rail coefficient for cargo where it traditionally has a
limited presence i.e. high-value commodities and non-conventional commodities.
Classification of commodities
Source: Ministry of Railways, HSIE Research
Indian Railways is now
targeting to increase its
market share to 44% by
FY51
12
22
62
59
113
207
232
272
289
337
358
966
1,779
4,708
Autos
Stones & Aggregares
Non Ferrous Metals
Fertilizer
Steel
Iron Ore
Containers
POL
Food Grains
Cement
Limestone
Coal
Misc other goods
Total

Page | 5
Logistics: Sector Thematic
Railways believes that the share of conventional freight (traditional bulk traffic)
will reduce from 40% of total freight carried in 2019 to 33% in 2051, while
conventional high value and non-conventional cargo will grow.
Share of conventional commodities to go down
Source: Ministry of Railways, HSIE Research
Railways intends to reduce tariff by up to 30% on select commodities including
BOG, Cement, Containers, Food Grains and RM for Steel. Through price cuts and
reduced travel time, it intends to raise rail coefficient - Balance other goods
(BOG) from 4% to 16%, cement from 37% to 50%, Containers from 24% to 43%
and food grains from 16% to 31%.
30%
32%
34%
36%
38%
40%
42%
2019 2026 2031 2041 2051
Conventional (Traditional Bulk)

Page | 6
Logistics: Sector Thematic
Key commodity groups, existing rail share and identification of
focus commodities for IR
Source: Ministry of Railways, HSIE Research
The modal share of
containers is expected to
increase from 24% to 43%
by 2031
Similarly, the modal
share of BOG is expected
to increase to 16% from
current levels

Page | 7
Logistics: Sector Thematic
Derivation of railway’s market share targets
The projected potential growth of freight traffic on rail, as discussed in the NRP
demand forecast report, indicates that rail traffic has a potential for almost 2.5x
growth over the next decade subject to improved logistics performance on rail.
Improved logistics performance shall catalyze growth in rail freight traffic (in mn
tonnes)
Source: Ministry of Railways, HSIE Research
Railways has used a total of four scenarios while considering its market share
targets. The study is fairly in-depth and uses reasonable assumptions, in our
view. Its base case is a market share target of 44% under the scenario 3C, which is
highlighted in the table below.
Comparison of Scenarios
Components Existing
Scenario Scenario 1: BAU
Scenario 2:
Enhancement
average speed
to 50 kmph
Scenario 3A:
Enhancement
average speed
to 50 kmph with
30% reduced
tariff
Scenario 3B:
Enhancement of
average speed
to 50 kmph with
30% less tariff
on selected
items*
Scenario 3C:
Enhancement of
average speed
to 50 kmph
gradually with
30% less tariff
on selected
commodities
Scenario 4: BAU
with tariff
reduction by
30%
Operating
speed (kmph) 25 25 50 50 50 25-50 25
Railway Tariff - BAU BAU 30% lesser than
BAU
30% lesser than
BAU on selected
items
30% lesser than
BAU on selected
items
30% lesser than
BAU
Daily Run in
Road 350 450 450 450 450 450 450
Cost on Road BAU BAU BAU BAU BAU BAU BAU
Rail
Commodity
Share (%)
28% 24% 40% 45% 44% 30%-44% 31%
Source: Ministry of Railways, HSIE Research
(Scenario 1) The present modal share in Rail is 28% but if there is no
augmentation in Rail and after Bharatmala Project, the share will come down to
24%.
(Scenario 2) In case the rail speed is enhanced to 50 Kmph instantly without
changing the tariff, the share increases to 40%.
(Scenario 3A) The share further enhances to 45% in case tariff reduction along
with instant speed enhancement to 50 Kmph by 2026 is considered.
Rail traffic has a
potential for almost 2.5x
growth over the next
decade 1,226
3,167
-
500
1,000
1,500
2,000
2,500
3,000
3,500
FY19 (Actuals) FY31 (Projected)

Page | 8
Logistics: Sector Thematic
(Scenario 3B) In case the tariff is reduced only on selected commodities which are
price sensitive and speed is enhanced instantly to 50 Kmph by 2026, the
estimated rail is 44%.
(Scenario 3C) Further in case the speed is enhanced gradually with rail speed
considered as 25 Kmph in 2021, 30 Kmph in 2026, 35 Kmph in 2031, 40 Kmph in
2041 and 50 Kmph in 2051, the rail share increases gradually and reaches 44%
by the year 2051 while in cardinal years it is estimated to be 33% (2026), 39%
(2031), 43% (2041) and 44% (2051).
(Scenario 4) In the Business-as-Usual Scenario (BAU), there is a reduction in cost
by 30%, while rail infrastructure remains the same.
As highlighted earlier, significant rail share increase is forecasted in containers,
BOG, Cement, POL and food grains. These are primarily high value/non-
conventional commodities, where rail has a limited presence currently.
Rail share for Scenario 3C
Commodity 2051 2041 2031 2026 2021 Existing
BOG 22% 20% 16% 9% 7% 4%
Cement 51% 51% 50% 48% 46% 37%
Coal* 74% 72% 70% 65% 61% 65%
Container 48% 47% 43% 32% 29% 24%
Fertilizer* 90% 90% 89% 87% 85% 87%
Food grains 32% 32% 31% 28% 28% 16%
Iron Ore* 82% 81% 77% 68% 60% 65%
Pig Iron 70% 69% 69% 66% 64% 49%
POL 48% 40% 28% 17% 15% 18%
Steel RM* 60% 59% 58% 56% 55% 56%
Total Percentage 44% 43% 39% 33% 31% 28%
Point Percent Change +16% +15% +11% +5% +3%
Tonnes/ day, Scenario 3C 18,863,731 13,857,702 8,676,969 5,742,684 4,108,379
Million Tonnes/ Year 6,885 5,058 3,167 2,096 1,500 1,162
Source: Ministry of Railways, HSIE Research
Rail commodity forecast by scenario in 2051 (million tonnes)
Commodity in million tonnes per year by Rail (2051) Present FY51 (Scenario 3C) Growth (x)
Containerisable BOG 23 429 18.7
Non-Containerisable BOG 54 990 18.3
Total BOG 77 1,419 18.4
Cement 114 1,079 9.5
Coal 575 1,577 2.7
Container 54 610 11.3
Fertilizer 49 256 5.2
Food grain 45 225 5.0
Iron Ore 137 652 4.8
Pig Iron 40 318 8.0
POL 43 630 14.7
Steel RM 28 120 4.3
Grand Total 1,162 6,885 5.9
Source: Ministry of Railways, HSIE Research

Page | 9
Logistics: Sector Thematic
Railways can increase share in the long-distance lead segments
Total freight movement having leads up to 300 km have increased from 840 MT
in 2007-08 to 1829.16 in 2018-19. Total freight movement having leads beyond 300
km has increased from 1486 MT in 2007-08 to 2245 MT in 2018-19. It is pertinent
to note that share of Rail in freight movement having leads beyond 300 km has
fallen from 51.5% (765 MT) in 2007-08 to 32.4% (727 MT) in 2018-19. However,
quantum of freight movement has remained same, but share has fallen due to
overall increase in the freight generation clearly stating the issue related to
stagnation of supply of railway freight wagons.
Total freight distribution (million tonnes)
Total Traffic 2017-18 2007-08#
a) Traffic carried by Road Transport 2911.76 1558.87
b) Traffic Carried by Rail 1162.72 768.72
c) Traffic Rail & Road (a+b) 4074.48 2327.59
d) Traffic Road Leads up to 300 km 1393.14 837.89
e) Traffic Rail leads up to 300 km 436.03 2.9
f) Total Traffic leads up to 300 km (d+e) 1829.16 840.79
g) Total Potential Traffic Moving Beyond 300 km
- Rail 726.69 765.82
- Road 1518.62 720.98
Total 2245.31 1486.8
Rail Share in Potential Traffic* 32.40% 51.50%
* % of Rail traffic (726.7MT) to total (2245.3MT)
Source: Ministry of Railways, HSIE Research
As the logistics costs is lower for railways over longer distances, the IR will likely
increase share in this segment.
Logistics cost for bulk commodities- Road vs Rail (Rs/Tkm)
Source: Ministry of Railways, HSIE Research
Total freight movement
having leads beyond 300
km has increased from
1486 MT in 2007-08 to
2245 MT in 2018-19

Page | 10
Logistics: Sector Thematic
For instance, while the average leads for containers is 624kms, that of the rail-
based movement is significantly higher at 885kms. In the container segment,
Railways has aggressive targets to increase share as highlighted above.
Mode wise average leads by commodity type (2017-18)
S. No Commodity Rail Road All Modes (Km)
1 Pig Iron 804.5 609.7 741.4
2 RM for Steel 528.8 548.4 537.4
3 Cement 503.7 483.8 491.2
4 Fertilizer 776.4 763.3 774.7
5 Coal 443.3 634.7 509.8
6 POL 624.3 844 804.8
7 Iron Ore 246.8 477 326.9
8 Food grain 1316.2 427.7 568
9 Container 885 539.6 624.2
10 BOG 597.3 480.1 485.2
Overall 530.1 522.4 524.6
Source: Ministry of Railways, HSIE Research
In the container segment,
Railways has aggressive
targets to increase share

Page | 11
Logistics: Sector Thematic
Impact on road logistics
We believe that railways will gain market share with the commissioning of the
DFC and this trend will accelerate as capacity is further augmented, as
highlighted under the NRP. The cost savings under double stacking will be ~20%
based on IR’s estimates as highlighted below.
Potential cost savings for double stack operations on DFCs – mainly for upper stacked containers
Source: Ministry of Railways, HSIE Research
In our exhibit below, we highlight that a potential shift of 1M TEUs to rail from
the western ports will result in an increase of ~1% in railway-based cargo.
This will correspondingly impact traffic on roadways, which will also affect the
utilisation rates of Medium and Heavy Commercial Vehicles. The current fleet
size of MHCVs on road is ~4m vehicles, which will impact 1% of the overall truck
fleet.
Potential market share gains by rail post DFC
Container TEUs (nos) [A] 1mn
Total tonnage (@12 T per container) [B] 12mn
Lead distance (kms) [C] 800
BTKM [B*C] 9.6
Total Rail BTKM 731
Increase in railway traffic 1.30%
Source: India Railways, HSIE Research; BTKM- Billion net tonne km

Page | 12
Logistics: Sector Thematic
Price targets and stock outlook:
We believe that rail-based logistic companies will be medium term beneficiaries
of the proposed enhancement in Indian Railways. We are positive on the
container train operators.
We raise our TP on CONCOR (ADD) to Rs 500 and Gateway Distriparks (BUY) to
Rs 160. We raise our FY22/23E EPS by 8% for both the companies and roll
forward our TP timeframe to Mar-22 (from Sep-21). We also increase our
multiple on Gateway from 8.5x EV/EBITDA to 9x to factor in the improved
demand environment and the company’s restructuring initiatives.
Change in estimates and TP
Coverage
companies
Old
Rating
New
Rating Old TP New TP ^
Old target
multiple
New
target
multiple
Old EPS New EPS % change
FY
21E
FY
22E
FY
23E
FY
21E
FY
22E
FY
23E
FY
21E
FY
22E
FY
23E
Container
Corporation ADD ADD 415 500 22x 22x 10.6 16.2 21.6 11.6 17.5 22.8 9 8 5
Gateway
Distriparks # BUY BUY 125 160
8.5x Rail
business
3.5x CFS
business
9x Rail
business
3.5x CFS
business
2.7 4.5 6.6 3.1 4.9 7.1 11 9 7
Source: Company, HSIE Research, #valued on EV/EBITDA, ^FY23E TP
Valuation summary
Mcap
(Rs bn)
CMP*
(Rs/sh) Reco
TP
(Rs)
Adj EPS (Rs/sh) P/E (x) RoE (%) EV/EBITDA (x)
FY
21E
FY
22E
FY
23E
FY
21E
FY
22E
FY
23E
FY
21E
FY
22E
FY
23E
FY
21E
FY
22E
FY
23E
LOGISTICS
Container
Corporation 272 446 ADD 500 11.6 17.5 22.8 37.9 25.1 19.3 6.9 10.1 12.4 19.9 14.2 10.9
Gateway
Distriparks 13 122 BUY 160 3.1 4.9 7.1 40.0 25.1 17.2 2.8 4.2 6.0 8.1 7.5 6.2
Source: HSIE Research *CMP as of 13th Jan-21

Page | 13
Logistics: Sector Thematic
3QFY21E earnings preview
In our 3Q preview, we believe that these companies will witness an improvement
in volumes as compared to 2Q.
NET SALES (Rs mn) EBITDA margin (%) APAT (Rs mn) Adj. EPS
3Q
FY21E
QoQ
(%)
YoY
(%)
3Q
FY21E
QoQ
(bps)
YoY
(bps)
3Q
FY21E
QoQ
(%)
YoY
(%)
3Q
FY21E
2Q
FY21
3Q
FY20
LOGISTICS
CONCOR 16,422 9 8 21.0 17 (333) 2,010 7 15 3.3 3.1 2.9
Gateway Distriparks 2,966 13 (1) 25.0 15 475 168 295 55 1.5 0.4 1.0
Source: Company, HSIE Research
COMPANY 3QFY21
OUTLOOK WHAT’S LIKELY KEY MONITORABLES
Container
Corporation AVG
Volumes in 3Q grew by 6/9% YoY/QoQ. We
expect sales to grow by 9/8% QoQ/YoY.
EBITDA margin is expected at 21% (-300bps
YoY)
We expect PAT to grow by 7/15% QoQ/YoY
to Rs 2bn.
Revised timelines on commissioning of the
DFC
Update on divestment initiatives by the
government
Gateway
Distriparks AVG
We expect consolidated revenue to grow by
13% QoQ, -1% YoY.
Operating margin at 25% to expand by
475bps YoY and 15bps QoQ
We expect profit to grow to Rs 168mn (vs. Rs
109mn YoY, Rs 43mn QoQ)
Post fundraising, timelines for merging of
subsidiaries
Update on Snowman Logistics stake sale
now that the deal with Adani has been
called off
Source: HSIE Research

Page | 14
Logistics: Sector Thematic
Annexure
Scenario 1: Business as Usual (BAU): Rail Infrastructure Remain same but
includes sanctioned projects such as Eastern and Western DFC, Mumbai
Ahmedabad HSR and projects as per Pink Book. Whereas in case of Roads,
Project Bharat Mala is considered implemented.
Scenario 2: Enhancement of Average Rail Speed of Freight Trains from 25 Kmph
to 50 Kmph.
Scenario 3: Enhancement of Speed from 25 Kmph to 50 Kmph with 30%
Reduced Tariff:
Implementation of Railway projects corresponds to average speed to 50
Kmph & reducing tariffs by 30% by 2026.
Implementation of Railway projects corresponds to average speed to 50
Kmph & reducing tariffs on 4 items by 30% by 2026
Implementation of Railway projects corresponds to average speed to 50
Kmph gradually & reducing tariff on 4 items by 30%
o Year 2021 - 25 Kmph
o Year 2026 – 30 Kmph
o Year 2031 – 35 Kmph
o Year 2041 – 40 Kmph
o Year 2051 – 50 Kmph
Scenario 4: Business as Usual (BAU) with reduction in cost by 30%: Rail
Infrastructure remains the same whereas the cost being charged is reduced by
30%.
Rail commodity forecast for Scenario 3C (million tonnes)
Commodity Existing 2021 2026 2031 2041 2051
Containerizable BOG 23 42 73 171 292 429
Non-Containerizable BOG 54 96 169 395 674 990
Total BOG 77 138 242 567 966 1,419
Cement 114 185 288 405 686 1,079
Coal 575 646 810 1,050 1,455 1,577
Container 54 90 132 234 374 610
Fertilizer 49 64 87 113 174 256
Foodgrain 45 88 103 127 165 225
Iron Ore 137 132 202 289 435 652
Pig Iron 40 77 108 147 221 318
POL 43 50 84 179 264 630
Steel RM 28 31 42 55 83 120
Total 1,162 1,500 2,096 3,167 4,823 6,885
Source: Ministry of Railways, HSIE Research

Page | 15
Logistics: Sector Thematic
Projected commodity demand (in million tonnes)
Source: Ministry of Railways, HSIE Research
Indian Railways vs Global Peers
IR’s revenue/NTKM significantly higher compared to
global peers, highlighting high rail freight cost
Revenue/NTKM for Steel, adjusted for purchasing
power parity (INR)
Source: Ministry of Railways, HSIE Research Source: Ministry of Railways, HSIE Research
Revenue/NTKM earned for Coal, adjusted for PPP,
FY2018
Revenue/NTKM for Container Freight, adjusted for
PPP, FY2018
Source: Ministry of Railways, HSIE Research Source: Ministry of Railways, HSIE Research
4,709 4,805
6,366
8,220
11,780
15,583
-
2,000
4,000
6,000
8,000
10,000
12,000
14,000
16,000
2019 2021 2026 2031 2041 2051
5.4
2.2
2.0
2.4
- 1.0 2.0 3.0 4.0 5.0 6.0
India
Canada
Australia
USA
Cement
6.3
1.8
2.1
2.7
- 1.0 2.0 3.0 4.0 5.0 6.0 7.0
India
Canada
Australia
USA
Steel
7.1
1.8
1.1
1.2
- 2.0 4.0 6.0 8.0
India
Canada
Australia
USA
Coal
3.6
1.8
2.3
2.7
- 1.0 2.0 3.0 4.0
India
Canada
Australia
USA
Containers

Page | 16
Logistics: Sector Thematic
Global comparison of containers’ modal share
Source: Ministry of Railways, HSIE Research
Pricing Reforms:
It is estimated that while the operating ratio for IR’s freight business in FY19 was
0.59, it was 1.92 for IR’s passenger business. This inherent cross-subsidy is
contributing to the reason for IR’s haulage charges being higher than its global
peers even after adjusting for purchasing power parity.
IR Passenger vs Freight Revenue, FY 2019 (Rs bn)
Source: Ministry of Railways, HSIE Research
Direct Grants are used globally to fund passenger service deficits. For instance:
Russian Railway has increasingly phased out cross subsidisation of passenger
operations by freight services. In FY16, Russian Railway received a direct grant of
Rb 32.5 bn to compensate for losses by Russian Railways associated with the
regulation of tariffs for passenger services.
In the UK, the government has provided direct grant support of 6.4p for every
rail passenger kilometre travelled in Great Britain in 2018-19.
30%
40%
55%
40%
70%
40%
40%
40%
50%
25%
30%
20%
5%
10%
5%
0% 10% 20% 30% 40% 50% 60% 70% 80% 90% 100%
Germany
Japan
China
US
India
Road Rail Coastal/IWT
983
511
1,274
748
-
200
400
600
800
1,000
1,200
1,400
Passenger cost of ops Passenger revenue Freight revenue Freight cost of ops
37%

Page | 17
Logistics: Sector Thematic
Thematic reports by HSIE
Cement: WHRS – A key cog in the
flywheel
Autos: Where are we on “S”
curve?
FMCG: Defensive businesses but
not valuations
Autos: A changed landscape Banks: Double whammy for some India Equity Strategy: Atma
Nirbhar Bharat
Indian IT: Demand recovery in sight Life Insurance: Recovery
may be swift with protection
driving margins
Retail: Whole flywheel is broken? Appliances: Looing beyond near-
term disruption
Pharma: Chronic therapy – A
portfolio prescription
Indian Gas: Looking beyond the
pandemic
India Equity Strategy: Quarterly
flipbook
Real Estate: Ripe for consumption Indian IT: expanding centre of
gravity
Indian Chemical: Evolution to
revolution!
Life Insurance: ULIP vs. MF Infrastructure: On the road to
rerating
Cement: Spotting the sweet spot Pharma: Cardiac: the heartbeat of domestic
market
Life Insurance: Comparative
annual report analysis
Indian microfinance: Should you
look micro as macros disappoint?
India Equity Strategy:
Quarterly flipbook
Autos: Divergent trends in PVs
and 2Ws
India Internet: the stage is set FMCG: Opportunity in adversity - A
comparative scorecard

Page | 18
Logistics: Sector Thematic
HDFC securities
Institutional Equities
Unit No. 1602, 16th Floor, Tower A, Peninsula Business Park,
Senapati Bapat Marg, Lower Parel, Mumbai - 400 013
Board: +91-22-6171-7330 www.hdfcsec.com
Disclosure:
We, Aditya Makharia, CA & Mansi Lall, MBA, authors and the names subscribed to this report, hereby certify that all of the views expressed in this research
report accurately reflect our views about the subject issuer(s) or securities. HSL has no material adverse disciplinary history as on the date of publication of this
report. We also certify that no part of our compensation was, is, or will be directly or indirectly related to the specific recommendation(s) or view(s) in this
report.
Research Analyst or his/her relative or HDFC Securities Ltd. does not have any financial interest in the subject company. Also Research Analyst or his relative
or HDFC Securities Ltd. or its Associate may have beneficial ownership of 1% or more in the subject company at the end of the month immediately preceding
the date of publication of the Research Report. Further Research Analyst or his relative or HDFC Securities Ltd. or its associate does not have any material
conflict of interest.
Any holding in stock –YES
HDFC Securities Limited (HSL) is a SEBI Registered Research Analyst having registration no. INH000002475.
Disclaimer:
This report has been prepared by HDFC Securities Ltd and is solely for information of the recipient only. The report must not be used as a singular basis of any
investment decision. The views herein are of a general nature and do not consider the risk appetite or the particular circumstances of an individual investor;
readers are requested to take professional advice before investing. Nothing in this document should be construed as investment advice. Each recipient of this
document should make such investigations as they deem necessary to arrive at an independent evaluation of an investment in securities of the companies
referred to in this document (including merits and risks) and should consult their own advisors to determine merits and risks of such investment. The
information and opinions contained herein have been compiled or arrived at, based upon information obtained in good faith from sources believed to be
reliable. Such information has not been independently verified and no guaranty, representation of warranty, express or implied, is made as to its accuracy,
completeness or correctness. All such information and opinions are subject to change without notice. Descriptions of any company or companies or their
securities mentioned herein are not intended to be complete. HSL is not obliged to update this report for such changes. HSL has the right to make changes and
modifications at any time.
This report is not directed to, or intended for display, downloading, printing, reproducing or for distribution to or use by, any person or entity who is a citizen
or resident or located in any locality, state, country or other jurisdiction where such distribution, publication, reproduction, availability or use would be
contrary to law or regulation or what would subject HSL or its affiliates to any registration or licensing requirement within such jurisdiction.
If this report is inadvertently sent or has reached any person in such country, especially, United States of America, the same should be ignored and brought to
the attention of the sender. This document may not be reproduced, distributed or published in whole or in part, directly or indirectly, for any purposes or in
any manner.
Foreign currencies denominated securities, wherever mentioned, are subject to exchange rate fluctuations, which could have an adverse effect on their value or
price, or the income derived from them. In addition, investors in securities such as ADRs, the values of which are influenced by foreign currencies effectively
assume currency risk. It should not be considered to be taken as an offer to sell or a solicitation to buy any security.
This document is not, and should not, be construed as an offer or solicitation of an offer, to buy or sell any securities or other financial instruments. This report
should not be construed as an invitation or solicitation to do business with HSL. HSL may from time to time solicit from, or perform broking, or other services
for, any company mentioned in this mail and/or its attachments.
HSL and its affiliated company(ies), their directors and employees may; (a) from time to time, have a long or short position in, and buy or sell the securities of
the company(ies) mentioned herein or (b) be engaged in any other transaction involving such securities and earn brokerage or other compensation or act as a
market maker in the financial instruments of the company(ies) discussed herein or act as an advisor or lender/borrower to such company(ies) or may have any
other potential conflict of interests with respect to any recommendation and other related information and opinions.
HSL, its directors, analysts or employees do not take any responsibility, financial or otherwise, of the losses or the damages sustained due to the investments
made or any action taken on basis of this report, including but not restricted to, fluctuation in the prices of shares and bonds, changes in the currency rates,
diminution in the NAVs, reduction in the dividend or income, etc.
HSL and other group companies, its directors, associates, employees may have various positions in any of the stocks, securities and financial instruments dealt
in the report, or may make sell or purchase or other deals in these securities from time to time or may deal in other securities of the companies / organizations
described in this report.
HSL or its associates might have managed or co-managed public offering of securities for the subject company or might have been mandated by the subject
company for any other assignment in the past twelve months.
HSL or its associates might have received any compensation from the companies mentioned in the report during the period preceding twelve months from the
date of this report for services in respect of managing or co-managing public offerings, corporate finance, investment banking or merchant banking, brokerage
services or other advisory service in a merger or specific transaction in the normal course of business.
HSL or its analysts did not receive any compensation or other benefits from the companies mentioned in the report or third party in connection with
preparation of the research report. Accordingly, neither HSL nor Research Analysts have any material conflict of interest at the time of publication of this
report. Compensation of our Research Analysts is not based on any specific merchant banking, investment banking or brokerage service transactions. HSL may
have issued other reports that are inconsistent with and reach different conclusion from the information presented in this report.
Research entity has not been engaged in market making activity for the subject company. Research analyst has not served as an officer, director or employee of
the subject company. We have not received any compensation/benefits from the subject company or third party in connection with the Research Report.
HDFC securities Limited, I Think Techno Campus, Building - B, "Alpha", Office Floor 8, Near Kanjurmarg Station, Opp. Crompton Greaves, Kanjurmarg
(East), Mumbai 400 042 Phone: (022) 3075 3400 Fax: (022) 2496 5066 Compliance Officer: Binkle R. Oza Email: [email protected] Phone: (022)
3045 3600 HDFC Securities Limited, SEBI Reg. No.: NSE, BSE, MSEI, MCX: INZ000186937; AMFI Reg. No. ARN: 13549; PFRDA Reg. No. POP: 11092018;
IRDA Corporate Agent License No.: CA0062; SEBI Research Analyst Reg. No.: INH000002475; SEBI Investment Adviser Reg. No.: INA000011538; CIN -
U67120MH2000PLC152193