Embed Size (px)
Citation preview
25 October 2011 Credit Research
Sector Report
UniCredit Research page 1 See last pages for disclaimer.
Sector Report United Kingdom ■ Considerable healthy balance sheet restructuring, clarity about its future
regulatory path and its interesting spread environment, currently make the UK an attractive country for investors.
■ Economy: Moving into 2012, we expect GDP growth to accelerate as financial market tensions gradually subside and the downward trend in global growth indicators flattens out. In addition, the effect of the BoE’s asset purchases should boost growth. We expect GDP to increase by 0.8% in 2011 and 1.5% in 2012. The UK is likely to benefit from a recov-ery in its main trading partners which should spur exports and, in turn, business confidence and thus investment. In addition, the squeeze in real household disposable income seen in 2011 should moderate, as the temporary effect of the factors pushing up prices begins to wane and in-flation decelerates. As a result, we expect growth to be driven by a mod-erate acceleration in consumption and a more marked recovery in ex-ports and investment.
■ Sector drivers: The UK banking system features five major players: Bar-clays, HSBC, Lloyds, Royal Bank of Scotland and Santander UK. In some business segments, such as current accounts or SME banking, these five institutions have a combined market share of 85% to 90%. Furthermore, there are a number of banks that operate on a local or na-tional level, such as Clydesdale, or building societies, e.g. Coventry Building Society or Yorkshire Building Society. The latter are institutions that specialize in mortgage lending. On 12 September 2011, the UK In-dependent Commission on Banking (ICB) published its recommenda-tions for a reform of the British financial system. The core measure to achieve these aims is setting up a ring-fence around business entities such as retail banking in order to protect them from losses generated by other units, such as investment banking. Only ring-fenced banks shall be allowed to take deposits and provide overdrafts, purportedly with an im-plementation deadline until 2019. Moreover, while the report does not re-quire a full separation of retail and investment banking business, the ICB recommends increasing capital requirements for large ring-fenced banks. We will look into the differentiated impact of these recommendations on the individual banking segments.
■ Covered Bonds: The UK covered bond market came into existence in 2003. This market has since constantly grown, reaching a total volume of EUR 209bn as at the end of 2010. However, only around 40% is related to EUR-denominated benchmark bonds, which currently amount to EUR 85bn from eleven issuers. In March 2008, a specific UK covered bond legislation was implemented.
■ We believe that the recent spread widening is fundamentally exagger-ated. With the right timing and a focus on liquid bonds, it may be worth considering specific trades in UK bank bonds. The large UK banking groups are solidly rooted in retail business and/or part of a mutual sys-tem. As soon as market fears wane, the fundamental strength of UK banks will likely be mirrored in tighter spreads.
Contents UK Economic Outlook ________________________ 2UK Housing Market __________________________ 4UK Banking Sector___________________________ 5
Introduction, Crisis, Recovery & the ICB_________ 5A Comparison of the big 5 UK Banks_____________ 9Overview – Investment Metrics ________________ 12The Stress-Robustness of major UK Banks_______ 16Regulation ________________________________ 22The UK Covered Bond Legislation ______________ 23Overview of the UK Covered Bond Market________ 26Snapshot – UK Bank Profiles__________________ 29
Abbey/Santander _________________________ 29Abbey/Santander UK's Cover Pool Details ______ 30Barclays ________________________________ 36Barclays' Cover Pool Details_________________ 37Clydesdale ______________________________ 44Clydesdale's Cover Pool Details______________ 45Coventry Building Society___________________ 49Coventry's Cover Pool Details _______________ 50HSBC __________________________________ 54HSBC's Cover Pool Details__________________ 55Lloyds Banking Group______________________ 62Lloyds' Cover Pool Details __________________ 63Nationwide Building Society _________________ 69Nationwide's Cover Pool Details______________ 70Royal Bank of Scotland_____________________ 75RBS' Cover Pool Details ____________________ 76Standard Chartered _______________________ 82Yorkshire Building Society __________________ 88YBS' Cover Pool Details ____________________ 89
Spread Overview ___________________________ 93Investment Considerations____________________ 99
Analysis of secondary Market Spreads_________ 99Trade Ideas_____________________________ 100UK Bonds Overview (unsecured) ____________ 103Quantitative Trade Signals _________________ 105
Company websites www.santander.co.uk www.barclays.com www.cbonline.co.uk www.coventrybuildingsociety.co.uk www.hsbc.com www.lloydsbankinggroup.com www.nationwide.co.uk www.rbs.com www.standardchartered.com www.ybs.co.uk
Authors Dr. Tilo Höpker (UniCredit Bank) +49 89 378-12960 [email protected] Franz Rudolf, CEFA (UniCredit Bank) +49 89 378-12449 [email protected] Mauro Giorgio Marrano (UniCredit Bank) +39 02 88628222 [email protected] Bloomberg UCCR Internet www.research.unicreditgroup.eu
25 October 2011 Credit Research
Sector Report
UniCredit Research page 2 See last pages for disclaimer.
UK Economic Outlook Summary Moving into 2012, we expect GDP growth to accelerate as financial market tensions
gradually subside and the downward trend in global growth indicators flattens out. Inaddition, the effect of the BoE’s asset purchases should boost growth. We expect GDPto increase by 0.8% in 2011 and 1.5% in 2012. Inflation reached 5.2% in Septemberdriven by increases in utility charges, but should fall sharply in forthcoming years asthe effect of the temporary factors pushing up prices wane. The outlook for the UK economy has worsened over the summer due to the deterioration of the global eco-nomic outlook, rising financial market tensions, and the sustained weakness of thedomestic economy. Recent data and indicators point to continued weak growth in 3Qand 4Q. On the back of the deterioration of the outlook, at the October meeting the Bank of England resumed asset purchases, increasing the size of the stock of pur-chases by GBP 75bn to a total of GBP 275bn. We expect an additional increase of GBP50bn in 1Q12.
GDP growth to remain weak in 3Q and 4Q
Following very modest growth in 2Q, with the preliminary GDP reading revised down from0.2% qoq to 0.1%, data available for 3Q point to continued weak growth. Both PMIs deterio-rated in 3Q compared to 2Q (the manufacturing index fell from 52.7 to 50.0, while the servicesindex dropped from 58.7 to 53.1). Industrial production for July and August suggests that the production sector will grow 0.2% qoq, providing a positive, but modest, contribution to GDPgrowth in 3Q. On the expenditure side, consumer spending indicators remained weak, with 3Q retail sales falling 0.2% qoq compared to 2Q. On a positive note, trade data suggest that net exports are likely to provide a positive contribution to 3Q GDP growth. On the basis ofavailable data and information, we expect GDP to grow 0.2% qoq in 3Q. Regarding 4Q, weexpect GDP growth to slow to 0.1%, with growth suffering from the slowdown in the globaleconomy, particularly in the UK’s main trade partners such as the euro area. GDP shouldgrow 0.8% overall in 2011.
Growth will begin to recover in 2012
Moving into 2012, we expect GDP growth to accelerate as financial market tensions graduallysubside and the downward trend in global growth indicators flattens out. Furthermore, the effect of asset purchases should boost growth. The UK is likely to benefit from a recovery in its main trading partners (especially in the euro area, where we expect growth to start accel-erating at the beginning of 2012 and to reach its potential around the middle of the year)which should spur exports and, in turn, business confidence and thus investment. In addition, the squeeze in real household disposable income seen in 2011 should moderate, as the tem-porary effect of the factors pushing up prices (higher commodity prices, VAT increase and higher imports) begins to wane and inflation decelerates. As a result, we expect growth to be driven by a moderate acceleration in consumption and a more marked recovery in exports and investment. We expect GDP to grow 1.5% in 2012.
Labor market conditions are worsening
After having improved since mid-2010, labor market indicators began to deteriorate in 3Q. In the three months to August, employment fell by 178,000 as job creation in the private sectorwas unable to offset the fall in public sector employment, while unemployment increased by 114,000. For both indicators, these are the poorest performances since mid-2009. The unem-ployment rate increased from 7.9% to 8.1%. Due to the deterioration of the growth outlook seen over the summer, we expect labor market conditions to worsen in the remainder of theyear, before stabilizing in 1Q12 and starting to improve in 2Q12 as growth accelerates andeconomic prospects improve.
Inflation should have peaked in September
Inflation has been increasing since the end of 2009, mainly driven by higher commodity andimport prices, and VAT increases. Headline inflation accelerated from 4.5% to 5.2% in Sep-tember driven by utility charges. Such an increase was already factored in by the Bank ofEngland that had been warning in the preceding months about inflation going above 5% andtherefore it should not change the Bank’s view on QE. We expect inflation to have peaked in
25 October 2011 Credit Research
Sector Report
UniCredit Research page 3 See last pages for disclaimer.
September and we see it beginning to gradually slow down by the end of the year, and more sharply in 2012 when the effect of the temporary factors pushing up prices wane (VAT in-creases, commodity and import prices). We expect inflation to average 4.3% in 2011 and2.4% in 2012.
BoE: more QE in 1Q12 On the back of the deterioration of the outlook, at the October meeting the Bank of England resumed asset purchases, increasing the size of the stock of purchases by GBP 75bn to atotal of GBP 275bn. As in the first round, the BoE will purchase gilts with a maturity greaterthan three years in a timeframe of four months. The minutes of the meeting showed that thedecision was unanimous and the MPC hinted that the Bank of England could announce more purchases if needed. We expect the BoE to announce an additional increase of GBP 50bn in1Q12, bringing the stock of purchases to GBP 325bn. As for the Bank rate, we do not expectthe first hike until 1Q13.
25 October 2011 Credit Research
Sector Report
UniCredit Research page 4 See last pages for disclaimer.
UK Housing Market Summary The housing market remains weak. The recovery is likely to be very gradual, reflecting
a weak demand for housing due to credit constraints, squeezed household incomes, and uncertainty over the economic outlook. However, historically low Bank rates andthe resumption of quantitative easing, should provide some support to the housingmarket.
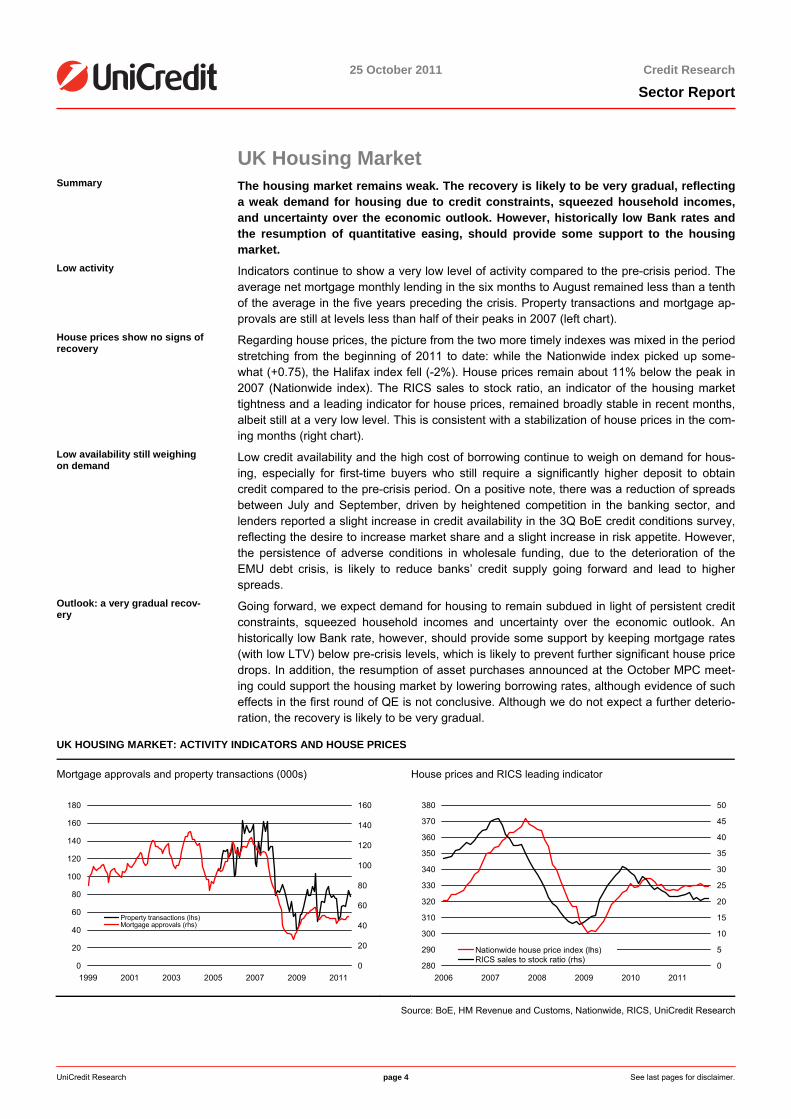
Low activity Indicators continue to show a very low level of activity compared to the pre-crisis period. The average net mortgage monthly lending in the six months to August remained less than a tenth of the average in the five years preceding the crisis. Property transactions and mortgage ap-provals are still at levels less than half of their peaks in 2007 (left chart).
House prices show no signs of recovery
Regarding house prices, the picture from the two more timely indexes was mixed in the period stretching from the beginning of 2011 to date: while the Nationwide index picked up some-what (+0.75), the Halifax index fell (-2%). House prices remain about 11% below the peak in 2007 (Nationwide index). The RICS sales to stock ratio, an indicator of the housing markettightness and a leading indicator for house prices, remained broadly stable in recent months,albeit still at a very low level. This is consistent with a stabilization of house prices in the com-ing months (right chart).
Low availability still weighing on demand
Low credit availability and the high cost of borrowing continue to weigh on demand for hous-ing, especially for first-time buyers who still require a significantly higher deposit to obtain credit compared to the pre-crisis period. On a positive note, there was a reduction of spreads between July and September, driven by heightened competition in the banking sector, andlenders reported a slight increase in credit availability in the 3Q BoE credit conditions survey,reflecting the desire to increase market share and a slight increase in risk appetite. However, the persistence of adverse conditions in wholesale funding, due to the deterioration of theEMU debt crisis, is likely to reduce banks’ credit supply going forward and lead to higherspreads.
Outlook: a very gradual recov-ery
Going forward, we expect demand for housing to remain subdued in light of persistent creditconstraints, squeezed household incomes and uncertainty over the economic outlook. Anhistorically low Bank rate, however, should provide some support by keeping mortgage rates (with low LTV) below pre-crisis levels, which is likely to prevent further significant house pricedrops. In addition, the resumption of asset purchases announced at the October MPC meet-ing could support the housing market by lowering borrowing rates, although evidence of such effects in the first round of QE is not conclusive. Although we do not expect a further deterio-ration, the recovery is likely to be very gradual.
UK HOUSING MARKET: ACTIVITY INDICATORS AND HOUSE PRICES
Mortgage approvals and property transactions (000s) House prices and RICS leading indicator
0
20
40
60
80
100
120
140
160
180
1999 2001 2003 2005 2007 2009 20110
20
40
60
80
100
120
140
160
Property transactions (lhs)Mortgage approvals (rhs)
280
290
300
310
320
330
340
350
360
370
380
2006 2007 2008 2009 2010 20110
5
10
15
20
25
30
35
40
45
50
Nationwide house price index (lhs)RICS sales to stock ratio (rhs)
Source: BoE, HM Revenue and Customs, Nationwide, RICS, UniCredit Research
25 October 2011 Credit Research
Sector Report
UniCredit Research page 5 See last pages for disclaimer.
UK Banking Sector
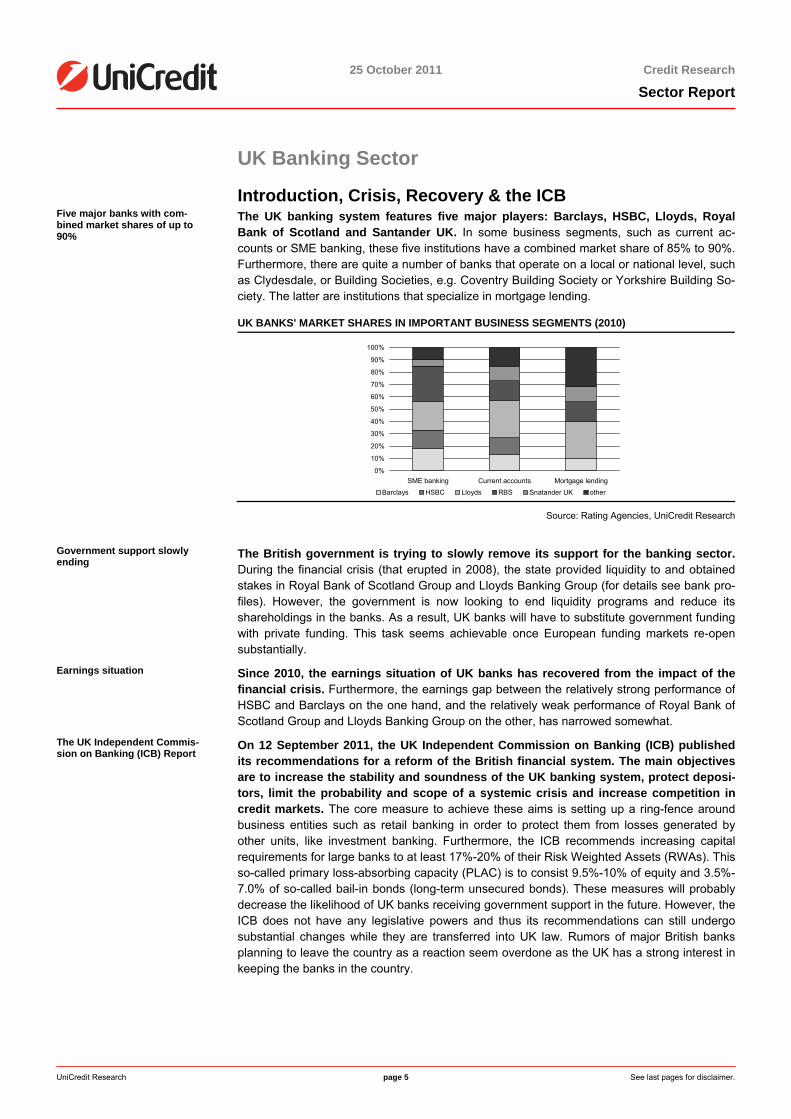
Introduction, Crisis, Recovery & the ICB Five major banks with com-bined market shares of up to 90%
The UK banking system features five major players: Barclays, HSBC, Lloyds, Royal Bank of Scotland and Santander UK. In some business segments, such as current ac-counts or SME banking, these five institutions have a combined market share of 85% to 90%. Furthermore, there are quite a number of banks that operate on a local or national level, such as Clydesdale, or Building Societies, e.g. Coventry Building Society or Yorkshire Building So-ciety. The latter are institutions that specialize in mortgage lending.
UK BANKS' MARKET SHARES IN IMPORTANT BUSINESS SEGMENTS (2010)
0%
10%
20%
30%
40%
50%
60%
70%
80%
90%
100%
SME banking Current accounts Mortgage lending
Barclays HSBC Lloyds RBS Snatander UK other Source: Rating Agencies, UniCredit Research
Government support slowly ending
The British government is trying to slowly remove its support for the banking sector.During the financial crisis (that erupted in 2008), the state provided liquidity to and obtained stakes in Royal Bank of Scotland Group and Lloyds Banking Group (for details see bank pro-files). However, the government is now looking to end liquidity programs and reduce its shareholdings in the banks. As a result, UK banks will have to substitute government funding with private funding. This task seems achievable once European funding markets re-open substantially.
Earnings situation Since 2010, the earnings situation of UK banks has recovered from the impact of the financial crisis. Furthermore, the earnings gap between the relatively strong performance ofHSBC and Barclays on the one hand, and the relatively weak performance of Royal Bank of Scotland Group and Lloyds Banking Group on the other, has narrowed somewhat.
The UK Independent Commis-sion on Banking (ICB) Report
On 12 September 2011, the UK Independent Commission on Banking (ICB) published its recommendations for a reform of the British financial system. The main objectives are to increase the stability and soundness of the UK banking system, protect deposi-tors, limit the probability and scope of a systemic crisis and increase competition incredit markets. The core measure to achieve these aims is setting up a ring-fence around business entities such as retail banking in order to protect them from losses generated byother units, like investment banking. Furthermore, the ICB recommends increasing capital requirements for large banks to at least 17%-20% of their Risk Weighted Assets (RWAs). This so-called primary loss-absorbing capacity (PLAC) is to consist 9.5%-10% of equity and 3.5%-7.0% of so-called bail-in bonds (long-term unsecured bonds). These measures will probably decrease the likelihood of UK banks receiving government support in the future. However, the ICB does not have any legislative powers and thus its recommendations can still undergo substantial changes while they are transferred into UK law. Rumors of major British banks planning to leave the country as a reaction seem overdone as the UK has a strong interest in keeping the banks in the country.
25 October 2011 Credit Research
Sector Report
UniCredit Research page 6 See last pages for disclaimer.
Sector wrap-up and latest events
On 7 October 2011, Moody's downgraded the senior debt and deposit ratings of 12 UK finan-cial institutions and confirmed the rating of 1 institution, concluding its review of UK systemic support started on 24 May: ■ The downgrades reflect Moody's re-assessment of the UK's support environment, leading
it to remove the assumption of systemic support for seven smaller institutions and to lower systemic support by one-to-three notches for five larger financial groups.
■ Moody's ascribes these to the announcements and actions made by British authorities, which it believes will lower the predictability of support in the medium to long run.
■ The agency also said that the UK government remains likely to offer some form of supportto systemically important financial institutions still having up to three notches of uplift.
■ Moody's said it is more probable that there will be no support for smaller institutions.
■ The rating actions were not caused by worsening financial strength of the banking systemnor of the UK government.
■ Moreover, Moody's has a negative outlook on the senior debt and deposit ratings of banks with still two or more notches of systemic support. This is due to the possibility of a further lowering of systemic support over the medium-to-long term.
■ The specific downgrades for individual banks were as follows: a one-notch downgrade of Lloyds TSB Bank plc (to A1 from Aa3), Santander UK plc (to A1 from Aa3), Cooperative Bank plc (to A3 from A2), a two-notch downgrade of RBS plc (to A2 from Aa3) and Nation-wide Building Society (to A2 from Aa3); and downgrades by one to five notches for seven smaller building societies. Clydesdale Bank's ratings were confirmed at A2, with a negativeoutlook.
■ Regarding standalone rating actions (which preceded the debt rating actions), the following banks were upgraded: Cooperative Bank, Santander UK, Nationwide, Yorkshire, and Prin-cipality Building Society.
To put this into context: On 12 September 2011, the UK's government-appointed Inde-pendent Commission on Banking (ICB) released its final recommendations on reformsto improve stability and competition in the UK banking. These are the main recommenda-tions and points:
■ Only ring-fenced banks shall be allowed to take deposits and provide overdrafts, with animplementation deadline until 2019 and purportedly (i) slowly enough to avoid undermining the economy and (ii) to prevent UK retail banks from leaving the country.
■ The report does not require a full separation of retail and investment banking business butrecommends that riskier business should be done at non-ring-fenced banks and not benefit from explicit government support. That a total separation was not recommended wasdriven by concerns about: (i) higher economic expense (loss of synergies), (ii) potentialconflicts with European law and (iii) precluding support for troubled retail banks from else-where in banking groups.
■ Large ring-fenced banks (RWAs/GDP of >3%: Barclays, HSBC, Lloyds Banking Group,Nationwide, RBS, Santander UK) are faced with a minimum equity-RWA ratio of 10%, banks with RWAs/GDP of 1%-3% (Co-op, Verde, Clydesdale) face a 7% + ring-fence buffer of 3/2x (RWAs/GDP-1%) – yielding a buffer of max. 10% – and all other banks (RWAs/GDP of <1%) a 7% buffer.
25 October 2011 Credit Research
Sector Report
UniCredit Research page 7 See last pages for disclaimer.
■ Retail and other activities of large UK banking groups should have a primary loss-absorbing capacity of 17%-20% (equity and other capital that also includes long-term un-secured debt, which may bear losses in resolution [bail-in bonds] and could also include contingent capital ["CoCos"]).
■ Reform costs are estimated at GBP 4bn-7bn p.a. for the aggregate of UK banks and will affect around a third of UK banks' balance sheets or up to GBP 2.3tn.
■ The implementation and final decision on the recommendations rests with the Chancellor of the Exchequer, Osborne, who supports ring-fencing and wants the necessary legislation in place "while this parliament is sitting".
■ Ring-fencing was to be expected, as was the response by the British Bankers’ Association(BBA). The BBA stated that UK banks were already implementing “sweeping reforms” andthat the "ICB’s recommendations cover the same important issues. Any further reform measures adopted by the UK authorities need to be carefully analyzed and compared withthose agreed internationally. It is vital that the full impact any further reforms will have onthe economy, the recovery and banks’ ability to support their customers in the UK is under-stood”.
■ Also, as expected, the report provides relief for taxpayers but leaves enough time for UK banks to adapt to the new rules and not to be as harsh (full separation, immediate imple-mentation, etc.) as to trigger a re-location of UK banks (somewhat unrealistic) or an imme-diate drop in profits/capitalization levels. Also, given Basel III, the discussion of extra capi-tal buffers for systemically important banks and the general trend to make banks suppos-edly safer but also less "sexy" (resolution schemes, ring-fencing discussions in other coun-tries, stress tests, EC imposed de-risking in return for state aid, "voluntary" rights issues and disposal of non-core assets, staff cuts, etc.), the recommendations do not come as asurprise really.
■ On 14 September (in contrast to its rating action on 7 October), Moody's stated that theICB report has no immediate rating impact for UK banks, but is credit-negative overall for bondholders of the largest UK banking groups due to following:
– The UK government still needs to formally accept the ICB recommendations and legislation will likely require a lengthy drafting process and a longer-than-expected implementation period, which may extend until 2019. This would in-crease the probability that the final decisions may differ from the current rec-ommendations.
– Over the longer term, the ICB proposals could be credit-negative for bondhold-ers of the largest UK banks due to enhanced resolution powers, including the ability to bail-in senior unsecured bondholders and possibly higher funding and operating costs.
– On the other hand, the high capital requirements imposed by the ICB's recom-mendations and the simpler structure regarding ring-fenced banking entities are credit-positive and could be a mitigating factor, at least for the ring-fenced bank-ing units.
– Moody's has pointed to three aspects in the ICB's recommendations that mighthave the greatest importance for bondholders:
25 October 2011 Credit Research
Sector Report
UniCredit Research page 8 See last pages for disclaimer.
■ Moody's said that it would assign separate standalone ratings to Ring-Fenced Banks (RFBs) and Non-Ring-Fenced Banks (NRFBs), and that the recommendations would probably affect the rating agency's evaluation of franchise value, funding, prof-itability and capital adequacy. Despite keeping the overall group risk profile, Moody's expects the recommendations to be positive for the standalone rating of RFBs due to more stable earnings. They would be negative for the standalone ratings of NRFBs thanks to more volatile earnings and possibly higher funding costs.
■ Regarding capital, the core capital ratios required by the ICB's recommendations will be slightly higher for the RFBs of the large UK banks than Basel III for G-SIB banksand would therefore be credit-positive. However, the additional loss-absorbing ca-pacity will highly depend on its specific composition of equity, contingent capital instruments or loss-absorbing debt.
■ Concerning resolution tools, the ICB's recommendations regarding depositor prefer-ence for insured depositors and statutory bail-in powers to impose losses on senior unsecured debt are in the same vein as the long-term international and EU plans on bank resolution and are credit negative. The capital and loss-absorbing requirementsfor the largest banks are negative if they rely mainly on allowing senior unse-cured debt to be bailed in. Moody's also expects the recommendations to lead to an overall further lessening in systemic support in Moody's senior debt ratings both for RFBs and NRFBs.
■ The rating considerations above were followed by Fitch's lowering of the UK support ratingfloors on 13 October, cutting Lloyds Banking Group plc's long-term IDR to A from AA-, placing Barclays IDR on watch negative and RBS Group's long-term IDR on A from AA-.
To conclude, the above-mentioned fits into the larger European context as follows. Wethink the pessimistic market view will continue to predominate in the near future. The Euro-pean sovereign crisis remains center-stage, and as long as this issue has not been resolved, tightening potential is limited. Moreover, there is no new positive investment trigger on the horizon that could divert investors' attention. Hence, the many investment opportunities that make sense fundamentally and are highly attractive following the re-pricing will become even more attractive in the next few weeks before we return to tighter, justified levels. However, at some point, market participants will perceive spread levels as sufficiently attractive and thenegative story as priced in – and start buying again. Finding this optimal entry point is impos-sible to predict, especially due to the large carry that is lost when not being invested, meaninginvestors will return to financials credit before positive news kicks in. While September was another challenging month for financials credit markets, with spreads widening across the board, there was some relief at the end of the month following political support for the EFSFenlargement.
25 October 2011 Credit Research
Sector Report
UniCredit Research page 9 See last pages for disclaimer.
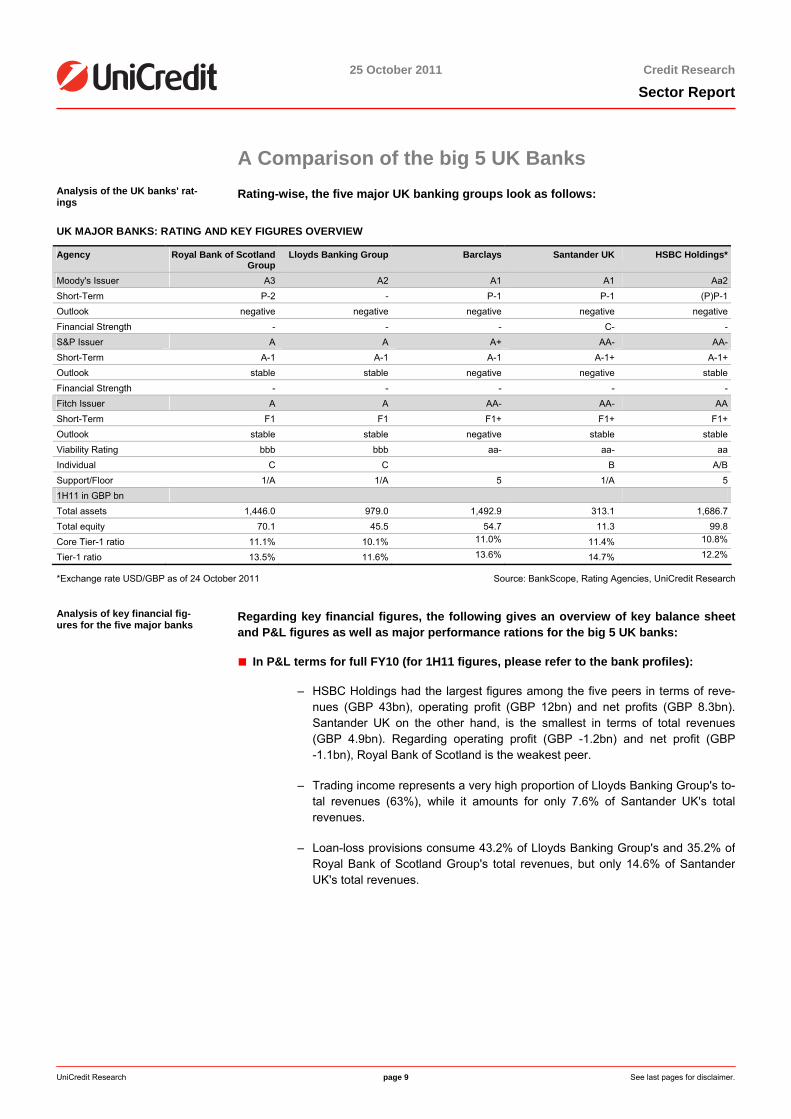
A Comparison of the big 5 UK Banks Analysis of the UK banks' rat-ings
Rating-wise, the five major UK banking groups look as follows:
UK MAJOR BANKS: RATING AND KEY FIGURES OVERVIEW
Agency Royal Bank of Scotland Group
Lloyds Banking Group Barclays Santander UK HSBC Holdings*
Moody's Issuer A3 A2 A1 A1 Aa2Short-Term P-2 - P-1 P-1 (P)P-1Outlook negative negative negative negative negativeFinancial Strength - - - C- -S&P Issuer A A A+ AA- AA-Short-Term A-1 A-1 A-1 A-1+ A-1+Outlook stable stable negative negative stableFinancial Strength - - - - -Fitch Issuer A A AA- AA- AAShort-Term F1 F1 F1+ F1+ F1+Outlook stable stable negative stable stableViability Rating bbb bbb aa- aa- aaIndividual C C B A/BSupport/Floor 1/A 1/A 5 1/A 51H11 in GBP bn Total assets 1,446.0 979.0 1,492.9 313.1 1,686.7Total equity 70.1 45.5 54.7 11.3 99.8Core Tier-1 ratio 11.1% 10.1% 11.0% 11.4% 10.8%
Tier-1 ratio 13.5% 11.6% 13.6% 14.7% 12.2%
*Exchange rate USD/GBP as of 24 October 2011 Source: BankScope, Rating Agencies, UniCredit Research
Analysis of key financial fig-ures for the five major banks
Regarding key financial figures, the following gives an overview of key balance sheet and P&L figures as well as major performance rations for the big 5 UK banks:
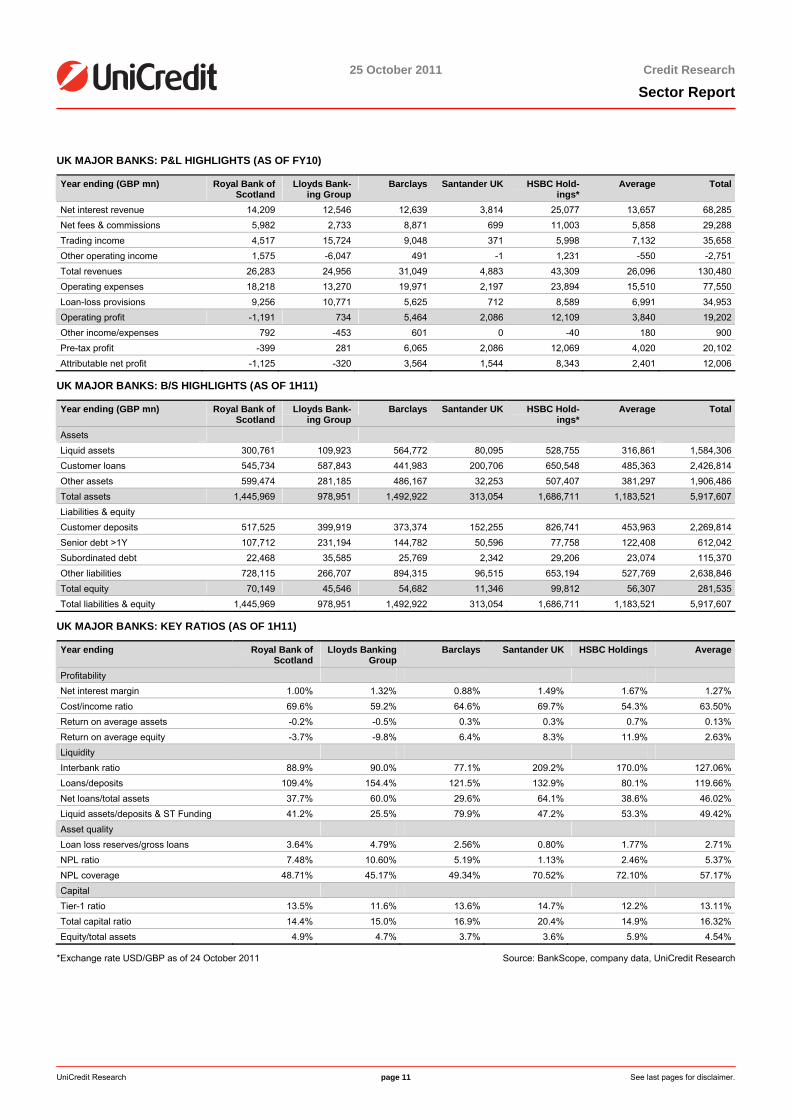
■ In P&L terms for full FY10 (for 1H11 figures, please refer to the bank profiles):
– HSBC Holdings had the largest figures among the five peers in terms of reve-nues (GBP 43bn), operating profit (GBP 12bn) and net profits (GBP 8.3bn).Santander UK on the other hand, is the smallest in terms of total revenues(GBP 4.9bn). Regarding operating profit (GBP -1.2bn) and net profit (GBP-1.1bn), Royal Bank of Scotland is the weakest peer.
– Trading income represents a very high proportion of Lloyds Banking Group's to-tal revenues (63%), while it amounts for only 7.6% of Santander UK's total revenues.
– Loan-loss provisions consume 43.2% of Lloyds Banking Group's and 35.2% of Royal Bank of Scotland Group's total revenues, but only 14.6% of SantanderUK's total revenues.
25 October 2011 Credit Research
Sector Report
UniCredit Research page 10 See last pages for disclaimer.
■ In balance sheet terms (1H11):
– HSBC Holdings (GBP 1,687bn) has the largest asset base, representing 28.5%of the peer group's total assets. Santander UK is the smallest player (GBP313bn) with only 5.3% of total assets of the peer group.
– Average customer loan shares in terms of total assets for the big 5 is 41%,which is surpassed by Santander UK (64.1%) and Lloyds Banking Group (60.0%). Barclays has a customer loan share of only 29.6%.
– Senior debt of more than one year to maturity is 23.6% of Lloyds BankingGroup's total funding vs. an average of 10.3% and just 4.6% at HSBC Holdings.
– Funding is mainly done via other liabilities and customer deposits, with other li-abilities constituting 59.9% for Barclays' and 50.4% for Royal Bank of Scot-land's funding needs, while customer deposits amount to 49% for HSBC Hold-ings and 25.0% for Barclay's funding. The average loan/deposit ratio is 119.7%, surpassed by Lloyds Banking Group (154.4%), Santander UK (132.9%) andBarclays (121.5%).
■ Regarding ratios and valuation (1H11):
– Barclays has the lowest net interest margin (0.88%) and HSBC Holdings hasthe highest (1.67%), while HSBC Holdings has the highest ROE (11.9%) and Lloyds Banking Group the lowest (-9.8%). ROA ranges from -0.5% for Lloyds Banking Group to 0.7% for HSBC Holdings.
– Santander UK and Royal Bank of Scotland Group have the highest cost/income ratio at 69.7% and 69.6%, while HSBC Holdings has the lowest at only 54.3%.
– NPL ratios range between 1.13% for Santander UK and 10.60% for LloydsBanking Group, while NPL coverage is between 72.1% for HSBC Holdings and45.17% for Lloyds Banking Group.
– Capital ratios range from very solid Santander UK (Tier-1 ratio: 14.7% in 1H11 vs. 14.8% in FY10 and total capital ratio: 20.4% in 1H11 vs. 20.6% in FY10) to LloydsBanking Group (Tier-1 ratio: 11.6% in 1H11 vs. 11.6% in FY10 and total capital ratio:15.0% in 1H11 vs. 15.2% in FY10). More concretely, Santander UK leads in the field of Tier-1 ratios (14.7%) followed by Barclays (13.6%), Royal Bank of Scotland (13.5%),HSBC Holdings (12.2%) and Lloyds Banking Group (11.6%). Santander UK also leadsin total capital ratios (20.4%), followed by Barclays (16.9%), Lloyds Banking Group (15.0%), HSBC Holdings (14.9%) and Royal Bank of Scotland (14.4%). Moreover, theequity/total assets ratio ranges from 3.6% at Santander UK to 5.9% at HSBC Holdings:equity represents 5.9% of HSBC Holdings', 4.9% of Royal Bank of Scotland's, 4.7% ofLloyds Banking Group's, 3.7% of Barclays' and 3.6% of Santander UK's total assets.
– In absolute terms, equity markets attach the highest absolute and relative value toHSBC Holdings, with an overall market capitalization of GBP 94bn and a price/book value of 0.94. HSBC Holdings is followed by a group of relatively close peers: RoyalBank of Scotland (with a market capitalization of GBP 27bn and a price/book value of0.37), Lloyds Banking Group (with a market capitalization of GBP 23bn and a price/book value of 0.52), and Barclays (with a market capitalization of GBP 23bn and a price/bookvalue of 0.44).
25 October 2011 Credit Research
Sector Report
UniCredit Research page 11 See last pages for disclaimer.
UK MAJOR BANKS: P&L HIGHLIGHTS (AS OF FY10)
Year ending (GBP mn) Royal Bank of Scotland
Lloyds Bank-ing Group
Barclays Santander UK HSBC Hold-ings*
Average Total
Net interest revenue 14,209 12,546 12,639 3,814 25,077 13,657 68,285Net fees & commissions 5,982 2,733 8,871 699 11,003 5,858 29,288Trading income 4,517 15,724 9,048 371 5,998 7,132 35,658Other operating income 1,575 -6,047 491 -1 1,231 -550 -2,751Total revenues 26,283 24,956 31,049 4,883 43,309 26,096 130,480Operating expenses 18,218 13,270 19,971 2,197 23,894 15,510 77,550Loan-loss provisions 9,256 10,771 5,625 712 8,589 6,991 34,953Operating profit -1,191 734 5,464 2,086 12,109 3,840 19,202Other income/expenses 792 -453 601 0 -40 180 900Pre-tax profit -399 281 6,065 2,086 12,069 4,020 20,102Attributable net profit -1,125 -320 3,564 1,544 8,343 2,401 12,006
UK MAJOR BANKS: B/S HIGHLIGHTS (AS OF 1H11)
Year ending (GBP mn) Royal Bank of Scotland
Lloyds Bank-ing Group
Barclays Santander UK HSBC Hold-ings*
Average Total
Assets Liquid assets 300,761 109,923 564,772 80,095 528,755 316,861 1,584,306Customer loans 545,734 587,843 441,983 200,706 650,548 485,363 2,426,814Other assets 599,474 281,185 486,167 32,253 507,407 381,297 1,906,486Total assets 1,445,969 978,951 1,492,922 313,054 1,686,711 1,183,521 5,917,607Liabilities & equity Customer deposits 517,525 399,919 373,374 152,255 826,741 453,963 2,269,814Senior debt >1Y 107,712 231,194 144,782 50,596 77,758 122,408 612,042Subordinated debt 22,468 35,585 25,769 2,342 29,206 23,074 115,370Other liabilities 728,115 266,707 894,315 96,515 653,194 527,769 2,638,846Total equity 70,149 45,546 54,682 11,346 99,812 56,307 281,535Total liabilities & equity 1,445,969 978,951 1,492,922 313,054 1,686,711 1,183,521 5,917,607
UK MAJOR BANKS: KEY RATIOS (AS OF 1H11)
Year ending Royal Bank of Scotland
Lloyds Banking Group
Barclays Santander UK HSBC Holdings Average
Profitability Net interest margin 1.00% 1.32% 0.88% 1.49% 1.67% 1.27%Cost/income ratio 69.6% 59.2% 64.6% 69.7% 54.3% 63.50%Return on average assets -0.2% -0.5% 0.3% 0.3% 0.7% 0.13%Return on average equity -3.7% -9.8% 6.4% 8.3% 11.9% 2.63%Liquidity Interbank ratio 88.9% 90.0% 77.1% 209.2% 170.0% 127.06%Loans/deposits 109.4% 154.4% 121.5% 132.9% 80.1% 119.66%Net loans/total assets 37.7% 60.0% 29.6% 64.1% 38.6% 46.02%Liquid assets/deposits & ST Funding 41.2% 25.5% 79.9% 47.2% 53.3% 49.42%Asset quality Loan loss reserves/gross loans 3.64% 4.79% 2.56% 0.80% 1.77% 2.71%NPL ratio 7.48% 10.60% 5.19% 1.13% 2.46% 5.37%NPL coverage 48.71% 45.17% 49.34% 70.52% 72.10% 57.17%Capital Tier-1 ratio 13.5% 11.6% 13.6% 14.7% 12.2% 13.11%Total capital ratio 14.4% 15.0% 16.9% 20.4% 14.9% 16.32%Equity/total assets 4.9% 4.7% 3.7% 3.6% 5.9% 4.54%
*Exchange rate USD/GBP as of 24 October 2011 Source: BankScope, company data, UniCredit Research
25 October 2011 Credit Research
Sector Report
UniCredit Research page 12 See last pages for disclaimer.
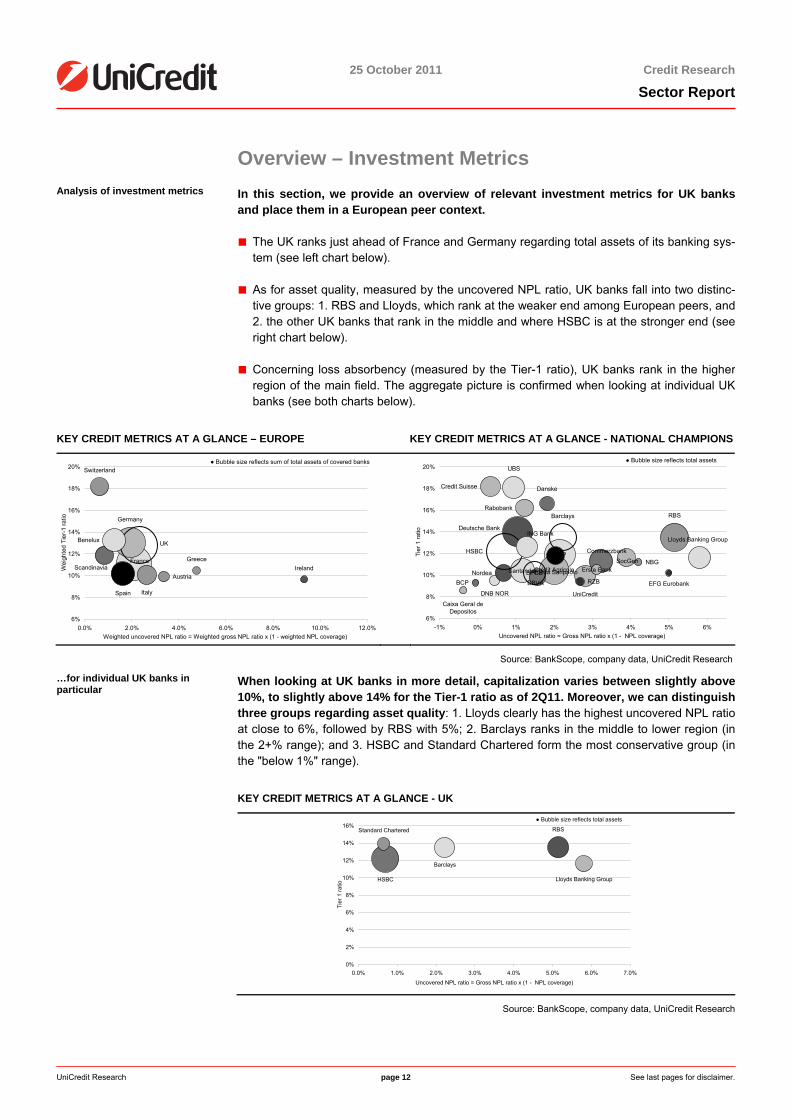
Overview – Investment Metrics Analysis of investment metrics In this section, we provide an overview of relevant investment metrics for UK banks
and place them in a European peer context.
■ The UK ranks just ahead of France and Germany regarding total assets of its banking sys-tem (see left chart below).
■ As for asset quality, measured by the uncovered NPL ratio, UK banks fall into two distinc-tive groups: 1. RBS and Lloyds, which rank at the weaker end among European peers, and 2. the other UK banks that rank in the middle and where HSBC is at the stronger end (see right chart below).
■ Concerning loss absorbency (measured by the Tier-1 ratio), UK banks rank in the higher region of the main field. The aggregate picture is confirmed when looking at individual UKbanks (see both charts below).
KEY CREDIT METRICS AT A GLANCE – EUROPE KEY CREDIT METRICS AT A GLANCE - NATIONAL CHAMPIONS
IrelandFrance
Germany
Greece
Italy
Scandinavia
Spain
Switzerland
UK
Austria
Benelux
6%
8%
10%
12%
14%
16%
18%
20%
0.0% 2.0% 4.0% 6.0% 8.0% 10.0% 12.0%Weighted uncovered NPL ratio = Weighted gross NPL ratio x (1 - weighted NPL coverage)
Wei
ghte
d Ti
er-1
ratio
● Bubble size reflects sum of total assets of covered banks
BNPSocGen
Crédit Agricole
Deutsche Bank
Intesa Sanpaolo
UniCreditCaixa Geral de
Depositos
BCP
Danske
DNB NOR
Nordea Santander
BBVA
Barclays
HSBC
Lloyds Banking Group
RBS
Credit Suisse
UBS
Commerzbank
NBG
EFG Eurobank
ING Bank
Rabobank
Erste Bank
RZBBPCE
6%
8%
10%
12%
14%
16%
18%
20%
-1% 0% 1% 2% 3% 4% 5% 6%Uncovered NPL ratio = Gross NPL ratio x (1 - NPL coverage)
Tier
1 ra
tio
● Bubble size reflects total assets
Source: BankScope, company data, UniCredit Research
…for individual UK banks in particular
When looking at UK banks in more detail, capitalization varies between slightly above 10%, to slightly above 14% for the Tier-1 ratio as of 2Q11. Moreover, we can distinguish three groups regarding asset quality: 1. Lloyds clearly has the highest uncovered NPL ratio at close to 6%, followed by RBS with 5%; 2. Barclays ranks in the middle to lower region (in the 2+% range); and 3. HSBC and Standard Chartered form the most conservative group (in the "below 1%" range).
KEY CREDIT METRICS AT A GLANCE - UK
Barclays
HSBC Lloyds Banking Group
RBSStandard Chartered
0%
2%
4%
6%
8%
10%
12%
14%
16%
0.0% 1.0% 2.0% 3.0% 4.0% 5.0% 6.0% 7.0%
Uncovered NPL ratio = Gross NPL ratio x (1 - NPL coverage)
Tier
1 ra
tio
● Bubble size reflects total assets
Source: BankScope, company data, UniCredit Research
25 October 2011 Credit Research
Sector Report
UniCredit Research page 13 See last pages for disclaimer.
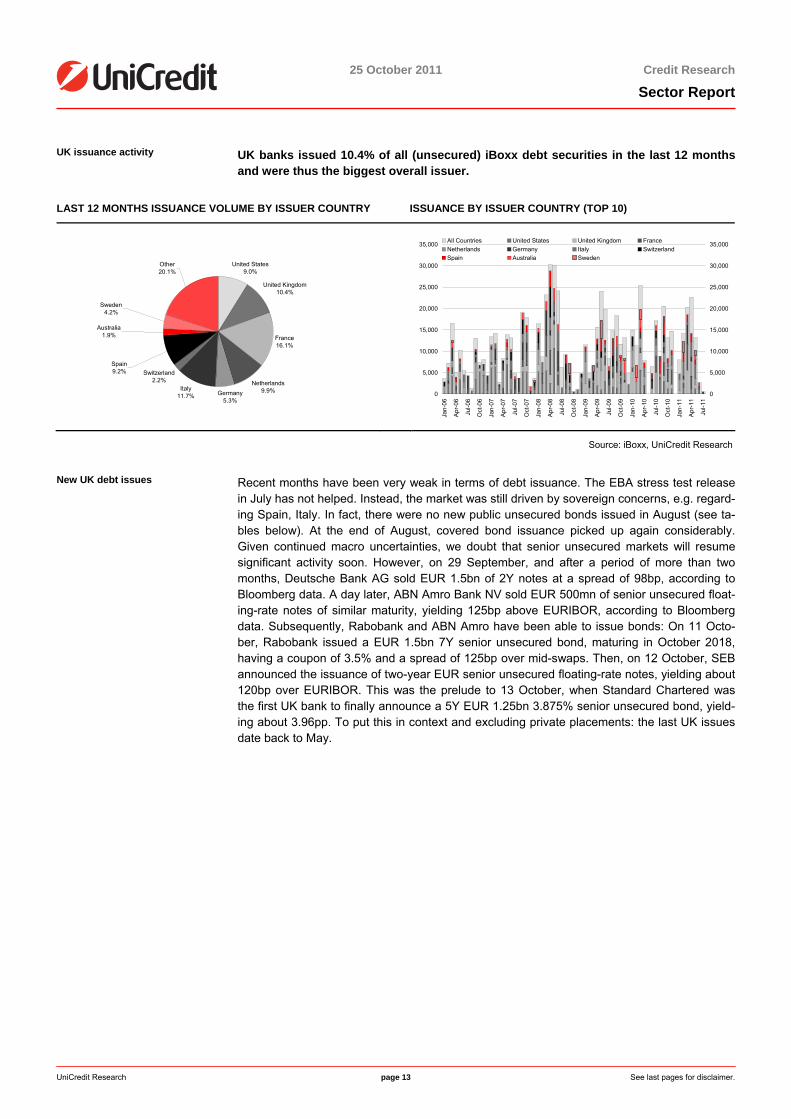
UK issuance activity UK banks issued 10.4% of all (unsecured) iBoxx debt securities in the last 12 months and were thus the biggest overall issuer.
LAST 12 MONTHS ISSUANCE VOLUME BY ISSUER COUNTRY ISSUANCE BY ISSUER COUNTRY (TOP 10)
United States9.0%
United Kingdom10.4%
France16.1%
Netherlands9.9%Germany
5.3%
Italy11.7%
Switzerland2.2%
Other20.1%
Spain9.2%
Australia1.9%
Sweden4.2%
0
5,000
10,000
15,000
20,000
25,000
30,000
35,000
Jan-
06
Apr
-06
Jul-0
6
Oct
-06
Jan-
07
Apr
-07
Jul-0
7
Oct
-07
Jan-
08
Apr
-08
Jul-0
8
Oct
-08
Jan-
09
Apr
-09
Jul-0
9
Oct
-09
Jan-
10
Apr
-10
Jul-1
0
Oct
-10
Jan-
11
Apr
-11
Jul-1
1
0
5,000
10,000
15,000
20,000
25,000
30,000
35,000All Countries United States United Kingdom FranceNetherlands Germany Italy SwitzerlandSpain Australia Sweden
Source: iBoxx, UniCredit Research
New UK debt issues Recent months have been very weak in terms of debt issuance. The EBA stress test release in July has not helped. Instead, the market was still driven by sovereign concerns, e.g. regard-ing Spain, Italy. In fact, there were no new public unsecured bonds issued in August (see ta-bles below). At the end of August, covered bond issuance picked up again considerably.Given continued macro uncertainties, we doubt that senior unsecured markets will resumesignificant activity soon. However, on 29 September, and after a period of more than twomonths, Deutsche Bank AG sold EUR 1.5bn of 2Y notes at a spread of 98bp, according toBloomberg data. A day later, ABN Amro Bank NV sold EUR 500mn of senior unsecured float-ing-rate notes of similar maturity, yielding 125bp above EURIBOR, according to Bloombergdata. Subsequently, Rabobank and ABN Amro have been able to issue bonds: On 11 Octo-ber, Rabobank issued a EUR 1.5bn 7Y senior unsecured bond, maturing in October 2018, having a coupon of 3.5% and a spread of 125bp over mid-swaps. Then, on 12 October, SEB announced the issuance of two-year EUR senior unsecured floating-rate notes, yielding about 120bp over EURIBOR. This was the prelude to 13 October, when Standard Chartered was the first UK bank to finally announce a 5Y EUR 1.25bn 3.875% senior unsecured bond, yield-ing about 3.96pp. To put this in context and excluding private placements: the last UK issues date back to May.
25 October 2011 Credit Research
Sector Report
UniCredit Research page 14 See last pages for disclaimer.
UK Financials iBoxx volume development
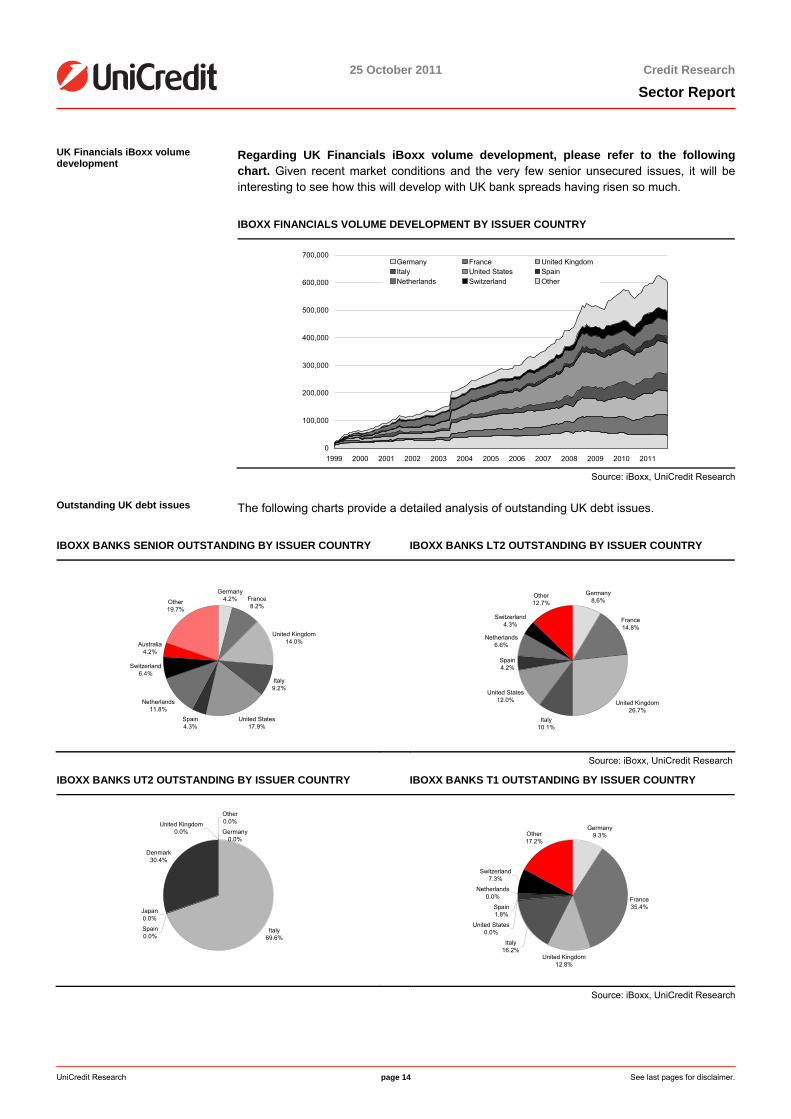
Regarding UK Financials iBoxx volume development, please refer to the following chart. Given recent market conditions and the very few senior unsecured issues, it will be interesting to see how this will develop with UK bank spreads having risen so much.
IBOXX FINANCIALS VOLUME DEVELOPMENT BY ISSUER COUNTRY
0
100,000
200,000
300,000
400,000
500,000
600,000
700,000
1999 2000 2001 2002 2003 2004 2005 2006 2007 2008 2009 2010 2011
Germany France United KingdomItaly United States SpainNetherlands Switzerland Other
Source: iBoxx, UniCredit Research
Outstanding UK debt issues The following charts provide a detailed analysis of outstanding UK debt issues.
IBOXX BANKS SENIOR OUTSTANDING BY ISSUER COUNTRY IBOXX BANKS LT2 OUTSTANDING BY ISSUER COUNTRY
Germany4.2% France
8.2%
United Kingdom14.0%
Italy9.2%
United States17.9%
Spain4.3%
Netherlands11.8%
Switzerland6.4%
Australia4.2%
Other19.7%
Germany8.6%
France14.8%
United Kingdom26.7%
Italy10.1%
United States12.0%
Spain4.2%
Netherlands6.6%
Switzerland4.3%
Other12.7%
Source: iBoxx, UniCredit Research
IBOXX BANKS UT2 OUTSTANDING BY ISSUER COUNTRY IBOXX BANKS T1 OUTSTANDING BY ISSUER COUNTRY
Germany0.0%
Italy69.6%
Spain0.0%
Japan0.0%
Denmark30.4%
Other0.0%United Kingdom
0.0%
Germany9.3%
France35.4%
United Kingdom12.8%
Italy16.2%
United States0.0%
Spain1.8%
Netherlands0.0%
Switzerland7.3%
Other17.2%
Source: iBoxx, UniCredit Research
25 October 2011 Credit Research
Sector Report
UniCredit Research page 15 See last pages for disclaimer.
Outstanding UK debt issues in perspective
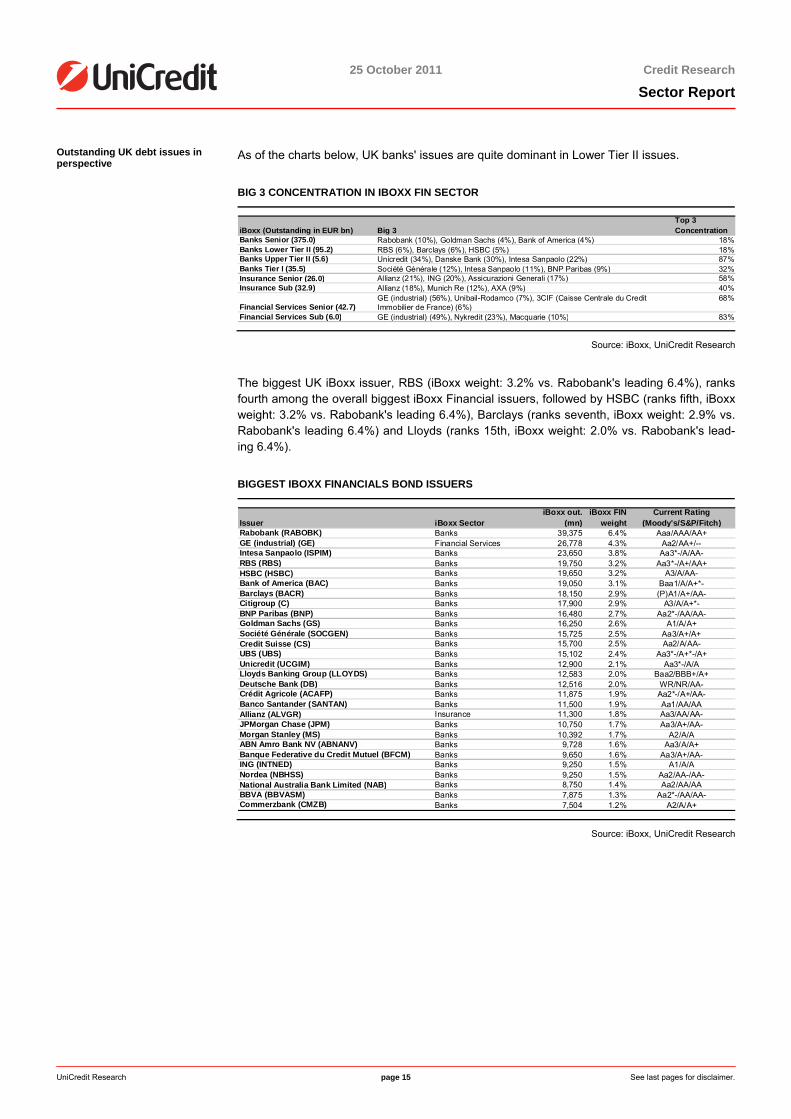
As of the charts below, UK banks' issues are quite dominant in Lower Tier II issues.
BIG 3 CONCENTRATION IN IBOXX FIN SECTOR
iBoxx (Outstanding in EUR bn) Big 3Top 3 Concentration
Banks Senior (375.0) Rabobank (10%), Goldman Sachs (4%), Bank of America (4%) 18%Banks Lower Tier II (95.2) RBS (6%), Barclays (6%), HSBC (5%) 18%Banks Upper Tier II (5.6) Unicredit (34%), Danske Bank (30%), Intesa Sanpaolo (22%) 87%Banks Tier I (35.5) Société Générale (12%), Intesa Sanpaolo (11%), BNP Paribas (9%) 32%Insurance Senior (26.0) Allianz (21%), ING (20%), Assicurazioni Generali (17%) 58%Insurance Sub (32.9) Allianz (18%), Munich Re (12%), AXA (9%) 40%
Financial Services Senior (42.7)GE (industrial) (56%), Unibail-Rodamco (7%), 3CIF (Caisse Centrale du Credit Immobilier de France) (6%)
68%
Financial Services Sub (6.0) GE (industrial) (49%), Nykredit (23%), Macquarie (10%) 83%
Source: iBoxx, UniCredit Research
The biggest UK iBoxx issuer, RBS (iBoxx weight: 3.2% vs. Rabobank's leading 6.4%), ranks fourth among the overall biggest iBoxx Financial issuers, followed by HSBC (ranks fifth, iBoxx weight: 3.2% vs. Rabobank's leading 6.4%), Barclays (ranks seventh, iBoxx weight: 2.9% vs. Rabobank's leading 6.4%) and Lloyds (ranks 15th, iBoxx weight: 2.0% vs. Rabobank's lead-ing 6.4%).
BIGGEST IBOXX FINANCIALS BOND ISSUERS
Issuer iBoxx SectoriBoxx out.
(mn)iBoxx FIN
weightCurrent Rating
(Moody's/S&P/Fitch)Rabobank (RABOBK) Banks 39,375 6.4% Aaa/AAA/AA+GE (industrial) (GE) Financial Services 26,778 4.3% Aa2/AA+/--Intesa Sanpaolo (ISPIM) Banks 23,650 3.8% Aa3*-/A/AA-RBS (RBS) Banks 19,750 3.2% Aa3*-/A+/AA+HSBC (HSBC) Banks 19,650 3.2% A3/A/AA-Bank of America (BAC) Banks 19,050 3.1% Baa1/A/A+*-Barclays (BACR) Banks 18,150 2.9% (P)A1/A+/AA-Citigroup (C) Banks 17,900 2.9% A3/A/A+*-BNP Paribas (BNP) Banks 16,480 2.7% Aa2*-/AA/AA-Goldman Sachs (GS) Banks 16,250 2.6% A1/A/A+Société Générale (SOCGEN) Banks 15,725 2.5% Aa3/A+/A+Credit Suisse (CS) Banks 15,700 2.5% Aa2/A/AA-UBS (UBS) Banks 15,102 2.4% Aa3*-/A+*-/A+Unicredit (UCGIM) Banks 12,900 2.1% Aa3*-/A/ALloyds Banking Group (LLOYDS) Banks 12,583 2.0% Baa2/BBB+/A+Deutsche Bank (DB) Banks 12,516 2.0% WR/NR/AA-Crédit Agricole (ACAFP) Banks 11,875 1.9% Aa2*-/A+/AA-Banco Santander (SANTAN) Banks 11,500 1.9% Aa1/AA/AAAllianz (ALVGR) Insurance 11,300 1.8% Aa3/AA/AA-JPMorgan Chase (JPM) Banks 10,750 1.7% Aa3/A+/AA-Morgan Stanley (MS) Banks 10,392 1.7% A2/A/AABN Amro Bank NV (ABNANV) Banks 9,728 1.6% Aa3/A/A+Banque Federative du Credit Mutuel (BFCM) Banks 9,650 1.6% Aa3/A+/AA-ING (INTNED) Banks 9,250 1.5% A1/A/ANordea (NBHSS) Banks 9,250 1.5% Aa2/AA-/AA-National Australia Bank Limited (NAB) Banks 8,750 1.4% Aa2/AA/AABBVA (BBVASM) Banks 7,875 1.3% Aa2*-/AA/AA-Commerzbank (CMZB) Banks 7,504 1.2% A2/A/A+
Source: iBoxx, UniCredit Research

25 October 2011 Credit Research
Sector Report
UniCredit Research page 16 See last pages for disclaimer.
The Stress-Robustness of major UK Banks Analysis of the UK banks' stress resilience
Stress-wise, the major individual UK banking groups showed the following overall ex-posure to periphery countries, according to EBA's 15 July stress test.
UK BANKS' EXPOSURE TO OVERALL TOTAL PERIPHERY COUNTRIES AS OF FY10 CT1
NB: Lloyds does not have any exposure to periphery countries according to EBA data. Source: EBA, UniCredit Research
…and composition of their periphery exposure
The major individual UK banking groups had the following composition regarding their periph-ery exposure, according to EBA's 15 July stress test.
UK BANKS' SHARE OF INDIVIDUAL OVERALL TOTAL PERIPHERAL COUNTRY EXPOSURE AS OF FY10
Periphery's share as of FY10 Periphery's share of FY10 CT1 capital by country
0%
10%
20%
30%
40%
50%
60%
70%
80%
90%
100%
Barclays HSBC Holdings Lloyds BankingGroup
RBS Group
Italy Portugal Ireland Greece Spain
0%
20%
40%
60%
80%
100%
120%
Barclays HSBC Holdings Lloyds BankingGroup
RBS Group
Greece Ireland Italy Portugal Spain
NB: Lloyds does not have any exposure to periphery countries according to EBA data Source: EBA, Company data, UniCredit Research
0%
20%
40%
60%
80%
100%
120%
140%
160%
180%
200%
Barclays HSBC Holdings Lloyds BankingGroup
RBS Group
25 October 2011 Credit Research
Sector Report
UniCredit Research page 17 See last pages for disclaimer.
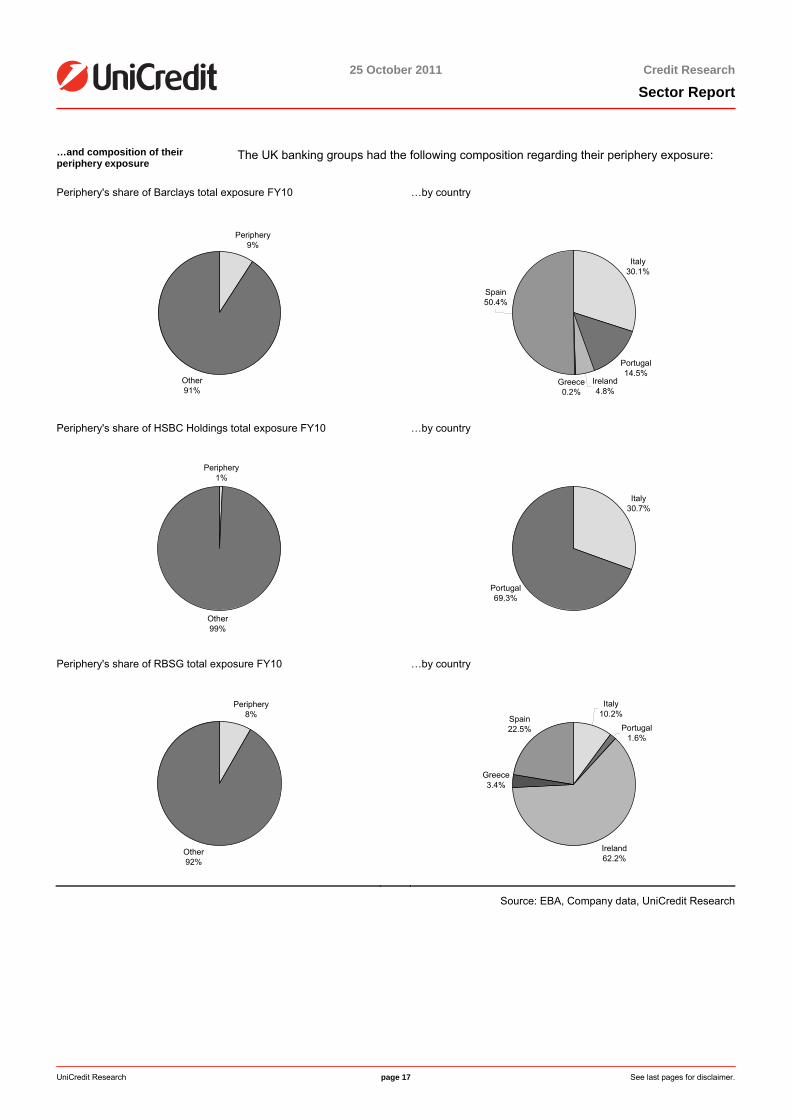
…and composition of their periphery exposure
The UK banking groups had the following composition regarding their periphery exposure:
Periphery's share of Barclays total exposure FY10 …by country
Periphery9%
Other91%
Italy30.1%
Portugal14.5%
Ireland4.8%
Greece0.2%
Spain50.4%
Periphery's share of HSBC Holdings total exposure FY10 …by country
Periphery1%
Other99%
Italy30.7%
Portugal69.3%
Periphery's share of RBSG total exposure FY10 …by country
Periphery8%
Other92%
Italy10.2%
Portugal1.6%
Ireland62.2%
Greece3.4%
Spain22.5%
Source: EBA, Company data, UniCredit Research
25 October 2011 Credit Research
Sector Report
UniCredit Research page 18 See last pages for disclaimer.
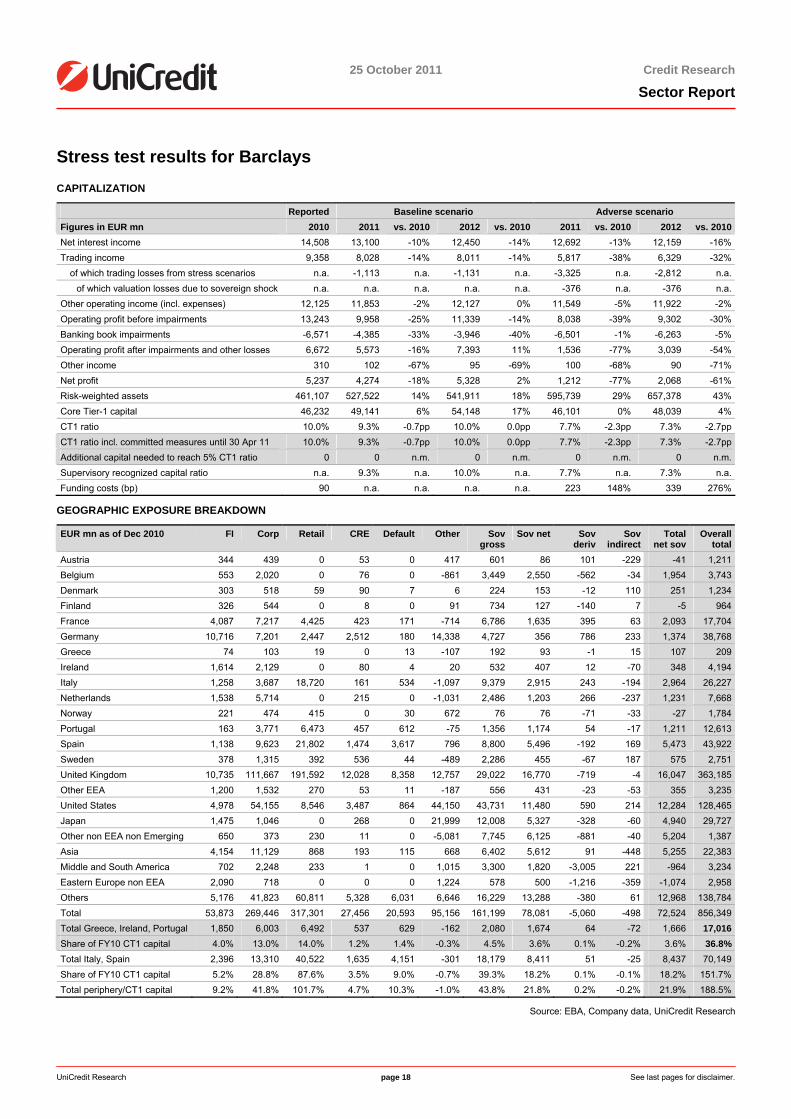
Stress test results for Barclays CAPITALIZATION
Reported Baseline scenario Adverse scenario Figures in EUR mn 2010 2011 vs. 2010 2012 vs. 2010 2011 vs. 2010 2012 vs. 2010Net interest income 14,508 13,100 -10% 12,450 -14% 12,692 -13% 12,159 -16%Trading income 9,358 8,028 -14% 8,011 -14% 5,817 -38% 6,329 -32%
of which trading losses from stress scenarios n.a. -1,113 n.a. -1,131 n.a. -3,325 n.a. -2,812 n.a.of which valuation losses due to sovereign shock n.a. n.a. n.a. n.a. n.a. -376 n.a. -376 n.a.
Other operating income (incl. expenses) 12,125 11,853 -2% 12,127 0% 11,549 -5% 11,922 -2%Operating profit before impairments 13,243 9,958 -25% 11,339 -14% 8,038 -39% 9,302 -30%Banking book impairments -6,571 -4,385 -33% -3,946 -40% -6,501 -1% -6,263 -5%Operating profit after impairments and other losses 6,672 5,573 -16% 7,393 11% 1,536 -77% 3,039 -54%Other income 310 102 -67% 95 -69% 100 -68% 90 -71%Net profit 5,237 4,274 -18% 5,328 2% 1,212 -77% 2,068 -61%Risk-weighted assets 461,107 527,522 14% 541,911 18% 595,739 29% 657,378 43%Core Tier-1 capital 46,232 49,141 6% 54,148 17% 46,101 0% 48,039 4%CT1 ratio 10.0% 9.3% -0.7pp 10.0% 0.0pp 7.7% -2.3pp 7.3% -2.7ppCT1 ratio incl. committed measures until 30 Apr 11 10.0% 9.3% -0.7pp 10.0% 0.0pp 7.7% -2.3pp 7.3% -2.7ppAdditional capital needed to reach 5% CT1 ratio 0 0 n.m. 0 n.m. 0 n.m. 0 n.m.Supervisory recognized capital ratio n.a. 9.3% n.a. 10.0% n.a. 7.7% n.a. 7.3% n.a.Funding costs (bp) 90 n.a. n.a. n.a. n.a. 223 148% 339 276%
GEOGRAPHIC EXPOSURE BREAKDOWN
EUR mn as of Dec 2010 FI Corp Retail CRE Default Other Sov gross
Sov net Sov deriv
Sov indirect
Total net sov
Overall total
Austria 344 439 0 53 0 417 601 86 101 -229 -41 1,211Belgium 553 2,020 0 76 0 -861 3,449 2,550 -562 -34 1,954 3,743Denmark 303 518 59 90 7 6 224 153 -12 110 251 1,234Finland 326 544 0 8 0 91 734 127 -140 7 -5 964France 4,087 7,217 4,425 423 171 -714 6,786 1,635 395 63 2,093 17,704Germany 10,716 7,201 2,447 2,512 180 14,338 4,727 356 786 233 1,374 38,768Greece 74 103 19 0 13 -107 192 93 -1 15 107 209Ireland 1,614 2,129 0 80 4 20 532 407 12 -70 348 4,194Italy 1,258 3,687 18,720 161 534 -1,097 9,379 2,915 243 -194 2,964 26,227Netherlands 1,538 5,714 0 215 0 -1,031 2,486 1,203 266 -237 1,231 7,668Norway 221 474 415 0 30 672 76 76 -71 -33 -27 1,784Portugal 163 3,771 6,473 457 612 -75 1,356 1,174 54 -17 1,211 12,613Spain 1,138 9,623 21,802 1,474 3,617 796 8,800 5,496 -192 169 5,473 43,922Sweden 378 1,315 392 536 44 -489 2,286 455 -67 187 575 2,751United Kingdom 10,735 111,667 191,592 12,028 8,358 12,757 29,022 16,770 -719 -4 16,047 363,185Other EEA 1,200 1,532 270 53 11 -187 556 431 -23 -53 355 3,235United States 4,978 54,155 8,546 3,487 864 44,150 43,731 11,480 590 214 12,284 128,465Japan 1,475 1,046 0 268 0 21,999 12,008 5,327 -328 -60 4,940 29,727Other non EEA non Emerging 650 373 230 11 0 -5,081 7,745 6,125 -881 -40 5,204 1,387Asia 4,154 11,129 868 193 115 668 6,402 5,612 91 -448 5,255 22,383Middle and South America 702 2,248 233 1 0 1,015 3,300 1,820 -3,005 221 -964 3,234Eastern Europe non EEA 2,090 718 0 0 0 1,224 578 500 -1,216 -359 -1,074 2,958Others 5,176 41,823 60,811 5,328 6,031 6,646 16,229 13,288 -380 61 12,968 138,784Total 53,873 269,446 317,301 27,456 20,593 95,156 161,199 78,081 -5,060 -498 72,524 856,349Total Greece, Ireland, Portugal 1,850 6,003 6,492 537 629 -162 2,080 1,674 64 -72 1,666 17,016Share of FY10 CT1 capital 4.0% 13.0% 14.0% 1.2% 1.4% -0.3% 4.5% 3.6% 0.1% -0.2% 3.6% 36.8%Total Italy, Spain 2,396 13,310 40,522 1,635 4,151 -301 18,179 8,411 51 -25 8,437 70,149Share of FY10 CT1 capital 5.2% 28.8% 87.6% 3.5% 9.0% -0.7% 39.3% 18.2% 0.1% -0.1% 18.2% 151.7%Total periphery/CT1 capital 9.2% 41.8% 101.7% 4.7% 10.3% -1.0% 43.8% 21.8% 0.2% -0.2% 21.9% 188.5%
Source: EBA, Company data, UniCredit Research
25 October 2011 Credit Research
Sector Report
UniCredit Research page 19 See last pages for disclaimer.
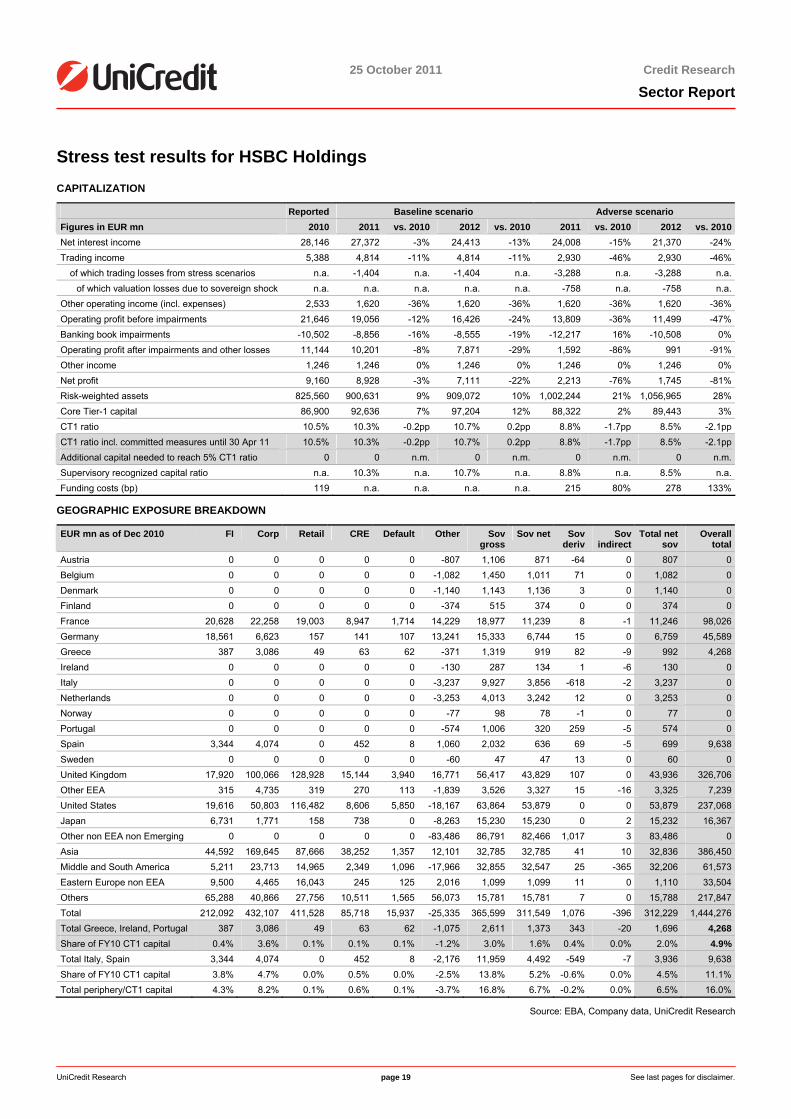
Stress test results for HSBC Holdings CAPITALIZATION
Reported Baseline scenario Adverse scenario Figures in EUR mn 2010 2011 vs. 2010 2012 vs. 2010 2011 vs. 2010 2012 vs. 2010Net interest income 28,146 27,372 -3% 24,413 -13% 24,008 -15% 21,370 -24%Trading income 5,388 4,814 -11% 4,814 -11% 2,930 -46% 2,930 -46%
of which trading losses from stress scenarios n.a. -1,404 n.a. -1,404 n.a. -3,288 n.a. -3,288 n.a.of which valuation losses due to sovereign shock n.a. n.a. n.a. n.a. n.a. -758 n.a. -758 n.a.
Other operating income (incl. expenses) 2,533 1,620 -36% 1,620 -36% 1,620 -36% 1,620 -36%Operating profit before impairments 21,646 19,056 -12% 16,426 -24% 13,809 -36% 11,499 -47%Banking book impairments -10,502 -8,856 -16% -8,555 -19% -12,217 16% -10,508 0%Operating profit after impairments and other losses 11,144 10,201 -8% 7,871 -29% 1,592 -86% 991 -91%Other income 1,246 1,246 0% 1,246 0% 1,246 0% 1,246 0%Net profit 9,160 8,928 -3% 7,111 -22% 2,213 -76% 1,745 -81%Risk-weighted assets 825,560 900,631 9% 909,072 10% 1,002,244 21% 1,056,965 28%Core Tier-1 capital 86,900 92,636 7% 97,204 12% 88,322 2% 89,443 3%CT1 ratio 10.5% 10.3% -0.2pp 10.7% 0.2pp 8.8% -1.7pp 8.5% -2.1ppCT1 ratio incl. committed measures until 30 Apr 11 10.5% 10.3% -0.2pp 10.7% 0.2pp 8.8% -1.7pp 8.5% -2.1ppAdditional capital needed to reach 5% CT1 ratio 0 0 n.m. 0 n.m. 0 n.m. 0 n.m.Supervisory recognized capital ratio n.a. 10.3% n.a. 10.7% n.a. 8.8% n.a. 8.5% n.a.Funding costs (bp) 119 n.a. n.a. n.a. n.a. 215 80% 278 133%
GEOGRAPHIC EXPOSURE BREAKDOWN
EUR mn as of Dec 2010 FI Corp Retail CRE Default Other Sov gross
Sov net Sov deriv
Sov indirect
Total net sov
Overall total
Austria 0 0 0 0 0 -807 1,106 871 -64 0 807 0Belgium 0 0 0 0 0 -1,082 1,450 1,011 71 0 1,082 0Denmark 0 0 0 0 0 -1,140 1,143 1,136 3 0 1,140 0Finland 0 0 0 0 0 -374 515 374 0 0 374 0France 20,628 22,258 19,003 8,947 1,714 14,229 18,977 11,239 8 -1 11,246 98,026Germany 18,561 6,623 157 141 107 13,241 15,333 6,744 15 0 6,759 45,589Greece 387 3,086 49 63 62 -371 1,319 919 82 -9 992 4,268Ireland 0 0 0 0 0 -130 287 134 1 -6 130 0Italy 0 0 0 0 0 -3,237 9,927 3,856 -618 -2 3,237 0Netherlands 0 0 0 0 0 -3,253 4,013 3,242 12 0 3,253 0Norway 0 0 0 0 0 -77 98 78 -1 0 77 0Portugal 0 0 0 0 0 -574 1,006 320 259 -5 574 0Spain 3,344 4,074 0 452 8 1,060 2,032 636 69 -5 699 9,638Sweden 0 0 0 0 0 -60 47 47 13 0 60 0United Kingdom 17,920 100,066 128,928 15,144 3,940 16,771 56,417 43,829 107 0 43,936 326,706Other EEA 315 4,735 319 270 113 -1,839 3,526 3,327 15 -16 3,325 7,239United States 19,616 50,803 116,482 8,606 5,850 -18,167 63,864 53,879 0 0 53,879 237,068Japan 6,731 1,771 158 738 0 -8,263 15,230 15,230 0 2 15,232 16,367Other non EEA non Emerging 0 0 0 0 0 -83,486 86,791 82,466 1,017 3 83,486 0Asia 44,592 169,645 87,666 38,252 1,357 12,101 32,785 32,785 41 10 32,836 386,450Middle and South America 5,211 23,713 14,965 2,349 1,096 -17,966 32,855 32,547 25 -365 32,206 61,573Eastern Europe non EEA 9,500 4,465 16,043 245 125 2,016 1,099 1,099 11 0 1,110 33,504Others 65,288 40,866 27,756 10,511 1,565 56,073 15,781 15,781 7 0 15,788 217,847Total 212,092 432,107 411,528 85,718 15,937 -25,335 365,599 311,549 1,076 -396 312,229 1,444,276Total Greece, Ireland, Portugal 387 3,086 49 63 62 -1,075 2,611 1,373 343 -20 1,696 4,268Share of FY10 CT1 capital 0.4% 3.6% 0.1% 0.1% 0.1% -1.2% 3.0% 1.6% 0.4% 0.0% 2.0% 4.9%Total Italy, Spain 3,344 4,074 0 452 8 -2,176 11,959 4,492 -549 -7 3,936 9,638Share of FY10 CT1 capital 3.8% 4.7% 0.0% 0.5% 0.0% -2.5% 13.8% 5.2% -0.6% 0.0% 4.5% 11.1%Total periphery/CT1 capital 4.3% 8.2% 0.1% 0.6% 0.1% -3.7% 16.8% 6.7% -0.2% 0.0% 6.5% 16.0%
Source: EBA, Company data, UniCredit Research

25 October 2011 Credit Research
Sector Report
UniCredit Research page 20 See last pages for disclaimer.
Stress test results for Lloyds Banking Group CAPITALIZATION
Reported Baseline scenario Adverse scenario Figures in EUR mn 2010 2011 vs. 2010 2012 vs. 2010 2011 vs. 2010 2012 vs. 2010Net interest income 16,363 16,012 -2% 15,030 -8% 14,759 -10% 14,589 -11%Trading income 374 307 -18% 307 -18% 132 -65% 132 -65%
of which trading losses from stress scenarios n.a. -18 n.a. -18 n.a. -194 n.a. -194 n.a.of which valuation losses due to sovereign shock n.a. n.a. n.a. n.a. n.a. -30 n.a. -30 n.a.
Other operating income (incl. expenses) 8,161 4,158 -49% 7,409 -9% 4,114 -50% 7,336 -10%Operating profit before impairments 13,022 9,182 -29% 12,084 -7% 7,717 -41% 11,380 -13%Banking book impairments -15,313 -8,681 -43% -5,164 -66% -20,145 32% -11,399 -26%Operating profit after impairments and other losses -2,292 501 -122% 6,920 -402% -12,428 442% -19 -99%Other income 980 -1,679 -271% 1,097 12% 1,919 96% -646 -166%Net profit -1,938 -1,246 -36% 5,772 -398% -8,104 318% -653 -66%Risk-weighted assets 472,114 483,304 2% 484,176 3% 520,087 10% 548,300 16%Core Tier-1 capital 47,984 48,044 0% 53,127 11% 41,193 -14% 39,851 -17%CT1 ratio 10.2% 9.9% -0.2pp 11.0% 0.8pp 7.9% -2.2pp 7.3% -2.9ppCT1 ratio incl. committed measures until 30 Apr 11 10.2% 10.2% 0.0pp 11.7% 1.5pp 8.1% -2.1pp 7.7% -2.4ppAdditional capital needed to reach 5% CT1 ratio 0 0 n.m. 0 n.m. 0 n.m. 0 n.m.Supervisory recognized capital ratio n.a. 10.2% n.a. 11.7% n.a. 8.1% n.a. 7.7% n.a.Funding costs (bp) 143 n.a. n.a. n.a. n.a. 262 84% 368 158%
GEOGRAPHIC EXPOSURE BREAKDOWN
EUR mn as of Dec 2010 FI Corp Retail CRE Default Other Sov gross
Sov net Sov deriv
Sov indirect
Total net sov
Overall total
Austria 0 0 0 0 0 -1 1 1 0 0 1 0Belgium 0 0 0 0 0 -5 0 0 5 0 5 0Denmark 0 0 0 0 0 -2 2 2 0 0 2 0Finland 0 0 0 0 0 0 0 0 0 0 0 0France 0 0 0 0 0 -765 765 765 0 0 765 0Germany 0 0 0 0 0 -1,911 1,911 1,911 0 0 1,911 0Greece 0 0 0 0 0 0 0 0 0 0 0 0Ireland 0 0 0 0 0 0 0 0 0 0 0 0Italy 0 0 0 0 0 -17 32 32 0 -15 17 0Netherlands 0 0 0 0 0 0 0 0 0 0 0 0Norway 0 0 0 0 0 0 0 0 0 0 0 0Portugal 0 0 0 0 0 0 0 0 0 0 0 0Spain 0 0 0 0 0 -62 62 62 0 0 62 0Sweden 0 0 0 0 0 0 0 0 0 0 0 0United Kingdom 7,173 116,550 504,795 47,870 37,661 87,216 15,143 15,143 1 0 15,143 816,409Other EEA 0 0 0 0 0 -505 502 502 2 0 505 0United States 5,214 19,518 103 23 1,258 28,481 12,253 12,253 0 1 12,254 66,852Japan 0 0 0 0 0 0 0 0 0 0 0 0Other non EEA non Emerging 0 0 0 0 0 -498 2,043 499 -1 0 498 0Asia 0 0 0 0 0 -26 0 0 26 0 26 0Middle and South America 0 0 0 0 0 0 0 0 0 0 0 0Eastern Europe non EEA 0 0 0 0 0 0 0 0 0 0 0 0Others 16,846 45,872 24,780 8,345 18,366 47,244 0 0 0 0 0 161,452Total 29,233 181,940 529,679 56,238 57,285 159,149 32,715 31,171 32 -14 31,189 1,044,713Total Greece, Ireland, Portugal 0 0 0 0 0 0 0 0 0 0 0 0Share of FY10 CT1 capital 0.0% 0.0% 0.0% 0.0% 0.0% 0.0% 0.0% 0.0% 0.0% 0.0% 0.0% 0.0%Total Italy, Spain 0 0 0 0 0 -79 94 94 0 -15 79 0Share of FY10 CT1 capital 0.0% 0.0% 0.0% 0.0% 0.0% -0.2% 0.2% 0.2% 0.0% 0.0% 0.2% 0.0%Total periphery/CT1 capital 0.0% 0.0% 0.0% 0.0% 0.0% -0.2% 0.2% 0.2% 0.0% 0.0% 0.2% 0.0%
Source: EBA, Company data, UniCredit Research
25 October 2011 Credit Research
Sector Report
UniCredit Research page 21 See last pages for disclaimer.
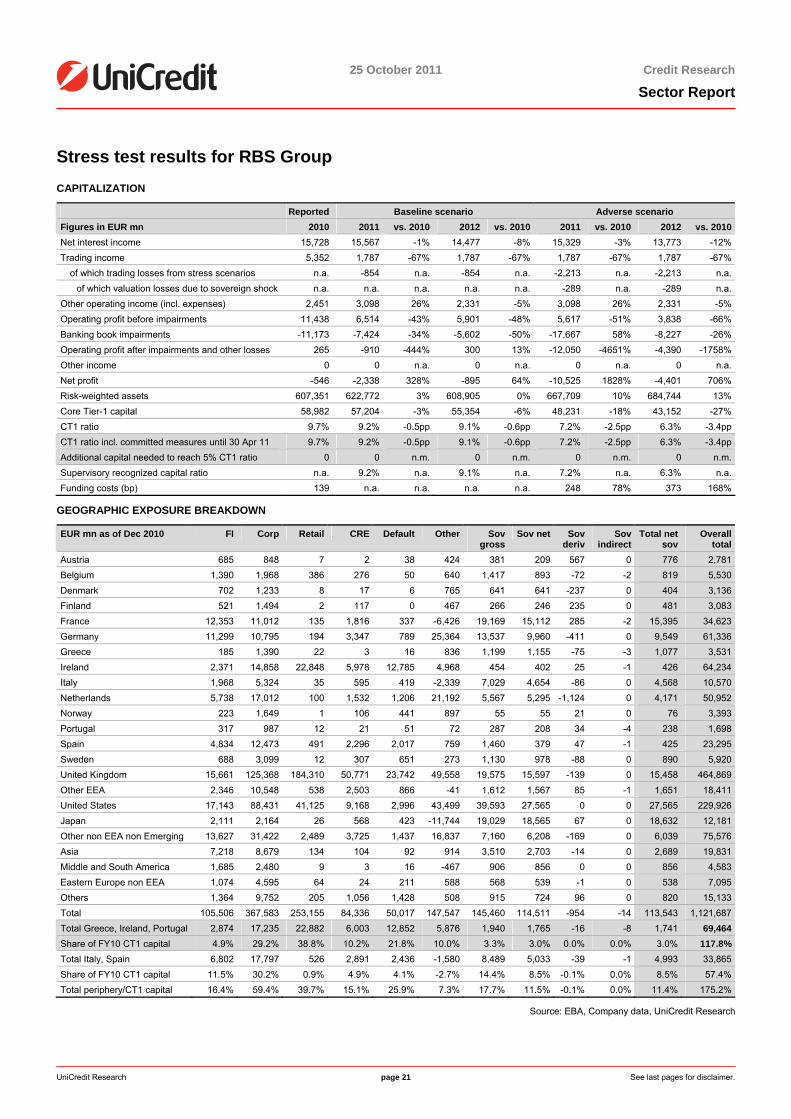
Stress test results for RBS Group CAPITALIZATION
Reported Baseline scenario Adverse scenario Figures in EUR mn 2010 2011 vs. 2010 2012 vs. 2010 2011 vs. 2010 2012 vs. 2010Net interest income 15,728 15,567 -1% 14,477 -8% 15,329 -3% 13,773 -12%Trading income 5,352 1,787 -67% 1,787 -67% 1,787 -67% 1,787 -67%
of which trading losses from stress scenarios n.a. -854 n.a. -854 n.a. -2,213 n.a. -2,213 n.a.of which valuation losses due to sovereign shock n.a. n.a. n.a. n.a. n.a. -289 n.a. -289 n.a.
Other operating income (incl. expenses) 2,451 3,098 26% 2,331 -5% 3,098 26% 2,331 -5%Operating profit before impairments 11,438 6,514 -43% 5,901 -48% 5,617 -51% 3,838 -66%Banking book impairments -11,173 -7,424 -34% -5,602 -50% -17,667 58% -8,227 -26%Operating profit after impairments and other losses 265 -910 -444% 300 13% -12,050 -4651% -4,390 -1758%Other income 0 0 n.a. 0 n.a. 0 n.a. 0 n.a.Net profit -546 -2,338 328% -895 64% -10,525 1828% -4,401 706%Risk-weighted assets 607,351 622,772 3% 608,905 0% 667,709 10% 684,744 13%Core Tier-1 capital 58,982 57,204 -3% 55,354 -6% 48,231 -18% 43,152 -27%CT1 ratio 9.7% 9.2% -0.5pp 9.1% -0.6pp 7.2% -2.5pp 6.3% -3.4ppCT1 ratio incl. committed measures until 30 Apr 11 9.7% 9.2% -0.5pp 9.1% -0.6pp 7.2% -2.5pp 6.3% -3.4ppAdditional capital needed to reach 5% CT1 ratio 0 0 n.m. 0 n.m. 0 n.m. 0 n.m.Supervisory recognized capital ratio n.a. 9.2% n.a. 9.1% n.a. 7.2% n.a. 6.3% n.a.Funding costs (bp) 139 n.a. n.a. n.a. n.a. 248 78% 373 168%
GEOGRAPHIC EXPOSURE BREAKDOWN
EUR mn as of Dec 2010 FI Corp Retail CRE Default Other Sov gross
Sov net Sov deriv
Sov indirect
Total net sov
Overall total
Austria 685 848 7 2 38 424 381 209 567 0 776 2,781Belgium 1,390 1,968 386 276 50 640 1,417 893 -72 -2 819 5,530Denmark 702 1,233 8 17 6 765 641 641 -237 0 404 3,136Finland 521 1,494 2 117 0 467 266 246 235 0 481 3,083France 12,353 11,012 135 1,816 337 -6,426 19,169 15,112 285 -2 15,395 34,623Germany 11,299 10,795 194 3,347 789 25,364 13,537 9,960 -411 0 9,549 61,336Greece 185 1,390 22 3 16 836 1,199 1,155 -75 -3 1,077 3,531Ireland 2,371 14,858 22,848 5,978 12,785 4,968 454 402 25 -1 426 64,234Italy 1,968 5,324 35 595 419 -2,339 7,029 4,654 -86 0 4,568 10,570Netherlands 5,738 17,012 100 1,532 1,206 21,192 5,567 5,295 -1,124 0 4,171 50,952Norway 223 1,649 1 106 441 897 55 55 21 0 76 3,393Portugal 317 987 12 21 51 72 287 208 34 -4 238 1,698Spain 4,834 12,473 491 2,296 2,017 759 1,460 379 47 -1 425 23,295Sweden 688 3,099 12 307 651 273 1,130 978 -88 0 890 5,920United Kingdom 15,661 125,368 184,310 50,771 23,742 49,558 19,575 15,597 -139 0 15,458 464,869Other EEA 2,346 10,548 538 2,503 866 -41 1,612 1,567 85 -1 1,651 18,411United States 17,143 88,431 41,125 9,168 2,996 43,499 39,593 27,565 0 0 27,565 229,926Japan 2,111 2,164 26 568 423 -11,744 19,029 18,565 67 0 18,632 12,181Other non EEA non Emerging 13,627 31,422 2,489 3,725 1,437 16,837 7,160 6,208 -169 0 6,039 75,576Asia 7,218 8,679 134 104 92 914 3,510 2,703 -14 0 2,689 19,831Middle and South America 1,685 2,480 9 3 16 -467 906 856 0 0 856 4,583Eastern Europe non EEA 1,074 4,595 64 24 211 588 568 539 -1 0 538 7,095Others 1,364 9,752 205 1,056 1,428 508 915 724 96 0 820 15,133Total 105,506 367,583 253,155 84,336 50,017 147,547 145,460 114,511 -954 -14 113,543 1,121,687Total Greece, Ireland, Portugal 2,874 17,235 22,882 6,003 12,852 5,876 1,940 1,765 -16 -8 1,741 69,464Share of FY10 CT1 capital 4.9% 29.2% 38.8% 10.2% 21.8% 10.0% 3.3% 3.0% 0.0% 0.0% 3.0% 117.8%Total Italy, Spain 6,802 17,797 526 2,891 2,436 -1,580 8,489 5,033 -39 -1 4,993 33,865Share of FY10 CT1 capital 11.5% 30.2% 0.9% 4.9% 4.1% -2.7% 14.4% 8.5% -0.1% 0.0% 8.5% 57.4%Total periphery/CT1 capital 16.4% 59.4% 39.7% 15.1% 25.9% 7.3% 17.7% 11.5% -0.1% 0.0% 11.4% 175.2%
Source: EBA, Company data, UniCredit Research
25 October 2011 Credit Research
Sector Report
UniCredit Research page 22 See last pages for disclaimer.
Regulation Overview Banking regulation in the UK is currently based on a three-pillar system consisting of
the Financial Services Authority (FSA), the Bank of England and HM Treasury. Together these three institutions are known as the UK Authorities. However, the three-pillar system will cease to exist by the end of 2012, with major responsibilities being shifted from the FSA to the Bank of England.
HM Treasury Her Majesty's Treasury (HM Treasury) is the British finance ministry. Led by the Chan-cellor of the Exchequer, it represents the political branch of the UK Authorities, with responsi-bility for the design of the overall legal and regulatory framework, which constrains and con-trols the operations of financial businesses within the UK.
Financial Services Authority (FSA)
The Financial Services Authority (FSA) regulates and supervises financial markets andfirms (including mortgage businesses, insurance companies, banks and building so-cieties) within a framework set by the British government through HM Treasury. The Financial Services and Markets Act 2000 provides the legal basis for FSA's operations. The FSA is an organization entirely funded by the institutions it supervises, yet it is still account-able to HM Treasury and to Parliament. The framework underlying FSA's regulatory activity isthe Advanced Risk-Responsive Operating Framework (ARROW), with its current form (AR-ROW II) having been introduced in 2006. Its methodology tries to asses the risk caused by single firms as well as sectors or even market risk. The FSA undertakes some basic risk as-sessment (overseeing the company's financial situation and compliance standards) for allfirms independent of the risk they bare for financial markets as a whole. In addition, the FSA maintains close contact to the management of firms, which bare a higher risk for financialmarkets. Furthermore, the FSA is responsible for preventing financial crimes, such as moneylaundering, fraud or market abuse. However, key competencies will be shifted from the FSA to the Bank of England as part of a reform of the British financial regulatory bodies.
The Bank of England The Bank of England's objective is to contribute to stability and soundness within the British financial system by monitoring financial institutions, overseeing payments, and functioning as a lender of last resort if needed. So, in comparison to the FSA, which fo-cuses on assessing the risk individual firms have on the financial system, the Bank of England screens financial and money markets as a whole for potential disruptions. The Bank of Eng-land is also responsible for ensuring the availability of funds for lending businesses and actsas a lender of last resort in times of crises.
Future developments The British government plans to undertake a reform of the financial sector regulatory body, which will shift competencies to the Bank of England and abolish the FSA. In-stead, a Financial Policy Committee (FPC) will be created within the Bank of England, which will be responsible for risk management in the financial sector from a macro point of view.Furthermore, a so-called Prudential Regulation Authority (PRA) will be established, with the task of assessing the soundness of financial institutions, including the assessment of their business models. Furthermore, a Financial Conduct Authority (FCA) will be created, ensuringproper conduct of financial service providers and protecting the interests of consumers. Thisreform aims at centralizing competencies and resources at the Bank of England in order to create a single institution, being able to control the financial system. According to HM Treas-ury, the new regulatory framework will take effect in late 2012.
Special Resolution Regime The Special Resolution Regime (SRR) gives the British financial authorities specialcompetences to deal with financial institutions that are in distress. The authorities can select from a wide range of possible measures taking into account the specific situation of the distressed institution. These measures include nationalizing banks for a limited amount of time, selling banks' assets or initiating insolvency proceedings. In order to put a bank under SRR, approval from all three UK authorities is needed, with HM Treasury being responsible for the potential nationalization of a bank's assets.
25 October 2011 Credit Research
Sector Report
UniCredit Research page 23 See last pages for disclaimer.
The UK Covered Bond Legislation UK covered bond legislation is in place since 2008 …
In March 2008, the UK covered bond legislation came into force and on 6 April 2011, HM Treasury and the FSA published its "Review of the UK's regulatory framework for cov-ered bonds". The legislation is a principle-based framework. Issuers of covered bonds can have their covered-bond programs registered with the Financial Services Authority (FSA) inorder to receive regulated covered bond status – but are not required to do so. The FSA pub-lishes the issuers of regulated covered bonds as well as a list of regulated covered bonds per issuer on their website (http://www.fsa.gov.uk/Pages/Register/rcb_register/index.shtml). Cur-rently, there are eleven issuers with regulated covered bonds in the UK: Abbey NationalTreasury Services, Bank of Scotland, Barclays, Clydesdale Bank, Coventry Building Society, HSBC Bank, Leeds Building Society, Lloyds TSB Bank, Nationwide Building Society, RoyalBank of Scotland, and Yorkshire Building Society.
… and was built around already existing programs
The UK covered bond legislation was built around already existing covered bond pro-grams and structures. Hence, certain elements of UK regulated covered bonds are alsosubject to common law, i.e. the segregation of assets via equitable assignment to a specialpurpose vehicle. The key elements of the UK covered bond legislation are:
Key aspects ■ Issuers: Issuance of covered bonds is restricted to UK authorized credit institutions.
■ Priority claim: The regulated covered bonds are direct, unconditional obligations of theissuer, but have also a priority claim over the cover pool in case of the insolvency of the is-suer.
■ Asset pool and eligible property: The definition of eligible assets is, in general, based on the CRD (Directive 2006/48/EC §68 of Annex VI), thus permitting residential and commer-cial mortgages, public sector loans, and shipping mortgages. However, in respect to publicsector debt, HMT limited exposures to Credit Step 1 bodies only (while the CRD also al-lows for Credit Step 2 bodies up to 20% of covered bonds). Social housing and loans re-lated to Public Partnership Projects, where these are secured by a public body with step-in rights, is explicitly mentioned as eligible property.
■ Use of RMBS/CMBS: The use of RMBS and of CMBS as collateral is defined narrower than in the CRD, limiting the range of eligible securities to residential real estate or com-mercial real estate exposures which were originated or acquired by the issuer, and only if the senior units have an AAA rating.
■ Regional scope: The regional scope of eligible property is restricted to property located inan EEA state, Switzerland, the US, Japan, Canada, Australia, New Zealand, the ChannelIslands or the Isle of Man.
■ Overcollateralization: UK legislation does not stipulate a minimum level of overcollaterali-zation, but requires sufficient collateral at all times. The level of overcollateralization is thussubject to the respective covered bond programs.
■ Register: A special record has to be kept of each asset in the asset pool.
■ Regular reporting: In order to ensure the quality of the cover pool, a report to the FSA isstipulated in the law. The issuer has to provide information regarding the assets in the rele-vant asset pool and the quality of these assets, as well as the capability of coverage, andtimely payment of claims. The frequency of reporting can be determined by the FSA.
25 October 2011 Credit Research
Sector Report
UniCredit Research page 24 See last pages for disclaimer.
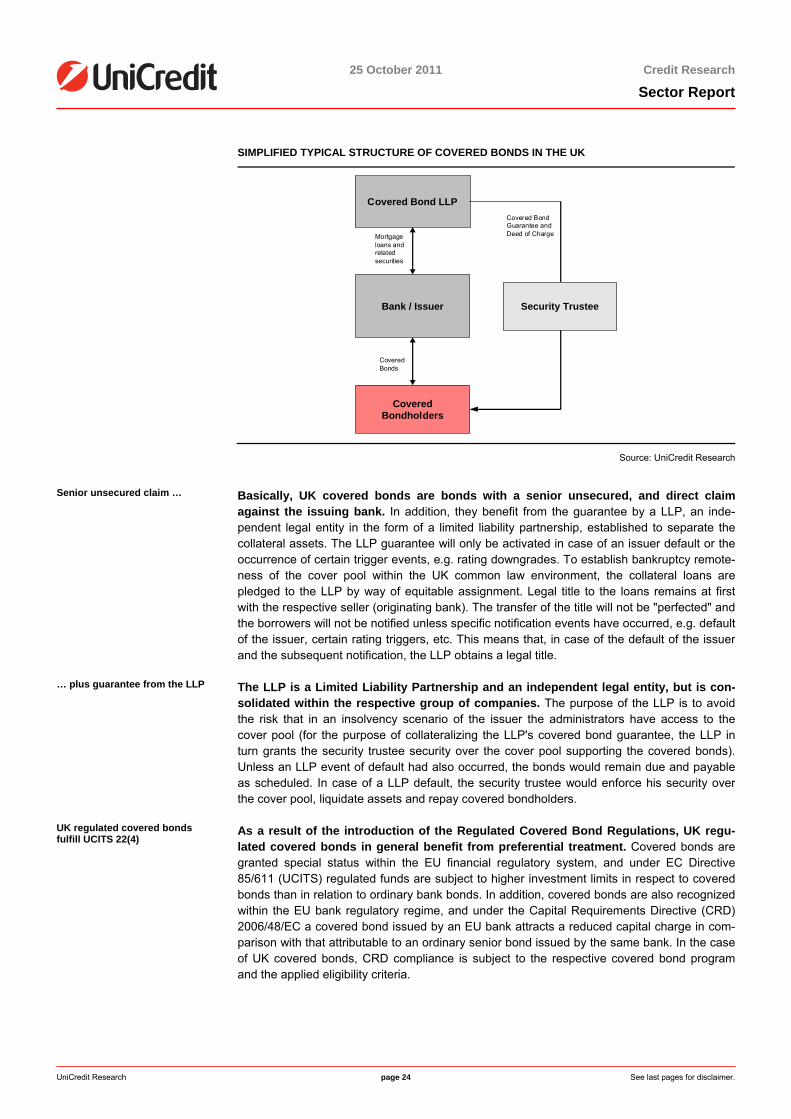
SIMPLIFIED TYPICAL STRUCTURE OF COVERED BONDS IN THE UK
Bank / Issuer
CoveredBondholders
Mortgage loans and related securities
Covered Bond LLP
Covered Bonds
Covered Bond Guarantee and Deed of Charge
Security Trustee
Source: UniCredit Research
Senior unsecured claim … Basically, UK covered bonds are bonds with a senior unsecured, and direct claim against the issuing bank. In addition, they benefit from the guarantee by a LLP, an inde-pendent legal entity in the form of a limited liability partnership, established to separate the collateral assets. The LLP guarantee will only be activated in case of an issuer default or theoccurrence of certain trigger events, e.g. rating downgrades. To establish bankruptcy remote-ness of the cover pool within the UK common law environment, the collateral loans arepledged to the LLP by way of equitable assignment. Legal title to the loans remains at firstwith the respective seller (originating bank). The transfer of the title will not be "perfected" andthe borrowers will not be notified unless specific notification events have occurred, e.g. defaultof the issuer, certain rating triggers, etc. This means that, in case of the default of the issuerand the subsequent notification, the LLP obtains a legal title.
… plus guarantee from the LLP The LLP is a Limited Liability Partnership and an independent legal entity, but is con-solidated within the respective group of companies. The purpose of the LLP is to avoid the risk that in an insolvency scenario of the issuer the administrators have access to the cover pool (for the purpose of collateralizing the LLP's covered bond guarantee, the LLP inturn grants the security trustee security over the cover pool supporting the covered bonds).Unless an LLP event of default had also occurred, the bonds would remain due and payableas scheduled. In case of a LLP default, the security trustee would enforce his security over the cover pool, liquidate assets and repay covered bondholders.
UK regulated covered bonds fulfill UCITS 22(4)
As a result of the introduction of the Regulated Covered Bond Regulations, UK regu-lated covered bonds in general benefit from preferential treatment. Covered bonds are granted special status within the EU financial regulatory system, and under EC Directive 85/611 (UCITS) regulated funds are subject to higher investment limits in respect to coveredbonds than in relation to ordinary bank bonds. In addition, covered bonds are also recognizedwithin the EU bank regulatory regime, and under the Capital Requirements Directive (CRD) 2006/48/EC a covered bond issued by an EU bank attracts a reduced capital charge in com-parison with that attributable to an ordinary senior bond issued by the same bank. In the caseof UK covered bonds, CRD compliance is subject to the respective covered bond program and the applied eligibility criteria.
25 October 2011 Credit Research
Sector Report
UniCredit Research page 25 See last pages for disclaimer.
Review of the regulatory framework
On 6 April, HM Treasury and the FSA published its "Review of the UK's regulatory framework for covered bonds". The Government and the regulator ask for feedback on the proposed changes to the UK Covered Bond Law until 1 July 2011. Following the consultation,it is intended to set out later in 2011 the final changes to the legislation which will then come into force at the end of 2012.
Key changes proposed In order to further strengthen the UK Covered Bond legislation and to increase the awareness of a prudential covered bond regulation, the following changes are proposed:
■ Designation of the regulated covered bond program to a specific collateral type, i.e. residential mortgages, commercial mortgages, public sector loans (including UK privatesector housing associations and public-private partnerships), or mixed collateral. Although the range of eligible assets according to the current legal framework is broader, UK issuersare currently only using residential mortgages in their programs. This could, however, change over time due to the dynamic structure of the pools. Thus, the changes target to make the identification of the underlying collateral more transparent to investors by clearlystating what kind of assets, e.g. residential or commercial mortgages are in the pool be-sides substitute collateral.
■ Exclusion of securitization as eligible assets. While the current legislation allows for the inclusion of securitization (as defined by the CRD), none of the issuers makes use of it. Inorder to draw a clear line between covered bonds and securitization, the proposal narrows down the definition of eligible assets and thus excludes securitizations from cover pools in the future.
■ Stipulation of a fixed minimum overcollateralization level. Although the level of over-collateralization (OC) has not been determined yet, the FSA acknowledged the European standard to implement a certain minimum OC by law. Although this minimum OC level willstill be significantly below the current OC levels, the levels required by the FSA stress test-ing, as well as below the levels required by rating agencies to achieve a triple A rating, itwill align the UK covered bond law with other European covered bond laws, e.g. the Ger-man legislation.
■ Introduction of an asset pool monitor. In order to provide an extra layer of control, issu-ers must appoint an independent asset monitor for each asset pool. The asset monitormust conduct a biannual inspection to ensure the compliance of the cover pool with regula-tions.
■ Transparency requirements in the form of investor reportings, including loan-level data. A frequently demanded implementation of transparency requirements into the legalframework (not just in the UK) will be included. Like in Germany, UK issuers will be obliged to report cover pool details on a quarterly basis with a high level of detailedness. While UKissuers already have a high degree of reporting standards (driven by to the monthly AssetCoverage Test), a common standard and the legal basis will add further confidence frominvestors, in our view.
■ The current structure of covered bond programs will be retained. Under the current regulations, the issuer (responsible for the payment of interest and principal) must set up aSpecial Purpose Vehicle (SPV) in order to transfer the collateral and effectively segregatethe cover pool from the issuer in case of insolvency. While the UK first considered to alsoallow an integrated model (with collateral staying directly on the balance sheet), the FSAdoes not intend to introduce an integrated model any longer.
Another good news for covered bonds was mentioned in the proposal: "the UK believes thatin the exercise of any bail-in powers, secured creditors’ rights to collateral should not be over-ridden". This is in line with our expectations for the overall covered bond landscape and fol-lows the German approach, to explicitly exclude covered bonds from any restructuring meas-ures, i.e. bail-in.
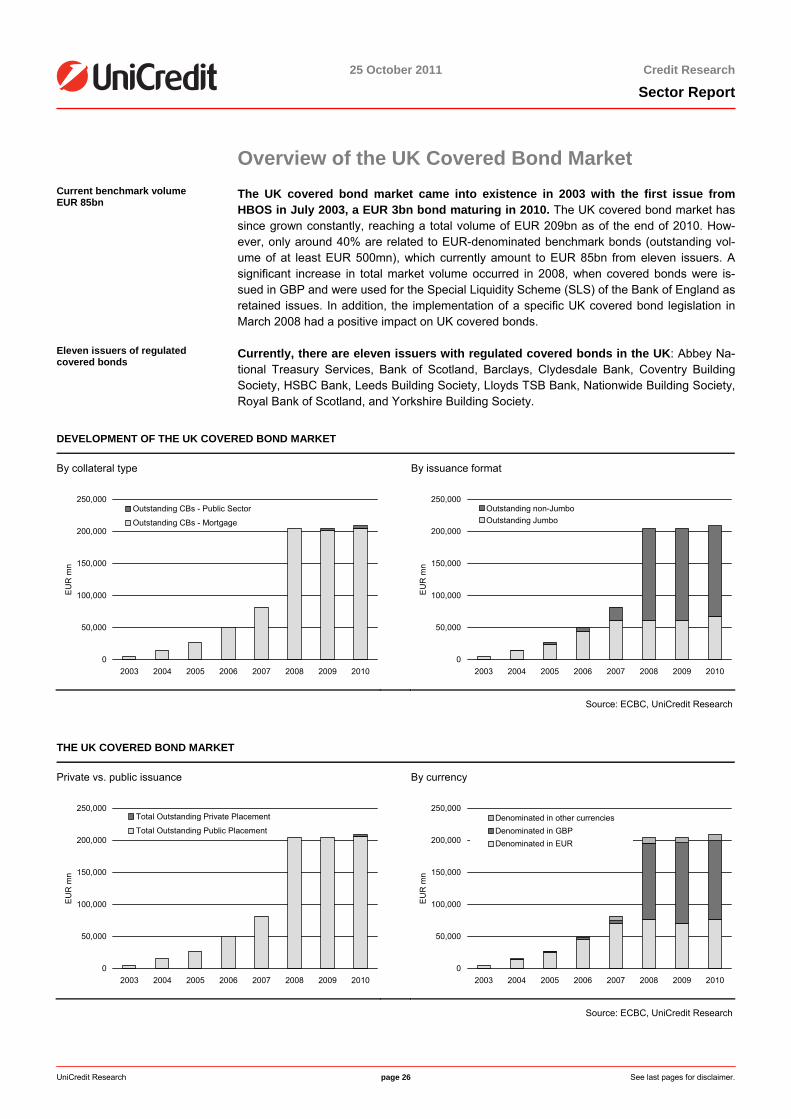
25 October 2011 Credit Research
Sector Report
UniCredit Research page 26 See last pages for disclaimer.
Overview of the UK Covered Bond Market Current benchmark volume EUR 85bn
The UK covered bond market came into existence in 2003 with the first issue from HBOS in July 2003, a EUR 3bn bond maturing in 2010. The UK covered bond market has since grown constantly, reaching a total volume of EUR 209bn as of the end of 2010. How-ever, only around 40% are related to EUR-denominated benchmark bonds (outstanding vol-ume of at least EUR 500mn), which currently amount to EUR 85bn from eleven issuers. Asignificant increase in total market volume occurred in 2008, when covered bonds were is-sued in GBP and were used for the Special Liquidity Scheme (SLS) of the Bank of England as retained issues. In addition, the implementation of a specific UK covered bond legislation inMarch 2008 had a positive impact on UK covered bonds.
Eleven issuers of regulated covered bonds
Currently, there are eleven issuers with regulated covered bonds in the UK: Abbey Na-tional Treasury Services, Bank of Scotland, Barclays, Clydesdale Bank, Coventry Building Society, HSBC Bank, Leeds Building Society, Lloyds TSB Bank, Nationwide Building Society,Royal Bank of Scotland, and Yorkshire Building Society.
DEVELOPMENT OF THE UK COVERED BOND MARKET
By collateral type By issuance format
0
50,000
100,000
150,000
200,000
250,000
2003 2004 2005 2006 2007 2008 2009 2010
EU
R m
n
Outstanding CBs - Public Sector
Outstanding CBs - Mortgage
0
50,000
100,000
150,000
200,000
250,000
2003 2004 2005 2006 2007 2008 2009 2010
EU
R m
n
Outstanding non-Jumbo Outstanding Jumbo
Source: ECBC, UniCredit Research
THE UK COVERED BOND MARKET
Private vs. public issuance By currency
0
50,000
100,000
150,000
200,000
250,000
2003 2004 2005 2006 2007 2008 2009 2010
EU
R m
n
Total Outstanding Private Placement
Total Outstanding Public Placement
0
50,000
100,000
150,000
200,000
250,000
2003 2004 2005 2006 2007 2008 2009 2010
EU
R m
n
Denominated in other currencies Denominated in GBPDenominated in EUR
Source: ECBC, UniCredit Research
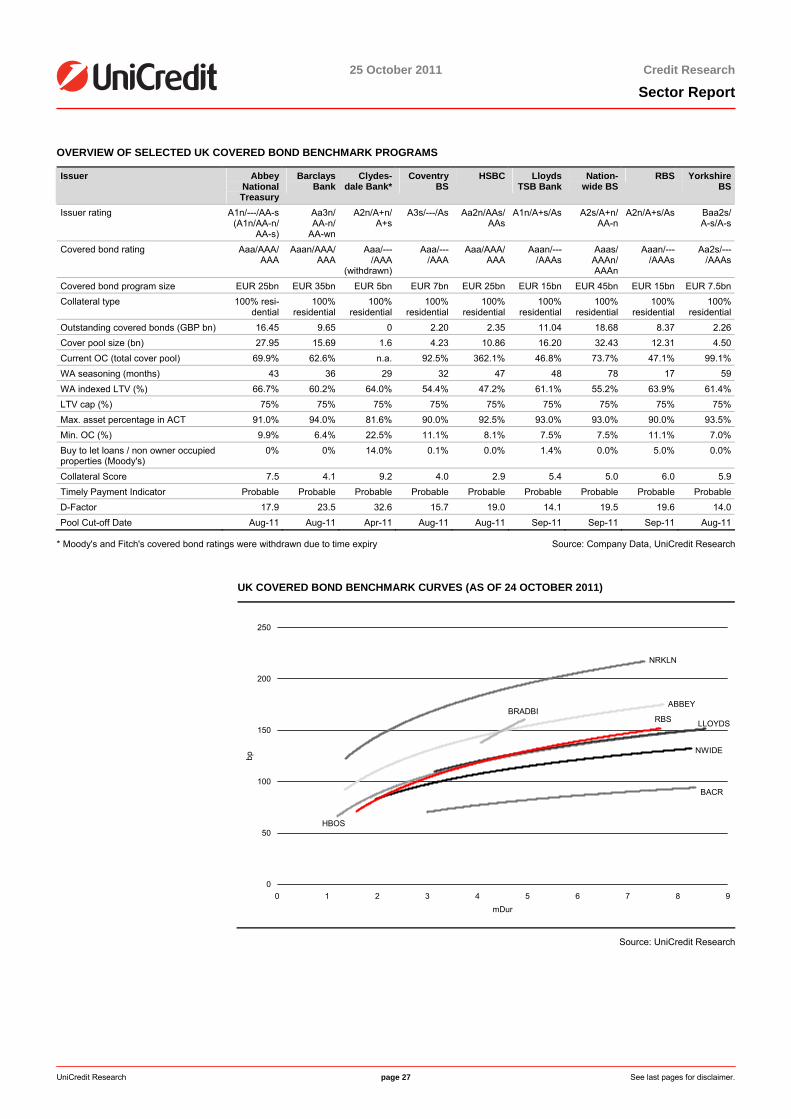
25 October 2011 Credit Research
Sector Report
UniCredit Research page 27 See last pages for disclaimer.
OVERVIEW OF SELECTED UK COVERED BOND BENCHMARK PROGRAMS
Issuer Abbey National Treasury
Barclays Bank
Clydes-dale Bank*
Coventry BS
HSBC Lloyds TSB Bank
Nation-wide BS
RBS Yorkshire BS
Issuer rating A1n/---/AA-s (A1n/AA-n/
AA-s)
Aa3n/AA-n/
AA-wn
A2n/A+n/A+s
A3s/---/As Aa2n/AAs/AAs
A1n/A+s/As A2s/A+n/ AA-n
A2n/A+s/As Baa2s/A-s/A-s
Covered bond rating Aaa/AAA/ AAA
Aaan/AAA/AAA
Aaa/---/AAA
(withdrawn)
Aaa/---/AAA
Aaa/AAA/AAA
Aaan/---/AAAs
Aaas/ AAAn/ AAAn
Aaan/---/AAAs
Aa2s/---/AAAs
Covered bond program size EUR 25bn EUR 35bn EUR 5bn EUR 7bn EUR 25bn EUR 15bn EUR 45bn EUR 15bn EUR 7.5bnCollateral type 100% resi-
dential 100%
residential100%
residential100%
residential100%
residential100%
residential 100%
residential 100%
residential100%
residentialOutstanding covered bonds (GBP bn) 16.45 9.65 0 2.20 2.35 11.04 18.68 8.37 2.26Cover pool size (bn) 27.95 15.69 1.6 4.23 10.86 16.20 32.43 12.31 4.50Current OC (total cover pool) 69.9% 62.6% n.a. 92.5% 362.1% 46.8% 73.7% 47.1% 99.1%WA seasoning (months) 43 36 29 32 47 48 78 17 59WA indexed LTV (%) 66.7% 60.2% 64.0% 54.4% 47.2% 61.1% 55.2% 63.9% 61.4%LTV cap (%) 75% 75% 75% 75% 75% 75% 75% 75% 75%Max. asset percentage in ACT 91.0% 94.0% 81.6% 90.0% 92.5% 93.0% 93.0% 90.0% 93.5%Min. OC (%) 9.9% 6.4% 22.5% 11.1% 8.1% 7.5% 7.5% 11.1% 7.0%Buy to let loans / non owner occupied properties (Moody's)
0% 0% 14.0% 0.1% 0.0% 1.4% 0.0% 5.0% 0.0%
Collateral Score 7.5 4.1 9.2 4.0 2.9 5.4 5.0 6.0 5.9Timely Payment Indicator Probable Probable Probable Probable Probable Probable Probable Probable ProbableD-Factor 17.9 23.5 32.6 15.7 19.0 14.1 19.5 19.6 14.0Pool Cut-off Date Aug-11 Aug-11 Apr-11 Aug-11 Aug-11 Sep-11 Sep-11 Sep-11 Aug-11
* Moody's and Fitch's covered bond ratings were withdrawn due to time expiry Source: Company Data, UniCredit Research
UK COVERED BOND BENCHMARK CURVES (AS OF 24 OCTOBER 2011)
ABBEY
BACR
BRADBI
HBOS
LLOYDS
NRKLN
NWIDE
RBS
0
50
100
150
200
250
0 1 2 3 4 5 6 7 8 9mDur
bp
Source: UniCredit Research
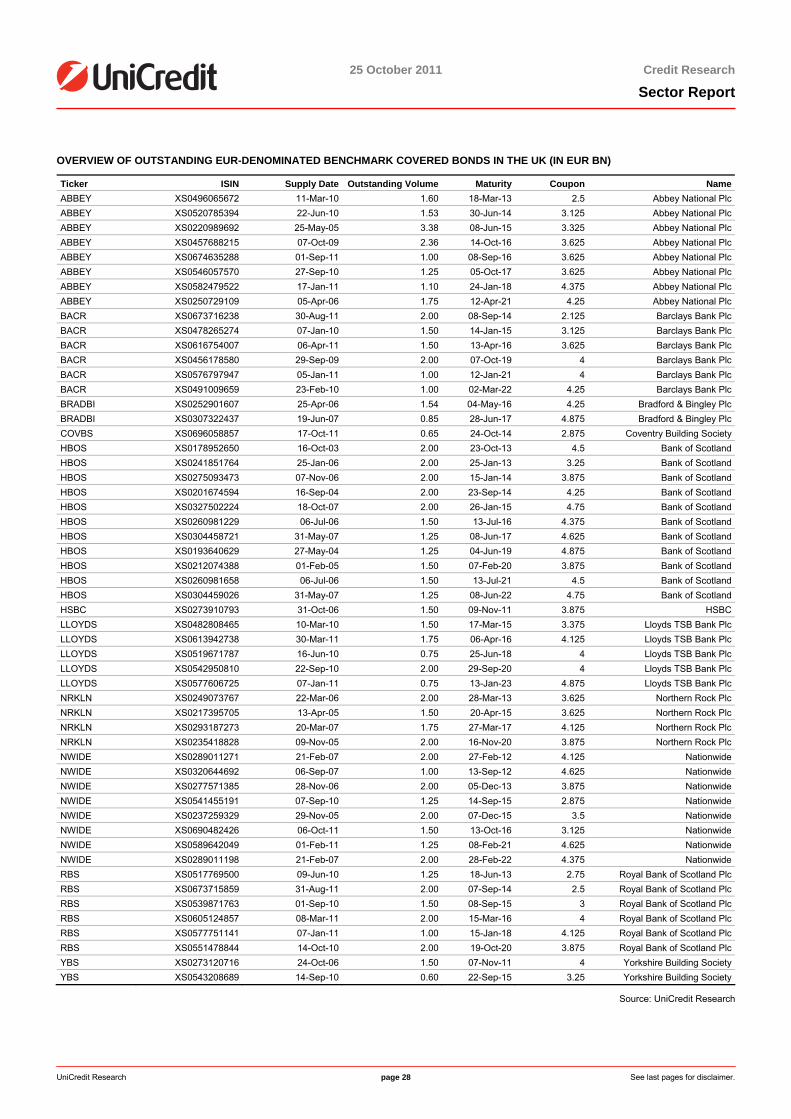
25 October 2011 Credit Research
Sector Report
UniCredit Research page 28 See last pages for disclaimer.
OVERVIEW OF OUTSTANDING EUR-DENOMINATED BENCHMARK COVERED BONDS IN THE UK (IN EUR BN)
Ticker ISIN Supply Date Outstanding Volume Maturity Coupon NameABBEY XS0496065672 11-Mar-10 1.60 18-Mar-13 2.5 Abbey National PlcABBEY XS0520785394 22-Jun-10 1.53 30-Jun-14 3.125 Abbey National PlcABBEY XS0220989692 25-May-05 3.38 08-Jun-15 3.325 Abbey National PlcABBEY XS0457688215 07-Oct-09 2.36 14-Oct-16 3.625 Abbey National PlcABBEY XS0674635288 01-Sep-11 1.00 08-Sep-16 3.625 Abbey National PlcABBEY XS0546057570 27-Sep-10 1.25 05-Oct-17 3.625 Abbey National PlcABBEY XS0582479522 17-Jan-11 1.10 24-Jan-18 4.375 Abbey National PlcABBEY XS0250729109 05-Apr-06 1.75 12-Apr-21 4.25 Abbey National PlcBACR XS0673716238 30-Aug-11 2.00 08-Sep-14 2.125 Barclays Bank PlcBACR XS0478265274 07-Jan-10 1.50 14-Jan-15 3.125 Barclays Bank PlcBACR XS0616754007 06-Apr-11 1.50 13-Apr-16 3.625 Barclays Bank PlcBACR XS0456178580 29-Sep-09 2.00 07-Oct-19 4 Barclays Bank PlcBACR XS0576797947 05-Jan-11 1.00 12-Jan-21 4 Barclays Bank PlcBACR XS0491009659 23-Feb-10 1.00 02-Mar-22 4.25 Barclays Bank PlcBRADBI XS0252901607 25-Apr-06 1.54 04-May-16 4.25 Bradford & Bingley PlcBRADBI XS0307322437 19-Jun-07 0.85 28-Jun-17 4.875 Bradford & Bingley PlcCOVBS XS0696058857 17-Oct-11 0.65 24-Oct-14 2.875 Coventry Building SocietyHBOS XS0178952650 16-Oct-03 2.00 23-Oct-13 4.5 Bank of ScotlandHBOS XS0241851764 25-Jan-06 2.00 25-Jan-13 3.25 Bank of ScotlandHBOS XS0275093473 07-Nov-06 2.00 15-Jan-14 3.875 Bank of ScotlandHBOS XS0201674594 16-Sep-04 2.00 23-Sep-14 4.25 Bank of ScotlandHBOS XS0327502224 18-Oct-07 2.00 26-Jan-15 4.75 Bank of ScotlandHBOS XS0260981229 06-Jul-06 1.50 13-Jul-16 4.375 Bank of ScotlandHBOS XS0304458721 31-May-07 1.25 08-Jun-17 4.625 Bank of ScotlandHBOS XS0193640629 27-May-04 1.25 04-Jun-19 4.875 Bank of ScotlandHBOS XS0212074388 01-Feb-05 1.50 07-Feb-20 3.875 Bank of ScotlandHBOS XS0260981658 06-Jul-06 1.50 13-Jul-21 4.5 Bank of ScotlandHBOS XS0304459026 31-May-07 1.25 08-Jun-22 4.75 Bank of ScotlandHSBC XS0273910793 31-Oct-06 1.50 09-Nov-11 3.875 HSBCLLOYDS XS0482808465 10-Mar-10 1.50 17-Mar-15 3.375 Lloyds TSB Bank PlcLLOYDS XS0613942738 30-Mar-11 1.75 06-Apr-16 4.125 Lloyds TSB Bank PlcLLOYDS XS0519671787 16-Jun-10 0.75 25-Jun-18 4 Lloyds TSB Bank PlcLLOYDS XS0542950810 22-Sep-10 2.00 29-Sep-20 4 Lloyds TSB Bank PlcLLOYDS XS0577606725 07-Jan-11 0.75 13-Jan-23 4.875 Lloyds TSB Bank PlcNRKLN XS0249073767 22-Mar-06 2.00 28-Mar-13 3.625 Northern Rock PlcNRKLN XS0217395705 13-Apr-05 1.50 20-Apr-15 3.625 Northern Rock PlcNRKLN XS0293187273 20-Mar-07 1.75 27-Mar-17 4.125 Northern Rock PlcNRKLN XS0235418828 09-Nov-05 2.00 16-Nov-20 3.875 Northern Rock PlcNWIDE XS0289011271 21-Feb-07 2.00 27-Feb-12 4.125 NationwideNWIDE XS0320644692 06-Sep-07 1.00 13-Sep-12 4.625 NationwideNWIDE XS0277571385 28-Nov-06 2.00 05-Dec-13 3.875 NationwideNWIDE XS0541455191 07-Sep-10 1.25 14-Sep-15 2.875 NationwideNWIDE XS0237259329 29-Nov-05 2.00 07-Dec-15 3.5 NationwideNWIDE XS0690482426 06-Oct-11 1.50 13-Oct-16 3.125 NationwideNWIDE XS0589642049 01-Feb-11 1.25 08-Feb-21 4.625 NationwideNWIDE XS0289011198 21-Feb-07 2.00 28-Feb-22 4.375 NationwideRBS XS0517769500 09-Jun-10 1.25 18-Jun-13 2.75 Royal Bank of Scotland PlcRBS XS0673715859 31-Aug-11 2.00 07-Sep-14 2.5 Royal Bank of Scotland PlcRBS XS0539871763 01-Sep-10 1.50 08-Sep-15 3 Royal Bank of Scotland PlcRBS XS0605124857 08-Mar-11 2.00 15-Mar-16 4 Royal Bank of Scotland PlcRBS XS0577751141 07-Jan-11 1.00 15-Jan-18 4.125 Royal Bank of Scotland PlcRBS XS0551478844 14-Oct-10 2.00 19-Oct-20 3.875 Royal Bank of Scotland PlcYBS XS0273120716 24-Oct-06 1.50 07-Nov-11 4 Yorkshire Building SocietyYBS XS0543208689 14-Sep-10 0.60 22-Sep-15 3.25 Yorkshire Building Society
Source: UniCredit Research
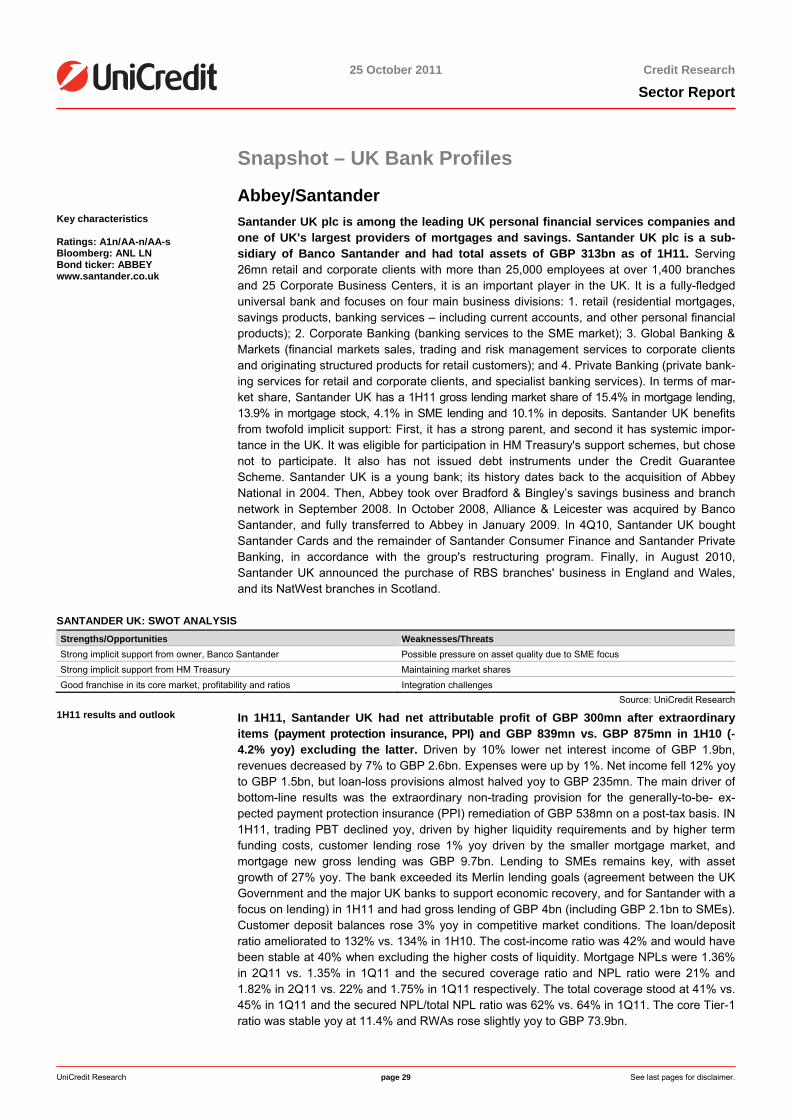
25 October 2011 Credit Research
Sector Report
UniCredit Research page 29 See last pages for disclaimer.
Snapshot – UK Bank Profiles
Abbey/Santander Key characteristics Ratings: A1n/AA-n/AA-s Bloomberg: ANL LN Bond ticker: ABBEY www.santander.co.uk
Santander UK plc is among the leading UK personal financial services companies and one of UK's largest providers of mortgages and savings. Santander UK plc is a sub-sidiary of Banco Santander and had total assets of GBP 313bn as of 1H11. Serving 26mn retail and corporate clients with more than 25,000 employees at over 1,400 branches and 25 Corporate Business Centers, it is an important player in the UK. It is a fully-fledged universal bank and focuses on four main business divisions: 1. retail (residential mortgages, savings products, banking services – including current accounts, and other personal financial products); 2. Corporate Banking (banking services to the SME market); 3. Global Banking & Markets (financial markets sales, trading and risk management services to corporate clientsand originating structured products for retail customers); and 4. Private Banking (private bank-ing services for retail and corporate clients, and specialist banking services). In terms of mar-ket share, Santander UK has a 1H11 gross lending market share of 15.4% in mortgage lending,13.9% in mortgage stock, 4.1% in SME lending and 10.1% in deposits. Santander UK benefits from twofold implicit support: First, it has a strong parent, and second it has systemic impor-tance in the UK. It was eligible for participation in HM Treasury's support schemes, but chose not to participate. It also has not issued debt instruments under the Credit Guarantee Scheme. Santander UK is a young bank; its history dates back to the acquisition of Abbey National in 2004. Then, Abbey took over Bradford & Bingley’s savings business and branch network in September 2008. In October 2008, Alliance & Leicester was acquired by BancoSantander, and fully transferred to Abbey in January 2009. In 4Q10, Santander UK bought Santander Cards and the remainder of Santander Consumer Finance and Santander Private Banking, in accordance with the group's restructuring program. Finally, in August 2010, Santander UK announced the purchase of RBS branches' business in England and Wales, and its NatWest branches in Scotland.
SANTANDER UK: SWOT ANALYSIS Strengths/Opportunities Weaknesses/Threats Strong implicit support from owner, Banco Santander Possible pressure on asset quality due to SME focus Strong implicit support from HM Treasury Maintaining market shares Good franchise in its core market, profitability and ratios Integration challenges
Source: UniCredit Research 1H11 results and outlook In 1H11, Santander UK had net attributable profit of GBP 300mn after extraordinary
items (payment protection insurance, PPI) and GBP 839mn vs. GBP 875mn in 1H10 (-4.2% yoy) excluding the latter. Driven by 10% lower net interest income of GBP 1.9bn, revenues decreased by 7% to GBP 2.6bn. Expenses were up by 1%. Net income fell 12% yoy to GBP 1.5bn, but loan-loss provisions almost halved yoy to GBP 235mn. The main driver of bottom-line results was the extraordinary non-trading provision for the generally-to-be- ex-pected payment protection insurance (PPI) remediation of GBP 538mn on a post-tax basis. IN 1H11, trading PBT declined yoy, driven by higher liquidity requirements and by higher term funding costs, customer lending rose 1% yoy driven by the smaller mortgage market, andmortgage new gross lending was GBP 9.7bn. Lending to SMEs remains key, with asset growth of 27% yoy. The bank exceeded its Merlin lending goals (agreement between the UK Government and the major UK banks to support economic recovery, and for Santander with a focus on lending) in 1H11 and had gross lending of GBP 4bn (including GBP 2.1bn to SMEs). Customer deposit balances rose 3% yoy in competitive market conditions. The loan/deposit ratio ameliorated to 132% vs. 134% in 1H10. The cost-income ratio was 42% and would have been stable at 40% when excluding the higher costs of liquidity. Mortgage NPLs were 1.36% in 2Q11 vs. 1.35% in 1Q11 and the secured coverage ratio and NPL ratio were 21% and1.82% in 2Q11 vs. 22% and 1.75% in 1Q11 respectively. The total coverage stood at 41% vs. 45% in 1Q11 and the secured NPL/total NPL ratio was 62% vs. 64% in 1Q11. The core Tier-1 ratio was stable yoy at 11.4% and RWAs rose slightly yoy to GBP 73.9bn.
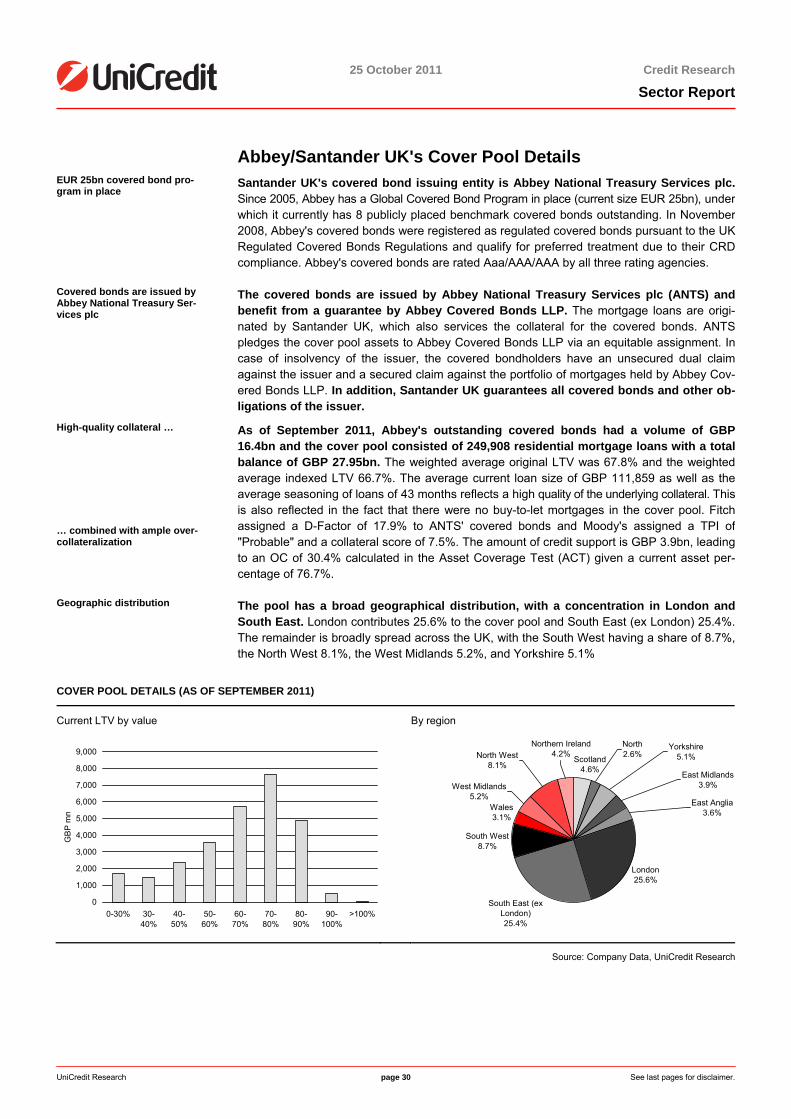
25 October 2011 Credit Research
Sector Report
UniCredit Research page 30 See last pages for disclaimer.
Abbey/Santander UK's Cover Pool Details EUR 25bn covered bond pro-gram in place
Santander UK's covered bond issuing entity is Abbey National Treasury Services plc.Since 2005, Abbey has a Global Covered Bond Program in place (current size EUR 25bn), under which it currently has 8 publicly placed benchmark covered bonds outstanding. In November 2008, Abbey's covered bonds were registered as regulated covered bonds pursuant to the UKRegulated Covered Bonds Regulations and qualify for preferred treatment due to their CRD compliance. Abbey's covered bonds are rated Aaa/AAA/AAA by all three rating agencies.
Covered bonds are issued by Abbey National Treasury Ser-vices plc
The covered bonds are issued by Abbey National Treasury Services plc (ANTS) andbenefit from a guarantee by Abbey Covered Bonds LLP. The mortgage loans are origi-nated by Santander UK, which also services the collateral for the covered bonds. ANTSpledges the cover pool assets to Abbey Covered Bonds LLP via an equitable assignment. Incase of insolvency of the issuer, the covered bondholders have an unsecured dual claimagainst the issuer and a secured claim against the portfolio of mortgages held by Abbey Cov-ered Bonds LLP. In addition, Santander UK guarantees all covered bonds and other ob-ligations of the issuer.
High-quality collateral … … combined with ample over-collateralization
As of September 2011, Abbey's outstanding covered bonds had a volume of GBP16.4bn and the cover pool consisted of 249,908 residential mortgage loans with a total balance of GBP 27.95bn. The weighted average original LTV was 67.8% and the weighted average indexed LTV 66.7%. The average current loan size of GBP 111,859 as well as theaverage seasoning of loans of 43 months reflects a high quality of the underlying collateral. This is also reflected in the fact that there were no buy-to-let mortgages in the cover pool. Fitch assigned a D-Factor of 17.9% to ANTS' covered bonds and Moody's assigned a TPI of"Probable" and a collateral score of 7.5%. The amount of credit support is GBP 3.9bn, leadingto an OC of 30.4% calculated in the Asset Coverage Test (ACT) given a current asset per-centage of 76.7%.
Geographic distribution The pool has a broad geographical distribution, with a concentration in London andSouth East. London contributes 25.6% to the cover pool and South East (ex London) 25.4%.The remainder is broadly spread across the UK, with the South West having a share of 8.7%,the North West 8.1%, the West Midlands 5.2%, and Yorkshire 5.1%
COVER POOL DETAILS (AS OF SEPTEMBER 2011)
Current LTV by value By region
0
1,000
2,000
3,000
4,000
5,000
6,000
7,000
8,000
9,000
0-30% 30-40%
40-50%
50-60%
60-70%
70-80%
80-90%
90-100%
>100%
GB
P m
n
Scotland4.6%
London25.6%
South East (ex London)25.4%
South West8.7%
Wales3.1%
West Midlands5.2%
North West8.1%
Northern Ireland4.2%
North2.6%
Yorkshire5.1%
East Midlands3.9%
East Anglia3.6%
Source: Company Data, UniCredit Research

25 October 2011 Credit Research
Sector Report
UniCredit Research page 31 See last pages for disclaimer.
Number Crunching
SANTANDER UK: P&L HIGHLIGHTS
Year ending (GBP mn) 30/06/2011 31/12/2010 31/12/2009 31/12/2008 31/12/2007 31/12/2006Net interest revenue 1,981 3,814 3,412 1,772 1,500 1,229Net fees & commissions 432 699 824 671 695 699Trading income 224 371 395 139 227 308Other operating income 30 -1 60 384 248 192Total revenues 2,667 4,883 4,691 2,966 2,670 2,428Operating expenses 1,859 2,197 2,164 1,562 1,574 1,698Loan-loss provisions 259 712 842 348 344 344Operating profit 549 2,086 1,690 1,054 752 386Other income/expenses 0 0 0 0 0 42Pretax profit 549 2,086 1,690 1,054 752 428Attributable net profit 413 1,544 1,190 811 685 68
SANTANDER UK: B/S HIGHLIGHTS
Year ending (GBP mn) 30/06/2011 31/12/2010 31/12/2009 31/12/2008 31/12/2007 31/12/2006Assets Liquid assets 80,095 67,124 52,583 50,972 72,689 65,444Customer loans 200,706 200,600 193,183 186,863 112,147 103,146Other assets 32,253 35,136 39,525 59,475 14,787 23,215Total assets 313,054 302,860 285,291 297,310 199,623 191,805Liabilities & equity Customer deposits 152,255 152,643 143,893 130,245 69,650 66,519Senior debt >1Y 50,596 42,858 38,570 49,297 43,250 37,149Subordinated debt 2,342 2,806 3,453 4,496 4,732 5,020Other liabilities 96,515 93,173 93,041 107,180 78,549 80,001Total equity 11,346 11,380 6,334 6,092 3,442 3,116Total liabilities & equity 313,054 302,860 285,291 297,310 199,623 191,805
SANTANDER UK: KEY RATIOS
Year ending (GBP mn) 30/06/2011 31/12/2010 31/12/2009 31/12/2008 31/12/2007 31/12/2006Profitability Net interest margin 1.49% 1.39% 1.21% 0.73% 0.79% 0.64%Cost/income ratio 69.7% 44.0% 46.1% 52.7% 59.0% 69.9%Return on average assets 0.3% 0.5% 0.4% 0.3% 0.4% 0.0%Return on average equity 8.3% 16.2% 17.9% 16.2% 20.9% 2.2%Liquidity Interbank ratio 209.2% 267.3% 430.8% 170.9% 43.4% 42.0%Loans/deposits 132.9% 132.5% 135.2% 144.2% 161.8% 155.9%Net loans/total assets 64.1% 66.2% 67.7% 62.9% 56.2% 53.8%Liquid assets/deposits & ST Fund-ing
47.2% 39.6% 33.1% 33.1% 93.7% 89.4%
Asset quality Loan loss reserves/gross loans 0.80% 0.82% 0.67% 0.53% 0.49% 0.52%NPL ratio 1.13% 1.14% 1.15% 0.61% 0.26% 0.80%NPL coverage 70.52% 71.65% 57.89% 87.65% 186.15% 64.89%Capital Tier-1 ratio 14.7% 14.8% 9.5% 8.5% 7.3% 8.0%Total capital ratio 20.4% 20.6% 17.6% 14.0% 11.4% 12.6%Equity/total assets 3.6% 3.8% 2.2% 2.1% 1.7% 1.6%
Source: BankScope, UniCredit Research
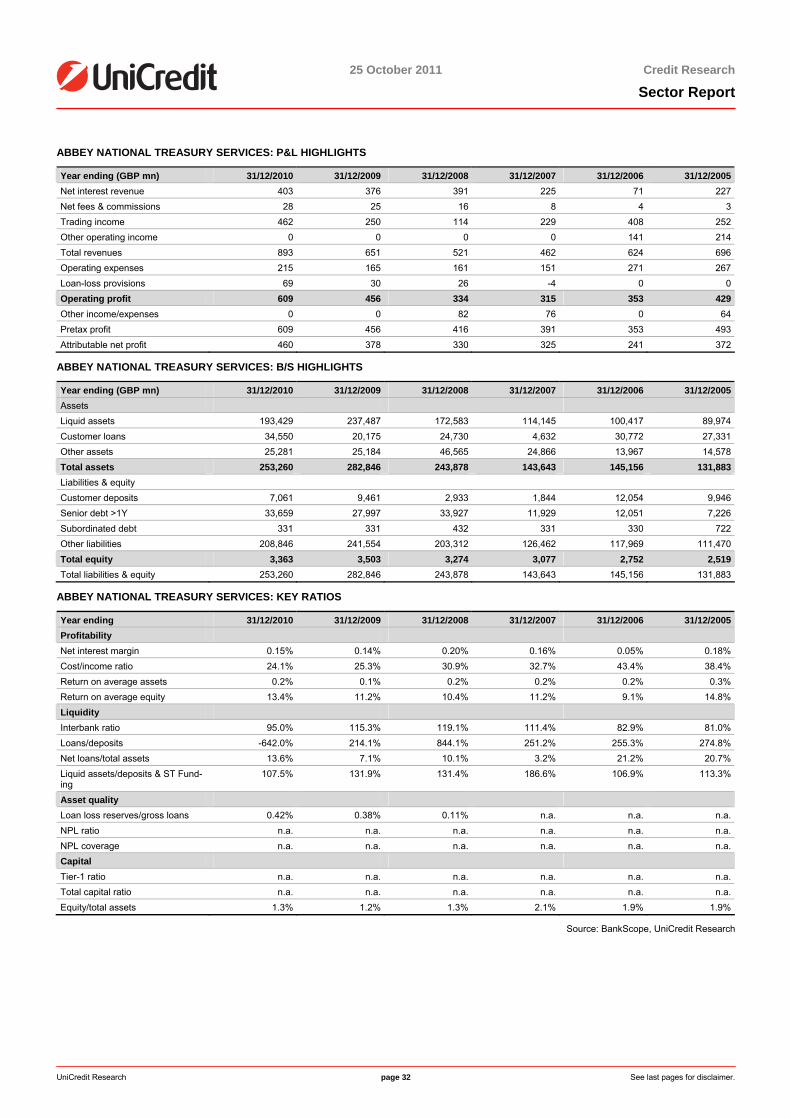
25 October 2011 Credit Research
Sector Report
UniCredit Research page 32 See last pages for disclaimer.
ABBEY NATIONAL TREASURY SERVICES: P&L HIGHLIGHTS
Year ending (GBP mn) 31/12/2010 31/12/2009 31/12/2008 31/12/2007 31/12/2006 31/12/2005Net interest revenue 403 376 391 225 71 227Net fees & commissions 28 25 16 8 4 3Trading income 462 250 114 229 408 252Other operating income 0 0 0 0 141 214Total revenues 893 651 521 462 624 696Operating expenses 215 165 161 151 271 267Loan-loss provisions 69 30 26 -4 0 0Operating profit 609 456 334 315 353 429Other income/expenses 0 0 82 76 0 64Pretax profit 609 456 416 391 353 493Attributable net profit 460 378 330 325 241 372
ABBEY NATIONAL TREASURY SERVICES: B/S HIGHLIGHTS
Year ending (GBP mn) 31/12/2010 31/12/2009 31/12/2008 31/12/2007 31/12/2006 31/12/2005Assets Liquid assets 193,429 237,487 172,583 114,145 100,417 89,974Customer loans 34,550 20,175 24,730 4,632 30,772 27,331Other assets 25,281 25,184 46,565 24,866 13,967 14,578Total assets 253,260 282,846 243,878 143,643 145,156 131,883Liabilities & equity Customer deposits 7,061 9,461 2,933 1,844 12,054 9,946Senior debt >1Y 33,659 27,997 33,927 11,929 12,051 7,226Subordinated debt 331 331 432 331 330 722Other liabilities 208,846 241,554 203,312 126,462 117,969 111,470Total equity 3,363 3,503 3,274 3,077 2,752 2,519Total liabilities & equity 253,260 282,846 243,878 143,643 145,156 131,883
ABBEY NATIONAL TREASURY SERVICES: KEY RATIOS
Year ending 31/12/2010 31/12/2009 31/12/2008 31/12/2007 31/12/2006 31/12/2005Profitability Net interest margin 0.15% 0.14% 0.20% 0.16% 0.05% 0.18%Cost/income ratio 24.1% 25.3% 30.9% 32.7% 43.4% 38.4%Return on average assets 0.2% 0.1% 0.2% 0.2% 0.2% 0.3%Return on average equity 13.4% 11.2% 10.4% 11.2% 9.1% 14.8%Liquidity Interbank ratio 95.0% 115.3% 119.1% 111.4% 82.9% 81.0%Loans/deposits -642.0% 214.1% 844.1% 251.2% 255.3% 274.8%Net loans/total assets 13.6% 7.1% 10.1% 3.2% 21.2% 20.7%Liquid assets/deposits & ST Fund-ing
107.5% 131.9% 131.4% 186.6% 106.9% 113.3%
Asset quality Loan loss reserves/gross loans 0.42% 0.38% 0.11% n.a. n.a. n.a.NPL ratio n.a. n.a. n.a. n.a. n.a. n.a.NPL coverage n.a. n.a. n.a. n.a. n.a. n.a.Capital Tier-1 ratio n.a. n.a. n.a. n.a. n.a. n.a.Total capital ratio n.a. n.a. n.a. n.a. n.a. n.a.Equity/total assets 1.3% 1.2% 1.3% 2.1% 1.9% 1.9%
Source: BankScope, UniCredit Research
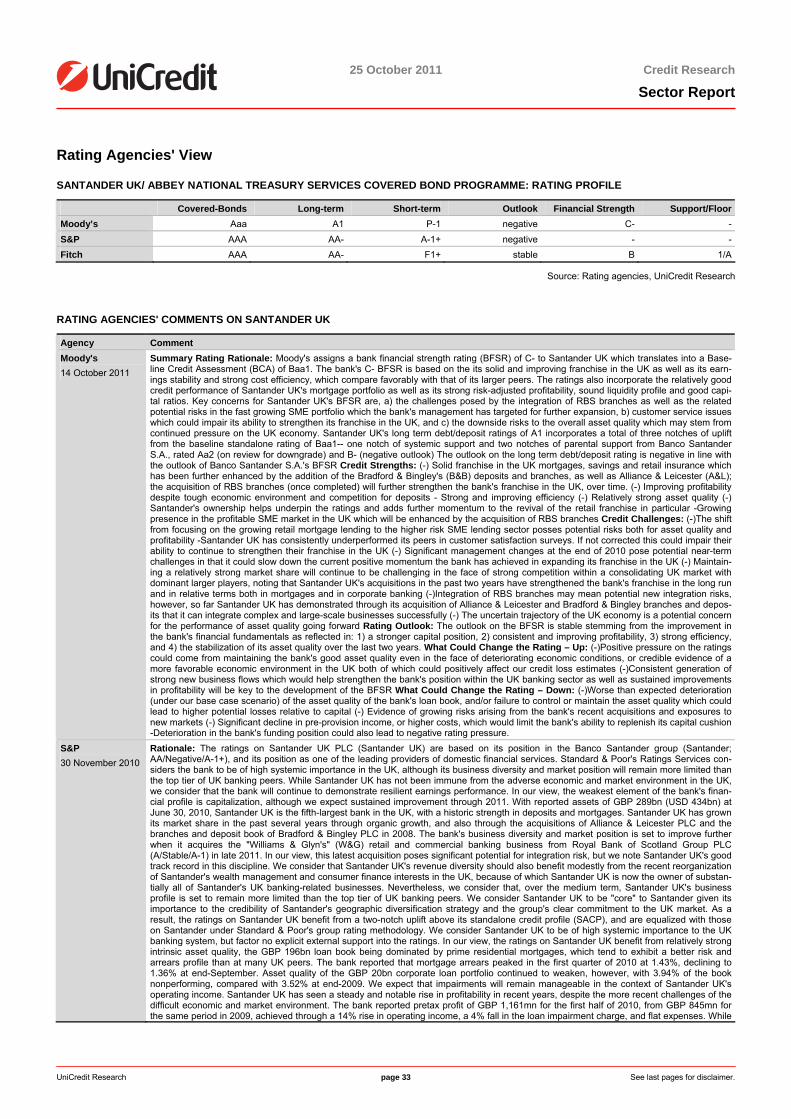
25 October 2011 Credit Research
Sector Report
UniCredit Research page 33 See last pages for disclaimer.
Rating Agencies' View
SANTANDER UK/ ABBEY NATIONAL TREASURY SERVICES COVERED BOND PROGRAMME: RATING PROFILE
Covered-Bonds Long-term Short-term Outlook Financial Strength Support/FloorMoody’s Aaa A1 P-1 negative C- -S&P AAA AA- A-1+ negative - -Fitch AAA AA- F1+ stable B 1/A
Source: Rating agencies, UniCredit Research
RATING AGENCIES' COMMENTS ON SANTANDER UK
Agency Comment Moody's 14 October 2011
Summary Rating Rationale: Moody's assigns a bank financial strength rating (BFSR) of C- to Santander UK which translates into a Base-line Credit Assessment (BCA) of Baa1. The bank's C- BFSR is based on the its solid and improving franchise in the UK as well as its earn-ings stability and strong cost efficiency, which compare favorably with that of its larger peers. The ratings also incorporate the relatively good credit performance of Santander UK's mortgage portfolio as well as its strong risk-adjusted profitability, sound liquidity profile and good capi-tal ratios. Key concerns for Santander UK's BFSR are, a) the challenges posed by the integration of RBS branches as well as the related potential risks in the fast growing SME portfolio which the bank's management has targeted for further expansion, b) customer service issues which could impair its ability to strengthen its franchise in the UK, and c) the downside risks to the overall asset quality which may stem from continued pressure on the UK economy. Santander UK's long term debt/deposit ratings of A1 incorporates a total of three notches of uplift from the baseline standalone rating of Baa1-- one notch of systemic support and two notches of parental support from Banco Santander S.A., rated Aa2 (on review for downgrade) and B- (negative outlook) The outlook on the long term debt/deposit rating is negative in line with the outlook of Banco Santander S.A.'s BFSR Credit Strengths: (-) Solid franchise in the UK mortgages, savings and retail insurance which has been further enhanced by the addition of the Bradford & Bingley's (B&B) deposits and branches, as well as Alliance & Leicester (A&L); the acquisition of RBS branches (once completed) will further strengthen the bank's franchise in the UK, over time. (-) Improving profitability despite tough economic environment and competition for deposits - Strong and improving efficiency (-) Relatively strong asset quality (-) Santander's ownership helps underpin the ratings and adds further momentum to the revival of the retail franchise in particular -Growing presence in the profitable SME market in the UK which will be enhanced by the acquisition of RBS branches Credit Challenges: (-)The shift from focusing on the growing retail mortgage lending to the higher risk SME lending sector posses potential risks both for asset quality and profitability -Santander UK has consistently underperformed its peers in customer satisfaction surveys. If not corrected this could impair their ability to continue to strengthen their franchise in the UK (-) Significant management changes at the end of 2010 pose potential near-term challenges in that it could slow down the current positive momentum the bank has achieved in expanding its franchise in the UK (-) Maintain-ing a relatively strong market share will continue to be challenging in the face of strong competition within a consolidating UK market with dominant larger players, noting that Santander UK's acquisitions in the past two years have strengthened the bank's franchise in the long run and in relative terms both in mortgages and in corporate banking (-)Integration of RBS branches may mean potential new integration risks, however, so far Santander UK has demonstrated through its acquisition of Alliance & Leicester and Bradford & Bingley branches and depos-its that it can integrate complex and large-scale businesses successfully (-) The uncertain trajectory of the UK economy is a potential concern for the performance of asset quality going forward Rating Outlook: The outlook on the BFSR is stable stemming from the improvement in the bank's financial fundamentals as reflected in: 1) a stronger capital position, 2) consistent and improving profitability, 3) strong efficiency, and 4) the stabilization of its asset quality over the last two years. What Could Change the Rating – Up: (-)Positive pressure on the ratings could come from maintaining the bank's good asset quality even in the face of deteriorating economic conditions, or credible evidence of a more favorable economic environment in the UK both of which could positively affect our credit loss estimates (-)Consistent generation of strong new business flows which would help strengthen the bank's position within the UK banking sector as well as sustained improvements in profitability will be key to the development of the BFSR What Could Change the Rating – Down: (-)Worse than expected deterioration (under our base case scenario) of the asset quality of the bank's loan book, and/or failure to control or maintain the asset quality which could lead to higher potential losses relative to capital (-) Evidence of growing risks arising from the bank's recent acquisitions and exposures to new markets (-) Significant decline in pre-provision income, or higher costs, which would limit the bank's ability to replenish its capital cushion -Deterioration in the bank's funding position could also lead to negative rating pressure.
S&P 30 November 2010
Rationale: The ratings on Santander UK PLC (Santander UK) are based on its position in the Banco Santander group (Santander; AA/Negative/A-1+), and its position as one of the leading providers of domestic financial services. Standard & Poor's Ratings Services con-siders the bank to be of high systemic importance in the UK, although its business diversity and market position will remain more limited than the top tier of UK banking peers. While Santander UK has not been immune from the adverse economic and market environment in the UK, we consider that the bank will continue to demonstrate resilient earnings performance. In our view, the weakest element of the bank's finan-cial profile is capitalization, although we expect sustained improvement through 2011. With reported assets of GBP 289bn (USD 434bn) at June 30, 2010, Santander UK is the fifth-largest bank in the UK, with a historic strength in deposits and mortgages. Santander UK has grown its market share in the past several years through organic growth, and also through the acquisitions of Alliance & Leicester PLC and the branches and deposit book of Bradford & Bingley PLC in 2008. The bank's business diversity and market position is set to improve further when it acquires the "Williams & Glyn's" (W&G) retail and commercial banking business from Royal Bank of Scotland Group PLC (A/Stable/A-1) in late 2011. In our view, this latest acquisition poses significant potential for integration risk, but we note Santander UK's good track record in this discipline. We consider that Santander UK's revenue diversity should also benefit modestly from the recent reorganization of Santander's wealth management and consumer finance interests in the UK, because of which Santander UK is now the owner of substan-tially all of Santander's UK banking-related businesses. Nevertheless, we consider that, over the medium term, Santander UK's business profile is set to remain more limited than the top tier of UK banking peers. We consider Santander UK to be "core" to Santander given its importance to the credibility of Santander's geographic diversification strategy and the group's clear commitment to the UK market. As a result, the ratings on Santander UK benefit from a two-notch uplift above its standalone credit profile (SACP), and are equalized with those on Santander under Standard & Poor's group rating methodology. We consider Santander UK to be of high systemic importance to the UK banking system, but factor no explicit external support into the ratings. In our view, the ratings on Santander UK benefit from relatively strong intrinsic asset quality, the GBP 196bn loan book being dominated by prime residential mortgages, which tend to exhibit a better risk and arrears profile than at many UK peers. The bank reported that mortgage arrears peaked in the first quarter of 2010 at 1.43%, declining to 1.36% at end-September. Asset quality of the GBP 20bn corporate loan portfolio continued to weaken, however, with 3.94% of the book nonperforming, compared with 3.52% at end-2009. We expect that impairments will remain manageable in the context of Santander UK's operating income. Santander UK has seen a steady and notable rise in profitability in recent years, despite the more recent challenges of the difficult economic and market environment. The bank reported pretax profit of GBP 1,161mn for the first half of 2010, from GBP 845mn for the same period in 2009, achieved through a 14% rise in operating income, a 4% fall in the loan impairment charge, and flat expenses. While
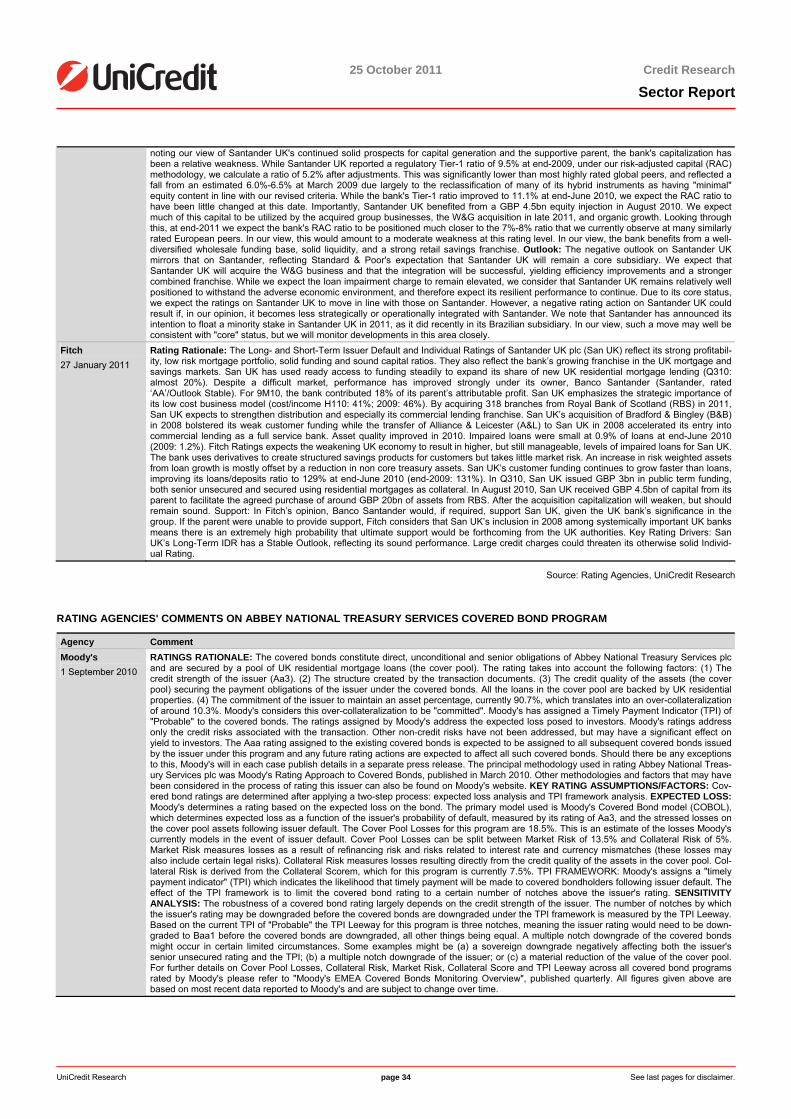
25 October 2011 Credit Research
Sector Report
UniCredit Research page 34 See last pages for disclaimer.
noting our view of Santander UK's continued solid prospects for capital generation and the supportive parent, the bank's capitalization has been a relative weakness. While Santander UK reported a regulatory Tier-1 ratio of 9.5% at end-2009, under our risk-adjusted capital (RAC) methodology, we calculate a ratio of 5.2% after adjustments. This was significantly lower than most highly rated global peers, and reflected a fall from an estimated 6.0%-6.5% at March 2009 due largely to the reclassification of many of its hybrid instruments as having "minimal" equity content in line with our revised criteria. While the bank's Tier-1 ratio improved to 11.1% at end-June 2010, we expect the RAC ratio to have been little changed at this date. Importantly, Santander UK benefited from a GBP 4.5bn equity injection in August 2010. We expect much of this capital to be utilized by the acquired group businesses, the W&G acquisition in late 2011, and organic growth. Looking through this, at end-2011 we expect the bank's RAC ratio to be positioned much closer to the 7%-8% ratio that we currently observe at many similarly rated European peers. In our view, this would amount to a moderate weakness at this rating level. In our view, the bank benefits from a well-diversified wholesale funding base, solid liquidity, and a strong retail savings franchise. Outlook: The negative outlook on Santander UK mirrors that on Santander, reflecting Standard & Poor's expectation that Santander UK will remain a core subsidiary. We expect that Santander UK will acquire the W&G business and that the integration will be successful, yielding efficiency improvements and a stronger combined franchise. While we expect the loan impairment charge to remain elevated, we consider that Santander UK remains relatively well positioned to withstand the adverse economic environment, and therefore expect its resilient performance to continue. Due to its core status, we expect the ratings on Santander UK to move in line with those on Santander. However, a negative rating action on Santander UK could result if, in our opinion, it becomes less strategically or operationally integrated with Santander. We note that Santander has announced its intention to float a minority stake in Santander UK in 2011, as it did recently in its Brazilian subsidiary. In our view, such a move may well be consistent with "core" status, but we will monitor developments in this area closely.
Fitch 27 January 2011
Rating Rationale: The Long- and Short-Term Issuer Default and Individual Ratings of Santander UK plc (San UK) reflect its strong profitabil-ity, low risk mortgage portfolio, solid funding and sound capital ratios. They also reflect the bank’s growing franchise in the UK mortgage and savings markets. San UK has used ready access to funding steadily to expand its share of new UK residential mortgage lending (Q310: almost 20%). Despite a difficult market, performance has improved strongly under its owner, Banco Santander (Santander, rated ‘AA’/Outlook Stable). For 9M10, the bank contributed 18% of its parent’s attributable profit. San UK emphasizes the strategic importance of its low cost business model (cost/income H110: 41%; 2009: 46%). By acquiring 318 branches from Royal Bank of Scotland (RBS) in 2011, San UK expects to strengthen distribution and especially its commercial lending franchise. San UK’s acquisition of Bradford & Bingley (B&B) in 2008 bolstered its weak customer funding while the transfer of Alliance & Leicester (A&L) to San UK in 2008 accelerated its entry into commercial lending as a full service bank. Asset quality improved in 2010. Impaired loans were small at 0.9% of loans at end-June 2010 (2009: 1.2%). Fitch Ratings expects the weakening UK economy to result in higher, but still manageable, levels of impaired loans for San UK. The bank uses derivatives to create structured savings products for customers but takes little market risk. An increase in risk weighted assets from loan growth is mostly offset by a reduction in non core treasury assets. San UK’s customer funding continues to grow faster than loans, improving its loans/deposits ratio to 129% at end-June 2010 (end-2009: 131%). In Q310, San UK issued GBP 3bn in public term funding, both senior unsecured and secured using residential mortgages as collateral. In August 2010, San UK received GBP 4.5bn of capital from its parent to facilitate the agreed purchase of around GBP 20bn of assets from RBS. After the acquisition capitalization will weaken, but should remain sound. Support: In Fitch’s opinion, Banco Santander would, if required, support San UK, given the UK bank’s significance in the group. If the parent were unable to provide support, Fitch considers that San UK’s inclusion in 2008 among systemically important UK banks means there is an extremely high probability that ultimate support would be forthcoming from the UK authorities. Key Rating Drivers: San UK’s Long-Term IDR has a Stable Outlook, reflecting its sound performance. Large credit charges could threaten its otherwise solid Individ-ual Rating.
Source: Rating Agencies, UniCredit Research
RATING AGENCIES' COMMENTS ON ABBEY NATIONAL TREASURY SERVICES COVERED BOND PROGRAM
Agency Comment Moody's 1 September 2010
RATINGS RATIONALE: The covered bonds constitute direct, unconditional and senior obligations of Abbey National Treasury Services plc and are secured by a pool of UK residential mortgage loans (the cover pool). The rating takes into account the following factors: (1) The credit strength of the issuer (Aa3). (2) The structure created by the transaction documents. (3) The credit quality of the assets (the cover pool) securing the payment obligations of the issuer under the covered bonds. All the loans in the cover pool are backed by UK residential properties. (4) The commitment of the issuer to maintain an asset percentage, currently 90.7%, which translates into an over-collateralization of around 10.3%. Moody's considers this over-collateralization to be "committed". Moody's has assigned a Timely Payment Indicator (TPI) of "Probable" to the covered bonds. The ratings assigned by Moody's address the expected loss posed to investors. Moody's ratings address only the credit risks associated with the transaction. Other non-credit risks have not been addressed, but may have a significant effect on yield to investors. The Aaa rating assigned to the existing covered bonds is expected to be assigned to all subsequent covered bonds issued by the issuer under this program and any future rating actions are expected to affect all such covered bonds. Should there be any exceptions to this, Moody's will in each case publish details in a separate press release. The principal methodology used in rating Abbey National Treas-ury Services plc was Moody's Rating Approach to Covered Bonds, published in March 2010. Other methodologies and factors that may have been considered in the process of rating this issuer can also be found on Moody's website. KEY RATING ASSUMPTIONS/FACTORS: Cov-ered bond ratings are determined after applying a two-step process: expected loss analysis and TPI framework analysis. EXPECTED LOSS: Moody's determines a rating based on the expected loss on the bond. The primary model used is Moody's Covered Bond model (COBOL), which determines expected loss as a function of the issuer's probability of default, measured by its rating of Aa3, and the stressed losses on the cover pool assets following issuer default. The Cover Pool Losses for this program are 18.5%. This is an estimate of the losses Moody's currently models in the event of issuer default. Cover Pool Losses can be split between Market Risk of 13.5% and Collateral Risk of 5%. Market Risk measures losses as a result of refinancing risk and risks related to interest rate and currency mismatches (these losses may also include certain legal risks). Collateral Risk measures losses resulting directly from the credit quality of the assets in the cover pool. Col-lateral Risk is derived from the Collateral Scorem, which for this program is currently 7.5%. TPI FRAMEWORK: Moody's assigns a "timely payment indicator" (TPI) which indicates the likelihood that timely payment will be made to covered bondholders following issuer default. The effect of the TPI framework is to limit the covered bond rating to a certain number of notches above the issuer's rating. SENSITIVITY ANALYSIS: The robustness of a covered bond rating largely depends on the credit strength of the issuer. The number of notches by which the issuer's rating may be downgraded before the covered bonds are downgraded under the TPI framework is measured by the TPI Leeway. Based on the current TPI of "Probable" the TPI Leeway for this program is three notches, meaning the issuer rating would need to be down-graded to Baa1 before the covered bonds are downgraded, all other things being equal. A multiple notch downgrade of the covered bonds might occur in certain limited circumstances. Some examples might be (a) a sovereign downgrade negatively affecting both the issuer's senior unsecured rating and the TPI; (b) a multiple notch downgrade of the issuer; or (c) a material reduction of the value of the cover pool. For further details on Cover Pool Losses, Collateral Risk, Market Risk, Collateral Score and TPI Leeway across all covered bond programs rated by Moody's please refer to "Moody's EMEA Covered Bonds Monitoring Overview", published quarterly. All figures given above are based on most recent data reported to Moody's and are subject to change over time.
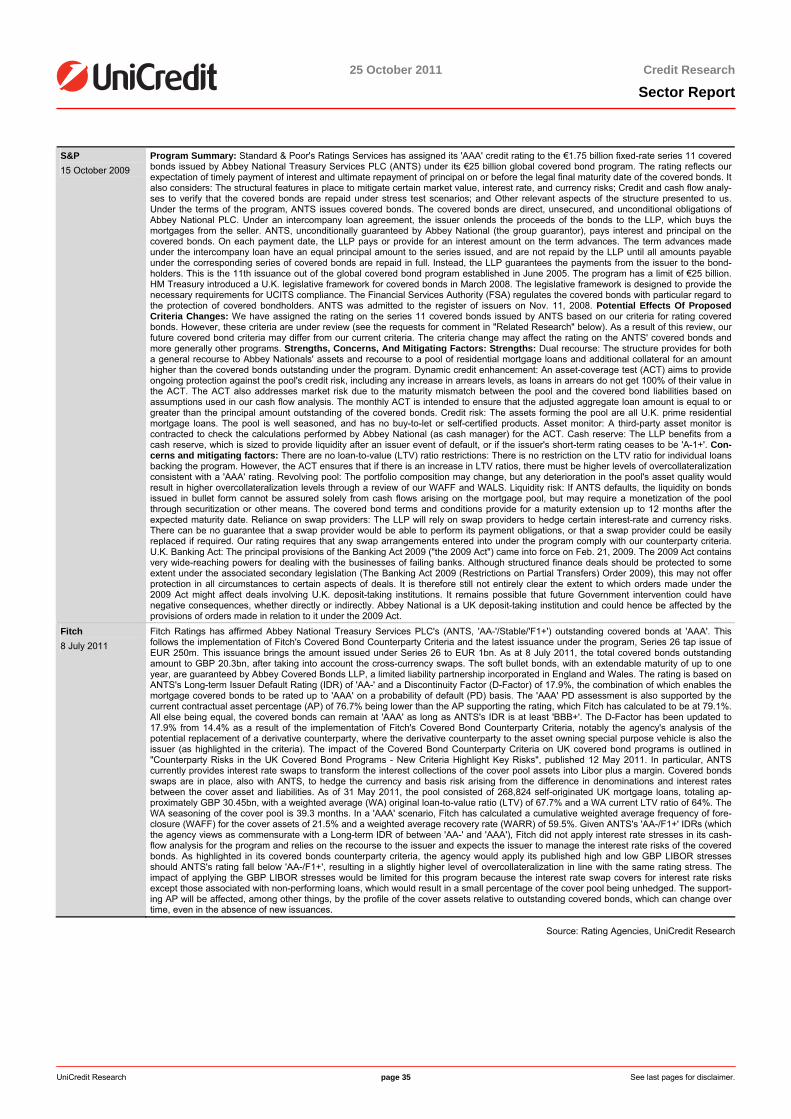
25 October 2011 Credit Research
Sector Report
UniCredit Research page 35 See last pages for disclaimer.
S&P 15 October 2009
Program Summary: Standard & Poor's Ratings Services has assigned its 'AAA' credit rating to the €1.75 billion fixed-rate series 11 covered bonds issued by Abbey National Treasury Services PLC (ANTS) under its €25 billion global covered bond program. The rating reflects our expectation of timely payment of interest and ultimate repayment of principal on or before the legal final maturity date of the covered bonds. It also considers: The structural features in place to mitigate certain market value, interest rate, and currency risks; Credit and cash flow analy-ses to verify that the covered bonds are repaid under stress test scenarios; and Other relevant aspects of the structure presented to us. Under the terms of the program, ANTS issues covered bonds. The covered bonds are direct, unsecured, and unconditional obligations of Abbey National PLC. Under an intercompany loan agreement, the issuer onlends the proceeds of the bonds to the LLP, which buys the mortgages from the seller. ANTS, unconditionally guaranteed by Abbey National (the group guarantor), pays interest and principal on the covered bonds. On each payment date, the LLP pays or provide for an interest amount on the term advances. The term advances made under the intercompany loan have an equal principal amount to the series issued, and are not repaid by the LLP until all amounts payable under the corresponding series of covered bonds are repaid in full. Instead, the LLP guarantees the payments from the issuer to the bond-holders. This is the 11th issuance out of the global covered bond program established in June 2005. The program has a limit of €25 billion. HM Treasury introduced a U.K. legislative framework for covered bonds in March 2008. The legislative framework is designed to provide the necessary requirements for UCITS compliance. The Financial Services Authority (FSA) regulates the covered bonds with particular regard to the protection of covered bondholders. ANTS was admitted to the register of issuers on Nov. 11, 2008. Potential Effects Of Proposed Criteria Changes: We have assigned the rating on the series 11 covered bonds issued by ANTS based on our criteria for rating covered bonds. However, these criteria are under review (see the requests for comment in "Related Research" below). As a result of this review, our future covered bond criteria may differ from our current criteria. The criteria change may affect the rating on the ANTS' covered bonds and more generally other programs. Strengths, Concerns, And Mitigating Factors: Strengths: Dual recourse: The structure provides for both a general recourse to Abbey Nationals' assets and recourse to a pool of residential mortgage loans and additional collateral for an amount higher than the covered bonds outstanding under the program. Dynamic credit enhancement: An asset-coverage test (ACT) aims to provide ongoing protection against the pool's credit risk, including any increase in arrears levels, as loans in arrears do not get 100% of their value in the ACT. The ACT also addresses market risk due to the maturity mismatch between the pool and the covered bond liabilities based on assumptions used in our cash flow analysis. The monthly ACT is intended to ensure that the adjusted aggregate loan amount is equal to or greater than the principal amount outstanding of the covered bonds. Credit risk: The assets forming the pool are all U.K. prime residential mortgage loans. The pool is well seasoned, and has no buy-to-let or self-certified products. Asset monitor: A third-party asset monitor is contracted to check the calculations performed by Abbey National (as cash manager) for the ACT. Cash reserve: The LLP benefits from a cash reserve, which is sized to provide liquidity after an issuer event of default, or if the issuer's short-term rating ceases to be 'A-1+'. Con-cerns and mitigating factors: There are no loan-to-value (LTV) ratio restrictions: There is no restriction on the LTV ratio for individual loans backing the program. However, the ACT ensures that if there is an increase in LTV ratios, there must be higher levels of overcollateralization consistent with a 'AAA' rating. Revolving pool: The portfolio composition may change, but any deterioration in the pool's asset quality would result in higher overcollateralization levels through a review of our WAFF and WALS. Liquidity risk: If ANTS defaults, the liquidity on bonds issued in bullet form cannot be assured solely from cash flows arising on the mortgage pool, but may require a monetization of the pool through securitization or other means. The covered bond terms and conditions provide for a maturity extension up to 12 months after the expected maturity date. Reliance on swap providers: The LLP will rely on swap providers to hedge certain interest-rate and currency risks. There can be no guarantee that a swap provider would be able to perform its payment obligations, or that a swap provider could be easily replaced if required. Our rating requires that any swap arrangements entered into under the program comply with our counterparty criteria. U.K. Banking Act: The principal provisions of the Banking Act 2009 ("the 2009 Act") came into force on Feb. 21, 2009. The 2009 Act contains very wide-reaching powers for dealing with the businesses of failing banks. Although structured finance deals should be protected to some extent under the associated secondary legislation (The Banking Act 2009 (Restrictions on Partial Transfers) Order 2009), this may not offer protection in all circumstances to certain aspects of deals. It is therefore still not entirely clear the extent to which orders made under the 2009 Act might affect deals involving U.K. deposit-taking institutions. It remains possible that future Government intervention could have negative consequences, whether directly or indirectly. Abbey National is a UK deposit-taking institution and could hence be affected by the provisions of orders made in relation to it under the 2009 Act.
Fitch 8 July 2011
Fitch Ratings has affirmed Abbey National Treasury Services PLC's (ANTS, 'AA-'/Stable/'F1+') outstanding covered bonds at 'AAA'. This follows the implementation of Fitch's Covered Bond Counterparty Criteria and the latest issuance under the program, Series 26 tap issue of EUR 250m. This issuance brings the amount issued under Series 26 to EUR 1bn. As at 8 July 2011, the total covered bonds outstanding amount to GBP 20.3bn, after taking into account the cross-currency swaps. The soft bullet bonds, with an extendable maturity of up to one year, are guaranteed by Abbey Covered Bonds LLP, a limited liability partnership incorporated in England and Wales. The rating is based on ANTS's Long-term Issuer Default Rating (IDR) of 'AA-' and a Discontinuity Factor (D-Factor) of 17.9%, the combination of which enables the mortgage covered bonds to be rated up to 'AAA' on a probability of default (PD) basis. The 'AAA' PD assessment is also supported by the current contractual asset percentage (AP) of 76.7% being lower than the AP supporting the rating, which Fitch has calculated to be at 79.1%. All else being equal, the covered bonds can remain at 'AAA' as long as ANTS's IDR is at least 'BBB+'. The D-Factor has been updated to 17.9% from 14.4% as a result of the implementation of Fitch's Covered Bond Counterparty Criteria, notably the agency's analysis of the potential replacement of a derivative counterparty, where the derivative counterparty to the asset owning special purpose vehicle is also the issuer (as highlighted in the criteria). The impact of the Covered Bond Counterparty Criteria on UK covered bond programs is outlined in "Counterparty Risks in the UK Covered Bond Programs - New Criteria Highlight Key Risks", published 12 May 2011. In particular, ANTS currently provides interest rate swaps to transform the interest collections of the cover pool assets into Libor plus a margin. Covered bonds swaps are in place, also with ANTS, to hedge the currency and basis risk arising from the difference in denominations and interest rates between the cover asset and liabilities. As of 31 May 2011, the pool consisted of 268,824 self-originated UK mortgage loans, totaling ap-proximately GBP 30.45bn, with a weighted average (WA) original loan-to-value ratio (LTV) of 67.7% and a WA current LTV ratio of 64%. The WA seasoning of the cover pool is 39.3 months. In a 'AAA' scenario, Fitch has calculated a cumulative weighted average frequency of fore-closure (WAFF) for the cover assets of 21.5% and a weighted average recovery rate (WARR) of 59.5%. Given ANTS's 'AA-/F1+' IDRs (which the agency views as commensurate with a Long-term IDR of between 'AA-' and 'AAA'), Fitch did not apply interest rate stresses in its cash-flow analysis for the program and relies on the recourse to the issuer and expects the issuer to manage the interest rate risks of the covered bonds. As highlighted in its covered bonds counterparty criteria, the agency would apply its published high and low GBP LIBOR stresses should ANTS's rating fall below 'AA-/F1+', resulting in a slightly higher level of overcollateralization in line with the same rating stress. The impact of applying the GBP LIBOR stresses would be limited for this program because the interest rate swap covers for interest rate risks except those associated with non-performing loans, which would result in a small percentage of the cover pool being unhedged. The support-ing AP will be affected, among other things, by the profile of the cover assets relative to outstanding covered bonds, which can change over time, even in the absence of new issuances.
Source: Rating Agencies, UniCredit Research
25 October 2011 Credit Research
Sector Report
UniCredit Research page 36 See last pages for disclaimer.
Barclays Key characteristics Ratings (PLC): A1n/A+n/AA-wn Ratings (Bank): Aa3n/AA-n/AA-wn Bloomberg: BARC LN Bond ticker: BACR www.barclays.com
Barclays, with total assets of GBP 1.5tn as of 1H11, is constantly among the top fivelargest banks in the world by total assets. Barclays has a strong franchise in the UK Retail & Business Banking, engages in international retail and commercial banking activities, and is also a prominent global player in investment banking (Barclays Capital), credit cards (Bar-claycard), and wealth management, while large parts of its asset management activities (Bar-clays Global Investors) have been sold. The bank operates in around 50 countries, with an extensive presence in Europe, the Americas, Africa and Asia, and has 145,000 employees serving 48mn customers. Due to its importance to the UK banking sector, continued externalsupport would likely be forthcoming if ever needed, even after recent rating actions and the ICB recommendations from September 2011. Barclays accepted only government guarantees for new bonds, ca. GBP 25bn of which have been issued, of which ca. GBP 19bn are still out-standing, but refused government capital injections and bad bank participation. Hence, there are no impositions by the European Commission, as the general UK bond guarantee program was cleared without such impositions. Barclays traces its roots back to 1690. Important acqui-sitions in recent times include the Spanish Banco Zaragozano (2003), South African Absa (2005), and the North American activities of Lehman Brothers (2008). Barclays plc is the stock-market listed holding company of Barclays Bank plc, the operating and debt issuing entity. Business is organized along two sub-groups: 1. Retail and Business Banking, and 2. Corporate and Investment Banking and Wealth Management, each of which has a number ofbusiness units. In addition, there is the Group Centre for all the support functions.
BARCLAYS: SWOT ANALYSIS Strengths/Opportunities Weaknesses/Threats Large and diversified balance sheet …but relatively high impairments Good profitability… …but strongly dependent on potentially volatile investment banking profits Adequate capitalization Risks in loan portfolio Solid liquidity and risk management
Source: UniCredit Research
1H11 results Barclays reported GBP 1.5bn in 1H11 net attributable profit (-38% yoy), compared with market expectations of GBP 1.29bn (Bloomberg), which also means a net profit of GBP 0.486bn in 2Q11, GBP 0.88bn less than in 1Q11. The main drivers in 1H11 vs. 1H10 were the generally-to-be-expected and non-recurring GBP 1bn provision relating to the Payment Protection Insurance (PPI) and lower trading income, which were only partly offset by overall lower provisions. In 1H11, the bank had a PBT of GBP 2.7bn vs. GBP 3.9bn in 1H10 and an adjusted PBT (excluding movements on own credit, a loss on acquisitions and disposals, and the provision for PPI in 1H11) of GBP 3.7bn 2011 vs. GBP 3bn in 1H10, +24% yoy. Total in-come without own credit fell by 3% yoy to GBP 15.2bn from GBP 15.7bn in 1H10. Segment-wise, Retail and Business Banking (RBB) income rose by 3% yoy to GBP 6.7bn. Barclays Capital total income fell 3% yoy to GBP 6.3bn from GBP 7.1bn, when excluding own credit,due to lower contributions from FI and Commodities. This was somewhat mitigated by better results from the Currencies, Equities and Prime Services, and IB businesses. Net operating income was stable at GBP 13.5bn for the group but RBB was significantly up by 14% yoy to GBP 5.4bn, Barclays Corporate by 90% yoy to GBP 857mn, and Barclays Wealth by 14% yoy to GBP 829mn. However, Barclays Capital's net operating income fell 15% yoy to GBP 6.5bn (including own credit gain and a reversal of impairment charges and other provisions). Provi-sions for loans and advances fell to 74bp vs. 118bp for FY10. Operating expenses were im-pacted by the GBP 1bn provision for the PPI and an increase in restructuring costs to GBP 216mn from GBP 93mn in 1H10. The group has a core Tier-1 ratio of 11% vs. 10% in 1H10, a Tier-1 ratio of 13.5% vs. 13.2% in 1H10, and a total capital ratio of 16.9% vs. 16.5% in 1H10.
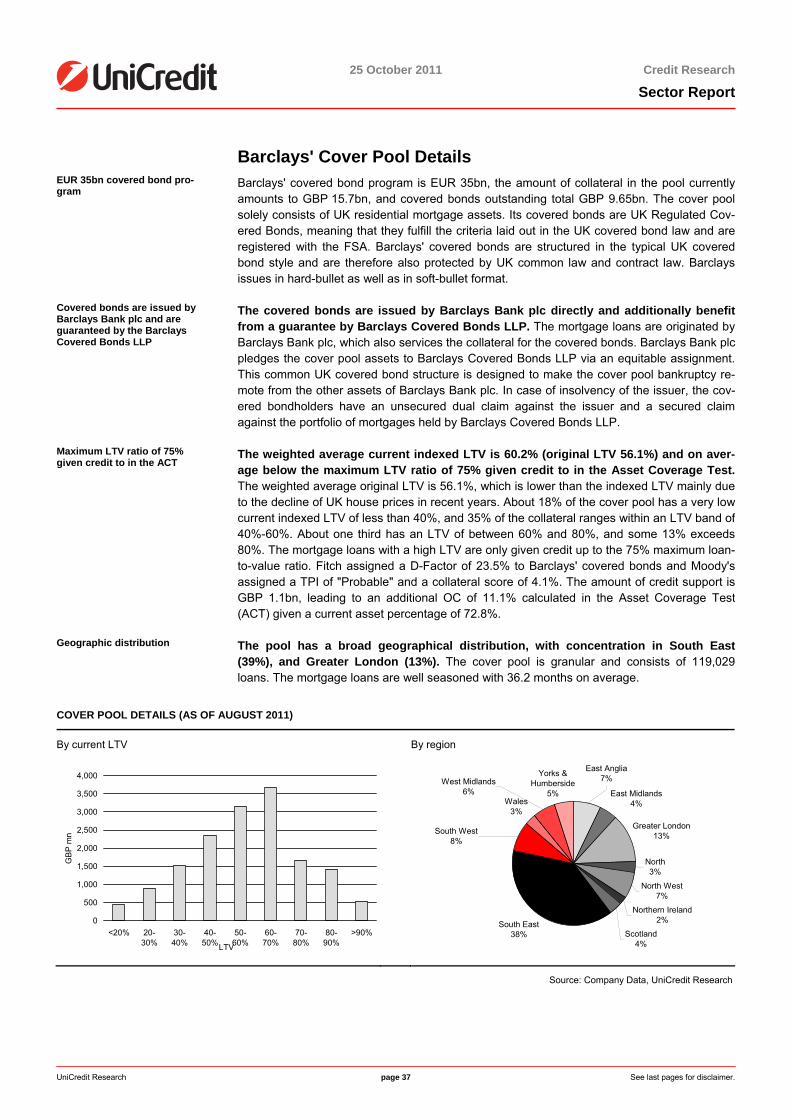
25 October 2011 Credit Research
Sector Report
UniCredit Research page 37 See last pages for disclaimer.
Barclays' Cover Pool Details EUR 35bn covered bond pro-gram
Barclays' covered bond program is EUR 35bn, the amount of collateral in the pool currently amounts to GBP 15.7bn, and covered bonds outstanding total GBP 9.65bn. The cover pool solely consists of UK residential mortgage assets. Its covered bonds are UK Regulated Cov-ered Bonds, meaning that they fulfill the criteria laid out in the UK covered bond law and are registered with the FSA. Barclays' covered bonds are structured in the typical UK coveredbond style and are therefore also protected by UK common law and contract law. Barclays issues in hard-bullet as well as in soft-bullet format.
Covered bonds are issued by Barclays Bank plc and are guaranteed by the Barclays Covered Bonds LLP
The covered bonds are issued by Barclays Bank plc directly and additionally benefit from a guarantee by Barclays Covered Bonds LLP. The mortgage loans are originated by Barclays Bank plc, which also services the collateral for the covered bonds. Barclays Bank plcpledges the cover pool assets to Barclays Covered Bonds LLP via an equitable assignment. This common UK covered bond structure is designed to make the cover pool bankruptcy re-mote from the other assets of Barclays Bank plc. In case of insolvency of the issuer, the cov-ered bondholders have an unsecured dual claim against the issuer and a secured claim against the portfolio of mortgages held by Barclays Covered Bonds LLP.
Maximum LTV ratio of 75% given credit to in the ACT
The weighted average current indexed LTV is 60.2% (original LTV 56.1%) and on aver-age below the maximum LTV ratio of 75% given credit to in the Asset Coverage Test.The weighted average original LTV is 56.1%, which is lower than the indexed LTV mainly due to the decline of UK house prices in recent years. About 18% of the cover pool has a very low current indexed LTV of less than 40%, and 35% of the collateral ranges within an LTV band of40%-60%. About one third has an LTV of between 60% and 80%, and some 13% exceeds 80%. The mortgage loans with a high LTV are only given credit up to the 75% maximum loan-to-value ratio. Fitch assigned a D-Factor of 23.5% to Barclays' covered bonds and Moody's assigned a TPI of "Probable" and a collateral score of 4.1%. The amount of credit support is GBP 1.1bn, leading to an additional OC of 11.1% calculated in the Asset Coverage Test (ACT) given a current asset percentage of 72.8%.
Geographic distribution The pool has a broad geographical distribution, with concentration in South East (39%), and Greater London (13%). The cover pool is granular and consists of 119,029 loans. The mortgage loans are well seasoned with 36.2 months on average.
COVER POOL DETAILS (AS OF AUGUST 2011)
By current LTV By region
0
500
1,000
1,500
2,000
2,500
3,000
3,500
4,000
<20% 20-30%
30-40%
40-50%
50-60%
60-70%
70-80%
80-90%
>90%
LTV
GB
P m
n
East Midlands4%
Greater London13%
North3%
North West7%
Northern Ireland2%
Scotland4%
South East38%
Wales3%
Yorks & Humberside
5%
East Anglia7%West Midlands
6%
South West8%
Source: Company Data, UniCredit Research
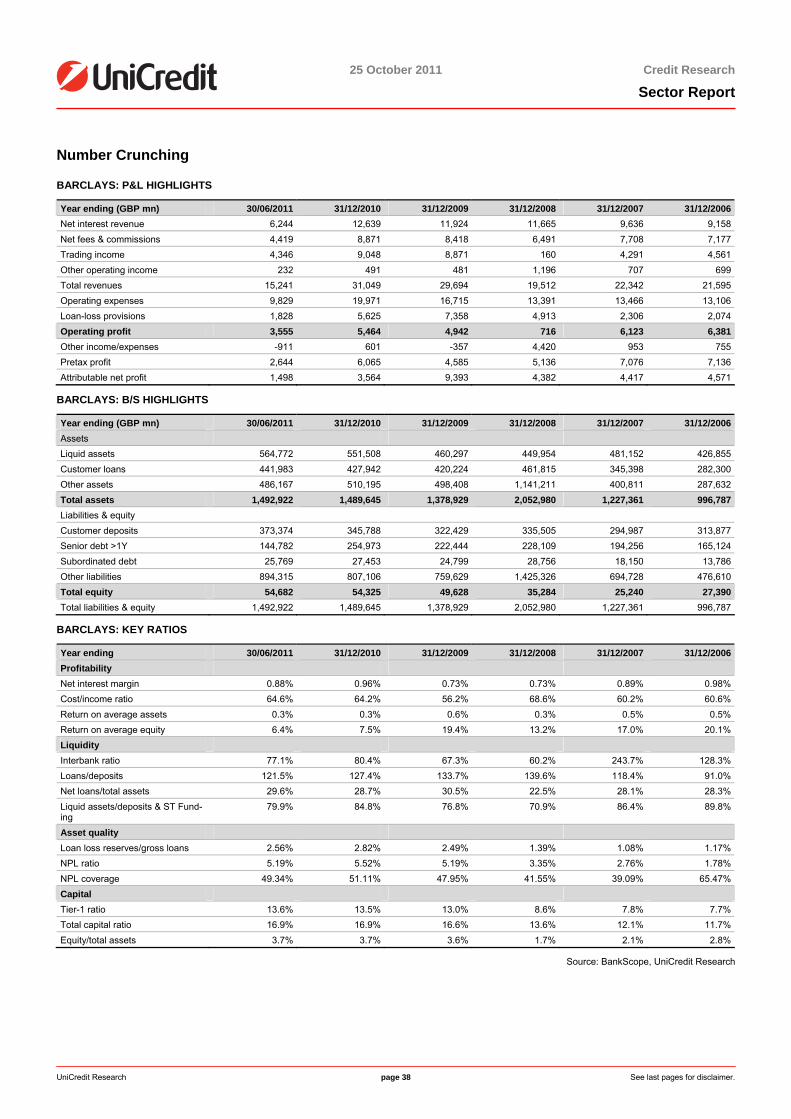
25 October 2011 Credit Research
Sector Report
UniCredit Research page 38 See last pages for disclaimer.
Number Crunching
BARCLAYS: P&L HIGHLIGHTS
Year ending (GBP mn) 30/06/2011 31/12/2010 31/12/2009 31/12/2008 31/12/2007 31/12/2006Net interest revenue 6,244 12,639 11,924 11,665 9,636 9,158Net fees & commissions 4,419 8,871 8,418 6,491 7,708 7,177Trading income 4,346 9,048 8,871 160 4,291 4,561Other operating income 232 491 481 1,196 707 699Total revenues 15,241 31,049 29,694 19,512 22,342 21,595Operating expenses 9,829 19,971 16,715 13,391 13,466 13,106Loan-loss provisions 1,828 5,625 7,358 4,913 2,306 2,074Operating profit 3,555 5,464 4,942 716 6,123 6,381Other income/expenses -911 601 -357 4,420 953 755Pretax profit 2,644 6,065 4,585 5,136 7,076 7,136Attributable net profit 1,498 3,564 9,393 4,382 4,417 4,571
BARCLAYS: B/S HIGHLIGHTS
Year ending (GBP mn) 30/06/2011 31/12/2010 31/12/2009 31/12/2008 31/12/2007 31/12/2006Assets Liquid assets 564,772 551,508 460,297 449,954 481,152 426,855Customer loans 441,983 427,942 420,224 461,815 345,398 282,300Other assets 486,167 510,195 498,408 1,141,211 400,811 287,632Total assets 1,492,922 1,489,645 1,378,929 2,052,980 1,227,361 996,787Liabilities & equity Customer deposits 373,374 345,788 322,429 335,505 294,987 313,877Senior debt >1Y 144,782 254,973 222,444 228,109 194,256 165,124Subordinated debt 25,769 27,453 24,799 28,756 18,150 13,786Other liabilities 894,315 807,106 759,629 1,425,326 694,728 476,610Total equity 54,682 54,325 49,628 35,284 25,240 27,390Total liabilities & equity 1,492,922 1,489,645 1,378,929 2,052,980 1,227,361 996,787
BARCLAYS: KEY RATIOS
Year ending 30/06/2011 31/12/2010 31/12/2009 31/12/2008 31/12/2007 31/12/2006Profitability Net interest margin 0.88% 0.96% 0.73% 0.73% 0.89% 0.98%Cost/income ratio 64.6% 64.2% 56.2% 68.6% 60.2% 60.6%Return on average assets 0.3% 0.3% 0.6% 0.3% 0.5% 0.5%Return on average equity 6.4% 7.5% 19.4% 13.2% 17.0% 20.1%Liquidity Interbank ratio 77.1% 80.4% 67.3% 60.2% 243.7% 128.3%Loans/deposits 121.5% 127.4% 133.7% 139.6% 118.4% 91.0%Net loans/total assets 29.6% 28.7% 30.5% 22.5% 28.1% 28.3%Liquid assets/deposits & ST Fund-ing
79.9% 84.8% 76.8% 70.9% 86.4% 89.8%
Asset quality Loan loss reserves/gross loans 2.56% 2.82% 2.49% 1.39% 1.08% 1.17%NPL ratio 5.19% 5.52% 5.19% 3.35% 2.76% 1.78%NPL coverage 49.34% 51.11% 47.95% 41.55% 39.09% 65.47%Capital Tier-1 ratio 13.6% 13.5% 13.0% 8.6% 7.8% 7.7%Total capital ratio 16.9% 16.9% 16.6% 13.6% 12.1% 11.7%Equity/total assets 3.7% 3.7% 3.6% 1.7% 2.1% 2.8%
Source: BankScope, UniCredit Research
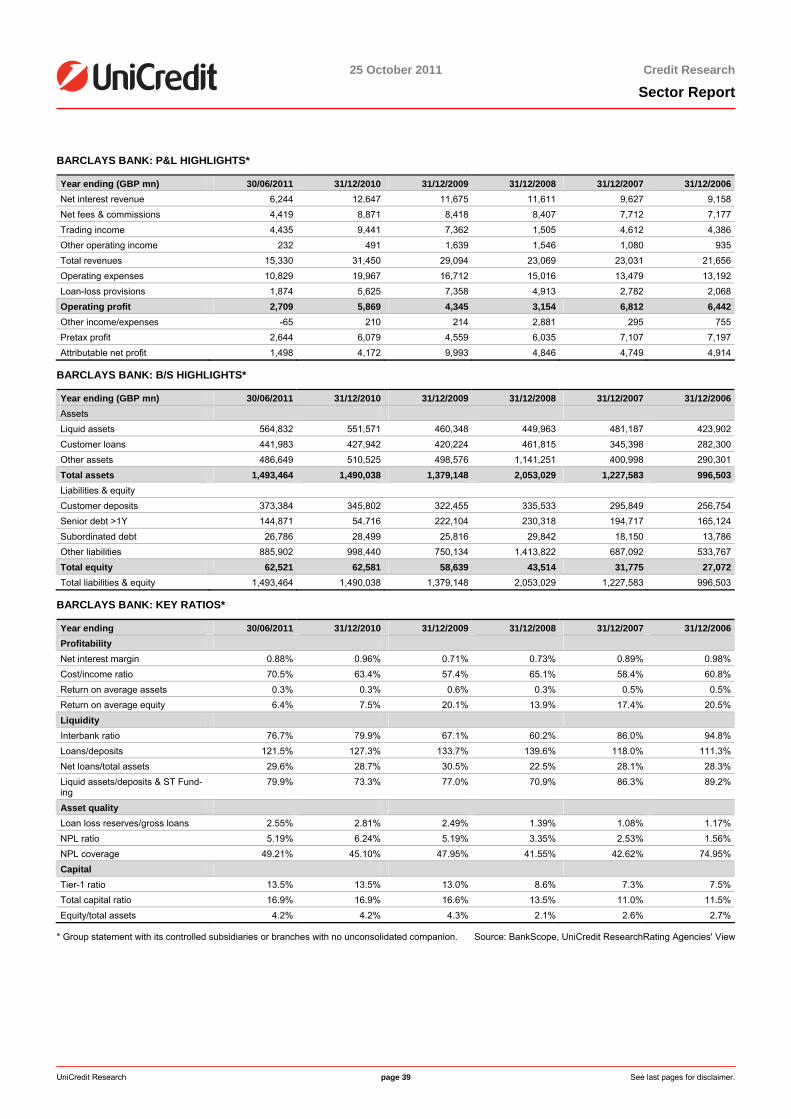
25 October 2011 Credit Research
Sector Report
UniCredit Research page 39 See last pages for disclaimer.
BARCLAYS BANK: P&L HIGHLIGHTS*
Year ending (GBP mn) 30/06/2011 31/12/2010 31/12/2009 31/12/2008 31/12/2007 31/12/2006Net interest revenue 6,244 12,647 11,675 11,611 9,627 9,158Net fees & commissions 4,419 8,871 8,418 8,407 7,712 7,177Trading income 4,435 9,441 7,362 1,505 4,612 4,386Other operating income 232 491 1,639 1,546 1,080 935Total revenues 15,330 31,450 29,094 23,069 23,031 21,656Operating expenses 10,829 19,967 16,712 15,016 13,479 13,192Loan-loss provisions 1,874 5,625 7,358 4,913 2,782 2,068Operating profit 2,709 5,869 4,345 3,154 6,812 6,442Other income/expenses -65 210 214 2,881 295 755Pretax profit 2,644 6,079 4,559 6,035 7,107 7,197Attributable net profit 1,498 4,172 9,993 4,846 4,749 4,914
BARCLAYS BANK: B/S HIGHLIGHTS*
Year ending (GBP mn) 30/06/2011 31/12/2010 31/12/2009 31/12/2008 31/12/2007 31/12/2006Assets Liquid assets 564,832 551,571 460,348 449,963 481,187 423,902Customer loans 441,983 427,942 420,224 461,815 345,398 282,300Other assets 486,649 510,525 498,576 1,141,251 400,998 290,301Total assets 1,493,464 1,490,038 1,379,148 2,053,029 1,227,583 996,503Liabilities & equity Customer deposits 373,384 345,802 322,455 335,533 295,849 256,754Senior debt >1Y 144,871 54,716 222,104 230,318 194,717 165,124Subordinated debt 26,786 28,499 25,816 29,842 18,150 13,786Other liabilities 885,902 998,440 750,134 1,413,822 687,092 533,767Total equity 62,521 62,581 58,639 43,514 31,775 27,072Total liabilities & equity 1,493,464 1,490,038 1,379,148 2,053,029 1,227,583 996,503
BARCLAYS BANK: KEY RATIOS*
Year ending 30/06/2011 31/12/2010 31/12/2009 31/12/2008 31/12/2007 31/12/2006Profitability Net interest margin 0.88% 0.96% 0.71% 0.73% 0.89% 0.98%Cost/income ratio 70.5% 63.4% 57.4% 65.1% 58.4% 60.8%Return on average assets 0.3% 0.3% 0.6% 0.3% 0.5% 0.5%Return on average equity 6.4% 7.5% 20.1% 13.9% 17.4% 20.5%Liquidity Interbank ratio 76.7% 79.9% 67.1% 60.2% 86.0% 94.8%Loans/deposits 121.5% 127.3% 133.7% 139.6% 118.0% 111.3%Net loans/total assets 29.6% 28.7% 30.5% 22.5% 28.1% 28.3%Liquid assets/deposits & ST Fund-ing
79.9% 73.3% 77.0% 70.9% 86.3% 89.2%
Asset quality Loan loss reserves/gross loans 2.55% 2.81% 2.49% 1.39% 1.08% 1.17%NPL ratio 5.19% 6.24% 5.19% 3.35% 2.53% 1.56%NPL coverage 49.21% 45.10% 47.95% 41.55% 42.62% 74.95%Capital Tier-1 ratio 13.5% 13.5% 13.0% 8.6% 7.3% 7.5%Total capital ratio 16.9% 16.9% 16.6% 13.5% 11.0% 11.5%Equity/total assets 4.2% 4.2% 4.3% 2.1% 2.6% 2.7%
* Group statement with its controlled subsidiaries or branches with no unconsolidated companion. Source: BankScope, UniCredit ResearchRating Agencies' View
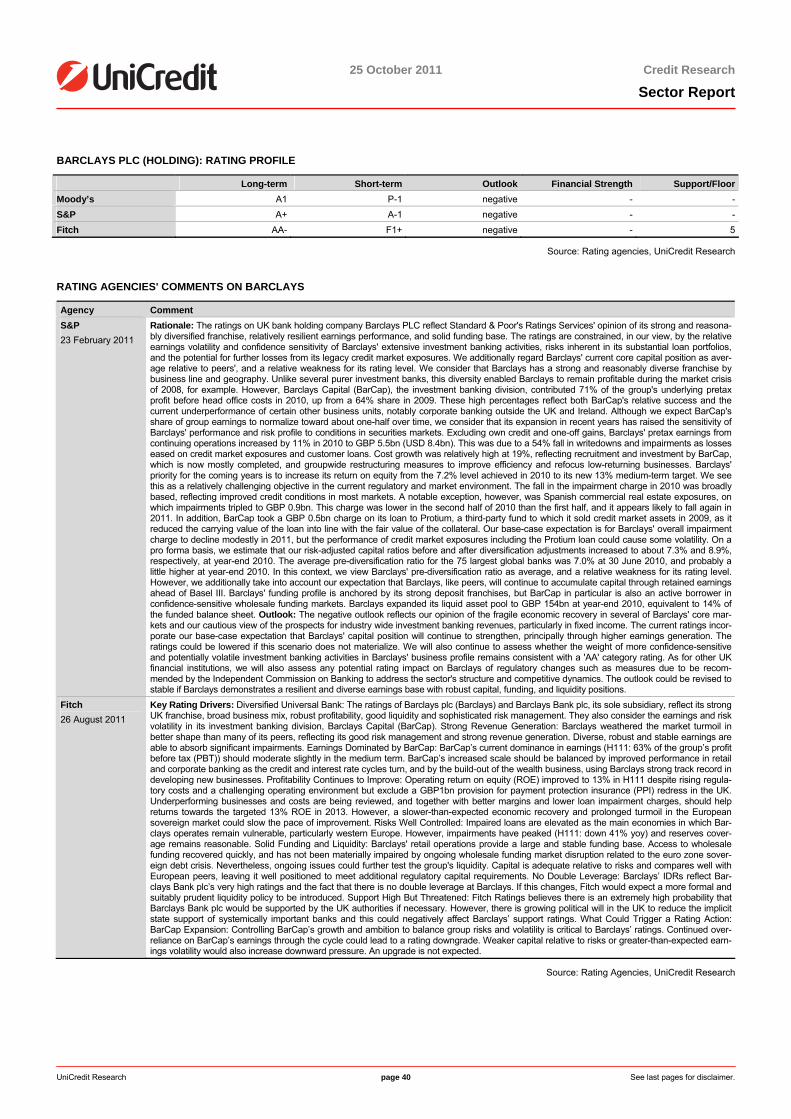
25 October 2011 Credit Research
Sector Report
UniCredit Research page 40 See last pages for disclaimer.
BARCLAYS PLC (HOLDING): RATING PROFILE
Long-term Short-term Outlook Financial Strength Support/FloorMoody’s A1 P-1 negative - -S&P A+ A-1 negative - -Fitch AA- F1+ negative - 5
Source: Rating agencies, UniCredit Research
RATING AGENCIES' COMMENTS ON BARCLAYS
Agency Comment S&P 23 February 2011
Rationale: The ratings on UK bank holding company Barclays PLC reflect Standard & Poor's Ratings Services' opinion of its strong and reasona-bly diversified franchise, relatively resilient earnings performance, and solid funding base. The ratings are constrained, in our view, by the relative earnings volatility and confidence sensitivity of Barclays' extensive investment banking activities, risks inherent in its substantial loan portfolios, and the potential for further losses from its legacy credit market exposures. We additionally regard Barclays' current core capital position as aver-age relative to peers', and a relative weakness for its rating level. We consider that Barclays has a strong and reasonably diverse franchise by business line and geography. Unlike several purer investment banks, this diversity enabled Barclays to remain profitable during the market crisis of 2008, for example. However, Barclays Capital (BarCap), the investment banking division, contributed 71% of the group's underlying pretax profit before head office costs in 2010, up from a 64% share in 2009. These high percentages reflect both BarCap's relative success and the current underperformance of certain other business units, notably corporate banking outside the UK and Ireland. Although we expect BarCap's share of group earnings to normalize toward about one-half over time, we consider that its expansion in recent years has raised the sensitivity of Barclays' performance and risk profile to conditions in securities markets. Excluding own credit and one-off gains, Barclays' pretax earnings from continuing operations increased by 11% in 2010 to GBP 5.5bn (USD 8.4bn). This was due to a 54% fall in writedowns and impairments as losses eased on credit market exposures and customer loans. Cost growth was relatively high at 19%, reflecting recruitment and investment by BarCap, which is now mostly completed, and groupwide restructuring measures to improve efficiency and refocus low-returning businesses. Barclays' priority for the coming years is to increase its return on equity from the 7.2% level achieved in 2010 to its new 13% medium-term target. We see this as a relatively challenging objective in the current regulatory and market environment. The fall in the impairment charge in 2010 was broadly based, reflecting improved credit conditions in most markets. A notable exception, however, was Spanish commercial real estate exposures, on which impairments tripled to GBP 0.9bn. This charge was lower in the second half of 2010 than the first half, and it appears likely to fall again in 2011. In addition, BarCap took a GBP 0.5bn charge on its loan to Protium, a third-party fund to which it sold credit market assets in 2009, as it reduced the carrying value of the loan into line with the fair value of the collateral. Our base-case expectation is for Barclays' overall impairment charge to decline modestly in 2011, but the performance of credit market exposures including the Protium loan could cause some volatility. On a pro forma basis, we estimate that our risk-adjusted capital ratios before and after diversification adjustments increased to about 7.3% and 8.9%, respectively, at year-end 2010. The average pre-diversification ratio for the 75 largest global banks was 7.0% at 30 June 2010, and probably a little higher at year-end 2010. In this context, we view Barclays' pre-diversification ratio as average, and a relative weakness for its rating level. However, we additionally take into account our expectation that Barclays, like peers, will continue to accumulate capital through retained earnings ahead of Basel III. Barclays' funding profile is anchored by its strong deposit franchises, but BarCap in particular is also an active borrower in confidence-sensitive wholesale funding markets. Barclays expanded its liquid asset pool to GBP 154bn at year-end 2010, equivalent to 14% of the funded balance sheet. Outlook: The negative outlook reflects our opinion of the fragile economic recovery in several of Barclays' core mar-kets and our cautious view of the prospects for industry wide investment banking revenues, particularly in fixed income. The current ratings incor-porate our base-case expectation that Barclays' capital position will continue to strengthen, principally through higher earnings generation. The ratings could be lowered if this scenario does not materialize. We will also continue to assess whether the weight of more confidence-sensitive and potentially volatile investment banking activities in Barclays' business profile remains consistent with a 'AA' category rating. As for other UK financial institutions, we will also assess any potential rating impact on Barclays of regulatory changes such as measures due to be recom-mended by the Independent Commission on Banking to address the sector's structure and competitive dynamics. The outlook could be revised to stable if Barclays demonstrates a resilient and diverse earnings base with robust capital, funding, and liquidity positions.
Fitch 26 August 2011
Key Rating Drivers: Diversified Universal Bank: The ratings of Barclays plc (Barclays) and Barclays Bank plc, its sole subsidiary, reflect its strong UK franchise, broad business mix, robust profitability, good liquidity and sophisticated risk management. They also consider the earnings and risk volatility in its investment banking division, Barclays Capital (BarCap). Strong Revenue Generation: Barclays weathered the market turmoil in better shape than many of its peers, reflecting its good risk management and strong revenue generation. Diverse, robust and stable earnings are able to absorb significant impairments. Earnings Dominated by BarCap: BarCap’s current dominance in earnings (H111: 63% of the group’s profit before tax (PBT)) should moderate slightly in the medium term. BarCap’s increased scale should be balanced by improved performance in retail and corporate banking as the credit and interest rate cycles turn, and by the build-out of the wealth business, using Barclays strong track record in developing new businesses. Profitability Continues to Improve: Operating return on equity (ROE) improved to 13% in H111 despite rising regula-tory costs and a challenging operating environment but exclude a GBP1bn provision for payment protection insurance (PPI) redress in the UK. Underperforming businesses and costs are being reviewed, and together with better margins and lower loan impairment charges, should help returns towards the targeted 13% ROE in 2013. However, a slower-than-expected economic recovery and prolonged turmoil in the European sovereign market could slow the pace of improvement. Risks Well Controlled: Impaired loans are elevated as the main economies in which Bar-clays operates remain vulnerable, particularly western Europe. However, impairments have peaked (H111: down 41% yoy) and reserves cover-age remains reasonable. Solid Funding and Liquidity: Barclays' retail operations provide a large and stable funding base. Access to wholesale funding recovered quickly, and has not been materially impaired by ongoing wholesale funding market disruption related to the euro zone sover-eign debt crisis. Nevertheless, ongoing issues could further test the group's liquidity. Capital is adequate relative to risks and compares well with European peers, leaving it well positioned to meet additional regulatory capital requirements. No Double Leverage: Barclays’ IDRs reflect Bar-clays Bank plc’s very high ratings and the fact that there is no double leverage at Barclays. If this changes, Fitch would expect a more formal and suitably prudent liquidity policy to be introduced. Support High But Threatened: Fitch Ratings believes there is an extremely high probability that Barclays Bank plc would be supported by the UK authorities if necessary. However, there is growing political will in the UK to reduce the implicit state support of systemically important banks and this could negatively affect Barclays’ support ratings. What Could Trigger a Rating Action: BarCap Expansion: Controlling BarCap’s growth and ambition to balance group risks and volatility is critical to Barclays’ ratings. Continued over-reliance on BarCap’s earnings through the cycle could lead to a rating downgrade. Weaker capital relative to risks or greater-than-expected earn-ings volatility would also increase downward pressure. An upgrade is not expected.
Source: Rating Agencies, UniCredit Research
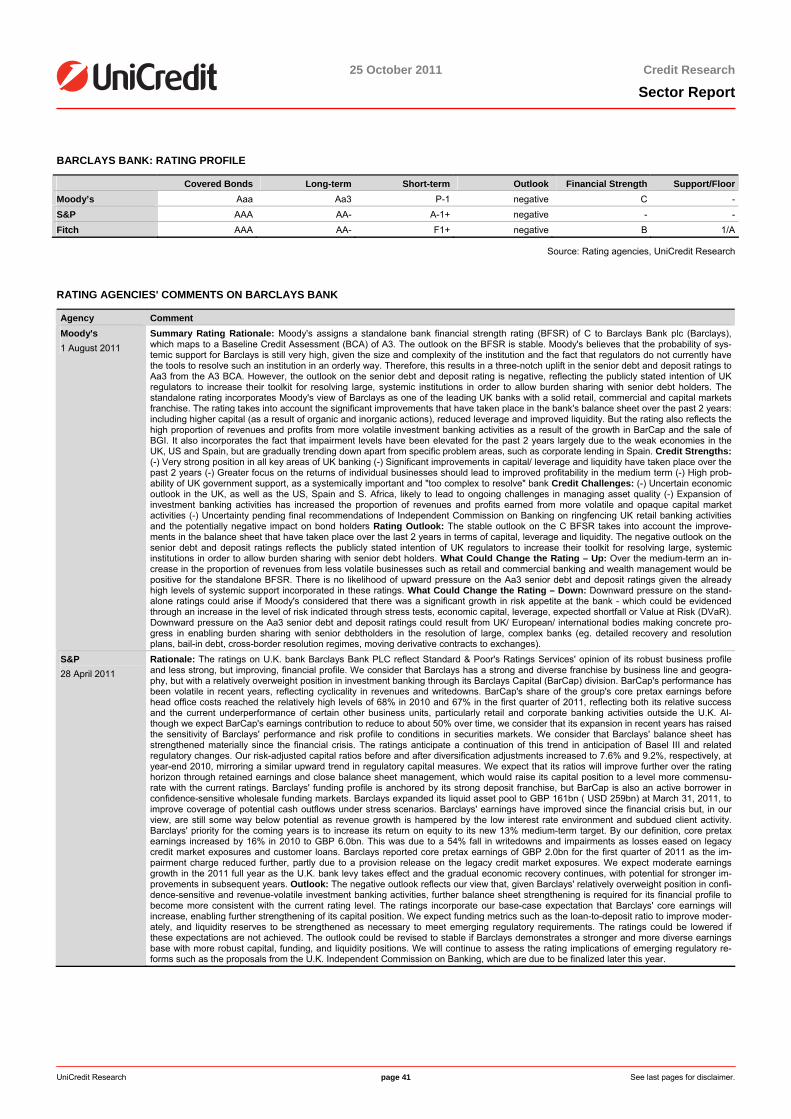
25 October 2011 Credit Research
Sector Report
UniCredit Research page 41 See last pages for disclaimer.
BARCLAYS BANK: RATING PROFILE
Covered Bonds Long-term Short-term Outlook Financial Strength Support/FloorMoody’s Aaa Aa3 P-1 negative C -S&P AAA AA- A-1+ negative - -Fitch AAA AA- F1+ negative B 1/A
Source: Rating agencies, UniCredit Research
RATING AGENCIES' COMMENTS ON BARCLAYS BANK
Agency Comment Moody's 1 August 2011
Summary Rating Rationale: Moody's assigns a standalone bank financial strength rating (BFSR) of C to Barclays Bank plc (Barclays), which maps to a Baseline Credit Assessment (BCA) of A3. The outlook on the BFSR is stable. Moody's believes that the probability of sys-temic support for Barclays is still very high, given the size and complexity of the institution and the fact that regulators do not currently have the tools to resolve such an institution in an orderly way. Therefore, this results in a three-notch uplift in the senior debt and deposit ratings to Aa3 from the A3 BCA. However, the outlook on the senior debt and deposit rating is negative, reflecting the publicly stated intention of UK regulators to increase their toolkit for resolving large, systemic institutions in order to allow burden sharing with senior debt holders. The standalone rating incorporates Moody's view of Barclays as one of the leading UK banks with a solid retail, commercial and capital markets franchise. The rating takes into account the significant improvements that have taken place in the bank's balance sheet over the past 2 years: including higher capital (as a result of organic and inorganic actions), reduced leverage and improved liquidity. But the rating also reflects the high proportion of revenues and profits from more volatile investment banking activities as a result of the growth in BarCap and the sale of BGI. It also incorporates the fact that impairment levels have been elevated for the past 2 years largely due to the weak economies in the UK, US and Spain, but are gradually trending down apart from specific problem areas, such as corporate lending in Spain. Credit Strengths: (-) Very strong position in all key areas of UK banking (-) Significant improvements in capital/ leverage and liquidity have taken place over the past 2 years (-) Greater focus on the returns of individual businesses should lead to improved profitability in the medium term (-) High prob-ability of UK government support, as a systemically important and "too complex to resolve" bank Credit Challenges: (-) Uncertain economic outlook in the UK, as well as the US, Spain and S. Africa, likely to lead to ongoing challenges in managing asset quality (-) Expansion of investment banking activities has increased the proportion of revenues and profits earned from more volatile and opaque capital market activities (-) Uncertainty pending final recommendations of Independent Commission on Banking on ringfencing UK retail banking activities and the potentially negative impact on bond holders Rating Outlook: The stable outlook on the C BFSR takes into account the improve-ments in the balance sheet that have taken place over the last 2 years in terms of capital, leverage and liquidity. The negative outlook on the senior debt and deposit ratings reflects the publicly stated intention of UK regulators to increase their toolkit for resolving large, systemic institutions in order to allow burden sharing with senior debt holders. What Could Change the Rating – Up: Over the medium-term an in-crease in the proportion of revenues from less volatile businesses such as retail and commercial banking and wealth management would be positive for the standalone BFSR. There is no likelihood of upward pressure on the Aa3 senior debt and deposit ratings given the already high levels of systemic support incorporated in these ratings. What Could Change the Rating – Down: Downward pressure on the stand-alone ratings could arise if Moody's considered that there was a significant growth in risk appetite at the bank - which could be evidenced through an increase in the level of risk indicated through stress tests, economic capital, leverage, expected shortfall or Value at Risk (DVaR). Downward pressure on the Aa3 senior debt and deposit ratings could result from UK/ European/ international bodies making concrete pro-gress in enabling burden sharing with senior debtholders in the resolution of large, complex banks (eg. detailed recovery and resolution plans, bail-in debt, cross-border resolution regimes, moving derivative contracts to exchanges).
S&P 28 April 2011
Rationale: The ratings on U.K. bank Barclays Bank PLC reflect Standard & Poor's Ratings Services' opinion of its robust business profile and less strong, but improving, financial profile. We consider that Barclays has a strong and diverse franchise by business line and geogra-phy, but with a relatively overweight position in investment banking through its Barclays Capital (BarCap) division. BarCap's performance has been volatile in recent years, reflecting cyclicality in revenues and writedowns. BarCap's share of the group's core pretax earnings before head office costs reached the relatively high levels of 68% in 2010 and 67% in the first quarter of 2011, reflecting both its relative success and the current underperformance of certain other business units, particularly retail and corporate banking activities outside the U.K. Al-though we expect BarCap's earnings contribution to reduce to about 50% over time, we consider that its expansion in recent years has raised the sensitivity of Barclays' performance and risk profile to conditions in securities markets. We consider that Barclays' balance sheet has strengthened materially since the financial crisis. The ratings anticipate a continuation of this trend in anticipation of Basel III and related regulatory changes. Our risk-adjusted capital ratios before and after diversification adjustments increased to 7.6% and 9.2%, respectively, at year-end 2010, mirroring a similar upward trend in regulatory capital measures. We expect that its ratios will improve further over the rating horizon through retained earnings and close balance sheet management, which would raise its capital position to a level more commensu-rate with the current ratings. Barclays' funding profile is anchored by its strong deposit franchise, but BarCap is also an active borrower in confidence-sensitive wholesale funding markets. Barclays expanded its liquid asset pool to GBP 161bn ( USD 259bn) at March 31, 2011, to improve coverage of potential cash outflows under stress scenarios. Barclays' earnings have improved since the financial crisis but, in our view, are still some way below potential as revenue growth is hampered by the low interest rate environment and subdued client activity. Barclays' priority for the coming years is to increase its return on equity to its new 13% medium-term target. By our definition, core pretax earnings increased by 16% in 2010 to GBP 6.0bn. This was due to a 54% fall in writedowns and impairments as losses eased on legacy credit market exposures and customer loans. Barclays reported core pretax earnings of GBP 2.0bn for the first quarter of 2011 as the im-pairment charge reduced further, partly due to a provision release on the legacy credit market exposures. We expect moderate earnings growth in the 2011 full year as the U.K. bank levy takes effect and the gradual economic recovery continues, with potential for stronger im-provements in subsequent years. Outlook: The negative outlook reflects our view that, given Barclays' relatively overweight position in confi-dence-sensitive and revenue-volatile investment banking activities, further balance sheet strengthening is required for its financial profile to become more consistent with the current rating level. The ratings incorporate our base-case expectation that Barclays' core earnings will increase, enabling further strengthening of its capital position. We expect funding metrics such as the loan-to-deposit ratio to improve moder-ately, and liquidity reserves to be strengthened as necessary to meet emerging regulatory requirements. The ratings could be lowered if these expectations are not achieved. The outlook could be revised to stable if Barclays demonstrates a stronger and more diverse earnings base with more robust capital, funding, and liquidity positions. We will continue to assess the rating implications of emerging regulatory re-forms such as the proposals from the U.K. Independent Commission on Banking, which are due to be finalized later this year.
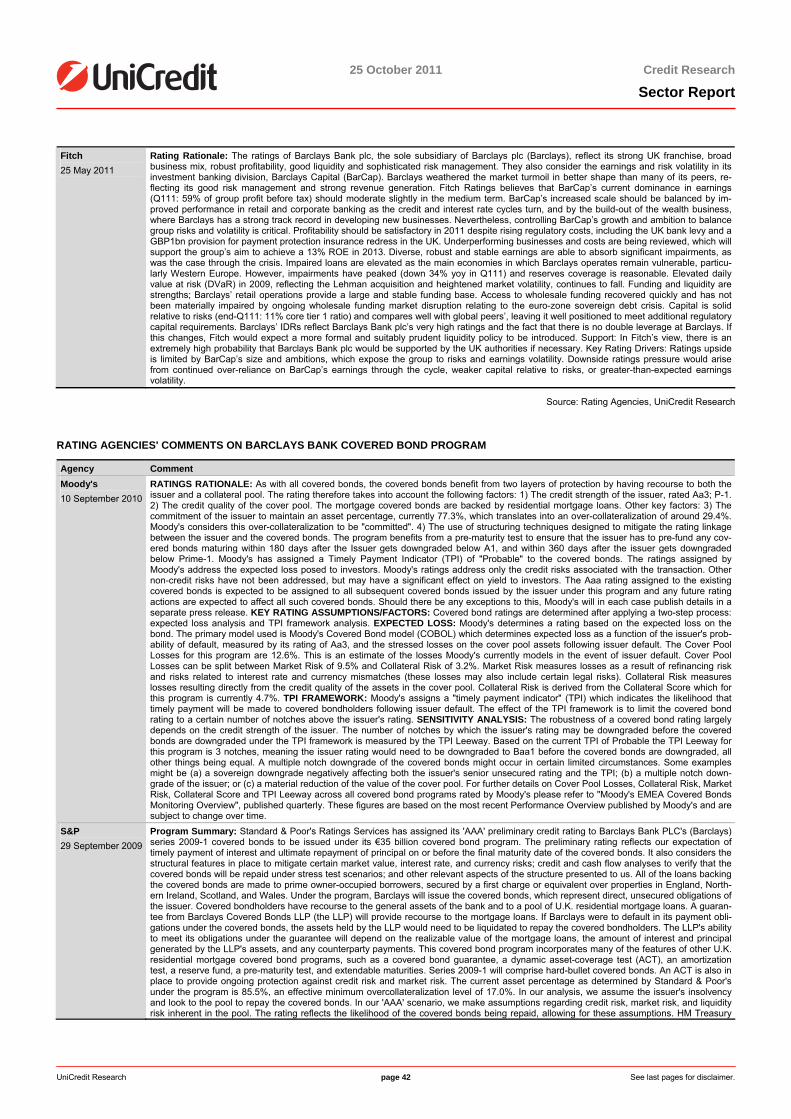
25 October 2011 Credit Research
Sector Report
UniCredit Research page 42 See last pages for disclaimer.
Fitch 25 May 2011
Rating Rationale: The ratings of Barclays Bank plc, the sole subsidiary of Barclays plc (Barclays), reflect its strong UK franchise, broad business mix, robust profitability, good liquidity and sophisticated risk management. They also consider the earnings and risk volatility in its investment banking division, Barclays Capital (BarCap). Barclays weathered the market turmoil in better shape than many of its peers, re-flecting its good risk management and strong revenue generation. Fitch Ratings believes that BarCap’s current dominance in earnings (Q111: 59% of group profit before tax) should moderate slightly in the medium term. BarCap’s increased scale should be balanced by im-proved performance in retail and corporate banking as the credit and interest rate cycles turn, and by the build-out of the wealth business, where Barclays has a strong track record in developing new businesses. Nevertheless, controlling BarCap’s growth and ambition to balance group risks and volatility is critical. Profitability should be satisfactory in 2011 despite rising regulatory costs, including the UK bank levy and a GBP1bn provision for payment protection insurance redress in the UK. Underperforming businesses and costs are being reviewed, which will support the group’s aim to achieve a 13% ROE in 2013. Diverse, robust and stable earnings are able to absorb significant impairments, as was the case through the crisis. Impaired loans are elevated as the main economies in which Barclays operates remain vulnerable, particu-larly Western Europe. However, impairments have peaked (down 34% yoy in Q111) and reserves coverage is reasonable. Elevated daily value at risk (DVaR) in 2009, reflecting the Lehman acquisition and heightened market volatility, continues to fall. Funding and liquidity are strengths; Barclays’ retail operations provide a large and stable funding base. Access to wholesale funding recovered quickly and has not been materially impaired by ongoing wholesale funding market disruption relating to the euro-zone sovereign debt crisis. Capital is solid relative to risks (end-Q111: 11% core tier 1 ratio) and compares well with global peers’, leaving it well positioned to meet additional regulatory capital requirements. Barclays’ IDRs reflect Barclays Bank plc’s very high ratings and the fact that there is no double leverage at Barclays. If this changes, Fitch would expect a more formal and suitably prudent liquidity policy to be introduced. Support: In Fitch’s view, there is an extremely high probability that Barclays Bank plc would be supported by the UK authorities if necessary. Key Rating Drivers: Ratings upside is limited by BarCap’s size and ambitions, which expose the group to risks and earnings volatility. Downside ratings pressure would arise from continued over-reliance on BarCap’s earnings through the cycle, weaker capital relative to risks, or greater-than-expected earnings volatility.
Source: Rating Agencies, UniCredit Research
RATING AGENCIES' COMMENTS ON BARCLAYS BANK COVERED BOND PROGRAM
Agency Comment Moody's 10 September 2010
RATINGS RATIONALE: As with all covered bonds, the covered bonds benefit from two layers of protection by having recourse to both the issuer and a collateral pool. The rating therefore takes into account the following factors: 1) The credit strength of the issuer, rated Aa3; P-1. 2) The credit quality of the cover pool. The mortgage covered bonds are backed by residential mortgage loans. Other key factors: 3) The commitment of the issuer to maintain an asset percentage, currently 77.3%, which translates into an over-collateralization of around 29.4%. Moody's considers this over-collateralization to be "committed". 4) The use of structuring techniques designed to mitigate the rating linkage between the issuer and the covered bonds. The program benefits from a pre-maturity test to ensure that the issuer has to pre-fund any cov-ered bonds maturing within 180 days after the Issuer gets downgraded below A1, and within 360 days after the issuer gets downgraded below Prime-1. Moody's has assigned a Timely Payment Indicator (TPI) of "Probable" to the covered bonds. The ratings assigned by Moody's address the expected loss posed to investors. Moody's ratings address only the credit risks associated with the transaction. Other non-credit risks have not been addressed, but may have a significant effect on yield to investors. The Aaa rating assigned to the existing covered bonds is expected to be assigned to all subsequent covered bonds issued by the issuer under this program and any future rating actions are expected to affect all such covered bonds. Should there be any exceptions to this, Moody's will in each case publish details in a separate press release. KEY RATING ASSUMPTIONS/FACTORS: Covered bond ratings are determined after applying a two-step process: expected loss analysis and TPI framework analysis. EXPECTED LOSS: Moody's determines a rating based on the expected loss on the bond. The primary model used is Moody's Covered Bond model (COBOL) which determines expected loss as a function of the issuer's prob-ability of default, measured by its rating of Aa3, and the stressed losses on the cover pool assets following issuer default. The Cover Pool Losses for this program are 12.6%. This is an estimate of the losses Moody's currently models in the event of issuer default. Cover Pool Losses can be split between Market Risk of 9.5% and Collateral Risk of 3.2%. Market Risk measures losses as a result of refinancing risk and risks related to interest rate and currency mismatches (these losses may also include certain legal risks). Collateral Risk measures losses resulting directly from the credit quality of the assets in the cover pool. Collateral Risk is derived from the Collateral Score which for this program is currently 4.7%. TPI FRAMEWORK: Moody's assigns a "timely payment indicator" (TPI) which indicates the likelihood that timely payment will be made to covered bondholders following issuer default. The effect of the TPI framework is to limit the covered bond rating to a certain number of notches above the issuer's rating. SENSITIVITY ANALYSIS: The robustness of a covered bond rating largely depends on the credit strength of the issuer. The number of notches by which the issuer's rating may be downgraded before the covered bonds are downgraded under the TPI framework is measured by the TPI Leeway. Based on the current TPI of Probable the TPI Leeway for this program is 3 notches, meaning the issuer rating would need to be downgraded to Baa1 before the covered bonds are downgraded, all other things being equal. A multiple notch downgrade of the covered bonds might occur in certain limited circumstances. Some examples might be (a) a sovereign downgrade negatively affecting both the issuer's senior unsecured rating and the TPI; (b) a multiple notch down-grade of the issuer; or (c) a material reduction of the value of the cover pool. For further details on Cover Pool Losses, Collateral Risk, Market Risk, Collateral Score and TPI Leeway across all covered bond programs rated by Moody's please refer to "Moody's EMEA Covered Bonds Monitoring Overview", published quarterly. These figures are based on the most recent Performance Overview published by Moody's and are subject to change over time.
S&P 29 September 2009
Program Summary: Standard & Poor's Ratings Services has assigned its 'AAA' preliminary credit rating to Barclays Bank PLC's (Barclays) series 2009-1 covered bonds to be issued under its €35 billion covered bond program. The preliminary rating reflects our expectation of timely payment of interest and ultimate repayment of principal on or before the final maturity date of the covered bonds. It also considers the structural features in place to mitigate certain market value, interest rate, and currency risks; credit and cash flow analyses to verify that the covered bonds will be repaid under stress test scenarios; and other relevant aspects of the structure presented to us. All of the loans backing the covered bonds are made to prime owner-occupied borrowers, secured by a first charge or equivalent over properties in England, North-ern Ireland, Scotland, and Wales. Under the program, Barclays will issue the covered bonds, which represent direct, unsecured obligations of the issuer. Covered bondholders have recourse to the general assets of the bank and to a pool of U.K. residential mortgage loans. A guaran-tee from Barclays Covered Bonds LLP (the LLP) will provide recourse to the mortgage loans. If Barclays were to default in its payment obli-gations under the covered bonds, the assets held by the LLP would need to be liquidated to repay the covered bondholders. The LLP's ability to meet its obligations under the guarantee will depend on the realizable value of the mortgage loans, the amount of interest and principal generated by the LLP's assets, and any counterparty payments. This covered bond program incorporates many of the features of other U.K. residential mortgage covered bond programs, such as a covered bond guarantee, a dynamic asset-coverage test (ACT), an amortization test, a reserve fund, a pre-maturity test, and extendable maturities. Series 2009-1 will comprise hard-bullet covered bonds. An ACT is also in place to provide ongoing protection against credit risk and market risk. The current asset percentage as determined by Standard & Poor's under the program is 85.5%, an effective minimum overcollateralization level of 17.0%. In our analysis, we assume the issuer's insolvency and look to the pool to repay the covered bonds. In our 'AAA' scenario, we make assumptions regarding credit risk, market risk, and liquidity risk inherent in the pool. The rating reflects the likelihood of the covered bonds being repaid, allowing for these assumptions. HM Treasury
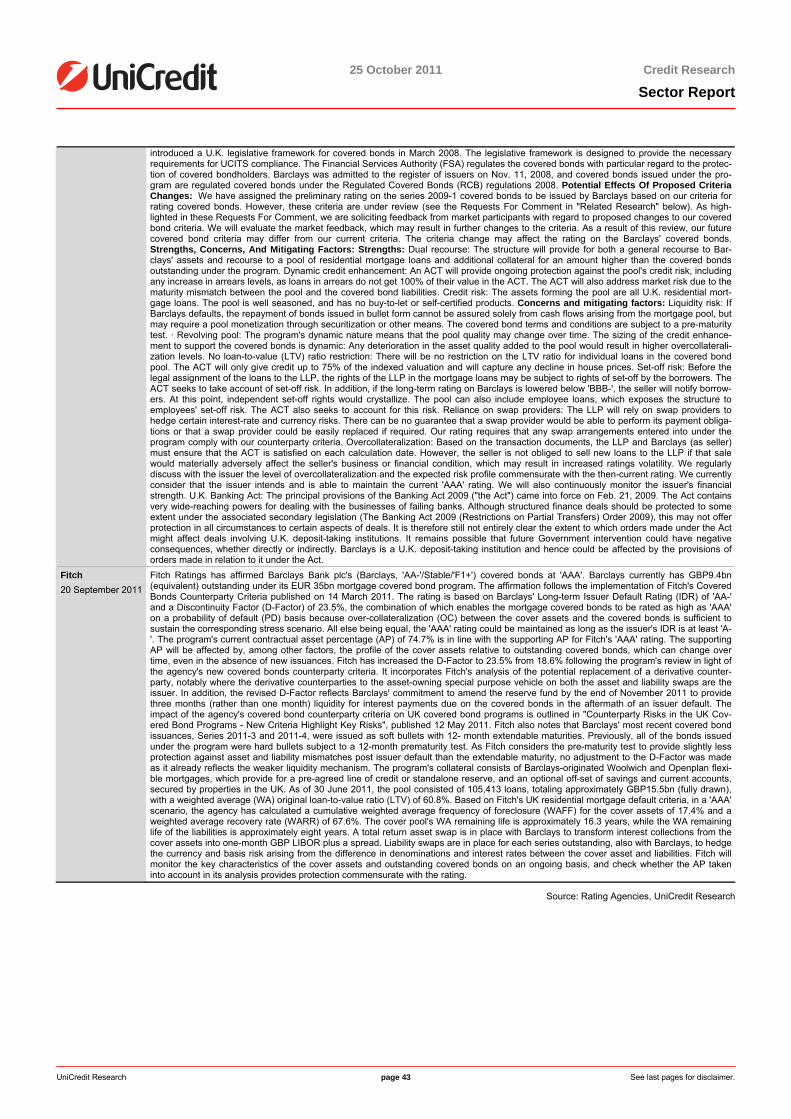
25 October 2011 Credit Research
Sector Report
UniCredit Research page 43 See last pages for disclaimer.
introduced a U.K. legislative framework for covered bonds in March 2008. The legislative framework is designed to provide the necessary requirements for UCITS compliance. The Financial Services Authority (FSA) regulates the covered bonds with particular regard to the protec-tion of covered bondholders. Barclays was admitted to the register of issuers on Nov. 11, 2008, and covered bonds issued under the pro-gram are regulated covered bonds under the Regulated Covered Bonds (RCB) regulations 2008. Potential Effects Of Proposed Criteria Changes: We have assigned the preliminary rating on the series 2009-1 covered bonds to be issued by Barclays based on our criteria for rating covered bonds. However, these criteria are under review (see the Requests For Comment in "Related Research" below). As high-lighted in these Requests For Comment, we are soliciting feedback from market participants with regard to proposed changes to our covered bond criteria. We will evaluate the market feedback, which may result in further changes to the criteria. As a result of this review, our future covered bond criteria may differ from our current criteria. The criteria change may affect the rating on the Barclays' covered bonds. Strengths, Concerns, And Mitigating Factors: Strengths: Dual recourse: The structure will provide for both a general recourse to Bar-clays' assets and recourse to a pool of residential mortgage loans and additional collateral for an amount higher than the covered bonds outstanding under the program. Dynamic credit enhancement: An ACT will provide ongoing protection against the pool's credit risk, including any increase in arrears levels, as loans in arrears do not get 100% of their value in the ACT. The ACT will also address market risk due to the maturity mismatch between the pool and the covered bond liabilities. Credit risk: The assets forming the pool are all U.K. residential mort-gage loans. The pool is well seasoned, and has no buy-to-let or self-certified products. Concerns and mitigating factors: Liquidity risk: If Barclays defaults, the repayment of bonds issued in bullet form cannot be assured solely from cash flows arising from the mortgage pool, but may require a pool monetization through securitization or other means. The covered bond terms and conditions are subject to a pre-maturity test. · Revolving pool: The program's dynamic nature means that the pool quality may change over time. The sizing of the credit enhance-ment to support the covered bonds is dynamic: Any deterioration in the asset quality added to the pool would result in higher overcollaterali-zation levels. No loan-to-value (LTV) ratio restriction: There will be no restriction on the LTV ratio for individual loans in the covered bond pool. The ACT will only give credit up to 75% of the indexed valuation and will capture any decline in house prices. Set-off risk: Before the legal assignment of the loans to the LLP, the rights of the LLP in the mortgage loans may be subject to rights of set-off by the borrowers. The ACT seeks to take account of set-off risk. In addition, if the long-term rating on Barclays is lowered below 'BBB-', the seller will notify borrow-ers. At this point, independent set-off rights would crystallize. The pool can also include employee loans, which exposes the structure to employees' set-off risk. The ACT also seeks to account for this risk. Reliance on swap providers: The LLP will rely on swap providers to hedge certain interest-rate and currency risks. There can be no guarantee that a swap provider would be able to perform its payment obliga-tions or that a swap provider could be easily replaced if required. Our rating requires that any swap arrangements entered into under the program comply with our counterparty criteria. Overcollateralization: Based on the transaction documents, the LLP and Barclays (as seller) must ensure that the ACT is satisfied on each calculation date. However, the seller is not obliged to sell new loans to the LLP if that sale would materially adversely affect the seller's business or financial condition, which may result in increased ratings volatility. We regularly discuss with the issuer the level of overcollateralization and the expected risk profile commensurate with the then-current rating. We currently consider that the issuer intends and is able to maintain the current 'AAA' rating. We will also continuously monitor the issuer's financial strength. U.K. Banking Act: The principal provisions of the Banking Act 2009 ("the Act") came into force on Feb. 21, 2009. The Act contains very wide-reaching powers for dealing with the businesses of failing banks. Although structured finance deals should be protected to some extent under the associated secondary legislation (The Banking Act 2009 (Restrictions on Partial Transfers) Order 2009), this may not offer protection in all circumstances to certain aspects of deals. It is therefore still not entirely clear the extent to which orders made under the Act might affect deals involving U.K. deposit-taking institutions. It remains possible that future Government intervention could have negative consequences, whether directly or indirectly. Barclays is a U.K. deposit-taking institution and hence could be affected by the provisions of orders made in relation to it under the Act.
Fitch 20 September 2011
Fitch Ratings has affirmed Barclays Bank plc's (Barclays, 'AA-'/Stable/'F1+') covered bonds at 'AAA'. Barclays currently has GBP9.4bn (equivalent) outstanding under its EUR 35bn mortgage covered bond program. The affirmation follows the implementation of Fitch's Covered Bonds Counterparty Criteria published on 14 March 2011. The rating is based on Barclays' Long-term Issuer Default Rating (IDR) of 'AA-' and a Discontinuity Factor (D-Factor) of 23.5%, the combination of which enables the mortgage covered bonds to be rated as high as 'AAA' on a probability of default (PD) basis because over-collateralization (OC) between the cover assets and the covered bonds is sufficient to sustain the corresponding stress scenario. All else being equal, the 'AAA' rating could be maintained as long as the issuer's IDR is at least 'A-'. The program's current contractual asset percentage (AP) of 74.7% is in line with the supporting AP for Fitch's 'AAA' rating. The supporting AP will be affected by, among other factors, the profile of the cover assets relative to outstanding covered bonds, which can change over time, even in the absence of new issuances. Fitch has increased the D-Factor to 23.5% from 18.6% following the program's review in light of the agency's new covered bonds counterparty criteria. It incorporates Fitch's analysis of the potential replacement of a derivative counter-party, notably where the derivative counterparties to the asset-owning special purpose vehicle on both the asset and liability swaps are the issuer. In addition, the revised D-Factor reflects Barclays' commitment to amend the reserve fund by the end of November 2011 to provide three months (rather than one month) liquidity for interest payments due on the covered bonds in the aftermath of an issuer default. The impact of the agency's covered bond counterparty criteria on UK covered bond programs is outlined in "Counterparty Risks in the UK Cov-ered Bond Programs - New Criteria Highlight Key Risks", published 12 May 2011. Fitch also notes that Barclays' most recent covered bond issuances, Series 2011-3 and 2011-4, were issued as soft bullets with 12- month extendable maturities. Previously, all of the bonds issued under the program were hard bullets subject to a 12-month prematurity test. As Fitch considers the pre-maturity test to provide slightly less protection against asset and liability mismatches post issuer default than the extendable maturity, no adjustment to the D-Factor was made as it already reflects the weaker liquidity mechanism. The program's collateral consists of Barclays-originated Woolwich and Openplan flexi-ble mortgages, which provide for a pre-agreed line of credit or standalone reserve, and an optional off-set of savings and current accounts, secured by properties in the UK. As of 30 June 2011, the pool consisted of 105,413 loans, totaling approximately GBP15.5bn (fully drawn), with a weighted average (WA) original loan-to-value ratio (LTV) of 60.8%. Based on Fitch's UK residential mortgage default criteria, in a 'AAA' scenario, the agency has calculated a cumulative weighted average frequency of foreclosure (WAFF) for the cover assets of 17.4% and a weighted average recovery rate (WARR) of 67.6%. The cover pool's WA remaining life is approximately 16.3 years, while the WA remaining life of the liabilities is approximately eight years. A total return asset swap is in place with Barclays to transform interest collections from the cover assets into one-month GBP LIBOR plus a spread. Liability swaps are in place for each series outstanding, also with Barclays, to hedge the currency and basis risk arising from the difference in denominations and interest rates between the cover asset and liabilities. Fitch will monitor the key characteristics of the cover assets and outstanding covered bonds on an ongoing basis, and check whether the AP taken into account in its analysis provides protection commensurate with the rating.
Source: Rating Agencies, UniCredit Research
25 October 2011 Credit Research
Sector Report
UniCredit Research page 44 See last pages for disclaimer.
Clydesdale Key characteristics Ratings: A2n/A+n/A+s Bloomberg: 1183Z LN Bond ticker: CLYDES www.cbonline.co.uk
Clydesdale Bank plc, with group total assets of GBP 44bn at end-March 2011, is a me-dium-sized regional UK bank and is one of Scotland's largest banks, with more than 150 retail branches and a network of "Financial Solutions Centers". It also has an in-creasing focus on Southern England. Clydesdale is a wholly owned subsidiary of National Australia Bank, the fifth continent's largest bank by total assets (AUD 686bn). Clydesdaleprovides a variety of banking services for personal and business customers with its retailbranches, integrated Financial Solutions Centers (iFS), direct banking and brokers. The main target groups are retail (retail branch networks and small business customers) and business customers (including Financial Solutions Centers). Clydesdale's Yorkshire Bank brand, head-quartered in Leeds, has over 180 branches and 22 Financial Solution Centers in the north of England and the Midlands. Given its size, UK government support appears limited for Clydes-dale; however, the bank is important for the UK clearing system, has leading market positions, and is a major banknote issuer in Scotland. Government support for senior claims, if ever needed, is therefore probable, in our view. Moreover, institutional protection should be forth-coming from its parent, although there are no explicit guarantees. During the financial crisis,Clydesdale did not rely on any kind of external support. Clydesdale was established in 1838,became a member of NAB in 1987, and in 2004 it absorbed Yorkshire Bank plc (not to be confused with Yorkshire Building Society), which was already a member of NAB Group (NAB sold its two Irish banks and merged its British banks that year), and continues as a separatebrand name.
CLYDESDALE: SWOT ANALYSIS Strengths/Opportunities Weaknesses/Threats Implicit protection from its parent, National Australia Bank Challenge of a more competitive environment Comfortable capitalization No unique selling proposition compared to peers Good asset quality If profitability does not improve, the owner might implement restructuring Sound funding and liquidity situation No support needed during the crisis
Source: UniCredit Research 1H10/11 results, trading update from August 2011 and outlook
For 1H10/11 (six months to March 2011), Clydesdale reported net "cash" (excluding fairvalue and hedge ineffectiveness results) profit of GBP 77mn (+26% yoy). On a net at-tributable basis, there was a loss of GBP 43mn, mainly due to the industry-wide Payment Protection Insurance issue resulting in a provision of GBP 116mn. While revenues remained stable and costs decreased slightly, a 17.5% drop in loan-loss provisions generated the profit surge. Overall, balance sheet figures were stable compared to September 2010. However, RWA decreased and regulatory capital increased by GBP 200mn in preferred shares issued in December 2010, leading to a 60bp higher Tier-1 ratio of 9.6%. Also, funding (loan/deposit ratio of 72%) and liquidity (GBP 9.8bn liquid assets) remained at constantly sound levels. In its 3Q11 trading update from 9 August 2011, NAB jointly updated on its UK Banking opera-tions (Clydesdale and Yorkshire Banks). Regarding customer support, UK Banking accom-plished its two-year pledge of GBP 10bn of gross new lending to businesses and mortgage customers before its October 2011 target. Business-wise, the gradual improvement in per-formance in 3Q11 continued. In spite of restrained credit demand, above system growth has been accomplished in business lending and mortgages. Furthermore, the charge for bad and doubtful debts was lower, but will remain dependant on a sustained improvement in economicconditions. The asset quality ratio of 90+ days past due and gross impaired assets to grossloans and acceptances has improved to 3.27% from 3.44% in 2Q11. Regarding the outlook,the UK CEO David Thorburn commented that, the "current uncertain economic environment underscores the need for us to continue to pursue our strategy of conservative and prudentbanking.”
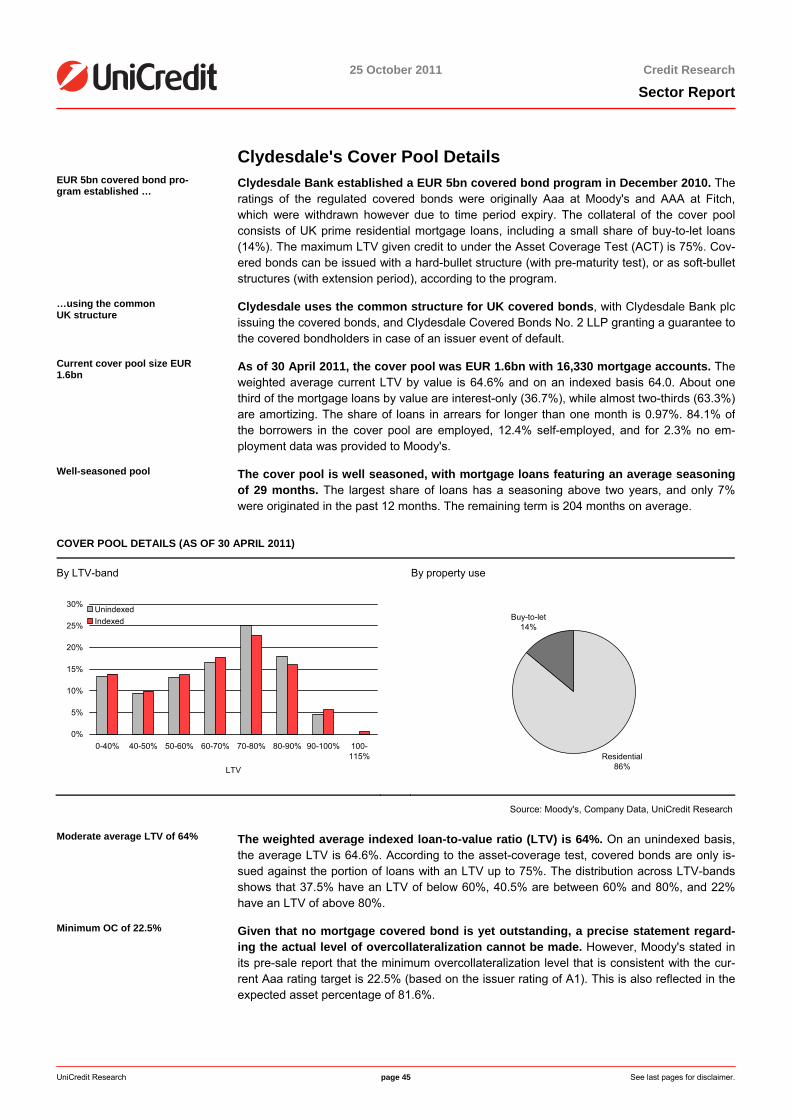
25 October 2011 Credit Research
Sector Report
UniCredit Research page 45 See last pages for disclaimer.
Clydesdale's Cover Pool Details EUR 5bn covered bond pro-gram established …
Clydesdale Bank established a EUR 5bn covered bond program in December 2010. The ratings of the regulated covered bonds were originally Aaa at Moody's and AAA at Fitch, which were withdrawn however due to time period expiry. The collateral of the cover poolconsists of UK prime residential mortgage loans, including a small share of buy-to-let loans (14%). The maximum LTV given credit to under the Asset Coverage Test (ACT) is 75%. Cov-ered bonds can be issued with a hard-bullet structure (with pre-maturity test), or as soft-bullet structures (with extension period), according to the program.
…using the common UK structure
Clydesdale uses the common structure for UK covered bonds, with Clydesdale Bank plc issuing the covered bonds, and Clydesdale Covered Bonds No. 2 LLP granting a guarantee tothe covered bondholders in case of an issuer event of default.
Current cover pool size EUR 1.6bn
As of 30 April 2011, the cover pool was EUR 1.6bn with 16,330 mortgage accounts. The weighted average current LTV by value is 64.6% and on an indexed basis 64.0. About onethird of the mortgage loans by value are interest-only (36.7%), while almost two-thirds (63.3%) are amortizing. The share of loans in arrears for longer than one month is 0.97%. 84.1% ofthe borrowers in the cover pool are employed, 12.4% self-employed, and for 2.3% no em-ployment data was provided to Moody's.
Well-seasoned pool The cover pool is well seasoned, with mortgage loans featuring an average seasoning of 29 months. The largest share of loans has a seasoning above two years, and only 7%were originated in the past 12 months. The remaining term is 204 months on average.
COVER POOL DETAILS (AS OF 30 APRIL 2011)
By LTV-band By property use
0%
5%
10%
15%
20%
25%
30%
0-40% 40-50% 50-60% 60-70% 70-80% 80-90% 90-100% 100-115%
LTV
UnindexedIndexed
Residential86%
Buy-to-let14%
Source: Moody's, Company Data, UniCredit Research
Moderate average LTV of 64% The weighted average indexed loan-to-value ratio (LTV) is 64%. On an unindexed basis, the average LTV is 64.6%. According to the asset-coverage test, covered bonds are only is-sued against the portion of loans with an LTV up to 75%. The distribution across LTV-bands shows that 37.5% have an LTV of below 60%, 40.5% are between 60% and 80%, and 22%have an LTV of above 80%.
Minimum OC of 22.5% Given that no mortgage covered bond is yet outstanding, a precise statement regard-ing the actual level of overcollateralization cannot be made. However, Moody's stated in its pre-sale report that the minimum overcollateralization level that is consistent with the cur-rent Aaa rating target is 22.5% (based on the issuer rating of A1). This is also reflected in the expected asset percentage of 81.6%.

25 October 2011 Credit Research
Sector Report
UniCredit Research page 46 See last pages for disclaimer.
Number Crunching
CLYDESDALE BANK: P&L HIGHLIGHTS
Year ending (GBP mn) 31/03/2011 30/09/2010 30/09/2009 30/09/2008 30/09/2007 30/09/2006Net interest revenue 489 960 845 896 862 782Net fees & commissions 119 227 239 268 232 224Trading income -47 -49 9 31 60 38Other operating income 9 -2 29 25 55 72Total revenues 570 1,136 1,122 1,220 1,209 1,116Operating expenses 365 728 686 701 701 676Loan-loss provisions 150 362 399 179 117 129Operating profit 55 46 37 340 391 311Other income/expenses -116 3 11 10 13 155Pretax profit -61 49 48 350 404 466Attributable net profit -43 36 34 247 277 326
CLYDESDALE BANK: B/S HIGHLIGHTS
Year ending (GBP mn) 31/03/2011 30/09/2010 30/09/2009 30/09/2008 30/09/2007 30/09/2006Assets Liquid assets 3,840 4,051 3,228 6,957 4,107 3,737Customer loans 35,060 34,847 34,445 32,431 27,832 24,376Other assets 4,062 4,762 4,697 2,588 3,622 1,022Total assets 42,962 43,660 42,370 41,976 35,561 29,135Liabilities & equity Customer deposits 27,928 28,500 26,717 22,334 19,319 17,081Senior debt >1Y 3,831 3,959 4,837 5,175 5,183 1,702Subordinated debt 1,276 1,176 1,176 1,302 867 245Other liabilities 7,495 7,578 7,490 11,001 8,070 8,424Total equity 2,432 2,447 2,150 2,164 2,122 1,683Total liabilities & equity 42,962 43,660 42,370 41,976 35,561 29,135
CLYDESDALE BANK: KEY RATIOS
Year ending 31/03/2011 30/09/2010 30/09/2009 30/09/2008 30/09/2007 30/09/2006Profitability Net interest margin 2.58% 2.50% 2.29% 2.67% 2.96% 3.35%Cost/income ratio 64.0% 64.1% 61.1% 57.5% 58.0% 60.6%Return on average assets -0.2% 0.1% 0.1% 0.6% 0.9% 1.3%Return on average equity -3.4% 1.5% 1.5% 11.5% 14.6% 23.5%Liquidity Interbank ratio 0.4% 0.3% 7.8% 20.5% 34.9% 26.1%Loans/deposits 126.9% 123.5% 130.2% 146.5% 145.3% 144.2%Net loans/total assets 81.6% 79.8% 81.3% 77.3% 78.3% 83.7%Liquid assets/deposits & ST Fund-ing
12.0% 12.5% 10.4% 22.8% 16.4% 15.8%
Asset quality Loan loss reserves/gross loans 1.06% 1.03% 0.97% 0.86% 0.85% 1.02%NPL ratio 2.40% 2.14% 1.44% 0.61% 0.22% 0.27%NPL coverage 44.12% 48.01% 67.20% 139.30% 380.95% 373.13%Capital Tier-1 ratio 9.6% 9.0% 8.2% 7.4% 7.8% n.a.Total capital ratio 15.1% 14.1% 13.1% 11.3% 12.6% n.a.Equity/total assets 5.7% 5.6% 5.1% 5.2% 6.0% 5.8%
Source: BankScope, UniCredit Research
25 October 2011 Credit Research
Sector Report
UniCredit Research page 47 See last pages for disclaimer.
Rating Agencies' View
CLYDESDALE BANK: RATING PROFILE
Covered Bonds Long-term Short-term Outlook Financial Strength Support/FloorMoody’s Aaa A2 P-1 negative C- -S&P --- A+ A-1 negative - -Fitch AAA A+ F1 stable C 1
Source: Rating agencies, UniCredit Research
RATING AGENCIES' COMMENTS ON CLYDESDALE BANK
Agency Comment Moody's 18 October 2011
Summary Rating Rationale: Moody's assigns a C- BFSR to Clydesdale Bank, which translates into a baseline credit assessment (BCA) of Baa1. This reflects its good intrinsic financial fundamentals and its valuable and defensible business franchise in both Scotland and the North of England. The rating also reflects the bank's stable funding base and the improvement in liquidity over recent years and balances this against the exposure that the bank has to the difficult UK environment, especially with regard to commercial property and the impact that this is having on the bank's profitability and asset quality. The A2/Prime-1 bank deposit ratings of Clydesdale Bank reflect its Baa1 baseline credit assessment as well as Moody's assessment of the high probability of support from its parent, National Australia Bank, in the event of need and the moderate probability of the bank receiving systemic support. This is based on the bank's position within the UK clearing system, its market position in Scotland and its role as a bank note issuer in Scotland. The recent reduction in parental support incorporated in the rating follows public comments from senior management at NAB, which suggest that, although NAB is likely to remain a supportive parent of Clydesdale while it owns the bank, it is open to a sale of the bank in the future. In Moody's view the discussion about a potential sale of Clydesdale in the future raises questions about the long-term strategic commitment of NAB to the UK market. Therefore Moody's has re-duced the uplift from the standalone rating incorporated into the ratings to one notch from two notches previously and as a result the adjusted baseline credit assessment (the standalone rating incorporating parental support) is now A3. Credit Strengths: (-) Its position as an integral part of the National Australia Bank Group (-) Diversified banking franchises in Scotland and in the North of England (-) Stable funding base (-) Improved capitalization Credit Challenges: (-) Continuing to build on the strong franchises, given the competitive nature of the markets in which the bank operates (-) Managing asset quality in less benign economic conditions (-) Maintaining the improved liquidity position of the bank (-) Managing the potential impact from the UK government's austerity measures Rating Outlook: The outlook on the A2 bank deposit and senior debt ratings, and on the Baa1 subordinated debt rating is negative. This is in line with Moody's view on the BCA of the bank, incorporating the difficult economic environment, pressures on wholesale funding markets and the potential impact of the UK government's austerity measures. What Could Change the Rating – Up: Any upward pressure on Clydesdale's BFSR would likely be dependent on a further strengthening of the bank's capital base given the likelihood of loan losses remaining elevated in the medium-term as a result of the exposure to commercial property and the challenging economic conditions in the UK. Following the recent downgrade of both Clydesdale and NAB there is little likelihood of upward pressure on the A2 senior ratings in the medium-term. What Could Change the Rating – Down: Negative pressure on Clydesdale's BFSR/BCA would be likely to stem from a significant decline in profitability, deterioration in asset quality and/or a weakening of its strong franchise in Scotland and the North of England. A downgrade of the Baa1 baseline credit assessment would likely lead to a downgrade of the A2 senior ratings.
S&P 29 June 2011
Rationale: The ratings on Clydesdale Bank PLC reflect Standard & Poor's Ratings Services' view of its strategically important position within the group headed by National Australia Bank Ltd. (NAB; AA/Stable/A-1+). The ratings on Clydesdale benefit from a three-notch uplift under Standard & Poor's group rating methodology. We consider Clydesdale to be of moderate systemic importance to the U.K. banking system, but factor no governmental support into the ratings on the bank. Clydesdale is a midsize bank (with 2010 earning assets of GBP 37.5bn) that offers a broad range of retail and business services. It has a relatively small market share nationwide, but stronger presence in Scotland and North of England where it uses the Clydesdale and Yorkshire brands, respectively. The ratings incorporate Standard & Poor's expectation of a gradual stabilization of asset quality and operating performance albeit in a challenged and uncertain operating environment. Although Clydesdale has reduced its exposure to the property and construction (P&C) sector with no material single loan concentrations and limited exposure to higher volatility development loans, we consider that Clydesdale continues to have significant exposure to this sector. In addi-tion, we note that while the non-property business lending portfolio is well diversified by industry sector, the relative concentration of the portfolio in economically vulnerable regions in Scotland and Northern England will continue to be a near-term challenge. Clydesdale's re-ported pretax profit in the year to Sept. 30, 2010 stabilized after the sharp drop in 2009 (GBP 49mn compared with GBP 48mn in 2009). The credit loss charge (as measured by new loan loss provisions/average customer loans) showed a small improvement from 1.22% in 2009 to 1.11% in 2010. Our base-case expectation is that credit loss charges will continue to be high in the medium term (given headwinds such as anemic economic growth, rising interest rates, and public sector spending cuts) with new loan loss provisions/average customer loans for the year ended Sept. 30, 2011 broadly stable at around the 1% to 1.1% level. Net interest margin (net interest income/average earning assets) improved from 2.24% in 2009 to 2.56% in 2010. However, in our view, higher average cost of funding will likely offset the benefits of any upward re-pricing of the loan book. As a result, we expect 2011 net interest margin to be at or slightly below 2010 levels. Given the combina-tion of stable but continued substantial credit loss charges and broadly flat net interest margin, we expect underlying performance in the year to Sept. 30, 2011 to be close to 2010 levels. However, we expect that the recently announced one-time payment protection insurance (PPI) provision of an additional GBP 100mn will result in a modest pretax loss for the year. In our view, Clydesdale's funding strategy remains a relative strength. The bank maintains a healthy deposit franchise with the loan-to-deposit ratio comparing satisfactorily with many U.K. peers, has good diversification in wholesale funding sources, and ownership by NAB provides additional funding flexibility. Standard & Poor's con-siders Clydesdale's capitalization to be satisfactory, as illustrated by a risk-adjusted capital (RAC) ratio of 9.7% (after diversification adjust-ments) at March 31, 2011. Capital has historically benefited from injections by the parent, with the most recent being a GBP 200mn preferred share investment in December 2010. Outlook: The negative outlook incorporates our view that the challenging operating environment will continue to weigh on the bank's asset quality and profitability. However, we expect the bank's overall creditworthiness to be supported by a stable market position, satisfactory capitalization, and good funding mix. The ratings could be lowered if: Credit losses appear likely to ex-ceed our expectations with new loan loss provisions/average customer loans increasing well above the 1.2% level, leading to material ero-sion in capital. Net interest margin declines below the 2.2%-2.3% level further pressure profitability. There is a material deterioration in Clydesdale's liquidity profile and funding mix. The ratings could also come under pressure if, in our view, there is an adverse change to Clydesdale's strategically important status in the NAB group. A change in Clydesdale's group status could result if, for example, in our opin-ion an improvement in market conditions increases the likelihood that NAB will consider strategic options for Clydesdale. The outlook could be revised to stable if management's efforts to manage the growth of the loan book and rebalance the portfolio toward higher-quality lending results in overall asset quality being more resilient than our expectation. At this time, we consider the possibility of a positive rating action as remote given the structural challenges of a midsize bank operating in economically vulnerable regions of the UK

25 October 2011 Credit Research
Sector Report
UniCredit Research page 48 See last pages for disclaimer.
Fitch 14 October 2011
Key Rating Drivers: Support-Driven IDRs: Clydesdale Bank PLC’s (CB) IDRs reflect Fitch’s view that support from its parent National Aus-tralia Bank Limited (NAB; ‘AA’/Stable) remains extremely likely. The Viability Rating (VR) reflects its satisfactory funding and liquidity, moder-ate impaired loans ratio and sufficient capitalisation. It also considers CB’s low profitability, high impairment charges and significant propor-tion of commercial property and SME lending, which the agency believes are more vulnerable to an anaemic economy, which could weaken. High Impairment Charges: Loan impairment charges remain high. Fitch Ratings believes that loan impairment charges are likely to have peaked but will remain high as the outlook for CB’s key UK markets remains difficult. H111 Loss After PPI: Underlying performance has improved with margins holding up well in the low interest rate environment. CB reported a loss in H111 after a one-off provision for payment protection insurance (PPI) mis-selling claims. Large Commercial Property Exposure: CB’s commercial property exposure constitutes around a fifth of gross loans with a material development finance element. Future asset quality deterioration is likely to be mitigated by the seasoning of the book, which is being managed down. Resilient Residential Mortgage Book: CB's medium-sized corporate and SME loan book (35% of end-H111 loans) is well diversified by sector and Fitch expects losses to remain manageable. The performance of CB's residential mortgage book (32% of end-H111 loans) has been resilient, supporting the bank’s moderate overall impaired loans ratio (end-H111: 2.4%). Satisfactory Funding: Fitch believes CB’s funding profile is satisfactory. Customer deposits have increased as a proportion of total funding and CB has reduced its reliance on funding from NAB. Liquidity is good, with cash and marketable securities covering its outstanding unsecured market funding. Fitch views capitalisation as sufficient in light of NAB’s regular capital injections. NAB Support Marginally Weaker: CB is wholly owned by NAB. Fitch believes there is an extremely high probability that NAB would provide financial support to CB if required. However, the more stringent regulation and a less favorable economic environment in the UK, may indicate that the UK banking sector has become less attractive to foreign banks. In Fitch’s view, the strategic importance of CB to its parent may be diminishing slightly. What Could Trigger a Rating Action: Strategic Importance to NAB: The Stable Outlook on CB’s Long-Term IDR reflects the Stable Outlook on NAB. Downside for the IDRs could arise from further changes in Fitch’s view of CB’s strategic importance to NAB. Viability Rating Upside Limited: The operating environment remains difficult, but upside to the VR could arise from improved profitability and reduced commercial property exposure. The VR could be downgraded if significant asset quality deterioration occurs, resulting in weakened earnings and capital.
Source: Rating Agencies, UniCredit Research
RATING AGENCIES' COMMENTS ON CLYDESDALE BANK COVERED BOND PROGRAM
Agency Comment Moody's 6 October 2011
Clydesdale postponed the planned issuance of the series 1 covered bonds. Moody's therefore withdrew the provisional rating assigned to the first series in line with "Moody's Investors Service's Policy for Withdrawal of Credit Ratings". Original Transaction Summary: In June 2011, Moody’s has assigned a provisional long-term rating of (P)Aaa to the covered bonds (the “covered bonds”) to be issued under the newly established €5 billion Global Covered Bond Programme of Clydesdale Bank plc (“Clydesdale”, or the “issuer”). As of 30 April 2011, the pool of assets (the “cover pool”) analysed by Moody’s consisted of 16,330 residential mortgage accounts with a total outstanding balance of £1.6 billion. The residential mortgages in the cover pool are all sterling-denominated and secured by mortgages on properties in the UK. The issuer transfers the cover pool by way of security to Clydesdale Covered Bonds No. 2 LLP (the “guarantor”, or the “SPV”), which in turn guarantees the issuer’s obligations to covered bondholders under the covered bonds. If an issuer event of default occurs, the guarantor will have access to the proceeds from the cover pool to fulfil its obligations under the guarantee.
Fitch 9 June 2011
In October 2011, Fitch has withdrawn Clydesdale Bank's (CB, 'A+'/Stable/'F1') No.2 programme mortgage covered bonds' expected rating. The withdrawal is due to the forthcoming debt issuance no longer proceeding as previously envisaged. The covered bond had an expected rating of 'AAA(exp)'. Original Rating Rationale: The ‘AAA’ expected rating assigned to Clydesdale Bank PLC’s (Clydesdale or the issuer) first public issue of mortgage covered bonds guaranteed by Clydesdale Covered Bonds No.2 Limited Liability Partnership (LLP) is based on the bank’s Long -Term Issuer Default Rating (IDR) of ‘AA−’, and on a Discontinuity Factor (D -Factor) of 19.3%. This combination enables the rating to reach ‘AAA’ on a probability -of -default (PD) basis because the asset percentage (AP, which measures the covered bonds issued as a proportion of the cover pool) is expected to be below 82.0% post issuance. The D -Factor of 19.3% is driven by: the segregation of the cover assets in the bankruptcy remote, special -purpose company acting as guarantor; the mitigants to liquidity gaps in the form of a cash reserve covering three months of interest payments on the covered bonds, and a 12 -month extendible maturity on the covered bonds versus Fitch Ratings’ assessment of the assets liquidity class (class 5 - needing up to nine months to liquidate in a stress scenario); the below -average — relative to other jurisdictions — provision for the guarantor to take appropriate decisions after issuer default and its ability to do so, aided by the ade-quate quality of the issuer’s IT systems; and the oversight of the Financial Services Authority (FSA) for the benefit of the covered bondhold-ers, as the issuer is regulated under the UK Regulated Covered Bond (RCB) framework. A dynamic asset coverage test (ACT) is in place to ensure that a minimum level of overcollateralization (OC) will be maintained by the issuer. The ACT stipulates that the AP cannot exceed 90% at any time. Highlights: At end -April 2011, the cover pool consisted of 16,330 loans granted to prime UK borrowers, with an aggregate outstanding balance of GBP1.6bn. The portfolio’s weighted -average (WA) original loan -to -value ratio (LTV) was 67.0%, with a WA current indexed LTV of 66.8%. The pool is diversified across the UK with a 30.6% concentration in Scotland. Around 14% of the pool is comprised of buy -to -let loans. In a ‘AAA’ scenario, Fitch calculated an expected loss of 8.3% for the cover pool. The covered bond is expected to be issued at a fixed rate, whereas the cover pool assets yield a mix of fixed and floating rate. Cover pool and covered bonds hedging agree-ments are expected be in place initially with Clydesdale. Fitch modeled maturity mismatches between the cover pool and covered bonds and found an AP of up to 82.0% to be sufficient to support the ‘AAA’ rating. The level of AP supporting the rating will be affected by, among other things, the profile of the cover assets relative to the covered bonds issued under the program, which can change over time, even in the ab-sence of new issuance. All else being equal, the covered bonds’ rating could still be maintained at ‘AAA’ if the issuer were rated as low as ‘BBB+’. Background: Under this program Clydesdale can periodically issue covered bonds secured on a dynamic pool of residential mort-gages and other eligible assets. The covered bonds rank pari passu among themselves and are direct, unconditional, unsecured and unsub-ordinated obligations of the issuer guaranteed by the LLP, a partnership entity established solely for the purposes of the program. The Pro-gram: The scope of the activities of the LLP — which guarantees the covered bonds — includes periodically acquiring mortgage loans from Clydesdale, together with their related security, and raising funds and guaranteeing the covered bonds. The guarantee pledged by the LLP plays a crucial role in Fitch’s assessment of the default probability of the covered bonds, compared with the issuer’s likelihood of default; it can allow the payments on the covered bonds to continue without interruption, despite the insolvency of the issuer, and allows Fitch to assign a rating above the issuer’s rating. Continuity Analysis Under Fitch’s covered bonds rating methodology, the covered bonds rated by the agency are assigned a D -Factor between 0% (best) and 100% (worst). The D –Factor reflects the likelihood of the covered bonds defaulting in the immediate aftermath of a default by the issuer. The D -Factor has four weighted components, which are analyzed below in relation to specific aspects of the issuer’s covered bond program.
Source: Rating Agencies, UniCredit Research
25 October 2011 Credit Research
Sector Report
UniCredit Research page 49 See last pages for disclaimer.
Coventry Building Society Key characteristics Ratings: A3s/-/As Bloomberg: 4620Z US Bond ticker: COVBS www.coventrybuildingsociety.co.uk
Coventry Building Society is the third-largest building society in the UK, with more than GBP 21bn in assets. Similar to other UK building societies, Coventry's main focusis to raise savings balances and to grant mortgage loans to its members. The building society entered into higher margin sectors such as buy-to-let, self-certified and non-conforming (but near prime) mortgages later than its peers, and takes a low-risk approach to these products. This allowed Coventry to keep its A-ratings in the credit crisis. While commer-cial lending ceased several years ago, various insurance companies that sideline the mort-gage business, as well as travel insurance companies, are offered. Coventry is mutual and therefore owned by its more than 1.5mn members. The building society employs more than 1,600 employees in its branches and call centre. In 1884, Coventry Permanent EconomicBuilding Society was founded. Following several mergers in the 1970's and 1980's, this entity became known as Coventry Building Society. In September 2010, Coventry completed theintegration of the Stroud & Swindon Building Society. Coventry now has a network of 92 branches and agencies in the Midlands, Southwest and Wales. This also allowed Coventry to expand its range of mortgage, savings and investment accounts and to offer cash cards as well as online accounts. With net mortgage lending of GBP 846mn as of 1H11, Coventry has a market share of 25% of all net mortgage lending in the UK, according to CML. Moreover, with gross mortgage advances of over GBP 1.9bn in 1H11, Coventry has a 3% market share in the UK mortgage lending and around 19% in all lending by mutual lenders, according to CML and BSA.
COVENTRY BUILDING SOCIETY: SWOT ANALYSIS Strengths/Opportunities Weaknesses/Threats Solid efficiency Questionable systemic support Good franchise Integration of Stroud & Swindon Robust profitability, capitalization and risk management
Source: UniCredit Research
1H11 results Coventry achieved record profits in 1H11, with net mortgage lending of 25% of the UK market. Underlying profit (operating profit after impairments and before exceptional items) before tax rose 10% yoy to GBP 51.1mn from GBP 46.5mn in 1H10. Profit before tax was GBP 45.0mnvs. GBP 43.5mn in 1H10 and net attributable profit increased by 9% yoy in 1H11 to GBP 33.7mn. This was driven by 12.6% higher net interest income yoy in 1H11 of GBP 89.6mn and 11.9% higher total income yoy of GBP 96.2mn. Expenses rose 18% yoy to GBP 37mnand impairment losses fell a whopping 59% yoy to GBP 4mn from GBP 6.8mn. However, the integration of Stroud & Swindon led to integration and merger-related costs of GBP 5mn vs. GBP 2mn in 1H10. Retail savings balances grew to a record GBP 17.7bn and the inaugural public covered bond issuance completed in April amounted to GBP 750mn. Since end-June 2007, total assets increased by GBP 9.7bn or 75.1% (excluding the now finalized integration of Stroud & Swindon, this amounted to GBP 7.2bn or 55.3%). Mortgage balances rose by GBP 7.8bn or 73.2%, and GBP 5.9bn or 55.4% excluding Stroud & Swindon since end-June 2007. Savings balances increased by GBP 9.2bn or 108.5%, and GBP 7bn or 82% excluding Stroud & Swindon since end-June 2007. The cost to average assets ratio was only 0.37%. Moreover, there were no provisions from the sale of Payment Protection Insurance. Coven-try's exposure to Irish banks was GBP 8.5mn and it had no exposure to Portugal, Italy,Greece or Spain. Regarding capitalization, Coventry reported a very solid core Tier-1 ratio of 24.1% vs. 22% as of end-December 2010. Regarding the outlook, Coventry believes that the current environment presents opportunities for growth and that it will report further progress between now and 2012.

25 October 2011 Credit Research
Sector Report
UniCredit Research page 50 See last pages for disclaimer.
Coventry's Cover Pool Details EUR 7bn covered bond pro-gram …
In April 2011, Coventry Building Society established a EUR 7bn covered bond program. As ofthe end of August 2011, it had GBP 2.2bn of covered bonds outstanding, backed by a coverpool of GBP 4.2bn. The most recent issue was a EUR 650mn covered bond with maturity in October 2014, its first in benchmark format. Coventry's covered bonds were registered asregulated covered bonds with the FSA and qualify for preferred treatment due to their CRD compliance. Coventry's covered bonds are rated Aaa and AAA by Moody's and Fitch, respec-tively.
…using the common UK structure
Coventry uses the common structure for UK covered bonds, with Coventry Building So-ciety issuing the covered bonds, and the LLP granting a guarantee to the covered bondhold-ers in case of an issuer event of default.
Cover pool size GBP 4.2bn As of the end of August 2011, the cover pool was EUR 4.2bn. With 38,766 mortgage ac-counts, it has a granular structure and the average loan balance is GBP 107,507. The weighted average current LTV by value is low with 55.0%, and on an indexed basis with54.4%. Only 17.5% of the mortgage loans are interest-only. There are no loans that are in arrears longer than three months. The amount of credit support is GBP 500.7mn, leading to an OC of 22.8% calculated in the Asset Coverage Test (ACT), with an asset percentage of 83.7% (Fitch) and 78.7% (Moody's).
Well-seasoned pool The cover pool is well seasoned, with mortgage loans featuring an average seasoning of 32 months. The largest share of loans has a seasoning of above two years (52%), andonly 22% were originated in the past 12 months. The remaining term is 17.2 years on aver-age. Regarding regional concentration, the cover pool has the common concentration in theLondon metropolitan area, with the Outer Metropolitan area contributing 15.6% and London14.2%, followed by West Midlands (14.9%) and Outer South East (12.5%).
Moderate average LTV of 54% The weighted average indexed loan-to-value ratio (LTV) is 54.4%. On an unindexed basis, the average LTV is 55.0%. According to the asset-coverage test, covered bonds are issued against the portion of loans with an LTV up to 75%. The distribution across LTV-bands shows that 52.8% have an LTV below 60%, 44.4% between 60% and 80%, and only 3.0% feature an LTV of above 80%. The high quality of the collateral is also reflected in Moody's collateralscore of 4.0%. Fitch assigned a D-Factor of 15.7% to Coventry's covered bonds and Moody's assigned a TPI of "Probable".
COVER POOL DETAILS (AS OF 31 AUGUST 2011)
By LTV-band By regional distribution
0
200
400
600
800
1,000
1,200
1,400
<25%
>=25
%<5
0%
>=50
%<5
5%
>=55
%<6
0%
>=60
%<6
5%
>=65
%<7
0%
>=70
%<7
5%
>=75
%<8
0%
>=80
%<8
5%
>=85
%<9
0%
>=90
%<9
5%
>=95
%<1
00%
>100
%
GB
P m
n
East Anglia
3.7% East Midlands 7.8%
London 14.2%
North 3.7%
North West 7.9%
Outer Metropolitan
15.6%
Outer South East
12.5%
South West 9.4%
Wales 3.1%
West Midlands 14.9%
Yorkshire and Humberside
Total 7.0%
Source: Moody's, Company Data, UniCredit Research
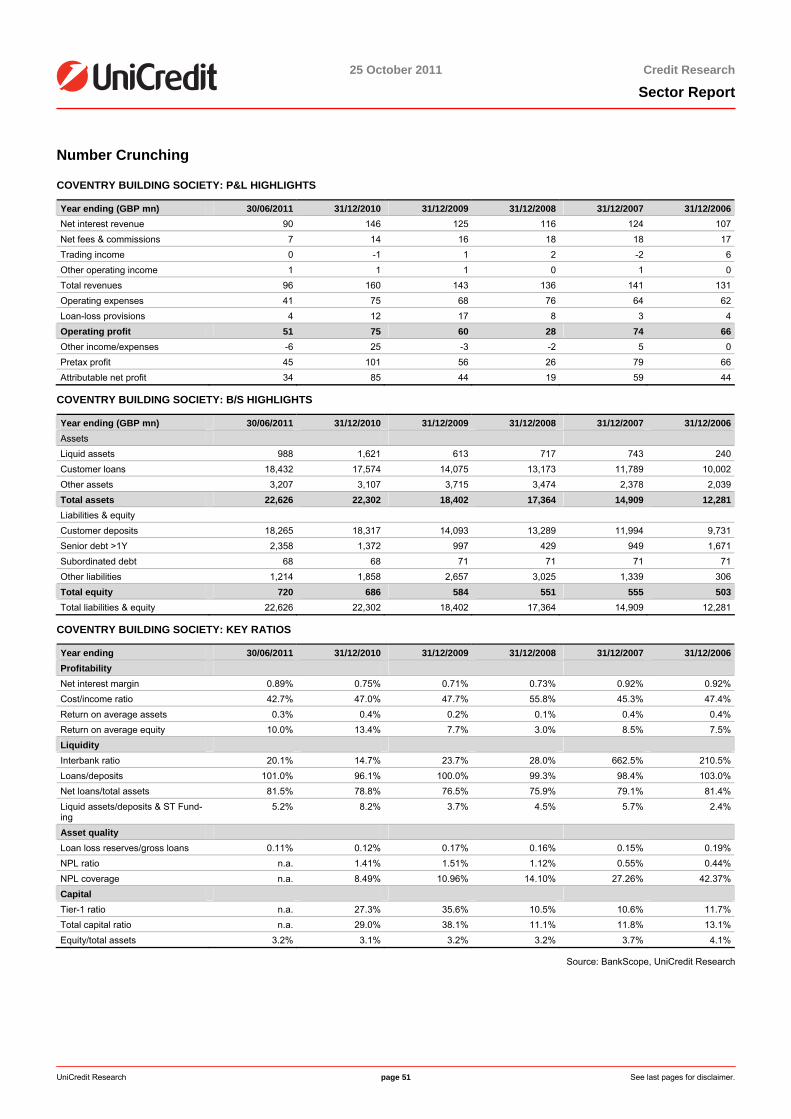
25 October 2011 Credit Research
Sector Report
UniCredit Research page 51 See last pages for disclaimer.
Number Crunching
COVENTRY BUILDING SOCIETY: P&L HIGHLIGHTS
Year ending (GBP mn) 30/06/2011 31/12/2010 31/12/2009 31/12/2008 31/12/2007 31/12/2006Net interest revenue 90 146 125 116 124 107Net fees & commissions 7 14 16 18 18 17Trading income 0 -1 1 2 -2 6Other operating income 1 1 1 0 1 0Total revenues 96 160 143 136 141 131Operating expenses 41 75 68 76 64 62Loan-loss provisions 4 12 17 8 3 4Operating profit 51 75 60 28 74 66Other income/expenses -6 25 -3 -2 5 0Pretax profit 45 101 56 26 79 66Attributable net profit 34 85 44 19 59 44
COVENTRY BUILDING SOCIETY: B/S HIGHLIGHTS
Year ending (GBP mn) 30/06/2011 31/12/2010 31/12/2009 31/12/2008 31/12/2007 31/12/2006Assets Liquid assets 988 1,621 613 717 743 240Customer loans 18,432 17,574 14,075 13,173 11,789 10,002Other assets 3,207 3,107 3,715 3,474 2,378 2,039Total assets 22,626 22,302 18,402 17,364 14,909 12,281Liabilities & equity Customer deposits 18,265 18,317 14,093 13,289 11,994 9,731Senior debt >1Y 2,358 1,372 997 429 949 1,671Subordinated debt 68 68 71 71 71 71Other liabilities 1,214 1,858 2,657 3,025 1,339 306Total equity 720 686 584 551 555 503Total liabilities & equity 22,626 22,302 18,402 17,364 14,909 12,281
COVENTRY BUILDING SOCIETY: KEY RATIOS
Year ending 30/06/2011 31/12/2010 31/12/2009 31/12/2008 31/12/2007 31/12/2006Profitability Net interest margin 0.89% 0.75% 0.71% 0.73% 0.92% 0.92%Cost/income ratio 42.7% 47.0% 47.7% 55.8% 45.3% 47.4%Return on average assets 0.3% 0.4% 0.2% 0.1% 0.4% 0.4%Return on average equity 10.0% 13.4% 7.7% 3.0% 8.5% 7.5%Liquidity Interbank ratio 20.1% 14.7% 23.7% 28.0% 662.5% 210.5%Loans/deposits 101.0% 96.1% 100.0% 99.3% 98.4% 103.0%Net loans/total assets 81.5% 78.8% 76.5% 75.9% 79.1% 81.4%Liquid assets/deposits & ST Fund-ing
5.2% 8.2% 3.7% 4.5% 5.7% 2.4%
Asset quality Loan loss reserves/gross loans 0.11% 0.12% 0.17% 0.16% 0.15% 0.19%NPL ratio n.a. 1.41% 1.51% 1.12% 0.55% 0.44%NPL coverage n.a. 8.49% 10.96% 14.10% 27.26% 42.37%Capital Tier-1 ratio n.a. 27.3% 35.6% 10.5% 10.6% 11.7%Total capital ratio n.a. 29.0% 38.1% 11.1% 11.8% 13.1%Equity/total assets 3.2% 3.1% 3.2% 3.2% 3.7% 4.1%
Source: BankScope, UniCredit Research

25 October 2011 Credit Research
Sector Report
UniCredit Research page 52 See last pages for disclaimer.
Rating Agencies' View
COVENTRY BUILDING SOCIETY: RATING PROFILE
Covered Bonds Long-term Short-term Outlook Financial Strength Support/FloorMoody’s Aaa A3 P-2 stable C -S&P - - - - - -Fitch AAA A F1 stable B 5
Source: Rating agencies, UniCredit Research
RATING AGENCIES' COMMENTS ON COVENTRY BUILDING SOCIETY
Agency Comment Moody's 24 August 2011
Summary Rating Rationale: Coventry's C BFSR (mapping to a long term scale rating of A3) reflects the society's good multi-regional fran-chise, which has been strengthened by the merger with Stroud & Swindon Building Society (S&S), its stable management, strong and im-proving deposit base and capital levels, its strong cost efficiency and earnings performance, as well as its relatively strong asset quality. The ratings also take into account Coventry's low net interest margins, which to some extent hampers its ability to replenish capital. We note, however, that the society's good performance in deposit retention and inflows have had the effect of constraining its margins somewhat, especially when compared to its peers and when taking into account the low risk nature of its assets. Moody's added that Coventry has com-pleted its legal merger with Stroud & Swindon ("S&S"), which should improve the society's geographic reach and create synergies for the combined entity to some extent (S&S's assets represent 13% of Coventry's assets before the merger). The integration of the two societies is on track but some execution risk remains in terms of integrating the relatively weaker S&S into Coventry and managing its operations. Poten-tial losses from S&S' purchased loan books, particularly its sub-prime and self-certification mortgages, were a cause for concern at the time of the merger announcement. However, Coventry has fair-valued the impact of such loans on its capital base and unless the fair-value of such loans is underestimated, no further losses from the S&S book of loans against the capital of the combined entity are expected; also noting that the asset quality of the S&S has indeed improved since the end of 2009 . Like most building societies in UK, Coventry has a strong liquidity profile with 100% of loans being funded with retail deposits. However, relative to its size and franchise in the UK banking system, the society's access to wholesale funding markets is of note among its peers, with an unsecured note issuance in October 2009 for £350 million and a public covered bond issuance of £750million in April 2011 which further support the society's already strong liquidity pro-file. Rating Outlook: The stable outlook on Coventry's ratings reflect its strong and improving capital levels relative to our forward looking loss scenarios, the resilience of its earnings, which should be able to withstand any downward pressure on its asset quality that may stem from the uncertain timing of the economic and housing recovery in the UK, as well as continued constraints in the credit and funding markets, which may pressure the society's financial performance in the medium term. Credit Strengths: (-) Well established strong multi-regional franchise with growing, nationwide customer base which should be strengthened further by its merger with S&S (-) Good level of efficiency especially relative to peers- indicating a tightly run business (-) overall asset quality strong compared to peers , taking into account its rela-tively high level of non-standard loans (-) Solid non-interest income generation capacity allows for greater flexibility to deal with price competi-tion on savings and mortgage products Credit Challenges: (-) Maintaining adequate profitability in the current low margin environment (-) Maintenance of asset quality (particularly in regard to non-standard mortgage lending) will continue to be a key rating factor; noting the non-performing loans from S&S have been fair-valued for the merger (-)Integration risks related to its merger with a much weaker entity, Stroud & Swindon What Could Change the Rating – Up: (-)Given continued uncertainties regarding the operating environment in the UK Coventry will be challenged to obtain a higher BFSR in the short term. However, continued demonstration of its ability to increase pre-provision income to bolster internal capital generation, and maintenance of low arrears in its prime as well as buy to let portfolio combined with containing rising arrears in its self-certified loans could put positive pressure on the ratings in the long-run. What Could Change the Rating – Down: (-) Coventry currently has a stable outlook however, worse than expected deterioration (under our base case scenario) of the asset quality of the Society's prime and buy-to-let loan book, and/or failure to control any deteriorating performance of Coventry's self-certified mortgage books could lead to downward pressure on the rating. We note, however, that this segment makes up only 4% of the portfolio. (-) A signifi-cant decline in pre-provision income, which would limit the Society's ability to maintain its capital cushion (-) A deterioration in the Society's funding position could also lead to negative rating pressure.
Fitch 24 June 2011
Rating Rationale: The ratings of Coventry Building Society (CBS) reflect its resilient profitability, strong capital position and conservative risk management. They also factor in its relatively limited geographical diversification and absolute size of capital. CBS’s profitability remained resilient during the global financial and economic crisis and was further enhanced by its merger with Stroud & Swindon Building Society (S&S) in September 2010. In contrast to a number of market participants with limited net lending, CBS has been in a position to continue lending, and has taken advantage of higher margins on new mortgages. With a strong focus on its core business of residential mortgages and customer deposits, and cost efficiencies, CBS consistently reports and one of the lowest cost/income ratios in the sector. In 2010, the society successfully increased operating profit by 27% yoy to GBP75m. Loan impairment charges (LICs) continued to fall from their 2008 peak to GBP11.8m in 2010, and Fitch Ratings expects LICs to remain manageable for the society in the short to medium term. CBS’s asset quality remains sound. As a result of conservative underwriting criteria and targeting prime residential and low loan/value ratio (LTV) buy-to-let (BTL) mortgages, its level of impaired loans has remained manageable. Fitch does not expect the small GBP15m commercial book ac-quired through the S&S merger to have a material impact on impaired loans. Funding is strong, and is largely made up of retail deposits; the loans/deposits ratio stood at just below 100% at end-2010. During 2010, deposit growth exceeded loan growth, and as a consequence CBS’s reliance on wholesale funding has reduced. Liquidity has increased somewhat in absolute terms, although CBS’s published liquidity ratio declined yoy to stand at 21% at end-2010. The composition, however, has been re-balanced to a significantly larger proportion of BoE re-serves and Gilts (>50% at end-2010 and 25% at end-2009). CBS’s capital ratios were strong at end-2010, with a Fitch core capital ratio of 22%, despite a dilution from the S&S merger. CBS benefits from low risk weights on its mortgages by using the Basel II internal ratings-based (IRB) approach, although its equity/total assets ratio is relatively weak as a result. Support: The Support Rating reflects Fitch’s re-vised view that support from the authorities for CBS’s wholesale senior unsecured debt, while possible, cannot be relied upon, especially following the introduction of the UK Banking Act in 2009. Key Rating Drivers: The Stable Outlook reflects CBS's strong Fitch core capital ratio and good asset quality. The society’s resilient profitability and ability to generate capital further underpins the outlook. A significant deterioration in profitability or higher impairment charges could trigger a ratings downgrade. Upside potential is limited, given CBS’s relatively small absolute size and limited geographical and product diversification.
Source: Rating Agencies, UniCredit Research
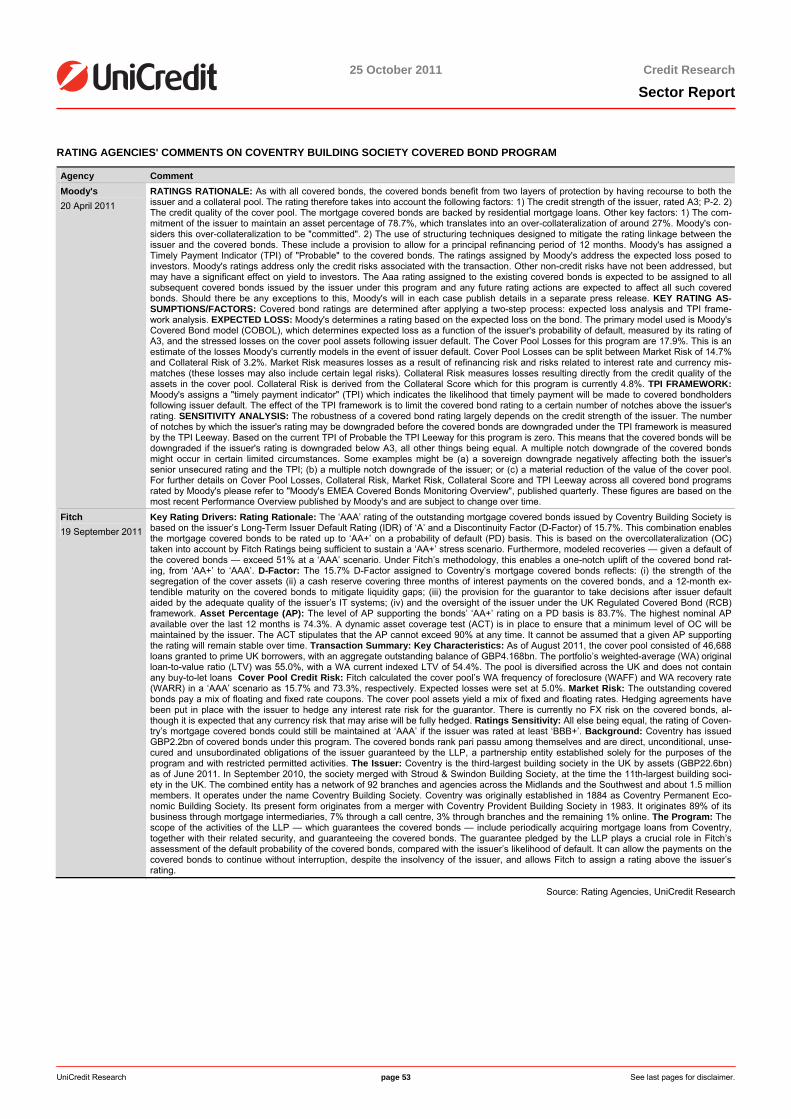
25 October 2011 Credit Research
Sector Report
UniCredit Research page 53 See last pages for disclaimer.
RATING AGENCIES' COMMENTS ON COVENTRY BUILDING SOCIETY COVERED BOND PROGRAM
Agency Comment Moody's 20 April 2011
RATINGS RATIONALE: As with all covered bonds, the covered bonds benefit from two layers of protection by having recourse to both the issuer and a collateral pool. The rating therefore takes into account the following factors: 1) The credit strength of the issuer, rated A3; P-2. 2) The credit quality of the cover pool. The mortgage covered bonds are backed by residential mortgage loans. Other key factors: 1) The com-mitment of the issuer to maintain an asset percentage of 78.7%, which translates into an over-collateralization of around 27%. Moody's con-siders this over-collateralization to be "committed". 2) The use of structuring techniques designed to mitigate the rating linkage between the issuer and the covered bonds. These include a provision to allow for a principal refinancing period of 12 months. Moody's has assigned a Timely Payment Indicator (TPI) of "Probable" to the covered bonds. The ratings assigned by Moody's address the expected loss posed to investors. Moody's ratings address only the credit risks associated with the transaction. Other non-credit risks have not been addressed, but may have a significant effect on yield to investors. The Aaa rating assigned to the existing covered bonds is expected to be assigned to all subsequent covered bonds issued by the issuer under this program and any future rating actions are expected to affect all such covered bonds. Should there be any exceptions to this, Moody's will in each case publish details in a separate press release. KEY RATING AS-SUMPTIONS/FACTORS: Covered bond ratings are determined after applying a two-step process: expected loss analysis and TPI frame-work analysis. EXPECTED LOSS: Moody's determines a rating based on the expected loss on the bond. The primary model used is Moody's Covered Bond model (COBOL), which determines expected loss as a function of the issuer's probability of default, measured by its rating of A3, and the stressed losses on the cover pool assets following issuer default. The Cover Pool Losses for this program are 17.9%. This is an estimate of the losses Moody's currently models in the event of issuer default. Cover Pool Losses can be split between Market Risk of 14.7% and Collateral Risk of 3.2%. Market Risk measures losses as a result of refinancing risk and risks related to interest rate and currency mis-matches (these losses may also include certain legal risks). Collateral Risk measures losses resulting directly from the credit quality of the assets in the cover pool. Collateral Risk is derived from the Collateral Score which for this program is currently 4.8%. TPI FRAMEWORK: Moody's assigns a "timely payment indicator" (TPI) which indicates the likelihood that timely payment will be made to covered bondholders following issuer default. The effect of the TPI framework is to limit the covered bond rating to a certain number of notches above the issuer's rating. SENSITIVITY ANALYSIS: The robustness of a covered bond rating largely depends on the credit strength of the issuer. The number of notches by which the issuer's rating may be downgraded before the covered bonds are downgraded under the TPI framework is measured by the TPI Leeway. Based on the current TPI of Probable the TPI Leeway for this program is zero. This means that the covered bonds will be downgraded if the issuer's rating is downgraded below A3, all other things being equal. A multiple notch downgrade of the covered bonds might occur in certain limited circumstances. Some examples might be (a) a sovereign downgrade negatively affecting both the issuer's senior unsecured rating and the TPI; (b) a multiple notch downgrade of the issuer; or (c) a material reduction of the value of the cover pool. For further details on Cover Pool Losses, Collateral Risk, Market Risk, Collateral Score and TPI Leeway across all covered bond programs rated by Moody's please refer to "Moody's EMEA Covered Bonds Monitoring Overview", published quarterly. These figures are based on the most recent Performance Overview published by Moody's and are subject to change over time.
Fitch 19 September 2011
Key Rating Drivers: Rating Rationale: The ‘AAA’ rating of the outstanding mortgage covered bonds issued by Coventry Building Society is based on the issuer’s Long-Term Issuer Default Rating (IDR) of ‘A’ and a Discontinuity Factor (D-Factor) of 15.7%. This combination enables the mortgage covered bonds to be rated up to ‘AA+’ on a probability of default (PD) basis. This is based on the overcollateralization (OC) taken into account by Fitch Ratings being sufficient to sustain a ‘AA+’ stress scenario. Furthermore, modeled recoveries — given a default of the covered bonds — exceed 51% at a ‘AAA’ scenario. Under Fitch’s methodology, this enables a one-notch uplift of the covered bond rat-ing, from ‘AA+’ to ‘AAA’. D-Factor: The 15.7% D-Factor assigned to Coventry’s mortgage covered bonds reflects: (i) the strength of the segregation of the cover assets (ii) a cash reserve covering three months of interest payments on the covered bonds, and a 12-month ex-tendible maturity on the covered bonds to mitigate liquidity gaps; (iii) the provision for the guarantor to take decisions after issuer default aided by the adequate quality of the issuer’s IT systems; (iv) and the oversight of the issuer under the UK Regulated Covered Bond (RCB) framework. Asset Percentage (AP): The level of AP supporting the bonds’ ‘AA+’ rating on a PD basis is 83.7%. The highest nominal AP available over the last 12 months is 74.3%. A dynamic asset coverage test (ACT) is in place to ensure that a minimum level of OC will be maintained by the issuer. The ACT stipulates that the AP cannot exceed 90% at any time. It cannot be assumed that a given AP supporting the rating will remain stable over time. Transaction Summary: Key Characteristics: As of August 2011, the cover pool consisted of 46,688 loans granted to prime UK borrowers, with an aggregate outstanding balance of GBP4.168bn. The portfolio’s weighted-average (WA) original loan-to-value ratio (LTV) was 55.0%, with a WA current indexed LTV of 54.4%. The pool is diversified across the UK and does not contain any buy-to-let loans Cover Pool Credit Risk: Fitch calculated the cover pool’s WA frequency of foreclosure (WAFF) and WA recovery rate (WARR) in a ‘AAA’ scenario as 15.7% and 73.3%, respectively. Expected losses were set at 5.0%. Market Risk: The outstanding covered bonds pay a mix of floating and fixed rate coupons. The cover pool assets yield a mix of fixed and floating rates. Hedging agreements have been put in place with the issuer to hedge any interest rate risk for the guarantor. There is currently no FX risk on the covered bonds, al-though it is expected that any currency risk that may arise will be fully hedged. Ratings Sensitivity: All else being equal, the rating of Coven-try’s mortgage covered bonds could still be maintained at ‘AAA’ if the issuer was rated at least ‘BBB+’. Background: Coventry has issued GBP2.2bn of covered bonds under this program. The covered bonds rank pari passu among themselves and are direct, unconditional, unse-cured and unsubordinated obligations of the issuer guaranteed by the LLP, a partnership entity established solely for the purposes of the program and with restricted permitted activities. The Issuer: Coventry is the third-largest building society in the UK by assets (GBP22.6bn) as of June 2011. In September 2010, the society merged with Stroud & Swindon Building Society, at the time the 11th-largest building soci-ety in the UK. The combined entity has a network of 92 branches and agencies across the Midlands and the Southwest and about 1.5 million members. It operates under the name Coventry Building Society. Coventry was originally established in 1884 as Coventry Permanent Eco-nomic Building Society. Its present form originates from a merger with Coventry Provident Building Society in 1983. It originates 89% of its business through mortgage intermediaries, 7% through a call centre, 3% through branches and the remaining 1% online. The Program: The scope of the activities of the LLP — which guarantees the covered bonds — include periodically acquiring mortgage loans from Coventry, together with their related security, and guaranteeing the covered bonds. The guarantee pledged by the LLP plays a crucial role in Fitch’s assessment of the default probability of the covered bonds, compared with the issuer’s likelihood of default. It can allow the payments on the covered bonds to continue without interruption, despite the insolvency of the issuer, and allows Fitch to assign a rating above the issuer’s rating.
Source: Rating Agencies, UniCredit Research
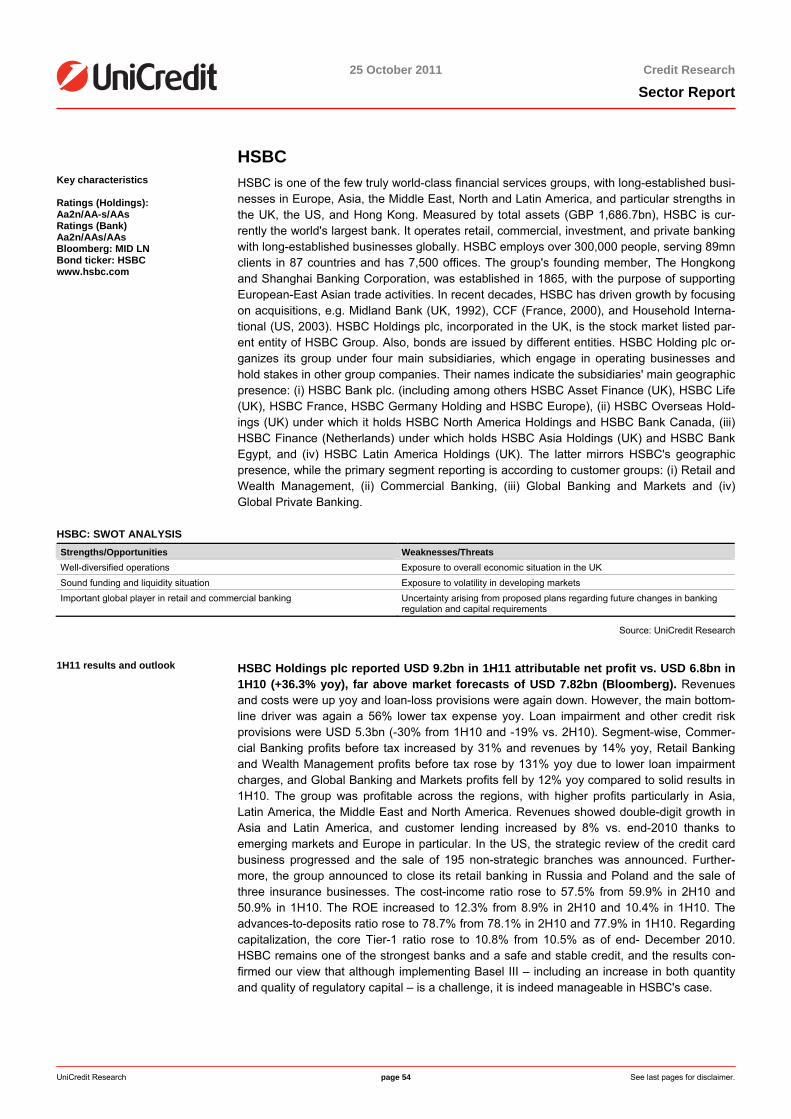
25 October 2011 Credit Research
Sector Report
UniCredit Research page 54 See last pages for disclaimer.
HSBC Key characteristics Ratings (Holdings): Aa2n/AA-s/AAs Ratings (Bank) Aa2n/AAs/AAs Bloomberg: MID LN Bond ticker: HSBC www.hsbc.com
HSBC is one of the few truly world-class financial services groups, with long-established busi-nesses in Europe, Asia, the Middle East, North and Latin America, and particular strengths in the UK, the US, and Hong Kong. Measured by total assets (GBP 1,686.7bn), HSBC is cur-rently the world's largest bank. It operates retail, commercial, investment, and private bankingwith long-established businesses globally. HSBC employs over 300,000 people, serving 89mn clients in 87 countries and has 7,500 offices. The group's founding member, The Hongkong and Shanghai Banking Corporation, was established in 1865, with the purpose of supportingEuropean-East Asian trade activities. In recent decades, HSBC has driven growth by focusing on acquisitions, e.g. Midland Bank (UK, 1992), CCF (France, 2000), and Household Interna-tional (US, 2003). HSBC Holdings plc, incorporated in the UK, is the stock market listed par-ent entity of HSBC Group. Also, bonds are issued by different entities. HSBC Holding plc or-ganizes its group under four main subsidiaries, which engage in operating businesses and hold stakes in other group companies. Their names indicate the subsidiaries' main geographic presence: (i) HSBC Bank plc. (including among others HSBC Asset Finance (UK), HSBC Life(UK), HSBC France, HSBC Germany Holding and HSBC Europe), (ii) HSBC Overseas Hold-ings (UK) under which it holds HSBC North America Holdings and HSBC Bank Canada, (iii)HSBC Finance (Netherlands) under which holds HSBC Asia Holdings (UK) and HSBC BankEgypt, and (iv) HSBC Latin America Holdings (UK). The latter mirrors HSBC's geographic presence, while the primary segment reporting is according to customer groups: (i) Retail and Wealth Management, (ii) Commercial Banking, (iii) Global Banking and Markets and (iv) Global Private Banking.
HSBC: SWOT ANALYSIS Strengths/Opportunities Weaknesses/Threats Well-diversified operations Exposure to overall economic situation in the UK Sound funding and liquidity situation Exposure to volatility in developing markets Important global player in retail and commercial banking Uncertainty arising from proposed plans regarding future changes in banking
regulation and capital requirements
Source: UniCredit Research
1H11 results and outlook HSBC Holdings plc reported USD 9.2bn in 1H11 attributable net profit vs. USD 6.8bn in1H10 (+36.3% yoy), far above market forecasts of USD 7.82bn (Bloomberg). Revenues and costs were up yoy and loan-loss provisions were again down. However, the main bottom-line driver was again a 56% lower tax expense yoy. Loan impairment and other credit risk provisions were USD 5.3bn (-30% from 1H10 and -19% vs. 2H10). Segment-wise, Commer-cial Banking profits before tax increased by 31% and revenues by 14% yoy, Retail Banking and Wealth Management profits before tax rose by 131% yoy due to lower loan impairmentcharges, and Global Banking and Markets profits fell by 12% yoy compared to solid results in1H10. The group was profitable across the regions, with higher profits particularly in Asia, Latin America, the Middle East and North America. Revenues showed double-digit growth in Asia and Latin America, and customer lending increased by 8% vs. end-2010 thanks toemerging markets and Europe in particular. In the US, the strategic review of the credit card business progressed and the sale of 195 non-strategic branches was announced. Further-more, the group announced to close its retail banking in Russia and Poland and the sale of three insurance businesses. The cost-income ratio rose to 57.5% from 59.9% in 2H10 and 50.9% in 1H10. The ROE increased to 12.3% from 8.9% in 2H10 and 10.4% in 1H10. The advances-to-deposits ratio rose to 78.7% from 78.1% in 2H10 and 77.9% in 1H10. Regardingcapitalization, the core Tier-1 ratio rose to 10.8% from 10.5% as of end- December 2010. HSBC remains one of the strongest banks and a safe and stable credit, and the results con-firmed our view that although implementing Basel III – including an increase in both quantity and quality of regulatory capital – is a challenge, it is indeed manageable in HSBC's case.
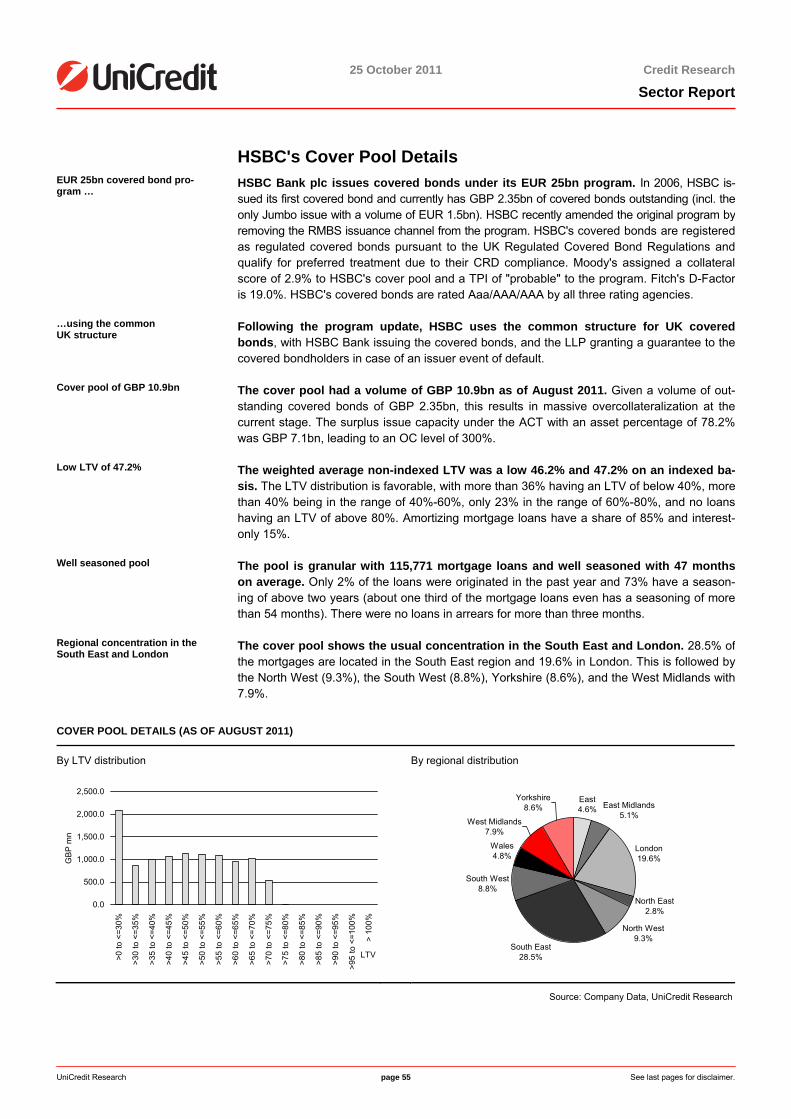
25 October 2011 Credit Research
Sector Report
UniCredit Research page 55 See last pages for disclaimer.
HSBC's Cover Pool Details EUR 25bn covered bond pro-gram …
HSBC Bank plc issues covered bonds under its EUR 25bn program. In 2006, HSBC is-sued its first covered bond and currently has GBP 2.35bn of covered bonds outstanding (incl. theonly Jumbo issue with a volume of EUR 1.5bn). HSBC recently amended the original program by removing the RMBS issuance channel from the program. HSBC's covered bonds are registered as regulated covered bonds pursuant to the UK Regulated Covered Bond Regulations and qualify for preferred treatment due to their CRD compliance. Moody's assigned a collateral score of 2.9% to HSBC's cover pool and a TPI of "probable" to the program. Fitch's D-Factor is 19.0%. HSBC's covered bonds are rated Aaa/AAA/AAA by all three rating agencies.
…using the common UK structure
Following the program update, HSBC uses the common structure for UK covered bonds, with HSBC Bank issuing the covered bonds, and the LLP granting a guarantee to the covered bondholders in case of an issuer event of default.
Cover pool of GBP 10.9bn The cover pool had a volume of GBP 10.9bn as of August 2011. Given a volume of out-standing covered bonds of GBP 2.35bn, this results in massive overcollateralization at the current stage. The surplus issue capacity under the ACT with an asset percentage of 78.2%was GBP 7.1bn, leading to an OC level of 300%.
Low LTV of 47.2% The weighted average non-indexed LTV was a low 46.2% and 47.2% on an indexed ba-sis. The LTV distribution is favorable, with more than 36% having an LTV of below 40%, more than 40% being in the range of 40%-60%, only 23% in the range of 60%-80%, and no loans having an LTV of above 80%. Amortizing mortgage loans have a share of 85% and interest-only 15%.
Well seasoned pool The pool is granular with 115,771 mortgage loans and well seasoned with 47 monthson average. Only 2% of the loans were originated in the past year and 73% have a season-ing of above two years (about one third of the mortgage loans even has a seasoning of more than 54 months). There were no loans in arrears for more than three months.
Regional concentration in the South East and London
The cover pool shows the usual concentration in the South East and London. 28.5% of the mortgages are located in the South East region and 19.6% in London. This is followed bythe North West (9.3%), the South West (8.8%), Yorkshire (8.6%), and the West Midlands with7.9%.
COVER POOL DETAILS (AS OF AUGUST 2011)
By LTV distribution By regional distribution
0.0
500.0
1,000.0
1,500.0
2,000.0
2,500.0
>0 to
<=3
0%
>30
to <
=35%
>35
to <
=40%
>40
to <
=45%
>45
to <
=50%
>50
to <
=55%
>55
to <
=60%
>60
to <
=65%
>65
to <
=70%
>70
to <
=75%
>75
to <
=80%
>80
to <
=85%
>85
to <
=90%
>90
to <
=95%
>95
to <
=100
%
> 10
0%
LTV
GB
P m
n
East 4.6% East Midlands
5.1%
London 19.6%
South West 8.8%
Wales 4.8%
West Midlands 7.9%
Yorkshire 8.6%
North West 9.3%
North East 2.8%
South East 28.5%
Source: Company Data, UniCredit Research
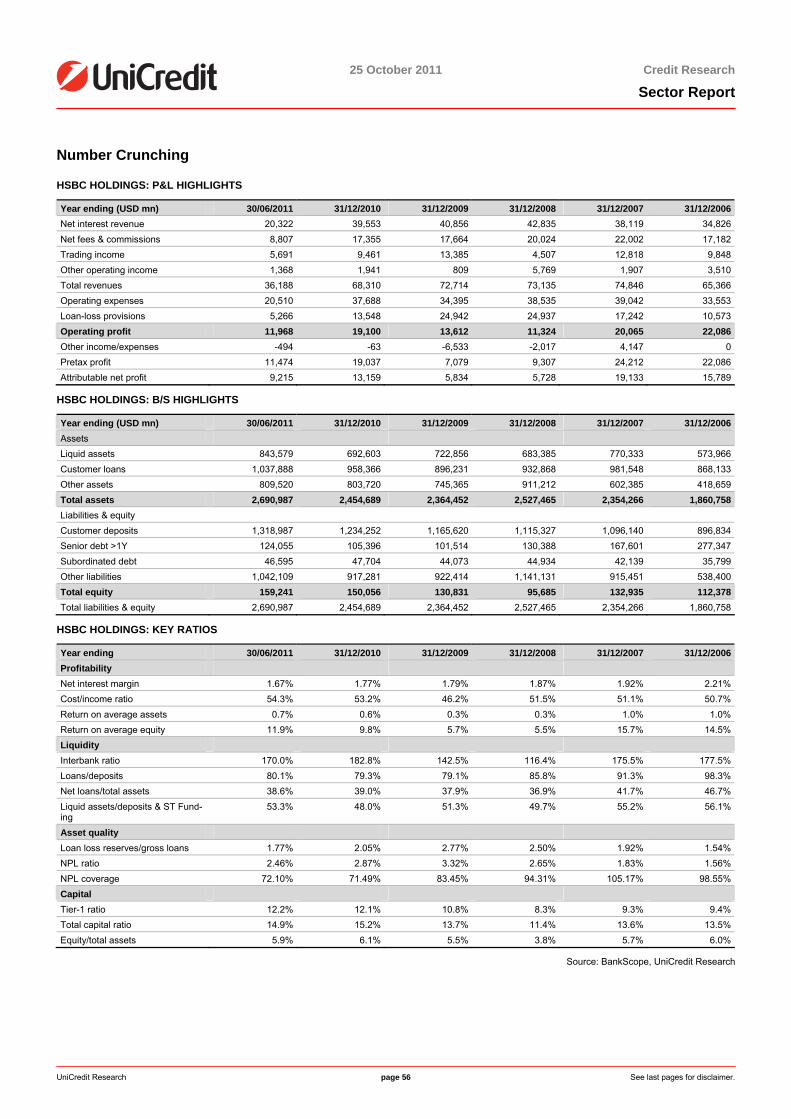
25 October 2011 Credit Research
Sector Report
UniCredit Research page 56 See last pages for disclaimer.
Number Crunching
HSBC HOLDINGS: P&L HIGHLIGHTS
Year ending (USD mn) 30/06/2011 31/12/2010 31/12/2009 31/12/2008 31/12/2007 31/12/2006Net interest revenue 20,322 39,553 40,856 42,835 38,119 34,826Net fees & commissions 8,807 17,355 17,664 20,024 22,002 17,182Trading income 5,691 9,461 13,385 4,507 12,818 9,848Other operating income 1,368 1,941 809 5,769 1,907 3,510Total revenues 36,188 68,310 72,714 73,135 74,846 65,366Operating expenses 20,510 37,688 34,395 38,535 39,042 33,553Loan-loss provisions 5,266 13,548 24,942 24,937 17,242 10,573Operating profit 11,968 19,100 13,612 11,324 20,065 22,086Other income/expenses -494 -63 -6,533 -2,017 4,147 0Pretax profit 11,474 19,037 7,079 9,307 24,212 22,086Attributable net profit 9,215 13,159 5,834 5,728 19,133 15,789
HSBC HOLDINGS: B/S HIGHLIGHTS
Year ending (USD mn) 30/06/2011 31/12/2010 31/12/2009 31/12/2008 31/12/2007 31/12/2006Assets Liquid assets 843,579 692,603 722,856 683,385 770,333 573,966Customer loans 1,037,888 958,366 896,231 932,868 981,548 868,133Other assets 809,520 803,720 745,365 911,212 602,385 418,659Total assets 2,690,987 2,454,689 2,364,452 2,527,465 2,354,266 1,860,758Liabilities & equity Customer deposits 1,318,987 1,234,252 1,165,620 1,115,327 1,096,140 896,834Senior debt >1Y 124,055 105,396 101,514 130,388 167,601 277,347Subordinated debt 46,595 47,704 44,073 44,934 42,139 35,799Other liabilities 1,042,109 917,281 922,414 1,141,131 915,451 538,400Total equity 159,241 150,056 130,831 95,685 132,935 112,378Total liabilities & equity 2,690,987 2,454,689 2,364,452 2,527,465 2,354,266 1,860,758
HSBC HOLDINGS: KEY RATIOS
Year ending 30/06/2011 31/12/2010 31/12/2009 31/12/2008 31/12/2007 31/12/2006Profitability Net interest margin 1.67% 1.77% 1.79% 1.87% 1.92% 2.21%Cost/income ratio 54.3% 53.2% 46.2% 51.5% 51.1% 50.7%Return on average assets 0.7% 0.6% 0.3% 0.3% 1.0% 1.0%Return on average equity 11.9% 9.8% 5.7% 5.5% 15.7% 14.5%Liquidity Interbank ratio 170.0% 182.8% 142.5% 116.4% 175.5% 177.5%Loans/deposits 80.1% 79.3% 79.1% 85.8% 91.3% 98.3%Net loans/total assets 38.6% 39.0% 37.9% 36.9% 41.7% 46.7%Liquid assets/deposits & ST Fund-ing
53.3% 48.0% 51.3% 49.7% 55.2% 56.1%
Asset quality Loan loss reserves/gross loans 1.77% 2.05% 2.77% 2.50% 1.92% 1.54%NPL ratio 2.46% 2.87% 3.32% 2.65% 1.83% 1.56%NPL coverage 72.10% 71.49% 83.45% 94.31% 105.17% 98.55%Capital Tier-1 ratio 12.2% 12.1% 10.8% 8.3% 9.3% 9.4%Total capital ratio 14.9% 15.2% 13.7% 11.4% 13.6% 13.5%Equity/total assets 5.9% 6.1% 5.5% 3.8% 5.7% 6.0%
Source: BankScope, UniCredit Research
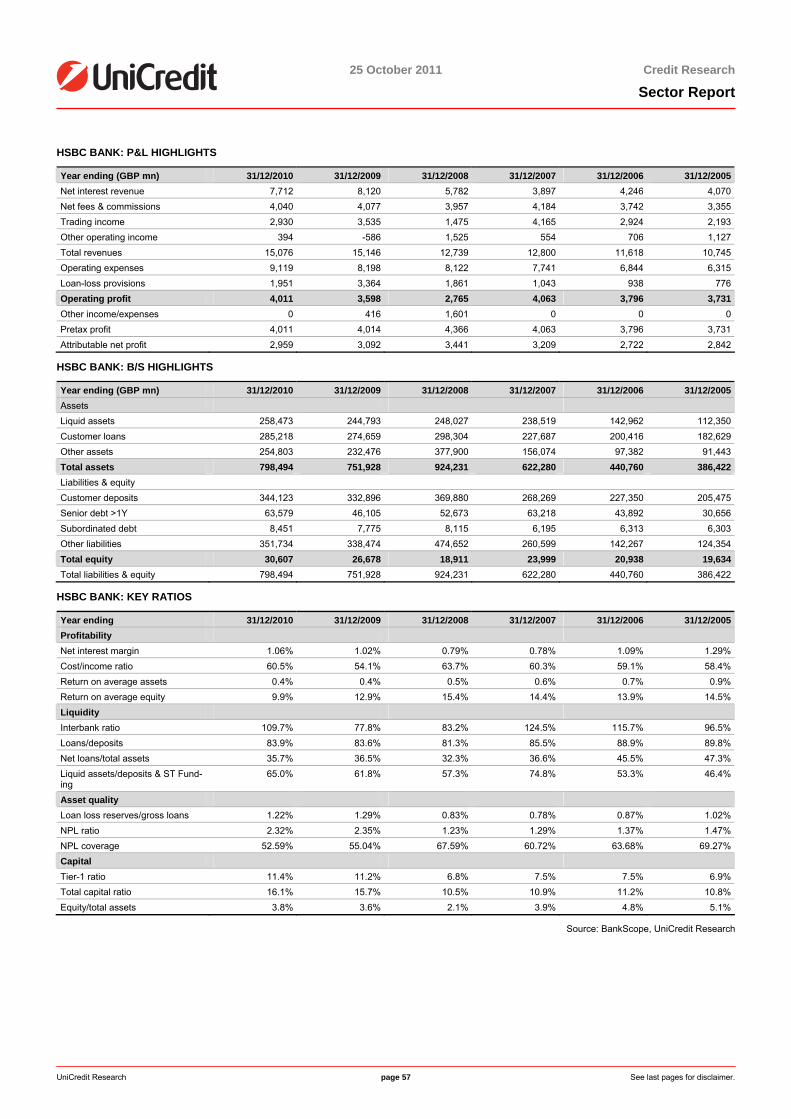
25 October 2011 Credit Research
Sector Report
UniCredit Research page 57 See last pages for disclaimer.
HSBC BANK: P&L HIGHLIGHTS
Year ending (GBP mn) 31/12/2010 31/12/2009 31/12/2008 31/12/2007 31/12/2006 31/12/2005Net interest revenue 7,712 8,120 5,782 3,897 4,246 4,070Net fees & commissions 4,040 4,077 3,957 4,184 3,742 3,355Trading income 2,930 3,535 1,475 4,165 2,924 2,193Other operating income 394 -586 1,525 554 706 1,127Total revenues 15,076 15,146 12,739 12,800 11,618 10,745Operating expenses 9,119 8,198 8,122 7,741 6,844 6,315Loan-loss provisions 1,951 3,364 1,861 1,043 938 776Operating profit 4,011 3,598 2,765 4,063 3,796 3,731Other income/expenses 0 416 1,601 0 0 0Pretax profit 4,011 4,014 4,366 4,063 3,796 3,731Attributable net profit 2,959 3,092 3,441 3,209 2,722 2,842
HSBC BANK: B/S HIGHLIGHTS
Year ending (GBP mn) 31/12/2010 31/12/2009 31/12/2008 31/12/2007 31/12/2006 31/12/2005Assets Liquid assets 258,473 244,793 248,027 238,519 142,962 112,350Customer loans 285,218 274,659 298,304 227,687 200,416 182,629Other assets 254,803 232,476 377,900 156,074 97,382 91,443Total assets 798,494 751,928 924,231 622,280 440,760 386,422Liabilities & equity Customer deposits 344,123 332,896 369,880 268,269 227,350 205,475Senior debt >1Y 63,579 46,105 52,673 63,218 43,892 30,656Subordinated debt 8,451 7,775 8,115 6,195 6,313 6,303Other liabilities 351,734 338,474 474,652 260,599 142,267 124,354Total equity 30,607 26,678 18,911 23,999 20,938 19,634Total liabilities & equity 798,494 751,928 924,231 622,280 440,760 386,422
HSBC BANK: KEY RATIOS
Year ending 31/12/2010 31/12/2009 31/12/2008 31/12/2007 31/12/2006 31/12/2005Profitability Net interest margin 1.06% 1.02% 0.79% 0.78% 1.09% 1.29%Cost/income ratio 60.5% 54.1% 63.7% 60.3% 59.1% 58.4%Return on average assets 0.4% 0.4% 0.5% 0.6% 0.7% 0.9%Return on average equity 9.9% 12.9% 15.4% 14.4% 13.9% 14.5%Liquidity Interbank ratio 109.7% 77.8% 83.2% 124.5% 115.7% 96.5%Loans/deposits 83.9% 83.6% 81.3% 85.5% 88.9% 89.8%Net loans/total assets 35.7% 36.5% 32.3% 36.6% 45.5% 47.3%Liquid assets/deposits & ST Fund-ing
65.0% 61.8% 57.3% 74.8% 53.3% 46.4%
Asset quality Loan loss reserves/gross loans 1.22% 1.29% 0.83% 0.78% 0.87% 1.02%NPL ratio 2.32% 2.35% 1.23% 1.29% 1.37% 1.47%NPL coverage 52.59% 55.04% 67.59% 60.72% 63.68% 69.27%Capital Tier-1 ratio 11.4% 11.2% 6.8% 7.5% 7.5% 6.9%Total capital ratio 16.1% 15.7% 10.5% 10.9% 11.2% 10.8%Equity/total assets 3.8% 3.6% 2.1% 3.9% 4.8% 5.1%
Source: BankScope, UniCredit Research
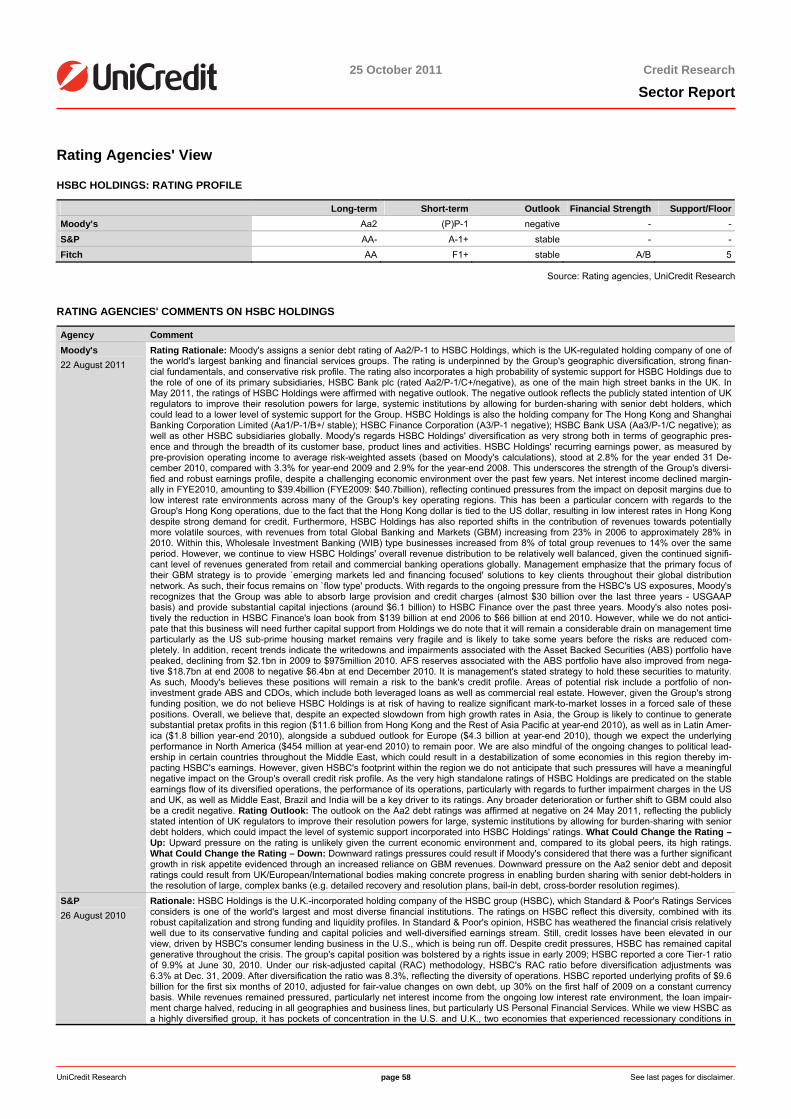
25 October 2011 Credit Research
Sector Report
UniCredit Research page 58 See last pages for disclaimer.
Rating Agencies' View
HSBC HOLDINGS: RATING PROFILE
Long-term Short-term Outlook Financial Strength Support/FloorMoody’s Aa2 (P)P-1 negative - -S&P AA- A-1+ stable - -Fitch AA F1+ stable A/B 5
Source: Rating agencies, UniCredit Research
RATING AGENCIES' COMMENTS ON HSBC HOLDINGS
Agency Comment Moody's 22 August 2011
Rating Rationale: Moody's assigns a senior debt rating of Aa2/P-1 to HSBC Holdings, which is the UK-regulated holding company of one of the world's largest banking and financial services groups. The rating is underpinned by the Group's geographic diversification, strong finan-cial fundamentals, and conservative risk profile. The rating also incorporates a high probability of systemic support for HSBC Holdings due to the role of one of its primary subsidiaries, HSBC Bank plc (rated Aa2/P-1/C+/negative), as one of the main high street banks in the UK. In May 2011, the ratings of HSBC Holdings were affirmed with negative outlook. The negative outlook reflects the publicly stated intention of UK regulators to improve their resolution powers for large, systemic institutions by allowing for burden-sharing with senior debt holders, which could lead to a lower level of systemic support for the Group. HSBC Holdings is also the holding company for The Hong Kong and Shanghai Banking Corporation Limited (Aa1/P-1/B+/ stable); HSBC Finance Corporation (A3/P-1 negative); HSBC Bank USA (Aa3/P-1/C negative); as well as other HSBC subsidiaries globally. Moody's regards HSBC Holdings' diversification as very strong both in terms of geographic pres-ence and through the breadth of its customer base, product lines and activities. HSBC Holdings' recurring earnings power, as measured by pre-provision operating income to average risk-weighted assets (based on Moody's calculations), stood at 2.8% for the year ended 31 De-cember 2010, compared with 3.3% for year-end 2009 and 2.9% for the year-end 2008. This underscores the strength of the Group's diversi-fied and robust earnings profile, despite a challenging economic environment over the past few years. Net interest income declined margin-ally in FYE2010, amounting to $39.4billion (FYE2009: $40.7billion), reflecting continued pressures from the impact on deposit margins due to low interest rate environments across many of the Group's key operating regions. This has been a particular concern with regards to the Group's Hong Kong operations, due to the fact that the Hong Kong dollar is tied to the US dollar, resulting in low interest rates in Hong Kong despite strong demand for credit. Furthermore, HSBC Holdings has also reported shifts in the contribution of revenues towards potentially more volatile sources, with revenues from total Global Banking and Markets (GBM) increasing from 23% in 2006 to approximately 28% in 2010. Within this, Wholesale Investment Banking (WIB) type businesses increased from 8% of total group revenues to 14% over the same period. However, we continue to view HSBC Holdings' overall revenue distribution to be relatively well balanced, given the continued signifi-cant level of revenues generated from retail and commercial banking operations globally. Management emphasize that the primary focus of their GBM strategy is to provide `emerging markets led and financing focused' solutions to key clients throughout their global distribution network. As such, their focus remains on `flow type' products. With regards to the ongoing pressure from the HSBC's US exposures, Moody's recognizes that the Group was able to absorb large provision and credit charges (almost $30 billion over the last three years - USGAAP basis) and provide substantial capital injections (around $6.1 billion) to HSBC Finance over the past three years. Moody's also notes posi-tively the reduction in HSBC Finance's loan book from $139 billion at end 2006 to $66 billion at end 2010. However, while we do not antici-pate that this business will need further capital support from Holdings we do note that it will remain a considerable drain on management time particularly as the US sub-prime housing market remains very fragile and is likely to take some years before the risks are reduced com-pletely. In addition, recent trends indicate the writedowns and impairments associated with the Asset Backed Securities (ABS) portfolio have peaked, declining from $2.1bn in 2009 to $975million 2010. AFS reserves associated with the ABS portfolio have also improved from nega-tive $18.7bn at end 2008 to negative $6.4bn at end December 2010. It is management's stated strategy to hold these securities to maturity. As such, Moody's believes these positions will remain a risk to the bank's credit profile. Areas of potential risk include a portfolio of non-investment grade ABS and CDOs, which include both leveraged loans as well as commercial real estate. However, given the Group's strong funding position, we do not believe HSBC Holdings is at risk of having to realize significant mark-to-market losses in a forced sale of these positions. Overall, we believe that, despite an expected slowdown from high growth rates in Asia, the Group is likely to continue to generate substantial pretax profits in this region ($11.6 billion from Hong Kong and the Rest of Asia Pacific at year-end 2010), as well as in Latin Amer-ica ($1.8 billion year-end 2010), alongside a subdued outlook for Europe ($4.3 billion at year-end 2010), though we expect the underlying performance in North America ($454 million at year-end 2010) to remain poor. We are also mindful of the ongoing changes to political lead-ership in certain countries throughout the Middle East, which could result in a destabilization of some economies in this region thereby im-pacting HSBC's earnings. However, given HSBC's footprint within the region we do not anticipate that such pressures will have a meaningful negative impact on the Group's overall credit risk profile. As the very high standalone ratings of HSBC Holdings are predicated on the stable earnings flow of its diversified operations, the performance of its operations, particularly with regards to further impairment charges in the US and UK, as well as Middle East, Brazil and India will be a key driver to its ratings. Any broader deterioration or further shift to GBM could also be a credit negative. Rating Outlook: The outlook on the Aa2 debt ratings was affirmed at negative on 24 May 2011, reflecting the publicly stated intention of UK regulators to improve their resolution powers for large, systemic institutions by allowing for burden-sharing with senior debt holders, which could impact the level of systemic support incorporated into HSBC Holdings' ratings. What Could Change the Rating – Up: Upward pressure on the rating is unlikely given the current economic environment and, compared to its global peers, its high ratings. What Could Change the Rating – Down: Downward ratings pressures could result if Moody's considered that there was a further significant growth in risk appetite evidenced through an increased reliance on GBM revenues. Downward pressure on the Aa2 senior debt and deposit ratings could result from UK/European/International bodies making concrete progress in enabling burden sharing with senior debt-holders in the resolution of large, complex banks (e.g. detailed recovery and resolution plans, bail-in debt, cross-border resolution regimes).
S&P 26 August 2010
Rationale: HSBC Holdings is the U.K.-incorporated holding company of the HSBC group (HSBC), which Standard & Poor's Ratings Services considers is one of the world's largest and most diverse financial institutions. The ratings on HSBC reflect this diversity, combined with its robust capitalization and strong funding and liquidity profiles. In Standard & Poor's opinion, HSBC has weathered the financial crisis relatively well due to its conservative funding and capital policies and well-diversified earnings stream. Still, credit losses have been elevated in our view, driven by HSBC's consumer lending business in the U.S., which is being run off. Despite credit pressures, HSBC has remained capital generative throughout the crisis. The group's capital position was bolstered by a rights issue in early 2009; HSBC reported a core Tier-1 ratio of 9.9% at June 30, 2010. Under our risk-adjusted capital (RAC) methodology, HSBC's RAC ratio before diversification adjustments was 6.3% at Dec. 31, 2009. After diversification the ratio was 8.3%, reflecting the diversity of operations. HSBC reported underlying profits of $9.6 billion for the first six months of 2010, adjusted for fair-value changes on own debt, up 30% on the first half of 2009 on a constant currency basis. While revenues remained pressured, particularly net interest income from the ongoing low interest rate environment, the loan impair-ment charge halved, reducing in all geographies and business lines, but particularly US Personal Financial Services. While we view HSBC as a highly diversified group, it has pockets of concentration in the U.S. and U.K., two economies that experienced recessionary conditions in
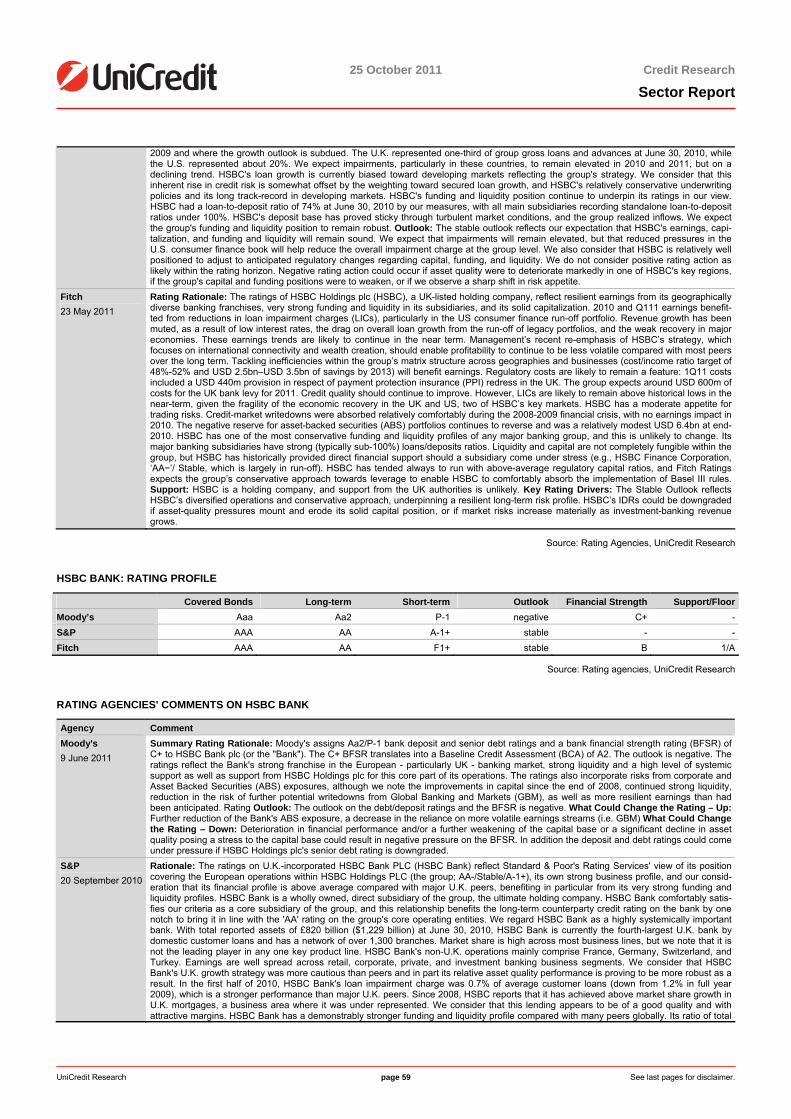
25 October 2011 Credit Research
Sector Report
UniCredit Research page 59 See last pages for disclaimer.
2009 and where the growth outlook is subdued. The U.K. represented one-third of group gross loans and advances at June 30, 2010, while the U.S. represented about 20%. We expect impairments, particularly in these countries, to remain elevated in 2010 and 2011, but on a declining trend. HSBC's loan growth is currently biased toward developing markets reflecting the group's strategy. We consider that this inherent rise in credit risk is somewhat offset by the weighting toward secured loan growth, and HSBC's relatively conservative underwriting policies and its long track-record in developing markets. HSBC's funding and liquidity position continue to underpin its ratings in our view. HSBC had a loan-to-deposit ratio of 74% at June 30, 2010 by our measures, with all main subsidiaries recording standalone loan-to-deposit ratios under 100%. HSBC's deposit base has proved sticky through turbulent market conditions, and the group realized inflows. We expect the group's funding and liquidity position to remain robust. Outlook: The stable outlook reflects our expectation that HSBC's earnings, capi-talization, and funding and liquidity will remain sound. We expect that impairments will remain elevated, but that reduced pressures in the U.S. consumer finance book will help reduce the overall impairment charge at the group level. We also consider that HSBC is relatively well positioned to adjust to anticipated regulatory changes regarding capital, funding, and liquidity. We do not consider positive rating action as likely within the rating horizon. Negative rating action could occur if asset quality were to deteriorate markedly in one of HSBC's key regions, if the group's capital and funding positions were to weaken, or if we observe a sharp shift in risk appetite.
Fitch 23 May 2011
Rating Rationale: The ratings of HSBC Holdings plc (HSBC), a UK-listed holding company, reflect resilient earnings from its geographically diverse banking franchises, very strong funding and liquidity in its subsidiaries, and its solid capitalization. 2010 and Q111 earnings benefit-ted from reductions in loan impairment charges (LICs), particularly in the US consumer finance run-off portfolio. Revenue growth has been muted, as a result of low interest rates, the drag on overall loan growth from the run-off of legacy portfolios, and the weak recovery in major economies. These earnings trends are likely to continue in the near term. Management’s recent re-emphasis of HSBC’s strategy, which focuses on international connectivity and wealth creation, should enable profitability to continue to be less volatile compared with most peers over the long term. Tackling inefficiencies within the group’s matrix structure across geographies and businesses (cost/income ratio target of 48%-52% and USD 2.5bn–USD 3.5bn of savings by 2013) will benefit earnings. Regulatory costs are likely to remain a feature: 1Q11 costs included a USD 440m provision in respect of payment protection insurance (PPI) redress in the UK. The group expects around USD 600m of costs for the UK bank levy for 2011. Credit quality should continue to improve. However, LICs are likely to remain above historical lows in the near-term, given the fragility of the economic recovery in the UK and US, two of HSBC’s key markets. HSBC has a moderate appetite for trading risks. Credit-market writedowns were absorbed relatively comfortably during the 2008-2009 financial crisis, with no earnings impact in 2010. The negative reserve for asset-backed securities (ABS) portfolios continues to reverse and was a relatively modest USD 6.4bn at end-2010. HSBC has one of the most conservative funding and liquidity profiles of any major banking group, and this is unlikely to change. Its major banking subsidiaries have strong (typically sub-100%) loans/deposits ratios. Liquidity and capital are not completely fungible within the group, but HSBC has historically provided direct financial support should a subsidiary come under stress (e.g., HSBC Finance Corporation, ‘AA−’/ Stable, which is largely in run-off). HSBC has tended always to run with above-average regulatory capital ratios, and Fitch Ratings expects the group’s conservative approach towards leverage to enable HSBC to comfortably absorb the implementation of Basel III rules. Support: HSBC is a holding company, and support from the UK authorities is unlikely. Key Rating Drivers: The Stable Outlook reflects HSBC’s diversified operations and conservative approach, underpinning a resilient long-term risk profile. HSBC’s IDRs could be downgraded if asset-quality pressures mount and erode its solid capital position, or if market risks increase materially as investment-banking revenue grows.
Source: Rating Agencies, UniCredit Research
HSBC BANK: RATING PROFILE
Covered Bonds Long-term Short-term Outlook Financial Strength Support/FloorMoody’s Aaa Aa2 P-1 negative C+ -S&P AAA AA A-1+ stable - -Fitch AAA AA F1+ stable B 1/A
Source: Rating agencies, UniCredit Research
RATING AGENCIES' COMMENTS ON HSBC BANK
Agency Comment Moody's 9 June 2011
Summary Rating Rationale: Moody's assigns Aa2/P-1 bank deposit and senior debt ratings and a bank financial strength rating (BFSR) of C+ to HSBC Bank plc (or the "Bank"). The C+ BFSR translates into a Baseline Credit Assessment (BCA) of A2. The outlook is negative. The ratings reflect the Bank's strong franchise in the European - particularly UK - banking market, strong liquidity and a high level of systemic support as well as support from HSBC Holdings plc for this core part of its operations. The ratings also incorporate risks from corporate and Asset Backed Securities (ABS) exposures, although we note the improvements in capital since the end of 2008, continued strong liquidity, reduction in the risk of further potential writedowns from Global Banking and Markets (GBM), as well as more resilient earnings than had been anticipated. Rating Outlook: The outlook on the debt/deposit ratings and the BFSR is negative. What Could Change the Rating – Up: Further reduction of the Bank's ABS exposure, a decrease in the reliance on more volatile earnings streams (i.e. GBM) What Could Change the Rating – Down: Deterioration in financial performance and/or a further weakening of the capital base or a significant decline in asset quality posing a stress to the capital base could result in negative pressure on the BFSR. In addition the deposit and debt ratings could come under pressure if HSBC Holdings plc's senior debt rating is downgraded.
S&P 20 September 2010
Rationale: The ratings on U.K.-incorporated HSBC Bank PLC (HSBC Bank) reflect Standard & Poor's Rating Services' view of its position covering the European operations within HSBC Holdings PLC (the group; AA-/Stable/A-1+), its own strong business profile, and our consid-eration that its financial profile is above average compared with major U.K. peers, benefiting in particular from its very strong funding and liquidity profiles. HSBC Bank is a wholly owned, direct subsidiary of the group, the ultimate holding company. HSBC Bank comfortably satis-fies our criteria as a core subsidiary of the group, and this relationship benefits the long-term counterparty credit rating on the bank by one notch to bring it in line with the 'AA' rating on the group's core operating entities. We regard HSBC Bank as a highly systemically important bank. With total reported assets of £820 billion ($1,229 billion) at June 30, 2010, HSBC Bank is currently the fourth-largest U.K. bank by domestic customer loans and has a network of over 1,300 branches. Market share is high across most business lines, but we note that it is not the leading player in any one key product line. HSBC Bank's non-U.K. operations mainly comprise France, Germany, Switzerland, and Turkey. Earnings are well spread across retail, corporate, private, and investment banking business segments. We consider that HSBC Bank's U.K. growth strategy was more cautious than peers and in part its relative asset quality performance is proving to be more robust as a result. In the first half of 2010, HSBC Bank's loan impairment charge was 0.7% of average customer loans (down from 1.2% in full year 2009), which is a stronger performance than major U.K. peers. Since 2008, HSBC reports that it has achieved above market share growth in U.K. mortgages, a business area where it was under represented. We consider that this lending appears to be of a good quality and with attractive margins. HSBC Bank has a demonstrably stronger funding and liquidity profile compared with many peers globally. Its ratio of total

25 October 2011 Credit Research
Sector Report
UniCredit Research page 60 See last pages for disclaimer.
loans to customer deposits, by our measures, was a relatively strong 98% at June 30, 2010. Capital remains satisfactory, in our view; HSBC Bank's reported a core Tier-1 regulatory capital ratio of 10.0% at June 30, 2010. This year, HSBC Bank has resumed paying sizable divi-dends to its parent (having paid no dividend in respect of 2008 earnings), which is consistent with its historic approach. HSBC Bank reported an underlying profit before tax of £2.6 billion in the first half of 2010. By our measures, core earnings were a satisfactory 24% of revenues, which compares well with major U.K. peers. Outlook: The stable outlook mirrors that on HSBC Holdings, and future changes to the ratings on HSBC Bank will result from rating actions on HSBC Holdings. We consider that the performance of its U.K. franchise and selected Euro-pean operations will remain an important driver in our overall assessment of the group. While trending lower, we expect loan impairments to remain elevated both this year and next, and given that HSBC Bank's deposit funding bias pressures margins in a low rate environment, we expect any further improvement in earnings to be relatively modest for the foreseeable future.
Fitch 16 December 2010
Rating Rationale: The Individual Rating of HSBC Bank plc (HSBC Bank) reflects its strong UK franchise, conservative risk appetite, resilient earnings and strong liquidity. HSBC Bank’s IDRs reflect its position as a major subsidiary of the wider HSBC group, headed by HSBC Hold-ings Plc (HSBC Holdings; LT IDR ‘AA/Stable’). Operating profitability has been relatively stable throughout the credit crisis and improved modestly in H110. Economic recovery should continue to filter through to lower impairment charges in the UK and European retail banking operations, although these will likely remain high. Global banking and markets earnings have also proven to be resilient, despite the absence of the record H109 market conditions. Fitch Ratings believes the 2011 earnings outlook will be modestly better than in 2010, and that the medium-term outlook will be sound. Risks have generally been well controlled and the bank has a conservative risk appetite. HSBC Bank and its subsidiaries consolidate a large part of the wider HSBC group’s global banking & markets businesses (GBM; mainly London, but also Paris and Dusseldorf). These businesses suffered far fewer market losses in 2008 than many peers and are focused on simple, client-driven products. Asset quality, having been strong, is likely to remain vulnerable as the UK and the European countries where HSBC Bank and its subsidiaries operate navigate a period of weaker growth and greater economic uncertainty. Funding and liquidity are major strengths of HSBC Bank. HSBC Bank has a large and stable customer deposit base that exceeds its loan book in size (consolidated loans/deposits ratio of 80% at end-H110). HSBC group’s policy is for subsidiaries to submit significant surpluses of regulatory capital to the centre. Capital at HSBC Bank has been strengthened by the group and with a solid starting point and strong internal capital generation, impending regulatory changes should be manageable. Fitch core and eligible capital were hard-hit in H208 (even if regulatory capital ratios were sound) by fair-value losses on available-for-sale (AFS) securities that have since started reversing. Fitch expects the vast majority of these to continue to reverse and that ultimate losses will be affordable for the bank. Support: Fitch believes that support would be provided by HSBC Holdings, to the extent that it is able. HSBC Bank is also of such domestic importance that there is an extremely high probability of support from the UK authorities. Key Rating Drivers: HSBC Bank’s IDRs are inherently linked to the credit profile of the wider HSBC group (HSBC Holdings plc’s IDR is also on Stable Outlook). Movements in HSBC Bank’s IDRs would be likely to be affected by changes in the credit profile of its parent and affiliates.
Source: Rating Agencies, UniCredit Research
RATING AGENCIES' COMMENTS ON HSBC BANK COVERED BOND PROGRAM
Agency Comment Moody's 12 July 2011
RATINGS RATIONALE: As with all covered bonds, the covered bonds benefit from two layers of protection by having recourse to both the issuer and a collateral pool. The rating therefore takes into account the following factors: 1) The credit strength of the issuer, rated Aa2; P-1. 2) The credit quality of the cover pool. The mortgage covered bonds are backed by residential mortgage loans. Other key factors: 3) The commitment of the issuer to maintain an asset percentage of 92.5%, which translates into an over-collateralization of around 8.8%. Moody's considers this over-collateralization to be "committed". 4) The use of structuring techniques designed to mitigate the rating linkage between the issuer and the covered bonds. These include a provision to allow for a principal refinancing period of 12 months. Moody's has assigned a Timely Payment Indicator (TPI) of "Probable" to the covered bonds. The ratings assigned by Moody's address the expected loss posed to investors. Moody's ratings address only the credit risks associated with the transaction. Other non-credit risks have not been addressed, but may have a significant effect on yield to investors. The Aaa rating assigned to the existing covered bonds is expected to be assigned to all subsequent covered bonds issued by the issuer under this program and any future rating actions are expected to affect all such covered bonds. Should there be any exceptions to this, Moody's will in each case publish details in a separate press release. KEY RATING AS-SUMPTIONS/FACTORS: Covered bond ratings are determined after applying a two-step process: expected loss analysis and TPI frame-work analysis. EXPECTED LOSS: Moody's determines a rating based on the expected loss on the bond. The primary model used is Moody's Covered Bond model (COBOL), which determines expected loss as a function of the issuer's probability of default, measured by its rating of Aa2, and the stressed losses on the cover pool assets following issuer default. The Cover Pool Losses for this program are 16.3%. This is an estimate of the losses Moody's currently models in the event of issuer default. Cover Pool Losses can be split between Market Risk of 14.4% and Collateral Risk of 1.9%. Market Risk measures losses as a result of refinancing risk and risks related to interest rate and currency mis-matches (these losses may also include certain legal risks). Collateral Risk measures losses resulting directly from the credit quality of the assets in the cover pool. Collateral Risk is derived from the Collateral Score, which for this program is currently 2.9%. TPI FRAMEWORK: Moody's assigns a "timely payment indicator" (TPI) which indicates the likelihood that timely payment will be made to covered bondholders following issuer default. The effect of the TPI framework is to limit the covered bond rating to a certain number of notches above the issuer's rating. SENSITIVITY ANALYSIS: The robustness of a covered bond rating largely depends on the credit strength of the issuer. The number of notches by which the issuer's rating may be downgraded before the covered bonds are downgraded under the TPI framework is measured by the TPI Leeway. Based on the current TPI of Probable the TPI Leeway for this program is four notches. This means that the issuer's rating would need to be downgraded to Baa1 before the covered bonds are downgraded, all other things being equal. A multiple notch downgrade of the covered bonds might occur in certain limited circumstances. Some examples might be (a) a sovereign downgrade negatively affecting both the issuer's senior unsecured rating and the TPI; (b) a multiple notch downgrade of the issuer; or (c) a material reduction of the value of the cover pool. For further details on Cover Pool Losses, Collateral Risk, Market Risk, Collateral Score and TPI Leeway across all covered bond programs rated by Moody's please refer to "Moody's EMEA Covered Bonds Monitoring Overview", published quarterly. These figures are based on the most recent Performance Overview published by Moody's and are subject to change over time.
S&P 13 December 2006
Transaction Summary: Standard & Poor's Ratings Services has assigned a 'AAA' credit rating to the first issuance under HSBC Bank PLC's ( HSBC) €15 billion covered bond program. The rating reflects the terms of the issuance, structure, cash flow mechanics of the program and Standard & Poor's cash flow analysis to verify that the covered bonds are repaid under stress test scenarios. Under the terms of the program, HSBC issues the covered bonds. The covered bonds are direct, unsecured, and unconditional obligations of HSBC. The cover pool was sold to HSBC Mortgage LLP (the LLP) in return for a capital interest in the LLP. The LLP has created security over the cover pool in favor of the LLP security trustee to secure its obligations under the covered bond guarantee. The cover pool is comprised of the share of the mortgage portfolio allocated to the covered bonds and the additional covered bond collateral portfolio. All of the assets in the LLP are held either in the mortgage portfolio or in the additional covered bond collateral portfolio. The latter is comprised of mortgages that meet the eligibility criteria (see "Collateral Description"), short-term investments rated 'A-1+' by Standard & Poor's, or long-term investments rated 'AAA' by Standard & Poor's. Notable Features: This is the first issuance under the global covered bond program set up by HSBC. U.K. covered bonds are more structurally diverse than those issued where there is an existing legal framework, because the U.K. does not have specific covered bond legislation. Each U.K. structure is issuer-specific. HSBC has established a platform that uses a single mortgage portfolio for the issue of both covered bonds and RMBS. The ability to issue both asset classes from one platform gives HSBC more flexibility in funding and enables it to
25 October 2011 Credit Research
Sector Report
UniCredit Research page 61 See last pages for disclaimer.
access either market more quickly than if it had separate platforms. In certain circumstances, it also allows HSBC to access principal cash flows that are not required by the covered bondholders and direct them to maturing RMBS. The first debt issuance was covered bonds. While this report describes the covered bond program and Standard & Poor's approach in assigning an 'AAA' rating to the first issuance of covered bonds, it makes reference to the RMBS program when necessary. This is a new structure and Standard & Poor's has therefore focused on the issue of asset segregation (see "Asset Segregation"), and ensuring that the covered bonds are isolated from events that may occur with regard to the RMBS bonds, and vice versa. The ownership structure of the LLP is also unusual. In this structure, three members all have a partnership interest in the LLP. The three members are the seller, HSBC; the RMBS member, Halphen Mortgage Backed Securities PLC; and the liquidation member, Halphen Liquidation Member Ltd. The latter is a bankruptcy-remote SPE, whose principal object is to hold a partnership interest in the LLP. The purpose is to enable both the covered bondholders and RMBS noteholders to have an interest in the assets of the LLP. The sharing of profits and the duties of the members are regulated by the partnership deed. The HSBC partnership inter-est is represented by the HSBC share and the RMBS member's partnership interest is represented by the RMBS share. Standard & Poor's has focused on this ownership structure to ensure that the LLP is bankruptcy-remote and that the covered bond entitlement to the assets of the LLP is secured under the covered bond guarantee. Strengths, Concerns, and Mitigating Factors: Strengths: As in other covered bond transactions across Europe, the structure provides for both a general recourse to HSBC's assets and recourse to a pool of mortgages and additional collateral in an amount higher than the debt outstanding under the program. The asset coverage test is designed to provide ongoing adequate protection against risks including the credit risk of the mortgages backing the program, their market value risk if they need to be liquidated, and the maturity mismatch that may exist between the mortgage pool and the covered bond maturities. The test gives inves-tors more information on the continuing level of over collateralization than is given in most covered bond frameworks. The collateral pool assets are all residential mortgage loans, compared with typical mortgage covered bonds in other jurisdictions, which tend to mix residential and commercial mortgage loans. Loans more than three months in arrears are subject to a haircut of 25% to 40% (subject to LTV ratios), of their value for the asset coverage test and HSBC adds loans if required by the asset coverage test, as long as HSBC is solvent. A transfer of the servicing is made if HSBC is downgraded below 'BBB-'. A third-party asset monitor is contracted to check the calculations performed by HSBC as cash manager for the asset coverage test. The LLP benefits from a cash reserve, subject to loss of HSBC's 'A-1+' rating, which is sized to provide liquidity after an HSBC event of default. Concerns: If HSBC defaults, the liquidity on bonds issued in bullet form cannot be assured solely from cash flows arising on the mortgage pool, but may require a monetization of the pool through securitization or other means. The sizing of set-off risk, which is included in the asset coverage test, is only implemented if HSBC is downgraded to a long-term rating below 'BBB'. The covered bondholders and RMBS noteholders have a share in the same mortgage portfolio. Mitigating factors: For those bonds with a "hard" bullet structure, the pre-maturity test (see "Pre-maturity test") applies to ensure timely repayment of principal. Covered bonds may also be issued with extendible maturities. In this case, if the LLP has insufficient funds to redeem the covered bonds following a HSBC event of default, the redemption may be deferred for up to 12 months. Standard & Poor's have therefore assessed the spread stability of both the whole-loan trading market and U.K. RMBS market when considering the ability to monetize the portfolio. Both markets are more developed than in any other European jurisdiction, and we consider the securitization market to be a resilient potential exit strategy. Standard & Poor's also reviews the proposed maturity dates of the covered bonds issued under the program to ensure that these are sufficiently staggered to allow an orderly securitization exit strategy. The legal analysis of borrower set-off risk, combined with the notifi-cation trigger, mitigates the borrower set-off risk. If HSBC does not notify the borrowers of the transfer of their mortgage loans to the LLP, the risk is sized for in the asset coverage test (see "Maintenance of the portfolio"). Asset segregation occurs when certain events take place (see "Asset Segregation"). It results in separate portfolios being created within the LLP. Standard & Poor's is comfortable that the asset segrega-tion mechanism, the bankruptcy-remoteness of the LLP, and the strong limited-recourse and non-petition language in the documentation is consistent with assigning a 'AAA' rating to the covered bonds that is de-linked from the rating on the RMBS bonds.
Fitch 23 June 2011
Rating Rationale: The ‘AAA’ rating on HSBC Bank plc’s (HSBC or the issuer) mortgage covered bonds, which is guaranteed by HSBC Mortgage LLP, is based on the issuer’s Long-Term Issuer Default Rating (IDR) of ‘AA’ (with Stable Outlook), a revised Discontinuity Factor (D-Factor) of 19.0%, and the overcollateralization (OC) which compensates for credit risk and asset/liability mismatches. This combination enables the rating to reach ‘AAA’ on a probability-of-default (PD) basis as the asset percentage (AP, which measures the covered bonds issued as a proportion of the cover pool) is below the 79.1% AP supporting the rating. The D-Factor of 19.0% is driven by: the segregation of the cover assets in the bankruptcy-remote, special-purpose company acting as guarantor; the mitigants to liquidity gaps in the form of a cash reserve covering the next succeeding three months of interest payment due on the covered bonds plus costs, a 12-month extendible maturity on the soft bullet covered bonds and a 12-month pre-maturity test for the hard bullet covered bonds, against Fitch Ratings’ assessment of the assets needing up to nine months to liquidate in a stress scenario (liquidity class 5); the provision for the guarantor to take action after issuer default and its ability to do so, aided by the adequate quality of the issuer’s IT systems; and the oversight of the Financial Services Authority (FSA), as the issuer is regulated under the UK Regulated Covered Bond (RCB) framework. A dynamic asset coverage test (ACT) is in place to ensure that a minimum level of OC will be maintained by the issuer. The ACT stipulates that the AP cannot exceed 92.5% at any time. Highlights: On the pool cutoff date of 10 May 2011, the cover pool consisted of 119,851 loans granted to prime UK borrowers, with an ag-gregate outstanding balance of GBP11.4bn. The portfolio’s weighted average (WA) original loan-to-value ratio (LTV) was 51.5%, with a WA current indexed LTV of 47.4%. The pool is diversified across the UK and does not contain any buy-to-let loans. In a ‘AAA’ scenario, Fitch calculated an expected loss of 4.5% for the provisional pool. The covered bonds issued bear a fixed or floating interest rate, and the cover pool assets yield a mix of fixed and floating interest. Hedging agreements have been entered into with the issuer to hedge interest rate risk for the guarantor. HSBC has recently amended the program by removing the RMBS issuance channel; it has also repaid Series 5 through to Series 11 and has amended the documents to be a standalone traditional UK covered bond program. Following the release of the “Covered Bond Counterparty Criteria”, published 14 March 2011, Fitch has re-assessed the program and adjusted the D-Factor to reflect the material-ity of the swaps provided by HSBC, and its impact on the likelihood of default of the covered bonds upon the default of the issuer. The level of AP supporting the rating will be affected by, among other things, the profile of the cover assets relative to the covered bonds issued under the program, which can change over time, even in the absence of new issuance. All else being equal, the covered bonds’ rating could still be maintained at ‘AAA’ if the issuer were rated as low as ‘BBB+’. Background: HSBC has previously issued GBP15.6bn of covered bonds under this program. The covered bonds rank pari passu among themselves and are direct, unconditional, unsecured and unsubordinated obligations of the issuer guaranteed by the LLP, a partnership entity established solely for the purposes of the program and with restricted permitted activities. The Issuer: HSBC is the fifth-largest banking group in the UK by assets (GBP798.5bn) and is a 100%-owned subsidiary of HSBC Holdings plc. As of December 2010, the bank had a network of over 1,300 branches in the UK, 14 branches located in the Isle of Man and the Channel Islands and various other branches around Europe. The Program: The scope of the activities of the LLP — which guarantees the covered bonds — include periodically acquiring mortgage loans from HSBC, together with their related security, raising funds and guaranteeing the covered bonds. The guarantee pledged by the LLP plays a crucial role in Fitch’s assessment of the default probability of the covered bonds, compared with the issuer’s likelihood of default; it can allow the payments on the covered bonds to continue without interruption, despite the insolvency of the issuer, and allows Fitch to assign a rating to the covered bonds above the issuer’s rating. Continu-ity Analysis: Under Fitch’s covered bonds rating methodology, the covered bonds rated by the agency are assigned a D-Factor between 0% (best) and 100% (worst). The D-Factor reflects the likelihood of the covered bonds defaulting in the immediate aftermath of a default by the issuer. The D-Factor has four weighted components, which are analyzed below in relation to specific aspects of the issuer’s covered bond program.
Source: Rating Agencies, UniCredit Research
25 October 2011 Credit Research
Sector Report
UniCredit Research page 62 See last pages for disclaimer.
Lloyds Banking Group Key characteristics Ratings (Group): A2n/As/As Ratings (TSB): A1n/A+s/As Bloomberg: LLOY LN Bond ticker: LLOYDS www.lloydsbankinggroup.com
Lloyds Banking Group is the UK's largest domestic retail bank and largest provider of current accounts, savings, personal loans, credit cards and mortgages. It serves over 30 million customers with more than 104,000 employees. Within the group, there are four business areas: Retail Banking, Wholesale, Insurance and Wealth & International. In January 2009, after acquiring HBOS plc, Lloyds TSB Group plc was renamed Lloyds Banking Group. Lloyds Banking Group has several multiple brands, among which Lloyds TSB and Halifax are the main brands in England and Wales, with Bank of Scotland being the main one in Scot-land. Other brands include Scottish Widows and Cheltenham & Gloucester. Given its impor-tance to the country's financial system, substantial government support was provided to Lloyds Banking Group. Lloyds was granted guarantees for around GBP 40bn in funding, of which GBP 31.6bn are outstanding, and it received GBP 19bn in T1 capital. As of 1H11, HM Treasury owns 40.2% of the group. As a result of government support, the European Com-mission insisted on the disposal of a retail banking unit and 19% of the group's mortgage bal-ances (Cheltenham & Gloucester, Intelligent Finance, several Lloyds TSB branches in Eng-land and Wales and the TSB brand) until 2013. The group's future strategy is to further re-duce non-core assets, cut staff and invest GBP 2bn during 2011-2014 to grow the core cus-tomer franchise. Lloyds also plans to further strengthen funding, liquidity and capitalization(with a core Tier-1 ratio above 10% in FY13, resulting in a negative effect of Basel 2.5 and 3 on the former of around 0.8%) and to resume dividend payments after expiration of the EU restrictions. Lloyds has solid funding targets until the end of 2014 on a combined businesses basis: (i) loan-to-deposit ratio <= 130% for the group and 120% for the core business; (ii) Li-quidity Coverage Ratio and Net Stable Funding Ratio requirements to be met before the im-plementation deadline.
LLOYDS: SWOT ANALYSIS Strengths/Opportunities Weaknesses/Threats 40.2% government-owned Vulnerability of the UK economy and mortgage sector Domestic retail market leader in a large country Very low geographic diversification Benefits from HBOS acquisition synergies Margin pressure Strong deposit funding base Break-up decision by the UK government in late 2011 (unlikely)
Source: UniCredit Research
Latest results … Lloyds Banking Group reported a net loss of GBP 2.3bn in 1H11 vs. a profit of GBP 596mn in 1H10 and below market expectations of GBP 2.2bn (Bloomberg). On a statu-tory basis, loss before tax was GBP 3.3bn vs. a profit of GBP 1.3bn in 1H10, mainly due to the significant – albeit one-time – PPI provision of GBP 3.2bn (GBP 51mn higher than an-nounced in the Strategic Review of 30 June 2011), massively lower trading surplus (-82% yoy) and higher operating expenses (+66% yoy) but lower overall impairment (-17% yoy), with a deterioration in Ireland but improvements particularly in Wholesale. Combined, or operating, business figures showed a PBT of GBP 1.1bn vs. GBP of 1.6bn in 1H10 and underlying PBT(exclusive of liability management and ECN effects of GBP 851mn) rose 36% yoy to GBP1.3bn from GBP 988mn in 1H10. Core business PBT was GBP 2.7bn vs. GBP 3.7bn in 1H10,while underlying total income (net of insurance claims) fell 12% yoy to GBP 10.4bn, as non-core assets were reduced and lending markets were under pressure. Underlying total income declined 7% yoy (exclusive of losses from the sale of treasury assets of GBP 670mn), mainlydue to 6% yoy less average interest-earning assets. The banking net interest margin fell to 2.07% from 2.12% in 1H10 as funding costs remained high and government and central bank facilities were repaid. The goal of yearly run-rate savings of GBP 2bn by end-2011 progresses as planned and impairment charges fell by 17% yoy to GBP 5.4bn. Due to fewer RWAs, capi-talization improved to 10.1% from 9.0% in 1H10 (core Tier-1 ratio), 11.6% from 10.3% in1H10 (Tier-1 ratio) and 15.2% from 13.4% (total capital ratio). Management sticks to its 2011 guidance and 2014 goals in its Strategic Review announcement (please also refer to our DCB of 1 July 2011).
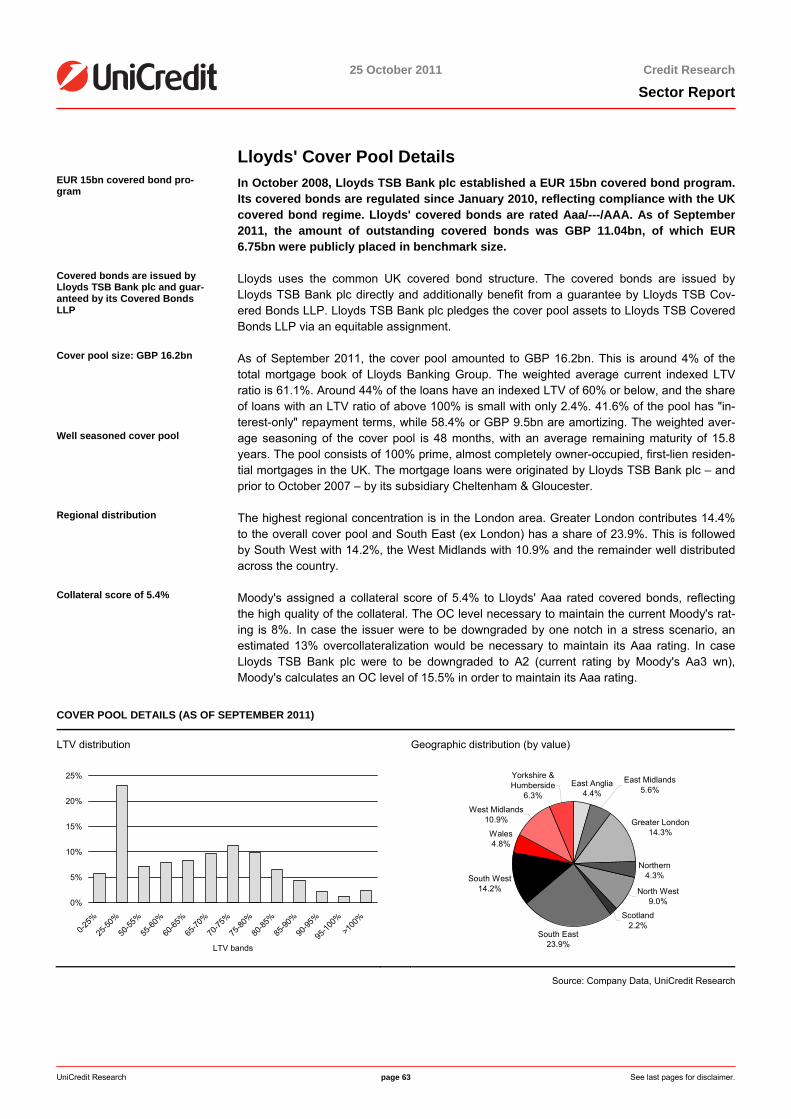
25 October 2011 Credit Research
Sector Report
UniCredit Research page 63 See last pages for disclaimer.
Lloyds' Cover Pool Details EUR 15bn covered bond pro-gram
In October 2008, Lloyds TSB Bank plc established a EUR 15bn covered bond program.Its covered bonds are regulated since January 2010, reflecting compliance with the UKcovered bond regime. Lloyds' covered bonds are rated Aaa/---/AAA. As of September 2011, the amount of outstanding covered bonds was GBP 11.04bn, of which EUR6.75bn were publicly placed in benchmark size.
Covered bonds are issued by Lloyds TSB Bank plc and guar-anteed by its Covered Bonds LLP
Lloyds uses the common UK covered bond structure. The covered bonds are issued byLloyds TSB Bank plc directly and additionally benefit from a guarantee by Lloyds TSB Cov-ered Bonds LLP. Lloyds TSB Bank plc pledges the cover pool assets to Lloyds TSB Covered Bonds LLP via an equitable assignment.
Cover pool size: GBP 16.2bn Well seasoned cover pool
As of September 2011, the cover pool amounted to GBP 16.2bn. This is around 4% of the total mortgage book of Lloyds Banking Group. The weighted average current indexed LTV ratio is 61.1%. Around 44% of the loans have an indexed LTV of 60% or below, and the shareof loans with an LTV ratio of above 100% is small with only 2.4%. 41.6% of the pool has "in-terest-only" repayment terms, while 58.4% or GBP 9.5bn are amortizing. The weighted aver-age seasoning of the cover pool is 48 months, with an average remaining maturity of 15.8years. The pool consists of 100% prime, almost completely owner-occupied, first-lien residen-tial mortgages in the UK. The mortgage loans were originated by Lloyds TSB Bank plc – and prior to October 2007 – by its subsidiary Cheltenham & Gloucester.
Regional distribution The highest regional concentration is in the London area. Greater London contributes 14.4%to the overall cover pool and South East (ex London) has a share of 23.9%. This is followedby South West with 14.2%, the West Midlands with 10.9% and the remainder well distributedacross the country.
Collateral score of 5.4% Moody's assigned a collateral score of 5.4% to Lloyds' Aaa rated covered bonds, reflectingthe high quality of the collateral. The OC level necessary to maintain the current Moody's rat-ing is 8%. In case the issuer were to be downgraded by one notch in a stress scenario, an estimated 13% overcollateralization would be necessary to maintain its Aaa rating. In caseLloyds TSB Bank plc were to be downgraded to A2 (current rating by Moody's Aa3 wn),Moody's calculates an OC level of 15.5% in order to maintain its Aaa rating.
COVER POOL DETAILS (AS OF SEPTEMBER 2011)
LTV distribution Geographic distribution (by value)
0%
5%
10%
15%
20%
25%
0-25%
25-50
%
50-55
%
55-60
%
60-65
%
65-70
%
70-75
%
75-80
%
80-85
%
85-90
%
90-95
%
95-10
0%>1
00%
LTV bands
East Anglia4.4%
Greater London14.3%
Northern 4.3%
North West9.0%
Scotland2.2%
East Midlands5.6%
Yorkshire & Humberside
6.3%
West Midlands10.9%
South West14.2%
Wales4.8%
South East23.9%
Source: Company Data, UniCredit Research
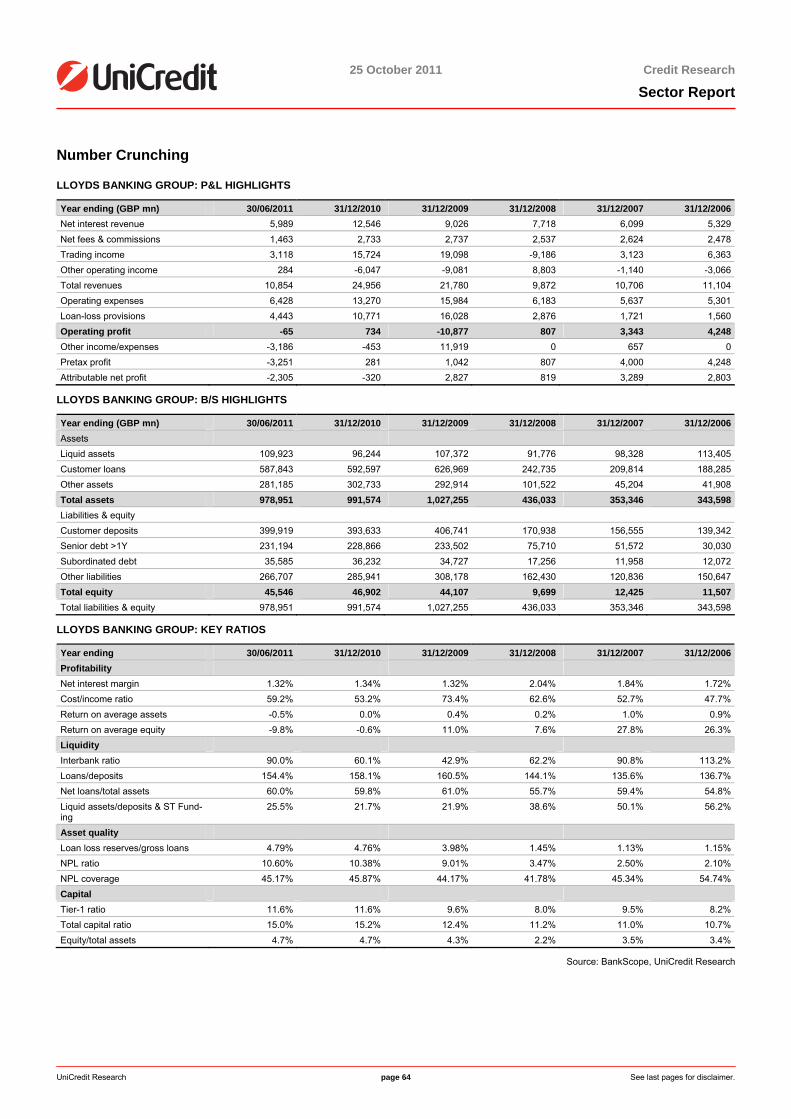
25 October 2011 Credit Research
Sector Report
UniCredit Research page 64 See last pages for disclaimer.
Number Crunching
LLOYDS BANKING GROUP: P&L HIGHLIGHTS
Year ending (GBP mn) 30/06/2011 31/12/2010 31/12/2009 31/12/2008 31/12/2007 31/12/2006Net interest revenue 5,989 12,546 9,026 7,718 6,099 5,329Net fees & commissions 1,463 2,733 2,737 2,537 2,624 2,478Trading income 3,118 15,724 19,098 -9,186 3,123 6,363Other operating income 284 -6,047 -9,081 8,803 -1,140 -3,066Total revenues 10,854 24,956 21,780 9,872 10,706 11,104Operating expenses 6,428 13,270 15,984 6,183 5,637 5,301Loan-loss provisions 4,443 10,771 16,028 2,876 1,721 1,560Operating profit -65 734 -10,877 807 3,343 4,248Other income/expenses -3,186 -453 11,919 0 657 0Pretax profit -3,251 281 1,042 807 4,000 4,248Attributable net profit -2,305 -320 2,827 819 3,289 2,803
LLOYDS BANKING GROUP: B/S HIGHLIGHTS
Year ending (GBP mn) 30/06/2011 31/12/2010 31/12/2009 31/12/2008 31/12/2007 31/12/2006Assets Liquid assets 109,923 96,244 107,372 91,776 98,328 113,405Customer loans 587,843 592,597 626,969 242,735 209,814 188,285Other assets 281,185 302,733 292,914 101,522 45,204 41,908Total assets 978,951 991,574 1,027,255 436,033 353,346 343,598Liabilities & equity Customer deposits 399,919 393,633 406,741 170,938 156,555 139,342Senior debt >1Y 231,194 228,866 233,502 75,710 51,572 30,030Subordinated debt 35,585 36,232 34,727 17,256 11,958 12,072Other liabilities 266,707 285,941 308,178 162,430 120,836 150,647Total equity 45,546 46,902 44,107 9,699 12,425 11,507Total liabilities & equity 978,951 991,574 1,027,255 436,033 353,346 343,598
LLOYDS BANKING GROUP: KEY RATIOS
Year ending 30/06/2011 31/12/2010 31/12/2009 31/12/2008 31/12/2007 31/12/2006Profitability Net interest margin 1.32% 1.34% 1.32% 2.04% 1.84% 1.72%Cost/income ratio 59.2% 53.2% 73.4% 62.6% 52.7% 47.7%Return on average assets -0.5% 0.0% 0.4% 0.2% 1.0% 0.9%Return on average equity -9.8% -0.6% 11.0% 7.6% 27.8% 26.3%Liquidity Interbank ratio 90.0% 60.1% 42.9% 62.2% 90.8% 113.2%Loans/deposits 154.4% 158.1% 160.5% 144.1% 135.6% 136.7%Net loans/total assets 60.0% 59.8% 61.0% 55.7% 59.4% 54.8%Liquid assets/deposits & ST Fund-ing
25.5% 21.7% 21.9% 38.6% 50.1% 56.2%
Asset quality Loan loss reserves/gross loans 4.79% 4.76% 3.98% 1.45% 1.13% 1.15%NPL ratio 10.60% 10.38% 9.01% 3.47% 2.50% 2.10%NPL coverage 45.17% 45.87% 44.17% 41.78% 45.34% 54.74%Capital Tier-1 ratio 11.6% 11.6% 9.6% 8.0% 9.5% 8.2%Total capital ratio 15.0% 15.2% 12.4% 11.2% 11.0% 10.7%Equity/total assets 4.7% 4.7% 4.3% 2.2% 3.5% 3.4%
Source: BankScope, UniCredit Research
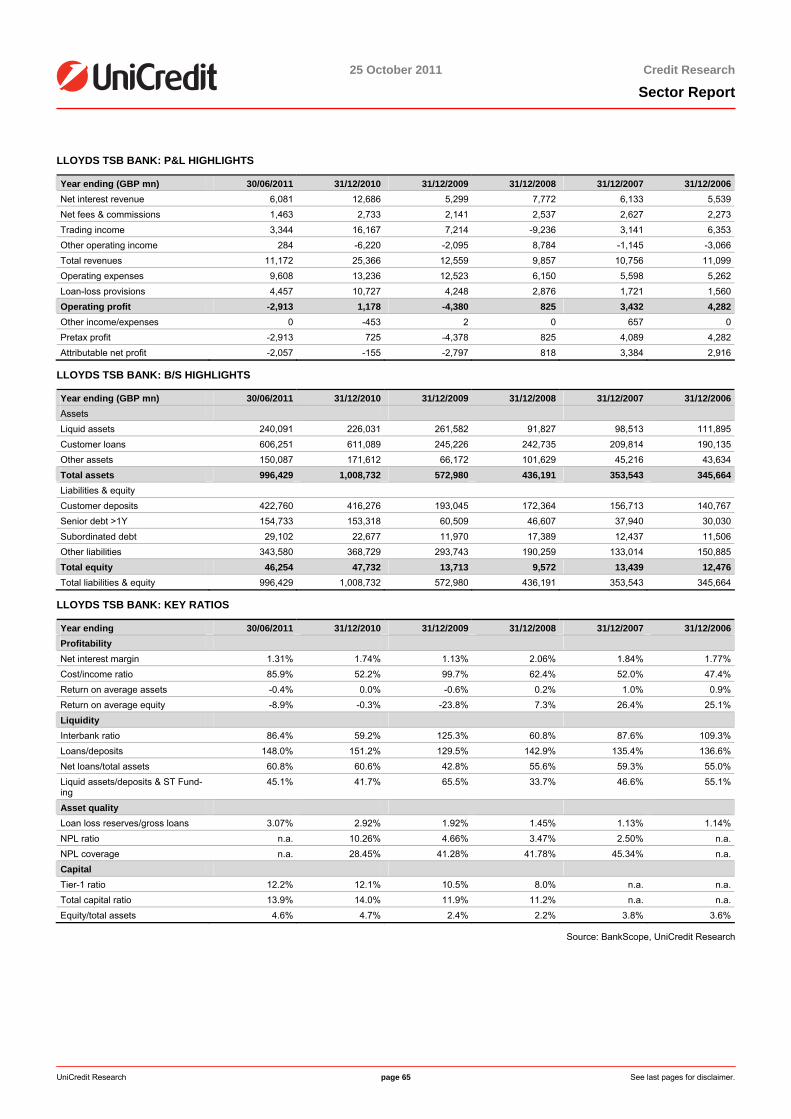
25 October 2011 Credit Research
Sector Report
UniCredit Research page 65 See last pages for disclaimer.
LLOYDS TSB BANK: P&L HIGHLIGHTS
Year ending (GBP mn) 30/06/2011 31/12/2010 31/12/2009 31/12/2008 31/12/2007 31/12/2006Net interest revenue 6,081 12,686 5,299 7,772 6,133 5,539Net fees & commissions 1,463 2,733 2,141 2,537 2,627 2,273Trading income 3,344 16,167 7,214 -9,236 3,141 6,353Other operating income 284 -6,220 -2,095 8,784 -1,145 -3,066Total revenues 11,172 25,366 12,559 9,857 10,756 11,099Operating expenses 9,608 13,236 12,523 6,150 5,598 5,262Loan-loss provisions 4,457 10,727 4,248 2,876 1,721 1,560Operating profit -2,913 1,178 -4,380 825 3,432 4,282Other income/expenses 0 -453 2 0 657 0Pretax profit -2,913 725 -4,378 825 4,089 4,282Attributable net profit -2,057 -155 -2,797 818 3,384 2,916
LLOYDS TSB BANK: B/S HIGHLIGHTS
Year ending (GBP mn) 30/06/2011 31/12/2010 31/12/2009 31/12/2008 31/12/2007 31/12/2006Assets Liquid assets 240,091 226,031 261,582 91,827 98,513 111,895Customer loans 606,251 611,089 245,226 242,735 209,814 190,135Other assets 150,087 171,612 66,172 101,629 45,216 43,634Total assets 996,429 1,008,732 572,980 436,191 353,543 345,664Liabilities & equity Customer deposits 422,760 416,276 193,045 172,364 156,713 140,767Senior debt >1Y 154,733 153,318 60,509 46,607 37,940 30,030Subordinated debt 29,102 22,677 11,970 17,389 12,437 11,506Other liabilities 343,580 368,729 293,743 190,259 133,014 150,885Total equity 46,254 47,732 13,713 9,572 13,439 12,476Total liabilities & equity 996,429 1,008,732 572,980 436,191 353,543 345,664
LLOYDS TSB BANK: KEY RATIOS
Year ending 30/06/2011 31/12/2010 31/12/2009 31/12/2008 31/12/2007 31/12/2006Profitability Net interest margin 1.31% 1.74% 1.13% 2.06% 1.84% 1.77%Cost/income ratio 85.9% 52.2% 99.7% 62.4% 52.0% 47.4%Return on average assets -0.4% 0.0% -0.6% 0.2% 1.0% 0.9%Return on average equity -8.9% -0.3% -23.8% 7.3% 26.4% 25.1%Liquidity Interbank ratio 86.4% 59.2% 125.3% 60.8% 87.6% 109.3%Loans/deposits 148.0% 151.2% 129.5% 142.9% 135.4% 136.6%Net loans/total assets 60.8% 60.6% 42.8% 55.6% 59.3% 55.0%Liquid assets/deposits & ST Fund-ing
45.1% 41.7% 65.5% 33.7% 46.6% 55.1%
Asset quality Loan loss reserves/gross loans 3.07% 2.92% 1.92% 1.45% 1.13% 1.14%NPL ratio n.a. 10.26% 4.66% 3.47% 2.50% n.a.NPL coverage n.a. 28.45% 41.28% 41.78% 45.34% n.a.Capital Tier-1 ratio 12.2% 12.1% 10.5% 8.0% n.a. n.a.Total capital ratio 13.9% 14.0% 11.9% 11.2% n.a. n.a.Equity/total assets 4.6% 4.7% 2.4% 2.2% 3.8% 3.6%
Source: BankScope, UniCredit Research
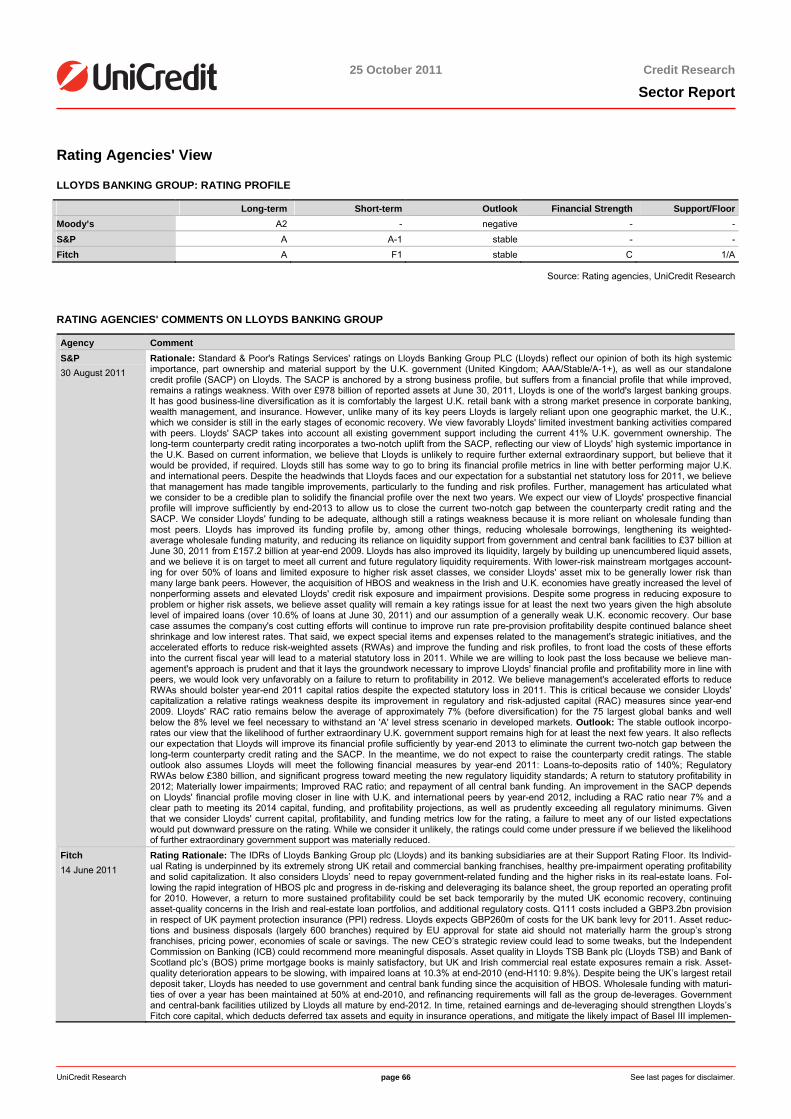
25 October 2011 Credit Research
Sector Report
UniCredit Research page 66 See last pages for disclaimer.
Rating Agencies' View
LLOYDS BANKING GROUP: RATING PROFILE
Long-term Short-term Outlook Financial Strength Support/FloorMoody’s A2 - negative - -S&P A A-1 stable - -Fitch A F1 stable C 1/A
Source: Rating agencies, UniCredit Research
RATING AGENCIES' COMMENTS ON LLOYDS BANKING GROUP
Agency Comment S&P 30 August 2011
Rationale: Standard & Poor's Ratings Services' ratings on Lloyds Banking Group PLC (Lloyds) reflect our opinion of both its high systemic importance, part ownership and material support by the U.K. government (United Kingdom; AAA/Stable/A-1+), as well as our standalone credit profile (SACP) on Lloyds. The SACP is anchored by a strong business profile, but suffers from a financial profile that while improved, remains a ratings weakness. With over £978 billion of reported assets at June 30, 2011, Lloyds is one of the world's largest banking groups. It has good business-line diversification as it is comfortably the largest U.K. retail bank with a strong market presence in corporate banking, wealth management, and insurance. However, unlike many of its key peers Lloyds is largely reliant upon one geographic market, the U.K., which we consider is still in the early stages of economic recovery. We view favorably Lloyds' limited investment banking activities compared with peers. Lloyds' SACP takes into account all existing government support including the current 41% U.K. government ownership. The long-term counterparty credit rating incorporates a two-notch uplift from the SACP, reflecting our view of Lloyds' high systemic importance in the U.K. Based on current information, we believe that Lloyds is unlikely to require further external extraordinary support, but believe that it would be provided, if required. Lloyds still has some way to go to bring its financial profile metrics in line with better performing major U.K. and international peers. Despite the headwinds that Lloyds faces and our expectation for a substantial net statutory loss for 2011, we believe that management has made tangible improvements, particularly to the funding and risk profiles. Further, management has articulated what we consider to be a credible plan to solidify the financial profile over the next two years. We expect our view of Lloyds' prospective financial profile will improve sufficiently by end-2013 to allow us to close the current two-notch gap between the counterparty credit rating and the SACP. We consider Lloyds' funding to be adequate, although still a ratings weakness because it is more reliant on wholesale funding than most peers. Lloyds has improved its funding profile by, among other things, reducing wholesale borrowings, lengthening its weighted-average wholesale funding maturity, and reducing its reliance on liquidity support from government and central bank facilities to £37 billion at June 30, 2011 from £157.2 billion at year-end 2009. Lloyds has also improved its liquidity, largely by building up unencumbered liquid assets, and we believe it is on target to meet all current and future regulatory liquidity requirements. With lower-risk mainstream mortgages account-ing for over 50% of loans and limited exposure to higher risk asset classes, we consider Lloyds' asset mix to be generally lower risk than many large bank peers. However, the acquisition of HBOS and weakness in the Irish and U.K. economies have greatly increased the level of nonperforming assets and elevated Lloyds' credit risk exposure and impairment provisions. Despite some progress in reducing exposure to problem or higher risk assets, we believe asset quality will remain a key ratings issue for at least the next two years given the high absolute level of impaired loans (over 10.6% of loans at June 30, 2011) and our assumption of a generally weak U.K. economic recovery. Our base case assumes the company's cost cutting efforts will continue to improve run rate pre-provision profitability despite continued balance sheet shrinkage and low interest rates. That said, we expect special items and expenses related to the management's strategic initiatives, and the accelerated efforts to reduce risk-weighted assets (RWAs) and improve the funding and risk profiles, to front load the costs of these efforts into the current fiscal year will lead to a material statutory loss in 2011. While we are willing to look past the loss because we believe man-agement's approach is prudent and that it lays the groundwork necessary to improve Lloyds' financial profile and profitability more in line with peers, we would look very unfavorably on a failure to return to profitability in 2012. We believe management's accelerated efforts to reduce RWAs should bolster year-end 2011 capital ratios despite the expected statutory loss in 2011. This is critical because we consider Lloyds' capitalization a relative ratings weakness despite its improvement in regulatory and risk-adjusted capital (RAC) measures since year-end 2009. Lloyds' RAC ratio remains below the average of approximately 7% (before diversification) for the 75 largest global banks and well below the 8% level we feel necessary to withstand an 'A' level stress scenario in developed markets. Outlook: The stable outlook incorpo-rates our view that the likelihood of further extraordinary U.K. government support remains high for at least the next few years. It also reflects our expectation that Lloyds will improve its financial profile sufficiently by year-end 2013 to eliminate the current two-notch gap between the long-term counterparty credit rating and the SACP. In the meantime, we do not expect to raise the counterparty credit ratings. The stable outlook also assumes Lloyds will meet the following financial measures by year-end 2011: Loans-to-deposits ratio of 140%; Regulatory RWAs below £380 billion, and significant progress toward meeting the new regulatory liquidity standards; A return to statutory profitability in 2012; Materially lower impairments; Improved RAC ratio; and repayment of all central bank funding. An improvement in the SACP depends on Lloyds' financial profile moving closer in line with U.K. and international peers by year-end 2012, including a RAC ratio near 7% and a clear path to meeting its 2014 capital, funding, and profitability projections, as well as prudently exceeding all regulatory minimums. Given that we consider Lloyds' current capital, profitability, and funding metrics low for the rating, a failure to meet any of our listed expectations would put downward pressure on the rating. While we consider it unlikely, the ratings could come under pressure if we believed the likelihood of further extraordinary government support was materially reduced.
Fitch 14 June 2011
Rating Rationale: The IDRs of Lloyds Banking Group plc (Lloyds) and its banking subsidiaries are at their Support Rating Floor. Its Individ-ual Rating is underpinned by its extremely strong UK retail and commercial banking franchises, healthy pre-impairment operating profitability and solid capitalization. It also considers Lloyds’ need to repay government-related funding and the higher risks in its real-estate loans. Fol-lowing the rapid integration of HBOS plc and progress in de-risking and deleveraging its balance sheet, the group reported an operating profit for 2010. However, a return to more sustained profitability could be set back temporarily by the muted UK economic recovery, continuing asset-quality concerns in the Irish and real-estate loan portfolios, and additional regulatory costs. Q111 costs included a GBP3.2bn provision in respect of UK payment protection insurance (PPI) redress. Lloyds expects GBP260m of costs for the UK bank levy for 2011. Asset reduc-tions and business disposals (largely 600 branches) required by EU approval for state aid should not materially harm the group’s strong franchises, pricing power, economies of scale or savings. The new CEO’s strategic review could lead to some tweaks, but the Independent Commission on Banking (ICB) could recommend more meaningful disposals. Asset quality in Lloyds TSB Bank plc (Lloyds TSB) and Bank of Scotland plc’s (BOS) prime mortgage books is mainly satisfactory, but UK and Irish commercial real estate exposures remain a risk. Asset-quality deterioration appears to be slowing, with impaired loans at 10.3% at end-2010 (end-H110: 9.8%). Despite being the UK’s largest retail deposit taker, Lloyds has needed to use government and central bank funding since the acquisition of HBOS. Wholesale funding with maturi-ties of over a year has been maintained at 50% at end-2010, and refinancing requirements will fall as the group de-leverages. Government and central-bank facilities utilized by Lloyds all mature by end-2012. In time, retained earnings and de-leveraging should strengthen Lloyds’s Fitch core capital, which deducts deferred tax assets and equity in insurance operations, and mitigate the likely impact of Basel III implemen-
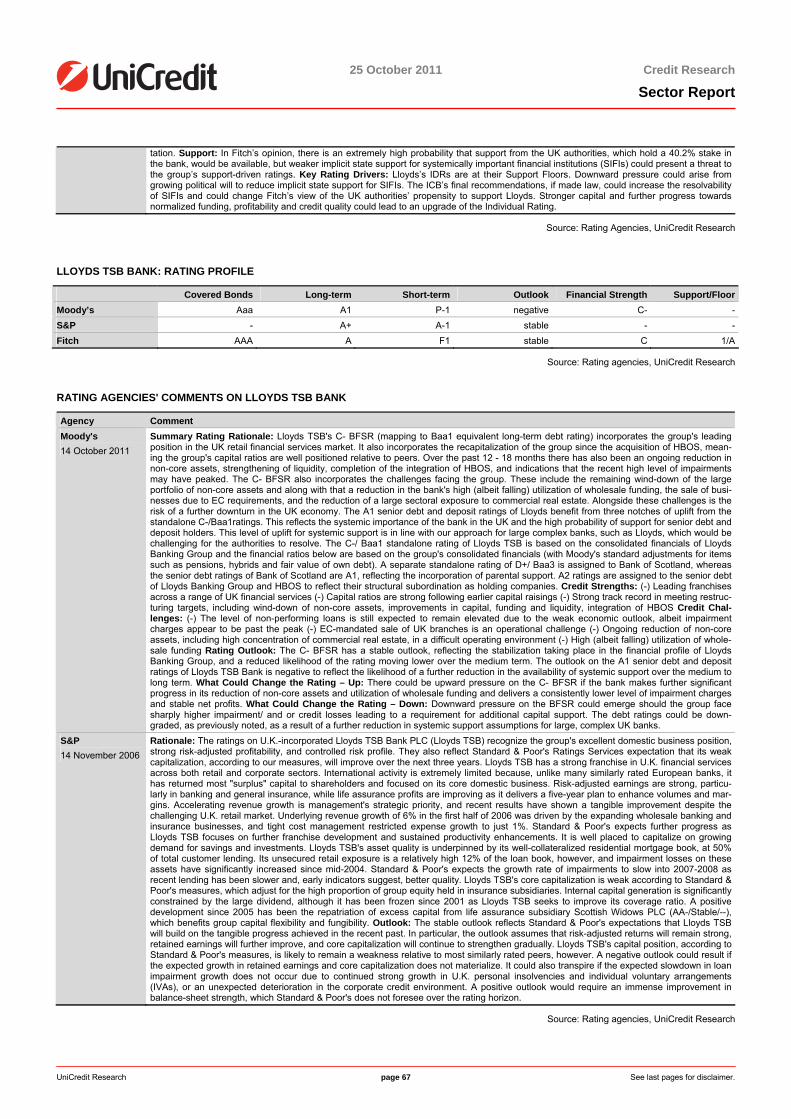
25 October 2011 Credit Research
Sector Report
UniCredit Research page 67 See last pages for disclaimer.
tation. Support: In Fitch’s opinion, there is an extremely high probability that support from the UK authorities, which hold a 40.2% stake in the bank, would be available, but weaker implicit state support for systemically important financial institutions (SIFIs) could present a threat to the group’s support-driven ratings. Key Rating Drivers: Lloyds’s IDRs are at their Support Floors. Downward pressure could arise from growing political will to reduce implicit state support for SIFIs. The ICB’s final recommendations, if made law, could increase the resolvability of SIFIs and could change Fitch’s view of the UK authorities’ propensity to support Lloyds. Stronger capital and further progress towards normalized funding, profitability and credit quality could lead to an upgrade of the Individual Rating.
Source: Rating Agencies, UniCredit Research
LLOYDS TSB BANK: RATING PROFILE
Covered Bonds Long-term Short-term Outlook Financial Strength Support/FloorMoody’s Aaa A1 P-1 negative C- -S&P - A+ A-1 stable - -Fitch AAA A F1 stable C 1/A
Source: Rating agencies, UniCredit Research
RATING AGENCIES' COMMENTS ON LLOYDS TSB BANK
Agency Comment Moody's 14 October 2011
Summary Rating Rationale: Lloyds TSB's C- BFSR (mapping to Baa1 equivalent long-term debt rating) incorporates the group's leading position in the UK retail financial services market. It also incorporates the recapitalization of the group since the acquisition of HBOS, mean-ing the group's capital ratios are well positioned relative to peers. Over the past 12 - 18 months there has also been an ongoing reduction in non-core assets, strengthening of liquidity, completion of the integration of HBOS, and indications that the recent high level of impairments may have peaked. The C- BFSR also incorporates the challenges facing the group. These include the remaining wind-down of the large portfolio of non-core assets and along with that a reduction in the bank's high (albeit falling) utilization of wholesale funding, the sale of busi-nesses due to EC requirements, and the reduction of a large sectoral exposure to commercial real estate. Alongside these challenges is the risk of a further downturn in the UK economy. The A1 senior debt and deposit ratings of Lloyds benefit from three notches of uplift from the standalone C-/Baa1ratings. This reflects the systemic importance of the bank in the UK and the high probability of support for senior debt and deposit holders. This level of uplift for systemic support is in line with our approach for large complex banks, such as Lloyds, which would be challenging for the authorities to resolve. The C-/ Baa1 standalone rating of Lloyds TSB is based on the consolidated financials of Lloyds Banking Group and the financial ratios below are based on the group's consolidated financials (with Moody's standard adjustments for items such as pensions, hybrids and fair value of own debt). A separate standalone rating of D+/ Baa3 is assigned to Bank of Scotland, whereas the senior debt ratings of Bank of Scotland are A1, reflecting the incorporation of parental support. A2 ratings are assigned to the senior debt of Lloyds Banking Group and HBOS to reflect their structural subordination as holding companies. Credit Strengths: (-) Leading franchises across a range of UK financial services (-) Capital ratios are strong following earlier capital raisings (-) Strong track record in meeting restruc-turing targets, including wind-down of non-core assets, improvements in capital, funding and liquidity, integration of HBOS Credit Chal-lenges: (-) The level of non-performing loans is still expected to remain elevated due to the weak economic outlook, albeit impairment charges appear to be past the peak (-) EC-mandated sale of UK branches is an operational challenge (-) Ongoing reduction of non-core assets, including high concentration of commercial real estate, in a difficult operating environment (-) High (albeit falling) utilization of whole-sale funding Rating Outlook: The C- BFSR has a stable outlook, reflecting the stabilization taking place in the financial profile of Lloyds Banking Group, and a reduced likelihood of the rating moving lower over the medium term. The outlook on the A1 senior debt and deposit ratings of Lloyds TSB Bank is negative to reflect the likelihood of a further reduction in the availability of systemic support over the medium to long term. What Could Change the Rating – Up: There could be upward pressure on the C- BFSR if the bank makes further significant progress in its reduction of non-core assets and utilization of wholesale funding and delivers a consistently lower level of impairment charges and stable net profits. What Could Change the Rating – Down: Downward pressure on the BFSR could emerge should the group face sharply higher impairment/ and or credit losses leading to a requirement for additional capital support. The debt ratings could be down-graded, as previously noted, as a result of a further reduction in systemic support assumptions for large, complex UK banks.
S&P 14 November 2006
Rationale: The ratings on U.K.-incorporated Lloyds TSB Bank PLC (Lloyds TSB) recognize the group's excellent domestic business position, strong risk-adjusted profitability, and controlled risk profile. They also reflect Standard & Poor's Ratings Services expectation that its weak capitalization, according to our measures, will improve over the next three years. Lloyds TSB has a strong franchise in U.K. financial services across both retail and corporate sectors. International activity is extremely limited because, unlike many similarly rated European banks, it has returned most "surplus" capital to shareholders and focused on its core domestic business. Risk-adjusted earnings are strong, particu-larly in banking and general insurance, while life assurance profits are improving as it delivers a five-year plan to enhance volumes and mar-gins. Accelerating revenue growth is management's strategic priority, and recent results have shown a tangible improvement despite the challenging U.K. retail market. Underlying revenue growth of 6% in the first half of 2006 was driven by the expanding wholesale banking and insurance businesses, and tight cost management restricted expense growth to just 1%. Standard & Poor's expects further progress as Lloyds TSB focuses on further franchise development and sustained productivity enhancements. It is well placed to capitalize on growing demand for savings and investments. Lloyds TSB's asset quality is underpinned by its well-collateralized residential mortgage book, at 50% of total customer lending. Its unsecured retail exposure is a relatively high 12% of the loan book, however, and impairment losses on these assets have significantly increased since mid-2004. Standard & Poor's expects the growth rate of impairments to slow into 2007-2008 as recent lending has been slower and, early indicators suggest, better quality. Lloyds TSB's core capitalization is weak according to Standard & Poor's measures, which adjust for the high proportion of group equity held in insurance subsidiaries. Internal capital generation is significantly constrained by the large dividend, although it has been frozen since 2001 as Lloyds TSB seeks to improve its coverage ratio. A positive development since 2005 has been the repatriation of excess capital from life assurance subsidiary Scottish Widows PLC (AA-/Stable/--), which benefits group capital flexibility and fungibility. Outlook: The stable outlook reflects Standard & Poor's expectations that Lloyds TSB will build on the tangible progress achieved in the recent past. In particular, the outlook assumes that risk-adjusted returns will remain strong, retained earnings will further improve, and core capitalization will continue to strengthen gradually. Lloyds TSB's capital position, according to Standard & Poor's measures, is likely to remain a weakness relative to most similarly rated peers, however. A negative outlook could result if the expected growth in retained earnings and core capitalization does not materialize. It could also transpire if the expected slowdown in loan impairment growth does not occur due to continued strong growth in U.K. personal insolvencies and individual voluntary arrangements (IVAs), or an unexpected deterioration in the corporate credit environment. A positive outlook would require an immense improvement in balance-sheet strength, which Standard & Poor's does not foresee over the rating horizon.
Source: Rating agencies, UniCredit Research
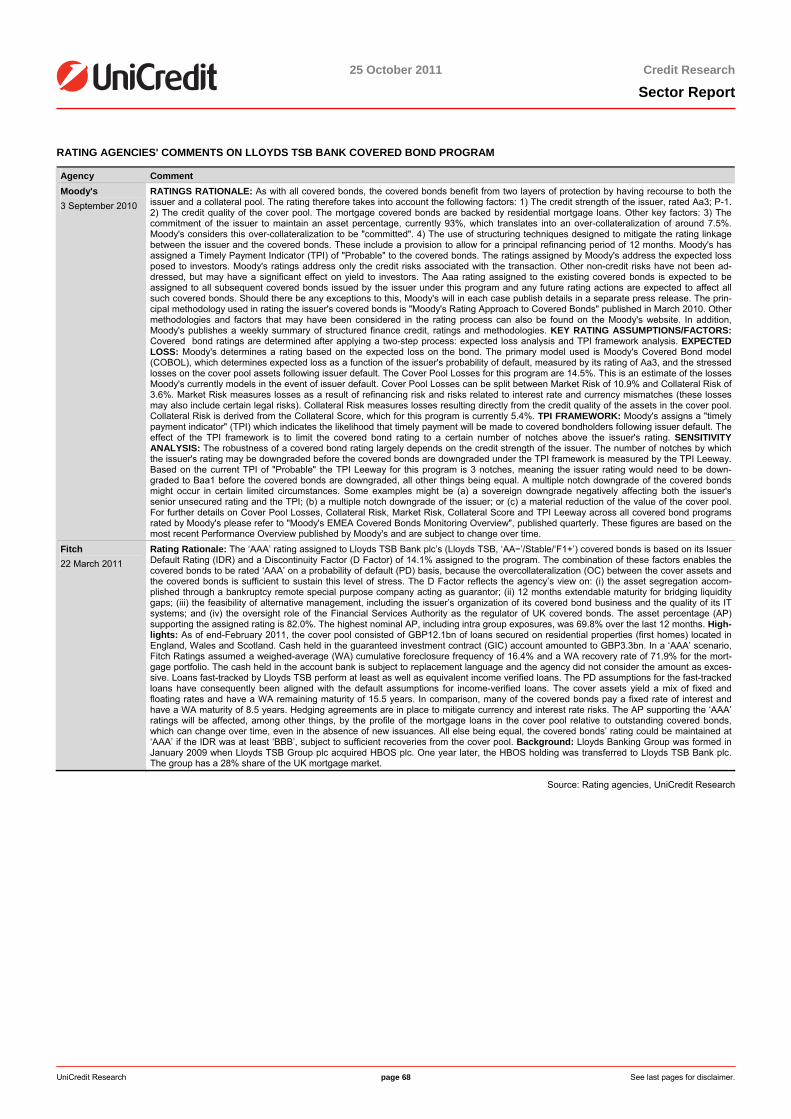
25 October 2011 Credit Research
Sector Report
UniCredit Research page 68 See last pages for disclaimer.
RATING AGENCIES' COMMENTS ON LLOYDS TSB BANK COVERED BOND PROGRAM
Agency Comment Moody's 3 September 2010
RATINGS RATIONALE: As with all covered bonds, the covered bonds benefit from two layers of protection by having recourse to both the issuer and a collateral pool. The rating therefore takes into account the following factors: 1) The credit strength of the issuer, rated Aa3; P-1. 2) The credit quality of the cover pool. The mortgage covered bonds are backed by residential mortgage loans. Other key factors: 3) The commitment of the issuer to maintain an asset percentage, currently 93%, which translates into an over-collateralization of around 7.5%. Moody's considers this over-collateralization to be "committed". 4) The use of structuring techniques designed to mitigate the rating linkage between the issuer and the covered bonds. These include a provision to allow for a principal refinancing period of 12 months. Moody's has assigned a Timely Payment Indicator (TPI) of "Probable" to the covered bonds. The ratings assigned by Moody's address the expected loss posed to investors. Moody's ratings address only the credit risks associated with the transaction. Other non-credit risks have not been ad-dressed, but may have a significant effect on yield to investors. The Aaa rating assigned to the existing covered bonds is expected to be assigned to all subsequent covered bonds issued by the issuer under this program and any future rating actions are expected to affect all such covered bonds. Should there be any exceptions to this, Moody's will in each case publish details in a separate press release. The prin-cipal methodology used in rating the issuer's covered bonds is "Moody's Rating Approach to Covered Bonds" published in March 2010. Other methodologies and factors that may have been considered in the rating process can also be found on the Moody's website. In addition, Moody's publishes a weekly summary of structured finance credit, ratings and methodologies. KEY RATING ASSUMPTIONS/FACTORS: Covered bond ratings are determined after applying a two-step process: expected loss analysis and TPI framework analysis. EXPECTED LOSS: Moody's determines a rating based on the expected loss on the bond. The primary model used is Moody's Covered Bond model (COBOL), which determines expected loss as a function of the issuer's probability of default, measured by its rating of Aa3, and the stressed losses on the cover pool assets following issuer default. The Cover Pool Losses for this program are 14.5%. This is an estimate of the losses Moody's currently models in the event of issuer default. Cover Pool Losses can be split between Market Risk of 10.9% and Collateral Risk of 3.6%. Market Risk measures losses as a result of refinancing risk and risks related to interest rate and currency mismatches (these losses may also include certain legal risks). Collateral Risk measures losses resulting directly from the credit quality of the assets in the cover pool. Collateral Risk is derived from the Collateral Score, which for this program is currently 5.4%. TPI FRAMEWORK: Moody's assigns a "timely payment indicator" (TPI) which indicates the likelihood that timely payment will be made to covered bondholders following issuer default. The effect of the TPI framework is to limit the covered bond rating to a certain number of notches above the issuer's rating. SENSITIVITY ANALYSIS: The robustness of a covered bond rating largely depends on the credit strength of the issuer. The number of notches by which the issuer's rating may be downgraded before the covered bonds are downgraded under the TPI framework is measured by the TPI Leeway. Based on the current TPI of "Probable" the TPI Leeway for this program is 3 notches, meaning the issuer rating would need to be down-graded to Baa1 before the covered bonds are downgraded, all other things being equal. A multiple notch downgrade of the covered bonds might occur in certain limited circumstances. Some examples might be (a) a sovereign downgrade negatively affecting both the issuer's senior unsecured rating and the TPI; (b) a multiple notch downgrade of the issuer; or (c) a material reduction of the value of the cover pool. For further details on Cover Pool Losses, Collateral Risk, Market Risk, Collateral Score and TPI Leeway across all covered bond programs rated by Moody's please refer to "Moody's EMEA Covered Bonds Monitoring Overview", published quarterly. These figures are based on the most recent Performance Overview published by Moody's and are subject to change over time.
Fitch 22 March 2011
Rating Rationale: The ‘AAA’ rating assigned to Lloyds TSB Bank plc’s (Lloyds TSB, ‘AA−’/Stable/‘F1+’) covered bonds is based on its Issuer Default Rating (IDR) and a Discontinuity Factor (D Factor) of 14.1% assigned to the program. The combination of these factors enables the covered bonds to be rated ‘AAA’ on a probability of default (PD) basis, because the overcollateralization (OC) between the cover assets and the covered bonds is sufficient to sustain this level of stress. The D Factor reflects the agency’s view on: (i) the asset segregation accom-plished through a bankruptcy remote special purpose company acting as guarantor; (ii) 12 months extendable maturity for bridging liquidity gaps; (iii) the feasibility of alternative management, including the issuer’s organization of its covered bond business and the quality of its IT systems; and (iv) the oversight role of the Financial Services Authority as the regulator of UK covered bonds. The asset percentage (AP) supporting the assigned rating is 82.0%. The highest nominal AP, including intra group exposures, was 69.8% over the last 12 months. High-lights: As of end-February 2011, the cover pool consisted of GBP12.1bn of loans secured on residential properties (first homes) located in England, Wales and Scotland. Cash held in the guaranteed investment contract (GIC) account amounted to GBP3.3bn. In a ‘AAA’ scenario, Fitch Ratings assumed a weighed-average (WA) cumulative foreclosure frequency of 16.4% and a WA recovery rate of 71.9% for the mort-gage portfolio. The cash held in the account bank is subject to replacement language and the agency did not consider the amount as exces-sive. Loans fast-tracked by Lloyds TSB perform at least as well as equivalent income verified loans. The PD assumptions for the fast-tracked loans have consequently been aligned with the default assumptions for income-verified loans. The cover assets yield a mix of fixed and floating rates and have a WA remaining maturity of 15.5 years. In comparison, many of the covered bonds pay a fixed rate of interest and have a WA maturity of 8.5 years. Hedging agreements are in place to mitigate currency and interest rate risks. The AP supporting the ‘AAA’ ratings will be affected, among other things, by the profile of the mortgage loans in the cover pool relative to outstanding covered bonds, which can change over time, even in the absence of new issuances. All else being equal, the covered bonds’ rating could be maintained at ‘AAA’ if the IDR was at least ‘BBB’, subject to sufficient recoveries from the cover pool. Background: Lloyds Banking Group was formed in January 2009 when Lloyds TSB Group plc acquired HBOS plc. One year later, the HBOS holding was transferred to Lloyds TSB Bank plc. The group has a 28% share of the UK mortgage market.
Source: Rating agencies, UniCredit Research
25 October 2011 Credit Research
Sector Report
UniCredit Research page 69 See last pages for disclaimer.
Nationwide Building Society Key characteristics Ratings: A2s/A+n/AA-n Bloomberg: 1205Z LN Bond ticker: NWIDE www.nationwide.co.uk
Nationwide Building Society (assets of GBP 190bn as of April 2011, FY ending March) is the UK's largest mutual banking organization and third largest mortgage and savings pro-vider. It is also the world's largest building society. Nationwide has 1,000 branches withinthe UK, the Isle of Man and the Republic of Ireland. Its core business is personal financialservices, including residential mortgage lending (largely funded through retail savings), gen-eral retail banking services, personal investment products, insurance, personal lending, and offshore deposit-taking. Nationwide also engages in commercial lending and treasury opera-tions to generate additional value for its more than 15mn members, who are also its custom-ers. Nationwide is a UK building society governed by the Building Societies Act ("the Act") of 1986,which to a large part defines its business model. According to the Act, building societies may have security trading activities; they must, however, refrain from trading and market-making in financial instruments. There is a "lending limit", which is in fact rather a lending minimum, of 75% that has to be made up of residential mortgage loans; on the funding side, 50% must berefinanced via member retail share accounts ("funding limit"). Overall, building societies haveto adhere to "criteria of prudent management", underlining the conservative character of this particular financial company type. Nationwide maintained its profitability during the downturn and did not require any capital injections. Nationwide has repaid 83% of what it drew from the Bank of England’s (BoE) Special Liquidity Scheme (SLS) facility during the financial crisis in 2008. Given its role as major mortgage lender and retail deposit taker, external support, if ever needed, is likely to be arranged by its regulator despite the generally lower level of UK systemic support, in our view. Nationwide's roots date back to 1846, and important mergers include Anglia BS in 1987 and Portman BS in 2007.
NATIONWIDE: SWOT ANALYSIS Strengths/Opportunities Weaknesses/Threats Strong franchise in residential mortgages and retail savings Might experience pressure to acquire weak competitors Sound funding and liquidity profiles Challenge of a more competitive environment Excellent asset quality Concentrated exposure to the UK economy and housing market Strong capitalization No shareholders
Source: UniCredit Research
Latest results … Nationwide reported FY10/11 (April 2011) 30% yoy higher underlying profit before tax of GBP 276mn and 17% higher other income yoy of GBP 445mn. The latter was driven by Nation-wide's strategy to diversify income. This was accompanied by a stable net interest margin of 0.81% vs. 0.83% in FY09/10. Regarding asset quality, the 3-months+ arrears ratio was 0.68% vs. 0.68% in FY09/10. According to CML data, this compares to an industry average 2.09% vs. 2.27% in FY09/10. Group impairment charges on loans and advances to customers amounted to GBP 359m vs. GBP 549mn in FY09/10, and commercial property impairmentcharges fell 41% yoy to GBP 175mn from GBP 299mn in FY09/10. The core Tier-1 ratio stood at 12.5% vs. 12.2% in FY09/10, the Tier-1 ratio at 15.7% vs. 15.3% in FY09/10 and the total capital ratio at 19.5% vs. 19.4% in FY09/10. Nationwide reported GBP 12.8bn in gross lend-ing, which corresponds to a 9.5% market share and – with more than 350,000 new current accounts – a market share of 9.4% for new accounts vs. 4% in FY09/10. The stable core li-quidity ratio remained at 13.8%, 72% of which is AAA-rated, 83% AA-rated or above and 96% A-rated or above. The Treasury Asset Portfolio amounted to GBP 31.4bn as of April 2011 andNationwide has liquidity holdings of GBP 50.6bn, which comprise GBP 18.3bn in unencum-bered self-issued securities. Moreover, the total AFS reserve improved by GBP 0.2bn yoy to GBP 0.5bn. The wholesale funding requirement declined due to positive retail flows, leaving the wholesale funding ratio down at 25.9% from 27.8% in FY09/10. In FY10/11, GBP 5.8bn of long-term wholesale funding was raised with a weighted average life above 8 years. Total assets decreased by 1.3% yoy to GBP 188.9bn.
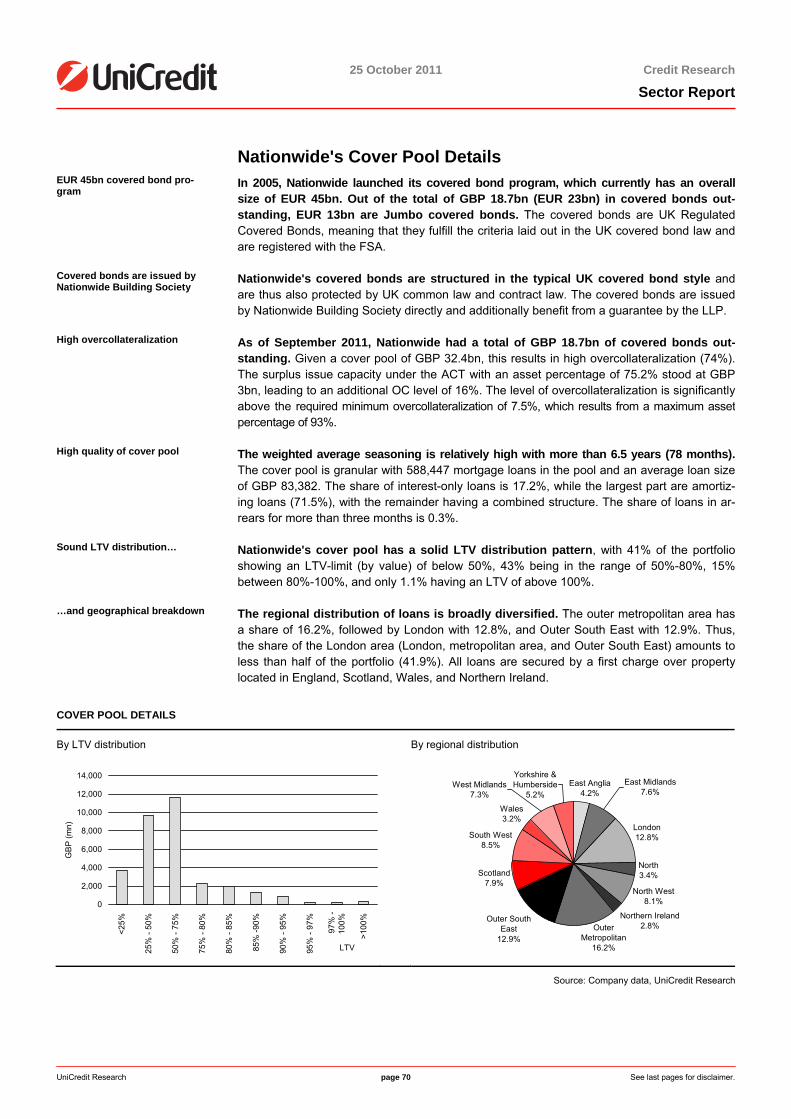
25 October 2011 Credit Research
Sector Report
UniCredit Research page 70 See last pages for disclaimer.
Nationwide's Cover Pool Details EUR 45bn covered bond pro-gram
In 2005, Nationwide launched its covered bond program, which currently has an overall size of EUR 45bn. Out of the total of GBP 18.7bn (EUR 23bn) in covered bonds out-standing, EUR 13bn are Jumbo covered bonds. The covered bonds are UK Regulated Covered Bonds, meaning that they fulfill the criteria laid out in the UK covered bond law and are registered with the FSA.
Covered bonds are issued by Nationwide Building Society
Nationwide's covered bonds are structured in the typical UK covered bond style and are thus also protected by UK common law and contract law. The covered bonds are issuedby Nationwide Building Society directly and additionally benefit from a guarantee by the LLP.
High overcollateralization As of September 2011, Nationwide had a total of GBP 18.7bn of covered bonds out-standing. Given a cover pool of GBP 32.4bn, this results in high overcollateralization (74%). The surplus issue capacity under the ACT with an asset percentage of 75.2% stood at GBP 3bn, leading to an additional OC level of 16%. The level of overcollateralization is significantlyabove the required minimum overcollateralization of 7.5%, which results from a maximum asset percentage of 93%.
High quality of cover pool The weighted average seasoning is relatively high with more than 6.5 years (78 months).The cover pool is granular with 588,447 mortgage loans in the pool and an average loan sizeof GBP 83,382. The share of interest-only loans is 17.2%, while the largest part are amortiz-ing loans (71.5%), with the remainder having a combined structure. The share of loans in ar-rears for more than three months is 0.3%.
Sound LTV distribution… Nationwide's cover pool has a solid LTV distribution pattern, with 41% of the portfolio showing an LTV-limit (by value) of below 50%, 43% being in the range of 50%-80%, 15% between 80%-100%, and only 1.1% having an LTV of above 100%.
…and geographical breakdown The regional distribution of loans is broadly diversified. The outer metropolitan area has a share of 16.2%, followed by London with 12.8%, and Outer South East with 12.9%. Thus, the share of the London area (London, metropolitan area, and Outer South East) amounts toless than half of the portfolio (41.9%). All loans are secured by a first charge over property located in England, Scotland, Wales, and Northern Ireland.
COVER POOL DETAILS
By LTV distribution By regional distribution
0
2,000
4,000
6,000
8,000
10,000
12,000
14,000
<25%
25%
- 50
%
50%
- 75
%
75%
- 80
%
80%
- 85
%
85%
-90%
90%
- 95
%
95%
- 97
%
97%
-10
0%
>100
%
LTV
GB
P (m
n)
East Anglia
4.2%
London 12.8%
North 3.4%
North West 8.1%
Northern Ireland 2.8%
Outer South East
12.9%
Scotland 7.9%
South West 8.5%
Wales 3.2%
Yorkshire & Humberside
5.2%
Outer Metropolitan
16.2%
East Midlands 7.6%
West Midlands 7.3%
Source: Company data, UniCredit Research
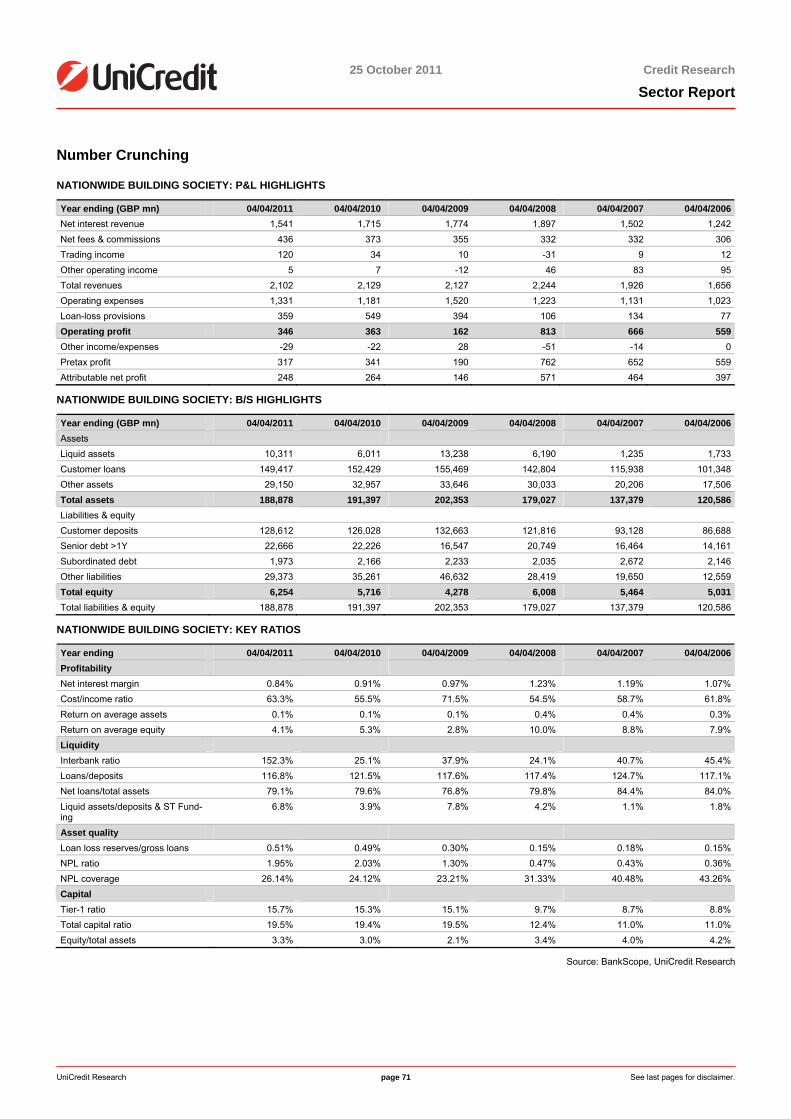
25 October 2011 Credit Research
Sector Report
UniCredit Research page 71 See last pages for disclaimer.
Number Crunching
NATIONWIDE BUILDING SOCIETY: P&L HIGHLIGHTS
Year ending (GBP mn) 04/04/2011 04/04/2010 04/04/2009 04/04/2008 04/04/2007 04/04/2006Net interest revenue 1,541 1,715 1,774 1,897 1,502 1,242Net fees & commissions 436 373 355 332 332 306Trading income 120 34 10 -31 9 12Other operating income 5 7 -12 46 83 95Total revenues 2,102 2,129 2,127 2,244 1,926 1,656Operating expenses 1,331 1,181 1,520 1,223 1,131 1,023Loan-loss provisions 359 549 394 106 134 77Operating profit 346 363 162 813 666 559Other income/expenses -29 -22 28 -51 -14 0Pretax profit 317 341 190 762 652 559Attributable net profit 248 264 146 571 464 397
NATIONWIDE BUILDING SOCIETY: B/S HIGHLIGHTS
Year ending (GBP mn) 04/04/2011 04/04/2010 04/04/2009 04/04/2008 04/04/2007 04/04/2006Assets Liquid assets 10,311 6,011 13,238 6,190 1,235 1,733Customer loans 149,417 152,429 155,469 142,804 115,938 101,348Other assets 29,150 32,957 33,646 30,033 20,206 17,506Total assets 188,878 191,397 202,353 179,027 137,379 120,586Liabilities & equity Customer deposits 128,612 126,028 132,663 121,816 93,128 86,688Senior debt >1Y 22,666 22,226 16,547 20,749 16,464 14,161Subordinated debt 1,973 2,166 2,233 2,035 2,672 2,146Other liabilities 29,373 35,261 46,632 28,419 19,650 12,559Total equity 6,254 5,716 4,278 6,008 5,464 5,031Total liabilities & equity 188,878 191,397 202,353 179,027 137,379 120,586
NATIONWIDE BUILDING SOCIETY: KEY RATIOS
Year ending 04/04/2011 04/04/2010 04/04/2009 04/04/2008 04/04/2007 04/04/2006Profitability Net interest margin 0.84% 0.91% 0.97% 1.23% 1.19% 1.07%Cost/income ratio 63.3% 55.5% 71.5% 54.5% 58.7% 61.8%Return on average assets 0.1% 0.1% 0.1% 0.4% 0.4% 0.3%Return on average equity 4.1% 5.3% 2.8% 10.0% 8.8% 7.9%Liquidity Interbank ratio 152.3% 25.1% 37.9% 24.1% 40.7% 45.4%Loans/deposits 116.8% 121.5% 117.6% 117.4% 124.7% 117.1%Net loans/total assets 79.1% 79.6% 76.8% 79.8% 84.4% 84.0%Liquid assets/deposits & ST Fund-ing
6.8% 3.9% 7.8% 4.2% 1.1% 1.8%
Asset quality Loan loss reserves/gross loans 0.51% 0.49% 0.30% 0.15% 0.18% 0.15%NPL ratio 1.95% 2.03% 1.30% 0.47% 0.43% 0.36%NPL coverage 26.14% 24.12% 23.21% 31.33% 40.48% 43.26%Capital Tier-1 ratio 15.7% 15.3% 15.1% 9.7% 8.7% 8.8%Total capital ratio 19.5% 19.4% 19.5% 12.4% 11.0% 11.0%Equity/total assets 3.3% 3.0% 2.1% 3.4% 4.0% 4.2%
Source: BankScope, UniCredit Research
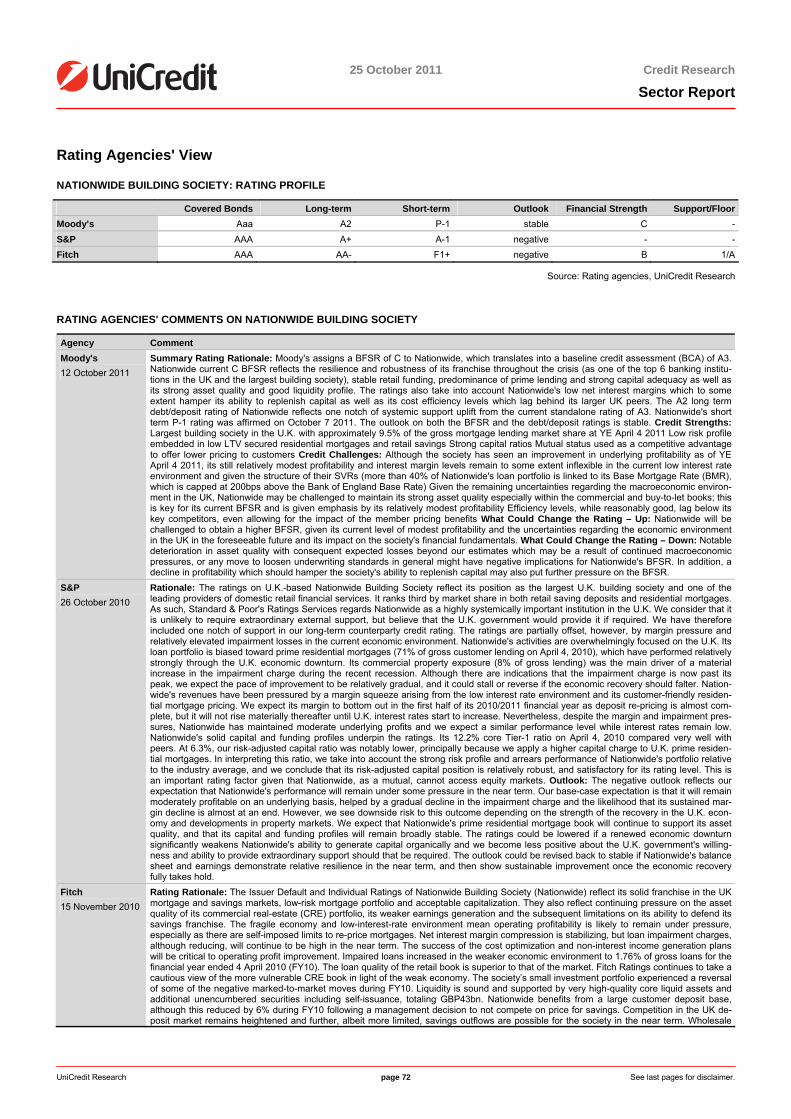
25 October 2011 Credit Research
Sector Report
UniCredit Research page 72 See last pages for disclaimer.
Rating Agencies' View
NATIONWIDE BUILDING SOCIETY: RATING PROFILE
Covered Bonds Long-term Short-term Outlook Financial Strength Support/FloorMoody’s Aaa A2 P-1 stable C -S&P AAA A+ A-1 negative - -Fitch AAA AA- F1+ negative B 1/A
Source: Rating agencies, UniCredit Research
RATING AGENCIES' COMMENTS ON NATIONWIDE BUILDING SOCIETY
Agency Comment Moody's 12 October 2011
Summary Rating Rationale: Moody's assigns a BFSR of C to Nationwide, which translates into a baseline credit assessment (BCA) of A3. Nationwide current C BFSR reflects the resilience and robustness of its franchise throughout the crisis (as one of the top 6 banking institu-tions in the UK and the largest building society), stable retail funding, predominance of prime lending and strong capital adequacy as well as its strong asset quality and good liquidity profile. The ratings also take into account Nationwide's low net interest margins which to some extent hamper its ability to replenish capital as well as its cost efficiency levels which lag behind its larger UK peers. The A2 long term debt/deposit rating of Nationwide reflects one notch of systemic support uplift from the current standalone rating of A3. Nationwide's short term P-1 rating was affirmed on October 7 2011. The outlook on both the BFSR and the debt/deposit ratings is stable. Credit Strengths: Largest building society in the U.K. with approximately 9.5% of the gross mortgage lending market share at YE April 4 2011 Low risk profile embedded in low LTV secured residential mortgages and retail savings Strong capital ratios Mutual status used as a competitive advantage to offer lower pricing to customers Credit Challenges: Although the society has seen an improvement in underlying profitability as of YE April 4 2011, its still relatively modest profitability and interest margin levels remain to some extent inflexible in the current low interest rate environment and given the structure of their SVRs (more than 40% of Nationwide's loan portfolio is linked to its Base Mortgage Rate (BMR), which is capped at 200bps above the Bank of England Base Rate) Given the remaining uncertainties regarding the macroeconomic environ-ment in the UK, Nationwide may be challenged to maintain its strong asset quality especially within the commercial and buy-to-let books; this is key for its current BFSR and is given emphasis by its relatively modest profitability Efficiency levels, while reasonably good, lag below its key competitors, even allowing for the impact of the member pricing benefits What Could Change the Rating – Up: Nationwide will be challenged to obtain a higher BFSR, given its current level of modest profitability and the uncertainties regarding the economic environment in the UK in the foreseeable future and its impact on the society's financial fundamentals. What Could Change the Rating – Down: Notable deterioration in asset quality with consequent expected losses beyond our estimates which may be a result of continued macroeconomic pressures, or any move to loosen underwriting standards in general might have negative implications for Nationwide's BFSR. In addition, a decline in profitability which should hamper the society's ability to replenish capital may also put further pressure on the BFSR.
S&P 26 October 2010
Rationale: The ratings on U.K.-based Nationwide Building Society reflect its position as the largest U.K. building society and one of the leading providers of domestic retail financial services. It ranks third by market share in both retail saving deposits and residential mortgages. As such, Standard & Poor's Ratings Services regards Nationwide as a highly systemically important institution in the U.K. We consider that it is unlikely to require extraordinary external support, but believe that the U.K. government would provide it if required. We have therefore included one notch of support in our long-term counterparty credit rating. The ratings are partially offset, however, by margin pressure and relatively elevated impairment losses in the current economic environment. Nationwide's activities are overwhelmingly focused on the U.K. Its loan portfolio is biased toward prime residential mortgages (71% of gross customer lending on April 4, 2010), which have performed relatively strongly through the U.K. economic downturn. Its commercial property exposure (8% of gross lending) was the main driver of a material increase in the impairment charge during the recent recession. Although there are indications that the impairment charge is now past its peak, we expect the pace of improvement to be relatively gradual, and it could stall or reverse if the economic recovery should falter. Nation-wide's revenues have been pressured by a margin squeeze arising from the low interest rate environment and its customer-friendly residen-tial mortgage pricing. We expect its margin to bottom out in the first half of its 2010/2011 financial year as deposit re-pricing is almost com-plete, but it will not rise materially thereafter until U.K. interest rates start to increase. Nevertheless, despite the margin and impairment pres-sures, Nationwide has maintained moderate underlying profits and we expect a similar performance level while interest rates remain low. Nationwide's solid capital and funding profiles underpin the ratings. Its 12.2% core Tier-1 ratio on April 4, 2010 compared very well with peers. At 6.3%, our risk-adjusted capital ratio was notably lower, principally because we apply a higher capital charge to U.K. prime residen-tial mortgages. In interpreting this ratio, we take into account the strong risk profile and arrears performance of Nationwide's portfolio relative to the industry average, and we conclude that its risk-adjusted capital position is relatively robust, and satisfactory for its rating level. This is an important rating factor given that Nationwide, as a mutual, cannot access equity markets. Outlook: The negative outlook reflects our expectation that Nationwide's performance will remain under some pressure in the near term. Our base-case expectation is that it will remain moderately profitable on an underlying basis, helped by a gradual decline in the impairment charge and the likelihood that its sustained mar-gin decline is almost at an end. However, we see downside risk to this outcome depending on the strength of the recovery in the U.K. econ-omy and developments in property markets. We expect that Nationwide's prime residential mortgage book will continue to support its asset quality, and that its capital and funding profiles will remain broadly stable. The ratings could be lowered if a renewed economic downturn significantly weakens Nationwide's ability to generate capital organically and we become less positive about the U.K. government's willing-ness and ability to provide extraordinary support should that be required. The outlook could be revised back to stable if Nationwide's balance sheet and earnings demonstrate relative resilience in the near term, and then show sustainable improvement once the economic recovery fully takes hold.
Fitch 15 November 2010
Rating Rationale: The Issuer Default and Individual Ratings of Nationwide Building Society (Nationwide) reflect its solid franchise in the UK mortgage and savings markets, low-risk mortgage portfolio and acceptable capitalization. They also reflect continuing pressure on the asset quality of its commercial real-estate (CRE) portfolio, its weaker earnings generation and the subsequent limitations on its ability to defend its savings franchise. The fragile economy and low-interest-rate environment mean operating profitability is likely to remain under pressure, especially as there are self-imposed limits to re-price mortgages. Net interest margin compression is stabilizing, but loan impairment charges, although reducing, will continue to be high in the near term. The success of the cost optimization and non-interest income generation plans will be critical to operating profit improvement. Impaired loans increased in the weaker economic environment to 1.76% of gross loans for the financial year ended 4 April 2010 (FY10). The loan quality of the retail book is superior to that of the market. Fitch Ratings continues to take a cautious view of the more vulnerable CRE book in light of the weak economy. The society’s small investment portfolio experienced a reversal of some of the negative marked-to-market moves during FY10. Liquidity is sound and supported by very high-quality core liquid assets and additional unencumbered securities including self-issuance, totaling GBP43bn. Nationwide benefits from a large customer deposit base, although this reduced by 6% during FY10 following a management decision to not compete on price for savings. Competition in the UK de-posit market remains heightened and further, albeit more limited, savings outflows are possible for the society in the near term. Wholesale
25 October 2011 Credit Research
Sector Report
UniCredit Research page 73 See last pages for disclaimer.
funding sources are well diversified. Capital is acceptable. Regulatory capital ratios benefit from the transition in FY09 to the internal ratings-based (IRB) approach for Basel II. Internal capital generation is weak, which is a concern given the limited options available to mutuals for raising core capital. The current international review on regulatory capital could help to address this limitation. Support: Nationwide has a leading market share in personal savings and is considered by the UK government to be one of the seven major UK financial institutions. In Fitch’s opinion there is an extremely high probability that support from the UK authorities would be forthcoming if required. What Could Trigger a Downgrade: The Negative Outlook reflects Nationwide’s weaker pre-impairment operating income. The IDRs could be down-graded if operating profitability remains weak and constrains Nationwide’s operating flexibility compared with its 'AA-' peers
Source: Rating Agencies, UniCredit Research
RATING AGENCIES' COMMENTS ON NATIONWIDE BUILDING SOCIETY COVERED BOND PROGRAM
Agency Comment Moody's 16 September 2010
RATINGS RATIONALE: As with all covered bonds, the covered bonds benefit from two layers of protection by having recourse to both the issuer and a collateral pool. The rating therefore takes into account the following factors: 1) The credit strength of the issuer, rated Aa3; P-1. 2) The credit quality of the cover pool. The mortgage covered bonds are backed by residential mortgage loans. Other key factors: 3) The commitment of the issuer to maintain an asset percentage, currently 84.5%, which translates into an over-collateralization of around 18.3%. Moody's considers this over-collateralization to be "committed". 4) The use of structuring techniques designed to mitigate the rating linkage between the issuer and the covered bonds. These include a provision to allow for a principal refinancing period of 12 months. Moody's has assigned a Timely Payment Indicator (TPI) of "Probable" to the covered bonds. The ratings assigned by Moody's address the expected loss posed to investors. Moody's ratings address only the credit risks associated with the transaction. Other non-credit risks have not been ad-dressed, but may have a significant effect on yield to investors. The Aaa rating assigned to the existing covered bonds is expected to be assigned to all subsequent covered bonds issued by the issuer under this program and any future rating actions are expected to affect all such covered bonds. Should there be any exceptions to this, Moody's will in each case publish details in a separate press release. KEY RATING ASSUMPTIONS/FACTORS: Covered bond ratings are determined after applying a two-step process: expected loss analysis and TPI framework analysis. EXPECTED LOSS: Moody's determines a rating based on the expected loss on the bond. The primary model used is Moody's Covered Bond model (COBOL) which determines expected loss as a function of the issuer's probability of default, measured by its rating of Aa3, and the stressed losses on the cover pool assets following issuer default. The Cover Pool Losses for this program are 16.5%. This is an estimate of the losses Moody's currently models in the event of issuer default. Cover Pool Losses can be split between Market Risk of 13.1% and Collateral Risk of 3.5% . Market Risk measures losses as a result of refinancing risk and risks related to interest rate and currency mismatches (these losses may also include certain legal risks). Collateral Risk measures losses resulting directly from the credit quality of the assets in the cover pool. Collateral Risk is derived from the Collateral Score, which for this program is currently 5.2%. TPI FRAMEWORK: Moody's assigns a "timely payment indicator" (TPI) which indicates the likelihood that timely payment will be made to cov-ered bondholders following issuer default. The effect of the TPI framework is to limit the covered bond rating to a certain number of notches above the issuer's rating. SENSITIVITY ANALYSIS: The robustness of a covered bond rating largely depends on the credit strength of the issuer. The number of notches by which the issuer's rating may be downgraded before the covered bonds are downgraded under the TPI framework is measured by the TPI Leeway. Based on the current TPI of Probable the TPI Leeway for this program is 3 notches, meaning the issuer rating would need to be downgraded to Baa1 before the covered bonds are downgraded, all other things being equal. A multiple notch downgrade of the covered bonds might occur in certain limited circumstances. Some examples might be (a) a sovereign downgrade nega-tively affecting both the issuer's senior unsecured rating and the TPI; (b) a multiple notch downgrade of the issuer; or (c) a material reduction of the value of the cover pool. For further details on Cover Pool Losses, Collateral Risk, Market Risk, Collateral Score and TPI Leeway across all covered bond programs rated by Moody's please refer to "Moody's EMEA Covered Bonds Monitoring Overview", published quar-terly. These figures are based on the most recent Performance Overview published by Moody's and are subject to change over time.
S&P 6 February 2008
Transaction Summary: Standard & Poor's Ratings Services assigned a 'AAA' credit rating to the second public issuance under the Nation-wide Covered Bond €14 billion global covered bond program. This issuance matures in December 2011, and follows the first public issuance in December 2005 of €2 billion covered bonds. The rating reflects the terms of the issuance, structure, cash flow mechanics of the program, and Standard & Poor's cash flow analysis to verify that the notes are repaid under stress test scenarios. Under the terms of the program, Nationwide Building Society (Nationwide) issues the covered bonds. The covered bonds are direct, unsecured, and unconditional obligations of Nationwide. Under an intercompany loan agreement, the issuer then onlends the bond proceeds to the LLP, which, in turn, buys the mort-gages from the seller. Nationwide pays interest and principal on the covered bonds. On each payment date, the LLP pays or provides for an interest amount on the term advances. The term advances of an equal principal amount as the series issued, made under the intercompany loan are not repaid by the LLP until all amounts payable under the corresponding series of covered bonds are repaid in full. Instead, the LLP guarantees the payments from the issuer to the bondholders. Notable Features: This is the second public issuance under the global cov-ered bond program set up by Nationwide. No legislative framework for covered bonds exists in the U.K., but for this program, Nationwide has reproduced all the major characteristics of covered bonds using existing U.K. law. The bonds are therefore called "covered bonds" through-out this new issue report. Nationwide is a building society, and this status provides membership rights to the borrowers. This has raised some additional issues in terms of set-off and perfection of the sale of the loans to the LLP. The program addresses those concerns by implement-ing a dynamic set-off calculation reserve, reset at least annually. Perfection of the sale has been restricted so that the borrowers' member-ship rights over the loans are protected. Strengths, Concerns, And Mitigating Factors: Strengths: As in other covered bond transactions across Europe, the structure provides for both a general recourse to Nationwide's assets and recourse to a mortgage pool in an amount higher than the debt outstanding under the program. The asset-coverage test is designed to provide ongoing adequate protection against, among other things, the credit risk of the mortgages backing the program, their market value risk if they need to be liquidated, and the matur-ity mismatch that may exist between the mortgage pool and the covered bond maturities. The test gives investors more information on the continuing level of overcollateralization than is given in most covered bond frameworks. The assets forming the collateral pool are all residen-tial mortgage loans, in contrast to typical mortgage-covered pools, which tend to mix residential and commercial mortgage loans. Loans more than three months in arrears are subject to a haircut to 40% (subject to LTV ratios), of their value for the asset-coverage test. Nationwide substitutes loans if required by the asset-coverage test, as long as Nationwide is solvent. · A transfer of the servicing is made if Nationwide is downgraded below 'BBB-'. A third-party asset monitor is contracted to check the calculations performed by Nationwide as cash manager for the asset-coverage test. The LLP benefits from a cash reserve, which was sized to provide liquidity after an issuer event of default. Disclo-sure standards on the nature and performance of underlying assets are expected to be higher than usual for the asset class. Concerns: There is no restriction on the LTV ratio for individual loans backing the program. Of the pool, 100% has a flexible feature, as it allows borrow-ers to make cash redraws and receive further advances. If Nationwide defaults, the liquidity on bonds issued in bullet form cannot be assured solely from cash flows arising on the mortgage pool, but may require a monetization of the pool through securitization or other means. An asset-coverage test may be technically breached by failure of the issuer to meet these test levels. This breach may trigger an event of default on the covered bonds, prematurely liquidating the pool of assets. The asset-coverage test tracks parity between assets and liabilities. Miti-gating factors: The asset-coverage test ensures that any increase in LTV ratios results in higher levels of overcollateralization consistent with a 'AAA' rating. Standard & Poor's takes flexible features into account in its credit analysis. The foreclosure frequency and loss severity calculations are based on the maximum drawable amounts. The covered bond terms and conditions provide for a maturity extension. If, following a Nationwide event of default, the LLP has insufficient funds to redeem the covered bonds, the redemption may be deferred for 12
25 October 2011 Credit Research
Sector Report
UniCredit Research page 74 See last pages for disclaimer.
months. When considering the ability to monetize the portfolio, Standard & Poor's assessed the depth and spread stability of both the whole-loan trading market and the U.K. RMBS market. Both are more developed than in any other European jurisdiction, and Standard & Poor's considers the securitization market to be a resilient potential exit strategy. To avoid flooding the market, a default by Nationwide would not result in accelerating the covered bonds. Maturities under the program are staggered so that no more than a certain amount of bullet debt could mature in any six months. Failure to meet the amortization test would trigger an early LLP event of default and acceleration of all series of covered bonds of the program. The level of overcollateralization in the program renders an event of default by Nationwide rating remote. If the asset-coverage test is breached, a three-month cure period is in place so that technical, temporary dips do not trigger a winding-down of the program and result in the potential losses of interest and principal. While the test is breached, no funds flow out of the LLP accounts back to the issuer, or LLP members, and the LLP cannot borrow from the issuer.
Fitch 21 September 2011
Fitch Ratings has affirmed Nationwide Building Society's (Nationwide; 'AA-'/Negative/'F1+') outstanding GBP17.193bn mortgage covered bonds at 'AAA'. The bonds constitute direct obligations of Nationwide and are guaranteed by Nationwide Building Society LLP. All bonds benefit from a 12-month extendable maturity from their expected maturity dates. The rating affirmation incorporates the application of Fitch's covered bonds counterparty criteria, published 14 March 2011. The rating is based on Nationwide's Long-term Issuer Default Rating (IDR) of 'AA-' and a Discontinuity Factor (D-Factor) of 19.5% assigned to the program. This combination enables both the probability of default and covered bonds to reach 'AAA'. The asset percentage (AP) supporting a 'AAA' rating stands at 79.0% compared to 82.6% previously. This compares to the contractual AP of 76.3% and the highest level of AP observed during the past 12 months being 60.1%. The decrease in the AP supporting the rating is mainly driven by Fitch updating the refinancing spread assumptions for the UK. All else equal, the covered bonds can remain rated 'AAA' provided Nationwide's IDR is at least 'BBB+'. Fitch increased the D-Factor to 19.5% from 14.6% following a review of the program in light of the updated covered bonds counterparty criteria. The review incorporates Fitch's analysis of the complexity that de-rivatives add to the alternative manager's responsibilities after issuer insolvency. The agency believes that derivative counterparties belong-ing to the same banking group as the issuer would leave covered bond investors more vulnerable upon an assumed issuer default than in programs where the hedging counterparties are external. This is the case for the cover pool swap and some of the covered bond swaps under the program. The review also incorporates analysis of the subordinated position of any termination payments potentially due by the cover pool to a defaulting swap counterparty, and the issuer's intention to amend the transaction documents within a short timeframe so that a reserve will have to be funded for an amount sufficient to cover the next three months rolling of interest obligations on the covered bonds. The impact of the agency's covered bond counterparty criteria on UK covered bond programs is outlined in "Counterparty Risks in the UK Covered Bond Programs - New Criteria Highlight Key Risks", published 12 May 2011. In addition, the D-Factor reflects the segregation of the cover assets through the bankruptcy-remote, special-purpose company acting as guarantor; the mitigants to liquidity gaps in the form of a 12-month extendable maturity feature for the bonds; the provisions for an alternative management of the program following a default of Nation-wide and the adequacy of the issuer's IT systems for that purpose. Furthermore, the D-Factor positively reflects the oversight from the UK regulator under the UK Regulated Covered Bond framework. At end-July 2011, the cover pool consisted of GBP33.453bn of residential mort-gage loans and GBP353.7m of cash held in a guaranteed investment contract (GIC) account with Nationwide Building Society. It consisted of 410,893 loans secured on residential properties in the UK with 31.88% currently on interest-only repayments. Overall the mortgage portfolio had a weighted average current indexed loan-to-value ratio of 56.1%. The cover pool assets are primarily located in, outer metropolitan region 16.1%, outer southeast 12.9% and London 12.7%. The weighted average seasoning of the loans is 76 months with loans more than 90 days in arrears currently 0.4%. All assets in the cover pool are sterling-denominated while the covered bonds are a combination of ster-ling, USD, Norwegian kroner and euro-denominated bonds. All currency risks are hedged. The cover assets yield both floating and fixed rates and an interest rate swap is in place with Nationwide to transform the interest collections from the cover assets into three-month GBP LIBOR plus a spread. The bonds yield fixed and floating rates and hedging agreements are in place with both internal and external swap counterparties all rated above 'A'/'F1' for each of the bonds. Fitch will monitor the key characteristics of the cover assets and outstanding covered bonds on an ongoing basis, and check whether the AP taken into account in its analysis provides protection commensurate with the rating.
Source: Rating Agencies, UniCredit Research
25 October 2011 Credit Research
Sector Report
UniCredit Research page 75 See last pages for disclaimer.
Royal Bank of Scotland Key characteristics Ratings (Group): A3n/As/As Ratings (PLC): A2n/A+s/As Bloomberg: RBS LN Bond ticker: RBS www.rbs.com
RBS is a universal bank engaging in private, retail, corporate, and investment banking,primarily in the UK and the US, but also in Ireland, Continental Europe, and Asia-Pacific. RBS is the UK's third-largest bank by total assets (GBP 1,446bn as of June 2011). Worldwide, RBS employs around 157,000 people and serves more than 40mn clients.Following some strategic mistakes, RBS needed to be bailed out by the UK government in 2008.Since then, it has been undergoing a multi-year restructuring process, which will lead to a stronger focus on domestic activities, with retail and corporate banking being center stage. In the UK, there are 25mn clients, served by more than 2,000 branches. RBS was founded in 1727. In 1985, it established Direct Line, a car insurance company. In 1988, it took over Citizens Financial Group in the US, and in 2000 it absorbed National Westminster (NatWest). The Royal Bank of Scotland Group plc is RBS Group's holding company, whose shares are stock market listed and 66% owned by HM Treasury (economic ownership is 82%). The major operating subsidiaries are Royal Bank of Scotland plc, National Westminster plc (including its subsidiaryUlster Bank Ltd), Citizens Financial Group Inc, First Active plc, and RBS N.V., organized intoeight operating divisions: UK Retail, UK Corporate, Wealth, Global Banking & Markets, GlobalTransaction Services, Ulster Bank, US Retail & Commercial, and RBS Insurance. RBS pur-sues a multi-brand and multi-channel strategy across all divisions. Given its importance to the country's financial system, government guarantees for around GBP 55bn in funding and GBP 45.5bn in T1 capital, including APS, were provided. In November 2009, RBS agreed to par-ticipate in the UK government-sponsored bad bank model (Asset Protection Scheme or APS).The European Commission imposed the following (please refer to our Credit Flash from 26 August 2011 for details): (i) Divestment, (ii) RBS will rank no higher than No. 5 in the com-bined all-debt league tables globally for three years; (iii) No dividends and coupons on exist-ing hybrid capital instruments or exercise of any call rights for a two-year period unless there is a legal obligation; and (iv) additional contingent RWA reduction.
RBS: SWOT ANALYSIS Strengths/Opportunities Weaknesses/Threats Strong domestic franchise Possible margin pressure Government ownership and implicit support Political interference Solid capitalization ratios Challenge of restructuring process and balance sheet deleveraging High diversification …which will reduce
Source: UniCredit Research
1H11 results and outlook RBS Group reported a 1H11 net loss of GBP 1.4bn vs. a net profit of GBP 9mn in 1H10and market estimates of a loss of GBP 571bn (Bloomberg). Group income was GBP 7.8bn in 2Q11 (-3% qoq and -5% yoy), with RBS's Core Retail & Commercial (R&C) stable and GlobalBanking & Markets (GBM) having declined qoq due to uncertain markets and weaker trading activity. RBS's 1H11 operating profit was GBP 1.9bn vs. GBP 1.1bn in 1H10. Core operating profit was GBP 1.7bn in 2Q11 vs. GBP 2.1bn in 1Q11 and GBP 1.6bn in 2Q10. The 2Q11 at-tributable loss of GBP 897mn was driven by the already announced GBP 850mn charge for Payment Protection Insurance (PPI) claims and the GBP 733mn provision for Greek govern-ment bonds. Segment-wise, RBS's Core R&C operating profit before impairments rose by 6.4%yoy to GBP 3.7bn in 1H11 from GBP 3.5bn in 1H10, while GBM declined by 37% yoy to GBP1.6bn in 1H11 from GBP 2.4bn in 1H10, and RBS Insurance recovered to GBP 206mn in 1H11. The cost-income ratio was 56% vs. 58% in 1Q11 and 60% in 2Q10. Total impairments in 1H11decreased 18% yoy to GBP 4.2bn. RBS's balance sheet decreased further by GBP 1bn qoq andGBP 7bn yoy to GBP 1,051bn. The group had a loan-deposit ratio (LDR) of 114%, with a stable Core LDR of 96%. RBS has also accomplished a total funding issuance of GBP 18bn of the GBP 23bn target for 2011. Its liquidity portfolio rose to GBP 155bn. The core Tier-1 ratio was 11.1%. Management said that it is well on track with its five-year strategic plan.
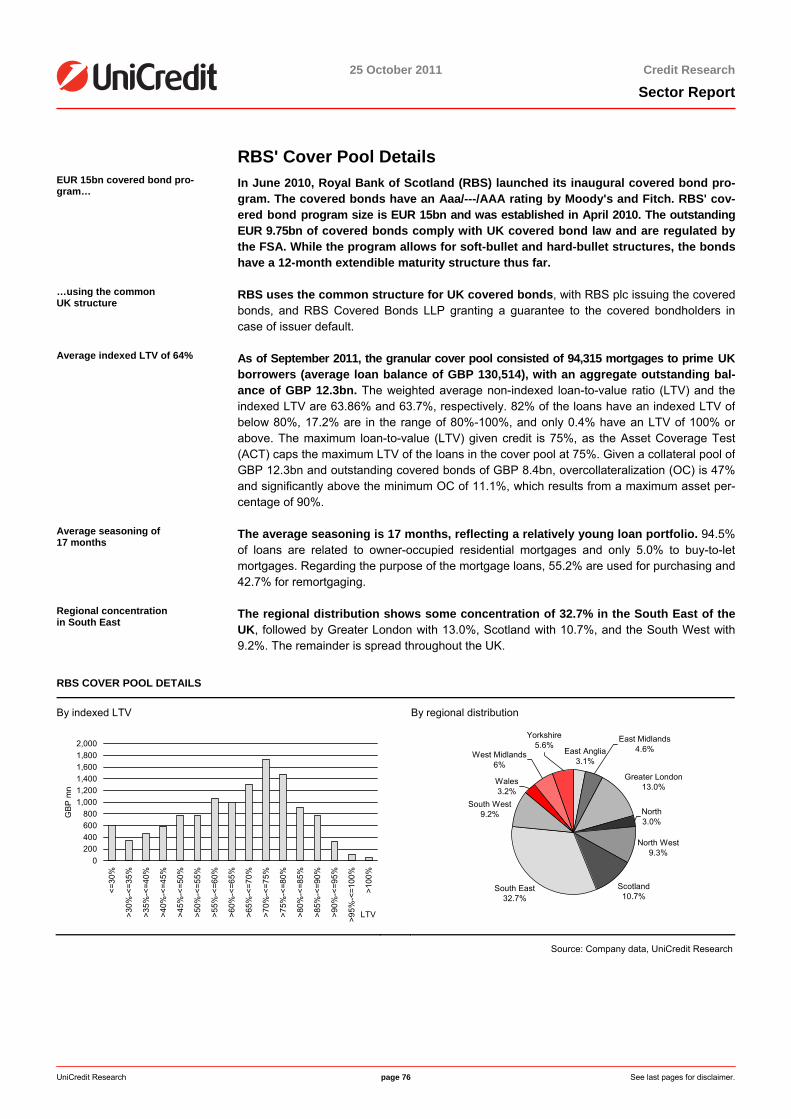
25 October 2011 Credit Research
Sector Report
UniCredit Research page 76 See last pages for disclaimer.
RBS' Cover Pool Details EUR 15bn covered bond pro-gram…
In June 2010, Royal Bank of Scotland (RBS) launched its inaugural covered bond pro-gram. The covered bonds have an Aaa/---/AAA rating by Moody's and Fitch. RBS' cov-ered bond program size is EUR 15bn and was established in April 2010. The outstandingEUR 9.75bn of covered bonds comply with UK covered bond law and are regulated by the FSA. While the program allows for soft-bullet and hard-bullet structures, the bonds have a 12-month extendible maturity structure thus far.
…using the common UK structure
RBS uses the common structure for UK covered bonds, with RBS plc issuing the covered bonds, and RBS Covered Bonds LLP granting a guarantee to the covered bondholders in case of issuer default.
Average indexed LTV of 64% As of September 2011, the granular cover pool consisted of 94,315 mortgages to prime UK borrowers (average loan balance of GBP 130,514), with an aggregate outstanding bal-ance of GBP 12.3bn. The weighted average non-indexed loan-to-value ratio (LTV) and the indexed LTV are 63.86% and 63.7%, respectively. 82% of the loans have an indexed LTV of below 80%, 17.2% are in the range of 80%-100%, and only 0.4% have an LTV of 100% or above. The maximum loan-to-value (LTV) given credit is 75%, as the Asset Coverage Test (ACT) caps the maximum LTV of the loans in the cover pool at 75%. Given a collateral pool of GBP 12.3bn and outstanding covered bonds of GBP 8.4bn, overcollateralization (OC) is 47% and significantly above the minimum OC of 11.1%, which results from a maximum asset per-centage of 90%.
Average seasoning of 17 months
The average seasoning is 17 months, reflecting a relatively young loan portfolio. 94.5% of loans are related to owner-occupied residential mortgages and only 5.0% to buy-to-letmortgages. Regarding the purpose of the mortgage loans, 55.2% are used for purchasing and 42.7% for remortgaging.
Regional concentration in South East
The regional distribution shows some concentration of 32.7% in the South East of the UK, followed by Greater London with 13.0%, Scotland with 10.7%, and the South West with 9.2%. The remainder is spread throughout the UK.
RBS COVER POOL DETAILS
By indexed LTV By regional distribution
0200400600800
1,0001,2001,4001,6001,8002,000
<=30
%
>30%
-<=3
5%
>35%
-<=4
0%
>40%
-<=4
5%
>45%
-<=5
0%
>50%
-<=5
5%
>55%
-<=6
0%
>60%
-<=6
5%
>65%
-<=7
0%
>70%
-<=7
5%
>75%
-<=8
0%
>80%
-<=8
5%
>85%
-<=9
0%
>90%
-<=9
5%
>95%
-<=1
00%
>100
%
LTV
GB
P m
n
East Anglia
3.1%
Greater London13.0%
North West9.3%
Scotland10.7%
Yorkshire5.6%
Wales3.2%
South West9.2% North
3.0%
South East32.7%
East Midlands4.6%
West Midlands6%
Source: Company data, UniCredit Research
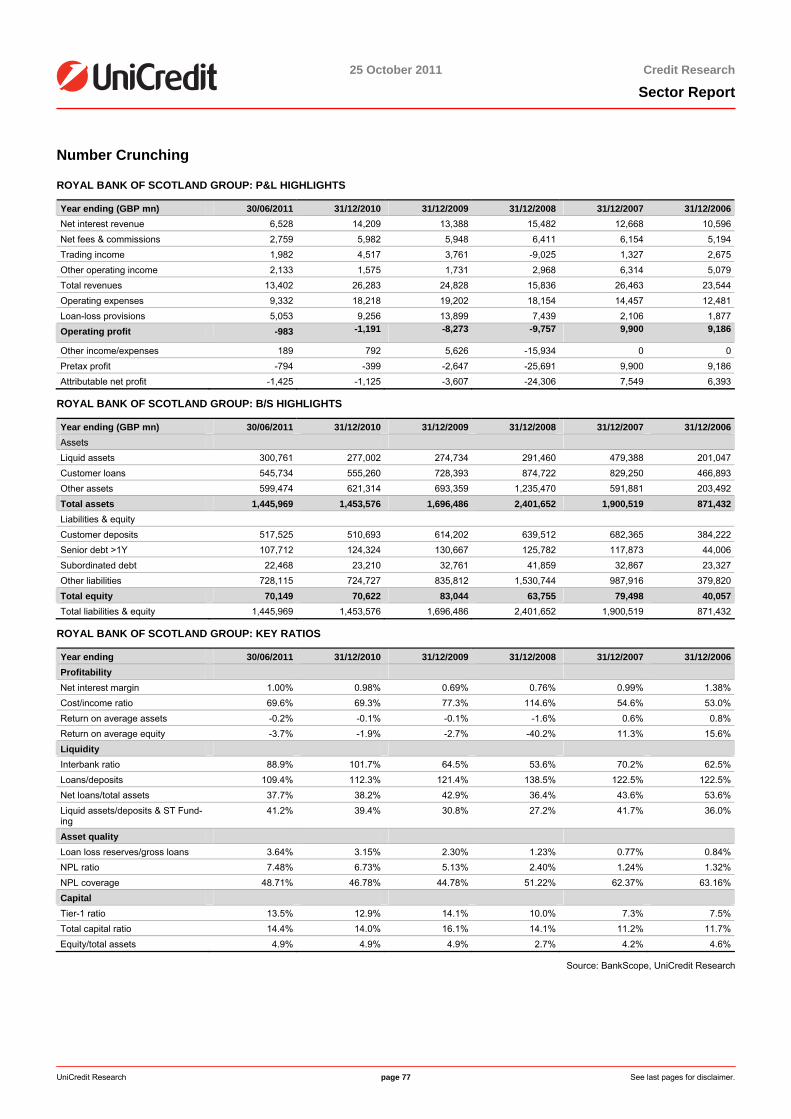
25 October 2011 Credit Research
Sector Report
UniCredit Research page 77 See last pages for disclaimer.
Number Crunching
ROYAL BANK OF SCOTLAND GROUP: P&L HIGHLIGHTS
Year ending (GBP mn) 30/06/2011 31/12/2010 31/12/2009 31/12/2008 31/12/2007 31/12/2006Net interest revenue 6,528 14,209 13,388 15,482 12,668 10,596Net fees & commissions 2,759 5,982 5,948 6,411 6,154 5,194Trading income 1,982 4,517 3,761 -9,025 1,327 2,675Other operating income 2,133 1,575 1,731 2,968 6,314 5,079Total revenues 13,402 26,283 24,828 15,836 26,463 23,544Operating expenses 9,332 18,218 19,202 18,154 14,457 12,481Loan-loss provisions 5,053 9,256 13,899 7,439 2,106 1,877Operating profit -983 -1,191 -8,273 -9,757 9,900 9,186
Other income/expenses 189 792 5,626 -15,934 0 0Pretax profit -794 -399 -2,647 -25,691 9,900 9,186Attributable net profit -1,425 -1,125 -3,607 -24,306 7,549 6,393
ROYAL BANK OF SCOTLAND GROUP: B/S HIGHLIGHTS
Year ending (GBP mn) 30/06/2011 31/12/2010 31/12/2009 31/12/2008 31/12/2007 31/12/2006Assets Liquid assets 300,761 277,002 274,734 291,460 479,388 201,047Customer loans 545,734 555,260 728,393 874,722 829,250 466,893Other assets 599,474 621,314 693,359 1,235,470 591,881 203,492Total assets 1,445,969 1,453,576 1,696,486 2,401,652 1,900,519 871,432Liabilities & equity Customer deposits 517,525 510,693 614,202 639,512 682,365 384,222Senior debt >1Y 107,712 124,324 130,667 125,782 117,873 44,006Subordinated debt 22,468 23,210 32,761 41,859 32,867 23,327Other liabilities 728,115 724,727 835,812 1,530,744 987,916 379,820Total equity 70,149 70,622 83,044 63,755 79,498 40,057Total liabilities & equity 1,445,969 1,453,576 1,696,486 2,401,652 1,900,519 871,432
ROYAL BANK OF SCOTLAND GROUP: KEY RATIOS
Year ending 30/06/2011 31/12/2010 31/12/2009 31/12/2008 31/12/2007 31/12/2006Profitability Net interest margin 1.00% 0.98% 0.69% 0.76% 0.99% 1.38%Cost/income ratio 69.6% 69.3% 77.3% 114.6% 54.6% 53.0%Return on average assets -0.2% -0.1% -0.1% -1.6% 0.6% 0.8%Return on average equity -3.7% -1.9% -2.7% -40.2% 11.3% 15.6%Liquidity Interbank ratio 88.9% 101.7% 64.5% 53.6% 70.2% 62.5%Loans/deposits 109.4% 112.3% 121.4% 138.5% 122.5% 122.5%Net loans/total assets 37.7% 38.2% 42.9% 36.4% 43.6% 53.6%Liquid assets/deposits & ST Fund-ing
41.2% 39.4% 30.8% 27.2% 41.7% 36.0%
Asset quality Loan loss reserves/gross loans 3.64% 3.15% 2.30% 1.23% 0.77% 0.84%NPL ratio 7.48% 6.73% 5.13% 2.40% 1.24% 1.32%NPL coverage 48.71% 46.78% 44.78% 51.22% 62.37% 63.16%Capital Tier-1 ratio 13.5% 12.9% 14.1% 10.0% 7.3% 7.5%Total capital ratio 14.4% 14.0% 16.1% 14.1% 11.2% 11.7%Equity/total assets 4.9% 4.9% 4.9% 2.7% 4.2% 4.6%
Source: BankScope, UniCredit Research
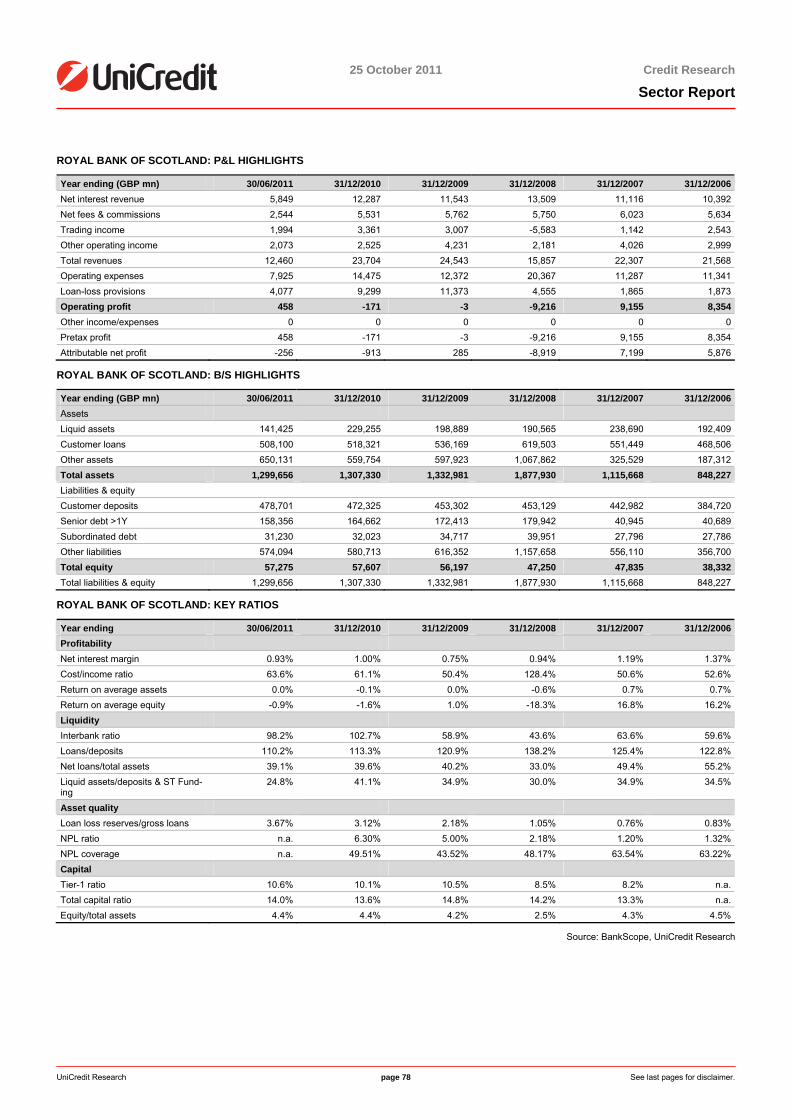
25 October 2011 Credit Research
Sector Report
UniCredit Research page 78 See last pages for disclaimer.
ROYAL BANK OF SCOTLAND: P&L HIGHLIGHTS
Year ending (GBP mn) 30/06/2011 31/12/2010 31/12/2009 31/12/2008 31/12/2007 31/12/2006Net interest revenue 5,849 12,287 11,543 13,509 11,116 10,392Net fees & commissions 2,544 5,531 5,762 5,750 6,023 5,634Trading income 1,994 3,361 3,007 -5,583 1,142 2,543Other operating income 2,073 2,525 4,231 2,181 4,026 2,999Total revenues 12,460 23,704 24,543 15,857 22,307 21,568Operating expenses 7,925 14,475 12,372 20,367 11,287 11,341Loan-loss provisions 4,077 9,299 11,373 4,555 1,865 1,873Operating profit 458 -171 -3 -9,216 9,155 8,354Other income/expenses 0 0 0 0 0 0Pretax profit 458 -171 -3 -9,216 9,155 8,354Attributable net profit -256 -913 285 -8,919 7,199 5,876
ROYAL BANK OF SCOTLAND: B/S HIGHLIGHTS
Year ending (GBP mn) 30/06/2011 31/12/2010 31/12/2009 31/12/2008 31/12/2007 31/12/2006Assets Liquid assets 141,425 229,255 198,889 190,565 238,690 192,409Customer loans 508,100 518,321 536,169 619,503 551,449 468,506Other assets 650,131 559,754 597,923 1,067,862 325,529 187,312Total assets 1,299,656 1,307,330 1,332,981 1,877,930 1,115,668 848,227Liabilities & equity Customer deposits 478,701 472,325 453,302 453,129 442,982 384,720Senior debt >1Y 158,356 164,662 172,413 179,942 40,945 40,689Subordinated debt 31,230 32,023 34,717 39,951 27,796 27,786Other liabilities 574,094 580,713 616,352 1,157,658 556,110 356,700Total equity 57,275 57,607 56,197 47,250 47,835 38,332Total liabilities & equity 1,299,656 1,307,330 1,332,981 1,877,930 1,115,668 848,227
ROYAL BANK OF SCOTLAND: KEY RATIOS
Year ending 30/06/2011 31/12/2010 31/12/2009 31/12/2008 31/12/2007 31/12/2006Profitability Net interest margin 0.93% 1.00% 0.75% 0.94% 1.19% 1.37%Cost/income ratio 63.6% 61.1% 50.4% 128.4% 50.6% 52.6%Return on average assets 0.0% -0.1% 0.0% -0.6% 0.7% 0.7%Return on average equity -0.9% -1.6% 1.0% -18.3% 16.8% 16.2%Liquidity Interbank ratio 98.2% 102.7% 58.9% 43.6% 63.6% 59.6%Loans/deposits 110.2% 113.3% 120.9% 138.2% 125.4% 122.8%Net loans/total assets 39.1% 39.6% 40.2% 33.0% 49.4% 55.2%Liquid assets/deposits & ST Fund-ing
24.8% 41.1% 34.9% 30.0% 34.9% 34.5%
Asset quality Loan loss reserves/gross loans 3.67% 3.12% 2.18% 1.05% 0.76% 0.83%NPL ratio n.a. 6.30% 5.00% 2.18% 1.20% 1.32%NPL coverage n.a. 49.51% 43.52% 48.17% 63.54% 63.22%Capital Tier-1 ratio 10.6% 10.1% 10.5% 8.5% 8.2% n.a.Total capital ratio 14.0% 13.6% 14.8% 14.2% 13.3% n.a.Equity/total assets 4.4% 4.4% 4.2% 2.5% 4.3% 4.5%
Source: BankScope, UniCredit Research
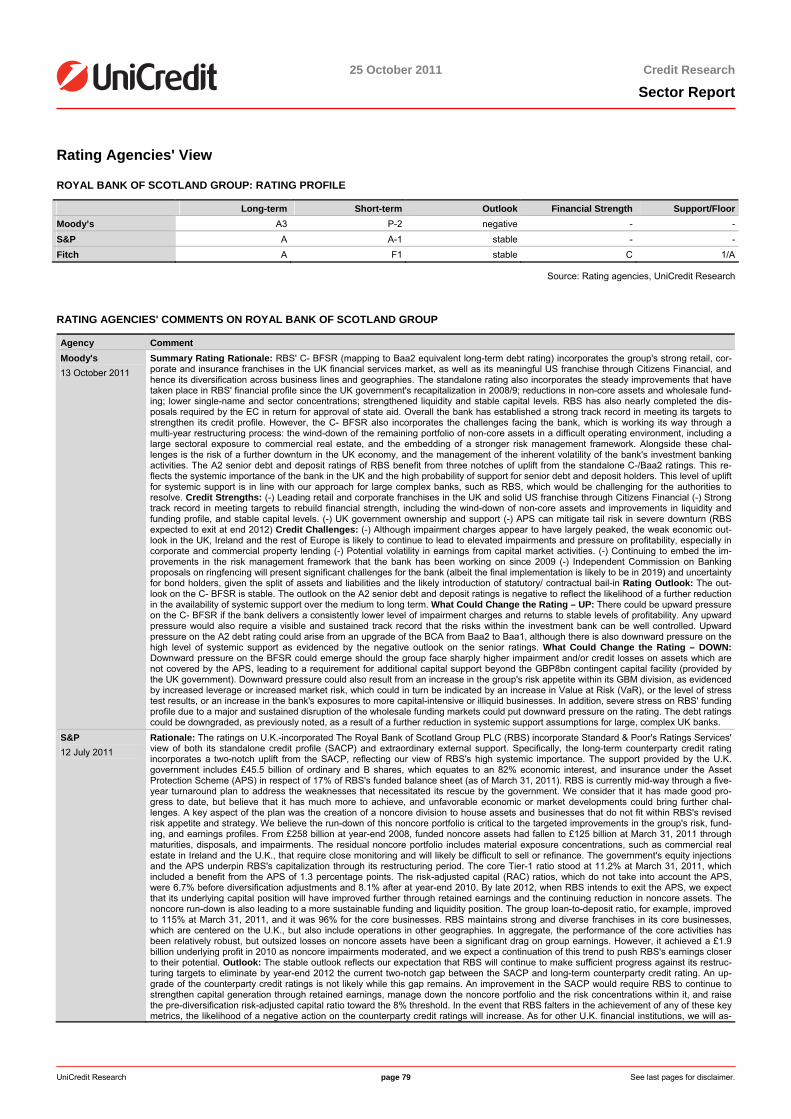
25 October 2011 Credit Research
Sector Report
UniCredit Research page 79 See last pages for disclaimer.
Rating Agencies' View
ROYAL BANK OF SCOTLAND GROUP: RATING PROFILE
Long-term Short-term Outlook Financial Strength Support/FloorMoody’s A3 P-2 negative - -S&P A A-1 stable - -Fitch A F1 stable C 1/A
Source: Rating agencies, UniCredit Research
RATING AGENCIES' COMMENTS ON ROYAL BANK OF SCOTLAND GROUP
Agency Comment Moody's 13 October 2011
Summary Rating Rationale: RBS' C- BFSR (mapping to Baa2 equivalent long-term debt rating) incorporates the group's strong retail, cor-porate and insurance franchises in the UK financial services market, as well as its meaningful US franchise through Citizens Financial, and hence its diversification across business lines and geographies. The standalone rating also incorporates the steady improvements that have taken place in RBS' financial profile since the UK government's recapitalization in 2008/9; reductions in non-core assets and wholesale fund-ing; lower single-name and sector concentrations; strengthened liquidity and stable capital levels. RBS has also nearly completed the dis-posals required by the EC in return for approval of state aid. Overall the bank has established a strong track record in meeting its targets to strengthen its credit profile. However, the C- BFSR also incorporates the challenges facing the bank, which is working its way through a multi-year restructuring process: the wind-down of the remaining portfolio of non-core assets in a difficult operating environment, including a large sectoral exposure to commercial real estate, and the embedding of a stronger risk management framework. Alongside these chal-lenges is the risk of a further downturn in the UK economy, and the management of the inherent volatility of the bank's investment banking activities. The A2 senior debt and deposit ratings of RBS benefit from three notches of uplift from the standalone C-/Baa2 ratings. This re-flects the systemic importance of the bank in the UK and the high probability of support for senior debt and deposit holders. This level of uplift for systemic support is in line with our approach for large complex banks, such as RBS, which would be challenging for the authorities to resolve. Credit Strengths: (-) Leading retail and corporate franchises in the UK and solid US franchise through Citizens Financial (-) Strong track record in meeting targets to rebuild financial strength, including the wind-down of non-core assets and improvements in liquidity and funding profile, and stable capital levels. (-) UK government ownership and support (-) APS can mitigate tail risk in severe downturn (RBS expected to exit at end 2012) Credit Challenges: (-) Although impairment charges appear to have largely peaked, the weak economic out-look in the UK, Ireland and the rest of Europe is likely to continue to lead to elevated impairments and pressure on profitability, especially in corporate and commercial property lending (-) Potential volatility in earnings from capital market activities. (-) Continuing to embed the im-provements in the risk management framework that the bank has been working on since 2009 (-) Independent Commission on Banking proposals on ringfencing will present significant challenges for the bank (albeit the final implementation is likely to be in 2019) and uncertainty for bond holders, given the split of assets and liabilities and the likely introduction of statutory/ contractual bail-in Rating Outlook: The out-look on the C- BFSR is stable. The outlook on the A2 senior debt and deposit ratings is negative to reflect the likelihood of a further reduction in the availability of systemic support over the medium to long term. What Could Change the Rating – UP: There could be upward pressure on the C- BFSR if the bank delivers a consistently lower level of impairment charges and returns to stable levels of profitability. Any upward pressure would also require a visible and sustained track record that the risks within the investment bank can be well controlled. Upward pressure on the A2 debt rating could arise from an upgrade of the BCA from Baa2 to Baa1, although there is also downward pressure on the high level of systemic support as evidenced by the negative outlook on the senior ratings. What Could Change the Rating – DOWN: Downward pressure on the BFSR could emerge should the group face sharply higher impairment and/or credit losses on assets which are not covered by the APS, leading to a requirement for additional capital support beyond the GBP8bn contingent capital facility (provided by the UK government). Downward pressure could also result from an increase in the group's risk appetite within its GBM division, as evidenced by increased leverage or increased market risk, which could in turn be indicated by an increase in Value at Risk (VaR), or the level of stress test results, or an increase in the bank's exposures to more capital-intensive or illiquid businesses. In addition, severe stress on RBS' funding profile due to a major and sustained disruption of the wholesale funding markets could put downward pressure on the rating. The debt ratings could be downgraded, as previously noted, as a result of a further reduction in systemic support assumptions for large, complex UK banks.
S&P 12 July 2011
Rationale: The ratings on U.K.-incorporated The Royal Bank of Scotland Group PLC (RBS) incorporate Standard & Poor's Ratings Services' view of both its standalone credit profile (SACP) and extraordinary external support. Specifically, the long-term counterparty credit rating incorporates a two-notch uplift from the SACP, reflecting our view of RBS's high systemic importance. The support provided by the U.K. government includes £45.5 billion of ordinary and B shares, which equates to an 82% economic interest, and insurance under the Asset Protection Scheme (APS) in respect of 17% of RBS's funded balance sheet (as of March 31, 2011). RBS is currently mid-way through a five-year turnaround plan to address the weaknesses that necessitated its rescue by the government. We consider that it has made good pro-gress to date, but believe that it has much more to achieve, and unfavorable economic or market developments could bring further chal-lenges. A key aspect of the plan was the creation of a noncore division to house assets and businesses that do not fit within RBS's revised risk appetite and strategy. We believe the run-down of this noncore portfolio is critical to the targeted improvements in the group's risk, fund-ing, and earnings profiles. From £258 billion at year-end 2008, funded noncore assets had fallen to £125 billion at March 31, 2011 through maturities, disposals, and impairments. The residual noncore portfolio includes material exposure concentrations, such as commercial real estate in Ireland and the U.K., that require close monitoring and will likely be difficult to sell or refinance. The government's equity injections and the APS underpin RBS's capitalization through its restructuring period. The core Tier-1 ratio stood at 11.2% at March 31, 2011, which included a benefit from the APS of 1.3 percentage points. The risk-adjusted capital (RAC) ratios, which do not take into account the APS, were 6.7% before diversification adjustments and 8.1% after at year-end 2010. By late 2012, when RBS intends to exit the APS, we expect that its underlying capital position will have improved further through retained earnings and the continuing reduction in noncore assets. The noncore run-down is also leading to a more sustainable funding and liquidity position. The group loan-to-deposit ratio, for example, improved to 115% at March 31, 2011, and it was 96% for the core businesses. RBS maintains strong and diverse franchises in its core businesses, which are centered on the U.K., but also include operations in other geographies. In aggregate, the performance of the core activities has been relatively robust, but outsized losses on noncore assets have been a significant drag on group earnings. However, it achieved a £1.9 billion underlying profit in 2010 as noncore impairments moderated, and we expect a continuation of this trend to push RBS's earnings closer to their potential. Outlook: The stable outlook reflects our expectation that RBS will continue to make sufficient progress against its restruc-turing targets to eliminate by year-end 2012 the current two-notch gap between the SACP and long-term counterparty credit rating. An up-grade of the counterparty credit ratings is not likely while this gap remains. An improvement in the SACP would require RBS to continue to strengthen capital generation through retained earnings, manage down the noncore portfolio and the risk concentrations within it, and raise the pre-diversification risk-adjusted capital ratio toward the 8% threshold. In the event that RBS falters in the achievement of any of these key metrics, the likelihood of a negative action on the counterparty credit ratings will increase. As for other U.K. financial institutions, we will as-
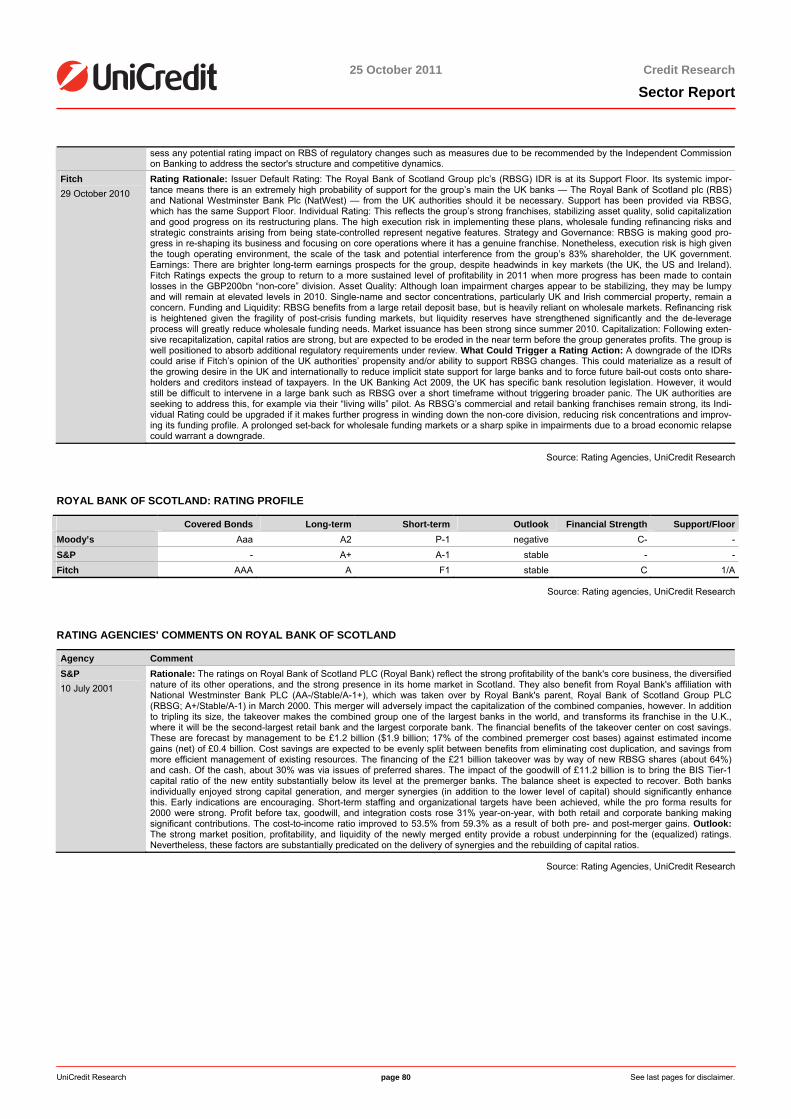
25 October 2011 Credit Research
Sector Report
UniCredit Research page 80 See last pages for disclaimer.
sess any potential rating impact on RBS of regulatory changes such as measures due to be recommended by the Independent Commission on Banking to address the sector's structure and competitive dynamics.
Fitch 29 October 2010
Rating Rationale: Issuer Default Rating: The Royal Bank of Scotland Group plc’s (RBSG) IDR is at its Support Floor. Its systemic impor-tance means there is an extremely high probability of support for the group’s main the UK banks — The Royal Bank of Scotland plc (RBS) and National Westminster Bank Plc (NatWest) — from the UK authorities should it be necessary. Support has been provided via RBSG, which has the same Support Floor. Individual Rating: This reflects the group’s strong franchises, stabilizing asset quality, solid capitalization and good progress on its restructuring plans. The high execution risk in implementing these plans, wholesale funding refinancing risks and strategic constraints arising from being state-controlled represent negative features. Strategy and Governance: RBSG is making good pro-gress in re-shaping its business and focusing on core operations where it has a genuine franchise. Nonetheless, execution risk is high given the tough operating environment, the scale of the task and potential interference from the group’s 83% shareholder, the UK government. Earnings: There are brighter long-term earnings prospects for the group, despite headwinds in key markets (the UK, the US and Ireland). Fitch Ratings expects the group to return to a more sustained level of profitability in 2011 when more progress has been made to contain losses in the GBP200bn “non-core” division. Asset Quality: Although loan impairment charges appear to be stabilizing, they may be lumpy and will remain at elevated levels in 2010. Single-name and sector concentrations, particularly UK and Irish commercial property, remain a concern. Funding and Liquidity: RBSG benefits from a large retail deposit base, but is heavily reliant on wholesale markets. Refinancing risk is heightened given the fragility of post-crisis funding markets, but liquidity reserves have strengthened significantly and the de-leverage process will greatly reduce wholesale funding needs. Market issuance has been strong since summer 2010. Capitalization: Following exten-sive recapitalization, capital ratios are strong, but are expected to be eroded in the near term before the group generates profits. The group is well positioned to absorb additional regulatory requirements under review. What Could Trigger a Rating Action: A downgrade of the IDRs could arise if Fitch’s opinion of the UK authorities’ propensity and/or ability to support RBSG changes. This could materialize as a result of the growing desire in the UK and internationally to reduce implicit state support for large banks and to force future bail-out costs onto share-holders and creditors instead of taxpayers. In the UK Banking Act 2009, the UK has specific bank resolution legislation. However, it would still be difficult to intervene in a large bank such as RBSG over a short timeframe without triggering broader panic. The UK authorities are seeking to address this, for example via their “living wills” pilot. As RBSG’s commercial and retail banking franchises remain strong, its Indi-vidual Rating could be upgraded if it makes further progress in winding down the non-core division, reducing risk concentrations and improv-ing its funding profile. A prolonged set-back for wholesale funding markets or a sharp spike in impairments due to a broad economic relapse could warrant a downgrade.
Source: Rating Agencies, UniCredit Research
ROYAL BANK OF SCOTLAND: RATING PROFILE
Covered Bonds Long-term Short-term Outlook Financial Strength Support/FloorMoody’s Aaa A2 P-1 negative C- -S&P - A+ A-1 stable - -Fitch AAA A F1 stable C 1/A
Source: Rating agencies, UniCredit Research
RATING AGENCIES' COMMENTS ON ROYAL BANK OF SCOTLAND
Agency Comment S&P 10 July 2001
Rationale: The ratings on Royal Bank of Scotland PLC (Royal Bank) reflect the strong profitability of the bank's core business, the diversified nature of its other operations, and the strong presence in its home market in Scotland. They also benefit from Royal Bank's affiliation with National Westminster Bank PLC (AA-/Stable/A-1+), which was taken over by Royal Bank's parent, Royal Bank of Scotland Group PLC (RBSG; A+/Stable/A-1) in March 2000. This merger will adversely impact the capitalization of the combined companies, however. In addition to tripling its size, the takeover makes the combined group one of the largest banks in the world, and transforms its franchise in the U.K., where it will be the second-largest retail bank and the largest corporate bank. The financial benefits of the takeover center on cost savings. These are forecast by management to be £1.2 billion ($1.9 billion; 17% of the combined premerger cost bases) against estimated income gains (net) of £0.4 billion. Cost savings are expected to be evenly split between benefits from eliminating cost duplication, and savings from more efficient management of existing resources. The financing of the £21 billion takeover was by way of new RBSG shares (about 64%) and cash. Of the cash, about 30% was via issues of preferred shares. The impact of the goodwill of £11.2 billion is to bring the BIS Tier-1 capital ratio of the new entity substantially below its level at the premerger banks. The balance sheet is expected to recover. Both banks individually enjoyed strong capital generation, and merger synergies (in addition to the lower level of capital) should significantly enhance this. Early indications are encouraging. Short-term staffing and organizational targets have been achieved, while the pro forma results for 2000 were strong. Profit before tax, goodwill, and integration costs rose 31% year-on-year, with both retail and corporate banking making significant contributions. The cost-to-income ratio improved to 53.5% from 59.3% as a result of both pre- and post-merger gains. Outlook: The strong market position, profitability, and liquidity of the newly merged entity provide a robust underpinning for the (equalized) ratings. Nevertheless, these factors are substantially predicated on the delivery of synergies and the rebuilding of capital ratios.
Source: Rating Agencies, UniCredit Research
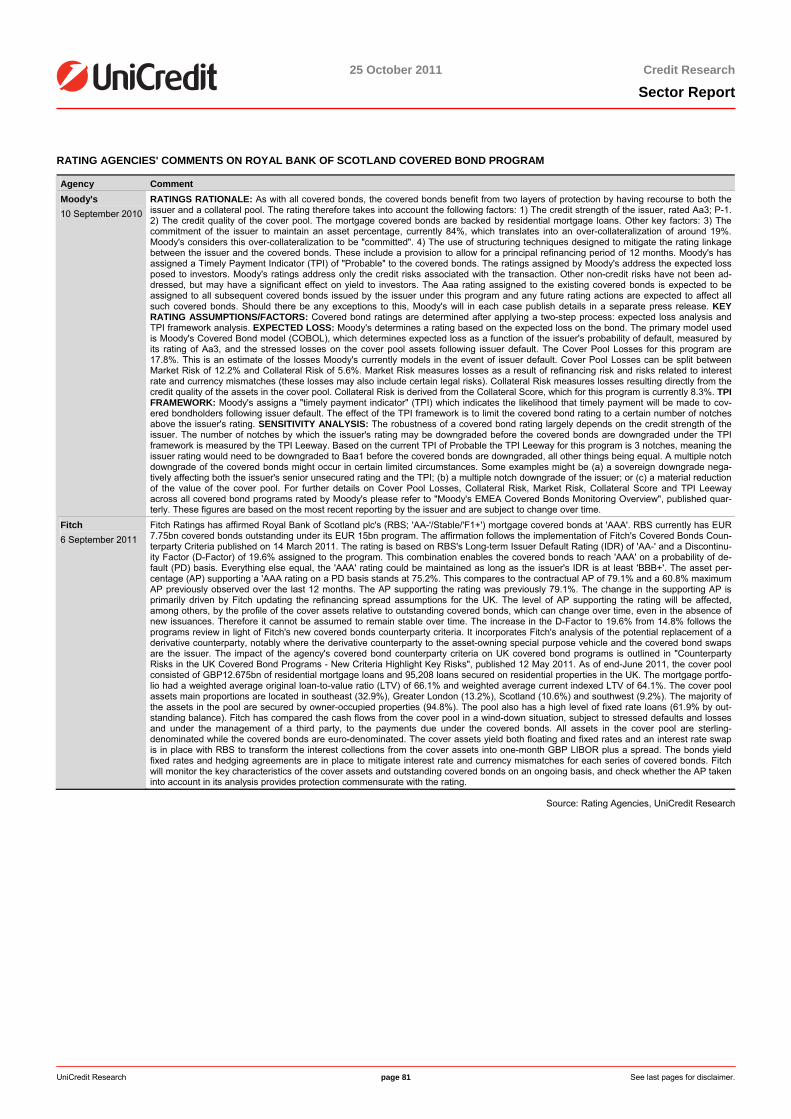
25 October 2011 Credit Research
Sector Report
UniCredit Research page 81 See last pages for disclaimer.
RATING AGENCIES' COMMENTS ON ROYAL BANK OF SCOTLAND COVERED BOND PROGRAM
Agency Comment Moody's 10 September 2010
RATINGS RATIONALE: As with all covered bonds, the covered bonds benefit from two layers of protection by having recourse to both the issuer and a collateral pool. The rating therefore takes into account the following factors: 1) The credit strength of the issuer, rated Aa3; P-1. 2) The credit quality of the cover pool. The mortgage covered bonds are backed by residential mortgage loans. Other key factors: 3) The commitment of the issuer to maintain an asset percentage, currently 84%, which translates into an over-collateralization of around 19%. Moody's considers this over-collateralization to be "committed". 4) The use of structuring techniques designed to mitigate the rating linkage between the issuer and the covered bonds. These include a provision to allow for a principal refinancing period of 12 months. Moody's has assigned a Timely Payment Indicator (TPI) of "Probable" to the covered bonds. The ratings assigned by Moody's address the expected loss posed to investors. Moody's ratings address only the credit risks associated with the transaction. Other non-credit risks have not been ad-dressed, but may have a significant effect on yield to investors. The Aaa rating assigned to the existing covered bonds is expected to be assigned to all subsequent covered bonds issued by the issuer under this program and any future rating actions are expected to affect all such covered bonds. Should there be any exceptions to this, Moody's will in each case publish details in a separate press release. KEY RATING ASSUMPTIONS/FACTORS: Covered bond ratings are determined after applying a two-step process: expected loss analysis and TPI framework analysis. EXPECTED LOSS: Moody's determines a rating based on the expected loss on the bond. The primary model used is Moody's Covered Bond model (COBOL), which determines expected loss as a function of the issuer's probability of default, measured by its rating of Aa3, and the stressed losses on the cover pool assets following issuer default. The Cover Pool Losses for this program are 17.8%. This is an estimate of the losses Moody's currently models in the event of issuer default. Cover Pool Losses can be split between Market Risk of 12.2% and Collateral Risk of 5.6%. Market Risk measures losses as a result of refinancing risk and risks related to interest rate and currency mismatches (these losses may also include certain legal risks). Collateral Risk measures losses resulting directly from the credit quality of the assets in the cover pool. Collateral Risk is derived from the Collateral Score, which for this program is currently 8.3%. TPI FRAMEWORK: Moody's assigns a "timely payment indicator" (TPI) which indicates the likelihood that timely payment will be made to cov-ered bondholders following issuer default. The effect of the TPI framework is to limit the covered bond rating to a certain number of notches above the issuer's rating. SENSITIVITY ANALYSIS: The robustness of a covered bond rating largely depends on the credit strength of the issuer. The number of notches by which the issuer's rating may be downgraded before the covered bonds are downgraded under the TPI framework is measured by the TPI Leeway. Based on the current TPI of Probable the TPI Leeway for this program is 3 notches, meaning the issuer rating would need to be downgraded to Baa1 before the covered bonds are downgraded, all other things being equal. A multiple notch downgrade of the covered bonds might occur in certain limited circumstances. Some examples might be (a) a sovereign downgrade nega-tively affecting both the issuer's senior unsecured rating and the TPI; (b) a multiple notch downgrade of the issuer; or (c) a material reduction of the value of the cover pool. For further details on Cover Pool Losses, Collateral Risk, Market Risk, Collateral Score and TPI Leeway across all covered bond programs rated by Moody's please refer to "Moody's EMEA Covered Bonds Monitoring Overview", published quar-terly. These figures are based on the most recent reporting by the issuer and are subject to change over time.
Fitch 6 September 2011
Fitch Ratings has affirmed Royal Bank of Scotland plc's (RBS; 'AA-'/Stable/'F1+') mortgage covered bonds at 'AAA'. RBS currently has EUR 7.75bn covered bonds outstanding under its EUR 15bn program. The affirmation follows the implementation of Fitch's Covered Bonds Coun-terparty Criteria published on 14 March 2011. The rating is based on RBS's Long-term Issuer Default Rating (IDR) of 'AA-' and a Discontinu-ity Factor (D-Factor) of 19.6% assigned to the program. This combination enables the covered bonds to reach 'AAA' on a probability of de-fault (PD) basis. Everything else equal, the 'AAA' rating could be maintained as long as the issuer's IDR is at least 'BBB+'. The asset per-centage (AP) supporting a 'AAA rating on a PD basis stands at 75.2%. This compares to the contractual AP of 79.1% and a 60.8% maximum AP previously observed over the last 12 months. The AP supporting the rating was previously 79.1%. The change in the supporting AP is primarily driven by Fitch updating the refinancing spread assumptions for the UK. The level of AP supporting the rating will be affected, among others, by the profile of the cover assets relative to outstanding covered bonds, which can change over time, even in the absence of new issuances. Therefore it cannot be assumed to remain stable over time. The increase in the D-Factor to 19.6% from 14.8% follows the programs review in light of Fitch's new covered bonds counterparty criteria. It incorporates Fitch's analysis of the potential replacement of a derivative counterparty, notably where the derivative counterparty to the asset-owning special purpose vehicle and the covered bond swaps are the issuer. The impact of the agency's covered bond counterparty criteria on UK covered bond programs is outlined in "Counterparty Risks in the UK Covered Bond Programs - New Criteria Highlight Key Risks", published 12 May 2011. As of end-June 2011, the cover pool consisted of GBP12.675bn of residential mortgage loans and 95,208 loans secured on residential properties in the UK. The mortgage portfo-lio had a weighted average original loan-to-value ratio (LTV) of 66.1% and weighted average current indexed LTV of 64.1%. The cover pool assets main proportions are located in southeast (32.9%), Greater London (13.2%), Scotland (10.6%) and southwest (9.2%). The majority of the assets in the pool are secured by owner-occupied properties (94.8%). The pool also has a high level of fixed rate loans (61.9% by out-standing balance). Fitch has compared the cash flows from the cover pool in a wind-down situation, subject to stressed defaults and losses and under the management of a third party, to the payments due under the covered bonds. All assets in the cover pool are sterling-denominated while the covered bonds are euro-denominated. The cover assets yield both floating and fixed rates and an interest rate swap is in place with RBS to transform the interest collections from the cover assets into one-month GBP LIBOR plus a spread. The bonds yield fixed rates and hedging agreements are in place to mitigate interest rate and currency mismatches for each series of covered bonds. Fitch will monitor the key characteristics of the cover assets and outstanding covered bonds on an ongoing basis, and check whether the AP taken into account in its analysis provides protection commensurate with the rating.
Source: Rating Agencies, UniCredit Research
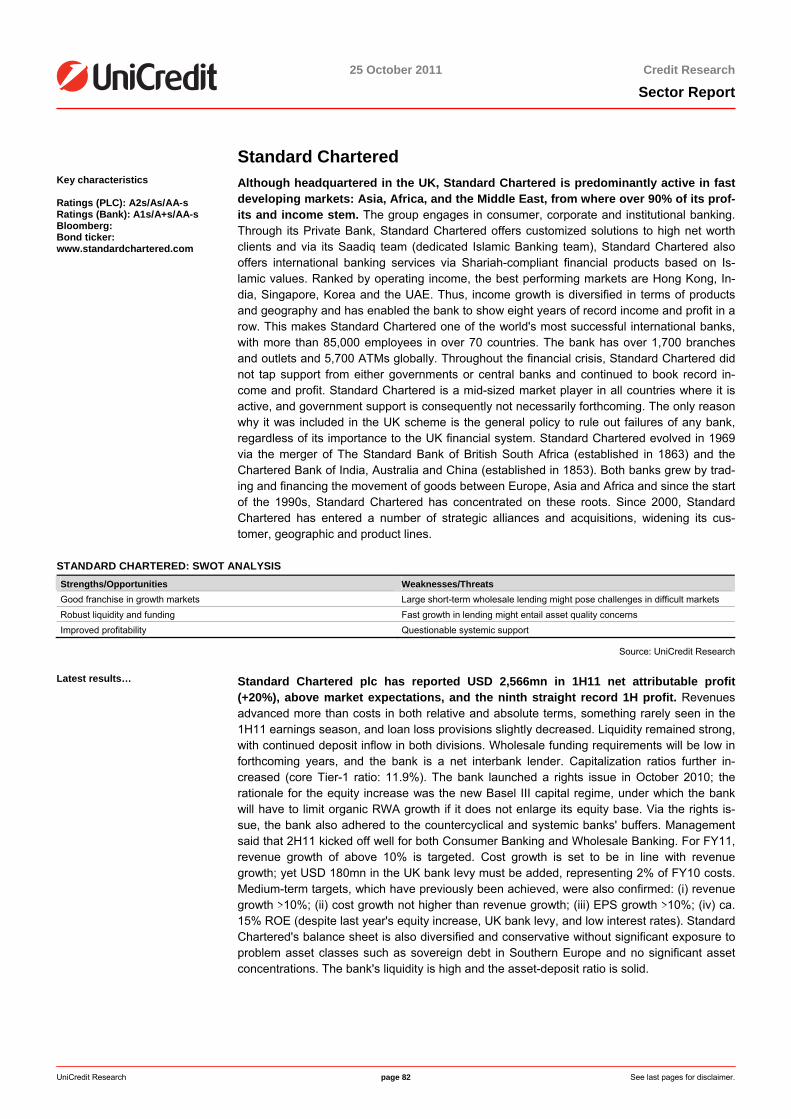
25 October 2011 Credit Research
Sector Report
UniCredit Research page 82 See last pages for disclaimer.
Standard Chartered Key characteristics Ratings (PLC): A2s/As/AA-s Ratings (Bank): A1s/A+s/AA-s Bloomberg: Bond ticker: www.standardchartered.com
Although headquartered in the UK, Standard Chartered is predominantly active in fastdeveloping markets: Asia, Africa, and the Middle East, from where over 90% of its prof-its and income stem. The group engages in consumer, corporate and institutional banking. Through its Private Bank, Standard Chartered offers customized solutions to high net worthclients and via its Saadiq team (dedicated Islamic Banking team), Standard Chartered also offers international banking services via Shariah-compliant financial products based on Is-lamic values. Ranked by operating income, the best performing markets are Hong Kong, In-dia, Singapore, Korea and the UAE. Thus, income growth is diversified in terms of products and geography and has enabled the bank to show eight years of record income and profit in a row. This makes Standard Chartered one of the world's most successful international banks,with more than 85,000 employees in over 70 countries. The bank has over 1,700 branches and outlets and 5,700 ATMs globally. Throughout the financial crisis, Standard Chartered did not tap support from either governments or central banks and continued to book record in-come and profit. Standard Chartered is a mid-sized market player in all countries where it is active, and government support is consequently not necessarily forthcoming. The only reason why it was included in the UK scheme is the general policy to rule out failures of any bank, regardless of its importance to the UK financial system. Standard Chartered evolved in 1969 via the merger of The Standard Bank of British South Africa (established in 1863) and theChartered Bank of India, Australia and China (established in 1853). Both banks grew by trad-ing and financing the movement of goods between Europe, Asia and Africa and since the startof the 1990s, Standard Chartered has concentrated on these roots. Since 2000, Standard Chartered has entered a number of strategic alliances and acquisitions, widening its cus-tomer, geographic and product lines.
STANDARD CHARTERED: SWOT ANALYSIS Strengths/Opportunities Weaknesses/Threats Good franchise in growth markets Large short-term wholesale lending might pose challenges in difficult markets Robust liquidity and funding Fast growth in lending might entail asset quality concerns Improved profitability Questionable systemic support
Source: UniCredit Research
Latest results… Standard Chartered plc has reported USD 2,566mn in 1H11 net attributable profit(+20%), above market expectations, and the ninth straight record 1H profit. Revenues advanced more than costs in both relative and absolute terms, something rarely seen in the1H11 earnings season, and loan loss provisions slightly decreased. Liquidity remained strong, with continued deposit inflow in both divisions. Wholesale funding requirements will be low inforthcoming years, and the bank is a net interbank lender. Capitalization ratios further in-creased (core Tier-1 ratio: 11.9%). The bank launched a rights issue in October 2010; the rationale for the equity increase was the new Basel III capital regime, under which the bankwill have to limit organic RWA growth if it does not enlarge its equity base. Via the rights is-sue, the bank also adhered to the countercyclical and systemic banks' buffers. Managementsaid that 2H11 kicked off well for both Consumer Banking and Wholesale Banking. For FY11,revenue growth of above 10% is targeted. Cost growth is set to be in line with revenue growth; yet USD 180mn in the UK bank levy must be added, representing 2% of FY10 costs. Medium-term targets, which have previously been achieved, were also confirmed: (i) revenue growth >10%; (ii) cost growth not higher than revenue growth; (iii) EPS growth >10%; (iv) ca. 15% ROE (despite last year's equity increase, UK bank levy, and low interest rates). Standard Chartered's balance sheet is also diversified and conservative without significant exposure toproblem asset classes such as sovereign debt in Southern Europe and no significant assetconcentrations. The bank's liquidity is high and the asset-deposit ratio is solid.
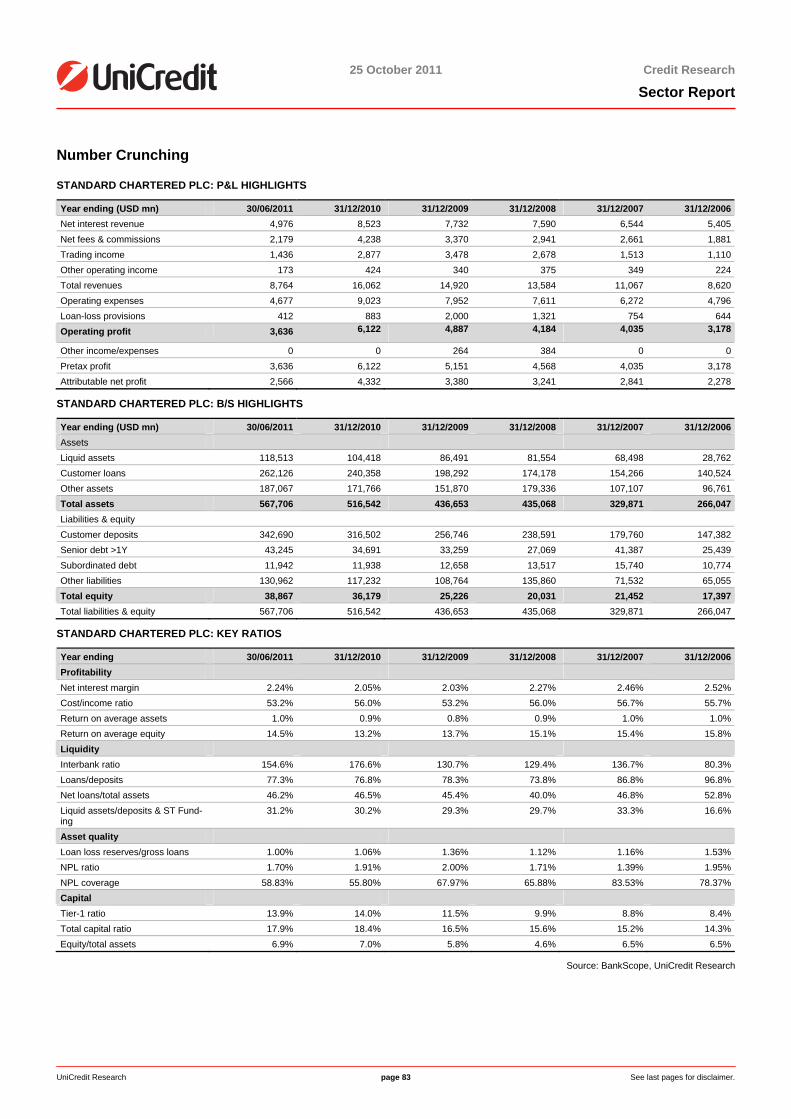
25 October 2011 Credit Research
Sector Report
UniCredit Research page 83 See last pages for disclaimer.
Number Crunching
STANDARD CHARTERED PLC: P&L HIGHLIGHTS
Year ending (USD mn) 30/06/2011 31/12/2010 31/12/2009 31/12/2008 31/12/2007 31/12/2006Net interest revenue 4,976 8,523 7,732 7,590 6,544 5,405Net fees & commissions 2,179 4,238 3,370 2,941 2,661 1,881Trading income 1,436 2,877 3,478 2,678 1,513 1,110Other operating income 173 424 340 375 349 224Total revenues 8,764 16,062 14,920 13,584 11,067 8,620Operating expenses 4,677 9,023 7,952 7,611 6,272 4,796Loan-loss provisions 412 883 2,000 1,321 754 644Operating profit 3,636 6,122 4,887 4,184 4,035 3,178
Other income/expenses 0 0 264 384 0 0Pretax profit 3,636 6,122 5,151 4,568 4,035 3,178Attributable net profit 2,566 4,332 3,380 3,241 2,841 2,278
STANDARD CHARTERED PLC: B/S HIGHLIGHTS
Year ending (USD mn) 30/06/2011 31/12/2010 31/12/2009 31/12/2008 31/12/2007 31/12/2006Assets Liquid assets 118,513 104,418 86,491 81,554 68,498 28,762Customer loans 262,126 240,358 198,292 174,178 154,266 140,524Other assets 187,067 171,766 151,870 179,336 107,107 96,761Total assets 567,706 516,542 436,653 435,068 329,871 266,047Liabilities & equity Customer deposits 342,690 316,502 256,746 238,591 179,760 147,382Senior debt >1Y 43,245 34,691 33,259 27,069 41,387 25,439Subordinated debt 11,942 11,938 12,658 13,517 15,740 10,774Other liabilities 130,962 117,232 108,764 135,860 71,532 65,055Total equity 38,867 36,179 25,226 20,031 21,452 17,397Total liabilities & equity 567,706 516,542 436,653 435,068 329,871 266,047
STANDARD CHARTERED PLC: KEY RATIOS
Year ending 30/06/2011 31/12/2010 31/12/2009 31/12/2008 31/12/2007 31/12/2006Profitability Net interest margin 2.24% 2.05% 2.03% 2.27% 2.46% 2.52%Cost/income ratio 53.2% 56.0% 53.2% 56.0% 56.7% 55.7%Return on average assets 1.0% 0.9% 0.8% 0.9% 1.0% 1.0%Return on average equity 14.5% 13.2% 13.7% 15.1% 15.4% 15.8%Liquidity Interbank ratio 154.6% 176.6% 130.7% 129.4% 136.7% 80.3%Loans/deposits 77.3% 76.8% 78.3% 73.8% 86.8% 96.8%Net loans/total assets 46.2% 46.5% 45.4% 40.0% 46.8% 52.8%Liquid assets/deposits & ST Fund-ing
31.2% 30.2% 29.3% 29.7% 33.3% 16.6%
Asset quality Loan loss reserves/gross loans 1.00% 1.06% 1.36% 1.12% 1.16% 1.53%NPL ratio 1.70% 1.91% 2.00% 1.71% 1.39% 1.95%NPL coverage 58.83% 55.80% 67.97% 65.88% 83.53% 78.37%Capital Tier-1 ratio 13.9% 14.0% 11.5% 9.9% 8.8% 8.4%Total capital ratio 17.9% 18.4% 16.5% 15.6% 15.2% 14.3%Equity/total assets 6.9% 7.0% 5.8% 4.6% 6.5% 6.5%
Source: BankScope, UniCredit Research
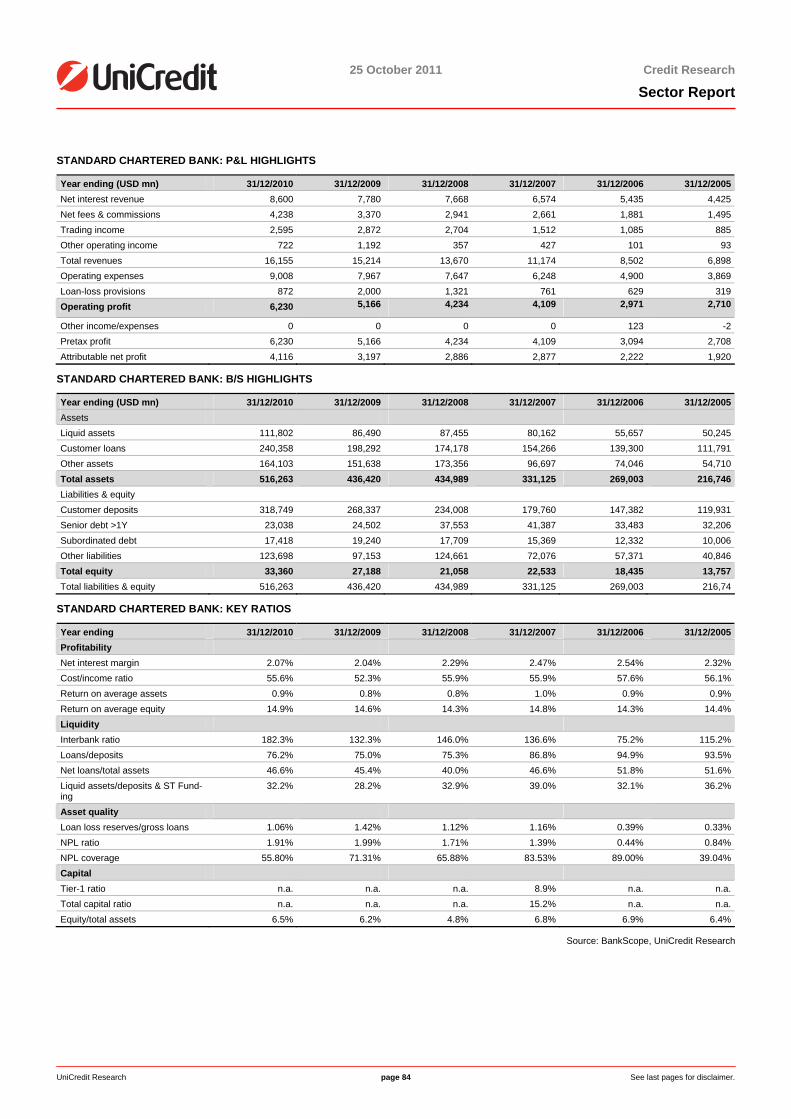
25 October 2011 Credit Research
Sector Report
UniCredit Research page 84 See last pages for disclaimer.
STANDARD CHARTERED BANK: P&L HIGHLIGHTS
Year ending (USD mn) 31/12/2010 31/12/2009 31/12/2008 31/12/2007 31/12/2006 31/12/2005Net interest revenue 8,600 7,780 7,668 6,574 5,435 4,425Net fees & commissions 4,238 3,370 2,941 2,661 1,881 1,495Trading income 2,595 2,872 2,704 1,512 1,085 885Other operating income 722 1,192 357 427 101 93Total revenues 16,155 15,214 13,670 11,174 8,502 6,898Operating expenses 9,008 7,967 7,647 6,248 4,900 3,869Loan-loss provisions 872 2,000 1,321 761 629 319Operating profit 6,230 5,166 4,234 4,109 2,971 2,710
Other income/expenses 0 0 0 0 123 -2Pretax profit 6,230 5,166 4,234 4,109 3,094 2,708Attributable net profit 4,116 3,197 2,886 2,877 2,222 1,920
STANDARD CHARTERED BANK: B/S HIGHLIGHTS
Year ending (USD mn) 31/12/2010 31/12/2009 31/12/2008 31/12/2007 31/12/2006 31/12/2005Assets Liquid assets 111,802 86,490 87,455 80,162 55,657 50,245Customer loans 240,358 198,292 174,178 154,266 139,300 111,791Other assets 164,103 151,638 173,356 96,697 74,046 54,710Total assets 516,263 436,420 434,989 331,125 269,003 216,746Liabilities & equity Customer deposits 318,749 268,337 234,008 179,760 147,382 119,931Senior debt >1Y 23,038 24,502 37,553 41,387 33,483 32,206Subordinated debt 17,418 19,240 17,709 15,369 12,332 10,006Other liabilities 123,698 97,153 124,661 72,076 57,371 40,846Total equity 33,360 27,188 21,058 22,533 18,435 13,757Total liabilities & equity 516,263 436,420 434,989 331,125 269,003 216,74
STANDARD CHARTERED BANK: KEY RATIOS
Year ending 31/12/2010 31/12/2009 31/12/2008 31/12/2007 31/12/2006 31/12/2005Profitability Net interest margin 2.07% 2.04% 2.29% 2.47% 2.54% 2.32%Cost/income ratio 55.6% 52.3% 55.9% 55.9% 57.6% 56.1%Return on average assets 0.9% 0.8% 0.8% 1.0% 0.9% 0.9%Return on average equity 14.9% 14.6% 14.3% 14.8% 14.3% 14.4%Liquidity Interbank ratio 182.3% 132.3% 146.0% 136.6% 75.2% 115.2%Loans/deposits 76.2% 75.0% 75.3% 86.8% 94.9% 93.5%Net loans/total assets 46.6% 45.4% 40.0% 46.6% 51.8% 51.6%Liquid assets/deposits & ST Fund-ing
32.2% 28.2% 32.9% 39.0% 32.1% 36.2%
Asset quality Loan loss reserves/gross loans 1.06% 1.42% 1.12% 1.16% 0.39% 0.33%NPL ratio 1.91% 1.99% 1.71% 1.39% 0.44% 0.84%NPL coverage 55.80% 71.31% 65.88% 83.53% 89.00% 39.04%Capital Tier-1 ratio n.a. n.a. n.a. 8.9% n.a. n.a.Total capital ratio n.a. n.a. n.a. 15.2% n.a. n.a.Equity/total assets 6.5% 6.2% 4.8% 6.8% 6.9% 6.4%
Source: BankScope, UniCredit Research
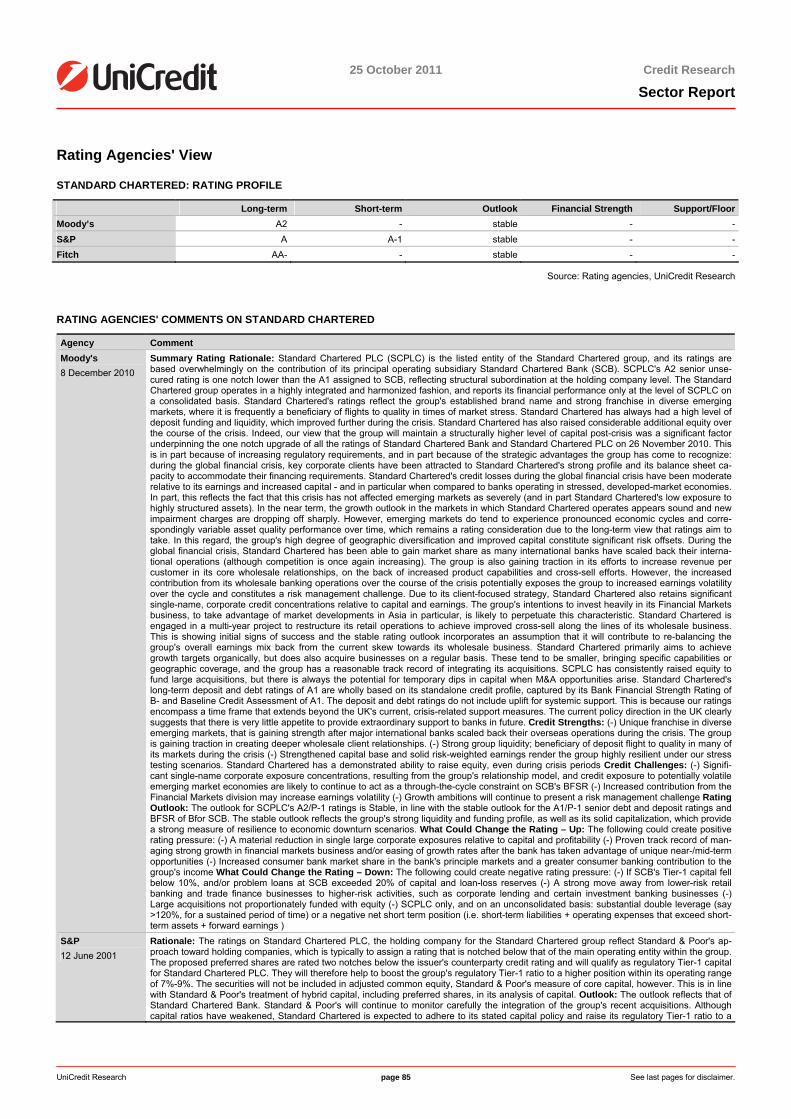
25 October 2011 Credit Research
Sector Report
UniCredit Research page 85 See last pages for disclaimer.
Rating Agencies' View
STANDARD CHARTERED: RATING PROFILE
Long-term Short-term Outlook Financial Strength Support/FloorMoody’s A2 - stable - -S&P A A-1 stable - -Fitch AA- - stable - -
Source: Rating agencies, UniCredit Research
RATING AGENCIES' COMMENTS ON STANDARD CHARTERED
Agency Comment Moody's 8 December 2010
Summary Rating Rationale: Standard Chartered PLC (SCPLC) is the listed entity of the Standard Chartered group, and its ratings are based overwhelmingly on the contribution of its principal operating subsidiary Standard Chartered Bank (SCB). SCPLC's A2 senior unse-cured rating is one notch lower than the A1 assigned to SCB, reflecting structural subordination at the holding company level. The Standard Chartered group operates in a highly integrated and harmonized fashion, and reports its financial performance only at the level of SCPLC on a consolidated basis. Standard Chartered's ratings reflect the group's established brand name and strong franchise in diverse emerging markets, where it is frequently a beneficiary of flights to quality in times of market stress. Standard Chartered has always had a high level of deposit funding and liquidity, which improved further during the crisis. Standard Chartered has also raised considerable additional equity over the course of the crisis. Indeed, our view that the group will maintain a structurally higher level of capital post-crisis was a significant factor underpinning the one notch upgrade of all the ratings of Standard Chartered Bank and Standard Chartered PLC on 26 November 2010. This is in part because of increasing regulatory requirements, and in part because of the strategic advantages the group has come to recognize: during the global financial crisis, key corporate clients have been attracted to Standard Chartered's strong profile and its balance sheet ca-pacity to accommodate their financing requirements. Standard Chartered's credit losses during the global financial crisis have been moderate relative to its earnings and increased capital - and in particular when compared to banks operating in stressed, developed-market economies. In part, this reflects the fact that this crisis has not affected emerging markets as severely (and in part Standard Chartered's low exposure to highly structured assets). In the near term, the growth outlook in the markets in which Standard Chartered operates appears sound and new impairment charges are dropping off sharply. However, emerging markets do tend to experience pronounced economic cycles and corre-spondingly variable asset quality performance over time, which remains a rating consideration due to the long-term view that ratings aim to take. In this regard, the group's high degree of geographic diversification and improved capital constitute significant risk offsets. During the global financial crisis, Standard Chartered has been able to gain market share as many international banks have scaled back their interna-tional operations (although competition is once again increasing). The group is also gaining traction in its efforts to increase revenue per customer in its core wholesale relationships, on the back of increased product capabilities and cross-sell efforts. However, the increased contribution from its wholesale banking operations over the course of the crisis potentially exposes the group to increased earnings volatility over the cycle and constitutes a risk management challenge. Due to its client-focused strategy, Standard Chartered also retains significant single-name, corporate credit concentrations relative to capital and earnings. The group's intentions to invest heavily in its Financial Markets business, to take advantage of market developments in Asia in particular, is likely to perpetuate this characteristic. Standard Chartered is engaged in a multi-year project to restructure its retail operations to achieve improved cross-sell along the lines of its wholesale business. This is showing initial signs of success and the stable rating outlook incorporates an assumption that it will contribute to re-balancing the group's overall earnings mix back from the current skew towards its wholesale business. Standard Chartered primarily aims to achieve growth targets organically, but does also acquire businesses on a regular basis. These tend to be smaller, bringing specific capabilities or geographic coverage, and the group has a reasonable track record of integrating its acquisitions. SCPLC has consistently raised equity to fund large acquisitions, but there is always the potential for temporary dips in capital when M&A opportunities arise. Standard Chartered's long-term deposit and debt ratings of A1 are wholly based on its standalone credit profile, captured by its Bank Financial Strength Rating of B- and Baseline Credit Assessment of A1. The deposit and debt ratings do not include uplift for systemic support. This is because our ratings encompass a time frame that extends beyond the UK's current, crisis-related support measures. The current policy direction in the UK clearly suggests that there is very little appetite to provide extraordinary support to banks in future. Credit Strengths: (-) Unique franchise in diverse emerging markets, that is gaining strength after major international banks scaled back their overseas operations during the crisis. The group is gaining traction in creating deeper wholesale client relationships. (-) Strong group liquidity; beneficiary of deposit flight to quality in many of its markets during the crisis (-) Strengthened capital base and solid risk-weighted earnings render the group highly resilient under our stress testing scenarios. Standard Chartered has a demonstrated ability to raise equity, even during crisis periods Credit Challenges: (-) Signifi-cant single-name corporate exposure concentrations, resulting from the group's relationship model, and credit exposure to potentially volatile emerging market economies are likely to continue to act as a through-the-cycle constraint on SCB's BFSR (-) Increased contribution from the Financial Markets division may increase earnings volatility (-) Growth ambitions will continue to present a risk management challenge Rating Outlook: The outlook for SCPLC's A2/P-1 ratings is Stable, in line with the stable outlook for the A1/P-1 senior debt and deposit ratings and BFSR of Bfor SCB. The stable outlook reflects the group's strong liquidity and funding profile, as well as its solid capitalization, which provide a strong measure of resilience to economic downturn scenarios. What Could Change the Rating – Up: The following could create positive rating pressure: (-) A material reduction in single large corporate exposures relative to capital and profitability (-) Proven track record of man-aging strong growth in financial markets business and/or easing of growth rates after the bank has taken advantage of unique near-/mid-term opportunities (-) Increased consumer bank market share in the bank's principle markets and a greater consumer banking contribution to the group's income What Could Change the Rating – Down: The following could create negative rating pressure: (-) If SCB's Tier-1 capital fell below 10%, and/or problem loans at SCB exceeded 20% of capital and loan-loss reserves (-) A strong move away from lower-risk retail banking and trade finance businesses to higher-risk activities, such as corporate lending and certain investment banking businesses (-) Large acquisitions not proportionately funded with equity (-) SCPLC only, and on an unconsolidated basis: substantial double leverage (say >120%, for a sustained period of time) or a negative net short term position (i.e. short-term liabilities + operating expenses that exceed short-term assets + forward earnings )
S&P 12 June 2001
Rationale: The ratings on Standard Chartered PLC, the holding company for the Standard Chartered group reflect Standard & Poor's ap-proach toward holding companies, which is typically to assign a rating that is notched below that of the main operating entity within the group. The proposed preferred shares are rated two notches below the issuer's counterparty credit rating and will qualify as regulatory Tier-1 capital for Standard Chartered PLC. They will therefore help to boost the group's regulatory Tier-1 ratio to a higher position within its operating range of 7%-9%. The securities will not be included in adjusted common equity, Standard & Poor's measure of core capital, however. This is in line with Standard & Poor's treatment of hybrid capital, including preferred shares, in its analysis of capital. Outlook: The outlook reflects that of Standard Chartered Bank. Standard & Poor's will continue to monitor carefully the integration of the group's recent acquisitions. Although capital ratios have weakened, Standard Chartered is expected to adhere to its stated capital policy and raise its regulatory Tier-1 ratio to a

25 October 2011 Credit Research
Sector Report
UniCredit Research page 86 See last pages for disclaimer.
more comfortable level within its operating range by retained earnings generation (which would also boost common equity). Standard Char-tered's productivity initiatives should help the bank in the face of a more uncertain international economic environment, providing some pro-tection against increased competition in some markets. Standard Chartered's balance sheet proved resilient during the Asian financial crisis. This resilience resulted from good capitalization, strong liquidity, and proactive risk management procedures. These management policies are expected to continue. The preferred shares rating is based on the proposed structure of the transaction, and is subject to change should the final structure differ substantially from that planned.
Fitch 19 October 2011
Key Rating Drivers: Asian Key Markets: The ratings of Standard Chartered Plc (SC) and its subsidiary, Standard Chartered Bank (SCB), reflect consistently high operating profitability, well-managed growth, good asset quality, and conservative liquidity management and capitali-sation. The ratings also reflect the greater potential volatility of its key markets (Hong Kong, Singapore, Korea and India) and some depend-ence on Wholesale Banking (WB) earnings. Strong Growth Prospects: SC’s performance benefits from the strong growth of many of its key markets. Operating ROAE remained high in H111 (19.54%). SC expects double-digit income growth in 2011, and Fitch Ratings believes profitability will continue to be high, supported by the benign outlook for its key markets as SC increases its market penetration. Wholesale Banking Earnings Driver: Earnings continue to be driven by WB (H111: 71% of pre-tax profit). The quality of WB income is good, with the majority relating to cash management and custody, trade and financial market client income. Consumer Banking (CB) pre-tax profit contribu-tion improved in H111 as loan impairment charges fell and wealth management, deposit and unsecured asset income strengthened despite pressure on secured asset income. Well-Managed Growth: Loan growth (H111: 9%; 2010: 21%) has been at a similar pace for CB and WB. CB’s lending includes a large proportion of retail mortgages with conservative loan-to-value ratios in its key markets. WB’s loan book is mod-erately larger and is typically short-term. Credit growth is rapid, but credit exposure can be quickly adjusted given its short-term nature. Good Asset Quality: Impaired loans were low at 1.7% of gross loans at end-H111. Impaired loans mainly relate to WB and are largely outside of SC’s key markets, arising from other Asian and Middle Eastern countries. Fitch believes some deterioration in asset quality and collateral values could occur if there were a severe downturn in one or more of SC’s key markets or in China, although this is not the agency’s central expectation. Market risk is moderate but Fitch expects it to increase incrementally to meet client needs. Sound Local Liquidity Management: SC’s liquidity is conservatively managed. Although liquidity is not fully fungible across countries, Fitch takes comfort that loan books in most geographies are more than covered by local customer deposits and the overall loans/customer deposits ratio was a low 77.3% at end-H111. SC benefits from flight to quality in times of stress. Refinancing risk is low with less than USD5bn term maturities before 2013. Capital Gen-eration Supports Growth: SC’s capitalisation is sound. Following a USD5bn rights issue in H210, its Fitch core capital ratio stood at 11.7% at end-H111. Risk-weighted asset growth is significant, but internal capital generation after dividends remains good. ICB Reforms Reduce Support: Fitch believes there is an extremely high probability that SCB would receive support from the UK government, as demonstrated by its inclusion in HM Treasury’s list of systemically important banks released in 2008. However, near-term pressure on support is heightened by reforms supporting resolution regimes. What Could Trigger a Rating Action: Limited Upside: Upside ratings potential is limited by their high level. Downside risk would most likely arise from a major deterioration in performance and/or asset quality due to a severe downturn in one or more of its key markets, which is not the agency’s central expectation.
Source: Rating Agencies, UniCredit Research
STANDARD CHARTERED BANK: RATING PROFILE
Long-term Short-term Outlook Financial Strength Support/FloorMoody’s A1 P-1 stable B- -S&P A+ A-1 stable - -Fitch AA- F1+ stable B 1/A-
Source: Rating agencies, UniCredit Research
RATING AGENCIES' COMMENTS ON STANDARD CHARTERED BANK
Agency Comment S&P 28 September 2011
Rationale: The ratings on U.K.-based Standard Chartered Bank (SCB) reflect Standard & Poor's Ratings Services' view of its strengths--specifically its diversification, liquidity and funding profile, solid historical earnings record, including its good track record at dealing with stresses, and relatively strong capitalization. The ratings also recognize some moderate weaknesses, notably that SCB lacks a dominant position in its key markets and its earnings are biased toward wholesale banking. While we expect SCB to continue to pursue a largely or-ganic growth strategy, we consider it possible that the bank may make a transformational acquisition that could alter its risk profile. SCB is a U.K.-domiciled bank operating in numerous markets globally, principally across Asia, Africa, and the Middle East. Although the bank plays a limited role in the U.K. economy, we nonetheless classify it as being of moderate systemic importance to the U.K. banking system. We note that SCB was eligible for capital support in the U.K. government's bank recapitalization plan. In practice, it did not need to use this support. In our view, SCB's markets provide a highly diverse earnings stream, with no single country contributing more than 25% of revenue or profit before tax. While SCB's major markets have been resilient amid a difficult global economic environment--particularly in Europe and the U.S.--its markets are not immune from external shocks. Management's apparent proactivity in positioning the businesses ahead of the economic downturn supported its good performance in recent years. We expect SCB's markets, despite some structural challenges and economic imbalances, to be generally supportive of the bank's earnings growth, due to their favorable demographics and good economic growth pros-pects. The bank's profitability metrics are generally sound, in our view. We calculate that SCB had a pre-provision return on risk-weighted assets of 2.9% and a cost-to-income ratio of 56% in 2010. We expect the bank to maintain its solid performance, produce satisfactory profit figures, and maintain sound return ratios in the next 18 months. We also anticipate that SCB's geographic diversification will continue to act as a strong stabilizing factor for performance--unless there's a synchronized slowdown in several of its key markets, such as Greater China, India, Singapore, and Korea, due to an external shock. For instance, revenue from India dropped notably in the first half of 2011 because of pressure from competition and regulation changes as well as management's actions. The strong performance in Hong Kong, however, more than offset the decline. We expect SCB's income to continue to rise and provide a good buffer against increased credit costs. SCB's asset quality is satisfactory, in our view, supported by the group's underwriting practices and the good economic conditions in markets where the group operates. The rapid loan growth in 2010 is a rating sensitivity and could be a source of impaired loans should economic conditions deteriorate. We expect the group's loan growth to slow down to a pace closer to the nominal GDP growth of its major markets. In our view, the factors leading to the explosive growth in 2010 were temporary and are unlikely to be repeated in the next 18 months. We consider SCB's funding and liquidity as good. The group is a net provider of liquidity to the interbank market and benefits from a low customer loan-to-customer deposit ratio of 79%, according to our calculations, thanks to its position in deposit-rich markets and a balanced approach to cus-tomer origination. We believe that SCB has significantly strengthened its capital base over the past 18 months, supported by multiple com-mon share capital-raising activities. SCB's risk adjusted capital (RAC) ratio after the diversification adjustment improved through 2010, end-
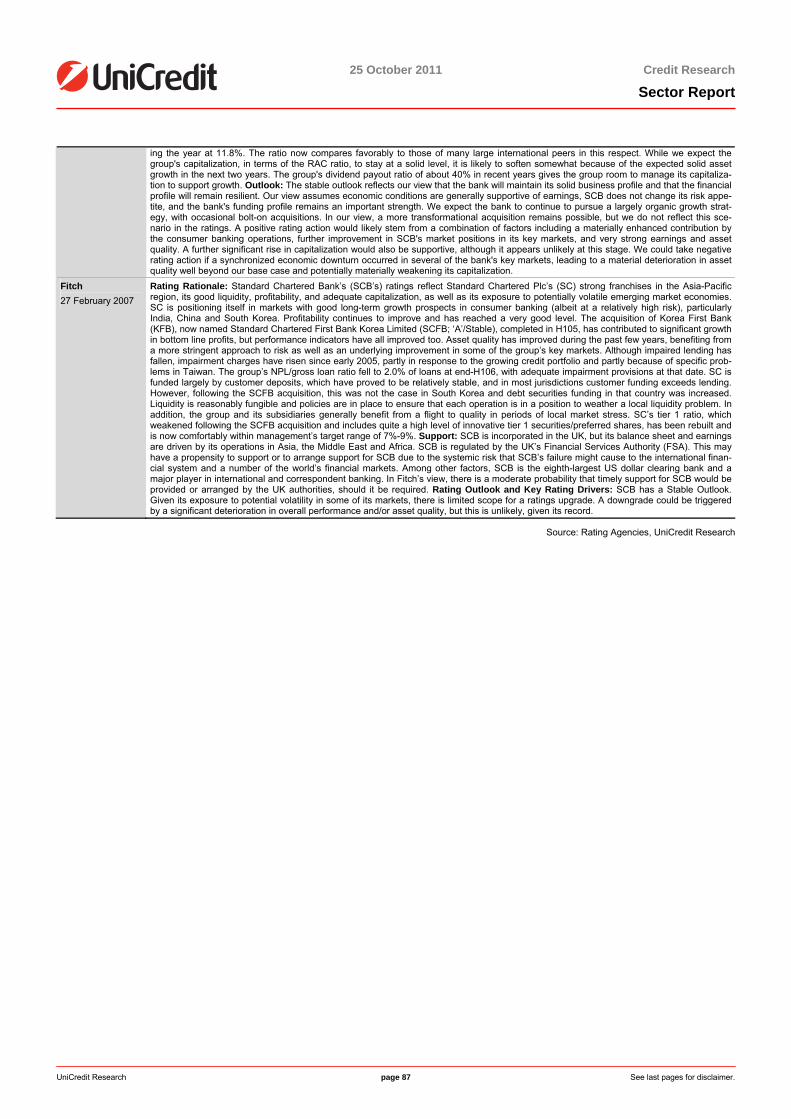
25 October 2011 Credit Research
Sector Report
UniCredit Research page 87 See last pages for disclaimer.
ing the year at 11.8%. The ratio now compares favorably to those of many large international peers in this respect. While we expect the group's capitalization, in terms of the RAC ratio, to stay at a solid level, it is likely to soften somewhat because of the expected solid asset growth in the next two years. The group's dividend payout ratio of about 40% in recent years gives the group room to manage its capitaliza-tion to support growth. Outlook: The stable outlook reflects our view that the bank will maintain its solid business profile and that the financial profile will remain resilient. Our view assumes economic conditions are generally supportive of earnings, SCB does not change its risk appe-tite, and the bank's funding profile remains an important strength. We expect the bank to continue to pursue a largely organic growth strat-egy, with occasional bolt-on acquisitions. In our view, a more transformational acquisition remains possible, but we do not reflect this sce-nario in the ratings. A positive rating action would likely stem from a combination of factors including a materially enhanced contribution by the consumer banking operations, further improvement in SCB's market positions in its key markets, and very strong earnings and asset quality. A further significant rise in capitalization would also be supportive, although it appears unlikely at this stage. We could take negative rating action if a synchronized economic downturn occurred in several of the bank's key markets, leading to a material deterioration in asset quality well beyond our base case and potentially materially weakening its capitalization.
Fitch 27 February 2007
Rating Rationale: Standard Chartered Bank’s (SCB’s) ratings reflect Standard Chartered Plc’s (SC) strong franchises in the Asia-Pacific region, its good liquidity, profitability, and adequate capitalization, as well as its exposure to potentially volatile emerging market economies. SC is positioning itself in markets with good long-term growth prospects in consumer banking (albeit at a relatively high risk), particularly India, China and South Korea. Profitability continues to improve and has reached a very good level. The acquisition of Korea First Bank (KFB), now named Standard Chartered First Bank Korea Limited (SCFB; ‘A’/Stable), completed in H105, has contributed to significant growth in bottom line profits, but performance indicators have all improved too. Asset quality has improved during the past few years, benefiting from a more stringent approach to risk as well as an underlying improvement in some of the group’s key markets. Although impaired lending has fallen, impairment charges have risen since early 2005, partly in response to the growing credit portfolio and partly because of specific prob-lems in Taiwan. The group’s NPL/gross loan ratio fell to 2.0% of loans at end-H106, with adequate impairment provisions at that date. SC is funded largely by customer deposits, which have proved to be relatively stable, and in most jurisdictions customer funding exceeds lending. However, following the SCFB acquisition, this was not the case in South Korea and debt securities funding in that country was increased. Liquidity is reasonably fungible and policies are in place to ensure that each operation is in a position to weather a local liquidity problem. In addition, the group and its subsidiaries generally benefit from a flight to quality in periods of local market stress. SC’s tier 1 ratio, which weakened following the SCFB acquisition and includes quite a high level of innovative tier 1 securities/preferred shares, has been rebuilt and is now comfortably within management’s target range of 7%-9%. Support: SCB is incorporated in the UK, but its balance sheet and earnings are driven by its operations in Asia, the Middle East and Africa. SCB is regulated by the UK’s Financial Services Authority (FSA). This may have a propensity to support or to arrange support for SCB due to the systemic risk that SCB’s failure might cause to the international finan-cial system and a number of the world’s financial markets. Among other factors, SCB is the eighth-largest US dollar clearing bank and a major player in international and correspondent banking. In Fitch’s view, there is a moderate probability that timely support for SCB would be provided or arranged by the UK authorities, should it be required. Rating Outlook and Key Rating Drivers: SCB has a Stable Outlook. Given its exposure to potential volatility in some of its markets, there is limited scope for a ratings upgrade. A downgrade could be triggered by a significant deterioration in overall performance and/or asset quality, but this is unlikely, given its record.
Source: Rating Agencies, UniCredit Research
25 October 2011 Credit Research
Sector Report
UniCredit Research page 88 See last pages for disclaimer.
Yorkshire Building Society Key characteristics Ratings: Baa2s/A-s/A-s Bloomberg: 133535Z LN Bond ticker: YBS www.ybs.co.uk
Yorkshire Building Society (YBS) is the second-largest building society in the UK (total assets of GBP 30bn as of June 2011). It provides a variety of financial products and services such assavings and investment accounts, loans, mortgages and insurance products. YBS' overallobjective is to help its members to buy their own homes and to encourage others to save. Outside its core business, the society acts as an intermediary for various insurance and in-vestments products, and offers support for the implementation of share plans. Yorkshire has 2.6 million members, 178 branches and 90 agencies in the UK. YBS' predecessor companies' roots date back to 1864. Today's YBS is the result of a merger between Huddersfield & Brad-ford and West Yorkshire Building Societies in 1982. Ten years later, YBS merged with Hay-wards Heath Building Society. The latest mergers were with Barnsley Building Society in 2008 and Chelsea Building Society in 2010. Its integration with Chelsea Building Society is at an advanced stage and the migration of the core systems will generate further synergies. In April 2011, Yorkshire announced its merger plan with Norwich and Peterborough Building Society(N&P) and its intent to buy Egg Banking Plc's savings and mortgage book to add scale in theUK retail financial services market. Yorkshire has also widened its high street presence with nine new agencies in 1H11 and extended the online mortgage application process to Chelseamembers. Moreover, Yorkshire has initiated a new market-leading branch-based savings ac-count that combines competitive variable rates with access to funds. Furthermore, YBS has announced that it will wind-down its offshore subsidiary Yorkshire Guernsey Ltd due tochanges in the treatment of offshore deposit-taking subsidiaries.
YBS: SWOT ANALYSIS Strengths/Opportunities Weaknesses/Threats Sound retail funding Questionable systemic support Solid asset quality As a mutual, relatively low profitability Strong capitalization
Source: UniCredit Research
1H11 results and outlook Yorkshire reported a pretax profit of GBP 73.1mn vs. GBP 57.5mn in 1H10 and a core operat-ing profit of GBP 90.2mn vs. GBP 53.2mn in 1H10. Net profit in 1H11 was GBP 52.9mn vs. GBP 46.mn in 1H10. This was driven by net interest income of GBP 171.7mn in 1H11 vs.GBP 111.5mn in 1H10, while non-interest income for the core business rose to GBP 20mn from GBP 18.5mn in 1H10. Fair value adjustments were lower in 1H11 at GBP -4.1mn vs. GBP -5mn in 1H10. However, in contrast to net realized profits in 1H10 of GBP 15mn from thesale of non-mortgage assets, Yorkshire reported a net realized loss of GBP 0.2mn in 1H11. Total statutory income was GBP 188.8mn and GBP 191.5mn for the core business vs. GBP 136.1mn and GBP 145mn respectively in 1H10. Management expenses rose to GBP 86.3mnfrom GBP 72.8mn and the FSCS levy amounted to GBP 2.3mn vs. GBP 1.5mn in 1H10. Loan impairments fell to GBP 15mn from GBP 19mn in 1H10. Asset quality ameliorated with 90+ days loans in arrears by volume standing at 1.80% vs. 1.84% as of 31 December 2010. TheSociety's core Tier-1 ratio stands at 12.7% vs. 12.4% % as of end-2010. Gross mortgage lending doubled to GBP 1.5bn from GBP 718mn in 1H10, leaving total assets stable hoh atGBP 30bn. At GBP 21bn, members’ savings balances were stable compared with GBP 21.4bn as of 31 December 2010, as were the mortgage balances at GBP 23.1bn vs. GBP23.4bn as of end-2010. Thus 99.7% of mortgages are funded by savings balances and re-serves vs. 99.8% as of 31 December 2010. Yorkshire's liquidity ratio rose slightly to 21.7%from 21.1% as of end-2010. Regarding management's outlook, Yorkshire is confident that it is "very well placed to continue to grow and prosper. The merger and acquisition work we have announced in this period is in line with our overall strategy".

25 October 2011 Credit Research
Sector Report
UniCredit Research page 89 See last pages for disclaimer.
YBS' Cover Pool Details EUR 7.5bn covered bond pro-gram
Yorkshire Building Society (YBS) established its covered bond program in 2006, which currently has a program size of EUR 7.5bn. YBS' covered bonds are UK Regulated Cov-ered Bonds, i.e. they fulfill the criteria laid out in the UK covered bond law and are registered with the FSA. The volume of outstanding covered bonds is GBP 2.26bn, and the amount of collateral in the pool is GBP 4.5bn as of August 2011. The cover pool is of high quality andconsists solely of UK owner-occupied residential mortgage assets.
Covered bonds are issued by Yorkshire Building Society and guaranteed by the Covered Bonds LLP
YBS' covered bonds are structured in the typical UK covered bond style. The covered bonds are issued by YBS directly and additionally benefit from a guarantee of Yorkshire Build-ing Society Covered Bonds LLP. The mortgage loans are originated by YBS, which also ser-vices the collateral for the covered bonds. YBS pledges the cover pool assets to YBS Cov-ered Bonds LLP via an equitable assignment. In case of insolvency of the issuer, the coveredbondholders have an unsecured dual claim against the issuer and a secured claim against theportfolio of mortgages held by the LLP.
High quality collateral … … combined with ample over-collateralization
At the end of August 2011, YBS' cover pool consisted of 45,395 mortgage loans with a total balance of GBP 4.50bn. The cover pool is granular and has an average loan balance ofGBP 99,121. The average seasoning is 59 months. Around 24.4% of the mortgages are inter-est only and just 0.2% (or 77 loans) were more than three months in arrears. Fitch assigned a D-Factor of 14.0% to YBS' covered bonds and Moody's collateral score is 5.9%. The amount of credit support is GBP 855mn, leading to a voluntary overcollateralization (OC) of 37.8% ontop of the minimum OC of 37.2% calculated in the Asset Coverage Test (ACT) given a current asset percentage of 72.9%.
Average LTV of 61.4% … … and broad geographic distri-bution … … and good seasoning
The weighted average current indexed LTV is 61.4% (non-indexed LTV 60.8%) and on average significantly below the maximum LTV ratio of 75% given credit in the Asset Coverage Test. About 22% of the cover pool has a very low current indexed LTV of less than 40% and23% of the collateral is within the LTV band of 40% to 60%. About 32% have an LTV of be-tween 60% and 80%, and some 23% exceeds 80%. The mortgage loans with a high LTV areonly given credit up to the 75% maximum loan-to-value ratio. The pool has a broad geo-graphical distribution, with some concentration in Yorkshire and Humberside (21% by value). Greater London contributes 11.6% to the cover pool. The mortgage loans are well seasoned,with almost five years on average (59 months). The portion of new loans with a seasoningbelow one year is 8.9%.
COVER POOL DETAILS
By LTV distribution By regional distribution
0%
2%
4%
6%
8%
10%
12%
14%
<30%
30-3
5%
35-4
0%
40-4
5%
45-5
0%
50-5
5%
55-6
0%
60-6
5%
65-7
0%
70-7
5%
75-8
0%
80-8
5%
85-9
0%
90-9
5%
95-1
00%
>100
%
East Anglia
3.0%Greater London
11.6%
Northern Ireland0.3%
North5.2%
North West14.5%
Scotland10.6%
Other South East
15.5%
South West5.0%
Wales3.8%
West Midlands5.2%
Yorkshire and Humberside
20.5%
East Midlands4.9%
Source: Company Data, UniCredit Research
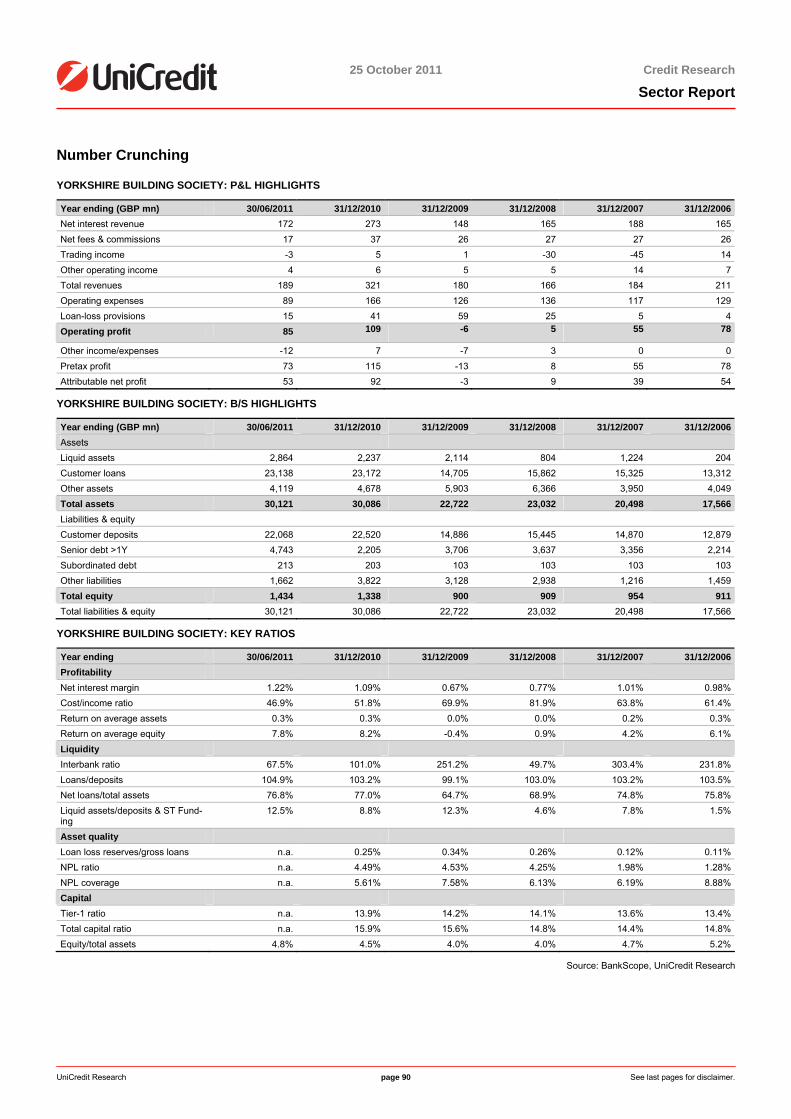
25 October 2011 Credit Research
Sector Report
UniCredit Research page 90 See last pages for disclaimer.
Number Crunching
YORKSHIRE BUILDING SOCIETY: P&L HIGHLIGHTS
Year ending (GBP mn) 30/06/2011 31/12/2010 31/12/2009 31/12/2008 31/12/2007 31/12/2006Net interest revenue 172 273 148 165 188 165Net fees & commissions 17 37 26 27 27 26Trading income -3 5 1 -30 -45 14Other operating income 4 6 5 5 14 7Total revenues 189 321 180 166 184 211Operating expenses 89 166 126 136 117 129Loan-loss provisions 15 41 59 25 5 4Operating profit 85 109 -6 5 55 78
Other income/expenses -12 7 -7 3 0 0Pretax profit 73 115 -13 8 55 78Attributable net profit 53 92 -3 9 39 54
YORKSHIRE BUILDING SOCIETY: B/S HIGHLIGHTS
Year ending (GBP mn) 30/06/2011 31/12/2010 31/12/2009 31/12/2008 31/12/2007 31/12/2006Assets Liquid assets 2,864 2,237 2,114 804 1,224 204Customer loans 23,138 23,172 14,705 15,862 15,325 13,312Other assets 4,119 4,678 5,903 6,366 3,950 4,049Total assets 30,121 30,086 22,722 23,032 20,498 17,566Liabilities & equity Customer deposits 22,068 22,520 14,886 15,445 14,870 12,879Senior debt >1Y 4,743 2,205 3,706 3,637 3,356 2,214Subordinated debt 213 203 103 103 103 103Other liabilities 1,662 3,822 3,128 2,938 1,216 1,459Total equity 1,434 1,338 900 909 954 911Total liabilities & equity 30,121 30,086 22,722 23,032 20,498 17,566
YORKSHIRE BUILDING SOCIETY: KEY RATIOS
Year ending 30/06/2011 31/12/2010 31/12/2009 31/12/2008 31/12/2007 31/12/2006Profitability Net interest margin 1.22% 1.09% 0.67% 0.77% 1.01% 0.98%Cost/income ratio 46.9% 51.8% 69.9% 81.9% 63.8% 61.4%Return on average assets 0.3% 0.3% 0.0% 0.0% 0.2% 0.3%Return on average equity 7.8% 8.2% -0.4% 0.9% 4.2% 6.1%Liquidity Interbank ratio 67.5% 101.0% 251.2% 49.7% 303.4% 231.8%Loans/deposits 104.9% 103.2% 99.1% 103.0% 103.2% 103.5%Net loans/total assets 76.8% 77.0% 64.7% 68.9% 74.8% 75.8%Liquid assets/deposits & ST Fund-ing
12.5% 8.8% 12.3% 4.6% 7.8% 1.5%
Asset quality Loan loss reserves/gross loans n.a. 0.25% 0.34% 0.26% 0.12% 0.11%NPL ratio n.a. 4.49% 4.53% 4.25% 1.98% 1.28%NPL coverage n.a. 5.61% 7.58% 6.13% 6.19% 8.88%Capital Tier-1 ratio n.a. 13.9% 14.2% 14.1% 13.6% 13.4%Total capital ratio n.a. 15.9% 15.6% 14.8% 14.4% 14.8%Equity/total assets 4.8% 4.5% 4.0% 4.0% 4.7% 5.2%
Source: BankScope, UniCredit Research
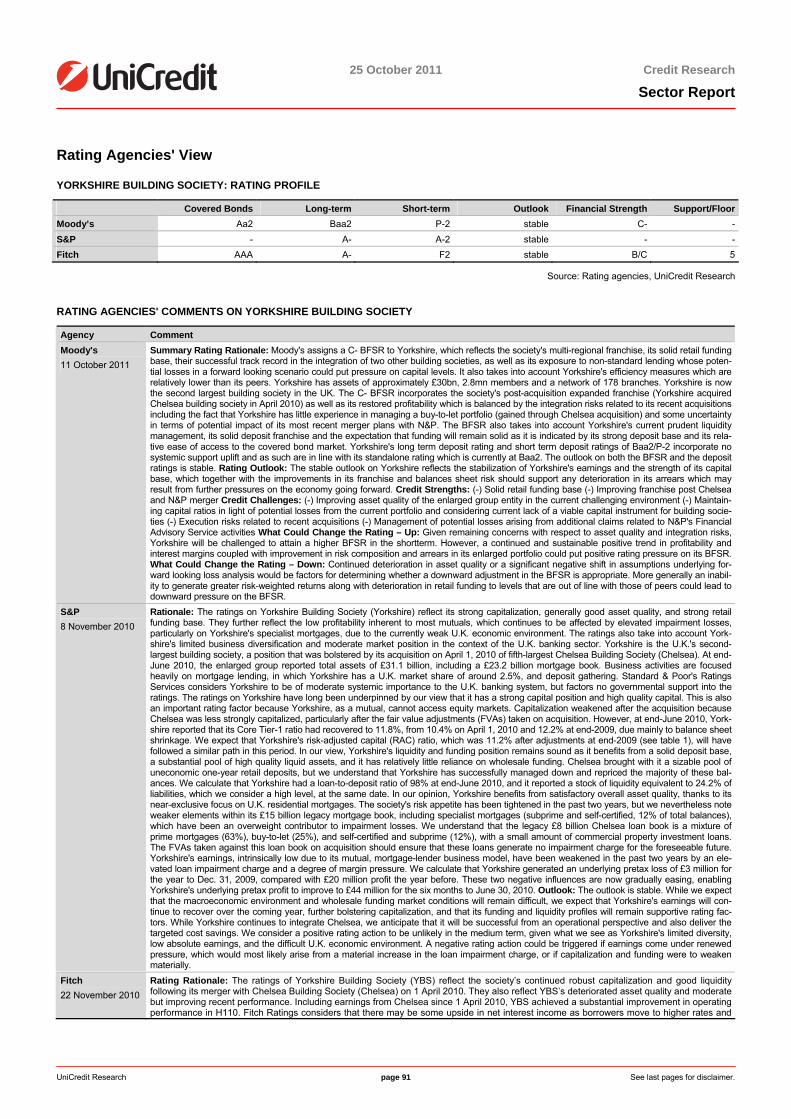
25 October 2011 Credit Research
Sector Report
UniCredit Research page 91 See last pages for disclaimer.
Rating Agencies' View
YORKSHIRE BUILDING SOCIETY: RATING PROFILE
Covered Bonds Long-term Short-term Outlook Financial Strength Support/FloorMoody’s Aa2 Baa2 P-2 stable C- -S&P - A- A-2 stable - -Fitch AAA A- F2 stable B/C 5
Source: Rating agencies, UniCredit Research
RATING AGENCIES' COMMENTS ON YORKSHIRE BUILDING SOCIETY
Agency Comment Moody's 11 October 2011
Summary Rating Rationale: Moody's assigns a C- BFSR to Yorkshire, which reflects the society's multi-regional franchise, its solid retail funding base, their successful track record in the integration of two other building societies, as well as its exposure to non-standard lending whose poten-tial losses in a forward looking scenario could put pressure on capital levels. It also takes into account Yorkshire's efficiency measures which are relatively lower than its peers. Yorkshire has assets of approximately £30bn, 2.8mn members and a network of 178 branches. Yorkshire is now the second largest building society in the UK. The C- BFSR incorporates the society's post-acquisition expanded franchise (Yorkshire acquired Chelsea building society in April 2010) as well as its restored profitability which is balanced by the integration risks related to its recent acquisitions including the fact that Yorkshire has little experience in managing a buy-to-let portfolio (gained through Chelsea acquisition) and some uncertainty in terms of potential impact of its most recent merger plans with N&P. The BFSR also takes into account Yorkshire's current prudent liquidity management, its solid deposit franchise and the expectation that funding will remain solid as it is indicated by its strong deposit base and its rela-tive ease of access to the covered bond market. Yorkshire's long term deposit rating and short term deposit ratings of Baa2/P-2 incorporate no systemic support uplift and as such are in line with its standalone rating which is currently at Baa2. The outlook on both the BFSR and the deposit ratings is stable. Rating Outlook: The stable outlook on Yorkshire reflects the stabilization of Yorkshire's earnings and the strength of its capital base, which together with the improvements in its franchise and balances sheet risk should support any deterioration in its arrears which may result from further pressures on the economy going forward. Credit Strengths: (-) Solid retail funding base (-) Improving franchise post Chelsea and N&P merger Credit Challenges: (-) Improving asset quality of the enlarged group entity in the current challenging environment (-) Maintain-ing capital ratios in light of potential losses from the current portfolio and considering current lack of a viable capital instrument for building socie-ties (-) Execution risks related to recent acquisitions (-) Management of potential losses arising from additional claims related to N&P's Financial Advisory Service activities What Could Change the Rating – Up: Given remaining concerns with respect to asset quality and integration risks, Yorkshire will be challenged to attain a higher BFSR in the shortterm. However, a continued and sustainable positive trend in profitability and interest margins coupled with improvement in risk composition and arrears in its enlarged portfolio could put positive rating pressure on its BFSR. What Could Change the Rating – Down: Continued deterioration in asset quality or a significant negative shift in assumptions underlying for-ward looking loss analysis would be factors for determining whether a downward adjustment in the BFSR is appropriate. More generally an inabil-ity to generate greater risk-weighted returns along with deterioration in retail funding to levels that are out of line with those of peers could lead to downward pressure on the BFSR.
S&P 8 November 2010
Rationale: The ratings on Yorkshire Building Society (Yorkshire) reflect its strong capitalization, generally good asset quality, and strong retail funding base. They further reflect the low profitability inherent to most mutuals, which continues to be affected by elevated impairment losses, particularly on Yorkshire's specialist mortgages, due to the currently weak U.K. economic environment. The ratings also take into account York-shire's limited business diversification and moderate market position in the context of the U.K. banking sector. Yorkshire is the U.K.'s second-largest building society, a position that was bolstered by its acquisition on April 1, 2010 of fifth-largest Chelsea Building Society (Chelsea). At end-June 2010, the enlarged group reported total assets of £31.1 billion, including a £23.2 billion mortgage book. Business activities are focused heavily on mortgage lending, in which Yorkshire has a U.K. market share of around 2.5%, and deposit gathering. Standard & Poor's Ratings Services considers Yorkshire to be of moderate systemic importance to the U.K. banking system, but factors no governmental support into the ratings. The ratings on Yorkshire have long been underpinned by our view that it has a strong capital position and high quality capital. This is also an important rating factor because Yorkshire, as a mutual, cannot access equity markets. Capitalization weakened after the acquisition because Chelsea was less strongly capitalized, particularly after the fair value adjustments (FVAs) taken on acquisition. However, at end-June 2010, York-shire reported that its Core Tier-1 ratio had recovered to 11.8%, from 10.4% on April 1, 2010 and 12.2% at end-2009, due mainly to balance sheet shrinkage. We expect that Yorkshire's risk-adjusted capital (RAC) ratio, which was 11.2% after adjustments at end-2009 (see table 1), will have followed a similar path in this period. In our view, Yorkshire's liquidity and funding position remains sound as it benefits from a solid deposit base, a substantial pool of high quality liquid assets, and it has relatively little reliance on wholesale funding. Chelsea brought with it a sizable pool of uneconomic one-year retail deposits, but we understand that Yorkshire has successfully managed down and repriced the majority of these bal-ances. We calculate that Yorkshire had a loan-to-deposit ratio of 98% at end-June 2010, and it reported a stock of liquidity equivalent to 24.2% of liabilities, which we consider a high level, at the same date. In our opinion, Yorkshire benefits from satisfactory overall asset quality, thanks to its near-exclusive focus on U.K. residential mortgages. The society's risk appetite has been tightened in the past two years, but we nevertheless note weaker elements within its £15 billion legacy mortgage book, including specialist mortgages (subprime and self-certified, 12% of total balances), which have been an overweight contributor to impairment losses. We understand that the legacy £8 billion Chelsea loan book is a mixture of prime mortgages (63%), buy-to-let (25%), and self-certified and subprime (12%), with a small amount of commercial property investment loans. The FVAs taken against this loan book on acquisition should ensure that these loans generate no impairment charge for the foreseeable future. Yorkshire's earnings, intrinsically low due to its mutual, mortgage-lender business model, have been weakened in the past two years by an ele-vated loan impairment charge and a degree of margin pressure. We calculate that Yorkshire generated an underlying pretax loss of £3 million for the year to Dec. 31, 2009, compared with £20 million profit the year before. These two negative influences are now gradually easing, enabling Yorkshire's underlying pretax profit to improve to £44 million for the six months to June 30, 2010. Outlook: The outlook is stable. While we expect that the macroeconomic environment and wholesale funding market conditions will remain difficult, we expect that Yorkshire's earnings will con-tinue to recover over the coming year, further bolstering capitalization, and that its funding and liquidity profiles will remain supportive rating fac-tors. While Yorkshire continues to integrate Chelsea, we anticipate that it will be successful from an operational perspective and also deliver the targeted cost savings. We consider a positive rating action to be unlikely in the medium term, given what we see as Yorkshire's limited diversity, low absolute earnings, and the difficult U.K. economic environment. A negative rating action could be triggered if earnings come under renewed pressure, which would most likely arise from a material increase in the loan impairment charge, or if capitalization and funding were to weaken materially.
Fitch 22 November 2010
Rating Rationale: The ratings of Yorkshire Building Society (YBS) reflect the society’s continued robust capitalization and good liquidity following its merger with Chelsea Building Society (Chelsea) on 1 April 2010. They also reflect YBS’s deteriorated asset quality and moderate but improving recent performance. Including earnings from Chelsea since 1 April 2010, YBS achieved a substantial improvement in operating performance in H110. Fitch Ratings considers that there may be some upside in net interest income as borrowers move to higher rates and
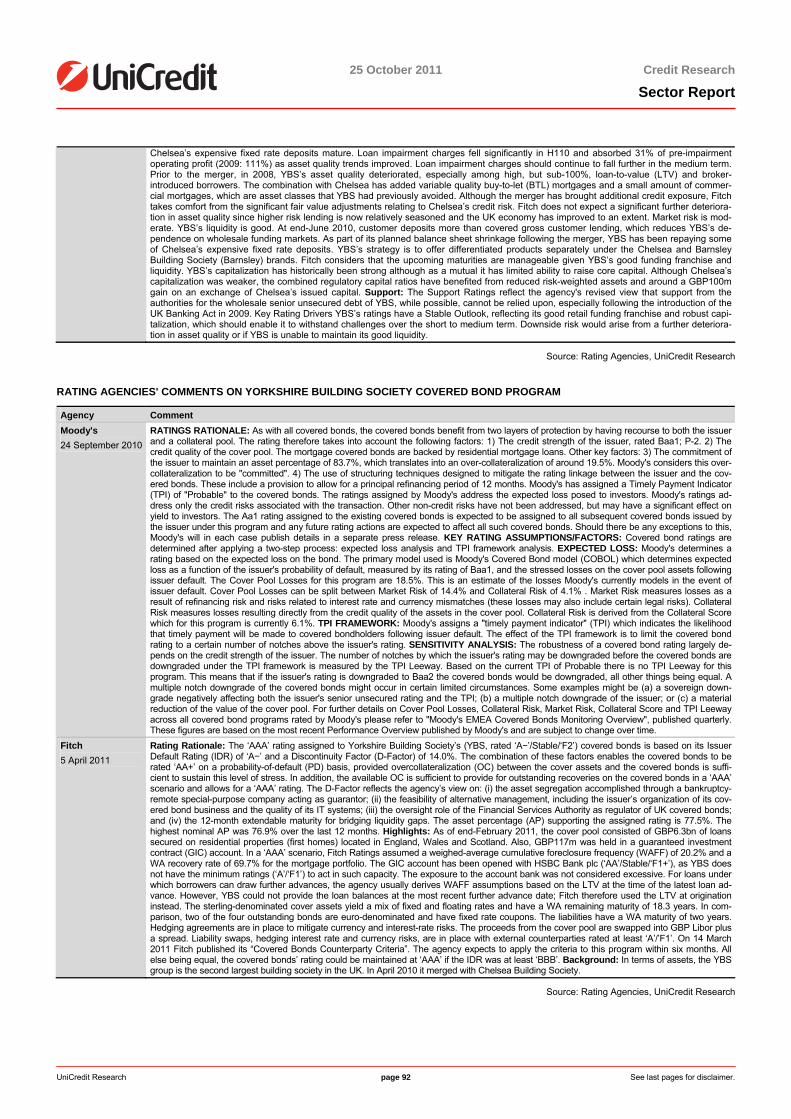
25 October 2011 Credit Research
Sector Report
UniCredit Research page 92 See last pages for disclaimer.
Chelsea’s expensive fixed rate deposits mature. Loan impairment charges fell significantly in H110 and absorbed 31% of pre-impairment operating profit (2009: 111%) as asset quality trends improved. Loan impairment charges should continue to fall further in the medium term. Prior to the merger, in 2008, YBS’s asset quality deteriorated, especially among high, but sub-100%, loan-to-value (LTV) and broker-introduced borrowers. The combination with Chelsea has added variable quality buy-to-let (BTL) mortgages and a small amount of commer-cial mortgages, which are asset classes that YBS had previously avoided. Although the merger has brought additional credit exposure, Fitch takes comfort from the significant fair value adjustments relating to Chelsea’s credit risk. Fitch does not expect a significant further deteriora-tion in asset quality since higher risk lending is now relatively seasoned and the UK economy has improved to an extent. Market risk is mod-erate. YBS’s liquidity is good. At end-June 2010, customer deposits more than covered gross customer lending, which reduces YBS’s de-pendence on wholesale funding markets. As part of its planned balance sheet shrinkage following the merger, YBS has been repaying some of Chelsea’s expensive fixed rate deposits. YBS’s strategy is to offer differentiated products separately under the Chelsea and Barnsley Building Society (Barnsley) brands. Fitch considers that the upcoming maturities are manageable given YBS’s good funding franchise and liquidity. YBS’s capitalization has historically been strong although as a mutual it has limited ability to raise core capital. Although Chelsea’s capitalization was weaker, the combined regulatory capital ratios have benefited from reduced risk-weighted assets and around a GBP100m gain on an exchange of Chelsea’s issued capital. Support: The Support Ratings reflect the agency's revised view that support from the authorities for the wholesale senior unsecured debt of YBS, while possible, cannot be relied upon, especially following the introduction of the UK Banking Act in 2009. Key Rating Drivers YBS’s ratings have a Stable Outlook, reflecting its good retail funding franchise and robust capi-talization, which should enable it to withstand challenges over the short to medium term. Downside risk would arise from a further deteriora-tion in asset quality or if YBS is unable to maintain its good liquidity.
Source: Rating Agencies, UniCredit Research
RATING AGENCIES' COMMENTS ON YORKSHIRE BUILDING SOCIETY COVERED BOND PROGRAM
Agency Comment Moody's 24 September 2010
RATINGS RATIONALE: As with all covered bonds, the covered bonds benefit from two layers of protection by having recourse to both the issuer and a collateral pool. The rating therefore takes into account the following factors: 1) The credit strength of the issuer, rated Baa1; P-2. 2) The credit quality of the cover pool. The mortgage covered bonds are backed by residential mortgage loans. Other key factors: 3) The commitment of the issuer to maintain an asset percentage of 83.7%, which translates into an over-collateralization of around 19.5%. Moody's considers this over-collateralization to be "committed". 4) The use of structuring techniques designed to mitigate the rating linkage between the issuer and the cov-ered bonds. These include a provision to allow for a principal refinancing period of 12 months. Moody's has assigned a Timely Payment Indicator (TPI) of "Probable" to the covered bonds. The ratings assigned by Moody's address the expected loss posed to investors. Moody's ratings ad-dress only the credit risks associated with the transaction. Other non-credit risks have not been addressed, but may have a significant effect on yield to investors. The Aa1 rating assigned to the existing covered bonds is expected to be assigned to all subsequent covered bonds issued by the issuer under this program and any future rating actions are expected to affect all such covered bonds. Should there be any exceptions to this, Moody's will in each case publish details in a separate press release. KEY RATING ASSUMPTIONS/FACTORS: Covered bond ratings are determined after applying a two-step process: expected loss analysis and TPI framework analysis. EXPECTED LOSS: Moody's determines a rating based on the expected loss on the bond. The primary model used is Moody's Covered Bond model (COBOL) which determines expected loss as a function of the issuer's probability of default, measured by its rating of Baa1, and the stressed losses on the cover pool assets following issuer default. The Cover Pool Losses for this program are 18.5%. This is an estimate of the losses Moody's currently models in the event of issuer default. Cover Pool Losses can be split between Market Risk of 14.4% and Collateral Risk of 4.1% . Market Risk measures losses as a result of refinancing risk and risks related to interest rate and currency mismatches (these losses may also include certain legal risks). Collateral Risk measures losses resulting directly from the credit quality of the assets in the cover pool. Collateral Risk is derived from the Collateral Score which for this program is currently 6.1%. TPI FRAMEWORK: Moody's assigns a "timely payment indicator" (TPI) which indicates the likelihood that timely payment will be made to covered bondholders following issuer default. The effect of the TPI framework is to limit the covered bond rating to a certain number of notches above the issuer's rating. SENSITIVITY ANALYSIS: The robustness of a covered bond rating largely de-pends on the credit strength of the issuer. The number of notches by which the issuer's rating may be downgraded before the covered bonds are downgraded under the TPI framework is measured by the TPI Leeway. Based on the current TPI of Probable there is no TPI Leeway for this program. This means that if the issuer's rating is downgraded to Baa2 the covered bonds would be downgraded, all other things being equal. A multiple notch downgrade of the covered bonds might occur in certain limited circumstances. Some examples might be (a) a sovereign down-grade negatively affecting both the issuer's senior unsecured rating and the TPI; (b) a multiple notch downgrade of the issuer; or (c) a material reduction of the value of the cover pool. For further details on Cover Pool Losses, Collateral Risk, Market Risk, Collateral Score and TPI Leeway across all covered bond programs rated by Moody's please refer to "Moody's EMEA Covered Bonds Monitoring Overview", published quarterly. These figures are based on the most recent Performance Overview published by Moody's and are subject to change over time.
Fitch 5 April 2011
Rating Rationale: The ‘AAA’ rating assigned to Yorkshire Building Society’s (YBS, rated ‘A−’/Stable/‘F2’) covered bonds is based on its Issuer Default Rating (IDR) of ‘A−’ and a Discontinuity Factor (D-Factor) of 14.0%. The combination of these factors enables the covered bonds to be rated ‘AA+’ on a probability-of-default (PD) basis, provided overcollateralization (OC) between the cover assets and the covered bonds is suffi-cient to sustain this level of stress. In addition, the available OC is sufficient to provide for outstanding recoveries on the covered bonds in a ‘AAA’ scenario and allows for a ‘AAA’ rating. The D-Factor reflects the agency’s view on: (i) the asset segregation accomplished through a bankruptcy-remote special-purpose company acting as guarantor; (ii) the feasibility of alternative management, including the issuer’s organization of its cov-ered bond business and the quality of its IT systems; (iii) the oversight role of the Financial Services Authority as regulator of UK covered bonds; and (iv) the 12-month extendable maturity for bridging liquidity gaps. The asset percentage (AP) supporting the assigned rating is 77.5%. The highest nominal AP was 76.9% over the last 12 months. Highlights: As of end-February 2011, the cover pool consisted of GBP6.3bn of loans secured on residential properties (first homes) located in England, Wales and Scotland. Also, GBP117m was held in a guaranteed investment contract (GIC) account. In a ‘AAA’ scenario, Fitch Ratings assumed a weighed-average cumulative foreclosure frequency (WAFF) of 20.2% and a WA recovery rate of 69.7% for the mortgage portfolio. The GIC account has been opened with HSBC Bank plc (‘AA’/Stable/‘F1+’), as YBS does not have the minimum ratings (‘A’/‘F1’) to act in such capacity. The exposure to the account bank was not considered excessive. For loans under which borrowers can draw further advances, the agency usually derives WAFF assumptions based on the LTV at the time of the latest loan ad-vance. However, YBS could not provide the loan balances at the most recent further advance date; Fitch therefore used the LTV at origination instead. The sterling-denominated cover assets yield a mix of fixed and floating rates and have a WA remaining maturity of 18.3 years. In com-parison, two of the four outstanding bonds are euro-denominated and have fixed rate coupons. The liabilities have a WA maturity of two years. Hedging agreements are in place to mitigate currency and interest-rate risks. The proceeds from the cover pool are swapped into GBP Libor plus a spread. Liability swaps, hedging interest rate and currency risks, are in place with external counterparties rated at least ‘A’/’F1’. On 14 March 2011 Fitch published its “Covered Bonds Counterparty Criteria”. The agency expects to apply the criteria to this program within six months. All else being equal, the covered bonds’ rating could be maintained at ‘AAA’ if the IDR was at least ‘BBB’. Background: In terms of assets, the YBS group is the second largest building society in the UK. In April 2010 it merged with Chelsea Building Society.
Source: Rating Agencies, UniCredit Research
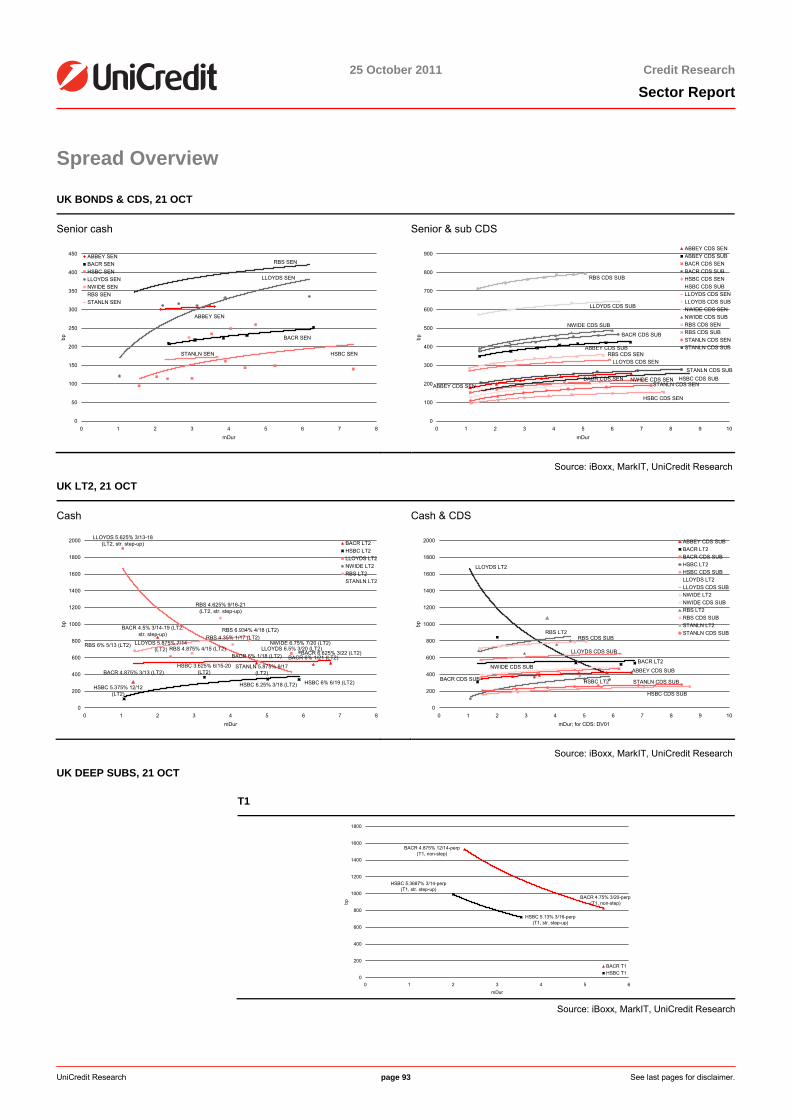
25 October 2011 Credit Research
Sector Report
UniCredit Research page 93 See last pages for disclaimer.
Spread Overview
UK BONDS & CDS, 21 OCT
Senior cash Senior & sub CDS
ABBEY SEN
BACR SEN
HSBC SEN
LLOYDS SEN
RBS SEN
STANLN SEN
0
50
100
150
200
250
300
350
400
450
0 1 2 3 4 5 6 7 8mDur
bp
ABBEY SENBACR SENHSBC SENLLOYDS SENNWIDE SENRBS SENSTANLN SEN
ABBEY CDS SEN
ABBEY CDS SUB
BACR CDS SEN
BACR CDS SUB
HSBC CDS SEN
HSBC CDS SUB
LLOYDS CDS SEN
LLOYDS CDS SUB
NWIDE CDS SEN
NWIDE CDS SUB
RBS CDS SEN
RBS CDS SUB
STANLN CDS SEN
STANLN CDS SUB
0
100
200
300
400
500
600
700
800
900
0 1 2 3 4 5 6 7 8 9 10mDur
bp
ABBEY CDS SENABBEY CDS SUBBACR CDS SENBACR CDS SUBHSBC CDS SENHSBC CDS SUBLLOYDS CDS SENLLOYDS CDS SUBNWIDE CDS SENNWIDE CDS SUBRBS CDS SENRBS CDS SUBSTANLN CDS SENSTANLN CDS SUB
Source: iBoxx, MarkIT, UniCredit Research
UK LT2, 21 OCT
Cash Cash & CDS
BACR 6.625% 3/22 (LT2)BACR 6% 1/21 (LT2)
BACR 4.5% 3/14-19 (LT2, str. step-up)
BACR 6% 1/18 (LT2)
BACR 4.875% 3/13 (LT2)HSBC 3.625% 6/15-20
(LT2)
HSBC 6% 6/19 (LT2)HSBC 6.25% 3/18 (LT2)HSBC 5.375% 12/12 (LT2)
LLOYDS 6.5% 3/20 (LT2)LLOYDS 5.875% 7/14
(LT2)
LLOYDS 5.625% 3/13-18 (LT2, str. step-up)
NWIDE 6.75% 7/20 (LT2)
RBS 4.625% 9/16-21 (LT2, str. step-up)
RBS 6.934% 4/18 (LT2)RBS 4.35% 1/17 (LT2)
RBS 4.875% 4/15 (LT2)RBS 6% 5/13 (LT2)
STANLN 5.875% 9/17 (LT2)
0
200
400
600
800
1000
1200
1400
1600
1800
2000
0 1 2 3 4 5 6 7 8mDur
bp
BACR LT2HSBC LT2LLOYDS LT2NWIDE LT2RBS LT2STANLN LT2
ABBEY CDS SUB
BACR LT2
BACR CDS SUB HSBC LT2
HSBC CDS SUB
LLOYDS LT2
LLOYDS CDS SUB
NWIDE CDS SUB
RBS LT2RBS CDS SUB
STANLN CDS SUB
0
200
400
600
800
1000
1200
1400
1600
1800
2000
0 1 2 3 4 5 6 7 8 9 10mDur; for CDS: DV01
bp
ABBEY CDS SUBBACR LT2BACR CDS SUBHSBC LT2HSBC CDS SUBLLOYDS LT2LLOYDS CDS SUBNWIDE LT2NWIDE CDS SUBRBS LT2RBS CDS SUBSTANLN LT2STANLN CDS SUB
Source: iBoxx, MarkIT, UniCredit Research
UK DEEP SUBS, 21 OCT
T1
BACR 4.75% 3/20-perp (T1, non-step)
BACR 4.875% 12/14-perp (T1, non-step)
HSBC 5.13% 3/16-perp (T1, str. step-up)
HSBC 5.3687% 3/14-perp (T1, str. step-up)
0
200
400
600
800
1000
1200
1400
1600
1800
0 1 2 3 4 5 6mDur
bp
BACR T1HSBC T1
Source: iBoxx, MarkIT, UniCredit Research
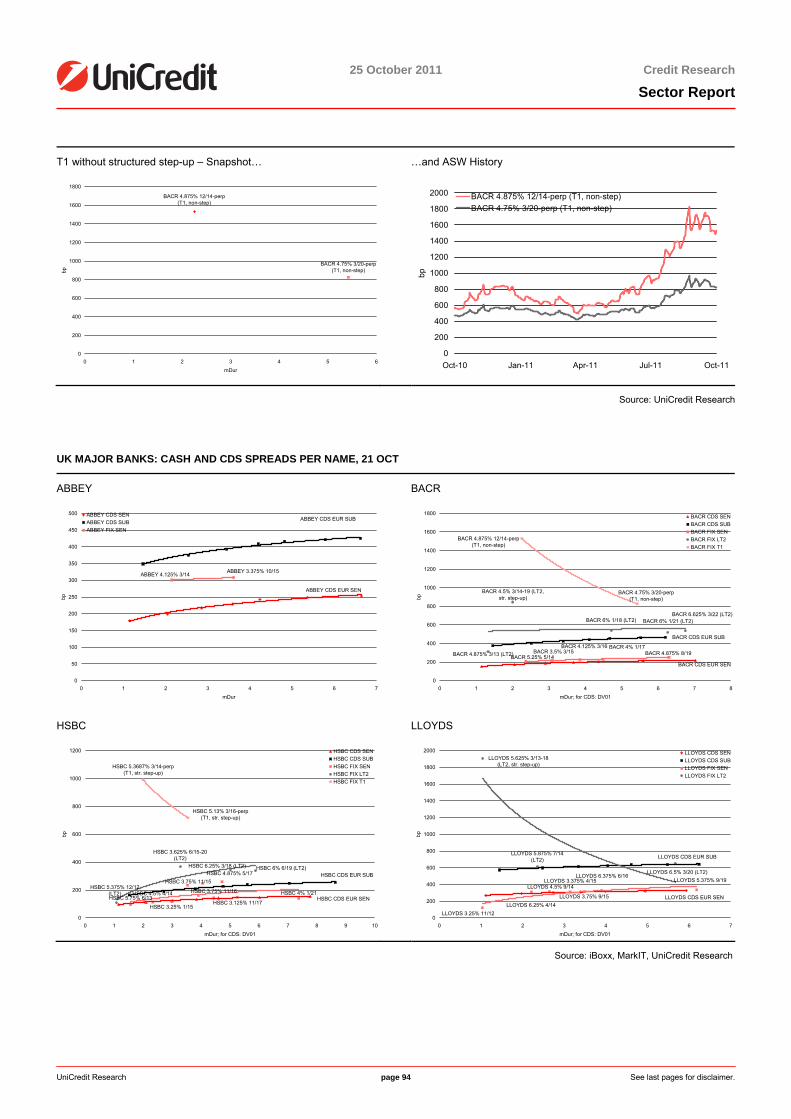
25 October 2011 Credit Research
Sector Report
UniCredit Research page 94 See last pages for disclaimer.
T1 without structured step-up – Snapshot… …and ASW History
BACR 4.875% 12/14-perp (T1, non-step)
BACR 4.75% 3/20-perp (T1, non-step)
0
200
400
600
800
1000
1200
1400
1600
1800
0 1 2 3 4 5 6mDur
bp
0
200
400
600
800
1000
1200
1400
1600
1800
2000
Oct-10 Jan-11 Apr-11 Jul-11 Oct-11
bp
BACR 4.875% 12/14-perp (T1, non-step)BACR 4.75% 3/20-perp (T1, non-step)
Source: UniCredit Research
UK MAJOR BANKS: CASH AND CDS SPREADS PER NAME, 21 OCT
ABBEY BACR
ABBEY 4.125% 3/14 ABBEY 3.375% 10/15
0
50
100
150
200
250
300
350
400
450
500
0 1 2 3 4 5 6 7mDur
bp
ABBEY CDS SENABBEY CDS SUBABBEY FIX SEN
ABBEY CDS EUR SEN
ABBEY CDS EUR SUB
BACR 5.25% 5/14BACR 3.5% 3/15
BACR 4.125% 3/16 BACR 4% 1/17BACR 4.875% 8/19BACR 4.875% 3/13 (LT2)
BACR 6% 1/18 (LT2)
BACR 4.5% 3/14-19 (LT2, str. step-up)
BACR 6% 1/21 (LT2)BACR 6.625% 3/22 (LT2)
BACR 4.875% 12/14-perp (T1, non-step)
BACR 4.75% 3/20-perp (T1, non-step)
0
200
400
600
800
1000
1200
1400
1600
1800
0 1 2 3 4 5 6 7 8mDur; for CDS: DV01
bp
BACR CDS SENBACR CDS SUBBACR FIX SENBACR FIX LT2BACR FIX T1
BACR CDS EUR SEN
BACR CDS EUR SUB
HSBC LLOYDS
HSBC 4% 1/21
HSBC 3.125% 11/17
HSBC 4.875% 5/17
HSBC 3.75% 11/16
HSBC 3.75% 11/15
HSBC 3.25% 1/15
HSBC 4.5% 4/14HSBC 5.75% 6/13
HSBC 3.625% 6/15-20 (LT2)
HSBC 6% 6/19 (LT2)HSBC 6.25% 3/18 (LT2)
HSBC 5.375% 12/12 (LT2)
HSBC 5.13% 3/16-perp (T1, str. step-up)
HSBC 5.3687% 3/14-perp (T1, str. step-up)
0
200
400
600
800
1000
1200
0 1 2 3 4 5 6 7 8 9 10mDur; for CDS: DV01
bp
HSBC CDS SENHSBC CDS SUBHSBC FIX SENHSBC FIX LT2HSBC FIX T1
HSBC CDS EUR SEN
HSBC CDS EUR SUB
LLOYDS 3.25% 11/12LLOYDS 6.25% 4/14
LLOYDS 4.5% 9/14LLOYDS 3.375% 4/15
LLOYDS 3.75% 9/15
LLOYDS 6.375% 6/16LLOYDS 5.375% 9/19
LLOYDS 5.625% 3/13-18 (LT2, str. step-up)
LLOYDS 5.875% 7/14 (LT2)
LLOYDS 6.5% 3/20 (LT2)
0
200
400
600
800
1000
1200
1400
1600
1800
2000
0 1 2 3 4 5 6 7mDur; for CDS: DV01
bp
LLOYDS CDS SENLLOYDS CDS SUBLLOYDS FIX SENLLOYDS FIX LT2
LLOYDS CDS EUR SEN
LLOYDS CDS EUR SUB
Source: iBoxx, MarkIT, UniCredit Research
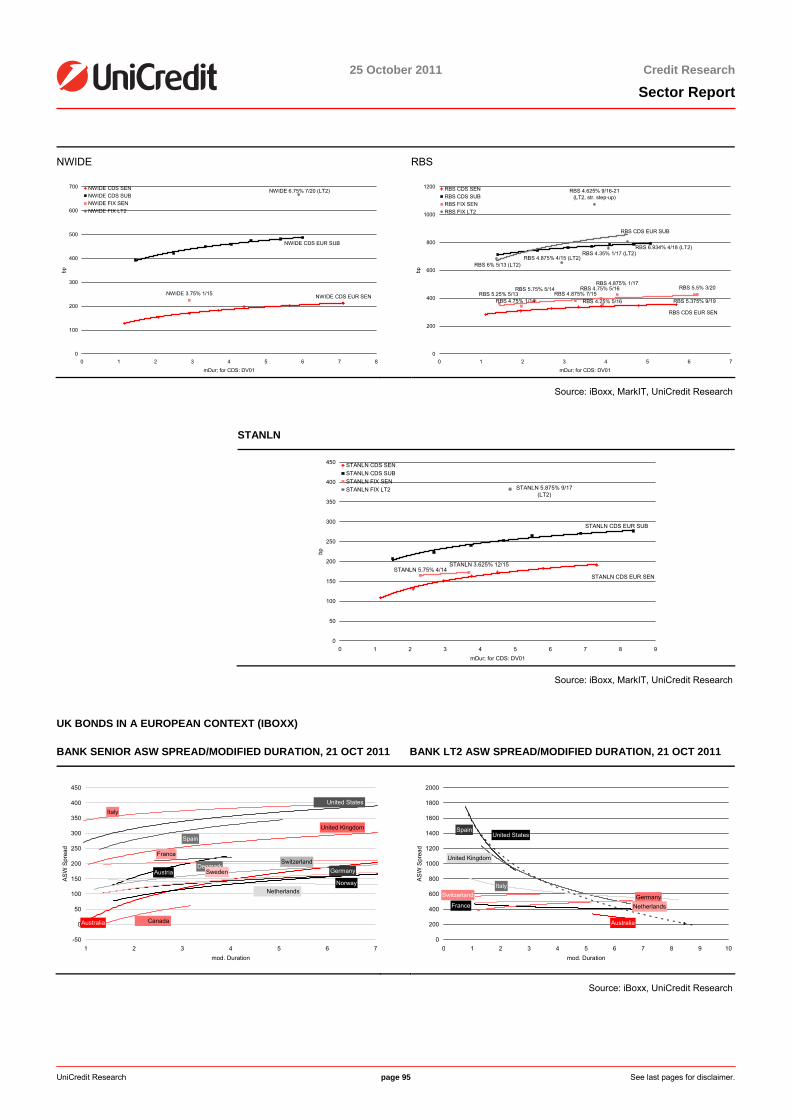
25 October 2011 Credit Research
Sector Report
UniCredit Research page 95 See last pages for disclaimer.
NWIDE RBS
NWIDE 3.75% 1/15
NWIDE 6.75% 7/20 (LT2)
0
100
200
300
400
500
600
700
0 1 2 3 4 5 6 7 8mDur; for CDS: DV01
bp
NWIDE CDS SENNWIDE CDS SUBNWIDE FIX SENNWIDE FIX LT2
NWIDE CDS EUR SEN
NWIDE CDS EUR SUB
RBS 5.25% 5/13RBS 4.75% 1/14
RBS 5.75% 5/14RBS 4.875% 7/15
RBS 4.25% 5/16
RBS 4.75% 5/16RBS 4.875% 1/17
RBS 5.375% 9/19
RBS 5.5% 3/20
RBS 6% 5/13 (LT2)RBS 4.875% 4/15 (LT2)
RBS 4.35% 1/17 (LT2)RBS 6.934% 4/18 (LT2)
RBS 4.625% 9/16-21 (LT2, str. step-up)
0
200
400
600
800
1000
1200
0 1 2 3 4 5 6 7mDur; for CDS: DV01
bp
RBS CDS SENRBS CDS SUBRBS FIX SENRBS FIX LT2
RBS CDS EUR SEN
RBS CDS EUR SUB
Source: iBoxx, MarkIT, UniCredit Research
STANLN
STANLN 3.625% 12/15STANLN 5.75% 4/14
STANLN 5.875% 9/17 (LT2)
0
50
100
150
200
250
300
350
400
450
0 1 2 3 4 5 6 7 8 9mDur; for CDS: DV01
bp
STANLN CDS SENSTANLN CDS SUBSTANLN FIX SENSTANLN FIX LT2
STANLN CDS EUR SEN
STANLN CDS EUR SUB
Source: iBoxx, MarkIT, UniCredit Research
UK BONDS IN A EUROPEAN CONTEXT (IBOXX)
BANK SENIOR ASW SPREAD/MODIFIED DURATION, 21 OCT 2011 BANK LT2 ASW SPREAD/MODIFIED DURATION, 21 OCT 2011
Australia
Austria
Canada
Denmark
France
Germany
Italy
NetherlandsNorway
Spain
Sweden
Switzerland
United Kingdom
United States
-50
0
50
100
150
200
250
300
350
400
450
1 2 3 4 5 6 7mod. Duration
ASW
Spr
ead
Australia
FranceGermany
Italy
Netherlands
Spain
Switzerland
United Kingdom
United States
0
200
400
600
800
1000
1200
1400
1600
1800
2000
0 1 2 3 4 5 6 7 8 9 10mod. Duration
ASW
Spr
ead
Source: iBoxx, UniCredit Research
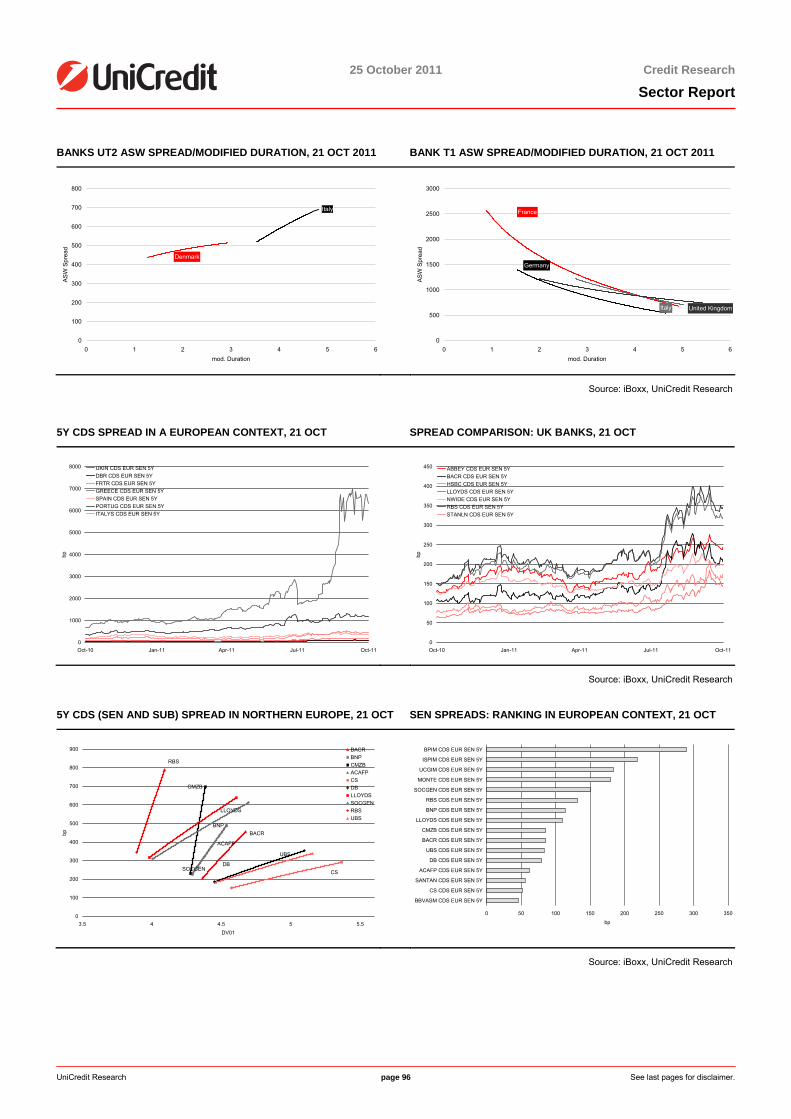
25 October 2011 Credit Research
Sector Report
UniCredit Research page 96 See last pages for disclaimer.
BANKS UT2 ASW SPREAD/MODIFIED DURATION, 21 OCT 2011 BANK T1 ASW SPREAD/MODIFIED DURATION, 21 OCT 2011
Denmark
Italy
0
100
200
300
400
500
600
700
800
0 1 2 3 4 5 6mod. Duration
ASW
Spr
ead
France
Germany
Italy United Kingdom
0
500
1000
1500
2000
2500
3000
0 1 2 3 4 5 6mod. Duration
ASW
Spr
ead
Source: iBoxx, UniCredit Research
5Y CDS SPREAD IN A EUROPEAN CONTEXT, 21 OCT SPREAD COMPARISON: UK BANKS, 21 OCT
0
1000
2000
3000
4000
5000
6000
7000
8000
Oct-10 Jan-11 Apr-11 Jul-11 Oct-11
bp
UKIN CDS EUR SEN 5YDBR CDS EUR SEN 5YFRTR CDS EUR SEN 5YGREECE CDS EUR SEN 5YSPAIN CDS EUR SEN 5YPORTUG CDS EUR SEN 5YITALYS CDS EUR SEN 5Y
0
50
100
150
200
250
300
350
400
450
Oct-10 Jan-11 Apr-11 Jul-11 Oct-11
bp
ABBEY CDS EUR SEN 5YBACR CDS EUR SEN 5YHSBC CDS EUR SEN 5YLLOYDS CDS EUR SEN 5YNWIDE CDS EUR SEN 5YRBS CDS EUR SEN 5YSTANLN CDS EUR SEN 5Y
Source: iBoxx, UniCredit Research
5Y CDS (SEN AND SUB) SPREAD IN NORTHERN EUROPE, 21 OCT SEN SPREADS: RANKING IN EUROPEAN CONTEXT, 21 OCT
BACRBNP
CMZB
ACAFP
CSDB
LLOYDS
SOCGEN
RBS
UBS
0
100
200
300
400
500
600
700
800
900
3.5 4 4.5 5 5.5DV01
bp
BACRBNPCMZBACAFPCSDBLLOYDSSOCGENRBSUBS
0 50 100 150 200 250 300 350
BBVASM CDS EUR SEN 5Y
CS CDS EUR SEN 5Y
SANTAN CDS EUR SEN 5Y
ACAFP CDS EUR SEN 5Y
DB CDS EUR SEN 5Y
UBS CDS EUR SEN 5Y
BACR CDS EUR SEN 5Y
CMZB CDS EUR SEN 5Y
LLOYDS CDS EUR SEN 5Y
BNP CDS EUR SEN 5Y
RBS CDS EUR SEN 5Y
SOCGEN CDS EUR SEN 5Y
MONTE CDS EUR SEN 5Y
UCGIM CDS EUR SEN 5Y
ISPIM CDS EUR SEN 5Y
BPIM CDS EUR SEN 5Y
bp
Source: iBoxx, UniCredit Research
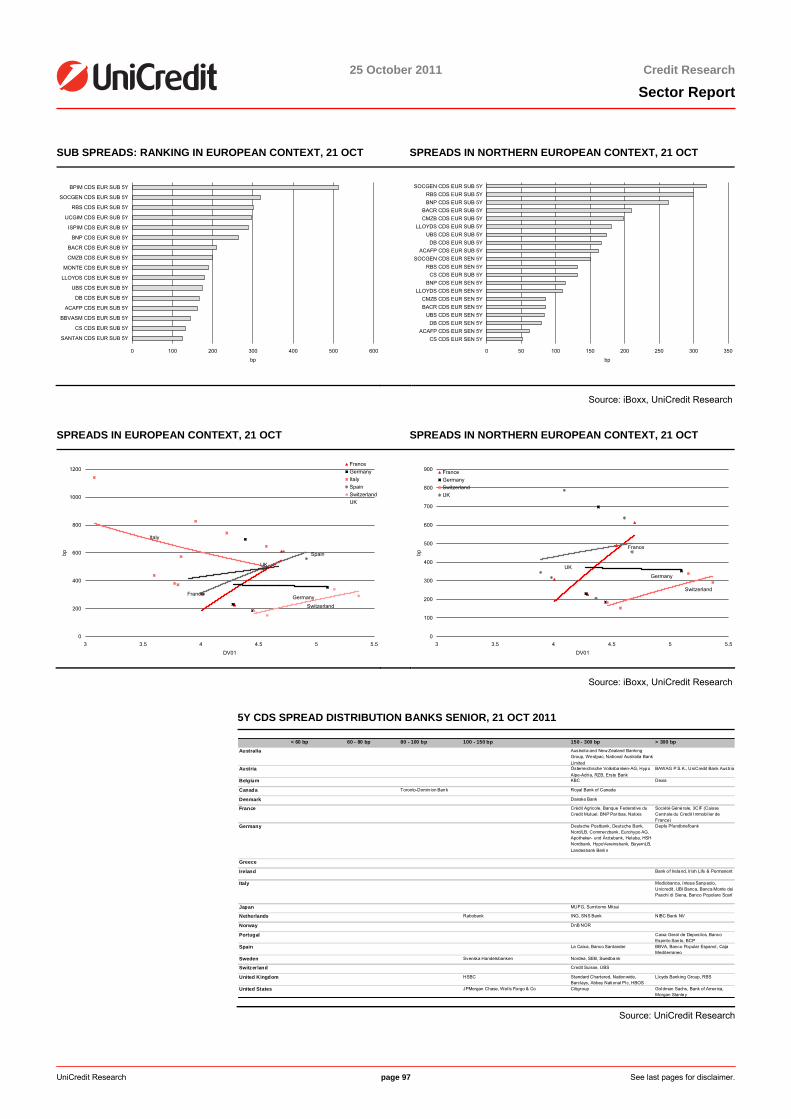
25 October 2011 Credit Research
Sector Report
UniCredit Research page 97 See last pages for disclaimer.
SUB SPREADS: RANKING IN EUROPEAN CONTEXT, 21 OCT SPREADS IN NORTHERN EUROPEAN CONTEXT, 21 OCT
0 100 200 300 400 500 600
SANTAN CDS EUR SUB 5Y
CS CDS EUR SUB 5Y
BBVASM CDS EUR SUB 5Y
ACAFP CDS EUR SUB 5Y
DB CDS EUR SUB 5Y
UBS CDS EUR SUB 5Y
LLOYDS CDS EUR SUB 5Y
MONTE CDS EUR SUB 5Y
CMZB CDS EUR SUB 5Y
BACR CDS EUR SUB 5Y
BNP CDS EUR SUB 5Y
ISPIM CDS EUR SUB 5Y
UCGIM CDS EUR SUB 5Y
RBS CDS EUR SUB 5Y
SOCGEN CDS EUR SUB 5Y
BPIM CDS EUR SUB 5Y
bp
0 50 100 150 200 250 300 350
CS CDS EUR SEN 5YACAFP CDS EUR SEN 5Y
DB CDS EUR SEN 5YUBS CDS EUR SEN 5Y
BACR CDS EUR SEN 5YCMZB CDS EUR SEN 5Y
LLOYDS CDS EUR SEN 5YBNP CDS EUR SEN 5Y
CS CDS EUR SUB 5YRBS CDS EUR SEN 5Y
SOCGEN CDS EUR SEN 5YACAFP CDS EUR SUB 5Y
DB CDS EUR SUB 5YUBS CDS EUR SUB 5Y
LLOYDS CDS EUR SUB 5YCMZB CDS EUR SUB 5YBACR CDS EUR SUB 5Y
BNP CDS EUR SUB 5YRBS CDS EUR SUB 5Y
SOCGEN CDS EUR SUB 5Y
bp
Source: iBoxx, UniCredit Research
SPREADS IN EUROPEAN CONTEXT, 21 OCT SPREADS IN NORTHERN EUROPEAN CONTEXT, 21 OCT
FranceGermany
Italy
Spain
Switzerland
UK
0
200
400
600
800
1000
1200
3 3.5 4 4.5 5 5.5DV01
bp
FranceGermanyItalySpainSwitzerlandUK
France
Germany
Switzerland
UK
0
100
200
300
400
500
600
700
800
900
3 3.5 4 4.5 5 5.5DV01
bp
FranceGermanySwitzerlandUK
Source: iBoxx, UniCredit Research
5Y CDS SPREAD DISTRIBUTION BANKS SENIOR, 21 OCT 2011
< 60 bp 60 - 80 bp 80 - 100 bp 100 - 150 bp 150 - 300 bp > 300 bp
Australia Australia and New Zealand Banking Group, Westpac, National Australia Bank Limited
Austria Österreichische Volksbanken-AG, Hypo Alpe-Adria, RZB, Erste Bank
BAWAG P.S.K., UniCredit Bank Austr ia
Belgium KBC Dexia
Canada Toronto-Domin ion Bank Royal Bank of Canada
Denmark Danske Bank
France Crédit Agricole, Banque Federative du Credit Mutuel, BNP Par ibas, Natixis
Société Générale, 3CIF (Caisse Centrale du Credit Immobil ier de France)
Germany Deutsche Postbank, Deutsche Bank, Nord/LB, Commerzbank, Eurohypo AG, Apotheker- und Ärztebank, Helaba, HSH Nordbank, HypoVereinsbank, BayernLB, Landesbank Berlin
Depfa Pfandbriefbank
Greece
Ireland Bank of Ireland, Iri sh Life & Permanent
Italy Mediobanca, Intesa Sanpaolo, Unicredit, UBI Banca, Banca Monte dei Paschi di Siena, Banco Popolare Scarl
Japan MUFG, Sumitomo Mitsui
Netherlands Rabobank ING, SNS Bank NIBC Bank NV
Norway DnB NOR
Portugal Caixa Geral de Depositos, Banco Espirito Santo, BCP
Spain La Caixa, Banco Santander BBVA, Banco Popular Espanol, Caja Mediterraneo
Sweden Svenska Handelsbanken Nordea, SEB, Swedbank
Switzerland Credit Suisse, UBS
United Kingdom HSBC Standard Chartered, Nationwide, Barclays, Abbey National Plc, HBOS
Lloyds Banking Group, RBS
United States JPMorgan Chase, Wel ls Fargo & Co Citigroup Goldman Sachs, Bank of Amer ica, Morgan Stanley
Source: UniCredit Research
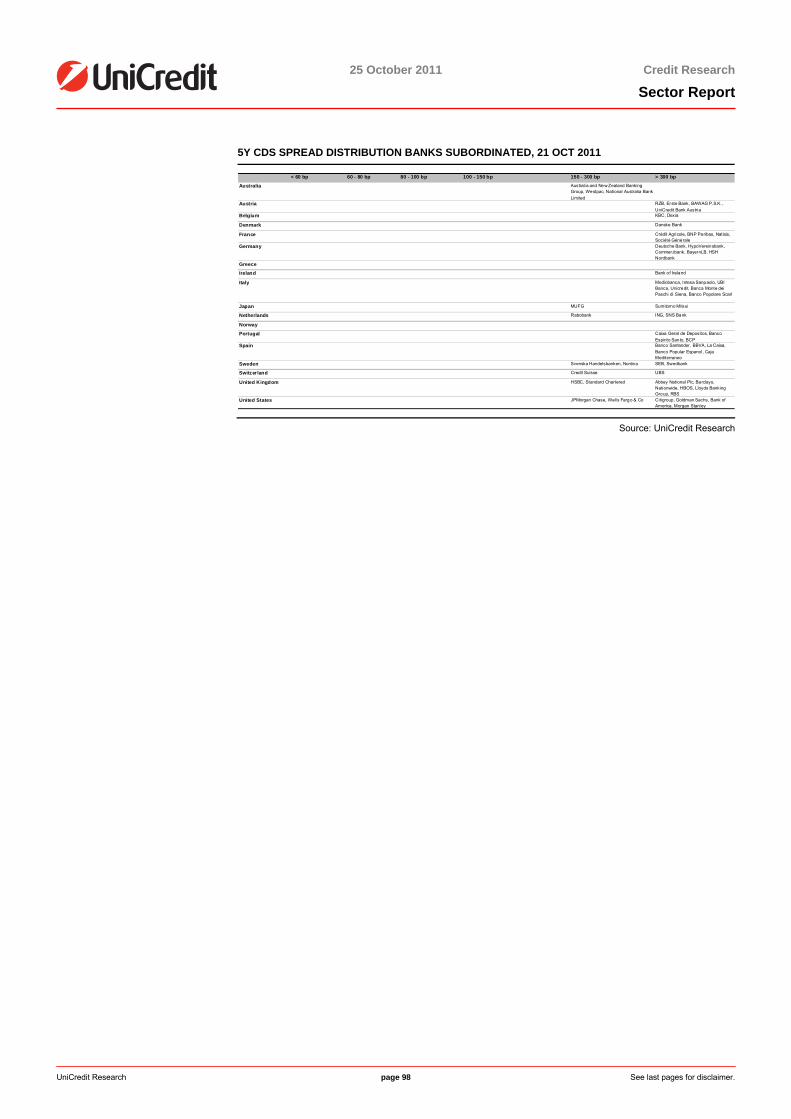
25 October 2011 Credit Research
Sector Report
UniCredit Research page 98 See last pages for disclaimer.
5Y CDS SPREAD DISTRIBUTION BANKS SUBORDINATED, 21 OCT 2011
< 60 bp 60 - 80 bp 80 - 100 bp 100 - 150 bp 150 - 300 bp > 300 bp
Australia Australia and New Zealand Banking Group, Westpac, National Australia Bank Limited
Austria RZB, Erste Bank, BAWAG P.S.K., UniCredit Bank Austria
Belgium KBC, Dexia
Denmark Danske Bank
France Crédit Agricole, BNP Paribas, Natixis, Société Générale
Germany Deutsche Bank, HypoVereinsbank, Commerzbank, BayernLB, HSH Nordbank
Greece
Ireland Bank of Ireland
Italy Mediobanca, Intesa Sanpaolo, UBI Banca, Unicredit, Banca Monte dei Paschi di Siena, Banco Popolare Scarl
Japan MUFG Sumitomo Mitsui
Netherlands Rabobank ING, SNS Bank
Norway
Portugal Caixa Geral de Depositos, Banco Espirito Santo, BCP
Spain Banco Santander , BBVA, La Caixa, Banco Popular Espanol , Caja Mediterraneo
Sweden Svenska Handelsbanken, Nordea SEB, Swedbank
Switzerland Credit Suisse UBS
United Kingdom HSBC, Standard Chartered Abbey National Plc, Barclays, Nationwide, HBOS, Lloyds Banking Group, RBS
United States JPMorgan Chase, Wells Fargo & Co Citigroup, Goldman Sachs, Bank of America, Morgan Stanley
Source: UniCredit Research

25 October 2011 Credit Research
Sector Report
UniCredit Research page 99 See last pages for disclaimer.
Investment Considerations
Analysis of secondary Market Spreads Analysis of secondary market spreads Senior LT2
In the following, we analyze the UK iBoxx universe across the capital structure spec-trum. The respective issuer banks combine the following features: considerable activi-ties in the UK and mostly liquid debt instruments outstanding. The situation is as fol-lows:
■ Regarding senior bonds, RBS's clearly trade the widest and while HSBC's the tightest. This is not surprising given HSBC's superior fundamentals and international reach and RBS'sweaker characteristics. As Lloyds is comparable to RBS, they trade the second widest,however by a noticeable spread distance to RBS. Similarly, as STANLN is a solid group in emerging markets, it trades just a bit wider than those of HSBC. Although BACR also has robust fundamentals, their bonds trade wider than STANLN, most likely due to the large contribution of potentially market-volatile Barclay's Capital to BACR's overall results. The picture for senior cash is confirmed, when looking at senior and sub CDS.
■ The picture for UK banks' LT2 (chart spreads are priced to next call; please refer to thetable below for a comparison of YTC and YTM for all bonds analyzed) is striking with re-gard to the very wide LLOYDS 5.625% 3/13-18 (LT2, str. step-up), especially in contrast to HSBC 5.375% 12/12 (LT2) but also to bullet LLOYDS 5.875% 7/14 (LT2). Given LLOYD'sinverted LT2 cash curve, the market has priced in a perceived low call probability. More-over, HSBC's cash curve widens for longer modified durations, while BACR's LT2 cashcurve stays flat.
■ The picture for UK banks' sub CDS's is similar to that of the cash curve, but HSBC's CDS sub curve is flatter than its cash curve. This is explained by a number of factors. First, HSBC has different issuance entities, which makes comparing bonds and CDS spreads difficult. Second, while the spread difference has already existed in the past for longermodified durations, this is now influenced also by the 2019 deadline for the ICB recom-mendations, when comparing it to HSBC 6% 6/19, for example.
Deep Subs ■ Within deep subs (chart spreads are priced to next call; please refer to the table below fora comparison of YTC and YTM for all bonds analyzed), there are these constellations:
– There are no liquid outstanding UT2 bonds from UK banks.
– There are also two UK banks T1 iBoxx issuers, BACR and HSBC and they arenot readily comparable. HSBC's T1s have a structured step, while BACR's donot and just switch from fix to floating when not called. Both issuers' T1 bonds have inverted cash curves, as the market has priced in a perceived low callprobability. For T1s without structured steps, it is interesting to note that thespread of BACR 4.875% 12/14-perp (T1, non-step), measured to the next calldate, has decoupled from the spread of BACR 4.75% 3/20-perp (T1, non-step), measured to the next call date, since July 2011 and widened substantially,driven by the perceived low call probability. However, these bonds are retail bonds (no step-up and minimum piece/increment: EUR 10,000 each) which are generally not expected to be called. Hence, when looking at the YTM, the pic-ture reverses and BACR 4.875% 12/14-perp (T1, non-step) now offers a lower YTM than BACR 4.75% 3/20-perp (T1, non-step), as can be seen in the table "Analyzed Bonds".
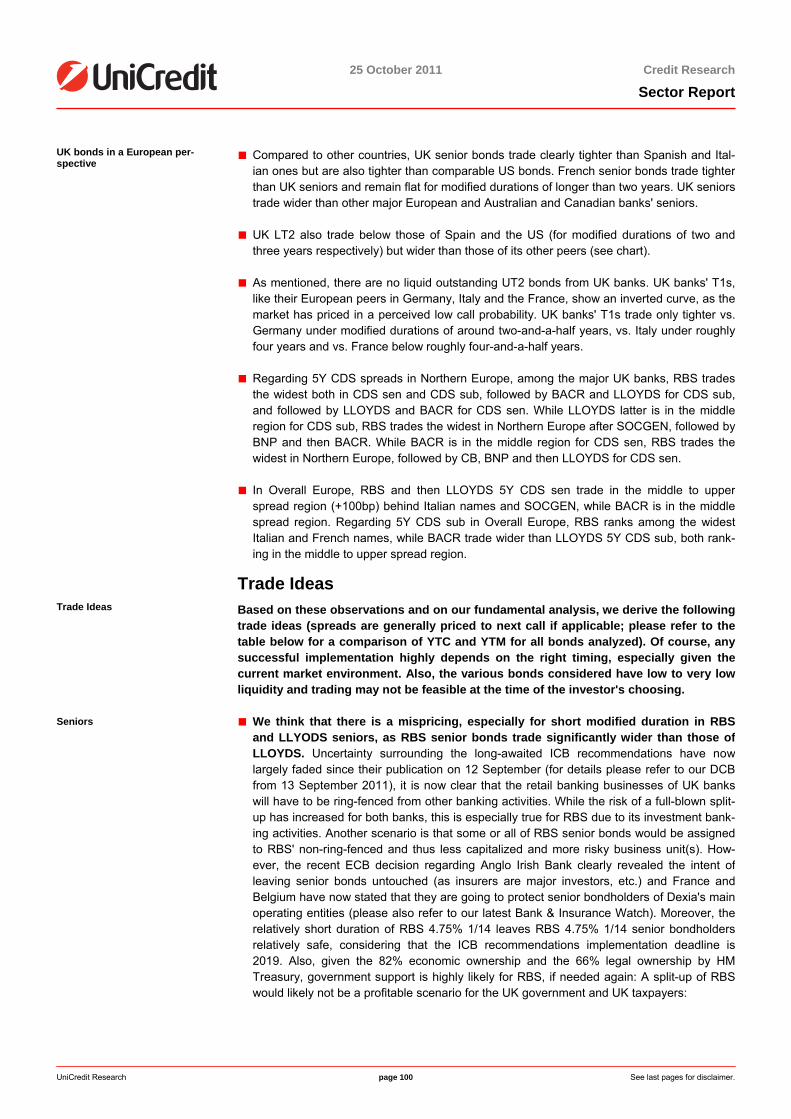
25 October 2011 Credit Research
Sector Report
UniCredit Research page 100 See last pages for disclaimer.
UK bonds in a European per-spective
■ Compared to other countries, UK senior bonds trade clearly tighter than Spanish and Ital-ian ones but are also tighter than comparable US bonds. French senior bonds trade tighter than UK seniors and remain flat for modified durations of longer than two years. UK seniors trade wider than other major European and Australian and Canadian banks' seniors.
■ UK LT2 also trade below those of Spain and the US (for modified durations of two andthree years respectively) but wider than those of its other peers (see chart).
■ As mentioned, there are no liquid outstanding UT2 bonds from UK banks. UK banks' T1s,like their European peers in Germany, Italy and the France, show an inverted curve, as themarket has priced in a perceived low call probability. UK banks' T1s trade only tighter vs.Germany under modified durations of around two-and-a-half years, vs. Italy under roughly four years and vs. France below roughly four-and-a-half years.
■ Regarding 5Y CDS spreads in Northern Europe, among the major UK banks, RBS tradesthe widest both in CDS sen and CDS sub, followed by BACR and LLOYDS for CDS sub, and followed by LLOYDS and BACR for CDS sen. While LLOYDS latter is in the middle region for CDS sub, RBS trades the widest in Northern Europe after SOCGEN, followed by BNP and then BACR. While BACR is in the middle region for CDS sen, RBS trades thewidest in Northern Europe, followed by CB, BNP and then LLOYDS for CDS sen.
■ In Overall Europe, RBS and then LLOYDS 5Y CDS sen trade in the middle to upper spread region (+100bp) behind Italian names and SOCGEN, while BACR is in the middlespread region. Regarding 5Y CDS sub in Overall Europe, RBS ranks among the widestItalian and French names, while BACR trade wider than LLOYDS 5Y CDS sub, both rank-ing in the middle to upper spread region.
Trade Ideas Trade Ideas Seniors
Based on these observations and on our fundamental analysis, we derive the following trade ideas (spreads are generally priced to next call if applicable; please refer to thetable below for a comparison of YTC and YTM for all bonds analyzed). Of course, any successful implementation highly depends on the right timing, especially given the current market environment. Also, the various bonds considered have low to very low liquidity and trading may not be feasible at the time of the investor's choosing.
■ We think that there is a mispricing, especially for short modified duration in RBS and LLYODS seniors, as RBS senior bonds trade significantly wider than those ofLLOYDS. Uncertainty surrounding the long-awaited ICB recommendations have now largely faded since their publication on 12 September (for details please refer to our DCB from 13 September 2011), it is now clear that the retail banking businesses of UK bankswill have to be ring-fenced from other banking activities. While the risk of a full-blown split-up has increased for both banks, this is especially true for RBS due to its investment bank-ing activities. Another scenario is that some or all of RBS senior bonds would be assignedto RBS' non-ring-fenced and thus less capitalized and more risky business unit(s). How-ever, the recent ECB decision regarding Anglo Irish Bank clearly revealed the intent of leaving senior bonds untouched (as insurers are major investors, etc.) and France andBelgium have now stated that they are going to protect senior bondholders of Dexia's mainoperating entities (please also refer to our latest Bank & Insurance Watch). Moreover, the relatively short duration of RBS 4.75% 1/14 leaves RBS 4.75% 1/14 senior bondholdersrelatively safe, considering that the ICB recommendations implementation deadline is2019. Also, given the 82% economic ownership and the 66% legal ownership by HM Treasury, government support is highly likely for RBS, if needed again: A split-up of RBS would likely not be a profitable scenario for the UK government and UK taxpayers:
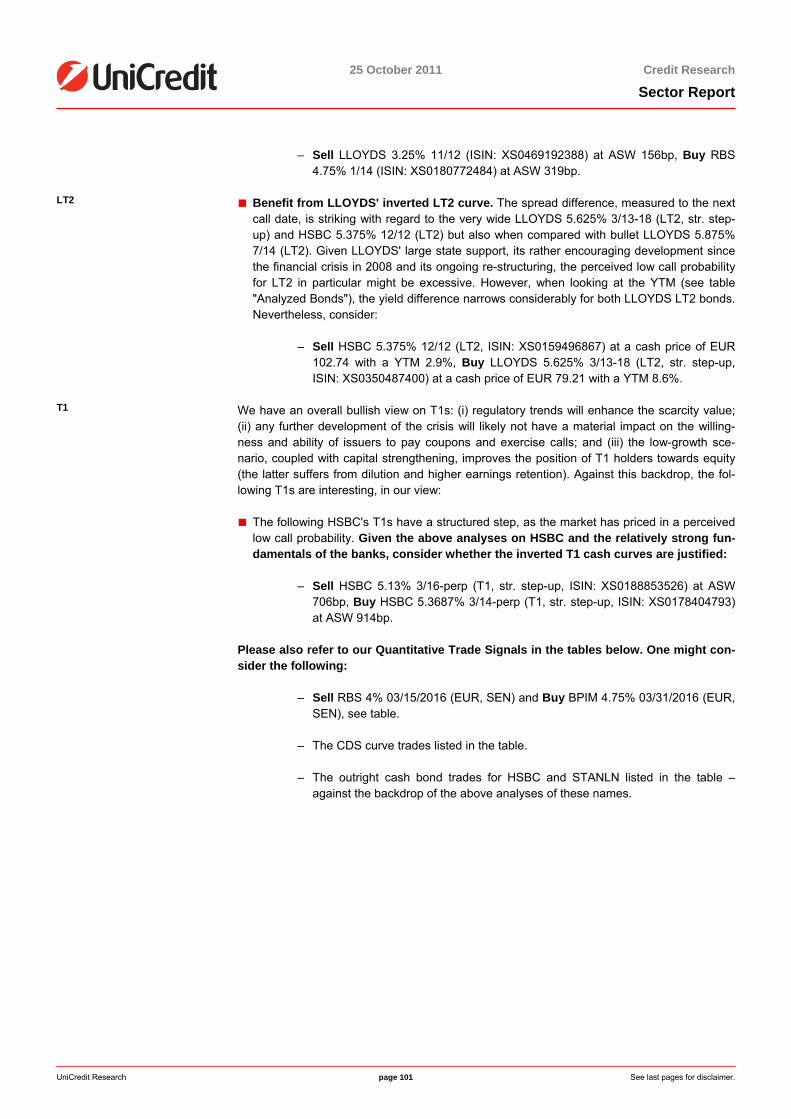
25 October 2011 Credit Research
Sector Report
UniCredit Research page 101 See last pages for disclaimer.
– Sell LLOYDS 3.25% 11/12 (ISIN: XS0469192388) at ASW 156bp, Buy RBS 4.75% 1/14 (ISIN: XS0180772484) at ASW 319bp.
LT2 ■ Benefit from LLOYDS' inverted LT2 curve. The spread difference, measured to the next
call date, is striking with regard to the very wide LLOYDS 5.625% 3/13-18 (LT2, str. step-up) and HSBC 5.375% 12/12 (LT2) but also when compared with bullet LLOYDS 5.875%7/14 (LT2). Given LLOYDS' large state support, its rather encouraging development since the financial crisis in 2008 and its ongoing re-structuring, the perceived low call probability for LT2 in particular might be excessive. However, when looking at the YTM (see table"Analyzed Bonds"), the yield difference narrows considerably for both LLOYDS LT2 bonds.Nevertheless, consider:
– Sell HSBC 5.375% 12/12 (LT2, ISIN: XS0159496867) at a cash price of EUR 102.74 with a YTM 2.9%, Buy LLOYDS 5.625% 3/13-18 (LT2, str. step-up, ISIN: XS0350487400) at a cash price of EUR 79.21 with a YTM 8.6%.
T1
We have an overall bullish view on T1s: (i) regulatory trends will enhance the scarcity value; (ii) any further development of the crisis will likely not have a material impact on the willing-ness and ability of issuers to pay coupons and exercise calls; and (iii) the low-growth sce-nario, coupled with capital strengthening, improves the position of T1 holders towards equity (the latter suffers from dilution and higher earnings retention). Against this backdrop, the fol-lowing T1s are interesting, in our view:
■ The following HSBC's T1s have a structured step, as the market has priced in a perceived low call probability. Given the above analyses on HSBC and the relatively strong fun-damentals of the banks, consider whether the inverted T1 cash curves are justified:
– Sell HSBC 5.13% 3/16-perp (T1, str. step-up, ISIN: XS0188853526) at ASW 706bp, Buy HSBC 5.3687% 3/14-perp (T1, str. step-up, ISIN: XS0178404793) at ASW 914bp.
Please also refer to our Quantitative Trade Signals in the tables below. One might con-sider the following:
– Sell RBS 4% 03/15/2016 (EUR, SEN) and Buy BPIM 4.75% 03/31/2016 (EUR, SEN), see table.
– The CDS curve trades listed in the table.
– The outright cash bond trades for HSBC and STANLN listed in the table –against the backdrop of the above analyses of these names.
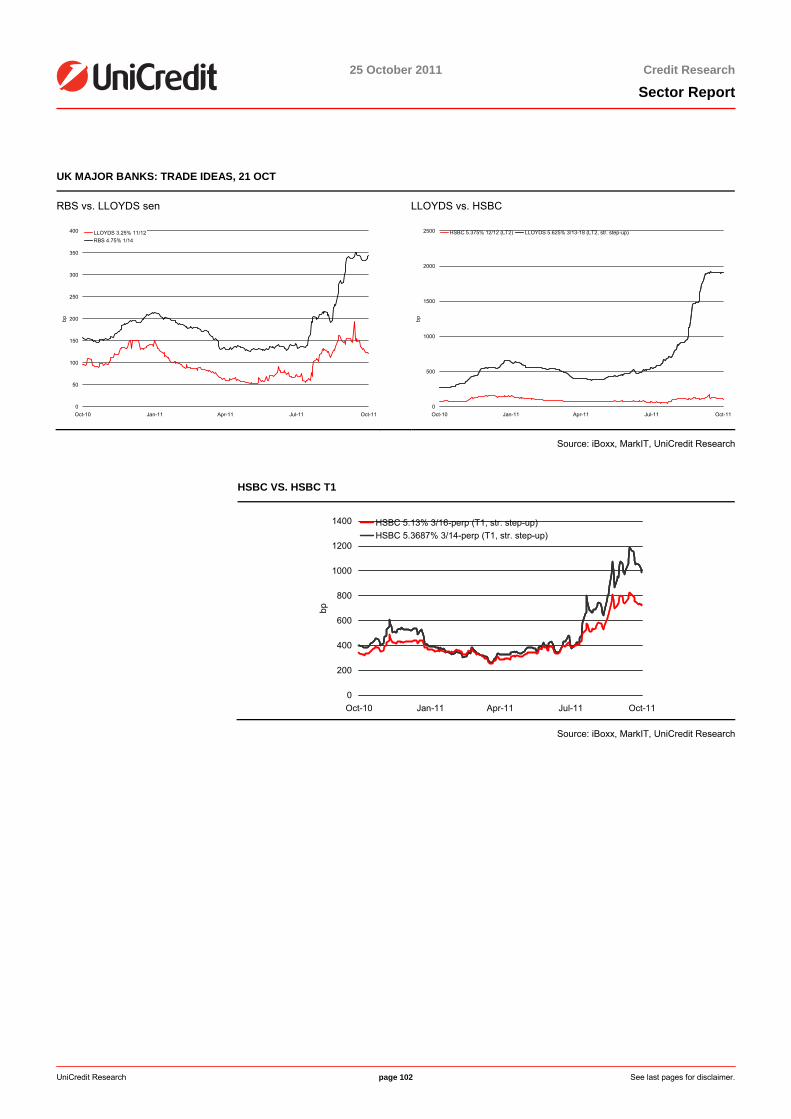
25 October 2011 Credit Research
Sector Report
UniCredit Research page 102 See last pages for disclaimer.
UK MAJOR BANKS: TRADE IDEAS, 21 OCT
RBS vs. LLOYDS sen LLOYDS vs. HSBC
0
50
100
150
200
250
300
350
400
Oct-10 Jan-11 Apr-11 Jul-11 Oct-11
bp
LLOYDS 3.25% 11/12RBS 4.75% 1/14
0
500
1000
1500
2000
2500
Oct-10 Jan-11 Apr-11 Jul-11 Oct-11bp
HSBC 5.375% 12/12 (LT2) LLOYDS 5.625% 3/13-18 (LT2, str. step-up)
Source: iBoxx, MarkIT, UniCredit Research
HSBC VS. HSBC T1
0
200
400
600
800
1000
1200
1400
Oct-10 Jan-11 Apr-11 Jul-11 Oct-11
bp
HSBC 5.13% 3/16-perp (T1, str. step-up)HSBC 5.3687% 3/14-perp (T1, str. step-up)
Source: iBoxx, MarkIT, UniCredit Research
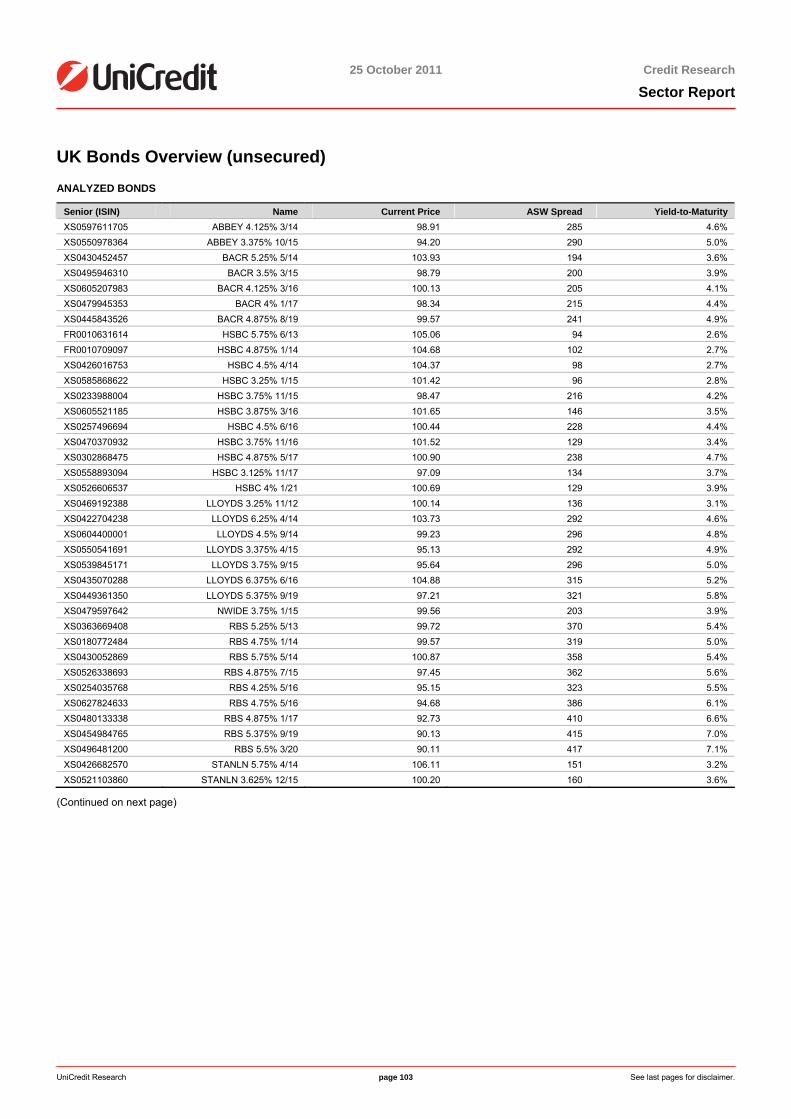
25 October 2011 Credit Research
Sector Report
UniCredit Research page 103 See last pages for disclaimer.
UK Bonds Overview (unsecured) ANALYZED BONDS
Senior (ISIN) Name Current Price ASW Spread Yield-to-Maturity XS0597611705 ABBEY 4.125% 3/14 98.91 285 4.6% XS0550978364 ABBEY 3.375% 10/15 94.20 290 5.0% XS0430452457 BACR 5.25% 5/14 103.93 194 3.6% XS0495946310 BACR 3.5% 3/15 98.79 200 3.9% XS0605207983 BACR 4.125% 3/16 100.13 205 4.1% XS0479945353 BACR 4% 1/17 98.34 215 4.4% XS0445843526 BACR 4.875% 8/19 99.57 241 4.9% FR0010631614 HSBC 5.75% 6/13 105.06 94 2.6% FR0010709097 HSBC 4.875% 1/14 104.68 102 2.7% XS0426016753 HSBC 4.5% 4/14 104.37 98 2.7% XS0585868622 HSBC 3.25% 1/15 101.42 96 2.8% XS0233988004 HSBC 3.75% 11/15 98.47 216 4.2% XS0605521185 HSBC 3.875% 3/16 101.65 146 3.5% XS0257496694 HSBC 4.5% 6/16 100.44 228 4.4% XS0470370932 HSBC 3.75% 11/16 101.52 129 3.4% XS0302868475 HSBC 4.875% 5/17 100.90 238 4.7% XS0558893094 HSBC 3.125% 11/17 97.09 134 3.7% XS0526606537 HSBC 4% 1/21 100.69 129 3.9% XS0469192388 LLOYDS 3.25% 11/12 100.14 136 3.1% XS0422704238 LLOYDS 6.25% 4/14 103.73 292 4.6% XS0604400001 LLOYDS 4.5% 9/14 99.23 296 4.8% XS0550541691 LLOYDS 3.375% 4/15 95.13 292 4.9% XS0539845171 LLOYDS 3.75% 9/15 95.64 296 5.0% XS0435070288 LLOYDS 6.375% 6/16 104.88 315 5.2% XS0449361350 LLOYDS 5.375% 9/19 97.21 321 5.8% XS0479597642 NWIDE 3.75% 1/15 99.56 203 3.9% XS0363669408 RBS 5.25% 5/13 99.72 370 5.4% XS0180772484 RBS 4.75% 1/14 99.57 319 5.0% XS0430052869 RBS 5.75% 5/14 100.87 358 5.4% XS0526338693 RBS 4.875% 7/15 97.45 362 5.6% XS0254035768 RBS 4.25% 5/16 95.15 323 5.5% XS0627824633 RBS 4.75% 5/16 94.68 386 6.1% XS0480133338 RBS 4.875% 1/17 92.73 410 6.6% XS0454984765 RBS 5.375% 9/19 90.13 415 7.0% XS0496481200 RBS 5.5% 3/20 90.11 417 7.1% XS0426682570 STANLN 5.75% 4/14 106.11 151 3.2% XS0521103860 STANLN 3.625% 12/15 100.20 160 3.6%
(Continued on next page)
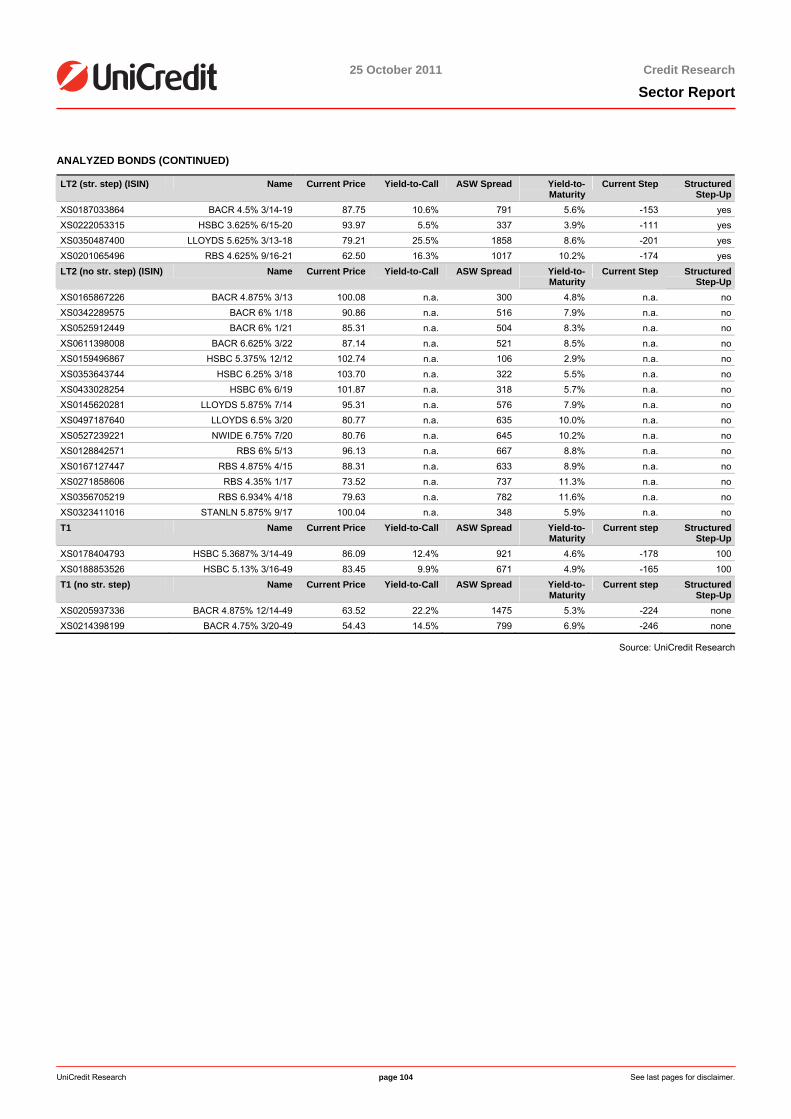
25 October 2011 Credit Research
Sector Report
UniCredit Research page 104 See last pages for disclaimer.
ANALYZED BONDS (CONTINUED)
LT2 (str. step) (ISIN) Name Current Price Yield-to-Call ASW Spread Yield-to-Maturity
Current Step Structured Step-Up
XS0187033864 BACR 4.5% 3/14-19 87.75 10.6% 791 5.6% -153 yesXS0222053315 HSBC 3.625% 6/15-20 93.97 5.5% 337 3.9% -111 yesXS0350487400 LLOYDS 5.625% 3/13-18 79.21 25.5% 1858 8.6% -201 yesXS0201065496 RBS 4.625% 9/16-21 62.50 16.3% 1017 10.2% -174 yesLT2 (no str. step) (ISIN) Name Current Price Yield-to-Call ASW Spread Yield-to-
Maturity Current Step Structured
Step-UpXS0165867226 BACR 4.875% 3/13 100.08 n.a. 300 4.8% n.a. noXS0342289575 BACR 6% 1/18 90.86 n.a. 516 7.9% n.a. noXS0525912449 BACR 6% 1/21 85.31 n.a. 504 8.3% n.a. noXS0611398008 BACR 6.625% 3/22 87.14 n.a. 521 8.5% n.a. noXS0159496867 HSBC 5.375% 12/12 102.74 n.a. 106 2.9% n.a. noXS0353643744 HSBC 6.25% 3/18 103.70 n.a. 322 5.5% n.a. noXS0433028254 HSBC 6% 6/19 101.87 n.a. 318 5.7% n.a. noXS0145620281 LLOYDS 5.875% 7/14 95.31 n.a. 576 7.9% n.a. noXS0497187640 LLOYDS 6.5% 3/20 80.77 n.a. 635 10.0% n.a. noXS0527239221 NWIDE 6.75% 7/20 80.76 n.a. 645 10.2% n.a. noXS0128842571 RBS 6% 5/13 96.13 n.a. 667 8.8% n.a. noXS0167127447 RBS 4.875% 4/15 88.31 n.a. 633 8.9% n.a. noXS0271858606 RBS 4.35% 1/17 73.52 n.a. 737 11.3% n.a. noXS0356705219 RBS 6.934% 4/18 79.63 n.a. 782 11.6% n.a. noXS0323411016 STANLN 5.875% 9/17 100.04 n.a. 348 5.9% n.a. noT1 Name Current Price Yield-to-Call ASW Spread Yield-to-
Maturity Current step Structured
Step-UpXS0178404793 HSBC 5.3687% 3/14-49 86.09 12.4% 921 4.6% -178 100XS0188853526 HSBC 5.13% 3/16-49 83.45 9.9% 671 4.9% -165 100T1 (no str. step) Name Current Price Yield-to-Call ASW Spread Yield-to-
Maturity Current step Structured
Step-UpXS0205937336 BACR 4.875% 12/14-49 63.52 22.2% 1475 5.3% -224 noneXS0214398199 BACR 4.75% 3/20-49 54.43 14.5% 799 6.9% -246 none
Source: UniCredit Research
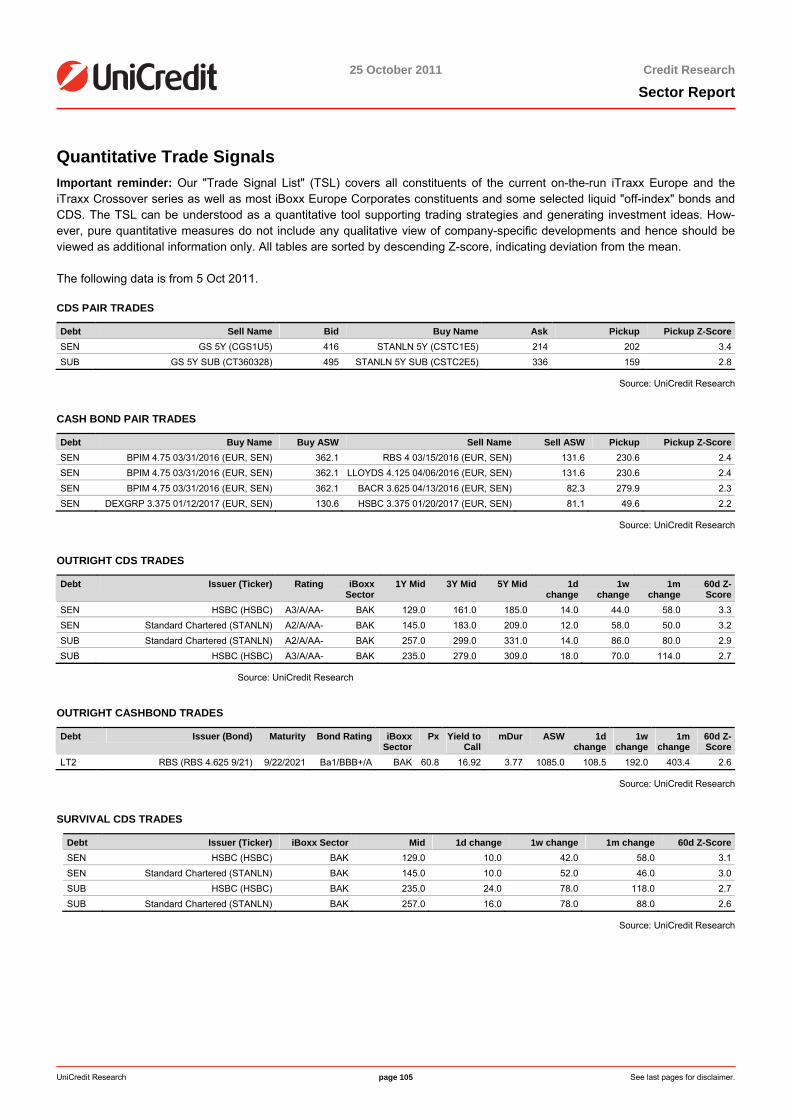
25 October 2011 Credit Research
Sector Report
UniCredit Research page 105 See last pages for disclaimer.
Quantitative Trade Signals Important reminder: Our "Trade Signal List" (TSL) covers all constituents of the current on-the-run iTraxx Europe and the iTraxx Crossover series as well as most iBoxx Europe Corporates constituents and some selected liquid "off-index" bonds and CDS. The TSL can be understood as a quantitative tool supporting trading strategies and generating investment ideas. How-ever, pure quantitative measures do not include any qualitative view of company-specific developments and hence should be viewed as additional information only. All tables are sorted by descending Z-score, indicating deviation from the mean.
The following data is from 5 Oct 2011.
CDS PAIR TRADES
Debt Sell Name Bid Buy Name Ask Pickup Pickup Z-ScoreSEN GS 5Y (CGS1U5) 416 STANLN 5Y (CSTC1E5) 214 202 3.4SUB GS 5Y SUB (CT360328) 495 STANLN 5Y SUB (CSTC2E5) 336 159 2.8
Source: UniCredit Research
CASH BOND PAIR TRADES
Debt Buy Name Buy ASW Sell Name Sell ASW Pickup Pickup Z-ScoreSEN BPIM 4.75 03/31/2016 (EUR, SEN) 362.1 RBS 4 03/15/2016 (EUR, SEN) 131.6 230.6 2.4SEN BPIM 4.75 03/31/2016 (EUR, SEN) 362.1 LLOYDS 4.125 04/06/2016 (EUR, SEN) 131.6 230.6 2.4SEN BPIM 4.75 03/31/2016 (EUR, SEN) 362.1 BACR 3.625 04/13/2016 (EUR, SEN) 82.3 279.9 2.3SEN DEXGRP 3.375 01/12/2017 (EUR, SEN) 130.6 HSBC 3.375 01/20/2017 (EUR, SEN) 81.1 49.6 2.2
Source: UniCredit Research
OUTRIGHT CDS TRADES
Debt Issuer (Ticker) Rating iBoxx Sector
1Y Mid 3Y Mid 5Y Mid 1d change
1w change
1m change
60d Z-Score
SEN HSBC (HSBC) A3/A/AA- BAK 129.0 161.0 185.0 14.0 44.0 58.0 3.3SEN Standard Chartered (STANLN) A2/A/AA- BAK 145.0 183.0 209.0 12.0 58.0 50.0 3.2SUB Standard Chartered (STANLN) A2/A/AA- BAK 257.0 299.0 331.0 14.0 86.0 80.0 2.9SUB HSBC (HSBC) A3/A/AA- BAK 235.0 279.0 309.0 18.0 70.0 114.0 2.7
Source: UniCredit Research
OUTRIGHT CASHBOND TRADES
Debt Issuer (Bond) Maturity Bond Rating iBoxx Sector
Px Yield to Call
mDur ASW 1d change
1w change
1m change
60d Z-Score
LT2 RBS (RBS 4.625 9/21) 9/22/2021 Ba1/BBB+/A BAK 60.8 16.92 3.77 1085.0 108.5 192.0 403.4 2.6
Source: UniCredit Research
SURVIVAL CDS TRADES
Debt Issuer (Ticker) iBoxx Sector Mid 1d change 1w change 1m change 60d Z-ScoreSEN HSBC (HSBC) BAK 129.0 10.0 42.0 58.0 3.1SEN Standard Chartered (STANLN) BAK 145.0 10.0 52.0 46.0 3.0SUB HSBC (HSBC) BAK 235.0 24.0 78.0 118.0 2.7SUB Standard Chartered (STANLN) BAK 257.0 16.0 78.0 88.0 2.6
Source: UniCredit Research

25 October 2011 Credit Research
Sector Report
UniCredit Research page 106 See last pages for disclaimer.
BASIS TRADES
Debt Issuer (Bond) Duration below bond
Duration above bond
iBoxx Sector
Maturity for CDS
CDS Spread
ASW Basis 60d Z-Score on
BasisSEN HSBC (HSBC 3.375 1/17) 5 7 BAK 03/17 185.7 81.1 104.7 4.0SEN HSBC (HSBC 4 1/21) 7 10 BAK 03/21 197.0 149.5 47.5 3.4SEN HSBC (HSBC 3.125 11/17) 5 7 BAK 12/17 188.0 139.6 48.4 3.2SEN HSBC (HSBC 5.75 6/13) 1 2 BAK 06/13 137.0 91.6 45.4 3.1LT2 HSBC (HSBC 5.375 12/12) 1 2 BAK 03/13 240.4 128.3 112.1 3.0SEN HSBC (HSBC 3.25 1/15) 3 4 BAK 03/15 164.0 103.8 60.2 2.9SEN HSBC (HSBC 3.75 11/16) 5 5 BAK 12/16 185.0 144.0 41.0 2.6SEN HSBC (HSBC 4.5 4/14) 2 3 BAK 06/14 153.0 104.5 48.5 2.2SEN Standard Chartered (STANLN 3.625 12/15) 4 4 BAK 12/15 197.0 145.7 51.3 2.1SEN HSBC (HSBC 4.875 1/14) 2 3 BAK 03/14 148.9 112.9 36.1 2.1SEN Lloyds Banking Group (LLOYDS 4 9/20) 7 10 BAK 12/20 389.7 149.1 240.5 2.0SEN RBS (RBS 3.875 10/20) 7 10 BAK 12/20 409.7 146.7 263.0 1.9SEN Lloyds Banking Group (LLOYDS 6.375 6/16) 4 5 BAK 06/16 378.0 365.8 12.2 1.8SEN Lloyds Banking Group (LLOYDS 4.125 4/16) 4 5 BAK 06/16 378.0 131.6 246.4 1.8
Source: UniCredit Research
HYBRID RATIOS
Debt Dur. below Bond
Dur. above Bond
Issuer (Bond) Issuer Rating Bond Rating iBoxx Sector
Maturity for CDS
CDS Spread
iBoxx ASW
CDS to Spread
60d Z-Score on
CDS to Spread
LT2 1 2 Lloyds Banking Group (LLOYDS
5.625 3/13)
Baa2/BBB+/A+ Baa2/BBB+/A+ BAK 3/20/2013 325.4 1890.3 5.8 1.5
LT2 3 4 RBS (RBS 4.875 4/15)
Aa3*-/A+/AA+ Baa3/BBB+/A+ BAK 6/20/2015 388.0 644.4 1.7 1.4
LT2 7 10 Barclays (BACR 4.5 3/19)
(P)A1/A+/AA- Baa1/A/A+ BAK 3/20/2019 259.5 830.9 3.2 1.4
LT2 1 2 RBS (RBS 6 5/13) Aa3*-/A+/AA+ Baa3/BBB+/A+ BAK 6/20/2013 350.0 665.9 1.9 1.3LT2 10 10 RBS (RBS 4.625
9/21) Aa3*-/A+/AA+ Ba1/BBB+/A BAK 12/20/2021 411.0 1085.0 2.6 1.3
Source: UniCredit Research
25 October 2011 Credit Research
Sector Report
UniCredit Research page 107 See last pages for disclaimer.
Disclaimer Our recommendations are based on information obtained from, or are based upon public information sources that we consider to be reliable but for the completeness and accuracy of which we assume no liability. All estimates and opinions included in the report represent the independent judgment of the analysts as of the date of the issue. We reserve the right to modify the views expressed herein at any time without notice. Moreover, we reserve the right not to update this information or to discontinue it altogether without notice. This analysis is for information purposes only and (i) does not constitute or form part of any offer for sale or subscription of or solicitation of any offer to buy or subscribe for any financial, money market or investment instrument or any security, (ii) is neither intended as such an offer for sale or subscription of or solicitation of an offer to buy or subscribe for any financial, money market or investment instrument or any security nor (iii) as an advertisement thereof. The investment possibilities discussed in this report may not be suitable for certain investors depending on their specific investment objectives and time horizon or in the context of their overall financial situation. The investments discussed may fluctuate in price or value. Investors may get back less than they invested. Changes in rates of exchange may have an adverse effect on the value of investments. Further-more, past performance is not necessarily indicative of future results. In particular, the risks associated with an investment in the financial, money market or investment instru-ment or security under discussion are not explained in their entirety. This information is given without any warranty on an "as is" basis and should not be regarded as a substitute for obtaining individual advice. Investors must make their own de-termination of the appropriateness of an investment in any instruments referred to herein based on the merits and risks involved, their own investment strategy and their legal, fiscal and financial position. As this document does not qualify as an investment recommendation or as a direct investment recommendation, neither this document nor any part of it shall form the basis of, or be relied on in connection with or act as an inducement to enter into, any contract or commitment whatsoever. Investors are urged to contact their bank's investment advisor for individual explanations and advice. Neither UniCredit Bank AG, UniCredit Bank AG London Branch, UniCredit Bank AG Vienna Branch, UniCredit Bank AG Milan Branch, UniCredit Securities, UniCredit Menkul Değerler A.Ş., Zagrebačka banka and UniCredit Bulbank nor any of their respective directors, officers or employees nor any other person accepts any liability whatsoever (in negligence or otherwise) for any loss howsoever arising from any use of this document or its contents or otherwise arising in connection therewith. This analysis is being distributed by electronic and ordinary mail to professional investors, who are expected to make their own investment decisions without undue reliance on this publication, and may not be redistributed, reproduced or published in whole or in part for any purpose. Responsibility for the content of this publication lies with: a) UniCredit Bank AG, Am Tucherpark 16, 80538 Munich, Germany, (also responsible for the distribution pursuant to §34b WpHG). The company belongs to UCI Group. Regulatory authority: “BaFin“ – Bundesanstalt für Finanzdienstleistungsaufsicht, Lurgiallee 12, 60439 Frankfurt, Germany. b) UniCredit Bank AG London Branch, Moor House, 120 London Wall, London EC2Y 5ET, United Kingdom. Regulatory authority: “BaFin“ – Bundesanstalt für Finanzdienstleistungsaufsicht, Lurgiallee 12, 60439 Frankfurt, Germany and subject to limited regulation by the Financial Ser-vices Authority (FSA), 25 The North Colonnade, Canary Wharf, London E14 5HS, United Kingdom. Details about the extent of our regulation by the Financial Services Authority are available from us on request. c) UniCredit Bank AG Milan Branch, Via Tommaso Grossi 10, 20121 Milan, Italy, duly authorized by the Bank of Italy to provide investment services. Regulatory authority: “Bank of Italy”, Via Nazionale 91, 00184 Roma, Italy and Bundesanstalt für Finanzdienstleistungsaufsicht, Lurgiallee 12, 60439 Frankfurt, Germany. d) UniCredit Bank AG Vienna Branch, Julius-Tandler-Platz 3, 1090 Vienna, Austria Regulatory authority: Finanzmarktaufsichtsbehörde (FMA), Otto-Wagner-Platz 5, 1090 Vienna, Austria and subject to limited regulation by the “BaFin“ – Bundesanstalt für Fi-nanzdienstleistungsaufsicht, Lurgiallee 12, 60439 Frankfurt, Germany. Details about the extent of our regulation by the Bundesanstalt für Finanzdienstleistungsaufsicht are available from us on request. e) UniCredit Securities, Boulevard Ring Office Building, 17/1 Chistoprudni Boulevard, Moscow 101000, Russia Regulatory authority: Federal Service on Financial Markets, 9 Leninsky prospekt, Moscow 119991, Russia f) UniCredit Menkul Değerler A.Ş., Büyükdere Cad. No. 195, Büyükdere Plaza Kat. 5, 34394 Levent, Istanbul, Turkey Regulatory authority: Sermaye Piyasası Kurulu – Capital Markets Board of Turkey, Eskişehir Yolu 8.Km No:156, 06530 Ankara, Turkey g) Zagrebačka banka, Paromlinska 2, HR-10000 Zagreb, Croatia Regulatory authority: Croatian Agency for Supervision of Financial Services, Miramarska 24B, 10000 Zagreb, Croatia h) UniCredit Bulbank, Sveta Nedelya Sq. 7, BG-1000 Sofia, Bulgaria Regulatory authority: Financial Supervision Commission (FSC), 33 Shar Planina str.,1303 Sofia, Bulgaria This report may contain excerpts sourced from UniCredit Bank Russia, UniCredit Tiriac Bank, Bank Pekao or Yapi Kredi all members of the UniCredit group. If so, the pieces and the contents have not been materially altered. POTENTIAL CONFLICTS OF INTERESTS Commerzbank 3; Deutsche Bank 1a, 2, 3, 4; HypoVereinsbank 1a, 3; BANCO POPULAR ESPANOL (BPE) 2, 3; Royal Bank of Scotland 2; Bayerische Landesbank 2, 3; WL Bank ( Westfälische Landschaft Bodenkreditbank AG) 3; Deutsche Genossenschafts Hypothekenbank AG 3; RCI Banque S.A. 2; Landesbank Berlin Girozentrale 3; Medio-banca-Banca di Credito Finanziario SpA 1a, 1b, 3, 6a; NRW Bank 2, 3; European Investment Bank 2, 3; JP Morgan Chase & Co. 3; CITIGROUP 3; Allied Irish Banks PLC 3; Deutsche Postbank AG 3; Societe Generale 3; OBERBANK AG 1a; Barclays 3; Banca Monte dei Paschi di Siena 2, 3; Berlin-Hannoversche Hypothekenbank AG (BHH) 3; Bank of America Corp. 3; Credit Suisse 2, 3; BANK FÜR TIROL U. VORARLBERG AG 1a; SEB Hypothekenbank AG 3; Eurocash 4; WestLB AG 3; Deutsche Hypotheken-bank 2, 3; AyT Cédulas Cajas 3; Caixa Geral de Depositos 3; Allgemeine Hypothekenbank Rheinboden AG 3; Westdeutsche Immobilienbank 3; Erste Bank 2, 3; Dexia SA 2, 3; Intesa Sanpaolo 2; Banco Espirito Santo SA 3; BNP Paribas 3; Credit Agricole SA 3; HSH Nordbank AG 3; Eurohypo Aktiengesellschaft 2, 3; Hypothekenbank in Essen AG 3; Münchener Hypothekenbank eG 2, 3; HSBC Holdings PLC 2, 3; DEPFA BANK plc. 3; Lloyds Banking Group 2, 3; Capitalia 1a; UBS 3; UniCredit SpA 1a, 2; Banco Santander 3; IKB Deutsche Industriebank Aktiengesellschaft 3; Bank Austria Creditanstalt 1a, 2, 3; Landesbank Baden-Württemberg (LBBW) 3; BKS Bank AG 1a; Kommu-nalkredit Austria AG 3; Düsseldorf Hypothekenbank AG 2, 3; L-Bank Landeskreditbank Baden-Württemberg 2, 3; BBVA 3; Aareal Bank 3; Banco Comercial Portugues SA 3; Swedbank AB 2, 3; Wells Fargo & Co 3; BK MONTREAL CD 2 WKN:850386 3; Komercni Banka AS 3; Danske Bank A/S 3; Banca Popolare Di Milano 3; Royal Bank of Canada 3; ABN Amro Bank N.V. 2, 3; Skandinaviska Enskilda Banken AB 3; Raiffeisen Bank International 2, 3; DnB NORBank ASA 3; Würth Finance International 2; IM Cedulas 3; NATIONAL AUSTRALIA BANK LTD. 2; PKO BP 3; Deutsche Schiffsbank 1a; Caixa Catalunya 3; Hypo Pfandbriefbank International 3; Landwirtschaftliche Ren-tenbank 3; Caja Madrid 2, 3; Bank Handlowy 3; Banca Carige SpA 2, 3; Stadshypotek Bank 3; Unione Banche Italiane 2, 3; VTB 3; Banco Popolare 3; Bankinter SA 3; Banco Sabadell 1a, 3; Zagrebacka Banka d.d. 1a; Sekerbank 4; Morgan Stanley 2, 3; Goldman Sachs 2, 3; BABCOCK & BROWN LTD 1a; Deutsche Börse AG 3; Merrill Lynch & Co. Inc. 3; Wüstenrot & Württembergische AG 1a; Fortis 3; DAB Bank 1a; Mediolanum 3; AMER. EXPRESS DL -,20 WKN:850226 3; WASHINGTON MUTUAL 3; Azimut Holding 3; Warsaw Stock Exchange 3; CA Immo Anlagen 1a, 3; IMMOFINANZ 2, 3, 4; conwert 3; GTC 2, 3; Orco Property Group 3; PRELIOS 7; DIC Asset 3; Aedes 7; CA Immo International 3; Warimpex 3; alstria office REIT 2, 4; Emlak Konut REIT 2, 4; GSW Immobilien 2, 4; Prime Office REIT 3, 4; Key 1a: UniCredit Bank AG, UniCredit Bank AG London Branch, UniCredit Bank AG Vienna Branch, UniCredit Bank AG Milan Branch, UniCredit Securities, UniCredit Menkul Değerler A.Ş., Zagrebačka banka and UniCredit Bulbank and/or a company affiliated with it (pursuant to relevant domestic law) owns at least 2% of the capital stock of the company. Key 1b: The analyzed company owns at least 2% of the capital stock of UniCredit Bank AG, UniCredit Bank AG London Branch, UniCredit Bank AG Vienna Branch, UniCredit Bank AG Milan Branch, UniCredit Securities, UniCredit Menkul Değerler A.Ş., Zagrebačka banka and UniCredit Bulbank and/or a company affiliated with it (pursuant to relevant domestic law). Key 2: UniCredit Bank AG, UniCredit Bank AG London Branch, UniCredit Bank AG Vienna Branch, UniCredit Bank AG Milan Branch, UniCredit Securities, UniCredit Menkul Değerler A.Ş., Zagrebačka banka and UniCredit Bulbank and/or a company affiliated with it (pursuant to relevant domestic law) belonged to a syndicate that has acquired securi-ties or any related derivatives of the analyzed company within the twelve months preceding publication, in connection with any publicly disclosed offer of securities of the ana-lyzed company, or in any related derivatives. Key 3: UniCredit Bank AG, UniCredit Bank AG London Branch, UniCredit Bank AG Vienna Branch, UniCredit Bank AG Milan Branch, UniCredit Securities, UniCredit Menkul Değerler A.Ş., Zagrebačka banka and UniCredit Bulbank and/or a company affiliated (pursuant to relevant domestic law) administers the securities issued by the analyzed company on the stock exchange or on the market by quoting bid and ask prices (i.e. acts as a market maker or liquidity provider in the securities of the analyzed company or in any related derivatives). Key 4: The analyzed company and UniCredit Bank AG, UniCredit Bank AG London Branch, UniCredit Bank AG Vienna Branch, UniCredit Bank AG Milan Branch, UniCredit Securities, UniCredit Menkul Değerler A.Ş., Zagrebačka banka and UniCredit Bulbank and/or a company affiliated (pursuant to relevant domestic law) concluded an agreement on services in connection with investment banking transactions in the last 12 months, in return for which the Bank received a consideration or promise of consideration.
25 October 2011 Credit Research
Sector Report
UniCredit Research page 108 See last pages for disclaimer.
Key 5: The analyzed company and UniCredit Bank AG, UniCredit Bank AG London Branch, UniCredit Bank AG Vienna Branch, UniCredit Bank AG Milan Branch, UniCredit Securities, UniCredit Menkul Değerler A.Ş., Zagrebačka banka and UniCredit Bulbank and/or a company affiliated (pursuant to relevant domestic law) have concluded an agree-ment on the preparation of analyses. Key 6a: Employees of UniCredit Bank AG Milan Branch and/or members of the Board of Directors of UniCredit (pursuant to relevant domestic law) are members of the Board of Directors of the Issuer. Members of the Board of Directors of the Issuer hold office in the Board of Directors of UniCredit (pursuant to relevant domestic law). Key 6b: The analyst is on the supervisory/management board of the company they cover. Key 7: UniCredit Bank AG Milan Branch and/or other Italian banks belonging to the UniCredit Group (pursuant to relevant domestic law) extended significant amounts of credit facilities to the Issuer. RECOMMENDATIONS, RATINGS AND EVALUATION METHODOLOGY Overview of our ratings You will find the history of rating regarding recommendation changes as well as an overview of the breakdown in absolute and relative terms of our investment ratings on our websites www.research.unicreditgroup.eu and www.cib-unicredit.com/research-disclaimer under the heading “Disclaimer.” Note on what the evaluation of equities is based: We currently use a three-tier recommendation system for the stocks in our formal coverage: Buy, Hold, or Sell (see definitions below): A Buy is applied when the expected total return over the next twelve months is higher than the stock's cost of equity. A Hold is applied when the expected total return over the next twelve months is lower than its cost of equity but higher than zero. A Sell is applied when the stock's expected total return over the next twelve months is negative. We employ three further categorizations for stocks in our coverage: Restricted: A rating and/or financial forecasts and/or target price is not disclosed owing to compliance or other regulatory considerations such as blackout period or conflict of interest. Coverage in transition: Due to changes in the research team, the disclosure of a stock's rating and/or target price and/or financial information are temporarily suspended. The stock remains in the research universe and disclosures of relevant information will be resumed in due course. Not rated: Suspension of coverage. Company valuations are based on the following valuation methods: Multiple-based models (P/E, P/cash flow, EV/sales, EV/EBIT, EV/EBITA, EV/EBITDA), peer-group compari-sons, historical valuation approaches, discount models (DCF, DVMA, DDM), break-up value approaches or asset-based evaluation methods. Furthermore, recommendations are also based on the Economic profit approach. Valuation models are dependent on macroeconomic factors, such as interest rates, exchange rates, raw materials, and on assump-tions about the economy. Furthermore, market sentiment affects the valuation of companies. The valuation is also based on expectations that might change rapidly and without notice, depending on developments specific to individual industries. Our recommendations and target prices derived from the models might therefore change accordingly. The investment ratings generally relate to a 12-month horizon. They are, however, also subject to market conditions and can only represent a snapshot. The ratings may in fact be achieved more quickly or slowly than expected, or need to be revised upward or downward. Note on the bases of evaluation for interest-bearing securities: Our investment ratings are in principle judgments relative to an index as a benchmark. Issuer level: Marketweight: We recommend having the same portfolio exposure in the name as the respective reference index (the iBoxx index universe for high-grade names and the ML EUR HY index for sub-investment grade names). Overweight: We recommend having a higher portfolio exposure in the name as the respective reference index (the iBoxx index universe for high-grade names and the ML EUR HY index for sub-investment grade names). Underweight: We recommend having a lower portfolio exposure in the name as the respective reference index (the iBoxx index universe for high-grade names and the ML EUR HY index for sub-investment grade names). Instrument level: Core hold: We recommend holding the respective instrument for investors who already have exposure. Sell: We recommend selling the respective instrument for investors who already have exposure. Buy: We recommend buying the respective instrument for investors who already have exposure. Trading recommendations for fixed-interest securities mostly focus on the credit spread (yield difference between the fixed-interest security and the relevant government bond or swap rate) and on the rating views and methodologies of recognized agencies (S&P, Moody’s, Fitch). Depending on the type of investor, investment ratings may refer to a short period or to a 6 to 9-month horizon. Please note that the provision of securities services may be subject to restrictions in certain jurisdictions. You are required to acquaint your-self with local laws and restrictions on the usage and the availability of any services described herein. The information is not intended for distribution to or use by any person or entity in any jurisdiction where such distribution would be contrary to the applicable law or provisions. The prices used in the analysis are the closing prices of the appropriate local trading system or the closing prices on the relevant local stock exchanges available on the men-tioned date at 23:59 CET, unless otherwise specified. In the case of unlisted stocks, the average market prices based on various major broker sources (OTC market) on the mentioned date at 23:59 CET, unless otherwise specified, are used. The MSCI sourced information is the exclusive property of Morgan Stanley Capital International Inc. (MSCI). Without prior written permission of MSCI, this information and any other MSCI intellectual property may not be reproduced, redisseminated or used to create any financial products, including any indices. This information is provided on an “as is” basis. The user assumes the entire risk of any use made of this information. MSCI, its affiliates and any third party involved in, or related to, computing or compiling the informa-tion hereby expressly disclaim all warranties of originality, accuracy, completeness, merchantability or fitness for a particular purpose with respect to any of this information. Without limiting any of the foregoing, in no event shall MSCI, any of its affiliates or any third party involved in, or related to, computing or compiling the information have any liability for any damages of any kind. MSCI, Morgan Stanley Capital International and the MSCI indices are services marks of MSCI and its affiliates. The Global Industry Classification Standard (GICS) was developed by and is the exclusive property of Morgan Stanley Capital International Inc. and Standard & Poor’s. GICS is a service mark of MSCI and S&P and has been licensed for use by UniCredit Bank AG. Coverage Policy A list of the companies covered by UniCredit Bank AG, UniCredit Bank AG London Branch, UniCredit Bank AG Vienna Branch, UniCredit Bank AG Milan Branch, UniCredit Securities, UniCredit Menkul Değerler A.Ş., Zagrebačka banka and UniCredit Bulbank is available upon request. Frequency of reports and updates It is intended that each of these companies be covered at least once a year, in the event of key operations and/or changes in the recommendation. Companies for which UniCredit Bank AG Milan Branch acts as Sponsor or Specialist must be covered in accordance with the regulations of the competent market authority. SIGNIFICANT FINANCIAL INTEREST: UniCredit Bank AG, UniCredit Bank AG London Branch, UniCredit Bank AG Vienna Branch, UniCredit Bank AG Milan Branch, UniCredit Securities, UniCredit Menkul Değerler A.Ş., Zagrebačka banka and UniCredit Bulbank and/or a company affiliated (pursuant to relevant national German, Italian, Austrian, UK, Russian and Turkish law) with them regularly trade shares of the analyzed company. UniCredit Bank AG, UniCredit Bank AG London Branch, UniCredit Bank AG Vienna Branch, UniCredit Bank AG Milan Branch, UniCredit Securities, UniCredit Menkul Değerler A.Ş., Zagrebačka banka and UniCredit Bulbank may hold significant open derivative positions on the stocks of the company which are not delta-neutral. Analyses may refer to one or several companies and to the securities issued by them. In some cases, the analyzed issuers have actively supplied information for this analysis. ANALYST DECLARATION The author’s remuneration has not been, and will not be, geared to the recommendations or views expressed in this study, neither directly nor indirectly.
ORGANIZATIONAL AND ADMINISTRATIVE ARRANGEMENTS TO AVOID AND PREVENT CONFLICTS OF INTEREST To prevent or remedy conflicts of interest, UniCredit Bank AG, UniCredit Bank AG London Branch, UniCredit Bank AG Vienna Branch, UniCredit Bank AG Milan Branch, UniCredit Securities, UniCredit Menkul Değerler A.Ş., Zagrebačka banka and UniCredit Bulbank have established the organizational arrangements required from a legal and
25 October 2011 Credit Research
Sector Report
UniCredit Research page 109 See last pages for disclaimer.
supervisory aspect, adherence to which is monitored by its compliance department. Conflicts of interest arising are managed by legal and physical and non-physical barriers (collectively referred to as “Chinese Walls”) designed to restrict the flow of information between one area/department of UniCredit Bank AG, UniCredit Bank AG London Branch, UniCredit Bank AG Vienna Branch, UniCredit Bank AG Milan Branch, UniCredit Securities, UniCredit Menkul Değerler A.Ş., Zagrebačka banka and UniCredit Bulbank and an-other. In particular, Investment Banking units, including corporate finance, capital market activities, financial advisory and other capital raising activities, are segregated by physi-cal and non-physical boundaries from Markets Units, as well as the research department. In the case of equities execution by UniCredit Bank AG Milan Branch, other than as a matter of client facilitation or delta hedging of OTC and listed derivative positions, there is no proprietary trading. Disclosure of publicly available conflicts of interest and other material interests is made in the research. Analysts are supervised and managed on a day-to-day basis by line managers who do not have responsibility for Investment Banking activities, including corporate finance activities, or other activities other than the sale of securities to clients.
ADDITIONAL REQUIRED DISCLOSURES UNDER THE LAWS AND REGULATIONS OF JURISDICTIONS INDICATED Notice to Australian investors This publication is intended for wholesale clients in Australia subject to the following: UniCredit Bank AG (UCB AG) and its branches do not hold an Australian Financial Services licence but are exempt from the requirement to hold a licence under the Act in re-spect of the financial services to wholesale clients. UCB AG and its branches are regulated by BaFin under German laws, which differ from Australian laws. This document is only for distribution to wholesale clients as defined in Section 761G of the Corporations Act. UCB AG and its branches are not Authorised Deposit Taking Institutions under the Banking Act 1959 and are not authorised to conduct a banking business in Australia. Notice to Austrian investors This document does not constitute or form part of any offer for sale or subscription of or solicitation of any offer to buy or subscribe for any securities and neither this document nor any part of it shall form the basis of, or be relied on in connection with or act as an inducement to enter into, any contract or commitment whatsoever. This document is confidential and is being supplied to you solely for your information and may not be reproduced, redistributed or passed on to any other person or published, in whole or part, for any purpose. Notice to Czech investors This report is intended for clients of UniCredit Bank AG, UniCredit Bank AG London Branch, UniCredit Bank AG Vienna Branch, UniCredit Bank AG Milan Branch, UniCredit Securities, UniCredit Menkul Değerler A.Ş., Zagrebačka banka and UniCredit Bulbank in the Czech Republic and may not be used or relied upon by any other person for any purpose. Notice to Italian investors This document is not for distribution to retail clients as defined in article 26, paragraph 1(e) of Regulation n. 16190 approved by CONSOB on 29 October 2007. In the case of a short note, we invite the investors to read the related company report that can be found on UniCredit Research website www.research.unicreditgroup.eu. Notice to Japanese investors This document does not constitute or form part of any offer for sale or subscription for or solicitation of any offer to buy or subscribe for any securities and neither this document nor any part of it shall form the basis of, or be relied on in connection with or act as an inducement to enter into, any contract or commitment whatsoever. Notice to Polish investors This document is intended solely for professional clients as defined in Art. 3 39b of the Trading in Financial Instruments Act of 29 July 2005.The publisher and distributor of the recommendation certifies that it has acted with due care and diligence in preparing the recommendation, however, assumes no liability for its completeness and accuracy. Notice to Russian investors As far as we are aware, not all of the financial instruments referred to in this analysis have been registered under the federal law of the Russian Federation "On the Securities Market" dated 22 April 1996, as amended (the "Law"), and are not being offered, sold, delivered or advertised in the Russian Federation. This analysis is intended for qualified investors, as defined by the Law, and shall not be distributed or disseminated to a general public and to any person, who is not a qualified investor. Notice to Turkish investors Investment information, comments and recommendations stated herein are not within the scope of investment advisory activities. Investment advisory services are provided in accordance with a contract of engagement on investment advisory services concluded with brokerage houses, portfolio management companies, non-deposit banks and the clients. Comments and recommendations stated herein rely on the individual opinions of the ones providing these comments and recommendations. These opinions may not suit your financial status, risk and return preferences. For this reason, to make an investment decision by relying solely on the information stated here may not result in consequences that meet your expectations. Notice to UK investors This communication is directed only at clients of UniCredit Bank AG, UniCredit Bank AG London Branch, UniCredit Bank AG Vienna Branch, UniCredit Bank AG Milan Branch, UniCredit Securities, UniCredit Menkul Değerler A.Ş., Zagrebačka banka or UniCredit Bulbank who (i) have professional experience in matters relating to investments or (ii) are persons falling within Article 49(2)(a) to (d) (“high net worth companies, unincorporated associations, etc.”) of the United Kingdom Financial Services and Markets Act 2000 (Financial Promotion) Order 2005 or (iii) to whom it may otherwise lawfully be communicated (all such persons together being referred to as “relevant persons”). This communica-tion must not be acted on or relied on by persons who are not relevant persons. Any investment or investment activity to which this communication relates is available only to relevant persons and will be engaged in only with relevant persons. Notice to U.S. investors This report is being furnished to U.S. recipients in reliance on Rule 15a-6 ("Rule 15a-6") under the U.S. Securities Exchange Act of 1934, as amended. Each U.S. recipient of this report represents and agrees, by virtue of its acceptance thereof, that it is such a "major U.S. institutional investor" (as such term is defined in Rule 15a-6) and that it understands the risks involved in executing transactions in such securities. Any U.S. recipient of this report that wishes to discuss or receive additional information regarding any security or issuer mentioned herein, or engage in any transaction to purchase or sell or solicit or offer the purchase or sale of such securities, should contact a registered representative of UniCredit Capital Markets, LLC (“UCI Capital Markets”). Any transaction by U.S. persons (other than a registered U.S. broker-dealer or bank acting in a broker-dealer capacity) must be effected with or through UCI Capital Markets. The securities referred to in this report may not be registered under the U.S. Securities Act of 1933, as amended, and the issuer of such securities may not be subject to U.S. reporting and/or other requirements. Available information regarding the issuers of such securities may be limited, and such issuers may not be subject to the same auditing and reporting standards as U.S. issuers. The information contained in this report is intended solely for certain "major U.S. institutional investors" and may not be used or relied upon by any other person for any purpose. Such information is provided for informational purposes only and does not constitute a solicitation to buy or an offer to sell any securities under the Securities Act of 1933, as amended, or under any other U.S. federal or state securities laws, rules or regulations. The investment opportunities discussed in this report may be unsuitable for certain inves-tors depending on their specific investment objectives, risk tolerance and financial position. In jurisdictions where UCI Capital Markets is not registered or licensed to trade in securities, commodities or other financial products, transactions may be executed only in accordance with applicable law and legislation, which may vary from jurisdiction to jurisdiction and which may require that a transaction be made in accordance with applicable exemptions from registration or licensing requirements. The information in this publication is based on carefully selected sources believed to be reliable, but UCI Capital Markets does not make any representation with respect to its completeness or accuracy. All opinions expressed herein reflect the author’s judgment at the original time of publication, without regard to the date on which you may receive such information, and are subject to change without notice. UCI Capital Markets may have issued other reports that are inconsistent with, and reach different conclusions from, the information presented in this report. These publications reflect the different assumptions, views and analytical methods of the analysts who prepared them. Past performance should not be taken as an indication or guarantee of future performance, and no representation or warranty, express or implied, is provided in relation to future performance. UCI Capital Markets and any company affiliated with it may, with respect to any securities discussed herein: (a) take a long or short position and buy or sell such securities; (b) act as investment and/or commercial bankers for issuers of such securities; (c) act as market makers for such securities; (d) serve on the board of any issuer of such securities; and (e) act as paid consultant or advisor to any issuer. The information contained herein may include forward-looking statements within the meaning of U.S. federal securities laws that are subject to risks and uncertainties. Factors that could cause a company’s actual results and financial condition to differ from expectations include, without limitation: political uncertainty, changes in general economic condi-tions that adversely affect the level of demand for the company’s products or services, changes in foreign exchange markets, changes in international and domestic financial markets and in the competitive environment, and other factors relating to the foregoing. All forward-looking statements contained in this report are qualified in their entirety by this cautionary statement. This document may not be distributed in Canada.
25 October 2011 Credit Research
Sector Report
UniCredit Research page 110 See last pages for disclaimer.
UniCredit Research* Thorsten Weinelt, CFA Global Head of Research & Chief Strategist +49 89 378-15110 [email protected]
Dr. Ingo Heimig Head of Research Operations +49 89 378-13952 [email protected]
Credit Research
Luis Maglanoc, CFA, Head +49 89 378-12708 [email protected]
Credit Strategy & Structured Credit Research Dr. Philip Gisdakis, Head Credit Strategy +49 89 378-13228 [email protected]
Dr. Tim Brunne Quantitative Credit Strategy +49 89 378-13521 [email protected]
Markus Ernst Credit Strategy & Structured Credit +49 89 378-14213 [email protected]
Dr. Stefan Kolek EEMEA Corporate Credits & Strategy +49 89 378-12495 [email protected]
Manuel Trojovsky Credit Strategy & Structured Credit +49 89 378-14145 [email protected]
Dr. Christian Weber, CFA Credit Strategy +49 89 378-12250 [email protected]
Financials Credit Research Franz Rudolf, CEFA, Head Covered Bonds +49 89 378-12449 [email protected]
Alexander Plenk, CFA, Deputy Head Banks +49 89 378-12429 [email protected]
Amey Dyckmans Sub-Sovereigns & Agencies +49 89 378-12004 [email protected]
Florian Hillenbrand, CFA Covered Bonds +49 89 378-12961 [email protected]
Dr. Tilo Höpker Banks +49 89 378-12960 [email protected]
Luis Maglanoc, CFA Insurance, Regulatory & Accounting Service +49 89 378-12708 [email protected]
Valentina Stadler Sub-Sovereigns & Agencies +49 89 378-16296 [email protected]
Emanuel Teuber Banks, Financial Services, Insurance +49 89 378-14245 [email protected]
Corporate Credit Research Stephan Haber, CFA, Co-Head Telecoms, Media, Technology +49 89 378-15192 [email protected]
Dr. Sven Kreitmair, CFA, Co-Head Automotive & Mobility +49 89 378-13246 [email protected]
Jana Arndt, CFA Basic Resources, Industrial G&S, Construction & Materials +49 89 378-13211 [email protected]
Dr. Manuel Herold Oil & Gas, Travel & Leisure +49 89 378-12650 [email protected]
Max Hüfner Chemicals, Aerospace & Defense, Packaging +49 89 378-13212 [email protected]
Susanne Reichhuber Utilities +49 89 378-13247 [email protected]
Rocco Schilling, CFA Consumers, Healthcare +49 89 378-15449 [email protected]
Kai Zirwes Industrial Transportation, Media, Pulp & Paper +49 89 378-11962 [email protected]
Publication Address
UniCredit Research Corporate & Investment Banking UniCredit Bank AG Arabellastrasse 12 D-81925 Munich Tel. +49 89 378-18927 Fax +49 89 378-18352
Bloomberg UCCR Internet www.research.unicreditgroup.eu
*UniCredit Research is the joint research department of UniCredit Bank AG (UniCredit Bank), UniCredit CAIB Group (UniCredit CAIB), UniCredit Securities (UniCredit Securities), UniCredit Menkul Değerler A.Ş. (UniCredit Menkul), Zagrebačka banka and UniCredit Bulbank.