Embed Size (px)
Citation preview
Sector profile: Agri-food and Drink
1 Compiled on behalf of the LLEP by Cambridge Econometrics
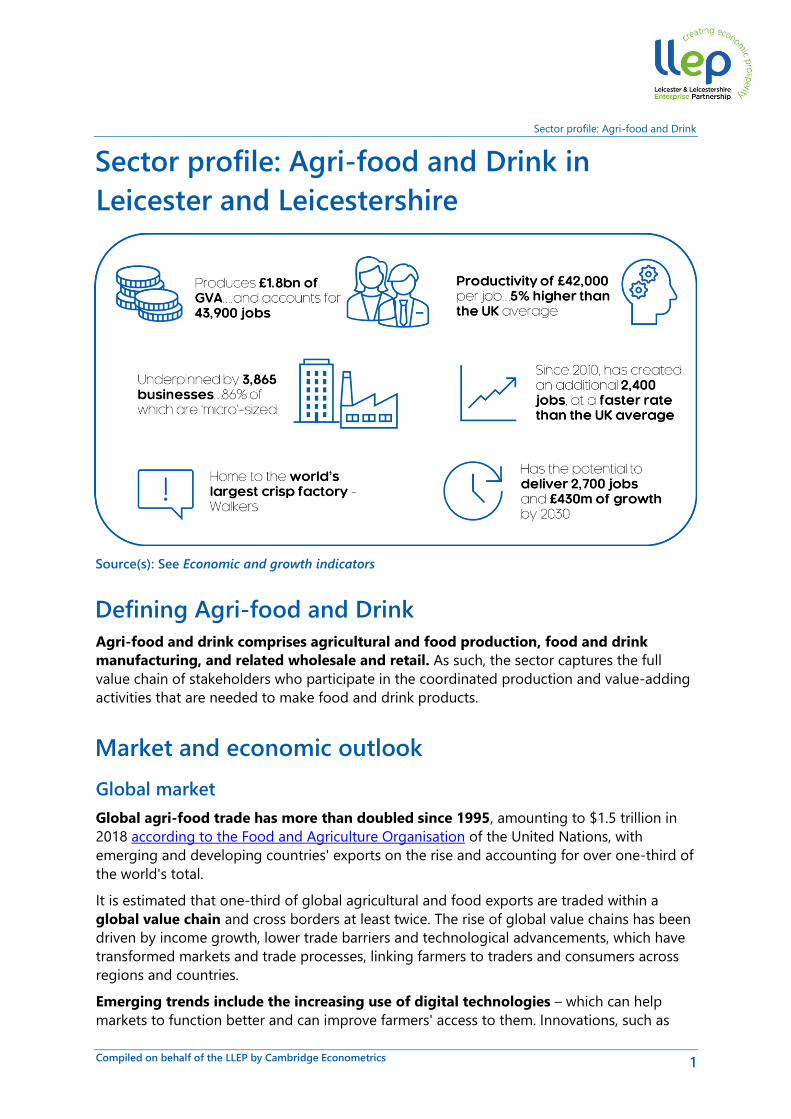
Sector profile: Agri-food and Drink in
Leicester and Leicestershire
Defining Agri-food and Drink
Agri-food and drink comprises agricultural and food production, food and drink
manufacturing, and related wholesale and retail. As such, the sector captures the full
value chain of stakeholders who participate in the coordinated production and value-adding
activities that are needed to make food and drink products.
Market and economic outlook
Global market
Global agri-food trade has more than doubled since 1995, amounting to $1.5 trillion in
2018 according to the Food and Agriculture Organisation of the United Nations, with
emerging and developing countries' exports on the rise and accounting for over one-third of
the world's total.
It is estimated that one-third of global agricultural and food exports are traded within a
global value chain and cross borders at least twice. The rise of global value chains has been
driven by income growth, lower trade barriers and technological advancements, which have
transformed markets and trade processes, linking farmers to traders and consumers across
regions and countries.
Emerging trends include the increasing use of digital technologies – which can help
markets to function better and can improve farmers' access to them. Innovations, such as
Source(s): See Economic and growth indicators
.
Sector profile: Agri-food and Drink
2 Compiled on behalf of the LLEP by Cambridge Econometrics
food e-commerce, can benefit both farmers and consumers. The evolution of trade and
markets will continue to be driven by technological progress; urbanization; population
and income growths; lower transport costs; trade policies and a decline in average import
tariffs.
Sustainability is another challenge facing agri-food markets globally. The promotion
and wider application of voluntary sustainability certification schemes and standards in
agriculture, are likely to increase as they can address trade-offs between economic,
environmental and social objectives. Sustainability certification schemes can promote fair
trade, inclusion, non-discrimination, and environmentally-friendly farm practices. They also
can ensure occupational safety, ban child labour, and encourage investments. However,
there remains significant progress to be made - whilst bananas are one of the most traded
tropical commodities in the world, only an estimated 5-8 percent are covered under
sustainability standards.
COVID-19 impacts have led to severe and widespread increases in global food
insecurity, affecting vulnerable households in almost every country, with impacts expected
to continue through 2021 and into 2022. Covid-19 has disrupted land management and
preparation, planting, processing, harvesting, animal husbandry, transport to market, and
market transactions. Global food prices have risen by 40% since January 2020. Maize prices
are 66% higher, wheat prices are 23% higher and cereal prices are 45% higher than in
January 2020.
Surging prices reflect strong demand, along with weather uncertainties,
macroeconomic conditions, and COVID-19-related supply disruptions. Numerous
countries are experiencing high food price inflation at the retail level, reflecting lingering
supply disruptions due to COVID-19 social distancing measures, currency devaluations, and
other factors. Rising food prices have a greater impact on people in low- and middle-income
countries since they spend a larger share of their income on food than people in high-
income countries.
UK market
In the UK, the agri-food sector accounted for a total estimated GVA of £120 billion, or
6.3% of the total, employing 4 million. In the UK, 72% of land is utilised for agriculture,
with 476,000 employed. Agriculture contributes 1.45% to UK GDP. The value of food, feed
and drink (FFD) exports was £23.6 billion in 2018/19 and the value of food, feed and drink
imports as £47.9 billion. As a result, the trade gap in food, feed and drink was £24.3 billion.
The food and drink sector is the UK’s largest manufacturing sector, contributing £28
billion to the economy annually and employing over 430,000 people. Representing almost 20
per cent of total UK manufacturing, the food and drink industry has a turnover of £105
billion. Exports of food and drink make an important contribution to the economy, are worth
£23bn and go to over 220 countries worldwide. The top 3 export partners are Ireland, the
USA and France.
Sector profile: Agri-food and Drink
3 Compiled on behalf of the LLEP by Cambridge Econometrics
Business impacts of Covid-19 and Brexit
The UK’s Agriculture sector is being buffeted by a range of acute challenges. There is
the transition to a new policy framework and the ending of direct payments to farmers after
the UK’s departure from the EU. Policy is now being shaped by the desire to deliver public
benefits, notably environmental goods, rather than income support. In England, the phasing
out of direct payment over the 7-year agricultural transition and introduction of the new
Environmental Land Management (ELM) scheme presents many challenges. The loss of direct
payments will leave many farm businesses under financial pressure unless they evolve.
Defra’s Farm business survey data suggests that the grazing livestock and cereal sectors are
most vulnerable, with a high proportion of their profits coming from support payments.
Performance varies enormously between farmers. Agriculture and Horticulture
Development Board (AHDB) analysis shows that a staggering 70% of variations in business
performance are down to the decisions farmers make. Just 5% of the variation in business
performance is down to geographic factors like soil and climate. DEFRA statistics (Agriculture
in the UK, 2019) noted that one-fifth of UK farms failed to make a positive Farm Business
Income (FBI) in 2018/19.
Labour costs are set to rise for the Agri-food and drink sector. Free movement of labour
between the UK and the EU ended on 31 December, leaving the industry exposed to a
significant future recruitment challenge. In a normal year over 95 per cent of the 60-70,000
seasonal, casual and gang labour jobs across agriculture and horticulture are filled by EU
nationals. High numbers are also found in the food manufacturing sector, with migrant
workers making up about 40 per cent of the workforce. With these changes it looks like the
industry will need to compete with other sectors to recruit domestic workers.
Prior to Covid-19 hitting the UK, investment in the food and drink manufacturing
sector had already begun to fall in late 2019, while GVA and exports had seen growth
over the year. Productivity had started to decline after reaching a 12-year high in 2017.
Current circumstances have been challenging for the sector. The onset of the pandemic, and
subsequent lockdown, led to domestic turnover falling by 8.6% in Q1 compared with Q4
2019, and a further 4.0% decline in Q2. As the UK officially entered recession, GVA in the
industry was also down (year-on-year) for the seventh consecutive month in June. According
to FDF survey data, net business confidence declined in both Q1 and Q2. Members are also
facing increased costs. 48% reported increased costs of stockpiling in Q1, 40% increased
ingredient costs in Q2 and over one third reported import costs rising by 5% or more. The
challenge now is to successfully restart all sectors of the industry, protect food industry
employees and customers, and support businesses in each sector of the food chain through
to recovery.
As a result of Covid-19, many food & drink businesses have replaced some of their B2B
customers with direct B2C sales. As a result of COVID and the temporary collapse of the
hospitality sector, many Agri-food and Drink businesses have by necessity partially replaced
their B2B customers in the hospitality sector by expansion into direct B2C sales – particularly
in the supply of more profitable quality food and drink. Some businesses are now saying that
in the future they see B2C as a much larger possibility particularly as the industry view is that
hospitality may never get back to pre-COVID levels (for example, the risk that there are much
lower city centre footfalls due to the continuance of home working as a default).
Sector profile: Agri-food and Drink
4 Compiled on behalf of the LLEP by Cambridge Econometrics
Brexit brings further challenges in terms of maintaining uninterrupted supply of imported
food and ingredients to all parts of the UK.
Activities and key organisations in Leicester and
Leicestershire
As with large parts of the UK, the economy of Leicester and its county was based on
agriculture which produced food and drink for the local population. The industrial
revolution during the 18th and 19th centuries saw rapid and extensive growth in the city of
Leicester and outlying towns such as Coalville, Market Harborough and Loughborough. The
ethnic diversity of Leicester and its environs has given rise to a much broader range of Agri-
food and Drink sector capabilities than may be found in other parts of the UK. The more
traditional pork pie and Stilton cheese production located around the town of Melton
Mowbray in the east of the LLEP area has given rise to a growing ‘premium brand’ image
which is being successfully developed, based on the town as ‘The Rural Capital of Food’.
Notable sides for the Food and drink industry include the Leicester Food Park and the
Melton Food Enterprise Zone (FEZ).
Significant agricultural and farming businesses and operations include Pilgrims, Britain’s
biggest provider of higher welfare pork and sustainable pig farming; Clawson’s Dairy –
producer of Blue Stilton, Blue Shropshire and Rutland Red cheeses; Woodhouse Farm,
producing Tamworth Pigs.
There are a number of long-established food and drink manufacturers in the area,
many with household names such as Walkers snack foods – a subsidiary of US giant PepsiCo,
Everard’s the brewers, Pedigree (part of Mars Corporation) and United Biscuits, one of the
UK’s largest producers of biscuits and snack foods, and Samworth Brothers Ltd – whose
products include Ginsters and West Cornwall Pasties, Melton Mowbray Pork Pies, Walkers
Sausage Co., and SCI-MX products. Recent growth firms include prize-winning Stilton cheese
producers Long Clawson Dairy Ltd, Pukka Pies, Lakshmi & Sons, and Fresh-Pak Chilled Foods.
Altogether there are around 200 F&D manufacturing businesses in the area producing
a wide range of products, but with a prevalence of bread and pastry bakeries, meat
products and snack food providers. The ethnic diversity of the area is also represented by the
sector with a number of producers of spices, sauces and traditional Indian foods.
University and R&D expertise
The UK Centre for Ecology and Hydrology (UKCEH), based at the University of Leicester
plays a prominent role in peatland research and management. The university also runs a
number of courses on agricultural and related sciences, including Environmental Science,
Applied and Environmental Geology, Zoology, and Geography.
The University of Loughborough is a global leader in sports nutrition research, offering
support to athletes for performance nutrition.
De Montfort University offers courses on nutrition as part of its life sciences and medical
courses.
Sector profile: Agri-food and Drink
5 Compiled on behalf of the LLEP by Cambridge Econometrics
The Allerton Project researches the effects of different farming methods on wildlife and the
environment, sharing results of its research through advisory and educational activities. This
is undertaken on the project’s 320-hectare demonstration farm based in Leicestershire. The
Allerton Project identifies management that delivers multiple benefits for our rural
landscape. Its work covers natural capital accounting, agri-environment schemes and
regenerative farming systems.
From soil and water, to woodland and environmental habitat that increases biodiversity, the
project’s aim is to build farmland resilience. The project’s research team collaborate with
other research organisations and help co-supervise numerous PhD and MSc projects. Visitors
to the project include businesses, policy makers, non-government organisations, regulators,
farmers, advisors, students and schools. The Allerton Project is an award winning, pioneering
blueprint for future rural landscapes.
Economic and growth indicators
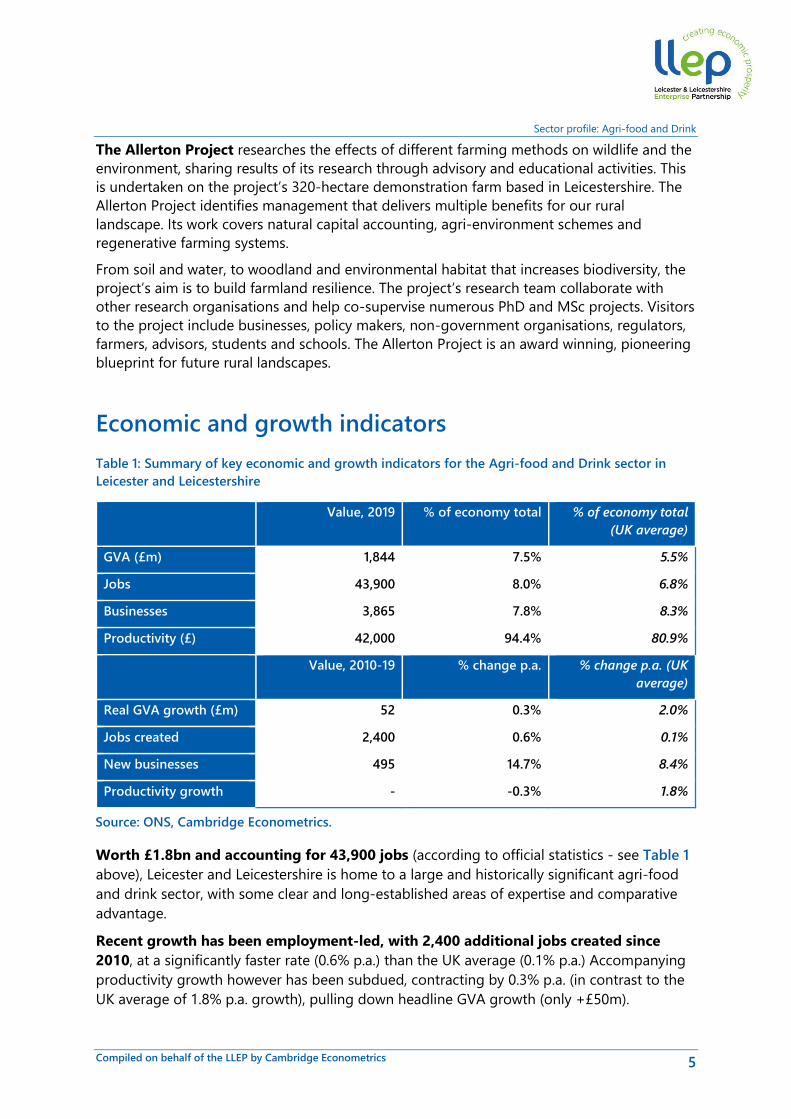
Table 1: Summary of key economic and growth indicators for the Agri-food and Drink sector in
Leicester and Leicestershire
Value, 2019 % of economy total % of economy total
(UK average)
GVA (£m) 1,844 7.5% 5.5%
Jobs 43,900 8.0% 6.8%
Businesses 3,865 7.8% 8.3%
Productivity (£) 42,000 94.4% 80.9%
Value, 2010-19 % change p.a. % change p.a. (UK
average)
Real GVA growth (£m) 52 0.3% 2.0%
Jobs created 2,400 0.6% 0.1%
New businesses 495 14.7% 8.4%
Productivity growth - -0.3% 1.8%
Worth £1.8bn and accounting for 43,900 jobs (according to official statistics - see Table 1
above), Leicester and Leicestershire is home to a large and historically significant agri-food
and drink sector, with some clear and long-established areas of expertise and comparative
advantage.
Recent growth has been employment-led, with 2,400 additional jobs created since
2010, at a significantly faster rate (0.6% p.a.) than the UK average (0.1% p.a.) Accompanying
productivity growth however has been subdued, contracting by 0.3% p.a. (in contrast to the
UK average of 1.8% p.a. growth), pulling down headline GVA growth (only +£50m).
Source: ONS, Cambridge Econometrics.
Sector profile: Agri-food and Drink
6 Compiled on behalf of the LLEP by Cambridge Econometrics
The sector remains some 8% more productive in Leicester and Leicestershire than the
UK average, however, highlighting the strength and expertise of the sector locally, though
this was down on a decade ago, where local activity was some 20% more productive.
The sector is comprised of almost 4,000 local businesses, of which 86% are ‘micro’-sized
(employing <9 people). An additional 495 agri-food and drink businesses have been
established in the LLEP area since 2010.
Additional evidence and research
Additional indicators and research on the sector in Leicester and Leicestershire show:
• DEFRA data highlights the size and strength of the local livestock sector; in 2017,
despite representing 15% of farmable land in the East Midlands, Leicestershire
accounted for more than a third of all dairy cattle (39,600 livestock) in the region, and
almost a quarter of all beef cattle (83,400) and sheep (298,900).
• The same dataset showed 188,600 hectares of farmable land were present in the
county, of which 171,100 hectares are utilised for arable crops, and only 400 hectares
for horticultural crops. 17,100 hectares is dedicated to livestock and other uses
• BEIS estimates the sector has helped reduce agricultural CO2 emissions by 9% in
Leicestershire since 2005, though this is lower than the East Midlands average (12%)
Sector profile: Agri-food and Drink
7 Compiled on behalf of the LLEP by Cambridge Econometrics
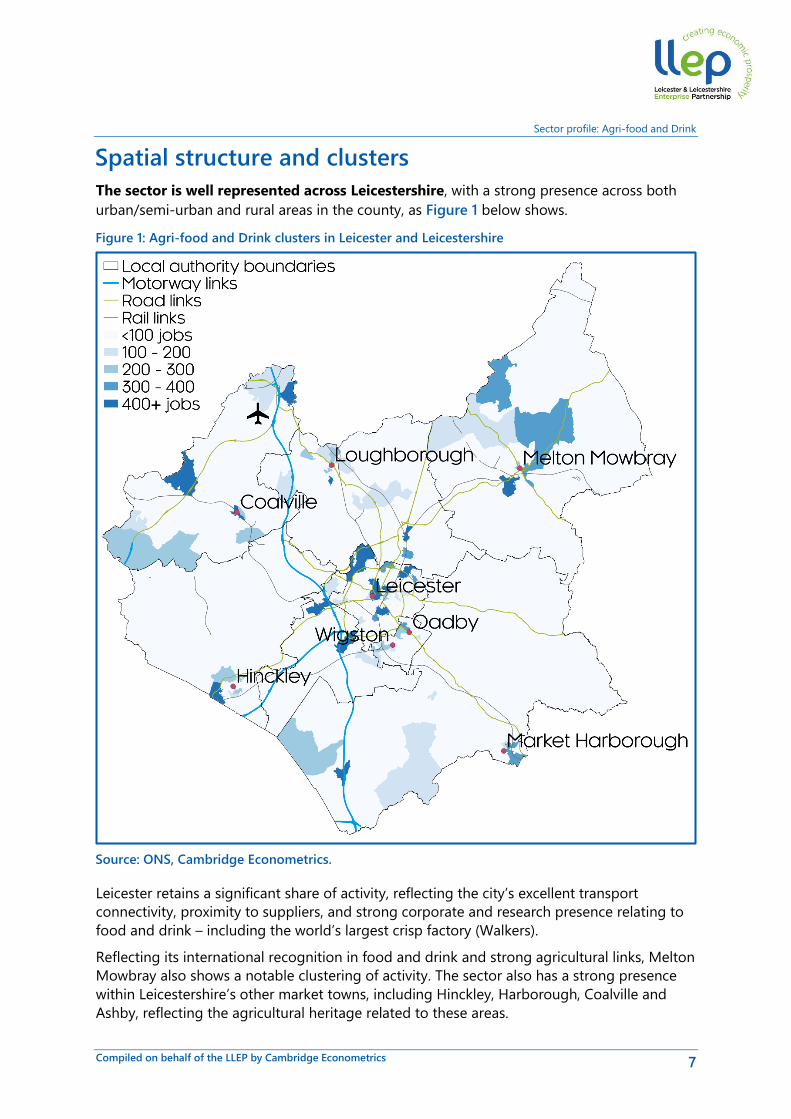
Spatial structure and clusters
The sector is well represented across Leicestershire, with a strong presence across both
urban/semi-urban and rural areas in the county, as Figure 1 below shows.
Leicester retains a significant share of activity, reflecting the city’s excellent transport
connectivity, proximity to suppliers, and strong corporate and research presence relating to
food and drink – including the world’s largest crisp factory (Walkers).
Reflecting its international recognition in food and drink and strong agricultural links, Melton
Mowbray also shows a notable clustering of activity. The sector also has a strong presence
within Leicestershire’s other market towns, including Hinckley, Harborough, Coalville and
Ashby, reflecting the agricultural heritage related to these areas.
Figure 1: Agri-food and Drink clusters in Leicester and Leicestershire
Source: ONS, Cambridge Econometrics.
Sector profile: Agri-food and Drink
8 Compiled on behalf of the LLEP by Cambridge Econometrics
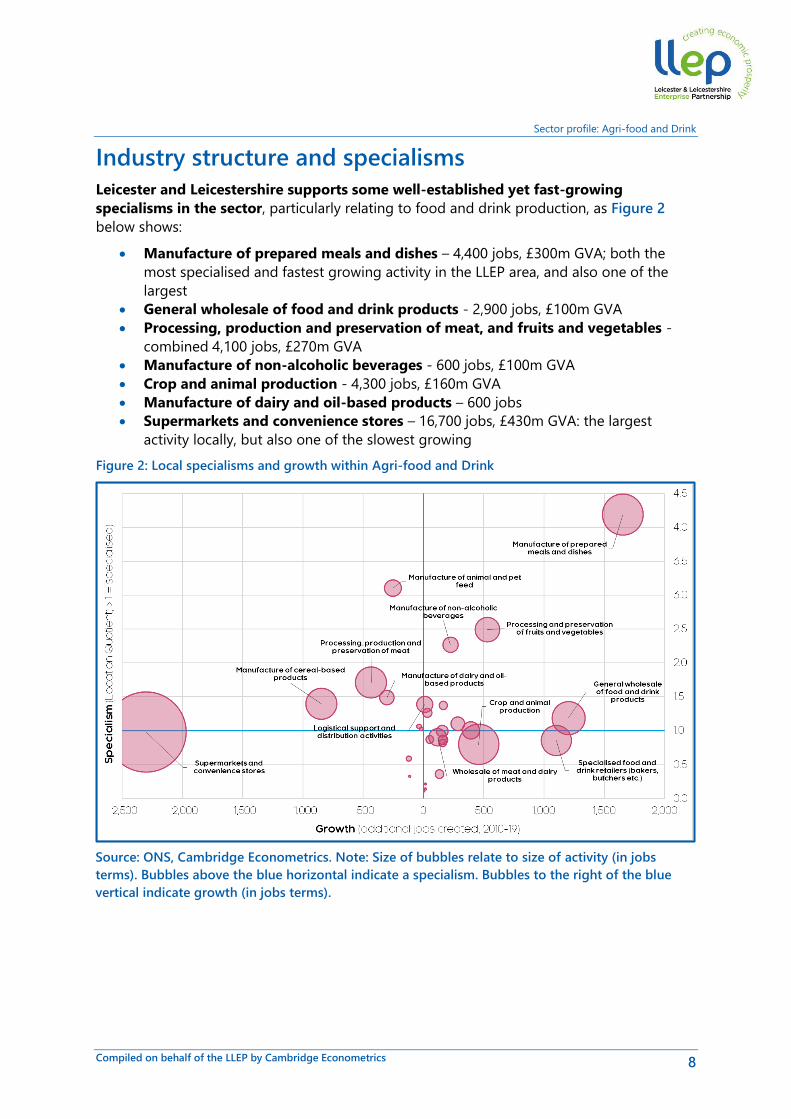
Industry structure and specialisms
Leicester and Leicestershire supports some well-established yet fast-growing
specialisms in the sector, particularly relating to food and drink production, as Figure 2
below shows:
• Manufacture of prepared meals and dishes – 4,400 jobs, £300m GVA; both the
most specialised and fastest growing activity in the LLEP area, and also one of the
largest
• General wholesale of food and drink products - 2,900 jobs, £100m GVA
• Processing, production and preservation of meat, and fruits and vegetables -
combined 4,100 jobs, £270m GVA
• Manufacture of non-alcoholic beverages - 600 jobs, £100m GVA
• Crop and animal production - 4,300 jobs, £160m GVA
• Manufacture of dairy and oil-based products – 600 jobs
• Supermarkets and convenience stores – 16,700 jobs, £430m GVA: the largest
activity locally, but also one of the slowest growing
Figure 2: Local specialisms and growth within Agri-food and Drink
Source: ONS, Cambridge Econometrics. Note: Size of bubbles relate to size of activity (in jobs
terms). Bubbles above the blue horizontal indicate a specialism. Bubbles to the right of the blue
vertical indicate growth (in jobs terms).
Sector profile: Agri-food and Drink
9 Compiled on behalf of the LLEP by Cambridge Econometrics
Sector prospects in Leicester and Leicestershire
Economic impact and recovery from Covid-19 and Brexit
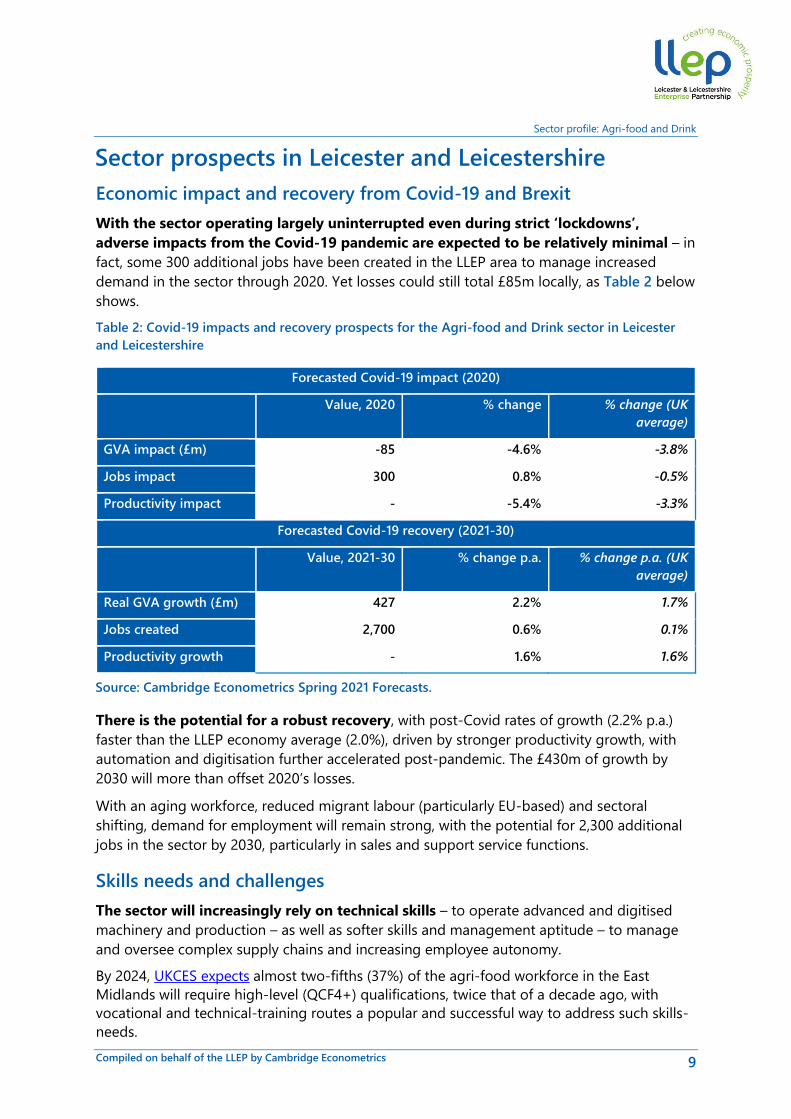
With the sector operating largely uninterrupted even during strict ‘lockdowns’,
adverse impacts from the Covid-19 pandemic are expected to be relatively minimal – in
fact, some 300 additional jobs have been created in the LLEP area to manage increased
demand in the sector through 2020. Yet losses could still total £85m locally, as Table 2 below
shows.
Table 2: Covid-19 impacts and recovery prospects for the Agri-food and Drink sector in Leicester
and Leicestershire
Forecasted Covid-19 impact (2020)
Value, 2020 % change % change (UK
average)
GVA impact (£m) -85 -4.6% -3.8%
Jobs impact 300 0.8% -0.5%
Productivity impact - -5.4% -3.3%
Forecasted Covid-19 recovery (2021-30)
Value, 2021-30 % change p.a. % change p.a. (UK
average)
Real GVA growth (£m) 427 2.2% 1.7%
Jobs created 2,700 0.6% 0.1%
Productivity growth - 1.6% 1.6%
There is the potential for a robust recovery, with post-Covid rates of growth (2.2% p.a.)
faster than the LLEP economy average (2.0%), driven by stronger productivity growth, with
automation and digitisation further accelerated post-pandemic. The £430m of growth by
2030 will more than offset 2020’s losses.
With an aging workforce, reduced migrant labour (particularly EU-based) and sectoral
shifting, demand for employment will remain strong, with the potential for 2,300 additional
jobs in the sector by 2030, particularly in sales and support service functions.
Skills needs and challenges
The sector will increasingly rely on technical skills – to operate advanced and digitised
machinery and production – as well as softer skills and management aptitude – to manage
and oversee complex supply chains and increasing employee autonomy.
By 2024, UKCES expects almost two-fifths (37%) of the agri-food workforce in the East
Midlands will require high-level (QCF4+) qualifications, twice that of a decade ago, with
vocational and technical-training routes a popular and successful way to address such skills-
needs.
Source: Cambridge Econometrics Spring 2021 Forecasts.
Sector profile: Agri-food and Drink
10 Compiled on behalf of the LLEP by Cambridge Econometrics
Yet uncertainty relating to the availability of migrant labour could also push up demand for
lower-skilled, manual-based roles, whilst the sector has the potential to continue providing
good, well-paid opportunities for those without higher-level qualifications.
Sector profile: Agri-food and Drink
11 Compiled on behalf of the LLEP by Cambridge Econometrics
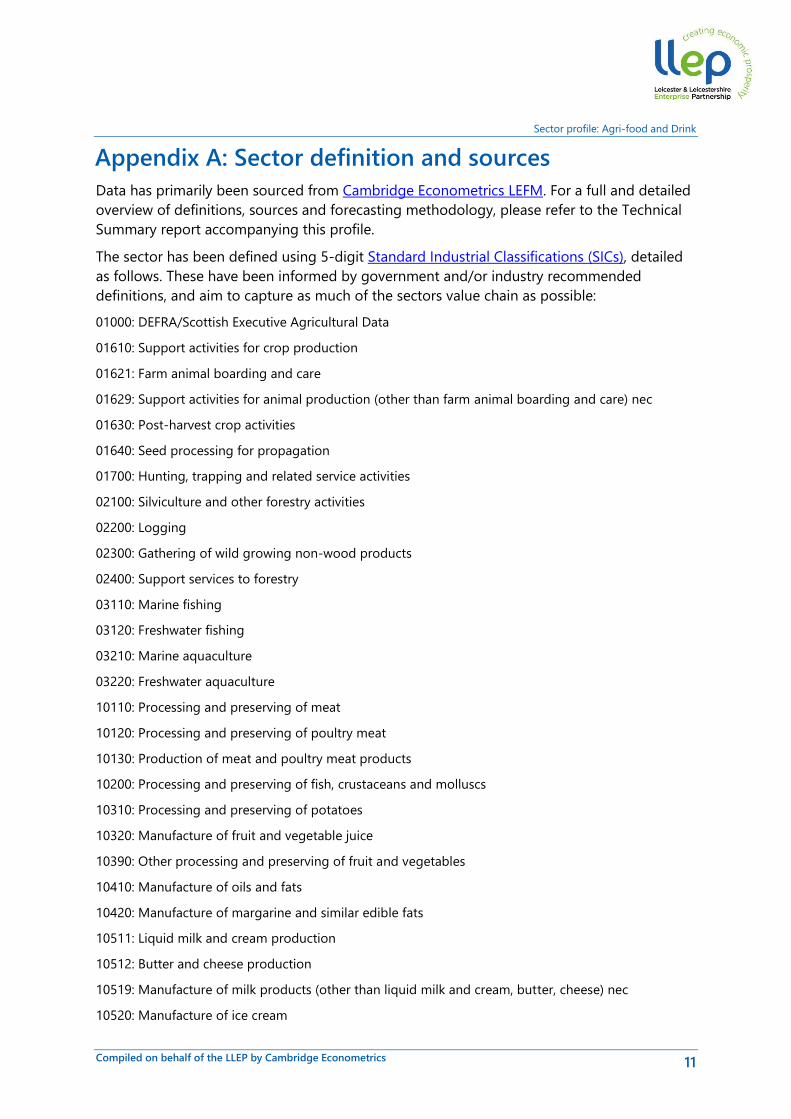
Appendix A: Sector definition and sources
Data has primarily been sourced from Cambridge Econometrics LEFM. For a full and detailed
overview of definitions, sources and forecasting methodology, please refer to the Technical
Summary report accompanying this profile.
The sector has been defined using 5-digit Standard Industrial Classifications (SICs), detailed
as follows. These have been informed by government and/or industry recommended
definitions, and aim to capture as much of the sectors value chain as possible:
01000: DEFRA/Scottish Executive Agricultural Data
01610: Support activities for crop production
01621: Farm animal boarding and care
01629: Support activities for animal production (other than farm animal boarding and care) nec
01630: Post-harvest crop activities
01640: Seed processing for propagation
01700: Hunting, trapping and related service activities
02100: Silviculture and other forestry activities
02200: Logging
02300: Gathering of wild growing non-wood products
02400: Support services to forestry
03110: Marine fishing
03120: Freshwater fishing
03210: Marine aquaculture
03220: Freshwater aquaculture
10110: Processing and preserving of meat
10120: Processing and preserving of poultry meat
10130: Production of meat and poultry meat products
10200: Processing and preserving of fish, crustaceans and molluscs
10310: Processing and preserving of potatoes
10320: Manufacture of fruit and vegetable juice
10390: Other processing and preserving of fruit and vegetables
10410: Manufacture of oils and fats
10420: Manufacture of margarine and similar edible fats
10511: Liquid milk and cream production
10512: Butter and cheese production
10519: Manufacture of milk products (other than liquid milk and cream, butter, cheese) nec
10520: Manufacture of ice cream
Sector profile: Agri-food and Drink
12 Compiled on behalf of the LLEP by Cambridge Econometrics
10611: Grain milling
10612: Manufacture of breakfast cereals and cereals-based foods
10620: Manufacture of starches and starch products
10710: Manufacture of bread; manufacture of fresh pastry goods and cakes
10720: Manufacture of rusks and biscuits; manufacture of preserved pastry goods and cakes
10730: Manufacture of macaroni, noodles, couscous and similar farinaceous products
10810: Manufacture of sugar
10821: Manufacture of cocoa, and chocolate confectionery
10822: Manufacture of sugar confectionery
10831: Tea processing
10832: Production of coffee and coffee substitutes
10840: Manufacture of condiments and seasonings
10850: Manufacture of prepared meals and dishes
10860: Manufacture of homogenised food preparations and dietetic food
10890: Manufacture of other food products nec
10910: Manufacture of prepared feeds for farm animals
10920: Manufacture of prepared pet foods
11010: Distilling, rectifying and blending of spirits
11020: Manufacture of wine from grape
11030: Manufacture of cider and other fruit wines
11040: Manufacture of other non-distilled fermented beverages
11050: Manufacture of beer
11060: Manufacture of malt
11070: Manufacture of soft drinks; production of mineral waters and other bottled waters
20150: Manufacture of fertilisers and nitrogen compounds
20200: Manufacture of pesticides and other agrochemical products
28301: Manufacture of agricultural tractors
28302: Manufacture of agricultural and forestry machinery (other than agricultural tractors)
28930: Manufacture of machinery for food, beverage and tobacco processing
46110: Agents involved in the sale of agricultural raw materials, live animals, textile raw materials and
semi-finished goods
46170: Agents involved in the sale of food, beverages and tobacco
46210: Wholesale of grain, unmanufactured tobacco, seeds and animal feeds
46220: Wholesale of flowers and plants
46230: Wholesale of live animals
Sector profile: Agri-food and Drink
13 Compiled on behalf of the LLEP by Cambridge Econometrics
46310: Wholesale of fruit and vegetables
46320: Wholesale of meat and meat products
46330: Wholesale of dairy products, eggs and edible oils and fats
46341: Wholesale of fruit and vegetable juices, mineral waters and soft drinks
46342: Wholesale of wine, beer, spirits and other alcoholic beverages
46360: Wholesale of sugar and chocolate and sugar confectionery
46370: Wholesale of coffee, tea, cocoa and spices
46380: Wholesale of other food, including fish, crustaceans and molluscs
46390: Non-specialised wholesale of food, beverages and tobacco
46610: Wholesale of agricultural machinery, equipment and supplies
47110: Retail sale in non-specialised stores with food, beverages or tobacco predominating
47210: Retail sale of fruit and vegetables in specialised stores
47220: Retail sale of meat and meat products in specialised stores
47230: Retail sale of fish, crustaceans and molluscs in specialised stores
47240: Retail sale of bread, cakes, flour confectionery and sugar confectionery in specialised stores
47250: Retail sale of beverages in specialised stores
47290: Other retail sale of food in specialised stores
47810: Retail sale via stalls and markets of food, beverages and tobacco products
49200: Freight rail transport (1.0% of SIC code only)
49410: Freight transport by road (7.5% of SIC code only)
50200: Sea and coastal freight water transport (1.2% of SIC code only)
50400: Inland freight water transport (1.2% of SIC code only)
51210: Freight air transport (0.1% of SIC code only)
52101: Operation of warehousing and storage facilities for water transport activities of division 50
(0.8% of SIC code only)
52102: Operation of warehousing and storage facilities for air transport activities of division 51 (0.8%
of SIC code only)
52103: Operation of warehousing and storage facilities for land transport activities of division 49 (0.8%
of SIC code only)
52211: Operation of rail freight terminals (0.8% of SIC code only)
52219: Other service activities incidental to land transportation, nec (not including operation of rail
freight terminals, passenger facilities at railway stations or passenger facilities at bus and coach
stations) (0.8% of SIC code only)
52220: Service activities incidental to water transportation (0.8% of SIC code only)
52230: Service activities incidental to air transportation (0.8% of SIC code only)
52241: Cargo handling for water transport activities of division 50 (0.8% of SIC code only)
52242: Cargo handling for air transport activities of division 51 (0.8% of SIC code only)
Sector profile: Agri-food and Drink
14 Compiled on behalf of the LLEP by Cambridge Econometrics
52243: Cargo handling for land transport activities of division 49 (0.8% of SIC code only)
52290: Other transportation support activities (0.8% of SIC code only)
64201: Activities of agricultural holding companies
72110: Research and experimental development on biotechnology
77310: Renting and leasing of agricultural machinery and equipment
82920: Packaging activities (0.8% of SIC code only)