Embed Size (px)
Citation preview
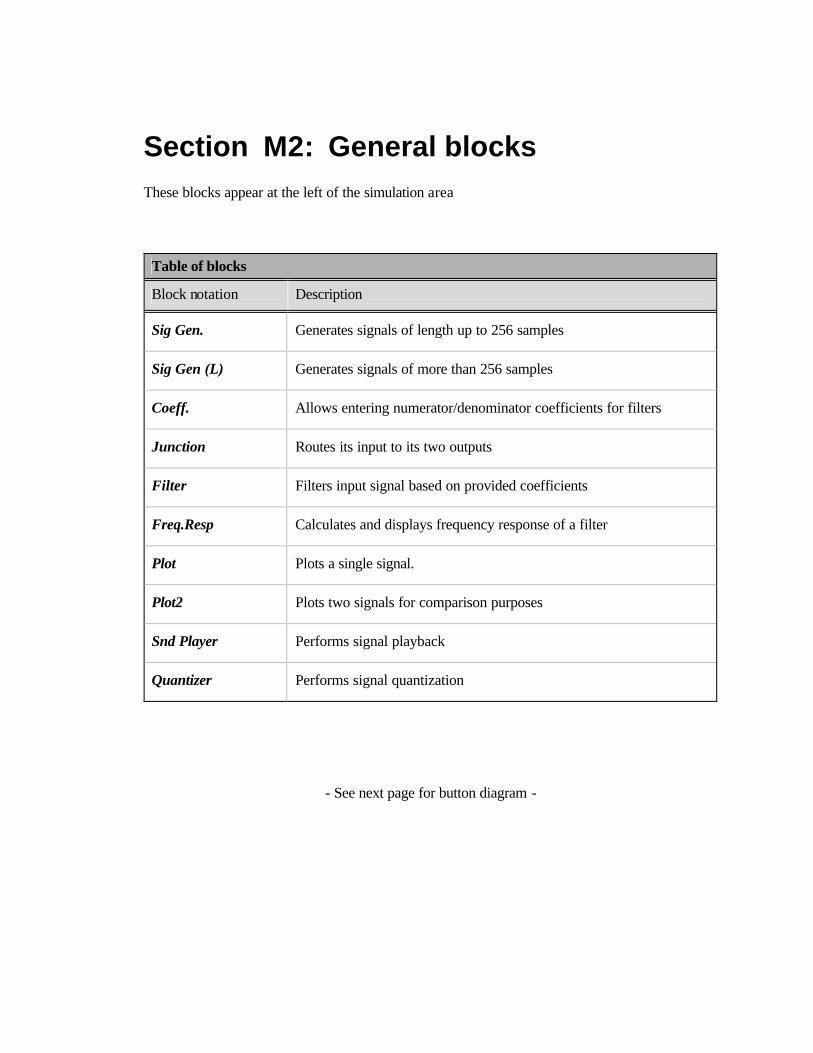
Section M2: General blocks These blocks appear at the left of the simulation area
Table of blocks
Block notation Description
Sig Gen. Generates signals of length up to 256 samples
Sig Gen (L) Generates signals of more than 256 samples
Coeff. Allows entering numerator/denominator coefficients for filters
Junction Routes its input to its two outputs
Filter Filters input signal based on provided coefficients
Freq.Resp Calculates and displays frequency response of a filter
Plot Plots a single signal.
Plot2 Plots two signals for comparison purposes
Snd Player Performs signal playback
Quantizer Performs signal quantization
- See next page for button diagram -

M2-2

M2-3
M2.1
Block name : Signal generator Notation: SigGen
Description: Generates a variety of time-domain signals. It supports: pulses, triangular, delta, exponential, sinusoid, sinc, random, and user-defined signals. The length of each signal (“pulse width”) and the amplitude of the signal (“gain”) can be set. A signal can be made periodic if the “periodic” option is selected. The base of the exponential can also be varied. Random signals can have uniform, normal, and Rayleigh distributions with variable mean and variance. Pin assignment:
Pin Description 1 Time-domain signal 2 1> 3 4
5
6
Dialog window(s):
(a)SigGen dialog window
Script use:
Name: siggen Example code: <param name = “3” value = “B3-siggen(3,1)”>

M2-4
M2.2
Block name : Long signal generator Notation: SigGen(L)
Description: This block produces 6 types of signals , i.e., male speech, female speech, music, white noise, colored noise, and sinusoid with a maximum data length of 8192 samples. The sinusoid option can generate a sum of two sinusoids , based on the specified frequencies and amplitudes. I desired, an option is provided to synchronize the part’s two independent outputs. The option “frame size” represents the number of samples in each frame. The option “overlap” allows frames to overlap. Possible overlapping schemes are: 0%, 25% and 50%. The output plot may be displayed with the signal normalized either with respect to the maximum magnitude of the current frame or the maximum of the entire signal. When the colored noise signal is selected, a new window is created where filter coefficients that convert white noise to colored noise can be entered. The frames can be directed to the output individually (“>>”) or all together automatically (“>>|”). Pin assignment:
Pin Description 1 Time-domain signal 1 (in frames) 1> 2 Time-domain signal 2 (in frames) 3 2> 4
5
6
Dialog window(s):
(a)SigGen(L) dialog window
Script use:
Name: siggen(L) Example code: <param name = “3” value = “B3-siggen(L)(3,1)”>

M2-5
M2.3
Block name : Coefficient Notation: Coeff
Description: This block allows the user to enter filter coefficients. A maximum of 11 coefficients can be used. Coefficients can be entered in “tabular” form or “by line” form as shown below. The “by line” option provides an easy way to ‘cut’ and ‘paste’ coefficients from other sources. Pin assignment:
1> Pin Description 1 Coefficients (numerator and denominator) 2 3 4
5
6
Dialog window(s):
(a)Coefficient dialog window-by line and tabular
Script use:
Name: Coeff Example code: <param name = “3” value = “B3-coeff(3,1)”>
Equation(s) Implemented :
∑∑==
−−−=M
ii
L
ii inyainxbny
10
)()()(
x(n) = input signal, y(n) = output signal, ai = feedback coefficients, bi = feed-forward coefficients

M2-6
M2.4
Block name : Junction Notation: Junction
Description: This block propagates its input signal at its two outputs. The input signa l can be either time-domain, frequency-domain, or filter coefficients. The Junction block essentially allows other blocks to share the same signal or parameters Pin assignment:
Pin Description 1 Input signal 2> 2 Output signal = input signal
>1 3 Output signal = input signal 3> 4
5
6
Dialog window(s):
-None-
Script use:
Name: junction Example code: <param name = “3” value = “B3-junction(3,1)”>
Equation(s) Implemented :
)()()( nznynx == x(n) = input signal y(n) = output signal at first output pin z(n) = output signal at second output pin

M2-7
M2.5
Block name : Filter Notation: Filter
Description: This block filters the input signal based on the provided numerator and denominator coefficients and the standard difference equation. The filter coefficients must be provided using the Coeff. block. An option is provided to start with zero initial conditions or non-zero initial conditions. Pin assignment:
2> Pin Description 1 Input signal x(n) 2 Filter coefficients
>1 3> 3 Filtered signal y(n) 4 Feedback and feed-forward coefficients ai and bi 5 >4 6
Dialog window(s):
(a)Filter dialog window
Script use:
Name: filter Example code: <param name = “3” value = “B3-filter(3,1)”>
Equation(s) Implemented :
∑∑==
−−−=M
ii
L
ii inyainxbny
10
)()()(
x(n) = input signal y(n) = output signal ai = feedback coefficients bi = feed-forward coefficients

M2-8
M2.6
Block name : Frequency response Notation: Freq-Resp
Description: This block calculates and displays the frequency response of a filter. It can be connected to any block that can generate filter coefficients. In its dialog window, the top plot displays the magnitude in dB or linear scale and the bottom plot shows the phase. Pin assignment:
Pin Description 1 Feedback and feed-forward coefficients ai and bi 2
3 4
5
>1 6
Dialog window(s):
(a)Frequency Response dialog window
Script use:
Name: freqresp Example code: <param name = “3” value = “B3-freqresp(3,1)”>
Equation(s) Implemented :
∑
∑
=
Ω−
=
Ω−
Ω
+= M
i
jii
L
i
jii
j
ea
ebeH
1
0
1)(
ai = feedback coefficients bi = feed-forward coefficients

M2-9
M2.7
Block name : Plot Notation: Plot
Description: This block primarily plots the signal at its input in an x-y axis coordinate system. It can also display values in text form and calculate some basic signal statistics. The magnitude, magnitude squared, real part, imaginary part, and phase of the input signal can be examined. Pin assignment:
Pin Description 1 Input signal x(n) 2 Output signal y(n) = input signal x(n)
>1 2> 3 4
5
6
Dialog window(s):
(a)Plot dialog window-Graphical

M2-10
(b)Plot dialog window-Statistics and values
Script use:
Name: plot Example code: <param name = “3” value = “B3-plot(3,1)”>
Equation(s) Implemented :
2 2
1 1
2 2
1 1
1 1Mean, ( ) Variance, ( ( ) )
1Standard Deviation Total energy ( ) Power ( )
N N
x x xn n
N N
xn n
x n x nN N
x n x nN
µ σ µ
σ
= =
= =
= = −
= = =
∑ ∑
∑ ∑
x(n) = input signal, N = number of samples

M2-11
M2.8
Block name : Plot 2 Notation: Plot2
Description: Plots two signals in the same dialog window. All signals are plotted in terms of samples, and any scale changes apply to both graphs. Graphs can be plotted one below the other, one next to the other or in the same axis. Use the “Graph Position” option to vary the graph location. Pin assignment:
Pin Description 1 Input signal x(n)
>1 3> 2 Input signal y(n) 3 Output signal z(n) = Input signal x(n)
>2 4> 4 Output signal g(n) = Input signal y(n)
5
6
Dialog window(s):
(a)Plot 2 dialog window-Horizontal orientation

M2-12
(b)Plot 2 dialog window-Vertical orientation
(c)Plot 2 dialog window- same axis option
Script use:
Name: plot2 Example code: <param name = “3” value = “B3-plot2(3,1)”>

M2-13
M2.9
Block name : Sound Player Notation: SndPlyr
Description: This block is used for signal playback. Dragging the volume scroll bar to the right increases the signal volume. Pin assignment:
Pin Description 1 Input signal x(n) 2
>1 3 4
5
6
Dialog window(s):
(a)Sound Plyr dialog window
Script use:
Name: sndplayer Example code: <param name = “3” value = “B3-sndplayer(3,1)”>

M2-14
M2.10
Block name : Quantizer Notation: Quantizer
Description: This block is used for signal quantization. Uniform or non-uniform quantization can be selected. For uniform quantization, the amplitude levels are divided into steps of (0.5)n, where n is the number of quantization bits. These discrete levels are used to represent the signal amplitudes. Non-uniform quantization is achieved by uniformly quantizing a µ-law or A-law compressed signal. Note that this block can only simulate the effect of quantization on signals or on filter coefficients. Pin assignment:
Pin Description 1 Input signal x(n) 2 Quantized signal y(n)
>1 2> 3 4
5
6
Dialog window(s):
(a)Quantizer dialog window
Script use:
Name: quant Example code: <param name = “3” value = “B3-quant (3,1)”>
Equation(s) Implemented :
µ– law can be stated as, )1log(
)1log(
µ
µ
+
+= in
out
xx ; µ = 0;
A– law can be stated as, A
xAx in
out log1 += ; 0 = xin = 1/A and
AxA
x inout log1
)log(1+
+= ; 1/A = xin = 1
where, xin and xout are the normalized input and output signal amplitudes and A = 1