Embed Size (px)
Citation preview

Section I. Basic Measure Information I.A. Measure Name CAPQuaM PQMP HROB III: High risk deliveries at facilities with 24/7 in-house blood banking/transfusion services available
I.B. Measure Number 0122 I.C. Measure Description Please provide a non-technical description of the measure that conveys what it measures to a broad audience. Percent of high risk deliveries that are delivered at a facility with 24/7 in-house blood banking/transfusion services available I.D. Measure Owner CAPQuaM I.E. National Quality Forum (NQF) ID (if applicable) N/A I.F. Measure Hierarchy Please note here if the measure is part of a measure hierarchy or is part of a measure group or composite measure. The following definitions are used by(AHRQ)'s National Quality Measures Clearinghouse and are available at http://www.qualitymeasures.ahrq.gov/about/hierarchy.aspx: 1. Please identify the name of the collection of measures to which the measure belongs (if
applicable). A Collection is the highest possible level of the measure hierarchy. A Collection may contain one or more Sets, Subsets, Composites, and/or Individual Measures.
This measure belongs to PQMP Availability of High Risk Obstetric Services Collection #1
2. Please identify the name of the measure set to which the measure belongs (if applicable). A Set
is the second level of the hierarchy. A Set may include one or more Subsets, Composites, and/or Individual Measures.

High risk obstetrical deliveries at hospitals with appropriate high risk facilities. 3. Please identify the name of the subset to which the measure belongs (if applicable). A Subset
is the third level of the hierarchy. A Subset may include one or more Composites, and/or Individual Measures.
Structural subset
4. Please identify the name of the composite measure to which the measure belongs (if
applicable). A Composite is a measure with a score that is an aggregate of scores from other measures. A Composite may include one or more other Composites and/or Individual Measures. Composites may comprise component Measures that can or cannot be used on their own.
N/A
I.G. Numerator Statement Number of eligible deliveries that occur in facilities with 24/7 in-house blood banking / transfusion services. By 24/7 blood banking/transfusion services we mean that the following are always available to obstetrical patients: testing of blood group and Rh Type; cross-matching; antibody testing; transfusion with on site and available blood, either ABO specific or 0-Rh-negative; transfusion with fresh frozen plasma; and transfusion with cryoprecipitate. Numerator Elements: Number of deliveries Maternal and infant ICD-9 codes Response to survey question identified on technical specifications I.H. Numerator Exclusions None
I.I. Denominator Statement Overall number of eligible deliveries Eligible deliveries are identified in two distinct ways. Maternal and infant ICD-9 codes are specified in Section 2 Detailed Measure Specifications. 1. Class A: Maternal Diagnoses and Comorbidities 2. Class B: Delivery Complications, Fetal Injury or Compromise, or Suboptimal Infant Diagnoses
a. Maternal Delivery Complication Codes (ICD9) b. Maternal Stillbirth or Birth Hypoxia/Asphyxia Codes c. Premature or small infant. (Infant codes):
3. Either Class A or Class B (Unduplicated union of Class A and Class B) Denominator Elements: Number of deliveries Maternal and infant ICD-9 codes Maternal DRG, CPT codes, and revenue codes when available I.J. Denominator Exclusions None I.K. Data Sources Check all the data sources for which the measure is specified and tested. Administrative Data (e.g claims data), Survey – Health care professional report, Other (Please list all other data sources in the field below). , If other, please list all other data sources in the field below. Health care professional can be representing a health care facility that delivers babies Section II: Detailed Measure Specifications Provide sufficient detail to describe how a measure would be calculated from the recommended data sources, uploading a separate document (+ Upload attachment) or a link to a URL. Examples of detailed measure specifications can be found in the CHIPRA Initial Core Set Technical Specifications Manual 2011 published by the Centers for Medicare & Medicaid Services. Although submission of formal programming code or algorithms that demonstrate how a measure would be calculated from a query of an appropriate electronic data source are not requested at this time, the availability of these resources may be a factor in determining whether a measure can be recommended for use.

3. Description Reporting on the extent to which high risk women are delivered at facilities with a 24/7 in -house physician capable of safely managing labor and delivery, and performing a cesarean section, including an emergent cesarean section. This measure is intended to be reported at the level of health plan or geographical entity, such as county, state, region, etc. It is not appropriate for measuring at the level of clinical provider. This measure is a descriptor of the availability of care for the population of women who may need high risk obstetrical services and is not a measure of the quality of care received by any individual in that population. 4. Eligible Population Women age 10- 65 years inclusive, who are admitted to a hospital or health care facility and deliver an infant, whether living or dead. Delivery shall be identified using the table below, with exclusions as noted regardless of how delivery was identified. The table is recreated largely from work done by CDC researchers.
Identify Deliveries
Identification of Deliveries of Interest
Description Code(s)
Revenue Code 722 Delivery
Outcome of delivery ICD-9 ICD-9-CM = V27
Normal delivery ICD-9-CM = 650
Diagnosis-related group 370 (complicated cesarean section), 811,191 (3.03)
371 (uncomplicated cesarean section),
(DRG) delivery codes
372 (complicated vaginal delivery),
373 (uncomplicated vaginal delivery)
374 (uncomplicated vaginal delivery with sterilization
and/or dilatation & curettage)
375 (vaginal delivery with operation room procedure
except sterilization and/or dilatation & curettage)
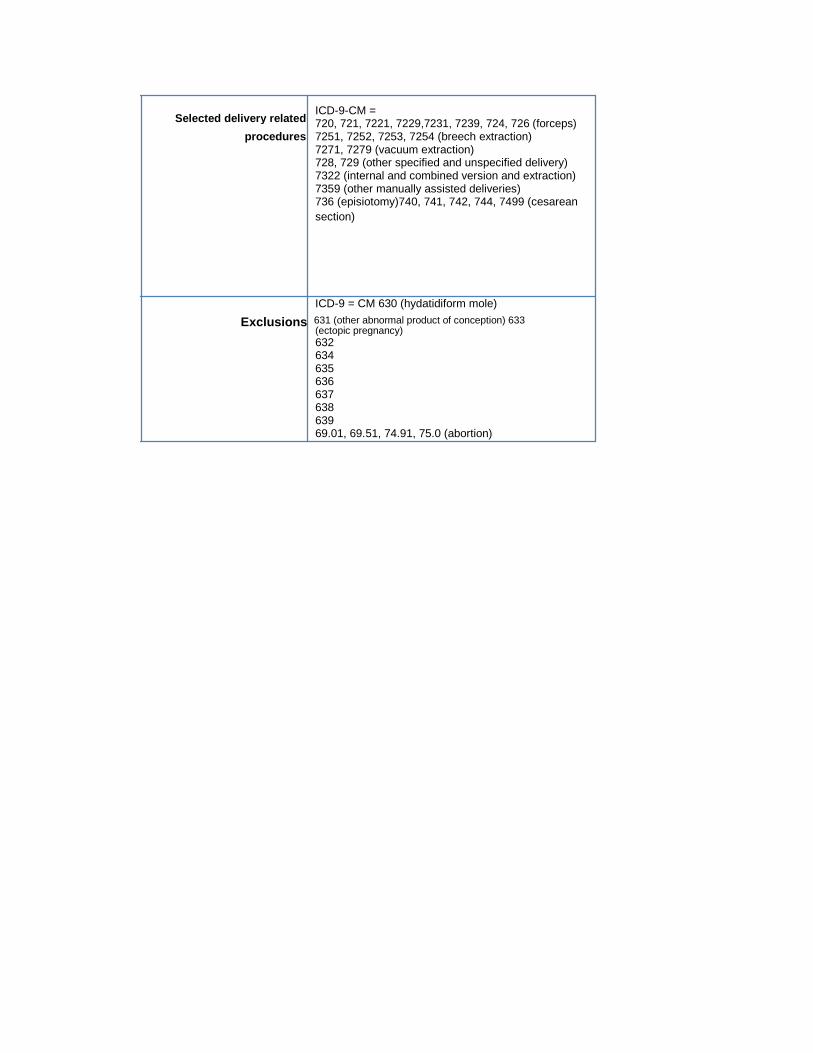
Selected delivery related ICD-9-CM =
720, 721, 7221, 7229,7231, 7239, 724, 726 (forceps)
procedures
7251, 7252, 7253, 7254 (breech extraction)
7271, 7279 (vacuum extraction)
728, 729 (other specified and unspecified delivery)
7322 (internal and combined version and extraction)
7359 (other manually assisted deliveries)
736 (episiotomy)740, 741, 742, 744, 7499 (cesarean
section)
ICD-9 = CM 630 (hydatidiform mole) Exclusions 631 (other abnormal product of conception) 633
(ectopic pregnancy) 632 634 635 636 637 638 639 69.01, 69.51, 74.91, 75.0 (abortion)
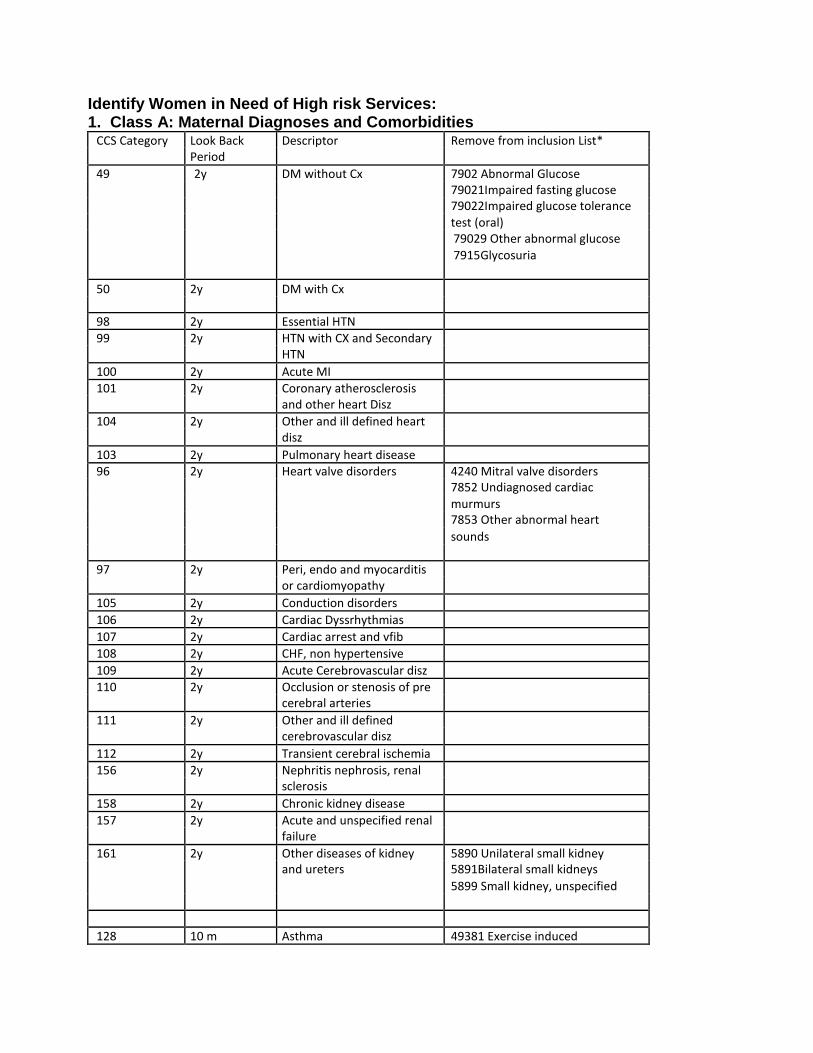
Identify Women in Need of High risk Services: 1. Class A: Maternal Diagnoses and Comorbidities
CCS Category Look Back Descriptor Remove from inclusion List* Period
49 2y DM without Cx 7902 Abnormal Glucose 79021Impaired fasting glucose 79022Impaired glucose tolerance test (oral) 79029 Other abnormal glucose 7915Glycosuria
50 2y DM with Cx
98 2y Essential HTN 99 2y HTN with CX and Secondary
HTN 100 2y Acute MI 101 2y Coronary atherosclerosis
and other heart Disz 104 2y Other and ill defined heart
disz 103 2y Pulmonary heart disease 96 2y Heart valve disorders 4240 Mitral valve disorders
7852 Undiagnosed cardiac murmurs 7853 Other abnormal heart sounds
97 2y Peri, endo and myocarditis or cardiomyopathy
105 2y Conduction disorders 106 2y Cardiac Dyssrhythmias 107 2y Cardiac arrest and vfib 108 2y CHF, non hypertensive 109 2y Acute Cerebrovascular disz 110 2y Occlusion or stenosis of pre
cerebral arteries 111 2y Other and ill defined
cerebrovascular disz 112 2y Transient cerebral ischemia 156 2y Nephritis nephrosis, renal
sclerosis 158 2y Chronic kidney disease 157 2y Acute and unspecified renal
failure 161 2y Other diseases of kidney 5890 Unilateral small kidney
and ureters 5891Bilateral small kidneys 5899 Small kidney, unspecified
128 10 m Asthma 49381 Exercise induced
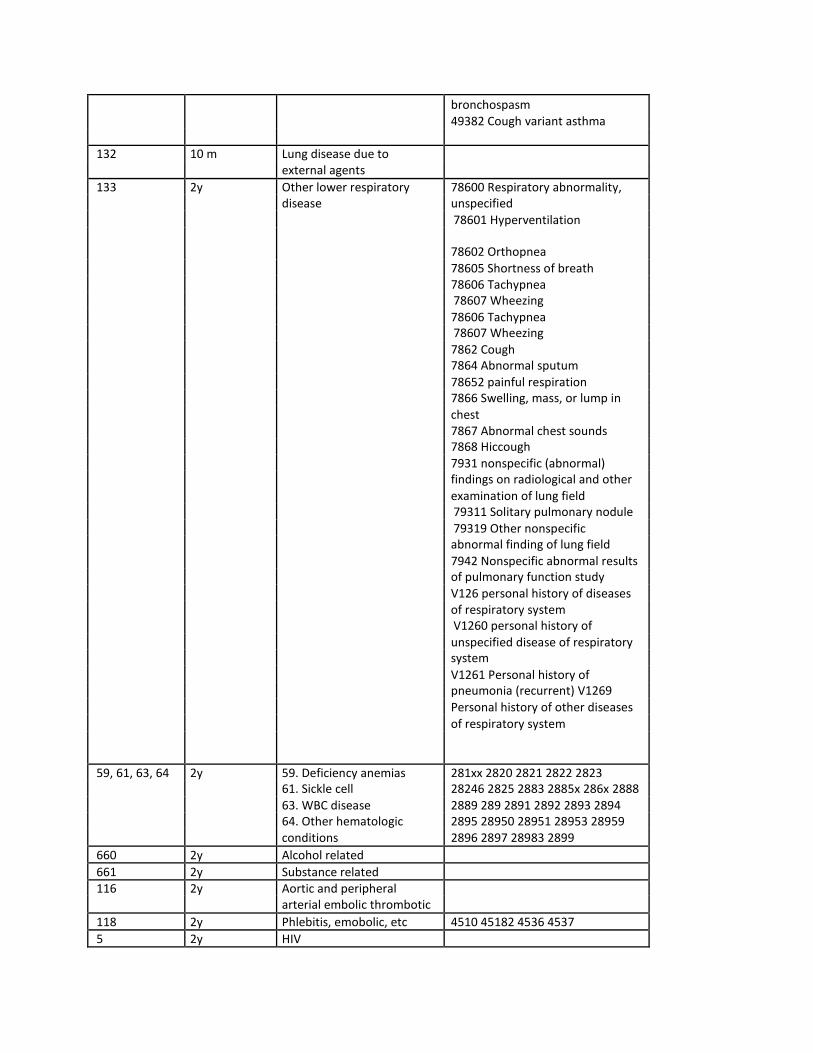
bronchospasm 49382 Cough variant asthma
132 10 m Lung disease due to external agents
133 2y Other lower respiratory 78600 Respiratory abnormality, disease unspecified 78601 Hyperventilation
78602 Orthopnea 78605 Shortness of breath 78606 Tachypnea 78607 Wheezing 78606 Tachypnea 78607 Wheezing 7862 Cough 7864 Abnormal sputum 78652 painful respiration 7866 Swelling, mass, or lump in chest 7867 Abnormal chest sounds 7868 Hiccough 7931 nonspecific (abnormal) findings on radiological and other examination of lung field 79311 Solitary pulmonary nodule 79319 Other nonspecific abnormal finding of lung field 7942 Nonspecific abnormal results of pulmonary function study V126 personal history of diseases of respiratory system V1260 personal history of unspecified disease of respiratory system V1261 Personal history of pneumonia (recurrent) V1269 Personal history of other diseases of respiratory system
59, 61, 63, 64 2y 59. Deficiency anemias 281xx 2820 2821 2822 2823
61. Sickle cell 28246 2825 2883 2885x 286x 2888 63. WBC disease 2889 289 2891 2892 2893 2894 64. Other hematologic 2895 28950 28951 28953 28959 conditions 2896 2897 28983 2899
660 2y Alcohol related 661 2y Substance related 116 2y Aortic and peripheral
arterial embolic thrombotic 118 2y Phlebitis, emobolic, etc 4510 45182 4536 4537 5 2y HIV

182 2y Hemorrhage during 640 64200 64201 64202 64203 pregnancy, abruption, 64080 64081 64083 64090 64091 previa 64093
183 10m Hypertension complicating 64230 64231 64232 64233 64234 pregnancy
83 2y Epilepsy *These are ICD9 codes that are included in the CCS software for the indicated Group that need to be removed from the inclusion list. That is, they are not specific exclusions, but neither do they establish eligibility.
Note: The look back period is the preferred time before delivery to be included for analysis. When 2 full years prior to delivery are available, reporting entities should use 2 full years of data, the reporting year up until the month following the pregnancy and a prior look back year. For each delivery, use the shorter of the indicated look back period OR the total available data ending with the month of delivery.
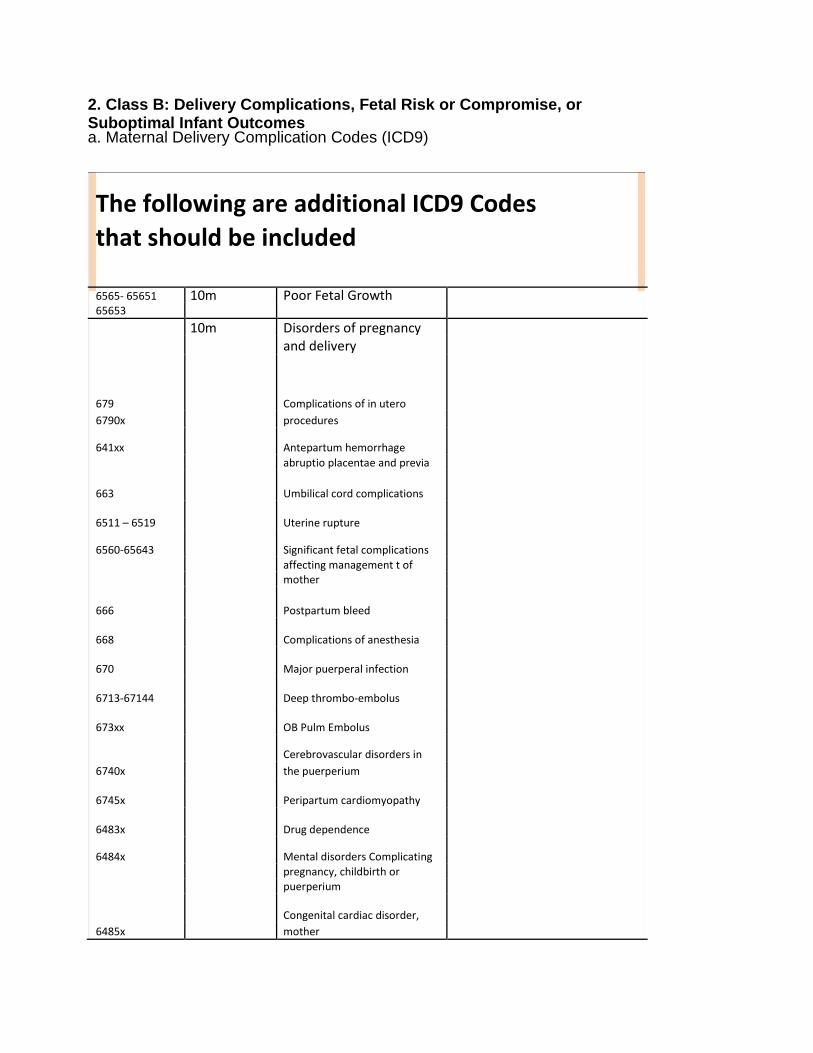
2. Class B: Delivery Complications, Fetal Risk or Compromise, or Suboptimal Infant Outcomes a. Maternal Delivery Complication Codes (ICD9)
The following are additional ICD9 Codes that should be included
6565‐ 65651 10m Poor Fetal Growth 65653
10m Disorders of pregnancy and delivery
679 Complications of in utero 6790x procedures
641xx Antepartum hemorrhage abruptio placentae and previa
663 Umbilical cord complications
6511 – 6519 Uterine rupture
6560‐65643 Significant fetal complications affecting management t of mother
666 Postpartum bleed
668 Complications of anesthesia
670 Major puerperal infection
6713‐67144 Deep thrombo‐embolus
673xx OB Pulm Embolus
Cerebrovascular disorders in 6740x the puerperium
6745x Peripartum cardiomyopathy
6483x Drug dependence
6484x Mental disorders Complicating pregnancy, childbirth or puerperium
Congenital cardiac disorder, 6485x mother

Other CV disease cx pregnancy,
6486x etc
6494x Epilepsy cx pregnancy, etc
Coagulation dfects cx
6943x pregnancy, etc
345xx Epilepsy
V23.5 History of Fetal Loss/Stillbirth
V23.41 History of pre‐term Labor
V23.49 Poor OB history
a. Maternal Stillbirth or Birth Hypoxia/Asphyxia Codes
V27.1 Single Stillborn V27.3 One twin stillborn V27.4 Both twins stillborn V27.6 Other multiple birth, with stillborn V27.7 Other multiple birth, all stillborn
768xx Intrauterine hypoxia and Birth asphyxia 656.4x Intrauterine death affecting management of mother
b. Premature or small infant. (Infant codes):
76400 LIGHT-FOR-DATES WTNOS 76490 FET GROWTH RETARD WTNOS 76401 LIGHT-FOR-DATES <500G 76491 FET GROWTH RETARD <500G 76402 LT-FOR-DATES 500-749G 76492 FET GROWTH RET 500-749G 76403 LT-FOR-DATES 750-999G 76493 FET GROWTH RET 750-999G 76404 LT-FOR-DATES 1000-1249G 76494 FET GRWTH RET 1000-1249G 76405 LT-FOR-DATES 1250-1499G 76495 FET GRWTH RET 1250-1499G 76406 LT-FOR-DATES 1500-1749G 76496 FET GRWTH RET 1500-1749G 76407 LT-FOR-DATES 1750-1999G 76497 FET GRWTH RET 1750-1999G 76408 LT-FOR-DATES 2000-2499G 76498 FET GRWTH RET 2000-2499G 76410 LT-FOR-DATE W/MAL WTNOS 76500 EXTREME IMMATUR WTNOS 76411 LT-FOR-DATE W/MAL <500G 76501 EXTREME IMMATUR <500G 76412 LT-DATE W/MAL 500-749G 76502 EXTREME IMMATUR 500-749G 76413 LT-DATE W/MAL 750-999G 76503 EXTREME IMMATUR 750-999G 76414 LT-DATE W/MAL 1000-1249G 76504 EXTREME IMMAT 1000-1249G 76415 LT-DATE W/MAL 1250-1499G 76505 EXTREME IMMAT 1250-1499G 76416 LT-DATE W/MAL 1500-1749G 76506 EXTREME IMMAT 1500-1749G 76417 LT-DATE W/MAL 1750-1999G 76507 EXTREME IMMAT 1750-1999G 76418 LT-DATE W/MAL 2000-2499G 76508 EXTREME IMMAT 2000-2499G 76420 FETAL MALNUTRITION WTNOS 76510 PRETERM INFANT NEC WTNOS 76421 FETAL MALNUTRITION <500G 76511 PRETERM NEC <500G 76422 FETAL MALNUTR 500-749G 76512 PRETERM NEC 500-749G 76423 FETAL MAL 750-999G 76513 PRETERM NEC 750-999G 76424 FETAL MAL 1000-1249G 76514 PRETERM NEC 1000-1249G 76425 FETAL MAL 1250-1499G 76515 PRETERM NEC 1250-1499G 76426 FETAL MAL 1500-1749G 76516 PRETERM NEC 1500-1749G 76427 FETAL MALNUTR 1750-1999G 76517 PRETERM NEC 1750-1999G 76428 FETAL MALNUTR 2000-2499G 76518 PRETERM NEC 2000-2499G
3. Either Class A or Class B (UnDuplicated Union of the Class 1 and Class 2 Sets)
C. DATA SOURCES A. Survey of hospitals, birthing centers, and other health care facilities at which eligible women have delivered:
• Classify by answer yes or no to the following question:
Does this facility always have 24/7 in house dedicated coverage of the obstetrical service by a physician capable of safely managing labor and delivery, and performing a cesarean section, including an emergent cesarean section?
• Yes • No • Unsure • Refuse
This is Question 1 of the four question HROB questionnaire included in the Appendix.
B. Data with billing and diagnosis codes
a. Identify Eligible population Women who have deliveries in health care facilities Identify those deliveries associated with high risk
conditions Maternal record: High Risk Diagnoses Maternal record: Complicated Delivery Maternal record: Stillbirth or Birth Asphyxia Infant record: Premature or Small Infant
• Woman’s medical record
If needed for maternal race, ethnicity, or data regarding place of residence.
D. CALCULATION Step 1: Identify all deliveries that occurred in medical facilities, using the criteria
above. Step 2: Link Maternal and Infant charts Step 3: Identify Class A, Class B, and an unduplicated list that represents the

Union of Class A or Class B High Risk Pregnancies. These are Denominator 1, Denominator 2, and Denominator 3, respectively. These are considered women in potential need of high risk services (“high risk” for short)
Step 4: Identify each health care facility that has at least one delivery that is in Denominator 1 or Denominator 2
Step 5: Identify which of those health care facilities answered “Yes” to above question. Classify each facility by whether or not they answered “Yes”. Missing data regarding the facility are considered to be “No” responses. Consider as Class 1 facilities answering “Yes”, Consider as Class 2 facilities that did not.
Step 6: Collect the following data elements for all eligible women i. Race ii. Ethnicity iii. Insurance type (Public, Commercial, Uninsured) iv. Benefit type (if insured): HMO, PPO, Medicaid Primary Care
Management (PCCM) Plan, Fee for Service (FFS), Other v. Zip Code, State and County or equivalent area of Mother’s
residence. Record FIPS if available Step 7: Create stratification variables
i. Race/Ethnicity: Hispanic, Non-Hispanic Black, Non-Hispanic White; Non-Hispanic Asian/Pacific Islander, Other Non-Hispanic
ii. Public vs Commercial (Private Insurance) iii. HMO vs PPO vs FFS vs PCCM vs Other iv. Urban Influence Code. Identify the Urban Influence Code(1) or UIC.
(2013 urban influence codes available at: http://www.ers.usda.gov/data-products/urban-influence-codes.aspx#.UZUvG2cVoj8 ). Use mother’s place of residence to determine UIC. State and County names can be linked or looked up directly or zip codes can be linked to County indirectly, using the Missouri Census Data Center (http://mcdc.missouri.edu/). These data will link to County or County equivalents as used in various states.

v. Identify the Level of Poverty in the mother’s county of residence. The percent of all residents in poverty by county or county equivalent are available from the US Department of Agriculture at http://www.ers.usda.gov/data-products/county-level-data-sets/download-data.aspx Our stratification standards are based on 2011 US population data that we have analyzed with SAS 9.3. Using Mother’s state and county of residence (or equivalent) or FIPS code, use the variable PCTPOVALL_2011 to categorize into one of 5 Strata:
a. Lowest Quartile of Poverty if percent in poverty is <=12.5% b. Second Quartile of Poverty if percent in poverty is >12.5%
and <=16.5% c. Third Quartile of poverty if percent in poverty is >16.5% and
<=20.7% d. First upper quartile (75th-90th) if percent in poverty is
>20.7% and <=25.7% e. Second upper quartile (>90th percentile
If needed, the Missouri Data center linked in Step 7. iv. may be used to link zip codes to county equivalents.
Step 8: Count the number of high risk deliveries that occurred in Class 1 and Class 2 facilities for each of the three ways of qualifying (Class A, Class B, and Union of Class A or Class B. These are Numerator 1, Numerator 2, and Numerator 3, respectively. Step 9: Calculate the percentage of high risk pregnancies that were delivered in Class 1 and Class 2 Hospitals.
• Percentage1 is calculated as the 100*Numerator1/Denominator 1 • Percentage2 is calculated as the 100*Numerator2/Denominator 2 • Percentage3 is calculated as the 100*Numerator3/Denominator 3 • Report all percentages to 2 decimal places
Step 10: Report the results of Step 9. Step 11: Repeat steps 3,8, 9, & 10 for each stratification category listed below, using the following data elements. Report all strata with N of at least 250
· Race and ethnicity · Insurance type (Public/Medicaid, Private/Commercial, None, other) · Benefit type: HMO vs PPO vs FFS vs PCCM vs Other · Urban Influence Code or UIC. · Level of Poverty in the County of Residence.
Step 12: Optionally calculate 95% confidence intervals. Calculate standard error as the square root of the proportion of newborns delivered in facilities with the given structure multiplied by 1-the same proportion divided by the number of deliveries.
· Multiply the standard error by 1.96. · Subtract that value from the measured proportion. Report the greater of 0 and
that number as the lower bound of the 95% confidence interval; · Add the product from b to the measured proportion. Use the lesser of that sum or 1 as
the upper bound of the 95% confidence interval. Section III. Importance of the Measure In the following sections, provide brief descriptions of how the measure meets one or more of the following criteria for measure importance (general importance, importance to Medicaid and/or CHIP, complements or enhances an existing measure). Include references related to specific points made in your narrative (not a free-form listing of citations). III.A. Evidence for general importance of the measure Provide evidence for all applicable aspects of general importance: • Addresses a known or suspected quality gap and/or disparity in quality (e.g., addresses a
socioeconomic disparity, a racial/ethnic disparity, a disparity for Children with Special Health Care Needs (CSHCN), a disparity for limited English proficient (LEP) populations).
• Potential for quality improvement (i.e., there are effective approaches to reducing the quality gap or disparity in quality).
• Prevalence of condition among children under age 21 and/or among pregnant women • Severity of condition and burden of condition on children, family, and society (unrelated to cost) • Fiscal burden of measure focus (e.g., clinical condition) on patients, families, public and
private payers, or society more generally, currently and over the life span of the child. • Association of measure topic with children’s future health – for example, a measure
addressing childhood obesity may have implications for the subsequent development of cardiovascular diseases.
• The extent to which the measure is applicable to changes across developmental stages (e.g., infancy, early childhood, middle childhood, adolescence, young adulthood).
The Collaboration for Advancing Pediatric Quality Measures (CAPQuaM) was assigned the topic of availability of high risk obstetrical services as a PQMP priority by the Agency for Healthcare Research and Quality and CMS. We developed a set of high risk obstetric availability measures in close consultation with our expert panel. Optimal health of children in the United States is fostered by healthy pregnancies, healthy deliveries, and outcomes of pregnancy that include healthy mothers and babies. Appropriate availability of specific aspects of care for pregnant women, in particular those in need of high risk obstetric services, is necessary to achieve desired outcomes. For example, subspecialty care is necessary for specific high risk women and this will be the focus of future CAPQuaM

measures. The current set of measures addresses four critical structures necessary for optimal outcomes among women with high risk conditions. While there is much interest in obstetrics in classifying levels of obstetric care, we prioritized four specific attributes that others might use to define such levels.(2) The proposed availability measures address important gaps in quality and safety and also have the potential to narrow disparities in maternal and neonatal outcomes. These four structural attributes (24-hour in-house physicians covering obstetrics and capable of managing labor and delivery, including performing emergent cesarean sections, 24-hour in house physicians available and capable of providing obstetric anesthesia, 24-hour availability of blood bank/transfusion services, and delivery at a facility with a Level 3 or higher NICU) have the potential to improve both maternal and infant outcomes in the setting of high risk deliveries. They were chosen to represent a prioritized selection of key structural attributes that impact the timeliness with which a potentially urgent service may be available to women who are delivering in the context of a pregnancy that manifests higher than typical risk. The prioritization process involved our team of stakeholders as well as an expert panel, whose clinical and health services judgments guided the process. Delivery care provided to pregnant women is critical for the health and well-being of mothers and babies. The burden of chronic illness and risk factors for pregnancy complications (e.g. hypertension, diabetes, advancing maternal age, previous cesarean section) are all rising among women, increasing their risk for morbidity and mortality.(2) Over the past decade, maternal mortality has increased in the U.S.; striking racial disparities persist.(3, 4) Black women are 3 to 4 times more likely to suffer a pregnancy-related death than white women.(3) Racial and ethnic disparities are also reflected when considering both the processes and outcomes of neonates (5-7) . For every maternal death, 100 or more women suffer severe maternal morbidity, a potentially life-threatening diagnosis or life-saving procedure that is associated with pregnancy. Examples include organ failure (e.g. acute renal failure, liver, respiratory), obstetric shock, pulmonary embolism, amniotic embolism, eclampsia, septicemia, cardiac events, mechanical ventilation, transfusion, invasive hemodynamic monitoring, and hysterectomy. Severe maternal morbidity is rising and affects approximately 52,000 women annually in the US.(4) Studies using the Nationwide Inpatient Sample show the prevalence of at least one severe complication rose 75% from 1998-99 to 2008-09: renal failure increased by 97%, thrombolic embolism by 100%, adult respiratory distress syndrome by 75%, blood transfusion by 183%, and ventilation by 34%. Similar to maternal and neonatal mortality, minority women are more likely to suffer a severe maternal morbidity than white women.(4) Severe morbidity is more common at the extremes of reproductive age and for black women as compared with white women. Quality and safety of care are an important lever to address these issues as research suggests that at least one-third to one-half of maternal deaths in the US may be preventable through improvements in quality of care.(8- 10) Additional studies suggest that on the continuum of care to adverse pregnancy outcomes, there are a number of points that can be impacted by improved safety and quality.(11) All four structural measures are critical to ensure safety of mothers and babies in the setting of deliveries that are of higher risk, whether due to maternal comorbidities or complications of pregnancy(12,13 ) . We refer to these collectively as high risk deliveries. To improve care for

women who require high risk obstetrical services, it is imperative that quality measures address the availability of high-risk obstetrical services by assessing how available key services are at hospitals providing obstetric care. Agencies such as the March of Dimes, American Academy of Pediatrics, American College of Obstetricians and Gynecologists, American Academy of Family Physicians and American Medical Association have emphasized the need for stratification of facilities based on maternal levels of care, so that the definition of levels of care should be based on the capability to provide more complex care. For example, Table 1 displays the Indiana Perinatal Network’s criteria on when to consult, refer, or transport a pregnant woman. See Table 1 below. Similarly, quality measures can play a critical role in identifying gaps in care delivery and subsequently act to decrease severe maternal morbidity and mortality(2) The CAPQuaM measure development process sought to ground availability measures in a definitional framework of what constitutes a high-risk obstetrical service. First, we approached the literature to establish a construct of conditions that potentially can be considered as high-risk, increasing the risk of maternal and/or infant morbidity and mortality. We subsequently convened a multidisciplinary panel of national experts to provide leadership, including helping to establish definitions for both availability and high risk obstetrical services. The panel held a telephone meeting, conducted pre-work via email and participated in a two-day face to face meeting. By the conclusion of the meeting the Panel had rated a variety of constructs using this adaptation of the two round RAND/UCLA modified Delphi process. This is the first measure set that we are aware of that addresses specifically the availability of high risk obstetrical care. It reflects our perspective that the optimal health of children in the United States is fostered by healthy pregnancies and deliveries. The availability of HROB services are critical for the health of pregnant women with high risk deliveries and ultimately for the health of the child they are carrying. An emerging consensus in the literature relates the construct of levels

of care for women and newborn services. The American Academy of Pediatrics (AAP) defines special and intensive care newborn services as Levels 2-4 in a specific manner and the field of obstetrics is rapidly moving in that direction. These measures both build off of the AAP definition and operationalize components that comprise levels of high risk obstetrical services. They capture the extent to which women in need of HROB services and who may be at risk for or experiencing a complicated delivery are delivered at hospitals that provide sufficient care. III.B. Evidence for Importance of the Measure to Medicaid and/or CHIP Comment on any specific features of this measure important to Medicaid and/or CHIP that are in addition to the evidence of importance described above, including the following: • The extent to which the measure is understood to be sensitive to changes in Medicaid or
CHIP (e.g., policy changes, quality improvement strategies). • Relevance to the Early and Periodic Screening, Diagnostic and Treatment benefit in
Medicaid (EPSDT). • Any other specific relevance to Medicaid/CHIP (please specify).

Consortium partners at the New York State Department of Health, including the Office of Health Insurance Programs / New York State Medicaid, steering committee, and scientific team have played central roles to the development of these measures. Evidence for high level of interest in this work in particular was demonstrated by the fact that the CAPQuaM team was asked to present this work in development to CMS Expert Panel on Improving Maternal and Infant Health Outcomes in Medicaid/CHIP Data, Measurement, and Reporting Workgroup. More generally, childbirth is the largest category for hospital admissions for commercial payers and Medicaid programs and the estimated annual hospital costs associated with childbirth and newborn care are over $80 billion in the United States annually.(14, 15) In New York State, 48.6% of deliveries in 2011 occurred in women insured by Medicaid.(16) In our analysis year, 55.6% (4197 neonates) of low birthweight neonates admitted to NICUs across New York State and who were in our study of newborn temperatures (approximately 90% of all newborns admitted to level 2 or 3 nurseries) were insured by Medicaid. Providing high quality care to women with high risk deliveries has the potential both to improve outcomes and to narrow disparities, important national priorities for CMS. In fact, leaders in obstetrics have proposed systematic changes in the delivery of obstetric care to address these issues. Both peer-reviewed and grey literature propose improved integrated maternal-fetal-neonatal care networks that optimize regionalization of care to improve access to critical 24/7 in-house obstetric services, blood bank/transfusion services, obstetrical anesthesia, and level 3 or 4 NICU services for women with high risk pregnancies.(2, 12,13) Therefore, the proposed measures have the potential to have a significant impact on the health of mothers and infants insured by Medicaid. High risk deliveries disproportionately impact women insured by Medicaid as compared with private insurance. Risk factors identified to be associated with high risk deliveries (e.g., hypertension, delivery of low birth weight infants) are all factors that are more prevalent among the Medicaid population. Given the fact that childbirth is the leading category for hospital admissions for Medicaid programs and the fact that high risk deliveries disproportionately occur among women insured by Medicaid, quality measures targeting high risk deliveries have the potential to improve quality of care for a sizeable portion of the Medicaid program. One key decision that our expert panel made that is particularly important for the vulnerable Medicaid population was establishing that high risk obstetrical services extend from preconception (e.g. managing the cessation of teratogenic medications) through delivery and the early postpartum period. Risk (and the need for HROB services) could be established at any time in that spectrum, including both premature delivery or an obstetrical emergency such as a postpartum hemorrhage. The Expert Panel offered definitions regarding which conditions established that a pregnancy required high risk obstetrical services. They further endorsed constructs important to the assessment of availability of high risk obstetrical (HROB) services. Among those constructs, the panel endorsed the concept of regionalization of care. The panel specifically endorsed the importance of certain services being available 24/7 in the hospital of delivery, among those a
qualified obstetrical physician, an obstetrical anesthesiologist, blood banking/transfusion services, and a Level 3 or higher NICU. A working draft of the Panel Summary after the second round of voting is attached as an Appendix. Not specifically incorporated in this summary was the breadth of dialogue regarding what it means to assess availability in this context. The conclusion that guided much of the subsequent conversation was that the role of these availability measures should be to describe availability at a population level even though the unit of analysis that we were to measure directly was an individual pregnancy. There are two key implications – these measures are not intended to assess the quality of care for a given pregnancy. They also are intended to generate a gradient along which availability of HROB services can be assessed. So while the measures have a concrete interpretation, over time the full nuance of their capacity to describe availability will be enhanced by the establishment of benchmarks in medically and geographically diverse populations and communities. The co-leads of this measure development, a pediatrician and an obstetrician, collaboratively operationalized these constructs into the measures in the current measure set, working with the CAPQuaM stakeholders, including NY Medicaid, and consulting the expert panelists as appropriate. Using ICD9 codes and a publicly available grouping system, AHRQ’s Clinical Classification Software (http://www.hcup-us.ahrq.gov/toolssoftware/ccs/ccs.jsp), the various conditions that could classify a pregnancy as in need of HROB services were specified into those seen in this measure. The four measures in this set incorporate these high priority conditions and services and address the capacity to have immediately available high-risk services before, during and after delivery. They describe the proportion of high risk deliveries that take place in facilities that meet one or more of four structural criteria. • 24/7 in-house physician staffing the obstetrical unit who is capable of safely managing labor and delivery, and performing a cesarean section, including an emergent cesarean section. • 24/7 in-house obstetrical anesthesia services • 24/7 in-house blood banking/transfusion services • Level 3 or higher NICU services The New York State Office of Health Insurance Programs is an active CAPQuaM partner and has been engaged in the conceptualization and development of these measures. Our testing has occurred in Medicaid data and is described below and in Sections IIIC, VIA and VIB. We assessed measure performance in MAX data for 18 states that had been used for validation activates by another of the CHIPRA Centers of Excellence. The algorithm was modified to use all maternal codes and no infant codes because of limitations of using anonymous MAX data and the consequent inability to match maternal with infant data. For the proxy OB outcome, self-report of Level 3 OB on AHA Survey, we were able to match 85% of hospitals. We eliminated 3 states with less than 80% of deliveries occurring in matched hospitals. In the remaining 15 states, the range of HROB deliveries in hospitals meeting criteria was from 3.11% in WY to 52.42% in KS, with a median of 33.04% and an interquartile range of 20.20%. The analysis suggests that even this modified approach to the measure using only maternal data is able to capture differences. Examination of neighboring states (eg AZ and NM) showed similar performance, (35.76% and 35.47% respectively), adding face validity to our analysis.

III.C. Relationship to Other Measures (if any) Describe, if known, how this measure complements or improves on an existing measure in this topic area for the child or adult population, or if it is intended to fill a specific gap in an existing measure category or topic. For example, the proposed measure may enhance an existing measure in the initial core set, it may lower the age range for an existing adult-focused measure, or it may fill a gap in measurement (e.g., for asthma care quality, inpatient care measures). We have developed 4 related measures based on self report of whether there is 24 hour 7 day a week availability of structural characteristics at the facility in which the woman gave birth: • Dedicated coverage of the obstetrical service by a physician dedicated to the OB service and capable of safely managing labor and delivery, performing a cesarean section, including an emergent cesarean section. • In-house coverage dedicated to the obstetrical service by an anesthesiologist who is qualified to provide obstetrical anesthesia. • On-site blood banking services/transfusions services that are always available for obstetrical patients, including: testing of blood group and Rh Type; cross-matching; antibody testing; transfusion with on site and available blood, either ABO specific or 0-Rh-negative; transfusion with fresh frozen plasma; and with cryoprecipitate. • Having a Level 3 or higher NICU on campus. The measures are defined as percent of high risk deliveries that occur in facilities that meet each characteristic. The selection of these topics is valid and justified by evidence summarized briefly below. All were prioritized during our formal expert process. Other priorities will guide future measure development. An American Hospital Association Chart Book (17)describes OB services as important to be always available: delay can impair maternal and neonatal outcomes. The failure to respond urgently and definitively to fetal distress, maternal hemorrhage or any number of complications during the peurperium can lead to sub-optimal outcomes or death. The Indiana Perinatal Network( 2) considers 24/7 in house obstetrical services to be part of subspecialty care; our partners in NY State require a maternal-fetal medicine specialist and a neonatologist always be on-site and available within 20 minutes in order to be designated either a Level 3 Perinatal Center or a Regional Perinatal Center (i.e., Level 4). Qualifying under the first measure requires coverage of OB by a physician capable of providing the indicated services: physicians may be obstetricians or family physicians qualified to fill those roles. In testing the measure, we used hospital’s self-report of being a Level 3 hospital for Obstetrics on the AHA Survey, supplemented by a NY hospital profiling website(18), as a proxy.

In 2010 in NY State Medicaid, 24.52% of Class A deliveries, 27.98% of Class B, and 24.66% of Unduplicated combined A and B occurred in hospitals that met the structural measure for OB care. In all measures Class A and B are reported separately to promote understandability to complement the combined finding (which always will be dominated by Class A). The integration of OB anesthesia into high risk care has become accepted(19). With increasing complexity of available anesthesia techniques (20)and an increase in the risk of deliveries occurring, our expert panel chose to operationalize the structural need as a 24/7 anesthesiologist with training in obstetric anesthesia. This is consistent with literature and reflects the diverse roles of the obstetrical anesthesiologist: managing pain, administering anesthesia, managing severe hypertension, and intubating and managing the complications thereof.(19, 21, 22) As these measures are intended to assess availability, panelists were not dissuaded by data (20) suggesting a shortage of OB anesthesiologists. Such a shortage may motivate the use and elevate the importance of this measure. The use of general anesthesia in 15-30% of emergent c-sections contrasts with less than 5% in elective c-sections simultaneously suggests that urgent situations may require different management than do routine ones (arguing for highly skilled specialists), and potentially that a lack of higher level anesthesia care in urgent situations may limit available options for women.(19, 20) Interviews with clinicians during the CAPQuaM 360 degree process suggest that lack of availability frequently limits women’s options. Of interest, hospitals that deliver between 100 and 500 babies represent 36% of all hospitals and account for almost 8% of births, suggesting the importance of workforce distribution.(20) They make up 36% of hospitals, suggesting their critical importance when developing measures of availability. 20% of hospitals that delivered 500-1500 deliveries per year (the middle stratum) reported themselves to be regional referral centers for HROB. Recent data update these findings. CAPQuaM is working with Drs. Jill Mhyre (an expert panel member), Andrea Fuller, and Brenda Bucklin on a manuscript, “Anesthesia Services for High Risk Obstetrics: Results from the 2011 Obstetric Anesthesia Workforce Survey.” This survey supports the salience of this measure. Results are shown in Tables 2-4 below. The data within categories are nationally representative, but final sampling weights are not ready to make national estimates across categories.
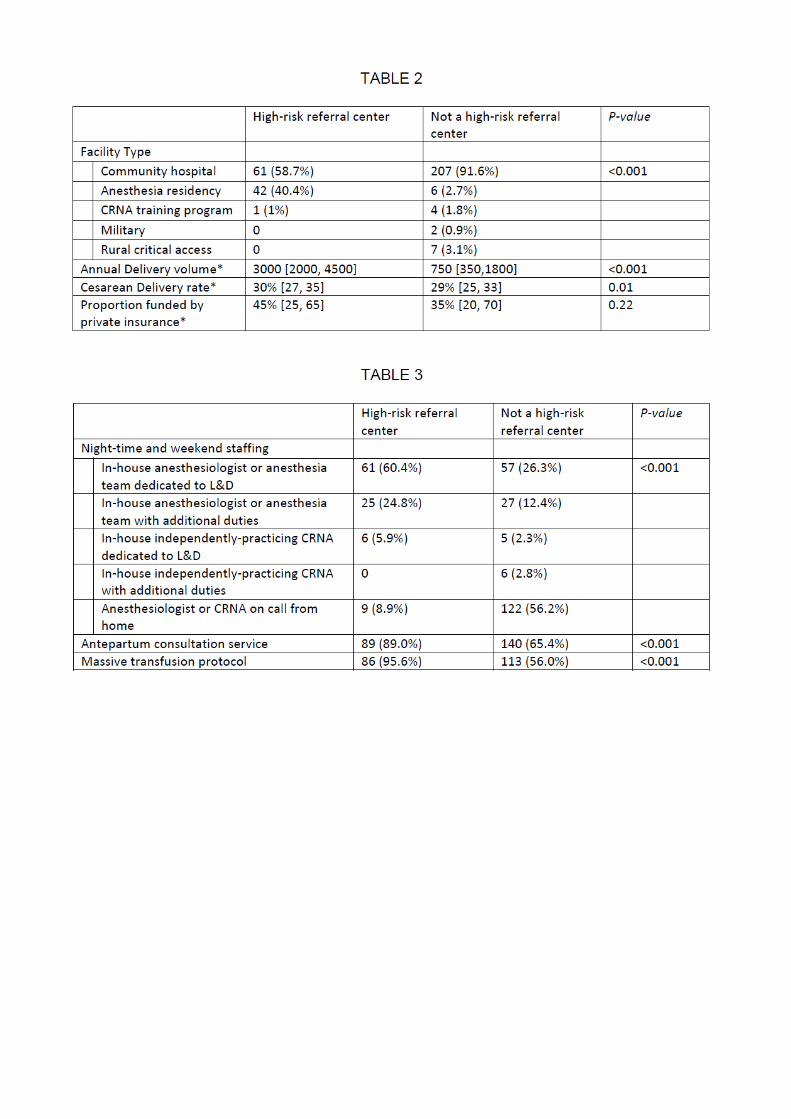
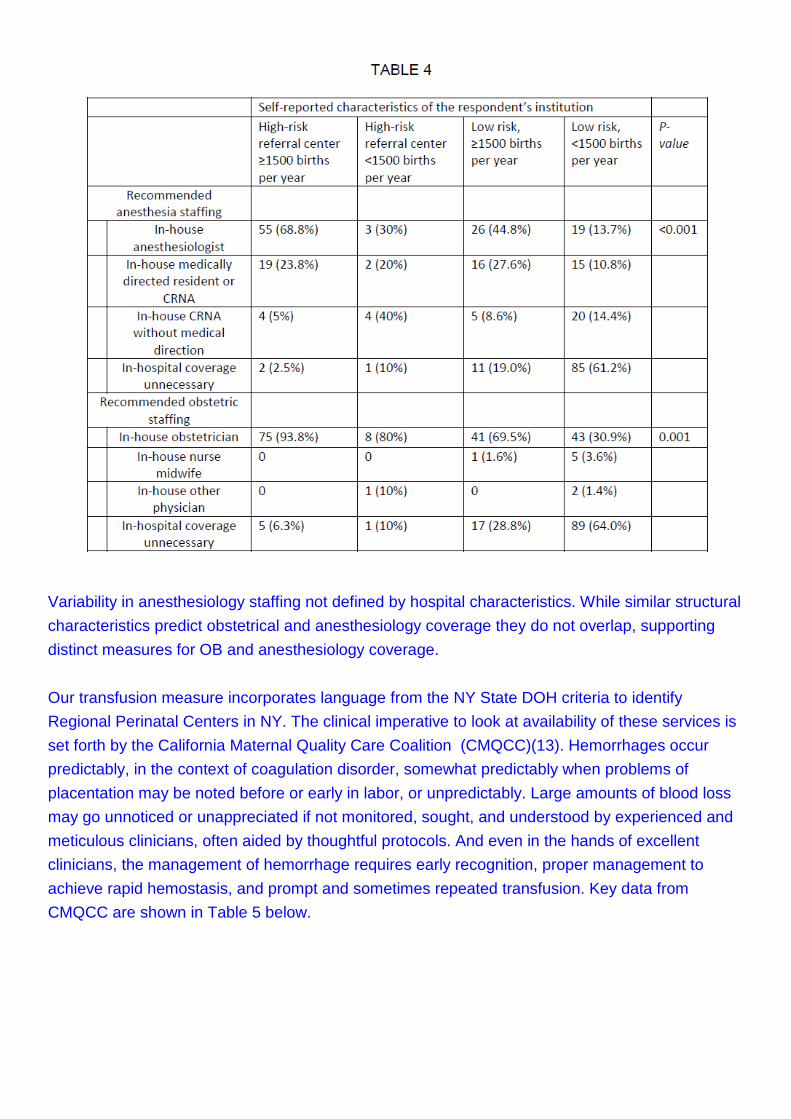
Variability in anesthesiology staffing not defined by hospital characteristics. While similar structural characteristics predict obstetrical and anesthesiology coverage they do not overlap, supporting distinct measures for OB and anesthesiology coverage. Our transfusion measure incorporates language from the NY State DOH criteria to identify Regional Perinatal Centers in NY. The clinical imperative to look at availability of these services is set forth by the California Maternal Quality Care Coalition (CMQCC)(13). Hemorrhages occur predictably, in the context of coagulation disorder, somewhat predictably when problems of placentation may be noted before or early in labor, or unpredictably. Large amounts of blood loss may go unnoticed or unappreciated if not monitored, sought, and understood by experienced and meticulous clinicians, often aided by thoughtful protocols. And even in the hands of excellent clinicians, the management of hemorrhage requires early recognition, proper management to achieve rapid hemostasis, and prompt and sometimes repeated transfusion. Key data from CMQCC are shown in Table 5 below.

For our NY State Medicaid data analysis we used regional perinatal centers (RPC) as a proxy for round the clock transfusion services--RPC are required to have them always available. Among HROB deliveries, for Class A, 13.38%; Class B, 12.62%; and the combined 13.46% delivered in RPC hospitals. We note here another “voltage drop” between OB coverage and blood bank
services, validating our decision to include both measures. Regionalization of perinatal care has been widely accepted in the US; studies document that delivery at hospitals with Level III NICUs is associated with reduced neonatal mortality; the American Academy of Pediatrics encourages regionalization of NICU services.(12, 23, 24) and established Level 3 NICUs as standard of care for many infants. Our 2010 New York State Medicaid analysis found that the following proportion of deliveries in hospitals that had Level 3 or higher nurseries (identified in this data set by regular submission of Revenue Code 173 or 174): Class A, 34.01%; Class B, 37.25%; and Unduplicated combined 34.16%. Even for Class B, in which the desirability for a NICU is highest and most proximal, nearly 2/3 of women deliver in hospitals that do not have one. Our literature review, data collection, and data analyses reveal many deliveries in institutions that lack desirable structural characteristics, plus the independent importance of each of these related measure.
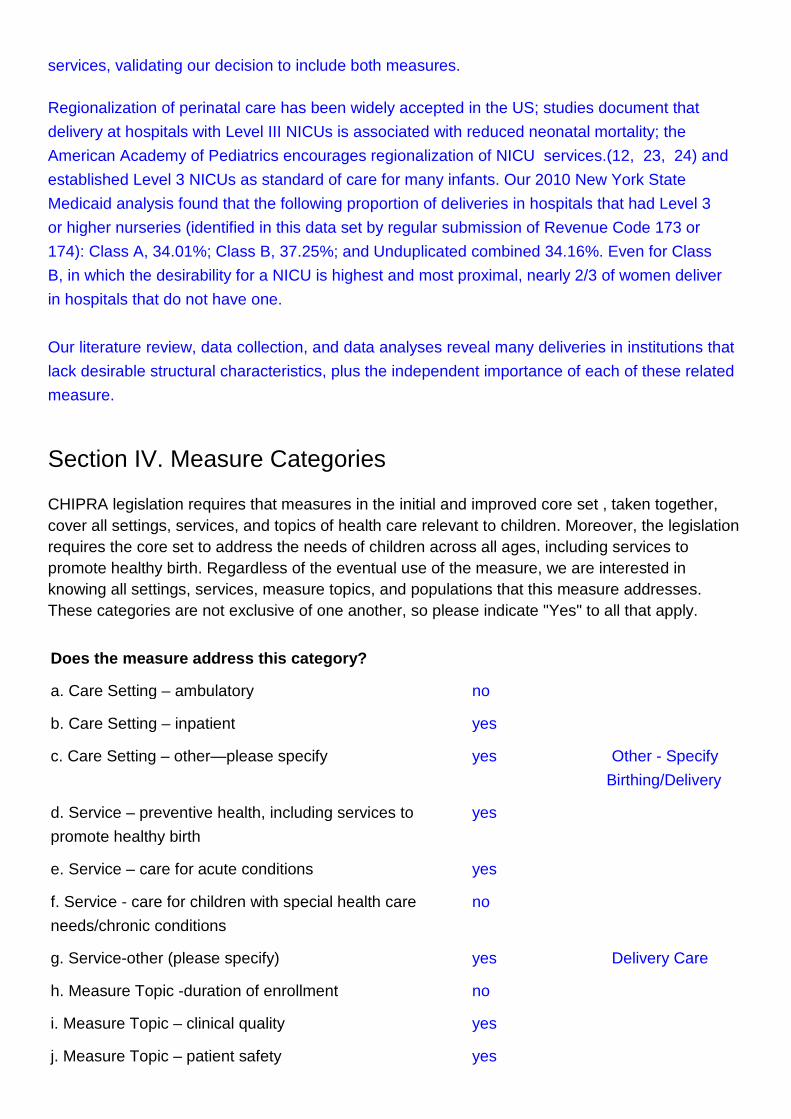
Section IV. Measure Categories CHIPRA legislation requires that measures in the initial and improved core set , taken together, cover all settings, services, and topics of health care relevant to children. Moreover, the legislation requires the core set to address the needs of children across all ages, including services to promote healthy birth. Regardless of the eventual use of the measure, we are interested in knowing all settings, services, measure topics, and populations that this measure addresses. These categories are not exclusive of one another, so please indicate "Yes" to all that apply.
Does the measure address this category?
a. Care Setting – ambulatory no
b. Care Setting – inpatient yes
c. Care Setting – other—please specify yes Other - Specify Birthing/Delivery
d. Service – preventive health, including services to yes promote healthy birth
e. Service – care for acute conditions yes
f. Service - care for children with special health care no needs/chronic conditions
g. Service-other (please specify) yes Delivery Care
h. Measure Topic -duration of enrollment no
i. Measure Topic – clinical quality yes
j. Measure Topic – patient safety yes

k. Measure Topic – family experience with care no
m. Measure Topic – other (please specify) no
n. Population – pregnant women yes
o. Population – neonates (28 days after birth) (specify age yes Delivery/Newborn range)
p. Population – infants (29 days to 1 year) (specify age no range)
q. Population – pre-school age children (1 year through 5 no years) (specify age range)
r. Population – school-age children (6 years through 10 yes Pregnant >=10 years) (specify age range)
s. Population – adolescents (11 years through 20 years) yes Pregnant (specify age range)
t. Population – other (specify age range) yes Pregnant <=65
u. Other category (please specify)
Section V. Evidence or Other Justification for the Focus of the Measure The evidence base for the focus of the measures will be made explicit and transparent as part of the public release of CHIPRA deliberations; thus, it is critical for submitters to specify the scientific evidence or other basis for the focus of the measure in the following sections. V.A. Research Evidence Research evidence should include a brief description of the evidence base for valid relationship(s) among the structure, process, and/or outcome of health care that is the focus of the measure. For example, evidence exists for the relationship between immunizing a child or adolescent (process of care) and improved outcomes for the child and the public. If sufficient evidence existed for the use of immunization registries in practice or at the State level and the provision of immunizations to children and adolescents, such evidence would support the focus of a measure on immunization registries (a structural measure). Describe the nature of the evidence, including study design, and provide relevant citations for statements made. Evidence may include rigorous systematic reviews of research literature and high-quality research studies.

Evidence is discussed throughout this form. A targeted review of the literature is in the Appendix. Further, we interviewed clinicians, engaged clinical societies and accreditors, patient/family groups, NY Medicaid and others to inform our measure development with the intelligence and experiences of stakeholders as well as the medical literature. The ratings of the panel along with a brief description of methodology are included as Appendices. These measures result from careful conduct of a systematic process. The availability of high risk obstetric (HROB) services is a challenging concept, and to develop quality measures that assess availability of high risk obstetrics services we first needed to define: 1) availability of services and 2) high risk obstetrical services. Specifically we wondered whether the target population could be identified by conditions present in the women, by the clinical services required, or by the clinicians providing the services. Through discussions with our Scientific Team, Steering Committee, review of the literature, and in consultation with our Expert Panel we answered these questions in the following manner. Regarding availability we expanded on the Anderson and Aday model, (25) which suggests that utilization of health care is driven by three predisposing characteristics, enabling resources and need, and that these factors are themselves influenced by the available system of care.(26, 27) While their distinction between availability and realized access has blurred over time, we nonetheless chose to respect our assignment by using an availability lens as our framework for these measure. At a system level, utilization can vary as a result of differences in individual behaviors or system characteristics. The current measures predominantly reflect distribution of system attributes, which may include geography, system design, and/or sufficiency of resources.(27) The definition of HROB services for the purposes of these measures is broad and may include services provided by a variety of clinicians if received by a woman who has an identifiable condition that predisposed her or her baby to an increased risk of morbidity and mortality during the assessment period. For this measure set we developed two subcategories of high risk identification. Derived from the literature, Expert Panel ratings, and discussions with our Steering Committee, and from insights drawn from clinician interviews we include a group of maternal diagnosis codes that place women at increased risk of maternal morbidity and mortality and a group of codes that represent complications of delivery, including low birthweight, that place infants at risk for increased morbidity and mortality. Poor birth outcomes, such as birth asphyxia or stillbirth are included among the latter. A significant proportion of pregnant women are at higher risk for maternal or infant morbidity and mortality.(2) Professional societies in pediatrics, anesthesia, and obstetrics provide guidance about the need for availability of specific services regarding HROB. A 2009 Joint Statement from the American Society of Anesthesiologists (ASA) and the American College of Obstetricians and Gynecologists (ACOG) called for available OB anesthesia services. Optimal anesthesia care should include credentialed clinicians always available to administer an appropriate anesthetic.(28 ) The Joint Statement also applies to our first measure as it calls for availability of a licensed practitioner who is credentialed to maintain support of vital functions in any OB emergency, including capacity to start a cesarean delivery within 30 minutes of the decision to perform it.(28) Inadequate physician

supervision is an important cause of adverse events around delivery. One review of maternal deaths and near misses, found mismanagement of patient, failure or delay in diagnosis as factors in 90% of cases (29). Studies focused on the potential for hemodynamic instability around delivery point out the structures required to manage them. (28) (30) Absence or delay of a physician qualified to deliver OB care has been associated with increased risk and higher rates of intrapartum anoxia. [17] Despite the absence of a randomized trial of 24/7 in house physician coverage of OB, the accumulated evidence supports our expert panel’s judgment: this is a critical structural element for HROB. Although 24-hour in-house anesthesia coverage has not been evaluated in a randomized trial, evidence suggests that inadequate anesthesiologist supervision is associated with maternal death. In a study of 18 years of anesthesia-related deaths in Michigan, more than half were attributed to inadequate supervision by an anesthesiologist.(7) Adequate monitoring by an anesthesiologist is vital, as nearly one-third of all births in the U.S. are cesarean deliveries, an increase of nearly 50% since 1996.(31) Risk of death for women with an emergency cesarean section is 3 times as high as those with a planned cesarean section, suggesting that physicians capable of safely performing an emergent cesarean section is of great concern in obstetric care. Moreover, in a retrospective study examining 1.5 million deliveries from 2000 to 2006, the rate of maternal mortality was 10-fold higher with Cesarean delivery compared with a vaginal mode of delivery.(32 ) Consistent with well-documented increases in maternal mortality in cesarean versus vaginal deliveries, the risk of severe maternal morbidity also increases (5-10 times higher), which includes hemorrhage and increased blood loss.(33) Pregnancy-related hemorrhage and transfusion rates have increased substantially over the last decade.(4) Therefore, on-site blood banking/transfusion services are imperative for planned and emergency cesareans, as well as other complications resulting in hemorrhage and extensive maternal blood loss. In their program that designates Regional Perinatal Centers, our partners in the New York State Department of Health operationalize it as: “24-hour capability to provide blood group, Rh Type, cross-matching, antibody testing…Either ABO specific or 0-Rh-negative blood and fresh frozen plasma and cryoprecipitate available at the facility at all times…” Postpartum hemorrhage remains one of the most significant maternal complications of childbirth in the United States, with peripartum transfusion the most commonly identified morbidity.(34) Given the increased risk for transfusion among women with anemia and placentation disorders, we will assess on-site blood banking for all high risk deliveries.(35) Lastly, our definition of high risk deliveries includes deliveries of low birthweight infants. There is an abundance of literature that has demonstrated that very small infants delivered in level 3 nurseries have better outcomes.(23, 36) In the 1970’s regionalization of perinatal care was instituted in the United States and evaluations have demonstrated that antepartum risk identification and transfer of management of high risk pregnancies to tertiary centers for delivery resulted in reduced neonatal mortality.(24) Regionalization of perinatal care has been widely accepted in the United States and reaffirmed in a recent American Academy of Pediatrics Policy

Statement(12). We include a broader definition to high risk and now propose to measure the proportion of high risk deliveries that occur in hospitals with Level III or higher neonatal intensive care units. V.B. Clinical or other rationale supporting the focus of the measure (optional) Provide documentation of the clinical or other rationale for the focus of this measure, including citations as appropriate and available. This is discussed in detail above in the Importance of the measure section. This measure has importance as a descriptor of the structural elements necessary for safe maternity care. The rationale can be summarized as follows: Our expert panel reinforced and prioritized as highly important several structural aspects of high risk obstetrical care (HROB) that are supported both by the evidence base and by leading clinical societies and other significant actors (see, for example, the New York State Perinatal Designation Matrix in the Appendix, or the California Maternal Quality Care Collaborative OB Hemorrhage Toolkit at http://cmqcc.org/ob_hemorrhage). There are four topics in the structural measures:
1. Presence of a 24 hour physician dedicated to obstetrics and capable of safely handling routine obstetrical care as well as obstetrical surgical emergencies, such as emergency caesarian sections;
2. Presence of a 24 hour obstetrical anesthesiologist capable of managing routine and emergent anesthesia care in the Labor and Delivery setting;
3. Capacity to manage peripartum hemorrhages. Presence of 24 hour blood banking/transfusion services.
4. Presence of a Level 3 or higher neonatal intensive care unit (using American Academy of Pediatrics definitions). In turn, these four measures represent the capacity to provide critical, often ‘life or death’ services in a timely way that meets the needs and capacities of these women to obtain them. Their significance raises them to concerns about patient safety. They are specified so as to be able to identify disparities that arise because of socio-economic, racial/ethnic, and rural/urban considerations. In this regard they address 4 (Timeliness, Equity, Safety, and Patient- Centeredness) of 6 characteristics (Efficient and Effective are the other two) of quality care described in the IOM’s Crossing the Quality Chasm. We have described the population effectiveness of these health care structures in our review above. And in the absence of a nationwide study evincing evidence that it is cost effective to make services available everywhere in the US, we have cited evidence that prevention of some of the complications that result from failures will be cost effective or cost saving at least in some circumstances. The proposed measures can provide new measures of availability with which to assess both the outcomes and the cost-effectiveness of future efforts to enhance the availability of HROB services.

We have operationalized the need for HROB services broadly, consistent with the guidance provided by our expert panel. Our definitions borrow from the literature and from AHRQ’s own clinical classification software, and at the margins are defined based upon specific guidance provided by our expert panel. In so doing, we produce a measure that is more sensitive and less specific, as is desirable for a measure intended to create a gradient at the population level such as we described above. These are not measures designed to assess as good or bad the quality of care for any individual pregnancy. Rather they are designed to provide insight into the availability of HROB services to a population of women who may need them. This approach is consistent with the useful Institute of Medicine definition of quality health care, as “The degree to which health services for individuals and populations increase the likelihood of desired health outcomes and are consistent with current professional knowledge.” (37) Thus each of these measures may be said to specify current professional knowledge in a way that produces an index that describes the degree to which specific HROB services (pertaining to delivery) are available to women who are at risk to need them. The salience and validity of our work has benefited from our use of a formal method, a pragmatic adaptation of the CAPQuaM 360 degree method. The method, as adapted to availability of HROB services, described in the next paragraph was specifically designed to develop valid and reliable measures in the face of pragmatic epistemological uncertainty. That is, recognizing that practice extends well beyond the research base, we designed this method to allow us to develop reliable and valid state of the science measures, in part by explicitly modeling and accounting for uncertainties in the measure development, in part by the conceptualization and implementation of a Boundary Guideline (see below). We have shared and refined this approach in a number of venues including within the PQMP, comprised of the various PQMP AHRQ-CMS CHIPRA Centers of Excellence, the state PQMP participants, and AHRQ and CMS participants. All presentations have invited dialogue and feedback. This work has been similarly presented at a number of Grand Rounds / weekly conferences in the New York-New Jersey area as well was to national/international audiences including the Bioethics and children’s health services communities. These latter venues include:
• 2012 Pediatric Academic Societies State of the Science Plenary (Boston). This presentation is included as an Appendix.
• 2012 Oxford-Mount Sinai Bioethics Consortium (Amsterdam)
• 2012 Child Health Services Research Interest Group at Academy Health (Orlando) Feedback from these presentations has been extremely positive. The Boundary Guideline construct has generated particular enthusiasm. We asked the Bioethics Consortium to extrapolate the primum non nocere (First, do no harm) principle to apply regarding this aspect of performance measurement. We received strong feedback that not only is it ethical to measure using systematically developed measures (even in the context of some uncertainty), but that it is ethically preferable to use such measures compared with the alternative of providing care that is not assessed (and perhaps not assessable) because of residual uncertainty.

Fortunately, in the case of this proposed measure we can present both a systematically developed measure and a variety of evidence to support its use.
Section VI. Scientific Soundness of the Measure Explain the methods used to determine the scientific soundness of the measure itself. Include results of all tests of validity and reliability, including description(s) of the study sample(s) and methods used to arrive at the results. Note how characteristics of other data systems, data sources, or eligible populations may affect reliability and validity. VI.A. Reliability Reliability of the measure is the extent to which the measure results are reproducible when conditions remain the same. The method for establishing the reliability of a measure will depend on the type of measure, data source, and other factors. Explain your rationale for selecting the methods you have chosen, show how you used the methods chosen, and provide information on the results (e.g., the Kappa statistic). Provide appropriate citations to justify methods. The strengths of this measure derive from its systematic development, its meticulous specification, its careful conceptualization and articulation and its grounding in existing science and consensus. The data collection and reliability therein depend upon the use of administrative data. These data are used to identify deliveries (our specifications are a slight enhancement of CDC methodologies described in Kuklina et al(38); to Kuklina’s work we added Revenue code 722). This was important for our test because the Medicaid MAX data provided by CMS and in which these schemas were tested does not include DRGs, which are employed in the Kuklina method. We tested also a variation of the approach to identify deliveries employed by HEDIS in its Timing of PreNatal Care measure in the initial CHIPRA core set. We found that these approaches identified substantially the same population of deliveries in a sixteen state subset of the national MAX database. We chose the 18 states to include in an attempt to manifest some standardization of approaches across the seven AHRQ-CMS CHIPRA Centers of Excellence—they were recommended to us as a diverse set of states with high data quality by the Children’s Hospital of Pennsylvania Center which has used them extensively in a number of their validation activities. As the different approaches produced 90% or more overlap, we decided to specify the measure based upon the Kuklina/CDC approach as both widely used and relevant for the type of population-based approach to measurement proposed in this measure. In determining which women were to be considered potentially in need of HROB services, our specifications further rely upon administrative data. One study found that quality measures that
could be calculated using administrative data showed higher rates of performance than indicated by a review of the medical record alone, and that claims data is more accurate for identifying services with a high likelihood of documentation due to reimbursement.(39) Further, at the current stage of EMR development and implementation, chart review is likely to prove infeasible for population-based measures of this scope. Since this measure is specified to be interpreted at the population and not the individual level, the impact of some of the imperfections of using administrative data will be overcome naturally because of the law of large numbers. As an illustration of our approach, we provide a case example of our decision to exclude two diagnoses from the inclusion criteria. The expert panel rated valvular heart disease as significant and an indication of the need for HROB. In its deliberations it made clear that often trivial conditions such as murmurs or simple mitral valve prolapse were not the target of its rating. So in specifying the inclusion specifications, we included Clinical Classifications category 96, Heart Valve Disorders, but specified the removal of three ICD-9 codes from that category (4240 Mitral valve disorders, 7852 Undiagnosed cardiac murmurs, 7853 Other abnormal heart sounds). There are two points about this. The CAPQuaM team made the clinical judgment that it was more true to the intention of the panel to accept the error that results from eliminating the rarer more serious isolated mitral valve disorders than the error of including the common and often innocuous mitral valve prolapse in the specified sample. This decision was affirmed when upon their review of our specifications and the table above, no panel member questioned that judgment. Secondly, we want to be clear that the three ICD-9 codes mentioned were not then used as exclusion criteria if there were other reasons for the pregnancy to be identified as high risk. Rather these codes were removed from the inclusion criteria. Regarding the assessment of the presence or absence of structural characteristics in this measure set, we have specified this measure to use the results of questionnaires or surveys that we envision as paper, email or internet-based. Our feasibility assessment determined that these data are readily available from key individuals at the hospitals. We could imagine that one or more states or health plans have databases that link some or all of these data (especially Level 3 or higher nurseries) and to hospitals and it would be an acceptable approach to use those data. The regular use of Revenue Code 173 or 174 could also be used to identify Level 3 or 4 Nursery care respectively. If challenged, we consider public self-report to be preferable to the use of a database unless there is evidence of deception or fraud. We have developed our survey questions in accordance with best practices and after studying the American Hospital Association Annual Survey of Hospitals(17, 40), which is considered the authoritative survey of hospital structural characteristics in the United States. After careful internal review and revision by the scientific team, appropriate clinicians, and experts, we concluded our development of the four-item questionnaire with one formal cognitive interview. We conducted this interview with the Director of Special Projects in the Office of Patient Excellence at the Mount Sinai Medical Center. This individual is not a clinician and had no previous involvement with the development of these measures. The items were revised and modified in accordance with the findings from that interview and provided back for her review. After a second round of revisions we

received confirmation that all relevant issues had been addressed successfully and that the questions were clear and unambiguous. We found that of ~119,000 Medicaid deliveries in New York State in 2010, 59254 were at sufficiently elevated risk to qualify for this measure set: 56,465 (~47%) were identified using Class A criteria, 7800 using Class B (~7%), and 59254 (just under 50%) using either Class A or Class B, meaning that 2789 (or about 5% of the overall high risk pregnancies) were identified only using Class B. We expected a substantial “voltage drop” between a condition of elevated risk and a complication or an undesirable outcome. Hence maternal diagnoses codes of Class A will predictably be orders of magnitude larger than the delivery and neonatal codes of Class B. These findings are consistent with our predictions and expectations. Our team had predicted that 40-50% of all pregnancies would have elevated risk and these findings are consistent with the expectations that Medicaid would be at least at the higher end of that range. Use of a mother-only algorithm in MAX data in 16 states indicates the proportion of high risk pregnancies ranges from 31.50% in NJ to 63.97% in KY. The NY MAX finding was 55,379 HROB pregnancies, almost identical to the 56,465 found using internal data bases on the maternal codes, indicating very high reliability across systems. VI.B. Validity Validity of the measure is the extent to which the measure meaningfully represents the concept being evaluated. The method for establishing the validity of a measure will depend on the type of measure, data source, and other factors. Explain your rationale for selecting the methods you have chosen, show how you used the methods chosen, and provide information on the results (e.g., R2 for concurrent validity). The reliability section above contains also contains information related to validity. Our definition of high risk obstetrical services results from a formal RAND/UCLA modified Delphi process conducted with a multidisciplinary panel of national experts that included obstetricians, MFM specialists, and a nurse midwife, anesthesiologist and family physician. We carefully operationalized the panel’s clinical recommendations by fine tuning AHRQ’s Clinical Classification Software. We operationalized panel specifications using data elements that are available in typical administrative data sets. Potential exceptions are elements like race and ethnicity. Our feasibility work confirmed race/ethnicity are generally available from clinical charts. The CHIPRA legislation (2009) which directs our measures to be capable of identifying disparities and we have specified it to be so, although we are aware of variability in the manner of assignment of race and ethnicity by health care facilities. Use of administrative data in performance assessment is common. They contain consistent elements, are available, inform regarding large numbers of individuals, and are relatively inexpensive. Validity of many has been established, and their strengths and weaknesses relative

to data abstracted from medical records and obtained via survey have been documented and their use encouraged by federal agencies.(41) The Centers for Medicare & Medicaid Services has made clear to the participating AHRQ-CMS CHIPRA Centers of Excellence funded to develop measures in the Pediatric Quality Measures Program that it places a premium on feasibility. Expert Panels have been demonstrated to enhance measure development and health care evaluation, including for children.(42) frontline practitioners can assist researchers to create useful measures.(43) CAPQuaM’s 360 degree method is highly engaged with collaborators, partners, and the literature. It targets relevant information and perspective and measures emerge from the process. Potential measures are tested to the extent that time and resources permit. In developing the HROB availability measures we incorporate: • Engagement with broadly diverse partnered institutions and senior advisors; • Detailed literature review; • Interviews with clinicians from around the country; • The CAPQuaM scientific team; • A geographically diverse, multidisciplinary expert panel who participated in a 2 Round
RAND/UCLA modified Delphi process, with enhanced follow up; • Development of a Boundary Guideline that incorporates simultaneously a variety of
gradients, including gradients of importance, relevance, and certainty, as appropriate to the construct being represented;
• Specification and review of measures and approaches to measurement by stakeholders and experts;
• Testing and assessment of measure performance using Medicaid data. Key aspects of validity of HROB measures Availability The construct of availability is complex and can be muddied in the distinction or lack thereof between availability, access, and utilization (27). For this first PQMP measure set on availability of HROB services, we selected four measures that avoid any potential confusion between availability and access or utilization. In modern medical practice, all women having babies require some form of delivery services. By looking at the rate at which eligible (i.e., high risk) deliveries occur in hospitals that have key structural elements associated with better outcomes we create an index of the availability of those services. All else equal, we would expect women who live in more medically dense communities to experience greater availability than those in less medically dense communities and those who live in more isolated communities to have less availability. While these measures are challenging to validate definitively, these predictions give us an opportunity to explore construct validity. High Risk We have operationalized a systematic expert process informed by a detailed literature review and incorporating a well described and frequently utilized system developed by AHRQ. While we have modified this system, it has been done to be consistent with its use in this context and to remain
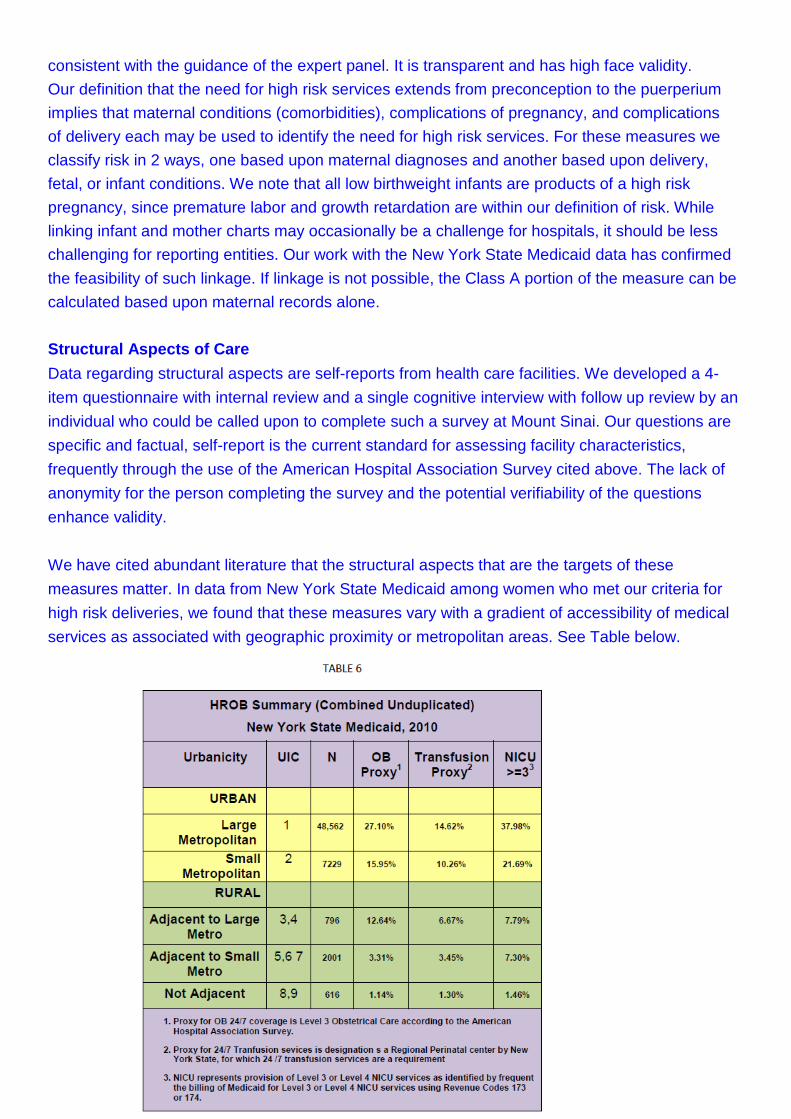
consistent with the guidance of the expert panel. It is transparent and has high face validity. Our definition that the need for high risk services extends from preconception to the puerperium implies that maternal conditions (comorbidities), complications of pregnancy, and complications of delivery each may be used to identify the need for high risk services. For these measures we classify risk in 2 ways, one based upon maternal diagnoses and another based upon delivery, fetal, or infant conditions. We note that all low birthweight infants are products of a high risk pregnancy, since premature labor and growth retardation are within our definition of risk. While linking infant and mother charts may occasionally be a challenge for hospitals, it should be less challenging for reporting entities. Our work with the New York State Medicaid data has confirmed the feasibility of such linkage. If linkage is not possible, the Class A portion of the measure can be calculated based upon maternal records alone. Structural Aspects of Care Data regarding structural aspects are self-reports from health care facilities. We developed a 4-item questionnaire with internal review and a single cognitive interview with follow up review by an individual who could be called upon to complete such a survey at Mount Sinai. Our questions are specific and factual, self-report is the current standard for assessing facility characteristics, frequently through the use of the American Hospital Association Survey cited above. The lack of anonymity for the person completing the survey and the potential verifiability of the questions enhance validity. We have cited abundant literature that the structural aspects that are the targets of these measures matter. In data from New York State Medicaid among women who met our criteria for high risk deliveries, we found that these measures vary with a gradient of accessibility of medical services as associated with geographic proximity or metropolitan areas. See Table below.
We interpret the findings to suggest that these services become less available with increasing rurality, as we had predicted. We designed the measures to identify reduced availability for any reason, including geographic isolation and the observed gradient strongly supports the validity of these as population measures of availability. These measures move in similar directions but not in lock step, confirming that they are measuring related but not identical constructs, as we would hope. The overall availability of these structural components of high risk obstetrical services is low compared to the identified need. Please see sections III.C, V.A, and VI.A. above for additional evidence of validity. Section VII. Identification of Disparities CHIPRA requires that quality measures be able to identify disparities by race, ethnicity, socioeconomic status, and special health care needs. Thus, westrongly encourage nominators to have tested measures in diverse populations. Such testing provides evidence for assessing measure’s performance for disparities identification. In the sections below, describe the results of efforts to demonstrate the capacity of this measure to produce results that can be stratified by the characteristics noted and retain the scientific soundness (reliability and validity) within and across the relevant subgroups. VII.A. Race/Ethnicity Our feasibility assessment confirmed that racial and ethnicity data are almost universally available and that method of assignment of race and ethnicity to the mother varied. It could be based on maternal self-report or assigned by the hospital. National improvement is needed in the methods
used to assign race and ethnicity in hospital discharge data. For the purposes of this measure we are resigned at this time to using the existing data as recorded in the mothers’ medical records. Testing sites that participated in the CAPQuaM feasibility assessment were asked to determine if maternal race/ethnicity was documented in the maternal chart, the infant chart, or if the information was located in both charts. Sites were also asked if infant race/ethnicity was documented in the maternal chart, the infant chart, or both charts. Representatives from institutions were asked to determine whether the data source for maternal race/ethnicity was located in an electronic medical record format (EMR) or a paper format. Institutions were also asked to indicate the difficulty of data abstraction in obtaining maternal race/ethnicity. Responses included very difficult to collect, difficult to collect, not difficult to collect, or unavailable. Virtually all indicated that this was not difficult to collect. The data was generally on the electronic medical records. The New York State Medicaid Program was able to identify race using their information systems. Forty five individuals out of nearly 60,000 pregnancies were missing data on race. We also examined race/ethnicity data in New York State Medicaid files. The following statistics focus on women found to be high risk by at least one of our two approaches identifying high risk women. Although the scarcity of black women having babies in rural counties limited the scope of our analyses, we were able to see racial differences in the more urban counties. In Large Metropolitan areas among women who met our criteria for high risk deliveries, 44.76% of black women, 40.11% of Hispanic women, and 30.04% of white women in Medicaid delivered in hospitals with Level 3 or higher NICUs. This may reflect housing patterns with increased numbers of minorities in inner cities, more proximate to hospitals with these services. This hypothesis is supported because those living in smaller metropolitan areas (under 250,000), show both lower rates and a different distribution: black women at 33.54%, white women at 20.04%, and Hispanic women at 13.89%. A different pattern is seen with regional perinatal centers, our proxy for 24/7 blood banking/transfusion centers. For large metro areas among women who met our criteria for high risk deliveries, 19.25% of white women, 13.92% of black women, and 13.82% of Hispanic women deliver at these institutions. Still a slightly different pattern (black>Hispanic>white) is seen in large metro areas for our OB proxy measure. We found that our measures are able to identify statistically significant differences in performance across race/ethnicity, poverty, and also when stratifying for several of the levels of urbanicity. VII.B. Special health care needs Not Assessed

VII.C. Socioeconomic status Institutions participating in feasibility assessments were asked to determine whether sources of payment could be found in patient charts. Payment sources were identified as being in the form of an electronic medical record (EMR) or a paper record. Representatives from the participating institutions were then asked to assess the difficulty of data abstraction of the payment source. Responses included very difficult to collect, difficult to collect, not difficult to collect, or unavailable. A space was also provided for institutions to provide an explanation and additional comments that might be insightful. Virtually all indicated that this was not difficult to collect. The data was generally on the electronic medical records. Our feasibility testing demonstrated that we can use Medicaid insurance as a marker for SES and our New York City data demonstrate this to be an important independent predictor of poor maternal and infant outcomes. We further use the national distribution of percent of individuals in poverty to establish five categories that reflect the counties level of poverty. We considered other data such as county median income or county unemployment, but felt that the percent of individuals in poverty was a more integrative measure. The use of a geographic rather than an individual measure is consistent with recent applications of hierarchical methods to study the impact of poverty and also with data that indicate that local disparities in income is an independent predictor of outcomes. It also allows this measure to consider issues of socioeconomic status while using publicly available data and requiring only the mother’s county of residence, a more reliable data point than self-reported income. Our analysis of USDA data considering 3142 counties and related geographic units found a mean of 17.2 % of county residents living in poverty, a standard deviation of 6.5%, and an interquartile range of 8.2%. The distribution illustrated below, shows meaningful dispersion and supports our plan to build off quartiles of distribution with a finer focus in higher areas of poverty. See Table 7 below.
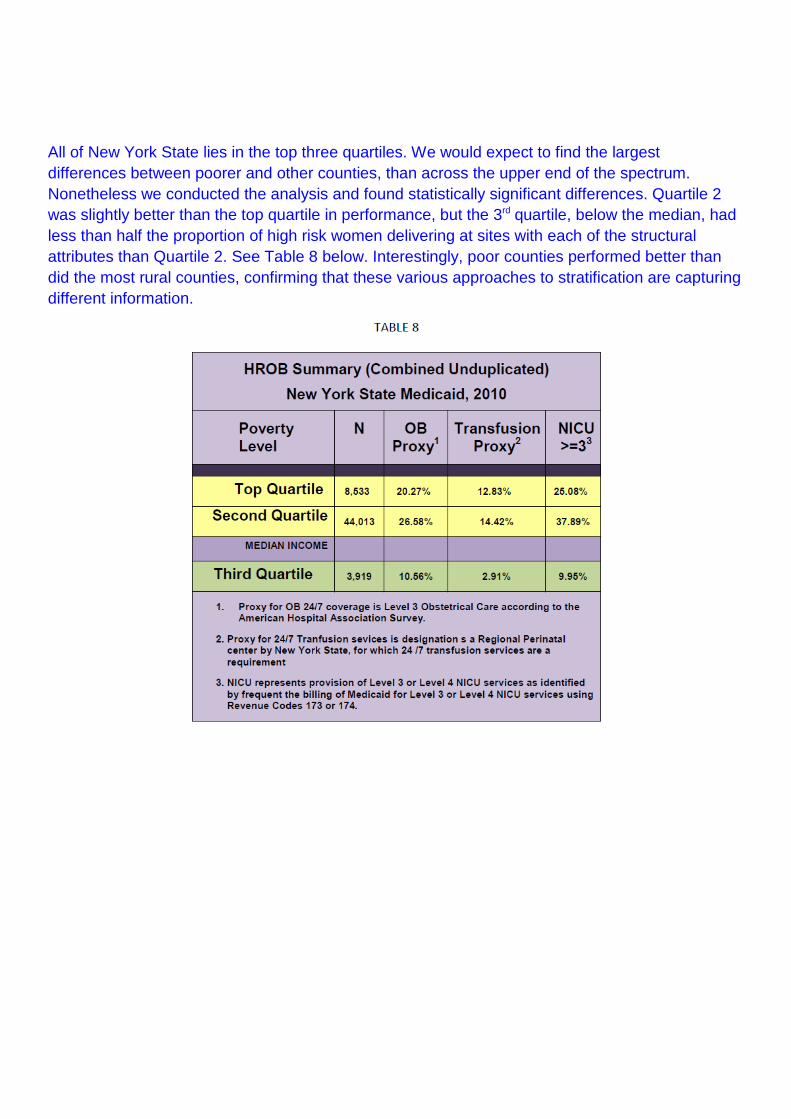
All of New York State lies in the top three quartiles. We would expect to find the largest differences between poorer and other counties, than across the upper end of the spectrum. Nonetheless we conducted the analysis and found statistically significant differences. Quartile 2 was slightly better than the top quartile in performance, but the 3rd quartile, below the median, had less than half the proportion of high risk women delivering at sites with each of the structural attributes than Quartile 2. See Table 8 below. Interestingly, poor counties performed better than did the most rural counties, confirming that these various approaches to stratification are capturing different information.

VII.D. Rurality/Urbanicity As described in the specification we use urban influence codes to describe the level of rurality or urbanicity. Metropolitan
1 In large metro area of 1+ million residents 2 In small metro area of less than 1 million
residents Non-metropolitan 3 Micropolitan adjacent to large metro 4 Non-core adjacent to large metro 5 Micropolitan adjacent to small metro 6 Non-core adjacent to small metro with own town 7 Non-core adjacent to small metro no own town 8 Micropolitan not adjacent to a metro area 9 Non-core adjacent to micro with own town 10 Non-core adjacent to micro with no own town 11 Non-core not adjacent to metro or micro with own town 12 Non-core not adjacent to metro or micro with no own town
We analyzed 3143 county equivalents in the U.S, and the results are shown in Table 9 below.
The population is heavily weighted to metropolitan areas as demonstrated in Table 10 below.

As noted, we use Urban Influence Codes (UIC), which have been developed by the USDA based on a number of criteria to describe the levels of urbanicity and rurality. This is intended not only to report within plan differences but to allow for aggregation as appropriate. While each UIC has its own meaningful definition, some researchers choose to aggregate various codes. We recommend consideration of the aggregation schema of Bennett and colleagues at the South Carolina Rural Research Center.(44) Their aggregation scheme brings together Codes 1 & 2 as Urban; 3,5, & 8 as micropolitan rural; 4,6, & 7 as rural adjacent to a metro area; and 9, 10, 11, & 12 as remote rural. We observe that UIC 5 might as well be aggregated with 4,6,&7 as an adjacent rural area. Further, this approach to rurality does not map exactly to the population density based definition of frontier (< 6 persons per square mile) as articulated in the Affordable Care Act. However, use of such categories is consistent with the ACA’s intent that the Secretary ask that data that are collected for racial and ethnic disparities also look at underserved frontier counties. Frontier health care may be approximated by analysis of the remote rural categories.(45) Our judgment was confirmed after CAPQuaM consulted with Gary Hart, Director of the Center for Rural Health at the University of North Dakota. School of Medicine & Health Sciences, who is heading a HRSA-funded project to develop new methods to analyze frontier health. We clarified that his work suggests that UIC 9-12 is the best overall approach to using county level data to study frontier health. Inclusion of UIC 8 would make the analysis more sensitive to including frontier areas but at a meaningful cost in sensitivity.
Those interested in care specific to large cities may wish to aggregate rural areas and analyze UIC 1 and 2 separately. The New York State Medicaid data were sensitive to urbanicity and this was described above in the main validity section. VII.E. Limited English Proficiency (LEP) Populations Not assessed, but there is nothing intrinsic to the measure to inhibit its use in that population so long as the LEP characteristic can be linked to the pregnancy or delivery data. Section VIII. Feasibility Feasibility is the extent to which the data required for the measure are readily available, retrievable without undue burden, and can be implemented for performance measurement. Using the following sections, explain the methods used to determine the feasibility of implementing the measure. VIII.A. Data Availability 1. What is the availability of data in existing data systems? How readily are the data available? Feasibility is the extent to which the data required for the measure are readily available, retrievable without undue burden, and can be implemented for performance measurement.11 Using the following sections, explain the methods used to determine the feasibility of implementing the measure. The CAPQuaM High-Risk OB measures seek to assess the proportion of high risk women that deliver at hospitals without certain levels of available services. As such, the data elements of interest include: • Documentation of conditions that would classify a woman as “high risk” • The number of deliveries at a given hospital • For stratification purposes:
o Race and ethnicity
o Insurance type (Medicaid, Private, Uninsured)
o Managed care insurance – Yes/No (where applicable)

o Benefit category (for Medicaid and CHIP eligible cohorts)
o Income level (as recorded for Medicaid and CHIP eligible cohorts)
o County equivalent and State, or Zip Code of residence Several of these data elements are readily available through hospital administrative data. For example, identification of women with “high risk” conditions, number of deliveries at a given hospital, and presence of a Level 3 (or higher) NICU, can be achieved through use of the appropriate ICD9, CCS, and/or revenue codes. Additionally, benefit type is typically recorded in health plan, Medicaid and CHIP administrative data sets. As part of our feasibility assessment, CAPQuaM partnered with New York State Medicaid to conduct a variety of analyses using their administrative data set. The findings from these analyses indicated that the aforementioned administrative data elements are also readily available at the state-level, and can be abstracted and used for calculating and reporting the CAPQuaM HROB measures. Further, we have specified several variables, for SES, and urbanicity by linking county of residence at the time of delivery to publicly available data sets. The CAPQuaM feasibility assessment received responses from 9 of 10 sites with obstetrical services around the country. Results from the assessment indicated that, in general, the data elements of interest are available in the medical record system and not difficult to abstract, including race, ethnicity, and zip code or state and county of residence, for those administrative systems that may lack them. Payment source (insurance type) should be available in a health plan data base and is also easily obtained from electronic data at the health care facility. While linking mother and infant records can be challenging at a few sites, this should be less difficult for insurers and the New York State Medicaid program had no problem doing so for our analyses. Finally, while data elements are generally available in administrative data sets, we have collected data from health care facilities with obstetrical services and confirmed the availability and accessibility of supplemental data were it needed. Our survey itself also asked about a number of structural characteristics including 24/7 services, blood banking/transfusion, NICU services and found these respondents did not have any trouble answering these questions. 2. If data are not available in existing data systems or would be better collected from future data systems, what is the potential for modifying current data systems or creating new data systems to enhance the feasibility of the measure and facilitate implementation? The data required for the CAPQuaM HROB Structural measures are generally available in the existing data systems, except for the structural attributes themselves. Development of a standardized assessment tool (or adoption of the CAPQuaM Demonstration Survey) and maintenance of a data base with results would make using these measures more rapid.

Enhancement of collection of patient reported race-ethnicity data into existing administrative systems would also be valuable. VIII.B. Lessons from Use of the Measure 1. Describe the extent to which the measure has been used or is in use, including the types of settings in which it has been used, and purposes for which it has been used. New measure. 2. If the measure has been used or is in use, what methods, if any, have already been used to collect data for this measure? We plan to use the Epic EMR to the extent possible and supplement with an electronic data entry system that is algorithmic and efficient with a data base residing on the hospital’s secure servers. The planning and development for this implementation is ongoing. 3. What lessons are available from the current or prior use of the measure? The measure is not currently in use.
Section IX. Levels of Aggregation CHIPRA states that data used in quality measures must be collected and reported in a standard format that permits comparison (at minimum) at State, health plan, and provider levels. Use the following table to provide information about this measure’s use for reporting at the levels of aggregation in the table. For the purpose of this section, please refer to the definitions for provider, practice site, medical group, and network in the Glossary of Terms. If there is no information about whether the measure could be meaningfully reported at a specific level of aggregation, please write "Not available" in the text field before progressing to the next section. Level of aggregation (Unit) for reporting on the quality of care for children covered by Medicaid/ CHIP†: State level*: Can compare States Intended use: Is measure intended to support yes
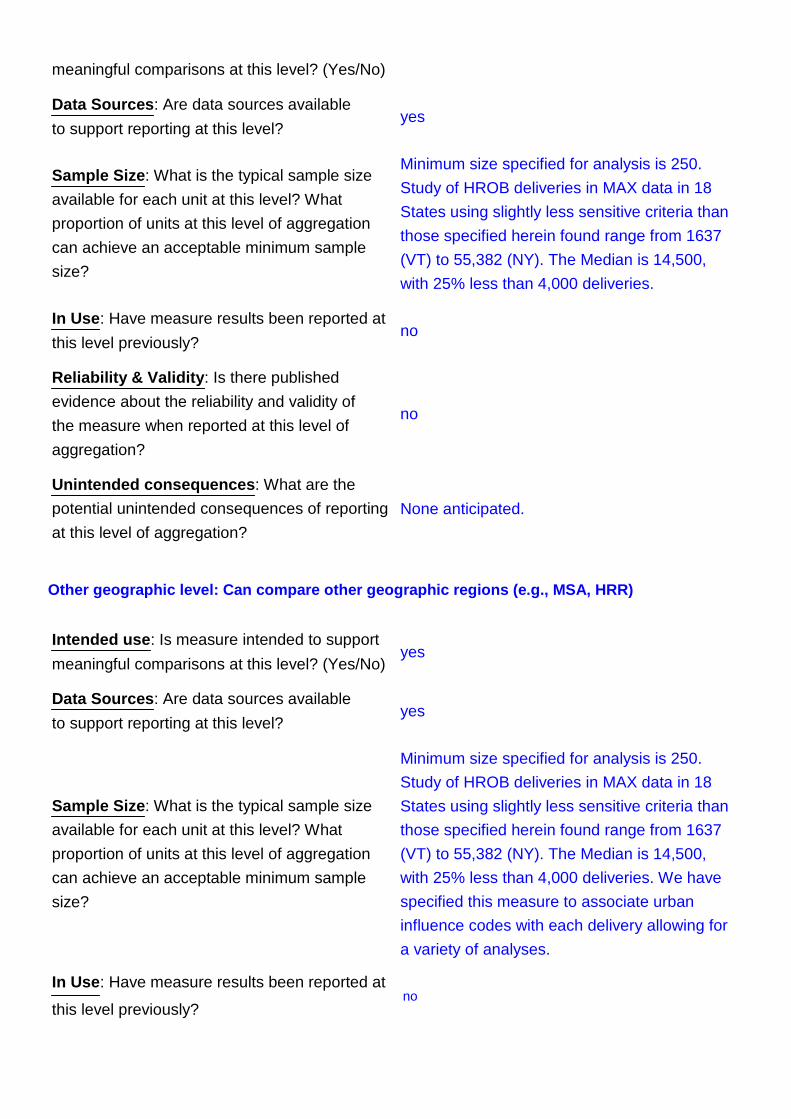
meaningful comparisons at this level? (Yes/No) Data Sources: Are data sources available to support reporting at this level?
Sample Size: What is the typical sample size available for each unit at this level? What proportion of units at this level of aggregation can achieve an acceptable minimum sample size?
In Use: Have measure results been reported at this level previously? Reliability & Validity: Is there published evidence about the reliability and validity of the measure when reported at this level of aggregation? Unintended consequences: What are the potential unintended consequences of reporting at this level of aggregation?
yes Minimum size specified for analysis is 250. Study of HROB deliveries in MAX data in 18 States using slightly less sensitive criteria than those specified herein found range from 1637 (VT) to 55,382 (NY). The Median is 14,500, with 25% less than 4,000 deliveries.
no no None anticipated.
Other geographic level: Can compare other geographic regions (e.g., MSA, HRR) Intended use: Is measure intended to support meaningful comparisons at this level? (Yes/No) Data Sources: Are data sources available to support reporting at this level? Sample Size: What is the typical sample size available for each unit at this level? What proportion of units at this level of aggregation can achieve an acceptable minimum sample size?
yes yes Minimum size specified for analysis is 250. Study of HROB deliveries in MAX data in 18 States using slightly less sensitive criteria than those specified herein found range from 1637 (VT) to 55,382 (NY). The Median is 14,500, with 25% less than 4,000 deliveries. We have specified this measure to associate urban influence codes with each delivery allowing for a variety of analyses.
In Use: Have measure results been reported at
no this level previously?

Reliability & Validity: Is there published evidence about the reliability and validity of the
no measure when reported at this level of aggregation? Unintended consequences: What are the potential unintended consequences of reporting None anticipated. at this level of aggregation? Medicaid or CHIP Payment model: Can compare payment models (e.g., managed care, primary care case management, FFS, and other models) Intended use: Is measure intended to support meaningful comparisons at this level? (Yes/No) Data Sources: Are data sources available to support reporting at this level?
Sample Size: What is the typical sample size available for each unit at this level? What proportion of units at this level of aggregation can achieve an acceptable minimum sample size?
In Use: Have measure results been reported at this level previously? Reliability & Validity: Is there published evidence about the reliability and validity of the measure when reported at this level of aggregation? Unintended consequences: What are the potential unintended consequences of reporting at this level of aggregation?
yes yes Minimum size specified for analysis is 250. Study of HROB deliveries in MAX data in 18 States using slightly less sensitive criteria than those specified herein found range from 1637 (VT) to 55,382 (NY). The Median is 14,500, with 25% less than 4,000 deliveries.
no no None Anticipated
Health plan*: Can compare quality of care among health plans. Intended use: Is measure intended to support
yes meaningful comparisons at this level? (Yes/No) Data Sources: Are data sources available to
yes support reporting at this level?

Sample Size: What is the typical sample size available for each unit at this level? What proportion of units at this level of aggregation can achieve an acceptable minimum sample size?
In Use: Have measure results been reported at this level previously? Reliability & Validity: Is there published evidence about the reliability and validity of the measure when reported at this level of aggregation? Unintended consequences: What are the potential unintended consequences of reporting at this level of aggregation?
Minimum size specified for analysis is 250. Study of HROB deliveries in MAX data in 18 States using slightly less sensitive criteria than those specified herein found range from 1637 (VT) to 55,382 (NY). The Median is 14,500, with 25% less than 4,000 deliveries.
no no None anticipated
PROVIDER LEVEL Individual practitioner: Can compare individual health care professionals Intended use: Is measure intended to support meaningful comparisons at this level? (Yes/No) Data Sources: Are data sources available to support reporting at this level? Sample Size: What is the typical sample size available for each unit at this level? What proportion of units at this level of aggregation can achieve an acceptable minimum sample size?
no no Not specified for this purpose. Use not recommended
In Use: Have measure results been reported at
no this level previously? Reliability & Validity: Is there published evidence about the reliability and validity of the
no measure when reported at this level of aggregation? Unintended consequences: What are the potential unintended consequences of reporting at this level of aggregation?
Not specified for this purpose. Use not recommended

PROVIDER LEVEL Hospital: Can compare hospitals Intended use: Is measure intended to support meaningful comparisons at this level? (Yes/No) Data Sources: Are data sources available to support reporting at this level? Sample Size: What is the typical sample size available for each unit at this level? What proportion of units at this level of aggregation can achieve an acceptable minimum sample size?
no no Not specified for this purpose. Use not recommended
In Use: Have measure results been reported at
no this level previously? Reliability & Validity: Is there published evidence about the reliability and validity of the
no measure when reported at this level of aggregation? Unintended consequences: What are the potential unintended consequences of reporting at this level of aggregation?
Not specified for this purpose. Use not recommended
PROVIDER LEVEL Practice, group, or facility:** Can compare: (i) practice sites; (ii) medical or other professional groups; or (iii) integrated or other delivery networks Intended use: Is measure intended to support meaningful comparisons at this level? (Yes/No) Data Sources: Are data sources available to support reporting at this level? Sample Size: What is the typical sample size available for each unit at this level? What proportion of units at this level of aggregation can achieve an acceptable minimum sample size?
no no Not specified for this purpose. Use not recommended

In Use: Have measure results been reported at no
this level previously? Reliability & Validity: Is there published evidence about the reliability and validity of the
no measure when reported at this level of aggregation? Unintended consequences: What are the potential unintended consequences of reporting at this level of aggregation?
Not specified for this purpose. Use not recommended
Section X. Understandability CHIPRA states that the core set should allow purchasers, families, and health care providers to understand the quality of care for children. Please describe the usefulness of this measure toward achieving this goal. Describe efforts to assess the understandability of this measure (e.g., focus group testing with stakeholders). The HROB measures describe the percent of high risk deliveries that occur in hospitals with the appropriate structural facilities. It is straight forward and intuitive as this represents a desirable clinical practice. Variations at the population level demonstrate differences in the availability of these services for women with high risk pregnancies and deliveries. These measures are intended for use at the population level and not to assess the quality of care or any individual pregnancy. We have not tested combining in these measures into an index as a 0-4 measure but could imagine some states or other entities wanting to do that. We will consider that for our future development work. Understandability is at the heart of CAPQuaM’s measure development process. Throughout development, CAPQuaM brought together diverse stakeholders – clinicians, scientists, payers, purchasers, consumer organizations, and others – to ensure their iterative engagement in advancing quality measures that are understandable, salient and actionable. CAPQuaM employed a 360° method, designed to involve key stakeholders in meaningful ways. Our development process for this measure cultivated formal input from: • Medical literature (both peer reviewed and gray, including state websites) • Relevant clinicians • Organizational stakeholders (our consortium partners, as well as advisory board members, see
below)
• Multi-disciplinary, geographically diverse expert panel including clinicians and academicians; and, CAPQuaM’s scientific team.
Clinical criteria, including consideration of inclusion and exclusion criteria, were developed using a modified version of the RAND/UCLA modified Delphi Panels. CAPQuaM sought recommendations from major clinical societies and other stakeholders to identify academic and clinician expert panel participants with a variety of areas of backgrounds, clinical and regional settings, and expertise. The product of this process was participation by a broad group of experts in the development of clinically detailed scenarios leading to the measures. CAPQuaM integrated perspectives from a national consortium, Steering Committee, and Senior Advisory Board at each step of the process, in addition to a continuing collaboration with AHRQ. Our team far exceeded the required minimums for expertise outside of the mainstream medical system, ensuring understandability at various levels, and by a variety of audiences. Alpha testing was performed to assess feasibility, mechanisms of data collection and operational aspects of collecting and analyzing data for the measure. Beta testing was performed by the NY State Office of Health Insurance Programs (Medicaid) in close collaboration with the CAPQuaM team, as well as by our team using MAX data from 16 states. The route to measure specification included development of relevant scenarios and issues for formal processing by our expert panel who participated in a two round RAND/UCLA modified Delphi panel that culminated in a two-day long in person meeting hosted at the Joint Commission and moderated by a pediatrician and an obstetrician-gynecologist. The output from that panel meeting was summarized in the form of a boundary guideline that was then used to guide the measure specification and prioritization.
Section XI. Health Information Technology Please respond to the following questions in terms of any health information technology (health IT) that has been or could be incorporated into the measure calculation. XI.A. Health IT Enhancement Please describe how health IT may enhance the use of this measure. As health information systems advance, perhaps the administrative data at the heart of this measure could migrate from billing and management systems to the EHR. We are not yet there. XI.B. Health IT Testing

Has the measure been tested as part of an electronic health record (EHR) or other health IT system? no If so, in what health IT system was it tested and what were the results of testing? Not at present. XI.C. Health IT Workflow Please describe how the information needed to calculate the measure may be captured as part of routine clinical or administrative workflow. Other than perhaps the race/ethnicity data the clinical data are a part of routine administrative data systems. The migration of diagnosis data from the EMR directly to administrative systems conceivably could improve the accuracy of the data in the future, although that is not clear. Routine surveys of hospitals regarding key structural attributes could be a part of state health program or state health department administrative or certification activities and those results could be maintained in a data base that was made available for analysis. XI.D. Health IT Standards Are the data elements in this measure supported explicitly by the Office of the National Coordinator for Health IT Standards and Certification criteria (see http://healthit.hhs.gov/portal/server.pt/community/healthit_hhs_gov__standards_ifr/1195)? no If yes, please describe. XI.E. Health IT Calculation Please assess the likelihood that missing or ambiguous information will lead to calculation errors. N/A XI.F. Health IT Other Functions If the measure is implemented in an EHR or other health IT system, how might implementation of other health IT functions (e.g., computerized decision support systems in an EHR) enhance
performance characteristics on the measure? N/A Section XII. Limitations of the Measure Describe any limitations of the measure related to the attributes included in this CPCF (i.e., availability of measure specifications, importance of the measure, evidence for the focus of the measure, scientific soundness of the measure, identification of disparities, feasibility, levels of aggregation, understandability, health information technology). This measure is based upon self reported presence of a key structural aspect of hospital care. That is the current state of the art for broad structural measures, absent mechanisms like Accreditation Audits. As these data re not to be collected anonymously, as they are verifiable, as the health care facility has no specific incentive to deceive and as deception related to performance measurement could be considered fraud, we are confident that this is a mild limitation. The definition of high risk obstetrical care is based upon a careful, evidence driven consensus process that was highly engaged and guided by an extraordinary and multidisciplinary panel of national experts. The CAPQuaM team carefully and faithfully operationalized their conclusions and maintained dialogue as we did so. Still there were infinite combinations of qualifying criteria and we had to specify one. We are confident that the specifications are strong, the conditions meaningful, and the population at increased risk. But these were designed from the outset and explicitly discussed at the expert meeting to be population-based measures. They are intended for the measurement of performance cross populations, not for the assessment of the quality of an individual's care. The inevitable noise in the measures was designed to be dwarfed by the signal when applied to large numbers of pregnant women, but not for any given individual.
Section XIII. Summary Statement Provide a summary rationale for why the measure should be selected for use, taking into account a balance among desirable attributes and limitations ofthe measure. Highlight specific advantages that this measure has over alternative measures on the same topic that were considered by the measure developer or specific advantages that this measure has over existing measures. If there is any information about this measure that is important for the review process but has not been addressed above, include it here. This innovative set of measures addresses a complex and critical idea: How available are important high risk obstetrical (HROB) services to women who may need them? We set forth specifications to identify pregnancies that constitute high risk. We assess four critical sets of practices or services and pose the same question for each: what percent of high risk pregnancies are delivered in facilities that make each of these available 24 hours a day, 7 days a week? The practices are: coverage of the OB service by a physician capable of managing labor and delivery and performing an emergent c-section; dedicated coverage of the OB service by an
anesthesiologist qualified to provide OB anesthesia, transfusion services; and a Level 3 or higher NICU. These measures respond to assignment to CAPQuaM an AHRQ-CMS CHIPRA Center of Excellence in the Pediatric Quality Measurement Program. We have used a rigorous and systematic process that was highly engaged with clinicians, stakeholders, and experts to develop these measures. We began with the evidence base and the literature. Childbirth accounts for a plurality of hospital admissions for Medicaid programs; our data show that between one and two thirds of them across the country are high risk. Hospital costs for childbirth and neonatal care are large. High risk women are suffer increased rates of maternal or infant morbidity and mortality. Maternal deaths and near misses are often preventable through improved quality and safety of maternity care. The rapidly rising rate of cesarean sections and associated complications points out the need for OB staffing by physicians. High maternal hemorrhage rates point out the critical importance of transfusion and blood bank services. And the value of NICU care as well as better outcomes for inborn children are well established. These are important measures regarding quality and patient safety. Racial/ethnic disparities in practice are well documented -- these 4 availability measures address important gaps in quality and safety in and have the potential to narrow disparities in maternal and neonatal outcomes. These were designed to be population measures and we have tested them in that regard. As intended, our validation tests showed that more geographically isolated areas show less availability than areas with more dense medical services. We found the measures to be complementary and not duplicative. They were sensitive to differences in socioeconomic status, race, and urbanicity. We found they could be implemented in New York State Medicaid data, and in publicly available MAX data, although with some limitations in the latter since mothers and babies could not be linked. Nonetheless the measures performed well in both sets (although space limitations curtailed our presentation of the results). The health of children in the United States is fostered by healthy pregnancies and deliveries that produce healthy mothers and healthy babies. The availability of high risk obstetric services are critical for the health of pregnant women with high risk deliveries and ultimately for the health of their unborn infant. It is important to capture the extent to which women with risk factors for a complicated delivery are delivered at hospitals that provide sufficient care for safe monitoring of emergent cesarean sections, obstetrical anesthesia services, in-house blood banking/transfusion services, as well as a level 3 NICU. These four measures are particularly relevant to the Medicaid Programs, as many of the women insured by this program are at higher risk for maternal and infant mortality and morbidity.
Section XIV: Identifying Information for the Measure Submitter Complete information about the person submitting the material, including the following:

First Name: Lawrence Last Name: Kleinman Title: Director, Mount Sinai
CAPQuaM Organization: Collaboration for
Advancing Pediatric Quality Measures
Mailing Address: One Gustave L. Levy
Place Box 1077 City: New York State: New York Postal Code: 10029 Telephone: 2126599556 E-mail: [email protected] The CHIPRA Pediatric Quality Measures Program (PQMP) Candidate Measure Submission Form (CPCF) was approved by the Office of Management and Budget (OMB) in accordance with the Paperwork Reduction Act. The OMB Control Number is 0935-0205 and the Expiration Date is December 31, 2015. PUBLIC DISCLOSURE REQUIREMENTS Each submission must include a written statement agreeing that, should U.S. Department of Health and Human Services accept the measure for the 2014 and/or 2015 Improved Core Measure Sets, full measure specifications for the accepted measure will be subject to public disclosure (e.g., on the Agency for Healthcare Research and Quality [AHRQ] and/or Centers for Medicare & Medicaid Services [CMS] websites), except that potential measure users will not be permitted to use the measure for commercial use. In addition, AHRQ expects that measures and full measure specifications will be made reasonably available to all interested parties. "Full measure specifications" is defined as all information that any potential measure implementer will need to use and analyze the measure, including use and analysis within an electronic health record or other health information technology. As used herein, "commercial use" refers to any sale, license or distribution of a measure for commercial gain, or incorporation of a measure into any product or service that is sold, licensed or distributed for commercial gain, even if there is no actual charge for inclusion of the measure. This statement must be signed by an individual authorized to act for any holder of copyright on each submitted measure or instrument. The authority of the signatory to provide such authorization should be described in the letter.

The signed written statement was submitted