Embed Size (px)
Citation preview

Section E – Monitoring Attachments
For
insp
ectio
n pur
pose
s only
.
Conse
nt of
copy
right
owne
r req
uired
for a
ny ot
her u
se.
EPA Export 14-10-2013:23:47:18

Contents: E.2.1 General
E.2.2 Purcellsinch WWTP Testing Procedures
E.2.3 Detailed Lab Procedures
Suspended Solids
Chemical Oxygen Demand (COD)
Nitrates
Nitrites
Total Nitrogen
Total Phosphorus
Nitrogen Ammonia
E.2.4 Calibration Certificates
E.2.5 Purcellsinch WWTP External Testing
& Accreditation Certificates
E.4. Purcellsinch WWTP Test Results 01-11-2006 to 31-10-2007
Summary - Purcellsinch WWTP Test Results
Tests Results From Purcelsinch WWTP:
For
insp
ectio
n pur
pose
s only
.
Conse
nt of
copy
right
owne
r req
uired
for a
ny ot
her u
se.
EPA Export 14-10-2013:23:47:18

Section E.2. Page 1 of 3
E.2. Monitoring and Sampling Points
E.2.1 General
The laboratory located in Purcellsinch WWTP facilitates numerous tests associated the
Waste Water Treatment Plant. Please refer to Drawing B.2.2 and Attachment B.2 which
identifies the onsite sampling points and the tests carried out at each point.
Each sample point is located with safe access and appropriate barriers and safety railings
to ensure safe sampling. The sample points denoted as grab samples are taken with a
telescopic rod with a beaker fixed to the end. These grab samples are taken in the same
locations each time in order to ensure consistency of the samples. The points denoted as
composite samples are 24 hour composite samples. Purcellsinch WWTP has four
composite samplers onsite. These are located at sample points 3, 4, 7 & 13. The samplers
are Endress & Hauser ASP Station 2000. These samplers are stainless steel refrigerated
units that are programmable to suit your requirements. With the exception of the storm
water sampler (no. 13) each sampler is programmed to take 50ml of sample every 15
minutes. Both on the inlet and outlet there is a continuous flow so sampling by time
works efficiently. The storm water sampler is set up with an ultra-sonic system. Once a
flow passes this point it starts the sampler
which then will take a sample every 15 minutes. Once a month all the samplers are
thoroughly cleaned and the measurement calibrated.
Sampling upstream and downstream of the discharge pipe is undertaken should our
discharge not meet requirements. This is a drift sample taken using a bucket on a length
of rope. The bucket is fired to the centre of the river and sample brought to the bank. The
sample points for river checks are upstream 25m and downstream 120m of the discharge
pipe. This sampling is undertaken by two members of staff, one member to take the
sample and the other staff member to assist and to be present should anything happen
whilst sampling. Life jackets are worn by both staff members as well as normal PPE
during this sampling.
For
insp
ectio
n pur
pose
s only
.
Conse
nt of
copy
right
owne
r req
uired
for a
ny ot
her u
se.
EPA Export 14-10-2013:23:47:18

Section E.2. Page 2 of 3
All tests are carried out in accordance to the procedures outlined in E.2.2. and full lab
procedures in E.2.3 attached at the back of this document. The tests are carried out by lab
staff that are of a technical background and have been inducted to the Purcellsinch
WWTP lab practices and safety procedures associated with working/sampling in the lab
and onsite. In order to ensure test accuracy each month the tests are carried out using
standard solutions. Standard solutions are also used to test the accuracy of the TOC
analysers. The lab at Purcellsinch WWTP is a member of the EPA intercalibration
programme with the last three years.
Documentation of all data is stored both electronically and hard copy. The data is entered
on a daily basis in the same format. On a daily basis the data is printed, checked and filed
on site. If any parameter is outside specifications this is brought to the immediate
attention of the Plant Manager. Only sampling associated with Purcellsinch WWTP is
recorded in this file. All analysis from other sources are documented under separate
headings.
E.2.2 Purcellsinch WWTP Testing Procedures
The following are the main tests carried out in Purcellsinch WWTP:
1. Suspended Solids
Suspended Solids by Gravimetric Analysis This method is based on 2540D
Suspended Solids @103-105C, Standard Methods for the Examination of Water and
Wastewater, 19th Edition, 1995.
2. Chemical Oxygen Demand (COD)
The lab operates with the HACH DR 2500 Spectrophotometer. For this test we use
Method 8000 Reactor Digestion Method.
3. Dissolved Oxygen (DO)
The lab uses the hand held Hach HQ40d DO & pH probe.
4. pH
The lab uses the hand held Hach HQ40d DO & pH probe.
For
insp
ectio
n pur
pose
s only
.
Conse
nt of
copy
right
owne
r req
uired
for a
ny ot
her u
se.
EPA Export 14-10-2013:23:47:19

Section E.2. Page 3 of 3
5. Nitrates
The lab operates with the HACH DR 2500 Spectrophotometer. For this test we use
Method 10020 Chromotropic Acid Method Test ‘N Tube Vials.
6. Nitrites
The lab operates with the HACH DR 2500 Spectrophotometer. For this test we use
Method 10019 Diazotization Method Test ‘N Tube Vials.
7. Total Nitrogen
The lab operates with the HACH DR 2500 Spectrophotometer. For this test we use
Method 10071 Persulfate Digestion Method Test ‘N Tube Vials.
8. Total Phosphorus
The lab operates with the HACH DR 2500 Spectrophotometer. For this test we use
Method 8190, PhosVer 3 Method Acid Persulfate Digestion with Test ‘N Tube Vials.
9. Nitrogen Ammonia
The lab operates with the HACH DR 2500 Spectrophotometer. For this test we use
Method 10031, Salicylate Method with Test ‘N Tube Vials.
10. Online TOC, TIC & TN
The TOC/TIC/TN is measured with an online TOC analyser. There are two of these
onsite (sample point No. 8 and sample point No. 14). These analysers were produced
by Pollution Control Systems, Rafeen House, Ringaskidddy, Co. Cork. The company
also carries out any maintenance and 6 monthly calibrations and servicing. The inlet
lines and reagent levels are cleaned/maintained daily by Kilkenny County Council.
11. Online SS monitors
These units are The SOLITAX sc Suspended Solids monitor with Hach Lange SC100
controller and monitor suspended solids online (sample point No’s 15 & 16).
For
insp
ectio
n pur
pose
s only
.
Conse
nt of
copy
right
owne
r req
uired
for a
ny ot
her u
se.
EPA Export 14-10-2013:23:47:19
E.2.3 Lab Procedures
Suspended Solids
Chemical Oxygen Demand (COD)
Nitrates
Nitrites
Total Nitrogen
Total Phosphorus
Nitrogen Ammonia
For
insp
ectio
n pur
pose
s only
.
Conse
nt of
copy
right
owne
r req
uired
for a
ny ot
her u
se.
EPA Export 14-10-2013:23:47:19

Suspended Solids 1 of 5
Suspended Solids by Gravimetric Analysis 1.0 SCOPE AND APPLICATION 1.1 This method covers the determination of suspended solids in drinking water , ground water,surface water,and waste water. 1.2 The application range is 1-1000mg/l. 1.3 This method is based on 2540D Suspended Soilds @103-105C, Standard Methods for the Examination of Water and Wastewater, 19th Edition, 1995 2.0 SUMMARY OF METHOD 2.1 A 100ml sample is filtered through a pre weighed Whatman GF/C filter paper. The filter paper is dried in an oven at 103-105C. Suspended solids is calculated based on the weight increase of the filter and the volume of sample filtered. 3.0 INTERFERENCES 3.1 A high content of dissolved solids will interfere with the detection of suspended solids. 3.2 Solids not consistent with the actual sample or not consistent with the sampling site will have a positive influence on the amount of suspended solids. 3.3 Dirty glassware, filter papers, filter holding items, ovens, balances etc will have a positive influence on the amount of suspended solids contained in the sample. 3.4 Inadequate mixing of the sample before filtration will influence results. 3.5 Inadequate rinsings of the glassware when adding sample to the filtering apparatus will have a positive influence on the amount of suspended solids. 4.0 SAFETY 4.1 The toxicity or carcinogenicity of the reagents involved in this analysis have not been fully established. Each chemical should be regarded as a potential health hazard and exposure should be as low as reasonably possible. Cautions are included for known extremely hazardous materials or procedures. 4.2 Consult the reference file of Material Safety Data Sheets (MSDS) for all relevant materials. 4.3 Due care and adherence to the specifications of the manufacturer must be upheld when using the filtering apparatus. 4.4 Standard laboratory safety practices must be employed when using any chemical or instrument involved in the analysis of suspended solids.
For
insp
ectio
n pur
pose
s only
.
Conse
nt of
copy
right
owne
r req
uired
for a
ny ot
her u
se.
EPA Export 14-10-2013:23:47:19

Suspended Solids 2 of 5
5.0 APPARATUS AND MATERIALS 5.1 Balance -- Analytical, capable of accurately weighing to the nearest 0.0001g. 5.2 Glassware: 5.2.1 Volumetric Flasks (1000mL, 100mL, 20mL) 5.2.2 Adjustable 1.0mL and 0.1mL pipettes calibrated per GLP07: 5.2.3 All necessary volumetric pipettes required to create the standards. 5.2.4 Other standard laboratory glassware as required. 5.3 AluminiumWeighing Trays (Used to weigh reagents). 5.4 Filtering apparatus: 5.4.1 Vacuum Pump 5.4.2 Vacuum Flask, 500ml capacity. 5.4.3 Whatman, GF/C Filter papers, 4.7cm 5.5 Stirplate capable of stirring a 1L volumetric flask. 5.6 100mL and 50mL graduated cylinders. 6.0 REAGENTS Note: In the general scope of works for Kilkenny County Council Sanitary Services, drinking water
and Waste Water testing does not require any reagents apart from deionised water. 6.1 Reagent/Dilution water: Deionised water, free from analyte of interest.
For
insp
ectio
n pur
pose
s only
.
Conse
nt of
copy
right
owne
r req
uired
for a
ny ot
her u
se.
EPA Export 14-10-2013:23:47:19

Suspended Solids 3 of 5
7.0 CALIBRATION 7.1 As the method of analysis is gravimetric, no calibration curve can be created. 7.2 Ongoing accuracy is by analysis of a standard at 500mg/L. Acceptable limits are defined by the Precision and Accuracy study. 8.0 QUALITY CONTROL 8.1 Kilkenny Main Drainage Laboratory is part of the EPA intercalibration programme. 8.2 Control Charts and QC Check Samples (QCS) 8.2.1 The 500mg/L QCS is run at the start of each batch , after every ten samples and at the end of each batch 8.2.3 QCS results are recorded using the Quickie Software. 8.2.4 The Warning Limits (Mean +/- 2 Std Dev).Refer to QP18 where the WL are exceeded.Actions taken must be noted in the Quickie Software. 8.2.5 The Control Limits (Mean + 3 Std Dev). Refer to QP18 where the CL are exceeded.Actions taken must be noted in the Quickie Software. 8.2.6 Refer to QP18 where there is an eight consecutive point trend in a positive or negative direction or where there is an eight consecutive point trend above or below the mean value.Actions taken must be noted in the Quickie Software. 8.3 The analyst must analyse a sample duplicate for every set of ten samples that are to be analysed.The difference between the two results must be <10%,other wise an NCT report should be raised to decide on batch disposition. 8.4 Training 8.3.1 Each analyst must demonstrate the ability to achieve acceptable results with this method. The method must be demonstrated on 3 occassions by an experienced analyst,the trainee will then perform analysis on 5 batches of QC's fully supervised by the trainer.The QC sample must be maintained within control limits at all times in order for the results to be deemed acceptable for the analyst. The trainee will then perform analysis of 3 batches of samples supervised by the trainer .The trainer will then decide if the analyst is fully trained. 8.5 Proficiency Schemes 8.2 Kilkenny Main Drainage Laboratory is part of the EPA intercalibration programme.
For
insp
ectio
n pur
pose
s only
.
Conse
nt of
copy
right
owne
r req
uired
for a
ny ot
her u
se.
EPA Export 14-10-2013:23:47:19
Suspended Solids 4 of 5
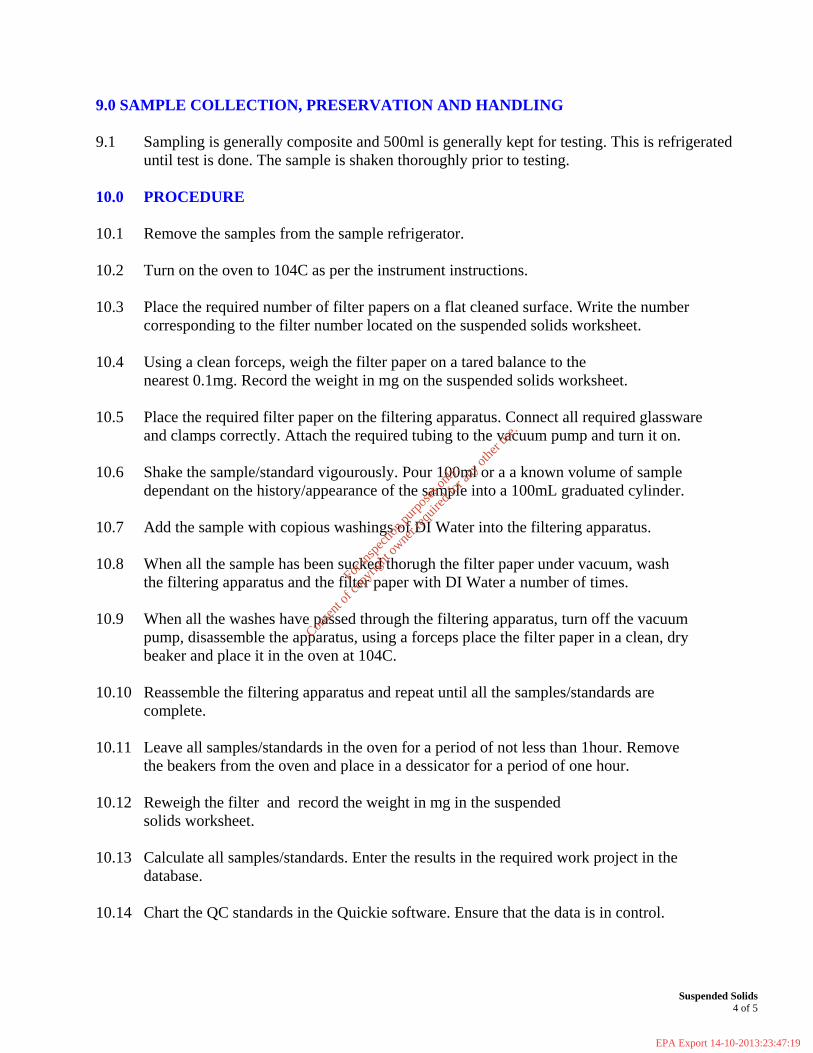
9.0 SAMPLE COLLECTION, PRESERVATION AND HANDLING 9.1 Sampling is generally composite and 500ml is generally kept for testing. This is refrigerated
until test is done. The sample is shaken thoroughly prior to testing. 10.0 PROCEDURE 10.1 Remove the samples from the sample refrigerator. 10.2 Turn on the oven to 104C as per the instrument instructions. 10.3 Place the required number of filter papers on a flat cleaned surface. Write the number corresponding to the filter number located on the suspended solids worksheet. 10.4 Using a clean forceps, weigh the filter paper on a tared balance to the nearest 0.1mg. Record the weight in mg on the suspended solids worksheet. 10.5 Place the required filter paper on the filtering apparatus. Connect all required glassware and clamps correctly. Attach the required tubing to the vacuum pump and turn it on. 10.6 Shake the sample/standard vigourously. Pour 100ml or a a known volume of sample dependant on the history/appearance of the sample into a 100mL graduated cylinder. 10.7 Add the sample with copious washings of DI Water into the filtering apparatus. 10.8 When all the sample has been sucked thorugh the filter paper under vacuum, wash the filtering apparatus and the filter paper with DI Water a number of times. 10.9 When all the washes have passed through the filtering apparatus, turn off the vacuum pump, disassemble the apparatus, using a forceps place the filter paper in a clean, dry beaker and place it in the oven at 104C. 10.10 Reassemble the filtering apparatus and repeat until all the samples/standards are complete. 10.11 Leave all samples/standards in the oven for a period of not less than 1hour. Remove the beakers from the oven and place in a dessicator for a period of one hour. 10.12 Reweigh the filter and record the weight in mg in the suspended solids worksheet. 10.13 Calculate all samples/standards. Enter the results in the required work project in the database. 10.14 Chart the QC standards in the Quickie software. Ensure that the data is in control.
For
insp
ectio
n pur
pose
s only
.
Conse
nt of
copy
right
owne
r req
uired
for a
ny ot
her u
se.
EPA Export 14-10-2013:23:47:19

Suspended Solids 5 of 5
11.0 CALCULATIONS 11.1 Total Suspended Solids ( mg/L)= (Final Weight 2 (mg)-Initial Weight (mg)) X 1000 Sample Volume Taken (mls) 12.0 METHOD PERFORMANCE
Method Performance Evaluation was performed according to QP14 Test Method Performance Evaluation & Uncertainty and all calculations were performed using Wrc AQC Analysis software
12.1 Method Detection Limit (MDL=1mg/l ): 11 batches of a wastewater in duplicate. 12.2 Precision and Accuracy: 11 batches of a waste water and low (50),medium (500), high (1000mg/l) QCS in duplicate . 12.4 Uncertainty of Measurement is calculated as follows: (U (ug/L) = Result * K*RSD). RSD= (Std Dev)/Mean. 12.5 The Control and Warning Limits are defined by the NS30 validation run. The limits are kept in control at all times and are plotted using the Quickie software.
For
insp
ectio
n pur
pose
s only
.
Conse
nt of
copy
right
owne
r req
uired
for a
ny ot
her u
se.
EPA Export 14-10-2013:23:47:19

DR/2500
Oxygen Demand, ChemicalOxygenCOD_None_Mid_RCD_Eng_Ody.fm Page 1 of 8
• Some of the chemicals and apparatus used in this procedure may be hazardous to the health and safety of the user if inappropriately handled or accidentally misused. Please read all warnings and refer to Waste Management and Safety on page 55 of this manual.
• Wear appropriate eye protection and clothing for adequate user protection. If contact occurs, flush the affected area with running water. Follow instructions carefully.
• Place a safety shield in front of the COD reactor to prevent injury if splattering occurs.
• The reagent mixture is light-sensitive. Keep unused vials in the opaque shipping container.
• Spilled reagent will affect test accuracy and is hazardous to skin and other materials. Wash spills with running water.
• Run one blank with each set of samples. Run all tests (the samples and the blank) with the same lot of vials. The lot number appears on the container label. See Blanks for Colorimetric Determination on page 4.
• For greater accuracy, analyze a minimum of three replicates and average the results.
Oxygen Demand, Chemical�Method 8000 Reactor Digestion Method*
* Jirka, A.M.; Carter, M.J., Analytical Chemistry, 1975, 47(8), 1397
(0.7 to 40.0, 3 to 150, 20 to 1500, and 200 to 15,000mg/L COD)
Scope and Application: For water, wastewater, and seawater; digestion is required; 3–150 mg/L and 20– 1500 mg/L COD ranges are USEPA approved for wastewater analyses**; 200–15,000 mg/L COD range, and 0.7 to 40.0 mg/L COD range are not USEPA approved.
** Federal Register, April 21, 1980, 45(78), 26811-26812
1. Homogenize 100 mL of sample for 30 seconds in a blender. (For samples containing large amounts of solids, increase the homogenization time.)
Note: If the sample does not contain suspended solids, omit step 1 and step 2.
2. For the 200–15,000 mg/L range or to improve accuracy and reproducibility of the other ranges, pour the homogenized sample into a 250-mL beaker and gently stir with a magnetic stir plate.
3. Turn on the COD Reactor. Preheat to 150 °C. Place the safety shield in front of the reactor.
4. Remove the caps from two COD Digestion Reagent Vials. (Be sure to use vials for the appropriate range.)
Tips and Techniques
Digestion Procedure Method 8000
For
insp
ectio
n pur
pose
s only
.
Conse
nt of
copy
right
owne
r req
uired
for a
ny ot
her u
se.
EPA Export 14-10-2013:23:47:19

Oxygen Demand, Chemical
Oxygen Demand, ChemicalPage 2 of 8 OxygenCOD_None_Mid_RCD_Eng_Ody.fm
5. Hold one vial at a 45-degree angle. Use a clean volumetric pipet to add 2.00 mL of sample to the vial. This is the prepared sample.
Note: Use a TenSette pipet to add 0.20 mL for the 200–15,000 mg/L range.
6. Hold a second vial at a 45-degree angle. Use a clean volumetric pipet to add 2.00 mL of deionized water to the vial. This is the blank.
Note: Use a TenSette pipet to add 0.20 mL for the 200–15,000 mg/L range.
7. Cap the vials tightly. Rinse them with deionized water and wipe with a clean paper towel.
8. Hold the vials by the cap over a sink. Invert gently several times to mix. Place the vials in the preheated COD Reactor.
The sample vials will become very hot during mixing.
9. Heat the vials for two hours.
10. Turn the reactor off.
Wait about 20 minutes for the vials to cool to 120 °C or less.
11. Invert each vial several times while still warm. Place the vials into a rack and cool to room temperature.
12. Proceed to the Colorimetric Determination Method 8000 on page 3.
HRS MIN SECHRS MIN SEC HRS MIN SECHRS MIN SEC
Go To Next Page
For
insp
ectio
n pur
pose
s only
.
Conse
nt of
copy
right
owne
r req
uired
for a
ny ot
her u
se.
EPA Export 14-10-2013:23:47:19

Oxygen Demand, Chemical
Oxygen Demand, ChemicalOxygenCOD_None_Mid_RCD_Eng_Ody.fm Page 3 of 8
1. Touch
Hach Programs.
Select program
431 COD ULR (Ultra-Low Range)
or
430 COD LR (Low Range)
or
435 COD HR (High Range/High Range Plus).
Touch Start.
2. Clean the outside of the vials with a damp towel followed by a dry one to remove fingerprints or other marks.
3. Place the blank into the cell holder.
4. Touch Zero.
The display will show:
0 mg/L COD
5. When the timer beeps, place the sample vial into thecell holder.
Results will appear in mg/L COD.
6. If using High Range Plus COD Digestion Reagent Vials, multiply the result by 10.
Note: For most accurate results with samples near 1,500 or 15,000 mg/L COD, repeat the analysis with a diluted sample.
Colorimetric Determination Method 8000
Hach Programs Zero
For
insp
ectio
n pur
pose
s only
.
Conse
nt of
copy
right
owne
r req
uired
for a
ny ot
her u
se.
EPA Export 14-10-2013:23:47:19

Oxygen Demand, Chemical
Oxygen Demand, ChemicalPage 4 of 8 OxygenCOD_None_Mid_RCD_Eng_Ody.fm
Blanks for Colorimetric DeterminationThe blank may be used repeatedly for measurements using the same lot of vials. Store it in the dark. Monitor decomposition by measuring the absorbance at the appropriate wavelength (356, 420, or 620 nm). Zero the instrument in the absorbance mode, using a vial containing 5 mL of deionized water and measure the absorbance of the blank. Record the value. Prepare a new blank when the absorbance has changed by about 0.01 absorbance units.
InterferencesChloride is the primary interference when determining COD concentration. Each COD vial contains mercuric sulfate that will eliminate chloride interference up to the level specified in column 1 in the table below. Samples with higher chloride concentrations should be diluted. Dilute the sample enough to reduce the chloride concentration to the level given in column 3.
If sample dilution will cause the COD concentration to be too low for accurate determination, add 0.50 g of mercuric sulfate (HgSO4) (Cat. No. 1915-20) to each COD vial before the sample is added. The additional mercuric sulfate will raise the maximum chloride concentration allowable to the level given in column 4.
Sampling and StorageCollect samples in glass bottles. Use plastic bottles only if they are known to be free of organic contamination. Test biologically active samples as soon as possible. Homogenize samples containing solids to assure representative samples. Samples treated with sulfuric acid (Cat. No. 979-49) to a pH of less than 2 (about 2 mL per liter) and refrigerated at 4 °C can be stored up to 28 days. Correct results for volume additions; see Section 3.1.3 Correcting for Volume Additions on page 31 for more information.
Vial Type UsedMaximum Cl– concentration
in sample (mg/L)
Suggested Cl– concentration of diluted
samples (mg/L)
Maximum Cl– concentration in sample when 0.50 HgSO4
added
Ultra Low Range (0.7–40 mg/L)
2000 1000 N/A
Low Range(3–150 mg/L)
2000 1000 8000
High Range(20–1500 mg/L)
2000 1000 4000
High Range Plus(200–15,000 mg/L)
20,000 10,000 40,000
For
insp
ectio
n pur
pose
s only
.
Conse
nt of
copy
right
owne
r req
uired
for a
ny ot
her u
se.
EPA Export 14-10-2013:23:47:19

Oxygen Demand, Chemical
Oxygen Demand, ChemicalOxygenCOD_None_Mid_RCD_Eng_Ody.fm Page 5 of 8
Accuracy Check
Standard Solution Method
1. Check the accuracy of the 0.7 to 40.0 mg/L range with a 30 mg/L COD standard solution. Using class A glassware, prepare a 1000 mg/L solution by diluting 850 mg dried (120 °C, overnight) potassium acid phthalate (KHP) in 1000 mL of organic–free deionized water. Prepare a 30 mg/L dilution by diluting 3.00 mL of this solution into a 100.0 mL volumetric flask. Dilute to volume with deionized water, stopper, and invert 10 times to mix. Use 2 mL as the sample volume. The result should be 30 mg/L COD.
• To adjust the calibration curve using the reading obtained with the 30 mg/L COD standard solution, touch Options on the current program menu. Touch Standard Adjust.
• Touch On. Touch Adjust to accept the displayed concentration. If an alternate concentration is used, touch the number in the box to enter the actual concentration, then touch OK. Touch Adjust.
2. Check the accuracy of the 3 to 150 mg/L range with a 100 mg/L standard. Prepare by dissolving 85 mg of dried (120 °C, overnight) potassium acid phthalate (KHP) in 1 liter of deionized water. Use 2 mL as the sample volume. The result should be 100 mg/L COD. Or dilute 10 mL of 1000-mg/L COD Standard Solution to 100 mL to produce a 100-mg/L standard.
• To adjust the calibration curve using the reading obtained with the 100 mg/L COD standard solution, touch Options on the current program menu. Touch Standard Adjust.
• Touch On. Touch Adjust to accept the displayed concentration. If an alternate concentration is used, touch the number in the box to enter the actual concentration, then touch OK. Touch Adjust.
3. Check the accuracy of the 20 to 1,500 mg/L range by using either a 300 mg/L or 1000 mg/L COD Standard Solution. Use 2 mL of one of these solutions as the sample volume; the expected result will be 300 or 1000 mg/L COD respectively. Or, prepare a 500 mg/L standard by dissolving 425 mg of dried (120 °C, overnight) KHP. Dilute to 1 liter with deionized water.
• To adjust the calibration curve using the reading obtained with the 300 mg/L or 1000 mg/L COD standard solution, touch Options on the current program menu. Touch Standard Adjust.
• Touch On. Touch Adjust to accept the displayed concentration. If an alternate concentration is used, touch the number in the box to enter the actual concentration, then touch OK. Touch Adjust.
4. Check the accuracy of the 200 to 15,000 mg/L range by using a 10,000 mg/L COD standard solution. Prepare the 10,000 mg/L solution by dissolving 8.500 g of dried (120 °C, overnight) KHP in 1 liter of deionized water. Use 0.2 mL of this solution as the sample volume; the expected result will be 10,000 mg/L COD.
• To adjust the calibration curve using the reading obtained with the 10,000 mg/L COD standard solution, touch Options on the current program menu. Touch Standard Adjust.
• Touch On. Touch Adjust to accept the displayed concentration. If an alternate concentration is used, touch the number in the box to enter the actual concentration, then touch OK. Touch Adjust.
See Section 3.2.3 Adjusting the Standard Curve on page 38 for more information.
For
insp
ectio
n pur
pose
s only
.
Conse
nt of
copy
right
owne
r req
uired
for a
ny ot
her u
se.
EPA Export 14-10-2013:23:47:19

Oxygen Demand, Chemical
Oxygen Demand, ChemicalPage 6 of 8 OxygenCOD_None_Mid_RCD_Eng_Ody.fm
Method Performance
PrecisionStandard:30 mg/L COD (Utra Low Range), 80 mg/L COD (Low Range), 800 mg/L COD (High Range), and 10,000mg/L COD (High Range Plus)
See Section 3.4.3 Precision on page 42 for more information, or if the standard concentration did not fall within the specified range.
Sensitivity
See Section 3.4.5 Sensitivity on page 43 for more information.
Alternate ReagentsMercury-free COD2 Reagents can provide a mercury-free testing option for non-reporting purposes. For process control applications, COD2 Reagents will eliminate mercury waste and save on disposal costs. These reagents are fully compatible with test procedures and calibration curves programmed into the DR/2500 spectrophotometer. Determine chloride and ammonia for accurate results.
Note: These reagents are not approved for USEPA reporting purposes. Request a copy of the COD Reagent Vial Information Brochure, Lit. No. 1356, for more information about specific applications.
Summary of MethodThe mg/L COD results are defined as the mg of O2 consumed per liter of sample under conditions of this procedure. In this procedure, the sample is heated for two hours with a strong oxidizing agent, potassium dichromate. Oxidizable organic compounds react, reducing the dichromate ion (Cr2O7
2–) to green chromic ion (Cr3+). When the 0.7–40.0 or the 3–150 mg/L colorimetric or titrimetric method is used, the amount of Cr6+ remaining is determined. When the 20–1,500 mg/L or 200–15,000 mg/L colorimetric method is used, the amount of Cr3+ produced is determined. The COD reagent also contains silver and mercury ions. Silver is a catalyst, and mercury is used to complex chloride interferences. Test results for the 0.7 to 40.0 mg/L range are measured at 365nm. Test results for the 3 to 150 mg/L range are measured at 420 nm. Test results for the 20 to 1,500 and the 2000 to 15,000 mg/L COD range are measured at 620 nm.
Program Range (mg/L) 95% Confidence Limits of Distribution
430 3–150 77.6–82.4 mg/L COD
431 0.7–40.0 29.0–31.0 mg/L COD
435 20–1500 778–822 mg/L COD
435 200–15000 9778–10,222 mg/L COD
Program Portion of Curve ∆Abs ∆Concentration
430 Entire range 0.010 3 mg/L COD
431 Entire range 0.010 0.7 mg/L COD
435 Entire range 0.010 20 mg/L COD
For
insp
ectio
n pur
pose
s only
.
Conse
nt of
copy
right
owne
r req
uired
for a
ny ot
her u
se.
EPA Export 14-10-2013:23:47:19
Oxygen Demand, Chemical
Oxygen Demand, ChemicalOxygenCOD_None_Mid_RCD_Eng_Ody.fm Page 7 of 8
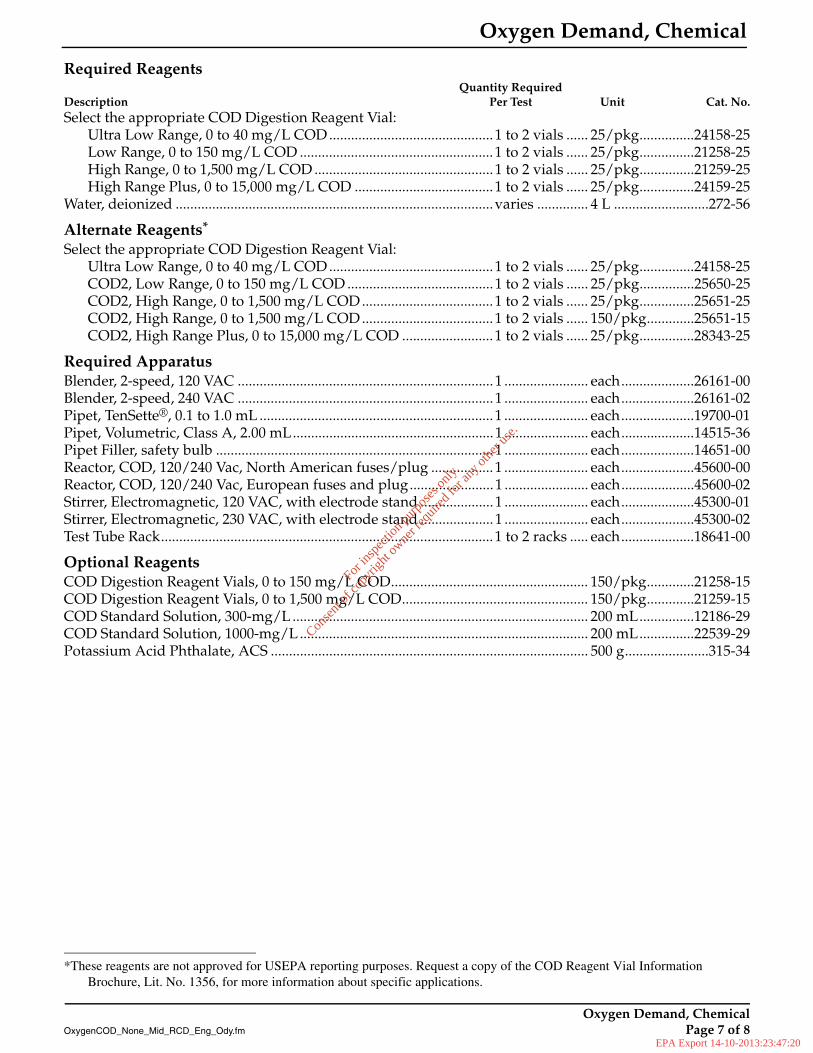
Required ReagentsQuantity Required
Description Per Test Unit Cat. No.Select the appropriate COD Digestion Reagent Vial:
Ultra Low Range, 0 to 40 mg/L COD .............................................1 to 2 vials ...... 25/pkg...............24158-25Low Range, 0 to 150 mg/L COD .....................................................1 to 2 vials ...... 25/pkg...............21258-25High Range, 0 to 1,500 mg/L COD .................................................1 to 2 vials ...... 25/pkg...............21259-25High Range Plus, 0 to 15,000 mg/L COD ......................................1 to 2 vials ...... 25/pkg...............24159-25
Water, deionized .......................................................................................varies .............. 4 L ..........................272-56
Alternate Reagents*
Select the appropriate COD Digestion Reagent Vial:Ultra Low Range, 0 to 40 mg/L COD .............................................1 to 2 vials ...... 25/pkg...............24158-25COD2, Low Range, 0 to 150 mg/L COD ........................................1 to 2 vials ...... 25/pkg...............25650-25COD2, High Range, 0 to 1,500 mg/L COD ....................................1 to 2 vials ...... 25/pkg...............25651-25COD2, High Range, 0 to 1,500 mg/L COD ....................................1 to 2 vials ...... 150/pkg.............25651-15COD2, High Range Plus, 0 to 15,000 mg/L COD .........................1 to 2 vials ...... 25/pkg...............28343-25
Required ApparatusBlender, 2-speed, 120 VAC ......................................................................1 ....................... each....................26161-00Blender, 2-speed, 240 VAC ......................................................................1 ....................... each....................26161-02Pipet, TenSette®, 0.1 to 1.0 mL ................................................................1 ....................... each....................19700-01Pipet, Volumetric, Class A, 2.00 mL.......................................................1 ....................... each....................14515-36Pipet Filler, safety bulb ............................................................................1 ....................... each....................14651-00Reactor, COD, 120/240 Vac, North American fuses/plug .................1 ....................... each....................45600-00Reactor, COD, 120/240 Vac, European fuses and plug.......................1 ....................... each....................45600-02Stirrer, Electromagnetic, 120 VAC, with electrode stand ....................1 ....................... each....................45300-01Stirrer, Electromagnetic, 230 VAC, with electrode stand ....................1 ....................... each....................45300-02Test Tube Rack...........................................................................................1 to 2 racks ..... each....................18641-00
Optional ReagentsCOD Digestion Reagent Vials, 0 to 150 mg/L COD...................................................... 150/pkg.............21258-15COD Digestion Reagent Vials, 0 to 1,500 mg/L COD................................................... 150/pkg.............21259-15COD Standard Solution, 300-mg/L ................................................................................. 200 mL...............12186-29COD Standard Solution, 1000-mg/L ............................................................................... 200 mL...............22539-29Potassium Acid Phthalate, ACS ....................................................................................... 500 g.......................315-34
*These reagents are not approved for USEPA reporting purposes. Request a copy of the COD Reagent Vial InformationBrochure, Lit. No. 1356, for more information about specific applications.
For
insp
ectio
n pur
pose
s only
.
Conse
nt of
copy
right
owne
r req
uired
for a
ny ot
her u
se.
EPA Export 14-10-2013:23:47:20

HACH COMPANYWORLD HEADQUARTERSTelephone: (970) 669-3050FAX: (970) 669-2932
FOR TECHNICAL ASSISTANCE, PRICE INFORMATION AND ORDERING:Call 800-227-4224
Contact the HACH office or distributor serving you.www.hach.com [email protected]
In the U.S.A. –Outside the U.S.A. –On the Worldwide Web – ; E-mail –
toll-free
© Hach Company, 2004. All rights reserved. Printed in the U.S.A. 12/04 4edPage 8 of 8 OxygenCOD_None_Mid_RCD_Eng_Ody.fm
For
insp
ectio
n pur
pose
s only
.
Conse
nt of
copy
right
owne
r req
uired
for a
ny ot
her u
se.
EPA Export 14-10-2013:23:47:20

DR/2500
NitrateNitrate_TNT_High_CHA_Eng_Ody.fm Page 1 of 4
• For more accurate results, determine a reagent blank value for each new lot of reagent. Follow the procedure using deionized water (nitrate-free) in place of the sample. Subtract the reagent blank value from the final results or perform a reagent blank adjust. See the DR/2500 instrument manual for more information on Running a Reagent Blank.
• This test is technique-sensitive. Invert the vials as described here to avoid low results: Hold the vial in a vertical position with the cap pointing up. Turn the vial upside-down. Wait for all of the solution to flow down to the cap. Pause. Return the vial to an upright position. Wait for all the solution to flow to the bottom of the vial. This process equals one inversion.
• Wipe the outside of sample cells before each insertion into the instrument cell holder. Use a damp towel followed by a dry one to remove fingerprints or other marks.
NitrateMethod 10020 Chromotropic Acid MethodTest ‘N Tube™ Vials HR (0.2 to 30.0 mg/L NO3
––N)Scope and Application: For water and wastewater
1. Touch
Hach Programs.
Select program
344 N, Nitrate HR TNT.
Touch Start.
2. Remove the cap from a NitraVer X Reagent A Test ‘N Tube vial and add 1.00 mL of sample (this is the blank).
3. Cap the tube and invert ten times to mix.
4. Wipe the blank and place it into the cell holder.
Tips and Techniques
Test ‘N Tube Method 10020
Hach Programs
For
insp
ectio
n pur
pose
s only
.
Conse
nt of
copy
right
owne
r req
uired
for a
ny ot
her u
se.
EPA Export 14-10-2013:23:47:20
Nitrate
NitratePage 2 of 4 Nitrate_TNT_High_CHA_Eng_Ody.fm
Interferences
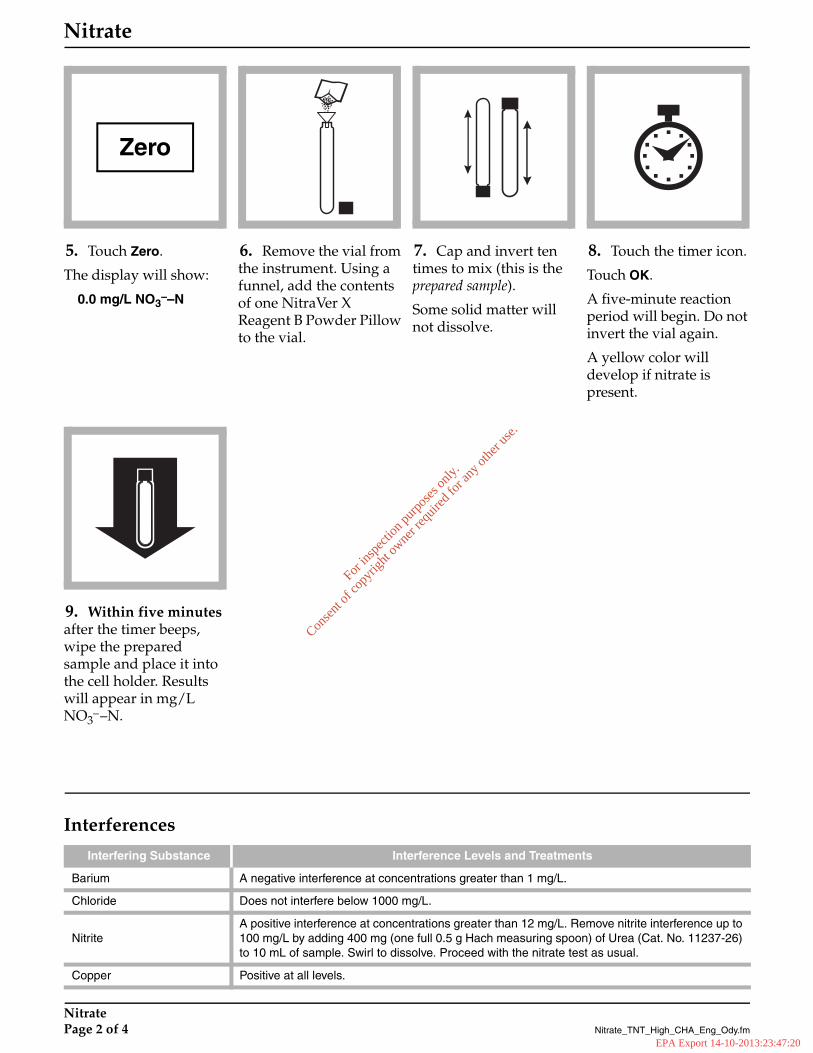
5. Touch Zero.
The display will show:
0.0 mg/L NO3––N
6. Remove the vial from the instrument. Using a funnel, add the contents of one NitraVer X Reagent B Powder Pillow to the vial.
7. Cap and invert ten times to mix (this is the prepared sample).
Some solid matter willnot dissolve.
8. Touch the timer icon.
Touch OK.
A five-minute reaction period will begin. Do not invert the vial again.
A yellow color will develop if nitrate is present.
9. Within five minutes after the timer beeps, wipe the prepared sample and place it into the cell holder. Results will appear in mg/L NO3
––N.
Interfering Substance Interference Levels and Treatments
Barium A negative interference at concentrations greater than 1 mg/L.
Chloride Does not interfere below 1000 mg/L.
NitriteA positive interference at concentrations greater than 12 mg/L. Remove nitrite interference up to 100 mg/L by adding 400 mg (one full 0.5 g Hach measuring spoon) of Urea (Cat. No. 11237-26) to 10 mL of sample. Swirl to dissolve. Proceed with the nitrate test as usual.
Copper Positive at all levels.
Zero
For
insp
ectio
n pur
pose
s only
.
Conse
nt of
copy
right
owne
r req
uired
for a
ny ot
her u
se.
EPA Export 14-10-2013:23:47:20

Nitrate
NitrateNitrate_TNT_High_CHA_Eng_Ody.fm Page 3 of 4
Sample Collection, Preservation, and StorageCollect samples in clean plastic or glass bottles. Store at 4 °C (39 °F) or lower if the sample is to be analyzed within 24 to 48 hours. Warm to room temperature before running the test. For longer storage periods (up to 14 days), adjust sample pH to 2 or less with Concentrated Sulfuric Acid, ACS (about 2 mL per liter) (Cat. No. 979-49). Sample refrigeration is still required.
Before testing the stored sample, warm to room temperature and neutralize with 5.0 N Sodium Hydroxide Standard Solution (Cat. No. 2450-26).
Do not use mercury compounds as preservatives.
Correct the test result for volume additions; see Section 3.1.3 Correcting for Volume Additions on page 31.
Accuracy Check
Standard Additions Method (Sample Spike)
1. After reading test results, leave the sample cell (unspiked sample) in the instrument. Verify the chemical form.
2. Touch Options. Touch Standard Additions. A summary of the standard additions procedure will appear.
3. Touch OK to accept the default values for standard concentration, sample volume, and spike volumes. Touch Edit to change these values. After values are accepted, the unspiked sample reading will appear in the top row. See Standard Additions in the DR/2500 instrument manual for more information.
4. Snap the neck off a High Range Nitrate Nitrogen Voluette® Ampule Standard, 500 mg/L NO3
––N.
5. Prepare three sample spikes. Fill three mixing cylinders (Cat. No. 1896-40) with 25 mL of sample. Use the TenSette® Pipet to add 0.1 mL, 0.2 mL, and 0.3 mL of standard, respectively, to each sample and mix thoroughly.
6. Analyze each sample spike as described in the procedure above, starting with the 0.1 mL sample spike. Accept each standard additions reading by touching Read. Each addition should reflect approximately 100% recovery.
7. After completing the sequence, touch Graph to view the best-fit line through the standard additions data points, accounting for matrix interferences. Touch View: Fit, then select Ideal Line and touch OK to view the relationship between the sample spikes and the “Ideal Line” of 100% recovery.
See Section 3.2.2 Standard Additions on page 36 for more information.
Standard Solution Method
Use a 10.0-mg/L Nitrate Nitrogen Standard Solution to check test accuracy.
See Section 3.2.1 Standard Solutions on page 35 for more information.
For
insp
ectio
n pur
pose
s only
.
Conse
nt of
copy
right
owne
r req
uired
for a
ny ot
her u
se.
EPA Export 14-10-2013:23:47:20
Nitrate
2003. All rights reserved. Printed in the U.S.A. 2/03 4edPage 4 of 4 Nitrate_TNT_High_CHA_Eng_Ody.fm
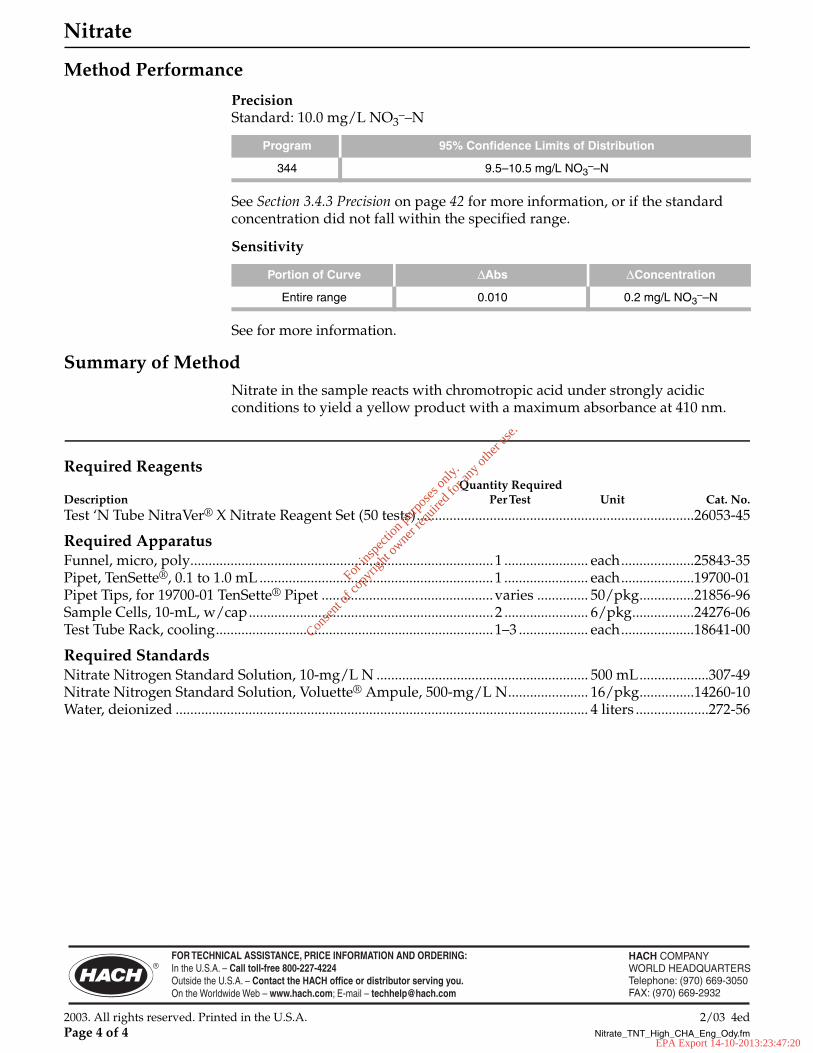
Method Performance
PrecisionStandard: 10.0 mg/L NO3
––N
See Section 3.4.3 Precision on page 42 for more information, or if the standard concentration did not fall within the specified range.
Sensitivity
See for more information.
Summary of MethodNitrate in the sample reacts with chromotropic acid under strongly acidic conditions to yield a yellow product with a maximum absorbance at 410 nm.
Required ReagentsQuantity Required
Description Per Test Unit Cat. No.Test ‘N Tube NitraVer® X Nitrate Reagent Set (50 tests)............................................................................26053-45
Required ApparatusFunnel, micro, poly...................................................................................1 ....................... each....................25843-35Pipet, TenSette®, 0.1 to 1.0 mL ................................................................1 ....................... each....................19700-01Pipet Tips, for 19700-01 TenSette® Pipet ...............................................varies .............. 50/pkg...............21856-96Sample Cells, 10-mL, w/cap...................................................................2 ....................... 6/pkg.................24276-06Test Tube Rack, cooling............................................................................1–3 ................... each....................18641-00
Required StandardsNitrate Nitrogen Standard Solution, 10-mg/L N .......................................................... 500 mL...................307-49Nitrate Nitrogen Standard Solution, Voluette® Ampule, 500-mg/L N...................... 16/pkg...............14260-10Water, deionized ................................................................................................................. 4 liters ....................272-56
Program 95% Confidence Limits of Distribution
344 9.5–10.5 mg/L NO3––N
Portion of Curve ∆Abs ∆Concentration
Entire range 0.010 0.2 mg/L NO3––N
For
insp
ectio
n pur
pose
s only
.
Conse
nt of
copy
right
owne
r req
uired
for a
ny ot
her u
se.
EPA Export 14-10-2013:23:47:20

DR/2500
NitriteNitrite_TNT_Low_DAZ_Eng_Ody.fm Page 1 of 4
• For more accurate results, determine a reagent blank value for each new lot of reagent. Follow the procedure using deionized water in place of the sample. Subtract the reagent blank value from the final results or perform a reagent blank adjust. See the DR/2500 instrument manual for more information on Running a Reagent Blank.
• Wipe the outside of sample cells before each insertion into the instrument cell holder. Use a damp towel followed by a dry one to remove fingerprints or other marks.
NitriteMethod 10019 Diazotization MethodTest ‘N Tube™ Vials LR (0.003 to 0.500 mg/L NO2
––N)Scope and Application: For water, wastewater, and seawater
1. Touch
Hach Programs.
Select program
345 N, Nitrite LR TNT.
Touch Start.
2. Fill a Test ‘N Tube NitriVer® 3 Nitrite vial with 5 mL of sample.
3. Cap and shake to dissolve the powder (this is the prepared sample).
A pink color will develop if nitrite-nitrogen is present.
4. Touch the timer icon.
Touch OK.
A 20-minute reaction period will begin.
Tips and Techniques
Test ‘N Tube Method 10019
Hach Programs
For
insp
ectio
n pur
pose
s only
.
Conse
nt of
copy
right
owne
r req
uired
for a
ny ot
her u
se.
EPA Export 14-10-2013:23:47:20

Nitrite
NitritePage 2 of 4 Nitrite_TNT_Low_DAZ_Eng_Ody.fm
Interferences
Sample Collection, Storage, and PreservationCollect samples in clean plastic or glass bottles. Store at 4 °C (30 °F) or lower if the sample is to be analyzed within 24 to 48 hours. Warm to room temperature before running the test.
5. When the timer beeps, fill an empty Test ‘N Tube™ vial with 5 mL of sample (this is the blank).
6. Wipe the blank and place it into the cell holder.
7. Touch Zero.
The display will show:
0.000 mg/L NO2––N
8. Place the prepared sample cell into the cell holder.
Results will appear in mg/L NO2
– –N.
Interfering Substance Interference Levels and Treatments
Antiminous ions Interfere by causing precipitation
Auric ions Interfere by causing precipitation
Bismuth ions Interfere by causing precipitation
Chloroplatinate ions Interfere by causing precipitation
Cupric ions Cause low results
Ferric ions Interfere by causing precipitation
Ferrous ions Cause low results
Lead ions Interfere by causing precipitation
Mercurous ions Interfere by causing precipitation
Metavanadate ions Interfere by causing precipitation
NitrateVery high levels of nitrate (>100 mg/L nitrate as N) appear to undergo a slight amount of reduction to nitrite, either spontaneously or during the course of the test. A small amount of nitrite will be found at these levels.
Silver ions Interfere by causing precipitation
Strong oxidizing and reducing substances
Interfere at all levels
Zero
For
insp
ectio
n pur
pose
s only
.
Conse
nt of
copy
right
owne
r req
uired
for a
ny ot
her u
se.
EPA Export 14-10-2013:23:47:20
Nitrite
NitriteNitrite_TNT_Low_DAZ_Eng_Ody.fm Page 3 of 4
Accuracy Check
Standard Solution Method
Preparing nitrite standards is difficult. A standard should be prepared by a trained chemist. Hach recommends using the standard preparation instructions in Standard Methods for the Examination of Water and Wastewater, 18th ed., under the headings “Stock nitrite solution,” “Intermediate nitrite solution,” and “Standard nitrite solution.” Prepare a 0.150-mg/L standard. Perform the nitrite test on the standard solution.
Method Performance
PrecisionStandard: 0.150 mg/L NO2
––N
See Section 3.4.3 Precision on page 42 for more information, or if the standard concentration did not fall within the specified range.
Sensitivity
See Section 3.4.5 Sensitivity on page 43 for more information.
Summary of MethodNitrite in the sample reacts with sulfanilic acid to form an intermediate diazonium salt. This couples with chromotropic acid to produce a pink colored complex directly proportional to the amount of nitrite present. Test results are measured at 507 nm.
Required ReagentsQuantity Required
Description per test Unit Cat. No.NitriVer® 3 Low Range Nitrite Test ‘N Tube™ Vial Set (50 tests) ............................................................26083-45
Required ApparatusPipet, TenSette®, 1.0 to 10.0 mL ..............................................................1 ....................... each....................19700-10Pipet Tips, for 19700-10 TenSette® Pipet ...............................................varies .............. 50/pkg...............21997-96
Required StandardsSodium Nitrite, ACS .......................................................................................................... 454 g.....................2452-01Water, deionized ................................................................................................................. 4 liters ....................272-56
Program 95% Confidence Limits of Distribution
345 0.146–0.154 mg/L NO2––N
Portion of Curve ∆Abs ∆Concentration
Entire range 0.010 0.003 mg/L NO2––N
For
insp
ectio
n pur
pose
s only
.
Conse
nt of
copy
right
owne
r req
uired
for a
ny ot
her u
se.
EPA Export 14-10-2013:23:47:20

© Hach Company, 2003. All rights reserved. Printed in the U.S.A. 2/03 4edPage 4 of 4 Nitrite_TNT_Low_DAZ_Eng_Ody.fm
For
insp
ectio
n pur
pose
s only
.
Conse
nt of
copy
right
owne
r req
uired
for a
ny ot
her u
se.
EPA Export 14-10-2013:23:47:20

DR/2500
Nitrogen, TotalNitrogenTot_TNT_Other_PSD_Eng_Ody.fm Page 1 of 8
• Digestion is required for determining total nitrogen. The digestion procedure is included below.
• Place a safety shield in front of the COD reactor to prevent injury if splattering occurs.
• This test is technique-sensitive. Invert the vials as described here to avoid low results: Hold the vial in a vertical position with the cap pointing up. Turn the vial upside-down. Wait for all of the solution to flow down to the cap. Pause. Return the vial to an upright position. Wait for all the solution to flow to the bottom of the vial. This process equals one inversion.
• Wipe the outside of sample cells before each insertion into the instrument cell holder. Use a damp towel followed by a dry one to remove fingerprints or other marks.
• If the test overranges, repeat the digestion and measurement with diluted sample. The digestion must be repeated for accurate results.
• Use the deionized water provided in the reagent set or Organic-free Water (Cat. No. 26415-49) to prepare the standards and perform the procedure.
Nitrogen, TotalMethod 10071 Persulfate Digestion MethodTest ‘N Tube™ Vials LR (0.5 to 25.0 mg/L N)Scope and Application: For water and wastewater
1. Turn on the COD Reactor. Heat to 103-106 °C (optimal temperature is 105 °C).
2. Using a funnel, add the contents of one Total Nitrogen Persulfate Reagent Powder Pillow to each of two Total Nitrogen Hydroxide Reagent vials.
Wipe off any reagent that may get on the lid or the tube threads.
3. Add 2 mL of sample to a vial (this is the prepared sample).
Add 2 mL of the deionized water included in the kit to a second vial (this is the reagent blank).
Note: Use only water that is free of all nitrogen-containing species as a substitute for the deionized water provided.
4. Cap both vials. Shake vigorously for at least 30 seconds to mix.
Note: The persulfate reagent may not dissolve completely after shaking. This will not affect accuracy.
Tips and Techniques
Test ‘N Tube Method 10071
For
insp
ectio
n pur
pose
s only
.
Conse
nt of
copy
right
owne
r req
uired
for a
ny ot
her u
se.
EPA Export 14-10-2013:23:47:20

Nitrogen, Total
Nitrogen, TotalPage 2 of 8 NitrogenTot_TNT_Other_PSD_Eng_Ody.fm
5. Place the vials in the reactor. Heat for exactly 30 minutes.
6. Using finger cots, immediately remove the hot vials from the reactor. Cool the vials to room temperature.
7. Touch
Hach Programs.
Select program
350 N, Total TNT.
Touch Start.
8. Remove the caps from the digested vials and add the contents of one Total Nitrogen (TN) Reagent A Powder Pillow to each vial.
9. Cap the tubes and shake for 15 seconds.
10. Touch the timer icon.
Touch OK.
A three-minute reaction period will begin.
11. After the timer beeps, remove the caps from the vials and add one TN Reagent B Powder Pillow to each vial.
12. Cap the tubes and shake for 15 seconds.
Note: The reagent may not dissolve completely after shaking. This will not affect accuracy.
The solution will begin to turn yellow.
Hach Programs
For
insp
ectio
n pur
pose
s only
.
Conse
nt of
copy
right
owne
r req
uired
for a
ny ot
her u
se.
EPA Export 14-10-2013:23:47:20

Nitrogen, Total
Nitrogen, TotalNitrogenTot_TNT_Other_PSD_Eng_Ody.fm Page 3 of 8
Blanks for Colorimetric MeasurementThe reagent blank may be used up to seven days for measurements using the same lots of reagents. Store it in the dark at room temperature (18–25 °C). If a small amount of white floc appears prior to the end of one week, discard the reagent blank and prepare a new one.
13. Touch the timer icon.
Touch OK.
A two-minute reaction period will begin.
14. After the timer beeps, remove the caps from two TN Reagent C vials and add 2 mL of digested, treated sample to one vial. Add 2 mL of digested, treated reagent blank to the second TN Reagent C vial.
15. Cap the vials and invert ten times to mix. Use slow, deliberate inversions for complete recovery. The tubes will be warm.
16. Touch the timer icon.
Touch OK.
A five-minute reaction period will begin.
The yellow color will intensify.
17. Wipe the reagent blank and place it into the cell holder.
18. Touch Zero.
The display will show:
0.0 mg/L N
19. Wipe the reagent vial and place it into the cell holder.
Results will appear in mg/L N.
Zero
For
insp
ectio
n pur
pose
s only
.
Conse
nt of
copy
right
owne
r req
uired
for a
ny ot
her u
se.
EPA Export 14-10-2013:23:47:20
Nitrogen, Total
Nitrogen, TotalPage 4 of 8 NitrogenTot_TNT_Other_PSD_Eng_Ody.fm
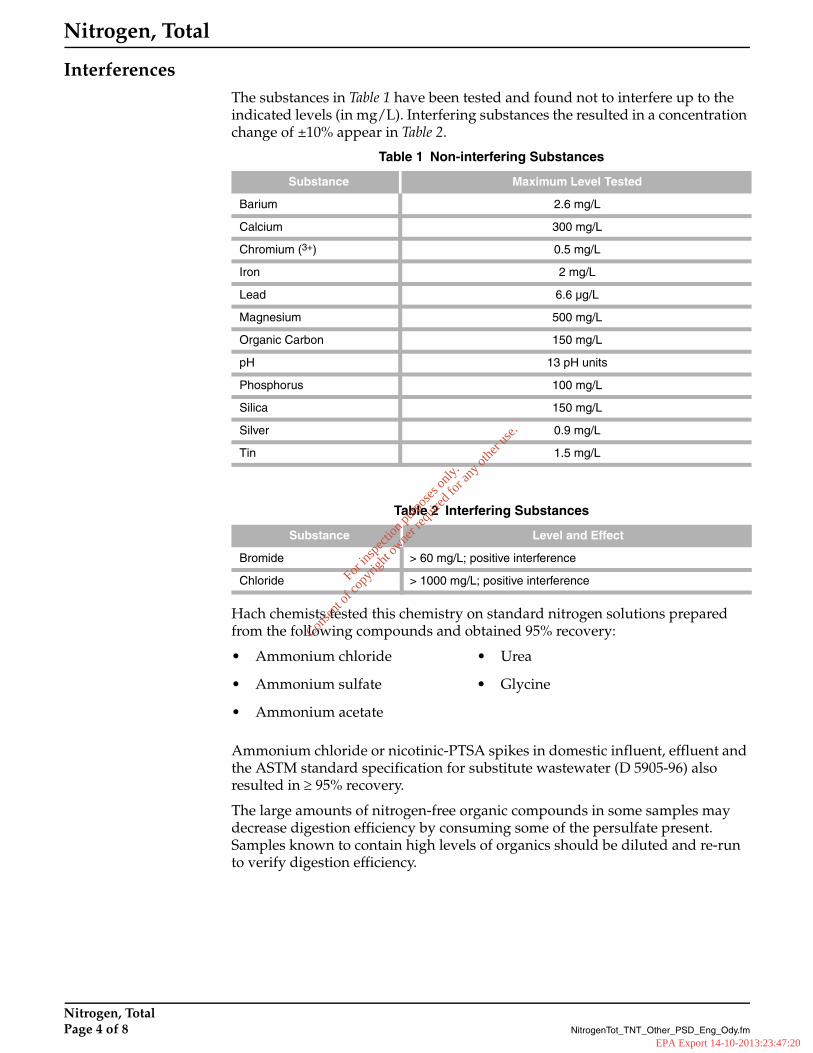
InterferencesThe substances in Table 1 have been tested and found not to interfere up to the indicated levels (in mg/L). Interfering substances the resulted in a concentration change of ±10% appear in Table 2.
Hach chemists tested this chemistry on standard nitrogen solutions prepared from the following compounds and obtained 95% recovery:
Ammonium chloride or nicotinic-PTSA spikes in domestic influent, effluent and the ASTM standard specification for substitute wastewater (D 5905-96) also resulted in ≥ 95% recovery.
The large amounts of nitrogen-free organic compounds in some samples may decrease digestion efficiency by consuming some of the persulfate present. Samples known to contain high levels of organics should be diluted and re-run to verify digestion efficiency.
Table 1 Non-interfering Substances
Substance Maximum Level Tested
Barium 2.6 mg/L
Calcium 300 mg/L
Chromium (3+) 0.5 mg/L
Iron 2 mg/L
Lead 6.6 µg/L
Magnesium 500 mg/L
Organic Carbon 150 mg/L
pH 13 pH units
Phosphorus 100 mg/L
Silica 150 mg/L
Silver 0.9 mg/L
Tin 1.5 mg/L
Table 2 Interfering Substances
Substance Level and Effect
Bromide > 60 mg/L; positive interference
Chloride > 1000 mg/L; positive interference
• Ammonium chloride • Urea
• Ammonium sulfate • Glycine
• Ammonium acetate
For
insp
ectio
n pur
pose
s only
.
Conse
nt of
copy
right
owne
r req
uired
for a
ny ot
her u
se.
EPA Export 14-10-2013:23:47:20
Nitrogen, Total
Nitrogen, TotalNitrogenTot_TNT_Other_PSD_Eng_Ody.fm Page 5 of 8
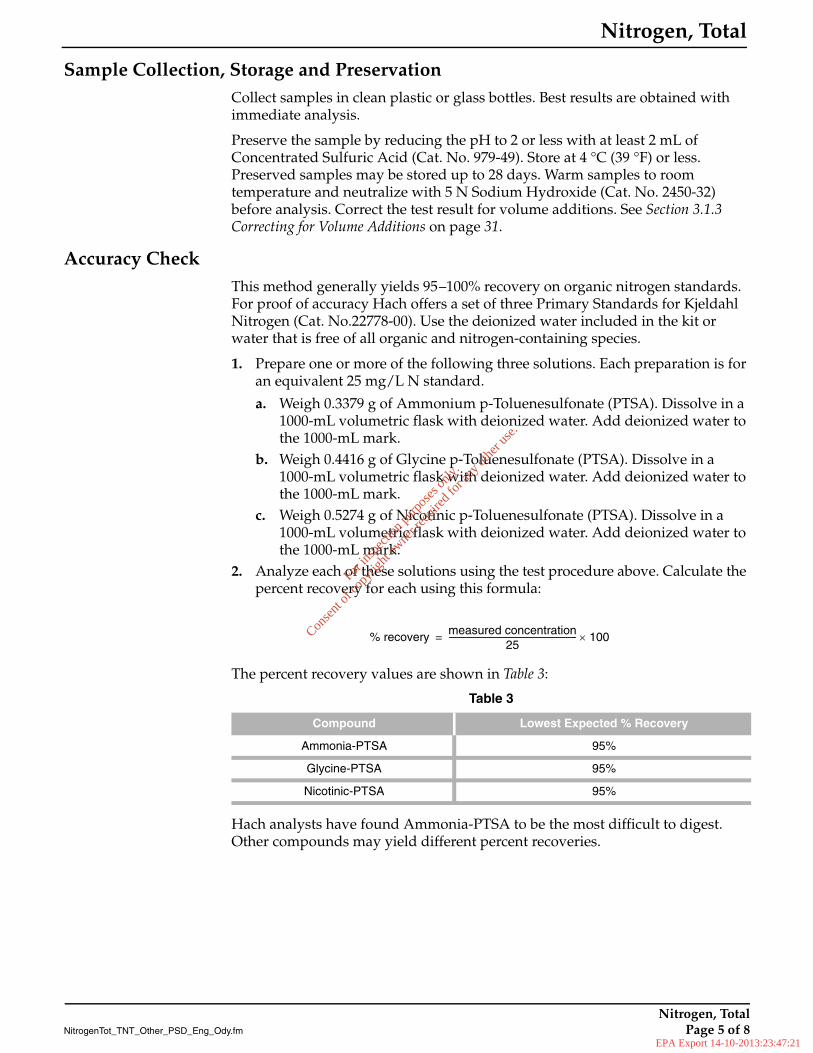
Sample Collection, Storage and PreservationCollect samples in clean plastic or glass bottles. Best results are obtained with immediate analysis.
Preserve the sample by reducing the pH to 2 or less with at least 2 mL of Concentrated Sulfuric Acid (Cat. No. 979-49). Store at 4 °C (39 °F) or less. Preserved samples may be stored up to 28 days. Warm samples to room temperature and neutralize with 5 N Sodium Hydroxide (Cat. No. 2450-32) before analysis. Correct the test result for volume additions. See Section 3.1.3 Correcting for Volume Additions on page 31.
Accuracy CheckThis method generally yields 95–100% recovery on organic nitrogen standards. For proof of accuracy Hach offers a set of three Primary Standards for Kjeldahl Nitrogen (Cat. No.22778-00). Use the deionized water included in the kit or water that is free of all organic and nitrogen-containing species.
1. Prepare one or more of the following three solutions. Each preparation is for an equivalent 25 mg/L N standard.
a. Weigh 0.3379 g of Ammonium p-Toluenesulfonate (PTSA). Dissolve in a 1000-mL volumetric flask with deionized water. Add deionized water to the 1000-mL mark.
b. Weigh 0.4416 g of Glycine p-Toluenesulfonate (PTSA). Dissolve in a1000-mL volumetric flask with deionized water. Add deionized water to the 1000-mL mark.
c. Weigh 0.5274 g of Nicotinic p-Toluenesulfonate (PTSA). Dissolve in a 1000-mL volumetric flask with deionized water. Add deionized water to the 1000-mL mark.
2. Analyze each of these solutions using the test procedure above. Calculate the percent recovery for each using this formula:
The percent recovery values are shown in Table 3:
Hach analysts have found Ammonia-PTSA to be the most difficult to digest. Other compounds may yield different percent recoveries.
% recovery measured concentration25
---------------------------------------------------------------- 100×=
Table 3
Compound Lowest Expected % Recovery
Ammonia-PTSA 95%
Glycine-PTSA 95%
Nicotinic-PTSA 95%
For
insp
ectio
n pur
pose
s only
.
Conse
nt of
copy
right
owne
r req
uired
for a
ny ot
her u
se.
EPA Export 14-10-2013:23:47:21

Nitrogen, Total
Nitrogen, TotalPage 6 of 8 NitrogenTot_TNT_Other_PSD_Eng_Ody.fm
Standard Additions Method (Sample Spike)
1. After reading test results, leave the sample cell (unspiked sample) in the instrument. Verify the chemical form.
2. Touch Options. Touch Standard Additions. A summary of the standard additions procedure will appear.
3. Touch OK to accept the default values for standard concentration, sample volume, and spike volumes. Touch Edit to change these values. After values are accepted, the unspiked sample reading will appear in the top row. See Standard Additions in the DR/2500 instrument manual for more information.
4. Snap the neck off an Ammonia Nitrogen Voluette® Ampule Standard Solution, 1000-mg/L as NH3–N.
5. Prepare three sample spikes. Fill three mixing cylinders with 50 mL of sample. Use the TenSette® Pipet to add 0.1, 0.2, and 0.3 mL of standard, respectively, to each sample and mix thoroughly.
6. Add 2 mL of each prepared solution, respectively, to three Total Nitrogen Hydroxide Reagent Vials.
7. Analyze each sample spike as described in the procedure above, starting with the 0.1 mL sample spike. Accept each standard additions reading by touching Read. Each addition should reflect approximately 100% recovery. The nitrogen concentration should increase by approximately 2, 4, and 6 mg/L N, respectively.
8. After completing the sequence, touch Graph to view the best-fit line through the standard additions data points, accounting for matrix interferences. Touch View: Fit, then select Ideal Line and touch OK to view the relationship between the sample spikes and the “Ideal Line” of 100% recovery.
See Section 3.2.2 Standard Additions on page 36 for more information.
Standard Solution Method
1. For proof of accuracy, substitute 2 mL of a 10-mg/L ammonia nitrogen standard solution for the sample in the procedure. A single analyst should obtain less than 5% variation on replicates.
2. To adjust the calibration curve using the reading obtained with the 10-mg/L N standard solution, touch Options on the current program menu. Touch Standard Adjust.
3. Touch On. Touch Adjust to accept the displayed concentration (the value depends on the selected chemical form). If an alternate concentration is used, touch the number in the box to enter the actual concentration, then touch OK. Touch Adjust.
See Section 3.2.3 Adjusting the Standard Curve on page 38, for more information.
For
insp
ectio
n pur
pose
s only
.
Conse
nt of
copy
right
owne
r req
uired
for a
ny ot
her u
se.
EPA Export 14-10-2013:23:47:21

Nitrogen, Total
Nitrogen, TotalNitrogenTot_TNT_Other_PSD_Eng_Ody.fm Page 7 of 8
Method Performance
PrecisionStandard: 10 mg/L NH3–N
See Section 3.4.3 Precision on page 42 for more information, or if the standard concentration did not fall within the specified range.
Sensitivity
See Section 3.4.5 Sensitivity on page 43 for more information.
Summary of MethodAn alkaline persulfate digestion converts all forms of nitrogen to nitrate. Sodium metabisulfite is added after the digestion to eliminate halogen oxide interferences. Nitrate then reacts with chromotropic acid under strongly acidic conditions to form a yellow complex with an absorbance maximum at 410 nm.
Required ReagentsQuantity Required
Description Per Test Unit Cat. No.Test ‘N Tube™ Total Nitrogen Reagent Set .................................................................... 50 vials...............26722-45
Required ApparatusCOD Reactor, 115/230 VAC, North American Plug............................1 ....................... each....................45600-00COD Reactor, 230 VAC, European Plug ................................................1 ....................... each....................45600-02Funnel, micro ............................................................................................1 ....................... each....................25843-35Safety Shield, laboratory bench, 38 x 40 cm..........................................1 ....................... each....................50030-00Test Tube Cooling Rack............................................................................1–3 ................... each....................18641-00
Required StandardsAmmonia Nitrogen Standard Solution as N, 100-mg/L .............................................. 500 mL...............24065-49Ammonia Nitrogen Standard Sol., 10-mL Voluette® Ampule, 160-mg/L NH3–N .. 16/pkg...............21091-10Primary Standard Set, Kjeldahl Nitrogen, 59-mL SCDB .............................................. 3/set...................22778-00Water, deionized ................................................................................................................. 500 mL...................272-49
orWater, organic-free.............................................................................................................. 500 mL...............26415-49
Program 95% Confidence Limits of Distribution
350 9.0–11.0 mg/L N
Portion of Curve ∆Abs ∆Concentration
Entire range 0.010 0.5 mg/L N
For
insp
ectio
n pur
pose
s only
.
Conse
nt of
copy
right
owne
r req
uired
for a
ny ot
her u
se.
EPA Export 14-10-2013:23:47:21

© Hach Company, 2003. All rights reserved. Printed in the U.S.A. 2/03 4edPage 8 of 8 NitrogenTot_TNT_Other_PSD_Eng_Ody.fm
For
insp
ectio
n pur
pose
s only
.
Conse
nt of
copy
right
owne
r req
uired
for a
ny ot
her u
se.
EPA Export 14-10-2013:23:47:21

DR/2500
Phosphorus, TotalPhosphorusTot_TNT_Other_PAP_Eng_Ody.fm Page 1 of 6
• For more accurate results, determine a reagent blank value for each new lot of reagent. Follow the procedure using deionized water in place of the sample. Subtract the reagent blank value from the final results or perform a reagent blank adjust. See the DR/2500 instrument manual for more information on Running a Reagent Blank.
• Place a safety shield in front of the COD reactor to prevent injury if splattering occurs.
• The test range for total phosphate is limited to 0.06 to 3.5 mg/L PO43–. Values greater than 3.5 mg/L may be used to estimate
dilution ratios, but should NOT be used for reporting purposes. If the value is greater than 3.5 mg/L, dilute the sample and repeat the digestion and the colorimetric test.
• Final samples will contain molybdenum. In addition, final samples will have a pH less than 2 and are considered corrosive (D002) by the Federal RCRA.
Phosphorus, Total�Method 8190 PhosVer® 3 with Acid Persulfate Digestion MethodTest ‘N Tube™ Vials (0.06 to 3.50 mg/L PO4
3– or 0.02 to 1.10 mg/L P)Scope and Application: For water, wastewater, and seawater; USEPA Accepted for reporting wastewater analyses
1. Turn on the COD reactor. Heat to 150 °C. Place the safety shield in front of the reactor.
2. Touch
Hach Programs.
Select program
536 P Total/AH PV TNT.
Touch Start.
3. Use a TenSette® Pipet to add 5.0 mL of sample to a Total and Acid Hydrolyzable Test Vial.
4. Use a funnel to add the contents of one Potassium Persulfate Powder Pillow for Phosphonate to the vial.
Tips and Techniques
Test ‘N Tube Method 8190
Hach Programs
For
insp
ectio
n pur
pose
s only
.
Conse
nt of
copy
right
owne
r req
uired
for a
ny ot
her u
se.
EPA Export 14-10-2013:23:47:21

Phosphorus, Total
Phosphorus, TotalPage 2 of 6 PhosphorusTot_TNT_Other_PAP_Eng_Ody.fm
5. Cap tightly and shake to dissolve.
6. Place the vial into the COD Reactor.
7. Touch the timer icon.
Touch OK.
A 30-minute heating period will begin.
8. When the timer beeps, carefully remove the hot vial from the reactor. Place it in a test tube rack and cool to room temperature.
9. Use a TenSette Pipet to add 2 mL of 1.54 N Sodium Hydroxide Standard Solution to the vial. Cap and mix.
10. Wipe the outside of the vial with a damp cloth followed by a dry one, to remove fingerprints or other marks.
11. Place the vial into the cell holder.
12. Touch Zero.
The display will show:
0.00 mg/L PO43–
13. Use a funnel to add the contents of one PhosVer 3 Powder Pillow to the vial.
14. Cap tightly and shake to mix for 10–15 seconds.
The powder will not dissolve completely.
15. Touch the timer icon.
Touch OK.
A two-minute reaction period will begin.
Read the sample within 2–8 minutes after the timer beeps.
16. After the timer beeps, wipe the outside of the vial with a damp cloth followed by a dry one, to remove fingerprints or other marks.
Zero
For
insp
ectio
n pur
pose
s only
.
Conse
nt of
copy
right
owne
r req
uired
for a
ny ot
her u
se.
EPA Export 14-10-2013:23:47:21

Phosphorus, Total
Phosphorus, TotalPhosphorusTot_TNT_Other_PAP_Eng_Ody.fm Page 3 of 6
Interferences
Sample Collection, Storage, and PreservationCollect samples in plastic or glass bottles that have been acid washed with 1:1 Hydrochloric Acid Solution (Cat. No. 884-49) and rinsed with deionized water. Do not use commercial detergents containing phosphate for cleaning glassware used in this test.
Analyze the samples immediately for the most reliable results. If prompt analysis is not possible, samples may be preserved up to 28 days by adjusting the pH to 2 or less with concentrated Sulfuric Acid (about 2 mL per liter)(Cat. No. 979-49) and storing at 4 °C. Warm the sample to room temperatureand neutralize with 5.0 N Sodium Hydroxide (Cat. No. 2450-53) before analysis. Correct for volume additions: see Section 3.1.3 Correcting for Volume Additions on page 31.
17. Place the prepared sample vial into the cell holder.
Results will appear in mg/L PO4
3–.
Interfering Substance Interference Levels and Treatments
Aluminum Greater than 200 mg/L
Arsenate Interferes at any level
Chromium Greater than 100 mg/L
Copper Greater than 10 mg/L
Iron Greater than 100 mg/L
Nickel Greater than 300 mg/L
pH, excess bufferingHighly buffered samples or extreme sample pH may exceed the buffering capacity of the reagents and require sample pretreatment.
Silica Greater than 50 mg/L
Silicate Greater than 10 mg/L
Sulfide Greater than 90 mg/L
Turbidity (large amounts) or color
May cause inconsistent results because the acid in the powder pillow may dissolve some of the suspended particles and because of variable desorption of orthophosphate from the particles.
Zinc Greater than 80 mg/L
For
insp
ectio
n pur
pose
s only
.
Conse
nt of
copy
right
owne
r req
uired
for a
ny ot
her u
se.
EPA Export 14-10-2013:23:47:22

Phosphorus, Total
Phosphorus, TotalPage 4 of 6 PhosphorusTot_TNT_Other_PAP_Eng_Ody.fm
Accuracy Check
Standard Additions Method (Sample Spike)
1. Clean glassware with 1:1 Hydrochloric Acid Standard Solution. Rinse again with deionized water. Do not use phosphate detergents to clean glassware.
2. After reading test results, leave the sample cell (unspiked sample) in the instrument. Verify the chemical form.
3. Touch Options. Touch Standard Additions. A summary of the standard additions procedure will appear.
4. Touch OK to accept the default values for standard concentration, sample volume, and spike volumes. Touch Edit to change these values. After values are accepted, the unspiked sample reading will appear in the top row. See Section 3.2.2 Standard Additions on page 36 for more information.
5. Open a Phosphate 10-mL Ampule Standard, 50-mg/L as PO43–.
6. Prepare three sample spikes. Fill three Mixing Cylinders (Cat. No. 1896-40) with 25 mL of sample. Use the TenSette Pipet to add 0.1 mL, 0.2 mL, and 0.3 mL of standard, respectively, to each sample and mix thoroughly.
7. Analyze each standard addition sample as described above (use a 5-mL aliquot of the spiked sample as the sample). Accept each standard additions reading by touching Read. Each addition should reflect approximately 100% recovery.
8. After completing the sequence, touch Graph to view the best-fit line through the standard additions data points, accounting for matrix interferences. Touch View: Fit, then select Ideal Line and touch OK to view the relationship between the sample spikes and the “Ideal Line” of 100% recovery.
See Section 3.2.2 Standard Additions on page 36 for more information.
Standard Solution Method
1. Use a 1.0-mg/L phosphate standard solution in place of the sample. Perform the procedure as describe above.
2. To adjust the calibration curve using the reading obtained with the 1.0-mg/L PO4
3– Phosphate Standard Solution, touch Options on the current program menu. Touch Standard Adjust.
3. Touch On. Touch Adjust to accept the displayed concentration (the value depends on the selected chemical form). If an alternate concentration is used, touch the number in the box to enter the actual concentration, then touch OK. Touch Adjust.
For more information, see Section 3.2.3 Adjusting the Standard Curve on page 38.
Method Performance
PrecisionStandard: 3.00 mg/L PO4
3–
See Section 3.4.3 Precision on page 42 for more information, or if the standard concentration did not fall within the specified range.
Program 95% Confidence Limits of Distribution
536 2.90–3.10 mg/L PO43–
For
insp
ectio
n pur
pose
s only
.
Conse
nt of
copy
right
owne
r req
uired
for a
ny ot
her u
se.
EPA Export 14-10-2013:23:47:22

Phosphorus, Total
Phosphorus, TotalPhosphorusTot_TNT_Other_PAP_Eng_Ody.fm Page 5 of 6
Sensitivity
See Section 3.4.5 Sensitivity on page 43 for more information.
Summary of MethodPhosphates present in organic and condensed inorganic forms (meta-, pyro-, or other polyphosphates) must be converted to reactive orthophosphate before analysis. Pretreatment of the sample with acid and heat provides the conditions for hydrolysis of the condensed inorganic forms. Organic phosphates are converted to orthophosphates by heating with acid and persulfate.
Orthophosphate reacts with molybdate in an acid medium to produce a mixed phosphate/molybdate complex. Ascorbic acid then reduces the complex, giving an intense molybdenum blue color. Test results are measured at 880 nm.
Required ReagentsQuantity Required
Description Per Test Unit Cat. No.Total Phosphorus Test ’N Tube™ Reagent Set ............................................................... 50 tests ...............27426-45Includes:
PhosVer® 3 Phosphate Reagent Powder Pillows...........................1 ....................... 50/pkg...............21060-46Potassium Persulfate Powder Pillows ............................................1 ....................... 50/pkg...............20847-66Sodium Hydroxide Solution, 1.54 N ...............................................2 mL ................ 100 mL...............27430-42Total and Acid Hydrolyzable Test Vials .........................................1 ....................... 50/pkg....................................*
Water, deionized ................................................................................................................. 4 liters ....................272-42
Required ApparatusCOD Reactor, 115/230 VAC (U.S.A. and Canada)...............................1 ....................... each....................45600-00COD Reactor, 115/230 VAC (Europe)....................................................1 ....................... each....................45600-02Funnel, micro ............................................................................................1 ....................... each....................25843-35Pipet, TenSette®, 1 to 10 mL ....................................................................1 ....................... each....................19700-10Pipet Tips, for 19700-10 TenSette® Pipet ...............................................1 ....................... 1000/pkg...........21856-28Safety Shield, laboratory bench ..............................................................1 ....................... each....................50030-00Test Tube Rack...........................................................................................1–3 ................... each....................18641-00
Required StandardsPhosphate Standard Solution, 10-mL Voluette® Ampule, 50-mg/L as PO4
3–........... 16/pkg...................171-10Phosphate Standard Solution, 1-mg/L as PO4
3– ........................................................... 500 mL.................2569-49
Portion of Curve ∆Abs ∆Concentration
Entire range 0.010 0.06 mg/L PO43–
*Not sold separately.
For
insp
ectio
n pur
pose
s only
.
Conse
nt of
copy
right
owne
r req
uired
for a
ny ot
her u
se.
EPA Export 14-10-2013:23:47:22

© Hach Company, 2003. All rights reserved. Printed in the U.S.A. 2/03 4edPage 6 of 6 PhosphorusTot_TNT_Other_PAP_Eng_Ody.fm
For
insp
ectio
n pur
pose
s only
.
Conse
nt of
copy
right
owne
r req
uired
for a
ny ot
her u
se.
EPA Export 14-10-2013:23:47:22

DR/2500
Nitrogen, AmmoniumNitrogenAmm_UniCell_Low_SAL_Eng_Ody.fm Page 1 of 4
• Adjust the pH of preserved samples to between pH 4–9 before testing.
• Clean the outside of the vial before placing it in the instrument. Wipe with a damp towel, followed by a dry one.
• Use the standard solution or standard addition method to verify results (see Accuracy Check).
• See 3.2.3 on page 38 for information on adjusting the calibration curve.
• Make sure that the temperature of the water sample and the sample vial is 20 °C. Temperature will affect the color of the reaction and may give inaccurate results.
• Analyze the sample between 15 and 30 minutes after the reaction begins. The final color and final absorbance are reached after a reaction time of 15 minutes and remains constant for an additional 15 minutes.
• Underrange appears on the display when the instrument is zeroed or when the determined sample concentration is below the operating range listed for this method.
Nitrogen, AmmoniumSalicylate Method
UniCell™ VialsScope and Application: For water, wastewater, surface water, swimming pool water, and process control
(0.05 to 1.50 mg/L NH4+)
1. Touch
Hach Programs.
Select program
802 Ammonium, HCT 100.
Touch Start.
2. Add 5.0 mL of sample to a sample vial.
3. Immediately screw a light green UniCap A (HCT 100-104 A) onto the sample vial.
Close the UniCap A bottle immediately after use.
4. Invert the sample vial repeatedly until the solid reagent in the cap is dissolved.
Tips and Techniques
UniCell Vials
Hach ProgramsHach Programs
For in
spec
tion p
urpo
ses o
nly.
Conse
nt of
copy
right
owne
r req
uired
for a
ny ot
her u
se.
EPA Export 14-10-2013:23:47:22

Nitrogen, Ammonium
Nitrogen, AmmoniumPage 2 of 4 NitrogenAmm_UniCell_Low_SAL_Eng_Ody.fm
InterferencesThe ions listed in the following table have been individually tested up to the given concentrations. Cumulative effects and the influence of other ions have not been evaluated.
5. Touch the timer icon.
Touch OK.
A 15-minute reaction period will begin.
6. Wipe the zero (white cap) and sample vials.
7. When the timer beeps, place the zero vial into the cell holder.
8. Touch Zero.
The display will show:
0.00 mg/L NH4+
Underrange
9. Wipe the sample vial and place it into the cell holder.
Results will appear in mg/L NH4
+.
HRS MIN SECHRS MIN SEC
Zero
Interfering Substance No interference up to:
Cl–, SO42– 1000 mg/L
K+, Na+, Ca2+ 500 mg/L
CO32–, NO3
–, Fe3+, Cr6+, Zn2+, Cu2+, Co2+, Ni2+, Hg2+ 50 mg/L
Fe2+ 25 mg/L
Sn2+ 10 mg/L
Pb2+ 5 mg/L
Ag+ 2 mg/L
For
insp
ectio
n pur
pose
s only
.
Conse
nt of
copy
right
owne
r req
uired
for a
ny ot
her u
se.
EPA Export 14-10-2013:23:47:22

Nitrogen, Ammonium
Nitrogen, AmmoniumNitrogenAmm_UniCell_Low_SAL_Eng_Ody.fm Page 3 of 4
Sample, Collection, Storage, and PreservationAnalyze samples within 3 hours after collection for best results. Collect samples in clean plastic or glass bottles. To preserve samples for longer periods, add 1 mL of concentrated sulfuric acid per liter and store at 4 °C.
Warm the sample to room temperature before testing. Adjust the pH to 4–9 with 5.0 N sodium hydroxide. Do not use mercury compounds as preservatives. Correct the test results for volume additions by dividing the total final volume (acid + base + sample) by the initial sample volume and multiplying the result by this factor. See Section 3.1.3 Correcting for Volume Additions on page 31
Accuracy Check
Standard Additions Method (Sample Spike)
1. After reading test results, leave the sample cell (unspiked sample) in the instrument.
2. Touch Options. Touch Standard Additions. A summary of the standard additions procedure will appear.
3. Enter 128.6 mg/L NH4+ (100-mg/L NH3–N) as the standard concentration.
4. Touch OK to accept the default values for sample volume and spike volumes. Touch Edit to change these values. After values are accepted, the unspiked sample reading will appear in the top row. See Standard Additions in the DR/2500 instrument manual for more information.
5. Prepare three sample spikes. Fill three 100-mL Mixing Cylinders (Cat. No. 20886-42) with 100 mL of sample. Use a pipet to add 0.2 mL, 0.4 mL, and 0.6 mL of (128.6 mg/L NH4
+) 100-mg/L NH3–N standard, respectively, to each sample and mix thoroughly.
6. Analyze each sample spike as described in the procedure above, starting with the 0.2 mL sample spike. Accept each standard additions reading by touching Read. Each addition should reflect approximately 100% recovery.
7. After completing the sequence, touch Graph to view the best-fit line through the standard additions data points, accounting for matrix interferences. Touch View: Fit, then select Ideal Line and touch OK to view the relationship between the sample spikes and the “Ideal Line” of 100% recovery.
See Section 3.2.2 Standard Additions on page 36 for more information.
Standard Solution Method
To check accuracy, use the Nitrogen Ammonia Standard Solution, 1.0-mg/L. Alternatively, dilute 1 mL of 50-mg/L Nitrogen Ammonia Standard Solution to 50 mL with deionized water in a 50-mL volumetric flask.
Note: Make sure that the selected chemical form is NH4+–N.
For
insp
ectio
n pur
pose
s only
.
Conse
nt of
copy
right
owne
r req
uired
for a
ny ot
her u
se.
EPA Export 14-10-2013:23:47:22

Nitrogen, Ammonium
2003. All rights reserved. Printed in the U.S.A. 2/03 4edPage 4 of 4 NitrogenAmm_UniCell_Low_SAL_Eng_Ody.fm
Method Performance
Precision
Standard: 1.00 mg/L NH4+–N
See Section 3.4.3 Precision on page 42 for more information, or if the standard concentration did not fall within the specified range.
Sensitivity
See Section 3.4.5 Sensitivity on page 43 for more information.
Summary of MethodAmmonium ions react with hypochlorite ions and salicylate ions at pH 12.6 in the presence of sodium nitroferricyanide to form indophenol blue. Test results are measured at 694 nm.
Required Reagents
Description Unit Cat. No.Ammonium - NH4, UniCell™ HCT 100.......................................................................... 23/pkg.............. HCT 100
Optional ReagentsAmmonium Standard Solution, 100-mg/L as NH3–N ................................................. 500 mL...............24065-49Nitrogen Ammonia Standard, 1-mg/L as NH3–N........................................................ 500 mL.................1891-49Sodium Hydroxide Standard Solution, 5.0 N................................................................. 50 mL SCDB .......2450-26Sulfuric Acid, ACS.............................................................................................................. 500 mL...................979-49
Optional ApparatusCylinder, mixing, 100-mL.................................................................................................. each....................20886-42Flask, volumetric, 1000-mL ............................................................................................... each....................14574-53Pipettor, Jencons, 1–5 mL................................................................................................... each....................27951-00Replacement tips for 27951-00 .......................................................................................... 100/pkg.............27952-00
Program 95% Confidence Limits of Distribution
802 0.76–0.80 mg/L NH4+–N
Program Portion of Curve ∆Abs ∆Concentration
802 Entire range 0.010 0.01 mg/L NH4+–N
For
insp
ectio
n pur
pose
s only
.
Conse
nt of
copy
right
owne
r req
uired
for a
ny ot
her u
se.
EPA Export 14-10-2013:23:47:22
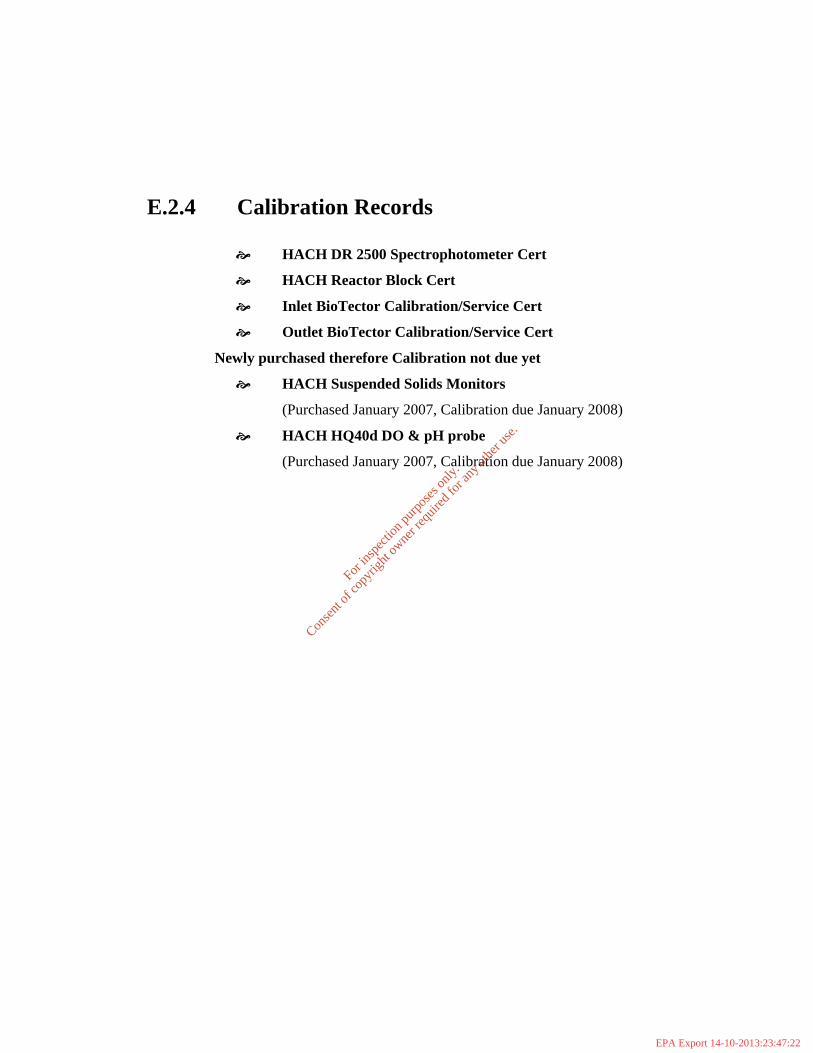
E.2.4 Calibration Records
HACH DR 2500 Spectrophotometer Cert
HACH Reactor Block Cert
Inlet BioTector Calibration/Service Cert
Outlet BioTector Calibration/Service Cert
Newly purchased therefore Calibration not due yet
HACH Suspended Solids Monitors
(Purchased January 2007, Calibration due January 2008)
HACH HQ40d DO & pH probe
(Purchased January 2007, Calibration due January 2008)
For
insp
ectio
n pur
pose
s only
.
Conse
nt of
copy
right
owne
r req
uired
for a
ny ot
her u
se.
EPA Export 14-10-2013:23:47:22

For
insp
ectio
n pur
pose
s only
.
Conse
nt of
copy
right
owne
r req
uired
for a
ny ot
her u
se.
EPA Export 14-10-2013:23:47:23

For
insp
ectio
n pur
pose
s only
.
Conse
nt of
copy
right
owne
r req
uired
for a
ny ot
her u
se.
EPA Export 14-10-2013:23:47:23

POLLUTION CONTROL SYSTEMS LTD RAFFEEN HOUSE, RINGASKIDDY,
CO. CORK, IRELAND. Tel (Int 353) 021 437-42-37 Fax (Int 353) 021 437-42-36
E-mail [email protected]
Kilkenny Co Co.
BioTector service and calibration report. Service type, 6 month. The BioTector TOC/TN analyser was serviced and calibrated on 09-July-2007. Calibration point, Zero and 75mg C/l TOC / 40mg C/l TN. Main Service points: BioTector. A fitting on pumphead was leaking, SS fitting was fixed. CO2 analyser zero reading was ~ 40ppm, CO2 analysers filters were replaced. Sample out tube was dirty, it was replaced. Optimization performed on TN analyser, Integration time on spectrometer increased from 35 to 70ms New ozone PCB current was correct, the found value was 1.02A All other standard service functions were carried out. Next service and calibration due on or before 09-Jan-2008. For Pollution Control Systems Ltd., Marek Pawlukowiec Electronic document, valid without signature.
For
insp
ectio
n pur
pose
s only
.
Conse
nt of
copy
right
owne
r req
uired
for a
ny ot
her u
se.
EPA Export 14-10-2013:23:47:23
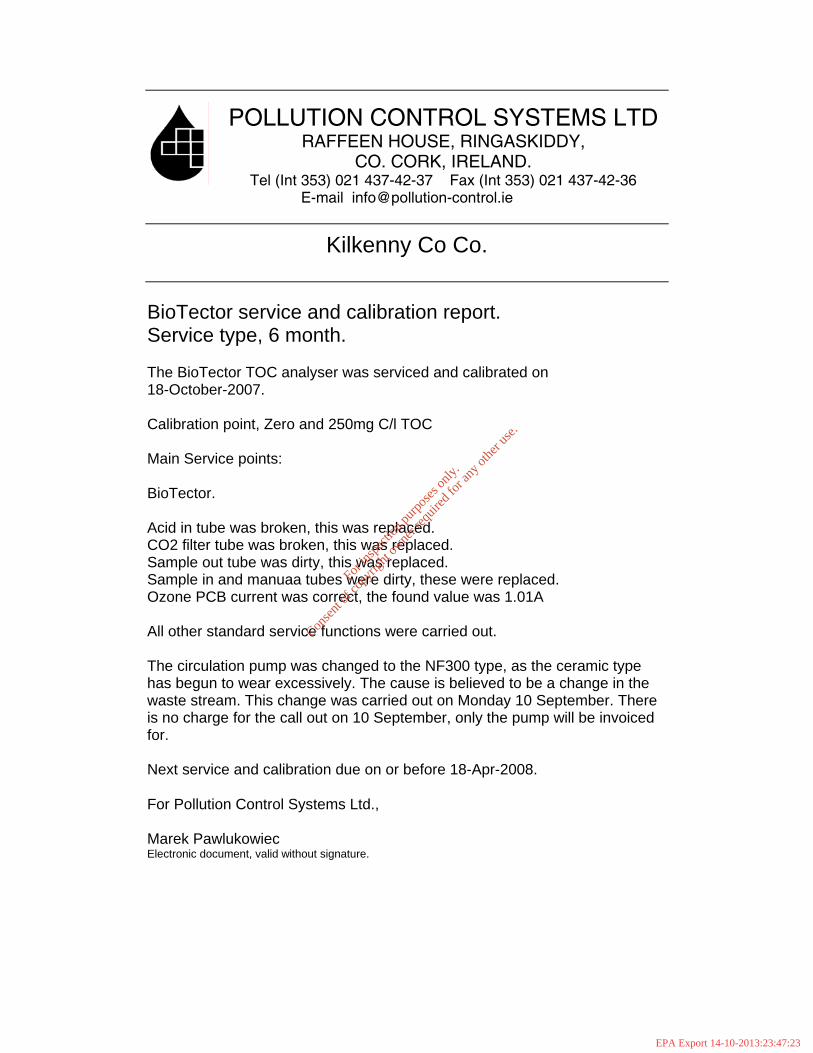
POLLUTION CONTROL SYSTEMS LTD RAFFEEN HOUSE, RINGASKIDDY,
CO. CORK, IRELAND. Tel (Int 353) 021 437-42-37 Fax (Int 353) 021 437-42-36
E-mail [email protected]
Kilkenny Co Co.
BioTector service and calibration report. Service type, 6 month. The BioTector TOC analyser was serviced and calibrated on 18-October-2007. Calibration point, Zero and 250mg C/l TOC Main Service points: BioTector. Acid in tube was broken, this was replaced. CO2 filter tube was broken, this was replaced. Sample out tube was dirty, this was replaced. Sample in and manuaa tubes were dirty, these were replaced. Ozone PCB current was correct, the found value was 1.01A All other standard service functions were carried out. The circulation pump was changed to the NF300 type, as the ceramic type has begun to wear excessively. The cause is believed to be a change in the waste stream. This change was carried out on Monday 10 September. There is no charge for the call out on 10 September, only the pump will be invoiced for. Next service and calibration due on or before 18-Apr-2008. For Pollution Control Systems Ltd., Marek Pawlukowiec Electronic document, valid without signature.
For
insp
ectio
n pur
pose
s only
.
Conse
nt of
copy
right
owne
r req
uired
for a
ny ot
her u
se.
EPA Export 14-10-2013:23:47:23

E.2.5 Purcellsinch WWTP External Testing & Accreditation Certificates
Summary of External Tests
ELS - Accreditation Certificate
TELLAB - Accreditation Certificate
For
insp
ectio
n pur
pose
s only
.
Conse
nt of
copy
right
owne
r req
uired
for a
ny ot
her u
se.
EPA Export 14-10-2013:23:47:23

E.2.5 Purcellsinch WWTP External Testing Summary
Some of the test parameters we are unable to test for at the lab in Purcellsinch therefore
some additional testing is carried out on behalf of Kilkenny County Council. These tests
are carried out by two independent labs. Below is a summary of the tests done for
Kilkenny County Council by those external laboratories:
Ammonia Arsenic Atrazine Barium BOD Boron Cadmium COD Chromium Copper Cyanide Dichloromethane Electrical Conductivity Fluoride Lead Mercury
Nickel Nitrate Nitrite Orthophosphate Phenols Selenium Simazine Sludge Analysis Sulphate Suspended Solids Toluene Total Nitrogen Total Phosphorus Tributyltin Xylenes Zinc
The two independent laboratories we use are: Environmental Laboratory Services Ltd, Acorn Business Campus, Mahon Industrial Park, Blackrock, Cork Tel: 353 (0)21-4536141 Fax: 353 (0)21-4536149 www.elsltd.com
T.E. LABORATORIES LTD Tullow Industrial Estate Tullow Co Carlow Tel: 059 9152881 Fax: 059 9152886 www.tellab.ie
Attached please find accreditation for both companies.
For
insp
ectio
n pur
pose
s only
.
Conse
nt of
copy
right
owne
r req
uired
for a
ny ot
her u
se.
EPA Export 14-10-2013:23:47:23

Edition 6 2006 – Jan – 30 111T Page 1 of 5
Wilton Park HouseWilton PlaceDublin 2
Tel: 353-1-607 3003Fax: 353-1-607 3109
E-mail: [email protected] http://www.inab.ie
Permanent Laboratory: Category A
Schedule of Accreditation
Environmental Laboratory Services Ltd.
Chemical Testing Laboratory
Initial Registration Date : 09/12/1999
Postal Address: Acorn Business Campus, Mahon Industrial Park,
Blackrock,Cork
Telephone: 353-(0)21-4536141
Fax: 353-(0)21-4536149
Contact: Mr Brendan Murray
Facilities: Public testing service
For
insp
ectio
n pur
pose
s only
.
Conse
nt of
copy
right
owne
r req
uired
for a
ny ot
her u
se.
EPA Export 14-10-2013:23:47:23

Edition 6 2006 – Jan – 30 111T Page 2 of 5
Wilton Park HouseWilton PlaceDublin 2Tel: 353-1-607 3003Fax: 353-1-607 3109Email: [email protected]://www.inab.ie
Permanent Laboratory: Category A
THE IRISH NATIONAL ACCREDITATION BOARD(INAB) is the Irish organisation for the accreditation oforganisations including laboratories.
Laboratory accreditation is available to testing andcalibration facilities operated by manufacturingorganisations, government departments, educationalinstitutions and commercial testing/calibrationservices. Indeed, any organisation undertakingtesting, measurement or calibration in any area oftechnology can seek accreditation for the work it isundertaking.
Each accredited laboratory has been assessed byskilled specialist assessors and found to meet criteriawhich are in compliance with ISO/IEC 17025 orISO/IEC 15189 (medical laboratories). Frequent audits,together with periodic interlaboratory testprogrammes, ensure that these standards ofoperation are maintained.
GLOSSARY OF TERMS
Facilities:
Public calibration/testing service: Commercialoperations which actively seek work from others.
Conditionally available for public calibration/testing:Established for another primary purpose but, morecommonly than not, is available for outside work.
Normally not available for public calibration/testing:Unavailable for public calibration/testing more often thannot.
Testing and Calibration Categories:
Category A: Permanent laboratory calibration and testingwhere the laboratory is erected on a fixed location for aperiod expected to be greater than three years.
Category B: Site calibration and testing that is performedby staff sent out on site by a permanent laboratory that isaccredited by the Irish National Accreditation Board.
Category C: Site calibration and testing that is performedin a site/mobile laboratory or by staff sent out by such alaboratory, the operation of which is the responsibility of apermanent laboratory accredited by the Irish NationalAccreditation Board.
Category D: Site calibration and testing that is performedon site by individuals and organisations that do not have apermanent calibration/testing laboratory. Testing may beperformed using(a) portable test equipment(b) a site laboratory(c) a mobile laboratory or(d) equipment from a mobile or site laboratory
Standard Specification or Test Procedure Used:
The standard specification or test procedure that isaccredited is the issue that is current on the date of themost recent visit, unless otherwise stated.
Laboratory users wishing to obtain assurance that calibration or test results are reliable and carried out to the Irish NationalAccreditation Board criteria should insist on receiving an accredited calibration certificate or test report.
Users should contact the laboratory directly to ensure that this scope of accreditation is current. INAB will on request verify the statusand scope.
For
insp
ectio
n pur
pose
s only
.
Conse
nt of
copy
right
owne
r req
uired
for a
ny ot
her u
se.
EPA Export 14-10-2013:23:47:23

Edition 6 2006 – Jan – 30 111T Page 3 of 5
Environmental Laboratory Services Ltd.
Chemical Testing Laboratory
Permanent Laboratory:Category A
SCOPE OF ACCREDITATION
NAB Classification number
Materials/products tested
Type of test/propertiesmeasuredRange of measurement
Standard specifications
Equipment/techniques used
766.01 Potable Water
766.99 Other waters
Ground waterSurface waterWaste water
COD 8-1500 mg/l
Orthophosphate 0.2-2mg/l
PH 0.3 – 14 PH Units
Ammonia 0.0089-10mg/l
Phosphate 0.001-mg/l
Chloride 1-250 mg/l
Nitrate 0.054-50 mg/l
Nitrite 0.002-1 mg/l
Documented in-house methods
TM 00010, closed RefluxColorimetric
TM00007, AscorbicAcid
EW019 – Electrometricmeasurement
EWOC3 Ammonia by AutoanalyserSpectrophotometry
EWO07 Phosphate by AutoanalyserSpectrophotometry
EWO15 Chloride by AutoanalyserSpectrophotometry
EWO34 Nitrate by AutoanalyserSpectrophotometry
EWO35 Nitrite by AutoanalyserSpectrophotometry
For
insp
ectio
n pur
pose
s only
.
Conse
nt of
copy
right
owne
r req
uired
for a
ny ot
her u
se.
EPA Export 14-10-2013:23:47:23
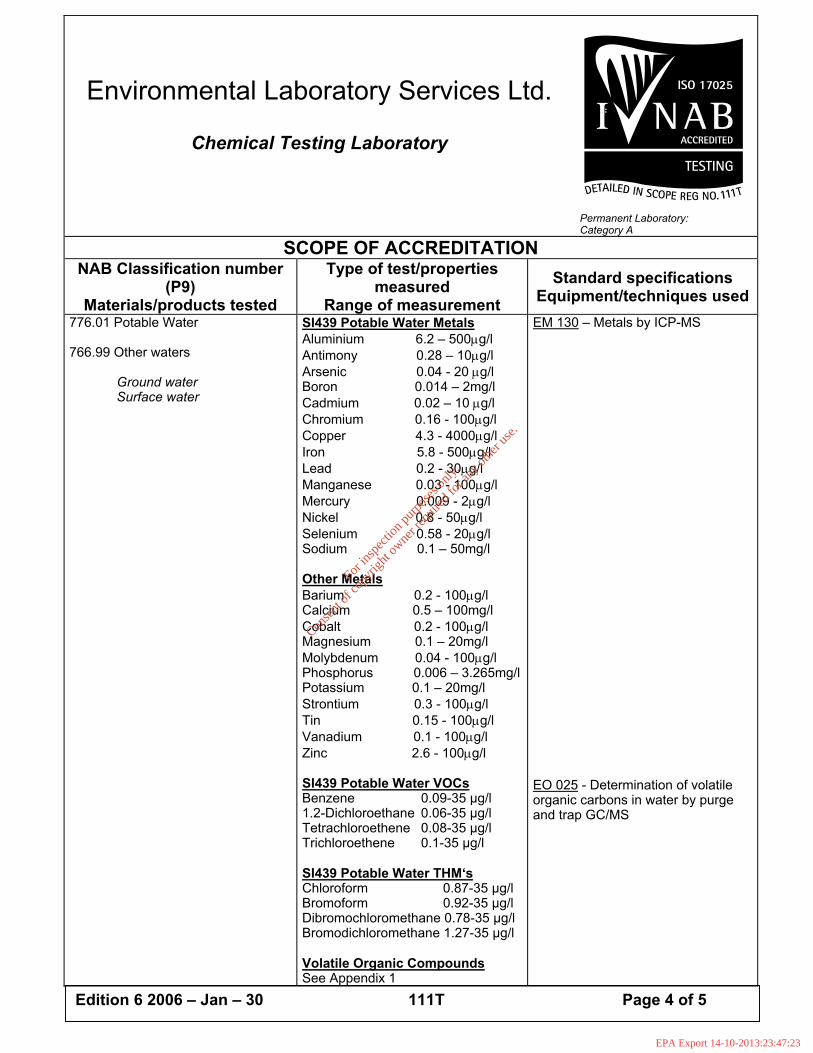
Edition 6 2006 – Jan – 30 111T Page 4 of 5
Environmental Laboratory Services Ltd.
Chemical Testing Laboratory
Permanent Laboratory:Category A
SCOPE OF ACCREDITATIONNAB Classification number
(P9)Materials/products tested
Type of test/propertiesmeasured
Range of measurementStandard specifications
Equipment/techniques used776.01 Potable Water
766.99 Other waters
Ground waterSurface water
SI439 Potable Water MetalsAluminium 6.2 – 500µg/lAntimony 0.28 – 10µg/lArsenic 0.04 - 20 µg/lBoron 0.014 – 2mg/lCadmium 0.02 – 10 µg/lChromium 0.16 - 100µg/lCopper 4.3 - 4000µg/lIron 5.8 - 500µg/lLead 0.2 - 30µg/lManganese 0.03 - 100µg/lMercury 0.009 - 2µg/lNickel 0.8 - 50µg/lSelenium 0.58 - 20µg/lSodium 0.1 – 50mg/l
Other MetalsBarium 0.2 - 100µg/lCalcium 0.5 – 100mg/lCobalt 0.2 - 100µg/lMagnesium 0.1 – 20mg/lMolybdenum 0.04 - 100µg/lPhosphorus 0.006 – 3.265mg/lPotassium 0.1 – 20mg/lStrontium 0.3 - 100µg/lTin 0.15 - 100µg/lVanadium 0.1 - 100µg/lZinc 2.6 - 100µg/l
SI439 Potable Water VOCsBenzene 0.09-35 µg/l1.2-Dichloroethane 0.06-35 µg/lTetrachloroethene 0.08-35 µg/lTrichloroethene 0.1-35 µg/l
SI439 Potable Water THM‘sChloroform 0.87-35 µg/lBromoform 0.92-35 µg/lDibromochloromethane 0.78-35 µg/lBromodichloromethane 1.27-35 µg/l
Volatile Organic CompoundsSee Appendix 1
EM 130 – Metals by ICP-MS
EO 025 - Determination of volatileorganic carbons in water by purgeand trap GC/MS
For
insp
ectio
n pur
pose
s only
.
Conse
nt of
copy
right
owne
r req
uired
for a
ny ot
her u
se.
EPA Export 14-10-2013:23:47:23

Edition 6 2006 – Jan – 30 111T Page 5 of 5
Environmental Laboratory Services Ltd.
Chemical Testing Laboratory
Permanent Laboratory:Category A
Appendix 1VOLATILE ORGANIC COMPOUNDS
No.
Analyte Range No.
Analyte Range
6 Bromomethane 0.09 - 35ug/l 51 13 Dichloropropane 0.06 - 35
ug/l
9 Ethyl Ether/Diethyl Ether 0.12 - 35 ug/l 52 2 Hexanone 0.79 - 35ug/l
10 11 Dichloroethene 0.15 - 35 ug/l 54 12 Dibromoethane 0.07 - 35ug/l
12 Iodomethane/Mehyl Iodide 0.06 - 35ug/l 55 Chlorobenzene 0.08 - 35
ug/l
13 Carbon Disulphide 0.07 - 35ug/l 56 1112
Tetrachloroethane1.27 - 35
ug/l
14 Allyl Chloride 0.14 - 35 ug/l 57 Ethyl Benzene 0.10 - 35ug/l
15 Methylene Chloride/DCM 2.33 - 35 ug/l 58 m & p Xylene 0.09 - 35ug/l
16 2-Propenenitrile/Acrylonitrile 1.76 - 35 ug/l 59 O Xylene 0.10 - 35
ug/l
17 ChlormethylCyanide/Chloroacetonitrile 0.04 - 35 ug/l 60 Stryene 1.64 - 35
ug/l
20 Hexachlorobutadiene 0.08 - 35 ug/l 62 Isopropyl Benzene 0.10 - 35ug/l
21 Trans-1,2 Dichloroethene 0.10 - 35 ug/l 63 Bromobenzene 0.07 - 35ug/l
22 MtBE 0.05 - 35 ug/l 64 1122Tetrachloroethane
0.06 - 35ug/l
23 11 Dichloroethane 0.09 - 35 ug/l 65 123 Trichloropropane 1.28 - 35ug/l
24 22 Dichloropropane 0.07 - 35 ug/l 67 Propyl Benzene 0.11 - 35ug/l
25 Cis-12 Dichloroethene 0.07 - 35 ug/l 68 2-Chlorotoluene 0.11 - 35ug/l
27 Methyl Acrylate 2.06 - 35 ug/l 69 4 Chlorotoluene 0.08 - 35ug/l
28 Bromochloromethane 0.07 - 35 ug/l 70 135Trimenthylbenzene
0.10 - 35ug/l
30 Tetrahydrofuran 2.83 - 35 ug/l 71 Tert Butyl Benzene 0.09 - 35ug/l
32 111 Trichloroethane 0.08 - 35 ug/l 72 124 Trimethlbenzene 0.09 - 35ug/l
33 1-Chlorobutane 0.08 - 35 ug/l 73 Sec Butyl Benzene 0.11 - 35ug/l
34 Carbon Tetrachloride 0.08 - 35 ug/l 74 13 Dichlorobenzene 0.09 - 35ug/l
35 11 Dichloropropene 0.10 - 35 ug/l 75 P Isopropyltoluene 0.12 - 35ug/l
40 12 Dichloropropane 0.08 - 35 ug/l 76 14 Dichlorobenzene 0.09 - 35
For
insp
ectio
n pur
pose
s only
.
Conse
nt of
copy
right
owne
r req
uired
for a
ny ot
her u
se.
EPA Export 14-10-2013:23:47:23
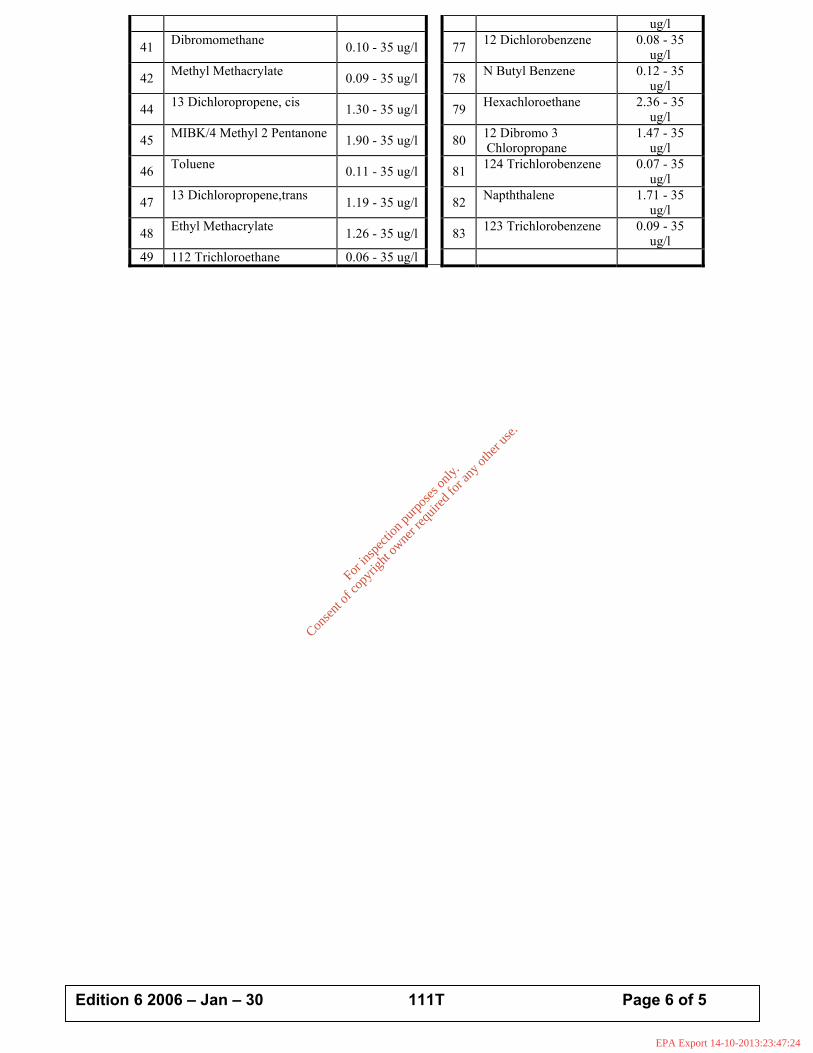
Edition 6 2006 – Jan – 30 111T Page 6 of 5
ug/l
41 Dibromomethane 0.10 - 35 ug/l 77 12 Dichlorobenzene 0.08 - 35ug/l
42 Methyl Methacrylate 0.09 - 35 ug/l 78 N Butyl Benzene 0.12 - 35ug/l
44 13 Dichloropropene, cis 1.30 - 35 ug/l 79 Hexachloroethane 2.36 - 35ug/l
45 MIBK/4 Methyl 2 Pentanone 1.90 - 35 ug/l 80 12 Dibromo 3 Chloropropane
1.47 - 35ug/l
46 Toluene 0.11 - 35 ug/l 81 124 Trichlorobenzene 0.07 - 35ug/l
47 13 Dichloropropene,trans 1.19 - 35 ug/l 82 Napththalene 1.71 - 35ug/l
48 Ethyl Methacrylate 1.26 - 35 ug/l 83 123 Trichlorobenzene 0.09 - 35ug/l
49 112 Trichloroethane 0.06 - 35 ug/l
For
insp
ectio
n pur
pose
s only
.
Conse
nt of
copy
right
owne
r req
uired
for a
ny ot
her u
se.
EPA Export 14-10-2013:23:47:24

For
insp
ectio
n pur
pose
s only
.
Conse
nt of
copy
right
owne
r req
uired
for a
ny ot
her u
se.
EPA Export 14-10-2013:23:47:24

For
insp
ectio
n pur
pose
s only
.
Conse
nt of
copy
right
owne
r req
uired
for a
ny ot
her u
se.
EPA Export 14-10-2013:23:47:24

For
insp
ectio
n pur
pose
s only
.
Conse
nt of
copy
right
owne
r req
uired
for a
ny ot
her u
se.
EPA Export 14-10-2013:23:47:24

For
insp
ectio
n pur
pose
s only
.
Conse
nt of
copy
right
owne
r req
uired
for a
ny ot
her u
se.
EPA Export 14-10-2013:23:47:24

For
insp
ectio
n pur
pose
s only
.
Conse
nt of
copy
right
owne
r req
uired
for a
ny ot
her u
se.
EPA Export 14-10-2013:23:47:24

For
insp
ectio
n pur
pose
s only
.
Conse
nt of
copy
right
owne
r req
uired
for a
ny ot
her u
se.
EPA Export 14-10-2013:23:47:24

For
insp
ectio
n pur
pose
s only
.
Conse
nt of
copy
right
owne
r req
uired
for a
ny ot
her u
se.
EPA Export 14-10-2013:23:47:24

E.4. Purcellsinch WWTP Test Results 01-11-2006 to 31-10-2007 E.4 Summary - Purcellsinch WWTP Test Results
E.4.1 Tests Results From Purcelsinch WWTP:
COD
BOD
Suspended Solids
pH & Temperature
Ammonia
Nitrites
Nitrates
Total Phosphate
Total Nitrogen
For in
spec
tion p
urpo
ses o
nly.
Conse
nt of
copy
right
owne
r req
uired
for a
ny ot
her u
se.
EPA Export 14-10-2013:23:47:24

Section E.4. Page 1 of 3
E.4 Sampling Data
The Urban Waste Water Treatment Regulations, 2001 – 2004 (UWWTR) prescribe
requirements for infrastructure provision, monitoring frequency and discharge limit
standards with respect to waste water treatment plants. In particular the following is of
note with respect to the information sought for this application.
Article 3 of the UWWTR prescribes the provision of a collection system for urban waste
water, on the commencement of the Regulations (2001), for every agglomeration with a
population equivalent in excess of 15000. Thereafter the First Schedule requires that such
collection systems shall be undertaken in accordance with the best technical knowledge
not entailing excessive costs having regard to;
a) the prevention of leaks
b) the volume and characteristics of the urban waste water
c) limitation of pollution of receiving waters due to storm water overflows
Section B.1 details the extent of the collection system with respect to PWWTP. As
illustrated in Section B.5 there are 21 Storm Water Overflows associated with the
PWWTP collection system. No data is at hand at the date of making this application to
illustrate the performance of these storm water overflows with respect to the requirements
of the Department of the Environment’s Procedures and Criteria in relation to Storm
Water Overflows issued subsequent to the Urban Waste Water Treatment Directive
(91/271/EEC).
Article 4 of the UWWTR prescribes the provision of treatment plants for waste waters
entering collection systems, on commencement of the Regulations, in respect of all
discharges from agglomerations with a population equivalent in excess of 10,000
discharging into Sensitive Areas, as defined in the Third Schedule, of which the River
Nore downstream of the PWWTP discharge to Inistioge Bridge is included. Such a
treatment plant is in place and the following points serve as an assessment of the plant
with regard to the discharge standards required from such plants.
For
insp
ectio
n pur
pose
s only
.
Conse
nt of
copy
right
owne
r req
uired
for a
ny ot
her u
se.
EPA Export 14-10-2013:23:47:24

Section E.4. Page 2 of 3
In accordance with the requirements of Part 1 of the Second Schedule the discharge from
PWWTP is required to demonstrate the following discharge characteristics;
BOD5 at 20 degrees C 25mg/l (Minimum Percentage Reduction 70 – 90)
COD 125mg/l (Minimum Percentage Reduction 75)
Total Suspended Solids 35mg/l (Minimum Percentage Reduction 90)
Total Phosphorus 2mg/l (Minimum Percentage Reduction 80)
Total Nitrogen 15mg/l (Minimum Percentage Reduction 70 – 80)
The UWWTR further prescribe a minimum annual number of samples of 24 for a plant
size of 50,000 population equivalent or greater.
Attachment E.4.1 contains details of the samples analysed in the period between 1st
November, 2006 and 31st October, 2007. A summary of the analyses undertaken is
detailed in the table below which illustrates that the number of samples taken exceeds the
requirements of the UWWTR.
SS BOD COD Total N Total P mg/l mg/l mg/l mg/L N mg/l P Average 31.73 18.67 62.72 4.65 5.50 Max 400.00 201.00 454.00 32.00 8.71 Min 0.00 2.00 1.00 0.20 0.95 No. of Samples Taken 359 168 361 54 29 Compliant Samples 280 139 324 50 1
Non Compliant 79 29 37 4 28
For
insp
ectio
n pur
pose
s only
.
Conse
nt of
copy
right
owne
r req
uired
for a
ny ot
her u
se.
EPA Export 14-10-2013:23:47:24

Section E.4. Page 3 of 3
The Table below summarises the exceedances encountered and identifies those which
were attributed to loadings in excess of the design capacity of the plant:
Parameter Samples Taken
Total Samples Non-Compliant
Samples non-compliant due to Exceedances of Design Criteria at Inlet
BOD5 168 29 11
COD 361 37 10 Suspended Solids 359 79 20
Furthermore specific site maintenance works were carried out on the following dates
which serve to account for exceedances in discharge standards:
09th to 18th January 2007 – Maintenance on Return Activated Sludge Bellmouths
01st to 05th February 2007 – Replacement of scraper blades in both final clarifiers
09th to 13th August 2007 – Cleaning of Aeration Basin No. 1
23rd to 27th August 2007 - Cleaning of Aeration Basin No. 2
For
insp
ectio
n pur
pose
s only
.
Conse
nt of
copy
right
owne
r req
uired
for a
ny ot
her u
se.
EPA Export 14-10-2013:23:47:25

E.4.1 Tests Results From Purcelsinch WWTP
For
insp
ectio
n pur
pose
s only
.
Conse
nt of
copy
right
owne
r req
uired
for a
ny ot
her u
se.
EPA Export 14-10-2013:23:47:25

Purcellsinch WWTP Tests Results01-11-2006 to 31-10-2007
Day Date Q - Flow PE Inlet Plant OutletPlant & Storm Outlet
% Reduction Inlet Plant OutletPlant & Storm Outlet
% Reduction InletPlant & Storm Outlet
% Reduction
Wednesday 01 November 2006 8138 79283 255 315Thursday 02 November 2006 10580 100983 45 39Friday 03 November 2006 12893 96750 8 26Saturday 04 November 2006 10564 88583 7 22Sunday 05 November 2006 10363 114550 5 76Monday 06 November 2006 11636 101550 54 62Tuesday 07 November 2006 10875 107100 23 29Wednesday 08 November 2006 11011 92933 11 21Thursday 09 November 2006 11759 106300 62 90Friday 10 November 2006 10920 101217 7 27Saturday 11 November 2006 10594 89983 3 25Sunday 12 November 2006 10734 128767 11 22Monday 13 November 2006 9792 86600 9 31Tuesday 14 November 2006 10571 112583 47 110Wednesday 15 November 2006 12046 96767 56 152Thursday 16 November 2006 12465 55283 15 50Friday 17 November 2006 12034 84333 6 31Saturday 18 November 2006 11757 108150 2 28Sunday 19 November 2006 14665 121083 27 108Monday 20 November 2006 13810 60567 12 17Tuesday 21 November 2006 6 64Wednesday 22 November 2006 12722 94783 52 112Thursday 23 November 2006 12113 70683 11 49Friday 24 November 2006 11804 82800 18 61Saturday 25 November 2006 11846 89083 6 22Sunday 26 November 2006 11710 63783 30 98Monday 27 November 2006 14117 62667 40 46Tuesday 28 November 2006 13326 67200 7 38Wednesday 29 November 2006 12382 90700 10 58Thursday 30 November 2006 13938 78317 127 219
For Sample Point Locations please refer to Drawing C.1.1Inlet - Sample Point No. 7Plant Outlet - Sample Point No. 3Plant & Storm Outlet - Sample Point No. 4
Inle
t Com
posit
e Sa
mpl
er O
ut o
f Ord
er
RED Text MEANS The Figure has exceeded lower
discharge limits
Blue Text MEANS The Figure has exceeded upper
discharge limits
Inle
t Com
posit
e Sa
mpl
er O
ut o
f Ord
er
BOD Values mg/l BODCOD Values mg/l CODSS Values mg/lCapacity Data
Section E.4. Page 1
For
insp
ectio
n pur
pose
s only
.
Conse
nt of
copy
right
owne
r req
uired
for a
ny ot
her u
se.
EPA Export 14-10-2013:23:47:25

Purcellsinch WWTP Tests Results01-11-2006 to 31-10-2007
Day Date Q - Flow PE Inlet Plant OutletPlant & Storm Outlet
% Reduction Inlet Plant OutletPlant & Storm Outlet
% Reduction InletPlant & Storm Outlet
% Reduction
BOD Values mg/l BODCOD Values mg/l CODSS Values mg/lCapacity Data
Friday 01 December 2006 12705 53867 8 32Saturday 02 December 2006 13115 84850 29 100Sunday 03 December 2006 13977 46600 32 73Monday 04 December 2006 12735 11 65Tuesday 05 December 2006 14072 20 47Wednesday 06 December 2006 13730 27 67Thursday 07 December 2006 14216 32 110Friday 08 December 2006 13339 64983 18 17Saturday 09 December 2006 13045 99683 17 22Sunday 10 December 2006 13527 73633 28 39Monday 11 December 2006 13564 65342 24 77Tuesday 12 December 2006 13913 71542 49 61Wednesday 13 December 2006 13877 79100 33 57Thursday 14 December 2006 13556 81908 28 45Friday 15 December 2006 14272 61067 44 60Saturday 16 December 2006 14711 71100 30 40Sunday 17 December 2006 14484 93342 17 16Monday 18 December 2006 15238 77217 20 24Tuesday 19 December 2006 14208 73333 6 5Wednesday 20 December 2006 11647 68350 155 67 57 536 108 80Thursday 21 December 2006 11940 57722 175 151 14 631 221 65Friday 22 December 2006 12587 99634 255 60 76 659 76 88Saturday 23 December 2006 12400 98813 205 20 90 691 166 76Sunday 24 December 2006 12402 65227 130 30 77 437 178 59Monday 25 December 2006 11131 38437 70 10 86 384 202 47Tuesday 26 December 2006 10686 33494 95 130 -37 452 83 82Wednesday 27 December 2006 12497 44482 85 85 0 570 269 53Thursday 28 December 2006 10867 58886 270 78 71 609 58 90Friday 29 December 2006 12950 64669 185 80 57 416 147 65Saturday 30 December 2006 12442 57505 155 40 74 230 29 87Sunday 31 December 2006 12944 61201 290 50 83 679 39 94
For Sample Point Locations please refer to Drawing C.1.1Inlet - Sample Point No. 7Plant Outlet - Sample Point No. 3Plant & Storm Outlet - Sample Point No. 4
Blue Text MEANS The Figure has exceeded upper
discharge limits
RED Text MEANS The Figure has exceeded lower
discharge limits
Inle
t Com
posit
e Sa
mpl
er O
ut o
f Ord
er
Inle
t Com
posit
e Sa
mpl
er O
ut o
f Ord
er
Section E.4. Page 2
For
insp
ectio
n pur
pose
s only
.
Conse
nt of
copy
right
owne
r req
uired
for a
ny ot
her u
se.
EPA Export 14-10-2013:23:47:25

Purcellsinch WWTP Tests Results01-11-2006 to 31-10-2007
Day Date Q - Flow PE Inlet Plant OutletPlant & Storm Outlet
% Reduction Inlet Plant OutletPlant & Storm Outlet
% Reduction InletPlant & Storm Outlet
% Reduction
BOD Values mg/l BODCOD Values mg/l CODSS Values mg/lCapacity Data
Monday 01 January 2007 12436 270 30 97 64 456 111 121 73Tuesday 02 January 2007 12216 70089 190 22 118 38 499 97 114 77Wednesday 03 January 2007 11208 65497 255 29 68 73 652 65 107 84Thursday 04 January 2007 11514 78295 180 27 81 55 562 83 134 76Friday 05 January 2007 12252 84615 140 125 117 16 838 135 118 86 360 52 86Saturday 06 January 2007 11978 52815 155 15 41 74 438 17 46 89 185 3 98Sunday 07 January 2007 11114 62586 170 9 31 82 403 10 36 91 105 7 93Monday 08 January 2007 10810 180 55 58 68 467 101 135 71 296 86 71Tuesday 09 January 2007 9632 250 55 46 82 703 350 334 52 444 201 55Wednesday 10 January 2007 9997 280 240 125 55 586 277 224 62 398 152 62Thursday 11 January 2007 10821 155 395 400 -158 399 97 99 75 560 68 88Friday 12 January 2007 11979 57911 170 110 110 35 488 187 191 61 615 136 78Saturday 13 January 2007 12303 69281 195 135 155 21 543 203 249 54 605 174 71Sunday 14 January 2007 12764 58994 165 170 195 -18 498 392 311 38 505 99 80Monday 15 January 2007 10936 62654 240 123 115 52 550 159 188 66 589 176 70Tuesday 16 January 2007 10854 58566 170 275 100 518 356 226 72 68Wednesday 17 January 2007 10953 49745 280 170 95 66 436 169 185 58 219 39 82Thursday 18 January 2007 12568 74099 325 120 125 62 566 156 173 69 162 17 90Friday 19 January 2007 12571 86382 190 34 51 73 803 45 65 92 175 3 98Saturday 20 January 2007 13160 91630 235 52 61 74 483 71 99 80 155 15 90Sunday 21 January 2007 13172 62863 350 33 47 87 876 63 102 88 172 3 98Monday 22 January 2007 12913 90064 305 17 19 94 557 40 64 89 174 3 98Tuesday 23 January 2007 12764 104046 380 35 39 90 683 59 95 86 215 3 99Wednesday 24 January 2007 14053 109588 220 36 35 84 567 65 54 90 128 13 90Thursday 25 January 2007 14389 164402 405 16 15 96 1161 42 54 95 599 25 96Friday 26 January 2007 14029 164696 230 23 20 91 574 100 66 89 532 27 95Saturday 27 January 2007 12776 121084 250 130 127 49 628 135 174 72 391 53 86Sunday 28 January 2007 11038 87968 280 22 34 88 531 72 48 91 404 34 92Monday 29 January 2007 12245 102421 155 26 26 83 590 50 62 89 402 25 94Tuesday 30 January 2007 13820 103917 255 80 77 70 563 117 123 78 362 30 92Wednesday 31 January 2007 12765 99317 190 10 15 92 619 54 38 94 334 16 95
For Sample Point Locations please refer to Drawing C.1.1Inlet - Sample Point No. 7Plant Outlet - Sample Point No. 3Plant & Storm Outlet - Sample Point No. 4
RED Text MEANS The Figure has exceeded lower
discharge limits
Blue Text MEANS The Figure has exceeded upper
discharge limits
Section E.4. Page 3
For
insp
ectio
n pur
pose
s only
.
Conse
nt of
copy
right
owne
r req
uired
for a
ny ot
her u
se.
EPA Export 14-10-2013:23:47:25
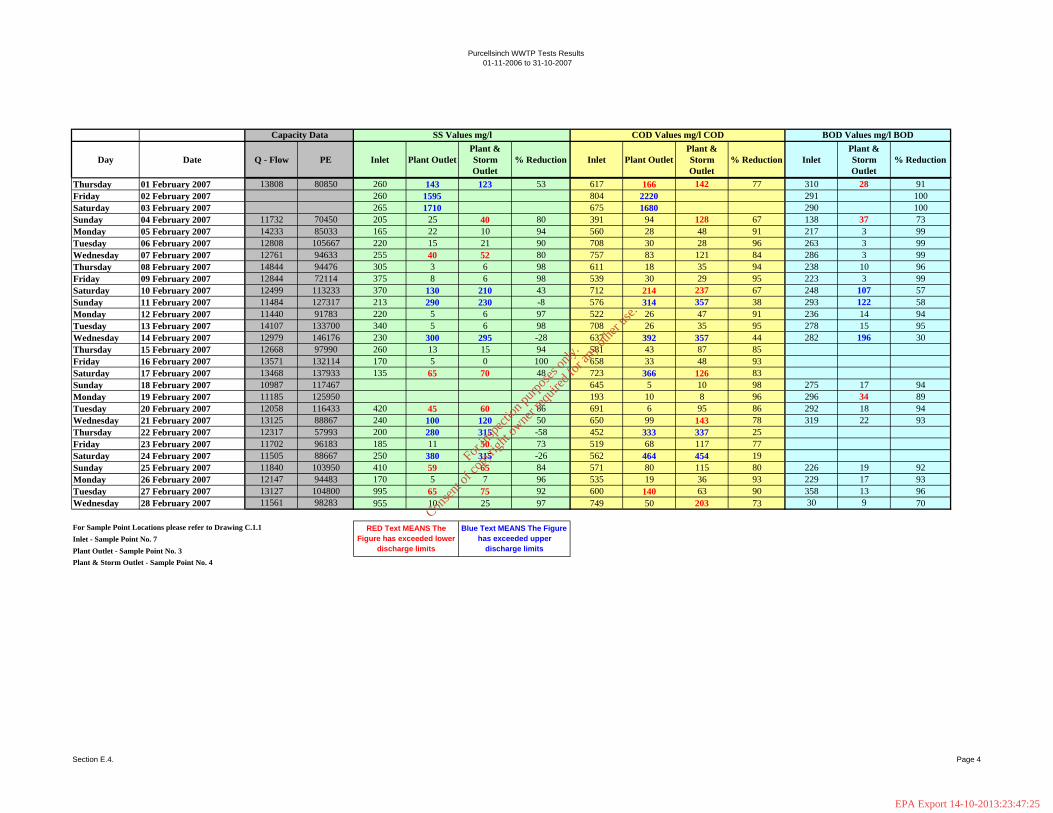
Purcellsinch WWTP Tests Results01-11-2006 to 31-10-2007
Day Date Q - Flow PE Inlet Plant OutletPlant & Storm Outlet
% Reduction Inlet Plant OutletPlant & Storm Outlet
% Reduction InletPlant & Storm Outlet
% Reduction
BOD Values mg/l BODCOD Values mg/l CODSS Values mg/lCapacity Data
Thursday 01 February 2007 13808 80850 260 143 123 53 617 166 142 77 310 28 91Friday 02 February 2007 260 1595 804 2220 291 100Saturday 03 February 2007 265 1710 675 1680 290 100Sunday 04 February 2007 11732 70450 205 25 40 80 391 94 128 67 138 37 73Monday 05 February 2007 14233 85033 165 22 10 94 560 28 48 91 217 3 99Tuesday 06 February 2007 12808 105667 220 15 21 90 708 30 28 96 263 3 99Wednesday 07 February 2007 12761 94633 255 40 52 80 757 83 121 84 286 3 99Thursday 08 February 2007 14844 94476 305 3 6 98 611 18 35 94 238 10 96Friday 09 February 2007 12844 72114 375 8 6 98 539 30 29 95 223 3 99Saturday 10 February 2007 12499 113233 370 130 210 43 712 214 237 67 248 107 57Sunday 11 February 2007 11484 127317 213 290 230 -8 576 314 357 38 293 122 58Monday 12 February 2007 11440 91783 220 5 6 97 522 26 47 91 236 14 94Tuesday 13 February 2007 14107 133700 340 5 6 98 708 26 35 95 278 15 95Wednesday 14 February 2007 12979 146176 230 300 295 -28 637 392 357 44 282 196 30Thursday 15 February 2007 12668 97990 260 13 15 94 581 43 87 85Friday 16 February 2007 13571 132114 170 5 0 100 658 33 48 93Saturday 17 February 2007 13468 137933 135 65 70 48 723 366 126 83Sunday 18 February 2007 10987 117467 645 5 10 98 275 17 94Monday 19 February 2007 11185 125950 193 10 8 96 296 34 89Tuesday 20 February 2007 12058 116433 420 45 60 86 691 6 95 86 292 18 94Wednesday 21 February 2007 13125 88867 240 100 120 50 650 99 143 78 319 22 93Thursday 22 February 2007 12317 57993 200 280 315 -58 452 333 337 25Friday 23 February 2007 11702 96183 185 11 50 73 519 68 117 77Saturday 24 February 2007 11505 88667 250 380 315 -26 562 464 454 19Sunday 25 February 2007 11840 103950 410 59 65 84 571 80 115 80 226 19 92Monday 26 February 2007 12147 94483 170 5 7 96 535 19 36 93 229 17 93Tuesday 27 February 2007 13127 104800 995 65 75 92 600 140 63 90 358 13 96Wednesday 28 February 2007 11561 98283 955 10 25 97 749 50 203 73 30 9 70
For Sample Point Locations please refer to Drawing C.1.1Inlet - Sample Point No. 7Plant Outlet - Sample Point No. 3Plant & Storm Outlet - Sample Point No. 4
RED Text MEANS The Figure has exceeded lower
discharge limits
Blue Text MEANS The Figure has exceeded upper
discharge limits
Section E.4. Page 4
For
insp
ectio
n pur
pose
s only
.
Conse
nt of
copy
right
owne
r req
uired
for a
ny ot
her u
se.
EPA Export 14-10-2013:23:47:25

Purcellsinch WWTP Tests Results01-11-2006 to 31-10-2007
Day Date Q - Flow PE Inlet Plant OutletPlant & Storm Outlet
% Reduction Inlet Plant OutletPlant & Storm Outlet
% Reduction InletPlant & Storm Outlet
% Reduction
BOD Values mg/l BODCOD Values mg/l CODSS Values mg/lCapacity Data
Thursday 01 March 2007 12339 96283 930 30 5 99 1269 9 20 98Friday 02 March 2007 12792 178917 575 20 45 92 557 6 48 91Saturday 03 March 2007 11999 193833 315 85 45 86 554 492 68 88Sunday 04 March 2007 12177 156367 275 10 30 89 463 24 72 84 328 20 94Monday 05 March 2007 12662 94867 185 4 32 83 433 26 68 84 181 19 90Tuesday 06 March 2007 13292 65450 250 26 37 85 627 68 90 86 277 20 93Wednesday 07 March 2007 13150 84233 275 3 9 97 604 25 29 95 292 18 94Thursday 08 March 2007 13391 81483 290 3 7 98 594 24 61 90Friday 09 March 2007 12970 104483 225 2 6 97 590 27 39 93Saturday 10 March 2007 13189 95417 225 34 47 79 598 74 82 86Sunday 11 March 2007 13250 102783 255 40 58 77 609 68 133 78 277 12 96Monday 12 March 2007 13681 81350 175 4 4 98 578 53 37 94 331 10 97Tuesday 13 March 2007 14011 90300 155 3 4 97 526 26 23 96 268 11 96Wednesday 14 March 2007 13515 77083 170 5 7 96 431 21 22 95 258 12 95Thursday 15 March 2007 12141 75067 195 2 8 96 661 28 20 97Friday 16 March 2007 12190 97983 220 3 2 99 734 29 33 96Saturday 17 March 2007 12433 99917 230 2 2 99 658 33 53 92Sunday 18 March 2007 13434 106500 210 2 2 99 696 37 26 96 295 3 99Monday 19 March 2007 12687 100683 260 3 2 99 708 44 44 94 332 12 96Tuesday 20 March 2007 13526 104297 340 4 3 99 896 18 31 97 289 11 96Wednesday 21 March 2007 12424 98745 305 7 6 98 763 50 38 95 316 7 98Thursday 22 March 2007 13762 115113 345 3 4 99 803 8 31 96Friday 23 March 2007 13573 107367 255 8 4 98 745 16 9 99Saturday 24 March 2007 13270 90767 275 3 5 98 845 3 3 100Sunday 25 March 2007 11118 90033 175 4 3 98 645 11 9 99Monday 26 March 2007 12776 102850 225 4 6 97 616 29 39 94Tuesday 27 March 2007 13839 115383 365 10 9 98 722 36 25 97 273 9 97Wednesday 28 March 2007 13609 104567 255 10 17 93 600 27 40 93 222 11 95Thursday 29 March 2007 15249 115867 305 5 7 98 736 49 56 92Friday 30 March 2007 13468 67621 170 2 2 99 482 23 18 96Saturday 31 March 2007 10846 82362 220 4 2 99 729 36 39 95
For Sample Point Locations please refer to Drawing C.1.1Inlet - Sample Point No. 7Plant Outlet - Sample Point No. 3Plant & Storm Outlet - Sample Point No. 4
RED Text MEANS The Figure has exceeded lower
discharge limits
Blue Text MEANS The Figure has exceeded upper
discharge limits
Section E.4. Page 5
For
insp
ectio
n pur
pose
s only
.
Conse
nt of
copy
right
owne
r req
uired
for a
ny ot
her u
se.
EPA Export 14-10-2013:23:47:25

Purcellsinch WWTP Tests Results01-11-2006 to 31-10-2007
Day Date Q - Flow PE Inlet Plant OutletPlant & Storm Outlet
% Reduction Inlet Plant OutletPlant & Storm Outlet
% Reduction InletPlant & Storm Outlet
% Reduction
BOD Values mg/l BODCOD Values mg/l CODSS Values mg/lCapacity Data
Sunday 01 April 2007 12221 93822 345 2 7 98 737 33 22 97 245 10 96Monday 02 April 2007 12232 96200 240 5 3 99 755 51 51 93 238 12 95Tuesday 03 April 2007 12323 89727 150 3 7 95 699 42 56 92 244 13 95Wednesday 04 April 2007 11379 78112 255 6 6 98 659 54 51 92 242 11 95Thursday 05 April 2007 11876 109111 235 2 2 99 882 29 28 97Friday 06 April 2007 11418 69460 245 2 1 100 584 22 29 95Saturday 07 April 2007 11456 113150 270 5 2 99 768 26 28 96Sunday 08 April 2007 11435 99167 260 6 1 100 672 42 31 95 251 6 98Monday 09 April 2007 11728 116300 270 5 2 99 855 32 44 95 269 8 97Tuesday 10 April 2007 11867 107683 265 9 7 97 625 28 29 95 331 8 98Wednesday 11 April 2007 11149 110000 505 145 150 70 836 190 177 79 331 6 98Thursday 12 April 2007 11063 99850 275 5 6 98 708 7 19 97Friday 13 April 2007 11493 83324 260 9 8 97 696 29 24 97Saturday 14 April 2007 11391 111217 270 435 380 -41 699 528 450 36Sunday 15 April 2007 10487 93350 265 10 6 98 972 23 47 95 217 4 98Monday 16 April 2007 10452 113083 285 36 30 89 686 48 51 93 238 4 98Tuesday 17 April 2007 10545 103850 260 45 51 80 893 90 121 86 217 3 99Wednesday 18 April 2007 10033 109450 310 32 33 89 824 69 82 90 266 3 99Thursday 19 April 2007 11022 121767 285 29 31 89 868 75 88 90Friday 20 April 2007 10151 118200 275 14 14 95 733 58 78 89Saturday 21 April 2007 9731 90017 285 19 19 93 900 71 97 89Sunday 22 April 2007 10147 116550 325 19 19 94 884 43 103 88 226 29 87Monday 23 April 2007 11322 128150 375 60 72 81 848 103 149 82 293 29 90Tuesday 24 April 2007 11488 124150 350 7 31 91 995 39 130 87Wednesday 25 April 2007 11377 109933 240 46 41 83 642 72 86 87Thursday 26 April 2007 11203 132433 415 10 4 99 1089 28 24 98Friday 27 April 2007 11206 109683 410 6 6 99 948 48 29 97Saturday 28 April 2007 10458 102367 380 3 8 98 827 20 32 96Sunday 29 April 2007 11230 107367 11 12 27 37Monday 30 April 2007 10361 102567 360 1 9 98 804 23 65 92 242 3 99
For Sample Point Locations please refer to Drawing C.1.1Inlet - Sample Point No. 7Plant Outlet - Sample Point No. 3Plant & Storm Outlet - Sample Point No. 4
RED Text MEANS The Figure has exceeded lower
discharge limits
Blue Text MEANS The Figure has exceeded upper
discharge limits
Section E.4. Page 6
For
insp
ectio
n pur
pose
s only
.
Conse
nt of
copy
right
owne
r req
uired
for a
ny ot
her u
se.
EPA Export 14-10-2013:23:47:25

Purcellsinch WWTP Tests Results01-11-2006 to 31-10-2007
Day Date Q - Flow PE Inlet Plant OutletPlant & Storm Outlet
% Reduction Inlet Plant OutletPlant & Storm Outlet
% Reduction InletPlant & Storm Outlet
% Reduction
BOD Values mg/l BODCOD Values mg/l CODSS Values mg/lCapacity Data
Tuesday 01 May 2007 10264 104300 260 4 11 96 712 2 48 93 370 3 99Wednesday 02 May 2007 10256 84400 265 5 2 99 653 48 36 94 161 3 98Thursday 03 May 2007 11284 96117 225 2 1 100 749 23 26 97Friday 04 May 2007 10719 107450 270 1 5 98 681 22 60 91Saturday 05 May 2007 8505 90517 375 2 12 97 828 18 19 98Sunday 06 May 2007 9819 95767 295 4 15 95 838 31 48 94 381 3 99Monday 07 May 2007 9761 114417 290 5 12 96 880 33 17 98 316 3 99Tuesday 08 May 2007 11099 126667 355 4 9 97 770 29 30 96 139 3 98Wednesday 09 May 2007 11360 98250 210 3 7 97 715 9 28 96 122 3 98Thursday 10 May 2007 11319 112767 270 11 12 96 788 44 58 93Friday 11 May 2007 10989 106033 295 8 19 94 785 54 81 90Saturday 12 May 2007 10770 106483 405 1 9 98 890 31 50 94Sunday 13 May 2007 10226 116233 285 2 10 96 876 40 77 91 283 3 99Monday 14 May 2007 10956 109700 255 23 29 89 875 40 49 94 282 3 99Tuesday 15 May 2007 10538 102517 235 2 7 97 714 26 15 98 282 3 99Wednesday 16 May 2007 10823 100700 305 3 2 99 790 36 30 96 295 3 99Thursday 17 May 2007 10679 105683 293 7 7 98 726 15 24 97Friday 18 May 2007 10932 111217 295 1 9 97 735 21 72 90Saturday 19 May 2007 9868 107767 340 1 12 96 816 21 74 91Sunday 20 May 2007 10437 120850 260 2 9 97 755 30 71 91 368 3 99Monday 21 May 2007 10523 119167 405 5 2 100 903 88 41 95 366 3 99Tuesday 22 May 2007 10574 121167 315 2 2 99 899 4 7 99 342 3 99Wednesday 23 May 2007 10582 104550 305 5 5 98 667 29 23 97 324 3 99Thursday 24 May 2007 10625 112617 280 3 9 97 959 23 19 98Friday 25 May 2007 11117 99217 275 1 6 98 675 18 26 96Saturday 26 May 2007 10824 96917 355 8 16 95 779 27 40 95Sunday 27 May 2007 10071 101800 310 12 21 93 773 32 65 92 300 3 99Monday 28 May 2007 10106 100300 265 7 13 95 782 16 31 96 302 3 99Tuesday 29 May 2007 10325 115550 460 15 18 96 981 51 77 92 400 13 97Wednesday 30 May 2007 9806 107833 290 4 17 94 751 16 68 91 251 20 92Thursday 31 May 2007 9602 89867 280 3 32 89 673 3 36 95
For Sample Point Locations please refer to Drawing C.1.1Inlet - Sample Point No. 7Plant Outlet - Sample Point No. 3Plant & Storm Outlet - Sample Point No. 4
Blue Text MEANS The Figure has exceeded upper
discharge limits
RED Text MEANS The Figure has exceeded lower
discharge limits
Section E.4. Page 7
For
insp
ectio
n pur
pose
s only
.
Conse
nt of
copy
right
owne
r req
uired
for a
ny ot
her u
se.
EPA Export 14-10-2013:23:47:25

Purcellsinch WWTP Tests Results01-11-2006 to 31-10-2007
Day Date Q - Flow PE Inlet Plant OutletPlant & Storm Outlet
% Reduction Inlet Plant OutletPlant & Storm Outlet
% Reduction InletPlant & Storm Outlet
% Reduction
BOD Values mg/l BODCOD Values mg/l CODSS Values mg/lCapacity Data
Friday 01 June 2007 10426 91467 275 5 7 97 620 2 2 100Saturday 02 June 2007 9967 84767 230 5 29 87 476 2 2 100Sunday 03 June 2007 11675 86683 90 8 10 89 363 2 2 99 160 3 98Monday 04 June 2007 10389 90350 100 2 6 94 438 2 2 100 203 3 99Tuesday 05 June 2007 10997 120000 335 5 7 98 841 7 26 97 343 5 99Wednesday 06 June 2007 9330 90300 340 8 23 93 822 23 29 96 297 5 98Thursday 07 June 2007 9640 98967 295 3 7 98 776 36 21 97Friday 08 June 2007 11020 89767 245 6 6 98 624 32 23 96Saturday 09 June 2007 9760 89550 315 1 11 97 830 36 52 94Sunday 10 June 2007 10425 104500 295 44 7 98 770 111 30 96 356 3 99Monday 11 June 2007 10881 114983 295 9 15 95 799 8 9 99 428 4 99Tuesday 12 June 2007 11676 102833 270 4 6 98 813 10 11 99 337 3 99Wednesday 13 June 2007 10261 107367 350 7 11 97 809 27 56 93 430 4 99Thursday 14 June 2007 10995 91267 335 16 23 93 843 65 67 92Friday 15 June 2007 9490 73844 435 66 63 86 747 103 146 80Saturday 16 June 2007 8722 51151 205 2 13 94 563 30 45 92Sunday 17 June 2007 8884 78753 290 2 16 94 851 34 98 88 345 28 92Monday 18 June 2007 9666 80349 390 2 27 93 798 22 61 92 349 30 91Tuesday 19 June 2007 11827 60567 275 2 24 91 454 2 51 89Wednesday 20 June 2007 12055 56733 445 3 19 96 731 13 41 94Thursday 21 June 2007 12857 142783 275 6 14 95 565 30 59 90Friday 22 June 2007 12219 100433 305 1 17 94 447 2 13 97Saturday 23 June 2007 11018 94267 395 1 4 99 656 2 22 97Sunday 24 June 2007 13344 130400 390 2 8 98 565 17 45 92 289 3 99Monday 25 June 2007 12780 181600 350 2 2 99 880 7 19 98 124 3 98Tuesday 26 June 2007 12088 119617 225 9 5 98 676 4 4 99 312 5 98Wednesday 27 June 2007 10989 132483 115 5 10 91 544 21 18 97 308 5 98Thursday 28 June 2007 11711 140533 350 1 2 99 965 21 31 97Friday 29 June 2007 12094 119567 230 1 1 100 652 42 70 89Saturday 30 June 2007 13004 124317 305 3 4 99 767 70 73 90
For Sample Point Locations please refer to Drawing C.1.1Inlet - Sample Point No. 7Plant Outlet - Sample Point No. 3Plant & Storm Outlet - Sample Point No. 4
RED Text MEANS The Figure has exceeded lower
discharge limits
Blue Text MEANS The Figure has exceeded upper
discharge limits
Section E.4. Page 8
For
insp
ectio
n pur
pose
s only
.
Conse
nt of
copy
right
owne
r req
uired
for a
ny ot
her u
se.
EPA Export 14-10-2013:23:47:25
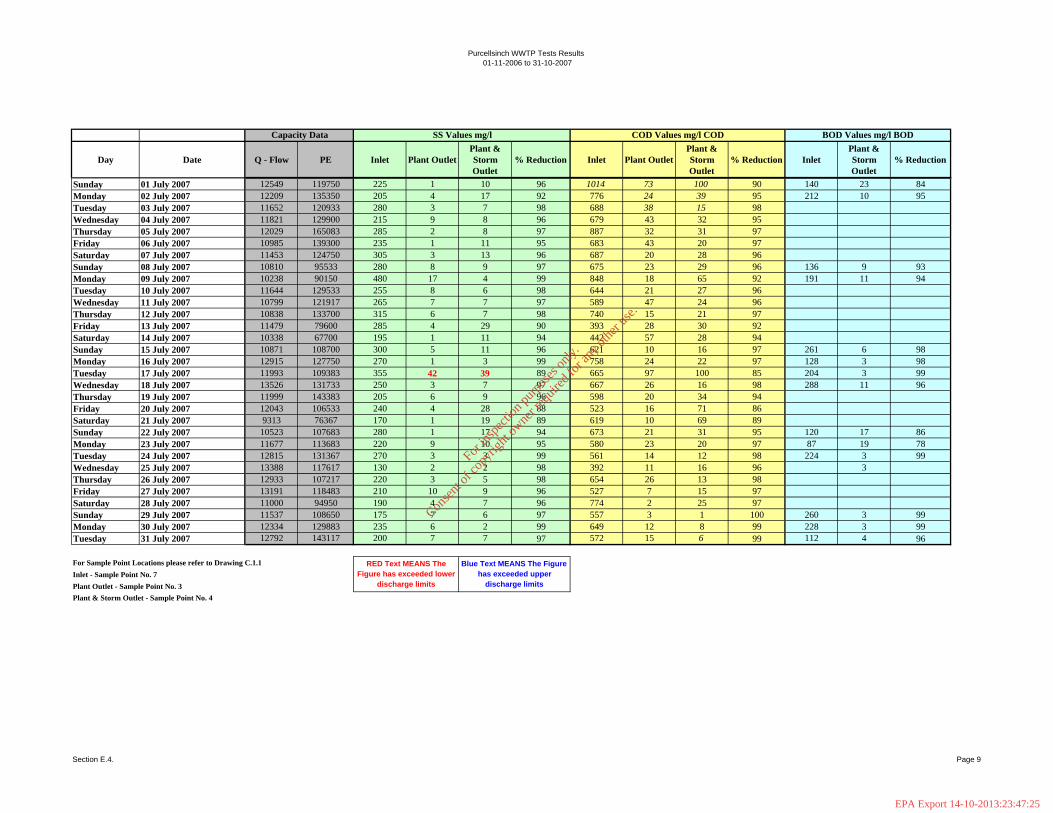
Purcellsinch WWTP Tests Results01-11-2006 to 31-10-2007
Day Date Q - Flow PE Inlet Plant OutletPlant & Storm Outlet
% Reduction Inlet Plant OutletPlant & Storm Outlet
% Reduction InletPlant & Storm Outlet
% Reduction
BOD Values mg/l BODCOD Values mg/l CODSS Values mg/lCapacity Data
Sunday 01 July 2007 12549 119750 225 1 10 96 1014 73 100 90 140 23 84Monday 02 July 2007 12209 135350 205 4 17 92 776 24 39 95 212 10 95Tuesday 03 July 2007 11652 120933 280 3 7 98 688 38 15 98Wednesday 04 July 2007 11821 129900 215 9 8 96 679 43 32 95Thursday 05 July 2007 12029 165083 285 2 8 97 887 32 31 97Friday 06 July 2007 10985 139300 235 1 11 95 683 43 20 97Saturday 07 July 2007 11453 124750 305 3 13 96 687 20 28 96Sunday 08 July 2007 10810 95533 280 8 9 97 675 23 29 96 136 9 93Monday 09 July 2007 10238 90150 480 17 4 99 848 18 65 92 191 11 94Tuesday 10 July 2007 11644 129533 255 8 6 98 644 21 27 96Wednesday 11 July 2007 10799 121917 265 7 7 97 589 47 24 96Thursday 12 July 2007 10838 133700 315 6 7 98 740 15 21 97Friday 13 July 2007 11479 79600 285 4 29 90 393 28 30 92Saturday 14 July 2007 10338 67700 195 1 11 94 442 57 28 94Sunday 15 July 2007 10871 108700 300 5 11 96 621 10 16 97 261 6 98Monday 16 July 2007 12915 127750 270 1 3 99 758 24 22 97 128 3 98Tuesday 17 July 2007 11993 109383 355 42 39 89 665 97 100 85 204 3 99Wednesday 18 July 2007 13526 131733 250 3 7 97 667 26 16 98 288 11 96Thursday 19 July 2007 11999 143383 205 6 9 96 598 20 34 94Friday 20 July 2007 12043 106533 240 4 28 88 523 16 71 86Saturday 21 July 2007 9313 76367 170 1 19 89 619 10 69 89Sunday 22 July 2007 10523 107683 280 1 17 94 673 21 31 95 120 17 86Monday 23 July 2007 11677 113683 220 9 10 95 580 23 20 97 87 19 78Tuesday 24 July 2007 12815 131367 270 3 3 99 561 14 12 98 224 3 99Wednesday 25 July 2007 13388 117617 130 2 2 98 392 11 16 96 3Thursday 26 July 2007 12933 107217 220 3 5 98 654 26 13 98Friday 27 July 2007 13191 118483 210 10 9 96 527 7 15 97Saturday 28 July 2007 11000 94950 190 4 7 96 774 2 25 97Sunday 29 July 2007 11537 108650 175 7 6 97 557 3 1 100 260 3 99Monday 30 July 2007 12334 129883 235 6 2 99 649 12 8 99 228 3 99Tuesday 31 July 2007 12792 143117 200 7 7 97 572 15 6 99 112 4 96
For Sample Point Locations please refer to Drawing C.1.1Inlet - Sample Point No. 7Plant Outlet - Sample Point No. 3Plant & Storm Outlet - Sample Point No. 4
RED Text MEANS The Figure has exceeded lower
discharge limits
Blue Text MEANS The Figure has exceeded upper
discharge limits
Section E.4. Page 9
For
insp
ectio
n pur
pose
s only
.
Conse
nt of
copy
right
owne
r req
uired
for a
ny ot
her u
se.
EPA Export 14-10-2013:23:47:25
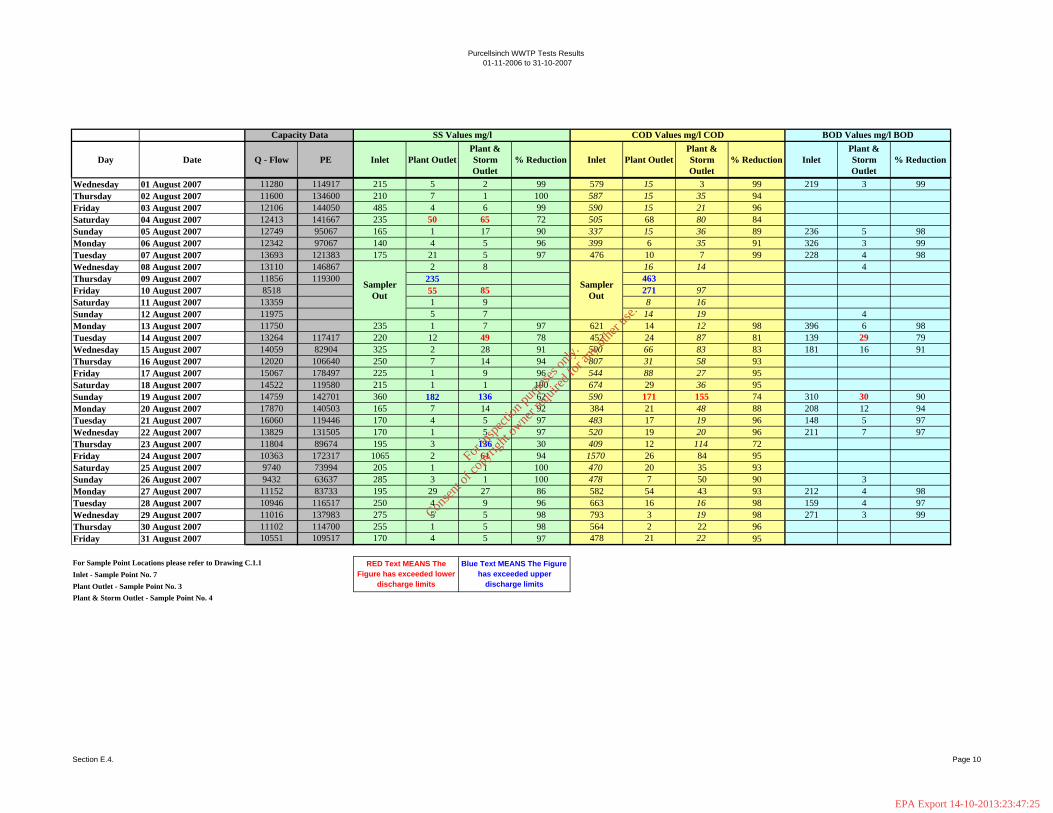
Purcellsinch WWTP Tests Results01-11-2006 to 31-10-2007
Day Date Q - Flow PE Inlet Plant OutletPlant & Storm Outlet
% Reduction Inlet Plant OutletPlant & Storm Outlet
% Reduction InletPlant & Storm Outlet
% Reduction
BOD Values mg/l BODCOD Values mg/l CODSS Values mg/lCapacity Data
Wednesday 01 August 2007 11280 114917 215 5 2 99 579 15 3 99 219 3 99Thursday 02 August 2007 11600 134600 210 7 1 100 587 15 35 94Friday 03 August 2007 12106 144050 485 4 6 99 590 15 21 96Saturday 04 August 2007 12413 141667 235 50 65 72 505 68 80 84Sunday 05 August 2007 12749 95067 165 1 17 90 337 15 36 89 236 5 98Monday 06 August 2007 12342 97067 140 4 5 96 399 6 35 91 326 3 99Tuesday 07 August 2007 13693 121383 175 21 5 97 476 10 7 99 228 4 98Wednesday 08 August 2007 13110 146867 2 8 16 14 4Thursday 09 August 2007 11856 119300 235 463Friday 10 August 2007 8518 55 85 271 97Saturday 11 August 2007 13359 1 9 8 16Sunday 12 August 2007 11975 5 7 14 19 4Monday 13 August 2007 11750 235 1 7 97 621 14 12 98 396 6 98Tuesday 14 August 2007 13264 117417 220 12 49 78 452 24 87 81 139 29 79Wednesday 15 August 2007 14059 82904 325 2 28 91 500 66 83 83 181 16 91Thursday 16 August 2007 12020 106640 250 7 14 94 807 31 58 93Friday 17 August 2007 15067 178497 225 1 9 96 544 88 27 95Saturday 18 August 2007 14522 119580 215 1 1 100 674 29 36 95Sunday 19 August 2007 14759 142701 360 182 136 62 590 171 155 74 310 30 90Monday 20 August 2007 17870 140503 165 7 14 92 384 21 48 88 208 12 94Tuesday 21 August 2007 16060 119446 170 4 5 97 483 17 19 96 148 5 97Wednesday 22 August 2007 13829 131505 170 1 5 97 520 19 20 96 211 7 97Thursday 23 August 2007 11804 89674 195 3 136 30 409 12 114 72Friday 24 August 2007 10363 172317 1065 2 61 94 1570 26 84 95Saturday 25 August 2007 9740 73994 205 1 1 100 470 20 35 93Sunday 26 August 2007 9432 63637 285 3 1 100 478 7 50 90 3Monday 27 August 2007 11152 83733 195 29 27 86 582 54 43 93 212 4 98Tuesday 28 August 2007 10946 116517 250 4 9 96 663 16 16 98 159 4 97Wednesday 29 August 2007 11016 137983 275 5 5 98 793 3 19 98 271 3 99Thursday 30 August 2007 11102 114700 255 1 5 98 564 2 22 96Friday 31 August 2007 10551 109517 170 4 5 97 478 21 22 95
For Sample Point Locations please refer to Drawing C.1.1Inlet - Sample Point No. 7Plant Outlet - Sample Point No. 3Plant & Storm Outlet - Sample Point No. 4
RED Text MEANS The Figure has exceeded lower
discharge limits
Blue Text MEANS The Figure has exceeded upper
discharge limits
Sampler Out
Sampler Out
Section E.4. Page 10
For
insp
ectio
n pur
pose
s only
.
Conse
nt of
copy
right
owne
r req
uired
for a
ny ot
her u
se.
EPA Export 14-10-2013:23:47:25

Purcellsinch WWTP Tests Results01-11-2006 to 31-10-2007
Day Date Q - Flow PE Inlet Plant OutletPlant & Storm Outlet
% Reduction Inlet Plant OutletPlant & Storm Outlet
% Reduction InletPlant & Storm Outlet
% Reduction
BOD Values mg/l BODCOD Values mg/l CODSS Values mg/lCapacity Data
Saturday 01 September 2007 11425 99173 4 7 35 48Sunday 02 September 2007 10467 83200 3 2 21 16 4Monday 03 September 2007 11010 87947 5 7 39 15 6Tuesday 04 September 2007 11217 88194 255 2 4 98 800 5 1 100 278 3 99Wednesday 05 September 2007 11186 75855 215 6 7 97 651 6 10 98 151 3 98Thursday 06 September 2007 10682 85011 240 2 4 98 764 20 21 97Friday 07 September 2007 11929 63497 235 7 10 96 511 39 16 97Saturday 08 September 2007 11017 69545 240 4 1 100 606 35 15 98Sunday 09 September 2007 10796 81420 250 5 11 96 724 24 41 94 368 3 99Monday 10 September 2007 10479 71279 235 3 1 100 653 31 16 98 314 6 98Tuesday 11 September 2007 11560 90313 230 2 5 98 750 36 40 95 517 100Wednesday 12 September 2007 10840 76445 250 1 5 98 677 15 25 96Thursday 13 September 2007 10857 81541 280 4 7 98 721 19 1 100Friday 14 September 2007 10720 80400 205 2 2 99 720 65 11 98Saturday 15 September 2007 10937 65736 185 1 5 97 577 18 1 100Sunday 16 September 2007 11076 73148 180 3 8 96 634 9 2 100 311 3 99Monday 17 September 2007 10830 71298 220 6 2 99 632 8 7 99 266 3 99Tuesday 18 September 2007 9365 59799 170 1 2 99 613 25 11 98 209 3 99Wednesday 19 September 2007 11559 81515 280 1 4 99 677 18 25 96 183 3 98Thursday 20 September 2007 9881 70196 295 2 16 95 682 22 40 94Friday 21 September 2007 12582 56933 240 4 3 99 564 9 14 98Saturday 22 September 2007 11949 81333 175 3 10 94 531 15 11 98Sunday 23 September 2007 11825 92880 260 63 43 83 806 75 1 100 376 17 95Monday 24 September 2007 12245 87013 210 5 4 98 650 32 32 95 330 7 98Tuesday 25 September 2007 13673 99813 280 74 71 75 662 116 96 85 202 3 99Wednesday 26 September 2007 10472 75787 200 3 4 98 644 17 18 97 110 3 97Thursday 27 September 2007 10824 84907 180 4 6 97 725 1 1 100Friday 28 September 2007 10950 92053 220 5 6 97 592 27 12 98Saturday 29 September 2007 10523 73880 315 78 74 77 690 74 96 86Sunday 30 September 2007 9398 79413 215 3 9 96 652 1 1 100 315
For Sample Point Locations please refer to Drawing C.1.1Inlet - Sample Point No. 7Plant Outlet - Sample Point No. 3Plant & Storm Outlet - Sample Point No. 4
Sampler Out
Sampler Out
RED Text MEANS The Figure has exceeded lower
discharge limits
Blue Text MEANS The Figure has exceeded upper
discharge limits
Section E.4. Page 11
For
insp
ectio
n pur
pose
s only
.
Conse
nt of
copy
right
owne
r req
uired
for a
ny ot
her u
se.
EPA Export 14-10-2013:23:47:25

Purcellsinch WWTP Tests Results01-11-2006 to 31-10-2007
Day Date Q - Flow PE Inlet Plant OutletPlant & Storm Outlet
% Reduction Inlet Plant OutletPlant & Storm Outlet
% Reduction InletPlant & Storm Outlet
% Reduction
BOD Values mg/l BODCOD Values mg/l CODSS Values mg/lCapacity Data
Monday 01 October 2007 10872 81613 245 3 7 97 653 1 3 100 174 4 98Tuesday 02 October 2007 11965 82467 250 4 3 99 783 20 30 96 403 2 100Wednesday 03 October 2007 12565 105987 370 2 5 99 799 7 21 97Thursday 04 October 2007 12804 97013 260 1 2 99 737 9 12 98Friday 05 October 2007 11544 83253 240 1 2 99 621 12 17 97Saturday 06 October 2007 11198 94667 265 2 5 98 694 15 17 98Sunday 07 October 2007 10656 105440 250 1 9 96 743 32 31 96 310 3 99Monday 08 October 2007 11537 101040 265 2 2 99 710 10 15 98 290 3 99Tuesday 09 October 2007 10946 94013 150 3 3 98 577 2 11 98 175 4 98Wednesday 10 October 2007 10525 93600 255 2 3 99 594 30 22 96 435 100Thursday 11 October 2007 10507 90547 230 3 3 99 655 1 1 100Friday 12 October 2007 10775 107707 240 1 9 96 752 11 10 99Saturday 13 October 2007 11038 114040 145 3 3 98 667 6 4 99Sunday 14 October 2007 10509 109800 225 7 7 97 721 16 10 99 370 2 99Monday 15 October 2007 10837 102013 290 10 8 97 681 1 1 100 326 3 99Tuesday 16 October 2007 11386 124253 375 25 35 91 822 25 36 96 392 16 96Wednesday 17 October 2007 11151 117240 405 9 12 97 822 21 22 97Thursday 18 October 2007 10843 82320 240 4 2 99 608 <1 2 100Friday 19 October 2007 11381 108187 1 4 12 36Saturday 20 October 2007 11141 101627 4 2 7 12Sunday 21 October 2007 11112 99360 2 5 20 21 3Monday 22 October 2007 12051 101453 595 3 11 98 803 11 39 95 356 11 97Tuesday 23 October 2007 13377 112583 370 1 2 99 854 28 10 99 449 3 99Wednesday 24 October 2007 11839 101883 270 1 2 99 777 11 21 97Thursday 25 October 2007 11093 112950 405 1 1 100 780 7 7 99Friday 26 October 2007 11876 104483 280 4 6 98 653 21 31 95Saturday 27 October 2007 12217 109367 350 4 9 97 899 23 19 98Sunday 28 October 2007 13178 128817 225 4 8 96 811 33 33 96 362 5 99Monday 29 October 2007 11278 108417 290 1 3 99 716 35 20 97 372 5 99Tuesday 30 October 2007 11410 93067 375 6 1 100 839 22 25 97 460 5 99Wednesday 31 October 2007 11063 97300 310 5 3 99 707 1 5 99
For Sample Point Locations please refer to Drawing C.1.1Inlet - Sample Point No. 7Plant Outlet - Sample Point No. 3Plant & Storm Outlet - Sample Point No. 4
Average 11701 100739 270.78 36.30 29.56 86.75 670.12 64.79 59.00 90.27 282.67 18.67 93.60Max 17870 193833 1065.00 1710.00 400.00 100.00 1570.00 2220.00 454.00 99.88 615.00 201.00 100.00Min 8505 33494 70.00 1.00 0.00 -158.06 193.00 1.00 1.00 19.22 30.00 2.00 30.50
RED Text MEANS The Figure has exceeded lower
discharge limits
Blue Text MEANS The Figure has exceeded upper
discharge limits
Sampler Out
Sampler Out
Section E.4. Page 12
For
insp
ectio
n pur
pose
s only
.
Conse
nt of
copy
right
owne
r req
uired
for a
ny ot
her u
se.
EPA Export 14-10-2013:23:47:25

Purcellsinch WWTP Test Results01-11-2006 to 31-10-2007
Date pH TempºC pH TempºC12 September 2007 7.19 8.2813 September 2007 7.08 21.4 7.9720 September 2007 7.28 7.0228 September 2007 7.24 8.0329 September 2007 7.39 8.0730 September 2007 7.23 7.93
01 October 2007 7.20 7.9703 October 2007 7.09 7.9505 October 2007 7.36 7.9009 October 2007 7.16 7.8510 October 2007 7.34 7.8415 October 2007 7.16 19.3 8.04 19.316 October 2007 7.41 17.8 7.80 17.017 October 2007 7.66 16.3 7.79 15.918 October 2007 7.65 16.0 7.81 15.419 October 2007 7.39 16.3 7.93 15.922 October 2007 7.28 16.5 7.76 16.123 October 2007 7.69 16.5 7.78 16.224 October 2007 7.90 15.5 7.83 14.825 October 2007 7.41 15.3 7.81 13.926 October 2007 7.56 15.7 7.87 14.831 October 2007 7.74 17.8 8.24 17.4
Max 7.9 21.4 8.28 19.3Min 7.08 15.3 7.02 13.9Average 7.38 17.03 7.89 16.06
Inlet P+S Outlet
Section E.4. Page 13
For
insp
ectio
n pur
pose
s only
.
Conse
nt of
copy
right
owne
r req
uired
for a
ny ot
her u
se.
EPA Export 14-10-2013:23:47:25

Purcellsinch WWTP Test Results01-11-2006 to 31-10-2007
Date Inlet P+S Outlet
Wednesday October 2007 0.474Thursday October 2007 17.547 1.405Sunday October 2007 0.318Monday October 2007 15.994 0.031Tuesday October 2007 20.342 0.062Thursday October 2007 0.016Wednesday October 2007 17.702 0.210
Thursday November 2007 17.702 0.202Sunday November 2007 16.304 0.171Monday November 2007 18.012 0.225Thursday November 2007 16.149 0.311Sunday November 2007 15.528 0.217
Average 17.253 0.303Max 20.342 1.405Min 15.528 0.016
Ammonia mg/L NH3-N
Section E.4. Page 14
For
insp
ectio
n pur
pose
s only
.
Conse
nt of
copy
right
owne
r req
uired
for a
ny ot
her u
se.
EPA Export 14-10-2013:23:47:25

Purcellsinch WWTP Test Results01-11-2006 to 31-10-2007
Inlet P+S Outlet
22 November 2006 0.25623 November 2006 0.212
20 December 2006 0.11221 December 2006 0.35222 December 2006 0.312 0.322
09 January 2007 0.032 0.023
04 April 2007 0.048 0.06809 April 2007 0.031 0.02112 April 2007 0.024 0.01717 April 2007 0.050 0.01623 April 2007 0.067 0.01029 April 2007 0.007 0.00930 April 2007 0.013 0.026
02 May 2007 0.115 0.02408 May 2007 0.037 0.01609 May 2007 0.010 0.00513 May 2007 0.026 0.00415 May 2007 0.029 0.01528 May 2007 0.038 0.02229 May 2007 0.042 0.018
25 June 2007 0.020 0.00128 June 2007 0.057 0.00409 July 2007 0.100 0.09817 July 2007 0.024 0.02419 July 2007 0.05723 July 2007 0.053 0.0130 July 2007 0.047 0.005
13 August 2007 0.051 0.03822 August 2007 0.055 0.01704 September 2007 0.014 0.06110 September 2007 0.045 0.05219 September 2007 0.015 0.033
16 October 2007 0.040 0.036
Average 0.050 0.060Max 0.312 0.352Min 0.007 0.001
Nitrite mg/l NO2¯ -N
Section E.4. Page 15
For
insp
ectio
n pur
pose
s only
.
Conse
nt of
copy
right
owne
r req
uired
for a
ny ot
her u
se.
EPA Export 14-10-2013:23:47:25

Purcellsinch WWTP Test Results01-11-2006 to 31-10-2007
Inlet P+S Outlet
22 November 2006 3123 November 2006 29.1
20 December 2006 30.121 December 2006 42.122 December 2006 33.1 28.65
09 January 2007 1.6 1.9
03 April 2007 1.6 2.104 April 2007 1.5 308 April 2007 1.7 2.112 April 2007 0.8 2.717 April 2007 0.5 0.723 April 2007 0.6 0.529 April 2007 0.1 3.130 April 2007 0.5 0.5
02 May 2007 0.5 0.508 May 2007 0.35 0.3509 May 2007 0.75 0.4513 May 2007 0.95 0.1515 May 2007 0.65 0.3517 May 2007 0.45 0.8528 May 2007 0.35 0.4529 May 2007 0.9 0.1
10 June 2007 1.05 0.0524 June 2007 0.15 0.6528 June 2007 0.95 1.05
01 July 2007 0.15 0.3508 July 2007 0.75 0.3511 July 2007 0.55 0.2516 July 2007 0.45 0.6518 July 2007 0.15 0.7523 July 2007 0.45 0.9531 July 2007 0.45
07 August 2007 2.6512 August 2007 8.9520 August 2007 0.65 0.9522 August 2007 0.25 1.3526 August 2007 0.75 6.4529 August 2007 0.55 2.15
02 September 2007 203 September 2007 2.606 September 2007 1.7
07 October 2007 0.8 0.415 October 2007 0.9 0.9
Average 1.64 5.14Max 33.10 42.10Min 0.10 0.05
Nitrate mg/l NO3¯ -N
Section E.4. Page 16
For
insp
ectio
n pur
pose
s only
.
Conse
nt of
copy
right
owne
r req
uired
for a
ny ot
her u
se.
EPA Export 14-10-2013:23:47:25

Purcellsinch WWTP Test Results01-11-2006 to 31-10-2007
Inlet P+S Outlet
22 November 2006 3.6223 November 2006 4.39
09 January 2007 6.64 6.90
12 February 2007 8.37 3.91
01 March 2007 9.41 7.17
08 May 2007 10.04 6.0010 May 2007 11.28 7.1114 May 2007 16.11 7.3016 May 2007 9.69 5.6717 May 2007 9.13 6.7824 May 2007 8.87 4.6327 May 2007 11.67 8.0929 May 2007 8.02 6.8531 May 2007 9.85 2.54
10 June 2007 9.07 5.0212 June 2007 6.65 5.6719 June 2007 4.50 2.6724 June 2007 7.04 3.8528 June 2007 8.22 8.09
01 July 2007 7.30 5.8708 July 2007 11.02 4.1710 July 2007 8.22 4.4316 July 2007 7.21 5.3817 July 2007 6.62 5.6423 July 2007 7.66 6.8226 July 2007 11.90 8.7130 July 2007 10.86 4.08
11 September 2007 9.13 0.95
16 October 2007 12.33 7.24
Average 9.142 5.503Max 16.109 8.707Min 4.500 0.946
Total P mg/l P
Section E.4. Page 17
For
insp
ectio
n pur
pose
s only
.
Conse
nt of
copy
right
owne
r req
uired
for a
ny ot
her u
se.
EPA Export 14-10-2013:23:47:25

Purcellsinch WWTP Test Results01-11-2006 to 31-10-2007
Inlet P+S Outlet
22 November 2006 2623 November 2006 32
09 January 2007 21 1.8
12 February 2007 18 2.1
01 March 2007 16 2.4
16 April 2007 22 1.622 April 2007 42 4.125 April 2007 3.3
07 May 2007 40 3.109 May 2007 34 1.013 May 2007 38 3.815 May 2007 62 1.516 May 2007 24 3.317 May 2007 44 0.227 May 2007 40 5.329 May 2007 22 3.431 May 2007 6 6.4
11 June 2007 28 0.417 June 2007 14.0 6.820 June 2007 2.725 June 2007 32.0 1.80
02 July 2007 0.305 July 2007 2.209 July 2007 26 4.711 July 2007 46 1.818 July 2007 32 2.024 July 2007 28 1.026 July 2007 38 1.329 July 2007 32 3.330 July 2007 18 2.431 July 2007 28 2.7
01 August 2007 16 1.305 August 2007 15.9 0.906 August 2007 19 3.507 August 2007 2.0 3.014 August 2007 8.0 7.915 August 2007 66 4.919 August 2007 16 8.920 August 2007 10 3.021 August 2007 18 2.222 August 2007 26 3.126 August 2007 38 6.327 August 2007 42 7.328 August 2007 20 4.529 August 2007 54 2.930 August 2007 12 2.8
04 September 2007 36 3.309 September 2007 34 3.211 September 2007 35 19.818 September 2007 27 15.419 September 2007 36 2.7
04 October 2007 22 1.614 October 2007 48 3.815 October 2007 3.9
Average 28.76 4.65Max 66.00 32.00Min 2.00 0.20
Total N mg/L N
Section E.4. Page 18
For
insp
ectio
n pur
pose
s only
.
Conse
nt of
copy
right
owne
r req
uired
for a
ny ot
her u
se.
EPA Export 14-10-2013:23:47:25