Embed Size (px)
Citation preview

Section 8.4

The definition of a hyperbola is similar to that of an ellipse. However, this time it is the difference in the distances to the two foci, which is constant.


Regardless of where a point is on a hyperbola, the difference in the distances from the point to the two foci is constant. Notice that this constant is equal to the distance between the two vertices of the hyperbola.
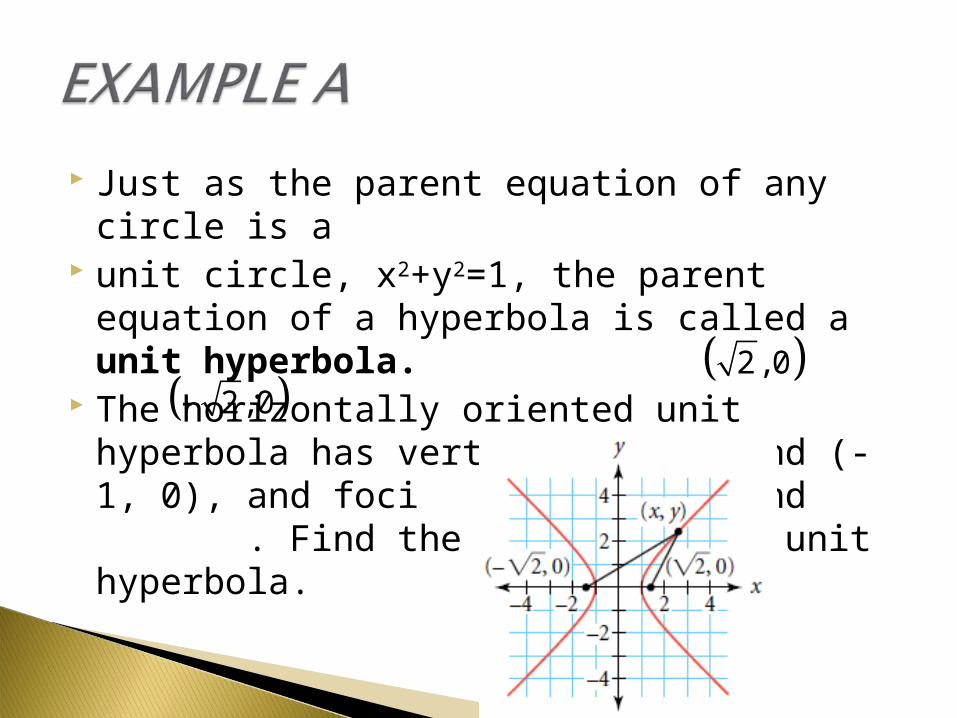
Just as the parent equation of any circle is a unit circle, x2+y2=1, the parent equation of
a hyperbola is called a unit hyperbola. The horizontally oriented unit hyperbola has
vertices (1, 0) and (-1, 0), and foci and . Find the equation of a unit hyperbola.
2,0
2,0
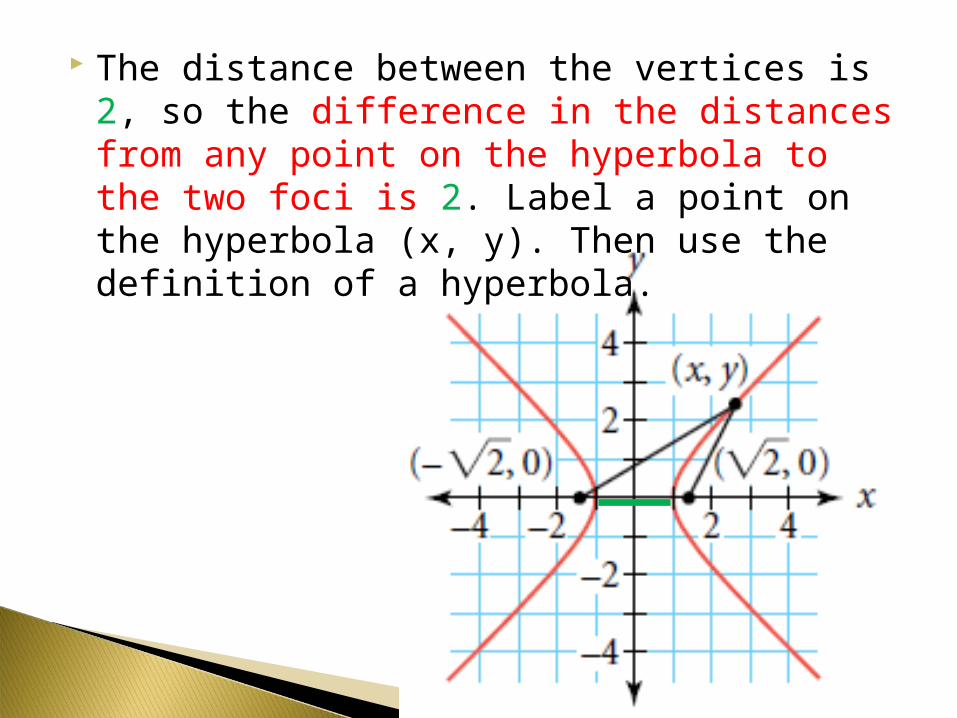
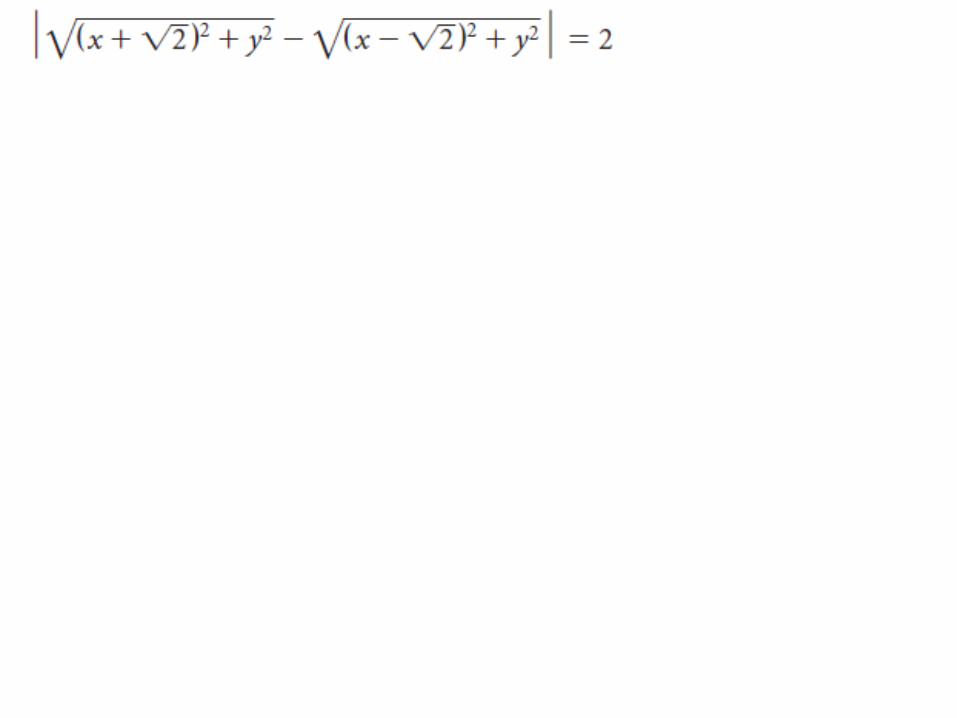
The distance between the vertices is 2, so the difference in the distances from any point on the hyperbola to the two foci is 2. Label a point on the hyperbola (x, y). Then use the definition of a hyperbola.

Check your answer by graphing on a calculator. First you must solve for y.
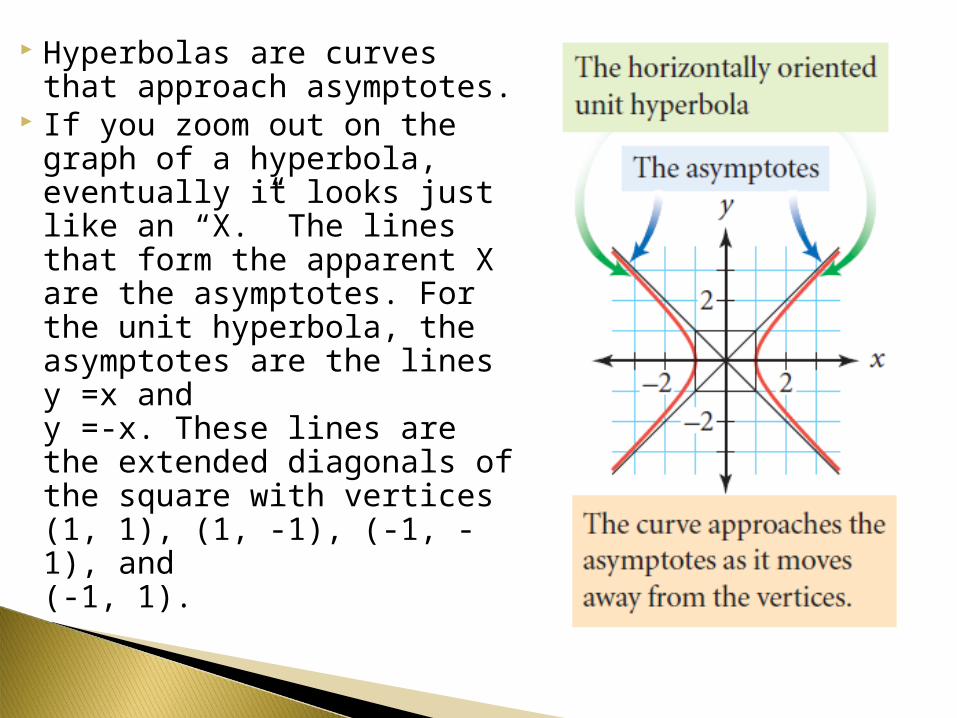
Hyperbolas are curves that approach asymptotes.
If you zoom out on the graph of a hyperbola, eventually it looks just like an “X.” The lines that form the apparent X are the asymptotes. For the unit hyperbola, the asymptotes are the lines y =x and y =-x. These lines are the extended diagonals of the square with vertices (1, 1), (1, -1), (-1, -1), and (-1, 1).
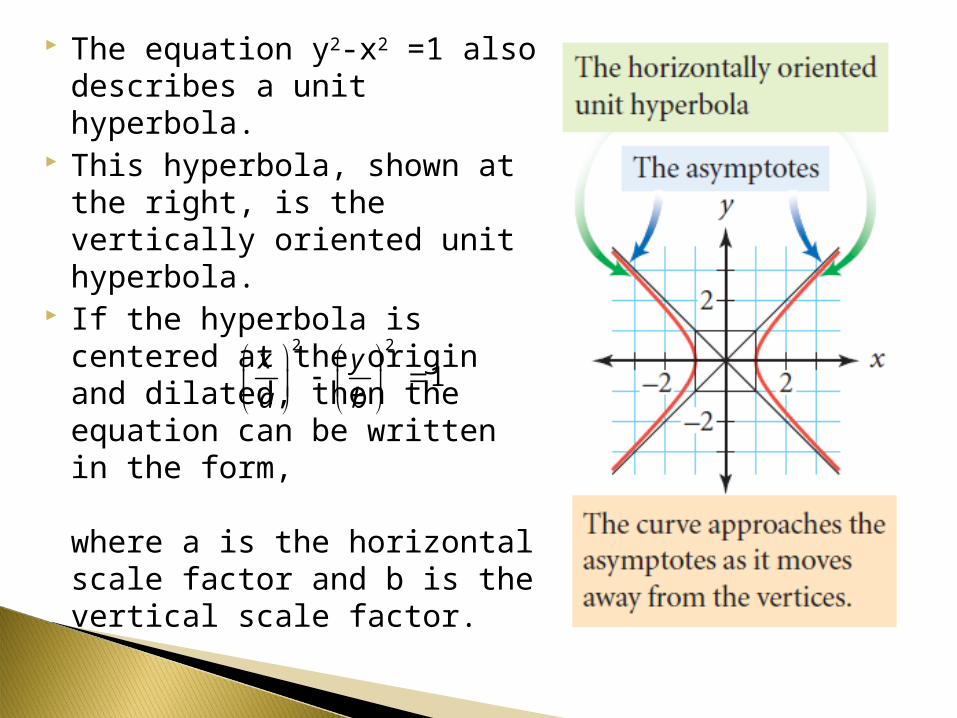
The equation y2-x2 =1 also describes a unit hyperbola.
This hyperbola, shown at the right, is the vertically oriented unit hyperbola.
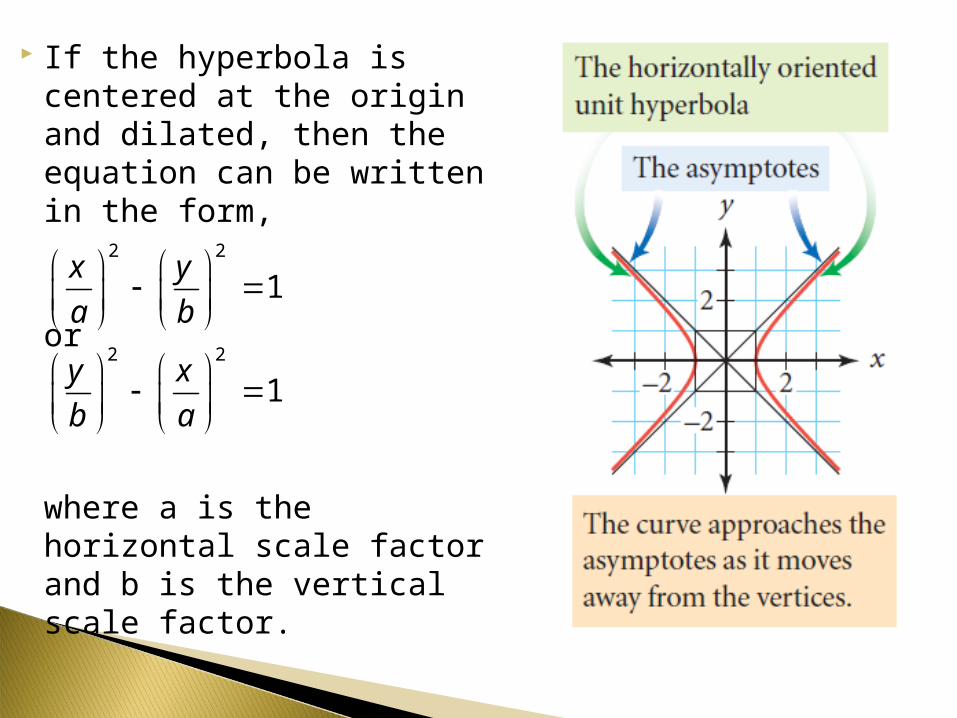
If the hyperbola is centered at the origin and dilated, then the equation can be written in the form,
where a is the horizontal scale factor and b is the vertical scale factor.
2 2
1x ya b
If the hyperbola is centered at the origin and dilated, then the equation can be written in the form,
or
where a is the horizontal scale factor and b is the vertical scale factor.
2 2
1x ya b
2 2
1y xb a
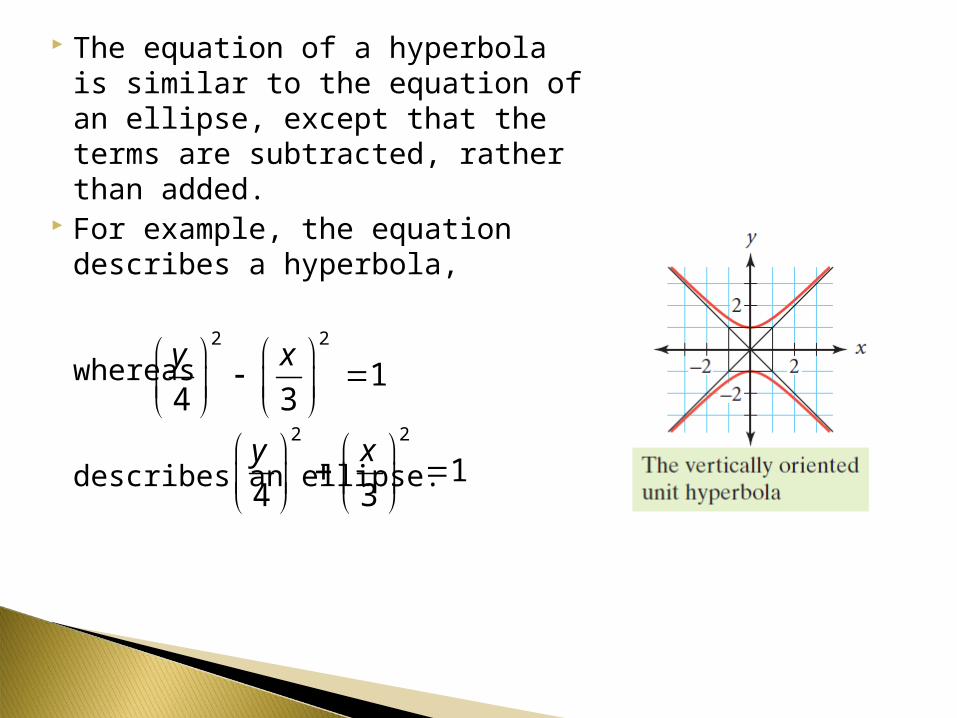
The equation of a hyperbola is similar to the equation of an ellipse, except that the terms are subtracted, rather than added.
For example, the equation describes a hyperbola,
whereas
describes an ellipse.
2 2
14 3y x
2 2
14 3y x
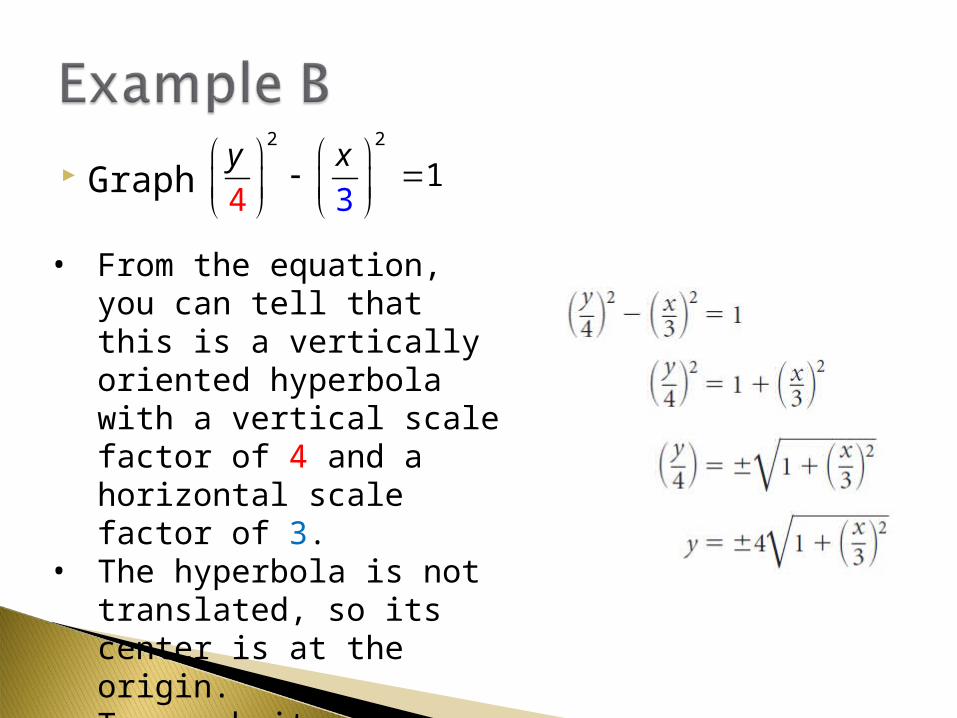
Graph 2 2
41
3y x
• From the equation, you can tell that this is a vertically oriented hyperbola with a vertical scale factor of 4 and a horizontal scale factor of 3.
• The hyperbola is not translated, so its center is at the origin.
• To graph it on your calculator, you must solve for y.

1. Dilate the unit box by the horizontal and vertical scale factors.
2 2
41
3y x

2. Draw in the asymptotes (the diagonals of the box, extended).
2 2
41
3y x

3. Locate the vertices at the centers of the sides of the box. Because the y2 term is positive, the vertices lie on the top and bottom sides of the box.
4. Draw the curve starting from the vertices and approaching the asymptotes.
2 2
41
3y x
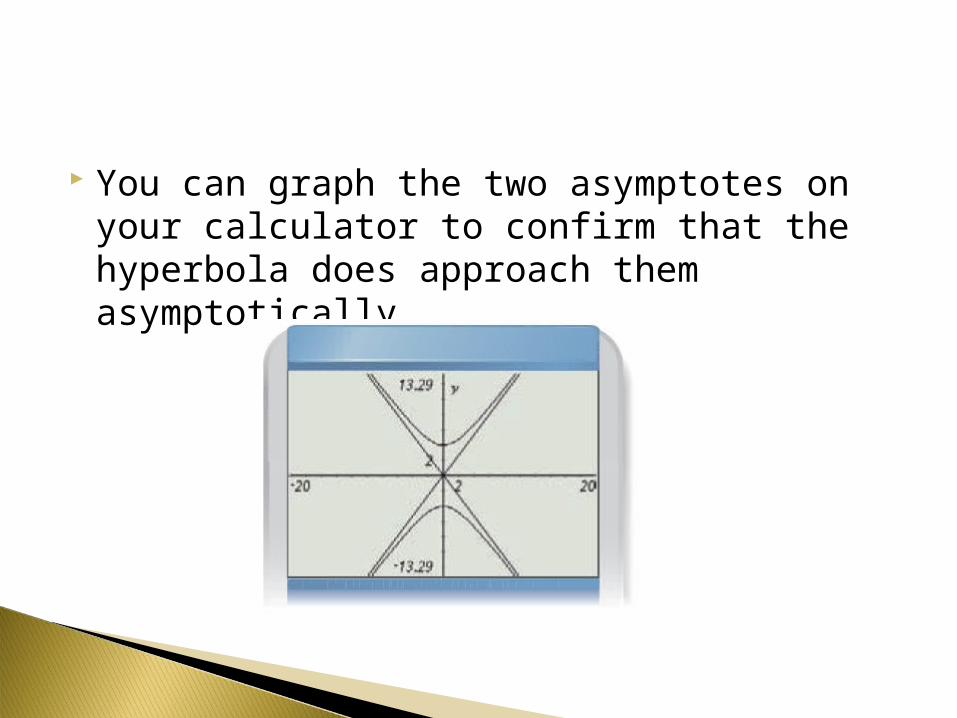
You can graph the two asymptotes on your calculator to confirm that the hyperbola does approach them asymptotically.
The location of foci in a hyperbola is related to a circle that can be drawn through the four corners of the asymptote rectangle. The distance from the center of the hyperbola to the foci is equal to the radius of the circle.
To locate the foci in a hyperbola, you can use the relationship a2, b2, c2, where a and b are the horizontal and vertical scale factors.

In the hyperbola from Example B, shown at right, , so c=5, and the foci are 5 units above and below the center of the hyperbola at (0, -5) and (0, 5).
2 2
41
3y x
2 2 23 4 c

Procedural Note◦ 1. One member of your group
will use a motion sensor to measure the distance to the walker for 10 seconds. The motion sensor must be kept pointed at the walker.
◦ 2. The walker should start about 5 m to the left of the sensor holder. He or she should walk at a steady pace in a straight line, continuing past the sensor holder, and stop about 5 m to the right of the sensor holder.

Step 1 Collect data as described in the Procedure Note. Transfer these data from the motion sensor to each calculator in the group, and graph your data. They should form one branch of a hyperbola.
Step 2 Assume the sensor was held at the center of the hyperbola, and find an equation to fit your data. You may want to try to graph the asymptotes first.
Step 3 Transfer your graph to paper, and add the foci and the other branch of the hyperbola. To verify your equation, choose at least two points on the curve and measure their distances from the foci. Calculate the differences between the distances from each focus. What do you notice? Why?
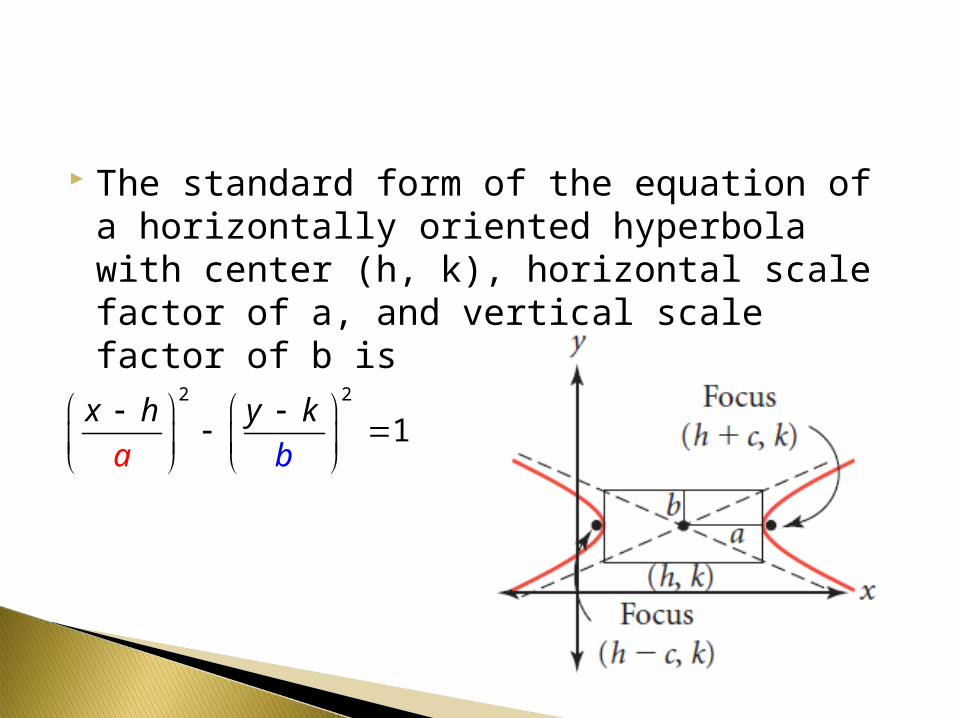
The standard form of the equation of a horizontally oriented hyperbola with center (h, k), horizontal scale factor of a, and vertical scale factor of b is
2 2
1x h y
bk
a

The equation of a vertically oriented hyperbola under the same conditions is
2 2
1y h x
ak
b

Write the equation of this hyperbola in standard form, and find the foci.

The center is halfway between the vertices, at the point (-4, 2).
The horizontal distance from the center to the vertex, a, is 2. If you knew the location of the asymptotes, you could find the value of b using the fact that the slopes of asymptotes of a hyperbola are .
In this case, to find the vertical scale factor you will need to estimate the asymptotes or, using a point from the graph, solve for the value of b.
ab

Write the equation, substituting the values you know.
2 24
12
2x yb

2 20 4 3.2 2
21
b
Estimating a point not too close to either vertex, such as (0, -3.2), will allowyou to approximate b.

The value of b is approximately 3, so the equation of the hyperbola is close to
You can find the distance to the foci by using the equation a2+ b2 =c2.
2 24
12 3
2x y