Embed Size (px)
Citation preview

Section 6.6
Graphs of Transformed Sine
and Cosine Functions
Copyright ©2013, 2009, 2006, 2001 Pearson Education, Inc.

Objectives
Graph transformations of y = sin x and y = cos x in the form y = A sin (Bx – C) + D andy = A cos (Bx – C) + D and determine the amplitude, the period, and the phase shift.
Graph sums of functions. Graph functions (damped oscillations) found by
multiplying trigonometric functions by other functions.

Variations of the Basic Graphs
We are interested in the graphs of functions in the form
y = A sin (Bx – C) + D
and
y = A cos (Bx – C) + D
where A, B, C, and D are all constants. These constants have the effect of translating, reflecting, stretching, and shrinking the basic graphs.

The Constant D
Let’s observe the effect of the constant D.

The Constant D
The Constant D
The constant D in
y = A sin (Bx – C) + D
and
y = A cos (Bx – C) + D
translates the graphs up D units if D > 0 or down |D| units if D < 0.
The Constant A
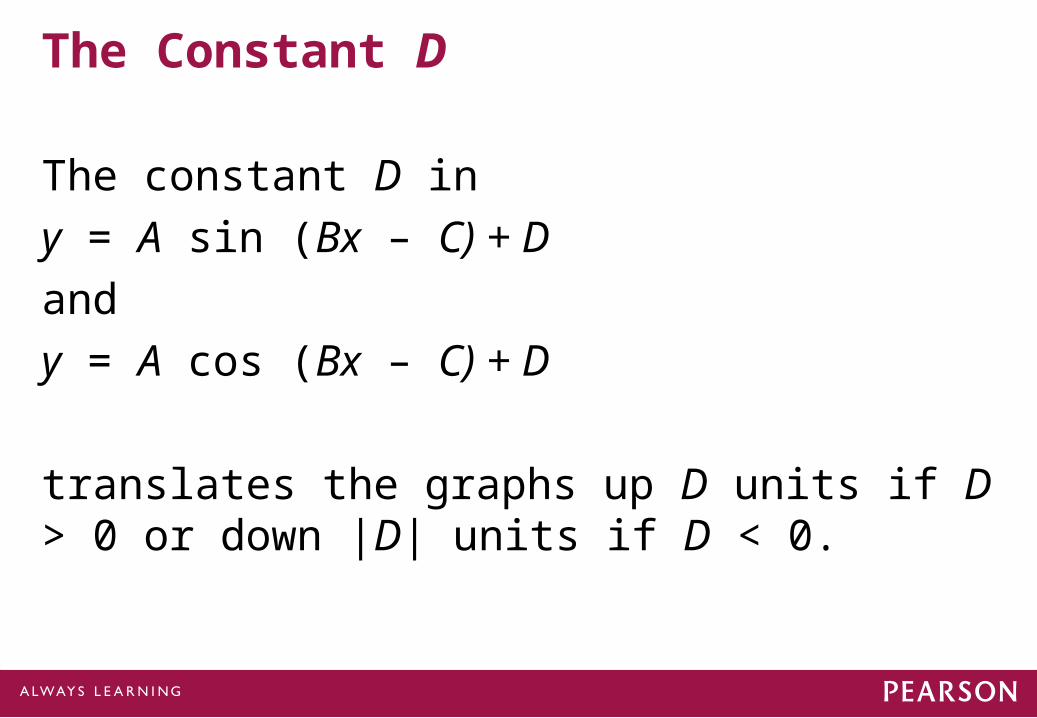
Let’s observe the effect of the constant A.

The Constant A

The Constant A
If |A| > 1, then there will be a vertical stretching.
If |A| < 1, then there will be a vertical shrinking.
If A < 0, the graph is also reflected across the x-axis.

Amplitude
The amplitude of the graphs of
y = A sin (Bx – C) + D
and
y = A cos (Bx – C) + D
is |A|.

The Constant B
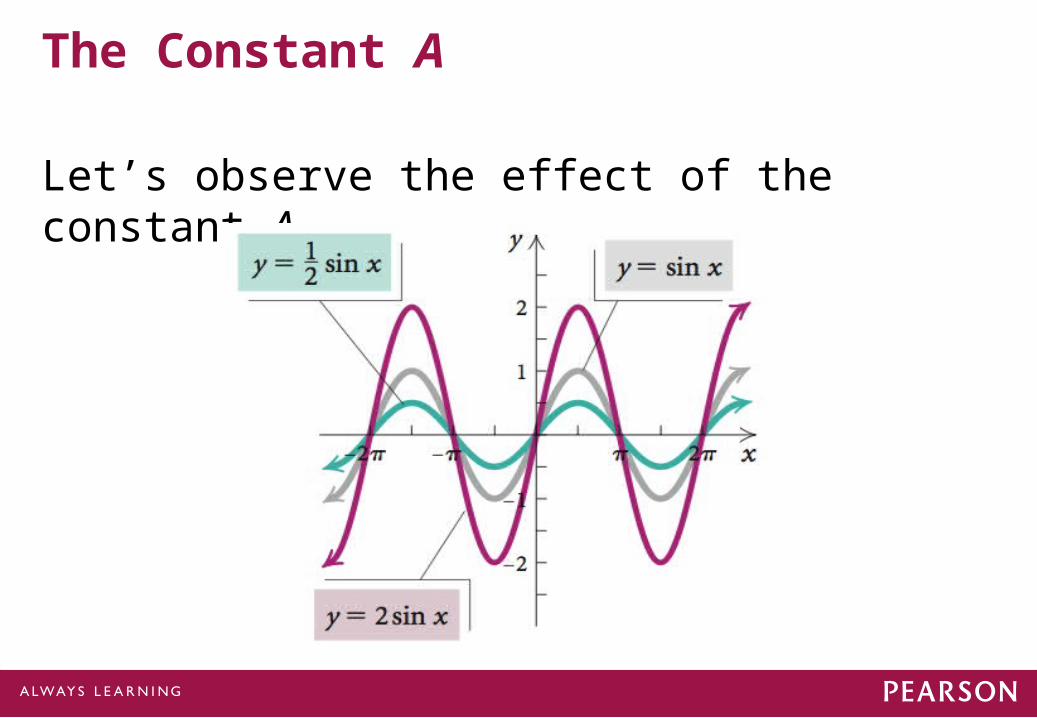
Let’s observe the effect of the constant B.

The Constant B

The Constant B
The Constant B

The Constant B
If |B| < 1, then there will be a horizontal stretching.
If |B| > 1, then there will be a horizontal shrinking.
If B < 0, the graph is also reflected across the y-axis.

Period
The period of the graphs of
is
y = A sin (Bx – C) + D
and
y = A cos (Bx – C) + D2B
.

Period
The period of the graphs of
is
y = A csc (Bx – C) + D
and
y = A sec (Bx – C) + D2B
.
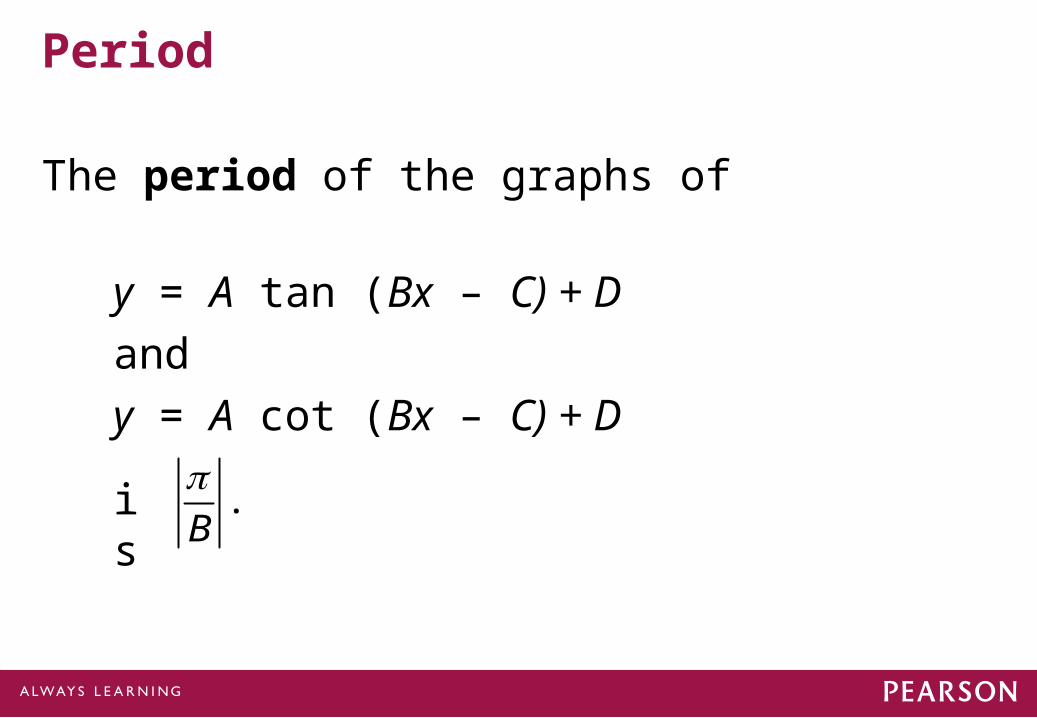
Period
The period of the graphs of
is
y = A tan (Bx – C) + D
and
y = A cot (Bx – C) + DB
.

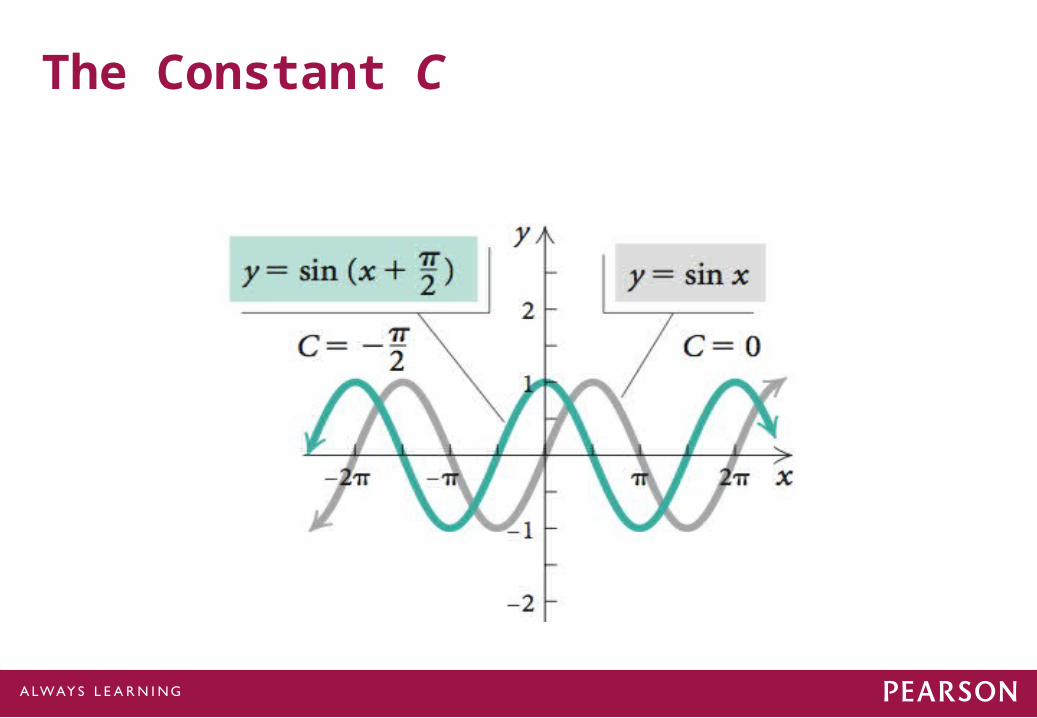
The Constant C
Let’s observe the effect of the constant C.
The Constant C
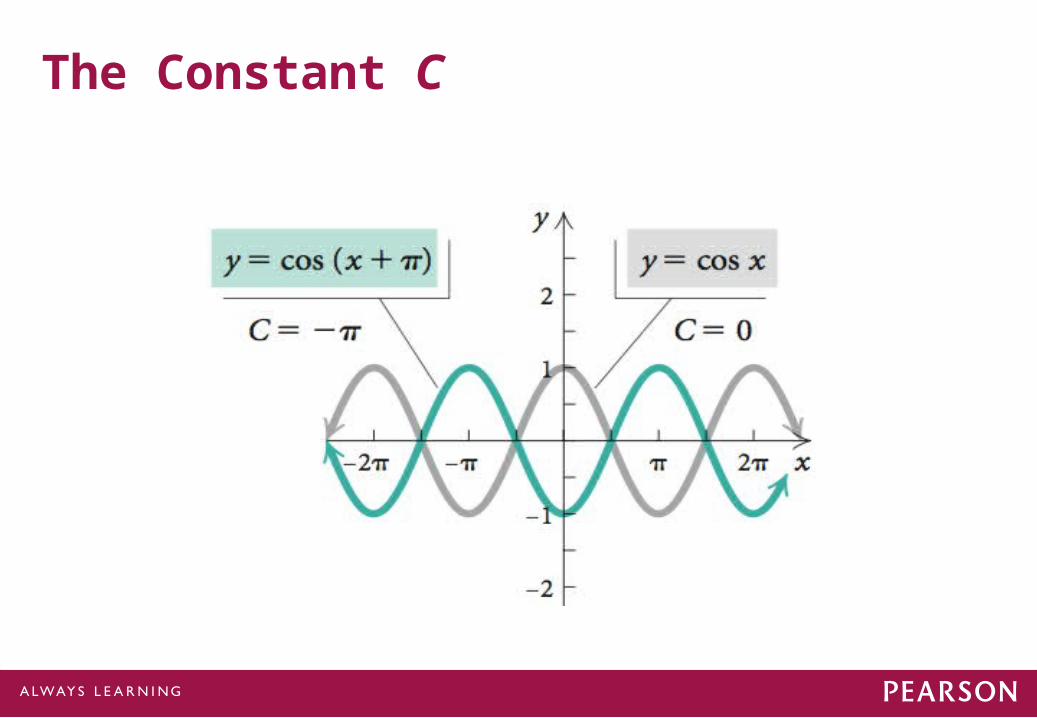
The Constant C

The Constant C

The Constant C
If B = 1, thenif |C| < 0, then there will be a horizontal translation of |C| units to the right, and
if |C| > 0, then there will be a horizontal translation of |C| units to the left.
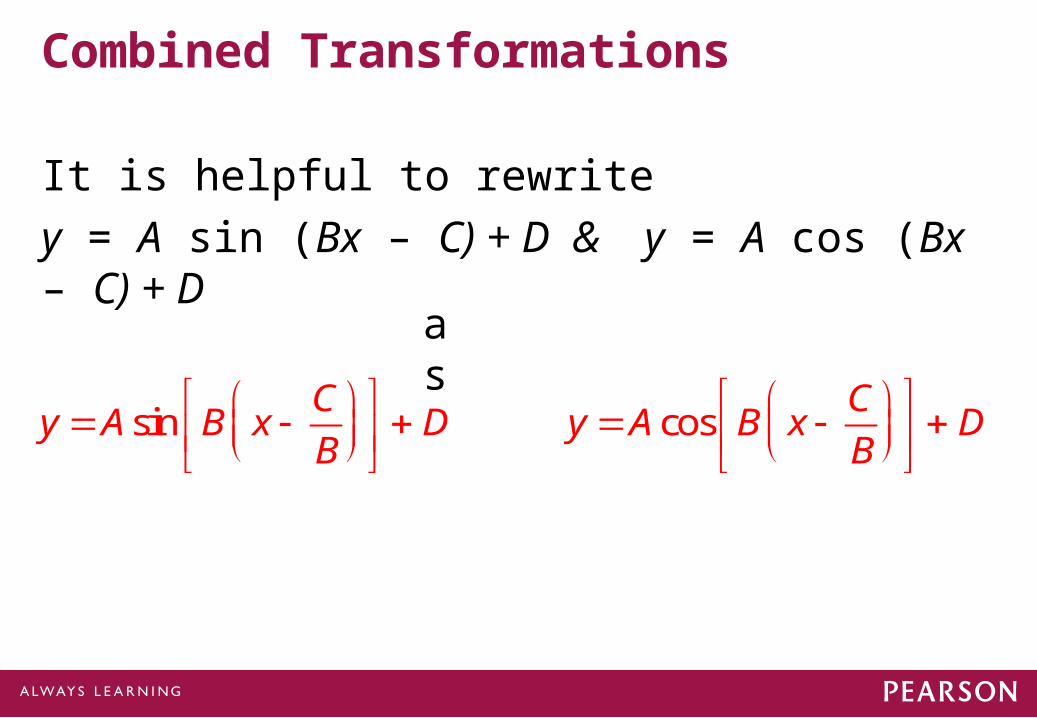
Combined Transformations
It is helpful to rewrite
y = A sin (Bx – C) + D & y = A cos (Bx – C) + D
as
y Asin B x C
B
D y Acos B x
C
B
D

Phase Shift
The phase shift of the graphs
is the quantity
and
C
B.
y Asin Bx C D Asin B x C
B
D
y Acos Bx C D Acos B x C
B
D
Phase Shift
If C/B > 0, the graph is translated to the right |C/B| units.
If C/B < 0, the graph is translated to the right |C/B| units.

Transformations of Sine and Cosine FunctionsTo graph
follow the steps listed on the following slides.
and
y Asin Bx C D Asin B x C
B
D
y Acos Bx C D Acos B x C
B
D
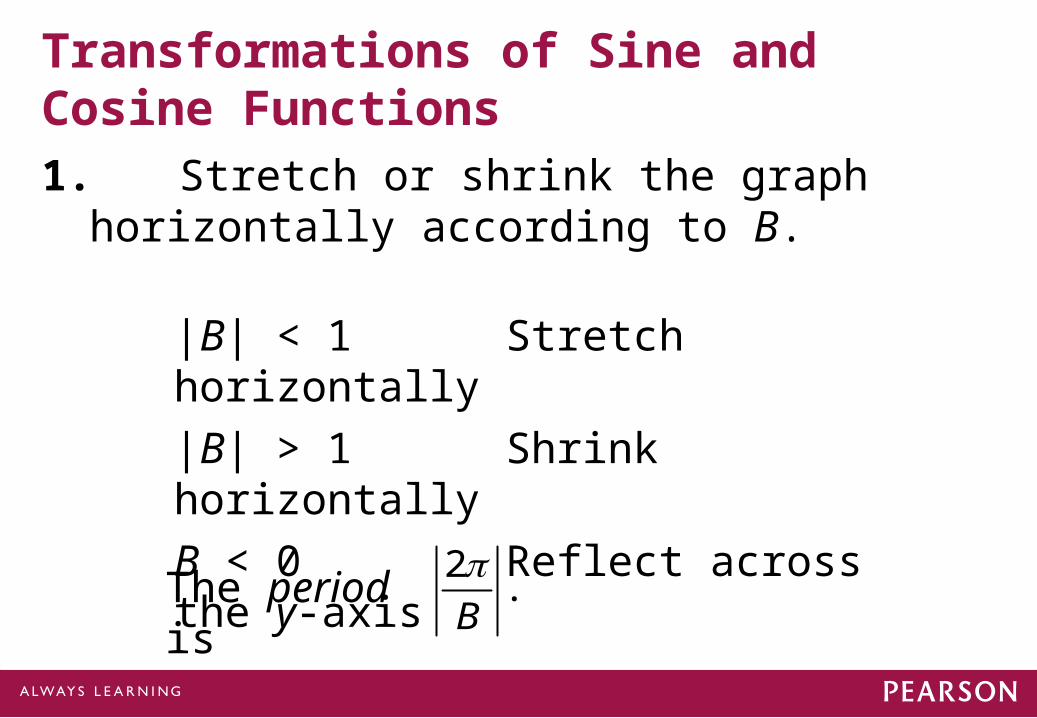
Transformations of Sine and Cosine Functions1. Stretch or shrink the graph horizontally
according to B.
The period is
|B| < 1 Stretch horizontally
|B| > 1 Shrink horizontally
B < 0 Reflect across the y-axis
2B
.

Transformations of Sine and Cosine Functions2. Stretch or shrink the graph vertically according
to A.
The amplitude is A.
|A| < 1 Shrink vertically
|A| > 1 Stretch vertically
A < 0 Reflect across the x-axis
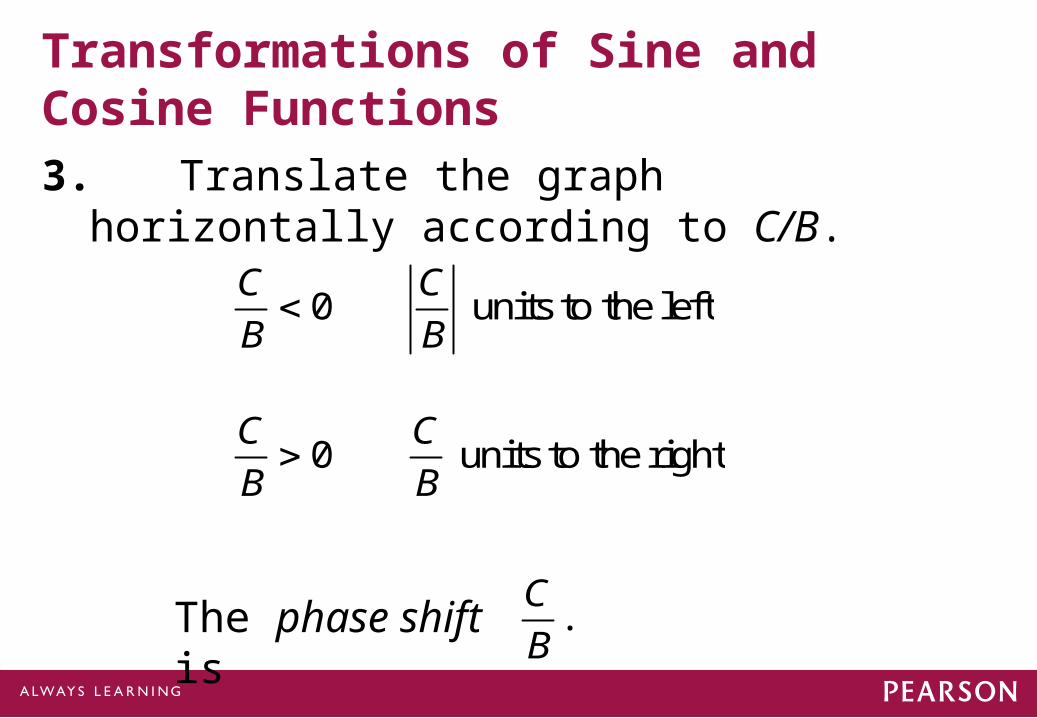
Transformations of Sine and Cosine Functions3. Translate the graph horizontally according to
C/B.
The phase shift isC
B.
C
B 0
C
B units to the left
C
B 0
C
B units to the right
Transformations of Sine and Cosine Functions4. Translate the graph vertically according to D.
D < 0 |D| units down
D > 0 D units up

Example
Sketch the graph ofFind the amplitude, the period, and the phase shift.
Solution:
y 3sin 2x / 2 1.
y 3sin 2x 2
1 3sin 2 x
4
1
Amplitude A 3 3
Period 2B
22
Phase shift C
B
2
2
4

Example (cont)
To create the final graph, we begin with the basic sine curve, y = sin x.Then we sketch graphs of each of the following equations in sequence.
1. y sin2x
4. y 3sin 2 x 4
1
2. y 3sin2x
3. y 3sin 2 x 4
Example
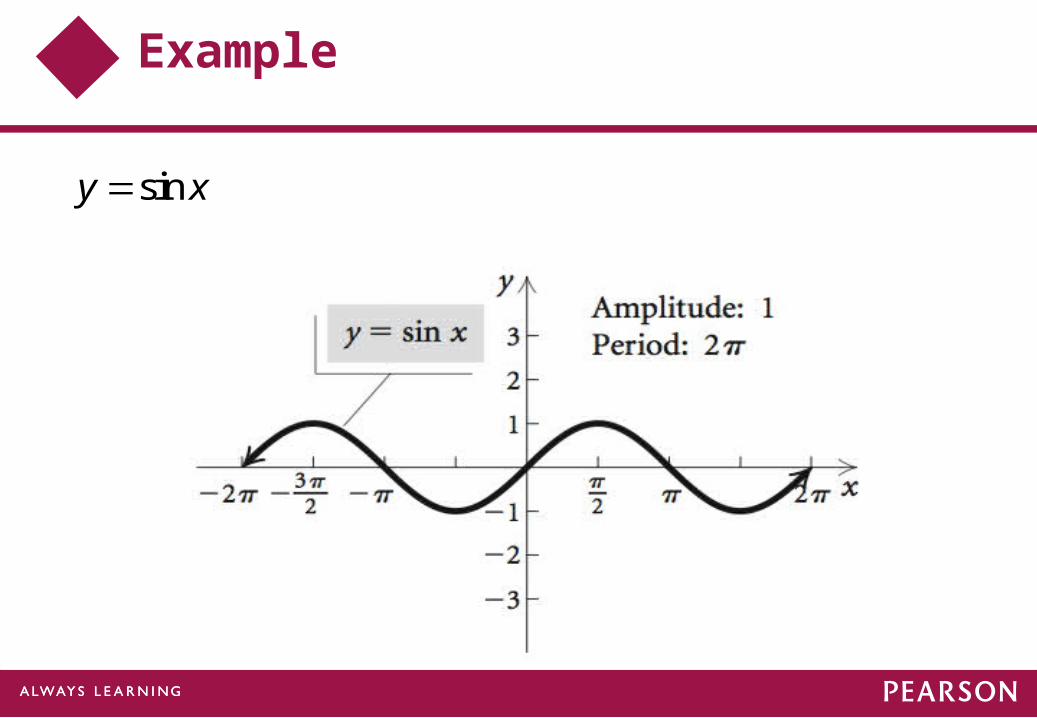
y sin x

Example (cont)
1. y sin2x

Example (cont)
2. y 3sin2x
Example (cont)
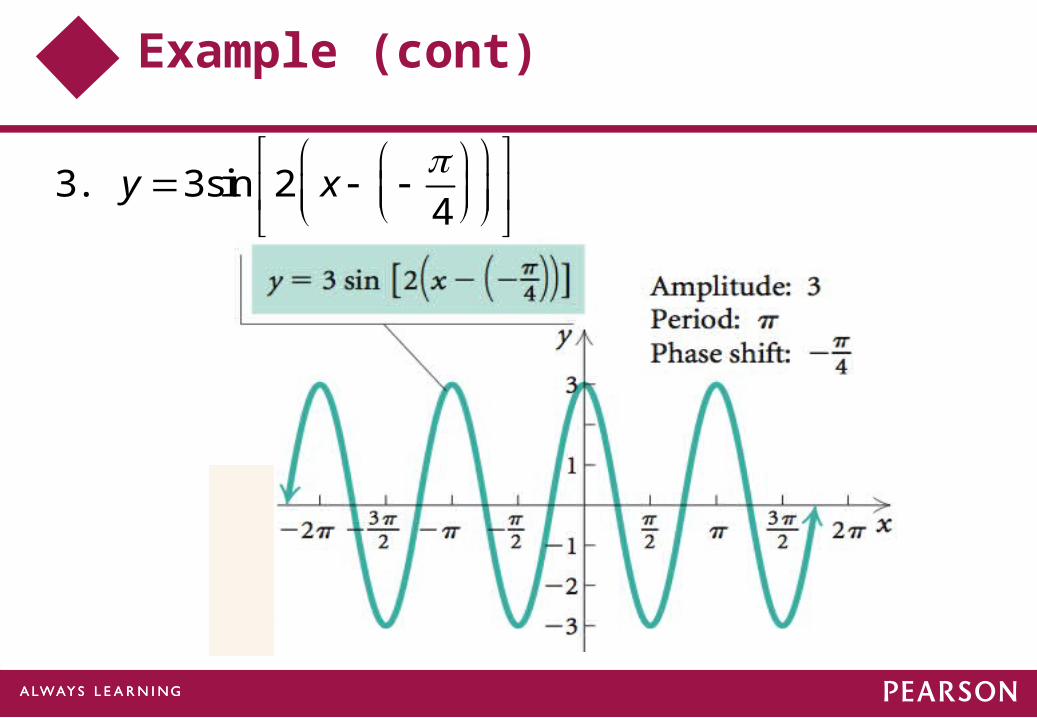
3. y 3sin 2 x 4

Example (cont)
4. y 3sin 2 x 4
1

Example
Graph: y = 2 sin x + sin 2x
Graph: y = 2 sin x and y = sin 2x on the same axes.

Example (cont)
Graphically add some y-coordinates, or ordinates, to obtain points on the graph that we seek.At x = π/4, transfer h up to add it to 2 sin x, yielding P1.
At x = – π/4, transfer m down to add it to 2 sin x, yielding P2.
At x = – 5π/4, add the negative ordinate of sin 2x to the positive ordinate of 2 sin x, yielding P3.
This method is called addition of ordinates, because we add the y-values (ordinates) of y = sin 2x to the y-values (ordinates) of y = 2 sin x.

Example (cont)
The period of the sum 2 sin x + sin 2x is 2π, the least common multiple of 2π and π.
Example
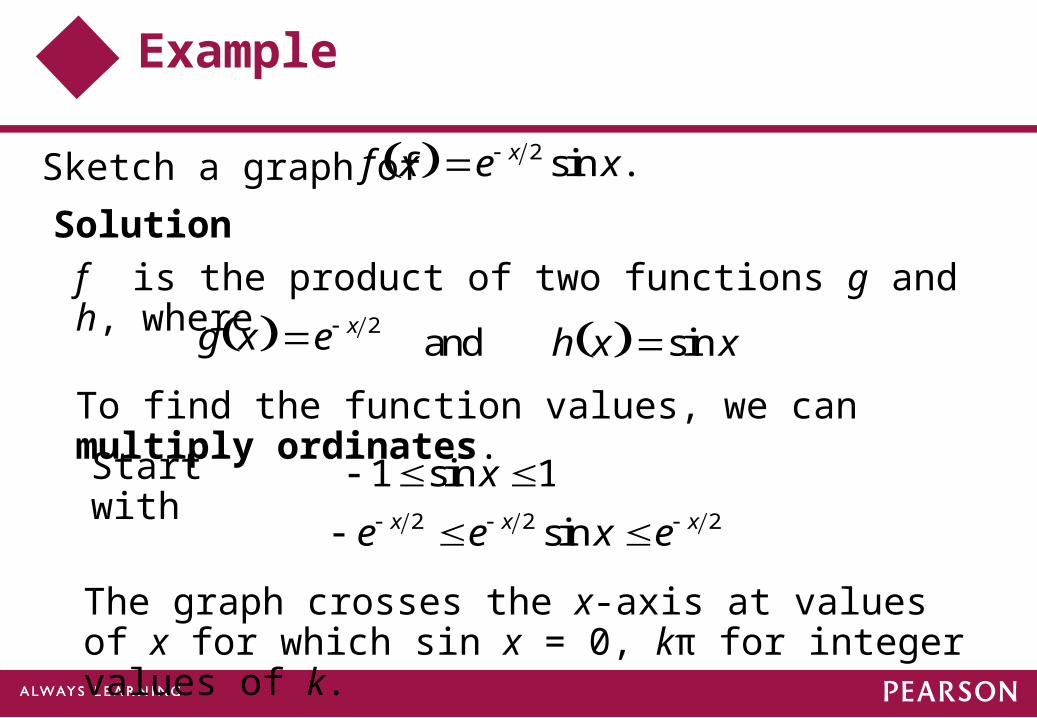
Sketch a graph of f x e x 2 sin x.
Solution
f is the product of two functions g and h, where
g x e x 2and h x sin x
To find the function values, we can multiply ordinates.Start with 1 sin x 1
e x 2 e x 2 sin x e x 2
The graph crosses the x-axis at values of x for which sin x = 0, kπ for integer values of k.

Example (cont)
f is constrained between the graphs of y = –e–x/2 andy = e–x/2. Start by graphing these functions using dashed lines.
Since f(x) = 0 when x = kπ, k an integer, we mark those points on the graph.
Use a calculator to compute other function values.
The graph is on the next slide.

Example (cont)