Embed Size (px)
Citation preview
Transform Milwaukee 4-1 Entrepreneurs and Entrepreneurship
Section 4 – Entrepreneurs and Entrepreneurship Developing and supporting entrepreneurs is a foundational economic development strategy; one that is
increasingly receiving consideration from communities and regions. Of particular interest is how economic
development organizations and local governments can effectively develop strategies that stimulate growth
among existing and latent business owners. Despite this recent attention, entrepreneurship frequently
remains misunderstood by policy analysts, economic development practitioners, and elected officials. Too
often, the result is nominal efforts to support entrepreneurs. Section 4 serves as a starting point for
overcoming these challenges by considering entrepreneurs and entrepreneurship in the context of
Milwaukee’s Industrial Corridor. The objectives are to understand the rationale for entrepreneurship as an
economic development strategy; measure entrepreneurial activity in the Milwaukee area; and identify
opportunities for rethinking local entrepreneurship policies.
Entrepreneurship as an Economic Development Strategy
Entrepreneurs and entrepreneurship have long been areas of interest among economic development
practitioners, academics and policy analysts. Regions and communities increasingly consider entrepreneurs to
be local assets that can be leveraged to produce economic growth.1 In the United States, much of this interest
has been driven by the domestic employment consequences arising from globalization and the decline of
traditional, mature industries such as manufacturing (Goetz and Freshwater, 2001). Even so, communities
have struggled with what level of importance to place on entrepreneurs within the customary economic
development disciplines of asset attraction, retention and expansion.
Traditionally, many communities and regions have focused on industry attraction as their primary economic
development strategy. These efforts often include providing economic enticements in an attempt to lure firms
to a community. The roots of this focus began with Mississippi’s Balancing Agriculture with Industry (BAWI)
policies enacted in the 1930’s. BAWI is often identified with the beginning of the industrial recruiting era as the
initiative sought to attract manufacturing to Mississippi by offering firms various financial incentives. While
BAWI was initially praised as a successful strategy for growing Mississippi’s economy, eighty years later
Mississippi is at or near the bottom of national rankings for state per capita income, unemployment rates, and
poverty levels. 2
Over the past two decades, the limited success of industrial relocation as a primary contributor to job growth
is apparent nationwide. While attracting an individual firm from elsewhere is certainly an important and
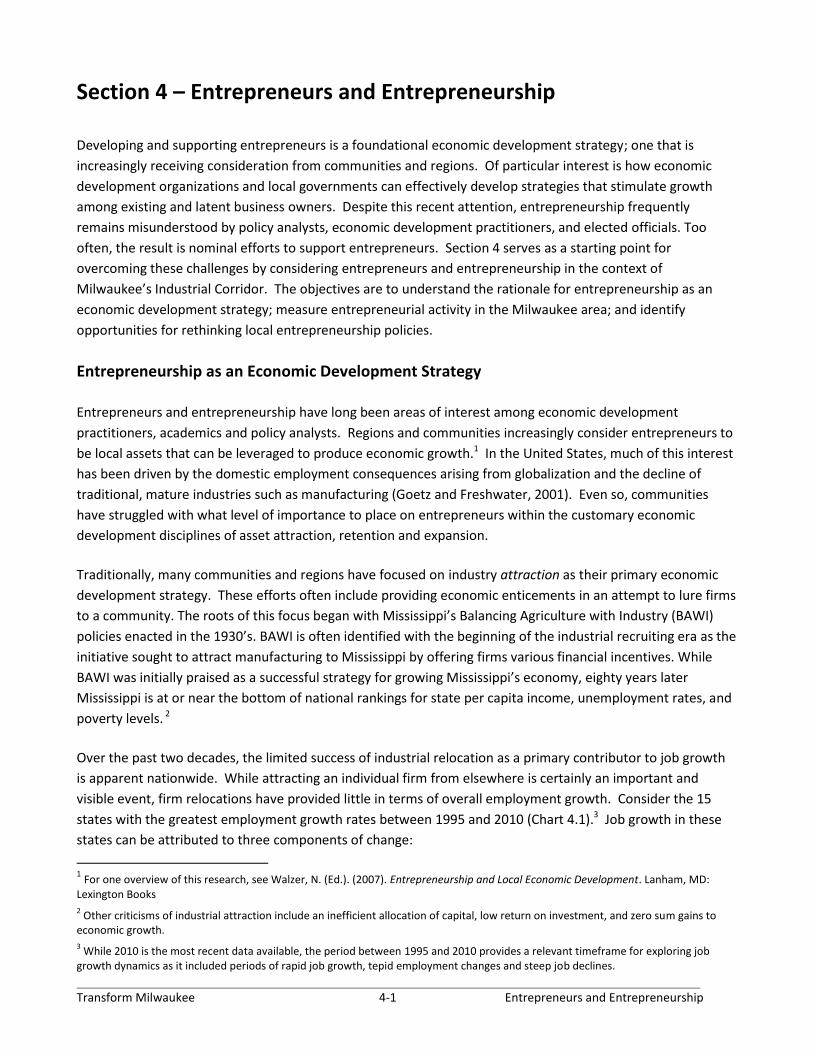
visible event, firm relocations have provided little in terms of overall employment growth. Consider the 15
states with the greatest employment growth rates between 1995 and 2010 (Chart 4.1).3 Job growth in these
states can be attributed to three components of change:
1 For one overview of this research, see Walzer, N. (Ed.). (2007). Entrepreneurship and Local Economic Development. Lanham, MD:
Lexington Books
2 Other criticisms of industrial attraction include an inefficient allocation of capital, low return on investment, and zero sum gains to
economic growth.
3 While 2010 is the most recent data available, the period between 1995 and 2010 provides a relevant timeframe for exploring job
growth dynamics as it included periods of rapid job growth, tepid employment changes and steep job declines.
Transform Milwaukee 4-2 Entrepreneurs and Entrepreneurship
1. Net establishment openings - Jobs in establishment openings minus jobs in establishment closings;
2. Net establishment expansions - Jobs in establishment expansions minus jobs in establishment contractions;
3. Net establishment relocations - Jobs in establishments moving into a region minus jobs in establishments
moving out of a region;
Chart 4.1 shows that job contributions from establishment expansions provide by far the greatest shares of
new jobs in most of the top 15 states.4 Furthermore, jobs from net openings tend to provide the second
largest source of job growth in most states. While net openings do involve some level of industry attraction, a
large share is from endogenous new startups. Net relocations, the remaining component of job growth,
provide only minor influences on new employment in some states, with no contributions in others. While
these figures provide just one perspective, additional research shows similar connections between economic
growth and business start-ups and expansions at a variety of geographic scales, both urban and rural.5
Chart 4.1 – Components of Job Growth among the 15 States with Greatest Employment Growth Rates (1995 to 2010)
Sources: YourEconomy.org and UW-Extension Center for Community and Economic Development
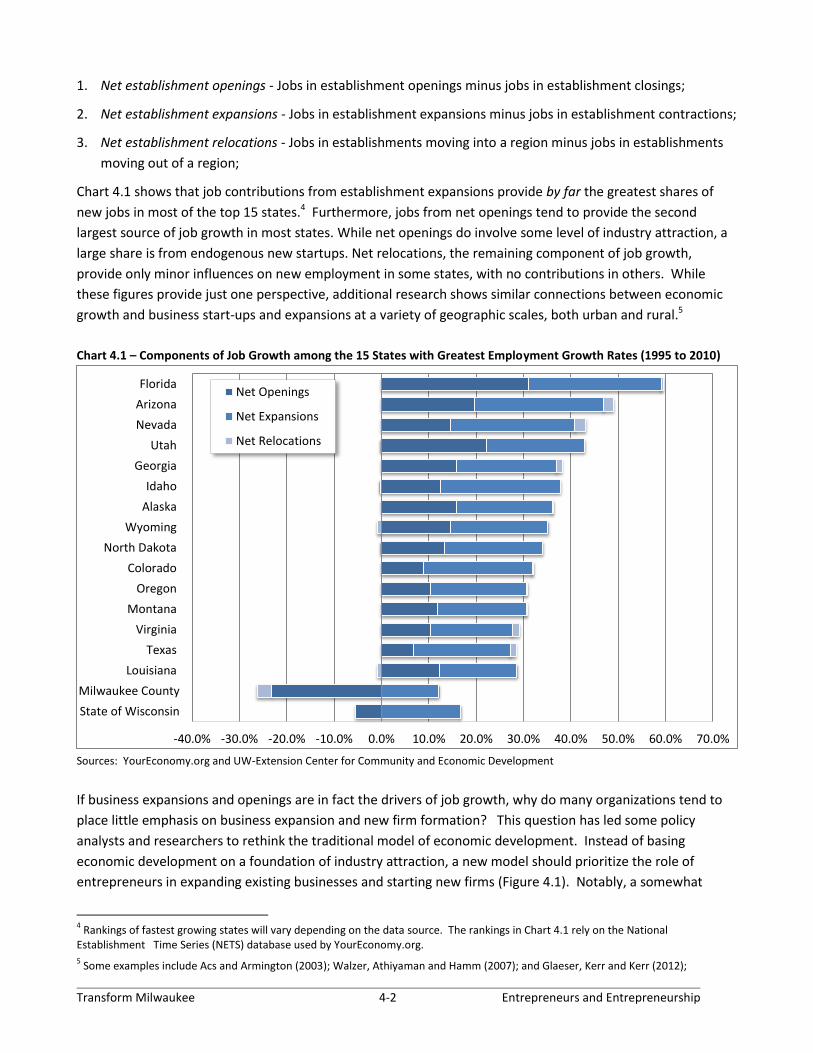
If business expansions and openings are in fact the drivers of job growth, why do many organizations tend to
place little emphasis on business expansion and new firm formation? This question has led some policy
analysts and researchers to rethink the traditional model of economic development. Instead of basing
economic development on a foundation of industry attraction, a new model should prioritize the role of
entrepreneurs in expanding existing businesses and starting new firms (Figure 4.1). Notably, a somewhat
4 Rankings of fastest growing states will vary depending on the data source. The rankings in Chart 4.1 rely on the National
Establishment Time Series (NETS) database used by YourEconomy.org.
5 Some examples include Acs and Armington (2003); Walzer, Athiyaman and Hamm (2007); and Glaeser, Kerr and Kerr (2012);
-40.0% -30.0% -20.0% -10.0% 0.0% 10.0% 20.0% 30.0% 40.0% 50.0% 60.0% 70.0%
Florida
Arizona
Nevada
Utah
Georgia
Idaho
Alaska
Wyoming
North Dakota
Colorado
Oregon
Montana
Virginia
Texas
Louisiana
Milwaukee County
State of Wisconsin
Net Openings
Net Expansions
Net Relocations
Transform Milwaukee 4-3 Entrepreneurs and Entrepreneurship
Traditional Model
Industrial Recruitment
Small Business Startups
Expansion
New Model
Attraction
Entrepreneurship
Retention
Figure 4.1 – Traditional and New Models of Economic Development
Source: Dabson (2003)
similar conclusion was drawn by a 2011 Public Policy Forum report looking at Milwaukee’s economic
development landscape:6
“In contrast to business attraction and financing, the resources dedicated to business
development and assistance are limited. Only three of the eight participants focus on business
development services targeted at start-ups and small/micro businesses, and those
organizations operate with relatively low budgets overall. BizStarts Milwaukee, for example,
had an operating budget of $389,805 in 2011—one of the lowest budgets of any organization
included on the map. WWBIC, an organization dedicated to providing both technical and
financial assistance to small and micro businesses, had a 2011 operating budget of slightly
more than $3.6 million, with one-third of the organization’s activities occurring outside of
southeast Wisconsin. In interviews conducted for this report, some participants suggested that
the resource discrepancy between business attraction and real estate financing on the one
hand, and support for start-ups and small business expansion on the other, should be
revisited.” (pg. 46).
Implementing a new model for local economic development can be challenging. Understandably, political
pressure, reduced visibility, and loss of funding are concerns facing organizations considering a new approach.
The challenges facing an increased emphasis on entrepreneurship in Milwaukee’s Industrial Corridor are likely
no different. Some of these apprehensions can be eased by noting that industry attraction is not abandoned in
the new model of economic development.7 In fact, the job growth trends and economic conditions noted in
the introduction to this report suggest attraction, retention and expansion all have necessary roles. However,
the largest challenge in adopting this new model may lie in understanding entrepreneurs and
entrepreneurship.
6 See: Helpap, D., Henken, R. and Peterangelo, J. (2011) Assembling the Parts: An examination of Milwaukee’s economic development
landscape. Public Policy Forum. Milwaukee, WI. 7 However, attraction in the new model is modified somewhat as it applies not only to the attraction of industries, but also the
attraction of new human, financial and social capital.
Transform Milwaukee 4-4 Entrepreneurs and Entrepreneurship
Defining Entrepreneurs
As entrepreneurship has become a somewhat recent emphasis of economic development efforts, policies and
strategies that effectively encourage the development of entrepreneurs are well not understood, particularly
at the local level. Some of this confusion arises from loosely-defined characterizations of an “entrepreneur.”
This is understandable. After all, researchers and academics in economics, sociology, psychology and political
science do not have consensus as to what constitutes an entrepreneur. While the debate over definitions
need not be repeated as part of this analysis, developing entrepreneurship strategies in Milwaukee’s Industrial
Corridor does require aligning policies with some formal perspectives on entrepreneurs and entrepreneurial
ventures.8
Ahmed and Hoffman (2008) define entrepreneurs as “people who design, produce and generate value through
the creation or expansion of economic activity.” This definition, or a similar one, is significant for two reasons.
First, the focus of the definition is on people and not economic institutions. Consequently, a primary strategy
for fostering entrepreneurs should be developing people, not merely enhancing infrastructure and business
climate. Second, Ahmed and Hoffman’s definition encompasses all economic activity and is not restricted to
the creation or expansion of businesses. As noted by Drucker (1985), entrepreneurial ventures are not limited
to businesses, but can include non-profits, universities and government institutions. While the creation and
expansion of new businesses will be the focus of this analysis, the development of entrepreneurial institutions
also will be considered.
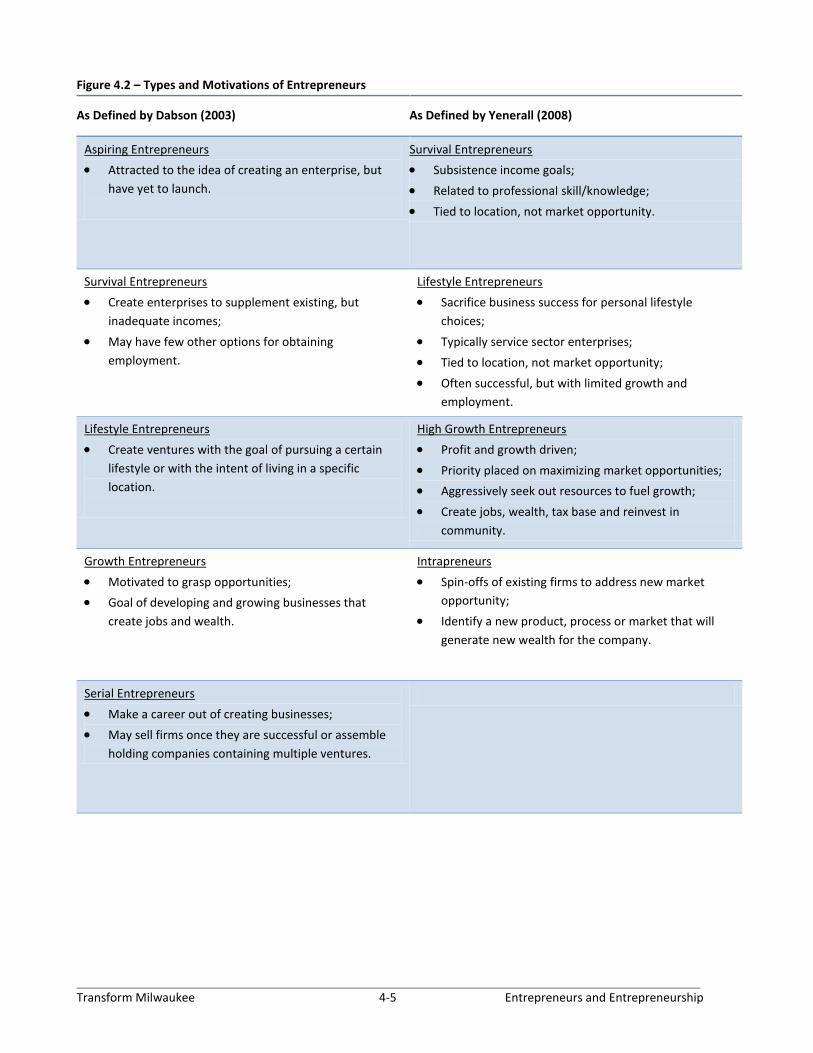
Understanding entrepreneurs also requires knowing an individual’s motives and goals (Figure 4.2). Some
people become entrepreneurs out of necessity. They form a venture to create economic opportunities where
few may exist. Others are driven by growth and look to create firms that generate jobs and wealth. These
varying entrepreneurial types will have different impacts on a community. Furthermore, diversity among
entrepreneurs suggests that entrepreneurship should not be conflated with small business development.
While entrepreneurial endeavors are often small in scale, they can include large and multiple ventures.
When considering the different types of entrepreneurs in Figure 4.2, it may be tempting from a policy
perspective to dismiss survival and lifestyle entrepreneurs and focus on growth or serial entrepreneurs.
Relatively few survival and lifestyle entrepreneurs will evolve into larger drivers of the local economy, whereas
growth and serial entrepreneurs may generate a larger return on public support or investment. However, all
types of entrepreneurs add to the local economy and contribute to the overall entrepreneurial culture in a
community (Dabson, 2007). Moreover, policies designed to support and develop these individuals need to
vary. For instance, a survival entrepreneur has different capital and technical assistance needs than does a
growth or serial entrepreneur.
8 For more on defining entrepreneurs, see Dabson, B. (2007) Entrepreneurship as a Rural Economic Development Policy: A Changing
Paradigm. In Walzer, N (Ed), Entrepreneurship and Local Economic Development (pp. 81-102). Lanham, MD: Lexington Books
Transform Milwaukee 4-5 Entrepreneurs and Entrepreneurship
Figure 4.2 – Types and Motivations of Entrepreneurs
As Defined by Dabson (2003) As Defined by Yenerall (2008)
Aspiring Entrepreneurs
Attracted to the idea of creating an enterprise, but
have yet to launch.
Survival Entrepreneurs
Subsistence income goals;
Related to professional skill/knowledge;
Tied to location, not market opportunity.
Survival Entrepreneurs
Create enterprises to supplement existing, but
inadequate incomes;
May have few other options for obtaining
employment.
Lifestyle Entrepreneurs
Sacrifice business success for personal lifestyle
choices;
Typically service sector enterprises;
Tied to location, not market opportunity;
Often successful, but with limited growth and
employment.
Lifestyle Entrepreneurs
Create ventures with the goal of pursuing a certain
lifestyle or with the intent of living in a specific
location.
High Growth Entrepreneurs
Profit and growth driven;
Priority placed on maximizing market opportunities;
Aggressively seek out resources to fuel growth;
Create jobs, wealth, tax base and reinvest in
community.
Growth Entrepreneurs
Motivated to grasp opportunities;
Goal of developing and growing businesses that
create jobs and wealth.
Intrapreneurs
Spin-offs of existing firms to address new market
opportunity;
Identify a new product, process or market that will
generate new wealth for the company.
Serial Entrepreneurs
Make a career out of creating businesses;
May sell firms once they are successful or assemble
holding companies containing multiple ventures.
Transform Milwaukee 4-6 Entrepreneurs and Entrepreneurship
Measuring Entrepreneurial Activity in the Milwaukee Region
Measuring entrepreneurial activity provides insights into the current intensity of the so-called entrepreneurial
“seed bed” in Milwaukee. That is, knowing levels of entrepreneurship potentially can guide efforts to identify
and develop supportive strategies. Just as defining “entrepreneurs” is challenging, it is also difficult to
measure entrepreneurial activity. Researchers and policy analysts have used a variety of metrics including:
new business formations; employment growth in startups; self-employment; proprietor or self-employment
income; initial public offerings; and investment activity (such as angel capital and venture capital). As no one
measure is comprehensive, a variety of metrics are used in this analysis:
Non-farm proprietors as a share of employment;
Household self-employment income;
Business births and deaths;
Employment and establishments by business
stage;
Minority-business enterprises.
Note that most of these measures are only available at either the county or regional level. Still, statistics for
Milwaukee County, the Milwaukee-Waukesha-West Allis MSA or the M7 Region are useful as they provide
perspectives on broader entrepreneurial culture in the region. Potential entrepreneurs throughout the region
also may provide opportunities for developing enterprises in Milwaukee’s Industrial Corridor.
Non-Farm Proprietors
Non-farm proprietor figures from the Bureau of Economic Analysis measure levels of non-farm self-
employment. These include sole-proprietors (e.g. non-employers) and individual business partners not
assumed to be limited partners. Self-employment estimates differ somewhat from other employment figures
as they are mostly reported by place-of-residence, rather than place-of-work. Furthermore, self-employment
estimates reflect the total number of sole proprietorships or partnerships active at any time during the year,
rather than the annual averages used for other measures of employment in this study.
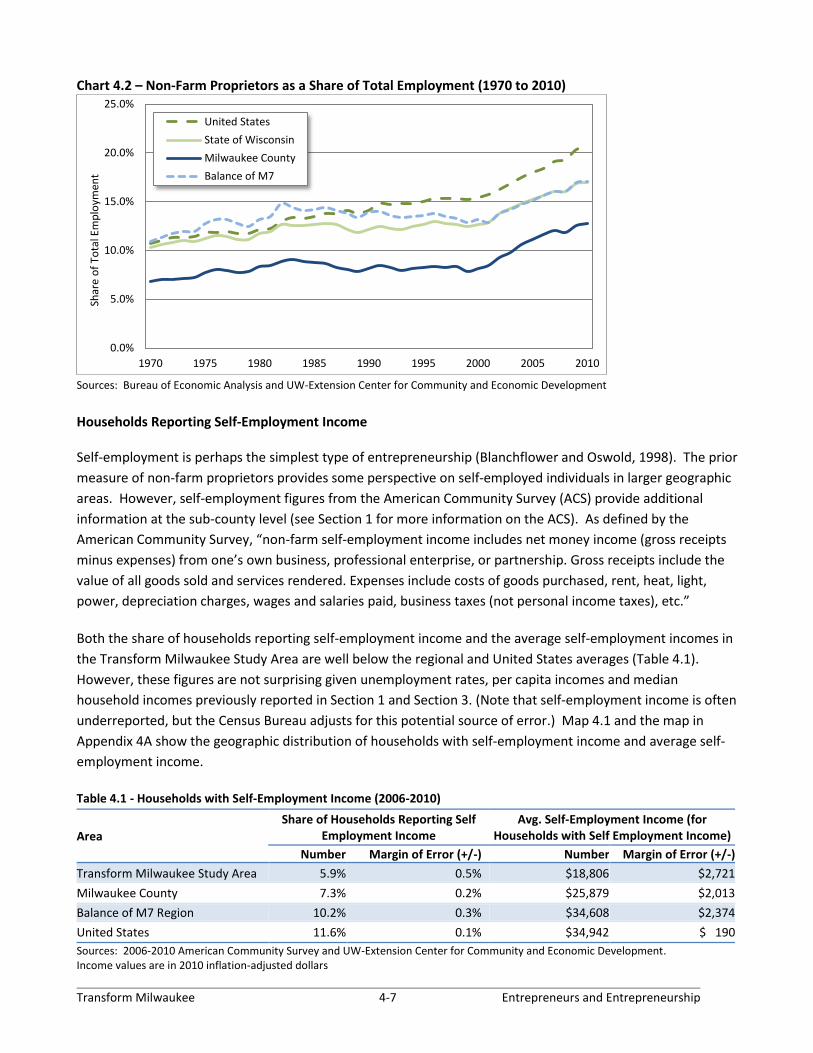
Non-farm proprietors are measured here as a percent of total employment in an area (Chart 4.2). Also called
entrepreneurship breadth, self-employment as a share of total employment provides perspective on the broad
propensity for entrepreneurial activity in an area.9 Despite similar growth trends, Milwaukee County, the
Balance of the M7 Region and the State of Wisconsin all have trailed the nation’s rate of entrepreneurship
breadth since the late 1980’s. Speculations for these lower levels throughout Wisconsin have been made, but
no definitive conclusion is available. In fact, the values are likely a combination of reasons. One specific factor
deserving further research is the state’s historical reliance on manufacturing, as the past availability of well-
paying jobs (many of them with benefits) may have reduced an individual’s incentive to be entrepreneurial.10
The increasing shares of self-employed individuals between 2000 and 2010 should be noted for all areas
depicted on Chart 4.2. While self-employment increased over this time, wage and salary employment growth
declined in Milwaukee County and was relatively flat in the U.S., Wisconsin and the Balance of the M7 Region.
Consequently, the increasing shares in the last decade largely are explained by other forms of employment not
keeping pace with the growth in self-employment.
9 For more on entrepreneurial breadth, see Henderson, J., Low, S.A., and Weiler, S. (2007) The Drivers of Regional Entrepreneurship in Rural and Metro Areas. In Walzer, N (Ed), Entrepreneurship and Local Economic Development (pp. 81-102). Lanham, MD: Lexington Books 10 A related hypothesis was first suggested by Chinitz (1961) and was recently expanded upon by Glaeser, Kerr and Kerr (2012).
Transform Milwaukee 4-7 Entrepreneurs and Entrepreneurship
Chart 4.2 – Non-Farm Proprietors as a Share of Total Employment (1970 to 2010)
Sources: Bureau of Economic Analysis and UW-Extension Center for Community and Economic Development
Households Reporting Self-Employment Income
Self-employment is perhaps the simplest type of entrepreneurship (Blanchflower and Oswold, 1998). The prior
measure of non-farm proprietors provides some perspective on self-employed individuals in larger geographic
areas. However, self-employment figures from the American Community Survey (ACS) provide additional
information at the sub-county level (see Section 1 for more information on the ACS). As defined by the
American Community Survey, “non-farm self-employment income includes net money income (gross receipts
minus expenses) from one’s own business, professional enterprise, or partnership. Gross receipts include the
value of all goods sold and services rendered. Expenses include costs of goods purchased, rent, heat, light,
power, depreciation charges, wages and salaries paid, business taxes (not personal income taxes), etc.”
Both the share of households reporting self-employment income and the average self-employment incomes in
the Transform Milwaukee Study Area are well below the regional and United States averages (Table 4.1).
However, these figures are not surprising given unemployment rates, per capita incomes and median
household incomes previously reported in Section 1 and Section 3. (Note that self-employment income is often
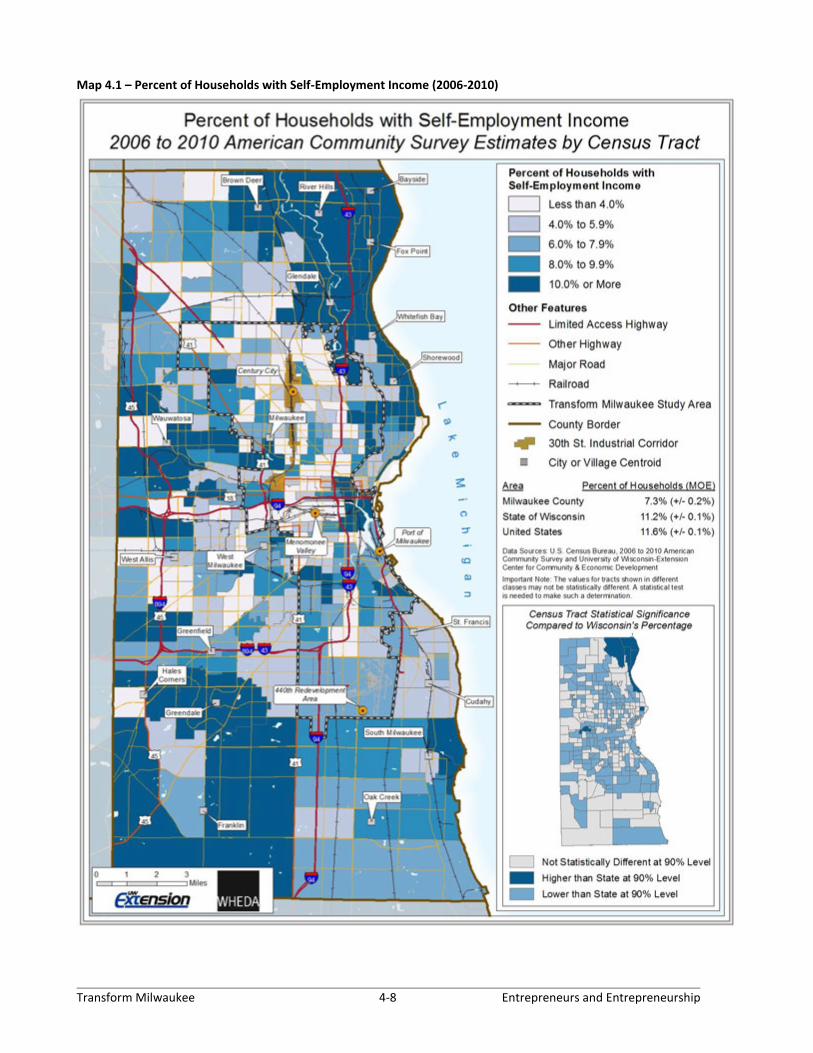
underreported, but the Census Bureau adjusts for this potential source of error.) Map 4.1 and the map in
Appendix 4A show the geographic distribution of households with self-employment income and average self-
employment income.
Table 4.1 - Households with Self-Employment Income (2006-2010)
Area
Share of Households Reporting Self Employment Income
Avg. Self-Employment Income (for Households with Self Employment Income)
Number Margin of Error (+/-) Number Margin of Error (+/-)
Transform Milwaukee Study Area 5.9% 0.5% $18,806 $2,721
Milwaukee County 7.3% 0.2% $25,879 $2,013
Balance of M7 Region 10.2% 0.3% $34,608 $2,374
United States 11.6% 0.1% $34,942 $ 190
Sources: 2006-2010 American Community Survey and UW-Extension Center for Community and Economic Development. Income values are in 2010 inflation-adjusted dollars
0.0%
5.0%
10.0%
15.0%
20.0%
25.0%
1970 1975 1980 1985 1990 1995 2000 2005 2010
Shar
e o
f To
tal E
mp
loym
ent
United States
State of Wisconsin
Milwaukee County
Balance of M7
Transform Milwaukee 4-8 Entrepreneurs and Entrepreneurship
Map 4.1 – Percent of Households with Self-Employment Income (2006-2010)
Transform Milwaukee 4-9 Entrepreneurs and Entrepreneurship
Establishment Births and Deaths
A popular view is that small businesses create most of the jobs in the United States. However, the exact role of
small businesses in job creation has been subject to much debate concerning: 1) the definition of a small
business; 2) the migration of firms between large and small employment categories; and 3) the time-frame
used to measure job growth (Davis, Haltiwanger and Schuh, 1996). Recently, research rooted in longitudinal
databases suggests that young businesses, not necessarily small businesses, are a better predictor of job
growth (Haltiwanger, Jarmin and Miranda, 2010; Haltiwanger, Hyatt, McEntarfer and Sousa, 2012). While not
all young firms are the same, these studies suggest that business births are an active component of job
creation. The employment contributions of business births in the form of net openings also were apparent
when considering the job creation dynamics previously reported in Chart 4.1.
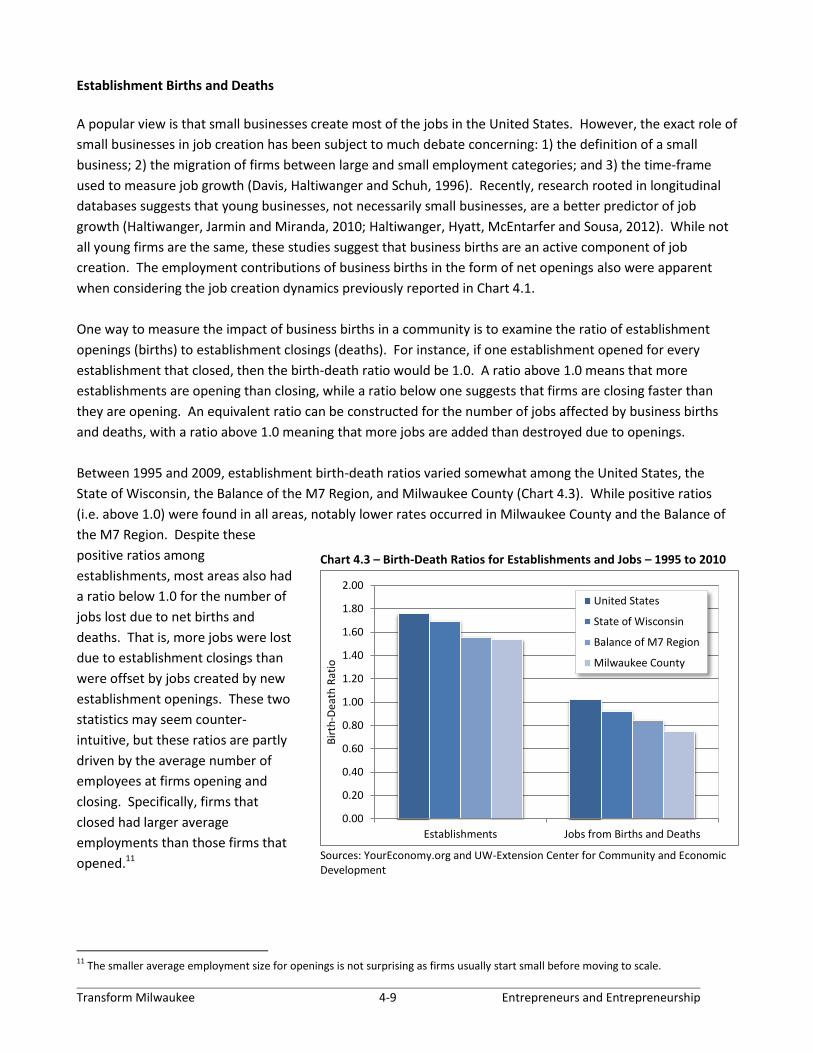
One way to measure the impact of business births in a community is to examine the ratio of establishment
openings (births) to establishment closings (deaths). For instance, if one establishment opened for every
establishment that closed, then the birth-death ratio would be 1.0. A ratio above 1.0 means that more
establishments are opening than closing, while a ratio below one suggests that firms are closing faster than
they are opening. An equivalent ratio can be constructed for the number of jobs affected by business births
and deaths, with a ratio above 1.0 meaning that more jobs are added than destroyed due to openings.
Between 1995 and 2009, establishment birth-death ratios varied somewhat among the United States, the
State of Wisconsin, the Balance of the M7 Region, and Milwaukee County (Chart 4.3). While positive ratios
(i.e. above 1.0) were found in all areas, notably lower rates occurred in Milwaukee County and the Balance of
the M7 Region. Despite these
positive ratios among
establishments, most areas also had
a ratio below 1.0 for the number of
jobs lost due to net births and
deaths. That is, more jobs were lost
due to establishment closings than
were offset by jobs created by new
establishment openings. These two
statistics may seem counter-
intuitive, but these ratios are partly
driven by the average number of
employees at firms opening and
closing. Specifically, firms that
closed had larger average
employments than those firms that
opened.11
11
The smaller average employment size for openings is not surprising as firms usually start small before moving to scale.
Chart 4.3 – Birth-Death Ratios for Establishments and Jobs – 1995 to 2010
Sources: YourEconomy.org and UW-Extension Center for Community and Economic Development
0.00
0.20
0.40
0.60
0.80
1.00
1.20
1.40
1.60
1.80
2.00
Establishments Jobs from Births and Deaths
Bir
th-D
eath
Rat
io
United States
State of Wisconsin
Balance of M7 Region
Milwaukee County
Transform Milwaukee 4-10 Entrepreneurs and Entrepreneurship
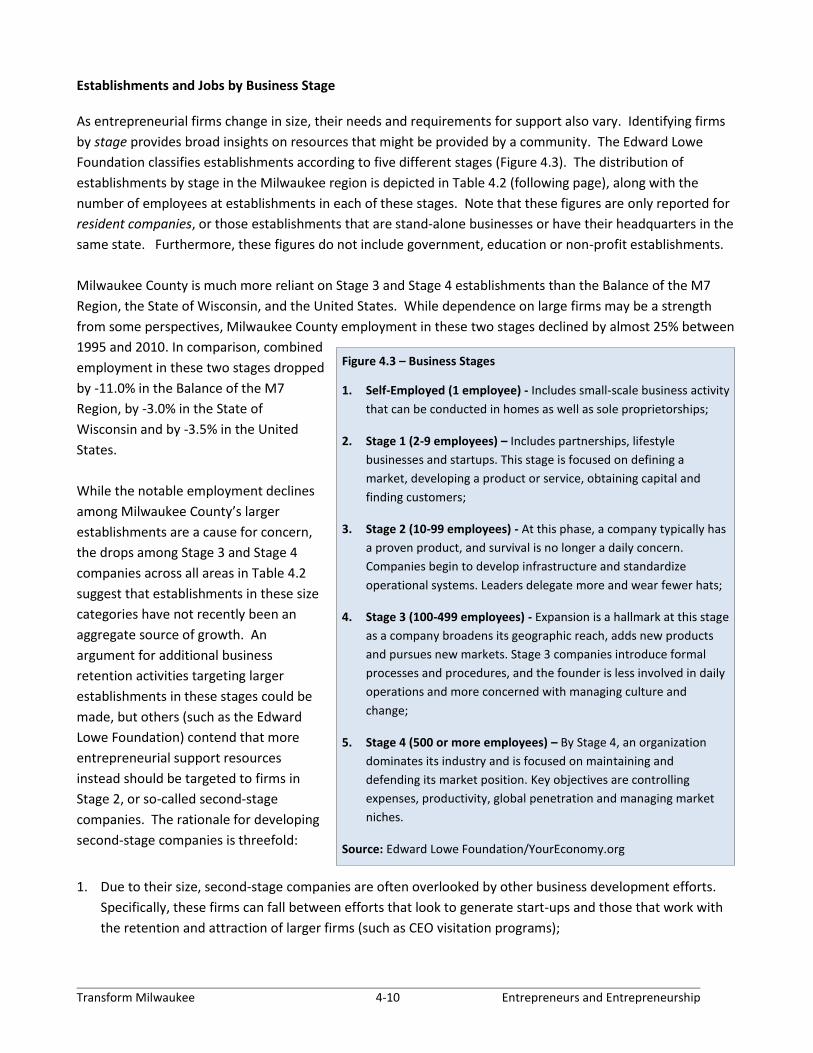
Figure 4.3 – Business Stages
1. Self-Employed (1 employee) - Includes small-scale business activity
that can be conducted in homes as well as sole proprietorships;
2. Stage 1 (2-9 employees) – Includes partnerships, lifestyle
businesses and startups. This stage is focused on defining a
market, developing a product or service, obtaining capital and
finding customers;
3. Stage 2 (10-99 employees) - At this phase, a company typically has
a proven product, and survival is no longer a daily concern.
Companies begin to develop infrastructure and standardize
operational systems. Leaders delegate more and wear fewer hats;
4. Stage 3 (100-499 employees) - Expansion is a hallmark at this stage
as a company broadens its geographic reach, adds new products
and pursues new markets. Stage 3 companies introduce formal
processes and procedures, and the founder is less involved in daily
operations and more concerned with managing culture and
change;
5. Stage 4 (500 or more employees) – By Stage 4, an organization
dominates its industry and is focused on maintaining and
defending its market position. Key objectives are controlling
expenses, productivity, global penetration and managing market
niches.
Source: Edward Lowe Foundation/YourEconomy.org
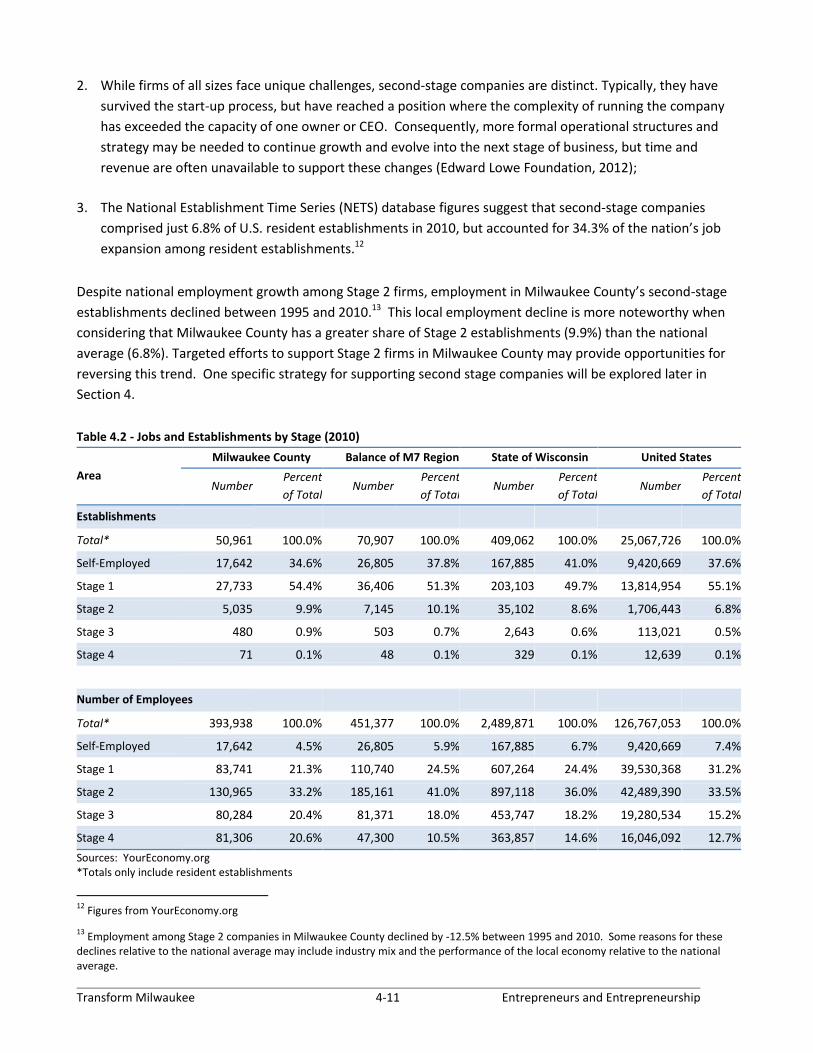
Establishments and Jobs by Business Stage As entrepreneurial firms change in size, their needs and requirements for support also vary. Identifying firms
by stage provides broad insights on resources that might be provided by a community. The Edward Lowe
Foundation classifies establishments according to five different stages (Figure 4.3). The distribution of
establishments by stage in the Milwaukee region is depicted in Table 4.2 (following page), along with the
number of employees at establishments in each of these stages. Note that these figures are only reported for
resident companies, or those establishments that are stand-alone businesses or have their headquarters in the
same state. Furthermore, these figures do not include government, education or non-profit establishments.
Milwaukee County is much more reliant on Stage 3 and Stage 4 establishments than the Balance of the M7
Region, the State of Wisconsin, and the United States. While dependence on large firms may be a strength
from some perspectives, Milwaukee County employment in these two stages declined by almost 25% between
1995 and 2010. In comparison, combined
employment in these two stages dropped
by -11.0% in the Balance of the M7
Region, by -3.0% in the State of
Wisconsin and by -3.5% in the United
States.
While the notable employment declines
among Milwaukee County’s larger
establishments are a cause for concern,
the drops among Stage 3 and Stage 4
companies across all areas in Table 4.2
suggest that establishments in these size
categories have not recently been an
aggregate source of growth. An
argument for additional business
retention activities targeting larger
establishments in these stages could be
made, but others (such as the Edward
Lowe Foundation) contend that more
entrepreneurial support resources
instead should be targeted to firms in
Stage 2, or so-called second-stage
companies. The rationale for developing
second-stage companies is threefold:
1. Due to their size, second-stage companies are often overlooked by other business development efforts.
Specifically, these firms can fall between efforts that look to generate start-ups and those that work with
the retention and attraction of larger firms (such as CEO visitation programs);
Transform Milwaukee 4-11 Entrepreneurs and Entrepreneurship
2. While firms of all sizes face unique challenges, second-stage companies are distinct. Typically, they have
survived the start-up process, but have reached a position where the complexity of running the company
has exceeded the capacity of one owner or CEO. Consequently, more formal operational structures and
strategy may be needed to continue growth and evolve into the next stage of business, but time and
revenue are often unavailable to support these changes (Edward Lowe Foundation, 2012);
3. The National Establishment Time Series (NETS) database figures suggest that second-stage companies
comprised just 6.8% of U.S. resident establishments in 2010, but accounted for 34.3% of the nation’s job
expansion among resident establishments.12
Despite national employment growth among Stage 2 firms, employment in Milwaukee County’s second-stage
establishments declined between 1995 and 2010.13 This local employment decline is more noteworthy when
considering that Milwaukee County has a greater share of Stage 2 establishments (9.9%) than the national
average (6.8%). Targeted efforts to support Stage 2 firms in Milwaukee County may provide opportunities for
reversing this trend. One specific strategy for supporting second stage companies will be explored later in
Section 4.
Table 4.2 - Jobs and Establishments by Stage (2010)
Area
Milwaukee County Balance of M7 Region State of Wisconsin United States
Number Percent
of Total Number
Percent
of Total Number
Percent
of Total Number
Percent
of Total
Establishments
Total* 50,961 100.0% 70,907 100.0% 409,062 100.0% 25,067,726 100.0%
Self-Employed 17,642 34.6% 26,805 37.8% 167,885 41.0% 9,420,669 37.6%
Stage 1 27,733 54.4% 36,406 51.3% 203,103 49.7% 13,814,954 55.1%
Stage 2 5,035 9.9% 7,145 10.1% 35,102 8.6% 1,706,443 6.8%
Stage 3 480 0.9% 503 0.7% 2,643 0.6% 113,021 0.5%
Stage 4 71 0.1% 48 0.1% 329 0.1% 12,639 0.1%
Number of Employees
Total* 393,938 100.0% 451,377 100.0% 2,489,871 100.0% 126,767,053 100.0%
Self-Employed 17,642 4.5% 26,805 5.9% 167,885 6.7% 9,420,669 7.4%
Stage 1 83,741 21.3% 110,740 24.5% 607,264 24.4% 39,530,368 31.2%
Stage 2 130,965 33.2% 185,161 41.0% 897,118 36.0% 42,489,390 33.5%
Stage 3 80,284 20.4% 81,371 18.0% 453,747 18.2% 19,280,534 15.2%
Stage 4 81,306 20.6% 47,300 10.5% 363,857 14.6% 16,046,092 12.7%
Sources: YourEconomy.org *Totals only include resident establishments
12
Figures from YourEconomy.org 13
Employment among Stage 2 companies in Milwaukee County declined by -12.5% between 1995 and 2010. Some reasons for these declines relative to the national average may include industry mix and the performance of the local economy relative to the national average.
Transform Milwaukee 4-12 Entrepreneurs and Entrepreneurship
Minority-Business Enterprises
Creating and developing successful entrepreneurs has long been encouraged as a strategy for promoting
economic advancement among minority groups. In particular, the creation of Minority Business Enterprises
(MBEs) has been suggested as an alternative route to employment, a means to escape poverty, and a strategy
for combating high unemployment rates among minorities (such as those rates found in the Transform
Milwaukee Study Area). Certainly, starting a business creates an employment opportunity for the proprietor,
but research also suggests that larger MBEs also produce additional employment opportunities in minority
communities. Specifically, MBEs are more likely to locate in urban minority communities and employ minority
workers from low income areas than non-minority owned businesses (Bates 2006).14
MBEs face a number of challenges that often result in smaller, less profitable and less viable firms (Bates, 1997;
Smith, 2005). A large body of research has been devoted to understanding these challenges, including
variations in success and formation rates across the United States. Commonly identified factors include: lower
levels of educational attainment; poor access to financial capital and management expertise; smaller
probabilities of having self-employed parents; experience levels; household characteristics; discrimination and
segregation; demographic trends; and the influence of historical events such as the Great Migration (Bates,
Lofstrom and Servon, 2011; Bogan and Darity, 2007; Boston and Boston, 2007; Smith, 2005). However, the
influence of these factors on MBE formation and success rates can vary among minority groups and business
types. For instance, Bates et al (2011) find that financial constraints may have little effect on entrepreneurial
entry to industries with low human capital requirements.
Minority business enterprises have been measured previously in Milwaukee, but deserve additional research.15
To analyze the ownership rates and types of minority businesses enterprises in Milwaukee, figures are
summarized from the 2007 Survey of Business Owners (SBO). Conducted every five years by the Census
Bureau, the SBO reports business ownership by gender, ethnicity, race, and veteran status. Survey coverage
encompasses non-farm businesses with receipts of $1,000 or more that filed Internal Revenue Service tax
forms as individual proprietorships, partnerships, or any type of corporation. Note that the 2012 SBO is
currently underway, but the results are not scheduled to be released until 2015.
The Survey of Business Owners is conducted on a company or firm basis, rather than an establishment basis,
and includes firms with paid employees and firms without paid employees. Business ownership is defined as
having 51 percent or more of the stock or equity in the business.16 Businesses may also be classified in more
than one racial group if the sole owner reported to be of more than one race; the majority owner was
reported to be of more than one race; or a majority combination of owners was reported to be of more than
one race. While data are available for Milwaukee County, the analysis relies on figures reported for the
Milwaukee-Waukesha-West Allis MSA as much of the information at the county level is suppressed due to
confidentiality considerations. Even so, a large percentage of the MBEs in the metropolitan area are located in
Milwaukee County.
14 Construction firms are the most likely to actively hire workers in low-income minority communities. 15 See: Minority Business Ownership in Metropolitan Milwaukee in the 1990s: Some Statistical Indicators and Comparisons to the Nation's Largest Metropolitan Areas. May 14, 2001. Marc V. Levine and Lisa Heuler Williams. 16 Minority-owned firms are those where Blacks or African Americans, American Indians and Alaska Natives, Asians, Native Hawaiians and Other Pacific Islanders, and/or Hispanics own 51 percent or more of the equity, interest, or stock of the business.
Transform Milwaukee 4-13 Entrepreneurs and Entrepreneurship
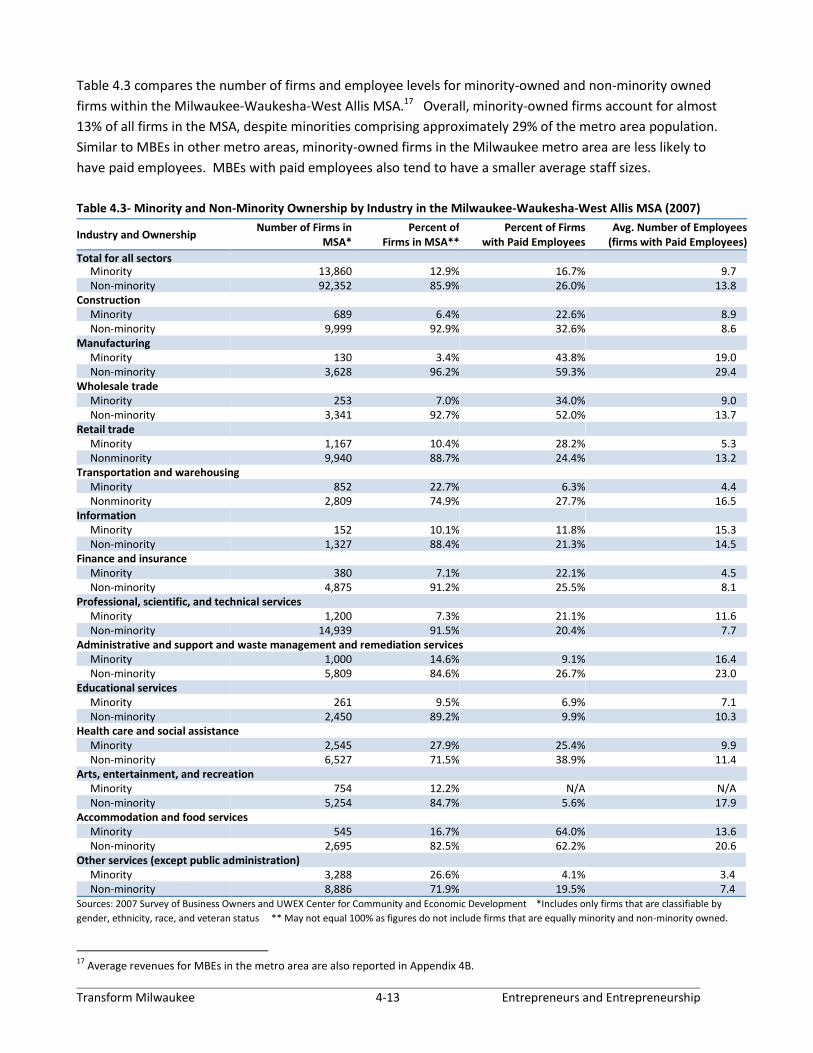
Table 4.3 compares the number of firms and employee levels for minority-owned and non-minority owned
firms within the Milwaukee-Waukesha-West Allis MSA.17 Overall, minority-owned firms account for almost
13% of all firms in the MSA, despite minorities comprising approximately 29% of the metro area population.
Similar to MBEs in other metro areas, minority-owned firms in the Milwaukee metro area are less likely to
have paid employees. MBEs with paid employees also tend to have a smaller average staff sizes.
Table 4.3- Minority and Non-Minority Ownership by Industry in the Milwaukee-Waukesha-West Allis MSA (2007)
Industry and Ownership Number of Firms in
MSA* Percent of
Firms in MSA** Percent of Firms
with Paid Employees Avg. Number of Employees
(firms with Paid Employees)
Total for all sectors Minority 13,860 12.9% 16.7% 9.7 Non-minority 92,352 85.9% 26.0% 13.8 Construction Minority 689 6.4% 22.6% 8.9 Non-minority 9,999 92.9% 32.6% 8.6 Manufacturing Minority 130 3.4% 43.8% 19.0 Non-minority 3,628 96.2% 59.3% 29.4 Wholesale trade Minority 253 7.0% 34.0% 9.0 Non-minority 3,341 92.7% 52.0% 13.7 Retail trade Minority 1,167 10.4% 28.2% 5.3 Nonminority 9,940 88.7% 24.4% 13.2 Transportation and warehousing Minority 852 22.7% 6.3% 4.4 Nonminority 2,809 74.9% 27.7% 16.5 Information Minority 152 10.1% 11.8% 15.3 Non-minority 1,327 88.4% 21.3% 14.5 Finance and insurance Minority 380 7.1% 22.1% 4.5 Non-minority 4,875 91.2% 25.5% 8.1 Professional, scientific, and technical services Minority 1,200 7.3% 21.1% 11.6 Non-minority 14,939 91.5% 20.4% 7.7 Administrative and support and waste management and remediation services Minority 1,000 14.6% 9.1% 16.4 Non-minority 5,809 84.6% 26.7% 23.0 Educational services Minority 261 9.5% 6.9% 7.1 Non-minority 2,450 89.2% 9.9% 10.3 Health care and social assistance Minority 2,545 27.9% 25.4% 9.9 Non-minority 6,527 71.5% 38.9% 11.4 Arts, entertainment, and recreation Minority 754 12.2% N/A N/A Non-minority 5,254 84.7% 5.6% 17.9 Accommodation and food services Minority 545 16.7% 64.0% 13.6 Non-minority 2,695 82.5% 62.2% 20.6 Other services (except public administration) Minority 3,288 26.6% 4.1% 3.4 Non-minority 8,886 71.9% 19.5% 7.4 Sources: 2007 Survey of Business Owners and UWEX Center for Community and Economic Development *Includes only firms that are classifiable by
gender, ethnicity, race, and veteran status ** May not equal 100% as figures do not include firms that are equally minority and non-minority owned.
17
Average revenues for MBEs in the metro area are also reported in Appendix 4B.
Transform Milwaukee 4-14 Entrepreneurs and Entrepreneurship
The Milwaukee metro area’s overall minority ownership rate of 12.9% is low compared to its total share of
minority residents. However, minority ownership rates in the metro area are even lower among so-called high
barrier industries. As defined by Bates et al (2011), a high-barrier industry is one defined by advanced
educational requirements and/or large levels of startup capital. Examples of high-barrier industries with small
relative levels of minority ownership in the Milwaukee-Waukesha-West Allis MSA include professional,
scientific and professional services (7.3% of firms); finance and insurance (7.1%); and wholesale trade (7.0%).
The share of MBEs in manufacturing (another high barrier industry) is especially surprising with minority-
ownership accounting for just 3.4% of firms in the metro area.
In contrast, MBEs in the Milwaukee MSA have higher shares of firms in low-barrier industries, or industries
relatively accessible to individuals with less than a college education and without large financial capital
requirements. Not unlike other large metropolitan areas, minority ownership rates in the Milwaukee metro
area tend to be the greatest in low-barrier industries including administrative and support services (14.6%);
accommodations and food services (16.7%); transportation and warehousing (22.7%) and other services
(26.6%). The one key exception in this low barrier distribution is construction, where minority-owned firms
only account for 6.4% of all firms in the MSA.18
While MBEs are important across all ethnicities and racial categories, this analysis primarily considers
ownership rates among Black or African American residents and Hispanic or Latino residents. Ownership
within these two groups in the Milwaukee-Waukesha-West Allis MSA is compared to MBEs in the 51 other U.S.
metro areas with a population of one-million or more. While this study is not intended to be a benchmarking
analysis, these comparisons provide perspectives and updates on past statistics suggesting that the Milwaukee
metro area has some of the lowest minority business ownership rates in the nation.19
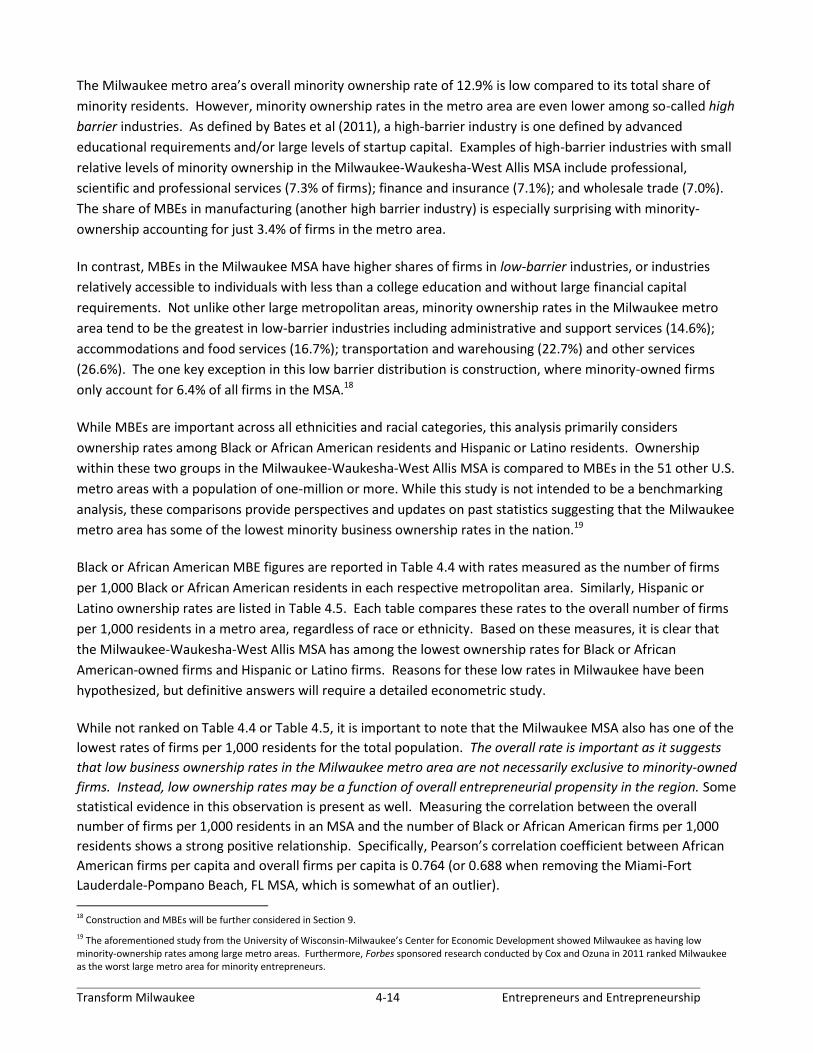
Black or African American MBE figures are reported in Table 4.4 with rates measured as the number of firms
per 1,000 Black or African American residents in each respective metropolitan area. Similarly, Hispanic or
Latino ownership rates are listed in Table 4.5. Each table compares these rates to the overall number of firms
per 1,000 residents in a metro area, regardless of race or ethnicity. Based on these measures, it is clear that
the Milwaukee-Waukesha-West Allis MSA has among the lowest ownership rates for Black or African
American-owned firms and Hispanic or Latino firms. Reasons for these low rates in Milwaukee have been
hypothesized, but definitive answers will require a detailed econometric study.
While not ranked on Table 4.4 or Table 4.5, it is important to note that the Milwaukee MSA also has one of the
lowest rates of firms per 1,000 residents for the total population. The overall rate is important as it suggests
that low business ownership rates in the Milwaukee metro area are not necessarily exclusive to minority-owned
firms. Instead, low ownership rates may be a function of overall entrepreneurial propensity in the region. Some
statistical evidence in this observation is present as well. Measuring the correlation between the overall
number of firms per 1,000 residents in an MSA and the number of Black or African American firms per 1,000
residents shows a strong positive relationship. Specifically, Pearson’s correlation coefficient between African
American firms per capita and overall firms per capita is 0.764 (or 0.688 when removing the Miami-Fort
Lauderdale-Pompano Beach, FL MSA, which is somewhat of an outlier).
18 Construction and MBEs will be further considered in Section 9. 19 The aforementioned study from the University of Wisconsin-Milwaukee’s Center for Economic Development showed Milwaukee as having low minority-ownership rates among large metro areas. Furthermore, Forbes sponsored research conducted by Cox and Ozuna in 2011 ranked Milwaukee as the worst large metro area for minority entrepreneurs.
Transform Milwaukee 4-15 Entrepreneurs and Entrepreneurship
Table 4.4 – Black or African American Firm Ownership Rates in Metro Areas of One-Million or More Residents (2007)
Metropolitan Statistical Area Black or African
American-Owned Firms
Black or African American
Population
African American Firms per 1,000
African American Residents
All Firms per 1,000 Residents
Miami-Fort Lauderdale-Pompano Beach, FL 99,595 1,088,868 91.5 143.9 Atlanta-Sandy Springs-Marietta, GA 127,209 1,632,334 77.9 101.8 New York-Northern New Jersey-Long Island, NY-NJ-PA 233,988 3,328,717 70.3 104.3 Los Angeles-Long Beach-Santa Ana, CA 64,035 918,918 69.7 103.6 Washington-Arlington-Alexandria, DC-VA-MD-WV 95,479 1,372,769 69.6 96.1 Riverside-San Bernardino-Ontario, CA 20,442 301,334 67.8 75.6 Dallas-Fort Worth-Arlington, TX 56,329 858,869 65.6 93.1 Houston-Sugar Land-Baytown, TX 61,439 942,299 65.2 90.4 Orlando-Kissimmee, FL 18,391 300,110 61.3 99.7 Chicago-Naperville-Joliet, IL-IN-WI 101,555 1,679,151 60.5 88.7 Portland-Vancouver-Beaverton, OR-WA 3,440 59,519 57.8 88.2 San Diego-Carlsbad-San Marcos, CA 8,481 148,451 57.1 94.4 Raleigh-Cary, NC 11,673 207,232 56.3 92.1 Minneapolis-St. Paul-Bloomington, MN-WI 11,354 204,706 55.5 94.8 Tampa-St. Petersburg-Clearwater, FL 16,192 303,300 53.4 94.0 Boston-Cambridge-Quincy, MA-NH 16,194 303,747 53.3 92.9 Detroit-Warren-Livonia, MI 53,372 1,010,872 52.8 79.6 Columbus, OH 12,706 241,974 52.5 83.7 Baltimore-Towson, MD 39,253 756,375 51.9 85.8 New Orleans-Metairie-Kenner, LA 18,103 349,608 51.8 96.8 Seattle-Tacoma-Bellevue, WA 8,824 172,658 51.1 88.2 Denver-Aurora, CO 6,732 132,104 51.0 104.6 Providence-New Bedford-Fall River, RI-MA 3,744 73,495 50.9 82.2 Austin-Round Rock, TX 5,952 118,216 50.3 96.8 Memphis, TN-MS-AR 28,500 571,228 49.9 79.0 Charlotte-Gastonia-Concord, NC-SC 18,582 377,805 49.2 89.7 San Francisco-Oakland-Fremont, CA 17,838 362,917 49.2 103.3 Birmingham-Hoover, AL 14,855 308,190 48.2 81.4 San Antonio, TX 5,821 124,008 46.9 84.4 Phoenix-Mesa-Scottsdale, AZ 7,981 174,642 45.7 75.4 Las Vegas-Paradise, NV 7,877 174,463 45.1 79.3 Oklahoma City, OK 5,321 118,115 45.0 97.7 Nashville-Davidson--Murfreesboro--Franklin, TN 10,344 231,510 44.7 101.4 Hartford-West Hartford-East Hartford, CT 5,031 117,539 42.8 80.6 Jacksonville, FL 11,459 282,178 40.6 82.3 Kansas City, MO-KS 9,137 230,844 39.6 83.6 Salt Lake City, UT 602 15,283 39.4 * 91.9 Richmond, VA 14,095 360,142 39.1 76.0 Indianapolis-Carmel, IN 9,334 239,366 39.0 82.4 Cleveland-Elyria-Mentor, OH 15,596 406,460 38.4 80.0 Louisville-Jefferson County, KY-IN 6,137 163,379 37.6 * 82.6 Cincinnati-Middletown, OH-KY-IN 9,329 251,953 37.0 75.7 St. Louis, MO-IL 18,328 503,430 36.4 75.8 Philadelphia-Camden-Wilmington, PA-NJ-DE-MD 41,613 1,174,450 35.4 * 79.1 Virginia Beach-Norfolk-Newport News, VA-NC 18,195 519,773 35.0 * 66.8 Milwaukee-Waukesha-West Allis, WI 8,054 246,177 32.7 69.6 Pittsburgh, PA 6,098 188,048 32.4* 73.8 Rochester, NY 3,710 114,864 32.3* 72.0* Buffalo-Niagara Falls, NY 3,060 135,649 22.6 62.2
Sources: 2007 Survey of Business Owners, 2006-2008 American Community Survey and UW-Extension Center for Community and Economic Development. Note that Sacramento and San Antonio are excluded from the calculations due to data suppression. *Not statistically different from the Milwaukee-Waukesha-West Allis MSA at the 90% level.

Transform Milwaukee 4-16 Entrepreneurs and Entrepreneurship
Table 4.5 – Hispanic or Latino Firm Ownership Rates in Metro Areas of One-Million or More Residents (2007)
Metropolitan Statistical Area Hispanic or
Latino-Owned Firms
Hispanic or Latino
Population
Hispanic or Latino Firms per 1,000
Hispanic or Latino Residents
All Firms per 1,000 Residents
Miami-Fort Lauderdale-Pompano Beach, FL 320,083 2,099,334 152.5 143.9 New Orleans-Metairie-Kenner, LA 6,290 66,294 94.9 96.8 Orlando-Kissimmee, FL 40,509 453,773 89.3 99.7 Tampa-St. Petersburg-Clearwater, FL 32,402 383,757 84.4 94.0 Jacksonville, FL 6,119 73,708 83.0 82.3 Washington-Arlington-Alexandria, DC-VA-MD-WV 44,456 633,399 70.2 96.1 Baltimore-Towson, MD 5,815 84,274 69.0 85.8 New York-Northern New Jersey-Long Island, NY-NJ-PA 242,939 4,036,076 60.2 104.3 Houston-Sugar Land-Baytown, TX 104,368 1,865,649 55.9 90.4 San Antonio, TX 56,644 1,047,746 54.1 84.4 Louisville-Jefferson County, KY-IN 1,731 33,147 52.2 82.6 Pittsburgh, PA 1,319 25,418 51.9 73.8 Atlanta-Sandy Springs-Marietta, GA 25,030 487,984 51.3 101.8 San Diego-Carlsbad-San Marcos, CA 44,156 901,183 49.0 94.4 San Francisco-Oakland-Fremont, CA 41,207 847,595 48.6 103.3 Los Angeles-Long Beach-Santa Ana, CA 266,582 5,645,374 47.2 103.6 St. Louis, MO-IL 2,819 60,218 46.8 75.8 Austin-Round Rock, TX 21,255 473,084 44.9 96.8 Riverside-San Bernardino-Ontario, CA 81,178 1,819,809 44.6 75.6 Columbus, OH 2,257 50,708 44.5 83.7 Richmond, VA 2,005 45,950 43.6 76.0 Nashville-Davidson--Murfreesboro--Franklin, TN 3,473 80,018 43.4 101.4 Providence-New Bedford-Fall River, RI-MA 6,264 145,927 42.9 82.2 Boston-Cambridge-Quincy, MA-NH 14,919 354,702 42.1 92.9 Dallas-Fort Worth-Arlington, TX 69,265 1,650,317 42.0 93.1 Charlotte-Gastonia-Concord, NC-SC 5,675 137,936 41.1 89.7 Raleigh-Cary, NC 3,677 90,290 40.7 92.1 Philadelphia-Camden-Wilmington, PA-NJ-DE-MD 15,444 380,066 40.6 79.1 Cincinnati-Middletown, OH-KY-IN 1,598 39,417 40.5 75.7 Birmingham-Hoover, AL 1,315 34,144 38.5 81.4 Seattle-Tacoma-Bellevue, WA 9,001 242,065 37.2 88.2 Sacramento--Arden-Arcade--Roseville, CA 14,362 387,122 37.1 83.8 San Jose-Sunnyvale-Santa Clara, CA 17,499 473,795 36.9 85.1 Virginia Beach-Norfolk-Newport News, VA-NC 2,484 69,777 35.6 66.8 Memphis, TN-MS-AR 1,725 48,482 35.6 79.0 Rochester, NY 1,867 52,485 35.6 72.0* Denver-Aurora, CO 18,804 541,716 34.7 104.6 Oklahoma City, OK 3,633 110,533 32.9 97.7 Detroit-Warren-Livonia, MI 5,045 162,931 31.0 79.6 Chicago-Naperville-Joliet, IL-IN-WI 55,086 1,849,486 29.8 88.7 Salt Lake City, UT 4,892 165,002 29.6 91.9 Kansas City, MO-KS 4,070 138,913 29.3 83.6 Portland-Vancouver-Beaverton, OR-WA 6,373 218,823 29.1 88.2 Indianapolis-Carmel, IN 2,286 78,860 29.0 82.4 Las Vegas-Paradise, NV 14,310 505,213 28.3 79.3 Cleveland-Elyria-Mentor, OH 2,321 87,267 26.6 80.0 Minneapolis-St. Paul-Bloomington, MN-WI 3,926 148,404 26.5 94.8 Hartford-West Hartford-East Hartford, CT 3,450 130,527 26.4 80.6 Phoenix-Mesa-Scottsdale, AZ 30,677 1,258,721 24.4 75.4 Buffalo-Niagara Falls, NY 927 38,265 24.2 * 62.2 Milwaukee-Waukesha-West Allis, WI 2,296 127,265 18.0 69.6 Sources: 2007 Survey of Business Owners, 2006-2008 American Community Survey and UW-Extension Center for Community and Economic Development *Not statistically different from the Milwaukee-Waukesha-West Allis MSA at the 90% level.

Transform Milwaukee 4-17 Entrepreneurs and Entrepreneurship
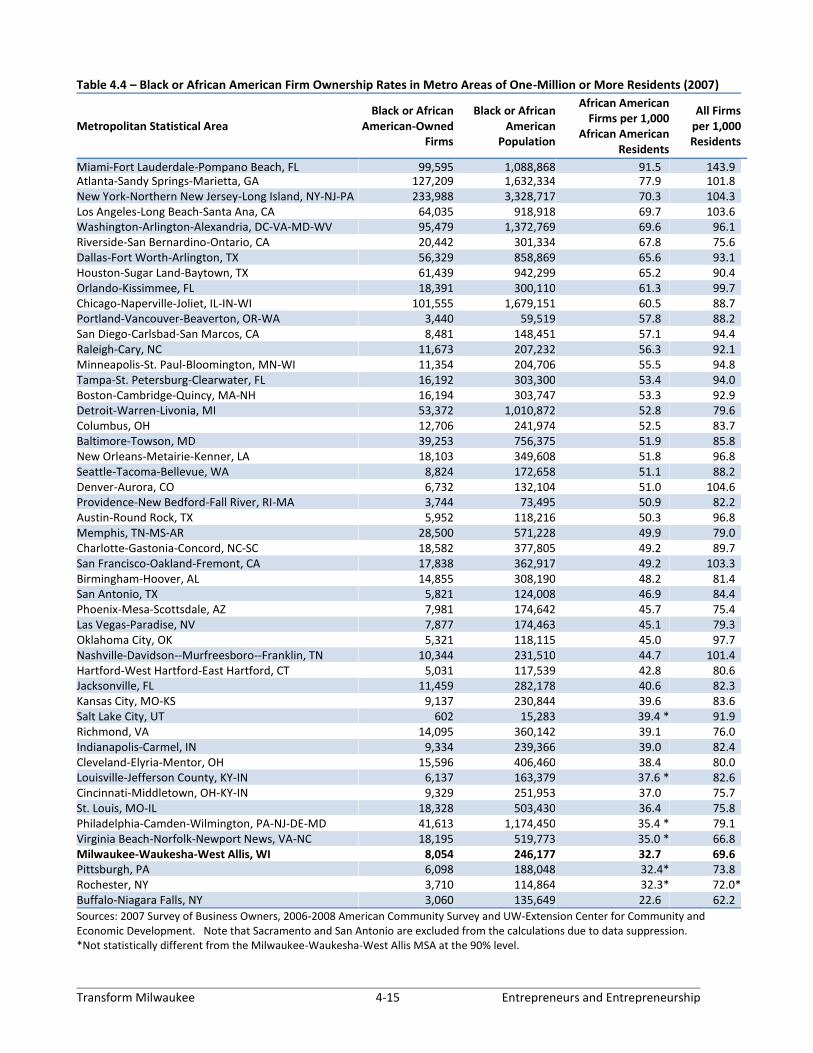
Somewhat lesser, but positive relationships (ρ = 0.642) are also found among Hispanic or Latino ownership
rates (ρ = 0.393 with the Miami metro area removed). These correlation coefficients recognize the dictum that
correlation does not mean causality, but there is some parallel between overall ownership rates and minority
ownership rates. These coefficients are summarized in Table 4.6 and scatterplots for ownership rates are also
available in Appendix 4C.
Minority and overall ownership rates among metro areas also can be normalized using location quotients. The
location quotient (LQ) is calculated by dividing a metropolitan area’s minority-owned firms per capita by its
overall firms per capita (See Section 2 for more on LQs). If a metro area has the same minority ownership rate
as its overall ownership rate, then the corresponding LQ would be 1.0. Location quotients with values below
1.0 show lower relative ownership rates among minority residents in a metro area, while values above 1.0
show higher rates. Accordingly, the measures control somewhat for metro areas that have high overall
ownership rates.
Comparing location quotients for Black or African American ownership rates, Milwaukee’s position improves
somewhat in that the metro area either ranks above, or is not statistically different from 21 other large
metropolitan areas (Table 4.7). Nonetheless, this figure remains well below those metro areas with the highest
location quotients. Furthermore, comparing location quotients for Hispanic or Latino ownership provides little
change in Milwaukee’s overall position (Table 4.8). Consequently, other factors beyond overall ownership
rates likely are contributing to the lower rates found in the Milwaukee metro area.
As mentioned earlier, a detailed econometric study would help to identify local factors contributing to MBE
formation rates in the Milwaukee metro area. Two factors that should be considered in this analysis are age
structure and educational attainment. Data suggest that entrepreneurial rates increase dramatically between
the ages of 35 and 64 and among persons with a bachelor’s degree or higher.20 However, when compared to
other large metropolitan areas, the Milwaukee MSA has one of the smallest shares of Black or African
American residents ages 35 to 64 and one of the lowest rates of Black or African American residents age 25 or
over with a college degree. Further, the Milwaukee MSA is in the bottom third of large metro areas for both
its share of Hispanic or Latino residents ages 35 to 64 and its share of Hispanic or Latino residents with a
bachelor’s degree or higher.
While the influences of age and education on entrepreneurial propensity are not necessarily specific to Black
or Hispanic entrepreneurs, there is some modest to strong correlation between these factors and minority
ownership rates in the nation’s largest metro areas. The scatterplots in Appendix 4C and the Pearson’s
correlation coefficients in Table 4.6 show moderate positive correlations between Black or African American
ownership rates and levels of Black or African American educational attainment in the nation’s largest metro
areas. A somewhat smaller, but positive correlation is found between Black or African American ownership
rates and the share of the population between the ages of 35 and 64. Even stronger correlations are seen
between Hispanic or Latino ownership rates and age and educational attainment.
20
Acs and Armington (2003) find that human capital affects firm formation rates. However, for other perspectives again see: Henderson, J., Low, S.A., and Weiler, S. (2007) and Yenerall (2008).
Transform Milwaukee 4-18 Entrepreneurs and Entrepreneurship
Table 4.6 – Selected Measures of Business Ownership Correlation in Large Metropolitan Areas
Variables Measured Correlation Coefficient (ρ)
Black or African American Ownership Rate and
Overall Ownership Rate 0.764 *
Hispanic or Latino Ownership Rate and
Overall Ownership Rate 0.642 **
Black or African American Ownership LQ and Share of Black or African
American Residents Ages 35 to 64 0.228
Correlation between Black or African American Ownership LQ and
Share of Black or African American Residents with a College Degree 0.444
Correlation between Hispanic or Latino Ownership LQ and Share of
Hispanic or Latino Residents Ages 35 to 64 0.689
Correlation between Hispanic or Latino Ownership LQ and Share of
Hispanic or Latino Residents with a College Degree 0.616
Sources: Source: 2007 Survey of Business Owners, 2006-2008 American Community Survey and Author’s Calculations * 0.688 with the Miami-Fort Lauderdale-Pompano Beach, FL MSA removed
** 0.393 with Miami-Fort Lauderdale-Pompano Beach, FL MSA removed
Again, these correlations are not evidence that minority business ownership rates in the Milwaukee-
Waukesha-West Allis MSA are necessarily attributed to age or education levels. Nonetheless, we know that
these two demographic categories are among the most entrepreneurial and are underrepresented in
Milwaukee’s Black or African residents and Hispanic or Latino residents relative to other metro areas. While
some public policy officials might view these figures as a challenge, Milwaukee’s demographics may actually
provide an opportunity in the coming decade. Specifically, the large number of young Black and African
American residents and younger Hispanic and Latino residents offers great potential for future MBEs in
Milwaukee. These potential entrepreneurs will need to be encouraged to create these opportunities. Levels
of human capital also will need to be increased. Strategies for developing these future potential business
owners will be examined later in this section.

Transform Milwaukee 4-19 Entrepreneurs and Entrepreneurship
Table 4.7 – Selected Demographic Characteristics and Ownership LQs for Black or African American Residents (2007)
Metropolitan Statistical Area African American
Owned Firm Location Quotient
African American Firms per 1,000
African American Residents
African American Residents –
% Age 35 to 64
African American Residents Age 25 and Over- % with
College Degree
Riverside-San Bernardino-Ontario, CA 0.90 67.8 34.7% 20.0% Atlanta-Sandy Springs-Marietta, GA 0.77 77.9 38.7% 25.4%
Washington-Arlington-Alexandria, DC-VA-MD-WV 0.72 69.6 41.8% 28.8%
Houston-Sugar Land-Baytown, TX 0.72 65.2 37.4% 20.5%
Dallas-Fort Worth-Arlington, TX 0.70 65.6 37.6% 21.2%
Chicago-Naperville-Joliet, IL-IN-WI 0.68 60.5 36.8% 19.0%
New York-Northern New Jersey-Long Island, NY-NJ-PA 0.67 70.3 38.9% 21.1%
Los Angeles-Long Beach-Santa Ana, CA 0.67 69.7 39.9% 22.9%
Detroit-Warren-Livonia, MI 0.66 52.8 38.2% 14.3%
Portland-Vancouver-Beaverton, OR-WA 0.66 57.8 37.2% 18.2%
Miami-Fort Lauderdale-Pompano Beach, FL 0.64 91.5 36.9% 16.8%
Memphis, TN-MS-AR 0.63 49.9 36.1% 13.5%
Columbus, OH 0.63 52.5 35.5% 18.0%
Providence-New Bedford-Fall River, RI-MA 0.62 50.9 34.9% 20.0%
Orlando-Kissimmee, FL 0.61 61.3 35.0% 18.6%
Raleigh-Cary, NC 0.61 56.3 38.0% 24.2%
Phoenix-Mesa-Scottsdale, AZ 0.61 45.7 35.1% 24.0%
San Diego-Carlsbad-San Marcos, CA 0.61 57.1 35.7% 21.1%
Baltimore-Towson, MD 0.60 51.9 38.7% 19.5%
Birmingham-Hoover, AL 0.59 48.2 38.1% 16.8%
Minneapolis-St. Paul-Bloomington, MN-WI 0.59 55.5 32.7% 20.5%
Seattle-Tacoma-Bellevue, WA 0.58 51.1 38.4% 20.4%
Boston-Cambridge-Quincy, MA-NH 0.57 53.3 37.0% 22.5%
Las Vegas-Paradise, NV 0.57 45.1 36.9% 15.2%
Tampa-St. Petersburg-Clearwater, FL 0.57 53.4 35.2% 18.4%
San Antonio, TX 0.56 * 46.9 37.4% 21.2%
Charlotte-Gastonia-Concord, NC-SC 0.55 49.2 37.9% 20.3%
New Orleans-Metairie-Kenner, LA 0.53 51.8 31.4% 12.8% *
Hartford-West Hartford-East Hartford, CT 0.53 * 42.8 38.3% 16.6%
Virginia Beach-Norfolk-Newport News, VA-NC 0.52 35.0 * 35.9% 15.9%
Austin-Round Rock, TX 0.52 * 50.3 36.1% 22.8%
Richmond, VA 0.51 * 39.1 39.5% 15.8%
Jacksonville, FL 0.49 * 40.6 36.4% 15.2%
Cincinnati-Middletown, OH-KY-IN 0.49 * 37.0 37.3% 15.7%
Denver-Aurora, CO 0.49 * 51.0 39.0% 22.7%
St. Louis, MO-IL 0.48 * 36.4 36.2% 15.7%
Cleveland-Elyria-Mentor, OH 0.48 * 38.4 37.5% 12.8% *
San Francisco-Oakland-Fremont, CA 0.48 * 49.2 41.7% 22.2%
Kansas City, MO-KS 0.47 * 39.6 36.8% 15.7%
Indianapolis-Carmel, IN 0.47 * 39.0 36.1% 17.1%
Milwaukee-Waukesha-West Allis, WI 0.47 32.7 33.4% 12.4%
Oklahoma City, OK 0.46 * 45.0 35.0% 18.1%
Louisville-Jefferson County, KY-IN 0.45 * 37.6 * 37.2% 13.9%
Rochester, NY 0.45 * 32.3 34.9% 12.8% *
Philadelphia-Camden-Wilmington, PA-NJ-DE-MD 0.45 * 35.4 * 37.7% 16.4%
Nashville-Davidson--Murfreesboro--Franklin, TN 0.44 * 44.7 36.1% 21.0%
Pittsburgh, PA 0.44 * 32.4 * 36.6% 15.9%
Salt Lake City, UT 0.43 * 39.4 * 31.9%* 24.1%
Buffalo-Niagara Falls, NY 0.36 22.6 34.6% 12.6% *
Sources: Source: 2007 Survey of Business Owners, 2006-2008 American Community Survey and UW-Extension Center for Community and Economic Development. Note that Sacramento and San Antonio are excluded from the calculations due to data suppression. *Not statistically different from the Milwaukee-Waukesha-West Allis MSA at the 90% level

Transform Milwaukee 4-20 Entrepreneurs and Entrepreneurship
Table 4.8 – Hispanic or Latino Ownership LQs, Residents Age 35 to 64, and Residents with a College Degree (2007)
Metropolitan Statistical Area
Hispanic or Latino Owned Firm Location
Quotient
Hispanic or Latino Firms per 1,000
Hispanic or Latino Residents
Hispanic or Latino Population –
% Age 35 to 64
Hispanic or Latino Population – Percent with
College Degree
Miami-Fort Lauderdale-Pompano Beach, FL 1.06 152.47 40.6% 24.4% Jacksonville, FL 1.01 83.02 34.5% 24.1% New Orleans-Metairie-Kenner, LA 0.98 94.88 35.5% 20.4% Tampa-St. Petersburg-Clearwater, FL 0.90 84.43 33.7% 18.3% Orlando-Kissimmee, FL 0.90 89.27 34.2% 19.7% Baltimore-Towson, MD 0.80 69.00 30.6% 27.9% Washington-Arlington-Alexandria, DC-VA-MD-WV 0.73 70.19 33.2% 23.1% Pittsburgh, PA 0.70 51.89 32.9% 34.9% San Antonio, TX 0.64 54.06 33.4% 12.8% Louisville-Jefferson County, KY-IN 0.63 52.22 28.7% * 15.9% Houston-Sugar Land-Baytown, TX 0.62 55.94 31.1% 10.3%* St. Louis, MO-IL 0.62 46.81 30.6% 25.6% Riverside-San Bernardino-Ontario, CA 0.59 44.61 28.9% 7.9% New York-Northern New Jersey-Long Island, NY-NJ-PA 0.58 60.19 36.2% 15.4% Richmond, VA 0.57 43.63 28.6% * 17.7% Cincinnati-Middletown, OH-KY-IN 0.54 40.54 27.2% * 25.0% Virginia Beach-Norfolk-Newport News, VA-NC 0.53 35.60 28.5% * 20.9% Columbus, OH 0.53 44.51 26.9% 20.6% Providence-New Bedford-Fall River, RI-MA 0.52 42.93 29.9% 13.0%* San Diego-Carlsbad-San Marcos, CA 0.52 49.00 30.1% 13.9% Philadelphia-Camden-Wilmington, PA-NJ-DE-MD 0.51 40.64 30.5% 14.0% Atlanta-Sandy Springs-Marietta, GA 0.50 51.29 28.4% * 15.3% Rochester, NY 0.49 35.57 30.4% 15.4% Birmingham-Hoover, AL 0.47 38.51 27.1% * 15.2% San Francisco-Oakland-Fremont, CA 0.47 48.62 33.7% 16.6% Austin-Round Rock, TX 0.46 44.93 29.9% 15.9% Charlotte-Gastonia-Concord, NC-SC 0.46 41.14 27.5% 15.6% Los Angeles-Long Beach-Santa Ana, CA 0.46 47.22 32.6% 9.8% Boston-Cambridge-Quincy, MA-NH 0.45 42.06 32.2% 17.6% Dallas-Fort Worth-Arlington, TX 0.45 41.97 29.1% 9.7% Memphis, TN-MS-AR 0.45 35.58 29.3% 11.7%* Sacramento--Arden-Arcade--Roseville, CA 0.44 37.10 29.4% 13.5% Raleigh-Cary, NC 0.44 40.72 27.1% 15.5% San Jose-Sunnyvale-Santa Clara, CA 0.43 36.93 32.0% 12.5% Nashville-Davidson--Murfreesboro--Franklin, TN 0.43 43.40 27.1% 9.6% Seattle-Tacoma-Bellevue, WA 0.42 37.18 29.0% 17.4% Buffalo-Niagara Falls, NY 0.39 * 24.23* 29.0% 15.4% Detroit-Warren-Livonia, MI 0.39 30.96 30.9% 16.3% Las Vegas-Paradise, NV 0.36 28.32 29.8% 8.3% Indianapolis-Carmel, IN 0.35 * 28.99 26.5% 13.9% Kansas City, MO-KS 0.35 29.30 29.1% 14.3% Oklahoma City, OK 0.34 * 32.87 26.9% 9.8%* Chicago-Naperville-Joliet, IL-IN-WI 0.34 29.78 30.2% 11.0%* Cleveland-Elyria-Mentor, OH 0.33 * 26.60 31.7% 14.3% Denver-Aurora, CO 0.33 34.71 30.1% 12.1%* Portland-Vancouver-Beaverton, OR-WA 0.33 29.12 27.1% 12.3%* Hartford-West Hartford-East Hartford, CT 0.33 * 26.43 31.8% 11.7%* Phoenix-Mesa-Scottsdale, AZ 0.32 * 24.37 27.6% 9.2% Salt Lake City, UT 0.32 * 29.65 27.5% 10.6%* Minneapolis-St. Paul-Bloomington, MN-WI 0.28 * 26.45 27.1% 18.1% Milwaukee-Waukesha-West Allis, WI 0.26 18.04 28.3% 11.5% Sources: Source: 2007 Survey of Business Owners, 2006-2008 American Community Survey and UW-Extension Center for Community and Economic Development *Not statistically different from the Milwaukee-Waukesha-West Allis MSA at the 90% level
Transform Milwaukee 4-21 Entrepreneurs and Entrepreneurship
Assessing Entrepreneurship Policy and Strategy for Milwaukee’s Industrial Corridor
Entrepreneurship is not a panacea for growing the local economy; however, the preceding metrics and
discussion suggest that entrepreneurial activity in the Milwaukee region is lacking. The factors driving these
measures are likely a combination of industrial legacy, human capital levels, demographic characteristics and
other dynamics. If entrepreneurship is to become a successful economic development strategy for
Milwaukee’s Industrial Corridor, then additional efforts are needed to cultivate entrepreneurs of all types.
However, developing initiatives and policies to further entrepreneurship will entail significant challenges.
Specific concerns to be addressed include those outlined by Markely et al (2005):
Reluctance of practitioners to abandon traditional strategies;
Shortage of institutional support for an entrepreneurship strategy;
Lack of community leaders’ familiarity with entrepreneurship;
Recognition that the outcomes of entrepreneurship are incremental;
Acceptance that there currently are limited examples of state and local strategies to provide guidance and
support.
Consequently, embracing entrepreneurship may require a sort of “leap of faith.” Success is unlikely to be swift.
Community leaders and economic developers need to learn more about entrepreneurship. Existing
entrepreneurial support organizations need to be included. Outcomes need to be measured and institutional
champions need to emerge. Ultimately, creating entrepreneurial strategies for Milwaukee’s Industrial Corridor
requires understanding best practices and tools that can be adapted to a breadth of entrepreneurial types. In
fact, several of these tools may be considered to be entrepreneurial themselves. Keeping these challenges in
mind, the following discussion considers five areas of entrepreneurial development strategy:
1. Increasing support for minority business enterprises;
2. Enhancing the entrepreneurial culture in the Transform Milwaukee Study Area and the broader region;
3. Understanding and rethinking the role of universities in entrepreneurship;
4. Connecting existing entrepreneurial support systems;
5. Developing support for second-stage companies.
Supporting Minority Business Enterprises
Improving minority ownership rates should be considered as a worthwhile strategy to create economic
opportunities in the Transform Milwaukee Study Area and beyond. Developing MBEs in manufacturing and
construction may be of particular interest given the region’s industrial base; the low number of MBEs in these
industries; and the propensity for minority owners in construction and manufacturing to hire within low
income areas. 21 However, impacts on unemployment rates resulting from increased numbers MBEs should be
tempered somewhat. As identified by Levine (2007), even in those metropolitan areas with high rates of
21
Expansion of MBEs beyond the Transform Milwaukee Study Area also may be important for improving minority employment prospects as an owner’s race often is a larger factor in predicting the racial composition of the small-business labor force (Bates 2006; Boston & Ross 1997).

Transform Milwaukee 4-22 Entrepreneurs and Entrepreneurship
minority business ownership, these firms only account for a small share of overall employment. Consequently,
a dramatic increase in MBEs could potentially have a small impact on employment conditions in the Transform
Milwaukee Study Area. Given this dynamic, the development of minority businesses should be viewed as one
among many strategies for improving local employment opportunities.
When considering strategies for the formation and development of MBEs in Milwaukee, there is little research
specific to the community to draw upon. However, research related to the support of small and minority-
owned businesses in other communities provides some context. One comprehensive analysis conducted in
New York suggests five “gaps” facing entrepreneurs in a metropolitan setting, many of whom were
disadvantaged (Servon, Fairlie, Rastello and Seely, 2010). These gaps involve both financial and non-financial
difficulties and include: 1) the information gap; 2) an institutional capacity and service delivery gap; 3) a capital
gap; 4) an asset gap; and 5) the transitional gap.
The first two gaps are unrelated to an entrepreneur’s financial resources. The information gap suggests that
cultural and language barriers; lack of awareness of resources; poor financial literacy; and lack of business
acumen all hinder informed business decision making. The institutional capacity and service delivery gap
suggests that small business support organizations often face capacity issues related to high levels of
fragmentation and inefficiency; duplication of services; inadequate staffing and resources; and slow
incorporation of emerging best practices. These two gaps will be addressed later in Section 4.
The remaining three gaps are related to financing, which has been the subject of significant research related to
MBEs and entrepreneurial development.22 First, the capital gap points to a lack of available financing both
before and after startup. Many entrepreneurs require very little capital for startup, often below the lending
threshold requirements of traditional lenders. Microloan funds and peer-to-peer lending networks provide
some opportunities for addressing this gap, as should the African American Chamber of Commerce’s revolving
loan fund (targeting start-up lending between $1,500 and $25,000). However, Servon et al (2010) suggest that
somewhat larger loan amounts between $50,000 and $100,000 are commonly unavailable to firms looking to
start or expand.
Second, the asset gap faces entrepreneurs without the necessary assets needed to secure loans, such as home
equity and a good credit history. In economically-challenged communities, such as the Transform Milwaukee
Study Area, this gap is particularly prevalent due to lower home ownership rates and property values. If
friends and families of entrepreneurs face similar economic conditions, the asset gap may be more extensive.
Specifically, friends and families without appropriate assets may not be able to serve as loan co-signers or
provide informal sources of lending
Finally, the transitional gap refers to challenges related to moving from non-traditional lines of credit to more
formal financing. As mentioned, microcredit resources are available to some entrepreneurs. However, these
sources may be offered a limited amount of times and are rarely applied to credit history. Consequently, once
microcredit sources subside, graduating to traditional financing may not be a viable step. Activities to
overcome these issues include identifying other sources of collateral and helping entrepreneurs to develop
22
A comprehensive review on the issues facing MBEs, including financing, is outside the scope of this analysis. However, Bates (2010) provides one overview of these issues.
Transform Milwaukee 4-23 Entrepreneurs and Entrepreneurship
richer credit histories (by documenting experiences with non-traditional lending sources that often do not
report to credit bureaus).
Lenders are concerned, of course, with financial gaps facing minority entrepreneurs and have explored ways to
address these issues. In a review of inner city lending strategies, Bates (2010) found mixed results among
models used over the past few decades including Minority Enterprise Small Business Investment Companies
(MESBICs); Specialized Small Business Investment Companies (SSBICs); community development financial
institution funds; private venture capital (VC) funds; Medallion Funding; and microenterprise programs. Bates
concludes that regardless of the model, publicly-subsidized business lenders must meet several well-
established preconditions for success. While these may seem intuitive to experienced lenders, they can be
difficult to operationalize in a central city environment.
First, the portfolio must be large enough to achieve scale economies in loan processing and servicing.
However, many subsidized inner-city lenders operate below the $2 million threshold. This affects viability as
lenders’ operating costs are too high. Inflated operating costs also may preclude a program’s ability to employ
a full-time professional manager with expertise to evaluate borrower creditworthiness.
Second, business lenders must be able to properly manage loan default risks, both by diversifying those risks
and by having the ability to recoup loan principal in the event of default. The latter has been achieved through
loan collateral requirements (such as those required by Medallion Funding) and loan guarantees from entities
such as the Small Business Administration. However, diversifying risks may also require lending outside a
limited geographic area in the inner city. Bates points to examples from ICV Partners and Chicago’s Shorebank
Neighborhood Fund, which made VC investments in Chicago’s inner city until the mid-1990s.23 Despite
managerial expertise and the level of financing necessary, ICV Partners’ equity investments in inner-city
ventures failed to generate competitive financial returns, while ICV Partners’ non-inner city investments
produced very high returns. While this dichotomy may not prove viable for a private for-profit investment
enterprise, it does suggest that balancing investments across geographic areas could provide one model for
diversifying risk in publically-subsidized central city investments. That is, lending programs that target the
Transform Milwaukee Initiative may need to spread risk by pooling investments across a broader geographic
area. This finding is reinforced by the Shorebank Neighborhood Fund, as targeting a limited geographic area
was one of the cited reasons for its failure.
An additional insight on microenterprise financing is provided by Bates et al (2011). They conclude that
microenterprise lending programs have been largely ineffective for both high and low barrier businesses. As
noted earlier, high barrier industries typically require advanced education and training and/or large scale
capital investments. Low barrier businesses are not capital intensive, but education and skill level play an
important role in access and success. In short, entry into low barrier industries typically is not constrained by
wealth and microloans often are not as critical. That is, aspiring minority entrepreneurs possessing few
personal assets are just as likely to become self-employed in low barrier industries as those with a net worth of
$25,000 to $50,000. Instead, education and training may be the most important factors in supporting
entrepreneurs entering low barrier enterprises. The authors conclude that microloan programs may better
23
ICV Partners is a for-profit venture capital fund operated by Michael Porter’s Initiative for a Competitive Inner City and American Securities.
Transform Milwaukee 4-24 Entrepreneurs and Entrepreneurship
serve existing small businesses needing to finance expansion and continuation of operations, rather than those
seeking start-up funding. In turn, these findings suggest that new models of targeted capital sources may be
needed for minority entrepreneurs looking to enter high barrier industries (such as improved inner-city VC
funds), rather than funds for low-barrier industries.
Other opportunities for supporting minority business enterprises include procurement contracting
requirements with local governments. These programs are largely in place, but should be approached with
some caution for MBEs. Specifically, MBEs obtaining 25% or more of revenues from public sector sources have
notably higher failure rates when compared to other non-minority and minority firms with government
procurement contracts. The reasons for these failure rates are attributed to MBEs often being younger,
smaller and undercapitalized relative to other government contractors (Bates, 1997; Bates, 2009).
Accordingly, government assistance directed at developing strong MBEs should target entrepreneurs with the
necessary resources and skills (Bates, 2006; Bates and Bradford, 2008). If WHEDA pursues contracting with
MBEs as part of the Transform Milwaukee Initiative, then practices such as unbundling of large contracts or
connecting smaller MBEs with larger, established minority business owners should be considered.
Furthermore, MBEs should seek to develop non-local and non-government revenue sources.
Enhancing the Entrepreneurial Culture
Entrepreneurship as an economic development strategy is not limited to minority business development and
should include the entire community. However, it is important to note that entrepreneurship has cultural
elements. Economic environments, family backgrounds, employment histories, organizational experiences,
social networks, and personality traits all affect the probability of someone acting entrepreneurially (Rauch
and Frese, 2000). Some of these factors are deeply engrained in individuals and in societies; therefore, pools
of potential entrepreneurs may vary in size from region to region. Other elements, such as organizational
experiences and social networks, can be changed and influenced to develop and grow a community’s pipeline
of entrepreneurs. In other words, communities are not locked into current levels of entrepreneurial activity
and can take steps to create an entrepreneurial culture.
A community’s culture as a factor influencing its economic opportunities may seem somewhat “fluffy” to
elected officials and economic development practitioners. Creating an entrepreneurial culture is not concrete
like designating a new TIF district. However, if we look deeper, a community’s culture is an integral part of
economic development. For instance, Shaffer, Deller and Marcouiller (2004) note that some communities have
cultures where people feel victimized by external forces (such as a factory closing), while other communities
instead build on these forces (coalescing around, say, a similar factory closing) and adapt to create new
economic opportunities. Other communities may fail to recognize a culture that maintains the status quo,
such as Appalachian entrepreneurs who feel a perceived negative attitude in the community toward success
(Taylor et al, 2003). Accordingly, a community culture that focuses on failures rather than opportunities may
not recognize assets available for development.24
24
Hustedde (2007) provides an in-depth overview of entrepreneurial culture.

Transform Milwaukee 4-25 Entrepreneurs and Entrepreneurship
So what characteristics of a community constitute an entrepreneurial culture? From a broad perspective, an
entrepreneurial culture is one in which a community is aware of the importance of entrepreneurs to the local
economy. It is open to new and different ideas and it accepts failure. It is willing to experiment. It encourages
and supports entrepreneurs. More specifically, Hustedde (2007) maintains that an entrepreneurial culture is
fostered by:
Creating opportunities to learn, question and think differently about entrepreneurship;
Welcoming fresh voices and embracing diversity;
Mobilizing resources for entrepreneurs;
Cultivating networks for entrepreneurs to thrive;
Focusing on assets instead of deficits;
Building a shared vision about entrepreneurship; and
Fostering entrepreneurial leaders and advocates;
Importantly, the creation of an entrepreneurial culture does not explicitly depend on infrastructure and
financing. While funding, scalable facilities, traditional built infrastructure (roads, water, and power) and
broadband access are necessary and important, these factors are not the most critical in developing a
community’s culture of entrepreneurship (Yenerall 2008).
Perhaps the most crucial steps in furthering Milwaukee’s entrepreneurial culture may be; 1) fostering
entrepreneurial advocates; 2) building a shared vision about entrepreneurship in the community; and 3)
creating more opportunities to learn, question, and think differently about entrepreneurship. As suggested by
the aforementioned Public Policy Forum report, Milwaukee has a number of active entrepreneurial support
organizations, networks and resources. Organizations such as BizStarts Milwaukee, the UW-Milwaukee Small
Business Development Center, Wisconsin Women’s Business Initiative Corporation, the Hispanic Chamber of
Commerce of Wisconsin, the African American Chamber of Commerce, Revolution Labs and other entities all
support entrepreneurs and small business owners in various manners. Other economic development
organizations also provide some support for entrepreneurs, but emphasize economic development strategies
such as real estate development or industry attraction and retention. While each organization should have its
niche in the economic development landscape, growing the entrepreneurial culture in the Transform
Milwaukee Study Area and the broader community will take even more advocates and a better understanding
of entrepreneurship among local leaders. The information in this report can be used to further this
understanding.
A first step to fostering entrepreneurship as a development strategy would be developing a shared approach
to championing entrepreneurial efforts among existing organizations, and collectively (as well as individually),
committing to those efforts. Given their limited resources relative to other economic development agencies,
existing entrepreneur support groups may need to find areas of collaboration and perhaps develop a common
voice. Doing so, however, requires a “champion” to convene this group; facilitate a consensus approach;
create a plan with real commitments; and agree to regularly affirm and assess progress. Some of these
conversations are occurring on an informal basis, but working through an external organization such as
WHEDA may help to formalize a consensus about how to support entrepreneurial development in Milwaukee.

Transform Milwaukee 4-26 Entrepreneurs and Entrepreneurship
A discussion among existing entrepreneurial support organizations also could include how to leverage
additional resources for increasing entrepreneurial outreach and education. Too often in communities,
outreach and learning are delivered in a reactionary manner. Individuals are introduced to entrepreneurship
in response to an economic shock such as a plant closing. Others have entrepreneurship suggested to them as
a means of creating employment in weak labor markets where job opportunities are limited. While these
types of efforts should not be dismissed, more emphasis should be place on proactive learning about
entrepreneurship, regardless of economic conditions faced by a community or an individual. Importantly,
education is not just about developing existing and prospective entrepreneurs. As not everyone should be an
entrepreneur, outreach should stress how entrepreneurship is not a good fit for many people.
Opportunities for learning about entrepreneurship need to be delivered where people live, work and recreate.
Events such as the Governor’s Conference on Minority Business Development, lectures, and webinars are
useful, but programs also need to be delivered where potential entrepreneurs interact on a daily basis.
Furthermore, educational efforts also need to include the broader community to help create support and
understanding of entrepreneurial residents. Examples of this outreach include churches and neighborhood
organizations hosting resource fairs for entrepreneurs and by featuring entrepreneurs in newsletters and other
forums. Inventor and entrepreneur groups also provide important venues for entrepreneurs to exchange
ideas and learn.
One of the greatest opportunities for furthering Milwaukee’s entrepreneurial culture lies with its youthful
population. As noted in Section 3, the Transform Milwaukee Study Area has a much younger population
structure than the Balance of the M7 Region and the overall State of Wisconsin. Furthermore, the Milwaukee-
Waukesha-West Allis MSA has some of the younger African American and Hispanic and Latino populations
among the nation’s largest metropolitan areas. Providing opportunities for these younger residents to learn
about entrepreneurship could develop a generation of potential entrepreneurs.
Certainly, organizations and programs that serve youth, such as Distributive Education Clubs of America
(DECA), Future Business Leaders of America (FBLA), Junior Achievement, and 4-H’s Be the “E” Entrepreneurship
program, provide examples for engaging youth in Milwaukee.25 However, K-12 systems and colleges and
universities also provide primary means for creating an entrepreneurial culture by infusing entrepreneurial
concepts and skills into classes and activities. Importantly, entrepreneurial learning in these settings does not
replace existing coursework, but becomes part of the curriculum. Many of these efforts are in place to some
degree, including dedicated facilities at Milwaukee Public Schools’ Milwaukee School of Entrepreneurship and
several entrepreneurial development programs at local universities (discussed below).
Understanding and Rethinking the Role of Universities in Entrepreneurship
Universities and colleges are important partners in developing entrepreneurs. At a basic level, universities
provide opportunities for obtaining the higher levels of educational attainment that are cited drivers of
entrepreneurial propensity. More directly, entrepreneurial development at universities frequently is equated
with technology transfer. As noted by Belenzon and Schankerman (2009), university technology transfer is
25
The CEO (Creating Entrepreneurial Opportunities) program in Effingham County, Illinois also provides an interesting model for
engaging youth: http://www.effinghamceo.com/

Transform Milwaukee 4-27 Entrepreneurs and Entrepreneurship
commonly viewed as innovation by faculty and its subsequent commercialization by a Technology Licensing
Office or TLO. Some economic development practitioners and policy makers may not necessarily see tech
transfer as an entrepreneurial activity; they view it as a stand-alone economic development strategy. However,
this perspective ignores the aforementioned definition of entrepreneurs as “people who design, produce and
generate value through the creation or expansion of economic activity.” That is, university technology transfer
depends on the ability of individuals to produce value through research and subsequently use this knowledge
to create economic activity. While the institution itself is a necessary and integral part of technology transfer,
its success ultimately rests on the entrepreneurial capacity of individuals within the institution.
Technology transfer increasingly has been promoted as a means of generating start-up companies and
economic growth in the communities where universities are located. The endorsement of tech transfer as an
economic development tool comes not only from public policy organizations and government bodies, but also
from within educational institutions themselves. Universities, especially publicly-funded ones, frequently tout
technology commercialization as a means of promoting their role as a public good. Not surprisingly, this
discussion has created high hopes for technology transfer within communities. These expectations are
strengthened by frequently-cited statistics showing the massive amounts of university research funded from
federal and private sources (West, 2012; Levine, 2009).
To many policy makers, these increased expectations for technology transfer to grow a region’s economy have
been disappointing. Elected officials and policy analysts ask why we are not seeing more return on investment
in terms of jobs and companies. These questions are valid. Often, they result in criticism of university
technology licensing offices for being inefficient and slow to respond to university faculty, economic
development organizations, private industry or taxpayers. For instance, researchers sponsored by the
Kauffman Foundation argue that “underperforming” TLOs are a reason for slow or limited commercialization
of university knowledge. Specifically, Litan and Mitchell (2010) argue that technology transfer is slowed
because TLOs are understaffed and have limited resources. This causes a backlog of inventions not being
processed and languishing in labs. Furthermore, TLOs sometimes slow the process to generate additional
licensing revenues from discoveries deemed to have the most commercial promise.26
While many of these criticisms may be justified, other evidence suggests that reforming the licensing process is
not necessarily the best means to further technology transfer. A review of research on TLO efficiencies and
staffing by Shane (2010) suggests there is little evidence to support claims of inefficiency at a broad level
(which is not to say that an individual TLO may not be understaffed or have limited resources). In contrast,
Shane offers a number of factors that affect university technology transfer. The most important issue may be
the willingness of faculty to disclose inventions, or inform the university’s TLO about their discovery. If a TLO is
not aware of an invention, then it cannot be licensed for commercial use. Shane suggests that the number of
inventions licensed through a TLO is not tied to inefficiencies in the process, but that license numbers are
highly correlated with the number of invention disclosures received by a TLO from faculty.
26
The Kauffman Foundation’s solution to this potential problem is to change the Bayh-Dole Act and allow university faculty the freedom to choose licensing agents/experts, rather than having to use the university’s TLO. However, research summarized by Shane (2010) suggests that having the freedom to choose a licensor may actually slow the rate of technology commercialization.
Transform Milwaukee 4-28 Entrepreneurs and Entrepreneurship
As suggested by Shane, a faculty member’s unwillingness to disclose an invention may be tied to traditional
university compensation and culture. Faculty members are often rewarded and promoted by the number and
quality of papers published, not by technology licensing. Faculty may work in fields where commercialization is
uncommon. They may be in a department where colleagues do not want to participate in technology transfer.
A faculty member may have personal reasons for not wanting to pursue commercialization or wanting to
disclose an invention. Furthermore, faculty simply may not be familiar or comfortable with the
commercialization process.
The rate of commercialization also is propelled by the private sector’s level of interest in university technology.
Shane also notes that a lack of private sector interest can be driven by inventions not yet being ready for
practical or commercial use (e.g. they are too basic or have insufficient applications). Uncertainly about
inventions also creates financial risks that may be deemed as too high to justify private sector investment.
Consequently, Shane cites that “industry is uninterested in them for the very reason that the government
funds basic research at universities in the first place – the difficulty of appropriating the returns to investment
in their development.”
Suggestions for overcoming obstacles to university technology transfer include changing university culture and
forming more alliances with private industry in the region. Examples include sharing more license revenues
with faculty primary investigators (PIs) and tying faculty compensation and promotion to commercialization.
From WHEDA’s perspective, opportunities also could include reducing the financial risk of adopting new
discoveries by directly connecting capital sources to potential start-ups originating through TLOs. Finally,
linking intellectual property to companies requires creating single points of contact to connect the private
sector with university expertise. Again, there is no guarantee that increasing connections will result in
increased economic growth; however, TLOs and the UW-System/WEDC Associate Vice president for Economic
Development, may be able to provide starting points for making these contacts.
These examples of changing university culture and creating more direct ties between industry and universities
have led to caution and criticism at universities. A broad, cogent critique of promoting university research as
an “engine” of local economic growth comes from Levine (2009). Levine argues that possible perils of
academic commercialization include increased financial burdens; undue influence from corporate interests;
and a potential undermining of the intellectual process. Ultimately, an emphasis placed on technology
transfer may not align with the university’s educational mission. Importantly for this discussion, Levine
provides some evidence that increased commercialization of university technology has had little impact in
advancing the economic prosperity of communities, even those with large research universities (e.g. Johns
Hopkins in Baltimore).
The appropriate role of technology transfer at UW-Milwaukee and other universities is not debated as part of
this analysis. An institution’s specific goals for revenues and local economic development through technology
transfer should be decided by that university’s various governance structures (faculty senate, chancellor, board
of regents, etc.) While Levine’s work serves to temper expectations for economic growth arising from
academic commercialization, it does not mean that universities should abandon technology transfer or
research funding. Instead, the goals and definitions of technology transfer pertaining to local economic
development outcomes should be reconsidered somewhat, especially when considering entrepreneurship as
an economic development strategy.

Transform Milwaukee 4-29 Entrepreneurs and Entrepreneurship
The impact of technology transfer on the local economy typically is measured in terms of invention disclosures,
patent applications, patents issued, license agreements, revenues and start-ups by faculty, PhD students and
postdoctoral scholars (West, 2012). Impacts also come from entrepreneurial alumni in the community. While
these measures are important, alternate approaches to fostering technology transfer at colleges and
universities also should be considered. Specific examples also come from Kauffman Foundation supported
research (despite its criticism of the current licensing process). This research from Boh, De-Haan and Strom
(2012) suggests means of creating university technology transfer through activities other than TLO licensing.
Six specific programs and practices are:27
1. Project-based classes on technology commercialization – These classes create interdisciplinary teams or
teams of MBA students to develop business plans and roadmaps for commercialization of university
technologies. Instructors often work directly with the TLO to identify appropriate invention disclosures or
those with provisional or utility patents filed. Faculty PIs of the selected inventions also participate. Other
interested faculty or graduate students may apply to participate in the class using their own technology for
potential commercialization;
2. Mentoring programs – Mentors offer guidance and advice to new entrepreneurs at the university level
(both faculty and students). Other services include referrals to lawyers, industry experts, potential
customers, licensees, and investors who help founding teams build their networks;
3. Accelerator/incubator programs - Accelerator or incubator programs help startups over longer periods of
time by providing mentoring, funding, office space, enhanced credibility, oversight, and management;
4. Business plan competitions – These competitions can play a key role in spinoff development by providing a
platform for team formation and offering an opportunity to develop a business plan and strategic
roadmap. Competitions can also enhance credibility and publicity;
5. Entrepreneurship education for students – Entrepreneurship education is integral to building an
entrepreneurial culture. Education can help inspire students to pursue entrepreneurship and provide
knowledge of the skills needed in the future;
6. Entrepreneurship education for faculty – Faculty members are often unfamiliar with the commercialization
process and may not be aware of entrepreneurial options. While faculty can be reluctant to participate in
workshops or educational programs not related to their research, universities still can offer
entrepreneurial educational programs and resources available for access if faculty choose to do so.
Certainly, these programs can build entrepreneurial capacity and culture among faculty and students.
Furthermore, most of these programs (if not all) already are present in some form at Milwaukee’s large
universities and colleges. MATC offers a technical diploma in entrepreneurship. UW-Milwaukee has programs
such as a chapter of the Collegiate Entrepreneurs Organization, a Student Startup Challenge, a Catalyst Grant
Program and a New Venture Business Plan Competition. The Sheldon B. Lubar School of Business offers an
Undergraduate Certificate in Entrepreneurship and an MBA elective track in entrepreneurship. The Bostrom
27
Several of these recommendations are echoed by West (2012) as well.
Transform Milwaukee 4-30 Entrepreneurs and Entrepreneurship
Center for Business Competitiveness, Innovation and Entrepreneurship has an entrepreneur internship
program and an entrepreneurs-in-residence program. Researchers from UWM also have recently participated
in the National Science Foundation’s Innovation Corps, a program to translate research into start-ups. Similar
examples are available through Marquette University’s Kohler Center for Entrepreneurship and Milwaukee
School of Engineering’s Center for Entrepreneurship. Technology transfer and development offices also are
present at each of these universities as well as at the Medical College of Wisconsin. However, additional
opportunities may exist, particularly by offering faculty outside these programs more information about
entrepreneurship for their students and themselves.
Better Connecting Existing Entrepreneurial Support Systems;
As listed in Figure 4.1, there are different types of entrepreneurs with various goals. Entrepreneurs can also be
categorized according to phases including: 1) pre-venture and latent entrepreneurs; 2) start-ups and early
growth businesses; 3) expanding or sustained growth firms; and 4) mature businesses. The need for capital
and technical support varies among these phases and a continuum of resources is needed to meet the needs
of these different entrepreneurs. Milwaukee has a number of fine programs offering general entrepreneurial
support, many of which have robust standard curriculums. However, entrepreneurs frequently need resources
beyond a general business development curriculum.
Directing entrepreneurs to the appropriate resources at the right time is challenging. As previously noted,
Servon et al (2010) suggest issues related to an information gap and an institutional capacity and service
delivery gap. As a reminder, the information gap suggests that cultural and language barriers; lack of
awareness of resources; poor financial literacy; and a lack of business acumen all hinder informed business
decision making. The institutional and service delivery gap suggests that small business support organizations
often face capacity issues related to high levels of fragmentation and inefficiency; duplication of services;
inadequate staffing and resources; and slow incorporation of emerging best practices. Previously, some of
these issues also were echoed in Wisconsin’s entrepreneurial support environment. Kauten (2000)
characterized entrepreneurs’ response to technical support resources in Wisconsin as follows:
The majority of people involved in the entrepreneurial process are not contacting assistance providers for
help. The reason is lack of awareness of programs;
When people did contact a resource provider, almost half of the respondents reported receiving
conflicting information.
To better connect entrepreneurs with a community’s various private, not-for-profit and public services, Servon
et al (2010) suggest creating entrepreneurship intermediaries. Similarly, the National Governor’s Association
(2004) advocates developing “brokers” that connect entrepreneurs to appropriate resources. Other means
for linking entrepreneurs with services include web-based tools. Several current websites serving as potential
entry points for entrepreneurs in Milwaukee provide links and information on existing support organizations.
However, a number of these resource lists do not describe information about the types of resources provided
by these organizations (i.e. technical support, licensing, available properties, workforce availability, financing,

Transform Milwaukee 4-31 Entrepreneurs and Entrepreneurship
etc.). Others have outdated information, listing organizations no longer in existence or referring to entities that
have since changed names (e.g. Wisconsin Department of Commerce). These omissions and inaccuracies may
actually increase confusion among entrepreneurs as to which organization provides an appropriate entry point
to the support system or which one provides a needed service on a “just-in-time” basis.
The concept of a “one-stop-shop” for services has become a cliché within economic development circles, but
there is undoubtedly a need for having a robust and comprehensive information system to support
entrepreneurs. The BizStarts Milwaukee website is one local example of this type of resource. However, many
of the resources on the BizStarts Milwaukee justifiably target start-ups and new businesses. While some
resources for existing businesses also reside on the BizStarts Milwaukee website, another potential model for
providing information to existing firms is the NYC Business Solutions website (Figure 4.4). The website’s
strength is its structure around specific activities related to starting, operating and expanding a business,
rather than by listing information by narrow topics or by organization. Its specific structure considers the
following activities:
Launching a Business;
Opening a New Location;
Growing a Business;
Running a Business;
Seasonal Expansion;
Staying in Business.
Additional links are structured according to business courses, legal assistance, financing assistance, incentives,
navigating government, labor recruitment and training, selling to government, and certification. Entrepreneurs
can have information translated into more than 30
languages. NYC Business Solutions also connects
businesses of all sorts with “case managers” who can
guide entrepreneurs.
Creation of a similar system in Milwaukee should be
discussed with existing support organizations, not as a
means of replacing existing resources, but as a way to
guide clients to an appropriate partner. This model
also could be used to disseminate information to firms
interested in relocating to the area. If such an effort is
to be pursued in Milwaukee, existing entrepreneurial
support organizations; other economic development
organizations; and lending institutions in the
community will need to create a formal skills, financing
and knowledge inventory around the aforementioned
topics. Ultimately, this inventory would create the
data necessary to drive the website.
Continued and expanded personalized mentoring and
coaching systems also are needed as part of the
system. Some entrepreneurs may best be served by
Figure 4.4 – NYC Business Solutions Website http://www.nyc.gov/html/sbs/nycbiz/html/home/home.shtml
Source: City of New York
Transform Milwaukee 4-32 Entrepreneurs and Entrepreneurship
more tailored mentoring and coaching rather than specific training programs that are presented in a
sequential, multi-session business plan curriculum. Having a mentor or coach to act as a sounding board or
help entrepreneurs seek out business skill and knowledge needs is essential.28 BizStarts Milwaukee’s Venture
Track Mentoring Program provides one specific example, but other types of mentoring programs should be
explored for firms that may not fit the BizStarts Milwaukee model.
Developing Support for Second-Stage Companies
As noted in the analysis of entrepreneurial activity, so-called second stage companies have been identified as a
potential, but often overlooked, source of revenue and job growth. To help foster this potential, several
communities, regions and states have created targeted efforts to grow these companies. Many of these
efforts fall under the auspices of Economic Gardening® (EG). Economic Gardening was introduced in 1989 by
Chris Gibbons in Littleton, Colorado, to address economic development needs after several thousand
employees were laid off at the community’s largest employer. The program was based on research by David
Birch at MIT indicating that the vast majority of all new jobs in any local economy are produced by small, local
businesses within the community. Consequently, the goal of Economic Gardening was to grow jobs through
entrepreneurial activity instead of hunting for them through recruiting.29
Since 1989, Economic Gardening has evolved greatly and is often used as a prototype to help second-stage
companies grow. As noted earlier, second-stage companies face distinct challenges in that they have typically
survived the start-up stage, but have also reached a position where the complexity of running the company
has exceeded the capacity of one owner or CEO. Consequently, more formal operational structures and
strategy may be needed to continue growth and evolve into the next stage of business. However, expertise,
time and revenue are often lacking to support efforts to develop new structures and identify growth
opportunities. Economic Gardening programs seek to overcome these challenges by providing assistance
related to developing new markets, refining business models and accessing competitive intelligence resources
usually available only to large corporations with sizeable budgets.
The specifics of Economic Gardening networks vary by program. The Edward Lowe Foundation’s National
Economic Gardening Center model connects qualifying companies to a team of research specialists. The
research team’s initial step is to interview the CEO and isolate specific growth issues. This beginning process is
imperative as a company’s actual obstacles to growth may be obscured by other perceived problems. The
research team then devotes a certain number of hours to each company over a brief period to gather
information for use in implement new strategies and activities. Research typically involves a specific set of
disciplines such as:
Competitive Intelligence – Exploring emerging trends within an industry, identifying competitors and
connecting suppliers;
28
However, expecting a mentor or coach to provide one-on-one education to the entrepreneur as needs arise is not practical and mentors need to be aware of other “just-in-time” resources offered by web-based tools, seminars and workshops. 29
This background is from the City of Littleton’s website. For more, see: http://www.littletongov.org/index.aspx?page=219
Transform Milwaukee 4-33 Entrepreneurs and Entrepreneurship
Search Engine Optimization (SEO) and Social Media Strategy Development – Maximizing these resources
to increase search engine visibility and website traffic;
Market Analysis – Identifying new markets and increasing penetration among existing customer
categories;
Geographic Information Systems (GIS) – GIS is used for data mining and visualization a variety of tasks
(e.g. analyzing trade areas, customer prospecting, site selection, market penetration, etc.);
Core Strategy Review – Some high-fidelity EG programs (such as GrowFL) review and develop business
strategies related to competition, niche markets, and phasing.
Importantly, most services provided by Economic Gardening networks go beyond typical business planning,
basic market analysis and operations management. They involve detailed competitive intelligence and
strategic analysis to help the company improve revenues. Consequently, EG networks are often
complimentary activities and do not duplicate services provided by existing entrepreneurial support
organizations.
Developing an Economic Gardening program in Milwaukee’s Industrial Corridor could help local second stage
companies. The program may be of particular interest as:
Dedicated support to second-stage companies appears to be a service delivery gap in the Milwaukee
region;
Milwaukee County has a large pool of potential second-stage firms and establishments (Table 4.9) that
could provide local growth potential. Not all establishments with 10-99 employees in Milwaukee County
fit the definition of a second-stage company, but a sizeable share might;30
Employment growth among second-stage firms in Milwaukee County has run counter to the national trend
for the last 15 years;
Milwaukee could be unique nationally in applying this program to a central city setting facing high
unemployment rates; (Existing and past programs are available at:
http://www.growfl.com/about/national-economic-gardening-map)
Pursing EG as part of the Transform Milwaukee Initiative would require a pilot program. A limited program
involving five to ten firms would be essential to providing “proof of concept” locally and determining whether
three important issues can be overcome. First, companies will need to develop trust with the local EG
research team with specifics of their operations. If successful, companies in the pilot program could become
champions of furthering the program and developing trust among peers in the community. Second, a program
must ensure an adequate pool of appropriate second-stage firms to participate. There are a large number of
potential second-stage firms in Milwaukee, so this challenge may be less problematic in Milwaukee. Finally,
30
For instance, a number of establishments in Table 4.9 are branch facilities or individual locations/outlets of large firms.
Transform Milwaukee 4-34 Entrepreneurs and Entrepreneurship
there needs to be sufficient capital for implementation of recommendations. Companies participating in EG
programs often do not have sufficient financial capital to implement recommendations from the research
team. Partnering with WHEDA and other organizations to develop this pilot program may aid in overcoming
these obstacles. Specifically, WHEDA and its partners may be able to foster trust among business owners and
perhaps better connect participants with financing.
Implementing an EG program could be modeled on many existing programs and costs can vary. To fully
establish a high-fidelity EG program locally requires costly software and databases. Consequently, some EG
networks rely on the research team at the Edward Lowe Foundation’s National Economic Gardening Center on
a pay-per-service basis. Other networks, such as GrowFL, have a statewide program operated through the
University of Central Florida (see: http://www.growfl.com/). For a pilot program in Milwaukee, most of the
needed resources possibly could be leveraged through local support networks and higher educational
institutions. For instance, UW-Extension’s Center for Community and Economic Development could offer
expertise in GIS and market analysis. The University of Wisconsin System has licenses for a number of
databases used in competitive intelligence activities. There may be faculty and academic staff at UWM,
Marquette, MATC and MSOE able to provide expertise on a variety of topics. However, these interests need to
be assessed. Furthermore, some level of training is necessary to meet national Economic Gardening
standards.31 If deemed worth pursing, identifying potential partners and formalizing an EG pilot program could
be accomplished through a series of meetings among interested parties.
31 The National Economic Gardening Center has formalized training requirements.

Transform Milwaukee 4-35 Entrepreneurs and Entrepreneurship
Table 4.9 – Number of Establishments with 10-99 Employees in Milwaukee County - Top 40 Industry Categories in 2011
NAICS Description Establishments with
10-99 Employees Total Establishments
of All Sizes
722 Food Services and Drinking Places 888 1,707
541 Professional, Scientific, and Technical Services 422 2,073
621 Ambulatory Health Care Services 409 1,449
611 Educational Services 313 543
561 Administrative and Support Services 301 1,088
624 Social Assistance 292 908
423 Merchant Wholesalers, Durable Goods 224 674
522 Credit Intermediation and Related Activities 154 467
446 Health and Personal Care Stores 147 311
238 Specialty Trade Contractors 146 737
448 Clothing and Clothing Accessories Stores 133 348
812 Personal and Laundry Services 129 543
623 Nursing and Residential Care Facilities 126 323
332 Fabricated Metal Product Manufacturing 126 242
813 Religious, Grantmaking, Civic, Professional, and Similar Orgs. 105 369
441 Motor Vehicle and Parts Dealers 103 238
445 Food and Beverage Stores 96 395
811 Repair and Maintenance 94 568
531 Real Estate 90 589
453 Miscellaneous Store Retailers 76 261
551 Management of Companies and Enterprises 73 218
484 Truck Transportation 73 275
424 Merchant Wholesalers, Nondurable Goods 69 272
524 Insurance Carriers and Related Activities 68 472
721 Accommodation 63 101
713 Amusement, Gambling, and Recreation Industries 63 159
333 Machinery Manufacturing 60 132
451 Sporting Goods, Hobby, Musical Instrument, and Book Stores 58 143
447 Gasoline Stations 52 273
311 Food Manufacturing 46 100
488 Support Activities for Transportation 44 117
323 Printing and Related Support Activities 43 116
523 Securities, Commodity Contracts, and Other Financial Investments 42 215
444 Building Material and Garden Equipment and Supplies Dealers 41 133
236 Construction of Buildings 40 267
532 Rental and Leasing Services 35 112
325 Chemical Manufacturing 34 61
442 Furniture and Home Furnishings Stores 32 119
485 Transit and Ground Passenger Transportation 30 69
443 Electronics and Appliance Stores 27 135
Sources: Wisconsin Department of Workforce Development and UW-Extension Center for Community and Economic Development
Transform Milwaukee 4-36 Entrepreneurs and Entrepreneurship
Conclusion
Developing entrepreneurs is not a panacea to improve the local labor market or grow the economy. However,
entrepreneurship in Milwaukee remains largely underutilized as an economic development strategy.
Entrepreneurial activity is lacking, particularly in start-ups, second-stage companies, and minority business
ownership. Improving entrepreneurial activity and the overall culture will take a long-term, focused effort. It
requires the support of existing organizations in the community. A better understanding of entrepreneurship
is needed in the community. While this research highlights some of these considerations, more in-depth
research will provide additional insights.
The preceding discussion suggested a number of areas where additional initiatives could be explored. Further
support for minority business enterprises should be considered. Effort is needed to enhance the community’s
entrepreneurial culture. Technology transfer needs to be better understood and reframed. Better
coordination of entrepreneurial support systems would be beneficial. Finally, a new targeted effort in
supporting second-stage companies could further existing entrepreneurial support initiatives in Milwaukee.
These strategies are not intended to be duplicative of existing efforts, but rather complementary to them.
Some of them could benefit from the assistance of WHEDA staff and resources. Others could be standalone
initiatives. Ultimately, WHEDA leadership needs to determine the best, most appropriate roles for the
organization.

Transform Milwaukee 4-37 Entrepreneurs and Entrepreneurship
Appendix 4A – Average Self-Employment Income by Census Tract (2006-2010)
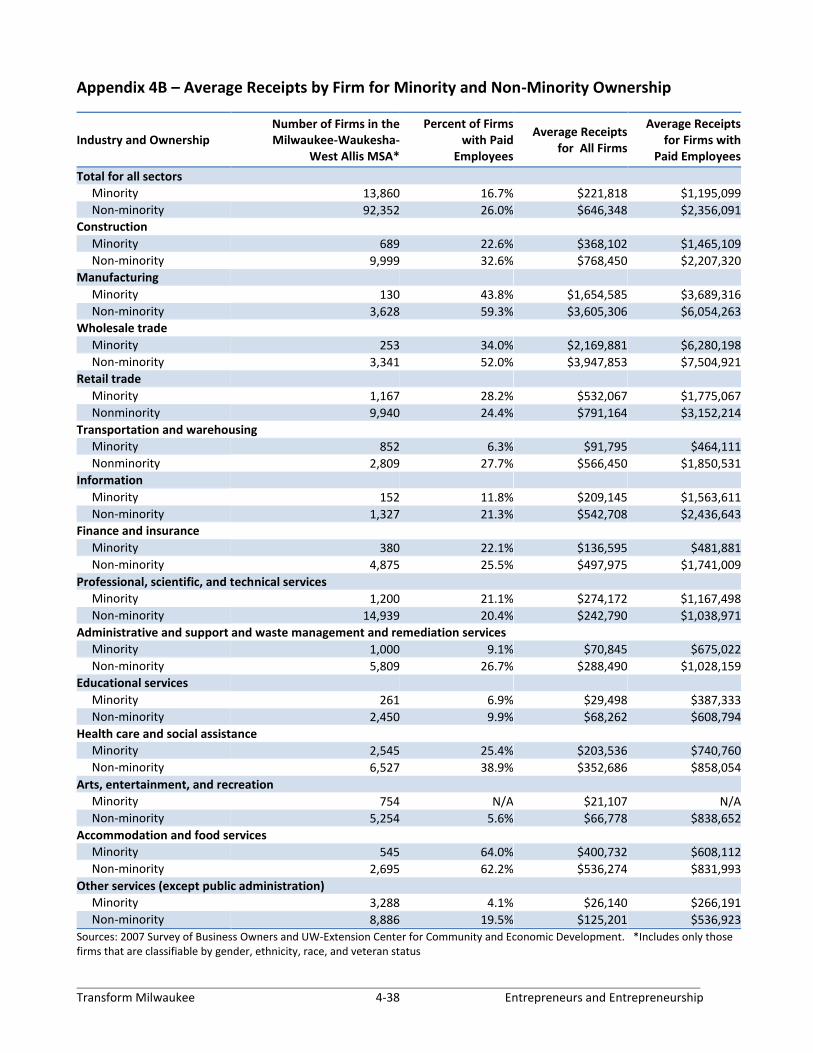
Transform Milwaukee 4-38 Entrepreneurs and Entrepreneurship
Appendix 4B – Average Receipts by Firm for Minority and Non-Minority Ownership
Industry and Ownership Number of Firms in the Milwaukee-Waukesha-
West Allis MSA*
Percent of Firms with Paid
Employees
Average Receipts for All Firms
Average Receipts for Firms with
Paid Employees
Total for all sectors
Minority 13,860 16.7% $221,818 $1,195,099
Non-minority 92,352 26.0% $646,348 $2,356,091 Construction
Minority 689 22.6% $368,102 $1,465,109
Non-minority 9,999 32.6% $768,450 $2,207,320
Manufacturing
Minority 130 43.8% $1,654,585 $3,689,316
Non-minority 3,628 59.3% $3,605,306 $6,054,263 Wholesale trade
Minority 253 34.0% $2,169,881 $6,280,198
Non-minority 3,341 52.0% $3,947,853 $7,504,921
Retail trade
Minority 1,167 28.2% $532,067 $1,775,067
Nonminority 9,940 24.4% $791,164 $3,152,214
Transportation and warehousing
Minority 852 6.3% $91,795 $464,111
Nonminority 2,809 27.7% $566,450 $1,850,531
Information
Minority 152 11.8% $209,145 $1,563,611
Non-minority 1,327 21.3% $542,708 $2,436,643 Finance and insurance
Minority 380 22.1% $136,595 $481,881
Non-minority 4,875 25.5% $497,975 $1,741,009
Professional, scientific, and technical services
Minority 1,200 21.1% $274,172 $1,167,498
Non-minority 14,939 20.4% $242,790 $1,038,971
Administrative and support and waste management and remediation services
Minority 1,000 9.1% $70,845 $675,022
Non-minority 5,809 26.7% $288,490 $1,028,159
Educational services
Minority 261 6.9% $29,498 $387,333
Non-minority 2,450 9.9% $68,262 $608,794
Health care and social assistance
Minority 2,545 25.4% $203,536 $740,760
Non-minority 6,527 38.9% $352,686 $858,054
Arts, entertainment, and recreation
Minority 754 N/A $21,107 N/A
Non-minority 5,254 5.6% $66,778 $838,652
Accommodation and food services
Minority 545 64.0% $400,732 $608,112
Non-minority 2,695 62.2% $536,274 $831,993
Other services (except public administration)
Minority 3,288 4.1% $26,140 $266,191
Non-minority 8,886 19.5% $125,201 $536,923
Sources: 2007 Survey of Business Owners and UW-Extension Center for Community and Economic Development. *Includes only those firms that are classifiable by gender, ethnicity, race, and veteran status
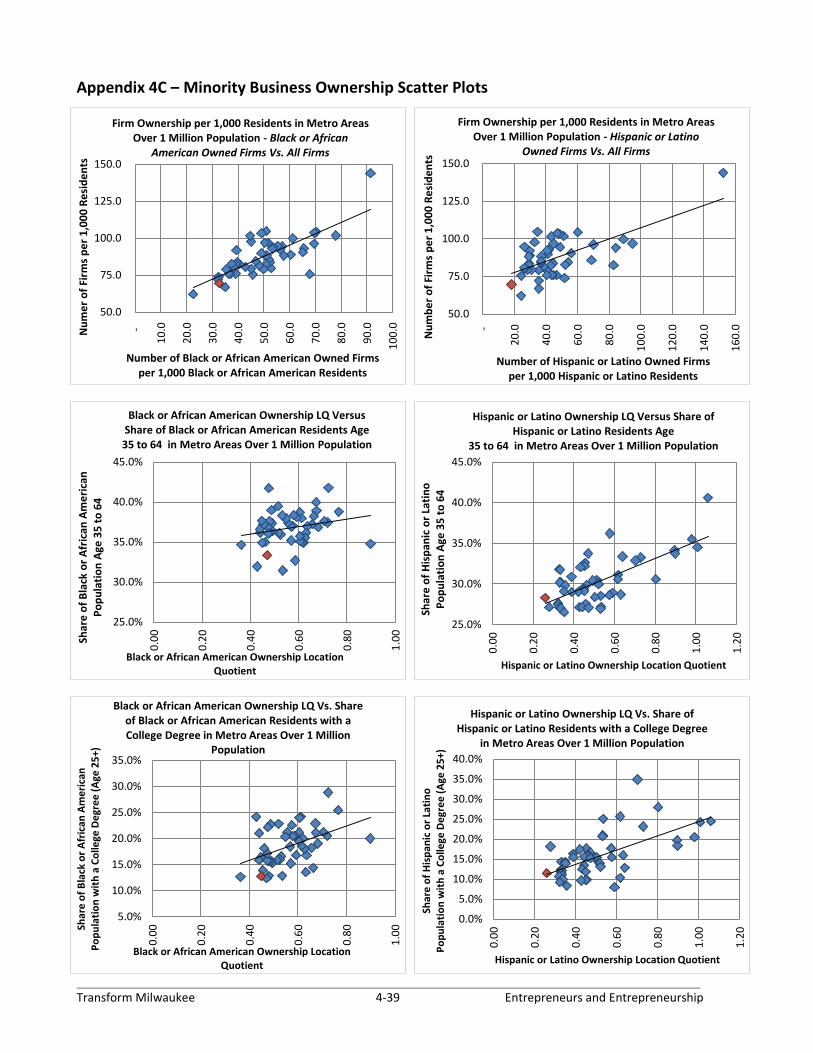
Transform Milwaukee 4-39 Entrepreneurs and Entrepreneurship
Appendix 4C – Minority Business Ownership Scatter Plots
50.0
75.0
100.0
125.0
150.0
-
10
.0
20
.0
30
.0
40
.0
50
.0
60
.0
70
.0
80
.0
90
.0
10
0.0Nu
me
r o
f Fi
rms
pe
r 1
,00
0 R
esi
de
nts
Number of Black or African American Owned Firms per 1,000 Black or African American Residents
Firm Ownership per 1,000 Residents in Metro Areas Over 1 Million Population - Black or African
American Owned Firms Vs. All Firms
50.0
75.0
100.0
125.0
150.0
-
20
.0
40
.0
60
.0
80
.0
10
0.0
12
0.0
14
0.0
16
0.0Nu
mb
er
of
Firm
s p
er
1,0
00
Re
sid
en
ts
Number of Hispanic or Latino Owned Firms per 1,000 Hispanic or Latino Residents
Firm Ownership per 1,000 Residents in Metro Areas Over 1 Million Population - Hispanic or Latino
Owned Firms Vs. All Firms
25.0%
30.0%
35.0%
40.0%
45.0%
0.0
0
0.2
0
0.4
0
0.6
0
0.8
0
1.0
0
Shar
e o
f B
lack
or
Afr
ican
Am
eri
can
P
op
ula
tio
n A
ge 3
5 t
o 6
4
Black or African American Ownership Location Quotient
Black or African American Ownership LQ Versus Share of Black or African American Residents Age
35 to 64 in Metro Areas Over 1 Million Population
25.0%
30.0%
35.0%
40.0%
45.0%
0.0
0
0.2
0
0.4
0
0.6
0
0.8
0
1.0
0
1.2
0
Shar
e o
f H
isp
anic
or
Lati
no
P
op
ula
tio
n A
ge 3
5 t
o 6
4
Hispanic or Latino Ownership Location Quotient
Hispanic or Latino Ownership LQ Versus Share of Hispanic or Latino Residents Age
35 to 64 in Metro Areas Over 1 Million Population
5.0%
10.0%
15.0%
20.0%
25.0%
30.0%
35.0%
0.0
0
0.2
0
0.4
0
0.6
0
0.8
0
1.0
0Shar
e o
f B
lack
or
Afr
ican
Am
eri
can
P
op
ula
tio
n w
ith
a C
olle
ge D
egr
ee
(A
ge 2
5+)
Black or African American Ownership Location Quotient
Black or African American Ownership LQ Vs. Share of Black or African American Residents with a College Degree in Metro Areas Over 1 Million
Population
0.0%
5.0%
10.0%
15.0%
20.0%
25.0%
30.0%
35.0%
40.0%
0.0
0
0.2
0
0.4
0
0.6
0
0.8
0
1.0
0
1.2
0
Shar
e o
f H
isp
anic
or
Lati
no
P
op
ula
tio
n w
ith
a C
olle
ge D
egr
ee
(A
ge 2
5+)
Hispanic or Latino Ownership Location Quotient
Hispanic or Latino Ownership LQ Vs. Share of Hispanic or Latino Residents with a College Degree
in Metro Areas Over 1 Million Population