Embed Size (px)
Citation preview
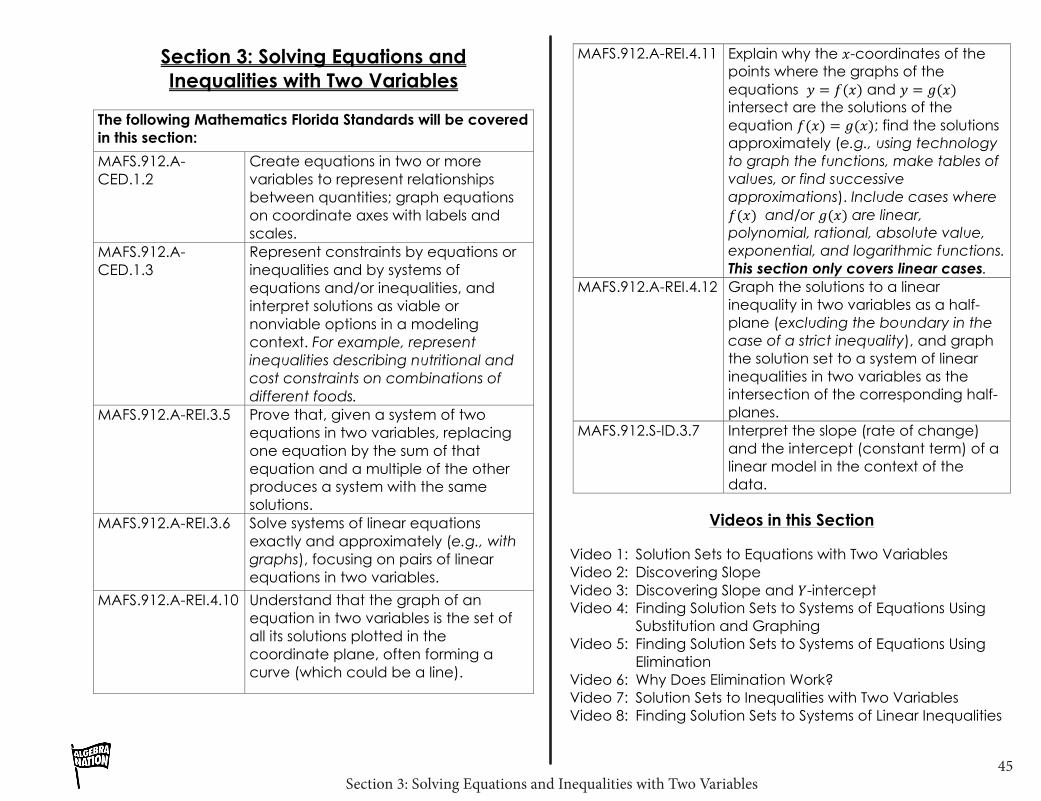
Section 3: Solving Equations and Inequalities with Two Variables45
!
Section 3: Solving Equations and Inequalities with Two Variables
The following Mathematics Florida Standards will be covered in this section:
MAFS.912.A-CED.1.2
Create equations in two or more variables to represent relationships between quantities; graph equations on coordinate axes with labels and scales.
MAFS.912.A-CED.1.3
Represent constraints by equations or inequalities and by systems of equations and/or inequalities, and interpret solutions as viable or nonviable options in a modeling context. For example, represent inequalities describing nutritional and cost constraints on combinations of different foods.
MAFS.912.A-REI.3.5 Prove that, given a system of two equations in two variables, replacing one equation by the sum of that equation and a multiple of the other produces a system with the same solutions.
MAFS.912.A-REI.3.6 Solve systems of linear equations exactly and approximately (e.g., with graphs), focusing on pairs of linear equations in two variables.
MAFS.912.A-REI.4.10 Understand that the graph of an equation in two variables is the set of all its solutions plotted in the coordinate plane, often forming a curve (which could be a line).
MAFS.912.A-REI.4.11 Explain why the 𝑥𝑥-coordinates of the points where the graphs of the equations 𝑦𝑦 = 𝑓𝑓(𝑥𝑥) and 𝑦𝑦 = 𝑔𝑔(𝑥𝑥) intersect are the solutions of the equation 𝑓𝑓(𝑥𝑥) = 𝑔𝑔(𝑥𝑥); find the solutions approximately (e.g., using technology to graph the functions, make tables of values, or find successive approximations). Include cases where 𝑓𝑓(𝑥𝑥) and/or 𝑔𝑔(𝑥𝑥) are linear, polynomial, rational, absolute value, exponential, and logarithmic functions. This section only covers linear cases.
MAFS.912.A-REI.4.12 Graph the solutions to a linear inequality in two variables as a half-plane (excluding the boundary in the case of a strict inequality), and graph the solution set to a system of linear inequalities in two variables as the intersection of the corresponding half-planes.
MAFS.912.S-ID.3.7 Interpret the slope (rate of change) and the intercept (constant term) of a linear model in the context of the data.
Videos in this Section
Video 1: Solution Sets to Equations with Two Variables Video 2: Discovering Slope Video 3: Discovering Slope and 𝑌𝑌-intercept Video 4: Finding Solution Sets to Systems of Equations Using Substitution and Graphing Video 5: Finding Solution Sets to Systems of Equations Using Elimination Video 6: Why Does Elimination Work? Video 7: Solution Sets to Inequalities with Two Variables Video 8: Finding Solution Sets to Systems of Linear Inequalities
Section 3: Solving Equations and Inequalities with Two Variables46
!
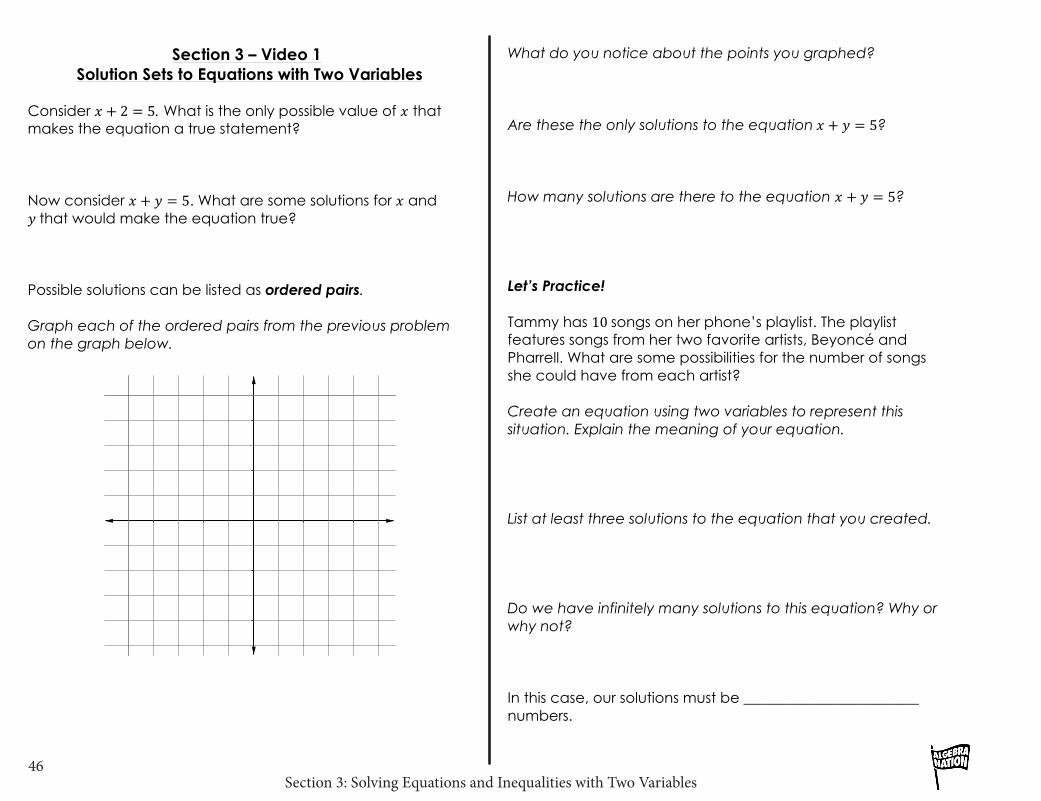
Section 3 – Video 1 Solution Sets to Equations with Two Variables
Consider 𝑥𝑥 + 2 = 5. What is the only possible value of 𝑥𝑥 that makes the equation a true statement? Now consider 𝑥𝑥 + 𝑦𝑦 = 5. What are some solutions for 𝑥𝑥 and 𝑦𝑦 that would make the equation true? Possible solutions can be listed as ordered pairs. Graph each of the ordered pairs from the previous problem on the graph below.
What do you notice about the points you graphed? Are these the only solutions to the equation 𝑥𝑥 + 𝑦𝑦 = 5? How many solutions are there to the equation 𝑥𝑥 + 𝑦𝑦 = 5? Let’s Practice! Tammy has 10 songs on her phone’s playlist. The playlist features songs from her two favorite artists, Beyoncé and Pharrell. What are some possibilities for the number of songs she could have from each artist? Create an equation using two variables to represent this situation. Explain the meaning of your equation. List at least three solutions to the equation that you created. Do we have infinitely many solutions to this equation? Why or why not? In this case, our solutions must be ________________________ numbers.
Section 3: Solving Equations and Inequalities with Two Variables47
!
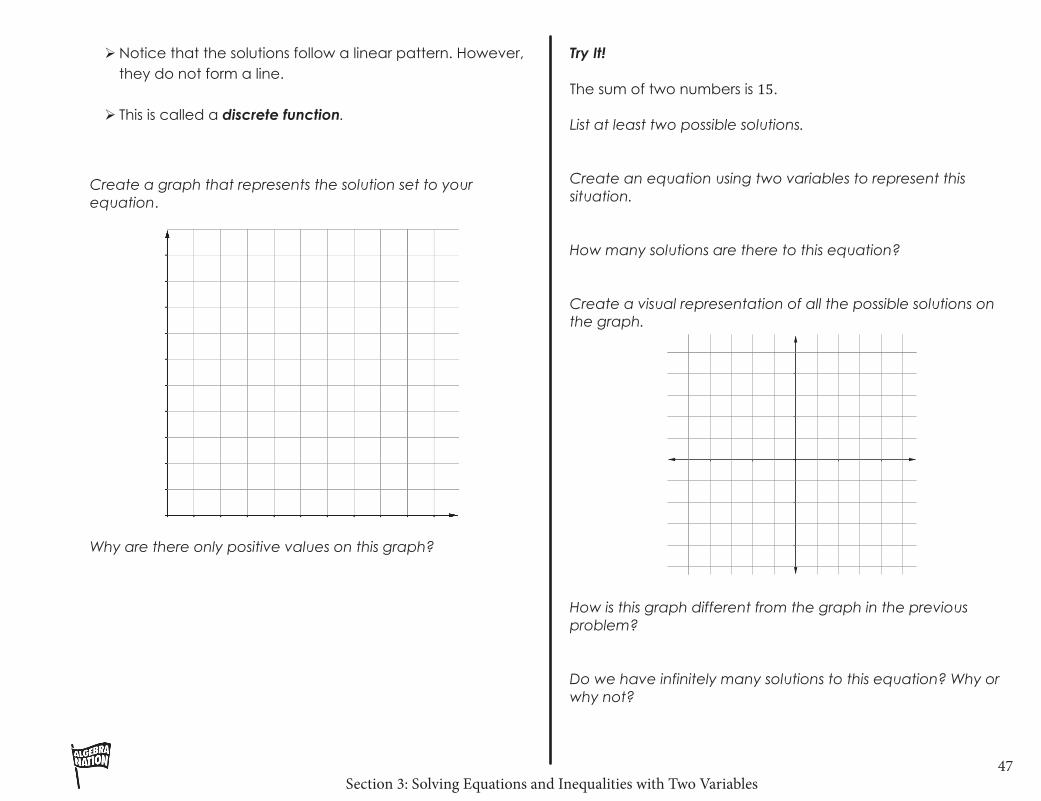
! Notice that the solutions follow a linear pattern. However, they do not form a line.
! This is called a discrete function.
Create a graph that represents the solution set to your equation.
Why are there only positive values on this graph?
Try It! The sum of two numbers is 15. List at least two possible solutions. Create an equation using two variables to represent this situation. How many solutions are there to this equation? Create a visual representation of all the possible solutions on the graph.
How is this graph different from the graph in the previous problem? Do we have infinitely many solutions to this equation? Why or why not?
Section 3: Solving Equations and Inequalities with Two Variables48
!
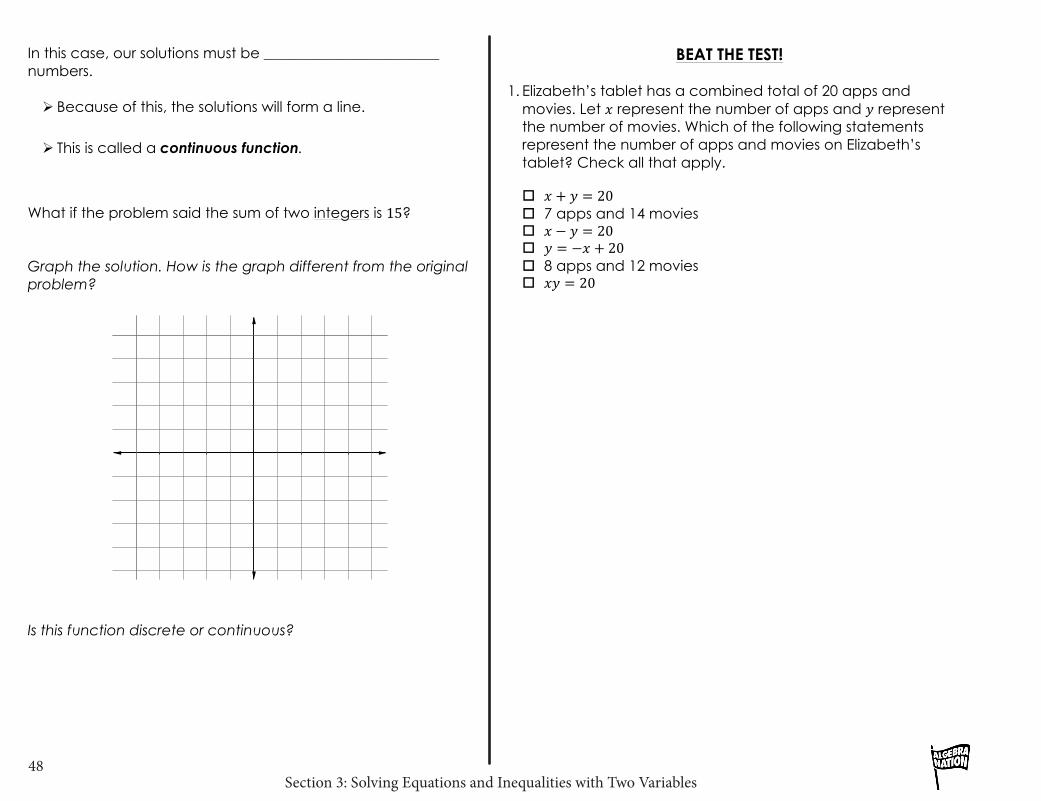
In this case, our solutions must be ________________________ numbers. ! Because of this, the solutions will form a line.
! This is called a continuous function.
What if the problem said the sum of two integers is 15? Graph the solution. How is the graph different from the original problem?
Is this function discrete or continuous?
BEAT THE TEST! 1. Elizabeth’s tablet has a combined total of 20 apps and
movies. Let 𝑥𝑥 represent the number of apps and 𝑦𝑦 represent the number of movies. Which of the following statements represent the number of apps and movies on Elizabeth’s tablet? Check all that apply.
" 𝑥𝑥 + 𝑦𝑦 = 20 " 7 apps and 14 movies " 𝑥𝑥 − 𝑦𝑦 = 20 " 𝑦𝑦 = −𝑥𝑥 + 20 " 8 apps and 12 movies " 𝑥𝑥𝑥𝑥 = 20
Section 3: Solving Equations and Inequalities with Two Variables49
!
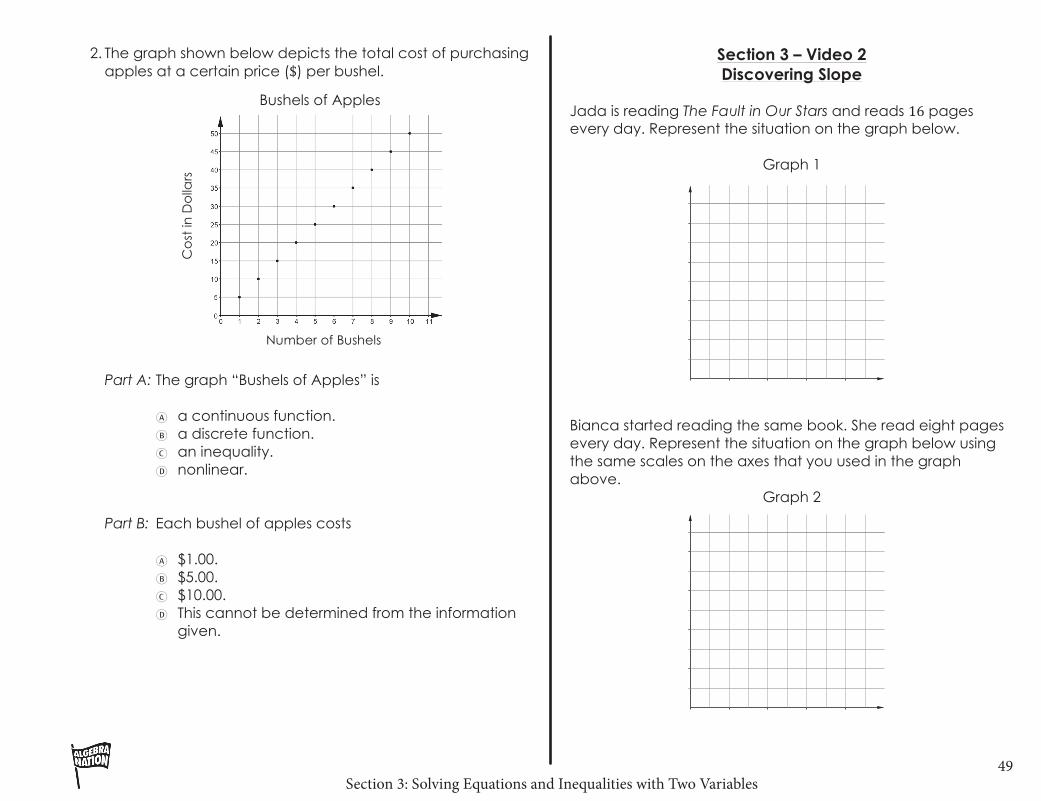
2. The graph shown below depicts the total cost of purchasing apples at a certain price ($) per bushel.
Part A: The graph “Bushels of Apples” is
A a continuous function. B a discrete function. C an inequality. D nonlinear.
Part B: Each bushel of apples costs
A $1.00. B $5.00. C $10.00. D This cannot be determined from the information
given.
Number of Bushels
Co
st in
Do
llars
Bushels of Apples
Section 3 – Video 2 Discovering Slope
Jada is reading The Fault in Our Stars and reads 16 pages every day. Represent the situation on the graph below.
Graph 1
Bianca started reading the same book. She read eight pages every day. Represent the situation on the graph below using the same scales on the axes that you used in the graph above.
Graph 2
Section 3: Solving Equations and Inequalities with Two Variables50
!
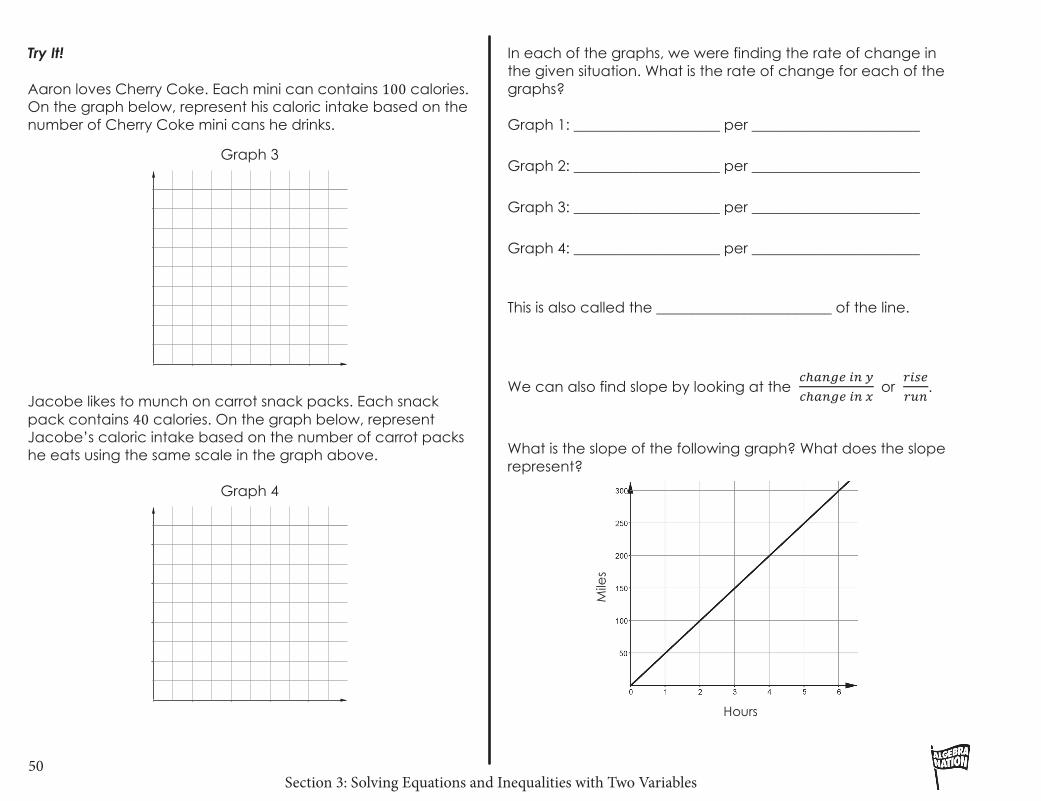
Try It! Aaron loves Cherry Coke. Each mini can contains 100 calories. On the graph below, represent his caloric intake based on the number of Cherry Coke mini cans he drinks.
Graph 3
Jacobe likes to munch on carrot snack packs. Each snack pack contains 40 calories. On the graph below, represent Jacobe’s caloric intake based on the number of carrot packs he eats using the same scale in the graph above.
Graph 4
In each of the graphs, we were finding the rate of change in the given situation. What is the rate of change for each of the graphs? Graph 1: ____________________ per _______________________ Graph 2: ____________________ per _______________________ Graph 3: ____________________ per _______________________ Graph 4: ____________________ per _______________________ This is also called the ________________________ of the line.
We can also find slope by looking at the !!!"#$ !" !!!!"#$ !" !
or !"#$!"#
.
What is the slope of the following graph? What does the slope represent?
Hours
Mile
s
Section 3: Solving Equations and Inequalities with Two Variables51
!
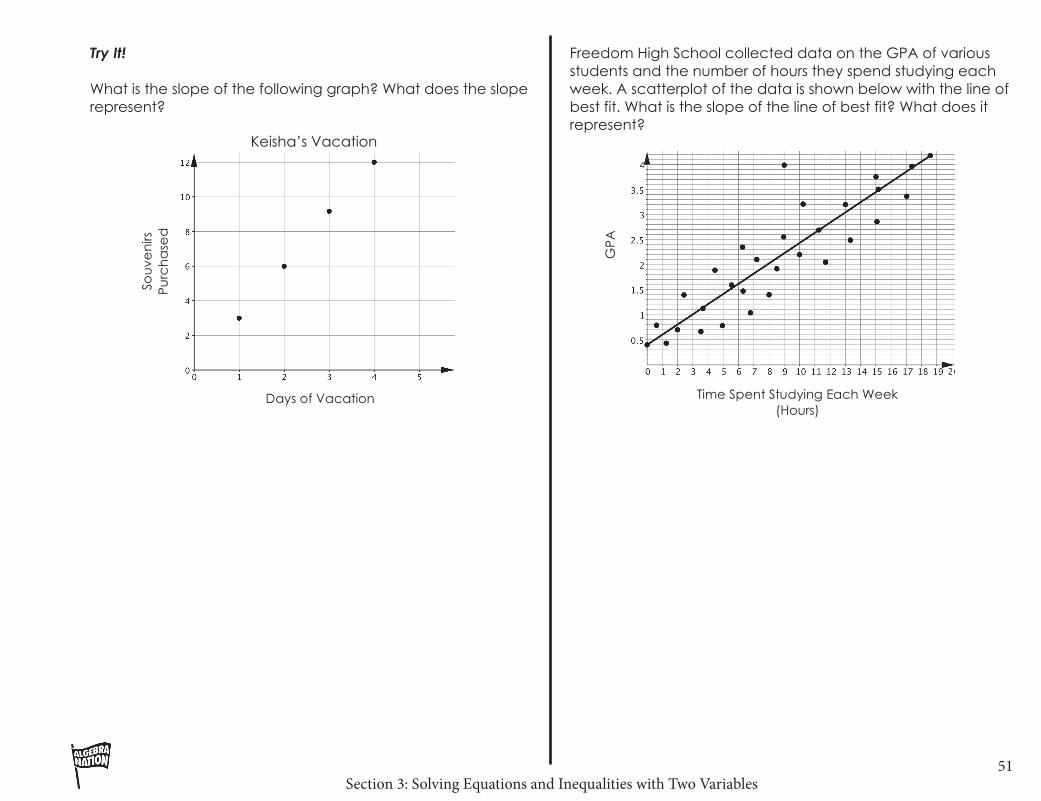
Try It! What is the slope of the following graph? What does the slope represent?
Days of Vacation
Sou
ven
irs
Purc
ha
sed
Keisha’s Vacation Souvenirs
Freedom High School collected data on the GPA of various students and the number of hours they spend studying each week. A scatterplot of the data is shown below with the line of best fit. What is the slope of the line of best fit? What does it represent?
Time Spent Studying Each Week (Hours)
GP
A
Section 3: Solving Equations and Inequalities with Two Variables52
!
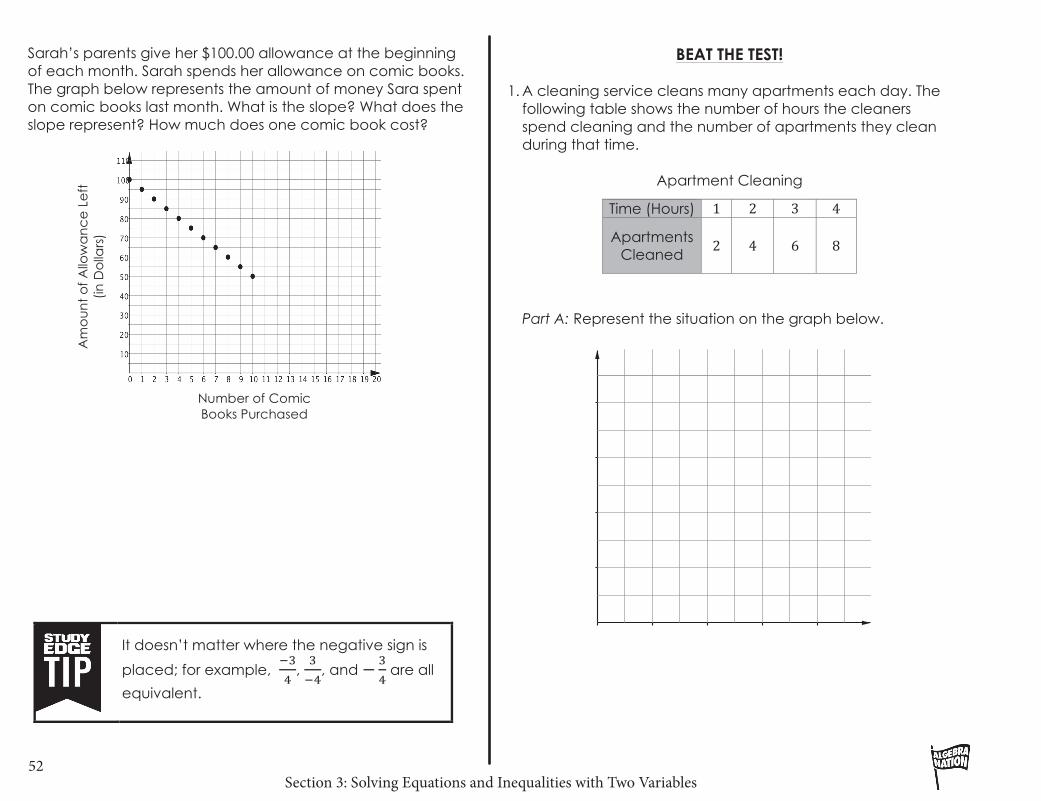
Sarah’s parents give her $100.00 allowance at the beginning of each month. Sarah spends her allowance on comic books. The graph below represents the amount of money Sara spent on comic books last month. What is the slope? What does the slope represent? How much does one comic book cost?
It doesn’t matter where the negative sign is
placed; for example, !!!
, !!!
, and − !! are all
equivalent.
Number of Comic Books Purchased
Am
ou
nt
of
Allo
wa
nc
e L
eft
(in
Do
llars
)
BEAT THE TEST!
1. A cleaning service cleans many apartments each day. The following table shows the number of hours the cleaners spend cleaning and the number of apartments they clean during that time.
Apartment Cleaning
Time (Hours) 1 2 3 4
Apartments Cleaned
2 4 6 8
Part A: Represent the situation on the graph below.
Section 3: Solving Equations and Inequalities with Two Variables53
!
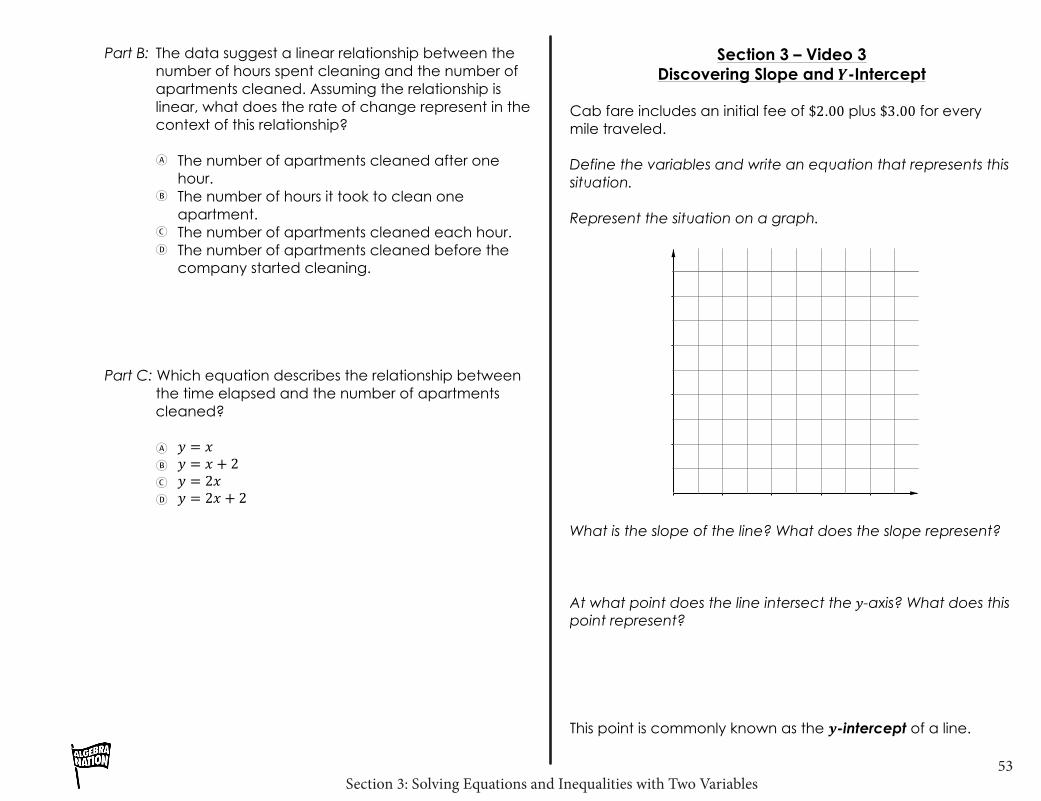
Part B: The data suggest a linear relationship between the number of hours spent cleaning and the number of apartments cleaned. Assuming the relationship is linear, what does the rate of change represent in the context of this relationship?
A The number of apartments cleaned after one
hour. B The number of hours it took to clean one
apartment. C The number of apartments cleaned each hour. D The number of apartments cleaned before the
company started cleaning.
Part C: Which equation describes the relationship between the time elapsed and the number of apartments cleaned?
A 𝑦𝑦 = 𝑥𝑥 B 𝑦𝑦 = 𝑥𝑥 + 2 C 𝑦𝑦 = 2𝑥𝑥 D 𝑦𝑦 = 2𝑥𝑥 + 2
Section 3 – Video 3 Discovering Slope and 𝒀𝒀-Intercept
Cab fare includes an initial fee of $2.00 plus $3.00 for every mile traveled. Define the variables and write an equation that represents this situation. Represent the situation on a graph.
What is the slope of the line? What does the slope represent? At what point does the line intersect the 𝑦𝑦-axis? What does this point represent? This point is commonly known as the 𝒚𝒚-intercept of a line.
Section 3: Solving Equations and Inequalities with Two Variables54
!
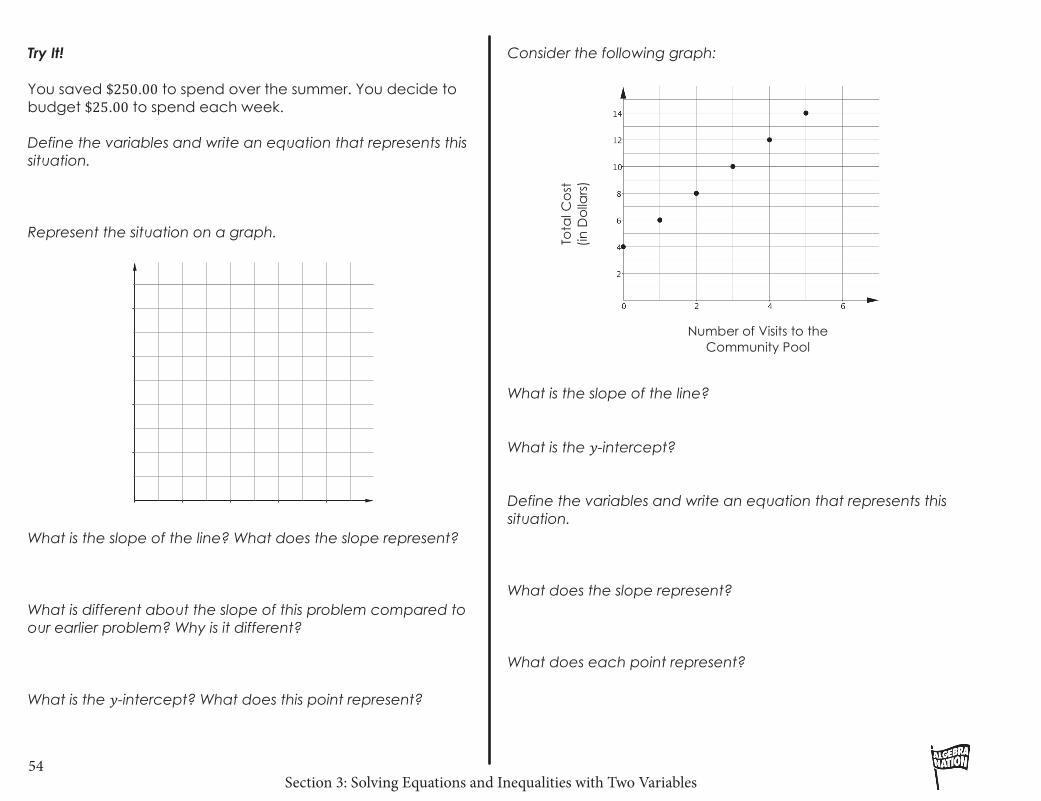
Try It! You saved $250.00 to spend over the summer. You decide to budget $25.00 to spend each week. Define the variables and write an equation that represents this situation. Represent the situation on a graph.
What is the slope of the line? What does the slope represent? What is different about the slope of this problem compared to our earlier problem? Why is it different? What is the 𝑦𝑦-intercept? What does this point represent?
Consider the following graph: What is the slope of the line? What is the 𝑦𝑦-intercept? Define the variables and write an equation that represents this situation. What does the slope represent? What does each point represent?
Number of Visits to the Community Pool
Tota
l Co
st
(in D
olla
rs)
Section 3: Solving Equations and Inequalities with Two Variables55
!
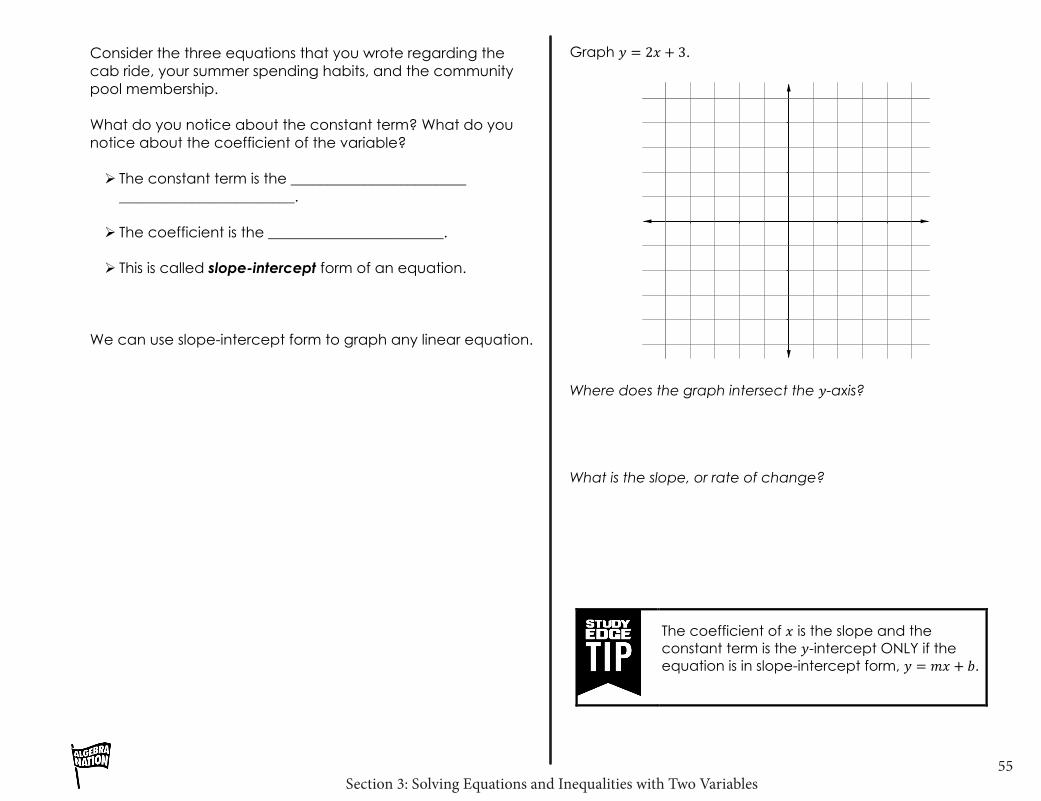
Consider the three equations that you wrote regarding the cab ride, your summer spending habits, and the community pool membership. What do you notice about the constant term? What do you notice about the coefficient of the variable? ! The constant term is the ________________________
________________________.
! The coefficient is the ________________________.
! This is called slope-intercept form of an equation. We can use slope-intercept form to graph any linear equation.
Graph 𝑦𝑦 = 2𝑥𝑥 + 3.
Where does the graph intersect the 𝑦𝑦-axis? What is the slope, or rate of change?
The coefficient of 𝑥𝑥 is the slope and the constant term is the 𝑦𝑦-intercept ONLY if the equation is in slope-intercept form, 𝑦𝑦 = 𝑚𝑚𝑚𝑚 + 𝑏𝑏.
Section 3: Solving Equations and Inequalities with Two Variables56
!
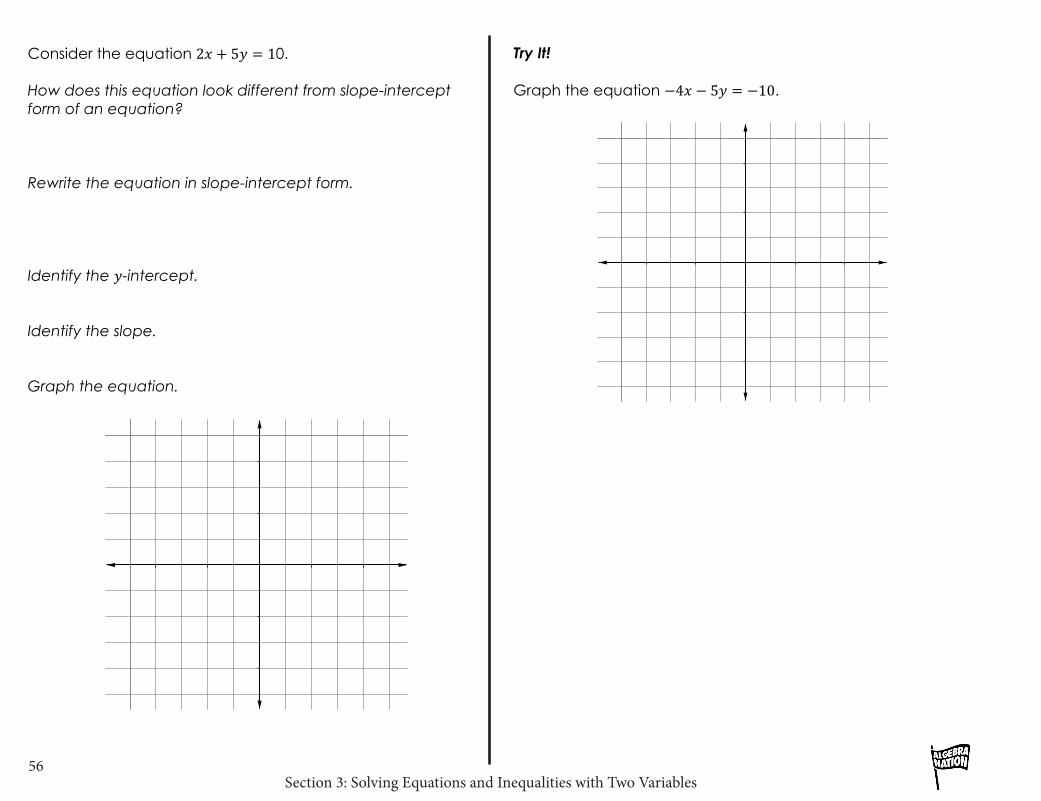
Consider the equation 2𝑥𝑥 + 5𝑦𝑦 = 10. How does this equation look different from slope-intercept form of an equation? Rewrite the equation in slope-intercept form. Identify the 𝑦𝑦-intercept. Identify the slope. Graph the equation.
Try It! Graph the equation −4𝑥𝑥 − 5𝑦𝑦 = −10.
Section 3: Solving Equations and Inequalities with Two Variables57
!
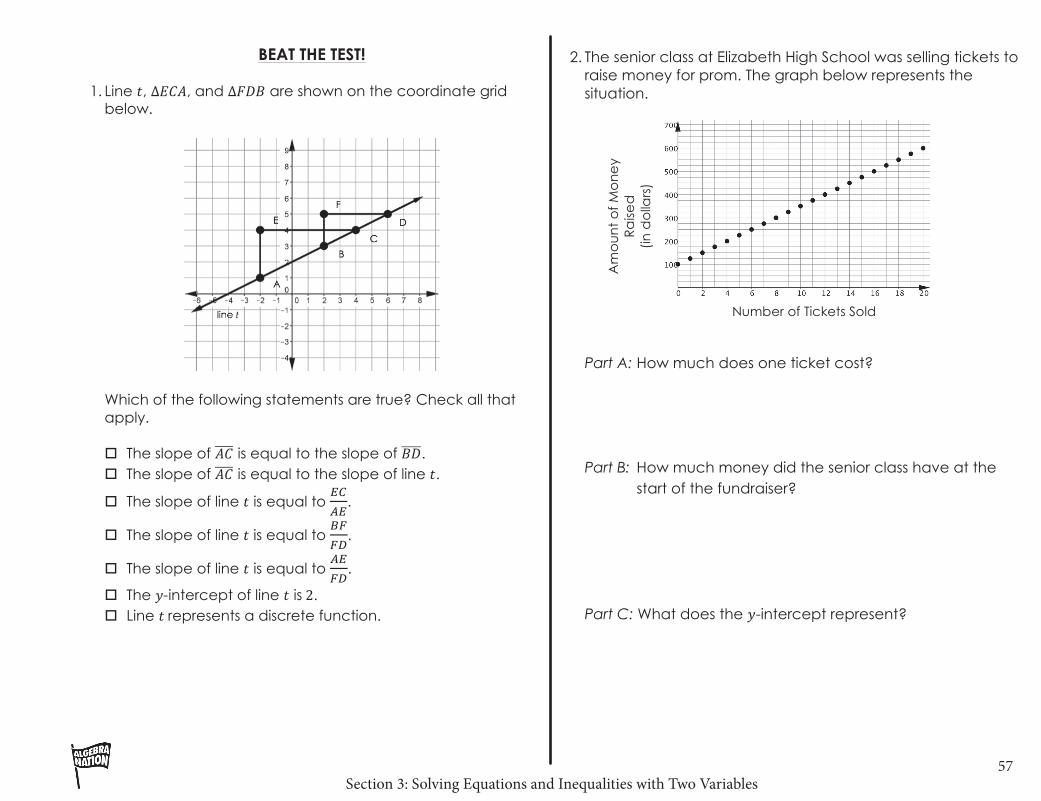
BEAT THE TEST! 1. Line 𝑡𝑡, ∆𝐸𝐸𝐸𝐸𝐸𝐸, and ∆𝐹𝐹𝐹𝐹𝐹𝐹 are shown on the coordinate grid
below.
Which of the following statements are true? Check all that apply. " The slope of 𝐴𝐴𝐴𝐴 is equal to the slope of 𝐵𝐵𝐵𝐵. " The slope of 𝐴𝐴𝐴𝐴 is equal to the slope of line 𝑡𝑡.
" The slope of line 𝑡𝑡 is equal to !"!"
.
" The slope of line 𝑡𝑡 is equal to !"!"
.
" The slope of line 𝑡𝑡 is equal to !"!"
.
" The 𝑦𝑦-intercept of line 𝑡𝑡 is 2. " Line 𝑡𝑡 represents a discrete function.
2. The senior class at Elizabeth High School was selling tickets to raise money for prom. The graph below represents the situation.
Part A: How much does one ticket cost? Part B: How much money did the senior class have at the
start of the fundraiser? Part C: What does the 𝑦𝑦-intercept represent?
Number of Tickets Sold
Am
ou
nt
of
Mo
ne
y R
aise
d
(in d
olla
rs)
Section 3: Solving Equations and Inequalities with Two Variables58
!
Section 3 – Video 4 Finding Solution Sets to Systems of Equations
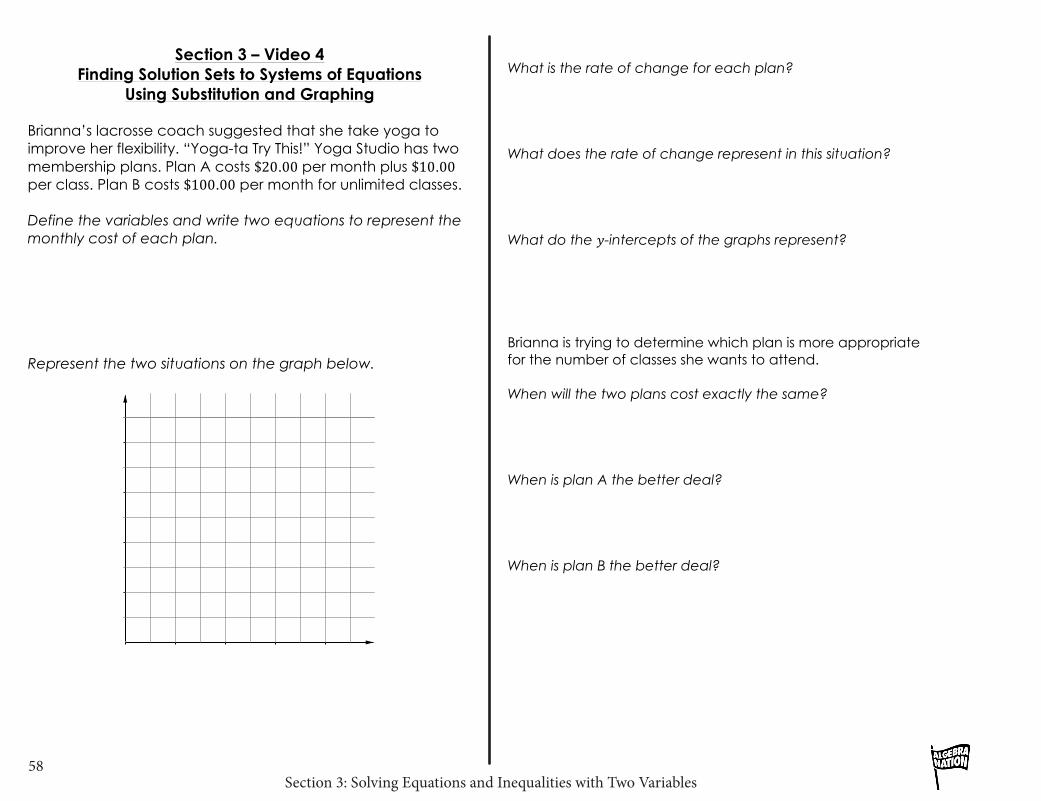
Using Substitution and Graphing Brianna’s lacrosse coach suggested that she take yoga to improve her flexibility. “Yoga-ta Try This!” Yoga Studio has two membership plans. Plan A costs $20.00 per month plus $10.00 per class. Plan B costs $100.00 per month for unlimited classes. Define the variables and write two equations to represent the monthly cost of each plan. Represent the two situations on the graph below.
What is the rate of change for each plan? What does the rate of change represent in this situation? What do the 𝑦𝑦-intercepts of the graphs represent? Brianna is trying to determine which plan is more appropriate for the number of classes she wants to attend. When will the two plans cost exactly the same? When is plan A the better deal? When is plan B the better deal?
Section 3: Solving Equations and Inequalities with Two Variables59
!
We can also help Brianna determine the best plan for her without graphing. Consider our two equations again. If 𝑦𝑦 represents the total cost, we simply want to know when the total costs would be equal. ! Set the two plans equal to each other and solve for the
number of visits.
! This method is called solving by _________________________.
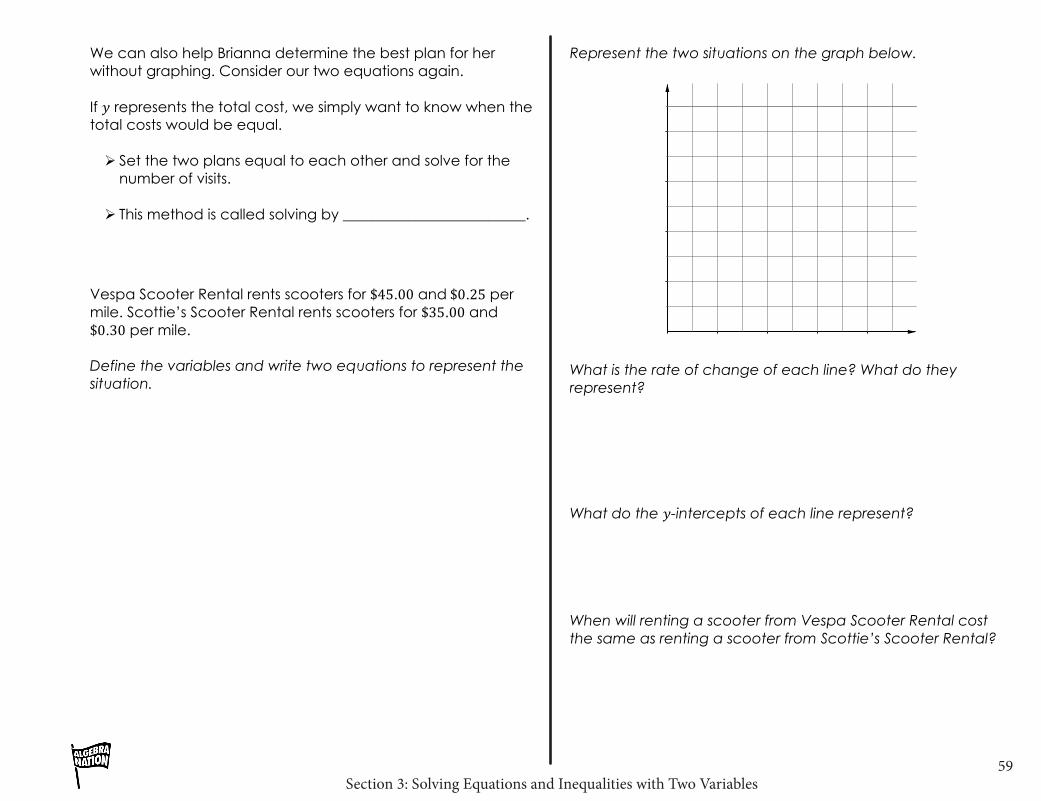
Vespa Scooter Rental rents scooters for $45.00 and $0.25 per mile. Scottie’s Scooter Rental rents scooters for $35.00 and $0.30 per mile. Define the variables and write two equations to represent the situation.
Represent the two situations on the graph below.
What is the rate of change of each line? What do they represent? What do the 𝑦𝑦-intercepts of each line represent? When will renting a scooter from Vespa Scooter Rental cost the same as renting a scooter from Scottie’s Scooter Rental?
Section 3: Solving Equations and Inequalities with Two Variables60
!
Describe a situation when renting from Vespa Scooter Rental would be a better deal than renting from Scottie’s Scooter Rental. Use the substitution method to help the renter determine when the two scooter rentals will cost the same amount.
You should always check your solution by plugging it back into both equations to make sure that it gives you a true statement.
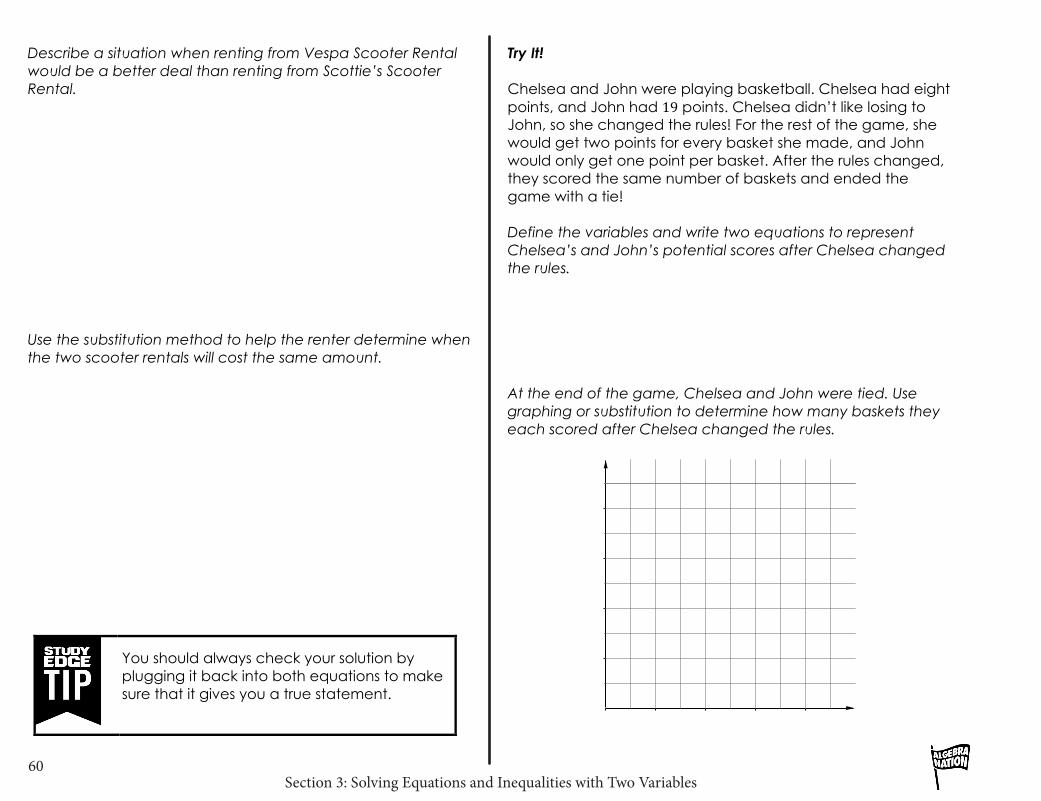
Try It! Chelsea and John were playing basketball. Chelsea had eight points, and John had 19 points. Chelsea didn’t like losing to John, so she changed the rules! For the rest of the game, she would get two points for every basket she made, and John would only get one point per basket. After the rules changed, they scored the same number of baskets and ended the game with a tie! Define the variables and write two equations to represent Chelsea’s and John’s potential scores after Chelsea changed the rules. At the end of the game, Chelsea and John were tied. Use graphing or substitution to determine how many baskets they each scored after Chelsea changed the rules.
Section 3: Solving Equations and Inequalities with Two Variables61
!
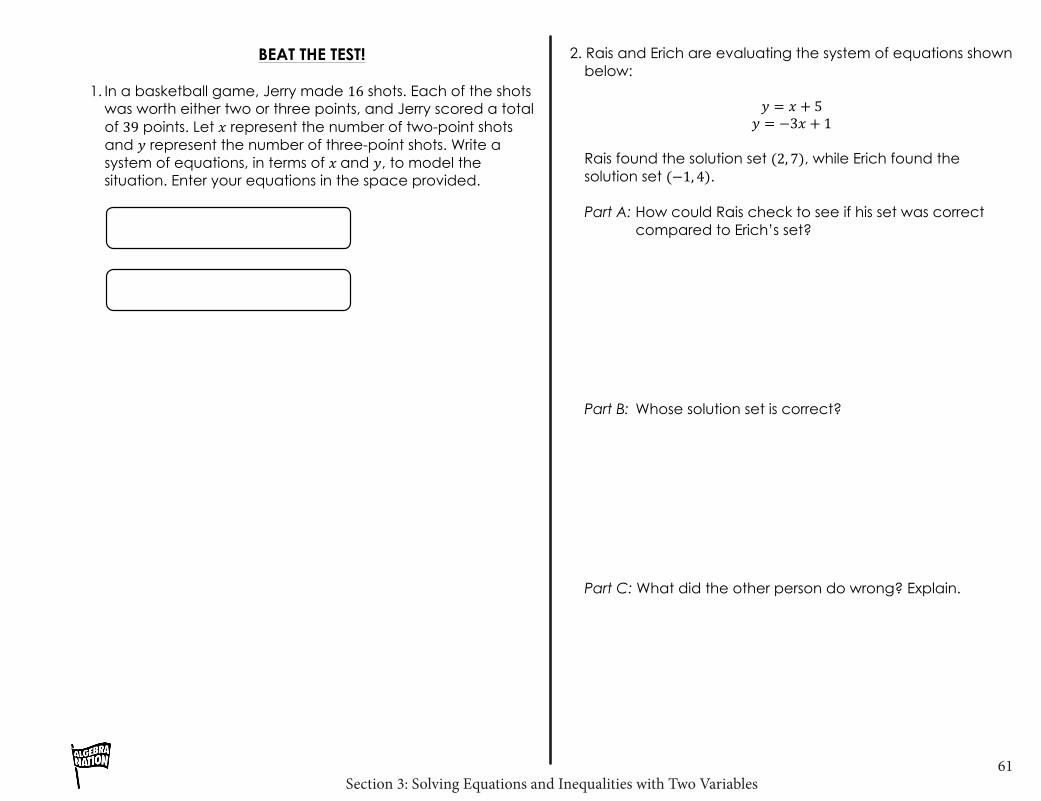
BEAT THE TEST! 1. In a basketball game, Jerry made 16 shots. Each of the shots
was worth either two or three points, and Jerry scored a total of 39 points. Let 𝑥𝑥 represent the number of two-point shots and 𝑦𝑦 represent the number of three-point shots. Write a system of equations, in terms of 𝑥𝑥 and 𝑦𝑦, to model the situation. Enter your equations in the space provided.
2. Rais and Erich are evaluating the system of equations shown below:
𝑦𝑦 = 𝑥𝑥 + 5 𝑦𝑦 = −3𝑥𝑥 + 1
Rais found the solution set (2,7), while Erich found the solution set (−1, 4). Part A: How could Rais check to see if his set was correct
compared to Erich’s set? Part B: Whose solution set is correct? Part C: What did the other person do wrong? Explain.
Section 3: Solving Equations and Inequalities with Two Variables62
!
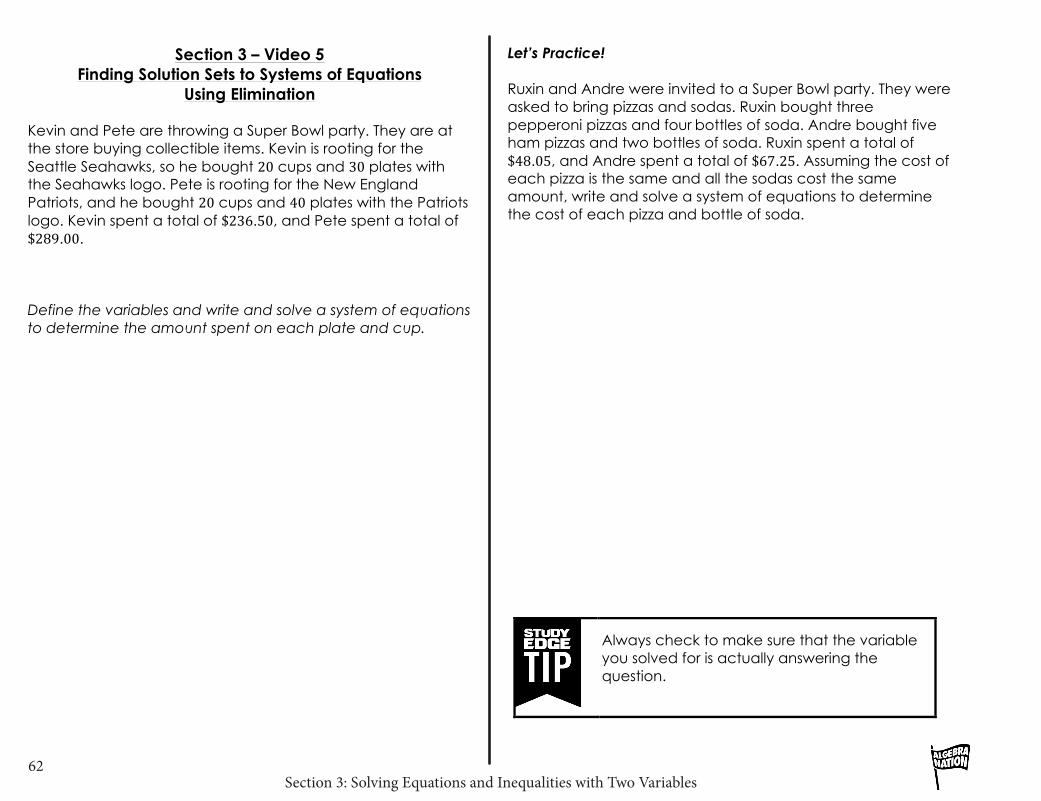
Let’s Practice! Ruxin and Andre were invited to a Super Bowl party. They were asked to bring pizzas and sodas. Ruxin bought three pepperoni pizzas and four bottles of soda. Andre bought five ham pizzas and two bottles of soda. Ruxin spent a total of $48.05, and Andre spent a total of $67.25. Assuming the cost of each pizza is the same and all the sodas cost the same amount, write and solve a system of equations to determine the cost of each pizza and bottle of soda.
Always check to make sure that the variable you solved for is actually answering the question.
Section 3 – Video 5 Finding Solution Sets to Systems of Equations
Using Elimination Kevin and Pete are throwing a Super Bowl party. They are at the store buying collectible items. Kevin is rooting for the Seattle Seahawks, so he bought 20 cups and 30 plates with the Seahawks logo. Pete is rooting for the New England Patriots, and he bought 20 cups and 40 plates with the Patriots logo. Kevin spent a total of $236.50, and Pete spent a total of $289.00. Define the variables and write and solve a system of equations to determine the amount spent on each plate and cup.
Section 3: Solving Equations and Inequalities with Two Variables63
!
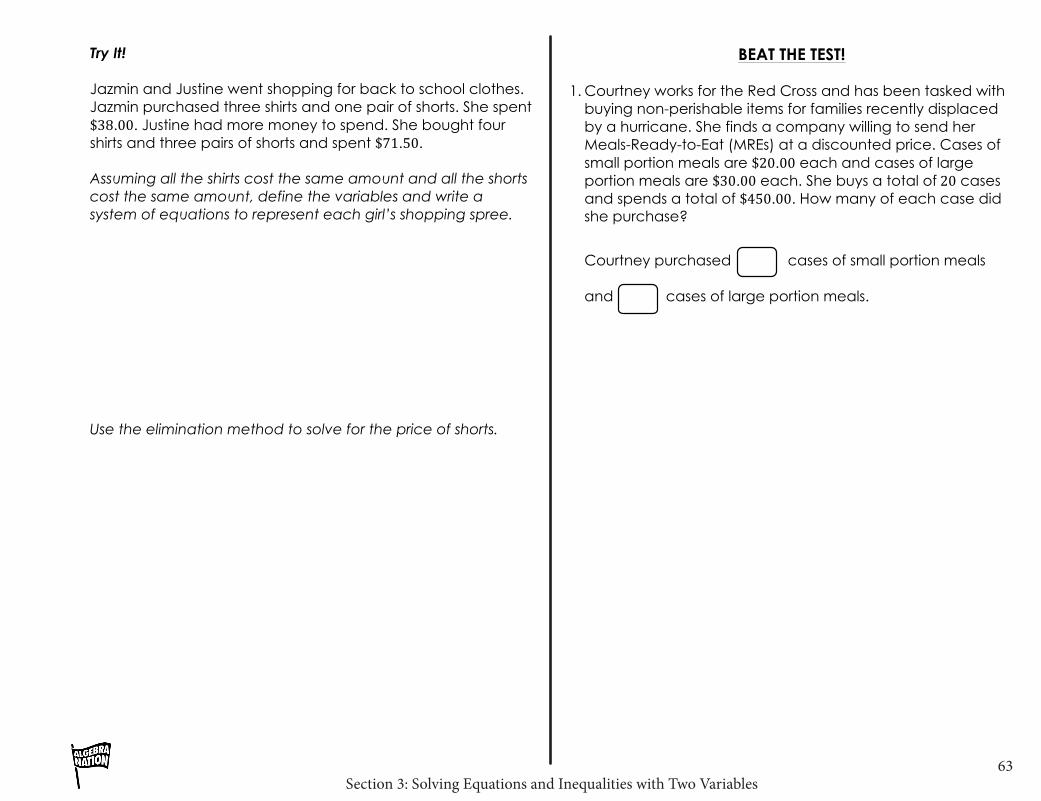
Try It! Jazmin and Justine went shopping for back to school clothes. Jazmin purchased three shirts and one pair of shorts. She spent $38.00. Justine had more money to spend. She bought four shirts and three pairs of shorts and spent $71.50. Assuming all the shirts cost the same amount and all the shorts cost the same amount, define the variables and write a system of equations to represent each girl’s shopping spree. Use the elimination method to solve for the price of shorts.
BEAT THE TEST! 1. Courtney works for the Red Cross and has been tasked with
buying non-perishable items for families recently displaced by a hurricane. She finds a company willing to send her Meals-Ready-to-Eat (MREs) at a discounted price. Cases of small portion meals are $20.00 each and cases of large portion meals are $30.00 each. She buys a total of 20 cases and spends a total of $450.00. How many of each case did she purchase?
Courtney purchased cases of small portion meals and cases of large portion meals.
Section 3: Solving Equations and Inequalities with Two Variables64
!
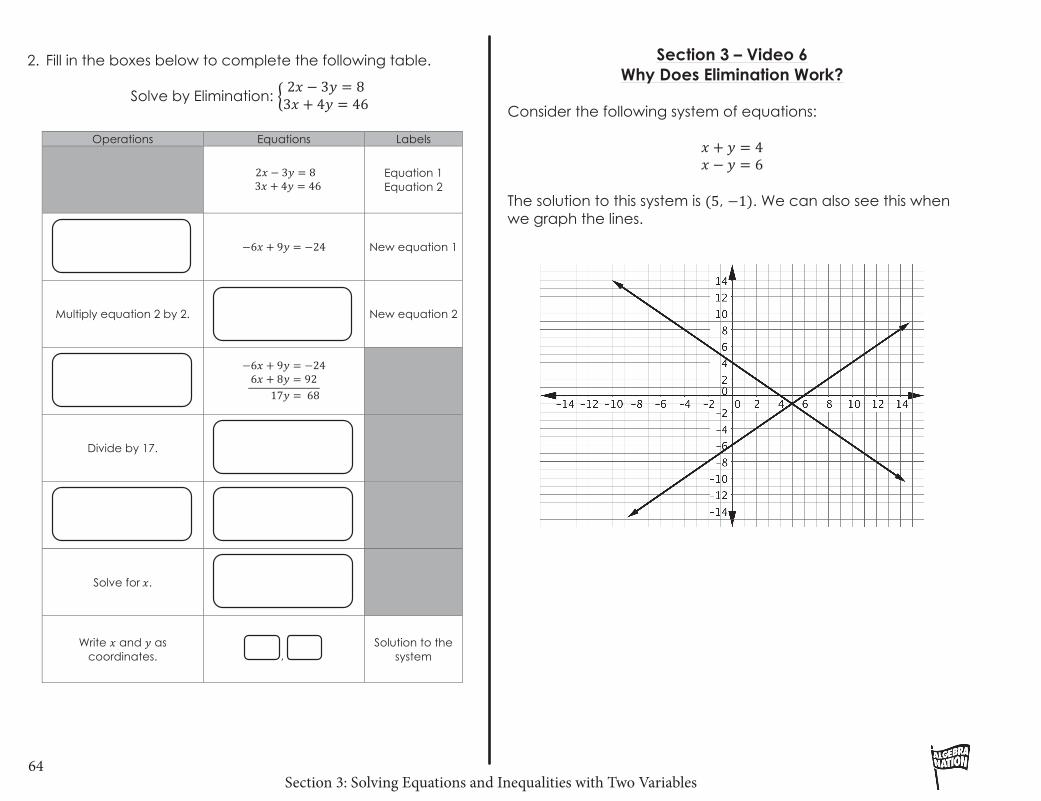
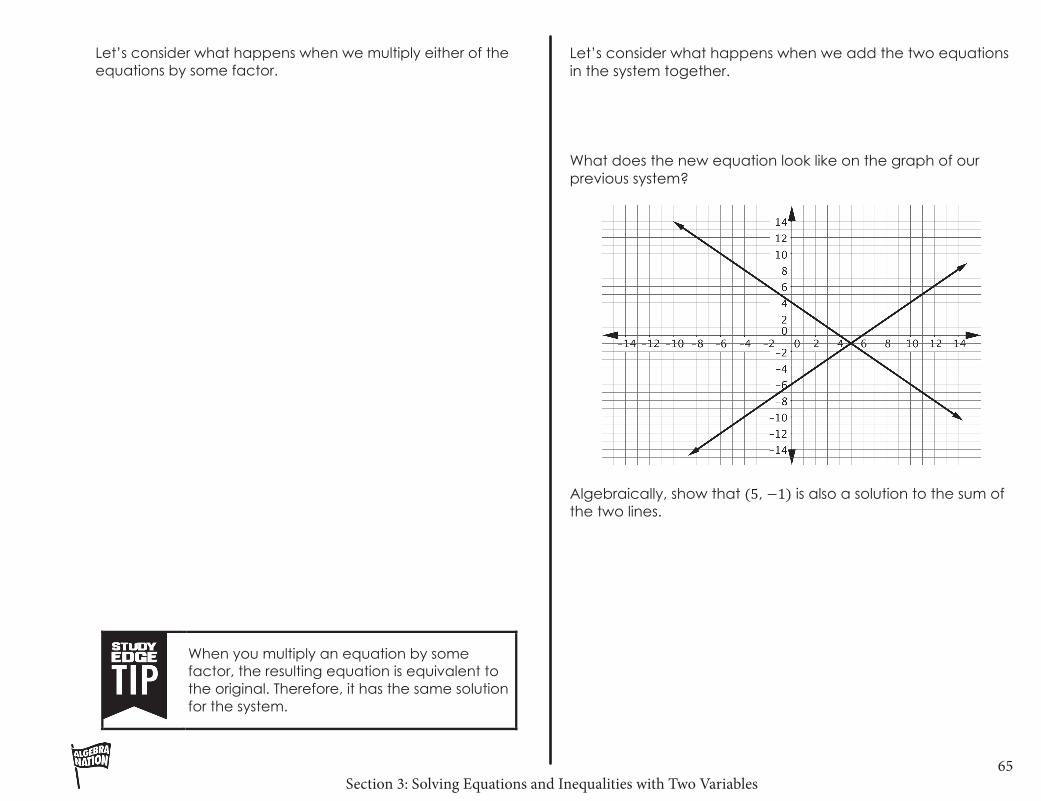
Section 3 – Video 6 Why Does Elimination Work?
Consider the following system of equations:
𝑥𝑥 + 𝑦𝑦 = 4 𝑥𝑥 − 𝑦𝑦 = 6
The solution to this system is (5, −1). We can also see this when we graph the lines.
2. Fill in the boxes below to complete the following table.
Solve by Elimination: 2𝑥𝑥 − 3𝑦𝑦 = 83𝑥𝑥 + 4𝑦𝑦 = 46
Operations Equations Labels
2𝑥𝑥 − 3𝑦𝑦 = 8 3𝑥𝑥 + 4𝑦𝑦 = 46
Equation 1 Equation 2
−6𝑥𝑥 + 9𝑦𝑦 = −24 New equation 1
Multiply equation 2 by 2.
New equation 2
−6𝑥𝑥 + 9𝑦𝑦 = −24 6𝑥𝑥 + 8𝑦𝑦 = 92 17𝑦𝑦 = 68
Divide by 17.
Solve for 𝑥𝑥.
Write 𝑥𝑥 and 𝑦𝑦 as coordinates. ,
Solution to the system
Section 3: Solving Equations and Inequalities with Two Variables65
!
Let’s consider what happens when we multiply either of the equations by some factor.
When you multiply an equation by some factor, the resulting equation is equivalent to the original. Therefore, it has the same solution for the system.
Let’s consider what happens when we add the two equations in the system together. What does the new equation look like on the graph of our previous system?
Algebraically, show that (5, −1) is also a solution to the sum of the two lines.
Section 3: Solving Equations and Inequalities with Two Variables66
!
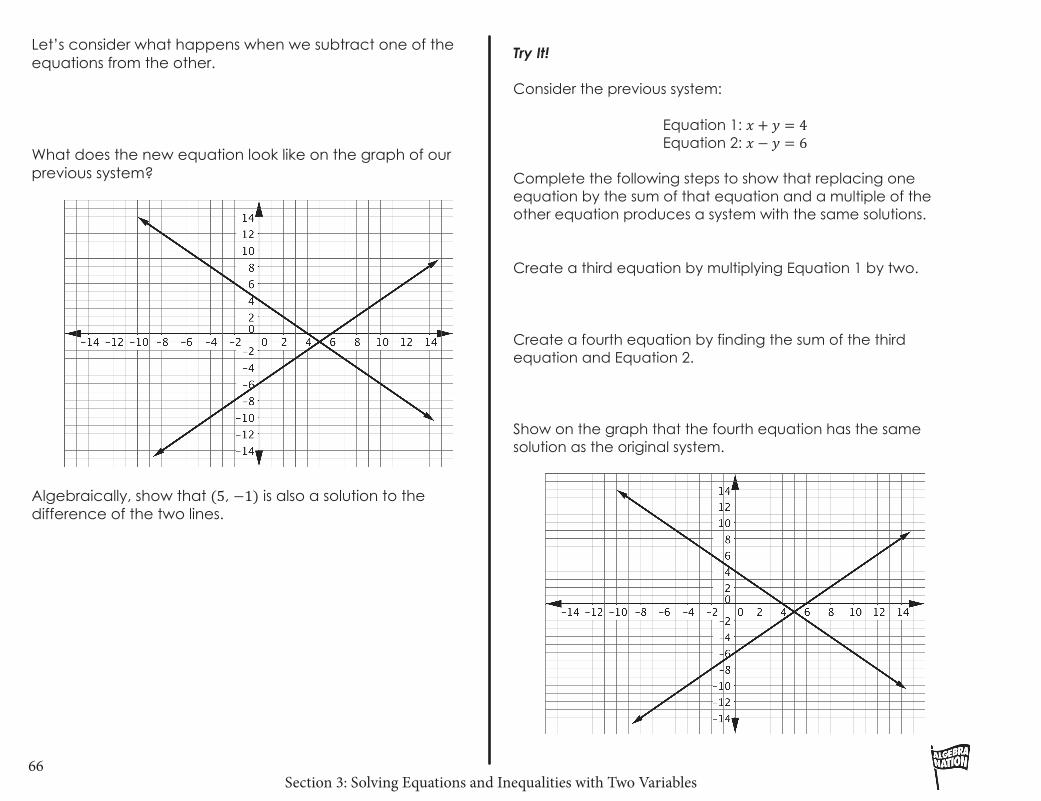
Try It! Consider the previous system:
Equation 1: 𝑥𝑥 + 𝑦𝑦 = 4 Equation 2: 𝑥𝑥 − 𝑦𝑦 = 6
Complete the following steps to show that replacing one equation by the sum of that equation and a multiple of the other equation produces a system with the same solutions. Create a third equation by multiplying Equation 1 by two. Create a fourth equation by finding the sum of the third equation and Equation 2. Show on the graph that the fourth equation has the same solution as the original system.
Let’s consider what happens when we subtract one of the equations from the other. What does the new equation look like on the graph of our previous system?
Algebraically, show that (5, −1) is also a solution to the difference of the two lines.
Section 3: Solving Equations and Inequalities with Two Variables67
!
Let’s consider the following system, which has a solution of (2, 5) and 𝑀𝑀, 𝑁𝑁, 𝑃𝑃, 𝑅𝑅, 𝑆𝑆, and 𝑇𝑇 are non-zero real numbers:
𝑀𝑀𝑀𝑀 + 𝑁𝑁𝑁𝑁 = 𝑃𝑃 𝑅𝑅𝑅𝑅 + 𝑆𝑆𝑆𝑆 = 𝑇𝑇
Create four equations that have the same solution as the system.
BEAT THE TEST! 1. Consider the following system:
Line P: 𝑥𝑥 + 3𝑦𝑦 = 12 Line Q: 2𝑥𝑥 + 𝑦𝑦 = −6
Which of the following equations could be substituted for line 𝑃𝑃 or line 𝑄𝑄 such that the new system would have the same solution? Select all that apply. " 2𝑥𝑥 + 6𝑦𝑦 = 12 " 3𝑥𝑥 + 4𝑦𝑦 = 6 " 3𝑥𝑥 + 9𝑦𝑦 = 36 " −𝑥𝑥 + 2𝑦𝑦 = 18 " 4𝑥𝑥 + 2𝑦𝑦 = −6
Section 3: Solving Equations and Inequalities with Two Variables68
!
Section 3 – Video 7 Solution Sets to Inequalities with Two Variables
The senior class is raising money for Grad Bash. The students’ parents are donating cakes. The students plan to sell entire cakes for $20.00 each and slices of cake for $3.00 each. If they want to raise at least $500.00, how many of each could they sell? List some possibilities for the number of whole cakes and cake slices students could sell to reach their goal of raising at least $500.00. Define the variable and write an inequality to represent the situation. Graph the region where the solutions to the inequality would lie.
2. The system 𝐴𝐴𝐴𝐴 + 𝐵𝐵𝐵𝐵 = 𝐶𝐶𝐷𝐷𝐷𝐷 + 𝐸𝐸𝐸𝐸 = 𝐹𝐹 has the solution (1, −3), where
𝐴𝐴, 𝐵𝐵, 𝐶𝐶, 𝐷𝐷, 𝐸𝐸, and 𝐹𝐹 are non-zero real numbers. Select all the systems of equations with the same solution. " 𝐴𝐴 − 𝐷𝐷 𝑥𝑥 + 𝐵𝐵 − 𝐸𝐸 𝑦𝑦 = 𝐶𝐶 − 𝐹𝐹 𝐷𝐷𝐷𝐷 + 𝐸𝐸𝐸𝐸 = 𝐹𝐹
" (2𝐴𝐴 + 𝐷𝐷)𝑥𝑥 + (2𝐵𝐵 + 𝐸𝐸)𝑦𝑦 = 𝐶𝐶 + 2𝐹𝐹 𝐷𝐷𝐷𝐷 + 𝐸𝐸𝐸𝐸 = 𝐹𝐹
" 𝐴𝐴𝐴𝐴 + 𝐵𝐵𝐵𝐵 = 𝐶𝐶 −3𝐷𝐷𝐷𝐷 − 3𝐸𝐸𝐸𝐸 = −3𝐹𝐹
" 𝐴𝐴 − 5𝐷𝐷 𝑥𝑥 + 𝐵𝐵 − 5𝐸𝐸 𝑦𝑦 = 𝐶𝐶 − 5𝐹𝐹 𝐷𝐷𝐷𝐷 + 𝐸𝐸𝐸𝐸 = 𝐹𝐹
" 𝐴𝐴𝐴𝐴 + (𝐵𝐵 + 𝐸𝐸)𝑦𝑦 = 𝐶𝐶 𝐴𝐴 + 𝐷𝐷 𝑥𝑥 + 𝐸𝐸𝐸𝐸 = 𝐶𝐶 + 𝐹𝐹
Section 3: Solving Equations and Inequalities with Two Variables69
!
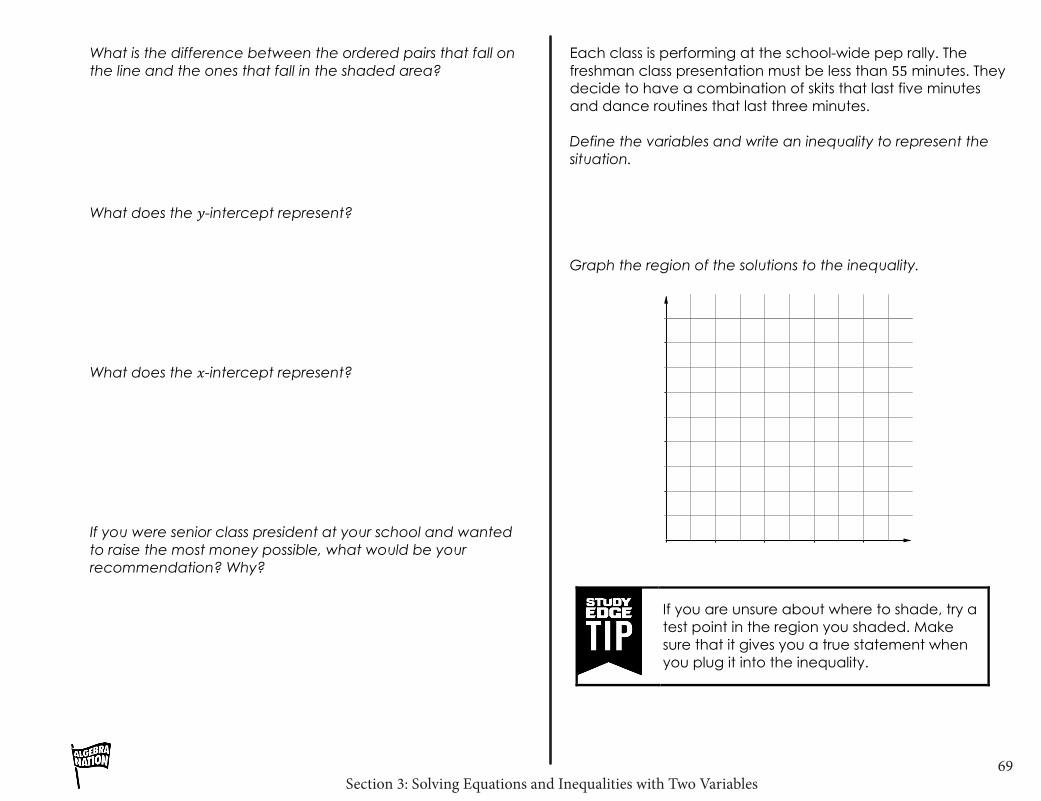
What is the difference between the ordered pairs that fall on the line and the ones that fall in the shaded area? What does the 𝑦𝑦-intercept represent? What does the 𝑥𝑥-intercept represent? If you were senior class president at your school and wanted to raise the most money possible, what would be your recommendation? Why?
Each class is performing at the school-wide pep rally. The freshman class presentation must be less than 55 minutes. They decide to have a combination of skits that last five minutes and dance routines that last three minutes. Define the variables and write an inequality to represent the situation. Graph the region of the solutions to the inequality.
If you are unsure about where to shade, try a test point in the region you shaded. Make sure that it gives you a true statement when you plug it into the inequality.
Section 3: Solving Equations and Inequalities with Two Variables70
!
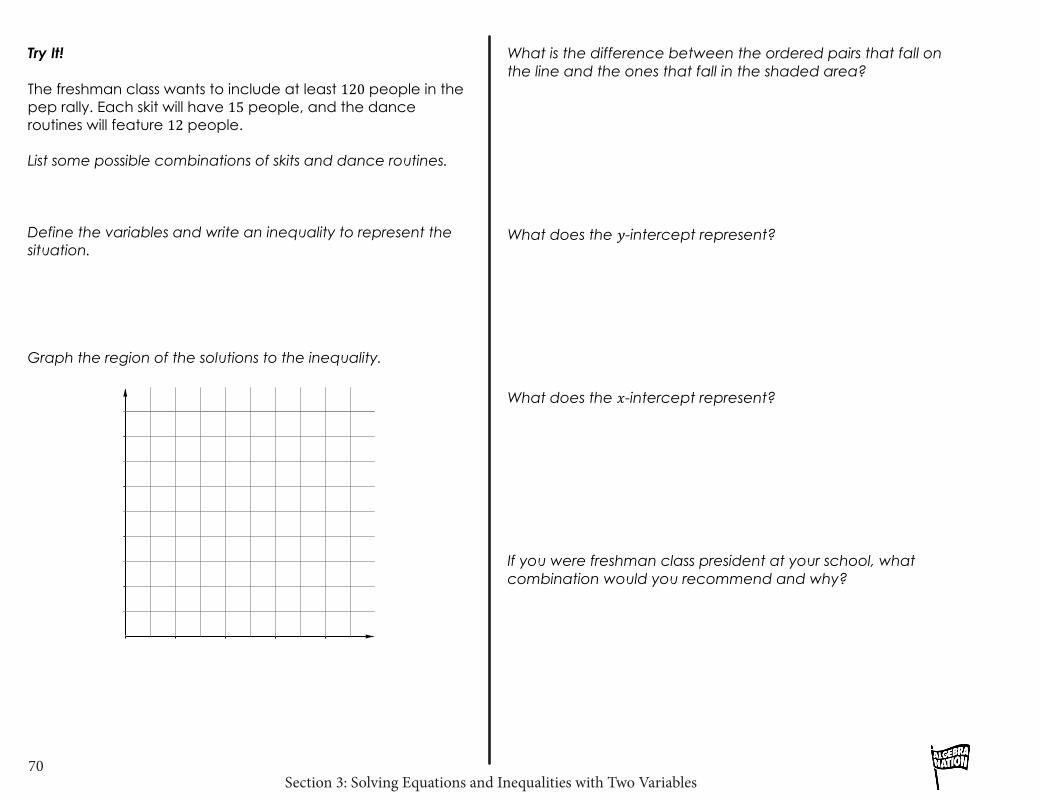
What is the difference between the ordered pairs that fall on the line and the ones that fall in the shaded area? What does the 𝑦𝑦-intercept represent? What does the 𝑥𝑥-intercept represent? If you were freshman class president at your school, what combination would you recommend and why?
Try It! The freshman class wants to include at least 120 people in the pep rally. Each skit will have 15 people, and the dance routines will feature 12 people. List some possible combinations of skits and dance routines. Define the variables and write an inequality to represent the situation. Graph the region of the solutions to the inequality.
Section 3: Solving Equations and Inequalities with Two Variables71
!
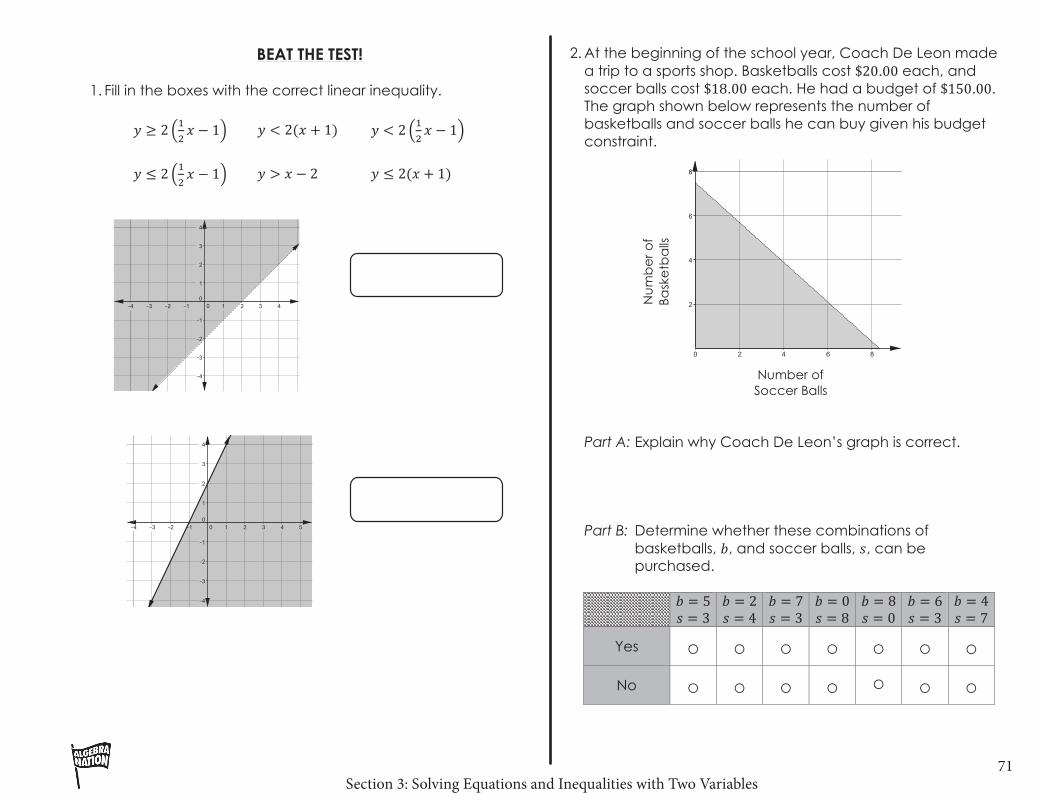
BEAT THE TEST! 1. Fill in the boxes with the correct linear inequality.
𝑦𝑦 ≥ 2 !!𝑥𝑥 − 1 𝑦𝑦 < 2(𝑥𝑥 + 1)
𝑦𝑦 < 2 !
!𝑥𝑥 − 1
𝑦𝑦 ≤ 2 !!𝑥𝑥 − 1 𝑦𝑦 > 𝑥𝑥 − 2 𝑦𝑦 ≤ 2(𝑥𝑥 + 1)
2. At the beginning of the school year, Coach De Leon made a trip to a sports shop. Basketballs cost $20.00 each, and soccer balls cost $18.00 each. He had a budget of $150.00. The graph shown below represents the number of basketballs and soccer balls he can buy given his budget constraint.
Part A: Explain why Coach De Leon’s graph is correct. Part B: Determine whether these combinations of
basketballs, 𝑏𝑏, and soccer balls, 𝑠𝑠, can be purchased.
𝑏𝑏 = 5 𝑠𝑠 = 3
𝑏𝑏 = 2 𝑠𝑠 = 4
𝑏𝑏 = 7 𝑠𝑠 = 3
𝑏𝑏 = 0 𝑠𝑠 = 8
𝑏𝑏 = 8 𝑠𝑠 = 0
𝑏𝑏 = 6 𝑠𝑠 = 3
𝑏𝑏 = 4 𝑠𝑠 = 7
Yes ○ ○ ○ ○ ○ ○ ○
No ○ ○ ○ ○ ○ ○ ○
Number of Soccer Balls
Nu
mb
er o
f Ba
ske
tba
lls
Section 3: Solving Equations and Inequalities with Two Variables72
!
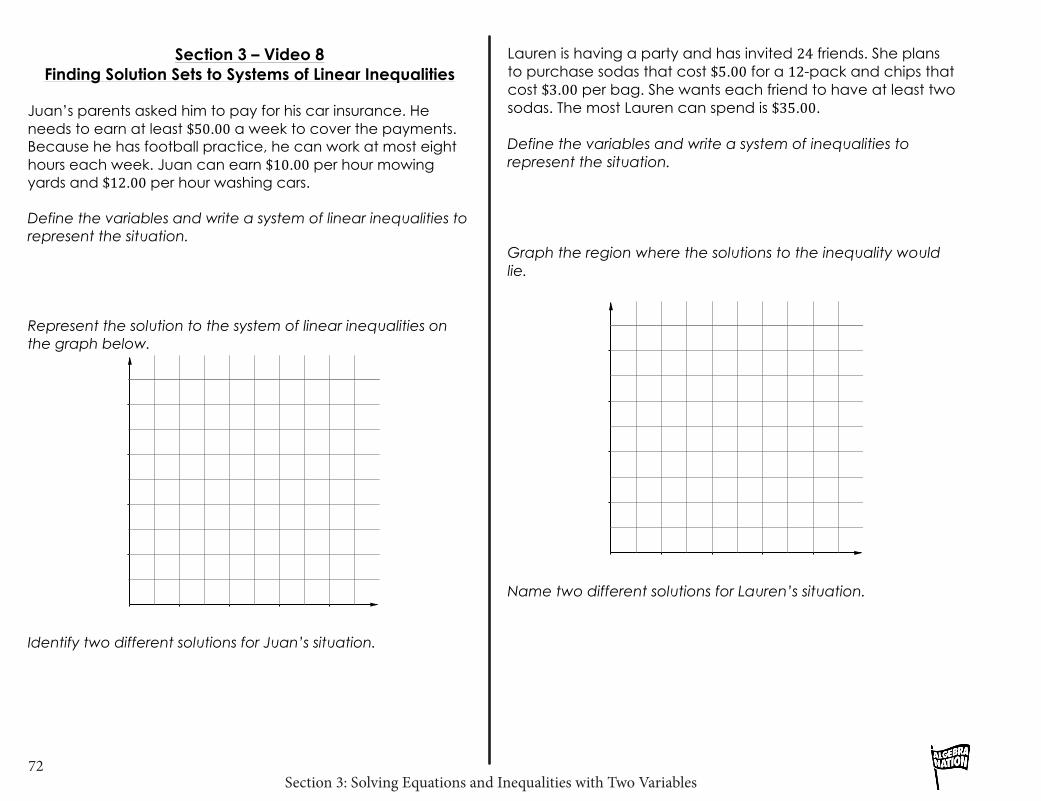
Lauren is having a party and has invited 24 friends. She plans to purchase sodas that cost $5.00 for a 12-pack and chips that cost $3.00 per bag. She wants each friend to have at least two sodas. The most Lauren can spend is $35.00. Define the variables and write a system of inequalities to represent the situation. Graph the region where the solutions to the inequality would lie.
Name two different solutions for Lauren’s situation.
Section 3 – Video 8 Finding Solution Sets to Systems of Linear Inequalities
Juan’s parents asked him to pay for his car insurance. He needs to earn at least $50.00 a week to cover the payments. Because he has football practice, he can work at most eight hours each week. Juan can earn $10.00 per hour mowing yards and $12.00 per hour washing cars. Define the variables and write a system of linear inequalities to represent the situation. Represent the solution to the system of linear inequalities on the graph below.
Identify two different solutions for Juan’s situation.
Section 3: Solving Equations and Inequalities with Two Variables73
!
Try It! Anna is an avid reader. Her generous grandparents gave her money for her birthday, and she decided to spend at most $150.00 on books. Barnes and Noble is running a special: all paperback books are $8.00 and hardback books are $12.00. She wants to purchase at least 12 books. Define the variables and write a system of linear inequalities to represent the situation. Graph the region where the solutions to the inequality would lie.
Name two different solutions for Anna’s situation.
BEAT THE TEST! 1. Every week, Megan works at Publix during the day and at a
private security company at night. She can work a maximum of 40 hours a week. After she calculates all her expenses, she concludes that she needs to earn at least $440.00 every week. Megan earns $12.00 an hour at Publix and $10.00 an hour as a private security guard. On the graph below, represent the possible hours Megan could work at each place.
Section 3: Solving Equations and Inequalities with Two Variables74
!
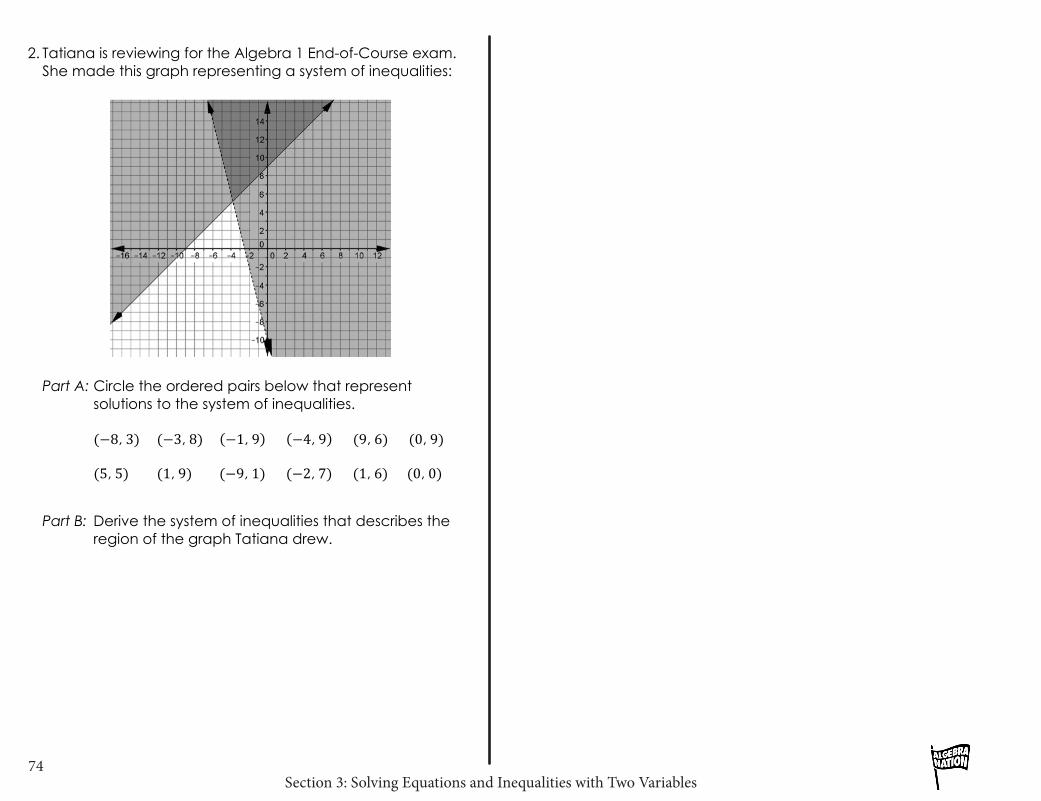
2. Tatiana is reviewing for the Algebra 1 End-of-Course exam. She made this graph representing a system of inequalities:
Part A: Circle the ordered pairs below that represent
solutions to the system of inequalities.
(−8, 3) (−3, 8) −1, 9 −4, 9 (9, 6) (0, 9)
(5, 5) (1, 9) (−9, 1) (−2, 7) (1, 6) (0, 0)
Part B: Derive the system of inequalities that describes the
region of the graph Tatiana drew.