Embed Size (px)
Citation preview
NORTH PERRY AIRPORT MASTER PLAN UPDATE
SECTION 3: AVIATION FORECAST
Montgomery Consulting Group August 11, 2009 Page 3-1
SECTION 3: AVIATION FORECAST
3.1 PURPOSE The purpose of this chapter is to project the future demand for general aviation services at North Perry Airport for three future periods: years 2011, 2016, and 2026. These periods represent the short-, intermediate-, and long-term planning periods for the development of the Airport and the Master Plan Update. Forecasting the demand for aviation is an essential step in the airport master planning process. The forecasts serve as the basis for planning the facilities needed to meet the area’s aviation demand. To adequately determine the types and sizes of facilities needed, forecasts for different elements of aviation activity are needed. Forecasts contained in this chapter include the following:
Based aircraft by type (fleet mix)
Single-engine piston
Multi-engine piston
Jet
Helicopter
Military
Other
Annual operations by type
Air carrier (charter)
Air taxi
General aviation local
General aviation itinerant
Military
IFR operations
Total operations
Peak hour operations
Aviation fuel demand
Forecast summary Definitions for key terms used in this chapter are as follows:
Based aircraft are aircraft that are regularly located at the Airport, including aircraft stored in bulk hangars, T-hangars, T-ports, or other specialized facilities and those aircraft that are typically tied down on aprons, ramps or are parked on the grass. Based aircraft are generally separated into several standard categories defined by the Federal Aviation Administration (FAA), including single-engine, multi-engine, turboprop and turbine (jet), helicopter, and other (experimental aircraft, powered parachutes, some ultra-light aircraft, gliders, blimps, other similar lighter-than-air aircraft).
Operations are generally subdivided into two major categories: local operations and itinerant operations.
Local operations are typically training operations taking place on or near the airfield (touch-and-go) or operations within an approximate 20-mile radius of the airfield.
Itinerant operations are generally landings or take-offs with defined departures and destinations, but can involve training.
NORTH PERRY AIRPORT MASTER PLAN UPDATE
SECTION 3: AVIATION FORECAST
Montgomery Consulting Group August 11, 2009 Page 3-2
Instrument Operations include all operations incurred as the result of the filing of an Instrument Flight Rules (IFR) flight plan, and also include practice approaches to airports supplied with appropriate electronic navigational aids (NAVAIDS). Instrument operations require contact with air traffic approach control at major airports or en route air traffic control at strategic locations along a pilot’s route of flight.
Peak Hour Activity forecasts provide a reasonable estimate of maximum demand on airport facilities during the busiest hour of an average day during the peak month of airport activity. Peak hour activity at general aviation airports are typically not as clearly defined as those at commercial service airports with regularly scheduled airline activity. Most Florida airports generally experience seasonal peaks due to tourist seasons and/or special aviation events.
3.2 BACKGROUND AND FORECAST METHODS This chapter presents an overview of the national and regional projections of general aviation activity developed by the FAA and the Florida Department of Transportation (FDOT). Forecasts are only estimates of future activity levels. The numbers projected are estimates of future activity based on indicators such as population growth, income growth, and other methodologies that historically track closely with aviation activity. The forecasts developed in this chapter will provide the Broward County Aviation Department (BCAD) with a basis for determining the necessary facility improvements to address future aviation needs in an efficient manner. A variety of forecasting methods and techniques have been shown over time to produce reliable estimates of future aviation activity. Estimating methods used for general aviation activity typically include the following:
Ratio Analysis (operations versus based aircraft, or fuel consumed versus aircraft operations)
Market Share
Regression Analysis (based aircraft versus socio-economic variables such as population, employment, income, etc.)
Statistical Sampling The FAA Terminal Area Forecasts (TAF) publication date of March 2006 was used to compile data through 2005. BCAD determined in the scoping process for the Master Plan Update, that the FAA’s TAF would be used as the base forecast for aviation activity for North Perry Airport, and no separate forecast methodologies need be developed. The projections contained in this chapter are considered unconstrained forecasts of aviation demand, as the FAA TAF presents unconstrained forecasts. Unconstrained forecasts assume that the airport’s capacity and airspace will be adequate to accommodate future operations. Unconstrained forecasts help determine the potential demand that exists for an airport.

NORTH PERRY AIRPORT MASTER PLAN UPDATE
SECTION 3: AVIATION FORECAST
Montgomery Consulting Group August 11, 2009 Page 3-3
3.3 TRENDS IN GENERAL AVIATION The projections discussed in this chapter consider the future demand of general aviation in the South Florida region. Aviation and aviation services play a critical role in Florida’s economic and community development. Twenty percent of the world’s flight training occurs in Florida1. According to the Florida Department of Transportation’s Continuing Florida Aviation Systems Planning Process (CFASPP), Southeast Florida is considered among the three largest and rapidly growing regions in Florida, as shown in Figure 3.1. It is important to review the atmosphere in which the forecasts were developed and highlight the assumptions on which these forecasts were based. The assumptions include:
The national economy will continue to have a sustained low to moderate growth level;
South Florida’s economy is closely tied to the tourism industry. An economic decline would only be expected if downsizing in this industry is realized on a national level;
Aircraft services will remain competitive with a choice of services at the airport and similar services available at nearby airports; and
Aviation fuel costs will increase moderately and fuel for aviation use will continue to be available.
FIGURE 3.1 FLORIDA POPULATION, ACTUAL AND PROJECTED (BY REGION), 1970-2030
Source: FDOT CFASPP, 2005
1 FDOT, Continuing Florida Aviation Systems Planning Process, Southeast Florida, 2005
NORTH PERRY AIRPORT MASTER PLAN UPDATE
SECTION 3: AVIATION FORECAST
Montgomery Consulting Group August 11, 2009 Page 3-4
3.4 BASED AIRCRAFT
3.4.1 BCAD RECORDS
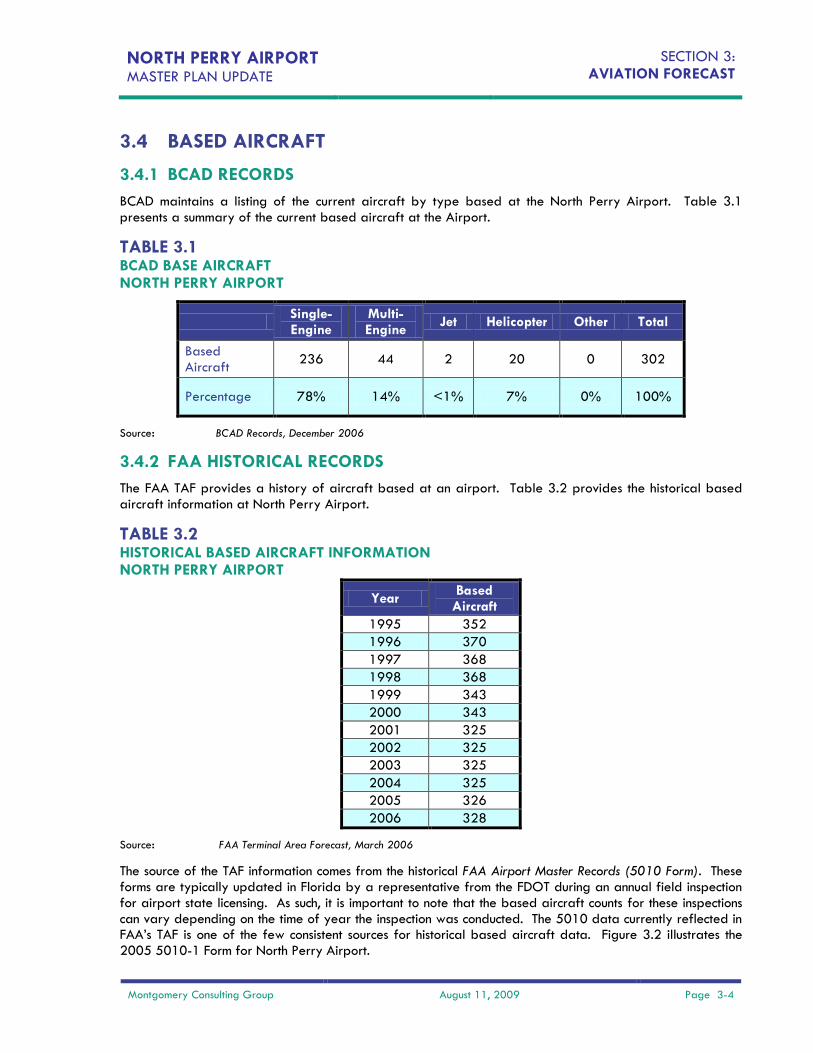
BCAD maintains a listing of the current aircraft by type based at the North Perry Airport. Table 3.1 presents a summary of the current based aircraft at the Airport.
TABLE 3.1 BCAD BASE AIRCRAFT NORTH PERRY AIRPORT
Single-Engine
Multi-Engine
Jet Helicopter Other Total
Based Aircraft
236 44 2 20 0 302
Percentage 78% 14% <1% 7% 0% 100%
Source: BCAD Records, December 2006
3.4.2 FAA HISTORICAL RECORDS
The FAA TAF provides a history of aircraft based at an airport. Table 3.2 provides the historical based aircraft information at North Perry Airport.
TABLE 3.2 HISTORICAL BASED AIRCRAFT INFORMATION NORTH PERRY AIRPORT
Year Based
Aircraft
1995 352
1996 370
1997 368
1998 368
1999 343
2000 343
2001 325
2002 325
2003 325
2004 325
2005 326
2006 328
Source: FAA Terminal Area Forecast, March 2006
The source of the TAF information comes from the historical FAA Airport Master Records (5010 Form). These forms are typically updated in Florida by a representative from the FDOT during an annual field inspection for airport state licensing. As such, it is important to note that the based aircraft counts for these inspections can vary depending on the time of year the inspection was conducted. The 5010 data currently reflected in FAA’s TAF is one of the few consistent sources for historical based aircraft data. Figure 3.2 illustrates the 2005 5010-1 Form for North Perry Airport.

NORTH PERRY AIRPORT MASTER PLAN UPDATE
SECTION 3: AVIATION FORECAST
Montgomery Consulting Group August 11, 2009 Page 3-5
FIGURE 3.2 AIRPORT MASTER RECORD – NORTH PERRY AIRPORT
Source: FAA 5010-1 Form dated 09/28/2006

NORTH PERRY AIRPORT MASTER PLAN UPDATE
SECTION 3: AVIATION FORECAST
Montgomery Consulting Group August 11, 2009 Page 3-6
Table 3.3 illustrates the existing mix of based aircraft at the North Perry Airport as indicated on the 2006 5010-1 Form.
TABLE 3.3 EXISTING BASED AIRCRAFT MIX NORTH PERRY AIRPORT
Single-Engine
Multi-Engine
Jet Helicopter Other Total
Based Aircraft
266 44 1 14 0 325
Percentage 82% 14% <1% 4% 0% 100%
Source: North Perry Airport, 5010-1 Form, 09/28/2006
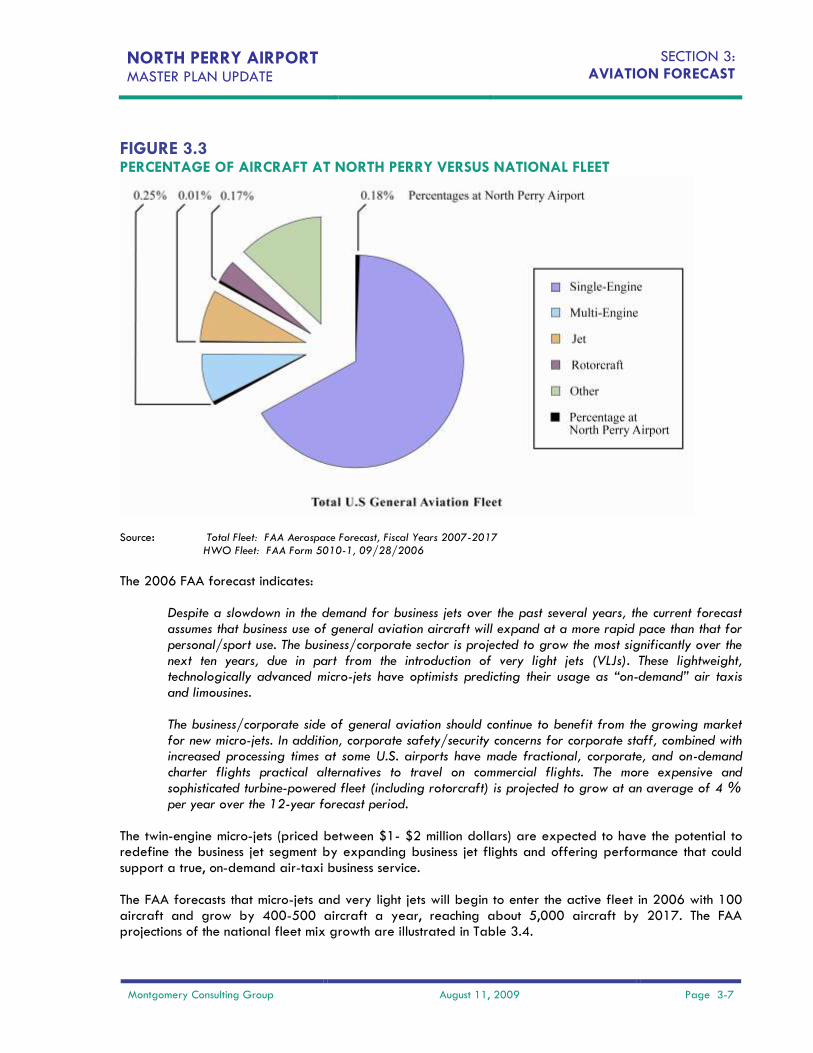
3.4.3 NATIONAL FORECAST – BASED AIRCRAFT Each year the FAA develops and publishes its national aviation forecast. This forecast addresses each segment of aviation including commercial, air taxi, general aviation (including corporate traffic), and air cargo. The current edition of this forecast is the FAA Aerospace Forecasts, Fiscal Years 2006 – 2017, published in 2006. The FAA Aviation Forecast considers the general economic growth of general aviation, the cost factors of ownership, the deregulation of the U.S. commercial airline industry, the factors affecting personal use, the fleet composition and aircraft shipments, the hours flown by general aviation aircraft and the pilot population. According to the FAA General Aviation Forecast2 for the year 2006, the number of active general aviation aircraft in the U.S. is expected to total approximately 216,835. Similarly, the 2006 U.S. active single engine aircraft is expected to number: 145,110; multi-engine: 17,505; rotorcraft: 8,070; turbojets: 17,255; and other aircraft (i.e., experimental and sport aircraft): 28,895. From the current based aircraft counts provided by the Airport’s Master Record3, the aircraft at North Perry Airport represents 0.15 percent of the total general aviation population, 0.18 percent of single engine aircraft, 0.25 percent of multi-engine aircraft, 0.17 percent of rotorcraft, and less than .01 percent of the turbojet population as illustrated in Figure 3.3.
2 FAA Aerospace Forecast 2007-2017, Table 27, Active General Aviation and Air Taxi Aircraft, Forecast 2006 3 North Perry Airport Master Record, Form 5010-1, dated 09/28/2006
NORTH PERRY AIRPORT MASTER PLAN UPDATE
SECTION 3: AVIATION FORECAST
Montgomery Consulting Group August 11, 2009 Page 3-7
FIGURE 3.3 PERCENTAGE OF AIRCRAFT AT NORTH PERRY VERSUS NATIONAL FLEET
Source: Total Fleet: FAA Aerospace Forecast, Fiscal Years 2007-2017
HWO Fleet: FAA Form 5010-1, 09/28/2006
The 2006 FAA forecast indicates:
Despite a slowdown in the demand for business jets over the past several years, the current forecast assumes that business use of general aviation aircraft will expand at a more rapid pace than that for personal/sport use. The business/corporate sector is projected to grow the most significantly over the next ten years, due in part from the introduction of very light jets (VLJs). These lightweight, technologically advanced micro-jets have optimists predicting their usage as “on-demand” air taxis and limousines. The business/corporate side of general aviation should continue to benefit from the growing market for new micro-jets. In addition, corporate safety/security concerns for corporate staff, combined with increased processing times at some U.S. airports have made fractional, corporate, and on-demand charter flights practical alternatives to travel on commercial flights. The more expensive and sophisticated turbine-powered fleet (including rotorcraft) is projected to grow at an average of 4 % per year over the 12-year forecast period.
The twin-engine micro-jets (priced between $1- $2 million dollars) are expected to have the potential to redefine the business jet segment by expanding business jet flights and offering performance that could support a true, on-demand air-taxi business service. The FAA forecasts that micro-jets and very light jets will begin to enter the active fleet in 2006 with 100 aircraft and grow by 400-500 aircraft a year, reaching about 5,000 aircraft by 2017. The FAA projections of the national fleet mix growth are illustrated in Table 3.4.

NORTH PERRY AIRPORT MASTER PLAN UPDATE
SECTION 3: AVIATION FORECAST
Montgomery Consulting Group August 11, 2009 Page 3-8
TABLE 3.4 NATIONAL FLEET MIX GROWTH PROJECTIONS FAA NATIONAL FORECAST
Aircraft Type Average Annual Growth Rate,
2006-2017
Single-engine Piston 0.3 %
Multi-engine Piston 0.1 %
Turboprop 2.2 %
Jet 6.0 %
Rotorcraft 4.4 %
Overall General Aviation 1.4 %
Source: FAA Aerospace Forecast, Fiscal Years 2006-2017, Table 27
The large increase in jet hours is an FAA National Forecast and result from the introduction of micro-jets, as well as increase in the fractional ownership fleet and its activity levels. FAA anticipates that micro-jet utilization rates will be similar to the utilization rates achieved by fractional operators. The FAA also regularly publishes a national long-range planning document for long-term planning purposes. The most recent of the long-term forecast is entitled FAA Long Range Aerospace Forecasts, Fiscal Years 2020, 2025, and 2030 and was published in August 2006. The FAA anticipates the overall national general aviation fleet will continue to increase at an average overall annual growth rate of 1.2 percent in the period from 2017 to 2030. Piston powered, fixed wing aircraft are projected to increase at an average annual growth rate of 0.3 percent over the same extended time, while turbine powered, fixed wing aircraft fleet is expected to increases at a 3.1percent average annual growth rate. The long-range projections do not detail single engine, multi-engine, or helicopter growth rates. The higher turbine portion of the fleet is based on the expectation of a greater business and corporate use of general aviation aircraft including the new micro-jets in an expanding U.S. economy.
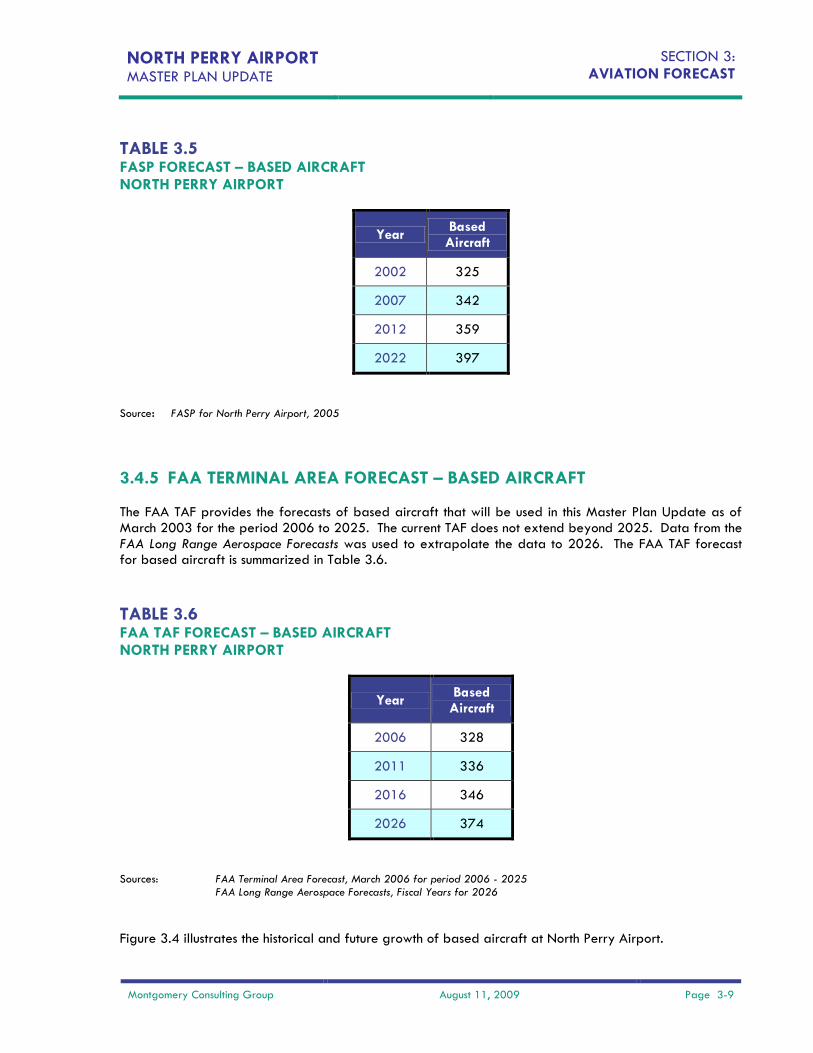
3.4.4 FLORIDA AVIATION SYSTEM PLAN – BASED AIRCRAFT The Florida Aviation System Plan (FASP), developed by the FDOT, is a broad blueprint assembled to guide the development of Florida’s 131 publicly-owned airports. FDOT developed the FASP with the purpose of developing a cost-effective 20-year FASP, justifying public funding for airports, and prioritizing the funding to the most critical projects. The latest version of the FASP4 developed a forecast for based aircraft from information compiled from individual airport master plans, FDOT inspections and reviews by airport management. This forecast is used by the FDOT to determine future airport requirements for the aviation system for Florida. This forecast is presented in Table 3.5.
4 FASP developed April 2005
NORTH PERRY AIRPORT MASTER PLAN UPDATE
SECTION 3: AVIATION FORECAST
Montgomery Consulting Group August 11, 2009 Page 3-9
TABLE 3.5 FASP FORECAST – BASED AIRCRAFT NORTH PERRY AIRPORT
Year Based
Aircraft
2002 325
2007 342
2012 359
2022 397
Source: FASP for North Perry Airport, 2005
3.4.5 FAA TERMINAL AREA FORECAST – BASED AIRCRAFT The FAA TAF provides the forecasts of based aircraft that will be used in this Master Plan Update as of March 2003 for the period 2006 to 2025. The current TAF does not extend beyond 2025. Data from the FAA Long Range Aerospace Forecasts was used to extrapolate the data to 2026. The FAA TAF forecast for based aircraft is summarized in Table 3.6.
TABLE 3.6 FAA TAF FORECAST – BASED AIRCRAFT NORTH PERRY AIRPORT
Year Based
Aircraft
2006 328
2011 336
2016 346
2026 374
Sources: FAA Terminal Area Forecast, March 2006 for period 2006 - 2025 FAA Long Range Aerospace Forecasts, Fiscal Years for 2026
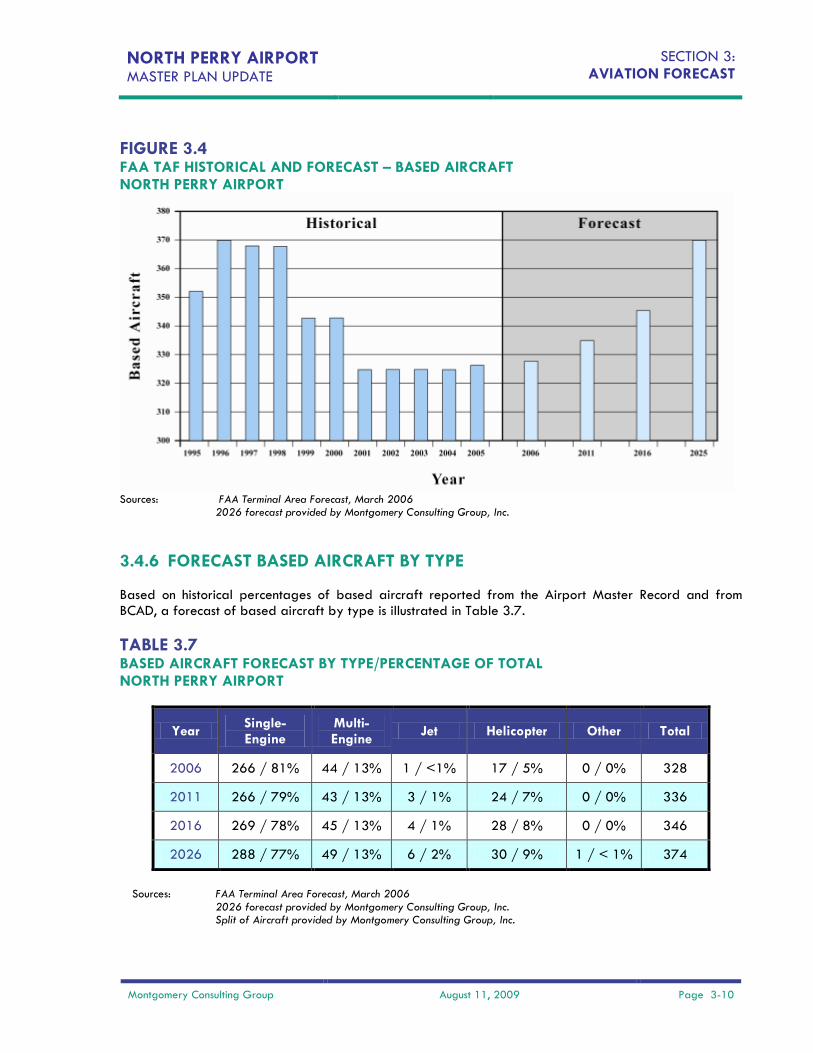
Figure 3.4 illustrates the historical and future growth of based aircraft at North Perry Airport.
NORTH PERRY AIRPORT MASTER PLAN UPDATE
SECTION 3: AVIATION FORECAST
Montgomery Consulting Group August 11, 2009 Page 3-10
FIGURE 3.4 FAA TAF HISTORICAL AND FORECAST – BASED AIRCRAFT NORTH PERRY AIRPORT
Sources: FAA Terminal Area Forecast, March 2006
2026 forecast provided by Montgomery Consulting Group, Inc.
3.4.6 FORECAST BASED AIRCRAFT BY TYPE Based on historical percentages of based aircraft reported from the Airport Master Record and from BCAD, a forecast of based aircraft by type is illustrated in Table 3.7.
TABLE 3.7 BASED AIRCRAFT FORECAST BY TYPE/PERCENTAGE OF TOTAL NORTH PERRY AIRPORT
Year Single-Engine
Multi-Engine
Jet Helicopter Other Total
2006 266 / 81% 44 / 13% 1 / <1% 17 / 5% 0 / 0% 328
2011 266 / 79% 43 / 13% 3 / 1% 24 / 7% 0 / 0% 336
2016 269 / 78% 45 / 13% 4 / 1% 28 / 8% 0 / 0% 346
2026 288 / 77% 49 / 13% 6 / 2% 30 / 9% 1 / < 1% 374
Sources: FAA Terminal Area Forecast, March 2006
2026 forecast provided by Montgomery Consulting Group, Inc. Split of Aircraft provided by Montgomery Consulting Group, Inc.
NORTH PERRY AIRPORT MASTER PLAN UPDATE
SECTION 3: AVIATION FORECAST
Montgomery Consulting Group August 11, 2009 Page 3-11
3.5 AIRCRAFT OPERATIONS
An operation is either a landing or a takeoff by an aircraft. Annual operations are the total landings and takeoffs over a given year at a particular airport.
3.5.1 BCAD RECORDS - AIR TRAFFIC CONTROL TOWER RECORDS
BCAD maintains operational information reported monthly by the air traffic control tower (ATCT). A summary of the operations data for 2004 to 2007 by type is illustrated in Table 3.8.
TABLE 3.8 ATCT TRAFFIC COUNTS 2004 – 2007 NORTH PERRY AIRPORT
Year Air
Carrier Air Taxi
Itinerant Civil
Itinerant Military
Local Civil Local
Military Total
IFR Civil or
Military
2004 0 19 55,243 62 84,488 68 139,880 2,612
2005 0 7 51,112 19 86,025 32 137,195 2,473
2006 0 4 57,233 24 105,739 222 163,222 2,239
2007 0 8 61,449 40 120,619 114 184,351 2,121
Source: North Perry Airport Air Traffic Control Tower
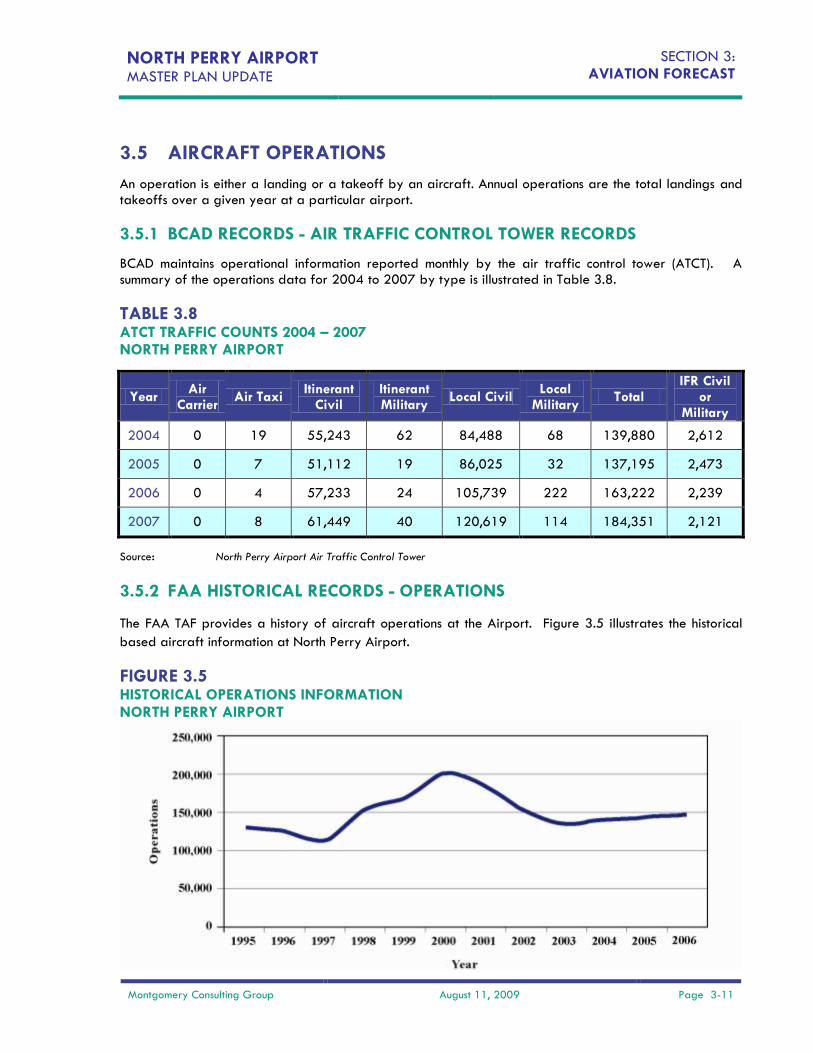
3.5.2 FAA HISTORICAL RECORDS - OPERATIONS
The FAA TAF provides a history of aircraft operations at the Airport. Figure 3.5 illustrates the historical
based aircraft information at North Perry Airport.
FIGURE 3.5 HISTORICAL OPERATIONS INFORMATION NORTH PERRY AIRPORT
NORTH PERRY AIRPORT MASTER PLAN UPDATE
SECTION 3: AVIATION FORECAST
Montgomery Consulting Group August 11, 2009 Page 3-12
Sources: FAA Terminal Area Forecast, March 2006 2026 forecast provided by Montgomery Consulting Group, Inc.
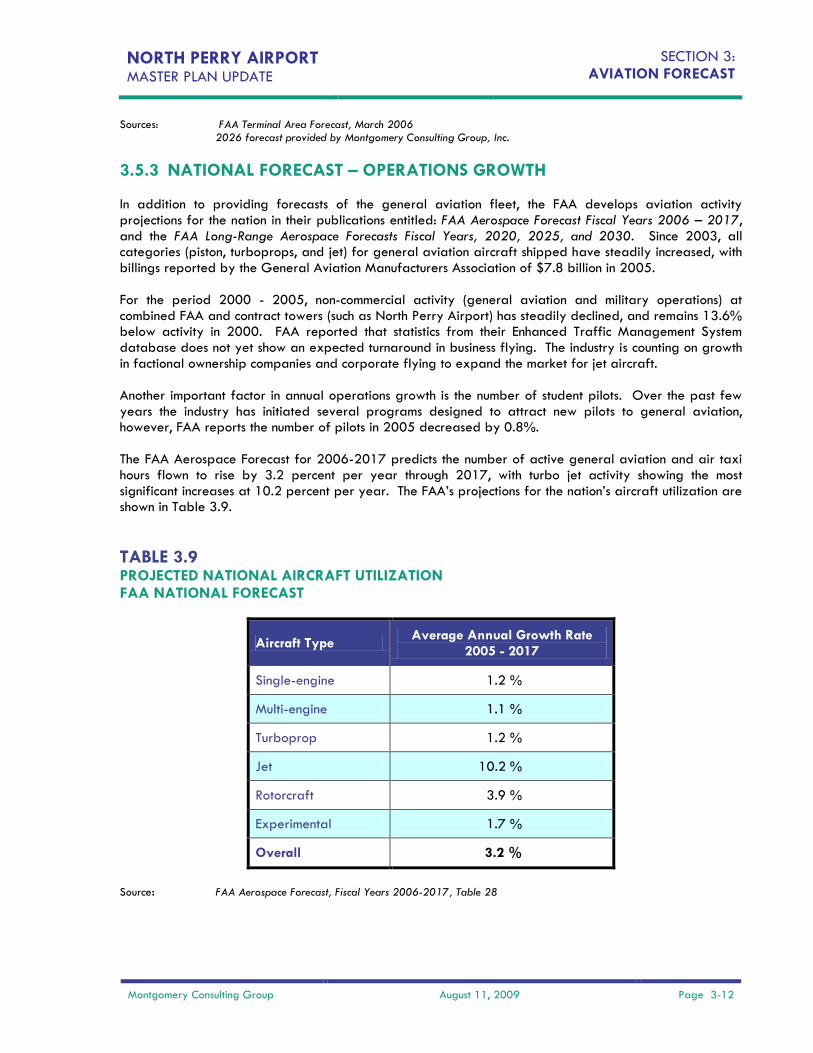
3.5.3 NATIONAL FORECAST – OPERATIONS GROWTH In addition to providing forecasts of the general aviation fleet, the FAA develops aviation activity projections for the nation in their publications entitled: FAA Aerospace Forecast Fiscal Years 2006 – 2017, and the FAA Long-Range Aerospace Forecasts Fiscal Years, 2020, 2025, and 2030. Since 2003, all categories (piston, turboprops, and jet) for general aviation aircraft shipped have steadily increased, with billings reported by the General Aviation Manufacturers Association of $7.8 billion in 2005. For the period 2000 - 2005, non-commercial activity (general aviation and military operations) at combined FAA and contract towers (such as North Perry Airport) has steadily declined, and remains 13.6% below activity in 2000. FAA reported that statistics from their Enhanced Traffic Management System database does not yet show an expected turnaround in business flying. The industry is counting on growth in factional ownership companies and corporate flying to expand the market for jet aircraft. Another important factor in annual operations growth is the number of student pilots. Over the past few years the industry has initiated several programs designed to attract new pilots to general aviation, however, FAA reports the number of pilots in 2005 decreased by 0.8%. The FAA Aerospace Forecast for 2006-2017 predicts the number of active general aviation and air taxi hours flown to rise by 3.2 percent per year through 2017, with turbo jet activity showing the most significant increases at 10.2 percent per year. The FAA’s projections for the nation’s aircraft utilization are shown in Table 3.9.
TABLE 3.9 PROJECTED NATIONAL AIRCRAFT UTILIZATION FAA NATIONAL FORECAST
Aircraft Type Average Annual Growth Rate
2005 - 2017
Single-engine 1.2 %
Multi-engine 1.1 %
Turboprop 1.2 %
Jet 10.2 %
Rotorcraft 3.9 %
Experimental 1.7 %
Overall 3.2 %
Source: FAA Aerospace Forecast, Fiscal Years 2006-2017, Table 28
NORTH PERRY AIRPORT MASTER PLAN UPDATE
SECTION 3: AVIATION FORECAST
Montgomery Consulting Group August 11, 2009 Page 3-13
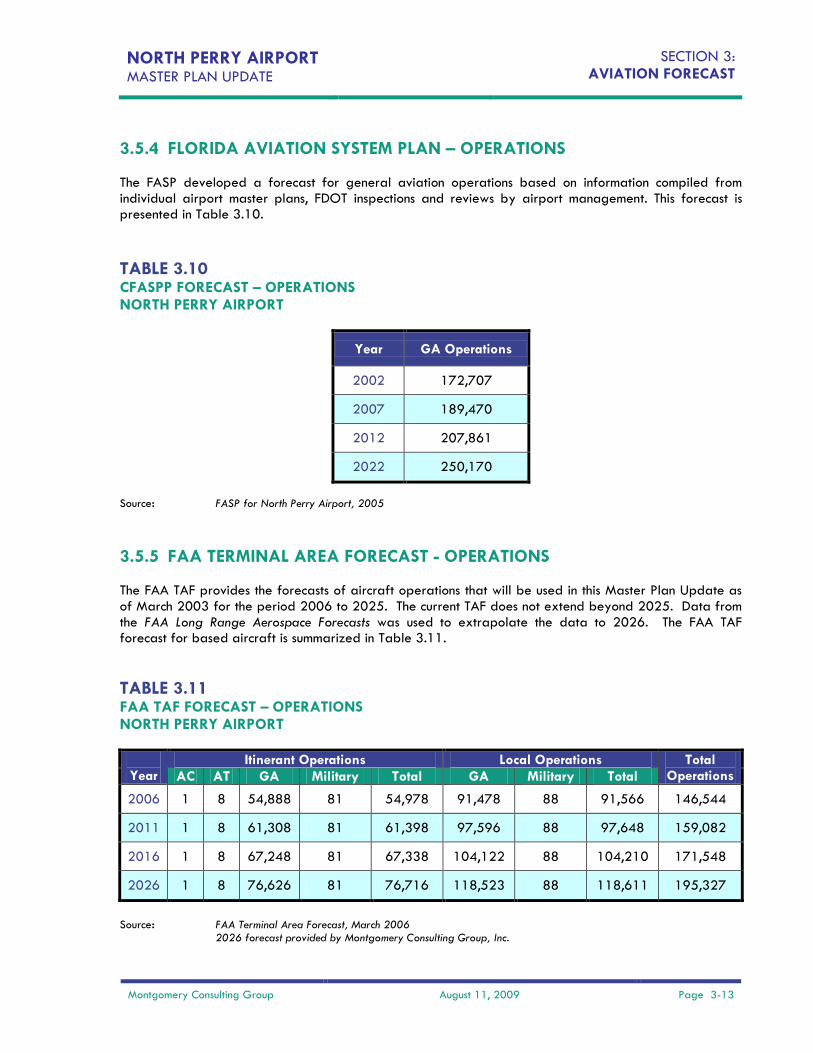
3.5.4 FLORIDA AVIATION SYSTEM PLAN – OPERATIONS The FASP developed a forecast for general aviation operations based on information compiled from individual airport master plans, FDOT inspections and reviews by airport management. This forecast is presented in Table 3.10.
TABLE 3.10 CFASPP FORECAST – OPERATIONS NORTH PERRY AIRPORT
Year GA Operations
2002 172,707
2007 189,470
2012 207,861
2022 250,170
Source: FASP for North Perry Airport, 2005
3.5.5 FAA TERMINAL AREA FORECAST - OPERATIONS The FAA TAF provides the forecasts of aircraft operations that will be used in this Master Plan Update as of March 2003 for the period 2006 to 2025. The current TAF does not extend beyond 2025. Data from the FAA Long Range Aerospace Forecasts was used to extrapolate the data to 2026. The FAA TAF forecast for based aircraft is summarized in Table 3.11.
TABLE 3.11 FAA TAF FORECAST – OPERATIONS NORTH PERRY AIRPORT
Itinerant Operations Year
Itinerant Operations Local Operations Total Operations AC AT GA Military Total GA Military Total
2006 1 8 54,888 81 54,978 91,478 88 91,566 146,544
2011 1 8 61,308 81 61,398 97,596 88 97,648 159,082
2016 1 8 67,248 81 67,338 104,122 88 104,210 171,548
2026 1 8 76,626 81 76,716 118,523 88 118,611 195,327
Source: FAA Terminal Area Forecast, March 2006
2026 forecast provided by Montgomery Consulting Group, Inc.
NORTH PERRY AIRPORT MASTER PLAN UPDATE
SECTION 3: AVIATION FORECAST
Montgomery Consulting Group August 11, 2009 Page 3-14
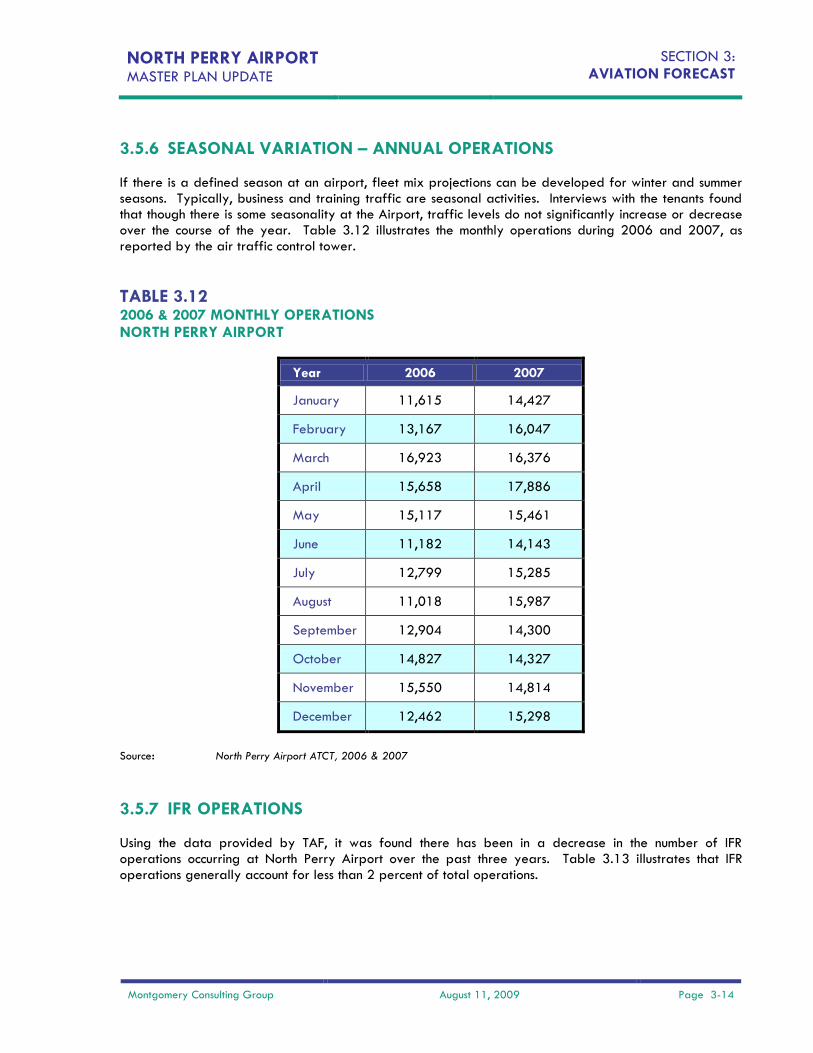
3.5.6 SEASONAL VARIATION – ANNUAL OPERATIONS If there is a defined season at an airport, fleet mix projections can be developed for winter and summer seasons. Typically, business and training traffic are seasonal activities. Interviews with the tenants found that though there is some seasonality at the Airport, traffic levels do not significantly increase or decrease over the course of the year. Table 3.12 illustrates the monthly operations during 2006 and 2007, as reported by the air traffic control tower.
TABLE 3.12 2006 & 2007 MONTHLY OPERATIONS NORTH PERRY AIRPORT
Year 2006 2007
January 11,615 14,427
February 13,167 16,047
March 16,923 16,376
April 15,658 17,886
May 15,117 15,461
June 11,182 14,143
July 12,799 15,285
August 11,018 15,987
September 12,904 14,300
October 14,827 14,327
November 15,550 14,814
December 12,462 15,298
Source: North Perry Airport ATCT, 2006 & 2007
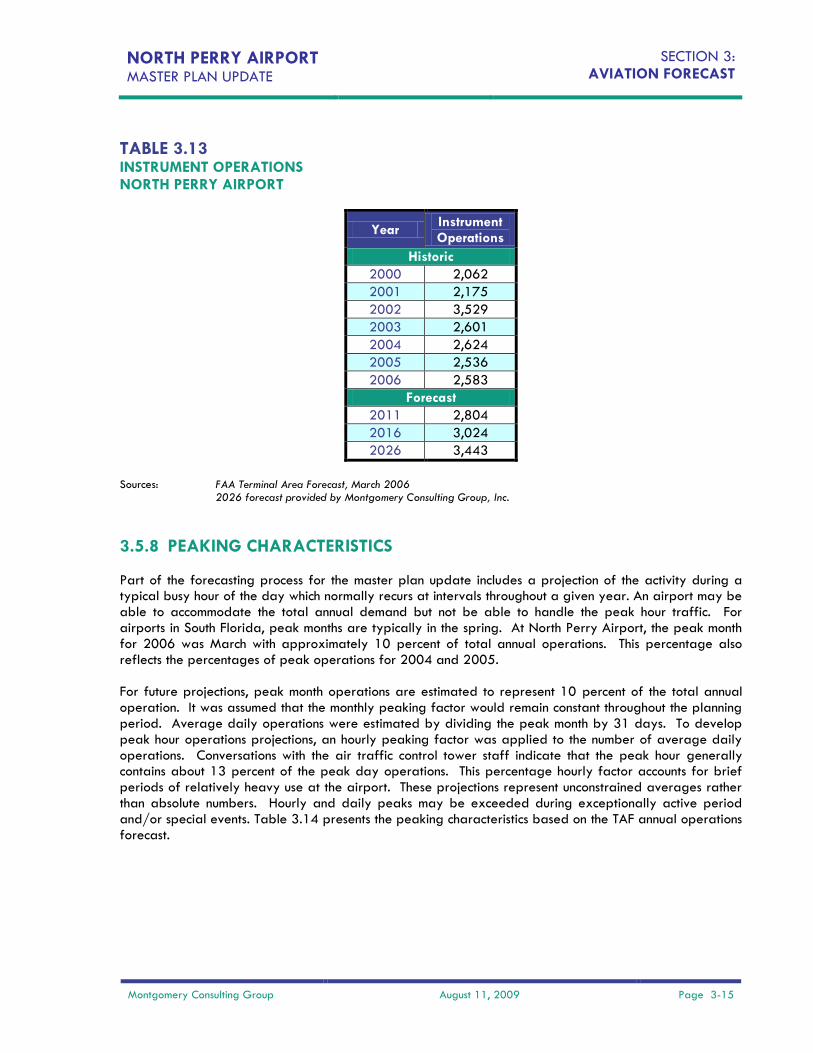
3.5.7 IFR OPERATIONS Using the data provided by TAF, it was found there has been in a decrease in the number of IFR operations occurring at North Perry Airport over the past three years. Table 3.13 illustrates that IFR operations generally account for less than 2 percent of total operations.
NORTH PERRY AIRPORT MASTER PLAN UPDATE
SECTION 3: AVIATION FORECAST
Montgomery Consulting Group August 11, 2009 Page 3-15
TABLE 3.13 INSTRUMENT OPERATIONS NORTH PERRY AIRPORT
Year Instrument Operations
Historic
2000 2,062
2001 2,175
2002 3,529
2003 2,601
2004 2,624
2005 2,536
2006 2,583
Forecast
2011 2,804
2016 3,024
2026 3,443
Sources: FAA Terminal Area Forecast, March 2006
2026 forecast provided by Montgomery Consulting Group, Inc.
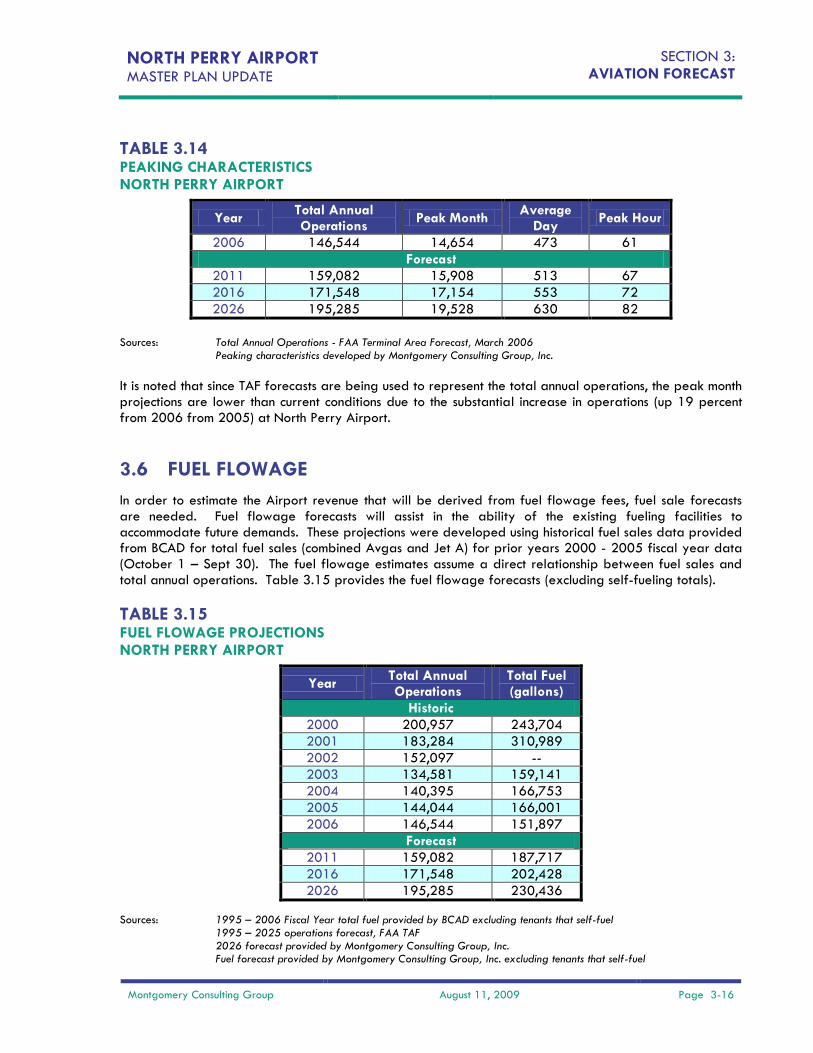
3.5.8 PEAKING CHARACTERISTICS Part of the forecasting process for the master plan update includes a projection of the activity during a typical busy hour of the day which normally recurs at intervals throughout a given year. An airport may be able to accommodate the total annual demand but not be able to handle the peak hour traffic. For airports in South Florida, peak months are typically in the spring. At North Perry Airport, the peak month for 2006 was March with approximately 10 percent of total annual operations. This percentage also reflects the percentages of peak operations for 2004 and 2005. For future projections, peak month operations are estimated to represent 10 percent of the total annual operation. It was assumed that the monthly peaking factor would remain constant throughout the planning period. Average daily operations were estimated by dividing the peak month by 31 days. To develop peak hour operations projections, an hourly peaking factor was applied to the number of average daily operations. Conversations with the air traffic control tower staff indicate that the peak hour generally contains about 13 percent of the peak day operations. This percentage hourly factor accounts for brief periods of relatively heavy use at the airport. These projections represent unconstrained averages rather than absolute numbers. Hourly and daily peaks may be exceeded during exceptionally active period and/or special events. Table 3.14 presents the peaking characteristics based on the TAF annual operations forecast.
NORTH PERRY AIRPORT MASTER PLAN UPDATE
SECTION 3: AVIATION FORECAST
Montgomery Consulting Group August 11, 2009 Page 3-16
TABLE 3.14 PEAKING CHARACTERISTICS NORTH PERRY AIRPORT
Year Total Annual Operations
Peak Month Average
Day Peak Hour
2006 146,544 14,654 473 61
Forecast
2011 159,082 15,908 513 67
2016 171,548 17,154 553 72
2026 195,285 19,528 630 82
Sources: Total Annual Operations - FAA Terminal Area Forecast, March 2006
Peaking characteristics developed by Montgomery Consulting Group, Inc.
It is noted that since TAF forecasts are being used to represent the total annual operations, the peak month projections are lower than current conditions due to the substantial increase in operations (up 19 percent from 2006 from 2005) at North Perry Airport.
3.6 FUEL FLOWAGE
In order to estimate the Airport revenue that will be derived from fuel flowage fees, fuel sale forecasts are needed. Fuel flowage forecasts will assist in the ability of the existing fueling facilities to accommodate future demands. These projections were developed using historical fuel sales data provided from BCAD for total fuel sales (combined Avgas and Jet A) for prior years 2000 - 2005 fiscal year data (October 1 – Sept 30). The fuel flowage estimates assume a direct relationship between fuel sales and total annual operations. Table 3.15 provides the fuel flowage forecasts (excluding self-fueling totals).
TABLE 3.15 FUEL FLOWAGE PROJECTIONS NORTH PERRY AIRPORT
Year Total Annual Operations
Total Fuel (gallons)
Historic
2000 200,957 243,704
2001 183,284 310,989
2002 152,097 --
2003 134,581 159,141
2004 140,395 166,753
2005 144,044 166,001
2006 146,544 151,897
Forecast
2011 159,082 187,717
2016 171,548 202,428
2026 195,285 230,436
Sources: 1995 – 2006 Fiscal Year total fuel provided by BCAD excluding tenants that self-fuel 1995 – 2025 operations forecast, FAA TAF 2026 forecast provided by Montgomery Consulting Group, Inc. Fuel forecast provided by Montgomery Consulting Group, Inc. excluding tenants that self-fuel
NORTH PERRY AIRPORT MASTER PLAN UPDATE
SECTION 3: AVIATION FORECAST
Montgomery Consulting Group August 11, 2009 Page 3-17
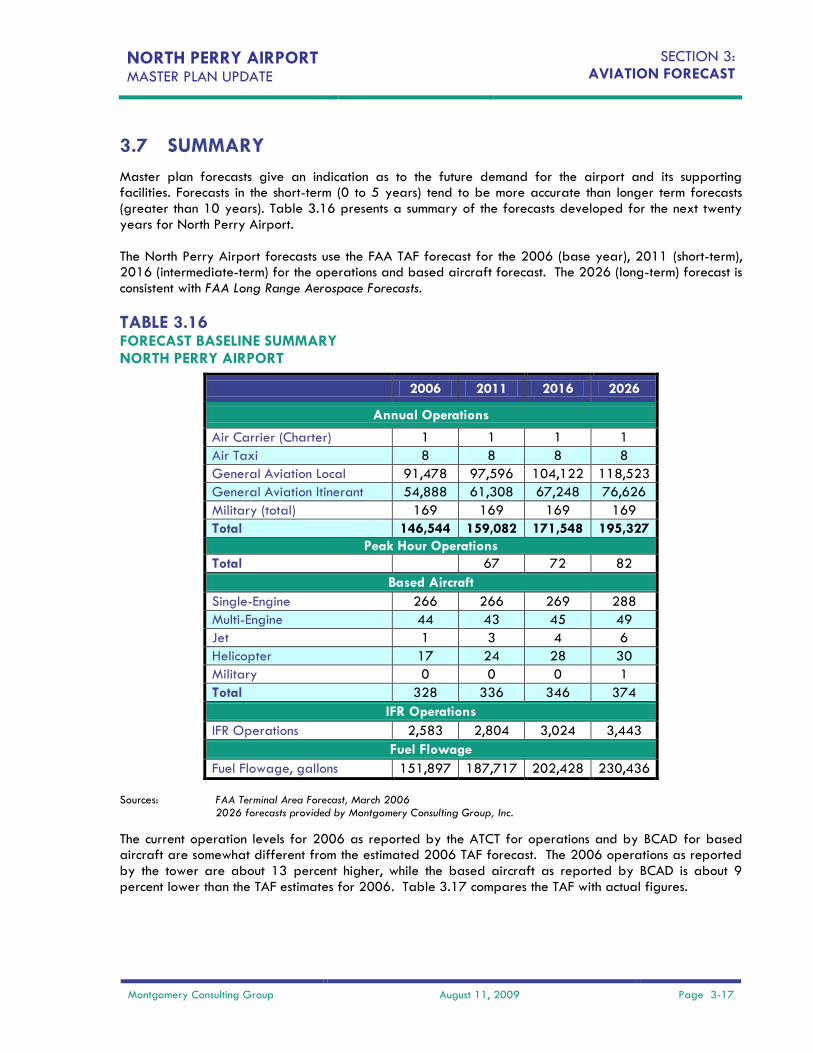
3.7 SUMMARY
Master plan forecasts give an indication as to the future demand for the airport and its supporting facilities. Forecasts in the short-term (0 to 5 years) tend to be more accurate than longer term forecasts (greater than 10 years). Table 3.16 presents a summary of the forecasts developed for the next twenty years for North Perry Airport. The North Perry Airport forecasts use the FAA TAF forecast for the 2006 (base year), 2011 (short-term), 2016 (intermediate-term) for the operations and based aircraft forecast. The 2026 (long-term) forecast is consistent with FAA Long Range Aerospace Forecasts.
TABLE 3.16 FORECAST BASELINE SUMMARY NORTH PERRY AIRPORT
2006 2011 2016 2026
Annual Operations
Air Carrier (Charter) 1 1 1 1
Air Taxi 8 8 8 8
General Aviation Local 91,478 97,596 104,122 118,523
General Aviation Itinerant 54,888 61,308 67,248 76,626
Military (total) 169 169 169 169
Total 146,544 159,082 171,548 195,327
Peak Hour Operations
Total 67 72 82
Based Aircraft
Single-Engine 266 266 269 288
Multi-Engine 44 43 45 49
Jet 1 3 4 6
Helicopter 17 24 28 30
Military 0 0 0 1
Total 328 336 346 374
IFR Operations
IFR Operations 2,583 2,804 3,024 3,443
Fuel Flowage
Fuel Flowage, gallons 151,897 187,717 202,428 230,436
Sources: FAA Terminal Area Forecast, March 2006
2026 forecasts provided by Montgomery Consulting Group, Inc.
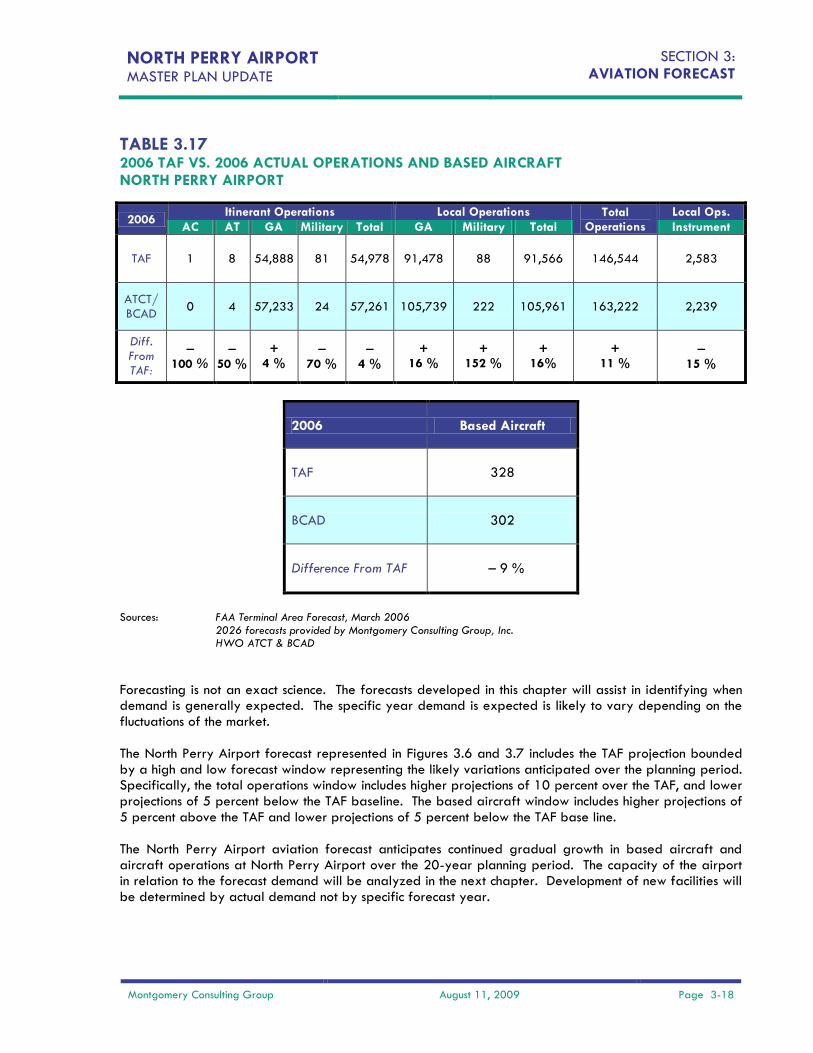
The current operation levels for 2006 as reported by the ATCT for operations and by BCAD for based aircraft are somewhat different from the estimated 2006 TAF forecast. The 2006 operations as reported by the tower are about 13 percent higher, while the based aircraft as reported by BCAD is about 9 percent lower than the TAF estimates for 2006. Table 3.17 compares the TAF with actual figures.
NORTH PERRY AIRPORT MASTER PLAN UPDATE
SECTION 3: AVIATION FORECAST
Montgomery Consulting Group August 11, 2009 Page 3-18
TABLE 3.17 2006 TAF VS. 2006 ACTUAL OPERATIONS AND BASED AIRCRAFT NORTH PERRY AIRPORT
2006 Based Aircraft
TAF 328
BCAD 302
Difference From TAF – 9 %
Sources: FAA Terminal Area Forecast, March 2006
2026 forecasts provided by Montgomery Consulting Group, Inc. HWO ATCT & BCAD
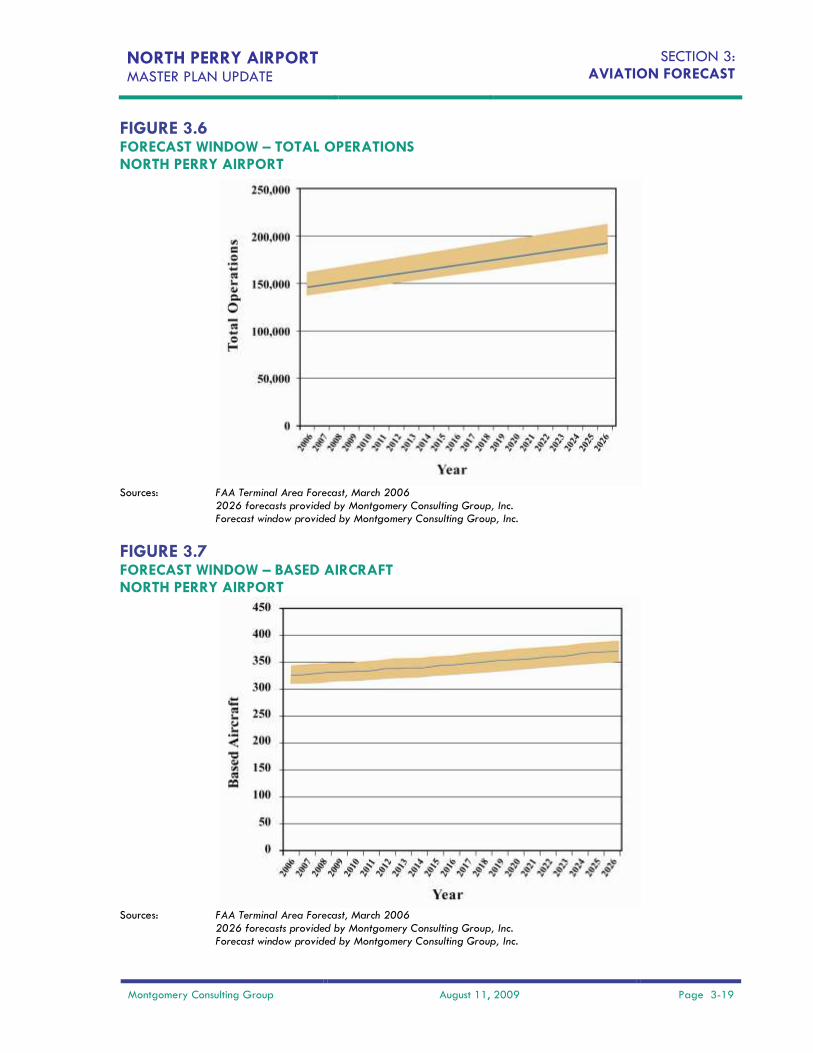
Forecasting is not an exact science. The forecasts developed in this chapter will assist in identifying when demand is generally expected. The specific year demand is expected is likely to vary depending on the fluctuations of the market. The North Perry Airport forecast represented in Figures 3.6 and 3.7 includes the TAF projection bounded by a high and low forecast window representing the likely variations anticipated over the planning period. Specifically, the total operations window includes higher projections of 10 percent over the TAF, and lower projections of 5 percent below the TAF baseline. The based aircraft window includes higher projections of 5 percent above the TAF and lower projections of 5 percent below the TAF base line. The North Perry Airport aviation forecast anticipates continued gradual growth in based aircraft and aircraft operations at North Perry Airport over the 20-year planning period. The capacity of the airport in relation to the forecast demand will be analyzed in the next chapter. Development of new facilities will be determined by actual demand not by specific forecast year.
2006 Itinerant Operations Local Operations Total
Operations
Local Ops.
AC AT GA Military Total GA Military Total Instrument
TAF 1 8 54,888 81 54,978 91,478 88 91,566 146,544 2,583
ATCT/ BCAD
0 4 57,233 24 57,261 105,739 222 105,961 163,222 2,239
Diff. From TAF:
– 100 %
– 50 %
+ 4 %
– 70 %
– 4 %
+ 16 %
+ 152 %
+ 16%
+ 11 %
– 15 %
NORTH PERRY AIRPORT MASTER PLAN UPDATE
SECTION 3: AVIATION FORECAST
Montgomery Consulting Group August 11, 2009 Page 3-19
FIGURE 3.6 FORECAST WINDOW – TOTAL OPERATIONS NORTH PERRY AIRPORT
Sources: FAA Terminal Area Forecast, March 2006
2026 forecasts provided by Montgomery Consulting Group, Inc. Forecast window provided by Montgomery Consulting Group, Inc.
FIGURE 3.7 FORECAST WINDOW – BASED AIRCRAFT NORTH PERRY AIRPORT
Sources: FAA Terminal Area Forecast, March 2006
2026 forecasts provided by Montgomery Consulting Group, Inc. Forecast window provided by Montgomery Consulting Group, Inc.