Embed Size (px)
Citation preview

Section 227 National Shoreline Erosion Control
Development
and
Demonstration Program
30% Design Submittal
for the
63rd Street “Hotspot”, Miami Beach, Florida
Respectfully submitted by,
April 3, 2003

SECTION 227 63RD STREET “HOTSPOT” MIAMI BEACH
Table of Contents SECTION 1 INTRODUCTION................................................................................. 6
1.1 DELIVERABLES UNDER SCOPE OF WORK ............................................................. 6 1.2 SITE LOCATION: THE 63RD STREET “HOTSPOT” ................................................... 7 1.3 GENERAL DESIGN OBJECTIVE.............................................................................. 7
1.3.1 Added Value of the SMART......................................................................... 8
SECTION 2 SITE CONDITIONS AND DESIGN PARAMETERS...................... 8 2.1 VERTICAL AND HORIZONTAL DATUM.................................................................. 8 2.2 TIDES ................................................................................................................... 9 2.3 STORM SURGE.................................................................................................... 10 2.4 CURRENTS ......................................................................................................... 11 2.5 WAVE CONDITIONS............................................................................................ 11
2.5.1 Wave Direction ......................................................................................... 11 2.5.2 Wave Height.............................................................................................. 12 2.5.3 Wave Period.............................................................................................. 12 2.5.4 Wave Properties Summary........................................................................ 13
2.6 LOCAL BOTTOM CHARACTERISTICS................................................................... 13
SECTION 3 SMART STRUCTURE DESIGN ...................................................... 14 3.1 STRUCTURAL DESIGN COMPONENTS ................................................................. 14
3.1.1 Product Description – REEF BALLS..................................................... 14 3.1.2 Product Description: Articulating Concrete Block Mats (ABM) ............. 16 3.1.3 Historical Example of using Articulating Block Mats in Marine Applications .............................................................................................................. 17
3.2 COMBINING REEFBALLS AND CONCRETE MATS (RBAM) ................................. 18 3.3 SMART STRUCTURE CONFIGURATION ............................................................. 19 3.4 STABILITY ANALYSIS FOR SMART STRUCTURE............................................... 20
3.4.1 Introduction............................................................................................... 20 3.4.2 Hydrodynamic Load - Wave Force Calculations ..................................... 20 3.4.3 Modification to Reefball Diameter Due to Marine Growth...................... 22 3.4.4 Selection of Appropriate Design Values of Coefficients........................... 22 3.4.5 Selection of Design Wave for Structural Stability .................................... 23 3.4.6 Breaking Wave Classification and Factor of Safety ................................. 24
3.5 STRUCTURAL RESISTANCE - RESTORING FORCES .............................................. 25 3.6 RESULTS OF HYDRAULIC STABILITY ANALYSIS................................................. 25 3.7 RESISTANCE TO SCOUR POTENTIAL ................................................................... 26 3.8 HYDRAULIC STABILITY OF INDIVIDUAL REEFBALLS.......................................... 26
SECTION 4 SMART STRUCTURE FUNCTIONAL PERFORMANCE.......... 26 4.1 FUNCTIONAL PERFORMANCE PROJECTION......................................................... 27 4.2 SMART BREAKWATER WAVE ATTENUATION ..................................... 27
4.2.1 Breakwater Profile Geometry ................................................................... 27 4.2.2 Relative Crest Height................................................................................ 29 4.2.3 Wave Attenuation Formulas ..................................................................... 29 4.2.4 Estimated Functional Performance - Wave Attenuation of SMART........ 31
30% DESIGN SUBMITTAL Page 2 of 51

SECTION 227 63RD STREET “HOTSPOT” MIAMI BEACH
4.3 SMART SAND RETENTION................................................................................ 33 4.4 SMART SEGMENTATION .................................................................................. 34 4.5 OPERATION AND MAINTENANCE........................................................................ 34
SECTION 5 SMART STRUCTURE CONSTRUCTION..................................... 34 5.1 INSTALLATION CONSTRUCTION METHODOLOGY ............................................... 34 5.2 REMOVAL METHOD ........................................................................................... 35 5.3 MATERIALS AND MATERIAL OPTIONS ............................................................... 35
5.3.1 Typical Concrete Specification ................................................................. 36 5.3.2 Typical Standard and References ............................................................. 36 5.3.3 Products .................................................................................................... 37 5.3.4 Trial Mix design........................................................................................ 38 5.3.5 Concrete Strength Requirements .............................................................. 38 5.3.6 Cabling and Anchorage ............................................................................ 39
5.4 PRELIMINARY CONSTRUCTION COST ESTIMATE ................................................ 39 5.4.1 Fabrication and Installation ..................................................................... 40 5.4.2 Removal..................................................................................................... 40
SECTION 6 100% DESIGN PLANS AND SPECS COST ESTIMATE............. 41
SECTION 7 CONCLUSIONS AND RECOMMENDATIONS............................ 43
SECTION 8 REFERENCES.................................................................................... 44
APPENDIX A - WIS STATION 9 EVALUATION..................................................... 46
APPENDIX B - MORRISONS EQUATION ............................................................... 49
APPENDIX C - 30% SMART STRUCTURE DESIGN PLANS ............................... 51
List of Figures Figure 2-1. Long-term sea level trend plot. ........................................................................ 9 Figure 2-2, FEMA surge level return interval plot. .......................................................... 10 Figure 3-1. Individual Reef BallTM unit. ............................................................................ 14 Figure 3-2. In-place Reef Balls TM.................................................................................... 14 Figure 3-3. Three-row submerged breakwater.................................................................. 15 Figure 3-4. Before and after Reef BallTM installation....................................................... 15 Figure 3-5. April 2001 aerial photograph. ........................................................................ 16 Figure 3-6. Installation of ABM's using a spreader bar (URS, 2001). ............................. 17 Figure 3-7. Typical RBAM unit profile on a flat incline................................................. 18 Figure 3-8. Typical RBAM unit in plan view................................................................... 18 Figure 3-9. Sample plan view of SMART structure layout. ............................................. 19 Figure 4-1. Definition sketch for a submerged breakwater. ............................................. 28 Figure A-1. Fractional wave height plot for WIS Station 9.............................................. 46 Figure A-2. Fractional wave period plot for WIS Station 9. ............................................ 46 Figure A-3. Return interval wave height plot for WIS Station 9...................................... 47 Figure A-4. Return interval wave period plot for WIS Station 9...................................... 47
30% DESIGN SUBMITTAL Page 3 of 51

SECTION 227 63RD STREET “HOTSPOT” MIAMI BEACH
List of Tables Table 2-1. Vertical datum reference (NOAA Station 8723080)........................................ 9 Table 2-2. FEMA surge levels per return period. ............................................................ 10 Table 2-3, Representative wave cases for performance evaluation.................................. 13 Table 3-1. Depth limited breaking wave, 1V: 100H slope. .............................................. 23 Table 3-2. Depth limited breaking wave, 1V: 2H slope. .................................................. 23 Table 3-3. Breaking wave properties in front of the structure. ......................................... 24 Table 3-4. Breaking wave properties on the structure. ..................................................... 24 Table 3-5. Hydraulic stability results................................................................................ 25 Table 4-1. Reefball sizes for use in SMART Breakwaters............................................... 32 Table 4-2. Wave transmission coefficients using Seabrook Formula............................... 32 Table 5-1. Trial mix Design.............................................................................................. 38 Table 5-2. Concrete compressive strength requirements. ................................................. 39 Table 5-3. Construction and installation cost estimate. .................................................... 40 Table 5-4. SMART system removal cost estimate. .......................................................... 40
30% DESIGN SUBMITTAL Page 4 of 51

SECTION 227 63RD STREET “HOTSPOT” MIAMI BEACH
Preface This report was authorized under the Section 227 of the Water Resources and Development Act (WRDA) of 1996, National Shoreline Erosion Control Development and Demonstration Program of the U.S. Army Corps of Engineers. The work consisted of preparing a 30% design submittal for a new class of innovative shoreline erosion control structures for the 63rd Street Hotspot, Miami Beach, Florida.
The report was prepared by Mr. George F. Turk, P.E., and Mr. Clinton S. Thurlow of the URS Corporation, Boca Raton, Florida office. Significant contributions were made to this report by Dr. Lee Harris, Florida Institute of Technology, Mr. Todd Barber, President, Reef Ball Development Group, Mr. Derrick Dice, Director of Engineering, Armortec Corporation, and Mr. Joseph Fredrickson, S. G. Pinney and Associates, Inc.
30% DESIGN SUBMITTAL Page 5 of 51

SECTION 227 63RD STREET “HOTSPOT” MIAMI BEACH
SECTION 1 INTRODUCTION
The National Shoreline Erosion Control Development and Demonstration Program of the U.S. Army Corps of Engineers was authorized under Section 227 of the Water Resources and Development Act (WRDA) of 1996. The multi-year Program began in 2000. The goal of the Section 227 Program is to evaluate the functional and structural performance of innovative or non-traditional ways of abating coastal erosion. The Program is intended to advance the state-of-the-art of shoreline erosion control technology, encourage the development of innovative solutions, and provide technical and public information designed to further the use of well-engineered alternative approaches.
A minimum of seven primary demonstration projects will be selected for the Program. Two on the Atlantic, one on the Gulf Coast, two on the Great Lakes, and two on the Pacific Ocean. The 63rd Street “Hotspot”, Miami Beach, Florida has been chosen as one of these sites. USACE has solicited and chosen several of innovative solutions for 30% design development. The URS proposed structure, dubbed the “SubMerged Artificial Reef Training Structure”, or the SMART structure, was one of the innovative technologies chosen for 30% design for Miami Beach, Florida. This report contains the 30% design deliverables for the 63rd Street SMART Project.
1.1 Deliverables under Scope of Work
There are several deliverables included in this report. They are:
DELIVERABLE A - 30% Plans and Specifications suitable for regulatory compliance assessment including,
• Preliminary project footprint
• Structural dimensions
• Typical construction profile
• Specifications
DELIVERABLE B – Technical Report covering issues such as,
• Project design conditions
• Physical parameters
• Structural stability - Loading and Resistance
• Treatment of scour potential
• Construction materials
30% DESIGN SUBMITTAL Page 6 of 51

SECTION 227 63RD STREET “HOTSPOT” MIAMI BEACH
• Construction method including equipment and materials
• Preliminary cost estimate for construction and removal
• Estimated cost differential structure designed for 20-yr
• Estimated maintenance requirements
• Preliminary statement of project functional performance
1.2 Site Location: The 63rd Street “Hotspot”
The City of Miami Beach is located on the southeast Florida coast of the Atlantic Ocean in Dade County. Miami Beach is located on a stabilized barrier island segment, with significant urban development. The barrier island segment ranges in with form 0.5 to 1.5 miles, and has an elevation of approximately 10-ft.
It is hypothesized the barrier island began as a shallow sandstone reef, where mangroves established themselves, and trapped sediment. The evolutionary result is what has become Miami Beach. Offshore of the beach a series of three submerged shore parallel reef lines exist. The continental shelf is narrow along this coast, with depths dropping less than a couple miles offshore. The mean foreshore slope in the project vicinity is estimated to be 1V: 100H.
The 63rd Street project site has been described as an “Erosional Hotspot” in Miami Beach (between FLDEP monuments R-44 to R-46.5), and is within the federally authorized Dade County Beach Erosion Control and Hurricane Protection Project (BEC&HP). It is in the 9.3-mile barrier island segment extending from Bakers Haulover Inlet southward to Government Cut. This shoreline has seen a significant number of beach fills, exclusively from offshore borrow sites located between the shore parallel offshore reefs The 63rd St. site has suffered excessive shoreline recession rates of 14-25 ft/year, documented since the early 1980’s.
1.3 General Design Objective
At present USACE Jacksonville District has a plan for a “Beach Erosion Control and Hurricane Protection Project” for Dade County, FL as part of the “Sustainability of Renourishment for Miami Beach” plan. The plan calls for an “alternative” upland sediment source demonstration beach fill project whereby the fill will be placed, starting just north of 83rd Street and terminate just south of 63rd Street. The objective of this Section 227 project is to retain sand at the southern terminus of this fill project without causing impacts to adjacent shorelines, when exposed to the combination of storm surge and design wave events with a 10-year return interval. A second objective is for the structure to remain stable and not incur any damage if exposed to the combination of storm surge and design wave events with a 50-year return interval.
30% DESIGN SUBMITTAL Page 7 of 51

SECTION 227 63RD STREET “HOTSPOT” MIAMI BEACH
1.3.1 ADDED VALUE OF THE SMART
The primary associated benefit of the SMART is the retention of sand. However, this design gains merit when considering the increase in marine habitat. At a minimum, the artificial reef structure will provide increased protective habitat for juvenile marine organisms. It is expected that the SMART will provide coral growth substrate.
Recreational benefits will likely be realized from the structures. First, a significant reduction in wave heights reaching the beach behind the SMART will be realized, making the beach more usable for non-swimmers and youth than adjacent non-protected beaches. Second, the close proximity of the reef to the beach makes it a prime target for snorklers and divers.
SECTION 2 SITE CONDITIONS AND DESIGN PARAMETERS
Site conditions, design parameters, and related information for this 30% design submittal were taken from several sources located in the Reference section of this report. Two different criteria are used for evaluation and design of the SMART structure, introduced here, but elaborated on in the “Design” and “Performance” chapters of this report. The criteria are performance and survivability. The performance goals for this structure are based on site conditions representing a majority of the circumstances the structure will be subjected to (ex: MHHW conditions vs. Storm Surge Conditions). The survivability goals are based on conditions representing extreme events (10-year return event), requiring preservation of the structural integrity of the SMART structure.
2.1 Vertical and Horizontal Datum
Previous design studies done in the area, such as the “Beach Erosion Control And Hurricane Protection Project (BEC&HP)” (USACE JAX, 2001), make compelling reasons for the use of Mean Water Level (MLW) as a vertical datum in order to maintain consistency with historical records. The nearest established datum station maintained by NOAA was station 8723080 located at the previous location of the Haulover Pier in the City of Miami Beach. The Haulover Pier was destroyed during Hurricane Andrew in 1992. The established benchmark for the National Geodetic Vertical Datum 1929 (NGVD 29) was reported as +0.79-ft MLW, with Mean Low Water (MLLW) at -0.13 ft, Mean High Water (MHW) at +2.54-ft, and Mean Higher High Water (MHHW) at +2.6-ft. The vertical datum has been summarized in Table 2.1.
30% DESIGN SUBMITTAL Page 8 of 51
SECTION 227 63RD STREET “HOTSPOT” MIAMI BEACH
Table 2-1. Vertical datum reference (NOAA Station 8723080).
Reference MLW NGVD - 29
MHHW +2.6-ft. +1.81-ft.
MHW +2.54-ft. +1.75-ft.
NGVD-29 +0.79-ft. 0.0-ft.
MLW 0.0-ft. -0.79-ft.
MLLW -0.13-ft. -0.92-ft.
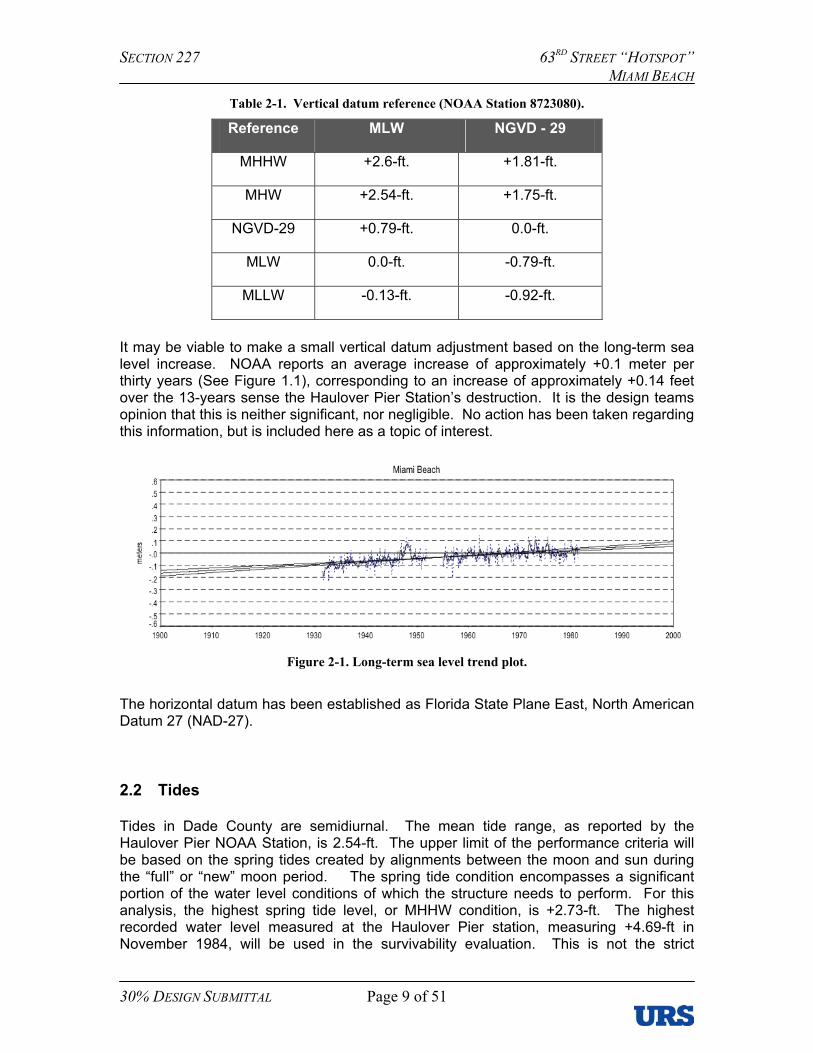
It may be viable to make a small vertical datum adjustment based on the long-term sea level increase. NOAA reports an average increase of approximately +0.1 meter per thirty years (See Figure 1.1), corresponding to an increase of approximately +0.14 feet over the 13-years sense the Haulover Pier Station’s destruction. It is the design teams opinion that this is neither significant, nor negligible. No action has been taken regarding this information, but is included here as a topic of interest.
Figure 2-1. Long-term sea level trend plot.
The horizontal datum has been established as Florida State Plane East, North American Datum 27 (NAD-27).
2.2 Tides
Tides in Dade County are semidiurnal. The mean tide range, as reported by the Haulover Pier NOAA Station, is 2.54-ft. The upper limit of the performance criteria will be based on the spring tides created by alignments between the moon and sun during the “full” or “new” moon period. The spring tide condition encompasses a significant portion of the water level conditions of which the structure needs to perform. For this analysis, the highest spring tide level, or MHHW condition, is +2.73-ft. The highest recorded water level measured at the Haulover Pier station, measuring +4.69-ft in November 1984, will be used in the survivability evaluation. This is not the strict
30% DESIGN SUBMITTAL Page 9 of 51

SECTION 227 63RD STREET “HOTSPOT” MIAMI BEACH
definition of the Highest Astronomical Tide (HAT), but will be referred to as such in this report.
2.3 Storm Surge
It is a requirement that the proposed SMART structure survive when subjected to depth-limited breaking waves associated with a 10-year storm surge level. FEMA has estimated the hurricane induced 10-year storm surge to be 4.7-ft (1.43-m). This design analysis has been extended to include return intervals of 20-years (5.7-ft (1.74-m)).
Figure 2-2, FEMA surge level return interval plot.
A detailed description of the data represented in Figure 2-2 can be found in the BEC&HP report (USACE JAX, 2001, p. 26-27). In summary, the top two trend lines indicate hurricane induced surge conditions at the south (top line) and the north (just below the top line) ends of Miami Beach. The bottom two trend lines represent “Nor’easter” induced storm conditions with, and without, spring tide levels included. Interpolation of data occurs below the 10-year and above the 50-year interval, outside of the design period of interest. A summary of conditions to be used in the analysis can be view in Table 2-2. These levels represent the total water surface elevation increase and are inclusive of the Highest Astronomical Tide. Evaluation for maximum force transmitted to the SMART structure will also include storm events occurring at low water conditions.
Table 2-2. FEMA surge levels per return period.
Reference 10-year 20-year 50-year
Hurricane Event +4.7-ft. +5.7-ft. +7.4-ft.
“Nor’easter” Event +3.6-ft. +3.8-ft. +4.2-ft.
30% DESIGN SUBMITTAL Page 10 of 51

SECTION 227 63RD STREET “HOTSPOT” MIAMI BEACH
2.4 Currents
Current strongly influences the sand retention capabilities of the SMART structure, and to a minor extent, affects structural stability. Globally, the Gulf Stream produces an almost steady-state northerly current offshore. Although, the Gulf Stream creates a very narrow banded condition of northerly flows, seaward of the shelf, local current conditions are best described as convective in nature, with a tendency to form a reverse eddy flow from the Gulf Stream. The result is a mixed current field with a higher average of southerly flow, as evidenced by the predominately southerly transport of sediment. Due to the location of 63rd Street, a significant distance from either Bakers Haulover Inlet or Government Cut, no tidally induced currents contribute to local conditions. Design considerations for the SMART focus on a southerly, long-shore current ranging between 1.0 and 2.0 knots.
2.5 Wave Conditions
The wave data used for this report come from WIS Station 9, Phase II Hindcast. An in-depth analysis of WIS Station 9 was conducted in the BEC&HP report (USACE JAX, 2001, p. 29-40) including evaluation of Station 9 data linearly translated to the 12.0-ft contour. In partial summary of the BEC&HP report, shallow-water conditions taken at the 12.0-ft contour, are located approximately 500 to 600 feet offshore, and are only comprised of onshore propagating waves from WIS Station 9. Offshore propagating waves are taken as “calm” events near-shore, in order to maintain the accuracy of any statistical analysis. In an effort to limit the number of cases used to evaluate the performance and survivability of the SMART structure, statistically representative wave conditions have been selected from the near-shore wave data contained in the BEC&HP report.
The performance of the SMART structure is variable in nature, as its level of interaction with the wave field changes as the wave field changes. This topic is discussed in detail in Section 4 of this report, and is the driving factor behind the selection of design wave conditions. On of the categories for performance is wave attenuation, measured as a fractional or percentage reduction in incident vs. transmitted wave height. To follow suit, wave determination for the performance determination is also done on a fractional or percent bases, to allow a range performance values over a range of wave conditions. Single values where evaluated for the 30% design, with additional cases planned for the 100% design.
2.5.1 WAVE DIRECTION
While “Nor’easter” winter storms result in a net transport to the south, the beach is primarily exposed to wave energy from the east to east-southeast directions. Significant portions of the waves are banded between 56 and 123 degrees (almost 99%). It is assumed that the northern end of the band represents the “Nor’easter” driven events and was taken as the direction for the “Nor’easter” wave conditions. Just fewer than
30% DESIGN SUBMITTAL Page 11 of 51

SECTION 227 63RD STREET “HOTSPOT” MIAMI BEACH
60% of the waves fall within the 78 to 101 degree band, resulting in a normal wave condition direction of 90 degrees. The southerly end of the spectrum, 123 degrees, will also be evaluated in order to establish performance for 99% of the wave directions.
2.5.2 WAVE HEIGHT
For the three directions established in the Wave Direction section in this chapter, two different wave heights where used, the significantly occurring wave and the extreme event wave. The significantly occurring waves where selected out of the near-shore wave data generated from WIS Station 9 and included in the BEC&HP report (USACE JAX, 2001, p. 35). The near-shore transformation, using Snell’s law, was not truncated for depth limited breaking wave criteria. A significant number of events occur that exceed local breaking wave limits, therefore, extreme event waves were calculated based on depth limited wave breaking criteria dependent on case specific surge and tide levels.
Waves propagating from the 56-degree direction are classified as the “Nor’easter” events. Annual wave activity from this heading increases significantly between the October and December months, 4,756 events compared to 1,970 events between June and August. Mean wave height values for these months are 4.7, 5.27, and 5.0-ft respectively. Due to a wave height resolution of 2-ft, the closest representative wave is 6.0-ft. A wave height of 6.0-ft represents approximately 75%, 69%, and 72% of the wave field for October, November, and December, respectively.
Significantly occurring waves from the 90-degree direction are classified as “normal condition” events. No significant fluctuations in the number of events occur in this direction, although small increases over the average can be seen in the Spring and Fall months, as expected. The means for May and September are 3.45-ft for both. The averaged wave height of 4.0-ft encompasses 69% of the wave field for May and 73% for September.
The southerly boundary wave of 123-degree primarily occurs during the summer months between June and August. The mean values for these months are 2.46, 1.98, and 2.45-ft respectively. A 4.0-ft wave height encompasses 87%, 94%, and 87% of the waves for the months of June, July, and August, respectively.
2.5.3 WAVE PERIOD
As discussed in the “Wave Height” section, wave periods will be selected for each of the three primary directions selected from the near-shore translated version of the WIS Station 9 wave data and contained in the BEC&HP report (USACE JAX, 2001, p. 35).
Wave heights selected in the “Wave Height” section of this report represent approximately 70% of the wave field for the “Nor’easter” and “normal” events, and approximately 90% of the southerly events occurring shore-normal. In order to determine the associated wave period, the percent representations where used to
30% DESIGN SUBMITTAL Page 12 of 51
SECTION 227 63RD STREET “HOTSPOT” MIAMI BEACH
extract the period that corresponds with the approximated occurrence value. In the case of the “Nor’easter” events, a summation of events from 0 to 9-seconds represents 70% of the cases occurring during the winter months. Spring and fall events are represented by period falling under 8-seconds, characterizing 70% of the wave field, correlating to the 4.0-ft wave height percentage determined in the “Wave Height” section of this report. Southerly occurring events during in the summer months exhibit an 8.0-second period for 90% representation.
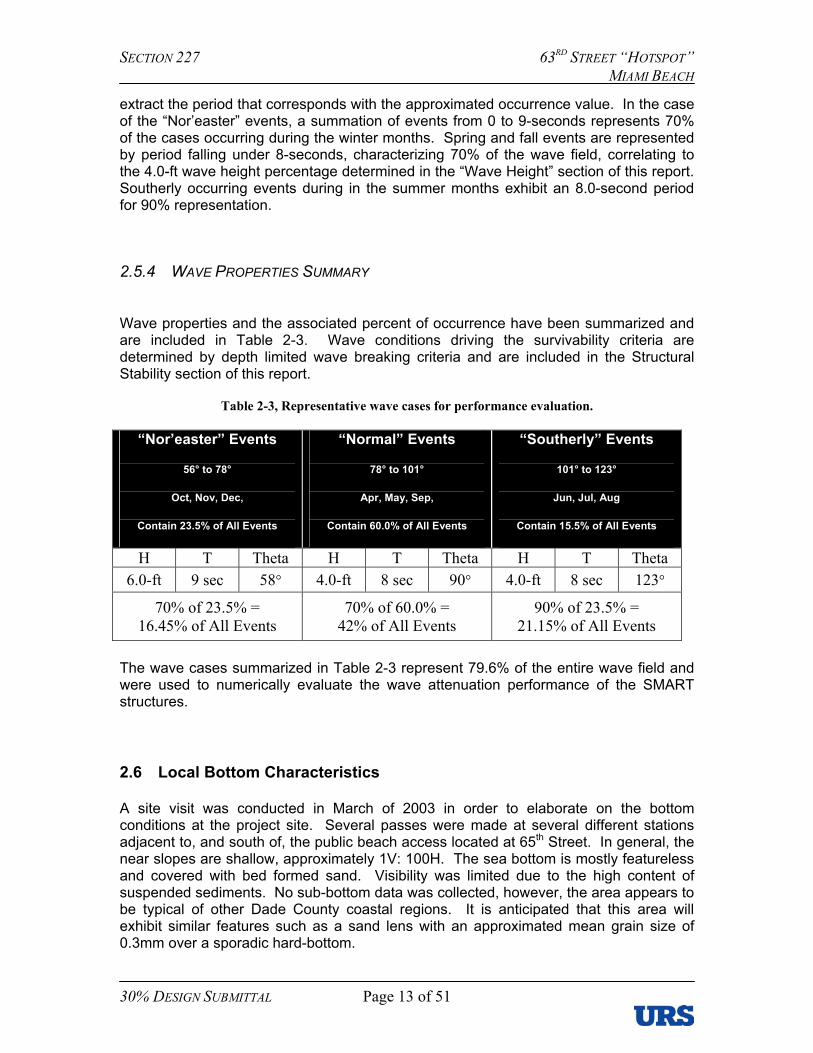
2.5.4 WAVE PROPERTIES SUMMARY
Wave properties and the associated percent of occurrence have been summarized and are included in Table 2-3. Wave conditions driving the survivability criteria are determined by depth limited wave breaking criteria and are included in the Structural Stability section of this report.
Table 2-3, Representative wave cases for performance evaluation.
“Nor’easter” Events
56° to 78°
Oct, Nov, Dec,
Contain 23.5% of All Events
“Normal” Events
78° to 101°
Apr, May, Sep,
Contain 60.0% of All Events
“Southerly” Events
101° to 123°
Jun, Jul, Aug
Contain 15.5% of All Events
H T Theta H T Theta H T Theta 6.0-ft 9 sec 58° 4.0-ft 8 sec 90° 4.0-ft 8 sec 123°
70% of 23.5% = 16.45% of All Events
70% of 60.0% = 42% of All Events
90% of 23.5% = 21.15% of All Events
The wave cases summarized in Table 2-3 represent 79.6% of the entire wave field and were used to numerically evaluate the wave attenuation performance of the SMART structures.
2.6 Local Bottom Characteristics
A site visit was conducted in March of 2003 in order to elaborate on the bottom conditions at the project site. Several passes were made at several different stations adjacent to, and south of, the public beach access located at 65th Street. In general, the near slopes are shallow, approximately 1V: 100H. The sea bottom is mostly featureless and covered with bed formed sand. Visibility was limited due to the high content of suspended sediments. No sub-bottom data was collected, however, the area appears to be typical of other Dade County coastal regions. It is anticipated that this area will exhibit similar features such as a sand lens with an approximated mean grain size of 0.3mm over a sporadic hard-bottom.
30% DESIGN SUBMITTAL Page 13 of 51

SECTION 227 63RD STREET “HOTSPOT” MIAMI BEACH
SECTION 3 SMART STRUCTURE DESIGN
3.1 Structural Design Components
To those involved in the field of coastal engineering, it is becoming apparent that pure structural controls (groins, breakwaters, etc.) or pure beach nourishment fall short of an optimal shoreline erosion control system. There is a paradigm shift in the thinking of engineers and scientists directed toward a hybrid approach to shoreline stabilization using structures and sand. Historically, coastal structures are often times too effective, disrupting longshore transport processes, starving downdrift beaches. Beach fills alone are susceptible to episodic storm erosion events, hence are viewed by some to be wasteful.
The proposed Submerged Artificial Reef Training structure, or SMART structure, is a low impact structure that is highly porous, dissipates energy through forcing wave breaking and creating local turbulence. It is comprised of two proprietary structural components. The artificial reef modules (Figure 3-1) to be used for this project are REEF BALLS
(hereafter referred to reefballs). The foundation and mounting base for the reefballs will be ARMORTEC Armorflex Articulating Concrete Block Mats (hereafter referred to as ABM). The SMART is a matrix of reefballs mounted to ABM. The ABM serves several functions. First, it adds significant mass with a very low center of gravity to the system. Second, it provides scour protection along the leading edges of the matrix and along the channels between adjacent reefballs. Third, it provides a convenient and expedient method of installing several reefballs at a time.
Figure 3-1. Individual Reef BallTM unit.
3.1.1 PRODUCT DESCRIPTION – REEF BALLS
Reefballs may be described as a bell shaped hollow concrete structure with randomly perforated complex holes. The density of the concrete used, and the thickness of the sidewalls and base can control its weight and mass. The surface is typically very rough. The reefball is formed with a re-usable fiberglass mold. It is very simple to fabricate. Small communities around the world have built many reef habitat enhancement projects at the “grass roots” level. Reefballs for large projects are cast en masse in concrete casting yard, and shipped to the project site. Figure 3-2. In-place Reef Balls TM.
30% DESIGN SUBMITTAL Page 14 of 51

SECTION 227 63RD STREET “HOTSPOT” MIAMI BEACH
3.1.1.1 Historical Use of Reefballs for Wave Attenuating, Sand Retention Structures
The first use of reefballs as a submerged artificial reef structure, acting as a submerged breakwater, provided both wave attenuation and sand retention, was for a project constructed along the southern shore of the Dominican Republic near Bayahibe (east of Santo Domingo and LaRomano) during the summer 1998 (Harris, 2003). Approximately 450 reefballs were installed to form a submerged breakwater for shoreline stabilization, environmental enhancement, and eco-tourism (Figure 3-3). The individual units used for the breakwater were 1.2-m high reefballs units and 1.3-m high Ultra Ball units, with base diameters of 1.5-m and 1.6-m, respectively, and a mass of 1,600 to 2,000 kilograms.
Figure 3-3. Three-row submerged breakwater.
The design of the submerged breakwater system consisted of three segmented breakwater sections, using three rows of Reef BallTM units for each segment. The breakwater was installed in water depths of 1.6-m to 2.0-m, so that the units were 0.3-m to 0.8-m below the mean water level. The tide range in the project area is approximately 0.4-m. In the fall of 1998, shortly after the installation of the breakwater system, a direct hit by Hurricane Georges (Category 3) and large waves from Hurricane Mitch (Category 5) impacted the project area. Not a single Reefball unit was displaced or damaged. As shown in Figure 3-4, the beach and shoreline in the lee of the submerged breakwater system has been stabilized and has accreted sand, with no adverse impacts on adjacent beaches.
Figure 3-4. Before and after Reef BallTM installation.
30% DESIGN SUBMITTAL Page 15 of 51

SECTION 227 63RD STREET “HOTSPOT” MIAMI BEACH
Figure 3-5 shows the location of three profile lines surveyed to document the performance of the submerged breakwater system. Shoreline and sand volume calculations, based on these beach profiles continue to shown that the Reefball breakwater has been very effective in stabilizing the beach, with a significant increase in beach width and elevation along the project shoreline. We anticipate better performance for the SMART structure, given the expanded spacing and increased number of units.
Figure 3-5. April 2001 aerial photograph.
3.1.2 PRODUCT DESCRIPTION: ARTICULATING CONCRETE BLOCK MATS (ABM)
The Armortec Armorflex ABM are concrete block and cable systems typically employed as channel linings for canals. Armortec has used this system for a number of applications, including marine projects such as pipeline scour protection, boat ramps, and shoreline revetments. The concrete blocks come in two forms, open and closed cells. Spaces between the blocks and the openings in the blocks themselves (open-cell) allow for relief of transient uplift pressure as a wave passes.
Blocks come in various sizes and dimensions. The sides of the blocks have a two-step profile so that when assembled into a mat they have a staggered configuration, which provides lateral interlocking. All sides are tapered and beveled. Each concrete block has two cable ducts to accept the assembly cable. The assembly cable can be made of polyester, galvanized steel, or stainless steel. Cabling the units together makes the protective covering far more resistant to disturbance by wave activity than individual, unconnected units of the same size.
30% DESIGN SUBMITTAL Page 16 of 51

SECTION 227 63RD STREET “HOTSPOT” MIAMI BEACH
The mats are made to articulate to accommodate vertical and horizontal curves, or undulations in the surface the mats are laid on (Figure 3-5). The minimum radius of curvature for any of the mats, r = 2-ft. ABM’s have been laid on slopes as steep as 1V: 1H. The leading, seaward edge the ABM’s can be anchored using either a helical or duckbill style anchor.
The mats can be easily and accurately lowered gently into place, accomplishing in one operation what would take up to 10 times as much activity and time for the equivalent amount of conventional armor rock protection.
Figure 3-6. Installation of ABM's using a spreader bar (URS, 2001).
3.1.3 HISTORICAL EXAMPLE OF USING ARTICULATING BLOCK MATS IN MARINE APPLICATIONS
The Glades Road Wastewater Treatment Plant 36-inch outfall in Boca Raton, Florida was built in the 1960’s. It is approximately 1 mile long, is aligned perpendicular to the shoreline about 1 mile north of the Boca Raton Inlet and discharges to the Atlantic Ocean roughly 90 ft below the surface. Although, the pipeline has been in place and in service nearly 25-years without movement or scour, visual surveys in 1971, 1984, and 1989 revealed some exposed segments with inadequate protection against damage from a category 4 hurricane, which in that area would generate a wave 27 ft high. One exposed reach of pipeline was in the area of a coral reef running parallel to the shoreline, about 1,600-2,700 ft from shore. After evaluating several alternatives, Armortec ABM’s were placed to cover a 1,100 ft long reach of exposed pipeline.
The individual concrete armor units of the mat are 17.4 in. by 15.5 in. by 9 in. thick and weigh 130 lb (dry weight). The units were cabled together into flexible 8 ft by 20 ft mats, draped side-by-side to form a continuous 20 ft wide covering, centered over the pipe in each area of the affected pipe sections. Only one layer of matting was used.
The armor-mat system was installed on the first exposed reach during the summer of 1992--- just a few weeks before Hurricane Andrew, a category 4 hurricane, hit south Florida. The track of the storm was approximately 50 miles south of Boca Raton and hurricane-force winds and waves subjected the outfall to a test very close to design conditions. Surveys after the storm showed that the mats and pipeline beneath them exhibited no damage. All mats were in place after the storm had passed. Farther offshore, however, protective armor rock installed in the late 1960's was completely dispersed. The force of Hurricane Andrew uncovered additional sections of the pipe.
30% DESIGN SUBMITTAL Page 17 of 51

SECTION 227 63RD STREET “HOTSPOT” MIAMI BEACH
The project team successfully covered these areas of pipeline with additional mats in 1993, making Boca Raton the first outfall system in the U.S. to use armor block mats a protect a pipeline of this size. The total cost to place mats along a total of 1,920 ft was just under $600,000. Because there were two mobilizations one year apart, the cost was slightly higher than it would have been if all the matting were placed during a single mobilization.
3.2 Combining Reefballs and Concrete Mats (RBAM)
Several options have been explored to connect the reefballs to the ABM, the combination of which will be called an RBAM. A couple of options under evaluation include use of reinforcement hoops and grouting them into the voids of the ABM, and connecting the units to the ABM by connecting to the cables used to construct the mat. The most popular option at this 30% design phase is to cast the reefballs directly on the ABM, allowing the concrete at to penetrate the matrix. To add to the interlocking, the ABM’s will be placed upside down, utilizing the chamfer of the blocks to create a wedge interlock. More research will be conducted on this topic for the 100% design. Figure 3-7 and 3-8 show typical configurations of the RBAM unit.
Figure 3-7. Typical RBAM unit profile on a flat incline.
Figure 3-8. Typical RBAM unit in plan view.
30% DESIGN SUBMITTAL Page 18 of 51

SECTION 227 63RD STREET “HOTSPOT” MIAMI BEACH
3.3 SMART Structure Configuration
The SMART matrix was configured to create “essentially” a shore-parallel segmented offshore reef (Figure 3-9). By using multiple rows (in the cross-shore) with appropriate spacing, the structure acts as a broad-crested breakwater, improving wave interaction, forcing wave attenuation or breaking. An additional benefit is that it uses much less material than traditional broad-crested offshore rubble breakwaters. The SMART matrix is designed to limit offshore migration of sand by providing a barrier to bedload movement and reduce the formation of rip currents. The SMART is a highly porous, self-limiting structure, allowing longshore sediment transport processes to occur landward of the structures abet at a reduced rate.
Figure 3-9. Sample plan view of SMART structure layout.
At 63rd Street, the objective of the SMART is to retain sand at the southern terminus of the beach fill. It is anticipated that sand will enter the SMART project site from the north and stabilize, providing a period of reduced feed rates to the adjacent downdrift beaches. Once the area behind the SMART structure has reached equilibrium, it will start bypassing sand to the downdrift beaches at the same rate occurring before the installation of the SMART. The bypassing will occur behind the structure, running mostly parallel to the beach, minimizing the loss of sand offshore.
Several factors contribute to the sand retention capabilities of the SMART structure. Foremost, it acts to create a more stable ocean bottom by reducing wave energy incident the beach through wave attenuation, thus reducing induced currents, increasing sedimentation and reducing scour. The SMART also creates a resistance to currents moving along the shoreline that carry suspended sands offsite. The bottom, sediment-carrying currents will be slowed, or rather redirected to the surface, by the introduction of the artificial reef structures. Spacing these units in the appropriate matrix creates an increased flow resistance on the sea bottom, increasing the boundary layer, and thus decreasing the flow velocities near the bottom allowing precipitation. It is intended that the introduction of the SMART will also increase the holding capacity of the project site by providing a shelf, or bathtub effect.
30% DESIGN SUBMITTAL Page 19 of 51

SECTION 227 63RD STREET “HOTSPOT” MIAMI BEACH
3.4 Stability Analysis For SMART Structure
3.4.1 INTRODUCTION
This section of the report presents the results of a stability analysis performed for the proposed submerged artificial reef offshore breakwater at the 63th Street Hotspot. The purpose of the proposed structure is to reduce the wave energy reaching the shoreline in this area, and to stabilize the sandy beaches landward of the breakwater.
As the use of reefballs for breakwaters is a new technology, only a limited amount of hydraulic stability experimentation has been previously conducted. The stability results presented in this section of the report is based in part on 2-D wave flume stability tests of reefball units performed by Dr. Lee Harris at Florida Institute of Technology (FIT) in Melbourne, Florida. These 2-D physical model investigations were used to determine the magnitude of the waves necessary to create movement (instability) of the units. In addition to these hydraulic tests, FIT also conducted wind tunnel tests to determine appropriate drag coefficients for reefballs. These results were combined with an analytical Morison Equation approach to determine forces and moments on these submerged structures.
3.4.2 HYDRODYNAMIC LOAD - WAVE FORCE CALCULATIONS
The goal of this analysis is to derive a total force the reefballs will be subjected to given a local wave height, period, and direction. Morrison et al. (1950) derived the most widely accepted method of determining the forces on small bodies exposed to wave action. Reefballs, which are small relative to wavelength, are subjected to both inertial and drag forces. Inertia force is generated as water particles, which carries momentum, passes around the body accelerating then decelerating. The body, in this case the reefball, has to do work on the fluid. The drag force component of the total force is the caused by the wake region on the “downstream” side of the reefball. The wake is a region of low pressure compare to the high pressure fronting the pile, thus an instantaneous pressure differential occurs as velocity vectors reverse every half-cycle of the wave. In a wave field, both drag and inertial forces occur and vary continuously with time.
The Morison Equation is the sum of these forces and is given as:
Equation 3-1 UUACtuACf DDIMw +
∂∂
=
Where: f w = wave force, per unit length on the piling CM = inertial coefficient, according to API (1993) = 1.6 AI = ρπD2/4
∂u/∂t = local acceleration D = “diameter” of the reefball
30% DESIGN SUBMITTAL Page 20 of 51
SECTION 227 63RD STREET “HOTSPOT” MIAMI BEACH
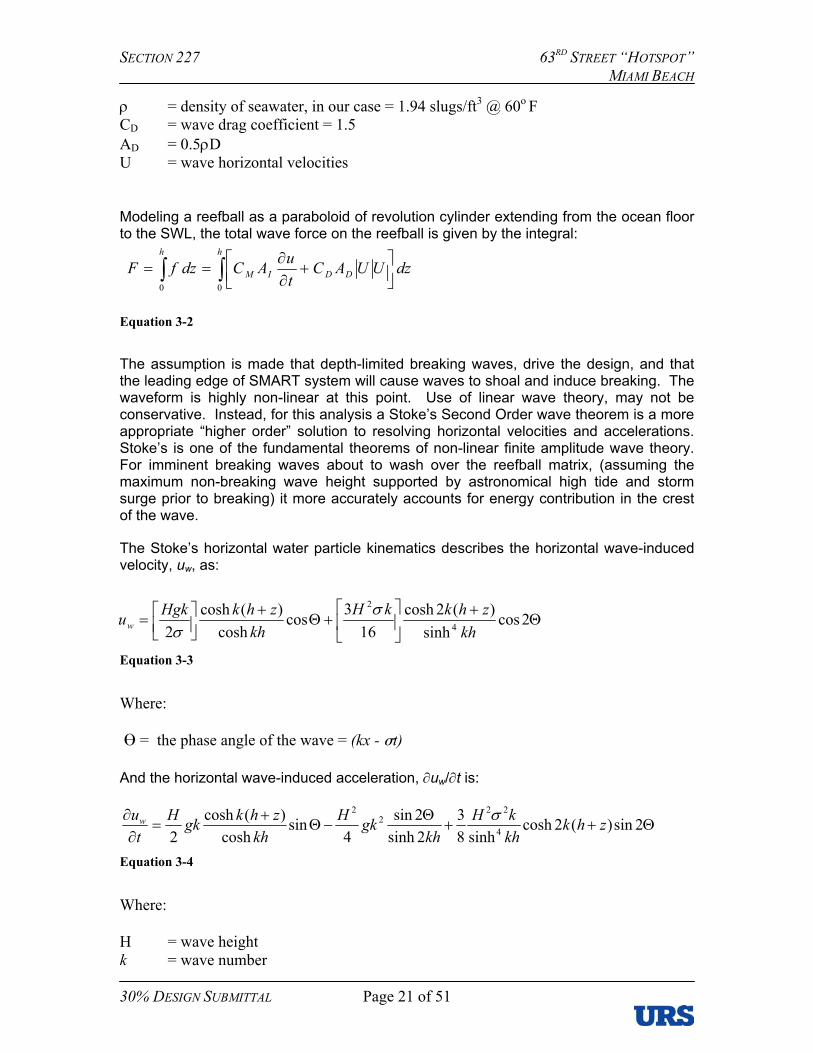
ρ = density of seawater, in our case = 1.94 slugs/ft3 @ 60o F CD = wave drag coefficient = 1.5 AD = 0.5ρD U = wave horizontal velocities Modeling a reefball as a paraboloid of revolution cylinder extending from the ocean floor to the SWL, the total wave force on the reefball is given by the integral:
dzUUACtuACdzfF
h
DDIM
h
∫∫
+
∂∂
==00
Equation 3-2
The assumption is made that depth-limited breaking waves, drive the design, and that the leading edge of SMART system will cause waves to shoal and induce breaking. The waveform is highly non-linear at this point. Use of linear wave theory, may not be conservative. Instead, for this analysis a Stoke’s Second Order wave theorem is a more appropriate “higher order” solution to resolving horizontal velocities and accelerations. Stoke’s is one of the fundamental theorems of non-linear finite amplitude wave theory. For imminent breaking waves about to wash over the reefball matrix, (assuming the maximum non-breaking wave height supported by astronomical high tide and storm surge prior to breaking) it more accurately accounts for energy contribution in the crest of the wave.
The Stoke’s horizontal water particle kinematics describes the horizontal wave-induced velocity, uw, as:
Θ
+
+Θ
+
= 2cos
sinh)(2cosh
163cos
cosh)(cosh
2 4
2
khzhkkH
khzhkHgkuw
σσ
Equation 3-3
Where: = the phase angle of the wave = (kx - σt) And the horizontal wave-induced acceleration, ∂uw/∂t is:
Θ++Θ
−Θ+
=∂
∂ 2sin)(2coshsinh8
32sinh2sin
4sin
cosh)(cosh
2 4
222
2
zhkkhkH
khgkH
khzhkgkH
tuw σ
Equation 3-4
Where: H = wave height k = wave number
30% DESIGN SUBMITTAL Page 21 of 51
SECTION 227 63RD STREET “HOTSPOT” MIAMI BEACH
σ = angular frequency 3.4.3 MODIFICATION TO REEFBALL DIAMETER DUE TO MARINE GROWTH
Drag forces acting on a reefball are a function of projected area the greater the area the higher the force. API RP-2A recommends that a thickness of marine growth be applied to the outside of a structural element. For this project a “marine growth coating” thickness of 38 mm (1.5 in) was used in the aforementioned calculations.
3.4.4 SELECTION OF APPROPRIATE DESIGN VALUES OF COEFFICIENTS
No set values of CM, or CD are universally accepted among certifying agencies, companies, or researchers. American Petroleum Institute (RP – 2A, 1993, C.3.2.7) suggests the use of the Morison Equation with typical values of CM = 1.6 and CD = 0.65 for smooth cylinders, and CM = 1.2 and CD = 1.05 for rough cylinders. Dean (1984) recommends using a CM = 1.33. Values of CD often vary according to Reynold’s Number and Kuelegan-Carpenter Parameter. Most experimental and prototype data for which drag and inertial coefficients have been generated is for circular cross-sections or spheres. A reefball is a hybrid of the two. It is also “leaky” which tends to reduce the added mass effects. Drag and inertial coefficient data for reefballs is sparse. Since there is little published data on values for CM for complex three-dimensional shapes such as artificial reef modules, it is necessary to make an estimation.
The coefficient of inertia is based in the size and shape of the object. CM is always greater than or equal to one. A general equation for CM is given below (Dean), where km is the added mass term whose value is determined by the shape of the object:
mm kC += 1
A widely used value for km is 1 for an object with a circular cross section.
Florida Institute of Technology conducted wave and wind tunnel tests to determine values for CD. From these results, two different values for CD were determined. In shallow water (10 to 30 feet) where the water velocities are large, CD = 1.2. For deeper water, the CD = 1.0.
The coefficient of drag is highly dependent on the surface roughness. The increased roughness due to biological growth on the reefball unit will cause the coefficient of drag to increase, consequently increasing the drag force. To account for this, CD was increased to 1.5.
For this analysis, a conservative approach was taken whereby the upper limit of both coefficients was used, CD = 1.5 and CM = 1.6.
30% DESIGN SUBMITTAL Page 22 of 51

SECTION 227 63RD STREET “HOTSPOT” MIAMI BEACH
3.4.5 SELECTION OF DESIGN WAVE FOR STRUCTURAL STABILITY
Along any coastal structure, breaking waves exist. At what water depth a given wave will break is a function of the wave steepness and slope of the local bathymetry. Weggel defined depth-limited breaking wave criteria (which was later converted into nomographs in the 1984 SPM) as:
dWhere: bHb ( )2/
1gTaHb
b
−=
15.19
19
)0.1(56.1)1(75.43
−−
−
+=
−=m
m
ebea
Equation 3-5
Where: db = depth at which the wave will break Hb = breaking wave height Making the assumption the foreshore slope is 1V: 100H, the depth of the water at the toe of the structure is 11.70 ft (including HAT and storm surge). Table 3-1 shows the range of depth-limited breaking wave heights, for a range of wave periods, T = 3.0-9.0 sec, that may break at the toe of the SMART breakwaters.
Table 3-1. Depth limited breaking wave, 1V: 100H slope.
T (s) 6.0 8.0 10.0 12.0 14.0 16.0 18.0m 0.01 0.01 0.01 0.01 0.01 0.01 0.01a 7.571 7.571 7.571 7.571 7.571 7.571 7.571b 0.856 0.856 0.856 0.856 0.856 0.856 0.856
Hb (ft) 9.30 9.60 9.75 9.83 9.88 9.91 9.93db (ft) 11.70 11.70 11.70 11.70 11.70 11.70 11.70
This data was used to evaluate the survivability of the structure, discussed in Section 3.5.
Also examined were the waves that will be forced to break on the structure. It is assumed the “apparent” slope of the seaward face of the SMART breakwater is 1V: 2H (using a Bay Ball at the toe and Goliath Ball shoreward). Table 3-2 shows the Hb = 9.4 ft, T = 9.0 sec will break on top of the structure during extreme wave conditions.
Table 3-2. Depth limited breaking wave, 1V: 2H slope.
T (s) 3.0 4.0 5.0 6.0 7.0 8.0 9.0 m 0.5 0.5 0.5 0.5 0.5 0.5 0.5 a 43.747 43.747 43.747 43.747 43.747 43.747 43.747 b 1.560 1.560 1.560 1.560 1.560 1.560 1.560
Hb (ft) 5.20 6.66 7.66 8.34 8.81 9.15 9.40 db (ft) 6.70 6.70 6.70 6.70 6.70 6.70 6.70
30% DESIGN SUBMITTAL Page 23 of 51

SECTION 227 63RD STREET “HOTSPOT” MIAMI BEACH
3.4.6 BREAKING WAVE CLASSIFICATION AND FACTOR OF SAFETY
Wave impact loads are a concern with “shallow water” breaking waves. For breaking waves, the magnitude of the impact is a function of the specific type of breaking wave. The primary categories of breaking waves are spilling, plunging, surging and collapsing.
Iribarren described the Surf Similarity Parameter (also known as the Iribarren Number or Breaking Parameter) and is defined as:
Equation 3-6
22tan
gTHπαζ =
Where:
ς < 0.5, spilling wave
0.5 <ς <3, plunging wave
ς ≅ 3.0-3.5, collapsing wave
ς > 3.5, surging wave
Table 3-3 indicates that the majority of the waves breaking at the toe of the structure will be of a spilling type.
Table 3-3. Breaking wave properties in front of the structure.
Wave Height, Hs (ft) 6.36 8.23 9.54 10.43 11.05 11.50 11.83 Wave Period, T (sec) 3.0 4.0 5.0 6.0 7.0 8.0 9.0
Slope Rise (V) 1 1 1 1 1 1 1 Slope Run (H) 20 20 20 20 20 20 20
α 2.86 deg 2.86 deg 2.86 deg 2.86 deg 2.86 deg 2.86 deg 2.86 degξ 0.135 0.158 0.183 0.210 0.238 0.267 0.296
Type Spilling Spilling Spilling Spilling Spilling Spilling Spilling For waves breaking on the structure, Table 3-4 shows the majority of the waves will be plunging, which is the most severe type of breaking wave.
Table 3-4. Breaking wave properties on the structure.
Wave Height, Hs (ft) 5.20 6.66 7.66 8.34 8.81 9.15 9.40 Wave Period, T (sec) 3.0 4.0 5.0 6.0 7.0 8.0 9.0
Slope Rise (V) 1 1 1 1 1 1 1 Slope Run (H) 2 2 2 2 2 2 2
α 26.57 deg 26.57 deg 26.57 deg 26.57 deg 26.57 deg 26.57 deg 26.57 degξ 1.490 1.754 2.045 2.352 2.669 2.994 3.323
Type Plunging Plunging Plunging Plunging Plunging Plunging Collapsing
30% DESIGN SUBMITTAL Page 24 of 51

SECTION 227 63RD STREET “HOTSPOT” MIAMI BEACH
A factor of safety (FS) is applied to account for the wave impact forces from these types of breaking waves, and other unknowns and unforeseen circumstances, which may affect the analysis. Although several assumptions have been made thus far, it is necessary to add a general factor of safety to the analysis. For this analysis an appropriate FS = 1.35, based on recommendations of American Petroleum Institute RP-2A.
The Factor of Safety is inserted into the Morison Equation resulting in:
wavetotal ff ×= 35.1
3.5 Structural Resistance - Restoring Forces
The resisting forces are what keep the submerged object from moving due to the wave induced forces. An object can either slide or overturn. For the RBAM, with frontal exposure to wave loading and nearly 25-ton of dry weight (14-ton submerged weight) no sliding will occur.
Of greater concern in the analysis is the potential for the leading (seaward) edge of the RBAM to lift and curl about a point shoreward of the leading edge. Primarily the submerged weight of the RBAM system resists this overturning moment.
3.6 Results of Hydraulic Stability Analysis
Table 3-5 (and Exhibit 1) shows the RBAM will remain stable even for the most severe wave case generated during the 20-year hurricane surge level.
Table 3-5. Hydraulic stability results.
Wave Height (ft)
Maximum Wave Period Sustained
Without Overturning
Maximum Wave Period Sustained With Double The Restoring Moment
6 21.9 18.7 8 17.4 14 10 14.1 5.7 12 11 4.9 14 5.8 4.5 16 5.1 4.3
It is to be understood that during the 100% design submittal a more robust structural analysis will be performed to account for lift forces and tangential drag. If during the future analysis a adequate factor of safety is not attained, A second line of defense to prevent overturning will be the inclusion of duckbill or helical anchors to resist uplift.
30% DESIGN SUBMITTAL Page 25 of 51

SECTION 227 63RD STREET “HOTSPOT” MIAMI BEACH
3.7 Resistance to Scour Potential
Whenever a “hard” structure rests on a sandy bottom, and waves and currents are present, potential for scour exists. When precast concrete artificial reef modules were originally proposed, one of the main concerns was scour. Reefballs by themselves were successfully placed on hard bottom in past projects without problems. For 63rd Street, the reefballs will be attached to ABMs. If scour occurs along the leading seaward edge of the mat “apron” its flexibility allows it to conform into the sea bottom
3.8 Hydraulic Stability of Individual Reefballs
A portion of the SMART designed with individual reefballs, which are not attached to the ABM’s. All of these individually placed units will be on the landward side of the fronting reef structures as short “stems” for several of the breakwater segments, and for the flanks. These reefballs will be jetted into the sand bottom using short sections of galvanized steel pipe, If hard bottom is encountered, they will be drilled and doweled with fiberglass rebar. It is anticipated the stability of these units may be increased due to the settling of the unit into the sand bottom. The water particle velocity due to the fluid traveling around the unit may cause sediments to erode from around and underneath the base of the unit, thus allowing the unit to settle into the bottom. Settling reduces the cross sectional area, thus reduce drag as well as creating the added resisting force of the sediments surrounding the modules
SECTION 4 SMART STRUCTURE FUNCTIONAL PERFORMANCE
The SMART offshore, segmented breakwater attenuates wave energy through processes of wave shoaling and breaking, increasing bottom friction and inducing turbulence, refraction, reflection, diffraction. The interactions of these processes are highly complex, and not well understood for a reef structure. However, for this analysis the most important wave attenuation process is energy dissipation through wave breaking. The primary goal of the SMART system is to significantly reduce the energy the beach is exposed to. As energy is a function of H2, reduce the wave height over the reef by 25% and the energy is reduced by 43%, reduce the wave height over the reef by 50% and the energy is reduced by 75%, and so on and so forth. As a general guideline, the breaking wave height ratio of Hb/Db = 0.78 is used, even though it may be conservative. The wave will shoal quickly on the leading edge of the reef, break and reform after it passes over the reef. At a certain threshold, dependent of water depth over the reef, a stable wave height will be attained. It is desired that this stable wave height have a low enough energy content to only minimally mobilize sediment behind the structure.
30% DESIGN SUBMITTAL Page 26 of 51

SECTION 227 63RD STREET “HOTSPOT” MIAMI BEACH
4.1 Functional Performance Projection
The goal of SMART is to significantly attenuate wave energy over a wide range of wave parameters and to stabilize the southern terminus of the alternative sediment source demonstration beach fill project. The project can be deemed successful if:
• The amortized cost of the SMART system is less expensive than subsequent beach renourishment projects and the interval between renourishments is significantly extended.
• The erosion rates in the area of the 63rd Street Hotspot decrease to marginal rates associated with stable beaches along the Dade County coastline.
• There are no impacts to adjacent shorelines associated with this Section 227 project.
• Beach utilization behind the project increases because of added value such as:
o A wider beach o A less energetic wave environment for swimmers o Recreational benefits associated with a reef environment
• Habitat enhancement for juvenile marine organisms and corals is realized.
4.2 SMART BREAKWATER WAVE ATTENUATION
Wave attenuation for the SMART system is a function of profile and plan geometry. Both relative submergence and cross-shore width are important factors in estimating functional performance. The following sections address these factors.
4.2.1 BREAKWATER PROFILE GEOMETRY
The main parameters used to describe the general geometry of a submerged breakwater are shown in Figure 4-1. These include the height of the structure = h, water depth at the toe of the structure = d, and the freeboard of the structure = F, where the freeboard is the difference between the height of a breakwater structure and the water depth at the seaward toe of the structure. The slope of the seaward face of the breakwater is tan θ, and the offshore slope of the bottom seaward of the structure is tan β = m, which is zero for a horizontal sea bottom.
30% DESIGN SUBMITTAL Page 27 of 51

SECTION 227 63RD STREET “HOTSPOT” MIAMI BEACH
water depth = d
freeboard = F
structureheight = h
crestwidth= B
structure base width
= h - d
still water level (SWL)
submergedbreakwaterstructure
bottom
Figure 4-1. Definition sketch for a submerged breakwater.
One of the most important parameters for the design and effectiveness of a breakwater is the degree of emergence or submergence. This can be expressed by three different dimensionless terms:
1. The degree of submergence = d/h; 2. The relative structure height = h/d; and 3. The relative freeboard to water depth ratio = F/d.
The degree of submergence is the ratio of the water depth to the height of the structure. For an emergent or subaerial structure, whose crest height exceeds the water depth, this ratio is less than one (d/h < 1.0), and for a submerged structure, this ratio is greater than one (d/h > 1.0).
The relative structure height, which is the ratio of the structure height to the water depth (h/d), also can be used as a dimensionless parameter to express the degree of emergence or submergence of a breakwater. The relative height has a value that is less than one (h/d < 1.0) for a submerged structure, and greater than one (h/d > 1.0) for a subaerial or emergent breakwater.
The freeboard is defined as the structure height minus the water depth,
Equation 4-1 F = h - d
Where F is the freeboard, h is the height of the structure above the bottom, and d is the water depth at the seaward toe of the structure. An emergent or subaerial breakwater has a positive freeboard value, and a submerged breakwater has a negative value for the freeboard. The dimensionless parameter for the relative freeboard is the freeboard ratio, which is defined as the freeboard divided by the water depth.
30% DESIGN SUBMITTAL Page 28 of 51

SECTION 227 63RD STREET “HOTSPOT” MIAMI BEACH
With this definition of the freeboard ratio, an emergent or subaerial breakwater has a positive value for the freeboard ratio (F/d > 1.0), while a submerged breakwater has a negative value for the freeboard ratio (F/d < 1.0).
These three dimensionless quantities, d/h, h/d, and F/d, indicate the relative height of the breakwater compared to the water depth, and are used to determine the magnitude of the wave and current forces on the breakwater, and the effectiveness of the structure in attenuating wave energy. A classification scheme is formulated later in this study to quantify these relationships.
4.2.2 RELATIVE CREST HEIGHT
Another important dimensionless parameter used for determining the interaction between the waves and a breakwater structure is the freeboard divided by the wave height, which can be expressed as:
Equation 4-2 FH
h dH
hH
dH
=−
= −
Where H is the height of the wave, measured from the bottom of the trough to the top of the crest. The use of the wave height in this ratio provides a direct comparison between the height of the structure above or below the still water level, and the height of the waves impacting the structure. Note that this ratio is equal to the ratio of the structure height to incident wave height minus the ratio of the water depth to the incident wave height.
For a submerged structure, the freeboard and freeboard ratios F/d and F/H all have negative values, and the structure is continuously overtopped by waves. The more submerged the structure is, the more negative the ratio of the freeboard to the wave height, and the interaction between the waves and the structure will decrease.
For an emergent structure that has a positive value of freeboard, F/H is also positive. When the ratio F/H is less than one (F/H <1.0), the structure is easily overtopped by the waves, and significant wave transmission past the structure by overtopping occurs (Ahrens, 1987). When F/H is greater than one (F/H >1.0), the structure height is at least one wave height above the still water level, and most of the wave energy is absorbed, and attenuated by the structure. Some wave energy still may be transmitted through the structure if the structure is porous, and some wave energy may be transmitted over the structure by wave overtopping (U.S. Army Corps of Engineers, 1984).
4.2.3 WAVE ATTENUATION FORMULAS
The primary purpose of a breakwater is to reduce the wave energy in its lee. The term “wave transmission” is used in reference to the wave energy that does travel past a breakwater, either by passing through and/or by overtopping the structure (U.S. Army Corps of Engineers, 1984). The wave energy that is attenuated in the lee of the breakwater is dissipated by the structure.
30% DESIGN SUBMITTAL Page 29 of 51

SECTION 227 63RD STREET “HOTSPOT” MIAMI BEACH
The effectiveness of a breakwater in attenuating wave energy can be measured by the amount of wave energy that is transmitted past the structure. The greater the wave transmission coefficient, the less the wave attenuation. Wave transmission is quantified by the use of the wave transmission coefficient,
Equation 4-3 KHHt
t
i
=
Where Kt is the wave transmission coefficient, Ht is the height of the transmitted wave on the landward side of the structure, and Hi is the height of the incident wave on the seaward side of the structure (U.S. Army Corps of Engineers, 1984). Ahrens (1987) defines the wave transmission coefficient differently, using the wave height on the landward side of the structure that would occur in the absence of the structure, in place of the incident wave height on the seaward side of the structure, so that
Equation 4-4 KHHt
t
c
=
Where Hc is the wave height measured at the same location as Ht, but without the breakwater present.
For submerged breakwaters and artificial reefs, the greater the submergence, the less the wave energy will impact the structure, and the less effective the structure will be for wave attenuation. The Shore Protection Manual (U.S. Army Corps of Engineers, 1984) presents numerous graphs of empirical data from wave tank tests that can be used to determine wave transmission coefficients.
Ahrens (1987) presents an empirical formula for subaerial breakwaters, where the crest of the structure is above the still water level and the ratio of freeboard to the incident wave height is greater than one (F/H > 1.0) as follows:
Equation 4-5 KH A
L D
t
n
=
+
10
1050
0 592
.
..
Where:
H = incident wave height
A = cross sectional area of the breakwater
L= local wavelength
Dn50 = nominal armor unit diameter of the median size (50%) armor unit given by:
Equation 4-6
31
5050
=
a
an
MD
ρ
30% DESIGN SUBMITTAL Page 30 of 51

SECTION 227 63RD STREET “HOTSPOT” MIAMI BEACH
Where:
Ma50 = the mass of the median size armor unit
ρa = mass density of the armor material.
Ahrens (1987) presents an empirical formula for “reef breakwaters” where the ratio of the freeboard to the incident wave height is less than one (F/H < 1.0), as
Equation 4-7 Khd
Ad L
FH
AD L
t
n
=
+
+
10
10 0 529 0 005511 188 0 261 3 2
502
.
. exp . .. . /
The dimensionless terms in parentheses in the denominator are the relative structure height (h/d) the ratio of the structure cross-sectional area to the product of the water depth and wavelength (A/dL), the relative freeboard (the ratio of the freeboard to the incident wave height, F/H which is the most influential variable according to Ahrens, 1987), and the ratio of the breakwater cross-sectional area raised to the 1.5 power divided by the product of the median armor unit diameter squared and the wavelength.
Seabrook (1997) performed extensive physical modeling tests of submerged breakwaters, using various depths of submergence, crest widths, water depths, and incident wave conditions. From that data he developed the following design equation for wave transmission at submerged rubble mound breakwaters:
Equation 4-8 ( ) ( )
+
−−= −
5050
/09.1/65.0 067.0047.01nn
BHHFt BD
FHLDBFeK
When using equations 5 and 7 the terms containing the nominal armor unit diameter, Dn50 are often found to be negligible compared to the other terms. This is especially true for Seabrook’s relationship in Equation 8, as the freeboard approaches zero as the structure crest approaches the still water level. This formula was derived from wave tank physical model tests using rubble mound armor stone, not reefball units, so that the results provide more of a design guidance and comparison rather actual expected wave transmission. It does provide a case for the need for physical model tests for reefball wave transmission
4.2.4 ESTIMATED FUNCTIONAL PERFORMANCE - WAVE ATTENUATION OF SMART
Reefball units of various sizes and weights are to be used on the SMART breakwater and are shown in the Table 4-1 below:
30% DESIGN SUBMITTAL Page 31 of 51

SECTION 227 63RD STREET “HOTSPOT” MIAMI BEACH
Table 4-1. Reefball sizes for use in SMART Breakwaters.
Unit Type Base Width (diameter, ft)
Crest Height(ft)
Approx. Weight(lbs)
Goliath Ball_E 6.0 6.0 9800
Goliath Ball_D 6.0 4.5 6200
Goliath Ball_C 6.0 4.5 5000
Goliath Ball_B 6.0 4.5 3700
Bay Ball_Solid 4.0 3.0 2400
Wave transmission coefficients using Seabrook’s Formula were calculated for the design of the SMART breakwater because Ahren’s relationship predicting transmission coefficients that did not vary much with varying the number of rows of units or with varying wave conditions. Seabrook’s seems more appropriate. The SMART design incorporates RBAMs placed offshore in shore-normal rows. The mean ABM height (reefball and 6-inch thick ACM) is 5.0 ft and placed in water depth of 6 ft so that the freeboard will be = F = -1 ft (MLW) for the “normal” conditions. Calculations were performed using 4, 5, and 6 rows of reefball units. The results are given Table 4-2 below.
Table 4-2. Wave transmission coefficients using Seabrook Formula.
Case H (feet)
T (sec)
F (ft) 4 rows 5 rows 6 rows
“Normal” 4.0 8.0 -1.0 0.27 0.25 0.24 Nor’easter – 10 yr 6.0 9.0 -4.6 0.53 0.51 0.49 Nor’easter – 20 yr 6.0 9.0 -4.8 0.54 0.52 0.50 Southerly – 10 yr 4.0 8.0 -5.7 0.67 0.66 0.65 Southerly – 20 yr 4.0 8.0 -6.7 0.72 0.71 0.70
The values in Table 4-2 do not show much variability whether 4, 5, or 6 rows of reefballs were used. Under “normal” conditions wave heights are reduced at least 70% for the given wave conditions. Even under extreme water levels, the wave attenuation was over 30%. Given this preliminary finding the minimum width of the SMART breakwater will be set at 5 rows, which should provide sufficient wave attenuation for shoreline stabilization in the project area.
It is understood more elegant solutions exist regarding wave attenuation over reefs. One of the most widely accepted methods is that of Dally, Dean, and Dalrymple (1985). They proposed steady-state energy balance equation describing wave propagation over reef as:
30% DESIGN SUBMITTAL Page 32 of 51

SECTION 227 63RD STREET “HOTSPOT” MIAMI BEACH
Equation 4-9 ( ) [ ]
3
sinh2
6cos
+−=
∂
∂
kdTHC
ECECdx
EC fgsg
g ππ
ρκθ
Where:
E = wave energy Cg = group celerity
x = cross-shore coordination θ = wave direction
κ = empirical decay coefficient d = total water depth
H = wave height T = wave period
k = wave number ρ = density of water
g = gravity Cf = bottom friction coefficient
ECgs= energy flux of stable wave height
This equation and other advanced formulae, along with specific physical model experiments (if USACE will fund) will be utilized in the 100% design effort in order to more accurately tune the structure and predict its performance.
4.3 SMART Sand Retention
A second goal of the SMART system is to provide a physical barrier to sand moving as bedload. Cross-shore transport retardation is accomplished by using solid-base reefballs, which act as a barrier sand movement. The solid bases of these reefballs extend up to a maximum elevation of approximately 1.5-feet about the ABMs. The maze-like pathways in the interstitial corridors between adjacent reefballs increases the distance sand must travel to get beyond the reef by a factor of 1.5. The SMART system is self-limiting, unlike traditional relatively non-porous rubble mound emergent breakwaters. The upper portions of the reefballs are quite porous and induce turbulence. It is expected that if sand accretes in the lee, adjacent to shoreward side of the structure it will only do so up to the solid portions of the reefballs.
Also include is the designs are short, truncated “stems” placed leeward of several of the reef segments. These are designed to check flows along the shore side of several of the segments. It is hoped they will allow sand to accrete during typical wave conditions, thus adding some width
30% DESIGN SUBMITTAL Page 33 of 51
SECTION 227 63RD STREET “HOTSPOT” MIAMI BEACH
4.4 SMART Segmentation
The SMART system proposed is a segmented offshore breakwater. The breakwater is segmented primarily to allow the least amount of construction materials to protect the greatest reach of shoreline. It has been stated that the 63rd Street Hotspot tends to migrate between R44 and R46.3, or 2,300-ft of shoreline. The proposed SMART has approximately 1,600 linear feet of RBAMs, yet protects 1,800 linear feet of shoreline. To do this five, 50-ft gaps have been placed into the system. Chasten et. al. (1993) discuss the exposure ratio, which is defined as the ratio of the gap width to the sum of the breakwater length and gap width. The SMART system has an exposure ratio of 0.20. Prototype structures listed in TR-CERC-93-19, Table 2, page 25, list exposure ratio values ranging from 0.25 – 0.66. It was decided the SMART system should have smaller gaps than traditional offshore segmented breakwaters mainly because the structure is submerged and much more porous. The final gap width will be determined during a more robust analysis during the 100% design effort.
4.5 Operation and Maintenance
One of the benefits associated with the SMART system is that it has no anticipated maintenance requirements. It is advised that period maintenance inspections be performed. Being that the system is being design to maintain structural stability for a 50-year event, no actual maintenance in the true sense will be required. What may be required is future tuning of the structure. There is the distinct possibility that the system may retain too much sand. In this case a decision may be made to remove the individual reefballs to make the structure more leaky. The design allows for select reefballs to be removed from the ABMs (without disturbing the ABMs) to increase the number of gaps. It also allows for the individual spudded reefballs to be removed from the short “stems”. In both these cases divers can place an air bladder in the reefball, and lift it out of position. Some jetting may be needed if the reefball is heavily silted in.
SECTION 5 SMART STRUCTURE CONSTRUCTION
5.1 Installation Construction Methodology
The majority of the system uses mats with reefballs permanently mounted on the ABMs (heretofore referred to as RBAM). A typical RBAM is 40-ft x 8-ft and weighs approximately 30-ton. In addition there are also reefballs that are fitted and locked into the mat and are easily removable without a crane. Also, there are individual reefballs that are not mat-mounted. These will be used in the lee of the structure for the short shore-normal “stems” and will be individually installed.
At present there are two methods of installation that are being considered. Most likely the SOARB will be installed from sea. Being that structures will be placed in the surf zone, use of a spud barge was ruled out. A crane (approximately 150-ton) mounted on a jack-up barge will be used to place the RBAMs. Attempts will be made to minimize the need for diver-assisted placement, but it is anticipated divers will be utilized during some of the operations. In order to place each RBAM special custom fixtures will be designed during the 100% submittal phase, in order to facilitate placement. These fixtures will
30% DESIGN SUBMITTAL Page 34 of 51

SECTION 227 63RD STREET “HOTSPOT” MIAMI BEACH
include, but not limited to lifting frames, jetting devices, positioning jigs, and anchor installation systems.
The RBAMs will be assembled on shore, either adjacent to a navigable waterway or shipped via truck to dockside. From here they will be loaded onto a barge (most likely 150’ x 50’) and hauled to the site with a tug. It is estimated up to 18 RBAMs can be loaded on the barge and haul to sea. This is the estimated number of RBAMs that can be positioned in a single day (weather contingent).
A second installation method is to install the RBAMs from a land-based operation. This will be considered but is highly dependent on access, regulatory compliance, sand availability, installation time, and cost. A land-based operation will require special fixtures with floatation that allow the mats to be dragged off the beach using guide wires and tugs.
As part of the 100% design submittal a complete, detailed construction installation plan will be included.
5.2 Removal Method
In the event this Section 227 project is deemed to have serious adverse effects, the program requires the structures be removed. The fact that the majority of the reefballs are mat-mounted means that the RBAMs can be removed in a reverse operation of their installation. This is a much simpler operation then dissembling a traditional rubble mound, where individual pieces would need to be recovered. The RBAMs can be lifted by crane and loaded on a barge and hauled back into port. The mats may be silted in and will require jetting to loosen and remove them. The individual spudded reefballs will require divers to either connect a lifting sling to reefball or divers can place an air bladder in the reefball, and lift it out of position. Again, some jetting may be needed if the reefball is heavily silted in.
5.3 Materials and Material Options
Both the reefballs and the blocks in the ABMs are constructed from concrete. Concrete used in a marine environment, which must provide structural strength, abrasion resistance, and encourage marine growth; a successful concrete mix design must provide the following:
1) Low enough pH for the biological life in the area 2) Proper surface texturing 3) Minimal breakage 4) Absence of toxic admixtures (and biologically active compounds) 5) Legal requirements
30% DESIGN SUBMITTAL Page 35 of 51

SECTION 227 63RD STREET “HOTSPOT” MIAMI BEACH
These must be achieved with a given curing time, curing temperatures, handling requirements, de-molding timing requirements, and cost of particular components. For the 63rd Street project, consideration in the 100% design will be given to the following:
1) Inclusion of 50-lbs of Microsilica per yard of concrete 2) Possible use of new proprietary Microsilica like products (NuCem) 3) Minimum Type II Portland cement content (Aids in lower pH) 4) Potential use of high density aggregates 5) Possible use of fiber reinforced concrete 6) Need for aggregate exposed surface texture
5.3.1 TYPICAL CONCRETE SPECIFICATION
The final concrete specification to be used for the reefballs and ABM, will include language whereby concrete proportioning and mixture products to be used to produce a concrete, which, when hardened will produce a required strength, permeability, and resistance to weathering in a reef environment.
5.3.2 TYPICAL STANDARD AND REFERENCES
Typical concrete standards and reference will include:
A. ACI-211.191-Standard Practice for Selecting Proportions for Normal, Heavyweight, and Mass Concrete.
B. ASTM C 260- Standard Specifications for Air-Entraining Admixtures for Concrete.
C. ASTM-C 1116 Type III- Standard Specifications for Fiber Reinforced Concrete or Shotcrete.
D. ACI - 305R -91- Hot Weather Concreting.
E. ACI - 306R -88- Cold Weather Concreting.
F. ACI - 308- Standard Practice for Curing Concrete.
G. ASTM C 618-Fly Ash For Use As A Mineral Admixture in Portland Cement Concrete.
H. ASTM C 494-92- Standard Specifications for Chemical Admixtures for Concrete.
I. ASTM C 1202-91- Electrical Indication of Concrete's Ability to Resist Chloride Ion Penetration.
J. ASTM C 33- Concrete Aggregates.
30% DESIGN SUBMITTAL Page 36 of 51

SECTION 227 63RD STREET “HOTSPOT” MIAMI BEACH
K. ASTM C 94- Ready Mix Concrete.
L. ASTM C 150-Portland Cement.
M. ACI 304- Recommended Practice For Measuring, Mixing, Transporting and placing concrete.
N. ASTM C 39 (Standard Specifications For Compressive Testing)
O. ASTM C-1240-93 (Standard Specifications for Silica Fume Concrete)
5.3.3 PRODUCTS
The following list of products are anticipated to be used in the concrete for reefballs and ABMs.
1) Portland Cement: Shall be Type II and conform to ASTM C-150
2) Fly Ash: Shall meet requirements of ASTM C-618, Type F. And must be proven to be non-toxic as defined by the Army Corps of Engineers General Artificial Reef Permits. Fly Ash is not permitted in the State of Georgia and in most Atlantic States. (In October, 1991, The Atlantic States Marine Fisheries Commission adopted a resolution that opposes the use of fly ash in artificial reefs other than for experimental applications until the Army Corps of Engineers develop and adopt guidelines and standards for use.)
3) Water: Shall be potable and free from deleterious substances and shall not contain more that 1000 parts per million of chlorides or sulfates and shall not contain more than 5 parts per million of lead, copper or zinc salts and shall not contain more than 10 parts per million of phosphates.
4) Fine Aggregate: Shall be in compliance with ASTM C-33.
5) Coarse Aggregate: Shall be in compliance with ASTM C-33 #8 (pea gravel). (Up to 1 inch aggregate can be substituted with permission from the mold user.) Limestone aggregate is preferred if the finished modules are to be used in tropical waters.
6) Concrete Admixtures: Shall be in compliance with ASTM C-494.
7) Required Additives: The following additives shall be used in all concrete mix designs when producing the Reef Ball Development Group's product line:
a. High Range Water Reducer: Shall be ADVA Flow 120 or 140.
30% DESIGN SUBMITTAL Page 37 of 51

SECTION 227 63RD STREET “HOTSPOT” MIAMI BEACH
b. Silica Fume: Shall be Force 10,000 Densified in Concrete Ready Bags as manufactured by W.R. Grace. (ASTM C-1240-93)
c. Air-Entrainer: ONLY IF ADVA is not used: Shall be W.R. Grace Darex II (ASTM C-260)
d. Optional Additives: The following additives may be used in concrete mix designs when producing Reef Ball Development's product line:
i. Fibers. Shall be either Microfibers as manf. by W.R. Grace, or Fibermesh Fibers (1 1/2 inches or longer)
ii. Accelerators: Any Non- Calcium Chloride or W.R. Grace Daracell (ASTM C-494 Type C or E)
iii. Retarders: Shall be in compliance with ASTM-C-494-Type D as in W.R. Grace Daratard
iv. Prohibited Admixtures: All other admixtures are prohibited.
5.3.4 TRIAL MIX DESIGN
The intent of this section is to provide a trial mix design for concrete to be used at 63rd Street. It is anticipated the mix design will be:
Table 5-1. Trial mix Design
One Cubic Yard One Cubic Meter Cement: 600 lbs. (Min.) 356 kg
Aggregate: 1800 lbs. 1068 kg Sand: 1160 lbs 688 kg Water: 240 1bs. (Max.) 142 kg
Force 10K: 50 lbs 30 kg Grace Microfibers .25 bag .3 bag Adva Flow 120 or
Adva Flow 140
3.5-5 ounces per 100 lbs cementor
6-10 ounces per 100 lbs cement 1
5.3.5 CONCRETE STRENGTH REQUIREMENTS
Compressive strengths for reefballs shall be tested in accordance with ASTM C 39. Compressive strengths shall reach a minimum of the following table at the time of use of at least:
30% DESIGN SUBMITTAL Page 38 of 51

SECTION 227 63RD STREET “HOTSPOT” MIAMI BEACH
Table 5-2. Concrete compressive strength requirements.
Super/Ultra/Reefball (psi) Pallet Ball(psi)
Floating Deployment 8,500+ 7,000+ Barge Deployment 7,000+ 5,500+
To remove from mold 750+ 750+ To lift from base 1,500+ 1,200+
The blocks for the ABMs will be manufactured at a local block plant. The minimum 28-day compressive strength will be 4,000 psi.
5.3.6 CABLING AND ANCHORAGE
At this time it is anticipated that the assembly cable will be made of galvanized steel cable. Polyester cable will also be considered. However, pending final design it appears that each 8-ft x 40-ft reefball/mat may weigh approximately 30-tons, which may exceed capacity of most polyester cables or be prohibitively expensive. While corrosion is often a concern using galvanized cable in a marine application, these cables will be submerged their entire life. Therefore, the cable can be sized to account for corrosion.
Anchors along the leading edge, used to increase the factor of safety against the mat lifting in extreme events, will be either a galvanized helical anchor, or a Manta Ray style duckbill anchor. It is anticipated that a single anchor will be used at the cable attachment point between two adjacent mats, again, only along the leading edge.
5.4 Preliminary Construction Cost Estimate
The following cost estimates are provided for the fabrication, installation, and removal of the SMART system. These are only preliminary at this time, as several factors can affect the final cost estimate, such as future material costs, permitting constraints, fuel costs, equipment availability, etc. It should be understood that the SMART is a scalable system. Being that it is unknown what the available fund for the project are the project can either be scaled up or scaled down. Based on the estimate below the cost of the project is $1250/LF. A detailed cost estimate will be provided at the time of the 100% design submittal.
30% DESIGN SUBMITTAL Page 39 of 51

SECTION 227 63RD STREET “HOTSPOT” MIAMI BEACH
5.4.1 FABRICATION AND INSTALLATION
Table 5-3. Construction and installation cost estimate.
Item Description Quantity Unit Unit Price Subtotal 1. Mobilization LS $200,000 $ 200,000 2. ABM Fabrication 64,000 SF $5 $ 320,000 3. Reefball Fabrication 1500 EA $400 $ 600,000 4. Fixture Fabrication 2 EA $25,000 $ 50,000 5. RBAM Installation 200 EA $2000 $ 400,000 6. Indiv. RB Installation 100 EA $250 $ 25,000 7. Anchor Installation 200 EA $400 $ 80,000 8. Demobilization EA $50,000 $ 50,000 Subtotal $1,725,000
9. Bonding 5% $ 86,250 10. Contingency 15% $ 258,750 11. Profit 10% $ 172,500
Total $2,242,000 5.4.2 REMOVAL
The following is an estimate of the removal and disposal of the SMART system.
Table 5-4. SMART system removal cost estimate.
Item Description Quantity Unit Unit Price Subtotal 1. Mobilization LS $125,000 $ 125,000 2. RBAM Removal 200 EA $1500 $ 300,000 3. Indiv. RB Removal 100 EA $250 $ 25,000 4. Anchor Removal 200 EA $200 $ 40,000 5. Demobilization EA $50,000 $ 50,000 6. Disposal LS $50,000 $ 50,000 Total $ 590,000
30% DESIGN SUBMITTAL Page 40 of 51

SECTION 227 63RD STREET “HOTSPOT” MIAMI BEACH
SECTION 6 100% DESIGN PLANS AND SPECS COST ESTIMATE
TIME/COST/TASK PROPOSAL FOR 100% PLANS AND SPECIFICATIONS FOR SECTION 227 MIAMI BEACH 63RD STREET HOTSPOT SMART SYSTEM
Date: April 04, 2003
Item Class Man-Hours Rate M-H x Rate1. Site Data Collection 1.a. Online Data Download Admin 40 $18.53 $741 1.b. Data Review and Compile Admin 10 $19.72 $197 Project Engineer 40 $24.24 $970 1.c. Format Data for use in N. Models and Drawings CADD 40 $20.92 $837 Project Engineer 20 $24.24 $485 2. Site Visits 2.a. Assess nearshore features Project Engineer 8 $24.24 $194 2.b. Conduct Cross Shore Surveys Project Engineer 40 $24.24 $970 Engineer 40 $19.48 $779 2.c. Conduct Near Shore Sediment Grab Samples Project Engineer 8 $24.24 $194 Engineer 8 $19.48 $156 2.d. Classify Near Shore Sediment Grab Samples Project Engineer 8 $24.24 $194 Engineer 8 $19.48 $156 3. Numerical Modeling 3.a. Build TINS Surface Project Engineer 20 $24.24 $485 CADD 20 $20.92 $418 3.b. Format local wave data for model. Project Engineer 8 $24.24 $194 Admin 16 $18.53 $296 3.c. Conduct NMLONG Analysis Project Engineer 8 $24.24 $194 3.d. Conduct CGWAVE Analysis Project Engineer 60 $24.24 $1,454 Engineer 20 $19.48 $390 3.e. Conduct Gensis-T Analysis Project Engineer 80 $24.24 $1,939 Engineer 40 $19.48 $779 3.f. Review Model findings. Project Manager 40 $40.97 $1,639 Project Engineer 40 $24.24 $970 4. Refine RBAM Analysis 4.a. Stability Analysis Project Manager 40 $40.97 $1,639 Project Engineer 80 $24.24 $1,939 4.b. Structural analysis Project Manager 40 $40.97 $1,639 Project Engineer 40 $24.24 $970 Engineer 40 $19.48 $779 CADD 40 $20.92 $837 4.c. Planform tuning Project Manager 20 $40.97 $819 Project Engineer 40 $24.24 $970 Engineer 80 $19.48 $1,558 CADD 80 $20.92 $1,674
30% DESIGN SUBMITTAL Page 41 of 51

SECTION 227 63RD STREET “HOTSPOT” MIAMI BEACH
5. Develop Specifications Project Manager 8 $40.97 $328 Project Engineer 40 $24.24 $970 CADD 16 $20.92 $335 6. Write Technical Report Project Manager 40 $40.97 $1,639 Project Engineer 60 $24.24 $1,454 Engineer 40 $19.48 $779 6.a. Develop Design Guidance Project Manager 40 $40.97 $1,639 Project Engineer 60 $24.24 $1,454 Engineer 40 $19.48 $779 Admin 16 $18.53 $296 7. Attend Design Review Meetings 7.a. 50% Review Project Manager 16 $40.97 $656 7.b. 75% Review Project Manager 16 $40.97 $656 7.c. 100% Review Project Manager 16 $40.97 $656 8. Travel Expenses $4,000 Subtotal $43,093 Overhead (170%) $73,259 Profit (10%) $4,309 9. Consulting with - Dr. Lee Harris Subcontractor 120 $115.00 $13,800 TOTAL $134,462
30% DESIGN SUBMITTAL Page 42 of 51
SECTION 227 63RD STREET “HOTSPOT” MIAMI BEACH
SECTION 7 CONCLUSIONS AND RECOMMENDATIONS
The SMART system represents a truly innovative shoreline erosion control system, keeping in the spirit of the Section 227 program. The recommended design calls for the submerged artificial reef breakwater to protect 1,800 feet of shoreline with five or six rows of reefballs, placed in a water depth of 6 feet below MLW. The weigh of the individual reefballs varies from 2,400-9,800 lbs. Use of ABM acts to anchor the reefballs and adds significant mass to the system.
A direct hit by a major hurricanes, may produce much greater forces than reported here which could produce instability and movement of the reefballs, unless additional anchorage is used. The preliminary cost estimate provided includes the cost of these anchors.
While the SMART system is relatively close to shore, ships, boats, and other watercraft may be damaged if they run into it. The submerged breakwater must be adequately marked for the safety of boaters and swimmers, just as the Sunny Isles submerged breakwater to the north are.
Like any new innovation, design guidance is extremely limited. Every attempt was made to use the best available data in formulating this design. Prediction of performance and hydraulic stability is very difficult. It is the recommendation of URS that physical model investigations be conducted. A need exist to better define wave attenuation and energy reduction on the beach, and hydraulic stability. Two-dimensional flume tests could be used to define wave attenuation as a function number of rows, water depth, spacing, and porosity. Three-dimensional tests, using tracers and current profilers could give a qualitative indication of shadowing effects, and sand training.
Traditional rubble mound submerged breakwaters typical cost over $2,000/LF. The SMART system is estimated to cost less than $1,300/LF. If this technology proves successful it will provide an economic alternative to traditional structures, benefit many community faced with eroding shorelines, and provide habit for many species of juvenile marine organisms.
30% DESIGN SUBMITTAL Page 43 of 51

SECTION 227 63RD STREET “HOTSPOT” MIAMI BEACH
SECTION 8 REFERENCES
1. Armortec, 2001. Armortec. Articulating Concrete Block Revetment System Design Manual
2. Ahrens, J.P. and Cox, J., 1990. “Design and Performance of Reef Breakwaters.” Journal of Coastal Research, Special Issue No. 7, The Coastal Education and Research Foundation (CERF), Fort Lauderdale, FL, pp. 61-75.
3. Ahrens, J.P., 1987. “Characteristics of Reef Breakwaters.” Technical Report CERC-87-17, Coastal Engineering Research Center, U.S. Army Corps of Engineers Waterways Experiment Station, Vicksburg, MS, 62 pp.
4. Coastal Systems International, 2001, “Coastal Processes Analysis: Dade County 63rd Street Hotspot”
5. Dally, W.R., Dean, R.G., and Dalrymple, R. A. 1985. “Wave Height Variation Across Beaches of Arbitrary Profile.” Journal of Geophysical Research, Vol 90, No. C6, pp 11917-11927
6. Dattatri, J., Raman, H., and Shankar, N.J., 1978. “Performance Characteristics of Submerged Breakwaters.” Coastal Engineering '78, ASCE, New York, NY, pp. 2152-2171.
7. Dean, Robert and Dalrymple, Robert. Water Wave Mechanics for Engineers and Scientists. World Scientific, New Jersey, 1991.
8. Harris, L. E., 2003. “Submerged Reef Structures for Beach Erosion Control” Abstract-Coastal Structures 2003, Portland, OR.
9. Hall, K. R. and Seabrook, S.R., 1998. “Design Equation for Transmission at Submerged Rubblemound Breakwaters.” Journal of Coastal Research, SI(26), pp. 102-106. Royal Palm Beach (Florida).
10. Kraus, N.C. and F. A. Galgano. 2001. “Beach Erosional Hotspots: Types Causes, and Solutions”, ERDC/CHL CHETN-11-44, Sept 2001
11. Nielsen, P.N. “Explicit Solutions to Practical Wave Problems”. Proceedings 19th Conference on Coastal Engineering, ASCE, V1, 968-982. 1984.
12. Pope, J., 1989. “Role of Breakwaters in Beach Erosion Control.” Beach Preservation Technology ’89, Coastal Engineering Research Center, U.S. Army Engineer Waterways Experiment Station, Vicksburg, MS, pp. 167-176.
13. Seabrook, S.R., 1997. Investigation of the Performance of Submerged Rubblemound Breakwaters, M.Sc. Thesis, Queen’s University, Ontario, Canada, 200 pp.
14. Seelig, W.N., 1980. “Two-Dimensional Tests of Wave Transmission and Reflection Characteristics of Laboratory Breakwaters.” T.R. 80-1, Coastal
30% DESIGN SUBMITTAL Page 44 of 51

SECTION 227 63RD STREET “HOTSPOT” MIAMI BEACH
Engineering Research Center, U.S. Army Corps of Engineers Waterways Experiment Station, Vicksburg, MS, 187 pp.
15. Reef Ball, 2003. Reef Ball Development Group. Reef Ball Design Guidance and Specifications
16. Reef Ball Home Page. http://www.reefball.org 17. Roberson, John and Crowe, Clayton, Engineering Fluid Mechanics.
Houghton Mifflin Company, Boston, MA. 1990. 18. U.S. Army Corps of Engineers. Automated Coastal Engineering System
(ACES). Coastal Engineering Research Center, Waterways Experiment Station, Vicksburg, Mississippi. Version 1.07e 1994.
19. U.S. Army Corps of Engineers. Shore Protection Manual. Coastal Engineering Research Center, Waterways Experiment Station, Washington, D.C.: U.S. Government Printing Office. 2 Vols 1984.
20. U.S. Army Corps of Engineers Jacksonville District, 2003. Plans for Sustainability of Renourishment Miami Beach, Beach Erosion Control and Hurricane Protection Project Dade County, Florida. D.O. File No. 24-37635, 2003
21. U.S. Army Corps of Engineers Jacksonville District 2001. “Dade County Shore Protection Project Evaluation Report.”
22. Van der Meer, J. W. and Daemen, I. F. R., 1994. “Stability and Wave Transmission at Low-Crested Rubble-Mound Structures.” Journal of Waterway, Port, Coastal and Ocean Engineering, ASCE. Vol. 120, pp. 1-19.
23. Van der Meer, J. W., 1991. “Stability and Wave Transmission at Low-Crested Structures.” Delft Hydraulics Publication 453.
24. Van der Meer, J. W., 1990. “Data on Wave Transmission Due to Overtopping.” Delft Hydraulics Publication H 986.
25. Van der Meer, J. W., 1988. “Deterministic and Probabilistic Design of Breakwater Armor Layers.” Journal of Waterway, Port, Coastal and Ocean Engineering, ASCE. Vol. 114, No. 1, pp. 66-80.
30% DESIGN SUBMITTAL Page 45 of 51

SECTION 227 63RD STREET “HOTSPOT” MIAMI BEACH
APPENDIX A - WIS STATION 9 EVALUATION
WIS Station 9 is located adjacent to the project site, offshore, in 220 meters of water. The stations geographical coordinates are 26-degree latitude and 80-degree longitude. An analysis of this station was conducted for the data starting in January 1975 and ending in December 1995, providing 58,440 three-hour averaged data sets. A histogram plot of wave height and period are provided as Figure A-1 and A-2.
Figure A-1. Fractional wave height plot for WIS Station 9.
Figure A-2. Fractional wave period plot for WIS Station 9.
30% DESIGN SUBMITTAL Page 46 of 51

SECTION 227 63RD STREET “HOTSPOT” MIAMI BEACH
Figure A-3. Return interval wave height plot for WIS Station 9.
Figure A-4. Return interval wave period plot for WIS Station 9.
30% DESIGN SUBMITTAL Page 47 of 51
SECTION 227 63RD STREET “HOTSPOT” MIAMI BEACH
Figures A-3 and A-4 show the return interval analysis of the wave height and period for Station 9. It is noted that the maximum calculated return year for period is on 5 years. This is due to the maximum event occurring 4 times during the 20-year period of record, reducing the effective length of the record to 5 years. This is most likely due to the course resolution of the periods of 1.0 second. Fractional seconds may delineate the maximum occurring case, providing better resolution for long interval extrapolations.
30% DESIGN SUBMITTAL Page 48 of 51

SECTION 227 63RD STREET “HOTSPOT” MIAMI BEACH
APPENDIX B - MORRISONS EQUATION
30% DESIGN SUBMITTAL Page 49 of 51

SECTION 227 63RD STREET “HOTSPOT” MIAMI BEACH
30% DESIGN SUBMITTAL Page 50 of 51

SECTION 227 63RD STREET “HOTSPOT” MIAMI BEACH
30% DESIGN SUBMITTAL Page 51 of 51
APPENDIX C - 30% SMART STRUCTURE DESIGN PLANS