Embed Size (px)
Citation preview
KINGFISH MAINE SITE LOCATION OF DEVELOPMENT APPLICATION
SECTION 11: Soils Kingfish Maine proposes to construct an enclosed recirculating aquaculture system (RAS) facility with multiple buildings, together with adjunct facilities and equipment on a property at 9 Mason Bay Road in Jonesport. Soils onsite are suitable for development as required in chapter 376, ‘Soil Type Standard of the Site Location Law’. It is requested that the requirement for a High Intensity Soil Survey be waived. This request is predicated on the developed data set developed for the project by soils investigations as outlined herein. Kingfish Maine has retained geotechnical engineers and soil scientists to assess soil information for the subject property for the purposes of determining suitability and limitations for the development of the RAS project. These investigations focused on the utilizable portions of the property. In addition, natural resources were identified and characterized, which identified additional soils characteristics in the wetland areas, as noted below. A NRCS Soil Resource Report was obtained for the project. Soil types are identified therein as sands and sand loams in areas other than the wetland and peatland in the northerly section of the property. Geotechnical investigations were performed by SW Cole Engineering in 2020. Soil types are mainly sands described in the geotechnical assessments as fluvial soils. This is consistent and associated with coastal geomorphology, and are suitable for construction. In addition, hydric soils are present in the wetlands onsite. These investigations have identified soils which are suitable for construction, and adequate depths of overburden for the project work to be pursued by conventional means. A number of machine dug and hand dug test pits for wastewater disposal were also performed. A septic design has been completed for the proposed wastewater disposal areas, and those designs and further test pit data are enumerated in Section 17. Mapping of the investigations performed are appended to this application. Maps are drawn at scales of 1”=100’ for explorations and test pits and at other scales. Appended to this section are the NRCS soil survey, the geotechnical investigation report which includes logs for borings and probes performed onsite, as well as test pit logs from hand dug test pits from the onsite wastewater disposal investigation.

KINGFISH MAINE SITE LOCATION OF DEVELOPMENT APPLICATION
APPENDIX 11A NRCS Soil Survey
United StatesDepartment ofAgriculture
A product of the NationalCooperative Soil Survey,a joint effort of the UnitedStates Department ofAgriculture and otherFederal agencies, Stateagencies including theAgricultural ExperimentStations, and localparticipants
Custom Soil Resource Report for
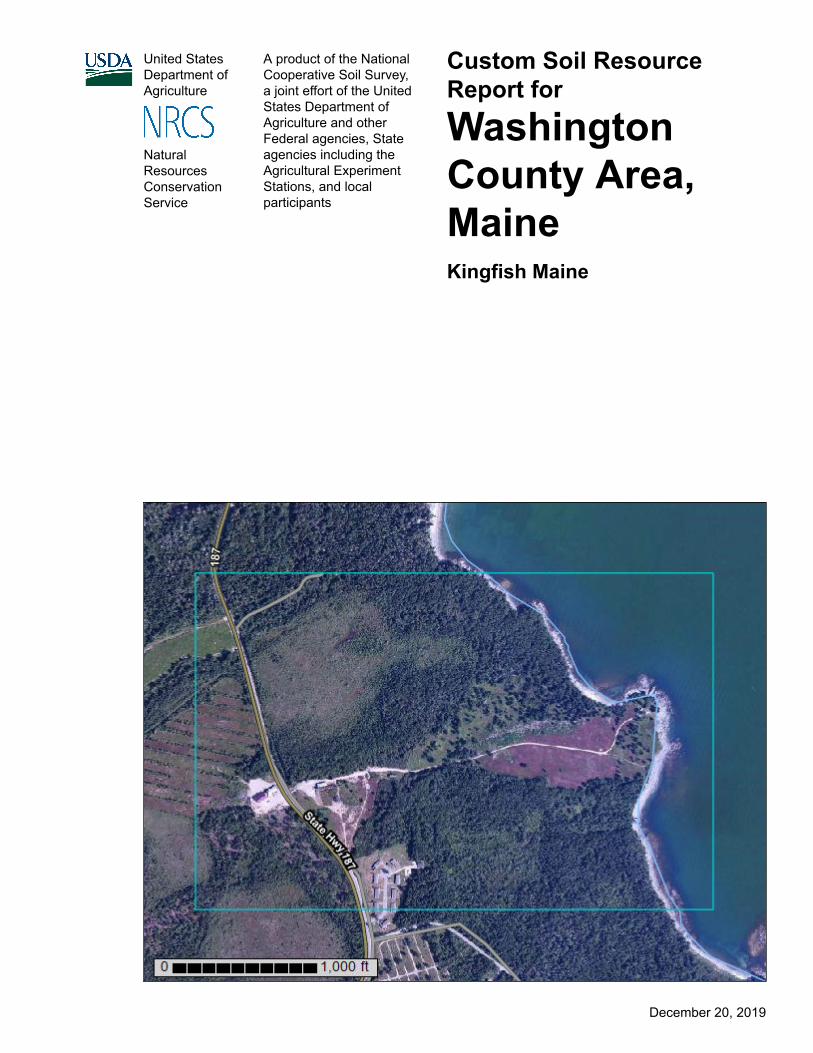
Washington County Area, MaineKingfish Maine
NaturalResourcesConservationService
December 20, 2019
PrefaceSoil surveys contain information that affects land use planning in survey areas. They highlight soil limitations that affect various land uses and provide information about the properties of the soils in the survey areas. Soil surveys are designed for many different users, including farmers, ranchers, foresters, agronomists, urban planners, community officials, engineers, developers, builders, and home buyers. Also, conservationists, teachers, students, and specialists in recreation, waste disposal, and pollution control can use the surveys to help them understand, protect, or enhance the environment.
Various land use regulations of Federal, State, and local governments may impose special restrictions on land use or land treatment. Soil surveys identify soil properties that are used in making various land use or land treatment decisions. The information is intended to help the land users identify and reduce the effects of soil limitations on various land uses. The landowner or user is responsible for identifying and complying with existing laws and regulations.
Although soil survey information can be used for general farm, local, and wider area planning, onsite investigation is needed to supplement this information in some cases. Examples include soil quality assessments (http://www.nrcs.usda.gov/wps/portal/nrcs/main/soils/health/) and certain conservation and engineering applications. For more detailed information, contact your local USDA Service Center (https://offices.sc.egov.usda.gov/locator/app?agency=nrcs) or your NRCS State Soil Scientist (http://www.nrcs.usda.gov/wps/portal/nrcs/detail/soils/contactus/?cid=nrcs142p2_053951).
Great differences in soil properties can occur within short distances. Some soils are seasonally wet or subject to flooding. Some are too unstable to be used as a foundation for buildings or roads. Clayey or wet soils are poorly suited to use as septic tank absorption fields. A high water table makes a soil poorly suited to basements or underground installations.
The National Cooperative Soil Survey is a joint effort of the United States Department of Agriculture and other Federal agencies, State agencies including the Agricultural Experiment Stations, and local agencies. The Natural Resources Conservation Service (NRCS) has leadership for the Federal part of the National Cooperative Soil Survey.
Information about soils is updated periodically. Updated information is available through the NRCS Web Soil Survey, the site for official soil survey information.
The U.S. Department of Agriculture (USDA) prohibits discrimination in all its programs and activities on the basis of race, color, national origin, age, disability, and where applicable, sex, marital status, familial status, parental status, religion, sexual orientation, genetic information, political beliefs, reprisal, or because all or a part of an individual's income is derived from any public assistance program. (Not all prohibited bases apply to all programs.) Persons with disabilities who require
2

alternative means for communication of program information (Braille, large print, audiotape, etc.) should contact USDA's TARGET Center at (202) 720-2600 (voice and TDD). To file a complaint of discrimination, write to USDA, Director, Office of Civil Rights, 1400 Independence Avenue, S.W., Washington, D.C. 20250-9410 or call (800) 795-3272 (voice) or (202) 720-6382 (TDD). USDA is an equal opportunity provider and employer.
3
ContentsPreface.................................................................................................................... 2How Soil Surveys Are Made..................................................................................5Soil Map.................................................................................................................. 8
Soil Map................................................................................................................9Legend................................................................................................................10Map Unit Legend................................................................................................ 11Map Unit Descriptions.........................................................................................11
Washington County Area, Maine.................................................................... 13BW—Bucksport and Wonsqueak mucks, 0 to 2 percent slopes................. 13CoB—Colton gravelly sandy loam, 3 to 8 percent slopes........................... 15CRC—Colton-Adams complex, 3 to 15 percent slopes.............................. 16Kn—Kinsman sand......................................................................................19KW—Kinsman-Wonsqueak association, 0 to 3 percent slopes.................. 20SG—Sebago and Moosabec soils.............................................................. 23W—Water....................................................................................................25
References............................................................................................................26
4
How Soil Surveys Are MadeSoil surveys are made to provide information about the soils and miscellaneous areas in a specific area. They include a description of the soils and miscellaneous areas and their location on the landscape and tables that show soil properties and limitations affecting various uses. Soil scientists observed the steepness, length, and shape of the slopes; the general pattern of drainage; the kinds of crops and native plants; and the kinds of bedrock. They observed and described many soil profiles. A soil profile is the sequence of natural layers, or horizons, in a soil. The profile extends from the surface down into the unconsolidated material in which the soil formed or from the surface down to bedrock. The unconsolidated material is devoid of roots and other living organisms and has not been changed by other biological activity.
Currently, soils are mapped according to the boundaries of major land resource areas (MLRAs). MLRAs are geographically associated land resource units that share common characteristics related to physiography, geology, climate, water resources, soils, biological resources, and land uses (USDA, 2006). Soil survey areas typically consist of parts of one or more MLRA.
The soils and miscellaneous areas in a survey area occur in an orderly pattern that is related to the geology, landforms, relief, climate, and natural vegetation of the area. Each kind of soil and miscellaneous area is associated with a particular kind of landform or with a segment of the landform. By observing the soils and miscellaneous areas in the survey area and relating their position to specific segments of the landform, a soil scientist develops a concept, or model, of how they were formed. Thus, during mapping, this model enables the soil scientist to predict with a considerable degree of accuracy the kind of soil or miscellaneous area at a specific location on the landscape.
Commonly, individual soils on the landscape merge into one another as their characteristics gradually change. To construct an accurate soil map, however, soil scientists must determine the boundaries between the soils. They can observe only a limited number of soil profiles. Nevertheless, these observations, supplemented by an understanding of the soil-vegetation-landscape relationship, are sufficient to verify predictions of the kinds of soil in an area and to determine the boundaries.
Soil scientists recorded the characteristics of the soil profiles that they studied. They noted soil color, texture, size and shape of soil aggregates, kind and amount of rock fragments, distribution of plant roots, reaction, and other features that enable them to identify soils. After describing the soils in the survey area and determining their properties, the soil scientists assigned the soils to taxonomic classes (units). Taxonomic classes are concepts. Each taxonomic class has a set of soil characteristics with precisely defined limits. The classes are used as a basis for comparison to classify soils systematically. Soil taxonomy, the system of taxonomic classification used in the United States, is based mainly on the kind and character of soil properties and the arrangement of horizons within the profile. After the soil
5
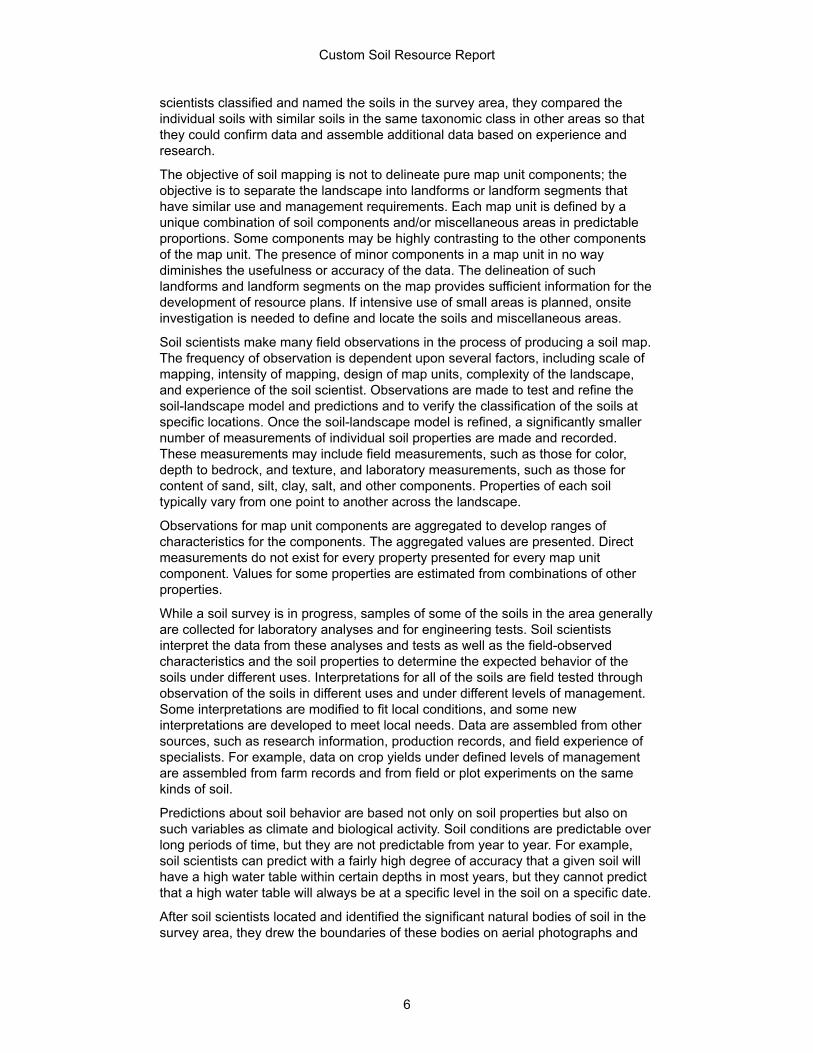
scientists classified and named the soils in the survey area, they compared the individual soils with similar soils in the same taxonomic class in other areas so that they could confirm data and assemble additional data based on experience and research.
The objective of soil mapping is not to delineate pure map unit components; the objective is to separate the landscape into landforms or landform segments that have similar use and management requirements. Each map unit is defined by a unique combination of soil components and/or miscellaneous areas in predictable proportions. Some components may be highly contrasting to the other components of the map unit. The presence of minor components in a map unit in no way diminishes the usefulness or accuracy of the data. The delineation of such landforms and landform segments on the map provides sufficient information for the development of resource plans. If intensive use of small areas is planned, onsite investigation is needed to define and locate the soils and miscellaneous areas.
Soil scientists make many field observations in the process of producing a soil map. The frequency of observation is dependent upon several factors, including scale of mapping, intensity of mapping, design of map units, complexity of the landscape, and experience of the soil scientist. Observations are made to test and refine the soil-landscape model and predictions and to verify the classification of the soils at specific locations. Once the soil-landscape model is refined, a significantly smaller number of measurements of individual soil properties are made and recorded. These measurements may include field measurements, such as those for color, depth to bedrock, and texture, and laboratory measurements, such as those for content of sand, silt, clay, salt, and other components. Properties of each soil typically vary from one point to another across the landscape.
Observations for map unit components are aggregated to develop ranges of characteristics for the components. The aggregated values are presented. Direct measurements do not exist for every property presented for every map unit component. Values for some properties are estimated from combinations of other properties.
While a soil survey is in progress, samples of some of the soils in the area generally are collected for laboratory analyses and for engineering tests. Soil scientists interpret the data from these analyses and tests as well as the field-observed characteristics and the soil properties to determine the expected behavior of the soils under different uses. Interpretations for all of the soils are field tested through observation of the soils in different uses and under different levels of management. Some interpretations are modified to fit local conditions, and some new interpretations are developed to meet local needs. Data are assembled from other sources, such as research information, production records, and field experience of specialists. For example, data on crop yields under defined levels of management are assembled from farm records and from field or plot experiments on the same kinds of soil.
Predictions about soil behavior are based not only on soil properties but also on such variables as climate and biological activity. Soil conditions are predictable over long periods of time, but they are not predictable from year to year. For example, soil scientists can predict with a fairly high degree of accuracy that a given soil will have a high water table within certain depths in most years, but they cannot predict that a high water table will always be at a specific level in the soil on a specific date.
After soil scientists located and identified the significant natural bodies of soil in the survey area, they drew the boundaries of these bodies on aerial photographs and
Custom Soil Resource Report
6

identified each as a specific map unit. Aerial photographs show trees, buildings, fields, roads, and rivers, all of which help in locating boundaries accurately.
Custom Soil Resource Report
7
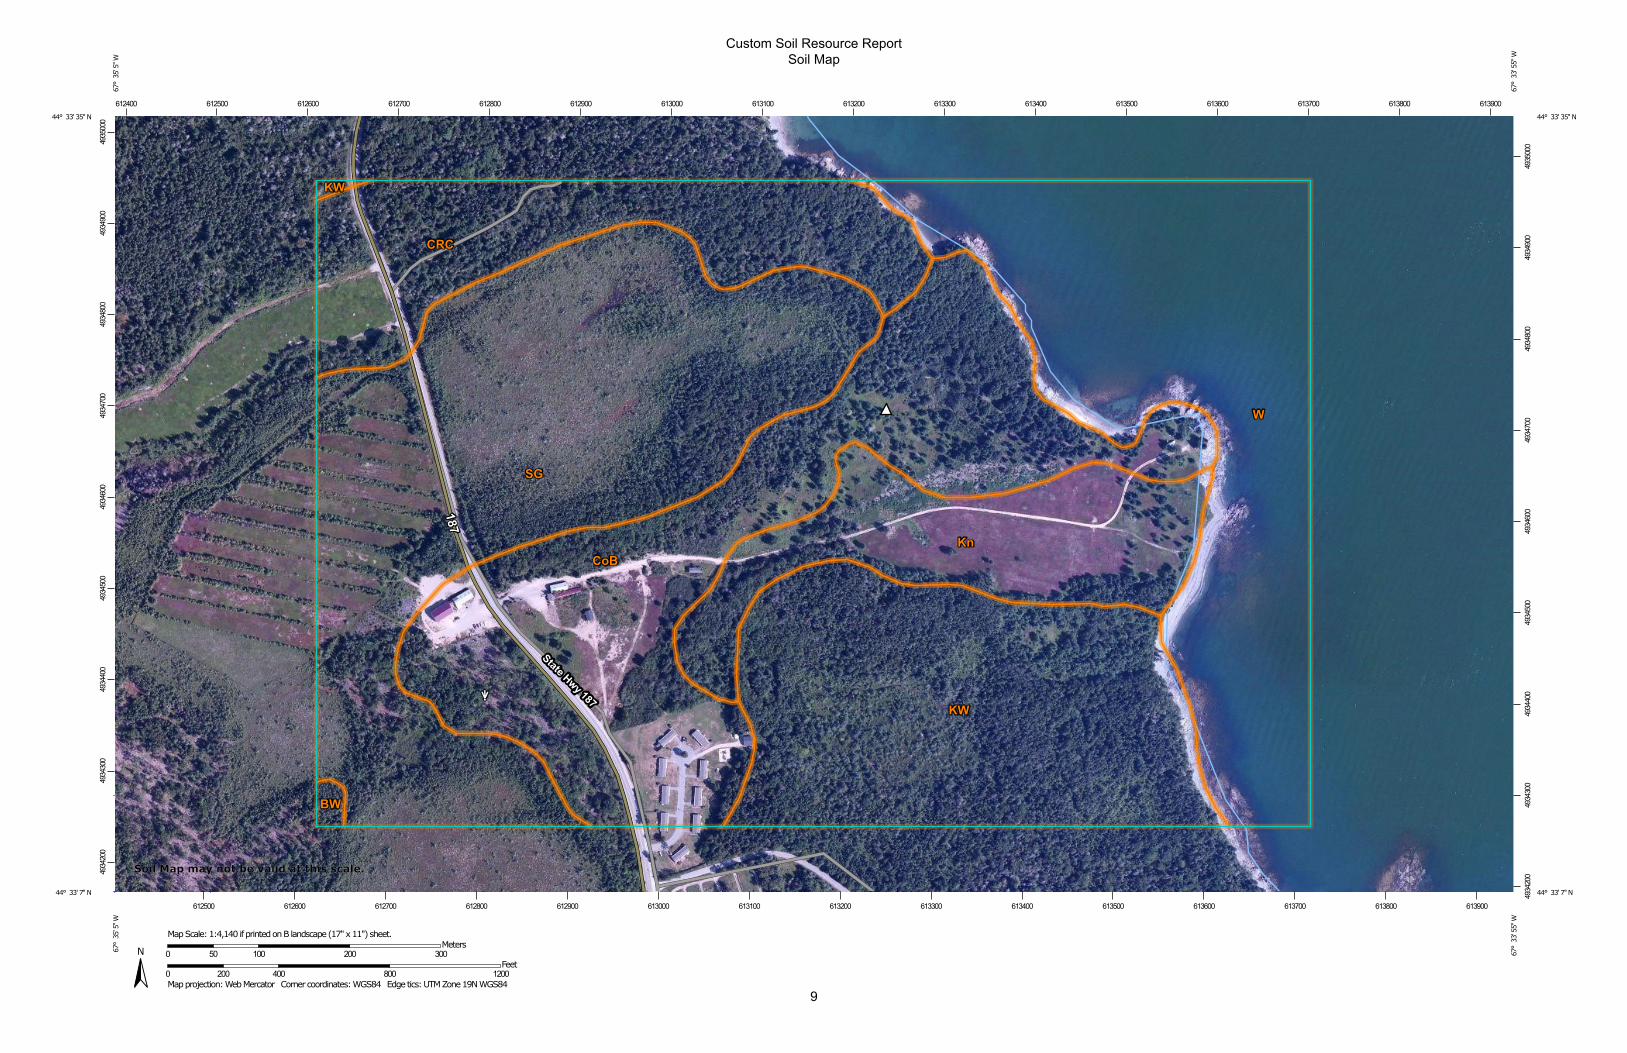
Soil MapThe soil map section includes the soil map for the defined area of interest, a list of soil map units on the map and extent of each map unit, and cartographic symbols displayed on the map. Also presented are various metadata about data used to produce the map, and a description of each soil map unit.
8
9
Custom Soil Resource ReportSoil Map
4934
200
4934
300
4934
400
4934
500
4934
600
4934
700
4934
800
4934
900
4935
000
4934
200
4934
300
4934
400
4934
500
4934
600
4934
700
4934
800
4934
900
4935
000
612400 612500 612600 612700 612800 612900 613000 613100 613200 613300 613400 613500 613600 613700 613800 613900
612500 612600 612700 612800 612900 613000 613100 613200 613300 613400 613500 613600 613700 613800 613900
44° 33' 35'' N67
° 3
5' 5
'' W44° 33' 35'' N
67° 3
3' 5
5'' W
44° 33' 7'' N
67° 3
5' 5
'' W
44° 33' 7'' N
67° 3
3' 5
5'' W
N
Map projection: Web Mercator Corner coordinates: WGS84 Edge tics: UTM Zone 19N WGS840 200 400 800 1200
Feet0 50 100 200 300
MetersMap Scale: 1:4,140 if printed on B landscape (17" x 11") sheet.
Soil Map may not be valid at this scale.
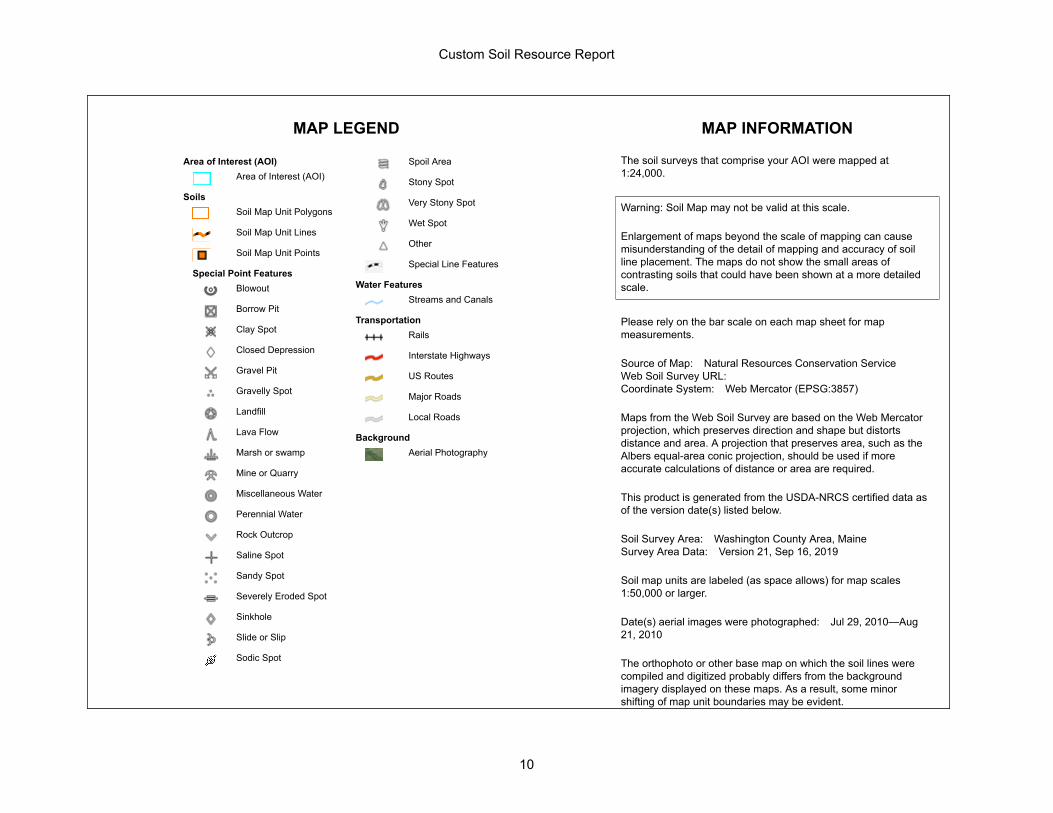
MAP LEGEND MAP INFORMATION
Area of Interest (AOI)Area of Interest (AOI)
SoilsSoil Map Unit Polygons
Soil Map Unit Lines
Soil Map Unit Points
Special Point FeaturesBlowout
Borrow Pit
Clay Spot
Closed Depression
Gravel Pit
Gravelly Spot
Landfill
Lava Flow
Marsh or swamp
Mine or Quarry
Miscellaneous Water
Perennial Water
Rock Outcrop
Saline Spot
Sandy Spot
Severely Eroded Spot
Sinkhole
Slide or Slip
Sodic Spot
Spoil Area
Stony Spot
Very Stony Spot
Wet Spot
Other
Special Line Features
Water FeaturesStreams and Canals
TransportationRails
Interstate Highways
US Routes
Major Roads
Local Roads
BackgroundAerial Photography
The soil surveys that comprise your AOI were mapped at 1:24,000.
Warning: Soil Map may not be valid at this scale.
Enlargement of maps beyond the scale of mapping can cause misunderstanding of the detail of mapping and accuracy of soil line placement. The maps do not show the small areas of contrasting soils that could have been shown at a more detailed scale.
Please rely on the bar scale on each map sheet for map measurements.
Source of Map: Natural Resources Conservation ServiceWeb Soil Survey URL: Coordinate System: Web Mercator (EPSG:3857)
Maps from the Web Soil Survey are based on the Web Mercator projection, which preserves direction and shape but distorts distance and area. A projection that preserves area, such as the Albers equal-area conic projection, should be used if more accurate calculations of distance or area are required.
This product is generated from the USDA-NRCS certified data as of the version date(s) listed below.
Soil Survey Area: Washington County Area, MaineSurvey Area Data: Version 21, Sep 16, 2019
Soil map units are labeled (as space allows) for map scales 1:50,000 or larger.
Date(s) aerial images were photographed: Jul 29, 2010—Aug 21, 2010
The orthophoto or other base map on which the soil lines were compiled and digitized probably differs from the background imagery displayed on these maps. As a result, some minor shifting of map unit boundaries may be evident.
Custom Soil Resource Report
10
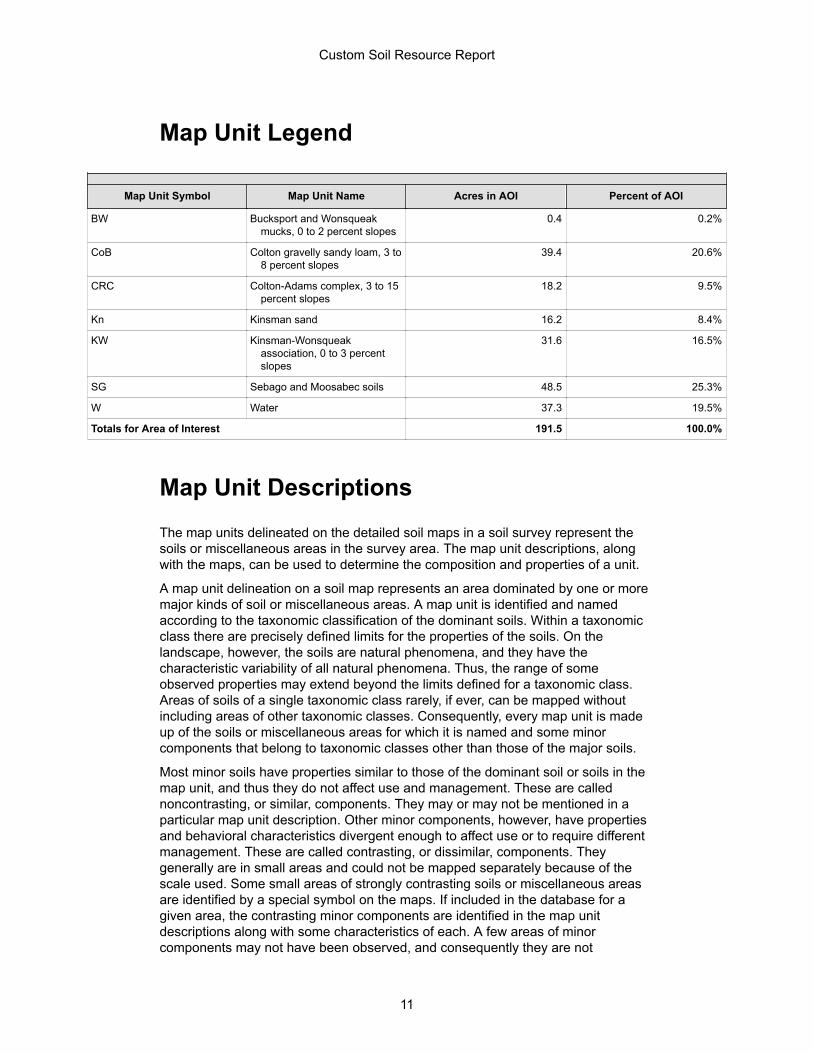
Map Unit Legend
Map Unit Symbol Map Unit Name Acres in AOI Percent of AOI
BW Bucksport and Wonsqueak mucks, 0 to 2 percent slopes
0.4 0.2%
CoB Colton gravelly sandy loam, 3 to 8 percent slopes
39.4 20.6%
CRC Colton-Adams complex, 3 to 15 percent slopes
18.2 9.5%
Kn Kinsman sand 16.2 8.4%
KW Kinsman-Wonsqueak association, 0 to 3 percent slopes
31.6 16.5%
SG Sebago and Moosabec soils 48.5 25.3%
W Water 37.3 19.5%
Totals for Area of Interest 191.5 100.0%
Map Unit DescriptionsThe map units delineated on the detailed soil maps in a soil survey represent the soils or miscellaneous areas in the survey area. The map unit descriptions, along with the maps, can be used to determine the composition and properties of a unit.
A map unit delineation on a soil map represents an area dominated by one or more major kinds of soil or miscellaneous areas. A map unit is identified and named according to the taxonomic classification of the dominant soils. Within a taxonomic class there are precisely defined limits for the properties of the soils. On the landscape, however, the soils are natural phenomena, and they have the characteristic variability of all natural phenomena. Thus, the range of some observed properties may extend beyond the limits defined for a taxonomic class. Areas of soils of a single taxonomic class rarely, if ever, can be mapped without including areas of other taxonomic classes. Consequently, every map unit is made up of the soils or miscellaneous areas for which it is named and some minor components that belong to taxonomic classes other than those of the major soils.
Most minor soils have properties similar to those of the dominant soil or soils in the map unit, and thus they do not affect use and management. These are called noncontrasting, or similar, components. They may or may not be mentioned in a particular map unit description. Other minor components, however, have properties and behavioral characteristics divergent enough to affect use or to require different management. These are called contrasting, or dissimilar, components. They generally are in small areas and could not be mapped separately because of the scale used. Some small areas of strongly contrasting soils or miscellaneous areas are identified by a special symbol on the maps. If included in the database for a given area, the contrasting minor components are identified in the map unit descriptions along with some characteristics of each. A few areas of minor components may not have been observed, and consequently they are not
Custom Soil Resource Report
11

mentioned in the descriptions, especially where the pattern was so complex that it was impractical to make enough observations to identify all the soils and miscellaneous areas on the landscape.
The presence of minor components in a map unit in no way diminishes the usefulness or accuracy of the data. The objective of mapping is not to delineate pure taxonomic classes but rather to separate the landscape into landforms or landform segments that have similar use and management requirements. The delineation of such segments on the map provides sufficient information for the development of resource plans. If intensive use of small areas is planned, however, onsite investigation is needed to define and locate the soils and miscellaneous areas.
An identifying symbol precedes the map unit name in the map unit descriptions. Each description includes general facts about the unit and gives important soil properties and qualities.
Soils that have profiles that are almost alike make up a soil series. Except for differences in texture of the surface layer, all the soils of a series have major horizons that are similar in composition, thickness, and arrangement.
Soils of one series can differ in texture of the surface layer, slope, stoniness, salinity, degree of erosion, and other characteristics that affect their use. On the basis of such differences, a soil series is divided into soil phases. Most of the areas shown on the detailed soil maps are phases of soil series. The name of a soil phase commonly indicates a feature that affects use or management. For example, Alpha silt loam, 0 to 2 percent slopes, is a phase of the Alpha series.
Some map units are made up of two or more major soils or miscellaneous areas. These map units are complexes, associations, or undifferentiated groups.
A complex consists of two or more soils or miscellaneous areas in such an intricate pattern or in such small areas that they cannot be shown separately on the maps. The pattern and proportion of the soils or miscellaneous areas are somewhat similar in all areas. Alpha-Beta complex, 0 to 6 percent slopes, is an example.
An association is made up of two or more geographically associated soils or miscellaneous areas that are shown as one unit on the maps. Because of present or anticipated uses of the map units in the survey area, it was not considered practical or necessary to map the soils or miscellaneous areas separately. The pattern and relative proportion of the soils or miscellaneous areas are somewhat similar. Alpha-Beta association, 0 to 2 percent slopes, is an example.
An undifferentiated group is made up of two or more soils or miscellaneous areas that could be mapped individually but are mapped as one unit because similar interpretations can be made for use and management. The pattern and proportion of the soils or miscellaneous areas in a mapped area are not uniform. An area can be made up of only one of the major soils or miscellaneous areas, or it can be made up of all of them. Alpha and Beta soils, 0 to 2 percent slopes, is an example.
Some surveys include miscellaneous areas. Such areas have little or no soil material and support little or no vegetation. Rock outcrop is an example.
Custom Soil Resource Report
12
Washington County Area, Maine
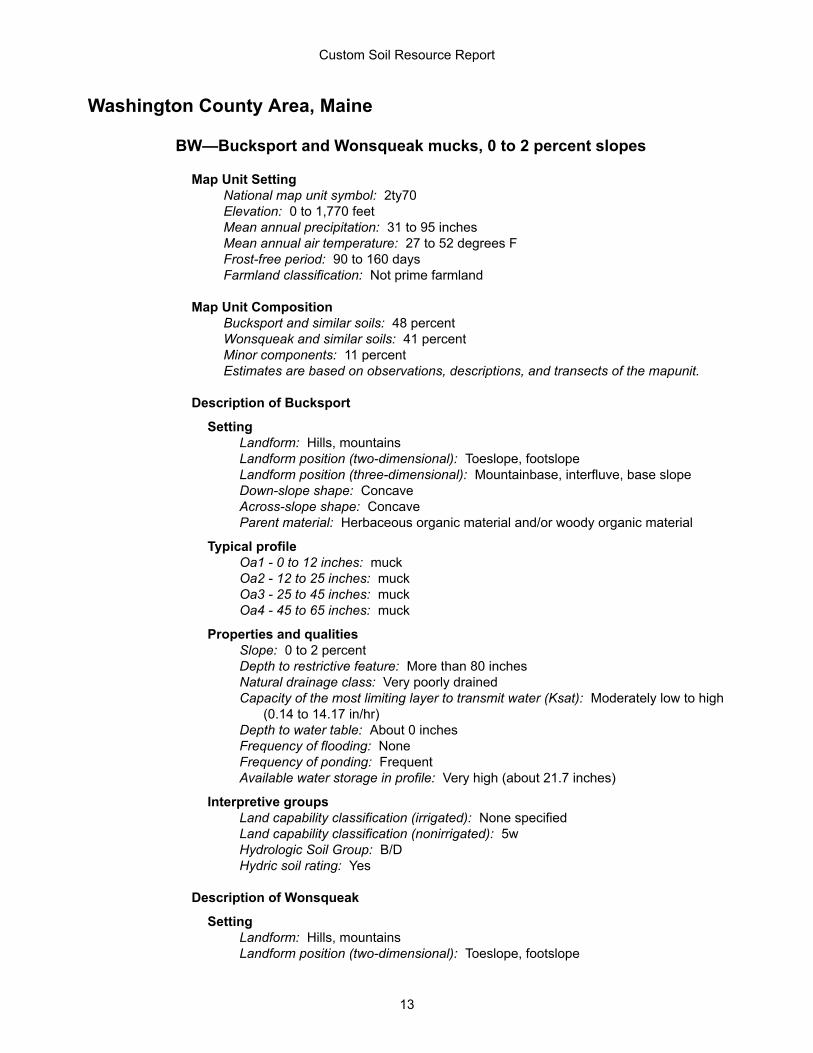
BW—Bucksport and Wonsqueak mucks, 0 to 2 percent slopes
Map Unit SettingNational map unit symbol: 2ty70Elevation: 0 to 1,770 feetMean annual precipitation: 31 to 95 inchesMean annual air temperature: 27 to 52 degrees FFrost-free period: 90 to 160 daysFarmland classification: Not prime farmland
Map Unit CompositionBucksport and similar soils: 48 percentWonsqueak and similar soils: 41 percentMinor components: 11 percentEstimates are based on observations, descriptions, and transects of the mapunit.
Description of Bucksport
SettingLandform: Hills, mountainsLandform position (two-dimensional): Toeslope, footslopeLandform position (three-dimensional): Mountainbase, interfluve, base slopeDown-slope shape: ConcaveAcross-slope shape: ConcaveParent material: Herbaceous organic material and/or woody organic material
Typical profileOa1 - 0 to 12 inches: muckOa2 - 12 to 25 inches: muckOa3 - 25 to 45 inches: muckOa4 - 45 to 65 inches: muck
Properties and qualitiesSlope: 0 to 2 percentDepth to restrictive feature: More than 80 inchesNatural drainage class: Very poorly drainedCapacity of the most limiting layer to transmit water (Ksat): Moderately low to high
(0.14 to 14.17 in/hr)Depth to water table: About 0 inchesFrequency of flooding: NoneFrequency of ponding: FrequentAvailable water storage in profile: Very high (about 21.7 inches)
Interpretive groupsLand capability classification (irrigated): None specifiedLand capability classification (nonirrigated): 5wHydrologic Soil Group: B/DHydric soil rating: Yes
Description of Wonsqueak
SettingLandform: Hills, mountainsLandform position (two-dimensional): Toeslope, footslope
Custom Soil Resource Report
13
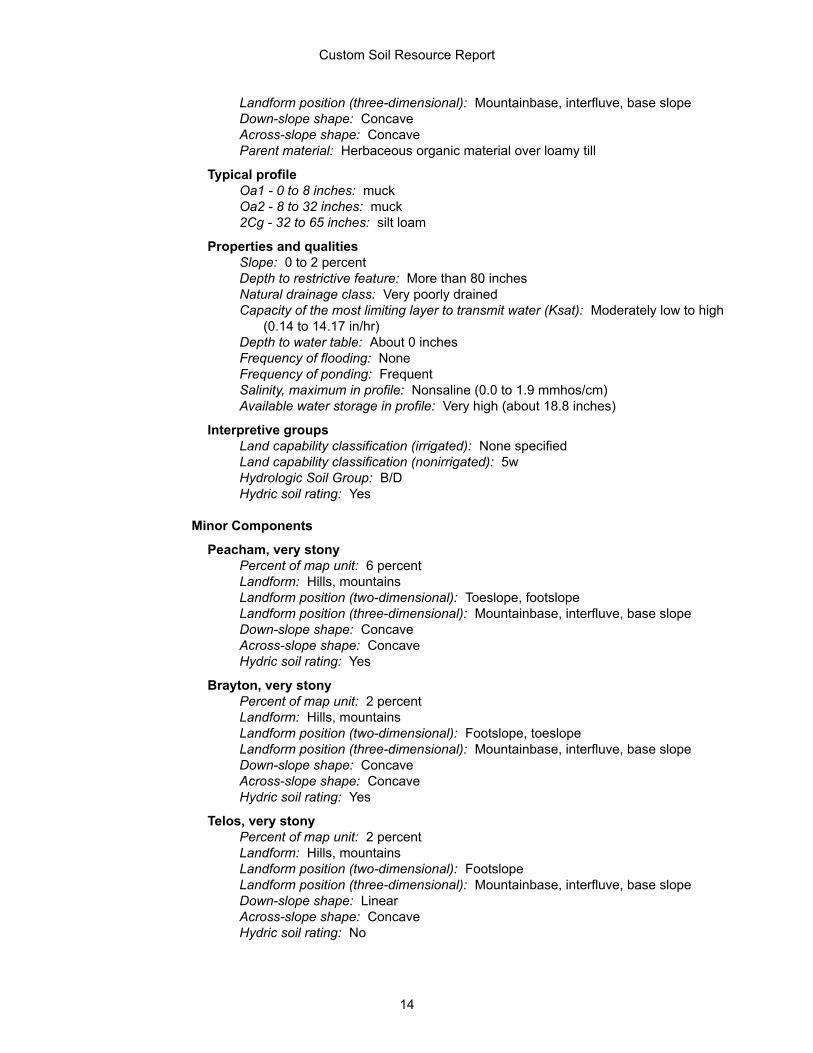
Landform position (three-dimensional): Mountainbase, interfluve, base slopeDown-slope shape: ConcaveAcross-slope shape: ConcaveParent material: Herbaceous organic material over loamy till
Typical profileOa1 - 0 to 8 inches: muckOa2 - 8 to 32 inches: muck2Cg - 32 to 65 inches: silt loam
Properties and qualitiesSlope: 0 to 2 percentDepth to restrictive feature: More than 80 inchesNatural drainage class: Very poorly drainedCapacity of the most limiting layer to transmit water (Ksat): Moderately low to high
(0.14 to 14.17 in/hr)Depth to water table: About 0 inchesFrequency of flooding: NoneFrequency of ponding: FrequentSalinity, maximum in profile: Nonsaline (0.0 to 1.9 mmhos/cm)Available water storage in profile: Very high (about 18.8 inches)
Interpretive groupsLand capability classification (irrigated): None specifiedLand capability classification (nonirrigated): 5wHydrologic Soil Group: B/DHydric soil rating: Yes
Minor Components
Peacham, very stonyPercent of map unit: 6 percentLandform: Hills, mountainsLandform position (two-dimensional): Toeslope, footslopeLandform position (three-dimensional): Mountainbase, interfluve, base slopeDown-slope shape: ConcaveAcross-slope shape: ConcaveHydric soil rating: Yes
Brayton, very stonyPercent of map unit: 2 percentLandform: Hills, mountainsLandform position (two-dimensional): Footslope, toeslopeLandform position (three-dimensional): Mountainbase, interfluve, base slopeDown-slope shape: ConcaveAcross-slope shape: ConcaveHydric soil rating: Yes
Telos, very stonyPercent of map unit: 2 percentLandform: Hills, mountainsLandform position (two-dimensional): FootslopeLandform position (three-dimensional): Mountainbase, interfluve, base slopeDown-slope shape: LinearAcross-slope shape: ConcaveHydric soil rating: No
Custom Soil Resource Report
14
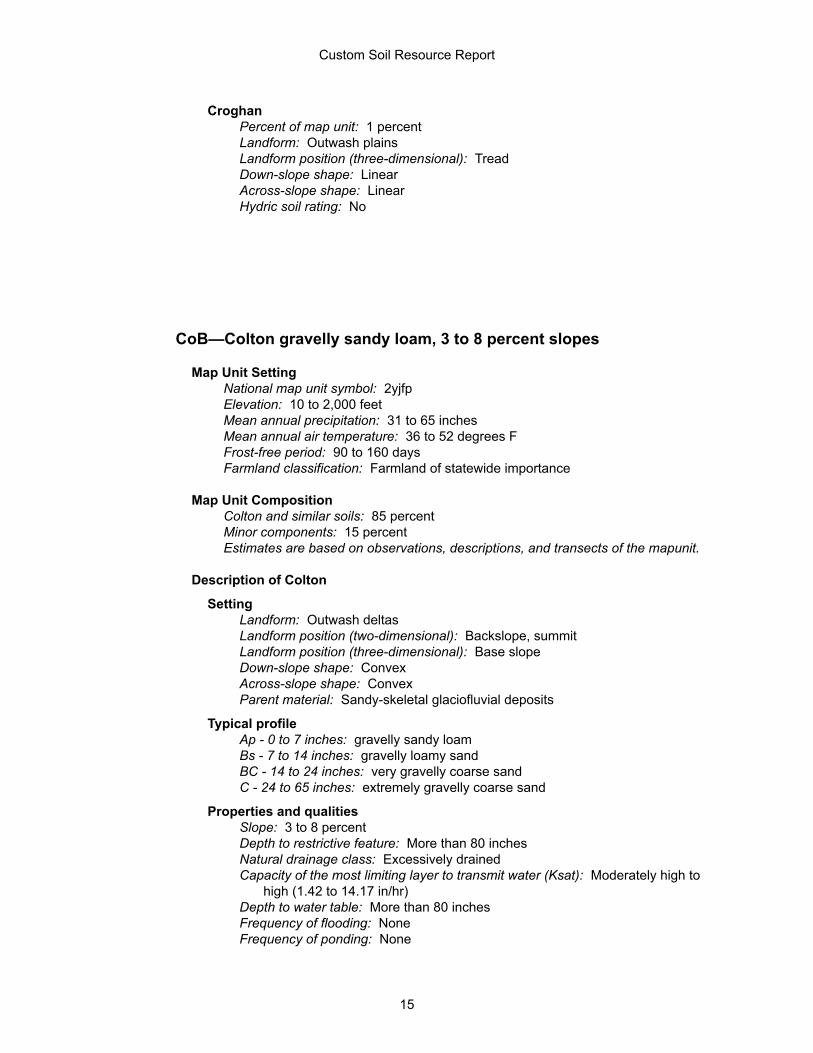
CroghanPercent of map unit: 1 percentLandform: Outwash plainsLandform position (three-dimensional): TreadDown-slope shape: LinearAcross-slope shape: LinearHydric soil rating: No
CoB—Colton gravelly sandy loam, 3 to 8 percent slopes
Map Unit SettingNational map unit symbol: 2yjfpElevation: 10 to 2,000 feetMean annual precipitation: 31 to 65 inchesMean annual air temperature: 36 to 52 degrees FFrost-free period: 90 to 160 daysFarmland classification: Farmland of statewide importance
Map Unit CompositionColton and similar soils: 85 percentMinor components: 15 percentEstimates are based on observations, descriptions, and transects of the mapunit.
Description of Colton
SettingLandform: Outwash deltasLandform position (two-dimensional): Backslope, summitLandform position (three-dimensional): Base slopeDown-slope shape: ConvexAcross-slope shape: ConvexParent material: Sandy-skeletal glaciofluvial deposits
Typical profileAp - 0 to 7 inches: gravelly sandy loamBs - 7 to 14 inches: gravelly loamy sandBC - 14 to 24 inches: very gravelly coarse sandC - 24 to 65 inches: extremely gravelly coarse sand
Properties and qualitiesSlope: 3 to 8 percentDepth to restrictive feature: More than 80 inchesNatural drainage class: Excessively drainedCapacity of the most limiting layer to transmit water (Ksat): Moderately high to
high (1.42 to 14.17 in/hr)Depth to water table: More than 80 inchesFrequency of flooding: NoneFrequency of ponding: None
Custom Soil Resource Report
15
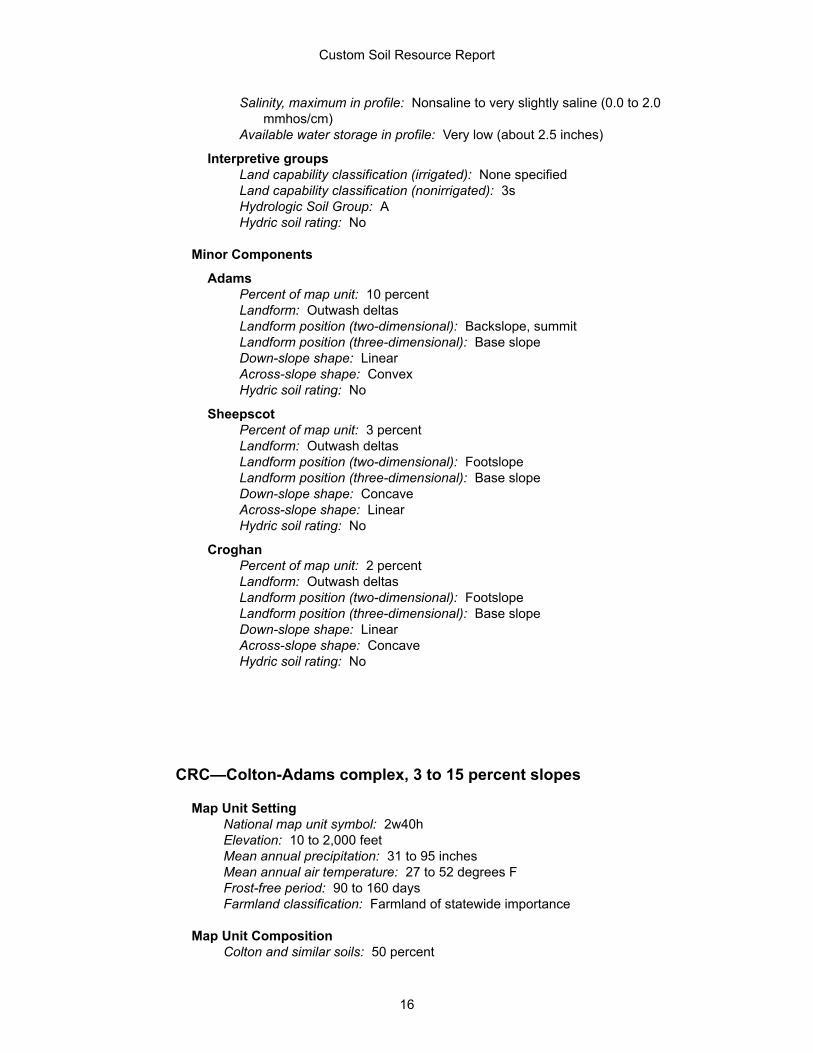
Salinity, maximum in profile: Nonsaline to very slightly saline (0.0 to 2.0 mmhos/cm)
Available water storage in profile: Very low (about 2.5 inches)
Interpretive groupsLand capability classification (irrigated): None specifiedLand capability classification (nonirrigated): 3sHydrologic Soil Group: AHydric soil rating: No
Minor Components
AdamsPercent of map unit: 10 percentLandform: Outwash deltasLandform position (two-dimensional): Backslope, summitLandform position (three-dimensional): Base slopeDown-slope shape: LinearAcross-slope shape: ConvexHydric soil rating: No
SheepscotPercent of map unit: 3 percentLandform: Outwash deltasLandform position (two-dimensional): FootslopeLandform position (three-dimensional): Base slopeDown-slope shape: ConcaveAcross-slope shape: LinearHydric soil rating: No
CroghanPercent of map unit: 2 percentLandform: Outwash deltasLandform position (two-dimensional): FootslopeLandform position (three-dimensional): Base slopeDown-slope shape: LinearAcross-slope shape: ConcaveHydric soil rating: No
CRC—Colton-Adams complex, 3 to 15 percent slopes
Map Unit SettingNational map unit symbol: 2w40hElevation: 10 to 2,000 feetMean annual precipitation: 31 to 95 inchesMean annual air temperature: 27 to 52 degrees FFrost-free period: 90 to 160 daysFarmland classification: Farmland of statewide importance
Map Unit CompositionColton and similar soils: 50 percent
Custom Soil Resource Report
16
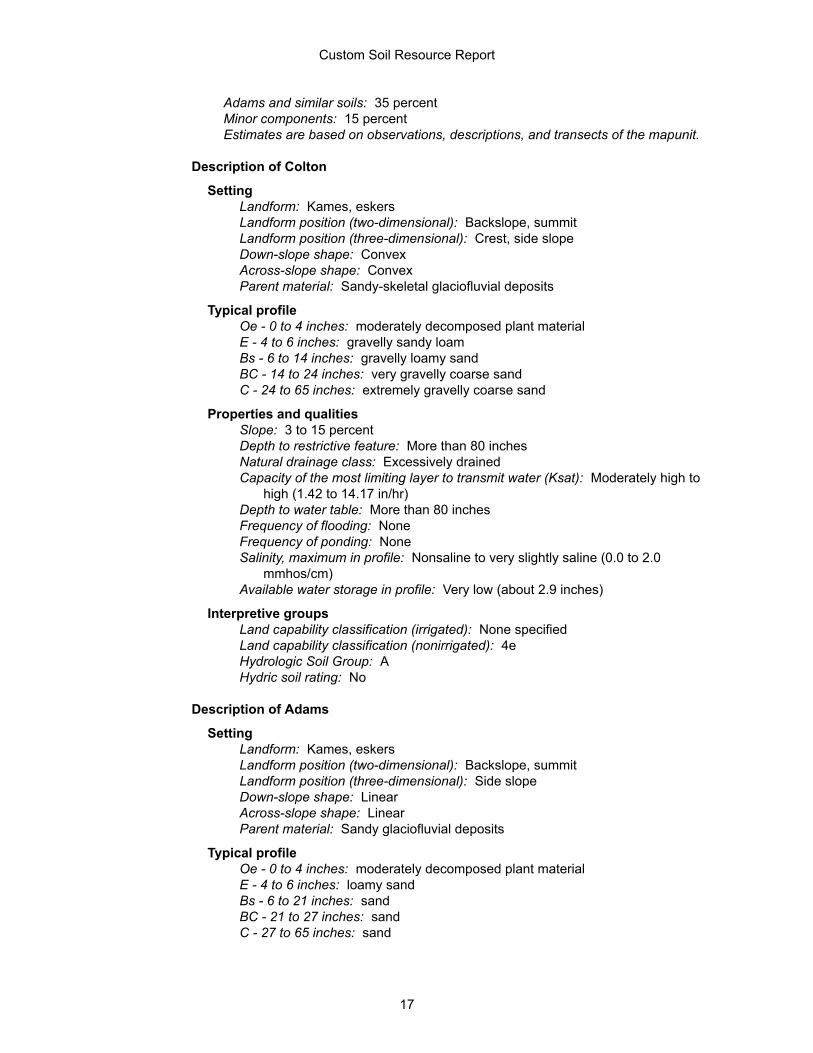
Adams and similar soils: 35 percentMinor components: 15 percentEstimates are based on observations, descriptions, and transects of the mapunit.
Description of Colton
SettingLandform: Kames, eskersLandform position (two-dimensional): Backslope, summitLandform position (three-dimensional): Crest, side slopeDown-slope shape: ConvexAcross-slope shape: ConvexParent material: Sandy-skeletal glaciofluvial deposits
Typical profileOe - 0 to 4 inches: moderately decomposed plant materialE - 4 to 6 inches: gravelly sandy loamBs - 6 to 14 inches: gravelly loamy sandBC - 14 to 24 inches: very gravelly coarse sandC - 24 to 65 inches: extremely gravelly coarse sand
Properties and qualitiesSlope: 3 to 15 percentDepth to restrictive feature: More than 80 inchesNatural drainage class: Excessively drainedCapacity of the most limiting layer to transmit water (Ksat): Moderately high to
high (1.42 to 14.17 in/hr)Depth to water table: More than 80 inchesFrequency of flooding: NoneFrequency of ponding: NoneSalinity, maximum in profile: Nonsaline to very slightly saline (0.0 to 2.0
mmhos/cm)Available water storage in profile: Very low (about 2.9 inches)
Interpretive groupsLand capability classification (irrigated): None specifiedLand capability classification (nonirrigated): 4eHydrologic Soil Group: AHydric soil rating: No
Description of Adams
SettingLandform: Kames, eskersLandform position (two-dimensional): Backslope, summitLandform position (three-dimensional): Side slopeDown-slope shape: LinearAcross-slope shape: LinearParent material: Sandy glaciofluvial deposits
Typical profileOe - 0 to 4 inches: moderately decomposed plant materialE - 4 to 6 inches: loamy sandBs - 6 to 21 inches: sandBC - 21 to 27 inches: sandC - 27 to 65 inches: sand
Custom Soil Resource Report
17
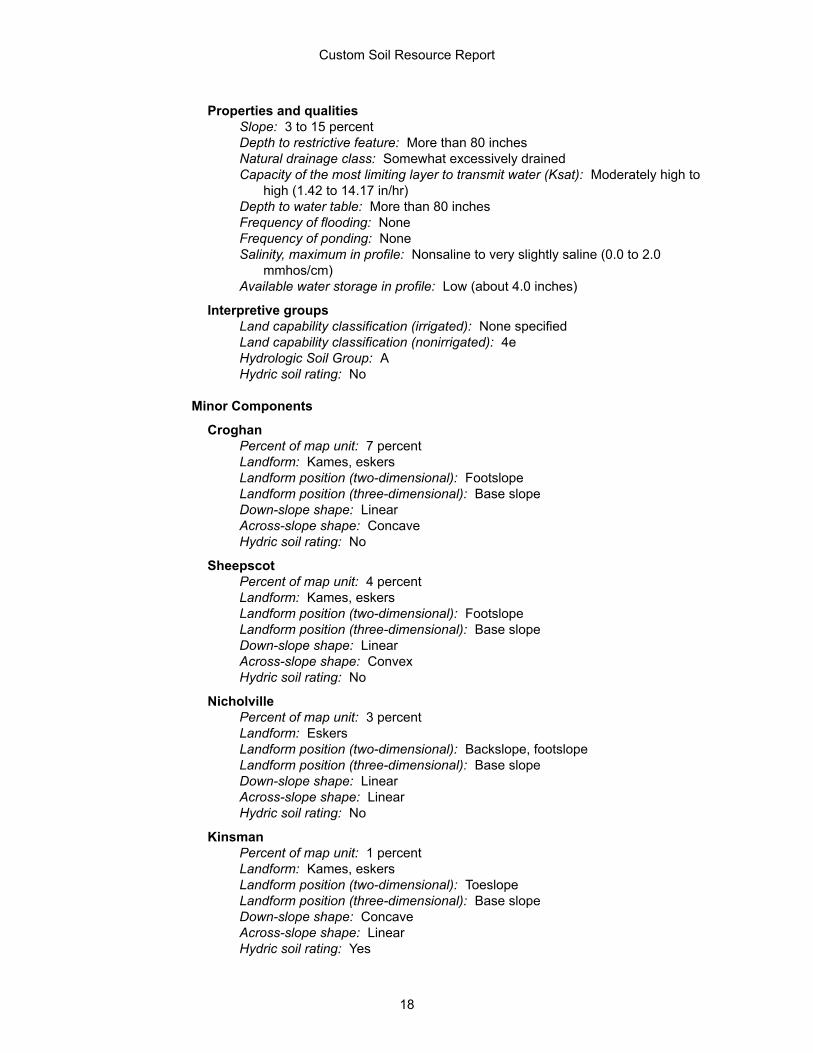
Properties and qualitiesSlope: 3 to 15 percentDepth to restrictive feature: More than 80 inchesNatural drainage class: Somewhat excessively drainedCapacity of the most limiting layer to transmit water (Ksat): Moderately high to
high (1.42 to 14.17 in/hr)Depth to water table: More than 80 inchesFrequency of flooding: NoneFrequency of ponding: NoneSalinity, maximum in profile: Nonsaline to very slightly saline (0.0 to 2.0
mmhos/cm)Available water storage in profile: Low (about 4.0 inches)
Interpretive groupsLand capability classification (irrigated): None specifiedLand capability classification (nonirrigated): 4eHydrologic Soil Group: AHydric soil rating: No
Minor Components
CroghanPercent of map unit: 7 percentLandform: Kames, eskersLandform position (two-dimensional): FootslopeLandform position (three-dimensional): Base slopeDown-slope shape: LinearAcross-slope shape: ConcaveHydric soil rating: No
SheepscotPercent of map unit: 4 percentLandform: Kames, eskersLandform position (two-dimensional): FootslopeLandform position (three-dimensional): Base slopeDown-slope shape: LinearAcross-slope shape: ConvexHydric soil rating: No
NicholvillePercent of map unit: 3 percentLandform: EskersLandform position (two-dimensional): Backslope, footslopeLandform position (three-dimensional): Base slopeDown-slope shape: LinearAcross-slope shape: LinearHydric soil rating: No
KinsmanPercent of map unit: 1 percentLandform: Kames, eskersLandform position (two-dimensional): ToeslopeLandform position (three-dimensional): Base slopeDown-slope shape: ConcaveAcross-slope shape: LinearHydric soil rating: Yes
Custom Soil Resource Report
18
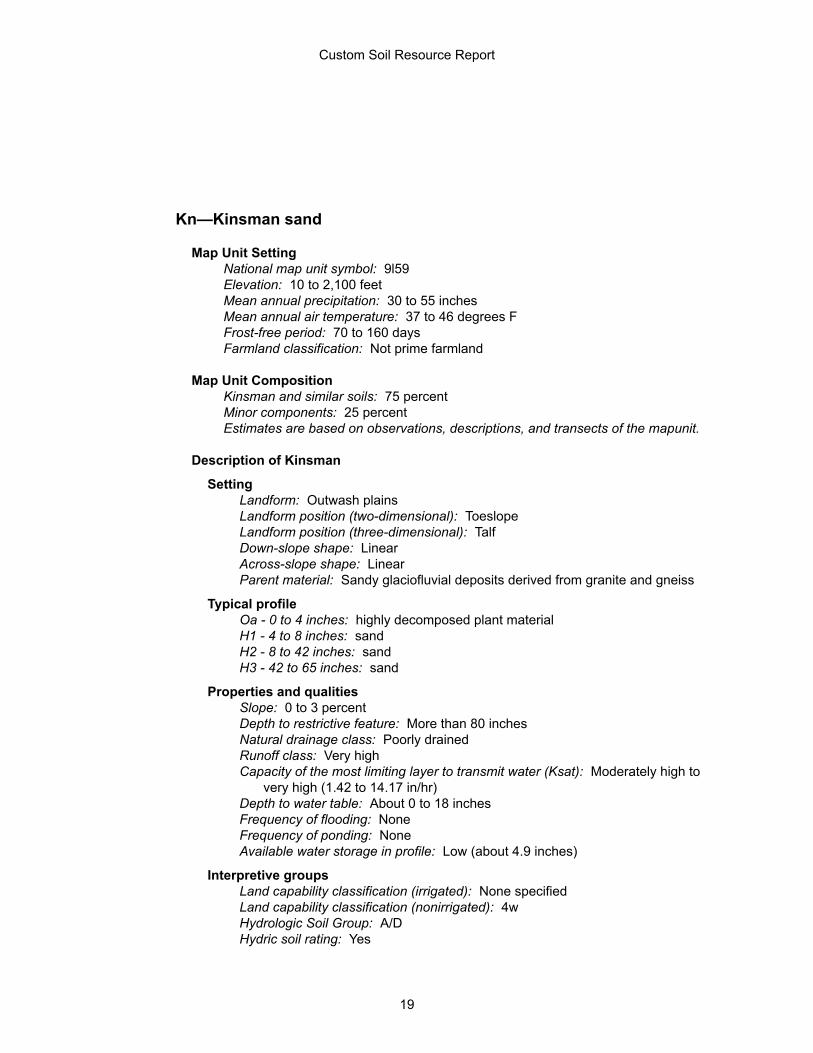
Kn—Kinsman sand
Map Unit SettingNational map unit symbol: 9l59Elevation: 10 to 2,100 feetMean annual precipitation: 30 to 55 inchesMean annual air temperature: 37 to 46 degrees FFrost-free period: 70 to 160 daysFarmland classification: Not prime farmland
Map Unit CompositionKinsman and similar soils: 75 percentMinor components: 25 percentEstimates are based on observations, descriptions, and transects of the mapunit.
Description of Kinsman
SettingLandform: Outwash plainsLandform position (two-dimensional): ToeslopeLandform position (three-dimensional): TalfDown-slope shape: LinearAcross-slope shape: LinearParent material: Sandy glaciofluvial deposits derived from granite and gneiss
Typical profileOa - 0 to 4 inches: highly decomposed plant materialH1 - 4 to 8 inches: sandH2 - 8 to 42 inches: sandH3 - 42 to 65 inches: sand
Properties and qualitiesSlope: 0 to 3 percentDepth to restrictive feature: More than 80 inchesNatural drainage class: Poorly drainedRunoff class: Very highCapacity of the most limiting layer to transmit water (Ksat): Moderately high to
very high (1.42 to 14.17 in/hr)Depth to water table: About 0 to 18 inchesFrequency of flooding: NoneFrequency of ponding: NoneAvailable water storage in profile: Low (about 4.9 inches)
Interpretive groupsLand capability classification (irrigated): None specifiedLand capability classification (nonirrigated): 4wHydrologic Soil Group: A/DHydric soil rating: Yes
Custom Soil Resource Report
19
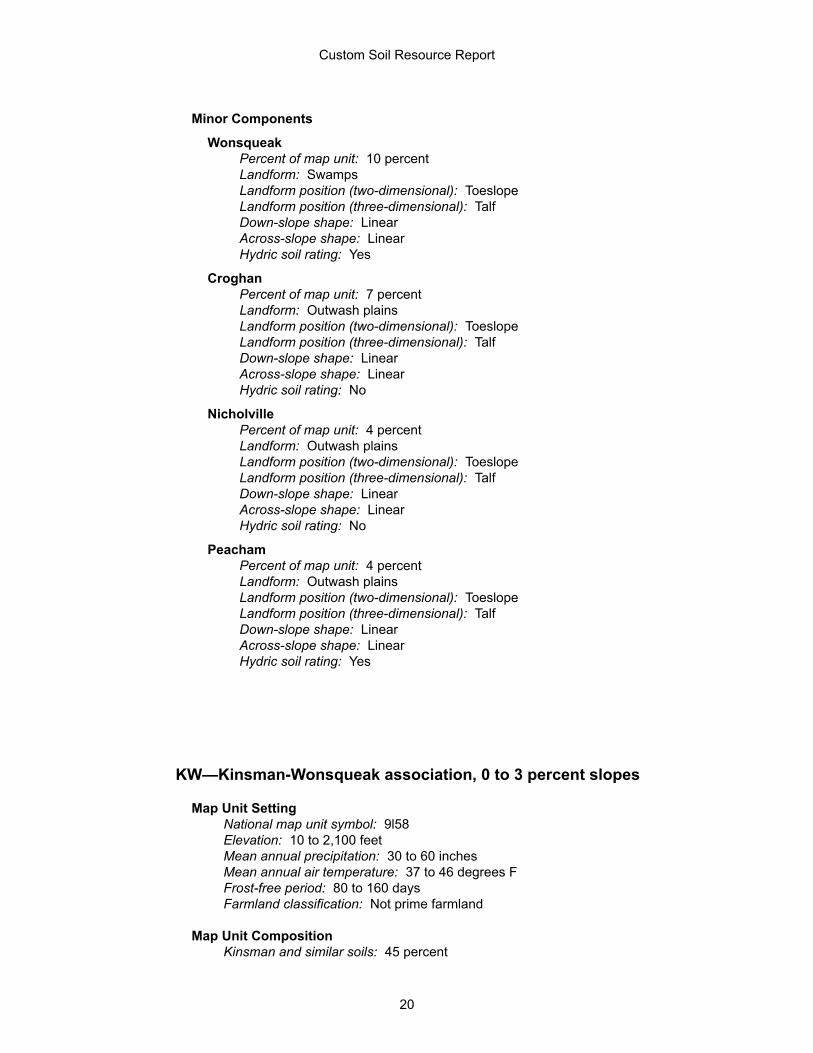
Minor Components
WonsqueakPercent of map unit: 10 percentLandform: SwampsLandform position (two-dimensional): ToeslopeLandform position (three-dimensional): TalfDown-slope shape: LinearAcross-slope shape: LinearHydric soil rating: Yes
CroghanPercent of map unit: 7 percentLandform: Outwash plainsLandform position (two-dimensional): ToeslopeLandform position (three-dimensional): TalfDown-slope shape: LinearAcross-slope shape: LinearHydric soil rating: No
NicholvillePercent of map unit: 4 percentLandform: Outwash plainsLandform position (two-dimensional): ToeslopeLandform position (three-dimensional): TalfDown-slope shape: LinearAcross-slope shape: LinearHydric soil rating: No
PeachamPercent of map unit: 4 percentLandform: Outwash plainsLandform position (two-dimensional): ToeslopeLandform position (three-dimensional): TalfDown-slope shape: LinearAcross-slope shape: LinearHydric soil rating: Yes
KW—Kinsman-Wonsqueak association, 0 to 3 percent slopes
Map Unit SettingNational map unit symbol: 9l58Elevation: 10 to 2,100 feetMean annual precipitation: 30 to 60 inchesMean annual air temperature: 37 to 46 degrees FFrost-free period: 80 to 160 daysFarmland classification: Not prime farmland
Map Unit CompositionKinsman and similar soils: 45 percent
Custom Soil Resource Report
20
Wonsqueak and similar soils: 35 percentMinor components: 20 percentEstimates are based on observations, descriptions, and transects of the mapunit.
Description of Kinsman
SettingLandform: Outwash plainsLandform position (two-dimensional): ToeslopeLandform position (three-dimensional): TalfDown-slope shape: LinearAcross-slope shape: LinearParent material: Sandy glaciofluvial deposits derived from granite and gneiss
Typical profileOa - 0 to 4 inches: highly decomposed plant materialH1 - 4 to 8 inches: sandH2 - 8 to 42 inches: sandH3 - 42 to 65 inches: sand
Properties and qualitiesSlope: 0 to 3 percentDepth to restrictive feature: More than 80 inchesNatural drainage class: Poorly drainedRunoff class: Very highCapacity of the most limiting layer to transmit water (Ksat): Moderately high to
very high (1.42 to 14.17 in/hr)Depth to water table: About 0 to 18 inchesFrequency of flooding: NoneFrequency of ponding: NoneAvailable water storage in profile: Low (about 4.9 inches)
Interpretive groupsLand capability classification (irrigated): None specifiedLand capability classification (nonirrigated): 4wHydrologic Soil Group: A/DHydric soil rating: Yes
Description of Wonsqueak
SettingLandform: SwampsLandform position (two-dimensional): ToeslopeLandform position (three-dimensional): TalfDown-slope shape: LinearAcross-slope shape: LinearParent material: Organic material
Typical profileOa1 - 0 to 8 inches: muckOa2 - 8 to 30 inches: muckCg - 30 to 65 inches: silty clay loam
Properties and qualitiesSlope: 0 to 2 percentDepth to restrictive feature: More than 80 inchesNatural drainage class: Very poorly drainedRunoff class: Very high
Custom Soil Resource Report
21
Capacity of the most limiting layer to transmit water (Ksat): Moderately high to high (0.20 to 2.00 in/hr)
Depth to water table: About 0 to 6 inchesFrequency of flooding: NoneFrequency of ponding: NoneAvailable water storage in profile: Very high (about 13.8 inches)
Interpretive groupsLand capability classification (irrigated): None specifiedLand capability classification (nonirrigated): 7wHydrologic Soil Group: B/DHydric soil rating: Yes
Minor Components
SheepscotPercent of map unit: 5 percentLandform: Outwash plainsLandform position (two-dimensional): ToeslopeLandform position (three-dimensional): TalfDown-slope shape: LinearAcross-slope shape: LinearHydric soil rating: No
CroghanPercent of map unit: 5 percentLandform: Outwash plainsLandform position (two-dimensional): ToeslopeLandform position (three-dimensional): TalfDown-slope shape: LinearAcross-slope shape: LinearHydric soil rating: No
ScanticPercent of map unit: 3 percentLandform: Marine terraces, river valleysLandform position (two-dimensional): ToeslopeLandform position (three-dimensional): TalfDown-slope shape: LinearAcross-slope shape: LinearEcological site: Marine Terrace Flat (F144BY001ME)Hydric soil rating: Yes
BucksportPercent of map unit: 3 percentLandform: SwampsLandform position (two-dimensional): ToeslopeLandform position (three-dimensional): TalfDown-slope shape: LinearAcross-slope shape: LinearHydric soil rating: Yes
RoundaboutPercent of map unit: 2 percentLandform: Outwash plainsLandform position (two-dimensional): ToeslopeLandform position (three-dimensional): Talf
Custom Soil Resource Report
22
Down-slope shape: LinearAcross-slope shape: LinearHydric soil rating: Yes
Kinsman, stones and boulders > 0.1 percentPercent of map unit: 1 percentLandform: Outwash plainsLandform position (two-dimensional): ToeslopeLandform position (three-dimensional): TalfDown-slope shape: LinearAcross-slope shape: LinearHydric soil rating: Yes
LamoinePercent of map unit: 1 percentLandform: Outwash plainsLandform position (two-dimensional): ToeslopeLandform position (three-dimensional): TalfDown-slope shape: LinearAcross-slope shape: LinearHydric soil rating: No
SG—Sebago and Moosabec soils
Map Unit SettingNational map unit symbol: 9l6dElevation: 10 to 2,100 feetMean annual precipitation: 18 to 55 inchesMean annual air temperature: 34 to 46 degrees FFrost-free period: 80 to 160 daysFarmland classification: Not prime farmland
Map Unit CompositionSebago and similar soils: 50 percentMoosabec and similar soils: 40 percentMinor components: 10 percentEstimates are based on observations, descriptions, and transects of the mapunit.
Description of Sebago
SettingLandform: BogsLandform position (two-dimensional): ToeslopeLandform position (three-dimensional): TalfDown-slope shape: LinearAcross-slope shape: LinearParent material: Organic material
Typical profileOa1 - 0 to 12 inches: mucky peat
Custom Soil Resource Report
23
Oa2 - 12 to 65 inches: mucky peat
Properties and qualitiesSlope: 0 to 1 percentDepth to restrictive feature: More than 80 inchesNatural drainage class: Very poorly drainedRunoff class: NegligibleCapacity of the most limiting layer to transmit water (Ksat): High (2.00 to 6.00
in/hr)Depth to water table: About 0 to 6 inchesFrequency of flooding: NoneFrequency of ponding: FrequentAvailable water storage in profile: Very high (about 20.9 inches)
Interpretive groupsLand capability classification (irrigated): None specifiedLand capability classification (nonirrigated): 8wHydrologic Soil Group: A/DHydric soil rating: Yes
Description of Moosabec
SettingLandform: Raised bogsLandform position (two-dimensional): ToeslopeLandform position (three-dimensional): TalfDown-slope shape: LinearAcross-slope shape: LinearParent material: Fibrist organic material
Typical profileOi - 0 to 65 inches: peat
Properties and qualitiesSlope: 0 to 1 percentDepth to restrictive feature: More than 80 inchesNatural drainage class: Very poorly drainedRunoff class: Very highCapacity of the most limiting layer to transmit water (Ksat): High to very high (6.00
to 20.00 in/hr)Depth to water table: About 0 to 24 inchesFrequency of flooding: NoneFrequency of ponding: NoneAvailable water storage in profile: Very high (about 20.9 inches)
Interpretive groupsLand capability classification (irrigated): None specifiedLand capability classification (nonirrigated): 8wHydrologic Soil Group: A/DHydric soil rating: Yes
Minor Components
BucksportPercent of map unit: 5 percentLandform: SwampsLandform position (two-dimensional): ToeslopeLandform position (three-dimensional): Talf
Custom Soil Resource Report
24
Down-slope shape: LinearAcross-slope shape: LinearHydric soil rating: Yes
WonsqueakPercent of map unit: 5 percentLandform: SwampsLandform position (two-dimensional): FootslopeLandform position (three-dimensional): TreadDown-slope shape: ConcaveAcross-slope shape: LinearHydric soil rating: Yes
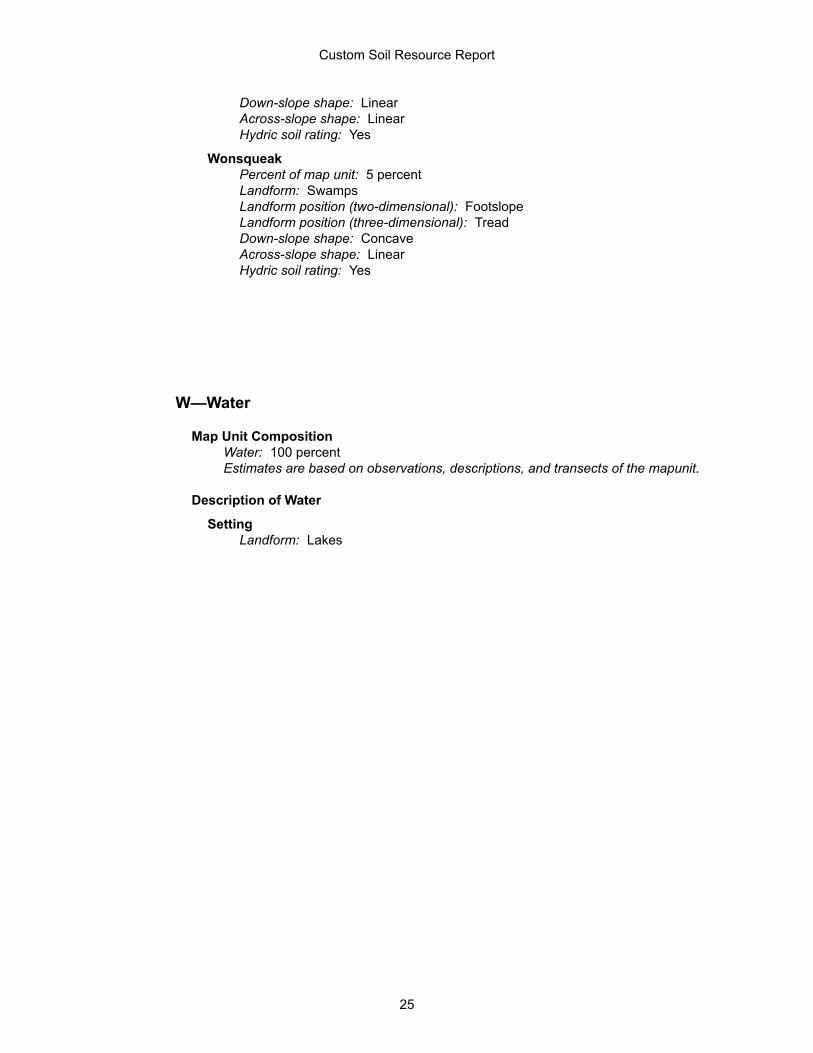
W—Water
Map Unit CompositionWater: 100 percentEstimates are based on observations, descriptions, and transects of the mapunit.
Description of Water
SettingLandform: Lakes
Custom Soil Resource Report
25
ReferencesAmerican Association of State Highway and Transportation Officials (AASHTO). 2004. Standard specifications for transportation materials and methods of sampling and testing. 24th edition.
American Society for Testing and Materials (ASTM). 2005. Standard classification of soils for engineering purposes. ASTM Standard D2487-00.
Cowardin, L.M., V. Carter, F.C. Golet, and E.T. LaRoe. 1979. Classification of wetlands and deep-water habitats of the United States. U.S. Fish and Wildlife Service FWS/OBS-79/31.
Federal Register. July 13, 1994. Changes in hydric soils of the United States.
Federal Register. September 18, 2002. Hydric soils of the United States.
Hurt, G.W., and L.M. Vasilas, editors. Version 6.0, 2006. Field indicators of hydric soils in the United States.
National Research Council. 1995. Wetlands: Characteristics and boundaries.
Soil Survey Division Staff. 1993. Soil survey manual. Soil Conservation Service. U.S. Department of Agriculture Handbook 18. http://www.nrcs.usda.gov/wps/portal/nrcs/detail/national/soils/?cid=nrcs142p2_054262
Soil Survey Staff. 1999. Soil taxonomy: A basic system of soil classification for making and interpreting soil surveys. 2nd edition. Natural Resources Conservation Service, U.S. Department of Agriculture Handbook 436. http://www.nrcs.usda.gov/wps/portal/nrcs/detail/national/soils/?cid=nrcs142p2_053577
Soil Survey Staff. 2010. Keys to soil taxonomy. 11th edition. U.S. Department of Agriculture, Natural Resources Conservation Service. http://www.nrcs.usda.gov/wps/portal/nrcs/detail/national/soils/?cid=nrcs142p2_053580
Tiner, R.W., Jr. 1985. Wetlands of Delaware. U.S. Fish and Wildlife Service and Delaware Department of Natural Resources and Environmental Control, Wetlands Section.
United States Army Corps of Engineers, Environmental Laboratory. 1987. Corps of Engineers wetlands delineation manual. Waterways Experiment Station Technical Report Y-87-1.
United States Department of Agriculture, Natural Resources Conservation Service. National forestry manual. http://www.nrcs.usda.gov/wps/portal/nrcs/detail/soils/home/?cid=nrcs142p2_053374
United States Department of Agriculture, Natural Resources Conservation Service. National range and pasture handbook. http://www.nrcs.usda.gov/wps/portal/nrcs/detail/national/landuse/rangepasture/?cid=stelprdb1043084
26
United States Department of Agriculture, Natural Resources Conservation Service. National soil survey handbook, title 430-VI. http://www.nrcs.usda.gov/wps/portal/nrcs/detail/soils/scientists/?cid=nrcs142p2_054242
United States Department of Agriculture, Natural Resources Conservation Service. 2006. Land resource regions and major land resource areas of the United States, the Caribbean, and the Pacific Basin. U.S. Department of Agriculture Handbook 296. http://www.nrcs.usda.gov/wps/portal/nrcs/detail/national/soils/?cid=nrcs142p2_053624
United States Department of Agriculture, Soil Conservation Service. 1961. Land capability classification. U.S. Department of Agriculture Handbook 210. http://www.nrcs.usda.gov/Internet/FSE_DOCUMENTS/nrcs142p2_052290.pdf
Custom Soil Resource Report
27

KINGFISH MAINE SITE LOCATION OF DEVELOPMENT APPLICATION
APPENDIX 11B Geotechnical Report
REPORT 19-1758.3 S January 5, 2021
Explorations, Geotechnical Engineering Services & Soil Resistivity Testing Proposed Aquaculture Facility Kingfish Maine, Inc. Dun Garvin Road Jonesport, ME Prepared For: Kingfish Zeeland Maine c/o: Gartley & Dorsky Engineering & Surveying Attention: William T. Lane, P.E., Vice President P.O. Box 1031 Camden, ME 04843 Prepared By: S. W. Cole Engineering, Inc. 37 Liberty Drive Bangor, ME 04401 Tel: (207) 848-5714
TABLE OF CONTENTS
1.0 INTRODUCTION.................................................................................................................. 1
1.1 Scope and Purpose .......................................................................................................... 1
1.2 Site and Proposed Construction ....................................................................................... 2
2.0 EXPLORATION AND TESTING ........................................................................................... 3
2.1 Explorations ..................................................................................................................... 3
2.1.1 Current Explorations .............................................................................................. 3
2.1.2 Prior Explorations .................................................................................................. 3
2.2 Testing ............................................................................................................................. 3
3.0 SUBSURFACE CONDITIONS ............................................................................................. 4
3.1 Soil and Bedrock .............................................................................................................. 4
3.1.1 Current Explorations .............................................................................................. 4
3.1.2 Prior Explorations .................................................................................................. 5
3.2 Groundwater .................................................................................................................... 5
3.3 Thermal Resistivity ........................................................................................................... 5
3.4 Electrical Resistivity ......................................................................................................... 6
4.0 EVALUATION AND RECOMMENDATIONS ........................................................................ 6
4.1 General Findings .............................................................................................................. 6
4.2 Site and Subgrade Preparation ........................................................................................ 7
4.3 Excavation and Dewatering .............................................................................................. 8
4.4 Foundations and Walls ..................................................................................................... 9
4.5 Foundation Drainage .......................................................................................................10
4.6 Slab-On-Grade ................................................................................................................10
4.7 Entrance Slabs, Sidewalks and Exterior Slabs ................................................................11
4.8 Embankment Construction ..............................................................................................11
4.9 Backfill and Compaction ..................................................................................................12
4.10 Weather Considerations ................................................................................................13
4.11 Design Review and Construction Testing ......................................................................13
5.0 CLOSURE...........................................................................................................................14
Appendix A Limitations Appendix B Figures Appendix C Exploration Logs, Refusal Summary Sheet & Key Appendix D Laboratory Test Results Appendix E Electrical Resistivity Test Results

1
19-1758.3 S
January 5, 2021
Kingfish Zeeland Maine c/o: Gartley & Dorsky Engineering & Surveying Attention: William T. Lane, P.E., Vice President P.O. Box 1031 Camden, ME 04843 Subject: Explorations, Geotechnical Engineering Services & Soil Resistivity Testing
Proposed Aquaculture Facility Kingfish Maine, Inc. Dun Garvin Road Jonesport, ME
Dear Bill: In accordance with our Proposal dated September 29, 2020, we have performed explorations, a geotechnical evaluation and soil resistivity testing for the subject project. This report summarizes our findings and geotechnical recommendations and its contents are subject to the limitations set forth in Appendix A. S. W. Cole Engineering, Inc. (S.W.COLE) previously performed a geotechnical investigation and submitted a Preliminary Geotechnical Report, dated March 23, 2020, which has been superseded by this report. 1.0 INTRODUCTION 1.1 Scope and Purpose The purpose of our services was to obtain additional subsurface information at the site in order to develop design geotechnical recommendations relative to foundations and earthwork associated with the proposed construction. Our scope of services included completion of eighteen test boring, nine ledge probes and three test pit explorations, soil resistivity testing, geotechnical laboratory testing, a geotechnical analysis of the subsurface findings and preparation of this report.
19-1758.3 S January 5, 2021
2
1.2 Site and Proposed Construction The site is located on Dun Garvin Road in Jonesport, Maine. The site generally consists of undeveloped areas with several small structures from previous development. The site includes open field area bordered by moderate to heavily wooded areas. The site is generally bisected by an existing gravel surfaced roadway. The site is bound along the eastern extent by the Atlantic Ocean. Based on the provided topographical information, the site for the proposed development generally slopes downward from west to east, from about elevation 65 to 35 feet. We understand development plans call for construction of an aquaculture facility to produce Dutch Yellowtail fish. Based on the Site Plan, dated December 14, 2020, from Gartley & Dorsky Engineering & Surveying (Gartley & Dorsky), we understand the main building, identified as Building 2, will include a structure on the order of 509,808 square feet (SF). We understand current design concepts for Building 2 include a Finish Floor Elevation (FFE) at elevation 55 feet. We understand grow-out tanks are proposed within Building 2 and will be founded at the on-grade slab elevation. We anticipate the foundations will extend up to 10 feet below the proposed FFE to allow for plumbing and utilities below on-grade slabs. We understand Building 1 is proposed directly north of building 2 and will include a structure on the order of 55,000 SF. We understand current design concepts for Building 1 include a FFE at elevation 54 feet. We understand the buildings will include multi-level, steel-framed construction with spread footing foundations and on-grade and elevated slabs. Additionally, smaller ancillary structures associated with the facility are proposed along the northern and southern extents. We understand a pump station associated with the intake and outlet pipes is proposed to the east of the buildings, adjacent to the Atlantic Ocean. Additionally, we understand access drives and parking areas are proposed adjacent to the building structures. Existing grades within the footprints of Buildings 1 and 2 generally slope downward from west to east from about elevation 62 to 36 feet requiring tapered cuts approaching 7 feet and tapered fills approaching 20 feet to achieve proposed FFE. Additionally, based on the proposed foundations extending to depths of about 10 feet below FFE, cuts on the order of 17 feet will be required to achieve proposed bottom of foundation grades. Details regarding structural loading are unknown at this time.
19-1758.3 S January 5, 2021
3
Proposed and existing site features are shown on the “Exploration Location Plan” attached in Appendix B. 2.0 EXPLORATION AND TESTING 2.1 Explorations
2.1.1 Current Explorations Eighteen test borings (B-101 through B-118) and 9 ledge probes (P-101 through P-109) were made at the site from October 26 to 29, 2020 by S. W. Cole Explorations, LLC. Three test pits (TP-1 through TP-3) were made at the site on November 23, 2020 to perform in-situ thermal resistivity testing. The test pits were made by Hanscom Construction, Inc. of Marshfield, Maine working under subcontract to S.W.COLE. The exploration locations were selected by Gartley & Dorsky and S.W.COLE. The explorations were established in the field by S.W.COLE using a sub-meter mapping grade GPS unit. The approximate exploration locations are shown on the “Exploration Location Plan” attached in Appendix B. Logs of the explorations, a refusal summary sheet and a key to the notes and symbols used on the logs are attached in Appendix C. The elevations shown on the exploration logs and refusal summary sheet were interpolated from existing ground contours as shown on the “Exploration Location Plan”.
2.1.2 Prior Explorations S.W.COLE performed a geotechnical investigation and submitted a Preliminary Geotechnical Report, dated March 23, 2020. The approximate location of our prior explorations, including twenty test borings (B-1 through B-20) and eleven ledge probes (P-1 through P-11), are shown on the “Exploration Location Plan” attached in Appendix B. Logs of the prior explorations are attached in Appendix C. 2.2 Testing The explorations were drilled using hollow-stem auger and cased wash-boring techniques. The soils were sampled at 2 to 5 foot intervals using a split spoon sampler and Standard Penetration Testing (SPT) methods. SPT blow counts are shown on the logs. Upon encountering bedrock, test borings B-101, B-102, B-110 and B-114 were advanced about 5 feet into bedrock using NQ2 rock core drilling techniques.
19-1758.3 S January 5, 2021
4
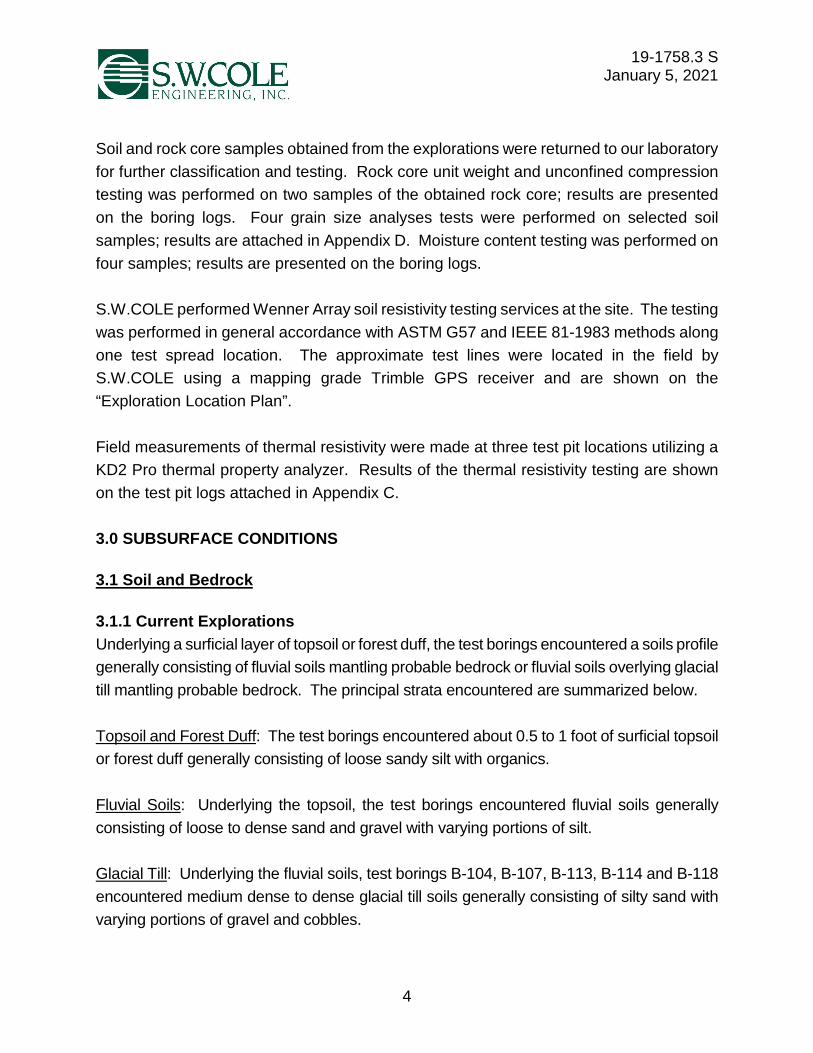
Soil and rock core samples obtained from the explorations were returned to our laboratory for further classification and testing. Rock core unit weight and unconfined compression testing was performed on two samples of the obtained rock core; results are presented on the boring logs. Four grain size analyses tests were performed on selected soil samples; results are attached in Appendix D. Moisture content testing was performed on four samples; results are presented on the boring logs. S.W.COLE performed Wenner Array soil resistivity testing services at the site. The testing was performed in general accordance with ASTM G57 and IEEE 81-1983 methods along one test spread location. The approximate test lines were located in the field by S.W.COLE using a mapping grade Trimble GPS receiver and are shown on the “Exploration Location Plan”. Field measurements of thermal resistivity were made at three test pit locations utilizing a KD2 Pro thermal property analyzer. Results of the thermal resistivity testing are shown on the test pit logs attached in Appendix C. 3.0 SUBSURFACE CONDITIONS 3.1 Soil and Bedrock 3.1.1 Current Explorations Underlying a surficial layer of topsoil or forest duff, the test borings encountered a soils profile generally consisting of fluvial soils mantling probable bedrock or fluvial soils overlying glacial till mantling probable bedrock. The principal strata encountered are summarized below. Topsoil and Forest Duff: The test borings encountered about 0.5 to 1 foot of surficial topsoil or forest duff generally consisting of loose sandy silt with organics. Fluvial Soils: Underlying the topsoil, the test borings encountered fluvial soils generally consisting of loose to dense sand and gravel with varying portions of silt. Glacial Till: Underlying the fluvial soils, test borings B-104, B-107, B-113, B-114 and B-118 encountered medium dense to dense glacial till soils generally consisting of silty sand with varying portions of gravel and cobbles.
19-1758.3 S January 5, 2021
5
Bedrock: All test boring and probe explorations were terminated on refusal surfaces (probable bedrock) at depths ranging from about 2 to 32 feet. A refusal summary sheet is attached in Appendix C. Upon encountering bedrock, test borings B-101, B-102, B-110 and B-114 were advanced about 5 feet into bedrock using NQ2 rock core drilling techniques. The bedrock consisted of gray volcanic rock of the Edmunds Formation. The Rock Quality Designation (RQD) value for the bedrock core ranged from 0 to 75 percent correlating to a Rock Mass Quality (RMQ) of very poor to good. Not all the strata were encountered at each exploration; refer to the attached logs for more detailed subsurface information.
3.1.2 Prior Explorations S.W.COLE completed a geotechnical investigation at the site in February 2020. The previous explorations encountered similar subsurface conditions, generally consisting of fluvial soils mantling probable bedrock or fluvial soils overlying glacial till mantling probable bedrock. Logs of the prior explorations are attached in Appendix C. 3.2 Groundwater Free water was observed in test borings B-109, B-113 and B-118 at depths ranging from the ground surface to about 11 feet. The soils were observed wet to saturated in test borings B-101 through B-104, B-106, B-107, B-110 through B-112 and B-114 through B-117 below depths of about 5 to 15 feet. Groundwater likely becomes perched on the relatively impervious silty native soils and bedrock encountered at the test borings. Long term groundwater information is not available. It should be anticipated that groundwater levels will fluctuate, particularly in response to periods of snowmelt and precipitation, as well as changes in site use and the adjacent tidal Atlantic Ocean. 3.3 Thermal Resistivity Field measurements of thermal resistivity were made at three test pit locations (TP-1 through TP-3) utilizing a KD2 Pro thermal property analyzer. Thermal resistivity is dependent on material type, density, and moisture content, and will vary accordingly in field tests. Field thermal resistivity measurements at test pits TP-1, TP-2 and TP-3 were 61.03, 82.06 and 75.39°C - cm / W, respectively. Results of the thermal resistivity testing are shown on the test pit logs attached in Appendix C.
19-1758.3 S January 5, 2021
6
3.4 Electrical Resistivity S.W.COLE performed one field soil electrical resistivity test spread at the site on November 5, 2020. The approximate location of the test spread is shown on the “Exploration Location Plan,” attached in Appendix B. Field soil electrical resistivity testing was performed using the fixed-center Wenner Array method with an AGI SuperSting R1 resistivity meter. The electrical resistivity testing was performed at two mutually perpendicular test lines (KFM.R1A and KFM.R1B) at one fixed-center location within the central portion of the site. Maximum A-spacing for the mutually perpendicular test lines were 300 feet. Instrument settings included automatic current and voltage settings and the use of interference compensation settings (for power at 60 Hz), which helps to minimize interferences to testing from nearby electrical fields. The apparent resistivity testing results are tabulated and graphed on the Resistivity Computation Data Sheets included as Appendix E. As shown on the Resistivity Computation Data Sheets, the apparent resistivity ranged from approximately 2,105 ohm-meters (Ωm) at spread KFM.R1A (1 foot A-spacing) to 8,130 Ωm at spread KFM.R1B (100 foot A-spacing). The apparent resistivity at the test spreads generally show similar trends. Variations in apparent resistivity between test locations and spread locations are interpreted as being due to variations in surficial and bedrock geology, moisture content and depth to water, and proximal unknown interferences. The resistivity data meets our data collection quality guidelines. The resistivity data should be reviewed by a grounding design engineer, in combination with the boring logs, to confirm that they are acceptable for the design of the grounding grid. It should be noted that these apparent resistivity measurements may be higher during drier seasonal conditions. 4.0 EVALUATION AND RECOMMENDATIONS 4.1 General Findings Based on the subsurface findings, the proposed construction appears feasible from a geotechnical standpoint. The principle geotechnical considerations are as follows:
• Relatively shallow bedrock was encountered within the western portion of Building 2. The probable bedrock was generally encountered about 1 to 5 feet above the
19-1758.3 S January 5, 2021
7
proposed bottom of footing grade in the area. We anticipate the bedrock will require blasting for excavation. Blasting should be controlled to reduce overblast; all loose and over-blasted bedrock must be removed beneath the proposed building footprint.
• Spread footings should bear on at least 3 inches of compacted Crushed Stone overlying new compacted fill soils or undisturbed, native soils. On-grade floor slabs should bear on at least 12-inches of properly compacted Structural Fill overlying properly prepared subgrades.
• Subgrades across the site will consist of moisture sensitive fluvial and glacial till soils. Earthwork and grading activities should occur during drier, non-freezing months of late Spring, Summer and Fall. Rubber tired construction equipment should not operate directly on the exposed native soils. Excavation of bearing surfaces should be completed with a smooth-edged bucket to lessen subgrade disturbance.
• Imported Granular Borrow, Structural Fill and Crushed Stone will be required for construction. The native soils are unsuitable for reuse below the proposed buildings or as backfill for foundations; however, may be suitable for reuse below paved and landscape areas, provided they are at a compactable moisture content at the time of construction.
4.2 Site and Subgrade Preparation We recommend site preparation begin with the construction of an erosion control system to protect adjacent drainage ways and areas outside the construction limits. Surficial topsoil and forest duff, soils with organics and roots should be completely removed from areas of proposed fill and construction. We recommend as much vegetation as possible should remain outside the construction areas to lessen the potential for erosion and site disturbance. Following stripping and grubbing of the site, we anticipate blasting will be required to achieve proposed bottom of foundation grades in the western portion of Building 2. We recommend that blasting for bedrock removal be controlled to within 1 foot below footing subgrade elevation for the proposed building. We understand the tanks will require below grade piping, which may require deeper blasting depths. Loose and over-blasted bedrock should be removed beneath the building footprint after blasting. Crushed Stone should be thoroughly worked into the bedrock surface to choke any voids or fractures in the bedrock.
19-1758.3 S January 5, 2021
8
Subgrade soils which become disturbed due to blasting should be removed and replaced with compacted Structural Fill. We recommend excavations to subgrade in soil be performed with a smooth-edged bucket to lessen disturbance of subgrade soils. We recommend footings be founded on 3 inches of compacted Crushed Stone overlying undisturbed native soils or new compacted fill soils. 4.3 Excavation and Dewatering Excavation work will generally encounter surficial organics, topsoil, forest duff, fluvial soils, glacial till, and bedrock. The native soils are moisture sensitive and can experience substantial strength loss if subjected to construction traffic and excavation activities, particularly when wet or thawing. Care must be exercised during construction to limit disturbance of the bearing soils. Earthwork and grading activities should occur during drier, non-freezing Spring, Summer and Fall seasons. Rubber tired construction equipment should not operate directly on the native soils when wet or thawing. Final cuts to subgrade in soil should be performed with a smooth-edged bucket to help reduce soil disturbance. Based on the subsurface findings, we anticipate blasting will be required for bedrock removal. We recommend a licensed blasting contractor be engaged to provide bedrock removal. Pre-blast surveys should be completed on surrounding structures, water supply wells and infrastructure prior to commencing blasting activities. Vibrations from construction should be controlled below threshold limits of 0.5 in/sec for structures, water supply wells and infrastructure within 500 feet of the project site. More restrictive vibration limits may be warranted in specific cases with sensitive equipment, historic structures or artifacts on-site or within close proximity. Groundwater was encountered in the current borings at depths ranging from the existing ground surface to depths of about 15 feet. Open excavations shallower than about 5 to 10 feet appear feasible with conventional sump and pump dewatering techniques. Deeper excavations, such as for over-excavations and utilities, may require sheetpiling and dewatering systems for groundwater cutoff and control. Controlling the water levels to at least 1 foot below planned excavation depths will help stabilize subgrades during construction. Excavations must be properly shored or sloped in accordance with OSHA trenching regulations to prevent sloughing and caving of the sidewalls during construction.

19-1758.3 S January 5, 2021
9
The design and planning of excavations, excavation support systems, and dewatering is the responsibility of the contractor. 4.4 Foundations and Walls Foundations for the proposed buildings should be cast on 3 inches of compacted Crushed Stone overlying undisturbed native fluvial or glacial till soils, compacted Granular Borrow or clean, sound bedrock. For foundations bearing on properly prepared subgrades, we recommend the following geotechnical parameters for design consideration:
Geotechnical Parameters for Spread Footings and Foundation Walls Design Frost Depth 4.5 feet Net Allowable Soil Bearing Pressure 3 ksf Base Friction Factor 0.35 Total Unit Weight of Backfill 130 pcf (compacted Structural Fill) At-Rest Lateral Earth Pressure Coefficient 0.5 (compacted Structural Fill) Internal Friction Angle of Backfill 32° (compacted Structural Fill) Total Post-Construction Settlement 1 inch or less Differential Post-Construction Settlement ½ inch or less
Based on the subsurface findings, we interpret the site soils to correspond to Seismic Soil Site Class D according to IBC 2015/ASCE 7-05. We recommend the following seismic design parameters:
RECOMMENDED SEISMIC DESIGN PARAMETERS Peak Ground Acceleration
(PGA) 0.2-second Spectral
Acceleration (Ss) 1-second Spectral Acceleration (S1)
0.124 g 0.22 g 0.063 g NOTE: Seismic design parameters from OSHPD accessed December, 31, 2020. (https://seismicmaps.org/)
Liquefaction is typically observed in saturated deposits of loose sands and non-plastic silts subjected to ground shaking most commonly from earthquakes. The foundation soils at the site typically consist of medium dense fluvial soils overlying glacial till soils mantling bedrock. Therefore, based on the soils present and the recommended Granular Borrow fill soils, we assess the risk of seismically induced liquefaction occurring at the site is low. Additionally, we assess the risk of seismically induced settlement occurring at the site is low.
19-1758.3 S January 5, 2021
10
4.5 Foundation Drainage We recommend an underdrain system be installed on the outside edge of perimeter footings. The underdrain pipe should consist of 4-inch diameter, perforated SDR-35 foundation drain pipe bedded in Crushed Stone and wrapped in non-woven geotextile fabric such as Mirafi 180N or equivalent. The underdrain pipe must have a positive gravity outlet protected from freezing, clogging and backflow. Surface grades should be sloped away from the building for positive surface water drainage. A general foundation detail sketch is attached in Appendix B. 4.6 Slab-On-Grade On-grade floor slabs in heated areas may be designed using a subgrade reaction modulus of 120 pci (pounds per cubic inch) provided the slab is underlain by at least 12-inches of compacted Structural Fill placed over properly prepared subgrades. The structural engineer or concrete consultant must design steel reinforcing and joint spacing appropriate to slab thickness and function. The presence of shallow bedrock beneath proposed buildings increases the risk of radon intrusion in the building. We recommend a qualified radon consultant be consulted to provide design of a sub-slab radon venting system and positive building pressurization, as needed for indoor air quality. We recommend a sub-slab vapor retarder particularly in areas of the building where the concrete slab will be covered with an impermeable surface treatment or floor covering that may be sensitive to moisture vapors. The vapor retarder must have a permeance that is less than the floor cover or surface treatment that is applied to the slab. The vapor retarder must have sufficient durability to withstand direct contact with the sub-slab base material and construction activity. The vapor retarder material should be placed according to the manufacturer’s recommended method, including the taping and lapping of all joints and wall connections. The architect and/or flooring consultant should select the vapor retarder products compatible with flooring and adhesive materials.
The floor slab should be appropriately cured using moisture retention methods after casting. Typical floor slab curing methods should be used for at least 7 days. The architect or flooring consultant should assign curing methods consistent with current applicable American Concrete Institute (ACI) procedures with consideration of curing method compatibility to proposed surface treatments, flooring and adhesive materials.
19-1758.3 S January 5, 2021
11
4.7 Entrance Slabs, Sidewalks and Exterior Slabs Entrance slabs, sidewalks and exterior slabs must be designed to reduce the effects of differential frost action between adjacent pavement, doorways, and entrances. We recommend that non-frost susceptible Structural Fill be provided to a depth of at least 4.5 feet below the top of entrance slabs, sidewalks, and exterior slabs. This thickness of Structural Fill should extend the full width of the entrance slab, sidewalk and exterior slabs or outward at least 4.5 feet, whichever is greater, thereafter transitioning up to the bottom of the adjacent sidewalk or pavement gravels at a 3H:1V or flatter slope. General details of this frost transition zone are attached in Appendix B. 4.8 Embankment Construction Based on the provided plan, we understand cuts and fills will be needed to achieve finish grade for the building and paved areas. Based on the existing grade, we understand tapered cuts of up to 7 feet and tapered fills of up to 20 feet are anticipated to achieve proposed FFE. Fill slopes should be constructed as level benches, which are overbuilt to facilitate compaction. The final slope face should be constructed by cutting back into the compacted core prior to placing slope surface materials. Embankments constructed on existing soil slopes steeper than 3H:1V should be keyed into the existing ground surface and built with continuous level benches. Embankments constructed on existing soil slopes flatter than 3H:1V may be constructed without keying and continuous benching. Soil slopes will be susceptible to surface erosion, slumping and sloughing, particularly during heavy rain and freeze/thaw events. We recommend slope faces be covered with topsoil and seed. Topsoil and seed should be installed, as soon as practicable, to create a vegetated mat over the entire surface of the slope. Slopes that are steeper than 2H:1V should be covered with an erosion control fabric. Slopes steeper than 1.5H:1V should be covered with geotextile fabric and rip-rap. We do not recommend slopes steeper than 1H:1V. If areas where surface water is concentrated and discharged over the slope are proposed, we recommend covering the slope with rip-rap placed over a layer of Structural Fill and a woven filter fabric.
19-1758.3 S January 5, 2021
12
4.9 Backfill and Compaction We recommend the following fill and backfill materials: recycled products must also be tested in accordance with applicable environmental regulations and approved by a qualified environmental consultant. Granular Borrow: Backfill for over-excavations and fill to raise grades in building and paved areas should be sand or silty sand meeting the gradation requirements of 2020 Maine Department of Transportation (MaineDOT) Standard Specification 703.19 Granular Borrow as given below:
Granular Borrow Sieve Size Percent Finer by Weight
Under Water (Wet Subgrade) Above Water (Dry Subgrade) 12 inch 100 100 3 inch Portion Passing 3 inch Sieve #40 0 to 70 0 to 70 #200 0 to 7 0 to 20
Structural Fill: Fill to repair soft areas, backfill for foundations, slab base material and material below exterior entrances and sidewalks should be clean, non-frost susceptible sand and gravel meeting the gradation requirements for Structural Fill as given below
Structural Fill Sieve Size Percent Finer by Weight
4 inch 100 3 inch 90 to 100 ¼ inch 25 to 90
#40 0 to 30 #200 0 to 6
Crushed Stone: Crushed Stone, used below foundations and for underdrain aggregate, should meet the requirements of 2020 MaineDOT Standard Specification 703.13 Crushed Stone 3/4-Inch. Underdrain Sand: Sand used as backfill around below slab utilities and piping should be clean, free-draining sand meeting the requirements of 2020 MaineDOT Standard
19-1758.3 S January 5, 2021
13
Specification 703.22 Underdrain Backfill Material Type B or as recommended by the Utility Designer. Reuse of Site Soils: The native soils are unsuitable for reuse as fill in the building areas, but may be suitable for re-use in landscape or paved areas, provided they are at a compactable moisture content at the time of construction. If used, the soils should be dried and placed as the lower lifts of fill. Placement and Compaction: Fill should be placed in horizontal lifts and compacted such that the desired density is achieved throughout the lift thickness with 3 to 5 passes of the compaction equipment. Loose lift thicknesses for grading fill, and backfill activities should not exceed 12 inches. We recommend that fill and backfill be compacted to at least 95 percent of its maximum dry density as determined by ASTM D-1557. Crushed Stone should be compacted with 3 to 5 passes of a vibratory plate compactor having a static weight of at least 500 pounds. 4.10 Weather Considerations Construction activity should be limited during wet and freezing weather and the site soils may require drying before construction activities may continue. The contractor should anticipate the need for water to temper fills in order to facilitate compaction during dry weather. If construction takes place during cold weather, subgrades, foundations and floor slabs must be protected during freezing conditions. Concrete and fill must not be placed on frozen soil; and once placed, the concrete and soil beneath the structure must be protected from freezing. 4.11 Design Review and Construction Testing S.W.COLE should be retained to review the construction documents to determine that our earthwork and foundation recommendations have been properly interpreted and implemented. A construction materials testing and special inspections program should be implemented during construction to observe compliance with the design concepts, plans, and specifications. S.W.COLE is available to provide geotechnical observations during earthwork and foundation activities as well as testing and special inspections of soil, concrete, steel, spray-applied fireproofing and asphalt construction materials.
19-1758.3 S January 5, 2021
14
5.0 CLOSURE It has been a pleasure to be of assistance to you with this phase of your project. We look forward to working with you during the construction phase of the project. Sincerely, S. W. Cole Engineering, Inc. Nathan D. Strout, P.E. Geotechnical Engineer NDS:tjb
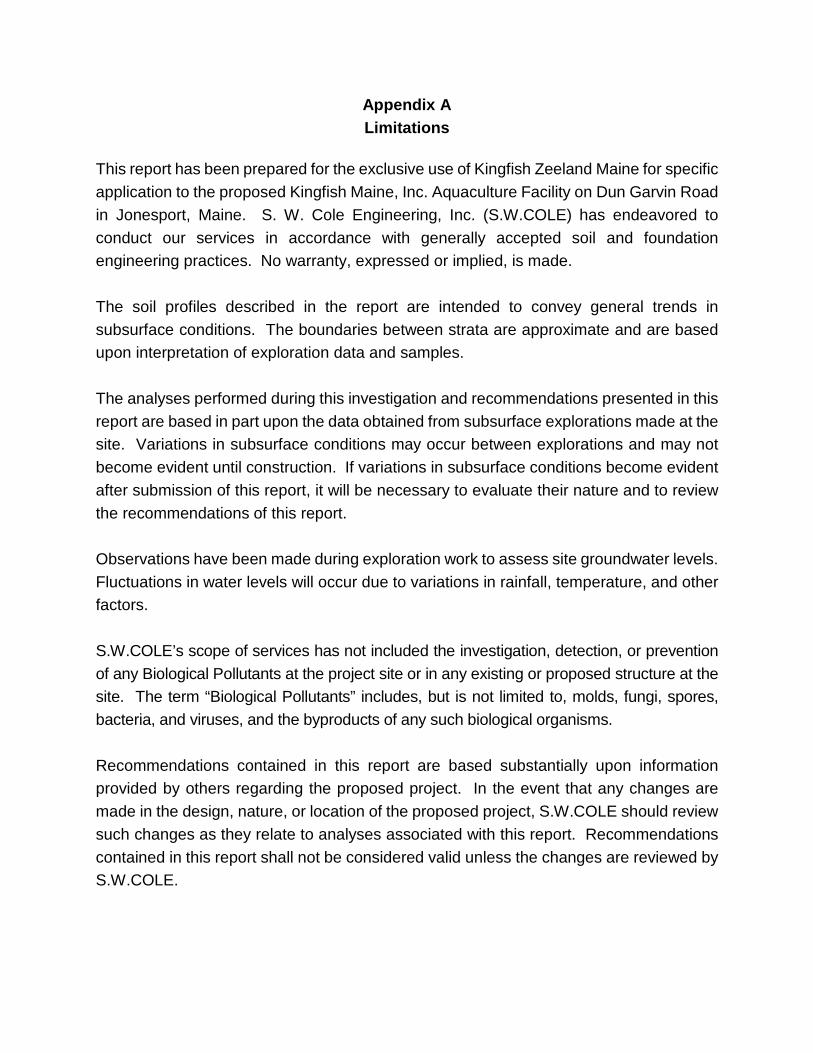
Appendix A Limitations
This report has been prepared for the exclusive use of Kingfish Zeeland Maine for specific application to the proposed Kingfish Maine, Inc. Aquaculture Facility on Dun Garvin Road in Jonesport, Maine. S. W. Cole Engineering, Inc. (S.W.COLE) has endeavored to conduct our services in accordance with generally accepted soil and foundation engineering practices. No warranty, expressed or implied, is made. The soil profiles described in the report are intended to convey general trends in subsurface conditions. The boundaries between strata are approximate and are based upon interpretation of exploration data and samples. The analyses performed during this investigation and recommendations presented in this report are based in part upon the data obtained from subsurface explorations made at the site. Variations in subsurface conditions may occur between explorations and may not become evident until construction. If variations in subsurface conditions become evident after submission of this report, it will be necessary to evaluate their nature and to review the recommendations of this report. Observations have been made during exploration work to assess site groundwater levels. Fluctuations in water levels will occur due to variations in rainfall, temperature, and other factors. S.W.COLE’s scope of services has not included the investigation, detection, or prevention of any Biological Pollutants at the project site or in any existing or proposed structure at the site. The term “Biological Pollutants” includes, but is not limited to, molds, fungi, spores, bacteria, and viruses, and the byproducts of any such biological organisms. Recommendations contained in this report are based substantially upon information provided by others regarding the proposed project. In the event that any changes are made in the design, nature, or location of the proposed project, S.W.COLE should review such changes as they relate to analyses associated with this report. Recommendations contained in this report shall not be considered valid unless the changes are reviewed by S.W.COLE.

APPENDIX B
Figures
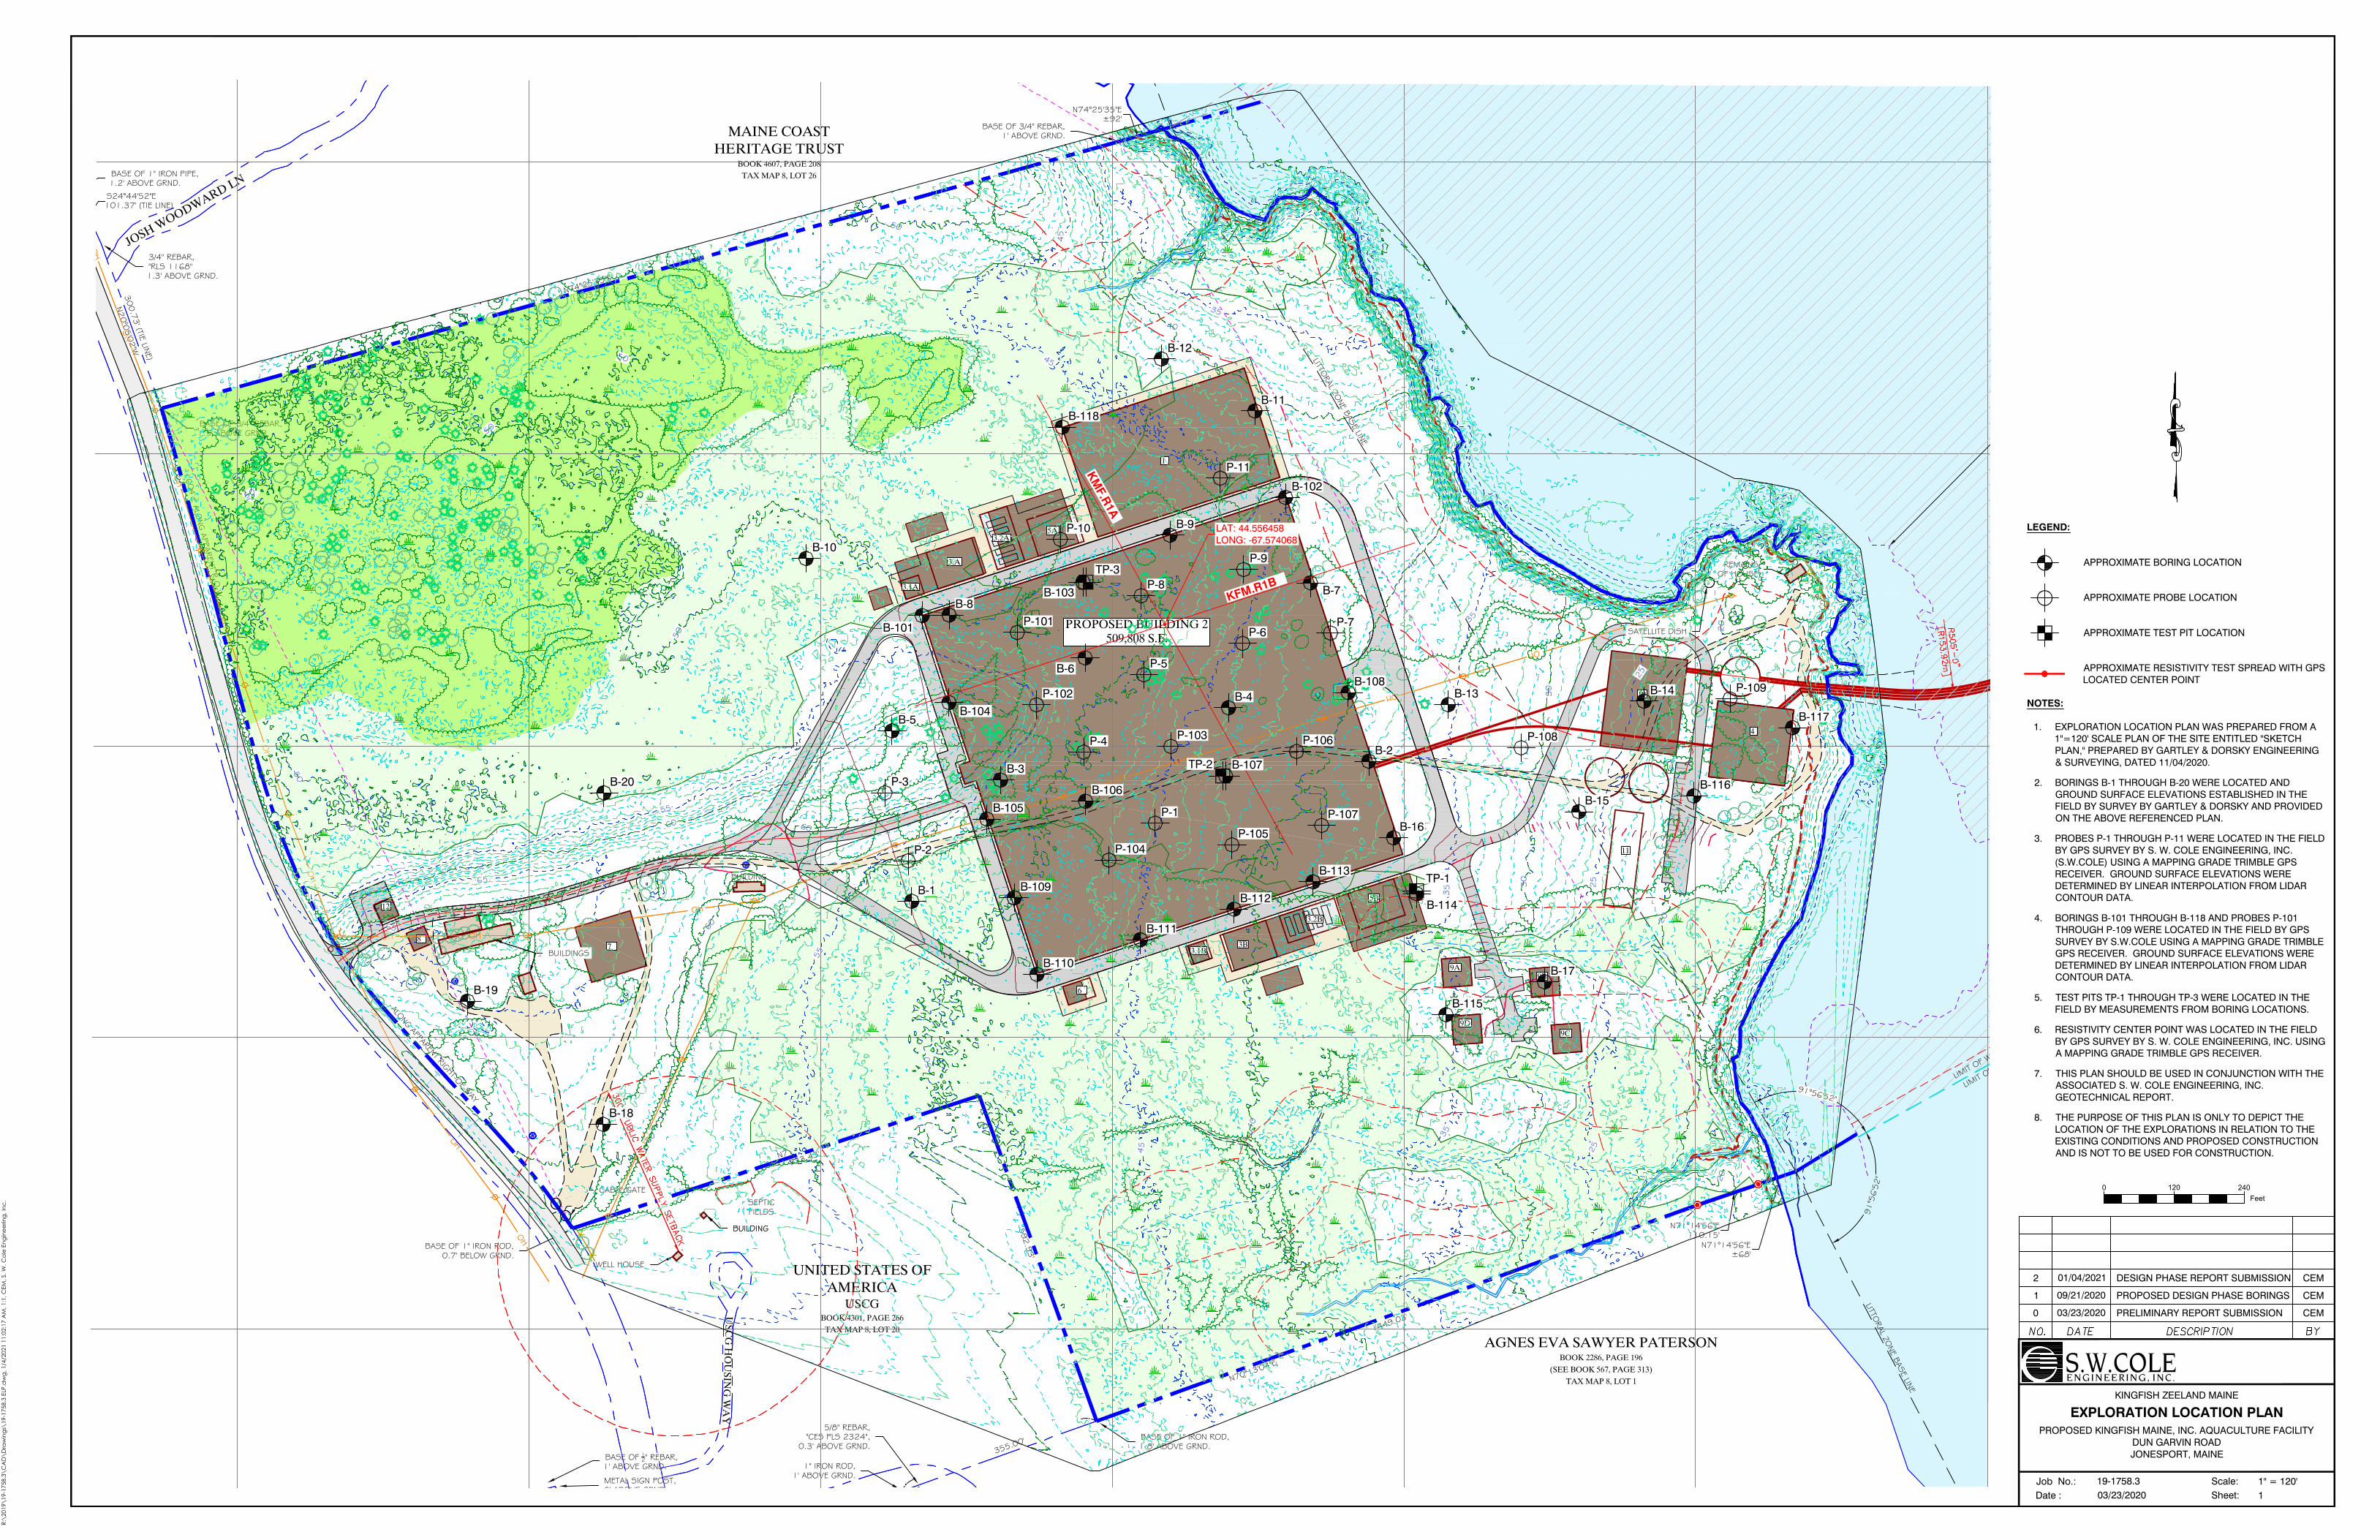
2020 HIGHEST ANNUAL TIDE (HAT) ASPUBLISHED BY NOAA FOR SHOPPEE POINTELEVATION =8.3' (SEE NOTE #3)
1449.03'
OH
OH
OH
OH
OH
OH
OH
OH
OHOH
OH
OH
OH
OH
OH
OH
OH
OH
OH OHOH
OH
MA
SON
BA
Y R
OA
D
SEPTICFIELDS
CHANDLER BAYA/K/A ENGLISHMAN BAY
ZONE VE (EL 15')
JOSH WOODWARD LN
USC
G H
OU
SING
WA
Y
W.W. WOODPROPERTIES, LLC
BOOK 4301, PAGE 266TAX MAP 8, LOT 23
93.2 ACRES
AGNES EVA SAWYER PATERSONBOOK 2286, PAGE 196
(SEE BOOK 567, PAGE 313)TAX MAP 8, LOT 1
MAINE COASTHERITAGE TRUST
BOOK 4607, PAGE 208TAX MAP 8, LOT 26
NATT POINT
(RO
UT
E 187)
GRAVELBEACH
LEDGE
LEDGE &BOULDERS
STREAM
STREAM
STRE
AM
DUN GARVIN ROAD
REMAINSOF HOUSE
BUILDING
BUILDINGS
BUILDING
N74°25'35"E
1703.57'
S24°44'52"E101.37' (TIE LINE)
N20°0
5'0
2"W
300.7
3' (TIE LINE)
N74°25'35"E±92'
N71°14'56"E110.15'
1094.03'
355.00'
N71°14'56"E±68'
N70°13'04"E
3206'± ALONG HAT
S19°4
9'4
0"E
592.9
3'
N58°27'02"E122'± TO LOW WATER
1604'±
ALONG APPAREN
T R-O-W
GRAVEL
WELL HOUSE
MEAN HIGH WATER (MHW)EL.=5.9'
MEAN LOW WATER (MLW)EL=-6.3'
3/4" REBAR,"RLS 1168"1.3' ABOVE GRND.
BASE OF 3/4" REBAR,1.5' ABOVE GRND.
BASE OF 3/4" REBAR,1' ABOVE GRND.
BASE OF 1" IRON PIPE,1.2' ABOVE GRND.
BASE OF 1" IRON ROD,1.8' ABOVE GRND.
1" IRON ROD,1' ABOVE GRND.
5/8" REBAR,"CES PLS 2324",
0.3' ABOVE GRND.
1" IRON ROD,1' ABOVE GRND.
METAL SIGN POST,2' ABOVE GRND.
BASE OF 12" REBAR,1' ABOVE GRND.
(MHW)EL.=5.9'
CABLE GATE
MEAN LOW WATER (MLW)EL=-6.3'
ALONG APPARENT RIGHT-OF-WAY
BASE OF 1" IRON ROD,0.7' BELOW GRND.
UNITED STATES OFAMERICA
USCGBOOK 4301, PAGE 266
TAX MAP 8, LOT 20
N71°54'57"E
733.43'
55
60 60
60
65
55
65
656565
50
45
40
35
30
40
35
30
25
20
20
2530
35
30
35
25
20
40
45
50
60
50
50
50
5050
50
50
45
7 3B3.1B
5B
6
PROPOSED BUILDING 2509,808 S.F.
3.1A
3.A
5A
1
10
4
11
12
8
9A9B
9C9D
3.2B
3.2A
OH
OH
OH
OH
OH
OH
OH
OH
OHOH
OH
OH
OH
OH
OH
OH
OH
OH
OH OHOH
OH
SATELLITE DISH
BUILDING
BUILDINGS
91°56'52"
91°5
6'5
2"
LITTORAL ZO
NE BASE LINE
LIMIT O
F W.W. W
OOD PROPER
TIES, LL
C LITTO
RAL ZONE
LIMIT O
F AGNES EV
A SAWYER PA
TERSON LIT
TORAL ZONE
LITTORAL ZO
NE BASE LINE
B-1
B-2
B-3
B-4
B-5
B-6
B-7B-8
B-9
B-10
B-11
B-12
B-13 B-14
B-15
B-16
B-17
B-18
B-19
P-1
P-2
P-3
P-4
P-5
P-6P-7
P-8
P-9
P-10
P-11
B-101
B-102
B-103
B-104
B-105
B-106
B-109
B-110
B-111
B-112
B-113
B-114
B-115
B-116
B-117
B-108
P-101
P-102
P-103
P-104P-105
P-106
P-107
P-108
P-109
B-118
B-20
LAT: 44.556458LONG: -67.574068
KFM.R1B
KM
F.R1A
TP-1
TP-2
TP-3
B-107
19-1758.303/23/2020
KINGFISH ZEELAND MAINE
PROPOSED KINGFISH MAINE, INC. AQUACULTURE FACILITYDUN GARVIN ROADJONESPORT, MAINE
EXPLORATION LOCATION PLAN
Job No.:Date :
Scale:Sheet:
1" = 120'1
S.W.COLEE N G I N E E R I N G , I N C .
LEGEND:
APPROXIMATE BORING LOCATION
APPROXIMATE PROBE LOCATION
APPROXIMATE TEST PIT LOCATION
APPROXIMATE RESISTIVITY TEST SPREAD WITH GPSLOCATED CENTER POINT
NOTES:
1. EXPLORATION LOCATION PLAN WAS PREPARED FROM A1"=120' SCALE PLAN OF THE SITE ENTITLED "SKETCHPLAN," PREPARED BY GARTLEY & DORSKY ENGINEERING& SURVEYING, DATED 11/04/2020.
2. BORINGS B-1 THROUGH B-20 WERE LOCATED ANDGROUND SURFACE ELEVATIONS ESTABLISHED IN THEFIELD BY SURVEY BY GARTLEY & DORSKY AND PROVIDEDON THE ABOVE REFERENCED PLAN.
3. PROBES P-1 THROUGH P-11 WERE LOCATED IN THE FIELDBY GPS SURVEY BY S. W. COLE ENGINEERING, INC.(S.W.COLE) USING A MAPPING GRADE TRIMBLE GPSRECEIVER. GROUND SURFACE ELEVATIONS WEREDETERMINED BY LINEAR INTERPOLATION FROM LIDARCONTOUR DATA.
4. BORINGS B-101 THROUGH B-118 AND PROBES P-101THROUGH P-109 WERE LOCATED IN THE FIELD BY GPSSURVEY BY S.W.COLE USING A MAPPING GRADE TRIMBLEGPS RECEIVER. GROUND SURFACE ELEVATIONS WEREDETERMINED BY LINEAR INTERPOLATION FROM LIDARCONTOUR DATA.
5. TEST PITS TP-1 THROUGH TP-3 WERE LOCATED IN THEFIELD BY MEASUREMENTS FROM BORING LOCATIONS.
6. RESISTIVITY CENTER POINT WAS LOCATED IN THE FIELDBY GPS SURVEY BY S. W. COLE ENGINEERING, INC. USINGA MAPPING GRADE TRIMBLE GPS RECEIVER.
7. THIS PLAN SHOULD BE USED IN CONJUNCTION WITH THEASSOCIATED S. W. COLE ENGINEERING, INC.GEOTECHNICAL REPORT.
8. THE PURPOSE OF THIS PLAN IS ONLY TO DEPICT THELOCATION OF THE EXPLORATIONS IN RELATION TO THEEXISTING CONDITIONS AND PROPOSED CONSTRUCTIONAND IS NOT TO BE USED FOR CONSTRUCTION.
Feet0 120 240
0 03/23/2020 PRELIMINARY REPORT SUBMISSION CEM
1 09/21/2020 PROPOSED DESIGN PHASE BORINGS CEM
2 01/04/2021 DESIGN PHASE REPORT SUBMISSION CEM
R:\2
019\
19-1
758.
3\C
AD
\Dra
win
gs\1
9-17
58.3
ELP
.dw
g, 1
/4/2
021
11:0
2:17
AM
, 1:1
, CEM
, S. W
. Col
e En
gine
erin
g, In
c.
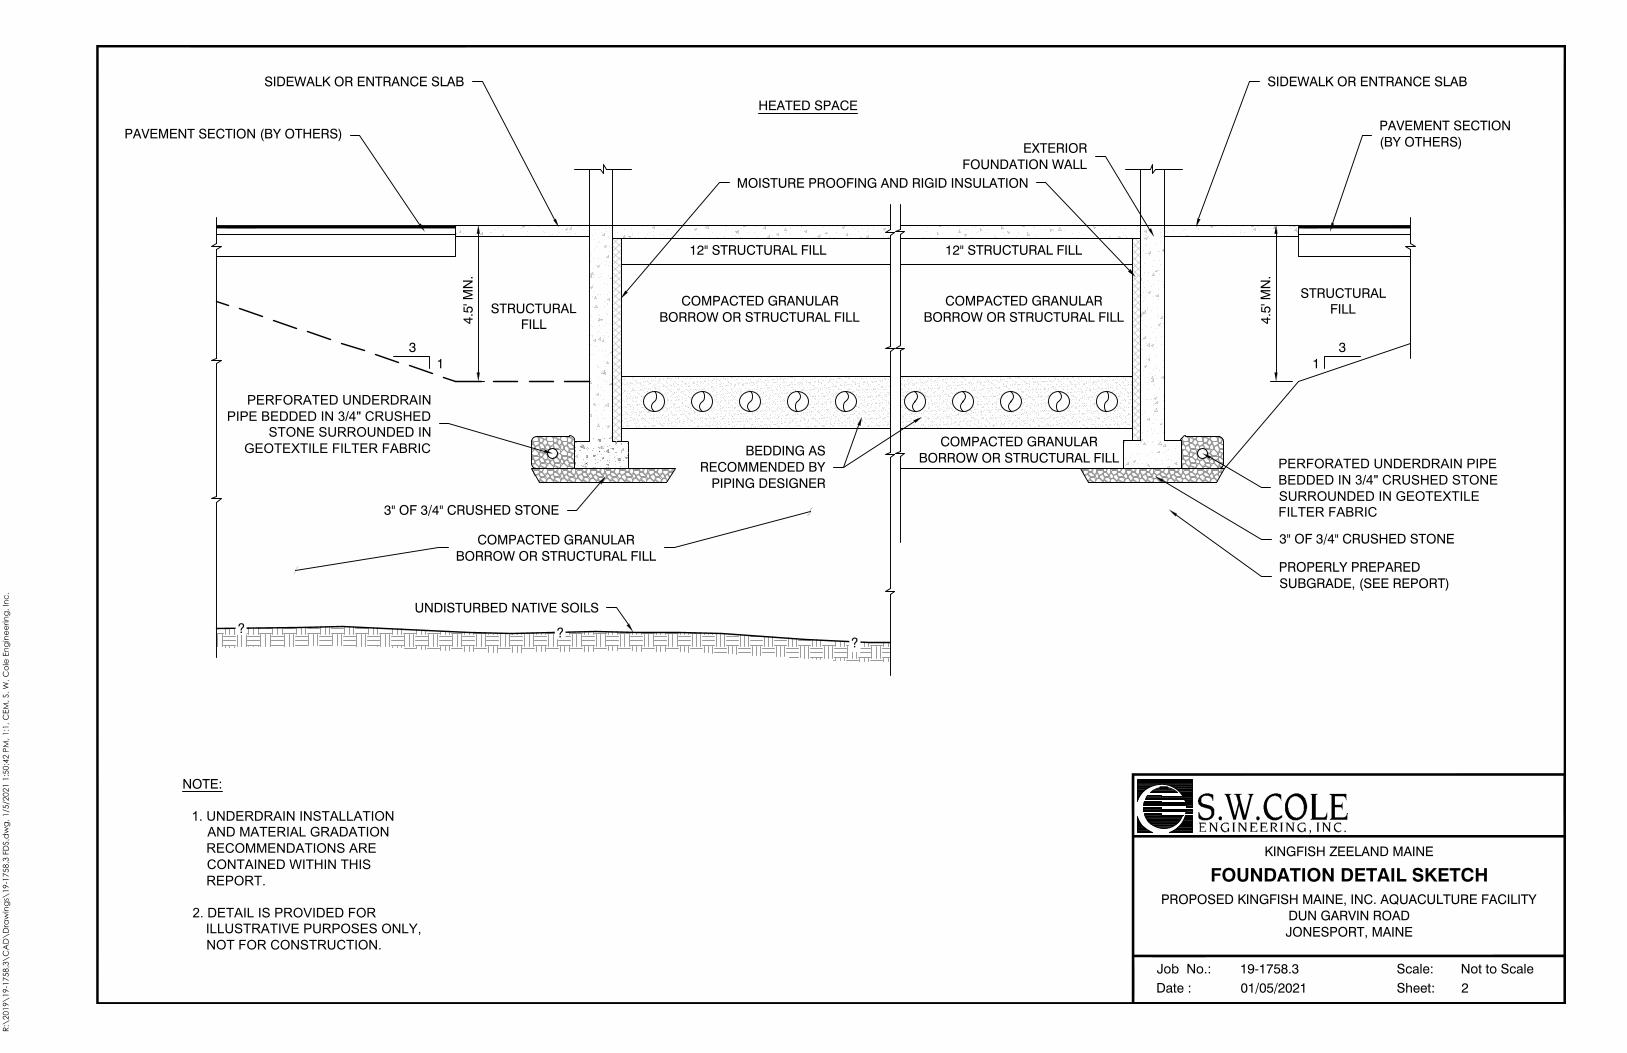
COMPACTED GRANULARBORROW OR STRUCTURAL FILL
STRUCTURALFILL
STRUCTURALFILL
31
4.5'
MN
.
HEATED SPACE
PERFORATED UNDERDRAINPIPE BEDDED IN 3/4" CRUSHED
STONE SURROUNDED INGEOTEXTILE FILTER FABRIC
PAVEMENT SECTION (BY OTHERS)
SIDEWALK OR ENTRANCE SLAB
MOISTURE PROOFING AND RIGID INSULATION
EXTERIORFOUNDATION WALL
PERFORATED UNDERDRAIN PIPEBEDDED IN 3/4" CRUSHED STONESURROUNDED IN GEOTEXTILEFILTER FABRIC
PROPERLY PREPAREDSUBGRADE, (SEE REPORT)
31
4.5'
MN
.
PAVEMENT SECTION(BY OTHERS)
SIDEWALK OR ENTRANCE SLAB
UNDISTURBED NATIVE SOILS
COMPACTED GRANULARBORROW OR STRUCTURAL FILL
???
12" STRUCTURAL FILL 12" STRUCTURAL FILL
BEDDING ASRECOMMENDED BY
PIPING DESIGNER
3" OF 3/4" CRUSHED STONE
3" OF 3/4" CRUSHED STONE
COMPACTED GRANULARBORROW OR STRUCTURAL FILL
COMPACTED GRANULARBORROW OR STRUCTURAL FILL
NOTE:
1. UNDERDRAIN INSTALLATIONAND MATERIAL GRADATIONRECOMMENDATIONS ARECONTAINED WITHIN THISREPORT.
2. DETAIL IS PROVIDED FORILLUSTRATIVE PURPOSES ONLY,NOT FOR CONSTRUCTION.
Job No.:Date :
Scale:Sheet:
S.W.COLEE N G I N E E R I N G , I N C .
FOUNDATION DETAIL SKETCH
Not to Scale2
19-1758.301/05/2021
KINGFISH ZEELAND MAINE
PROPOSED KINGFISH MAINE, INC. AQUACULTURE FACILITYDUN GARVIN ROADJONESPORT, MAINE
R:\2
019\
19-1
758.
3\C
AD
\Dra
win
gs\1
9-17
58.3
FD
S.d
wg,
1/5
/202
1 1:
50:4
2 PM
, 1:1
, CEM
, S. W
. Col
e En
gine
erin
g, In
c.
APPENDIX C
Exploration Logs, Refusal Summary Sheet and Key

1D
2D
3D
4D
1R
2R
3R
24/14
24/6
24/18
12/10
24/24
20/19
16/8
1-2-9-9
12-14-15-19
5-6-6-6
10-50
63
75
0
Forest DuffMedium dense, red-brown Gravelly SAND,some silt
Medium dense, brown Silty fine SAND
Bedrock, advanced by rollercone 11 to 11.5feetGray, very slightly weathered, contactmetamorphosed, mafic, VOLCANIC ROCK,joints at 0°, 30°, 40°, 50°, 75°, 85° fromhorizontal, slight iron oxide staining alongjoints (Edmunds Formation)
Bottom of Exploration at 16.5 feet
0-2
2-4
5-7
10-11
11.5-13.5
13.5-15.2
15.2-16.5
Pen. = Penetration LengthRec. = Recovery Length
LOGGED BY: Brendan Auth
CORE BARREL: NQ2
At time of DrillingAt Completion of DrillingAfter Drilling
D = Split Spoon Sample
CASING ID/OD: 4 in / 4 1/2 in
Water Level
AUGER ID/OD: N/A / N/A
ELEVATION (FT): 51.4' +/-
bpf = Blows per Foot
TOTAL DEPTH (FT): 16.5
U = Thin Walled Tube Sample
LOCATION: See Exploration Location Plan
DRILLER: Kevin Hanscom
KEY TO NOTESAND SYMBOLS:
Sv = Field Vane Shear Strength, kips/sq.ft.
Drilling Information
RIG TYPE: Track Mounted Diedrich D-50
HAMMER TYPE: Automatic / Automatic
GENERAL NOTES:
HAMMER WEIGHT (lbs): 140 / 140
R = Rock Core SampleV = Field Vane Shear mpf = Minute per Foot
WOR = Weight of RodsWOH = Weight of HammerRQD = Rock Quality Designation
HAMMER DROP (inch): 30 / 30
DRILLING CO.: S. W. Cole Explorations, LLC
PID = Photoionization Detector N/A = Not Applicable
SAMPLER: Standard Split-Spoon
qU = Unconfined Compressive Strength, kips/sq.ft.Ø = Friction Angle (Estimated)
DRILLING METHOD: Cased Boring
WATER LEVEL DEPTHS (ft): Soils wet below 5' +/-
HAMMER EFFICIENCY FACTOR: 0.995
Gra
phic
Log
Elev.(ft)
50
45
40
35
SampleNo. T
ype
Depth(ft)
5
10
15
CasingPen.(bpf)
Stratification lines represent approximateboundary between soil types, transitions maybe gradual. Water level readings have beenmade at times and under conditions stated.Fluctuations of groundwater may occur due toother factors than those present at the timemeasurements were made.
Pen./Rec.(in)
SAMPLE INFORMATION
H20Depth
BlowCount
orRQD
Field / LabTest Data
RemarksSample
Description &Classification
Depth(ft)
BORING LOG
DATE FINISH: 10/26/2020
BORING NO.: B-101
BORING NO.: B-101
PROJECT NO. 19-1758.3SHEET: 1 of 1
DATE START: 10/26/2020CLIENT: Kingfish Zeeland MainePROJECT: King Fish Maine, Inc. Aquaculture FacilityLOCATION: Dun Garvin Road, Jonesport, Maine
BO
RIN
G /
WE
LL 1
9-17
58.3
.GP
J S
WC
E T
EM
PLA
TE
.GD
T 1
/2/2
1
0.5
5.0
11.011.5
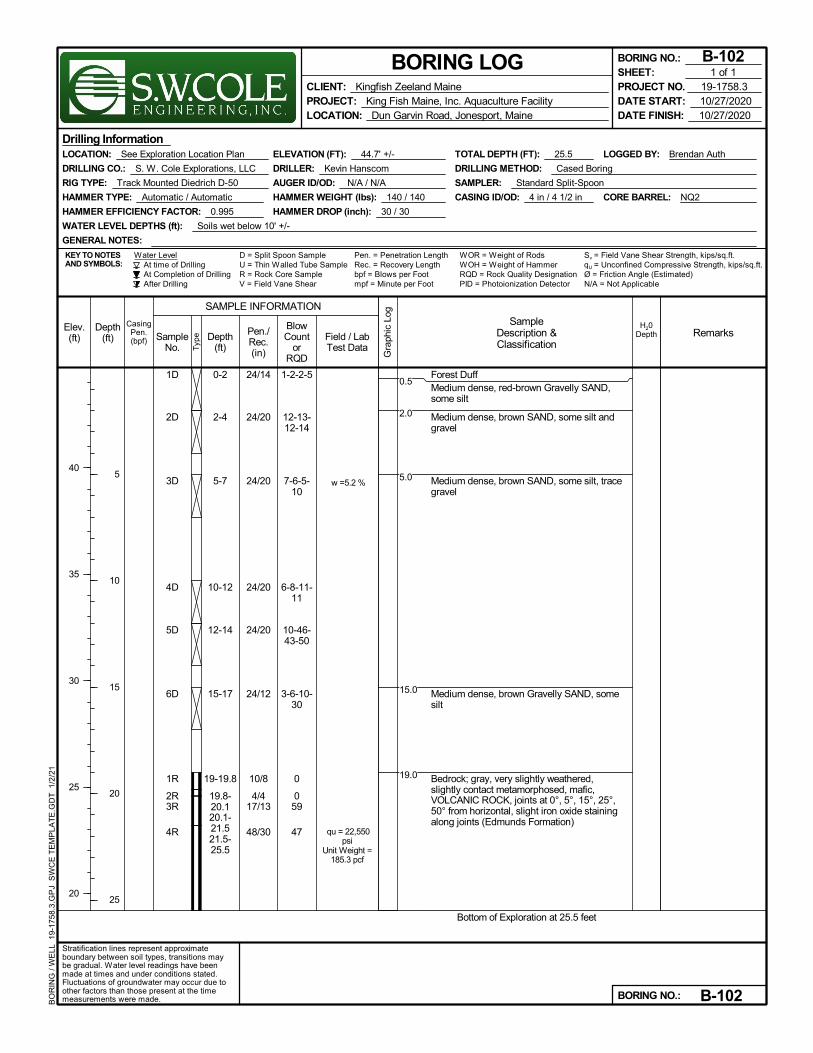
1D
2D
3D
4D
5D
6D
1R
2R3R
4R
24/14
24/20
24/20
24/20
24/20
24/12
10/8
4/417/13
48/30
1-2-2-5
12-13-12-14
7-6-5-10
6-8-11-11
10-46-43-50
3-6-10-30
0
059
47
w =5.2 %
qu = 22,550psi
Unit Weight =185.3 pcf
Forest DuffMedium dense, red-brown Gravelly SAND,some silt
Medium dense, brown SAND, some silt andgravel
Medium dense, brown SAND, some silt, tracegravel
Medium dense, brown Gravelly SAND, somesilt
Bedrock; gray, very slightly weathered,slightly contact metamorphosed, mafic,VOLCANIC ROCK, joints at 0°, 5°, 15°, 25°,50° from horizontal, slight iron oxide stainingalong joints (Edmunds Formation)
Bottom of Exploration at 25.5 feet
0-2
2-4
5-7
10-12
12-14
15-17
19-19.8
19.8-20.120.1-21.521.5-25.5
Pen. = Penetration LengthRec. = Recovery Length
LOGGED BY: Brendan Auth
CORE BARREL: NQ2
At time of DrillingAt Completion of DrillingAfter Drilling
D = Split Spoon Sample
CASING ID/OD: 4 in / 4 1/2 in
Water Level
AUGER ID/OD: N/A / N/A
ELEVATION (FT): 44.7' +/-
bpf = Blows per Foot
TOTAL DEPTH (FT): 25.5
U = Thin Walled Tube Sample
LOCATION: See Exploration Location Plan
DRILLER: Kevin Hanscom
KEY TO NOTESAND SYMBOLS:
Sv = Field Vane Shear Strength, kips/sq.ft.
Drilling Information
RIG TYPE: Track Mounted Diedrich D-50
HAMMER TYPE: Automatic / Automatic
GENERAL NOTES:
HAMMER WEIGHT (lbs): 140 / 140
R = Rock Core SampleV = Field Vane Shear mpf = Minute per Foot
WOR = Weight of RodsWOH = Weight of HammerRQD = Rock Quality Designation
HAMMER DROP (inch): 30 / 30
DRILLING CO.: S. W. Cole Explorations, LLC
PID = Photoionization Detector N/A = Not Applicable
SAMPLER: Standard Split-Spoon
qU = Unconfined Compressive Strength, kips/sq.ft.Ø = Friction Angle (Estimated)
DRILLING METHOD: Cased Boring
WATER LEVEL DEPTHS (ft): Soils wet below 10' +/-
HAMMER EFFICIENCY FACTOR: 0.995
Gra
phic
Log
Elev.(ft)
40
35
30
25
20
SampleNo. T
ype
Depth(ft)
5
10
15
20
25
CasingPen.(bpf)
Stratification lines represent approximateboundary between soil types, transitions maybe gradual. Water level readings have beenmade at times and under conditions stated.Fluctuations of groundwater may occur due toother factors than those present at the timemeasurements were made.
Pen./Rec.(in)
SAMPLE INFORMATION
H20Depth
BlowCount
orRQD
Field / LabTest Data
RemarksSample
Description &Classification
Depth(ft)
BORING LOG
DATE FINISH: 10/27/2020
BORING NO.: B-102
BORING NO.: B-102
PROJECT NO. 19-1758.3SHEET: 1 of 1
DATE START: 10/27/2020CLIENT: Kingfish Zeeland MainePROJECT: King Fish Maine, Inc. Aquaculture FacilityLOCATION: Dun Garvin Road, Jonesport, Maine
BO
RIN
G /
WE
LL 1
9-17
58.3
.GP
J S
WC
E T
EM
PLA
TE
.GD
T 1
/2/2
1
0.5
2.0
5.0
15.0
19.0
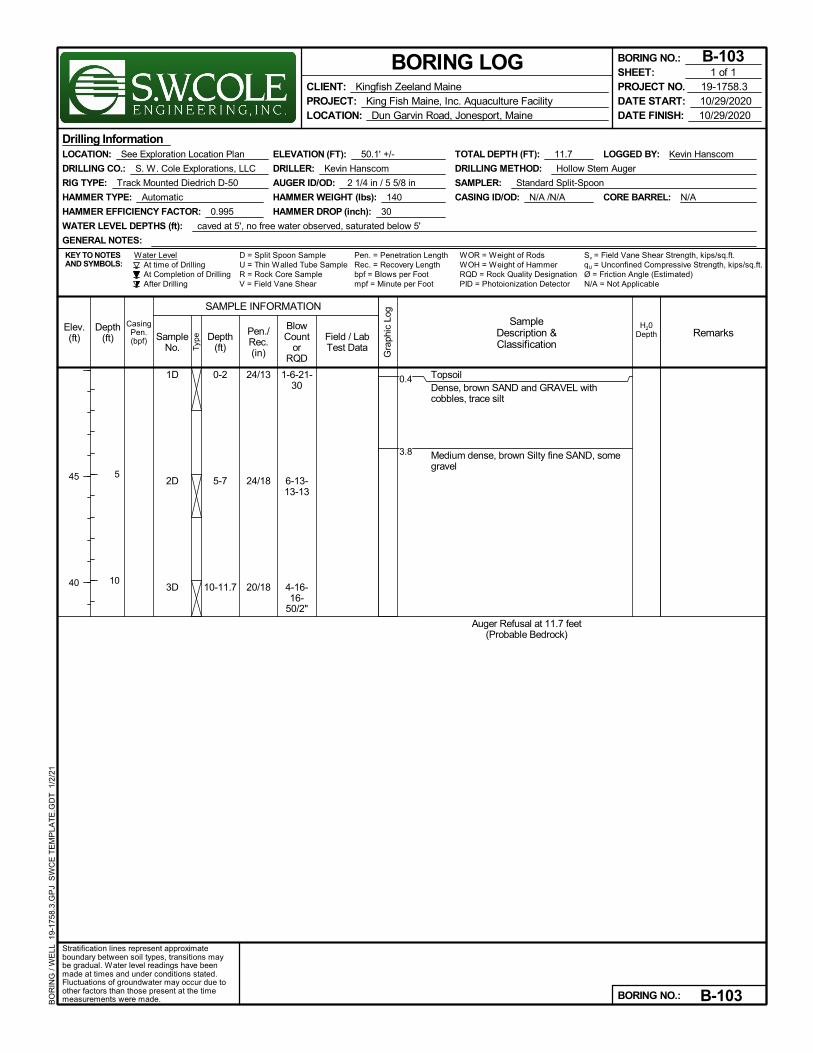
1D
2D
3D
24/13
24/18
20/18
1-6-21-30
6-13-13-13
4-16-16-
50/2"
TopsoilDense, brown SAND and GRAVEL withcobbles, trace silt
Medium dense, brown Silty fine SAND, somegravel
Auger Refusal at 11.7 feet(Probable Bedrock)
0-2
5-7
10-11.7
Pen. = Penetration LengthRec. = Recovery Length
LOGGED BY: Kevin Hanscom
CORE BARREL: N/A
At time of DrillingAt Completion of DrillingAfter Drilling
D = Split Spoon Sample
CASING ID/OD: N/A /N/A
Water Level
AUGER ID/OD: 2 1/4 in / 5 5/8 in
ELEVATION (FT): 50.1' +/-
bpf = Blows per Foot
TOTAL DEPTH (FT): 11.7
U = Thin Walled Tube Sample
LOCATION: See Exploration Location Plan
DRILLER: Kevin Hanscom
KEY TO NOTESAND SYMBOLS:
Sv = Field Vane Shear Strength, kips/sq.ft.
Drilling Information
RIG TYPE: Track Mounted Diedrich D-50
HAMMER TYPE: Automatic
GENERAL NOTES:
HAMMER WEIGHT (lbs): 140
R = Rock Core SampleV = Field Vane Shear mpf = Minute per Foot
WOR = Weight of RodsWOH = Weight of HammerRQD = Rock Quality Designation
HAMMER DROP (inch): 30
DRILLING CO.: S. W. Cole Explorations, LLC
PID = Photoionization Detector N/A = Not Applicable
SAMPLER: Standard Split-Spoon
qU = Unconfined Compressive Strength, kips/sq.ft.Ø = Friction Angle (Estimated)
DRILLING METHOD: Hollow Stem Auger
WATER LEVEL DEPTHS (ft): caved at 5', no free water observed, saturated below 5'
HAMMER EFFICIENCY FACTOR: 0.995
Gra
phic
Log
Elev.(ft)
45
40
SampleNo. T
ype
Depth(ft)
5
10
CasingPen.(bpf)
Stratification lines represent approximateboundary between soil types, transitions maybe gradual. Water level readings have beenmade at times and under conditions stated.Fluctuations of groundwater may occur due toother factors than those present at the timemeasurements were made.
Pen./Rec.(in)
SAMPLE INFORMATION
H20Depth
BlowCount
orRQD
Field / LabTest Data
RemarksSample
Description &Classification
Depth(ft)
BORING LOG
DATE FINISH: 10/29/2020
BORING NO.: B-103
BORING NO.: B-103
PROJECT NO. 19-1758.3SHEET: 1 of 1
DATE START: 10/29/2020CLIENT: Kingfish Zeeland MainePROJECT: King Fish Maine, Inc. Aquaculture FacilityLOCATION: Dun Garvin Road, Jonesport, Maine
BO
RIN
G /
WE
LL 1
9-17
58.3
.GP
J S
WC
E T
EM
PLA
TE
.GD
T 1
/2/2
1
0.4
3.8
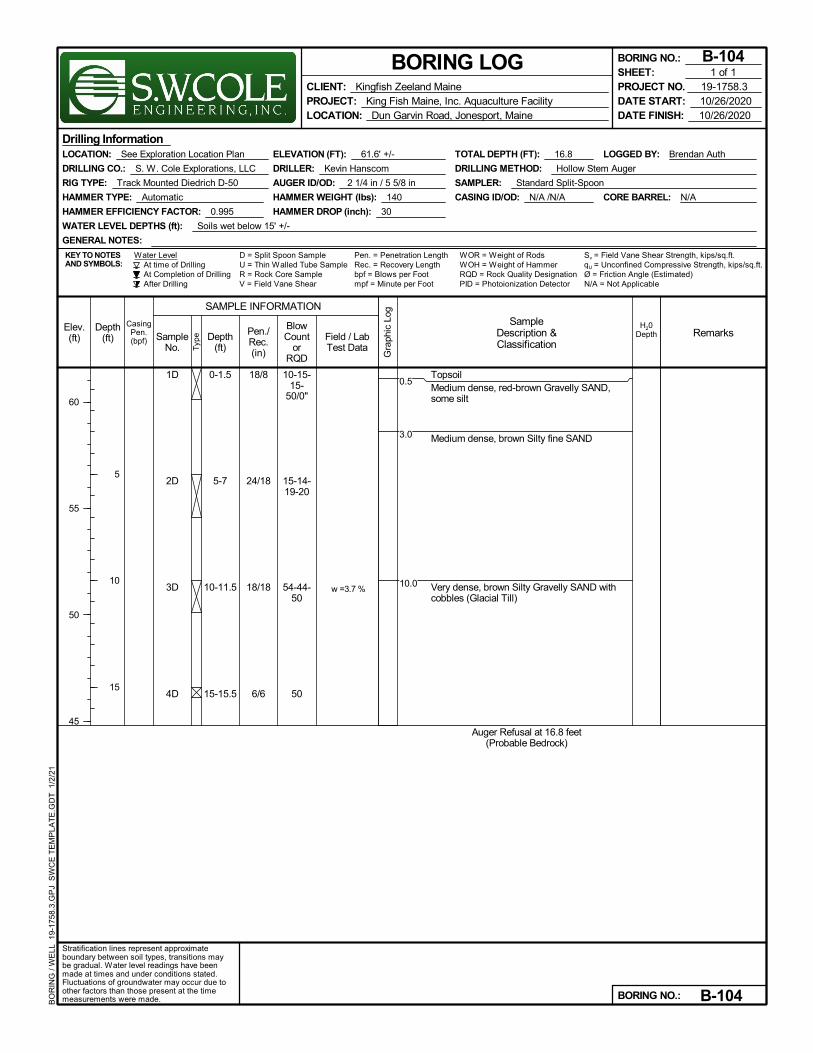
1D
2D
3D
4D
18/8
24/18
18/18
6/6
10-15-15-
50/0"
15-14-19-20
54-44-50
50
w =3.7 %
TopsoilMedium dense, red-brown Gravelly SAND,some silt
Medium dense, brown Silty fine SAND
Very dense, brown Silty Gravelly SAND withcobbles (Glacial Till)
Auger Refusal at 16.8 feet(Probable Bedrock)
0-1.5
5-7
10-11.5
15-15.5
Pen. = Penetration LengthRec. = Recovery Length
LOGGED BY: Brendan Auth
CORE BARREL: N/A
At time of DrillingAt Completion of DrillingAfter Drilling
D = Split Spoon Sample
CASING ID/OD: N/A /N/A
Water Level
AUGER ID/OD: 2 1/4 in / 5 5/8 in
ELEVATION (FT): 61.6' +/-
bpf = Blows per Foot
TOTAL DEPTH (FT): 16.8
U = Thin Walled Tube Sample
LOCATION: See Exploration Location Plan
DRILLER: Kevin Hanscom
KEY TO NOTESAND SYMBOLS:
Sv = Field Vane Shear Strength, kips/sq.ft.
Drilling Information
RIG TYPE: Track Mounted Diedrich D-50
HAMMER TYPE: Automatic
GENERAL NOTES:
HAMMER WEIGHT (lbs): 140
R = Rock Core SampleV = Field Vane Shear mpf = Minute per Foot
WOR = Weight of RodsWOH = Weight of HammerRQD = Rock Quality Designation
HAMMER DROP (inch): 30
DRILLING CO.: S. W. Cole Explorations, LLC
PID = Photoionization Detector N/A = Not Applicable
SAMPLER: Standard Split-Spoon
qU = Unconfined Compressive Strength, kips/sq.ft.Ø = Friction Angle (Estimated)
DRILLING METHOD: Hollow Stem Auger
WATER LEVEL DEPTHS (ft): Soils wet below 15' +/-
HAMMER EFFICIENCY FACTOR: 0.995
Gra
phic
Log
Elev.(ft)
60
55
50
45
SampleNo. T
ype
Depth(ft)
5
10
15
CasingPen.(bpf)
Stratification lines represent approximateboundary between soil types, transitions maybe gradual. Water level readings have beenmade at times and under conditions stated.Fluctuations of groundwater may occur due toother factors than those present at the timemeasurements were made.
Pen./Rec.(in)
SAMPLE INFORMATION
H20Depth
BlowCount
orRQD
Field / LabTest Data
RemarksSample
Description &Classification
Depth(ft)
BORING LOG
DATE FINISH: 10/26/2020
BORING NO.: B-104
BORING NO.: B-104
PROJECT NO. 19-1758.3SHEET: 1 of 1
DATE START: 10/26/2020CLIENT: Kingfish Zeeland MainePROJECT: King Fish Maine, Inc. Aquaculture FacilityLOCATION: Dun Garvin Road, Jonesport, Maine
BO
RIN
G /
WE
LL 1
9-17
58.3
.GP
J S
WC
E T
EM
PLA
TE
.GD
T 1
/2/2
1
0.5
3.0
10.0
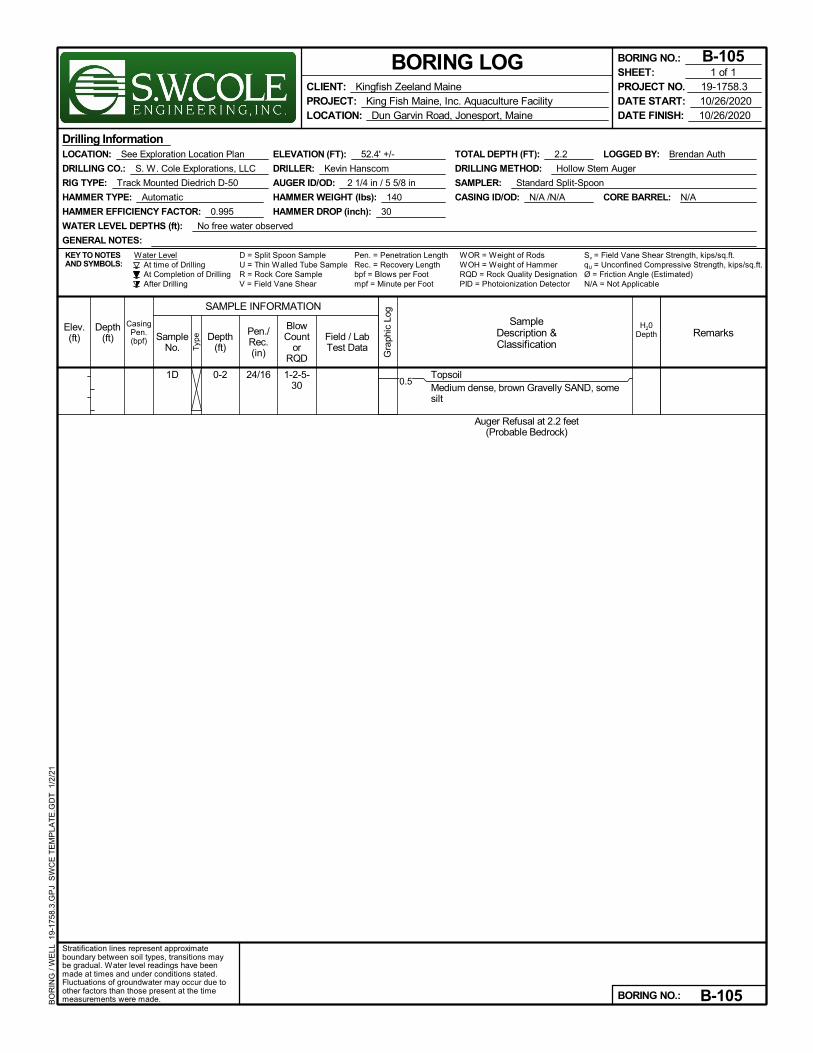
1D 24/16 1-2-5-30
TopsoilMedium dense, brown Gravelly SAND, somesilt
Auger Refusal at 2.2 feet(Probable Bedrock)
0-2
Pen. = Penetration LengthRec. = Recovery Length
LOGGED BY: Brendan Auth
CORE BARREL: N/A
At time of DrillingAt Completion of DrillingAfter Drilling
D = Split Spoon Sample
CASING ID/OD: N/A /N/A
Water Level
AUGER ID/OD: 2 1/4 in / 5 5/8 in
ELEVATION (FT): 52.4' +/-
bpf = Blows per Foot
TOTAL DEPTH (FT): 2.2
U = Thin Walled Tube Sample
LOCATION: See Exploration Location Plan
DRILLER: Kevin Hanscom
KEY TO NOTESAND SYMBOLS:
Sv = Field Vane Shear Strength, kips/sq.ft.
Drilling Information
RIG TYPE: Track Mounted Diedrich D-50
HAMMER TYPE: Automatic
GENERAL NOTES:
HAMMER WEIGHT (lbs): 140
R = Rock Core SampleV = Field Vane Shear mpf = Minute per Foot
WOR = Weight of RodsWOH = Weight of HammerRQD = Rock Quality Designation
HAMMER DROP (inch): 30
DRILLING CO.: S. W. Cole Explorations, LLC
PID = Photoionization Detector N/A = Not Applicable
SAMPLER: Standard Split-Spoon
qU = Unconfined Compressive Strength, kips/sq.ft.Ø = Friction Angle (Estimated)
DRILLING METHOD: Hollow Stem Auger
WATER LEVEL DEPTHS (ft): No free water observed
HAMMER EFFICIENCY FACTOR: 0.995
Gra
phic
Log
Elev.(ft) Sample
No. Typ
e
Depth(ft)
CasingPen.(bpf)
Stratification lines represent approximateboundary between soil types, transitions maybe gradual. Water level readings have beenmade at times and under conditions stated.Fluctuations of groundwater may occur due toother factors than those present at the timemeasurements were made.
Pen./Rec.(in)
SAMPLE INFORMATION
H20Depth
BlowCount
orRQD
Field / LabTest Data
RemarksSample
Description &Classification
Depth(ft)
BORING LOG
DATE FINISH: 10/26/2020
BORING NO.: B-105
BORING NO.: B-105
PROJECT NO. 19-1758.3SHEET: 1 of 1
DATE START: 10/26/2020CLIENT: Kingfish Zeeland MainePROJECT: King Fish Maine, Inc. Aquaculture FacilityLOCATION: Dun Garvin Road, Jonesport, Maine
BO
RIN
G /
WE
LL 1
9-17
58.3
.GP
J S
WC
E T
EM
PLA
TE
.GD
T 1
/2/2
1
0.5
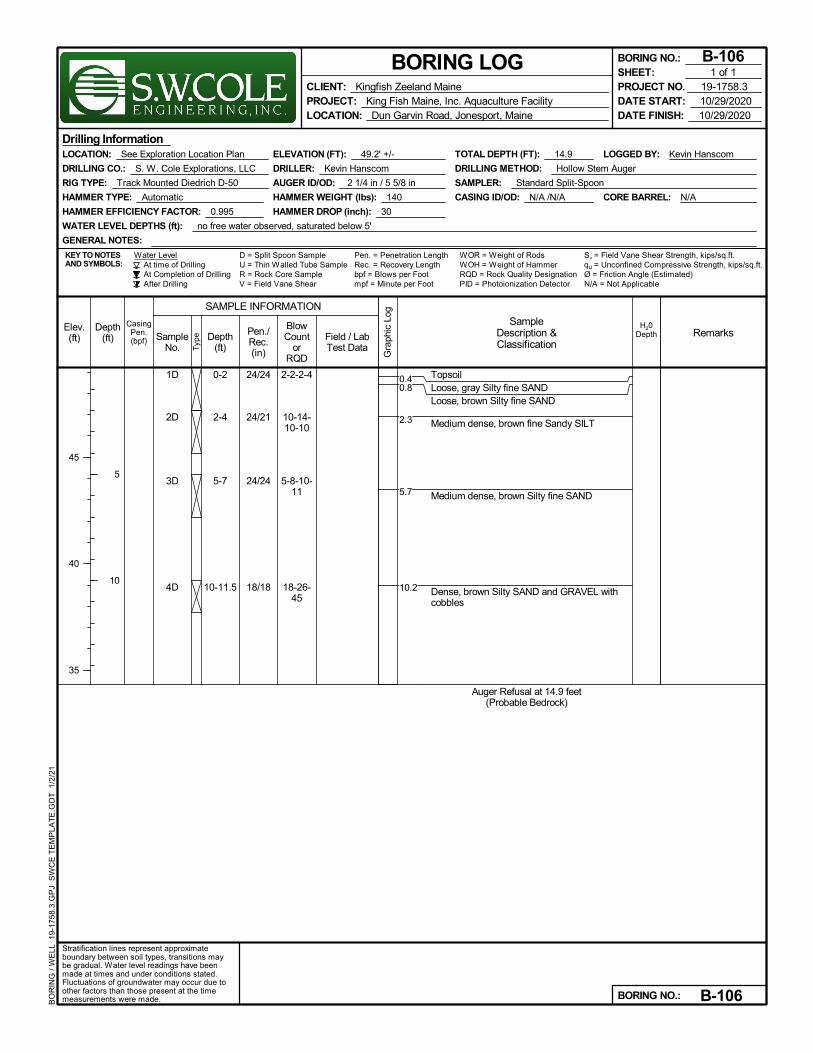
1D
2D
3D
4D
24/24
24/21
24/24
18/18
2-2-2-4
10-14-10-10
5-8-10-11
18-26-45
TopsoilLoose, gray Silty fine SANDLoose, brown Silty fine SAND
Medium dense, brown fine Sandy SILT
Medium dense, brown Silty fine SAND
Dense, brown Silty SAND and GRAVEL withcobbles
Auger Refusal at 14.9 feet(Probable Bedrock)
0-2
2-4
5-7
10-11.5
Pen. = Penetration LengthRec. = Recovery Length
LOGGED BY: Kevin Hanscom
CORE BARREL: N/A
At time of DrillingAt Completion of DrillingAfter Drilling
D = Split Spoon Sample
CASING ID/OD: N/A /N/A
Water Level
AUGER ID/OD: 2 1/4 in / 5 5/8 in
ELEVATION (FT): 49.2' +/-
bpf = Blows per Foot
TOTAL DEPTH (FT): 14.9
U = Thin Walled Tube Sample
LOCATION: See Exploration Location Plan
DRILLER: Kevin Hanscom
KEY TO NOTESAND SYMBOLS:
Sv = Field Vane Shear Strength, kips/sq.ft.
Drilling Information
RIG TYPE: Track Mounted Diedrich D-50
HAMMER TYPE: Automatic
GENERAL NOTES:
HAMMER WEIGHT (lbs): 140
R = Rock Core SampleV = Field Vane Shear mpf = Minute per Foot
WOR = Weight of RodsWOH = Weight of HammerRQD = Rock Quality Designation
HAMMER DROP (inch): 30
DRILLING CO.: S. W. Cole Explorations, LLC
PID = Photoionization Detector N/A = Not Applicable
SAMPLER: Standard Split-Spoon
qU = Unconfined Compressive Strength, kips/sq.ft.Ø = Friction Angle (Estimated)
DRILLING METHOD: Hollow Stem Auger
WATER LEVEL DEPTHS (ft): no free water observed, saturated below 5'
HAMMER EFFICIENCY FACTOR: 0.995
Gra
phic
Log
Elev.(ft)
45
40
35
SampleNo. T
ype
Depth(ft)
5
10
CasingPen.(bpf)
Stratification lines represent approximateboundary between soil types, transitions maybe gradual. Water level readings have beenmade at times and under conditions stated.Fluctuations of groundwater may occur due toother factors than those present at the timemeasurements were made.
Pen./Rec.(in)
SAMPLE INFORMATION
H20Depth
BlowCount
orRQD
Field / LabTest Data
RemarksSample
Description &Classification
Depth(ft)
BORING LOG
DATE FINISH: 10/29/2020
BORING NO.: B-106
BORING NO.: B-106
PROJECT NO. 19-1758.3SHEET: 1 of 1
DATE START: 10/29/2020CLIENT: Kingfish Zeeland MainePROJECT: King Fish Maine, Inc. Aquaculture FacilityLOCATION: Dun Garvin Road, Jonesport, Maine
BO
RIN
G /
WE
LL 1
9-17
58.3
.GP
J S
WC
E T
EM
PLA
TE
.GD
T 1
/2/2
1
0.40.8
2.3
5.7
10.2
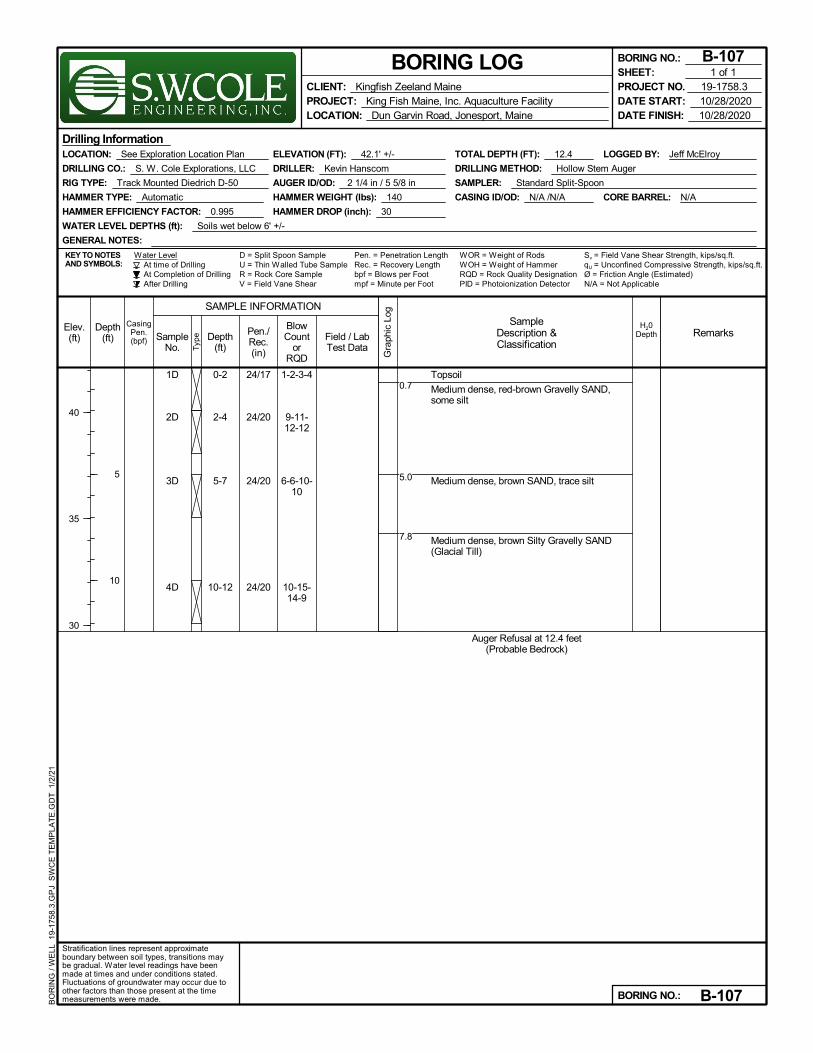
1D
2D
3D
4D
24/17
24/20
24/20
24/20
1-2-3-4
9-11-12-12
6-6-10-10
10-15-14-9
Topsoil
Medium dense, red-brown Gravelly SAND,some silt
Medium dense, brown SAND, trace silt
Medium dense, brown Silty Gravelly SAND(Glacial Till)
Auger Refusal at 12.4 feet(Probable Bedrock)
0-2
2-4
5-7
10-12
Pen. = Penetration LengthRec. = Recovery Length
LOGGED BY: Jeff McElroy
CORE BARREL: N/A
At time of DrillingAt Completion of DrillingAfter Drilling
D = Split Spoon Sample
CASING ID/OD: N/A /N/A
Water Level
AUGER ID/OD: 2 1/4 in / 5 5/8 in
ELEVATION (FT): 42.1' +/-
bpf = Blows per Foot
TOTAL DEPTH (FT): 12.4
U = Thin Walled Tube Sample
LOCATION: See Exploration Location Plan
DRILLER: Kevin Hanscom
KEY TO NOTESAND SYMBOLS:
Sv = Field Vane Shear Strength, kips/sq.ft.
Drilling Information
RIG TYPE: Track Mounted Diedrich D-50
HAMMER TYPE: Automatic
GENERAL NOTES:
HAMMER WEIGHT (lbs): 140
R = Rock Core SampleV = Field Vane Shear mpf = Minute per Foot
WOR = Weight of RodsWOH = Weight of HammerRQD = Rock Quality Designation
HAMMER DROP (inch): 30
DRILLING CO.: S. W. Cole Explorations, LLC
PID = Photoionization Detector N/A = Not Applicable
SAMPLER: Standard Split-Spoon
qU = Unconfined Compressive Strength, kips/sq.ft.Ø = Friction Angle (Estimated)
DRILLING METHOD: Hollow Stem Auger
WATER LEVEL DEPTHS (ft): Soils wet below 6' +/-
HAMMER EFFICIENCY FACTOR: 0.995
Gra
phic
Log
Elev.(ft)
40
35
30
SampleNo. T
ype
Depth(ft)
5
10
CasingPen.(bpf)
Stratification lines represent approximateboundary between soil types, transitions maybe gradual. Water level readings have beenmade at times and under conditions stated.Fluctuations of groundwater may occur due toother factors than those present at the timemeasurements were made.
Pen./Rec.(in)
SAMPLE INFORMATION
H20Depth
BlowCount
orRQD
Field / LabTest Data
RemarksSample
Description &Classification
Depth(ft)
BORING LOG
DATE FINISH: 10/28/2020
BORING NO.: B-107
BORING NO.: B-107
PROJECT NO. 19-1758.3SHEET: 1 of 1
DATE START: 10/28/2020CLIENT: Kingfish Zeeland MainePROJECT: King Fish Maine, Inc. Aquaculture FacilityLOCATION: Dun Garvin Road, Jonesport, Maine
BO
RIN
G /
WE
LL 1
9-17
58.3
.GP
J S
WC
E T
EM
PLA
TE
.GD
T 1
/2/2
1
0.7
5.0
7.8
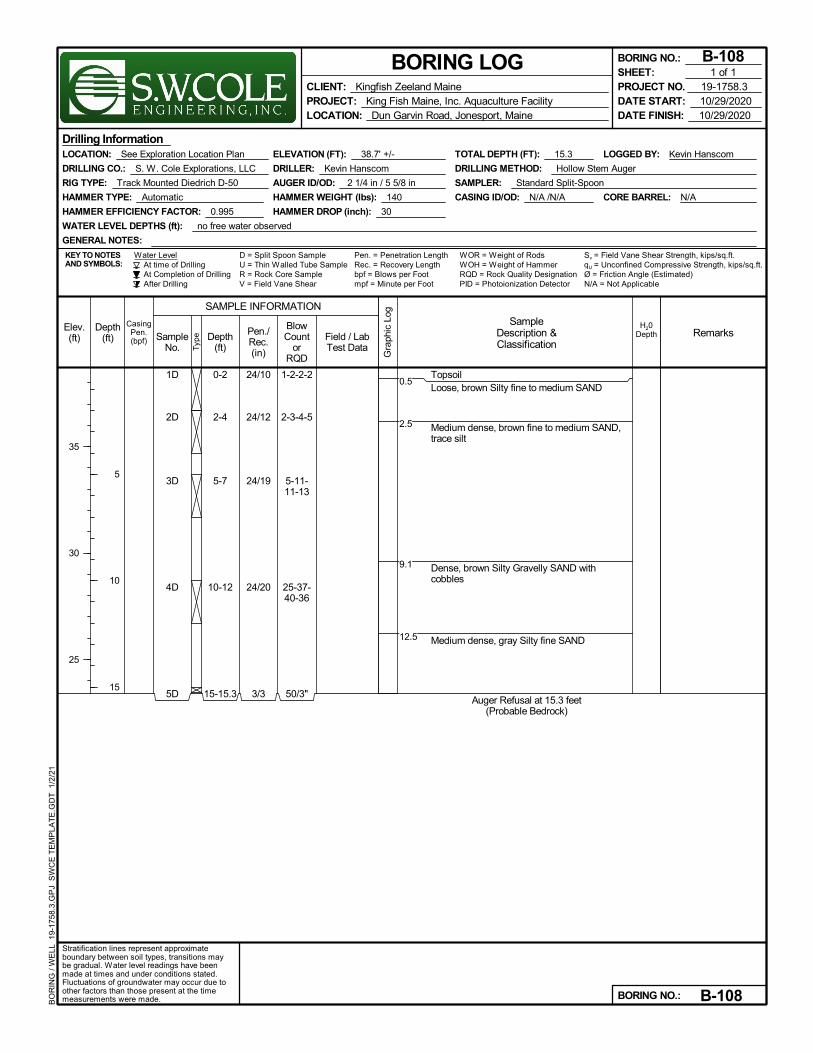
1D
2D
3D
4D
5D
24/10
24/12
24/19
24/20
3/3
1-2-2-2
2-3-4-5
5-11-11-13
25-37-40-36
50/3"
TopsoilLoose, brown Silty fine to medium SAND
Medium dense, brown fine to medium SAND,trace silt
Dense, brown Silty Gravelly SAND withcobbles
Medium dense, gray Silty fine SAND
Auger Refusal at 15.3 feet(Probable Bedrock)
0-2
2-4
5-7
10-12
15-15.3
Pen. = Penetration LengthRec. = Recovery Length
LOGGED BY: Kevin Hanscom
CORE BARREL: N/A
At time of DrillingAt Completion of DrillingAfter Drilling
D = Split Spoon Sample
CASING ID/OD: N/A /N/A
Water Level
AUGER ID/OD: 2 1/4 in / 5 5/8 in
ELEVATION (FT): 38.7' +/-
bpf = Blows per Foot
TOTAL DEPTH (FT): 15.3
U = Thin Walled Tube Sample
LOCATION: See Exploration Location Plan
DRILLER: Kevin Hanscom
KEY TO NOTESAND SYMBOLS:
Sv = Field Vane Shear Strength, kips/sq.ft.
Drilling Information
RIG TYPE: Track Mounted Diedrich D-50
HAMMER TYPE: Automatic
GENERAL NOTES:
HAMMER WEIGHT (lbs): 140
R = Rock Core SampleV = Field Vane Shear mpf = Minute per Foot
WOR = Weight of RodsWOH = Weight of HammerRQD = Rock Quality Designation
HAMMER DROP (inch): 30
DRILLING CO.: S. W. Cole Explorations, LLC
PID = Photoionization Detector N/A = Not Applicable
SAMPLER: Standard Split-Spoon
qU = Unconfined Compressive Strength, kips/sq.ft.Ø = Friction Angle (Estimated)
DRILLING METHOD: Hollow Stem Auger
WATER LEVEL DEPTHS (ft): no free water observed
HAMMER EFFICIENCY FACTOR: 0.995
Gra
phic
Log
Elev.(ft)
35
30
25
SampleNo. T
ype
Depth(ft)
5
10
15
CasingPen.(bpf)
Stratification lines represent approximateboundary between soil types, transitions maybe gradual. Water level readings have beenmade at times and under conditions stated.Fluctuations of groundwater may occur due toother factors than those present at the timemeasurements were made.
Pen./Rec.(in)
SAMPLE INFORMATION
H20Depth
BlowCount
orRQD
Field / LabTest Data
RemarksSample
Description &Classification
Depth(ft)
BORING LOG
DATE FINISH: 10/29/2020
BORING NO.: B-108
BORING NO.: B-108
PROJECT NO. 19-1758.3SHEET: 1 of 1
DATE START: 10/29/2020CLIENT: Kingfish Zeeland MainePROJECT: King Fish Maine, Inc. Aquaculture FacilityLOCATION: Dun Garvin Road, Jonesport, Maine
BO
RIN
G /
WE
LL 1
9-17
58.3
.GP
J S
WC
E T
EM
PLA
TE
.GD
T 1
/2/2
1
0.5
2.5
9.1
12.5
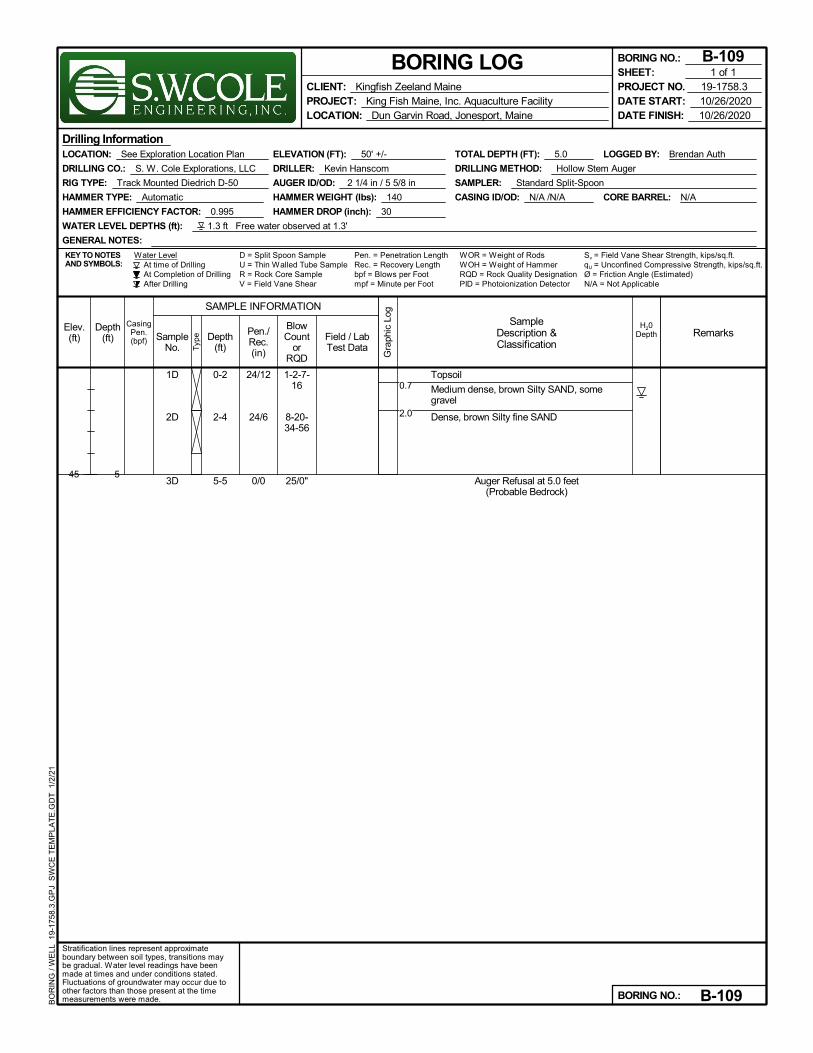
1D
2D
3D
24/12
24/6
0/0
1-2-7-16
8-20-34-56
25/0"
Topsoil
Medium dense, brown Silty SAND, somegravel
Dense, brown Silty fine SAND
Auger Refusal at 5.0 feet(Probable Bedrock)
0-2
2-4
5-5
Pen. = Penetration LengthRec. = Recovery Length
LOGGED BY: Brendan Auth
CORE BARREL: N/A
At time of DrillingAt Completion of DrillingAfter Drilling
D = Split Spoon Sample
CASING ID/OD: N/A /N/A
Water Level
AUGER ID/OD: 2 1/4 in / 5 5/8 in
ELEVATION (FT): 50' +/-
bpf = Blows per Foot
TOTAL DEPTH (FT): 5.0
U = Thin Walled Tube Sample
LOCATION: See Exploration Location Plan
DRILLER: Kevin Hanscom
KEY TO NOTESAND SYMBOLS:
Sv = Field Vane Shear Strength, kips/sq.ft.
Drilling Information
RIG TYPE: Track Mounted Diedrich D-50
HAMMER TYPE: Automatic
GENERAL NOTES:
HAMMER WEIGHT (lbs): 140
R = Rock Core SampleV = Field Vane Shear mpf = Minute per Foot
WOR = Weight of RodsWOH = Weight of HammerRQD = Rock Quality Designation
HAMMER DROP (inch): 30
DRILLING CO.: S. W. Cole Explorations, LLC
PID = Photoionization Detector N/A = Not Applicable
SAMPLER: Standard Split-Spoon
qU = Unconfined Compressive Strength, kips/sq.ft.Ø = Friction Angle (Estimated)
DRILLING METHOD: Hollow Stem Auger
WATER LEVEL DEPTHS (ft): 1.3 ft Free water observed at 1.3'
HAMMER EFFICIENCY FACTOR: 0.995
Gra
phic
Log
Elev.(ft)
45
SampleNo. T
ype
Depth(ft)
5
CasingPen.(bpf)
Stratification lines represent approximateboundary between soil types, transitions maybe gradual. Water level readings have beenmade at times and under conditions stated.Fluctuations of groundwater may occur due toother factors than those present at the timemeasurements were made.
Pen./Rec.(in)
SAMPLE INFORMATION
H20Depth
BlowCount
orRQD
Field / LabTest Data
RemarksSample
Description &Classification
Depth(ft)
BORING LOG
DATE FINISH: 10/26/2020
BORING NO.: B-109
BORING NO.: B-109
PROJECT NO. 19-1758.3SHEET: 1 of 1
DATE START: 10/26/2020CLIENT: Kingfish Zeeland MainePROJECT: King Fish Maine, Inc. Aquaculture FacilityLOCATION: Dun Garvin Road, Jonesport, Maine
BO
RIN
G /
WE
LL 1
9-17
58.3
.GP
J S
WC
E T
EM
PLA
TE
.GD
T 1
/2/2
1
0.7
2.0
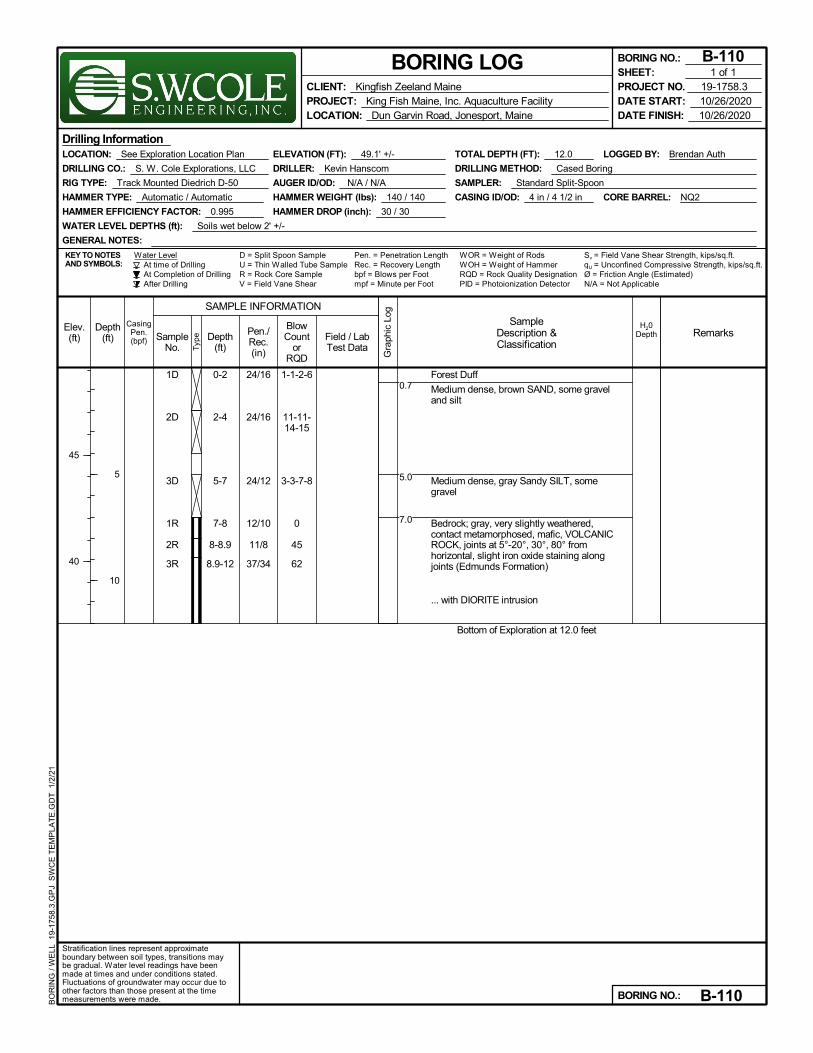
1D
2D
3D
1R
2R
3R
24/16
24/16
24/12
12/10
11/8
37/34
1-1-2-6
11-11-14-15
3-3-7-8
0
45
62
Forest Duff
Medium dense, brown SAND, some graveland silt
Medium dense, gray Sandy SILT, somegravel
Bedrock; gray, very slightly weathered,contact metamorphosed, mafic, VOLCANICROCK, joints at 5°-20°, 30°, 80° fromhorizontal, slight iron oxide staining alongjoints (Edmunds Formation)
... with DIORITE intrusion
Bottom of Exploration at 12.0 feet
0-2
2-4
5-7
7-8
8-8.9
8.9-12
Pen. = Penetration LengthRec. = Recovery Length
LOGGED BY: Brendan Auth
CORE BARREL: NQ2
At time of DrillingAt Completion of DrillingAfter Drilling
D = Split Spoon Sample
CASING ID/OD: 4 in / 4 1/2 in
Water Level
AUGER ID/OD: N/A / N/A
ELEVATION (FT): 49.1' +/-
bpf = Blows per Foot
TOTAL DEPTH (FT): 12.0
U = Thin Walled Tube Sample
LOCATION: See Exploration Location Plan
DRILLER: Kevin Hanscom
KEY TO NOTESAND SYMBOLS:
Sv = Field Vane Shear Strength, kips/sq.ft.
Drilling Information
RIG TYPE: Track Mounted Diedrich D-50
HAMMER TYPE: Automatic / Automatic
GENERAL NOTES:
HAMMER WEIGHT (lbs): 140 / 140
R = Rock Core SampleV = Field Vane Shear mpf = Minute per Foot
WOR = Weight of RodsWOH = Weight of HammerRQD = Rock Quality Designation
HAMMER DROP (inch): 30 / 30
DRILLING CO.: S. W. Cole Explorations, LLC
PID = Photoionization Detector N/A = Not Applicable
SAMPLER: Standard Split-Spoon
qU = Unconfined Compressive Strength, kips/sq.ft.Ø = Friction Angle (Estimated)
DRILLING METHOD: Cased Boring
WATER LEVEL DEPTHS (ft): Soils wet below 2' +/-
HAMMER EFFICIENCY FACTOR: 0.995
Gra
phic
Log
Elev.(ft)
45
40
SampleNo. T
ype
Depth(ft)
5
10
CasingPen.(bpf)
Stratification lines represent approximateboundary between soil types, transitions maybe gradual. Water level readings have beenmade at times and under conditions stated.Fluctuations of groundwater may occur due toother factors than those present at the timemeasurements were made.
Pen./Rec.(in)
SAMPLE INFORMATION
H20Depth
BlowCount
orRQD
Field / LabTest Data
RemarksSample
Description &Classification
Depth(ft)
BORING LOG
DATE FINISH: 10/26/2020
BORING NO.: B-110
BORING NO.: B-110
PROJECT NO. 19-1758.3SHEET: 1 of 1
DATE START: 10/26/2020CLIENT: Kingfish Zeeland MainePROJECT: King Fish Maine, Inc. Aquaculture FacilityLOCATION: Dun Garvin Road, Jonesport, Maine
BO
RIN
G /
WE
LL 1
9-17
58.3
.GP
J S
WC
E T
EM
PLA
TE
.GD
T 1
/2/2
1
0.7
5.0
7.0
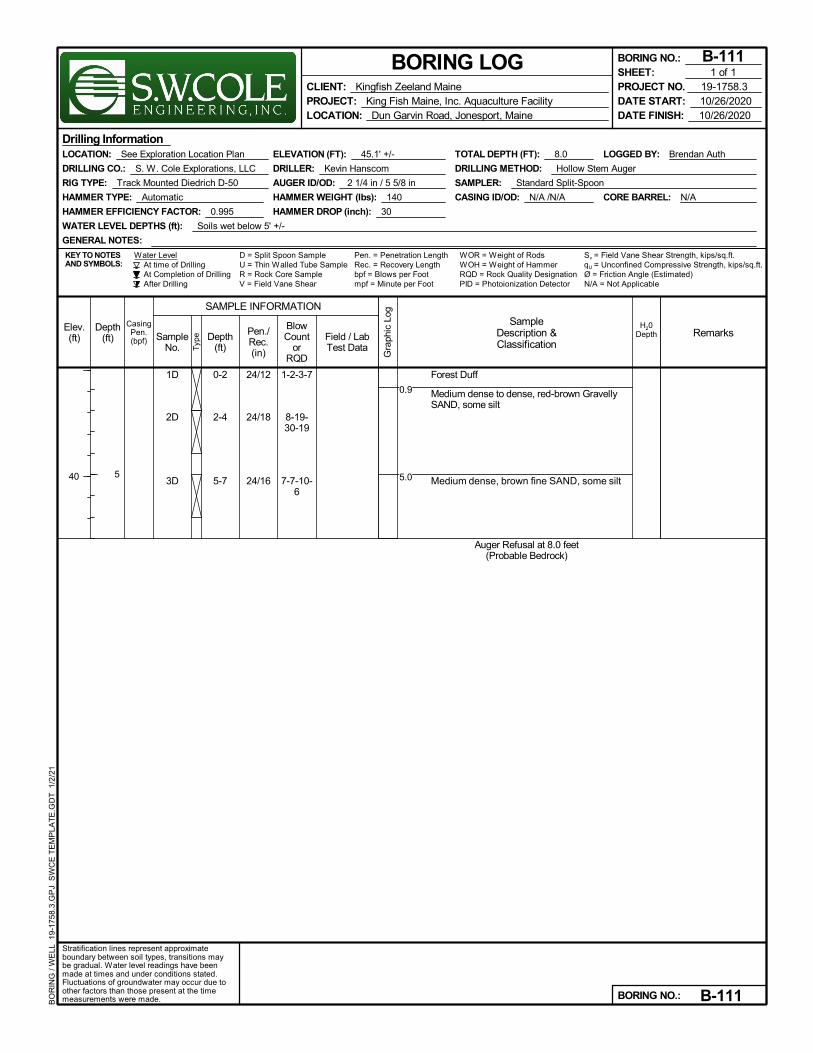
1D
2D
3D
24/12
24/18
24/16
1-2-3-7
8-19-30-19
7-7-10-6
Forest Duff
Medium dense to dense, red-brown GravellySAND, some silt
Medium dense, brown fine SAND, some silt
Auger Refusal at 8.0 feet(Probable Bedrock)
0-2
2-4
5-7
Pen. = Penetration LengthRec. = Recovery Length
LOGGED BY: Brendan Auth
CORE BARREL: N/A
At time of DrillingAt Completion of DrillingAfter Drilling
D = Split Spoon Sample
CASING ID/OD: N/A /N/A
Water Level
AUGER ID/OD: 2 1/4 in / 5 5/8 in
ELEVATION (FT): 45.1' +/-
bpf = Blows per Foot
TOTAL DEPTH (FT): 8.0
U = Thin Walled Tube Sample
LOCATION: See Exploration Location Plan
DRILLER: Kevin Hanscom
KEY TO NOTESAND SYMBOLS:
Sv = Field Vane Shear Strength, kips/sq.ft.
Drilling Information
RIG TYPE: Track Mounted Diedrich D-50
HAMMER TYPE: Automatic
GENERAL NOTES:
HAMMER WEIGHT (lbs): 140
R = Rock Core SampleV = Field Vane Shear mpf = Minute per Foot
WOR = Weight of RodsWOH = Weight of HammerRQD = Rock Quality Designation
HAMMER DROP (inch): 30
DRILLING CO.: S. W. Cole Explorations, LLC
PID = Photoionization Detector N/A = Not Applicable
SAMPLER: Standard Split-Spoon
qU = Unconfined Compressive Strength, kips/sq.ft.Ø = Friction Angle (Estimated)
DRILLING METHOD: Hollow Stem Auger
WATER LEVEL DEPTHS (ft): Soils wet below 5' +/-
HAMMER EFFICIENCY FACTOR: 0.995
Gra
phic
Log
Elev.(ft)
40
SampleNo. T
ype
Depth(ft)
5
CasingPen.(bpf)
Stratification lines represent approximateboundary between soil types, transitions maybe gradual. Water level readings have beenmade at times and under conditions stated.Fluctuations of groundwater may occur due toother factors than those present at the timemeasurements were made.
Pen./Rec.(in)
SAMPLE INFORMATION
H20Depth
BlowCount
orRQD
Field / LabTest Data
RemarksSample
Description &Classification
Depth(ft)
BORING LOG
DATE FINISH: 10/26/2020
BORING NO.: B-111
BORING NO.: B-111
PROJECT NO. 19-1758.3SHEET: 1 of 1
DATE START: 10/26/2020CLIENT: Kingfish Zeeland MainePROJECT: King Fish Maine, Inc. Aquaculture FacilityLOCATION: Dun Garvin Road, Jonesport, Maine
BO
RIN
G /
WE
LL 1
9-17
58.3
.GP
J S
WC
E T
EM
PLA
TE
.GD
T 1
/2/2
1
0.9
5.0
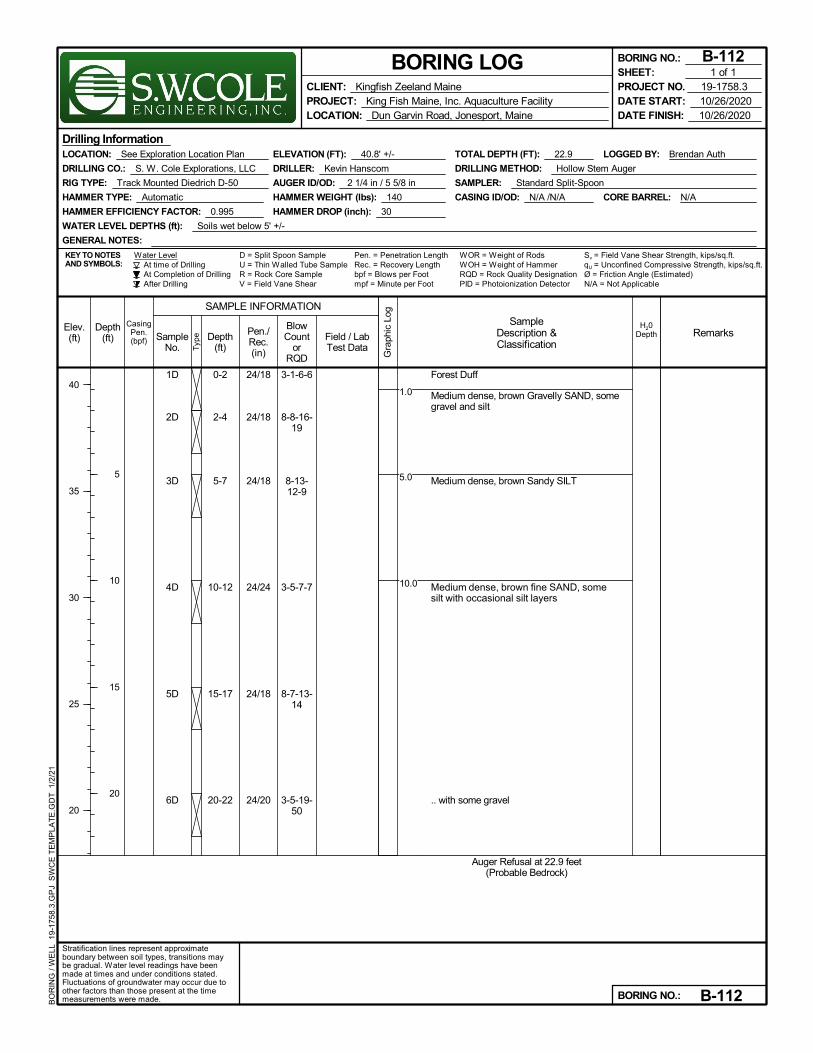
1D
2D
3D
4D
5D
6D
24/18
24/18
24/18
24/24
24/18
24/20
3-1-6-6
8-8-16-19
8-13-12-9
3-5-7-7
8-7-13-14
3-5-19-50
Forest Duff
Medium dense, brown Gravelly SAND, somegravel and silt
Medium dense, brown Sandy SILT
Medium dense, brown fine SAND, some silt with occasional silt layers
.. with some gravel
Auger Refusal at 22.9 feet(Probable Bedrock)
0-2
2-4
5-7
10-12
15-17
20-22
Pen. = Penetration LengthRec. = Recovery Length
LOGGED BY: Brendan Auth
CORE BARREL: N/A
At time of DrillingAt Completion of DrillingAfter Drilling
D = Split Spoon Sample
CASING ID/OD: N/A /N/A
Water Level
AUGER ID/OD: 2 1/4 in / 5 5/8 in
ELEVATION (FT): 40.8' +/-
bpf = Blows per Foot
TOTAL DEPTH (FT): 22.9
U = Thin Walled Tube Sample
LOCATION: See Exploration Location Plan
DRILLER: Kevin Hanscom
KEY TO NOTESAND SYMBOLS:
Sv = Field Vane Shear Strength, kips/sq.ft.
Drilling Information
RIG TYPE: Track Mounted Diedrich D-50
HAMMER TYPE: Automatic
GENERAL NOTES:
HAMMER WEIGHT (lbs): 140
R = Rock Core SampleV = Field Vane Shear mpf = Minute per Foot
WOR = Weight of RodsWOH = Weight of HammerRQD = Rock Quality Designation
HAMMER DROP (inch): 30
DRILLING CO.: S. W. Cole Explorations, LLC
PID = Photoionization Detector N/A = Not Applicable
SAMPLER: Standard Split-Spoon
qU = Unconfined Compressive Strength, kips/sq.ft.Ø = Friction Angle (Estimated)
DRILLING METHOD: Hollow Stem Auger
WATER LEVEL DEPTHS (ft): Soils wet below 5' +/-
HAMMER EFFICIENCY FACTOR: 0.995
Gra
phic
Log
Elev.(ft)
40
35
30
25
20
SampleNo. T
ype
Depth(ft)
5
10
15
20
CasingPen.(bpf)
Stratification lines represent approximateboundary between soil types, transitions maybe gradual. Water level readings have beenmade at times and under conditions stated.Fluctuations of groundwater may occur due toother factors than those present at the timemeasurements were made.
Pen./Rec.(in)
SAMPLE INFORMATION
H20Depth
BlowCount
orRQD
Field / LabTest Data
RemarksSample
Description &Classification
Depth(ft)
BORING LOG
DATE FINISH: 10/26/2020
BORING NO.: B-112
BORING NO.: B-112
PROJECT NO. 19-1758.3SHEET: 1 of 1
DATE START: 10/26/2020CLIENT: Kingfish Zeeland MainePROJECT: King Fish Maine, Inc. Aquaculture FacilityLOCATION: Dun Garvin Road, Jonesport, Maine
BO
RIN
G /
WE
LL 1
9-17
58.3
.GP
J S
WC
E T
EM
PLA
TE
.GD
T 1
/2/2
1
1.0
5.0
10.0

1D
2D
3D
4D
5D
D
24/19
24/19
24/14
24/24
24/24
0/0
1-2-2-3
4-5-12-16
10-6-6-8
3-3-8-6
7-8-9-13
25/0"
TopsoilLoose, red-brown Gravelly SAND, some silt
Medium dense, brown SAND, trace silt
Medium dense, Sandy SILT
... with numerous cobbles
Medium dense, varved Sandy SILT and fineSAND
Dense, probable brown Silty Gravelly SANDwith cobbles (Glacial Till)
Auger Refusal at 21.2 feet(Probable Bedrock)
0-2
2-4
5-7
10-12
15-17
20-20
Pen. = Penetration LengthRec. = Recovery Length
LOGGED BY: Jeff McElroy
CORE BARREL: N/A
At time of DrillingAt Completion of DrillingAfter Drilling
D = Split Spoon Sample
CASING ID/OD: N/A /N/A
Water Level
AUGER ID/OD: 2 1/4 in / 5 5/8 in
ELEVATION (FT): 38.8' +/-
bpf = Blows per Foot
TOTAL DEPTH (FT): 21.2
U = Thin Walled Tube Sample
LOCATION: See Exploration Location Plan
DRILLER: Kevin Hanscom
KEY TO NOTESAND SYMBOLS:
Sv = Field Vane Shear Strength, kips/sq.ft.
Drilling Information
RIG TYPE: Track Mounted Diedrich D-50
HAMMER TYPE: Automatic
GENERAL NOTES:
HAMMER WEIGHT (lbs): 140
R = Rock Core SampleV = Field Vane Shear mpf = Minute per Foot
WOR = Weight of RodsWOH = Weight of HammerRQD = Rock Quality Designation
HAMMER DROP (inch): 30
DRILLING CO.: S. W. Cole Explorations, LLC
PID = Photoionization Detector N/A = Not Applicable
SAMPLER: Standard Split-Spoon
qU = Unconfined Compressive Strength, kips/sq.ft.Ø = Friction Angle (Estimated)
DRILLING METHOD: Hollow Stem Auger
WATER LEVEL DEPTHS (ft): Free water observed at 11.5 feet
HAMMER EFFICIENCY FACTOR: 0.995
Gra
phic
Log
Elev.(ft)
35
30
25
20
SampleNo. T
ype
Depth(ft)
5
10
15
20
CasingPen.(bpf)
Stratification lines represent approximateboundary between soil types, transitions maybe gradual. Water level readings have beenmade at times and under conditions stated.Fluctuations of groundwater may occur due toother factors than those present at the timemeasurements were made.
Pen./Rec.(in)
SAMPLE INFORMATION
H20Depth
BlowCount
orRQD
Field / LabTest Data
RemarksSample
Description &Classification
Depth(ft)
BORING LOG
DATE FINISH: 10/28/2020
BORING NO.: B-113
BORING NO.: B-113
PROJECT NO. 19-1758.3SHEET: 1 of 1
DATE START: 10/28/2020CLIENT: Kingfish Zeeland MainePROJECT: King Fish Maine, Inc. Aquaculture FacilityLOCATION: Dun Garvin Road, Jonesport, Maine
BO
RIN
G /
WE
LL 1
9-17
58.3
.GP
J S
WC
E T
EM
PLA
TE
.GD
T 1
/2/2
1
0.5
2.5
5.5
9.0
18.0
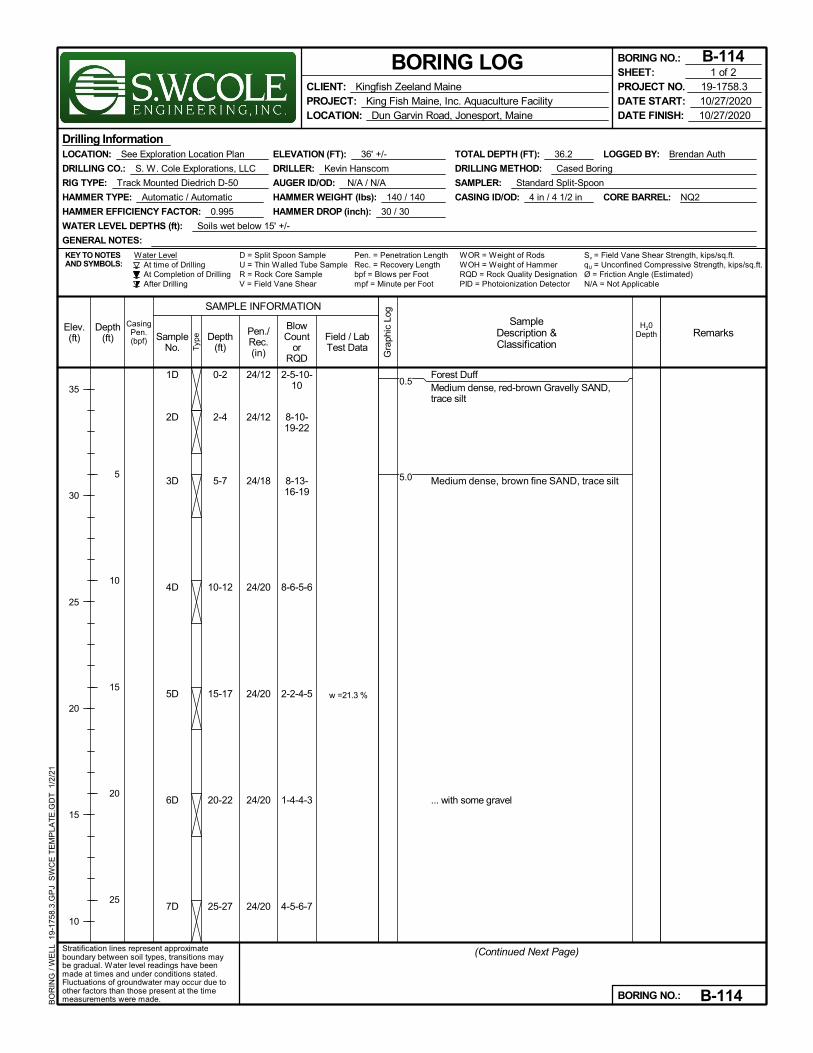
1D
2D
3D
4D
5D
6D
7D
24/12
24/12
24/18
24/20
24/20
24/20
24/20
2-5-10-10
8-10-19-22
8-13-16-19
8-6-5-6
2-2-4-5
1-4-4-3
4-5-6-7
w =21.3 %
Forest DuffMedium dense, red-brown Gravelly SAND,trace silt
Medium dense, brown fine SAND, trace silt
... with some gravel
0-2
2-4
5-7
10-12
15-17
20-22
25-27
Pen. = Penetration LengthRec. = Recovery Length
LOGGED BY: Brendan Auth
CORE BARREL: NQ2
At time of DrillingAt Completion of DrillingAfter Drilling
D = Split Spoon Sample
CASING ID/OD: 4 in / 4 1/2 in
Water Level
AUGER ID/OD: N/A / N/A
ELEVATION (FT): 36' +/-
bpf = Blows per Foot
TOTAL DEPTH (FT): 36.2
U = Thin Walled Tube Sample
LOCATION: See Exploration Location Plan
DRILLER: Kevin Hanscom
KEY TO NOTESAND SYMBOLS:
Sv = Field Vane Shear Strength, kips/sq.ft.
Drilling Information
RIG TYPE: Track Mounted Diedrich D-50
HAMMER TYPE: Automatic / Automatic
GENERAL NOTES:
HAMMER WEIGHT (lbs): 140 / 140
R = Rock Core SampleV = Field Vane Shear mpf = Minute per Foot
WOR = Weight of RodsWOH = Weight of HammerRQD = Rock Quality Designation
HAMMER DROP (inch): 30 / 30
DRILLING CO.: S. W. Cole Explorations, LLC
PID = Photoionization Detector N/A = Not Applicable
SAMPLER: Standard Split-Spoon
qU = Unconfined Compressive Strength, kips/sq.ft.Ø = Friction Angle (Estimated)
DRILLING METHOD: Cased Boring
WATER LEVEL DEPTHS (ft): Soils wet below 15' +/-
HAMMER EFFICIENCY FACTOR: 0.995
Gra
phic
Log
Elev.(ft)
35
30
25
20
15
10
(Continued Next Page)
SampleNo. T
ype
Depth(ft)
5
10
15
20
25
CasingPen.(bpf)
Stratification lines represent approximateboundary between soil types, transitions maybe gradual. Water level readings have beenmade at times and under conditions stated.Fluctuations of groundwater may occur due toother factors than those present at the timemeasurements were made.
Pen./Rec.(in)
SAMPLE INFORMATION
H20Depth
BlowCount
orRQD
Field / LabTest Data
RemarksSample
Description &Classification
Depth(ft)
BORING LOG
DATE FINISH: 10/27/2020
BORING NO.: B-114
BORING NO.: B-114
PROJECT NO. 19-1758.3SHEET: 1 of 2
DATE START: 10/27/2020CLIENT: Kingfish Zeeland MainePROJECT: King Fish Maine, Inc. Aquaculture FacilityLOCATION: Dun Garvin Road, Jonesport, Maine
BO
RIN
G /
WE
LL 1
9-17
58.3
.GP
J S
WC
E T
EM
PLA
TE
.GD
T 1
/2/2
1
0.5
5.0
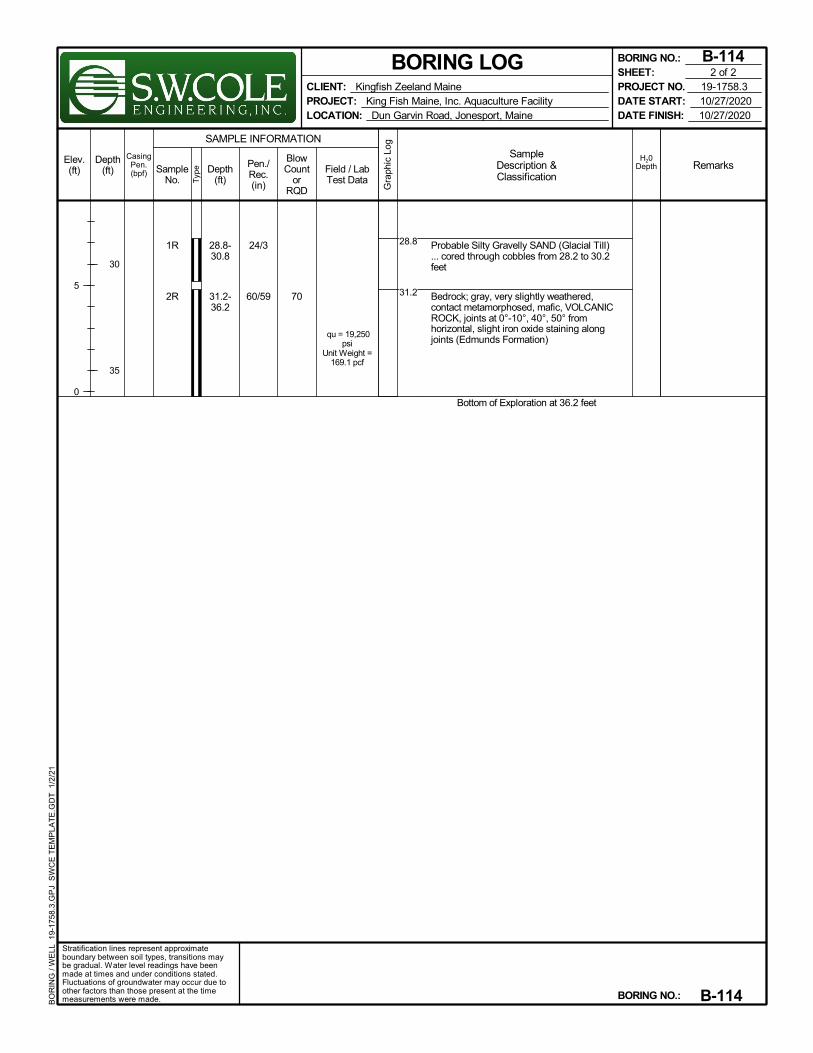
1R
2R
24/3
60/59 70
qu = 19,250psi
Unit Weight =169.1 pcf
Probable Silty Gravelly SAND (Glacial Till)... cored through cobbles from 28.2 to 30.2feet
Bedrock; gray, very slightly weathered,contact metamorphosed, mafic, VOLCANICROCK, joints at 0°-10°, 40°, 50° fromhorizontal, slight iron oxide staining alongjoints (Edmunds Formation)
Bottom of Exploration at 36.2 feet
28.8-30.8
31.2-36.2
Gra
phic
Log
Elev.(ft)
5
0
SampleNo. T
ype
Depth(ft)
30
35
CasingPen.(bpf)
Stratification lines represent approximateboundary between soil types, transitions maybe gradual. Water level readings have beenmade at times and under conditions stated.Fluctuations of groundwater may occur due toother factors than those present at the timemeasurements were made.
Pen./Rec.(in)
SAMPLE INFORMATION
H20Depth
BlowCount
orRQD
Field / LabTest Data
RemarksSample
Description &Classification
Depth(ft)
BORING LOG
DATE FINISH: 10/27/2020
BORING NO.: B-114
BORING NO.: B-114
PROJECT NO. 19-1758.3SHEET: 2 of 2
DATE START: 10/27/2020CLIENT: Kingfish Zeeland MainePROJECT: King Fish Maine, Inc. Aquaculture FacilityLOCATION: Dun Garvin Road, Jonesport, Maine
BO
RIN
G /
WE
LL 1
9-17
58.3
.GP
J S
WC
E T
EM
PLA
TE
.GD
T 1
/2/2
1
28.8
31.2
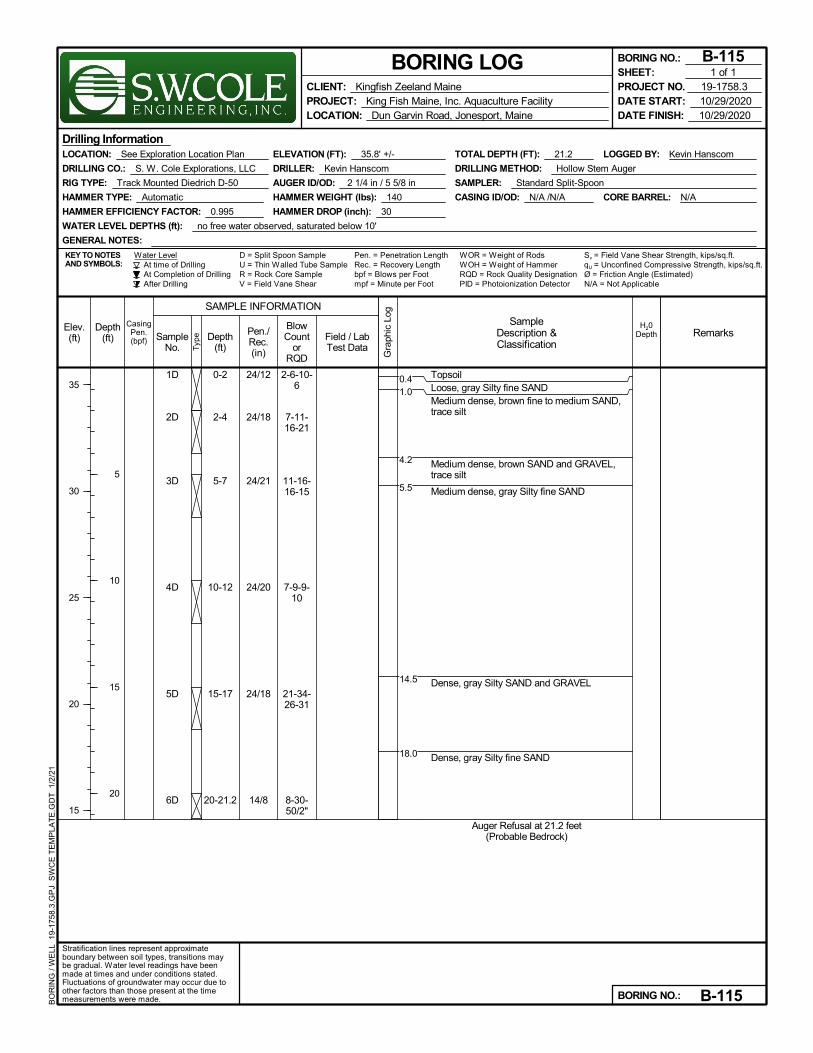
1D
2D
3D
4D
5D
6D
24/12
24/18
24/21
24/20
24/18
14/8
2-6-10-6
7-11-16-21
11-16-16-15
7-9-9-10
21-34-26-31
8-30-50/2"
TopsoilLoose, gray Silty fine SANDMedium dense, brown fine to medium SAND,trace silt
Medium dense, brown SAND and GRAVEL,trace silt
Medium dense, gray Silty fine SAND
Dense, gray Silty SAND and GRAVEL
Dense, gray Silty fine SAND
Auger Refusal at 21.2 feet(Probable Bedrock)
0-2
2-4
5-7
10-12
15-17
20-21.2
Pen. = Penetration LengthRec. = Recovery Length
LOGGED BY: Kevin Hanscom
CORE BARREL: N/A
At time of DrillingAt Completion of DrillingAfter Drilling
D = Split Spoon Sample
CASING ID/OD: N/A /N/A
Water Level
AUGER ID/OD: 2 1/4 in / 5 5/8 in
ELEVATION (FT): 35.8' +/-
bpf = Blows per Foot
TOTAL DEPTH (FT): 21.2
U = Thin Walled Tube Sample
LOCATION: See Exploration Location Plan
DRILLER: Kevin Hanscom
KEY TO NOTESAND SYMBOLS:
Sv = Field Vane Shear Strength, kips/sq.ft.
Drilling Information
RIG TYPE: Track Mounted Diedrich D-50
HAMMER TYPE: Automatic
GENERAL NOTES:
HAMMER WEIGHT (lbs): 140
R = Rock Core SampleV = Field Vane Shear mpf = Minute per Foot
WOR = Weight of RodsWOH = Weight of HammerRQD = Rock Quality Designation
HAMMER DROP (inch): 30
DRILLING CO.: S. W. Cole Explorations, LLC
PID = Photoionization Detector N/A = Not Applicable
SAMPLER: Standard Split-Spoon
qU = Unconfined Compressive Strength, kips/sq.ft.Ø = Friction Angle (Estimated)
DRILLING METHOD: Hollow Stem Auger
WATER LEVEL DEPTHS (ft): no free water observed, saturated below 10'
HAMMER EFFICIENCY FACTOR: 0.995
Gra
phic
Log
Elev.(ft)
35
30
25
20
15
SampleNo. T
ype
Depth(ft)
5
10
15
20
CasingPen.(bpf)
Stratification lines represent approximateboundary between soil types, transitions maybe gradual. Water level readings have beenmade at times and under conditions stated.Fluctuations of groundwater may occur due toother factors than those present at the timemeasurements were made.
Pen./Rec.(in)
SAMPLE INFORMATION
H20Depth
BlowCount
orRQD
Field / LabTest Data
RemarksSample
Description &Classification
Depth(ft)
BORING LOG
DATE FINISH: 10/29/2020
BORING NO.: B-115
BORING NO.: B-115
PROJECT NO. 19-1758.3SHEET: 1 of 1
DATE START: 10/29/2020CLIENT: Kingfish Zeeland MainePROJECT: King Fish Maine, Inc. Aquaculture FacilityLOCATION: Dun Garvin Road, Jonesport, Maine
BO
RIN
G /
WE
LL 1
9-17
58.3
.GP
J S
WC
E T
EM
PLA
TE
.GD
T 1
/2/2
1
0.41.0
4.2
5.5
14.5
18.0
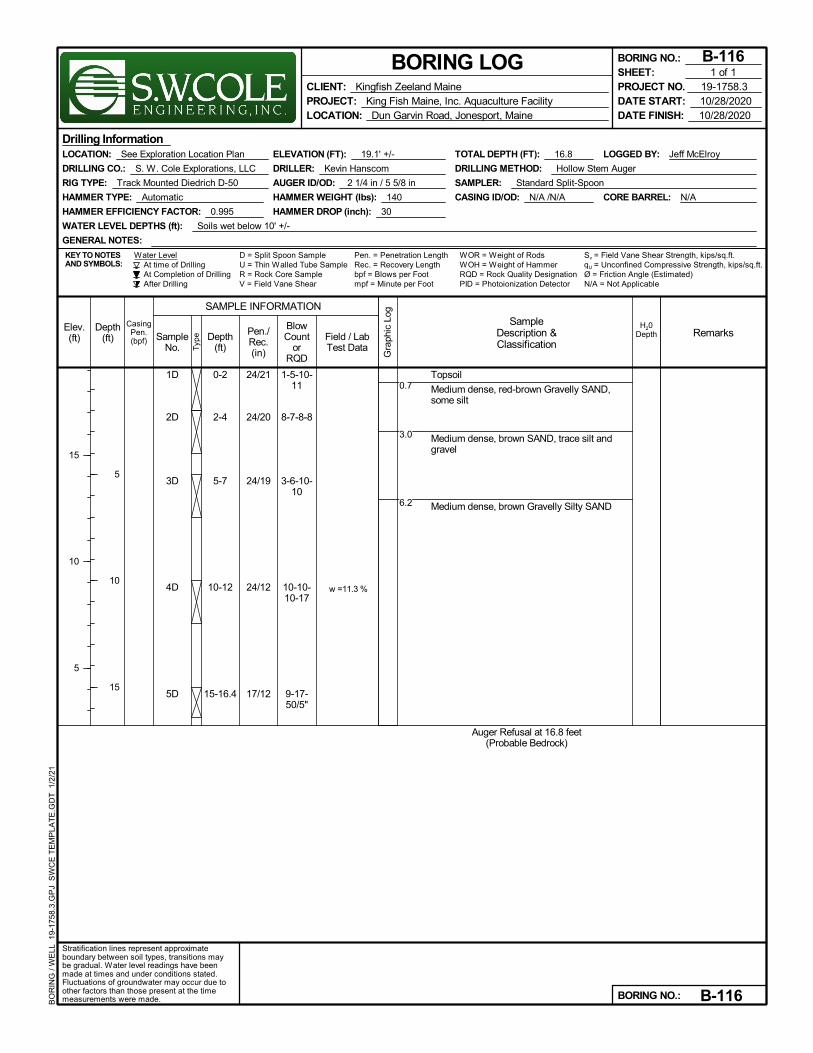
1D
2D
3D
4D
5D
24/21
24/20
24/19
24/12
17/12
1-5-10-11
8-7-8-8
3-6-10-10
10-10-10-17
9-17-50/5"
w =11.3 %
Topsoil
Medium dense, red-brown Gravelly SAND,some silt
Medium dense, brown SAND, trace silt andgravel
Medium dense, brown Gravelly Silty SAND
Auger Refusal at 16.8 feet(Probable Bedrock)
0-2
2-4
5-7
10-12
15-16.4
Pen. = Penetration LengthRec. = Recovery Length
LOGGED BY: Jeff McElroy
CORE BARREL: N/A
At time of DrillingAt Completion of DrillingAfter Drilling
D = Split Spoon Sample
CASING ID/OD: N/A /N/A
Water Level
AUGER ID/OD: 2 1/4 in / 5 5/8 in
ELEVATION (FT): 19.1' +/-
bpf = Blows per Foot
TOTAL DEPTH (FT): 16.8
U = Thin Walled Tube Sample
LOCATION: See Exploration Location Plan
DRILLER: Kevin Hanscom
KEY TO NOTESAND SYMBOLS:
Sv = Field Vane Shear Strength, kips/sq.ft.
Drilling Information
RIG TYPE: Track Mounted Diedrich D-50
HAMMER TYPE: Automatic
GENERAL NOTES:
HAMMER WEIGHT (lbs): 140
R = Rock Core SampleV = Field Vane Shear mpf = Minute per Foot
WOR = Weight of RodsWOH = Weight of HammerRQD = Rock Quality Designation
HAMMER DROP (inch): 30
DRILLING CO.: S. W. Cole Explorations, LLC
PID = Photoionization Detector N/A = Not Applicable
SAMPLER: Standard Split-Spoon
qU = Unconfined Compressive Strength, kips/sq.ft.Ø = Friction Angle (Estimated)
DRILLING METHOD: Hollow Stem Auger
WATER LEVEL DEPTHS (ft): Soils wet below 10' +/-
HAMMER EFFICIENCY FACTOR: 0.995
Gra
phic
Log
Elev.(ft)
15
10
5
SampleNo. T
ype
Depth(ft)
5
10
15
CasingPen.(bpf)
Stratification lines represent approximateboundary between soil types, transitions maybe gradual. Water level readings have beenmade at times and under conditions stated.Fluctuations of groundwater may occur due toother factors than those present at the timemeasurements were made.
Pen./Rec.(in)
SAMPLE INFORMATION
H20Depth
BlowCount
orRQD
Field / LabTest Data
RemarksSample
Description &Classification
Depth(ft)
BORING LOG
DATE FINISH: 10/28/2020
BORING NO.: B-116
BORING NO.: B-116
PROJECT NO. 19-1758.3SHEET: 1 of 1
DATE START: 10/28/2020CLIENT: Kingfish Zeeland MainePROJECT: King Fish Maine, Inc. Aquaculture FacilityLOCATION: Dun Garvin Road, Jonesport, Maine
BO
RIN
G /
WE
LL 1
9-17
58.3
.GP
J S
WC
E T
EM
PLA
TE
.GD
T 1
/2/2
1
0.7
3.0
6.2
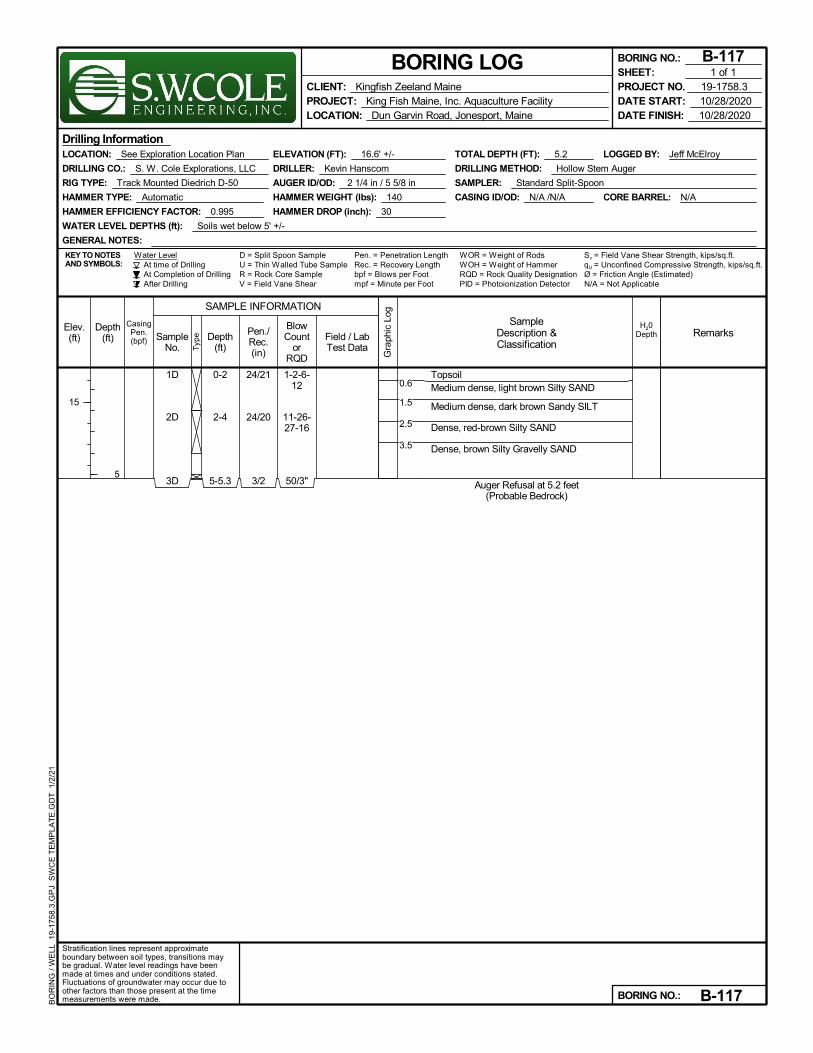
1D
2D
3D
24/21
24/20
3/2
1-2-6-12
11-26-27-16
50/3"
TopsoilMedium dense, light brown Silty SAND
Medium dense, dark brown Sandy SILT
Dense, red-brown Silty SAND
Dense, brown Silty Gravelly SAND
Auger Refusal at 5.2 feet(Probable Bedrock)
0-2
2-4
5-5.3
Pen. = Penetration LengthRec. = Recovery Length
LOGGED BY: Jeff McElroy
CORE BARREL: N/A
At time of DrillingAt Completion of DrillingAfter Drilling
D = Split Spoon Sample
CASING ID/OD: N/A /N/A
Water Level
AUGER ID/OD: 2 1/4 in / 5 5/8 in
ELEVATION (FT): 16.6' +/-
bpf = Blows per Foot
TOTAL DEPTH (FT): 5.2
U = Thin Walled Tube Sample
LOCATION: See Exploration Location Plan
DRILLER: Kevin Hanscom
KEY TO NOTESAND SYMBOLS:
Sv = Field Vane Shear Strength, kips/sq.ft.
Drilling Information
RIG TYPE: Track Mounted Diedrich D-50
HAMMER TYPE: Automatic
GENERAL NOTES:
HAMMER WEIGHT (lbs): 140
R = Rock Core SampleV = Field Vane Shear mpf = Minute per Foot
WOR = Weight of RodsWOH = Weight of HammerRQD = Rock Quality Designation
HAMMER DROP (inch): 30
DRILLING CO.: S. W. Cole Explorations, LLC
PID = Photoionization Detector N/A = Not Applicable
SAMPLER: Standard Split-Spoon
qU = Unconfined Compressive Strength, kips/sq.ft.Ø = Friction Angle (Estimated)
DRILLING METHOD: Hollow Stem Auger
WATER LEVEL DEPTHS (ft): Soils wet below 5' +/-
HAMMER EFFICIENCY FACTOR: 0.995
Gra
phic
Log
Elev.(ft)
15
SampleNo. T
ype
Depth(ft)
5
CasingPen.(bpf)
Stratification lines represent approximateboundary between soil types, transitions maybe gradual. Water level readings have beenmade at times and under conditions stated.Fluctuations of groundwater may occur due toother factors than those present at the timemeasurements were made.
Pen./Rec.(in)
SAMPLE INFORMATION
H20Depth
BlowCount
orRQD
Field / LabTest Data
RemarksSample
Description &Classification
Depth(ft)
BORING LOG
DATE FINISH: 10/28/2020
BORING NO.: B-117
BORING NO.: B-117
PROJECT NO. 19-1758.3SHEET: 1 of 1
DATE START: 10/28/2020CLIENT: Kingfish Zeeland MainePROJECT: King Fish Maine, Inc. Aquaculture FacilityLOCATION: Dun Garvin Road, Jonesport, Maine
BO
RIN
G /
WE
LL 1
9-17
58.3
.GP
J S
WC
E T
EM
PLA
TE
.GD
T 1
/2/2
1
0.6
1.5
2.5
3.5
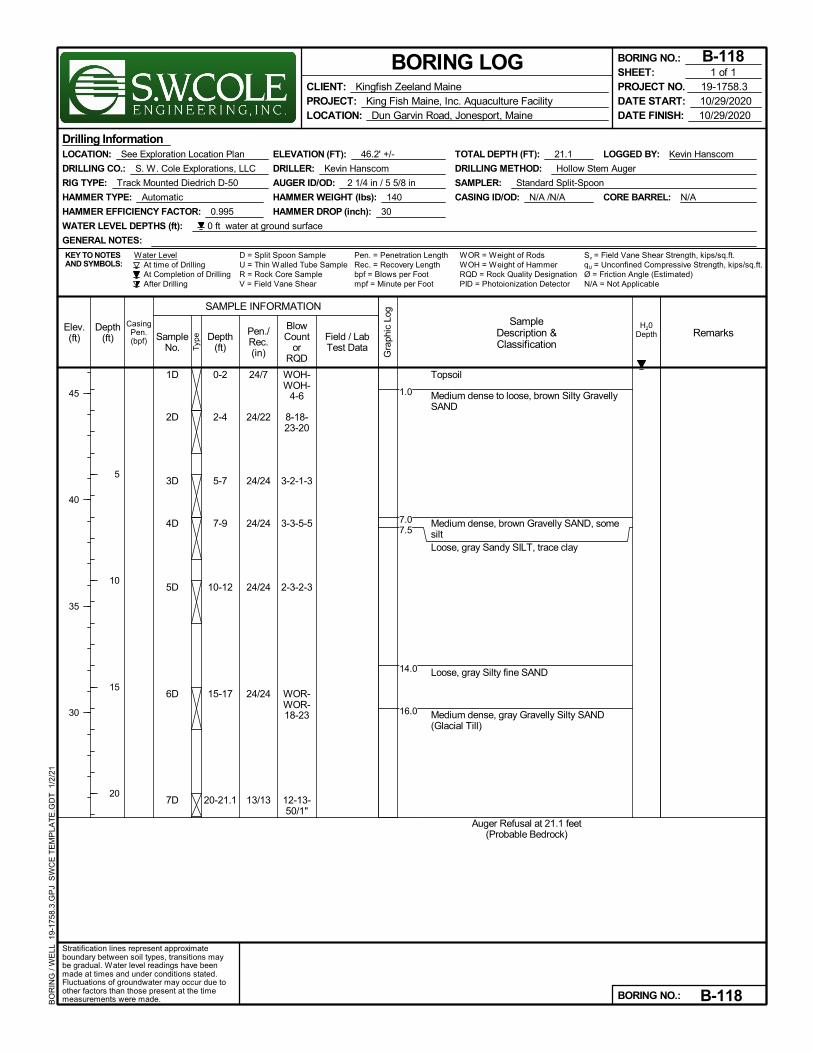
1D
2D
3D
4D
5D
6D
7D
24/7
24/22
24/24
24/24
24/24
24/24
13/13
WOH-WOH-
4-6
8-18-23-20
3-2-1-3
3-3-5-5
2-3-2-3
WOR-WOR-18-23
12-13-50/1"
Topsoil
Medium dense to loose, brown Silty GravellySAND
Medium dense, brown Gravelly SAND, somesiltLoose, gray Sandy SILT, trace clay
Loose, gray Silty fine SAND
Medium dense, gray Gravelly Silty SAND(Glacial Till)
Auger Refusal at 21.1 feet(Probable Bedrock)
0-2
2-4
5-7
7-9
10-12
15-17
20-21.1
Pen. = Penetration LengthRec. = Recovery Length
LOGGED BY: Kevin Hanscom
CORE BARREL: N/A
At time of DrillingAt Completion of DrillingAfter Drilling
D = Split Spoon Sample
CASING ID/OD: N/A /N/A
Water Level
AUGER ID/OD: 2 1/4 in / 5 5/8 in
ELEVATION (FT): 46.2' +/-
bpf = Blows per Foot
TOTAL DEPTH (FT): 21.1
U = Thin Walled Tube Sample
LOCATION: See Exploration Location Plan
DRILLER: Kevin Hanscom
KEY TO NOTESAND SYMBOLS:
Sv = Field Vane Shear Strength, kips/sq.ft.
Drilling Information
RIG TYPE: Track Mounted Diedrich D-50
HAMMER TYPE: Automatic
GENERAL NOTES:
HAMMER WEIGHT (lbs): 140
R = Rock Core SampleV = Field Vane Shear mpf = Minute per Foot
WOR = Weight of RodsWOH = Weight of HammerRQD = Rock Quality Designation
HAMMER DROP (inch): 30
DRILLING CO.: S. W. Cole Explorations, LLC
PID = Photoionization Detector N/A = Not Applicable
SAMPLER: Standard Split-Spoon
qU = Unconfined Compressive Strength, kips/sq.ft.Ø = Friction Angle (Estimated)
DRILLING METHOD: Hollow Stem Auger
WATER LEVEL DEPTHS (ft): 0 ft water at ground surface
HAMMER EFFICIENCY FACTOR: 0.995
Gra
phic
Log
Elev.(ft)
45
40
35
30
SampleNo. T
ype
Depth(ft)
5
10
15
20
CasingPen.(bpf)
Stratification lines represent approximateboundary between soil types, transitions maybe gradual. Water level readings have beenmade at times and under conditions stated.Fluctuations of groundwater may occur due toother factors than those present at the timemeasurements were made.
Pen./Rec.(in)
SAMPLE INFORMATION
H20Depth
BlowCount
orRQD
Field / LabTest Data
RemarksSample
Description &Classification
Depth(ft)
BORING LOG
DATE FINISH: 10/29/2020
BORING NO.: B-118
BORING NO.: B-118
PROJECT NO. 19-1758.3SHEET: 1 of 1
DATE START: 10/29/2020CLIENT: Kingfish Zeeland MainePROJECT: King Fish Maine, Inc. Aquaculture FacilityLOCATION: Dun Garvin Road, Jonesport, Maine
BO
RIN
G /
WE
LL 1
9-17
58.3
.GP
J S
WC
E T
EM
PLA
TE
.GD
T 1
/2/2
1
1.0
7.07.5
14.0
16.0
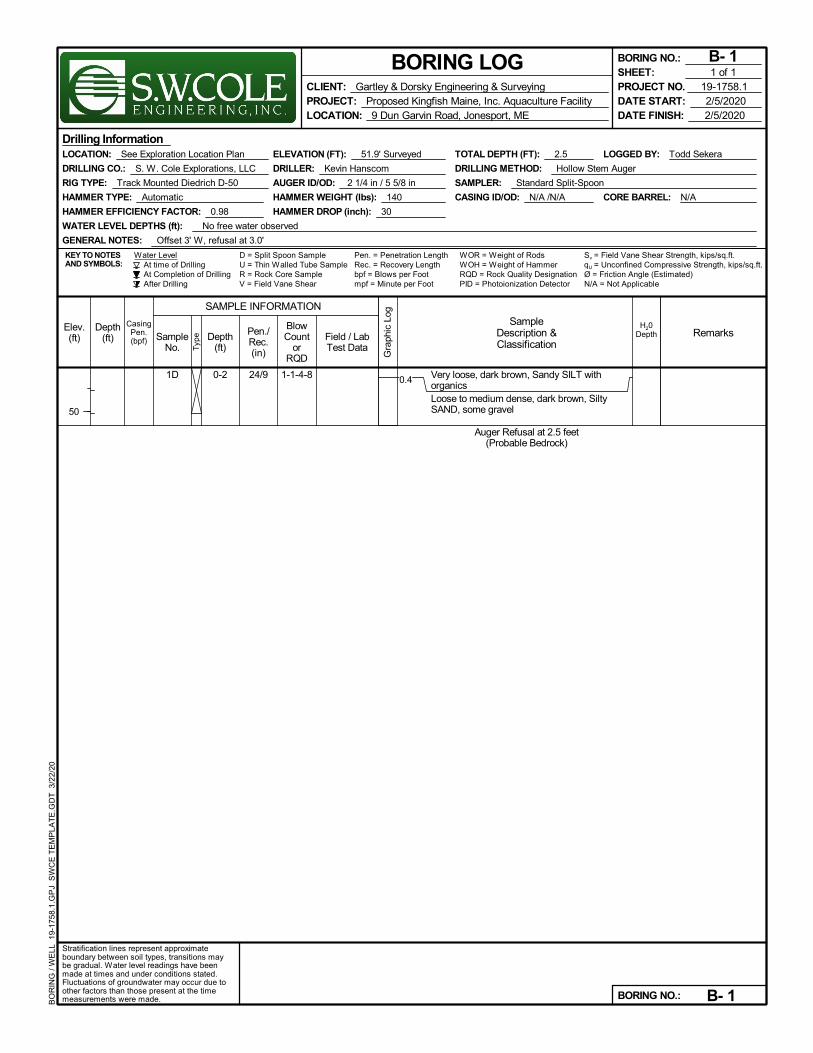
1D 24/9 1-1-4-8 Very loose, dark brown, Sandy SILT withorganicsLoose to medium dense, dark brown, SiltySAND, some gravel
Auger Refusal at 2.5 feet(Probable Bedrock)
0-2
Pen. = Penetration LengthRec. = Recovery Length
LOGGED BY: Todd Sekera
CORE BARREL: N/A
At time of DrillingAt Completion of DrillingAfter Drilling
D = Split Spoon Sample
CASING ID/OD: N/A /N/A
Water Level
AUGER ID/OD: 2 1/4 in / 5 5/8 in
ELEVATION (FT): 51.9' Surveyed
bpf = Blows per Foot
TOTAL DEPTH (FT): 2.5
U = Thin Walled Tube Sample
LOCATION: See Exploration Location Plan
DRILLER: Kevin Hanscom
HAMMER EFFICIENCY FACTOR: 0.98
KEY TO NOTESAND SYMBOLS:
WATER LEVEL DEPTHS (ft): No free water observed
Sv = Field Vane Shear Strength, kips/sq.ft.
Drilling Information
RIG TYPE: Track Mounted Diedrich D-50
HAMMER TYPE: Automatic
GENERAL NOTES: Offset 3' W, refusal at 3.0'
HAMMER WEIGHT (lbs): 140
R = Rock Core SampleV = Field Vane Shear mpf = Minute per Foot
WOR = Weight of RodsWOH = Weight of HammerRQD = Rock Quality Designation
HAMMER DROP (inch): 30
DRILLING CO.: S. W. Cole Explorations, LLC
PID = Photoionization Detector N/A = Not Applicable
SAMPLER: Standard Split-Spoon
qU = Unconfined Compressive Strength, kips/sq.ft.Ø = Friction Angle (Estimated)
DRILLING METHOD: Hollow Stem Auger
Gra
phic
Log
Elev.(ft)
50
SampleNo. T
ype
Depth(ft)
CasingPen.(bpf)
Stratification lines represent approximateboundary between soil types, transitions maybe gradual. Water level readings have beenmade at times and under conditions stated.Fluctuations of groundwater may occur due toother factors than those present at the timemeasurements were made.
Pen./Rec.(in)
SAMPLE INFORMATION
H20Depth
BlowCount
orRQD
Field / LabTest Data
RemarksSample
Description &Classification
Depth(ft)
BORING LOG
DATE START: 2/5/2020DATE FINISH: 2/5/2020
BORING NO.: B- 1
BORING NO.: B- 1
PROJECT NO. 19-1758.1SHEET: 1 of 1
CLIENT: Gartley & Dorsky Engineering & SurveyingPROJECT: Proposed Kingfish Maine, Inc. Aquaculture FacilityLOCATION: 9 Dun Garvin Road, Jonesport, ME
BO
RIN
G /
WE
LL 1
9-17
58.1
.GP
J S
WC
E T
EM
PLA
TE
.GD
T 3
/22/
20
0.4
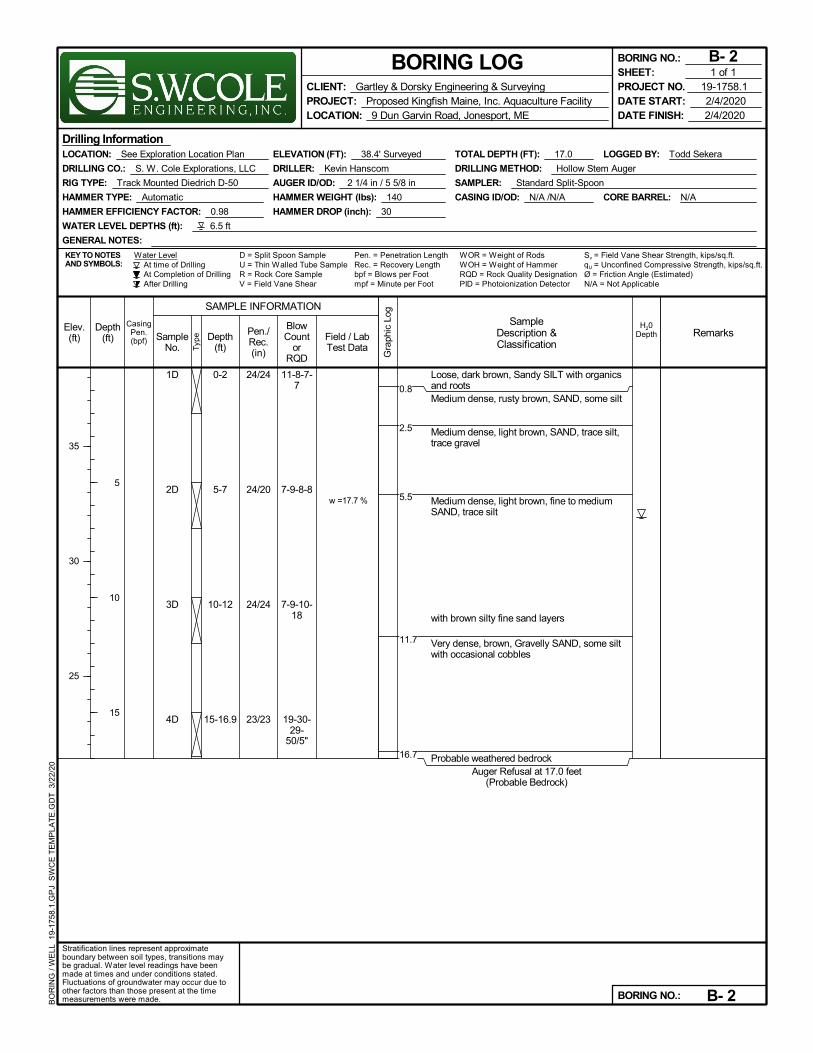
1D
2D
3D
4D
24/24
24/20
24/24
23/23
11-8-7-7
7-9-8-8
7-9-10-18
19-30-29-
50/5"
w =17.7 %
Loose, dark brown, Sandy SILT with organicsand rootsMedium dense, rusty brown, SAND, some silt
Medium dense, light brown, SAND, trace silt,trace gravel
Medium dense, light brown, fine to mediumSAND, trace silt
with brown silty fine sand layers
Very dense, brown, Gravelly SAND, some siltwith occasional cobbles
Probable weathered bedrockAuger Refusal at 17.0 feet
(Probable Bedrock)
0-2
5-7
10-12
15-16.9
Pen. = Penetration LengthRec. = Recovery Length
LOGGED BY: Todd Sekera
CORE BARREL: N/A
At time of DrillingAt Completion of DrillingAfter Drilling
D = Split Spoon Sample
CASING ID/OD: N/A /N/A
Water Level
AUGER ID/OD: 2 1/4 in / 5 5/8 in
ELEVATION (FT): 38.4' Surveyed
bpf = Blows per Foot
TOTAL DEPTH (FT): 17.0
U = Thin Walled Tube Sample
LOCATION: See Exploration Location Plan
DRILLER: Kevin Hanscom
HAMMER EFFICIENCY FACTOR: 0.98
KEY TO NOTESAND SYMBOLS:
WATER LEVEL DEPTHS (ft): 6.5 ft
Sv = Field Vane Shear Strength, kips/sq.ft.
Drilling Information
RIG TYPE: Track Mounted Diedrich D-50
HAMMER TYPE: Automatic
GENERAL NOTES:
HAMMER WEIGHT (lbs): 140
R = Rock Core SampleV = Field Vane Shear mpf = Minute per Foot
WOR = Weight of RodsWOH = Weight of HammerRQD = Rock Quality Designation
HAMMER DROP (inch): 30
DRILLING CO.: S. W. Cole Explorations, LLC
PID = Photoionization Detector N/A = Not Applicable
SAMPLER: Standard Split-Spoon
qU = Unconfined Compressive Strength, kips/sq.ft.Ø = Friction Angle (Estimated)
DRILLING METHOD: Hollow Stem Auger
Gra
phic
Log
Elev.(ft)
35
30
25
SampleNo. T
ype
Depth(ft)
5
10
15
CasingPen.(bpf)
Stratification lines represent approximateboundary between soil types, transitions maybe gradual. Water level readings have beenmade at times and under conditions stated.Fluctuations of groundwater may occur due toother factors than those present at the timemeasurements were made.
Pen./Rec.(in)
SAMPLE INFORMATION
H20Depth
BlowCount
orRQD
Field / LabTest Data
RemarksSample
Description &Classification
Depth(ft)
BORING LOG
DATE START: 2/4/2020DATE FINISH: 2/4/2020
BORING NO.: B- 2
BORING NO.: B- 2
PROJECT NO. 19-1758.1SHEET: 1 of 1
CLIENT: Gartley & Dorsky Engineering & SurveyingPROJECT: Proposed Kingfish Maine, Inc. Aquaculture FacilityLOCATION: 9 Dun Garvin Road, Jonesport, ME
BO
RIN
G /
WE
LL 1
9-17
58.1
.GP
J S
WC
E T
EM
PLA
TE
.GD
T 3
/22/
20
0.8
2.5
5.5
11.7
16.7

1D
2D
3D
24/20
24/18
22/14
2-1-1-8
6-6-8-7
15-20-32-
25/4"
Loose, dark brown, Sandy SILT with organicsLoose, rusty brown, fine to medium SAND,some silt
Medium dense, brown, Gravelly SAND, somesilt with occasional cobbles
Medium dense, brown, fine to mediumSAND, some silt, with clayey silt layers
Dense, brown, Gravelly Silty SAND withoccasional cobbles (Glacial Till)
Auger Refusal at 11.7 feet(Probable Bedrock)
0-2
5-7
10-11.8
Pen. = Penetration LengthRec. = Recovery Length
LOGGED BY: Todd Sekera
CORE BARREL: N/A
At time of DrillingAt Completion of DrillingAfter Drilling
D = Split Spoon Sample
CASING ID/OD: N/A /N/A
Water Level
AUGER ID/OD: 2 1/4 in / 5 5/8 in
ELEVATION (FT): 52.9' Surveyed
bpf = Blows per Foot
TOTAL DEPTH (FT): 11.7
U = Thin Walled Tube Sample
LOCATION: See Exploration Location Plan
DRILLER: Kevin Hanscom
HAMMER EFFICIENCY FACTOR: 0.98
KEY TO NOTESAND SYMBOLS:
WATER LEVEL DEPTHS (ft): 4.5 ft
Sv = Field Vane Shear Strength, kips/sq.ft.
Drilling Information
RIG TYPE: Track Mounted Diedrich D-50
HAMMER TYPE: Automatic
GENERAL NOTES:
HAMMER WEIGHT (lbs): 140
R = Rock Core SampleV = Field Vane Shear mpf = Minute per Foot
WOR = Weight of RodsWOH = Weight of HammerRQD = Rock Quality Designation
HAMMER DROP (inch): 30
DRILLING CO.: S. W. Cole Explorations, LLC
PID = Photoionization Detector N/A = Not Applicable
SAMPLER: Standard Split-Spoon
qU = Unconfined Compressive Strength, kips/sq.ft.Ø = Friction Angle (Estimated)
DRILLING METHOD: Hollow Stem Auger
Gra
phic
Log
Elev.(ft)
50
45
SampleNo. T
ype
Depth(ft)
5
10
CasingPen.(bpf)
Stratification lines represent approximateboundary between soil types, transitions maybe gradual. Water level readings have beenmade at times and under conditions stated.Fluctuations of groundwater may occur due toother factors than those present at the timemeasurements were made.
Pen./Rec.(in)
SAMPLE INFORMATION
H20Depth
BlowCount
orRQD
Field / LabTest Data
RemarksSample
Description &Classification
Depth(ft)
BORING LOG
DATE START: 2/5/2020DATE FINISH: 2/5/2020
BORING NO.: B- 3
BORING NO.: B- 3
PROJECT NO. 19-1758.1SHEET: 1 of 1
CLIENT: Gartley & Dorsky Engineering & SurveyingPROJECT: Proposed Kingfish Maine, Inc. Aquaculture FacilityLOCATION: 9 Dun Garvin Road, Jonesport, ME
BO
RIN
G /
WE
LL 1
9-17
58.1
.GP
J S
WC
E T
EM
PLA
TE
.GD
T 3
/22/
20
0.6
2.0
4.5
9.3
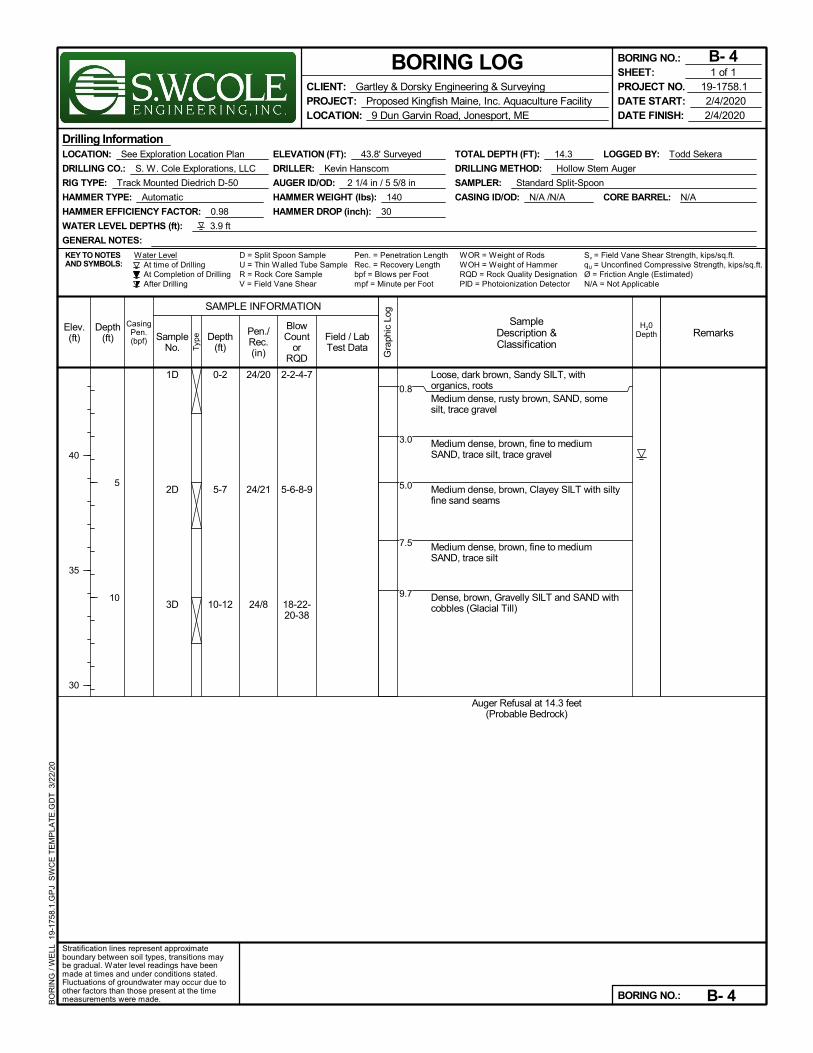
1D
2D
3D
24/20
24/21
24/8
2-2-4-7
5-6-8-9
18-22-20-38
Loose, dark brown, Sandy SILT, withorganics, rootsMedium dense, rusty brown, SAND, somesilt, trace gravel
Medium dense, brown, fine to mediumSAND, trace silt, trace gravel
Medium dense, brown, Clayey SILT with siltyfine sand seams
Medium dense, brown, fine to mediumSAND, trace silt
Dense, brown, Gravelly SILT and SAND withcobbles (Glacial Till)
Auger Refusal at 14.3 feet(Probable Bedrock)
0-2
5-7
10-12
Pen. = Penetration LengthRec. = Recovery Length
LOGGED BY: Todd Sekera
CORE BARREL: N/A
At time of DrillingAt Completion of DrillingAfter Drilling
D = Split Spoon Sample
CASING ID/OD: N/A /N/A
Water Level
AUGER ID/OD: 2 1/4 in / 5 5/8 in
ELEVATION (FT): 43.8' Surveyed
bpf = Blows per Foot
TOTAL DEPTH (FT): 14.3
U = Thin Walled Tube Sample
LOCATION: See Exploration Location Plan
DRILLER: Kevin Hanscom
HAMMER EFFICIENCY FACTOR: 0.98
KEY TO NOTESAND SYMBOLS:
WATER LEVEL DEPTHS (ft): 3.9 ft
Sv = Field Vane Shear Strength, kips/sq.ft.
Drilling Information
RIG TYPE: Track Mounted Diedrich D-50
HAMMER TYPE: Automatic
GENERAL NOTES:
HAMMER WEIGHT (lbs): 140
R = Rock Core SampleV = Field Vane Shear mpf = Minute per Foot
WOR = Weight of RodsWOH = Weight of HammerRQD = Rock Quality Designation
HAMMER DROP (inch): 30
DRILLING CO.: S. W. Cole Explorations, LLC
PID = Photoionization Detector N/A = Not Applicable
SAMPLER: Standard Split-Spoon
qU = Unconfined Compressive Strength, kips/sq.ft.Ø = Friction Angle (Estimated)
DRILLING METHOD: Hollow Stem Auger
Gra
phic
Log
Elev.(ft)
40
35
30
SampleNo. T
ype
Depth(ft)
5
10
CasingPen.(bpf)
Stratification lines represent approximateboundary between soil types, transitions maybe gradual. Water level readings have beenmade at times and under conditions stated.Fluctuations of groundwater may occur due toother factors than those present at the timemeasurements were made.
Pen./Rec.(in)
SAMPLE INFORMATION
H20Depth
BlowCount
orRQD
Field / LabTest Data
RemarksSample
Description &Classification
Depth(ft)
BORING LOG
DATE START: 2/4/2020DATE FINISH: 2/4/2020
BORING NO.: B- 4
BORING NO.: B- 4
PROJECT NO. 19-1758.1SHEET: 1 of 1
CLIENT: Gartley & Dorsky Engineering & SurveyingPROJECT: Proposed Kingfish Maine, Inc. Aquaculture FacilityLOCATION: 9 Dun Garvin Road, Jonesport, ME
BO
RIN
G /
WE
LL 1
9-17
58.1
.GP
J S
WC
E T
EM
PLA
TE
.GD
T 3
/22/
20
0.8
3.0
5.0
7.5
9.7
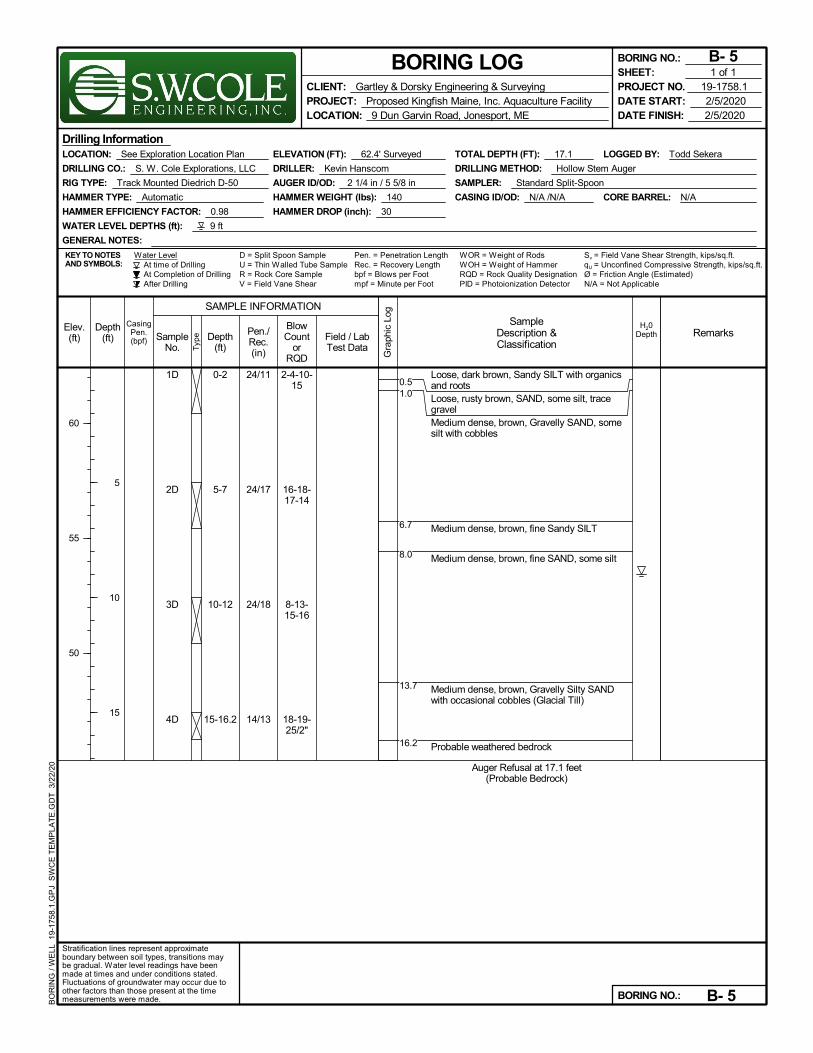
1D
2D
3D
4D
24/11
24/17
24/18
14/13
2-4-10-15
16-18-17-14
8-13-15-16
18-19-25/2"
Loose, dark brown, Sandy SILT with organicsand rootsLoose, rusty brown, SAND, some silt, tracegravelMedium dense, brown, Gravelly SAND, somesilt with cobbles
Medium dense, brown, fine Sandy SILT
Medium dense, brown, fine SAND, some silt
Medium dense, brown, Gravelly Silty SANDwith occasional cobbles (Glacial Till)
Probable weathered bedrock
Auger Refusal at 17.1 feet(Probable Bedrock)
0-2
5-7
10-12
15-16.2
Pen. = Penetration LengthRec. = Recovery Length
LOGGED BY: Todd Sekera
CORE BARREL: N/A
At time of DrillingAt Completion of DrillingAfter Drilling
D = Split Spoon Sample
CASING ID/OD: N/A /N/A
Water Level
AUGER ID/OD: 2 1/4 in / 5 5/8 in
ELEVATION (FT): 62.4' Surveyed
bpf = Blows per Foot
TOTAL DEPTH (FT): 17.1
U = Thin Walled Tube Sample
LOCATION: See Exploration Location Plan
DRILLER: Kevin Hanscom
HAMMER EFFICIENCY FACTOR: 0.98
KEY TO NOTESAND SYMBOLS:
WATER LEVEL DEPTHS (ft): 9 ft
Sv = Field Vane Shear Strength, kips/sq.ft.
Drilling Information
RIG TYPE: Track Mounted Diedrich D-50
HAMMER TYPE: Automatic
GENERAL NOTES:
HAMMER WEIGHT (lbs): 140
R = Rock Core SampleV = Field Vane Shear mpf = Minute per Foot
WOR = Weight of RodsWOH = Weight of HammerRQD = Rock Quality Designation
HAMMER DROP (inch): 30
DRILLING CO.: S. W. Cole Explorations, LLC
PID = Photoionization Detector N/A = Not Applicable
SAMPLER: Standard Split-Spoon
qU = Unconfined Compressive Strength, kips/sq.ft.Ø = Friction Angle (Estimated)
DRILLING METHOD: Hollow Stem Auger
Gra
phic
Log
Elev.(ft)
60
55
50
SampleNo. T
ype
Depth(ft)
5
10
15
CasingPen.(bpf)
Stratification lines represent approximateboundary between soil types, transitions maybe gradual. Water level readings have beenmade at times and under conditions stated.Fluctuations of groundwater may occur due toother factors than those present at the timemeasurements were made.
Pen./Rec.(in)
SAMPLE INFORMATION
H20Depth
BlowCount
orRQD
Field / LabTest Data
RemarksSample
Description &Classification
Depth(ft)
BORING LOG
DATE START: 2/5/2020DATE FINISH: 2/5/2020
BORING NO.: B- 5
BORING NO.: B- 5
PROJECT NO. 19-1758.1SHEET: 1 of 1
CLIENT: Gartley & Dorsky Engineering & SurveyingPROJECT: Proposed Kingfish Maine, Inc. Aquaculture FacilityLOCATION: 9 Dun Garvin Road, Jonesport, ME
BO
RIN
G /
WE
LL 1
9-17
58.1
.GP
J S
WC
E T
EM
PLA
TE
.GD
T 3
/22/
20
0.51.0
6.7
8.0
13.7
16.2
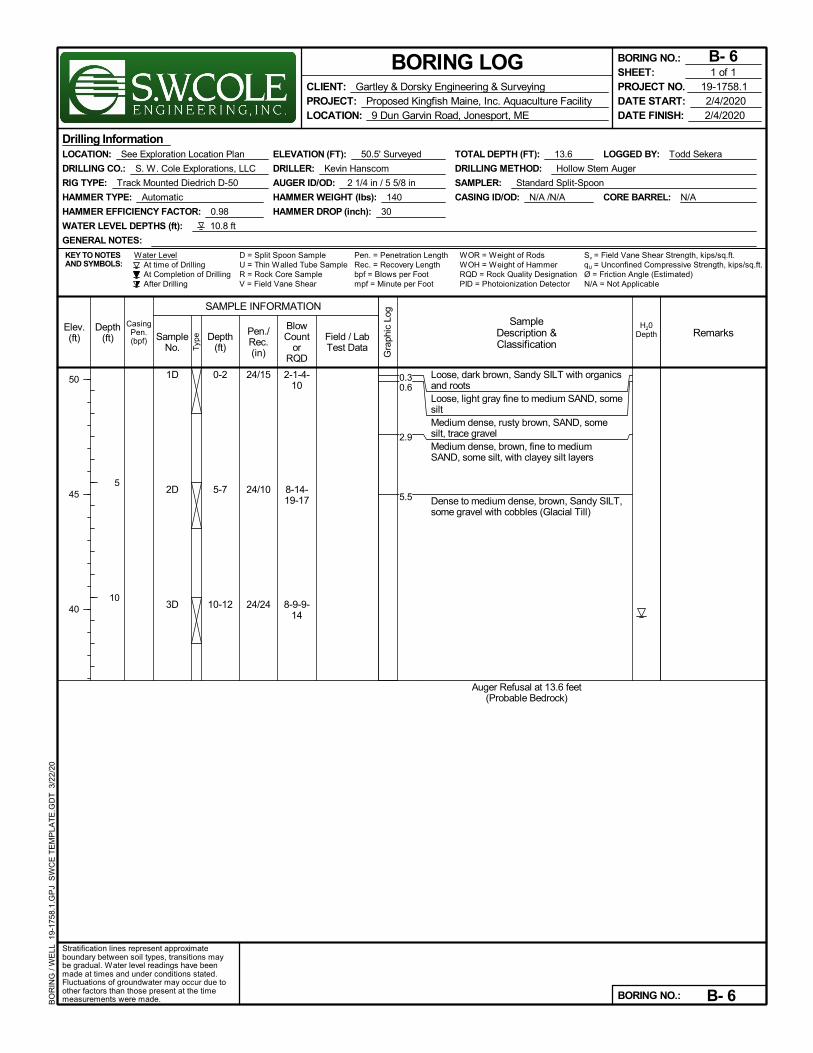
1D
2D
3D
24/15
24/10
24/24
2-1-4-10
8-14-19-17
8-9-9-14
Loose, dark brown, Sandy SILT with organicsand rootsLoose, light gray fine to medium SAND, somesiltMedium dense, rusty brown, SAND, somesilt, trace gravelMedium dense, brown, fine to mediumSAND, some silt, with clayey silt layers
Dense to medium dense, brown, Sandy SILT,some gravel with cobbles (Glacial Till)
Auger Refusal at 13.6 feet(Probable Bedrock)
0-2
5-7
10-12
Pen. = Penetration LengthRec. = Recovery Length
LOGGED BY: Todd Sekera
CORE BARREL: N/A
At time of DrillingAt Completion of DrillingAfter Drilling
D = Split Spoon Sample
CASING ID/OD: N/A /N/A
Water Level
AUGER ID/OD: 2 1/4 in / 5 5/8 in
ELEVATION (FT): 50.5' Surveyed
bpf = Blows per Foot
TOTAL DEPTH (FT): 13.6
U = Thin Walled Tube Sample
LOCATION: See Exploration Location Plan
DRILLER: Kevin Hanscom
HAMMER EFFICIENCY FACTOR: 0.98
KEY TO NOTESAND SYMBOLS:
WATER LEVEL DEPTHS (ft): 10.8 ft
Sv = Field Vane Shear Strength, kips/sq.ft.
Drilling Information
RIG TYPE: Track Mounted Diedrich D-50
HAMMER TYPE: Automatic
GENERAL NOTES:
HAMMER WEIGHT (lbs): 140
R = Rock Core SampleV = Field Vane Shear mpf = Minute per Foot
WOR = Weight of RodsWOH = Weight of HammerRQD = Rock Quality Designation
HAMMER DROP (inch): 30
DRILLING CO.: S. W. Cole Explorations, LLC
PID = Photoionization Detector N/A = Not Applicable
SAMPLER: Standard Split-Spoon
qU = Unconfined Compressive Strength, kips/sq.ft.Ø = Friction Angle (Estimated)
DRILLING METHOD: Hollow Stem Auger
Gra
phic
Log
Elev.(ft)
50
45
40
SampleNo. T
ype
Depth(ft)
5
10
CasingPen.(bpf)
Stratification lines represent approximateboundary between soil types, transitions maybe gradual. Water level readings have beenmade at times and under conditions stated.Fluctuations of groundwater may occur due toother factors than those present at the timemeasurements were made.
Pen./Rec.(in)
SAMPLE INFORMATION
H20Depth
BlowCount
orRQD
Field / LabTest Data
RemarksSample
Description &Classification
Depth(ft)
BORING LOG
DATE START: 2/4/2020DATE FINISH: 2/4/2020
BORING NO.: B- 6
BORING NO.: B- 6
PROJECT NO. 19-1758.1SHEET: 1 of 1
CLIENT: Gartley & Dorsky Engineering & SurveyingPROJECT: Proposed Kingfish Maine, Inc. Aquaculture FacilityLOCATION: 9 Dun Garvin Road, Jonesport, ME
BO
RIN
G /
WE
LL 1
9-17
58.1
.GP
J S
WC
E T
EM
PLA
TE
.GD
T 3
/22/
20
0.30.6
2.9
5.5
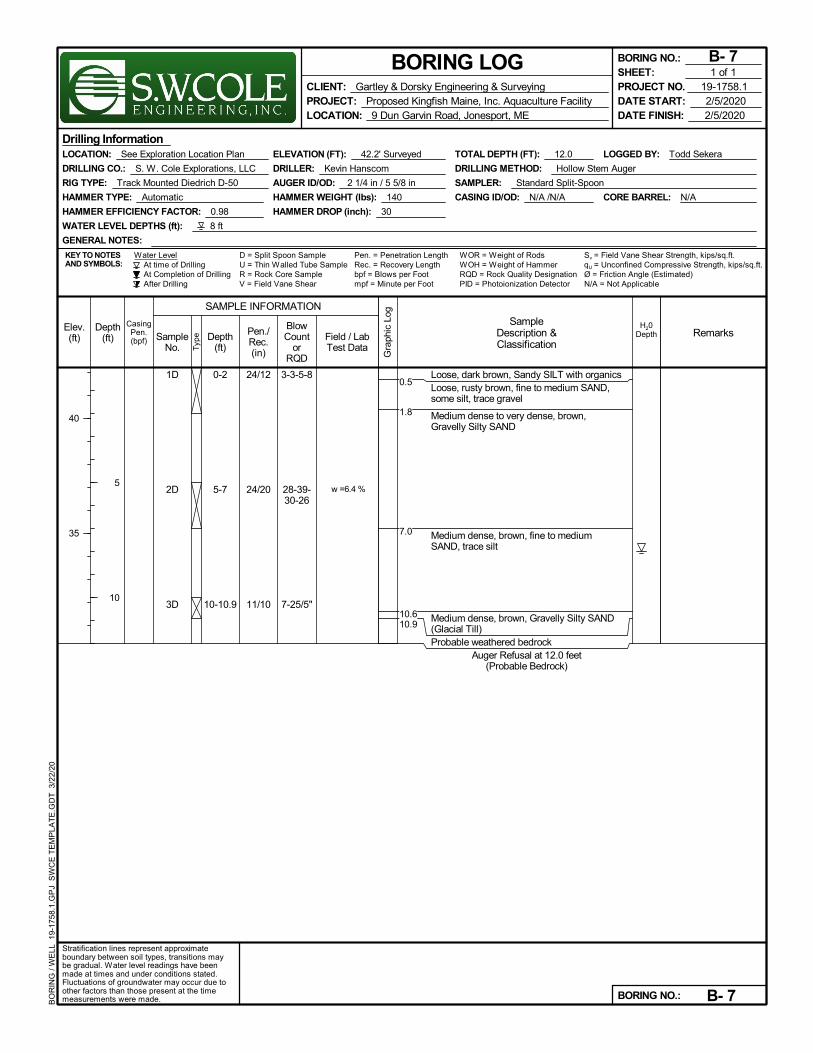
1D
2D
3D
24/12
24/20
11/10
3-3-5-8
28-39-30-26
7-25/5"
w =6.4 %
Loose, dark brown, Sandy SILT with organicsLoose, rusty brown, fine to medium SAND,some silt, trace gravel
Medium dense to very dense, brown,Gravelly Silty SAND
Medium dense, brown, fine to mediumSAND, trace silt
Medium dense, brown, Gravelly Silty SAND(Glacial Till)Probable weathered bedrock
Auger Refusal at 12.0 feet(Probable Bedrock)
0-2
5-7
10-10.9
Pen. = Penetration LengthRec. = Recovery Length
LOGGED BY: Todd Sekera
CORE BARREL: N/A
At time of DrillingAt Completion of DrillingAfter Drilling
D = Split Spoon Sample
CASING ID/OD: N/A /N/A
Water Level
AUGER ID/OD: 2 1/4 in / 5 5/8 in
ELEVATION (FT): 42.2' Surveyed
bpf = Blows per Foot
TOTAL DEPTH (FT): 12.0
U = Thin Walled Tube Sample
LOCATION: See Exploration Location Plan
DRILLER: Kevin Hanscom
HAMMER EFFICIENCY FACTOR: 0.98
KEY TO NOTESAND SYMBOLS:
WATER LEVEL DEPTHS (ft): 8 ft
Sv = Field Vane Shear Strength, kips/sq.ft.
Drilling Information
RIG TYPE: Track Mounted Diedrich D-50
HAMMER TYPE: Automatic
GENERAL NOTES:
HAMMER WEIGHT (lbs): 140
R = Rock Core SampleV = Field Vane Shear mpf = Minute per Foot
WOR = Weight of RodsWOH = Weight of HammerRQD = Rock Quality Designation
HAMMER DROP (inch): 30
DRILLING CO.: S. W. Cole Explorations, LLC
PID = Photoionization Detector N/A = Not Applicable
SAMPLER: Standard Split-Spoon
qU = Unconfined Compressive Strength, kips/sq.ft.Ø = Friction Angle (Estimated)
DRILLING METHOD: Hollow Stem Auger
Gra
phic
Log
Elev.(ft)
40
35
SampleNo. T
ype
Depth(ft)
5
10
CasingPen.(bpf)
Stratification lines represent approximateboundary between soil types, transitions maybe gradual. Water level readings have beenmade at times and under conditions stated.Fluctuations of groundwater may occur due toother factors than those present at the timemeasurements were made.
Pen./Rec.(in)
SAMPLE INFORMATION
H20Depth
BlowCount
orRQD
Field / LabTest Data
RemarksSample
Description &Classification
Depth(ft)
BORING LOG
DATE START: 2/5/2020DATE FINISH: 2/5/2020
BORING NO.: B- 7
BORING NO.: B- 7
PROJECT NO. 19-1758.1SHEET: 1 of 1
CLIENT: Gartley & Dorsky Engineering & SurveyingPROJECT: Proposed Kingfish Maine, Inc. Aquaculture FacilityLOCATION: 9 Dun Garvin Road, Jonesport, ME
BO
RIN
G /
WE
LL 1
9-17
58.1
.GP
J S
WC
E T
EM
PLA
TE
.GD
T 3
/22/
20
0.5
1.8
7.0
10.610.9
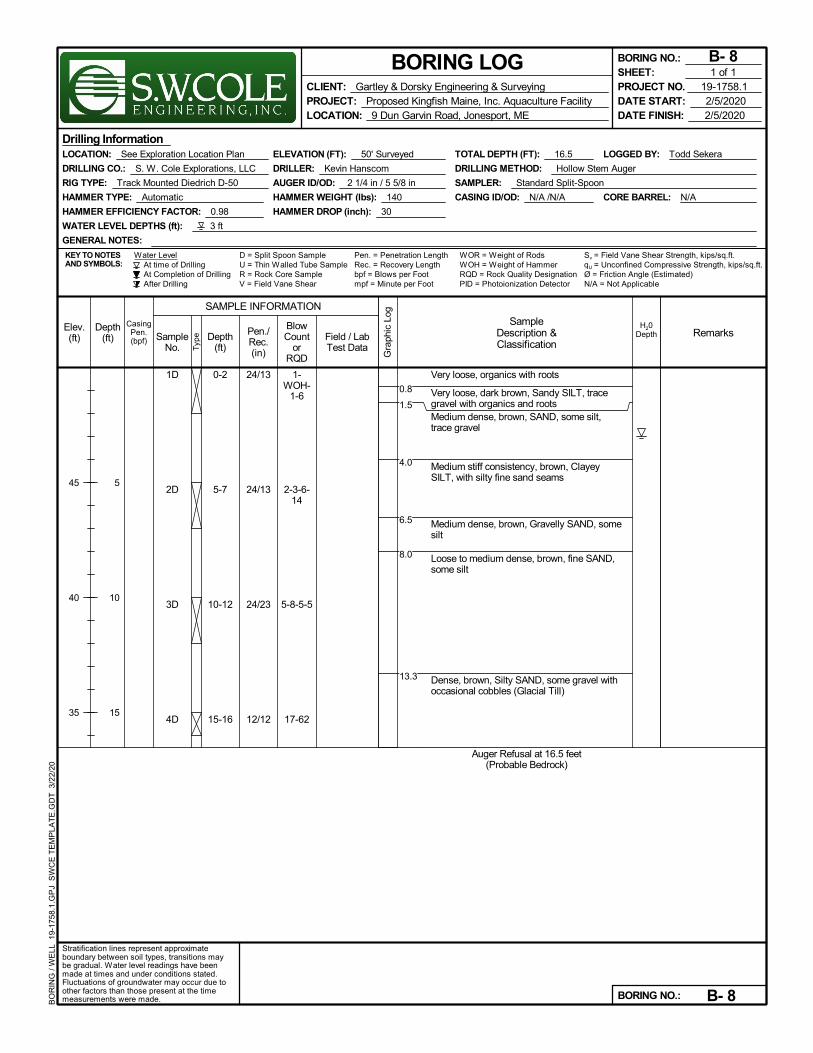
1D
2D
3D
4D
24/13
24/13
24/23
12/12
1-WOH-
1-6
2-3-6-14
5-8-5-5
17-62
Very loose, organics with roots
Very loose, dark brown, Sandy SILT, tracegravel with organics and rootsMedium dense, brown, SAND, some silt,trace gravel
Medium stiff consistency, brown, ClayeySILT, with silty fine sand seams
Medium dense, brown, Gravelly SAND, somesilt
Loose to medium dense, brown, fine SAND,some silt
Dense, brown, Silty SAND, some gravel withoccasional cobbles (Glacial Till)
Auger Refusal at 16.5 feet(Probable Bedrock)
0-2
5-7
10-12
15-16
Pen. = Penetration LengthRec. = Recovery Length
LOGGED BY: Todd Sekera
CORE BARREL: N/A
At time of DrillingAt Completion of DrillingAfter Drilling
D = Split Spoon Sample
CASING ID/OD: N/A /N/A
Water Level
AUGER ID/OD: 2 1/4 in / 5 5/8 in
ELEVATION (FT): 50' Surveyed
bpf = Blows per Foot
TOTAL DEPTH (FT): 16.5
U = Thin Walled Tube Sample
LOCATION: See Exploration Location Plan
DRILLER: Kevin Hanscom
HAMMER EFFICIENCY FACTOR: 0.98
KEY TO NOTESAND SYMBOLS:
WATER LEVEL DEPTHS (ft): 3 ft
Sv = Field Vane Shear Strength, kips/sq.ft.
Drilling Information
RIG TYPE: Track Mounted Diedrich D-50
HAMMER TYPE: Automatic
GENERAL NOTES:
HAMMER WEIGHT (lbs): 140
R = Rock Core SampleV = Field Vane Shear mpf = Minute per Foot
WOR = Weight of RodsWOH = Weight of HammerRQD = Rock Quality Designation
HAMMER DROP (inch): 30
DRILLING CO.: S. W. Cole Explorations, LLC
PID = Photoionization Detector N/A = Not Applicable
SAMPLER: Standard Split-Spoon
qU = Unconfined Compressive Strength, kips/sq.ft.Ø = Friction Angle (Estimated)
DRILLING METHOD: Hollow Stem Auger
Gra
phic
Log
Elev.(ft)
45
40
35
SampleNo. T
ype
Depth(ft)
5
10
15
CasingPen.(bpf)
Stratification lines represent approximateboundary between soil types, transitions maybe gradual. Water level readings have beenmade at times and under conditions stated.Fluctuations of groundwater may occur due toother factors than those present at the timemeasurements were made.
Pen./Rec.(in)
SAMPLE INFORMATION
H20Depth
BlowCount
orRQD
Field / LabTest Data
RemarksSample
Description &Classification
Depth(ft)
BORING LOG
DATE START: 2/5/2020DATE FINISH: 2/5/2020
BORING NO.: B- 8
BORING NO.: B- 8
PROJECT NO. 19-1758.1SHEET: 1 of 1
CLIENT: Gartley & Dorsky Engineering & SurveyingPROJECT: Proposed Kingfish Maine, Inc. Aquaculture FacilityLOCATION: 9 Dun Garvin Road, Jonesport, ME
BO
RIN
G /
WE
LL 1
9-17
58.1
.GP
J S
WC
E T
EM
PLA
TE
.GD
T 3
/22/
20
0.8
1.5
4.0
6.5
8.0
13.3
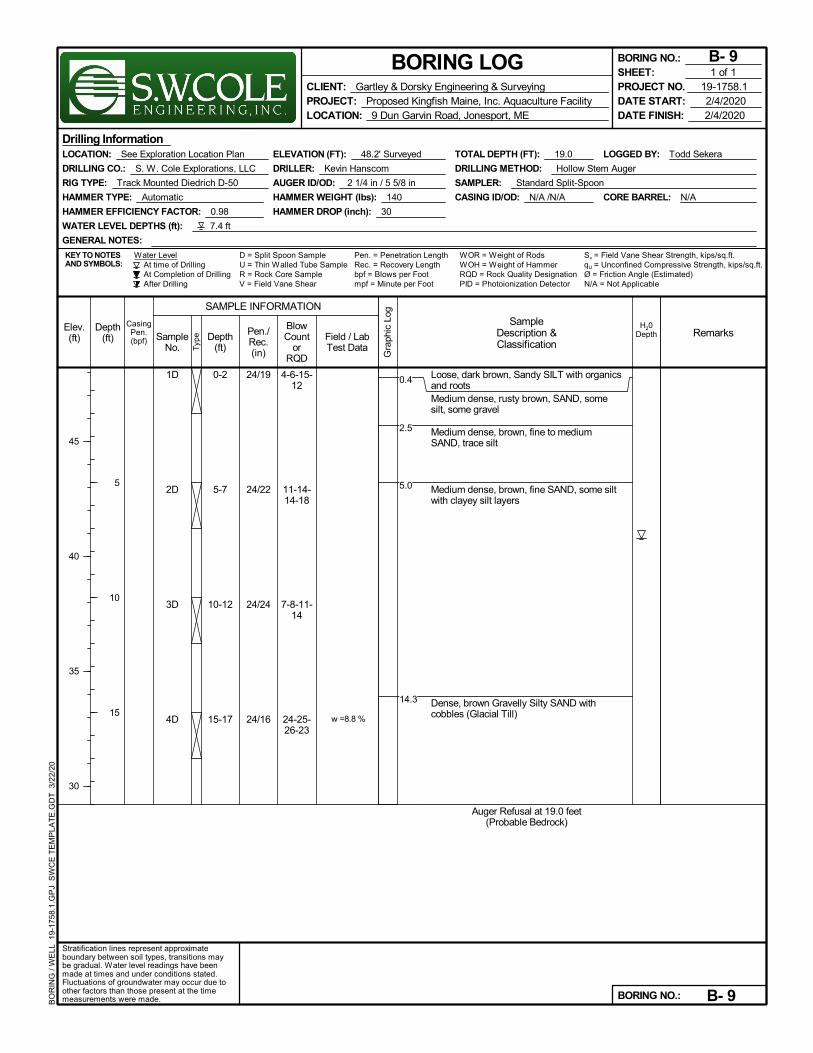
1D
2D
3D
4D
24/19
24/22
24/24
24/16
4-6-15-12
11-14-14-18
7-8-11-14
24-25-26-23
w =8.8 %
Loose, dark brown, Sandy SILT with organicsand rootsMedium dense, rusty brown, SAND, somesilt, some gravel
Medium dense, brown, fine to mediumSAND, trace silt
Medium dense, brown, fine SAND, some siltwith clayey silt layers
Dense, brown Gravelly Silty SAND withcobbles (Glacial Till)
Auger Refusal at 19.0 feet(Probable Bedrock)
0-2
5-7
10-12
15-17
Pen. = Penetration LengthRec. = Recovery Length
LOGGED BY: Todd Sekera
CORE BARREL: N/A
At time of DrillingAt Completion of DrillingAfter Drilling
D = Split Spoon Sample
CASING ID/OD: N/A /N/A
Water Level
AUGER ID/OD: 2 1/4 in / 5 5/8 in
ELEVATION (FT): 48.2' Surveyed
bpf = Blows per Foot
TOTAL DEPTH (FT): 19.0
U = Thin Walled Tube Sample
LOCATION: See Exploration Location Plan
DRILLER: Kevin Hanscom
HAMMER EFFICIENCY FACTOR: 0.98
KEY TO NOTESAND SYMBOLS:
WATER LEVEL DEPTHS (ft): 7.4 ft
Sv = Field Vane Shear Strength, kips/sq.ft.
Drilling Information
RIG TYPE: Track Mounted Diedrich D-50
HAMMER TYPE: Automatic
GENERAL NOTES:
HAMMER WEIGHT (lbs): 140
R = Rock Core SampleV = Field Vane Shear mpf = Minute per Foot
WOR = Weight of RodsWOH = Weight of HammerRQD = Rock Quality Designation
HAMMER DROP (inch): 30
DRILLING CO.: S. W. Cole Explorations, LLC
PID = Photoionization Detector N/A = Not Applicable
SAMPLER: Standard Split-Spoon
qU = Unconfined Compressive Strength, kips/sq.ft.Ø = Friction Angle (Estimated)
DRILLING METHOD: Hollow Stem Auger
Gra
phic
Log
Elev.(ft)
45
40
35
30
SampleNo. T
ype
Depth(ft)
5
10
15
CasingPen.(bpf)
Stratification lines represent approximateboundary between soil types, transitions maybe gradual. Water level readings have beenmade at times and under conditions stated.Fluctuations of groundwater may occur due toother factors than those present at the timemeasurements were made.
Pen./Rec.(in)
SAMPLE INFORMATION
H20Depth
BlowCount
orRQD
Field / LabTest Data
RemarksSample
Description &Classification
Depth(ft)
BORING LOG
DATE START: 2/4/2020DATE FINISH: 2/4/2020
BORING NO.: B- 9
BORING NO.: B- 9
PROJECT NO. 19-1758.1SHEET: 1 of 1
CLIENT: Gartley & Dorsky Engineering & SurveyingPROJECT: Proposed Kingfish Maine, Inc. Aquaculture FacilityLOCATION: 9 Dun Garvin Road, Jonesport, ME
BO
RIN
G /
WE
LL 1
9-17
58.1
.GP
J S
WC
E T
EM
PLA
TE
.GD
T 3
/22/
20
0.4
2.5
5.0
14.3
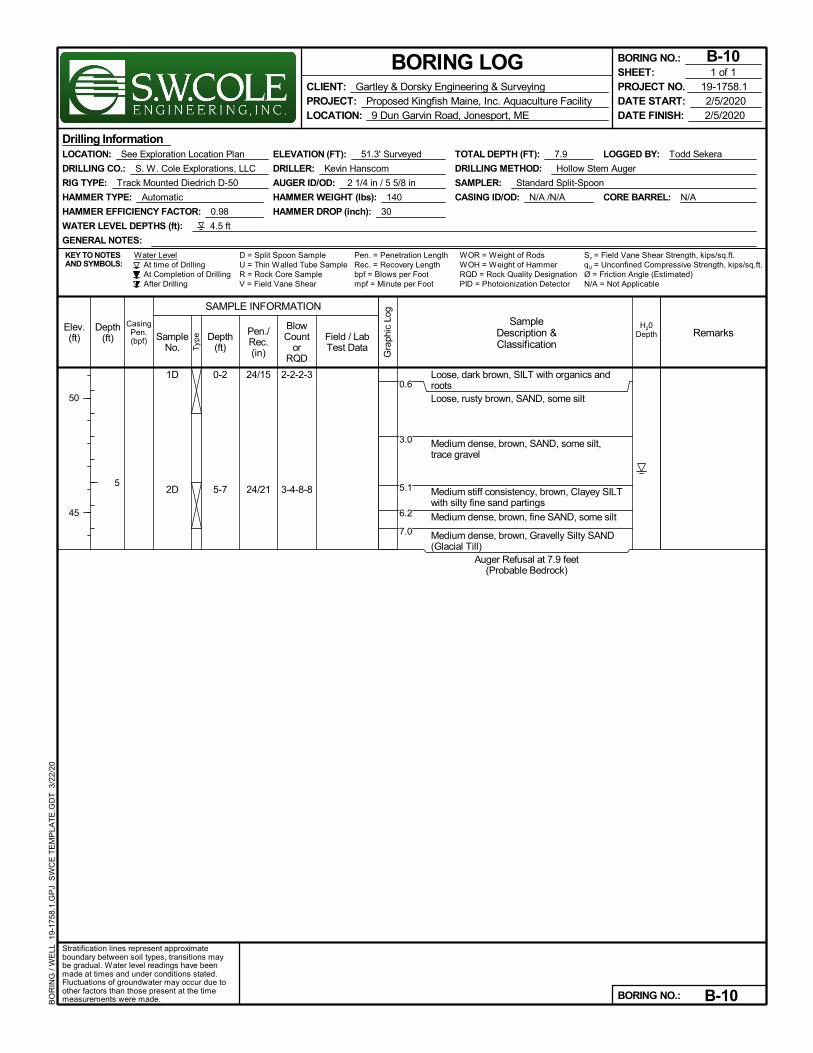
1D
2D
24/15
24/21
2-2-2-3
3-4-8-8
Loose, dark brown, SILT with organics androotsLoose, rusty brown, SAND, some silt
Medium dense, brown, SAND, some silt,trace gravel
Medium stiff consistency, brown, Clayey SILTwith silty fine sand partings
Medium dense, brown, fine SAND, some silt
Medium dense, brown, Gravelly Silty SAND(Glacial Till)
Auger Refusal at 7.9 feet(Probable Bedrock)
0-2
5-7
Pen. = Penetration LengthRec. = Recovery Length
LOGGED BY: Todd Sekera
CORE BARREL: N/A
At time of DrillingAt Completion of DrillingAfter Drilling
D = Split Spoon Sample
CASING ID/OD: N/A /N/A
Water Level
AUGER ID/OD: 2 1/4 in / 5 5/8 in
ELEVATION (FT): 51.3' Surveyed
bpf = Blows per Foot
TOTAL DEPTH (FT): 7.9
U = Thin Walled Tube Sample
LOCATION: See Exploration Location Plan
DRILLER: Kevin Hanscom
HAMMER EFFICIENCY FACTOR: 0.98
KEY TO NOTESAND SYMBOLS:
WATER LEVEL DEPTHS (ft): 4.5 ft
Sv = Field Vane Shear Strength, kips/sq.ft.
Drilling Information
RIG TYPE: Track Mounted Diedrich D-50
HAMMER TYPE: Automatic
GENERAL NOTES:
HAMMER WEIGHT (lbs): 140
R = Rock Core SampleV = Field Vane Shear mpf = Minute per Foot
WOR = Weight of RodsWOH = Weight of HammerRQD = Rock Quality Designation
HAMMER DROP (inch): 30
DRILLING CO.: S. W. Cole Explorations, LLC
PID = Photoionization Detector N/A = Not Applicable
SAMPLER: Standard Split-Spoon
qU = Unconfined Compressive Strength, kips/sq.ft.Ø = Friction Angle (Estimated)
DRILLING METHOD: Hollow Stem Auger
Gra
phic
Log
Elev.(ft)
50
45
SampleNo. T
ype
Depth(ft)
5
CasingPen.(bpf)
Stratification lines represent approximateboundary between soil types, transitions maybe gradual. Water level readings have beenmade at times and under conditions stated.Fluctuations of groundwater may occur due toother factors than those present at the timemeasurements were made.
Pen./Rec.(in)
SAMPLE INFORMATION
H20Depth
BlowCount
orRQD
Field / LabTest Data
RemarksSample
Description &Classification
Depth(ft)
BORING LOG
DATE START: 2/5/2020DATE FINISH: 2/5/2020
BORING NO.: B-10
BORING NO.: B-10
PROJECT NO. 19-1758.1SHEET: 1 of 1
CLIENT: Gartley & Dorsky Engineering & SurveyingPROJECT: Proposed Kingfish Maine, Inc. Aquaculture FacilityLOCATION: 9 Dun Garvin Road, Jonesport, ME
BO
RIN
G /
WE
LL 1
9-17
58.1
.GP
J S
WC
E T
EM
PLA
TE
.GD
T 3
/22/
20
0.6
3.0
5.1
6.2
7.0
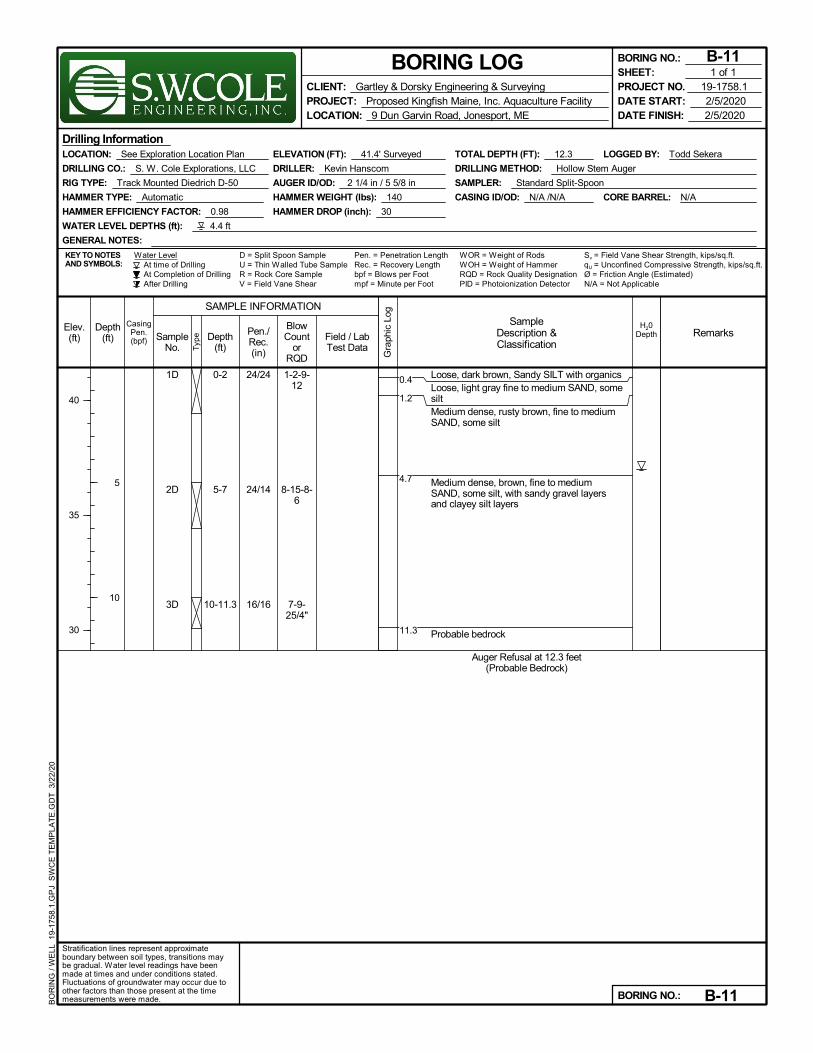
1D
2D
3D
24/24
24/14
16/16
1-2-9-12
8-15-8-6
7-9-25/4"
Loose, dark brown, Sandy SILT with organicsLoose, light gray fine to medium SAND, somesiltMedium dense, rusty brown, fine to mediumSAND, some silt
Medium dense, brown, fine to mediumSAND, some silt, with sandy gravel layersand clayey silt layers
Probable bedrock
Auger Refusal at 12.3 feet(Probable Bedrock)
0-2
5-7
10-11.3
Pen. = Penetration LengthRec. = Recovery Length
LOGGED BY: Todd Sekera
CORE BARREL: N/A
At time of DrillingAt Completion of DrillingAfter Drilling
D = Split Spoon Sample
CASING ID/OD: N/A /N/A
Water Level
AUGER ID/OD: 2 1/4 in / 5 5/8 in
ELEVATION (FT): 41.4' Surveyed
bpf = Blows per Foot
TOTAL DEPTH (FT): 12.3
U = Thin Walled Tube Sample
LOCATION: See Exploration Location Plan
DRILLER: Kevin Hanscom
HAMMER EFFICIENCY FACTOR: 0.98
KEY TO NOTESAND SYMBOLS:
WATER LEVEL DEPTHS (ft): 4.4 ft
Sv = Field Vane Shear Strength, kips/sq.ft.
Drilling Information
RIG TYPE: Track Mounted Diedrich D-50
HAMMER TYPE: Automatic
GENERAL NOTES:
HAMMER WEIGHT (lbs): 140
R = Rock Core SampleV = Field Vane Shear mpf = Minute per Foot
WOR = Weight of RodsWOH = Weight of HammerRQD = Rock Quality Designation
HAMMER DROP (inch): 30
DRILLING CO.: S. W. Cole Explorations, LLC
PID = Photoionization Detector N/A = Not Applicable
SAMPLER: Standard Split-Spoon
qU = Unconfined Compressive Strength, kips/sq.ft.Ø = Friction Angle (Estimated)
DRILLING METHOD: Hollow Stem Auger
Gra
phic
Log
Elev.(ft)
40
35
30
SampleNo. T
ype
Depth(ft)
5
10
CasingPen.(bpf)
Stratification lines represent approximateboundary between soil types, transitions maybe gradual. Water level readings have beenmade at times and under conditions stated.Fluctuations of groundwater may occur due toother factors than those present at the timemeasurements were made.
Pen./Rec.(in)
SAMPLE INFORMATION
H20Depth
BlowCount
orRQD
Field / LabTest Data
RemarksSample
Description &Classification
Depth(ft)
BORING LOG
DATE START: 2/5/2020DATE FINISH: 2/5/2020
BORING NO.: B-11
BORING NO.: B-11
PROJECT NO. 19-1758.1SHEET: 1 of 1
CLIENT: Gartley & Dorsky Engineering & SurveyingPROJECT: Proposed Kingfish Maine, Inc. Aquaculture FacilityLOCATION: 9 Dun Garvin Road, Jonesport, ME
BO
RIN
G /
WE
LL 1
9-17
58.1
.GP
J S
WC
E T
EM
PLA
TE
.GD
T 3
/22/
20
0.4
1.2
4.7
11.3
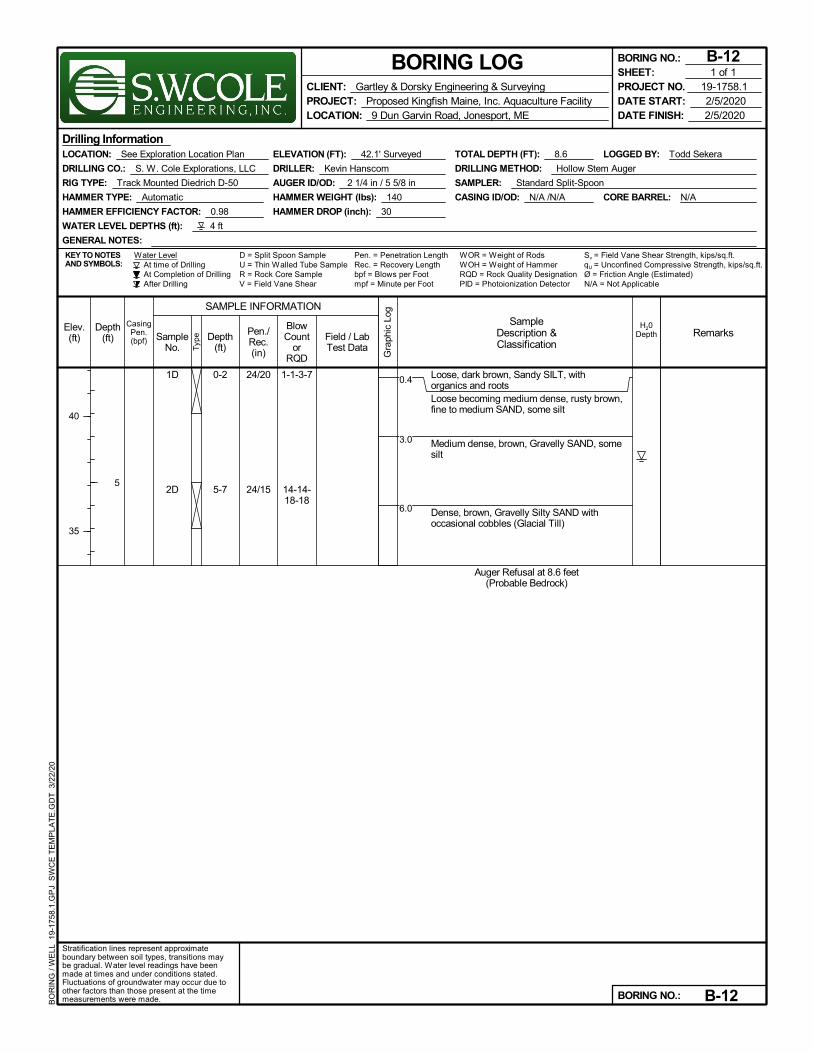
1D
2D
24/20
24/15
1-1-3-7
14-14-18-18
Loose, dark brown, Sandy SILT, withorganics and rootsLoose becoming medium dense, rusty brown,fine to medium SAND, some silt
Medium dense, brown, Gravelly SAND, somesilt
Dense, brown, Gravelly Silty SAND withoccasional cobbles (Glacial Till)
Auger Refusal at 8.6 feet(Probable Bedrock)
0-2
5-7
Pen. = Penetration LengthRec. = Recovery Length
LOGGED BY: Todd Sekera
CORE BARREL: N/A
At time of DrillingAt Completion of DrillingAfter Drilling
D = Split Spoon Sample
CASING ID/OD: N/A /N/A
Water Level
AUGER ID/OD: 2 1/4 in / 5 5/8 in
ELEVATION (FT): 42.1' Surveyed
bpf = Blows per Foot
TOTAL DEPTH (FT): 8.6
U = Thin Walled Tube Sample
LOCATION: See Exploration Location Plan
DRILLER: Kevin Hanscom
HAMMER EFFICIENCY FACTOR: 0.98
KEY TO NOTESAND SYMBOLS:
WATER LEVEL DEPTHS (ft): 4 ft
Sv = Field Vane Shear Strength, kips/sq.ft.
Drilling Information
RIG TYPE: Track Mounted Diedrich D-50
HAMMER TYPE: Automatic
GENERAL NOTES:
HAMMER WEIGHT (lbs): 140
R = Rock Core SampleV = Field Vane Shear mpf = Minute per Foot
WOR = Weight of RodsWOH = Weight of HammerRQD = Rock Quality Designation
HAMMER DROP (inch): 30
DRILLING CO.: S. W. Cole Explorations, LLC
PID = Photoionization Detector N/A = Not Applicable
SAMPLER: Standard Split-Spoon
qU = Unconfined Compressive Strength, kips/sq.ft.Ø = Friction Angle (Estimated)
DRILLING METHOD: Hollow Stem Auger
Gra
phic
Log
Elev.(ft)
40
35
SampleNo. T
ype
Depth(ft)
5
CasingPen.(bpf)
Stratification lines represent approximateboundary between soil types, transitions maybe gradual. Water level readings have beenmade at times and under conditions stated.Fluctuations of groundwater may occur due toother factors than those present at the timemeasurements were made.
Pen./Rec.(in)
SAMPLE INFORMATION
H20Depth
BlowCount
orRQD
Field / LabTest Data
RemarksSample
Description &Classification
Depth(ft)
BORING LOG
DATE START: 2/5/2020DATE FINISH: 2/5/2020
BORING NO.: B-12
BORING NO.: B-12
PROJECT NO. 19-1758.1SHEET: 1 of 1
CLIENT: Gartley & Dorsky Engineering & SurveyingPROJECT: Proposed Kingfish Maine, Inc. Aquaculture FacilityLOCATION: 9 Dun Garvin Road, Jonesport, ME
BO
RIN
G /
WE
LL 1
9-17
58.1
.GP
J S
WC
E T
EM
PLA
TE
.GD
T 3
/22/
20
0.4
3.0
6.0
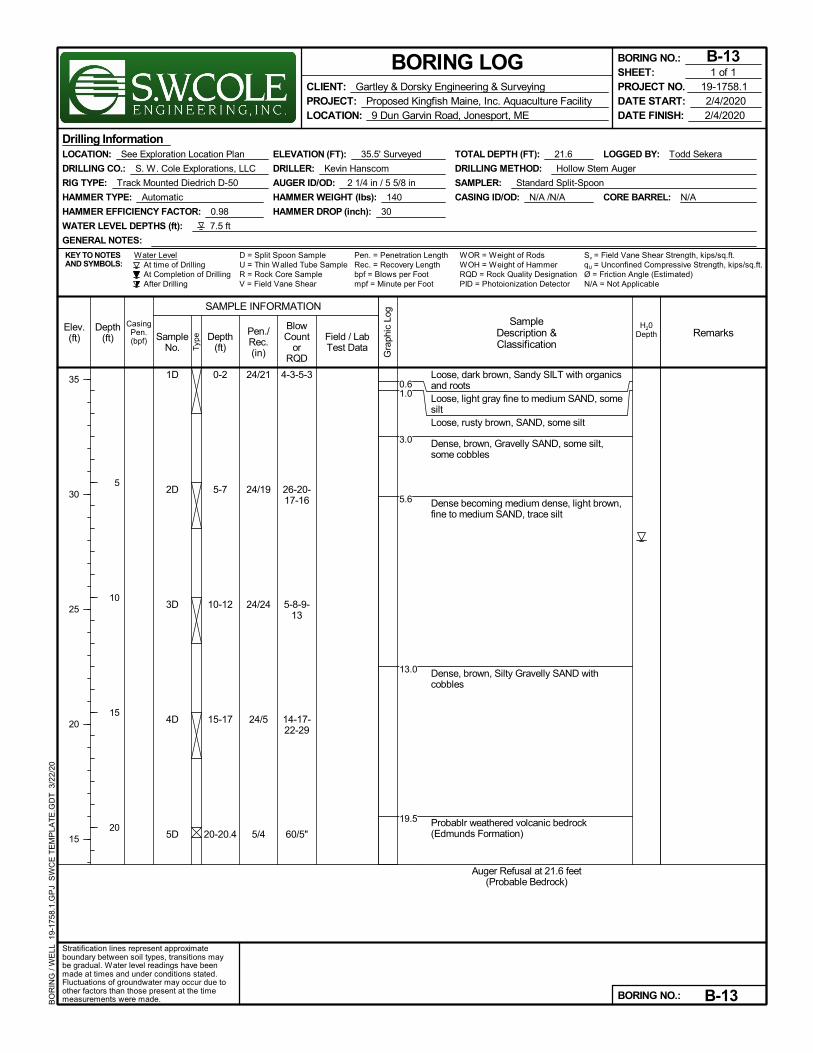
1D
2D
3D
4D
5D
24/21
24/19
24/24
24/5
5/4
4-3-5-3
26-20-17-16
5-8-9-13
14-17-22-29
60/5"
Loose, dark brown, Sandy SILT with organicsand rootsLoose, light gray fine to medium SAND, somesiltLoose, rusty brown, SAND, some silt
Dense, brown, Gravelly SAND, some silt,some cobbles
Dense becoming medium dense, light brown,fine to medium SAND, trace silt
Dense, brown, Silty Gravelly SAND withcobbles
Probablr weathered volcanic bedrock(Edmunds Formation)
Auger Refusal at 21.6 feet(Probable Bedrock)
0-2
5-7
10-12
15-17
20-20.4
Pen. = Penetration LengthRec. = Recovery Length
LOGGED BY: Todd Sekera
CORE BARREL: N/A
At time of DrillingAt Completion of DrillingAfter Drilling
D = Split Spoon Sample
CASING ID/OD: N/A /N/A
Water Level
AUGER ID/OD: 2 1/4 in / 5 5/8 in
ELEVATION (FT): 35.5' Surveyed
bpf = Blows per Foot
TOTAL DEPTH (FT): 21.6
U = Thin Walled Tube Sample
LOCATION: See Exploration Location Plan
DRILLER: Kevin Hanscom
HAMMER EFFICIENCY FACTOR: 0.98
KEY TO NOTESAND SYMBOLS:
WATER LEVEL DEPTHS (ft): 7.5 ft
Sv = Field Vane Shear Strength, kips/sq.ft.
Drilling Information
RIG TYPE: Track Mounted Diedrich D-50
HAMMER TYPE: Automatic
GENERAL NOTES:
HAMMER WEIGHT (lbs): 140
R = Rock Core SampleV = Field Vane Shear mpf = Minute per Foot
WOR = Weight of RodsWOH = Weight of HammerRQD = Rock Quality Designation
HAMMER DROP (inch): 30
DRILLING CO.: S. W. Cole Explorations, LLC
PID = Photoionization Detector N/A = Not Applicable
SAMPLER: Standard Split-Spoon
qU = Unconfined Compressive Strength, kips/sq.ft.Ø = Friction Angle (Estimated)
DRILLING METHOD: Hollow Stem Auger
Gra
phic
Log
Elev.(ft)
35
30
25
20
15
SampleNo. T
ype
Depth(ft)
5
10
15
20
CasingPen.(bpf)
Stratification lines represent approximateboundary between soil types, transitions maybe gradual. Water level readings have beenmade at times and under conditions stated.Fluctuations of groundwater may occur due toother factors than those present at the timemeasurements were made.
Pen./Rec.(in)
SAMPLE INFORMATION
H20Depth
BlowCount
orRQD
Field / LabTest Data
RemarksSample
Description &Classification
Depth(ft)
BORING LOG
DATE START: 2/4/2020DATE FINISH: 2/4/2020
BORING NO.: B-13
BORING NO.: B-13
PROJECT NO. 19-1758.1SHEET: 1 of 1
CLIENT: Gartley & Dorsky Engineering & SurveyingPROJECT: Proposed Kingfish Maine, Inc. Aquaculture FacilityLOCATION: 9 Dun Garvin Road, Jonesport, ME
BO
RIN
G /
WE
LL 1
9-17
58.1
.GP
J S
WC
E T
EM
PLA
TE
.GD
T 3
/22/
20
0.61.0
3.0
5.6
13.0
19.5

1D
2D
3D
24/19
24/16
24/19
2-4-9-10
5-7-7-9
5-6-6-6
Loose, dark brown, Sandy SILT with organicsMedium dense, rusty brown, SAND, some silt
Medium dense, light brown, fine to mediumSAND, trace silt, trace gravel
Brown Gravelly SAND, some silt
Auger Refusal at 14.1 feet(Probable Bedrock)
0-2
5-7
10-12
Pen. = Penetration LengthRec. = Recovery Length
LOGGED BY: Todd Sekera
CORE BARREL: N/A
At time of DrillingAt Completion of DrillingAfter Drilling
D = Split Spoon Sample
CASING ID/OD: N/A /N/A
Water Level
AUGER ID/OD: 2 1/4 in / 5 5/8 in
ELEVATION (FT): 23.7' Surveyed
bpf = Blows per Foot
TOTAL DEPTH (FT): 14.1
U = Thin Walled Tube Sample
LOCATION: See Exploration Location Plan
DRILLER: Kevin Hanscom
HAMMER EFFICIENCY FACTOR: 0.98
KEY TO NOTESAND SYMBOLS:
WATER LEVEL DEPTHS (ft): 9.5 ft
Sv = Field Vane Shear Strength, kips/sq.ft.
Drilling Information
RIG TYPE: Track Mounted Diedrich D-50
HAMMER TYPE: Automatic
GENERAL NOTES:
HAMMER WEIGHT (lbs): 140
R = Rock Core SampleV = Field Vane Shear mpf = Minute per Foot
WOR = Weight of RodsWOH = Weight of HammerRQD = Rock Quality Designation
HAMMER DROP (inch): 30
DRILLING CO.: S. W. Cole Explorations, LLC
PID = Photoionization Detector N/A = Not Applicable
SAMPLER: Standard Split-Spoon
qU = Unconfined Compressive Strength, kips/sq.ft.Ø = Friction Angle (Estimated)
DRILLING METHOD: Hollow Stem Auger
Gra
phic
Log
Elev.(ft)
20
15
10
SampleNo. T
ype
Depth(ft)
5
10
CasingPen.(bpf)
Stratification lines represent approximateboundary between soil types, transitions maybe gradual. Water level readings have beenmade at times and under conditions stated.Fluctuations of groundwater may occur due toother factors than those present at the timemeasurements were made.
Pen./Rec.(in)
SAMPLE INFORMATION
H20Depth
BlowCount
orRQD
Field / LabTest Data
RemarksSample
Description &Classification
Depth(ft)
BORING LOG
DATE START: 2/4/2020DATE FINISH: 2/4/2020
BORING NO.: B-14
BORING NO.: B-14
PROJECT NO. 19-1758.1SHEET: 1 of 1
CLIENT: Gartley & Dorsky Engineering & SurveyingPROJECT: Proposed Kingfish Maine, Inc. Aquaculture FacilityLOCATION: 9 Dun Garvin Road, Jonesport, ME
BO
RIN
G /
WE
LL 1
9-17
58.1
.GP
J S
WC
E T
EM
PLA
TE
.GD
T 3
/22/
20
0.4
3.0
13.0
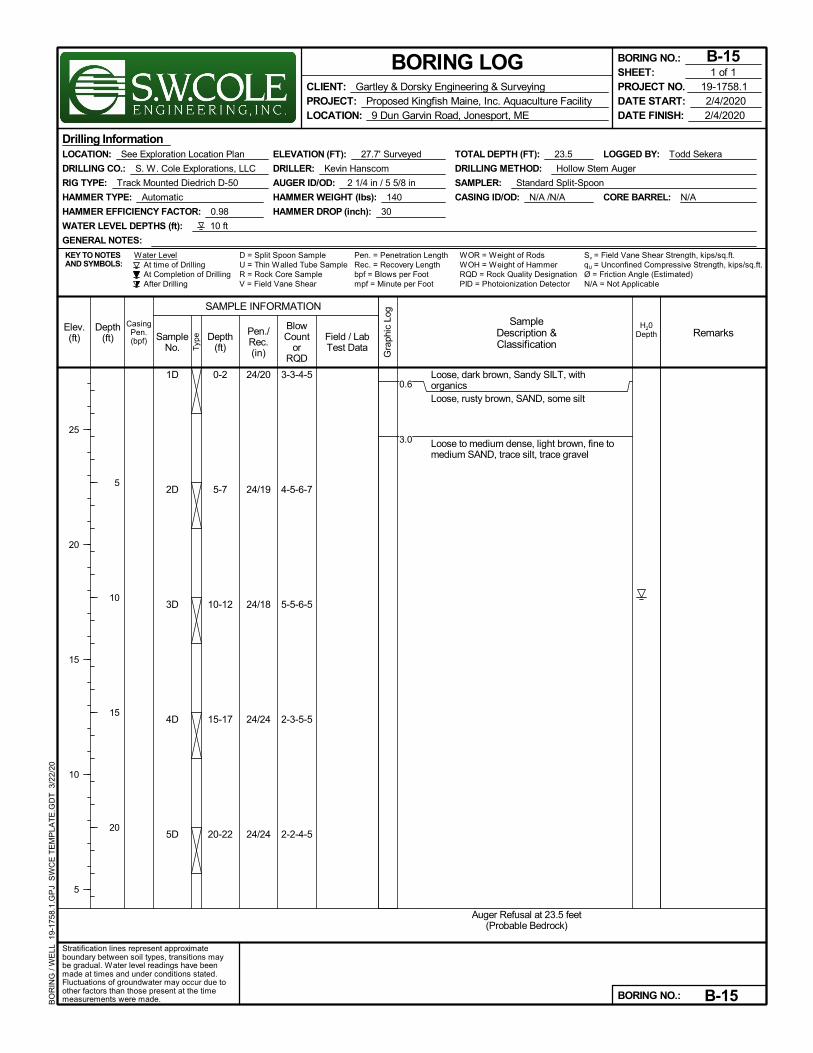
1D
2D
3D
4D
5D
24/20
24/19
24/18
24/24
24/24
3-3-4-5
4-5-6-7
5-5-6-5
2-3-5-5
2-2-4-5
Loose, dark brown, Sandy SILT, withorganicsLoose, rusty brown, SAND, some silt
Loose to medium dense, light brown, fine tomedium SAND, trace silt, trace gravel
Auger Refusal at 23.5 feet(Probable Bedrock)
0-2
5-7
10-12
15-17
20-22
Pen. = Penetration LengthRec. = Recovery Length
LOGGED BY: Todd Sekera
CORE BARREL: N/A
At time of DrillingAt Completion of DrillingAfter Drilling
D = Split Spoon Sample
CASING ID/OD: N/A /N/A
Water Level
AUGER ID/OD: 2 1/4 in / 5 5/8 in
ELEVATION (FT): 27.7' Surveyed
bpf = Blows per Foot
TOTAL DEPTH (FT): 23.5
U = Thin Walled Tube Sample
LOCATION: See Exploration Location Plan
DRILLER: Kevin Hanscom
HAMMER EFFICIENCY FACTOR: 0.98
KEY TO NOTESAND SYMBOLS:
WATER LEVEL DEPTHS (ft): 10 ft
Sv = Field Vane Shear Strength, kips/sq.ft.
Drilling Information
RIG TYPE: Track Mounted Diedrich D-50
HAMMER TYPE: Automatic
GENERAL NOTES:
HAMMER WEIGHT (lbs): 140
R = Rock Core SampleV = Field Vane Shear mpf = Minute per Foot
WOR = Weight of RodsWOH = Weight of HammerRQD = Rock Quality Designation
HAMMER DROP (inch): 30
DRILLING CO.: S. W. Cole Explorations, LLC
PID = Photoionization Detector N/A = Not Applicable
SAMPLER: Standard Split-Spoon
qU = Unconfined Compressive Strength, kips/sq.ft.Ø = Friction Angle (Estimated)
DRILLING METHOD: Hollow Stem Auger
Gra
phic
Log
Elev.(ft)
25
20
15
10
5
SampleNo. T
ype
Depth(ft)
5
10
15
20
CasingPen.(bpf)
Stratification lines represent approximateboundary between soil types, transitions maybe gradual. Water level readings have beenmade at times and under conditions stated.Fluctuations of groundwater may occur due toother factors than those present at the timemeasurements were made.
Pen./Rec.(in)
SAMPLE INFORMATION
H20Depth
BlowCount
orRQD
Field / LabTest Data
RemarksSample
Description &Classification
Depth(ft)
BORING LOG
DATE START: 2/4/2020DATE FINISH: 2/4/2020
BORING NO.: B-15
BORING NO.: B-15
PROJECT NO. 19-1758.1SHEET: 1 of 1
CLIENT: Gartley & Dorsky Engineering & SurveyingPROJECT: Proposed Kingfish Maine, Inc. Aquaculture FacilityLOCATION: 9 Dun Garvin Road, Jonesport, ME
BO
RIN
G /
WE
LL 1
9-17
58.1
.GP
J S
WC
E T
EM
PLA
TE
.GD
T 3
/22/
20
0.6
3.0
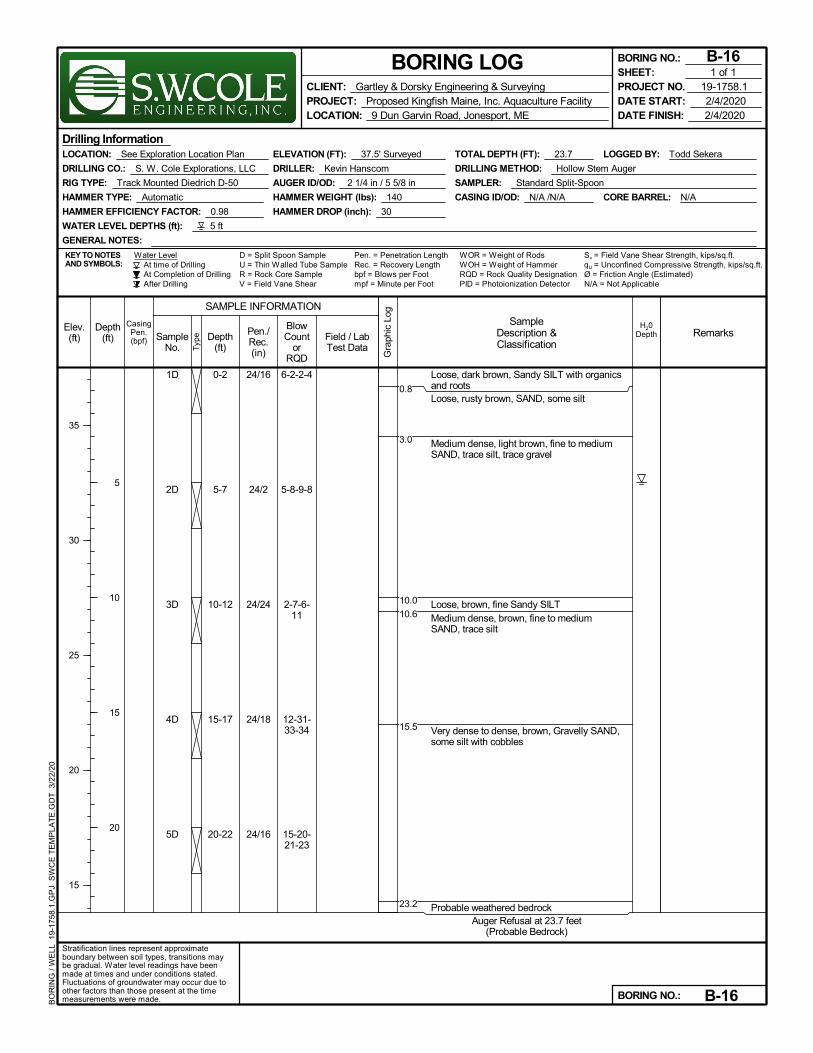
1D
2D
3D
4D
5D
24/16
24/2
24/24
24/18
24/16
6-2-2-4
5-8-9-8
2-7-6-11
12-31-33-34
15-20-21-23
Loose, dark brown, Sandy SILT with organicsand rootsLoose, rusty brown, SAND, some silt
Medium dense, light brown, fine to mediumSAND, trace silt, trace gravel
Loose, brown, fine Sandy SILTMedium dense, brown, fine to mediumSAND, trace silt
Very dense to dense, brown, Gravelly SAND,some silt with cobbles
Probable weathered bedrockAuger Refusal at 23.7 feet
(Probable Bedrock)
0-2
5-7
10-12
15-17
20-22
Pen. = Penetration LengthRec. = Recovery Length
LOGGED BY: Todd Sekera
CORE BARREL: N/A
At time of DrillingAt Completion of DrillingAfter Drilling
D = Split Spoon Sample
CASING ID/OD: N/A /N/A
Water Level
AUGER ID/OD: 2 1/4 in / 5 5/8 in
ELEVATION (FT): 37.5' Surveyed
bpf = Blows per Foot
TOTAL DEPTH (FT): 23.7
U = Thin Walled Tube Sample
LOCATION: See Exploration Location Plan
DRILLER: Kevin Hanscom
HAMMER EFFICIENCY FACTOR: 0.98
KEY TO NOTESAND SYMBOLS:
WATER LEVEL DEPTHS (ft): 5 ft
Sv = Field Vane Shear Strength, kips/sq.ft.
Drilling Information
RIG TYPE: Track Mounted Diedrich D-50
HAMMER TYPE: Automatic
GENERAL NOTES:
HAMMER WEIGHT (lbs): 140
R = Rock Core SampleV = Field Vane Shear mpf = Minute per Foot
WOR = Weight of RodsWOH = Weight of HammerRQD = Rock Quality Designation
HAMMER DROP (inch): 30
DRILLING CO.: S. W. Cole Explorations, LLC
PID = Photoionization Detector N/A = Not Applicable
SAMPLER: Standard Split-Spoon
qU = Unconfined Compressive Strength, kips/sq.ft.Ø = Friction Angle (Estimated)
DRILLING METHOD: Hollow Stem Auger
Gra
phic
Log
Elev.(ft)
35
30
25
20
15
SampleNo. T
ype
Depth(ft)
5
10
15
20
CasingPen.(bpf)
Stratification lines represent approximateboundary between soil types, transitions maybe gradual. Water level readings have beenmade at times and under conditions stated.Fluctuations of groundwater may occur due toother factors than those present at the timemeasurements were made.
Pen./Rec.(in)
SAMPLE INFORMATION
H20Depth
BlowCount
orRQD
Field / LabTest Data
RemarksSample
Description &Classification
Depth(ft)
BORING LOG
DATE START: 2/4/2020DATE FINISH: 2/4/2020
BORING NO.: B-16
BORING NO.: B-16
PROJECT NO. 19-1758.1SHEET: 1 of 1
CLIENT: Gartley & Dorsky Engineering & SurveyingPROJECT: Proposed Kingfish Maine, Inc. Aquaculture FacilityLOCATION: 9 Dun Garvin Road, Jonesport, ME
BO
RIN
G /
WE
LL 1
9-17
58.1
.GP
J S
WC
E T
EM
PLA
TE
.GD
T 3
/22/
20
0.8
3.0
10.0
10.6
15.5
23.2
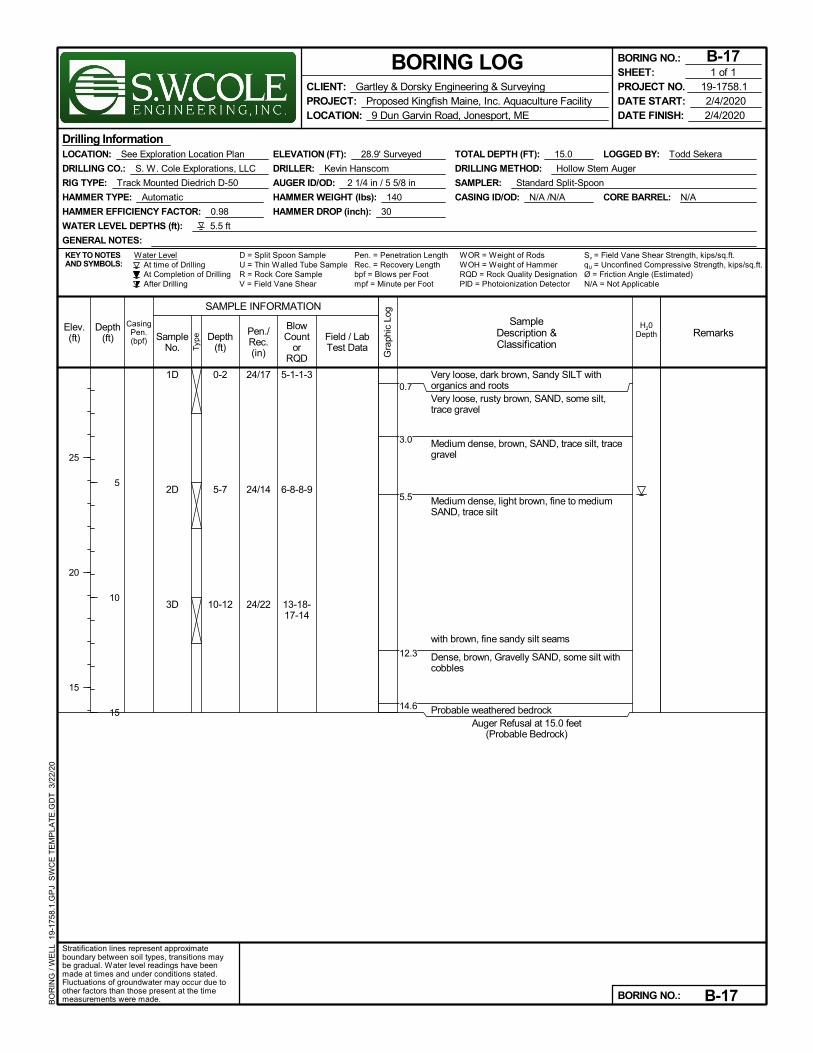
1D
2D
3D
24/17
24/14
24/22
5-1-1-3
6-8-8-9
13-18-17-14
Very loose, dark brown, Sandy SILT withorganics and rootsVery loose, rusty brown, SAND, some silt,trace gravel
Medium dense, brown, SAND, trace silt, tracegravel
Medium dense, light brown, fine to mediumSAND, trace silt
with brown, fine sandy silt seams
Dense, brown, Gravelly SAND, some silt withcobbles
Probable weathered bedrockAuger Refusal at 15.0 feet
(Probable Bedrock)
0-2
5-7
10-12
Pen. = Penetration LengthRec. = Recovery Length
LOGGED BY: Todd Sekera
CORE BARREL: N/A
At time of DrillingAt Completion of DrillingAfter Drilling
D = Split Spoon Sample
CASING ID/OD: N/A /N/A
Water Level
AUGER ID/OD: 2 1/4 in / 5 5/8 in
ELEVATION (FT): 28.9' Surveyed
bpf = Blows per Foot
TOTAL DEPTH (FT): 15.0
U = Thin Walled Tube Sample
LOCATION: See Exploration Location Plan
DRILLER: Kevin Hanscom
HAMMER EFFICIENCY FACTOR: 0.98
KEY TO NOTESAND SYMBOLS:
WATER LEVEL DEPTHS (ft): 5.5 ft
Sv = Field Vane Shear Strength, kips/sq.ft.
Drilling Information
RIG TYPE: Track Mounted Diedrich D-50
HAMMER TYPE: Automatic
GENERAL NOTES:
HAMMER WEIGHT (lbs): 140
R = Rock Core SampleV = Field Vane Shear mpf = Minute per Foot
WOR = Weight of RodsWOH = Weight of HammerRQD = Rock Quality Designation
HAMMER DROP (inch): 30
DRILLING CO.: S. W. Cole Explorations, LLC
PID = Photoionization Detector N/A = Not Applicable
SAMPLER: Standard Split-Spoon
qU = Unconfined Compressive Strength, kips/sq.ft.Ø = Friction Angle (Estimated)
DRILLING METHOD: Hollow Stem Auger
Gra
phic
Log
Elev.(ft)
25
20
15
SampleNo. T
ype
Depth(ft)
5
10
15
CasingPen.(bpf)
Stratification lines represent approximateboundary between soil types, transitions maybe gradual. Water level readings have beenmade at times and under conditions stated.Fluctuations of groundwater may occur due toother factors than those present at the timemeasurements were made.
Pen./Rec.(in)
SAMPLE INFORMATION
H20Depth
BlowCount
orRQD
Field / LabTest Data
RemarksSample
Description &Classification
Depth(ft)
BORING LOG
DATE START: 2/4/2020DATE FINISH: 2/4/2020
BORING NO.: B-17
BORING NO.: B-17
PROJECT NO. 19-1758.1SHEET: 1 of 1
CLIENT: Gartley & Dorsky Engineering & SurveyingPROJECT: Proposed Kingfish Maine, Inc. Aquaculture FacilityLOCATION: 9 Dun Garvin Road, Jonesport, ME
BO
RIN
G /
WE
LL 1
9-17
58.1
.GP
J S
WC
E T
EM
PLA
TE
.GD
T 3
/22/
20
0.7
3.0
5.5
12.3
14.6
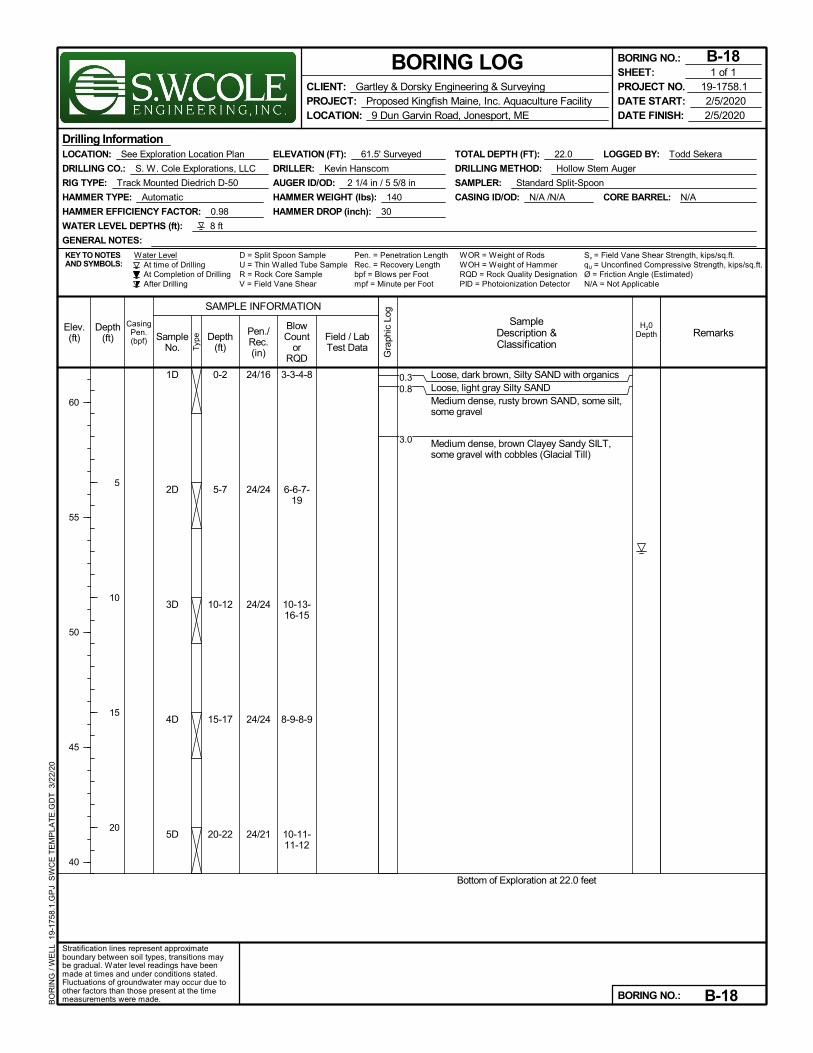
1D
2D
3D
4D
5D
24/16
24/24
24/24
24/24
24/21
3-3-4-8
6-6-7-19
10-13-16-15
8-9-8-9
10-11-11-12
Loose, dark brown, Silty SAND with organicsLoose, light gray Silty SANDMedium dense, rusty brown SAND, some silt,some gravel
Medium dense, brown Clayey Sandy SILT,some gravel with cobbles (Glacial Till)
Bottom of Exploration at 22.0 feet
0-2
5-7
10-12
15-17
20-22
Pen. = Penetration LengthRec. = Recovery Length
LOGGED BY: Todd Sekera
CORE BARREL: N/A
At time of DrillingAt Completion of DrillingAfter Drilling
D = Split Spoon Sample
CASING ID/OD: N/A /N/A
Water Level
AUGER ID/OD: 2 1/4 in / 5 5/8 in
ELEVATION (FT): 61.5' Surveyed
bpf = Blows per Foot
TOTAL DEPTH (FT): 22.0
U = Thin Walled Tube Sample
LOCATION: See Exploration Location Plan
DRILLER: Kevin Hanscom
HAMMER EFFICIENCY FACTOR: 0.98
KEY TO NOTESAND SYMBOLS:
WATER LEVEL DEPTHS (ft): 8 ft
Sv = Field Vane Shear Strength, kips/sq.ft.
Drilling Information
RIG TYPE: Track Mounted Diedrich D-50
HAMMER TYPE: Automatic
GENERAL NOTES:
HAMMER WEIGHT (lbs): 140
R = Rock Core SampleV = Field Vane Shear mpf = Minute per Foot
WOR = Weight of RodsWOH = Weight of HammerRQD = Rock Quality Designation
HAMMER DROP (inch): 30
DRILLING CO.: S. W. Cole Explorations, LLC
PID = Photoionization Detector N/A = Not Applicable
SAMPLER: Standard Split-Spoon
qU = Unconfined Compressive Strength, kips/sq.ft.Ø = Friction Angle (Estimated)
DRILLING METHOD: Hollow Stem Auger
Gra
phic
Log
Elev.(ft)
60
55
50
45
40
SampleNo. T
ype
Depth(ft)
5
10
15
20
CasingPen.(bpf)
Stratification lines represent approximateboundary between soil types, transitions maybe gradual. Water level readings have beenmade at times and under conditions stated.Fluctuations of groundwater may occur due toother factors than those present at the timemeasurements were made.
Pen./Rec.(in)
SAMPLE INFORMATION
H20Depth
BlowCount
orRQD
Field / LabTest Data
RemarksSample
Description &Classification
Depth(ft)
BORING LOG
DATE START: 2/5/2020DATE FINISH: 2/5/2020
BORING NO.: B-18
BORING NO.: B-18
PROJECT NO. 19-1758.1SHEET: 1 of 1
CLIENT: Gartley & Dorsky Engineering & SurveyingPROJECT: Proposed Kingfish Maine, Inc. Aquaculture FacilityLOCATION: 9 Dun Garvin Road, Jonesport, ME
BO
RIN
G /
WE
LL 1
9-17
58.1
.GP
J S
WC
E T
EM
PLA
TE
.GD
T 3
/22/
20
0.30.8
3.0
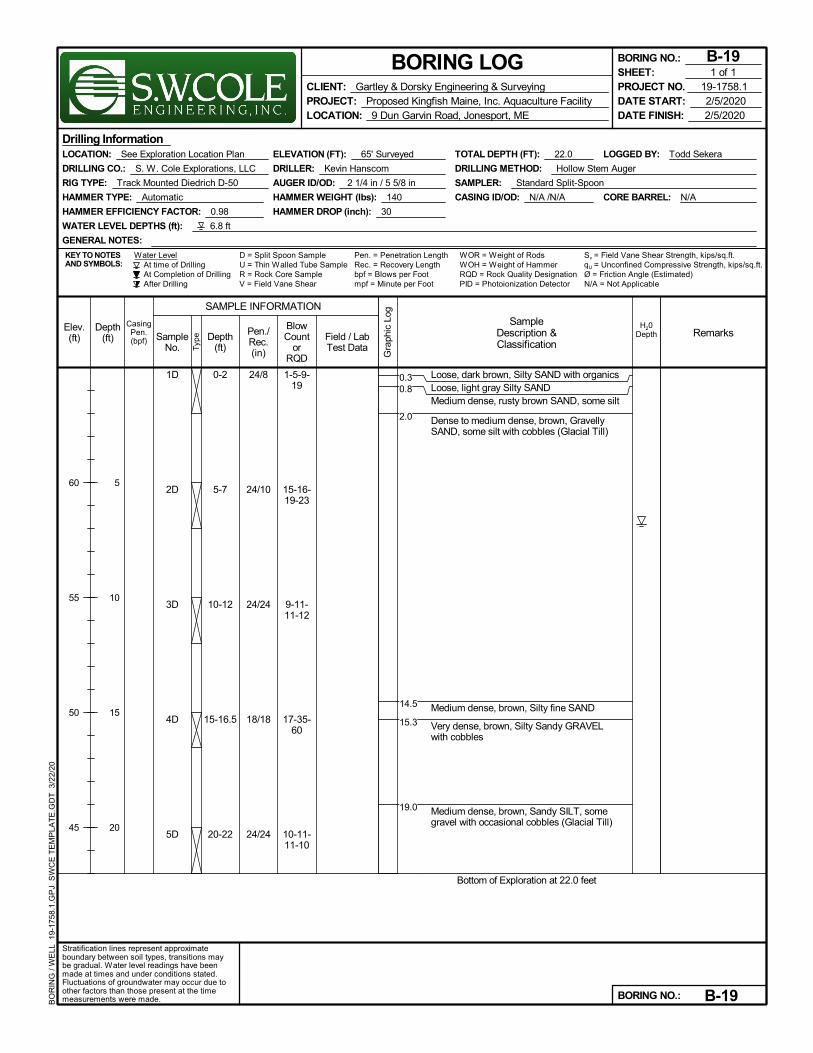
1D
2D
3D
4D
5D
24/8
24/10
24/24
18/18
24/24
1-5-9-19
15-16-19-23
9-11-11-12
17-35-60
10-11-11-10
Loose, dark brown, Silty SAND with organicsLoose, light gray Silty SANDMedium dense, rusty brown SAND, some silt
Dense to medium dense, brown, GravellySAND, some silt with cobbles (Glacial Till)
Medium dense, brown, Silty fine SAND
Very dense, brown, Silty Sandy GRAVELwith cobbles
Medium dense, brown, Sandy SILT, somegravel with occasional cobbles (Glacial Till)
Bottom of Exploration at 22.0 feet
0-2
5-7
10-12
15-16.5
20-22
Pen. = Penetration LengthRec. = Recovery Length
LOGGED BY: Todd Sekera
CORE BARREL: N/A
At time of DrillingAt Completion of DrillingAfter Drilling
D = Split Spoon Sample
CASING ID/OD: N/A /N/A
Water Level
AUGER ID/OD: 2 1/4 in / 5 5/8 in
ELEVATION (FT): 65' Surveyed
bpf = Blows per Foot
TOTAL DEPTH (FT): 22.0
U = Thin Walled Tube Sample
LOCATION: See Exploration Location Plan
DRILLER: Kevin Hanscom
HAMMER EFFICIENCY FACTOR: 0.98
KEY TO NOTESAND SYMBOLS:
WATER LEVEL DEPTHS (ft): 6.8 ft
Sv = Field Vane Shear Strength, kips/sq.ft.
Drilling Information
RIG TYPE: Track Mounted Diedrich D-50
HAMMER TYPE: Automatic
GENERAL NOTES:
HAMMER WEIGHT (lbs): 140
R = Rock Core SampleV = Field Vane Shear mpf = Minute per Foot
WOR = Weight of RodsWOH = Weight of HammerRQD = Rock Quality Designation
HAMMER DROP (inch): 30
DRILLING CO.: S. W. Cole Explorations, LLC
PID = Photoionization Detector N/A = Not Applicable
SAMPLER: Standard Split-Spoon
qU = Unconfined Compressive Strength, kips/sq.ft.Ø = Friction Angle (Estimated)
DRILLING METHOD: Hollow Stem Auger
Gra
phic
Log
Elev.(ft)
60
55
50
45
SampleNo. T
ype
Depth(ft)
5
10
15
20
CasingPen.(bpf)
Stratification lines represent approximateboundary between soil types, transitions maybe gradual. Water level readings have beenmade at times and under conditions stated.Fluctuations of groundwater may occur due toother factors than those present at the timemeasurements were made.
Pen./Rec.(in)
SAMPLE INFORMATION
H20Depth
BlowCount
orRQD
Field / LabTest Data
RemarksSample
Description &Classification
Depth(ft)
BORING LOG
DATE START: 2/5/2020DATE FINISH: 2/5/2020
BORING NO.: B-19
BORING NO.: B-19
PROJECT NO. 19-1758.1SHEET: 1 of 1
CLIENT: Gartley & Dorsky Engineering & SurveyingPROJECT: Proposed Kingfish Maine, Inc. Aquaculture FacilityLOCATION: 9 Dun Garvin Road, Jonesport, ME
BO
RIN
G /
WE
LL 1
9-17
58.1
.GP
J S
WC
E T
EM
PLA
TE
.GD
T 3
/22/
20
0.30.8
2.0
14.5
15.3
19.0
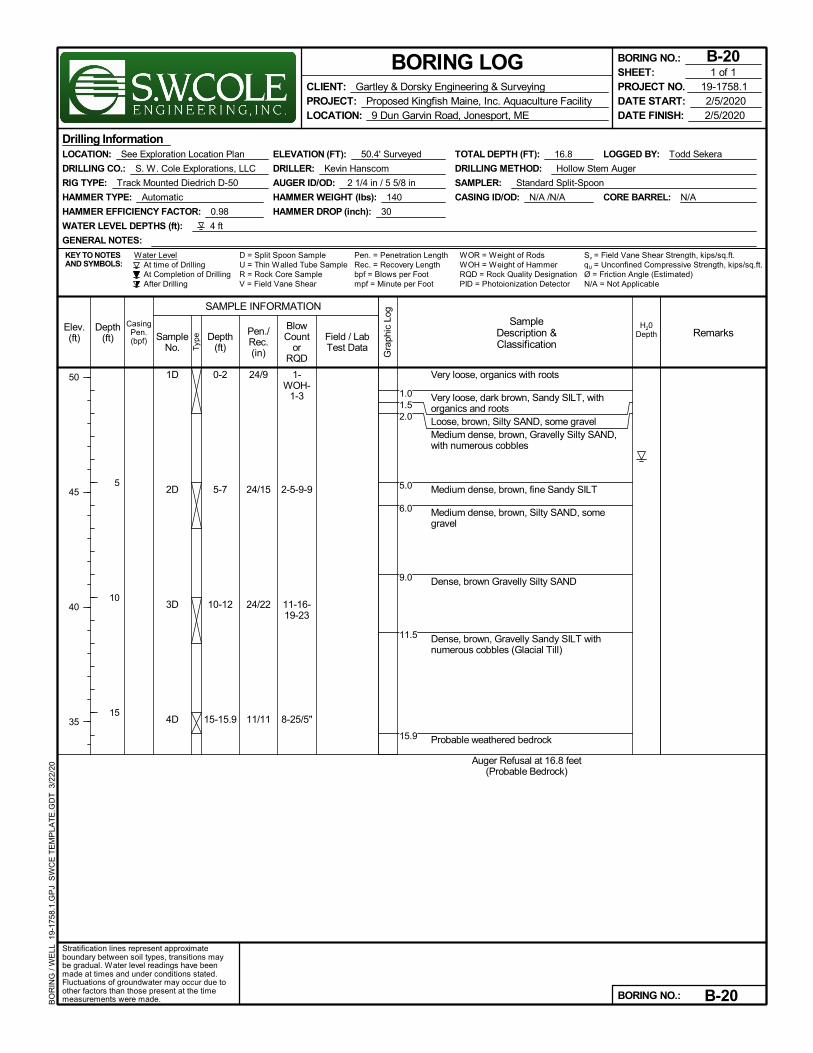
1D
2D
3D
4D
24/9
24/15
24/22
11/11
1-WOH-
1-3
2-5-9-9
11-16-19-23
8-25/5"
Very loose, organics with roots
Very loose, dark brown, Sandy SILT, withorganics and rootsLoose, brown, Silty SAND, some gravelMedium dense, brown, Gravelly Silty SAND,with numerous cobbles
Medium dense, brown, fine Sandy SILT
Medium dense, brown, Silty SAND, somegravel
Dense, brown Gravelly Silty SAND
Dense, brown, Gravelly Sandy SILT withnumerous cobbles (Glacial Till)
Probable weathered bedrock
Auger Refusal at 16.8 feet(Probable Bedrock)
0-2
5-7
10-12
15-15.9
Pen. = Penetration LengthRec. = Recovery Length
LOGGED BY: Todd Sekera
CORE BARREL: N/A
At time of DrillingAt Completion of DrillingAfter Drilling
D = Split Spoon Sample
CASING ID/OD: N/A /N/A
Water Level
AUGER ID/OD: 2 1/4 in / 5 5/8 in
ELEVATION (FT): 50.4' Surveyed
bpf = Blows per Foot
TOTAL DEPTH (FT): 16.8
U = Thin Walled Tube Sample
LOCATION: See Exploration Location Plan
DRILLER: Kevin Hanscom
HAMMER EFFICIENCY FACTOR: 0.98
KEY TO NOTESAND SYMBOLS:
WATER LEVEL DEPTHS (ft): 4 ft
Sv = Field Vane Shear Strength, kips/sq.ft.
Drilling Information
RIG TYPE: Track Mounted Diedrich D-50
HAMMER TYPE: Automatic
GENERAL NOTES:
HAMMER WEIGHT (lbs): 140
R = Rock Core SampleV = Field Vane Shear mpf = Minute per Foot
WOR = Weight of RodsWOH = Weight of HammerRQD = Rock Quality Designation
HAMMER DROP (inch): 30
DRILLING CO.: S. W. Cole Explorations, LLC
PID = Photoionization Detector N/A = Not Applicable
SAMPLER: Standard Split-Spoon
qU = Unconfined Compressive Strength, kips/sq.ft.Ø = Friction Angle (Estimated)
DRILLING METHOD: Hollow Stem Auger
Gra
phic
Log
Elev.(ft)
50
45
40
35
SampleNo. T
ype
Depth(ft)
5
10
15
CasingPen.(bpf)
Stratification lines represent approximateboundary between soil types, transitions maybe gradual. Water level readings have beenmade at times and under conditions stated.Fluctuations of groundwater may occur due toother factors than those present at the timemeasurements were made.
Pen./Rec.(in)
SAMPLE INFORMATION
H20Depth
BlowCount
orRQD
Field / LabTest Data
RemarksSample
Description &Classification
Depth(ft)
BORING LOG
DATE START: 2/5/2020DATE FINISH: 2/5/2020
BORING NO.: B-20
BORING NO.: B-20
PROJECT NO. 19-1758.1SHEET: 1 of 1
CLIENT: Gartley & Dorsky Engineering & SurveyingPROJECT: Proposed Kingfish Maine, Inc. Aquaculture FacilityLOCATION: 9 Dun Garvin Road, Jonesport, ME
BO
RIN
G /
WE
LL 1
9-17
58.1
.GP
J S
WC
E T
EM
PLA
TE
.GD
T 3
/22/
20
1.01.52.0
5.0
6.0
9.0
11.5
15.9
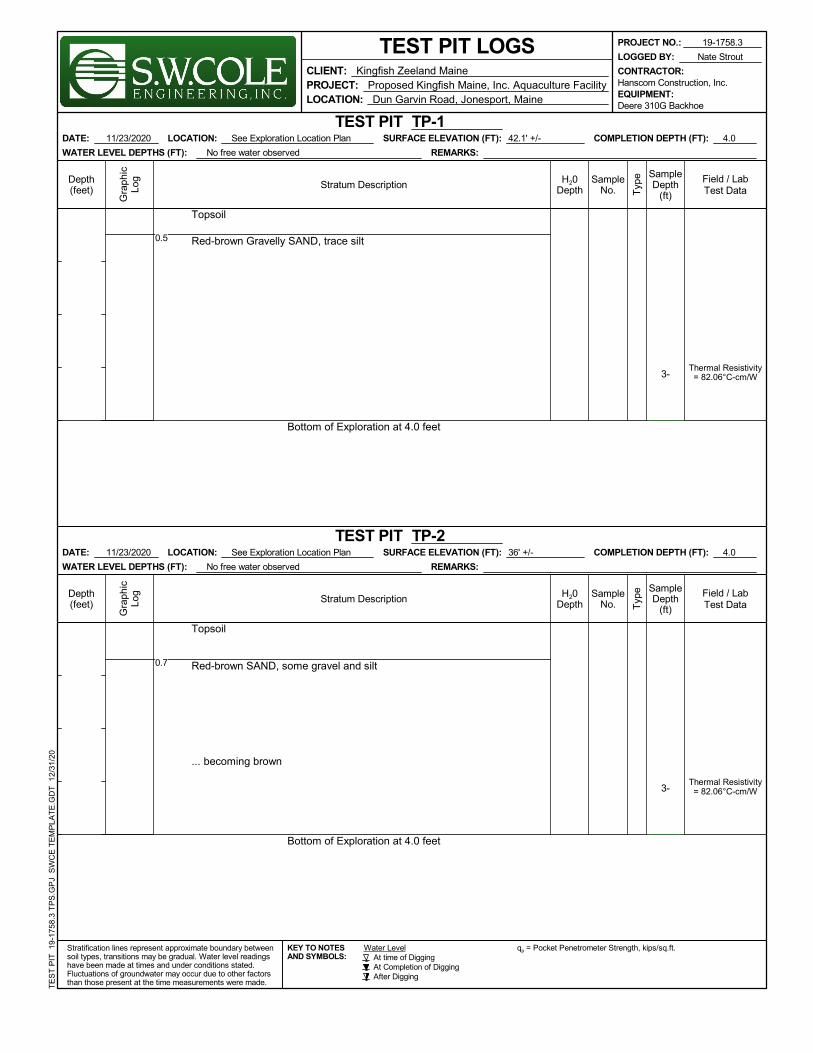
Topsoil
Red-brown Gravelly SAND, trace silt
Bottom of Exploration at 4.0 feet
Thermal Resistivity= 82.06°C-cm/W3-
Water Level qp = Pocket Penetrometer Strength, kips/sq.ft.
At Completion of DiggingAfter Digging
At time of Digging
H20Depth T
ype
Gra
phic
Log
Stratum DescriptionField / LabTest Data
SampleNo.
Depth(feet)
KEY TO NOTESAND SYMBOLS:
TEST PIT TP-1
SampleDepth
(ft)
COMPLETION DEPTH (FT): 4.0DATE: 11/23/2020 SURFACE ELEVATION (FT): 42.1' +/-LOCATION: See Exploration Location Plan
REMARKS:WATER LEVEL DEPTHS (FT): No free water observed
TEST PIT LOGSLOGGED BY: Nate Strout
Stratification lines represent approximate boundary betweensoil types, transitions may be gradual. Water level readingshave been made at times and under conditions stated.Fluctuations of groundwater may occur due to other factorsthan those present at the time measurements were made.
CONTRACTOR: Hanscom Construction, Inc.EQUIPMENT: Deere 310G Backhoe
PROJECT NO.: 19-1758.3T
ES
T P
IT 1
9-1
758
.3 T
PS
.GP
J S
WC
E T
EM
PLA
TE
.GD
T 1
2/31
/20
CLIENT: Kingfish Zeeland MainePROJECT: Proposed Kingfish Maine, Inc. Aquaculture FacilityLOCATION: Dun Garvin Road, Jonesport, Maine
Topsoil
Red-brown SAND, some gravel and silt
... becoming brown
Bottom of Exploration at 4.0 feet
Thermal Resistivity= 82.06°C-cm/W3-
H20Depth T
ype
Gra
phic
Log
Stratum DescriptionField / LabTest Data
SampleNo.
Depth(feet)
TEST PIT TP-2
SampleDepth
(ft)
COMPLETION DEPTH (FT): 4.0DATE: 11/23/2020 SURFACE ELEVATION (FT): 36' +/-LOCATION: See Exploration Location Plan
REMARKS:WATER LEVEL DEPTHS (FT): No free water observed
0.5
0.7
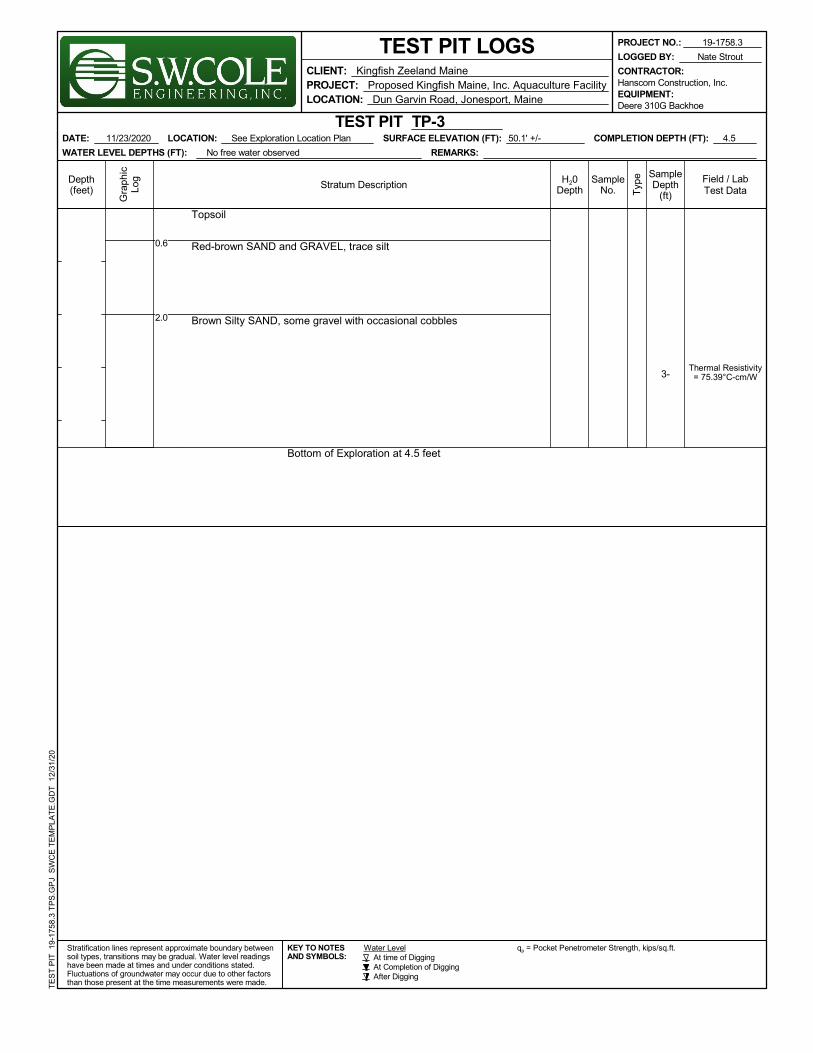
Topsoil
Red-brown SAND and GRAVEL, trace silt
Brown Silty SAND, some gravel with occasional cobbles
Bottom of Exploration at 4.5 feet
Thermal Resistivity= 75.39°C-cm/W3-
Water Level qp = Pocket Penetrometer Strength, kips/sq.ft.
At Completion of DiggingAfter Digging
At time of Digging
H20Depth T
ype
Gra
phic
Log
Stratum DescriptionField / LabTest Data
SampleNo.
Depth(feet)
KEY TO NOTESAND SYMBOLS:
TEST PIT TP-3
SampleDepth
(ft)
COMPLETION DEPTH (FT): 4.5DATE: 11/23/2020 SURFACE ELEVATION (FT): 50.1' +/-LOCATION: See Exploration Location Plan
REMARKS:WATER LEVEL DEPTHS (FT): No free water observed
TEST PIT LOGSLOGGED BY: Nate Strout
Stratification lines represent approximate boundary betweensoil types, transitions may be gradual. Water level readingshave been made at times and under conditions stated.Fluctuations of groundwater may occur due to other factorsthan those present at the time measurements were made.
CONTRACTOR: Hanscom Construction, Inc.EQUIPMENT: Deere 310G Backhoe
PROJECT NO.: 19-1758.3T
ES
T P
IT 1
9-1
758
.3 T
PS
.GP
J S
WC
E T
EM
PLA
TE
.GD
T 1
2/31
/20
CLIENT: Kingfish Zeeland MainePROJECT: Proposed Kingfish Maine, Inc. Aquaculture FacilityLOCATION: Dun Garvin Road, Jonesport, Maine
0.6
2.0
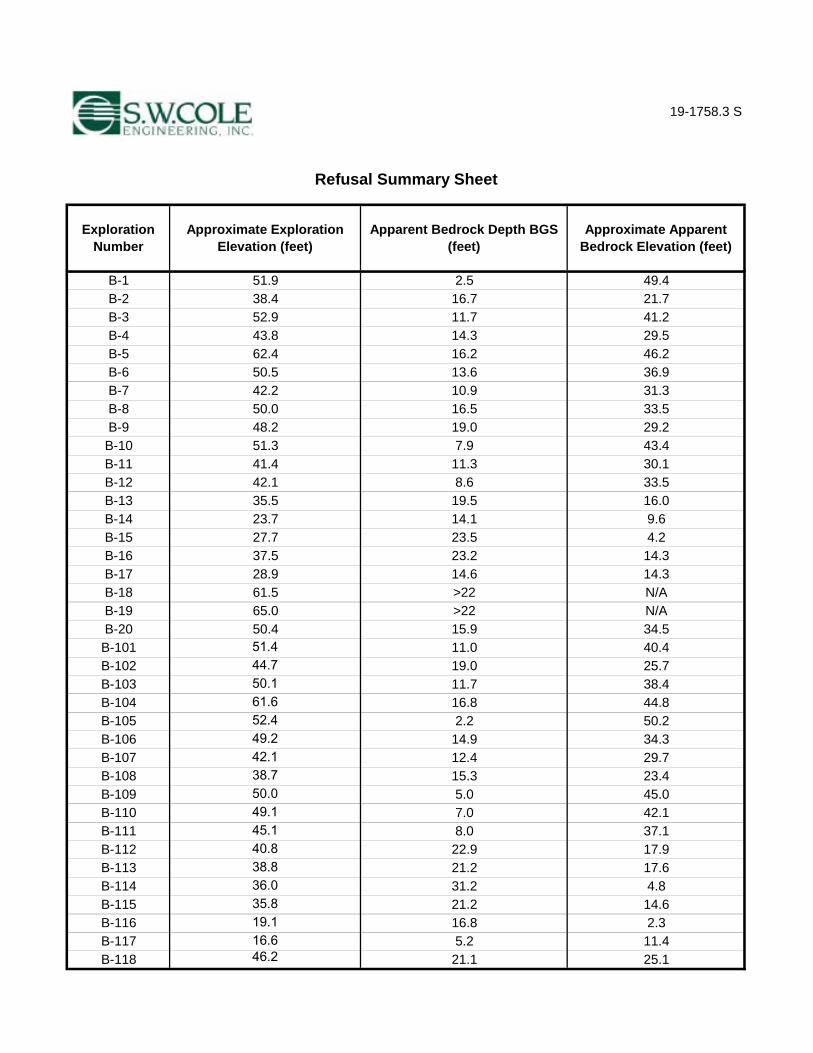
19-1758.3 S
5.221.1
23.445.042.137.117.917.64.814.62.311.425.1
15.35.07.08.022.921.231.221.216.8
B-117B-118
38.750.049.145.140.838.836.035.819.116.646.2
B-108B-109B-110
>2214.3
61.5
B-111B-112B-113B-114B-115B-116
B-19 >22 N/A15.9
21.741.229.546.236.931.333.529.243.430.133.516.09.64.214.3
N/A
34.5
19.0
65.050.4
11.3
B-17 14.6
35.523.727.737.528.9
B-12B-13B-14B-15B-16
42.141.4
8.619.514.123.523.2
Approximate Exploration Elevation (feet)
51.938.452.9
10.916.5
B-4
B-7
B-10
B-8B-9
42.250.048.251.3
B-5B-6
62.450.5
7.9
43.8
44.7B-103 11.7 38.4B-104 16.8
Refusal Summary Sheet
B-18
B-20
Apparent Bedrock Depth BGS (feet)
Approximate Apparent Bedrock Elevation (feet)
2.5 49.416.711.714.316.213.6
Exploration Number
B-1B-2B-3
B-11
44.850.161.6
51.4B-101 11.0 40.4
B-106 14.9 34.352.449.2
B-107 12.4 29.742.1
B-105 2.2 50.2
B-102 19.0 25.7
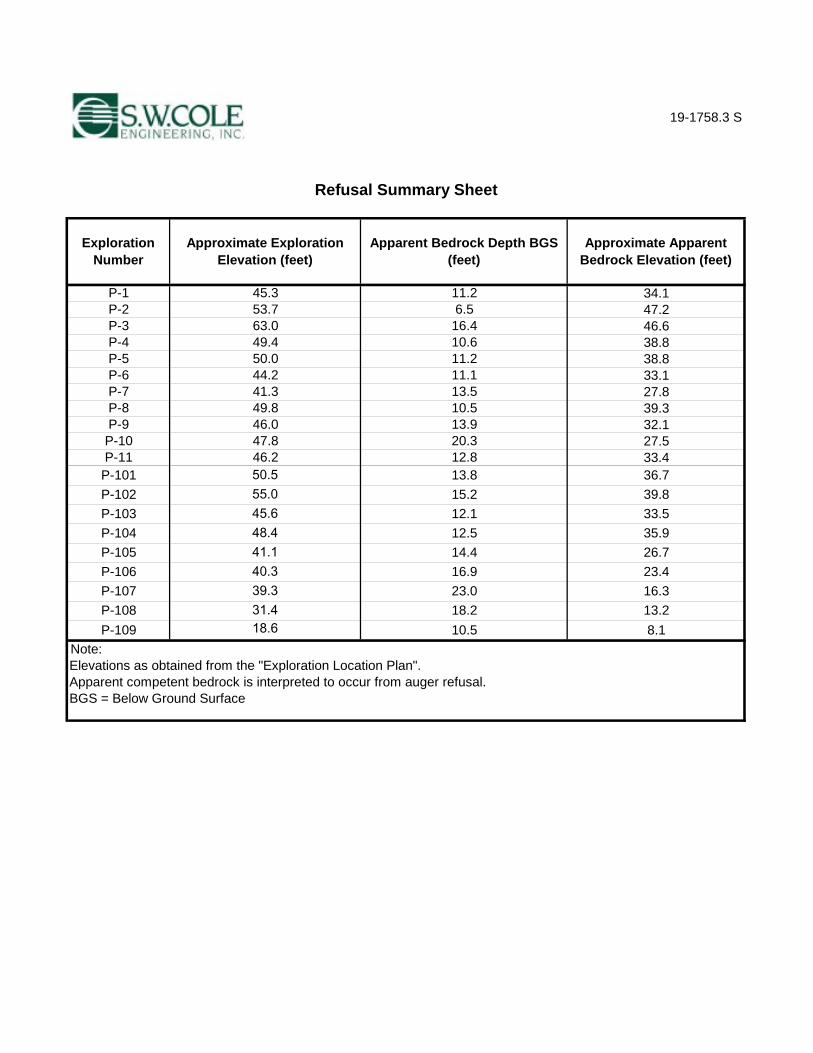
19-1758.3 S
Exploration Number
Approximate Exploration Elevation (feet)
Apparent Bedrock Depth BGS (feet)
Approximate Apparent Bedrock Elevation (feet)
Note: Elevations as obtained from the "Exploration Location Plan". Apparent competent bedrock is interpreted to occur from auger refusal. BGS = Below Ground Surface
P-107 39.3 23.0 16.3P-108 31.4 18.2 13.2P-109 18.6 10.5 8.1
P-104 48.4 12.5 35.9P-105 41.1 14.4 26.7P-106 40.3 16.9 23.4
P-101 50.5 13.8 36.7P-102 55.0 15.2 39.8P-103 45.6 12.1 33.5
20.312.8
34.147.246.638.838.833.127.839.332.127.533.4
11.26.516.410.611.211.113.510.513.9
P-10P-11
45.353.763.049.450.044.241.349.846.047.846.2
P-1P-2P-3P-4P-5P-6P-7P-8P-9
Refusal Summary Sheet
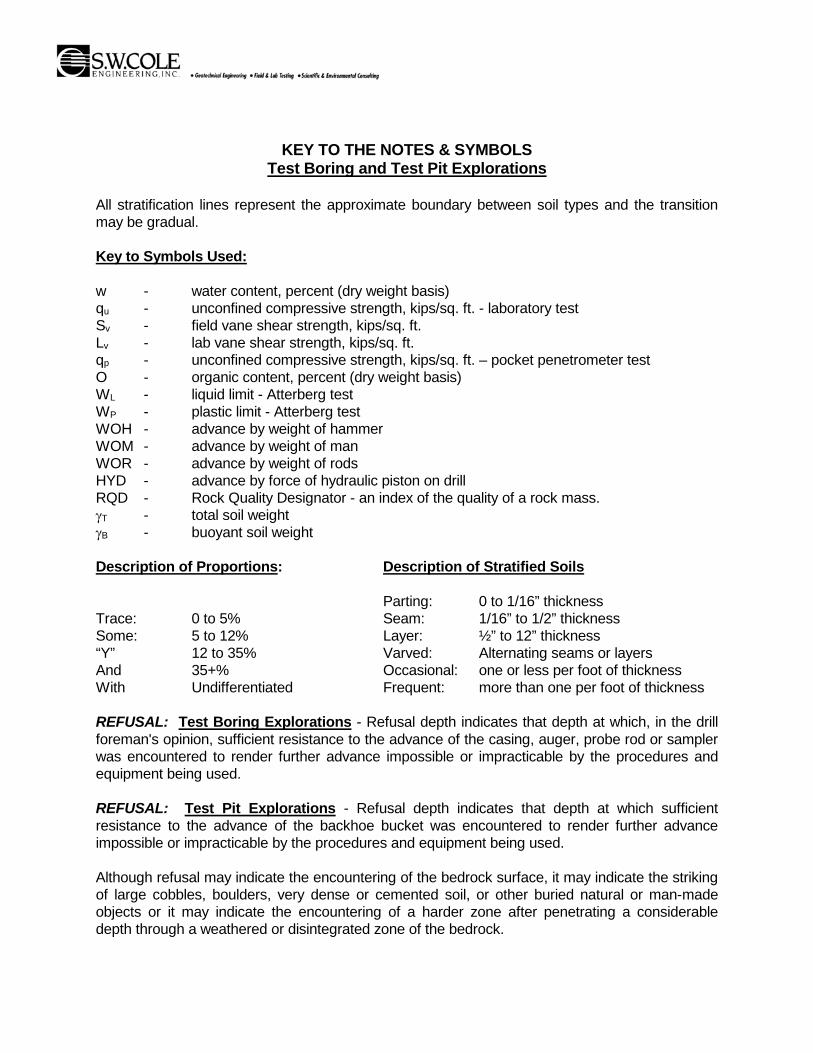
KEY TO THE NOTES & SYMBOLS Test Boring and Test Pit Explorations
All stratification lines represent the approximate boundary between soil types and the transition may be gradual.
Key to Symbols Used:
w - water content, percent (dry weight basis) qu - unconfined compressive strength, kips/sq. ft. - laboratory test Sv - field vane shear strength, kips/sq. ft. Lv - lab vane shear strength, kips/sq. ft. qp - unconfined compressive strength, kips/sq. ft. – pocket penetrometer test O - organic content, percent (dry weight basis) WL - liquid limit - Atterberg test WP - plastic limit - Atterberg test WOH - advance by weight of hammer WOM - advance by weight of man WOR - advance by weight of rods HYD - advance by force of hydraulic piston on drill RQD - Rock Quality Designator - an index of the quality of a rock mass. γT - total soil weight γB - buoyant soil weight
Description of Proportions: Description of Stratified Soils
Parting: 0 to 1/16” thickness Trace: 0 to 5% Seam: 1/16” to 1/2” thickness Some: 5 to 12% Layer: ½” to 12” thickness “Y” 12 to 35% Varved: Alternating seams or layers And 35+% Occasional: one or less per foot of thickness With Undifferentiated Frequent: more than one per foot of thickness
REFUSAL: Test Boring Explorations - Refusal depth indicates that depth at which, in the drill foreman's opinion, sufficient resistance to the advance of the casing, auger, probe rod or sampler was encountered to render further advance impossible or impracticable by the procedures and equipment being used.
REFUSAL: Test Pit Explorations - Refusal depth indicates that depth at which sufficient resistance to the advance of the backhoe bucket was encountered to render further advance impossible or impracticable by the procedures and equipment being used.
Although refusal may indicate the encountering of the bedrock surface, it may indicate the striking of large cobbles, boulders, very dense or cemented soil, or other buried natural or man-made objects or it may indicate the encountering of a harder zone after penetrating a considerable depth through a weathered or disintegrated zone of the bedrock.

APPENDIX D
Laboratory Test Results

Project Name JONESPORT ME - PROPOSED KINGFISH MAINE AQUACULTURE FACILITY - DESIGN PHASE - GEOTECHNICAL ENGINEERING
Project Number 19-1758.3Lab ID 26484B
Material Source B-102, 5-7 FEETDate Completed 11/19/2020Tested By BAXTER HUGHES
Date Received 11/18/2020
ASTM C-117 & C-136
Client KINGFISH ZEELAND MAINEExploration 3D
Report of Gradation
0%
10%
20%
30%
40%
50%
60%
70%
80%
90%
100%
0.00100.01000.10001.000010.0000100.0000
SIEVE SIZE - mm
AMO
UN
T PA
SSIN
G
.
3" 2" 1" #10 #20 #40 #100 #2001/2" 1/4"
SIEVE SIZE AMOUNT PASSING (%)STANDARD DESIGNATION (mm/µm)
6" 1001505" 1001254" 1001003" 100752" 10050
1-1/2" 10038.11" 10025.0
3/4" 10019.01/2" 10012.51/4" 996.3
No. 4 1.2% Gravel994.75No. 10 962.00No. 20 92850No. 40 86.9% Sand87425No. 60 76250No. 100 41150No. 200 11.9% Fines11.975
Comments:

Project Name JONESPORT ME - PROPOSED KINGFISH MAINE AQUACULTURE FACILITY - DESIGN PHASE - GEOTECHNICAL ENGINEERING
Project Number 19-1758.3Lab ID 26485B
Material Source B-104, 10-12 FEETDate Completed 11/19/2020Tested By DEAN MALLETT
Date Received 11/18/2020
ASTM C-117 & C-136
Client KINGFISH ZEELAND MAINEExploration 3D
Report of Gradation
0%
10%
20%
30%
40%
50%
60%
70%
80%
90%
100%
0.00100.01000.10001.000010.0000100.0000
SIEVE SIZE - mm
AMO
UN
T PA
SSIN
G
.
3" 2" 1" #10 #20 #40 #100 #2001/2" 1/4"
SIEVE SIZE AMOUNT PASSING (%)STANDARD DESIGNATION (mm/µm)
6" 1001505" 1001254" 1001003" 100752" 10050
1-1/2" 10038.11" 10025.0
3/4" 10019.01/2" 8612.51/4" 766.3
No. 4 27.5% Gravel724.75No. 10 612.00No. 20 49850No. 40 57.3% Sand41425No. 60 33250No. 100 25150No. 200 15.1% Fines15.175
Comments:
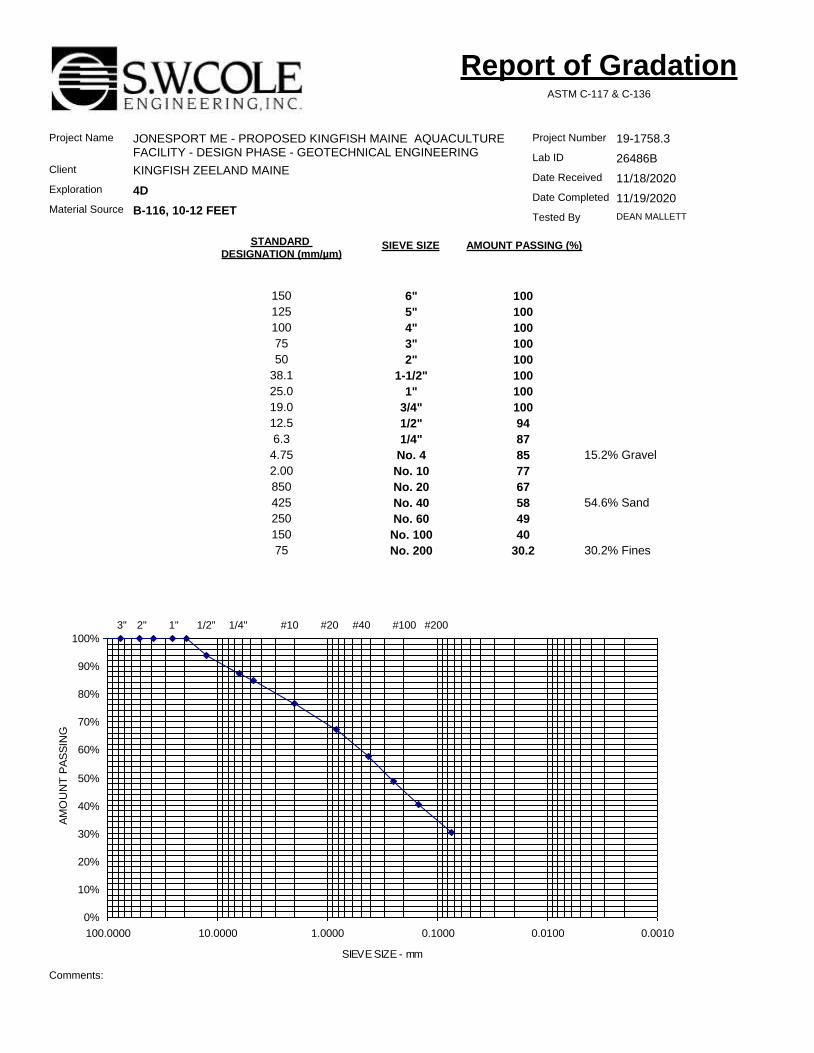
Project Name JONESPORT ME - PROPOSED KINGFISH MAINE AQUACULTURE FACILITY - DESIGN PHASE - GEOTECHNICAL ENGINEERING
Project Number 19-1758.3Lab ID 26486B
Material Source B-116, 10-12 FEETDate Completed 11/19/2020Tested By DEAN MALLETT
Date Received 11/18/2020
ASTM C-117 & C-136
Client KINGFISH ZEELAND MAINEExploration 4D
Report of Gradation
0%
10%
20%
30%
40%
50%
60%
70%
80%
90%
100%
0.00100.01000.10001.000010.0000100.0000
SIEVE SIZE - mm
AMO
UN
T PA
SSIN
G
.
3" 2" 1" #10 #20 #40 #100 #2001/2" 1/4"
SIEVE SIZE AMOUNT PASSING (%)STANDARD DESIGNATION (mm/µm)
6" 1001505" 1001254" 1001003" 100752" 10050
1-1/2" 10038.11" 10025.0
3/4" 10019.01/2" 9412.51/4" 876.3
No. 4 15.2% Gravel854.75No. 10 772.00No. 20 67850No. 40 54.6% Sand58425No. 60 49250No. 100 40150No. 200 30.2% Fines30.275
Comments:
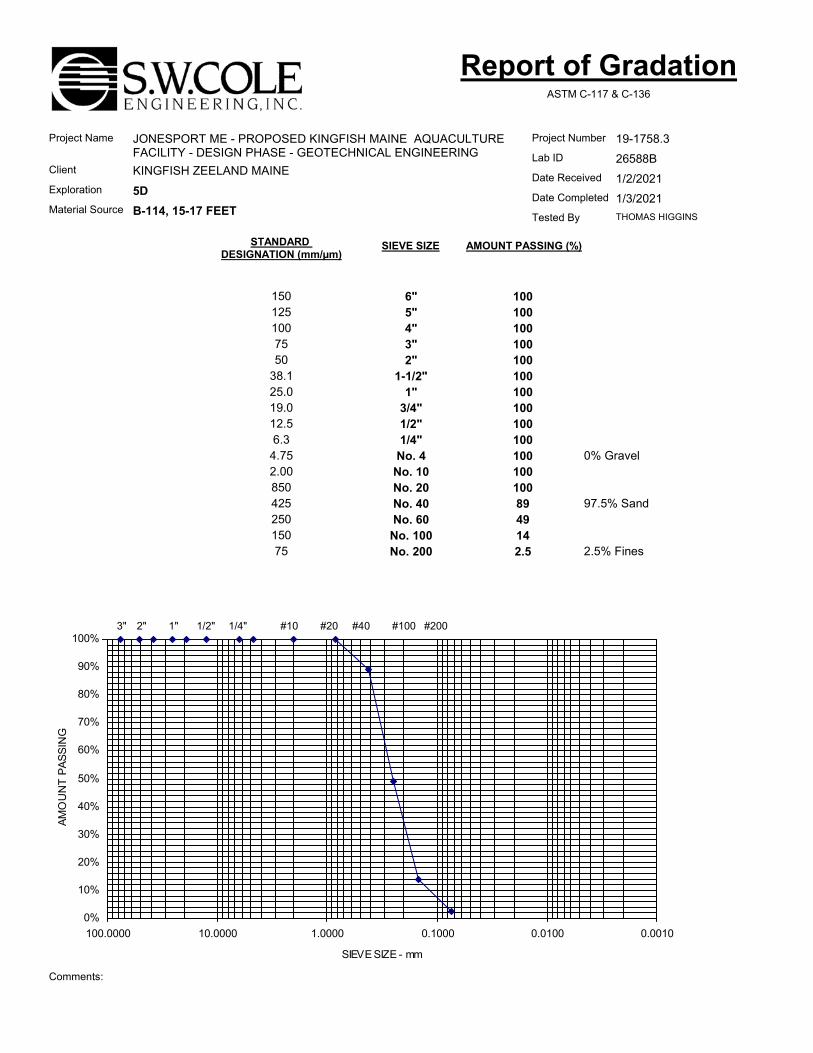
Project Name JONESPORT ME - PROPOSED KINGFISH MAINE AQUACULTURE FACILITY - DESIGN PHASE - GEOTECHNICAL ENGINEERING
Project Number 19-1758.3Lab ID 26588B
Material Source B-114, 15-17 FEETDate Completed 1/3/2021Tested By THOMAS HIGGINS
Date Received 1/2/2021
ASTM C-117 & C-136
Client KINGFISH ZEELAND MAINEExploration 5D
Report of Gradation
0%
10%
20%
30%
40%
50%
60%
70%
80%
90%
100%
0.00100.01000.10001.000010.0000100.0000
SIEVE SIZE - mm
AMO
UN
T PA
SSIN
G
3" 2" 1" #10 #20 #40 #100 #2001/2" 1/4"
SIEVE SIZE AMOUNT PASSING (%)STANDARD DESIGNATION (mm/µm)
6" 1001505" 1001254" 1001003" 100752" 10050
1-1/2" 10038.11" 10025.0
3/4" 10019.01/2" 10012.51/4" 1006.3
No. 4 0% Gravel1004.75No. 10 1002.00No. 20 100850No. 40 97.5% Sand89425No. 60 49250
No. 100 14150No. 200 2.5% Fines2.575
Comments:

APPENDIX E
Electrical Resistivity Test Results

RESISTIVITY COMPUTATION DATA SHEETWenner Configuration
Fixed Center
Project #: 19-1758.3 Date:Site: Proposed Kingfish Maine, Inc. Aquaculture Facility Mid point GPS Coordinates:
Spread No.: KFM.R1A Instrument:Orientation: 347° Magnetic
ApparentA - Spacing A/2 A+A/2 I V Resistance Resistivity %
(distance-feet) ft ft mA mV (v/I) (ohm-meters) ErrorΩ
1 0.5 1.5 2 2100 1050.0 2105 0.13 1.5 4.5 2 1312 656.0 3770 0.05 2.5 7.5 2 1084 542.0 5190 0.07 3.5 10.5 2 908 454.0 6080 0.0
10 5.0 15.0 2 734 367.0 7030 0.015 7.5 22.5 2 528 264.0 7580 0.025 12.5 37.5 26 4108 158.0 7560 0.050 25.0 75.0 33 2171 65.8 6300 0.0
100 50.0 150.0 42 1399 33.3 6370 0.0200 100.0 300.0 47 710 15.1 5800 0.0300 150.0 450.0 54 467 8.6 4970 0.0
Geomean 5,412Min 2,105Max 7,580
Median 6,080Std. Dev. 1,648
AGI SuperSting R1See Exploration Location Plan11/05/2020
0
1000
2000
3000
4000
5000
6000
7000
8000
9000
0 25 50 75 100 125 150 175 200 225 250 275 300
Ap
par
ent
Res
isti
vity
(o
hm
-met
ers)
A-spacing (feet)
Apparent ResistivityKFM.R1A
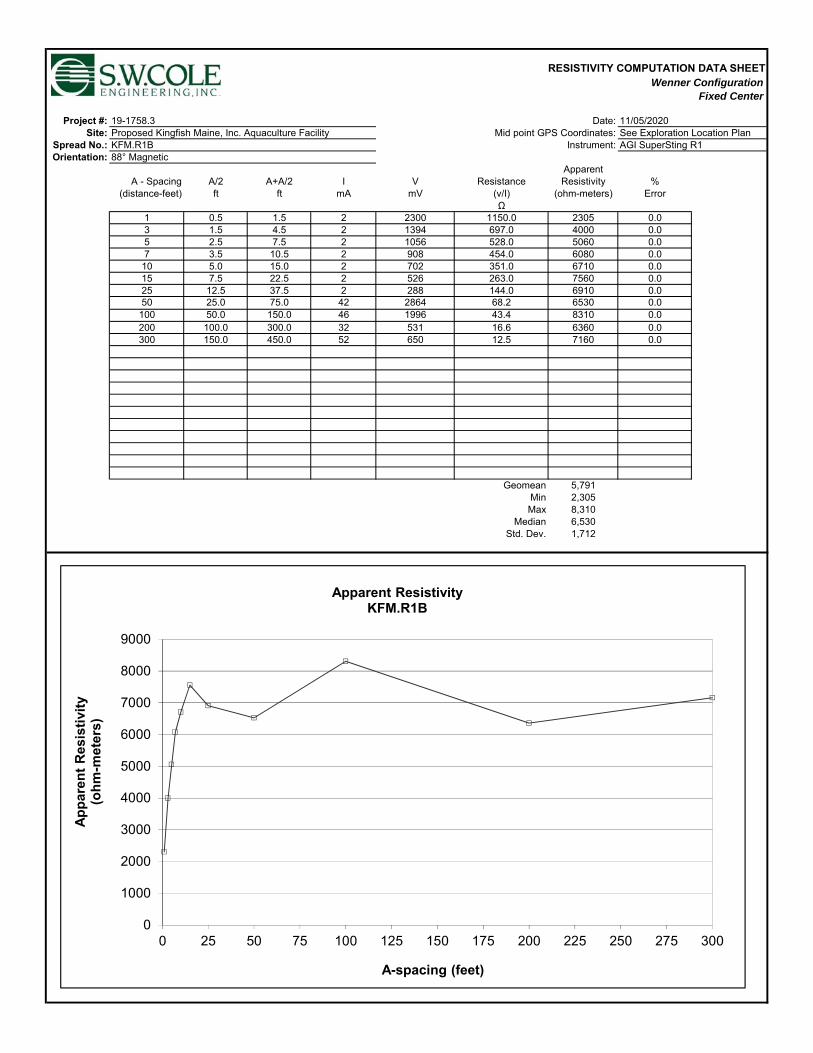
RESISTIVITY COMPUTATION DATA SHEETWenner Configuration
Fixed Center
Project #: 19-1758.3 Date:Site: Proposed Kingfish Maine, Inc. Aquaculture Facility Mid point GPS Coordinates:
Spread No.: KFM.R1B Instrument:Orientation: 88° Magnetic
ApparentA - Spacing A/2 A+A/2 I V Resistance Resistivity %
(distance-feet) ft ft mA mV (v/I) (ohm-meters) ErrorΩ
1 0.5 1.5 2 2300 1150.0 2305 0.03 1.5 4.5 2 1394 697.0 4000 0.05 2.5 7.5 2 1056 528.0 5060 0.07 3.5 10.5 2 908 454.0 6080 0.0
10 5.0 15.0 2 702 351.0 6710 0.015 7.5 22.5 2 526 263.0 7560 0.025 12.5 37.5 2 288 144.0 6910 0.050 25.0 75.0 42 2864 68.2 6530 0.0
100 50.0 150.0 46 1996 43.4 8310 0.0200 100.0 300.0 32 531 16.6 6360 0.0300 150.0 450.0 52 650 12.5 7160 0.0
Geomean 5,791Min 2,305Max 8,310
Median 6,530Std. Dev. 1,712
AGI SuperSting R1See Exploration Location Plan11/05/2020
0
1000
2000
3000
4000
5000
6000
7000
8000
9000
0 25 50 75 100 125 150 175 200 225 250 275 300
Ap
par
ent
Res
isti
vity
(o
hm
-met
ers)
A-spacing (feet)
Apparent ResistivityKFM.R1B

KINGFISH MAINE SITE LOCATION OF DEVELOPMENT APPLICATION
APPENDIX 11C Test Pit Data Report
____________________________________________________________________________________________________ 59 Union Street Unit 1 PO Box 1031 Camden, ME 04843 Ph (207) 236-4365 Fax (207) 236-3055 www.gartleydorsky.com
January 6, 2020 Megan Sorby Tom Sorby Kingfish Maine, Inc. via email: [email protected] [email protected] RE: Subsurface Wastewater Disposal Soil Investigation Project 2019-412 Kingfish Maine RAS Facility Dear Megan and Tom: We write to summarize the investigation work performed at your request at the proposed Kingfish Maine RAS facility site at 9 Dun Garvin Road, Jonesport. We have determined that suitable soils are present and will provide opportunities to site and install wastewater disposal systems. We base our understanding of the disposal requirements on current plans, and understand the final design sizing and scale will be dependent on clarification of the overall project scope. SOILS INVESTIGATION Natalie Marceau, licensed soils scientist and licensed site evaluator, screened the ~95 acre property to identify and characterize the locations of soils suitable for onsite wastewater disposal. Natalie performed onsite work to site and observe machine dug test pits at the property on December 23, 2019. Test pits, numbered from 1 to 15, were excavated and logs have been prepared to describe the conditions encountered. These logs represent moderately varying conditions, and indicate consistent and suitable soils across the portions of the site that will be available for siting disposal system(s). An exception to this condition was identified at Test Pit 10, which appears to be located where prior earthwork and filling have occurred. Owing to this disturbance, use of this location is dependent on adjacent conditions and would require further investigation to establish its suitability. The test pits were field located using submeter grade GPS mapping equipment, and have been annotated on the previously prepared base map. When the boundary survey and topographic map is generated by our surveyors, test pit location information will be added to that plan. Test pit 5 and Test pit 6 were excavated in the southerly portion of the property, and are relatively close to the adjacent Coast Guard housing facility’s well. This well is presently not registered as a public water supply, according to information provided by state Drinking Water Program staff. It had been regulated as one in the past, but its status was revised. A minimum separation of 100 feet is required from any well to any new disposal field. If the adjacent well was still a public water supply, the separation requirement would increase to 300 feet. SYSTEM SIZING REVIEW For onsite wastewater disposal requirements, domestic demand (non-process wastewater) is expected from employee use and staff housing. From information you have provided, staffing level is understood to be projected as 70 to 100 employees. Staff housing is understood to be several housing units, approximately 4 dwellings. Based on this planned level of development, the design flow prescribed by the Maine Subsurface Wastewater Disposal Rules is roughly approximated as 3,000 to 3,500 gallons per day.
Kingfish Maine Subsurface Wastewater Disposal Soil Investigation
Page 2 of 2
CONCEPTUAL DESIGN The soil profiles identified indicate that in the locations where suitable soils exist, the sizing factor for system design is predominantly 2.6 square feet per gallon per day. The sizing factor for test pit 6 is 3.3 square feet per gallon per day. System sizing varies, depending on whether the design incorporates state approved proprietary disposal units to reduce footprint. The identified sizing factors indicates a probable range of disposal field sizing of 10,000 square feet down to 3,000 square feet (exclusive of fill slopes), depending on which system type is incorporated into the design. SUMMARY We have observed soil profiles of suitable conditions and in sufficient varied locations to conclude that adequate soils exist on the property to support onsite subsurface wastewater disposal for the enumerated facility in conformance with applicable regulations. Enclosed herewith are test pit logs in the prescribed format per Maine Department of Human Services, Division of Health Engineering. Also enclosed is the referenced plan. We appreciate your interest. If you have any questions, please feel free to contact us at (207) 236-4365. Very truly yours, Gartley & Dorsky, Engineering & Surveying Inc.
William T. Lane, P.E. Natalie Marceau, S.S., S.E. Vice President Environmental Scientist cc: Sune Moeller, Kingfish Zeeland enclosures: Base Map Test Pit Logs
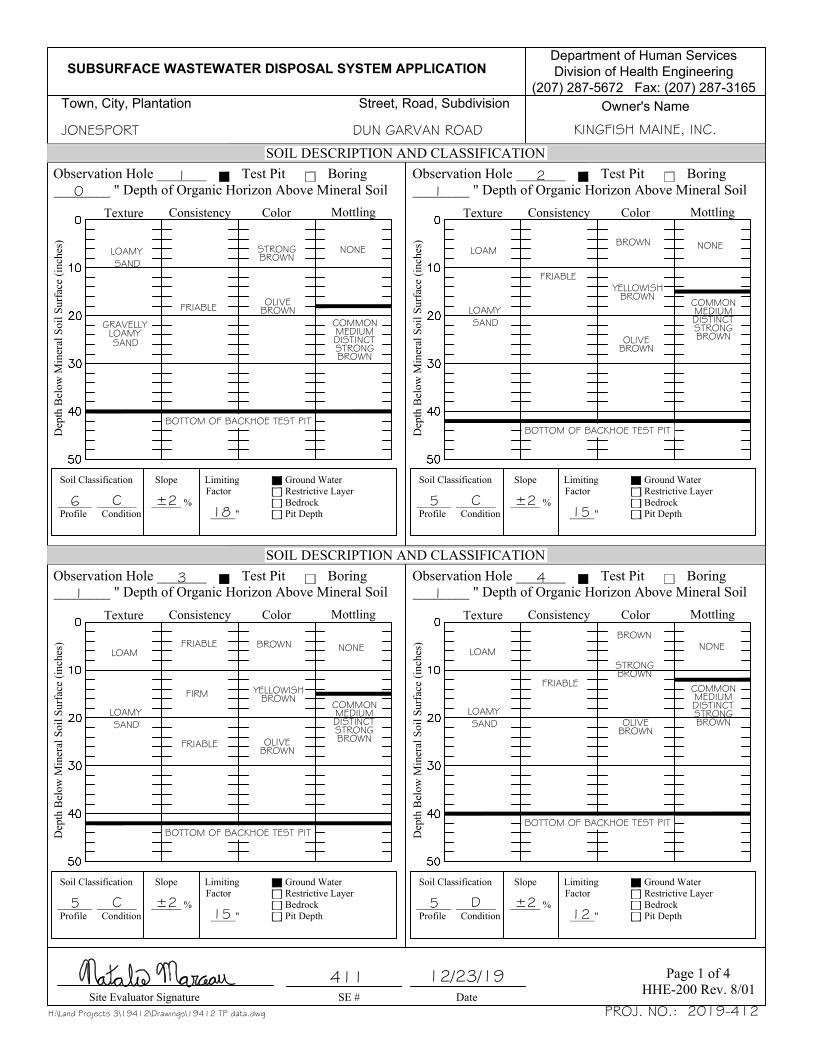
SUBSURFACE WASTEWATER DISPOSAL SYSTEM APPLICATION
Town, City, Plantation Street, Road, Subdivision
Department of Human Services
Division of Health Engineering
(207) 287-5672 Fax: (207) 287-3165
Owner's Name
SOIL DESCRIPTION AND CLASSIFICATION
Site Evaluator Signature SE # Date
SOIL DESCRIPTION AND CLASSIFICATION
Observation Hole _______ Test Pit Boring________ " Depth of Organic Horizon Above Mineral Soil
Observation Hole _______ Test Pit Boring________ " Depth of Organic Horizon Above Mineral Soil
Dep
th B
elow
Min
eral
Soi
l Sur
face
(inc
hes)
Soil Classification Slope Limiting [ ] Ground Water Factor [ ] Restrictive Layer_______ ________ ______ % [ ] Bedrock Profile Condition _____" [ ] Pit Depth
Soil Classification Slope Limiting [ ] Ground Water Factor [ ] Restrictive Layer_______ ________ ______ % [ ] Bedrock Profile Condition _____" [ ] Pit Depth
Texture MottlingConsistency Color Texture MottlingConsistency Color
Dep
th B
elow
Min
eral
Soi
l Sur
face
(inc
hes)
Observation Hole _______ Test Pit Boring________ " Depth of Organic Horizon Above Mineral Soil
Observation Hole _______ Test Pit Boring________ " Depth of Organic Horizon Above Mineral Soil
Dep
th B
elow
Min
eral
Soi
l Sur
face
(inc
hes)
Soil Classification Slope Limiting [ ] Ground Water Factor [ ] Restrictive Layer_______ ________ ______ % [ ] Bedrock Profile Condition _____" [ ] Pit Depth
10
6 C ±218
Soil Classification Slope Limiting [ ] Ground Water Factor [ ] Restrictive Layer_______ ________ ______ % [ ] Bedrock Profile Condition _____" [ ] Pit Depth
Texture MottlingConsistency Color Texture MottlingConsistency Color
Dep
th B
elow
Min
eral
Soi
l Sur
face
(inc
hes)
JONESPORT DUN GARVAN ROAD KINGFISH MAINE, INC.
12/23/19 Page 1 of 4HHE-200 Rev. 8/01
FRIABLE
BROWN
NONE
GRAVELLYLOAMYSAND
STRONGBROWN
OLIVEBROWN
FIRM
YELLOWISHBROWN
COMMONMEDIUMDISTINCTSTRONGBROWN
LOAMYSAND
BOTTOM OF BACKHOE TEST PIT
21
5 C ±215
31
5 C ±215
41
5 D ±212
411
H:\Land Projects 3\19412\Drawings\19412 TP data.dwg PROJ. NO.: 2019-412
BOTTOM OF BACKHOE TEST PIT
LOAMYSAND
LOAM
FRIABLE
BROWN
OLIVEBROWN
COMMONMEDIUMDISTINCTSTRONGBROWN
NONE
BOTTOM OF BACKHOE TEST PIT
YELLOWISHBROWN
LOAMYSAND
LOAMFRIABLE BROWN
OLIVEBROWN
COMMONMEDIUMDISTINCTSTRONGBROWN
NONE
BOTTOM OF BACKHOE TEST PIT
LOAMYSAND
LOAM
FRIABLE COMMONMEDIUMDISTINCTSTRONGBROWN
NONE
STRONGBROWN
OLIVEBROWN
FRIABLE
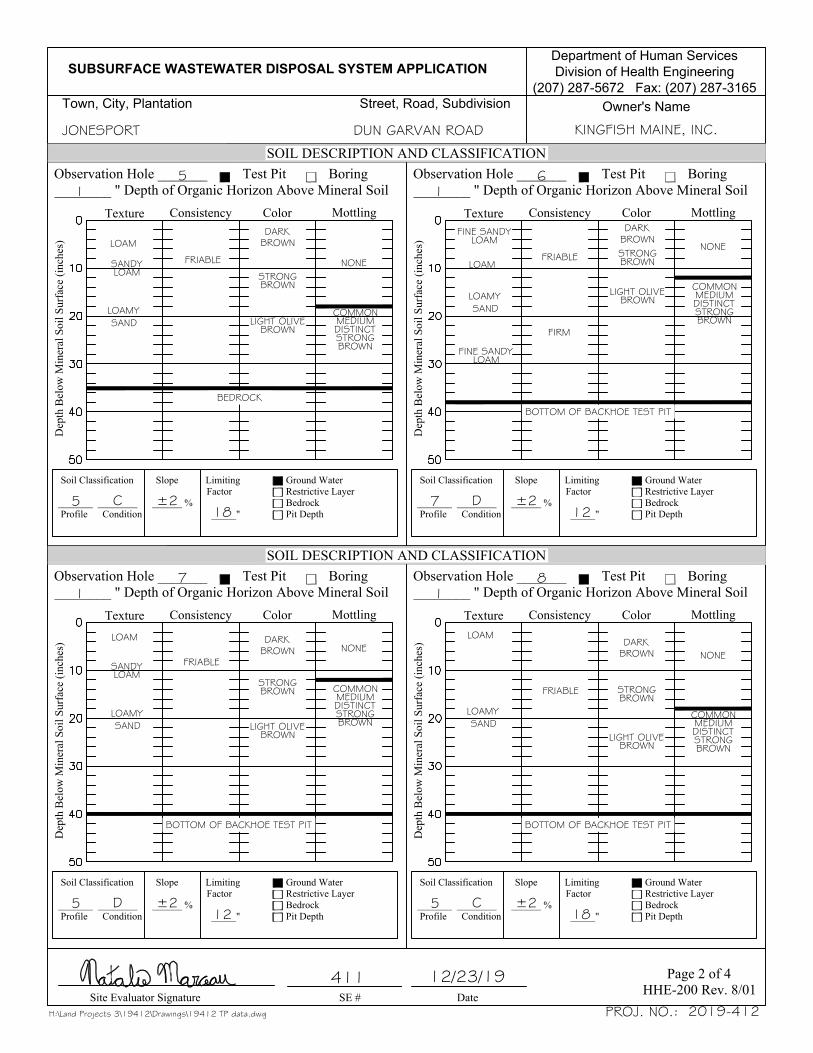
SUBSURFACE WASTEWATER DISPOSAL SYSTEM APPLICATION
Town, City, Plantation Street, Road, Subdivision
Department of Human Services
Division of Health Engineering
(207) 287-5672 Fax: (207) 287-3165
Owner's Name
SOIL DESCRIPTION AND CLASSIFICATION
Site Evaluator Signature SE # Date
SOIL DESCRIPTION AND CLASSIFICATION
Observation Hole _______ Test Pit Boring________ " Depth of Organic Horizon Above Mineral Soil
Observation Hole _______ Test Pit Boring________ " Depth of Organic Horizon Above Mineral Soil
Dep
th B
elow
Min
eral
Soi
l Sur
face
(inc
hes)
Soil Classification Slope Limiting [ ] Ground Water Factor [ ] Restrictive Layer_______ ________ ______ % [ ] Bedrock Profile Condition _____" [ ] Pit Depth
Soil Classification Slope Limiting [ ] Ground Water Factor [ ] Restrictive Layer_______ ________ ______ % [ ] Bedrock Profile Condition _____" [ ] Pit Depth
Texture MottlingConsistency Color Texture MottlingConsistency Color
Dep
th B
elow
Min
eral
Soi
l Sur
face
(inc
hes)
Observation Hole _______ Test Pit Boring________ " Depth of Organic Horizon Above Mineral Soil
Observation Hole _______ Test Pit Boring________ " Depth of Organic Horizon Above Mineral Soil
Dep
th B
elow
Min
eral
Soi
l Sur
face
(inc
hes)
Soil Classification Slope Limiting [ ] Ground Water Factor [ ] Restrictive Layer_______ ________ ______ % [ ] Bedrock Profile Condition _____" [ ] Pit Depth
51
5 C ±218
Soil Classification Slope Limiting [ ] Ground Water Factor [ ] Restrictive Layer_______ ________ ______ % [ ] Bedrock Profile Condition _____" [ ] Pit Depth
Texture MottlingConsistency Color Texture MottlingConsistency Color
Dep
th B
elow
Min
eral
Soi
l Sur
face
(inc
hes)
JONESPORT DUN GARVAN ROAD KINGFISH MAINE, INC.
12/23/19 Page 2 of 4HHE-200 Rev. 8/01
FRIABLE
LOAM
SANDYLOAM
COMMONMEDIUMDISTINCTSTRONGBROWN
LOAMYSAND
61
7 D ±212
71
5 D ±212
81
5 C ±218
411
H:\Land Projects 3\19412\Drawings\19412 TP data.dwg PROJ. NO.: 2019-412
BOTTOM OF BACKHOE TEST PITBEDROCK
DARKBROWN
NONESTRONGBROWN
LIGHT OLIVEBROWN
FINE SANDYLOAM
LOAMYSAND
LOAM
FINE SANDYLOAM
COMMONMEDIUMDISTINCTSTRONGBROWN
NONE
DARKBROWNSTRONGBROWN
LIGHT OLIVEBROWN
FRIABLE
FIRM
BOTTOM OF BACKHOE TEST PIT
DARKBROWN
STRONGBROWN
LIGHT OLIVEBROWN
SANDYLOAM
LOAMYSAND
LOAM
FRIABLE
COMMONMEDIUMDISTINCTSTRONGBROWN
NONE
BOTTOM OF BACKHOE TEST PIT
LOAMYSAND
LOAMDARK
BROWN
STRONGBROWN
LIGHT OLIVEBROWN
FRIABLE
COMMONMEDIUMDISTINCTSTRONGBROWN
NONE
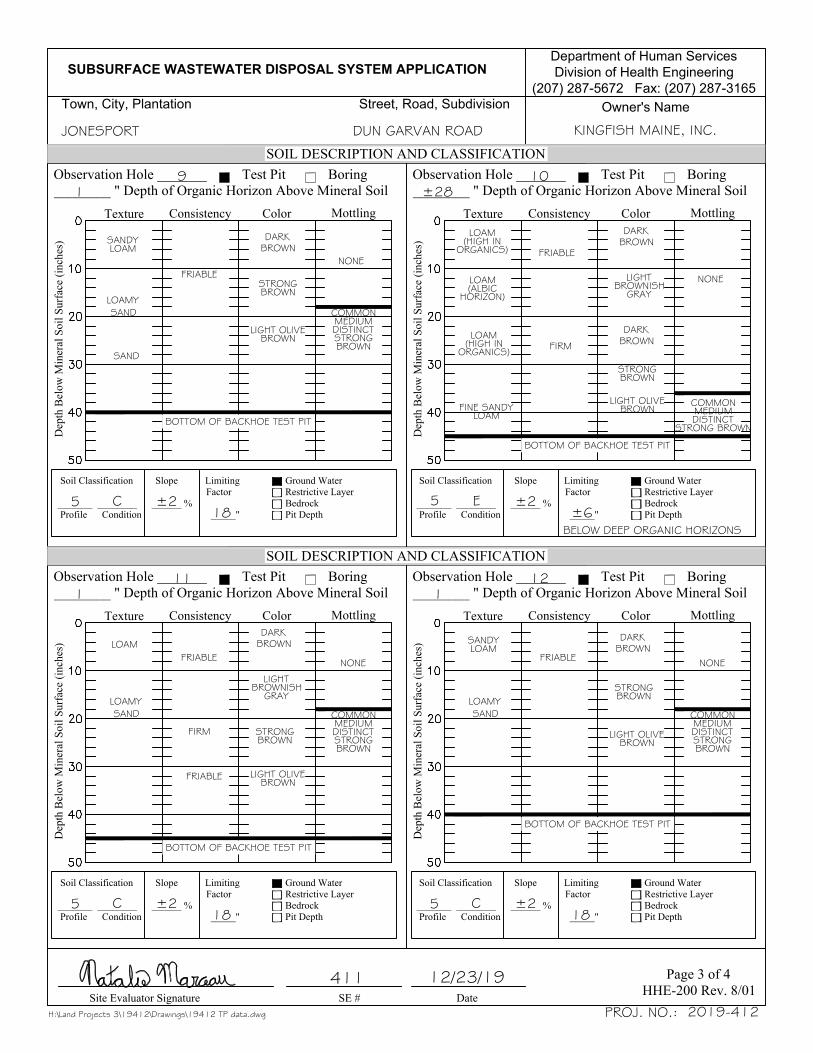
SUBSURFACE WASTEWATER DISPOSAL SYSTEM APPLICATION
Town, City, Plantation Street, Road, Subdivision
Department of Human Services
Division of Health Engineering
(207) 287-5672 Fax: (207) 287-3165
Owner's Name
SOIL DESCRIPTION AND CLASSIFICATION
Site Evaluator Signature SE # Date
SOIL DESCRIPTION AND CLASSIFICATION
Observation Hole _______ Test Pit Boring________ " Depth of Organic Horizon Above Mineral Soil
Observation Hole _______ Test Pit Boring________ " Depth of Organic Horizon Above Mineral Soil
Dep
th B
elow
Min
eral
Soi
l Sur
face
(inc
hes)
Soil Classification Slope Limiting [ ] Ground Water Factor [ ] Restrictive Layer_______ ________ ______ % [ ] Bedrock Profile Condition _____" [ ] Pit Depth
Soil Classification Slope Limiting [ ] Ground Water Factor [ ] Restrictive Layer_______ ________ ______ % [ ] Bedrock Profile Condition _____" [ ] Pit Depth
Texture MottlingConsistency Color Texture MottlingConsistency Color
Dep
th B
elow
Min
eral
Soi
l Sur
face
(inc
hes)
Observation Hole _______ Test Pit Boring________ " Depth of Organic Horizon Above Mineral Soil
Observation Hole _______ Test Pit Boring________ " Depth of Organic Horizon Above Mineral Soil
Dep
th B
elow
Min
eral
Soi
l Sur
face
(inc
hes)
Soil Classification Slope Limiting [ ] Ground Water Factor [ ] Restrictive Layer_______ ________ ______ % [ ] Bedrock Profile Condition _____" [ ] Pit Depth
91
5 C ±218
Soil Classification Slope Limiting [ ] Ground Water Factor [ ] Restrictive Layer_______ ________ ______ % [ ] Bedrock Profile Condition _____" [ ] Pit Depth
Texture MottlingConsistency Color Texture MottlingConsistency Color
Dep
th B
elow
Min
eral
Soi
l Sur
face
(inc
hes)
JONESPORT DUN GARVAN ROAD KINGFISH MAINE, INC.
12/23/19 Page 3 of 4HHE-200 Rev. 8/01
LOAMYSAND
SAND
10±28
±2±6
111
5 C ±218
121
5 C ±218
411
H:\Land Projects 3\19412\Drawings\19412 TP data.dwg PROJ. NO.: 2019-412
BOTTOM OF BACKHOE TEST PIT
SANDYLOAM
DARKBROWN
STRONGBROWN
LIGHT OLIVEBROWN
FRIABLE
COMMONMEDIUMDISTINCTSTRONGBROWN
NONE
BOTTOM OF BACKHOE TEST PIT
DARKBROWN
FRIABLE
LOAM(HIGH IN
ORGANICS)
LIGHTBROWNISH
GRAY
DARKBROWNLOAM
(HIGH INORGANICS)
LOAM(ALBIC
HORIZON)
STRONGBROWN
LIGHT OLIVEBROWN
FIRM
COMMONMEDIUMDISTINCT
STRONG BROWN
NONE
FINE SANDYLOAM
5 E
BELOW DEEP ORGANIC HORIZONS
BOTTOM OF BACKHOE TEST PIT
BOTTOM OF BACKHOE TEST PIT
FRIABLE
FIRM
DARKBROWN
LIGHTBROWNISH
GRAY
STRONGBROWN
LIGHT OLIVEBROWN
COMMONMEDIUMDISTINCTSTRONGBROWN
LOAMYSAND
LOAM
FRIABLE
NONE FRIABLE
DARKBROWN
STRONGBROWN
LIGHT OLIVEBROWN
COMMONMEDIUMDISTINCTSTRONGBROWN
LOAMYSAND
SANDYLOAM
NONE
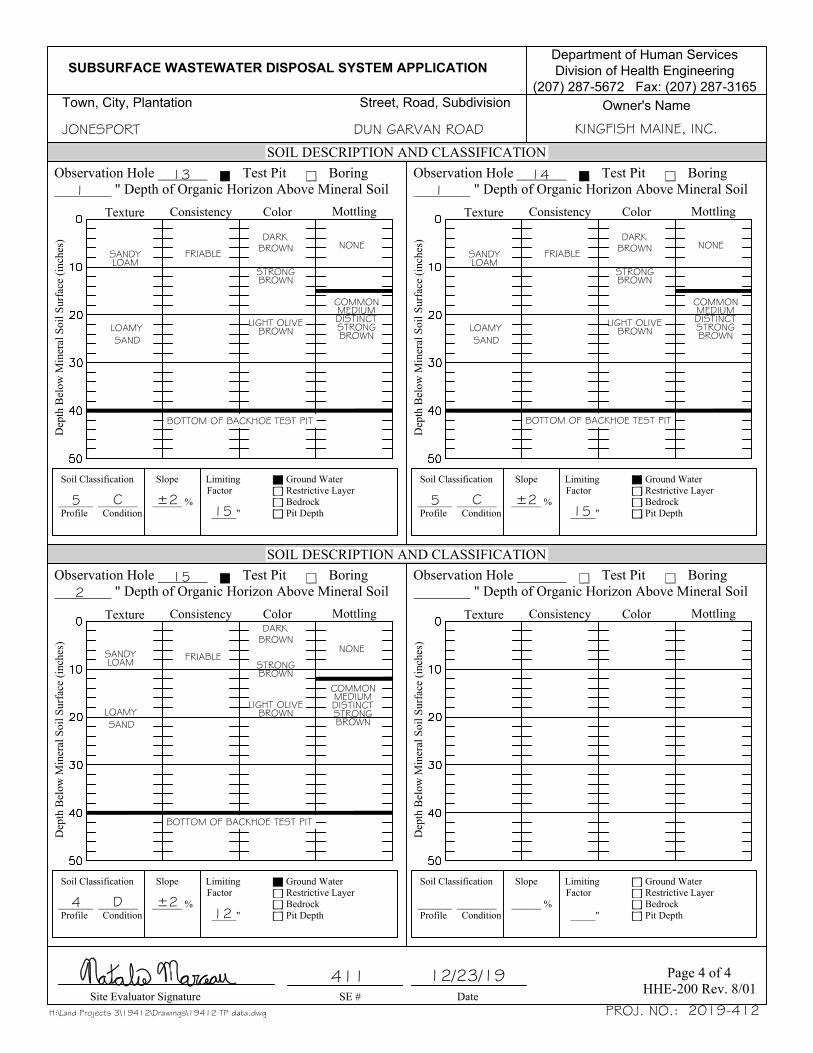
SUBSURFACE WASTEWATER DISPOSAL SYSTEM APPLICATION
Town, City, Plantation Street, Road, Subdivision
Department of Human Services
Division of Health Engineering
(207) 287-5672 Fax: (207) 287-3165
Owner's Name
SOIL DESCRIPTION AND CLASSIFICATION
Site Evaluator Signature SE # Date
SOIL DESCRIPTION AND CLASSIFICATION
Observation Hole _______ Test Pit Boring________ " Depth of Organic Horizon Above Mineral Soil
Observation Hole _______ Test Pit Boring________ " Depth of Organic Horizon Above Mineral Soil
Dep
th B
elow
Min
eral
Soi
l Sur
face
(inc
hes)
Soil Classification Slope Limiting [ ] Ground Water Factor [ ] Restrictive Layer_______ ________ ______ % [ ] Bedrock Profile Condition _____" [ ] Pit Depth
Soil Classification Slope Limiting [ ] Ground Water Factor [ ] Restrictive Layer_______ ________ ______ % [ ] Bedrock Profile Condition _____" [ ] Pit Depth
Texture MottlingConsistency Color Texture MottlingConsistency Color
Dep
th B
elow
Min
eral
Soi
l Sur
face
(inc
hes)
Observation Hole _______ Test Pit Boring________ " Depth of Organic Horizon Above Mineral Soil
Observation Hole _______ Test Pit Boring________ " Depth of Organic Horizon Above Mineral Soil
Dep
th B
elow
Min
eral
Soi
l Sur
face
(inc
hes)
Soil Classification Slope Limiting [ ] Ground Water Factor [ ] Restrictive Layer_______ ________ ______ % [ ] Bedrock Profile Condition _____" [ ] Pit Depth
131
5 C ±215
Soil Classification Slope Limiting [ ] Ground Water Factor [ ] Restrictive Layer_______ ________ ______ % [ ] Bedrock Profile Condition _____" [ ] Pit Depth
Texture MottlingConsistency Color Texture MottlingConsistency Color
Dep
th B
elow
Min
eral
Soi
l Sur
face
(inc
hes)
JONESPORT DUN GARVAN ROAD KINGFISH MAINE, INC.
12/23/19 Page 4 of 4HHE-200 Rev. 8/01
141
5 C ±215
152
4 D ±212
411
H:\Land Projects 3\19412\Drawings\19412 TP data.dwg PROJ. NO.: 2019-412
BOTTOM OF BACKHOE TEST PIT
SANDYLOAM
FRIABLE
LOAMYSAND
DARKBROWN
STRONGBROWN
LIGHT OLIVEBROWN
BOTTOM OF BACKHOE TEST PIT
NONE
COMMONMEDIUMDISTINCTSTRONGBROWN
SANDYLOAM
FRIABLE
LOAMYSAND
DARKBROWN
STRONGBROWN
LIGHT OLIVEBROWN
NONE
COMMONMEDIUMDISTINCTSTRONGBROWN
BOTTOM OF BACKHOE TEST PIT
SANDYLOAM
LOAMYSAND
FRIABLE
DARKBROWN
STRONGBROWN
LIGHT OLIVEBROWN
NONE
COMMONMEDIUMDISTINCTSTRONGBROWN