Embed Size (px)
Citation preview

SECTION 1
Cardiac
IntroductionApproach to Cardiac Imaging 4
Function and Coronary Artery DiseaseLeft Ventricular Function 6
Myocardial Infarction and Ischemia 10
Myocardial Viability 16
Right-to-Left Shunt 20
Cardiac
4
Approach to Cardiac Imaging
Nuclear Cardiac Imaging
Nuclear cardiology encompasses studies that diagnose and
risk stratify coronary artery disease, myocardial infarction andhibernation, left ventricular function, and detection of right-
to-left shunt.
Myocardial perfusion imaging evaluates myocardial perfusion
at rest and stress, diagnosing regional or global ischemia andmyocardial infarction. In 1 meta-analysis of ~ 39,000 patients,patients with normal or low-risk patterns (e.g., mild reversibleperfusion abnormalities in 1 vascular territory) on myocardialperfusion imaging had a 0.6% rate of cardiac death ormyocardial infarction per year. In patients with moderate orsevere reversible perfusion defects, the cardiac event rate was6% per year, a much higher rate compared with low-risk or
normal scans.
Myocardial perfusion imaging provides risk stratification in
symptomatic and asymptomatic patients. Patients at high riskfor coronary artery disease include those with diabetesmellitus, hyperlipidemia, hypertension, and a family history ofcoronary artery disease. If patients with risk factors areasymptomatic, myocardial perfusion imaging providesadditional clinical information predicting cardiac events. Forexample, in asymptomatic diabetic patients with moderate orlarge perfusion defects, the event rate is 2.4% per yearcompared with a 0.4% per year event rate in patients with
mildly abnormal or normal perfusion scans.
Evidence of severe disease on myocardial perfusion imaging
correlates with an annual death rate of 2.9% to 4.2%.Evidence of high-risk disease includes 2-vessel reversibleperfusion defects, transient ischemic dilatation (signifyingglobal subendocardial ischemia), and lung uptake on Tl-201
studies.
Stress protocols with myocardial perfusion imaging are
tailored to the clinical situation. Exercise stress protocolutilizing the modified Bruce protocol is used when possible.Note that with myocardial perfusion imaging, exercise stresstests are less valuable in patients with left bundle branchblock, as this can cause a false-positive reversible perfusiondefect in the septum. Pharmacologic stress protocols can beutilized in those patients unable to exercise. Vasodilator stressagents such as adenosine, regadenoson, and dipyridamole aremost commonly used, followed by dobutamine if vasodilator
stress is contraindicated.
Assessment of myocardial viability can be performed using Tl-
201 and F-18 FDG PET/CT. In patients found to haveunderperfused yet viable or hibernating myocardium, regionalwall motion is expected to improve after revascularization.One meta-analysis of ~ 3,000 patients with viable segmentsshowed a 79% reduction in annual mortality after
revascularization.
Nuclear cardiac imaging also has a role in risk stratification and
management of patients with heart failure. Left ventricularfunction can be assessed using gated acquisitions of leftventricular function on myocardial perfusion imaging or withTc-99m-labeled red blood cells (also called MUGA). Leftventricular ejection fractions using MUGA have been shown tohave less inter- and intraobserver variability than othermodalities, making it especially useful in serial determinations
in patients undergoing chemotherapy.
Finally, when anatomic evaluation fails to diagnose a
suspected right-to-left cardiac shunt, an indirect method of
diagnosis can be obtained using nuclear medicine. Ifextrapulmonary localization of the pulmonary perfusion tracer
Tc-99m MAA occurs, a right-to-left cardiac shunt is diagnosed.
Imaging Protocols
Myocardial Ischemia and InfarctionCardiac radiotracers are taken up by the myocardium in
proportion to cardiac blood flow. Images are obtained at restand stress, then compared. Perfusion defects at stress thatare not present at rest constitute inducible ischemia. Fixedperfusion defects at stress and rest signify myocardial
infarction &/or myocardial hibernation.
Imaging protocols include single- and dual-isotope studies
with Tc-99m-based perfusion agents &/or Tl-201 or PET/CTperfusion studies using Rb-82. Imaging with single-photonradiopharmaceuticals and gamma cameras is much moreavailable clinically and less expensive than PET/CT myocardialperfusion imaging. In general, imaging with Tl-201 is used lesscommonly due to poorer imaging characteristics anddosimetry considerations as compared to Tc-99m-based
radiopharmaceuticals.
Myocardial ViabilityMyocardial viability can be assessed though Tl-201 rest-
redistribution studies and F-18 FDG PET/CT. Tl-201 employstraditional gamma camera technology, 1 dose ofradiopharmaceutical, and requires limited patient preparation.F-18 FDG PET/CT imaging of anaerobic glycolysis inhibernating, nonperfused myocardium is common, butrequires recent meal and endogenous insulin response orexogenous insulin administration prior to F-18 FDGadministration and PET/CT imaging. In addition, the F-18 FDGPET/CT data must be compared with a resting nuclearmyocardial perfusion study, either a Tc-99m-based perfusion
agent or Tl-201.
LV FunctionLeft ventricular function can be assessed with left
ventriculography using Tc-99m-labeled red blood cells(traditionally called a MUGA scan) or gated myocardialperfusion scintigraphy, usually performed to diagnose cardiacischemia. End-diastolic and end-systolic counts or volumes areutilized to calculate the left ventricular ejection fraction. Visualanalysis of both types of studies allows for visual andquantitative analysis of regional and global left ventricular wall
motion.
Right-to-Left Cardiac ShuntTo diagnose a suspected right-to-left cardiac shunt, a Tc-99m
MAA pulmonary perfusion study is performed, with anteriorand posterior images over the head, chest, and abdomen. Incases of right-to-left shunt, Tc-99m MAA will be present in the
brain, lungs, and kidneys.
Practice Guidelines
The American Society of Nuclear Cardiology publishes clinical
guidelines and quality standards for appropriate use, imaging,and reporting of nuclear cardiology studies. Content can be
found online at www.asnc.org.
Selected References
1. Society of Nuclear Medicine and Molecular Imaging. ACR-SNMMI-SPRPractice Guideline for the Performance of Cardiac Scintigraphy.https://www.snmmi.org/ClinicalPractice/content.aspx?ItemNumber=6414#Cardio. Published October 1, 2009. Accessed July 31, 2015

Cardiac
5
Approach to Cardiac Imaging
(Left) This myocardialperfusion scan shows short-axis images of the leftventricle at stress (top) andrest (bottom). Note decreasedactivity in the membranousseptum st, a normal finding.(Right) This graphic shows ashort-axis bull's-eye of the leftventricle depicting the 17segments and the associatedvascular supply. Thesesegments are used whenreporting nuclear cardiologystudies.
(Left) Left anterior obliqueraw image from a myocardialperfusion scan shows aphotopenic defect around theheart st, corresponding to apericardial effusion. (Right)Short-axis myocardialperfusion scan at stress (top)and rest (bottom) shows the"hurricane" sign st, anartifact caused by patientmotion during the rest imageacquisition.
(Left) Anterior and posteriorTc-99m MAA shunt studyshows brain st and kidney uptake, signifying a right-to-left cardiac shunt. (Right)Vertical long-axis F-18 FDGPET cardiac viability studyshows uptake st in a segmentof hibernating myocardium on perfusion imaging.Revascularization of thisregion should improvemyocardial contractility.
Cardiac
6
Left Ventricular Function
KEY FACTS
IMAGING
• Multiple-gated cardiac blood pool acquisition (MUGA)
○ Low inter- and intraobserver variability (< 5%)
○ High reproducibility
• Radiopharmaceutical
○ 15-25 mCi (555-925 MBq) Tc-99m pertechnetateautologous labeled red blood cells (RBCs) IV
○ In vitro RBC labeling: Highest binding of radionuclide (~98%)
○ In vivo RBC labeling: > 80% binding
○ ROIs drawn around left ventricle
– End systole, end diastole, and background
○ Heart must be in regular rhythm for optimal imaging
○ If background drawn over spleen or aorta, ejectionfraction (EF) spuriously high
○ If background drawn over stomach or outside body, EFspuriously low
○ High unbound Tc-99m pertechnetate with recenttransfusion, renal failure, heparin therapy, somechemotherapy, other medications
DIAGNOSTIC CHECKLIST
• Evaluate raw images (cine) for study quality
○ Counts, labeling, gating, views
• Compare qualitative estimation of left ventricular ejectionfraction with quantitative calculation
• Comparison with previous studies important: Regions ofinterest should be similar
• Evaluate
○ Pericardial silhouette
○ Chamber sizes
○ Hypo/akinesis
○ Filling defects
○ Aneurysm
○ Ejection fraction
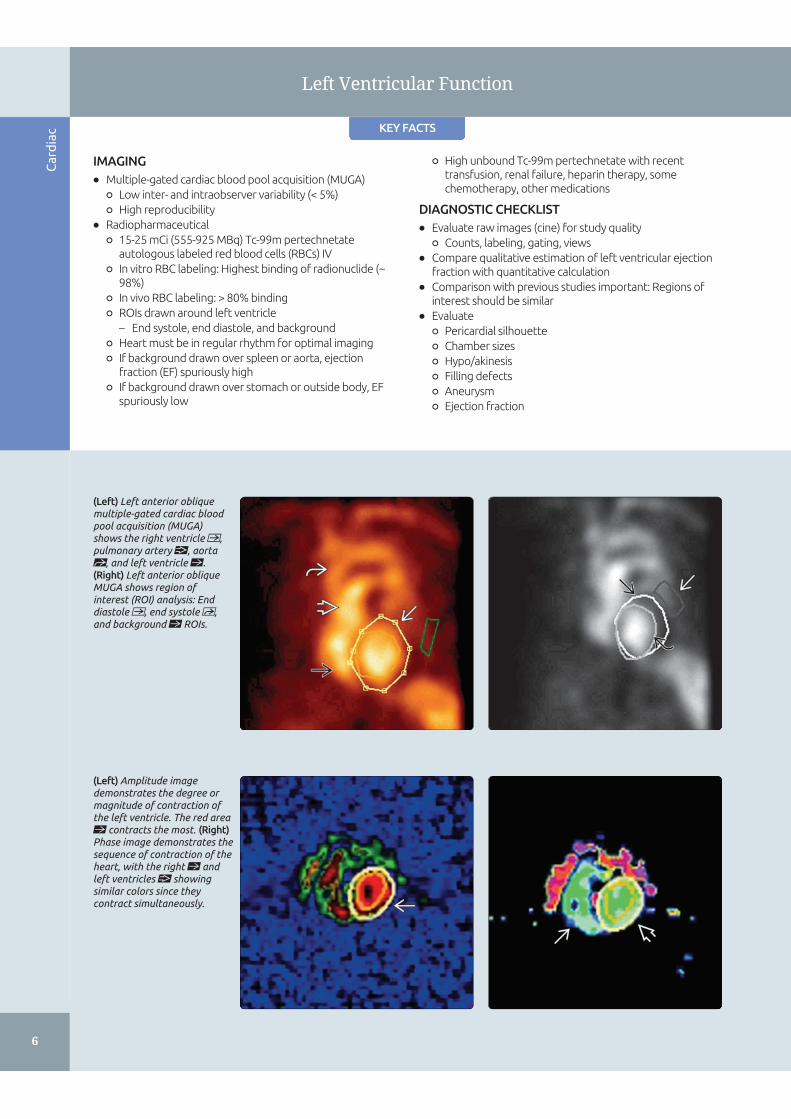
(Left) Left anterior obliquemultiple-gated cardiac bloodpool acquisition (MUGA)shows the right ventricle ,pulmonary artery , aortast, and left ventricle st.(Right) Left anterior obliqueMUGA shows region ofinterest (ROI) analysis: Enddiastole , end systole ,and background st ROIs.
(Left) Amplitude imagedemonstrates the degree ormagnitude of contraction ofthe left ventricle. The red areast contracts the most. (Right)Phase image demonstrates thesequence of contraction of theheart, with the right st andleft ventricles showingsimilar colors since theycontract simultaneously.
Cardiac
7
Left Ventricular Function
IMAGING
Imaging Recommendations
• Best imaging tool
○ Multiple-gated cardiac blood pool acquisition (MUGA)
○ Tc-99m labeled autologous red blood cells (RBCs)
– Images obtained over heart
– Analysis of counts at end diastole and end systole →left ventricular (LV) ejection fraction (EF)
○ Low inter- and intraobserver variability (< 5%)
○ High reproducibility
○ Excellent correlation with cardiac catheterizationventriculography (r = 0.94)
• Protocol advice
○ Patient prep: None
○ Radiopharmaceutical: 15-25 mCi (555-925 MBq) Tc-99mpertechnetate autologous labeled RBCs IV
– In vitro RBC labeling
□ Highest binding of radionuclide (~ 98%)
□ Safety issues with reinjection of blood products
□ Contraindicated if heparin allergy
– In vivo RBC labeling: > 80% binding
– High unbound Tc-99m pertechnetate levels withrecent transfusion, renal failure, heparin therapy,some chemotherapy, other medications
○ Dosimetry
– Organ receiving largest radiation dose: Heart
○ Image acquisition
– Patient supine
– ECG gating
□ 16-32 frames per R-R interval
– Planar images: LEAP/high-resolution collimator
– Matrix: 64 x 64
– Each image acquired for 300K counts or 5 min
– Anterior view: 45° shallower than best septal LAO
□ Shows anterolateral and apical LV; right atrium andright ventricle
– Best septal view LAO: Angle chosen that best showsseptum between right and left ventricles
□ Shows septal, anterolateral, posterolateral LV
– Left lateral/LPO: 45° greater than best septal LAO
□ Shows inferior, apical, anterolateral LV
– Caudal angulation ± slanted collimator: May helpseparate ventricular from atrial blood pool
– Image processing
□ Evaluate raw images (cine) for study quality:Counts, labeling, gating, views
○ Region of interest (ROI) analysis
– ROIs drawn around LV: End systole, end diastole, andbackground
□ Manual, automatic, or semiautomatic ROIplacement available
□ Avoid drawing background over spleen or aorta; EFwill be spuriously high
□ Avoid drawing background over empty stomach oroutside body; EF will be spuriously low
□ Background ~ 1/3 size of end diastole
Artifacts and Quality Control
• Heart must be in regular rhythm for optimal imaging
○ Irregular heartbeats rejected
– Optimal: ≤ 10% irregular beats
– Ejection fraction results less reliable if ≥ 30% irregularbeats
DIFFERENTIAL DIAGNOSIS
Ischemic Dilated Cardiomyopathy
• Cardiovascular
○ Regional wall motion abnormalities in coronary arterydistribution most common
Nonischemic Dilated Cardiomyopathy
• Toxic cardiomyopathy induced by chemotherapy
○ Serial LVEFs most common MUGA indication
• Also: Stress-induced, infectious, genetic, peripartum,sarcoid, autoimmune, cirrhosis, end-stage renal disease
DIAGNOSTIC CHECKLIST
Image Interpretation Pearls
• Compare qualitative estimation of LVEF with quantitativecalculation
○ Reprocessing may be necessary if discrepancy
• Comparison with previous studies important: ROIs shouldbe similar
○ Reprocessing may be necessary if discrepancy
Reporting Tips
• Cardiac morphology
○ Chamber sizes
○ Ventricular wall thickness
○ Pericardial silhouette
○ Filling defects
• Systolic function
○ Qualitative
– Global LV function
– Regional LV function
□ Hypo/akinesis, aneurysm
• Ejection fraction
○ Qualitative: Estimate from cine loop
○ Quantitative: ROI analysis of counts and calculation
– LVEF (%): [End diastolic counts - background counts] -[end systolic counts - background counts] / [enddiastolic counts - background counts] x 100
• Phase image: Shows sequence of contraction of atria andventricles
• Amplitude image: Shows magnitude of contraction of atriaand ventricles
• Right ventricular EF
○ Qualitative and quantitative analysis as with LVEF
SELECTED REFERENCES
1. American College of Radiology. ACR–SNM–SPR Practice Guideline for thePerformance of Cardiac Scintigraphy,[Resolution 14.[http://snmmi.files.cms-plus.com/docs/Cardiac_Scintigraphy_1382731812393_3.pdf.[Revised 2009.Accessed July 9, 2014

Cardiac
8
Left Ventricular Function
(Left) Anterior MUGA showsright atrium , right ventricle, anterolateral left ventriclest, and left ventricular apex. (Right) Anterior graphic ofthe heart shows right atriumst, right ventricle ,anterolateral left ventricle st,and left ventricular apex .
(Left) Left anterior obliqueMUGA shows septum st,anterolateral left ventricle st,and posterolateral leftventricle . Also called thebest septal view, this image iscommonly obtained at 45°.Caudal tilt can also assist inobtaining best view of septum.(Right) Left anterior obliquegraphic of the heart showsright ventricle , septum st,and left ventricle st.
(Left) Left posterior obliqueMUGA shows inferior ,apical , and anterolateralst left ventricle. Note splenicst activity, normal physiologicuptake on Tc-99mpertechnetate RBC studies.(Right) Left posterior obliquegraphic of the heart showsinferior , apical st, andanterolateral st left ventricle.

Cardiac
9
Left Ventricular Function
(Left) Anterior MUGA shows alarge photopenic defect stsurrounding the heart. (Right)Left anterior oblique MUGA inthe same patient shows thephotopenic defect st aroundthe heart, a large pericardialeffusion.
(Left) Left anterior obliqueMUGA shows a filling defectst in the left ventricular apex.The differential diagnosisincludes mass lesions andthrombus. Note that medicaldevices such as pacemakersand postmastectomy tissueexpanders can causeartifactual filling defects onMUGA; however, these tend tobe in different locationsdepending on the angle ofimaging. (Right) This MUGAshows dilated left ventricle and LV dyskinesis st apparenton end-systolic images, a smallLV aneurysm.
(Left) This MUGAdemonstrates dilated leftventricle and globalhypokinesis, evidenced byminimal excursion betweenend diastole st and endsystole in a patient withchemotherapy-inducedcardiomyopathy. (Right) ThisMUGA shows severebiventricular enlargement stin a patient with viral-inducedcardiomyopathy.
Cardiac
10
Myocardial Infarction and Ischemia
KEY FACTS
DIAGNOSTIC CHECKLIST
• Raw images
○ May identify artifacts, extracardiac tracer uptake (cancer,infection, bowel), infiltration
• Study quality
○ Comment if excessive motion, poor radiotraceruptake/infiltration, technical error
• Artifacts
○ Motion, scatter, reconstruction, attenuation
• Adequacy of stress modality
○ Exercise or pharmacologic
• Perfusion images: Qualitative analysis
○ LV chamber size: Normal vs. dilated
○ 17 segment model: Describe stress/rest perfusion
○ Transient ischemic dilatation (TID): Dropout ofendocardial border on stress
• Perfusion images: Quantitative analysis
○ 17 segment model: Each segment scored on 5-pt scale
○ Summed difference score: < 4 = normal; 4-8 = mildlyabnormal; 9-13 = moderately abnormal; > 13 = severelyabnormal
○ TID ratio: 1.12-1.36 positive for TID
• Gated images: Ejection fraction and wall motion
○ Brightening and endocardial excursion = normal
○ Hypokinesis/akinesis if photopenia, lack of endocardialexcursion
○ Lower limits of normal EF for MPI: 45%
○ EF overestimated if small heart size
• Conclusion
○ Positive or negative for inducible ischemia
○ Positive or negative for myocardial infarction (± peri-infarct ischemia)
– Consider possibility of hibernating myocardium, needfor viability study
○ LV function: EF and wall motion
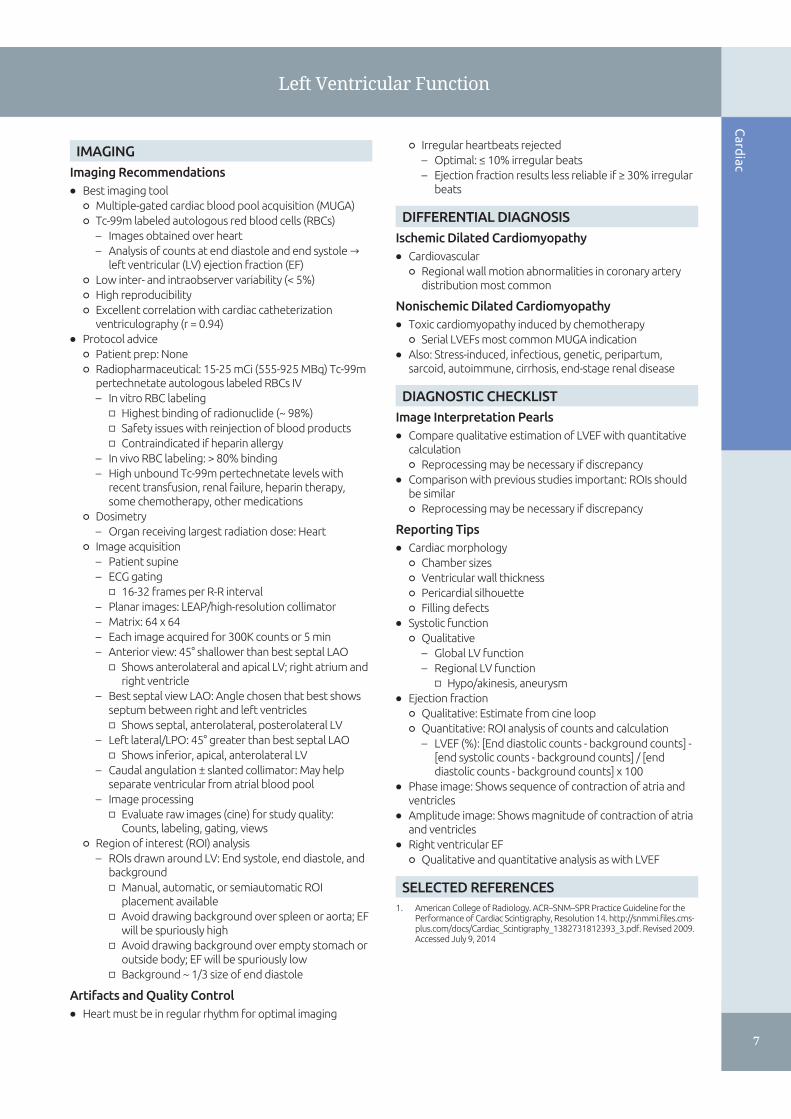
(Left) Short axis view of theleft ventricle on CT showsvascular territories supplyingthe myocardium. The leftanterior descending arterysupplies the anterior andseptal walls . The leftcircumflex artery supplies thelateral wall . The rightcoronary artery supplies theinferior and inferoseptal walls. (Right) Drawing of shortaxis 17-segment model showsbull's-eye view of the heart forquantitative analysis.
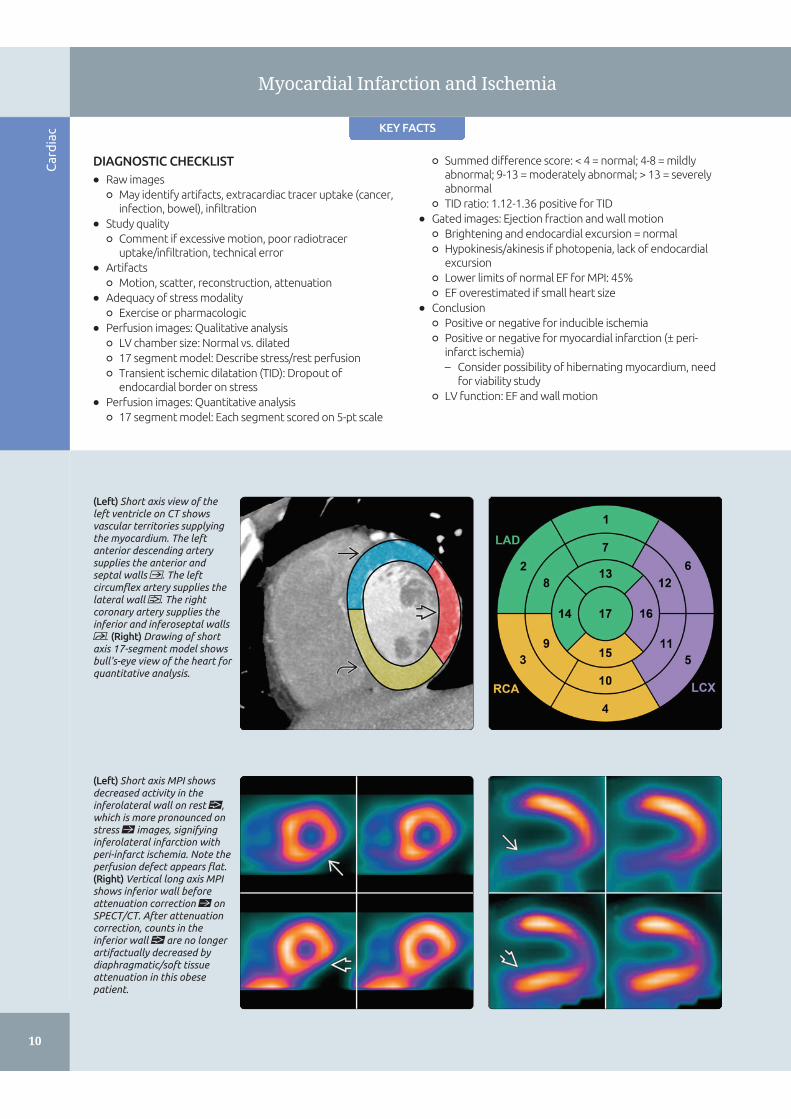
(Left) Short axis MPI showsdecreased activity in theinferolateral wall on rest ,which is more pronounced onstress st images, signifyinginferolateral infarction withperi-infarct ischemia. Note theperfusion defect appears flat.(Right) Vertical long axis MPIshows inferior wall beforeattenuation correction st onSPECT/CT. After attenuationcorrection, counts in theinferior wall are no longerartifactually decreased bydiaphragmatic/soft tissueattenuation in this obesepatient.

Cardiac
11
Myocardial Infarction and Ischemia
IMAGING
General Features
• Best diagnostic clue
○ Myocardial perfusion imaging (MPI)
– Usually Tc-99m-based perfusion agent that localizes tomyocardium
□ Radiotracer injected at rest, then image
□ Radiotracer injected at stress, then image
□ Rest and stress images compared
– Myocardial ischemia: Perfusion defect evident onstress images, normal perfusion on rest images
– Acute myocardial infarction (AMI): Perfusion defect onMPI with injection within 2 hrs of pain episode
– Chronic myocardial infarction: Fixed perfusion defecton rest and stress images
– Hibernating myocardium: Fixed perfusion defect onrest/stress images, normal on viability images
• Location
○ Anterior/septal wall: Left anterior descending (LAD)artery
○ Lateral wall: Circumflex artery
○ Inferior wall: Posterior descending artery (PDA)
– Right coronary artery (RCA) in 85% (right dominant)
– Continuation of circumflex in 15% (left dominant)
○ Apex: Usually from LAD, but variable[
Imaging Recommendations
• Protocol advice
○ Patient preparation
– Review for contraindications to stress test, pregnancy
– Mostly required for stress portion of test
□ NPO for 4 hrs prior to stress test
□ No caffeine 12 hrs prior to pharmacologic stress
○ Radiopharmaceutical
– Tc-99m sestamibi or Tc-99m tetrofosmin
□ Dose: 10-40 mCi (370 MBq to 1.4 GBq)
□ 1-day protocol: Up to 40 mCi (1.4 GBq) (10 mCi [370MBq] for rest, 30 mCi [1.1 GBq] for stress)
□ 2-day protocol (patients > 250-275 lbs): 25-30 mCi(925 MBq to 1.1 GBq) for both rest and stress, 1 dayapart
□ Dosimetry: Colon (sestamibi) and gallbladder wall(tetrofosmin) receive largest radiation dose
□ 6 hrs t1/2
– Thallium-201 chloride
□ Dose: 2-4 mCi (74-148 MBq)
□ Rest images on dual-tracer MPI
□ Stress-rest images on Tl-201 only MPI
□ Redistribution imaging for viability
□ Long t1/2 (73 hrs) leads to higher dose than Tc-99m-based agents
□ Dosimetry: Kidneys receive largest radiation dose
– Rb-82
□ Dose: 2D PET: 40-60 mCi (1.4-2.2 GBq); 3D PET: 10-20 mCi (370-740 MBq) BGO system; 30-40 mCi (1.1-1.4 GBq) LSO system
□ Generator produced
□ 75 sec t1/2
□ Cost-effective PET tracer for high-volume centers
□ Pharmacologic stress utilized due to short t1/2
□ Dosimetry: Kidneys receive largest radiation dose
– N-13 ammonia
□ Dose: 15-25 mCi (555-925 MBq)
□ PET perfusion agent
□ Cyclotron produced (on-site due to 9.8 min t1/2)
□ Dosimetry: Urinary bladder receives largestradiation dose
○ Image acquisition: Tc-99m sestamibi and Tc-99mtetrofosmin
– Patient position: Supine, upright/semiupright
– Injection to imaging time: 15-60 min
– Time between rest/stress injections: 30 min to 4 hrs
– Collimator: Low energy, high resolution
– 180° planar acquisition: Preferred if no attenuationcorrection (better spatial resolution, higher contrast,less attenuation)
– SPECT and SPECT/CT: Preferred in obese patients,allows attenuation correction
– Matrix: 64 x 64
– Step and shoot or continuous acquisition
– 60-64 projections;[20-25 sec per projection
– ECG gate stress only or rest and stress[
– 8 frames/cycle standard
– 140 keV with 15-20% window
○ Image acquisition: Tl-201
– Similar to Tc-99m-based tracers, except
□ 70-80 keV with 15-20% window
□ 64 projections
□ Stress-rest MPI: Image 10 min after injection forstress images; rest (redistribution) images at 3-4 hrs
□ Rest only for dual-tracer MPI: Image 10 min afterinjection for rest images; utilize Tc-99m-basedradiotracer for stress[
□ Viability: Image 10 min after injection for restimages; redistribution (viability) images at 3-4 hrs
○ Image acquisition: Rb-82 and N-13 ammonia PET/CT
– Rb-82: Image acquisition starts 1-1.5 min afterinjection, 5-10 min acquisition
– N-13 ammonia: Image acquisition starts 4-5 min afterinjection, 10-15 min acquisition
– Attenuation correction from CT [for large patients
○ Image processing
– Reconstruction using filtered backprojection oriterative reconstruction
– Stress images usually displayed on top row, restimages on bottom row
Artifacts and Quality Control
• Motion artifact
○ Hurricane sign: Counts outside epicardial border on shortaxis[
○ Blurred endocardial border
○ Lateral wall blurring
• Scatter artifact
○ Counts scatter into inferior wall due to high bowelactivity
• Reconstruction artifact
○ Photopenia in inferior wall from high bowel activity
○ Photopenia at 11 o'clock position on short-axis views onrest and stress
Cardiac
12
Myocardial Infarction and Ischemia
• Attenuation
○ Soft tissue attenuation causing fixed defects
○ Misregistration of attenuation correction map andperfusion data
DIFFERENTIAL DIAGNOSIS
Myocardial Infarction
• Normal apical thinning
• Left ventricular hypertrophy: Fixed lateral wall defect
• Soft tissue attenuation of photons: Breast (anterior wall),diaphragm (inferior wall)
• Septal hypokinesis common in absence of MI, especiallyafter coronary artery bypass graft surgery
• Decreased activity in lateral wall on N-13 ammonia PET canbe seen in healthy controls
• Myocardial hibernation:[Myocardium with little/noperfusion, but viable due to anaerobic glycolysis
○ 25% of fixed defects are viable on viability studies
Myocardial Ischemia
• Artifactual perfusion defects on stress only (e.g., bowelactivity on stress images, shift of overlying soft tissue)
• Left bundle branch block: Functional septal reversibilitywith exercise stress (false-positive)
Other Vascular Disease
• Vasospastic disease (Prinzmetal angina)
• Microvascular disease (e.g., diabetes mellitus, syndrome X)
PATHOLOGY
General Features
• Etiology
○ Ruptured coronary artery plaque disrupts myocardialblood supply
– Myocardial necrosis begins in 20-30 min, spreadingfrom subendo- to epicardium
○ Risk factors
– Hyperlipidemia, diabetes mellitus, hypertension,obesity, cigarette smoking, family history
CLINICAL ISSUES
Demographics
• Age
○ Men: Usually > 45 yrs
○ Women: > 55 yrs
DIAGNOSTIC CHECKLIST
Consider
• Myocardial infarction
○ Fixed perfusion defect, regional wall motion abnormality
○ Peri-infarct ischemia can cause chest pain
• Myocardial ischemia
○ Reversible perfusion defect on rest and stress images, noregional wall motion abnormality
Reporting Tips
• Raw images
○ Review to identify artifacts, extracardiac radiotraceruptake (breast/lung cancer, lymphoma, infection)
• Study quality
○ Comment if excessive motion, poor radiotraceruptake/infiltration, technical error
• Artifacts
○ Describe if present: Motion, scatter, reconstruction,attenuation
• Adequacy of stress modality
○ Exercise: Discuss percent age-predicted max heart rateachieved
○ Vasodilators: If infused and radiotracer injected perprotocol, assume adequate stress
• Perfusion images
○ Qualitative analysis
– LV chamber size: Normal vs. dilated
– 17 segment model: Describe perfusion defects onstress and rest using these segments
– Transient ischemic dilatation (TID): Dropout ofendocardial border on stress
○ Quantitative analysis
– Quantitative perfusion analysis
□ Computer generation of segmental perfusionscores in each of 17 segments on a 5-point scale atstress and rest (0 = normal, 4 = absent)
□ Summed stress score (SSS): Analysis of resting andstress-induced perfusion defects
□ Summed rest score (SRS): Analysis of restingperfusion defects
□ Summed difference score (SDS): SSS minus SRS; ameasure of stress-induced ischemia
□ SDS: < 4 = normal; 4-8 = mildly abnormal; 9-13 =moderately abnormal; > 13 = severely abnormal
– TID ratio: 1.12-1.36 correlates with multivessel disease
□ TID = endocardial volume at stress / endocardialvolume at rest
• Gated images
○ Wall motion
– Normal if brightening and endocardial excursion ongated slice images
– Hypokinesis/akinesis if photopenia, lack of endocardialexcursion
○ Ejection fraction
– Lower limits of normal for MPI: 45%
– Overestimated if small heart size
• Conclusion
○ Positive or negative for inducible ischemia
○ Positive or negative for myocardial infarction (± peri-infarct ischemia)
– Consider possibility of hibernating myocardium, needfor viability study
○ LV function: EF and wall motion
SELECTED REFERENCES
1. American College of Radiology. ACR-SNMMI-SPR Practice Guideline for thePerformance of Cardiac Scintigraphy. http://snmmi.files.cms-plus.com/docs/Cardiac_Scintigraphy_1382731812393_3.pdf. RevisedOctober 1, 2009. Accessed July 18, 2014
2. Struass et al. SNM Procedure Guideline for Myocardial Perfusion Imaging3.3. http://snmmi.files.cms-plus.com/docs/Myocardial20Perfusion20Imaging203.3.pdf. June 14,2008.[Accessed July 18, 2014
3. Dorbala S et al: SNMMI/ASNC/SCCT guideline for cardiac SPECT/CT andPET/CT 1.0. J Nucl Med. 54(8):1485-507, 2013
Cardiac
13
Myocardial Infarction and Ischemia
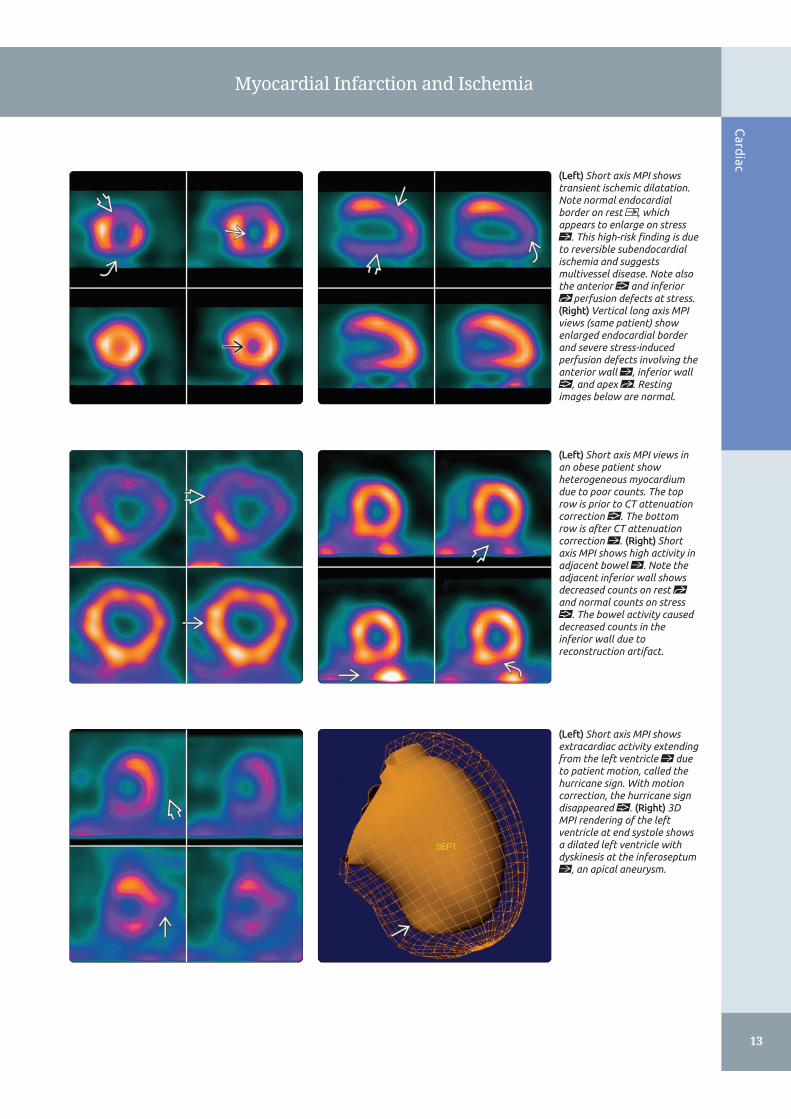
(Left) Short axis MPI showstransient ischemic dilatation.Note normal endocardialborder on rest , whichappears to enlarge on stressst. This high-risk finding is dueto reversible subendocardialischemia and suggestsmultivessel disease. Note alsothe anterior and inferiorst perfusion defects at stress.(Right) Vertical long axis MPIviews (same patient) showenlarged endocardial borderand severe stress-inducedperfusion defects involving theanterior wall st, inferior wall, and apex st. Restingimages below are normal.
(Left) Short axis MPI views inan obese patient showheterogeneous myocardiumdue to poor counts. The toprow is prior to CT attenuationcorrection . The bottomrow is after CT attenuationcorrection st. (Right) Shortaxis MPI shows high activity inadjacent bowel st. Note theadjacent inferior wall showsdecreased counts on rest stand normal counts on stress. The bowel activity causeddecreased counts in theinferior wall due toreconstruction artifact.
(Left) Short axis MPI showsextracardiac activity extendingfrom the left ventricle st dueto patient motion, called thehurricane sign. With motioncorrection, the hurricane signdisappeared . (Right) 3DMPI rendering of the leftventricle at end systole showsa dilated left ventricle withdyskinesis at the inferoseptumst, an apical aneurysm.
Cardiac
14
Myocardial Infarction and Ischemia
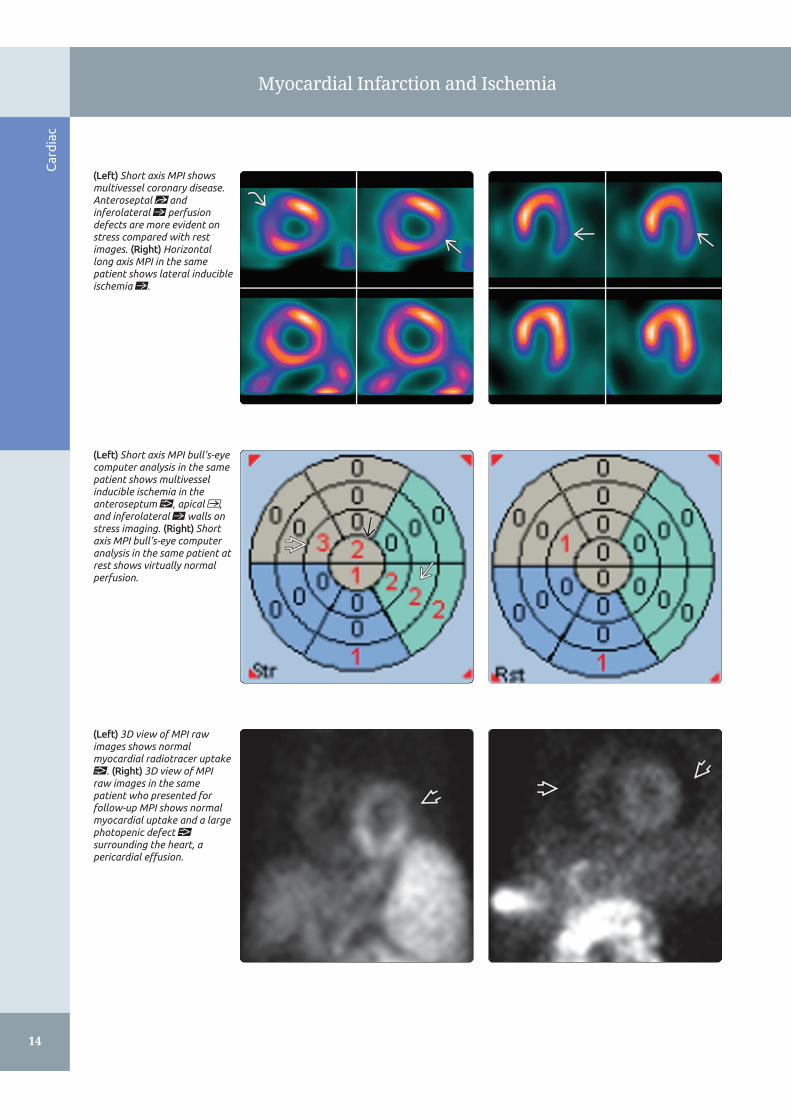
(Left) Short axis MPI showsmultivessel coronary disease.Anteroseptal st andinferolateral st perfusiondefects are more evident onstress compared with restimages. (Right) Horizontallong axis MPI in the samepatient shows lateral inducibleischemia st.
(Left) Short axis MPI bull's-eyecomputer analysis in the samepatient shows multivesselinducible ischemia in theanteroseptum , apical ,and inferolateral st walls onstress imaging. (Right) Shortaxis MPI bull's-eye computeranalysis in the same patient atrest shows virtually normalperfusion.
(Left) 3D view of MPI rawimages shows normalmyocardial radiotracer uptake. (Right) 3D view of MPIraw images in the samepatient who presented forfollow-up MPI shows normalmyocardial uptake and a largephotopenic defect surrounding the heart, apericardial effusion.
Cardiac
15
Myocardial Infarction and Ischemia
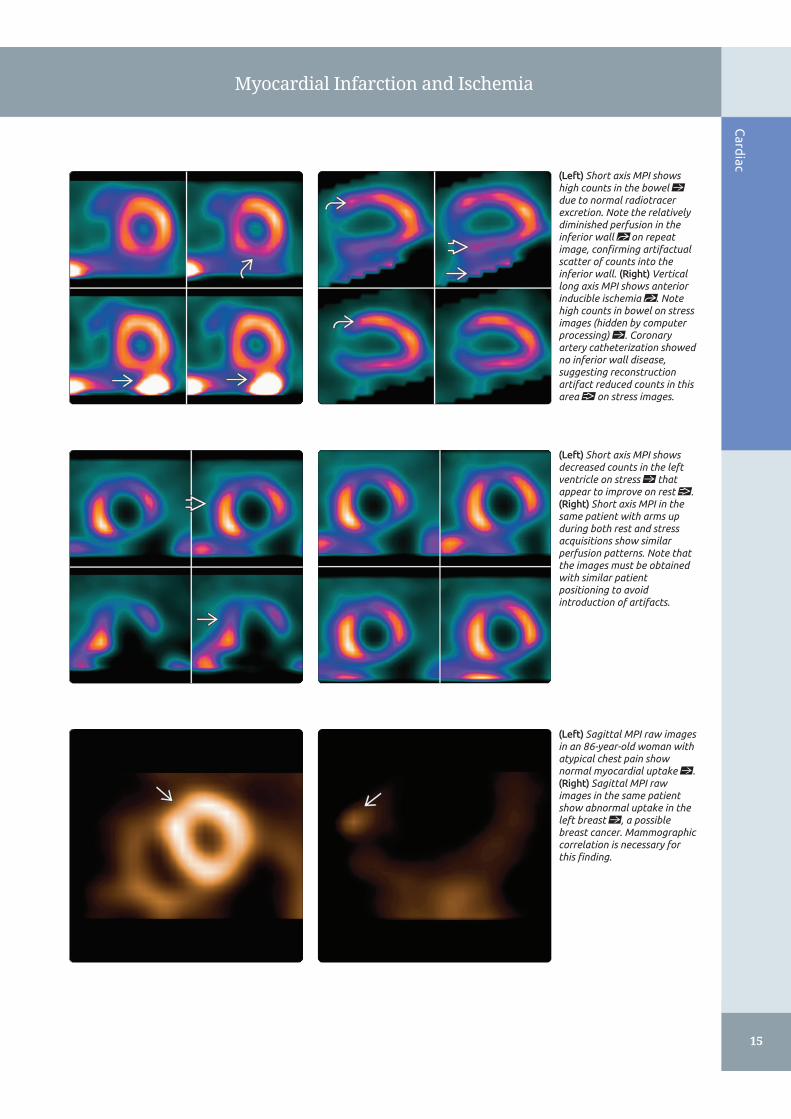
(Left) Short axis MPI showshigh counts in the bowel stdue to normal radiotracerexcretion. Note the relativelydiminished perfusion in theinferior wall st on repeatimage, confirming artifactualscatter of counts into theinferior wall. (Right) Verticallong axis MPI shows anteriorinducible ischemia st. Notehigh counts in bowel on stressimages (hidden by computerprocessing) st. Coronaryartery catheterization showedno inferior wall disease,suggesting reconstructionartifact reduced counts in thisarea on stress images.
(Left) Short axis MPI showsdecreased counts in the leftventricle on stress st thatappear to improve on rest .(Right) Short axis MPI in thesame patient with arms upduring both rest and stressacquisitions show similarperfusion patterns. Note thatthe images must be obtainedwith similar patientpositioning to avoidintroduction of artifacts.
(Left) Sagittal MPI raw imagesin an 86-year-old woman withatypical chest pain shownormal myocardial uptake st.(Right) Sagittal MPI rawimages in the same patientshow abnormal uptake in theleft breast st, a possiblebreast cancer. Mammographiccorrelation is necessary forthis finding.
Cardiac
16
Myocardial Viability
KEY FACTS
TERMINOLOGY
• Myocardial viability evaluation
○ Detection of myocardial hibernation or stunning vs.necrosis/infarction in patients with ischemiccardiomyopathy
IMAGING
• Tc-99m/Tl-201 myocardial perfusion scintigraphy
○ Viability present in 25% of regions called infarction
○ Viability present in up to 50% of patients with infarctedsegments
• Perfusion-PET mismatch
○ Myocardial uptake of radioactive glucose analogcompared with myocardial uptake of perfusionradiotracer (Tc-99m perfusion agent or Tl-201)
○ Anaerobic glucose utilization in underperfusedmyocardium = viability
• Tl-201 SPECT viability
○ Rest-redistribution mismatch
○ Delayed myocardial uptake in regions of underperfusedmyocardium = viability
TOP DIFFERENTIAL DIAGNOSES
• Myocardial hibernation
○ Chronic myocardial dysfunction due to chronicallydecreased myocardial perfusion (chronic totalocclusions)
○ Regions of abnormal perfusion will show F-18 FDGutilization or redistribution on Tl-201
• Myocardial stunning
○ Temporary myocardial dysfunction due to short-termunderperfusion or lack of perfusion to myocardium
○ Regions of abnormal perfusion will show F-18 FDGutilization or redistribution on Tl-201
• Myocardial infarction
○ Myocardial necrosis and remodeling (scar)
○ Regions of abnormal perfusion will show lack of F-18FDG utilization or lack of redistribution on Tl-201
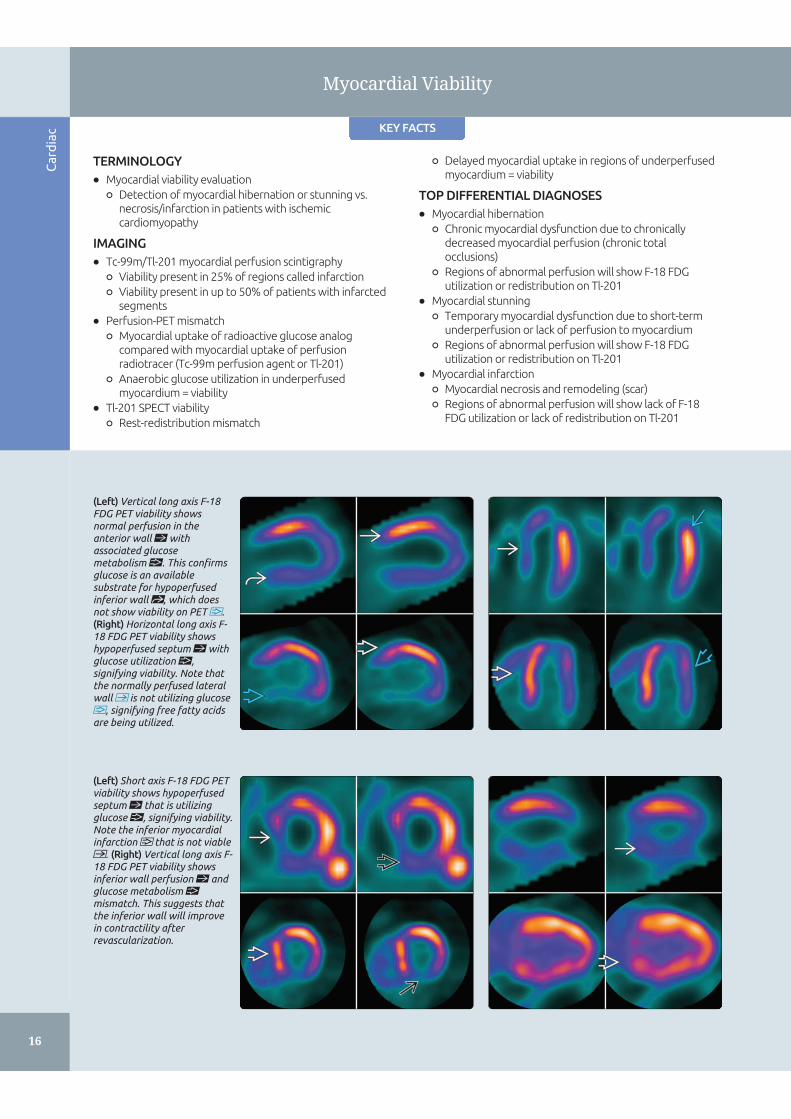
(Left) Vertical long axis F-18FDG PET viability showsnormal perfusion in theanterior wall st withassociated glucosemetabolism . This confirmsglucose is an availablesubstrate for hypoperfusedinferior wall st, which doesnot show viability on PET .(Right) Horizontal long axis F-18 FDG PET viability showshypoperfused septum st withglucose utilization ,signifying viability. Note thatthe normally perfused lateralwall is not utilizing glucose, signifying free fatty acidsare being utilized.
(Left) Short axis F-18 FDG PETviability shows hypoperfusedseptum st that is utilizingglucose , signifying viability.Note the inferior myocardialinfarction that is not viable. (Right) Vertical long axis F-18 FDG PET viability showsinferior wall perfusion st andglucose metabolism mismatch. This suggests thatthe inferior wall will improvein contractility afterrevascularization.
Cardiac
17
Myocardial Viability
TERMINOLOGY
Definitions
• Myocardial viability evaluation
○ Detection of myocardial hibernation or stunning vs.necrosis/infarction in patients with ischemiccardiomyopathy
– Myocardial hibernation
□ Chronic myocardial dysfunction due to chronicallydecreased myocardial perfusion
– Myocardial stunning
□ Temporary myocardial dysfunction due to short-term underperfusion or lack of perfusion tomyocardium
○ Regions of hibernating/stunned myocardium likely toshow improved contractility after revascularization
IMAGING
Nuclear Medicine Findings
• Tc-99m/Tl-201 myocardial perfusion scintigraphy
○ Viability present in 25% of regions called infarction
○ Viability present in up to 50% of patients with infarctedsegments
• F-18 FDG PET viability
○ Perfusion-PET mismatch
– Myocardial uptake of radioactive glucose analogcompared with myocardial uptake of perfusionradiotracer (Tc-99m perfusion agent or Tl-201)
– Anaerobic glucose utilization in underperfusedmyocardium = viability
• Tl-201 SPECT viability
○ Rest-redistribution mismatch
– Myocardial uptake of Tl-201 at rest compared withdelayed myocardial uptake (redistribution)
– Delayed myocardial uptake in regions ofunderperfused myocardium = viability
□ > 10% increase in tracer uptake on redistributionimages = viability
– Comparison of Tl-201 uptake in underperfusedsegments to normally perfused segments
□ ~ 90% of segments with > 80% uptake of normalsegments show functional improvement afterrevascularization
□ ~ 55% of segments with 50-60% uptake of normalsegments show functional improvement afterrevascularization
Imaging Recommendations
• Protocol advice
○ F-18 FDG PET viability
– Patient preparation
□ Obtain resting myocardial perfusion SPECT prior toF-18 FDG PET scan
□ Fast 6-12 hrs prior to F-18 FDG PET scan
□ F-18 FDG PET performed in presence of elevatedinsulin level (postprandial/post insulinadministration)
□ Oral glucose loading (25-100 g) followed by bloodglucose check at 45-90 min
□ Administer 1-5 units of insulin (sliding scale)depending on blood glucose level
– Radiopharmaceutical
□ 5-15 mCi (185-555 MBq) F-18 FDG
□ Injection after glucose load/insulin administration
– Dosimetry
□ Critical organ: Urinary bladder
– Image acquisition
□ Imaging performed at ~ 60 mins after F-18 FDGinjection
□ CT for attenuation correction
□ 3-10 min imaging time
– Image processing
□ Match F-18 FDG PET images with myocardialperfusion SPECT images using dedicatedmyocardial perfusion scintigraphy software
○ Tl-201 viability
– Patient preparation
□ None
– Radiopharmaceutical
□ 2-4 mCi (74-148 MBq) Tl-201
– Dosimetry
□ Critical organ: Testes, thyroid
– Image acquisition
□ 10 min after injection; 4 &/or 24 hr images
□ LEAP collimator
□ SPECT/CT with CT for attenuation correction
□ Long imaging times recommended to enhancecounting statistics on Tl-201 rest imaging
– Image processing
□ Match rest images to redistribution images usingdedicated myocardial perfusion scintigraphysoftware
Artifacts and Quality Control
• F-18 FDG PET viability
○ Severe type-II diabetes mellitus
– Can have no F-18 FDG myocardial uptake despiteinsulin
– Tl-201 preferred
○ Attenuation correction
– Misregistration of attenuation map can causeartifactually increased or decreased counts
– Attenuation correction recommended to decreaseartifactual perfusion defects in inferior (diaphragm),anterior (breast) walls
○ SPECT perfusion
– Overlapping bowel activity can add to counts ininferior wall, mimicking normal perfusion
• Tl-201 viability
○ Poor count statistics/artifacts due to obesity
– Use attenuation correction
○ Movement during imaging
– Motion correct or reimage
○ SPECT perfusion
– Overlapping bowel activity can add to counts ininferior wall, mimicking normal perfusion
– Attenuation correction recommended to decreaseartifactual perfusion defects in inferior (diaphragm),anterior (breast) walls
○ Attenuation correction

Cardiac
18
Myocardial Viability
– Misregistration of attenuation map can causeartifactually increased or decreased counts
○ Improper imaging time
– Inadequate time for redistribution on Tl-201 imaging(image at both 4 and 24 hr after injection to increasesensitivity for viability)
DIFFERENTIAL DIAGNOSIS
Myocardial Hibernation
• Chronic myocardial dysfunction due to chronicallydecreased myocardial perfusion (chronic total occlusions)
• Regions of abnormal perfusion will show F-18 FDGutilization or redistribution on Tl-201
Myocardial Stunning
• Temporary myocardial dysfunction due to short-termunderperfusion or lack of perfusion to myocardium
• Regions of abnormal perfusion will show F-18 FDGutilization or redistribution on Tl-201
Myocardial Infarction
• Myocardial necrosis and remodeling (scar)
• Regions of abnormal perfusion will show lack of F-18 FDGutilization or lack of redistribution on Tl-201
PATHOLOGY
Microscopic Features
• Myocardial viability requires
○ Sarcolemmal membrane integrity
○ Preserved metabolic activity
○ Adequate myocardial perfusion
CLINICAL ISSUES
Presentation
• Most common signs/symptoms
○ Heart failure
– Regional &/or global wall motion abnormalities
– Fatigue
– Dyspnea
– Physical activity limitations
○ Chronic total occlusions
– Chest pain in up to 50%
– ~ 12% heart failure
Demographics
• Age
○ 50-59 yrs: 8 per 1,000
○ 80-89 yrs: 66-79 per 1,000
• Epidemiology
○ USA: 5.1 million people have heart failure (2006)
○ Chronic total occlusions: 33-52% prevalence in patientswith coronary artery disease
Natural History & Prognosis
• Patients with viable myocardium
○ Benefit from revascularization
○ If untreated, risk of cardiac death or nonfatal MI isincreased
• Patients with nonviable myocardium
○ Increased morbidity and mortality with revascularization
• Viability testing most important in patients with heartfailure
○ 50% of patients with heart failure: Death within 5 years
○ Revascularization: Decreases morbidity and mortalitywhere viable myocardium is present
Treatment
• Revascularization with coronary artery bypass grafting
○ Older patients
○ Left main coronary artery disease
○ Diabetes mellitus
○ Triple vessel disease
• Revascularization with cardiac catheterization andpercutaneous coronary intervention
○ Younger patients
○ Normal renal function
○ Lower risk coronary artery disease
DIAGNOSTIC CHECKLIST
Consider
• F-18 FDG PET viability
○ If no F-18 FDG activity in heart, consider improper patientpreparation
• Tl-201 viability
○ Consider using Tl-201 in patients with severe type-IIdiabetes mellitus
– Lack of F-18 FDG uptake can be due to severe insulinresistance
○ False-negative Tl-201 scans often due to imaging tooearly after tracer injection
– If 4 hr images negative, repeat at 24 hrs
– 24 hr images most sensitive
• CT attenuation correction for F-18 FDG PET/CT andSPECT/CT tracers to reduce soft tissue artifacts
○ Note that misregistration of attenuation map can causeartifacts as well
SELECTED REFERENCES
1. Society of Nuclear Medicine and Molecular Imaging. ASNC-SCCT-SNMMIGuideline for Cardiac SPECT/CT and PET/CT 1.0. http://snmmi.files.cms-plus.com/docs/ASNC_SCCT_SNMMI%20Guideline%20for%20Cardiac%20SPECT-CT%20and%20PET-CT.pdf. Created November 15, 2012. Accessed July31, 2015
2. Society of Nuclear Medicine and Molecular Imaging. ACR-SNMMI-SPRPractice Guideline for the Performance of Cardiac Scintigraphy.http://snmmi.files.cms-plus.com/docs/Cardiac_Scintigraphy_1382731812393_3.pdf. CreatedOctober 1, 2009. Accessed July 31, 2015
3. Hoebers LP et al: Contemporary overview and clinical perspectives ofchronic total occlusions. Nat Rev Cardiol. 11(8):458-69, 2014
4. Sogbein OO et al: New SPECT and PET radiopharmaceuticals for imagingcardiovascular disease. Biomed Res Int. 2014:942960, 2014
5. Arrighi JA et al: Multimodality imaging for assessment of myocardial viability:nuclear, echocardiography, MR, and CT. Curr Cardiol Rep. 14(2):234-43, 2012
6. Fefer P et al: Current perspectives on coronary chronic total occlusions: theCanadian Multicenter Chronic Total Occlusions Registry. J Am Coll Cardiol.59(11):991-7, 2012
7. Strauss HW et al. Myocardial Perfusion Imaging 3.3. SNM, 2008

Cardiac
19
Myocardial Viability
(Left) Horizontal long axis F-18FDG PET viability showsmatched perfusion andglucose metabolism stdefects in the apex, signifyingnonviable myocardialinfarction. (Right) Verticallong axis F-18 FDG PETviability shows a large apicalmyocardial infarction st thatis not metabolizing glucose.
(Left) Short axis F-18 FDG PETviability shows an enlargedright ventricle st and ananterolateral perfusion defect. Note only blood poolactivity st, which may signifypoor patient preparation oranterolateral nonviability. Inhighly insulin-resistantpatients, the heart may nottake up glucose despiteviability. (Right) Vertical longaxis F-18 FDG PET viabilityshows decreased anterior stand apical st perfusion. Theanterior wall showsglucose metabolism, whereasthe apex does not.
(Left) Short axis F-18 FDG PETviability shows abnormalinferolateral perfusion with a high level of glucosemetabolism st, consistentwith myocardial viability. Notethe normal septum is notutilizing glucose but is stillutilizing free fatty acids as anenergy substrate. (Right)Horizontal long axis F-18 FDGPET viability shows viable,underperfused lateral wall .
Cardiac
20
Right-to-Left Shunt
KEY FACTS
TERMINOLOGY
• Right-to-left shunt: Abnormal shunting of blood throughcardiovascular and pulmonary system, bypassing thepulmonary capillary circulation
○ Can allow venous to arterial emboli, causing ischemia tomultiple organs (e.g., brain, bowel)
IMAGING
• Tc-99m MAA pulmonary perfusion scan
○ Abnormal uptake within brain and kidneys confirmsshunting of Tc-99m MAA administered intravenously
○ Tc-99m MAA should localize only in brain and kidneyswith shunt
○ Must be differentiated from extrapulmonary uptake offree Tc-99m pertechnetate
– Tc-99m can dissociate from MAA (resulting in free Tc-99m pertechnetate) due to lack of quality control inpharmacy and radiotracer handling
– Free Tc-99m pertechnetate is also visualized in thyroidgland, salivary glands and gastric mucosa
○ Use reduced MAA particle count (100,000-200,000) incase of suspected shunt, pulmonary hypertension,pregnancy or pediatric patient
○ Can quantitate the degree of shunt if desired
– Right-to-left shunt % = (total body counts - lungcounts)/(total body counts x 100)
DIAGNOSTIC CHECKLIST
• Always scrutinize VQ scans for unexpected incidentaluptake within brain or kidneys
• If uptake in kidneys, must look for brain or thyroid/salivaryuptake
• Brain images: Most sensitive indicator of right-to-left shunt
• Nuclear medicine findings are not specific for location ofshunt
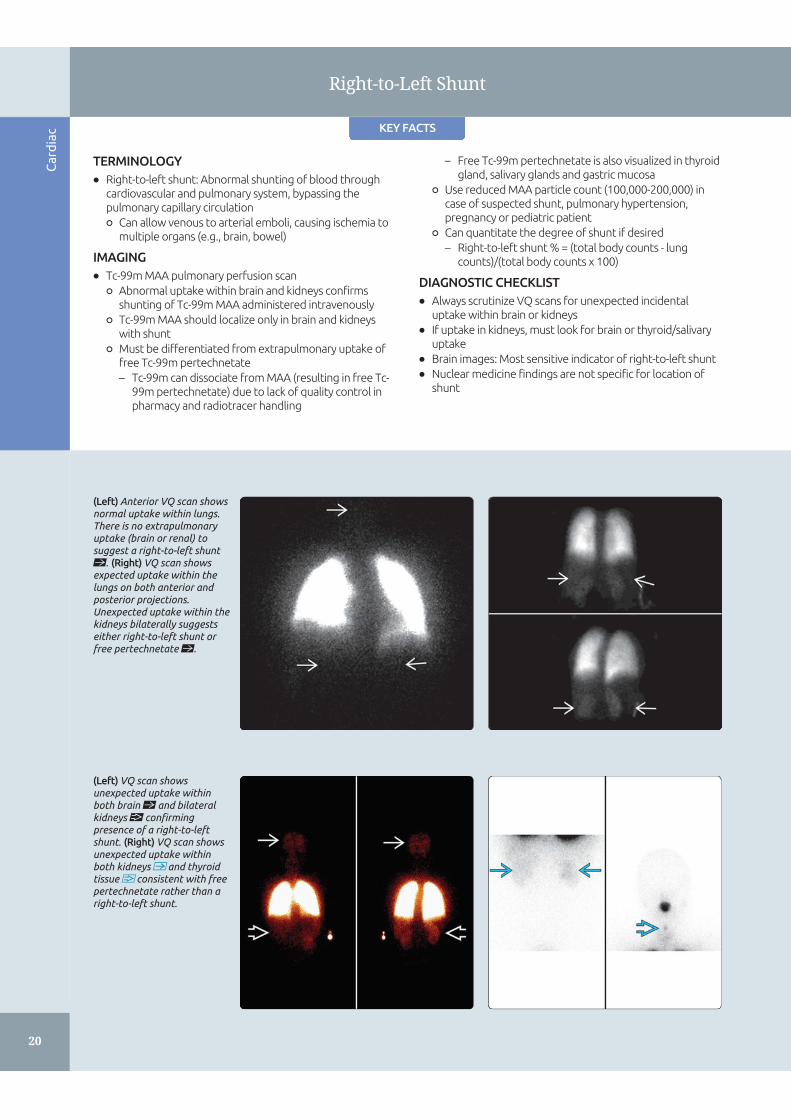
(Left) Anterior VQ scan showsnormal uptake within lungs.There is no extrapulmonaryuptake (brain or renal) tosuggest a right-to-left shuntst. (Right) VQ scan showsexpected uptake within thelungs on both anterior andposterior projections.Unexpected uptake within thekidneys bilaterally suggestseither right-to-left shunt orfree pertechnetate st.
(Left) VQ scan showsunexpected uptake withinboth brain st and bilateralkidneys confirmingpresence of a right-to-leftshunt. (Right) VQ scan showsunexpected uptake withinboth kidneys and thyroidtissue consistent with freepertechnetate rather than aright-to-left shunt.

Cardiac
21
Right-to-Left Shunt
TERMINOLOGY
Definitions
• Right-to-left shunt: Abnormal shunting of blood throughcardiovascular and pulmonary system, bypassing pulmonarycapillary circulation
○ Can allow venous to arterial emboli, causing ischemia tomultiple organs (e.g., brain, bowel)
IMAGING
Nuclear Medicine Findings
• Tc-99m MAA pulmonary perfusion scan
○ Abnormal uptake within brain and kidneys confirmsshunting of Tc-99m MAA administered intravenously
– Tc-99m MAA should localize only in brain and kidneyswith shunt
○ Must be differentiated from extrapulmonary uptake offree Tc-99m pertechnetate
– Tc-99m can dissociate from MAA (resulting in free Tc-99m pertechnetate) due to lack of quality control inpharmacy and radiotracer handling
– Free Tc-99m pertechnetate is also visualized in thyroidgland, salivary glands, and gastric mucosa
○ May be incidental finding on V/Q scan for suspectedpulmonary embolism[
Protocol Advice
• Radiopharmaceutical[
○ Tc-99m MAA
○ Use reduced MAA particle count (100,000-200,000) incase of suspected shunt, pulmonary hypertension,pregnancy, or pediatric patient
– If shunt present, particles bypass pulmonary capillarybed initially and become trapped in brain/kidneys
– Makes critical organs (brain, kidneys) at risk ofunanticipated radiation exposure
○ IV injection in upper extremity sufficient
– Can inject indwelling line but not through port or anyfiltered line because will filter out MAA particles
• Dose
○ Adults: 1-4 mCi (37-148 MBq) of Tc-99m MAA, ~ 200,000-700,000 particles
○ Children: 0.03 mCi/kg with minimum of 0.4 mCi
• Dosimetry
○ Adults: Largest radiation dose to lungs 0.067 mGy;effective dose 0.011 mSv
○ Pediatrics (5 year old): Largest radiation dose to lungs0.21 mGy; effective dose 0.038 mSv
• Image acquisition
○ LEAP collimator
○ In addition to anterior/posterior planar images of lungs,posterior images of kidneys and anterior/posterior ofbrain
– Brain images: Most sensitive indicator of right-to-leftshunt
• Image processing
○ Can quantitate degree of shunt if desired
– Right-to-left shunt % = (systemic counts/whole-bodycounts x 100%) = ([whole-body counts - lungcounts]/whole- body counts) x 100%
DIFFERENTIAL DIAGNOSIS
Intracardiac Right-to-Left Shunts
• Adults
○ Atrial septal defect or patent foramen ovale
• Children
○ Atrial septal defect, patent foramen ovale, ventricularseptal defect, or more complex congenital defects
Extracardiac Right-to-Left Shunts
• Pulmonary[
○ Arteriovenous malformation (AVM)
– Enlarge with time, most typically do not present untiladulthood
– May be single or multiple, simple or complex[
□ Hereditary hemorrhagic telangiectasia (a.k.a. Osler-Weber-Rendu) syndrome: Multiple systemic AVMs
• Anomalous systemic venous return
○ Left superior vena cava (if communication with leftatrium)[
Acquired Shunts
• Hepatopulmonary syndrome (develop pulmonary AVMs)
• Post-traumatic/surgical
Free Tc-99m Pertechnetate
• Tc-99m pertechnetate can dissociate from MAA (resultingin free Tc-99m pertechnetate) due to lack of quality controlin pharmacy and radiotracer handling
• Free Tc-99m pertechnetate also demonstrates uptakewithin kidneys
• Also shows uptake within thyroid &/or salivary glands,gastric mucosa
DIAGNOSTIC CHECKLIST
Image Interpretation Pearls
• Always scrutinize VQ scans for unexpected incidentaluptake within brain or kidneys
• If uptake in kidneys, must look for brain or thyroid/salivaryuptake
○ If brain uptake also noted, consistent with right-to-leftshunt
○ If thyroid/salivary, gastric mucosa uptake also noted, freeTc-99m pertechnetate rather than shunt
• Nuclear medicine findings are not specific for location ofshunt
SELECTED REFERENCES
1. Society of Nuclear Medicine and Molecular Imaging. SNMMI ProcedureStandard for Lung Scintigraphy 4.0. http://snmmi.files.cms-plus.com/docs/Lung_Scintigraphy_V4_Final.pdf. Created July 19, 2011.Accessed July 31, 2015
2. Ito K et al: Cut-off value for normal versus abnormal right-to-left shuntpercentages using (99m)Tc-macroaggregated albumin. Nucl Med Commun.32(10):936-40, 2011
3. MacDonald A et al: Infrequently performed studies in nuclear medicine: Part1. J Nucl Med Technol. 36(3):132-43; quiz 145, 2008
4. Graves MW et al: Scintigraphic diagnosis of a right to left shunt in end-stagelung disease. Respir Med. 97(5):549-54, 2003
5. Sugiyama M et al: Scintigraphic evaluation of small pulmonary right-to-leftshunt and therapeutic effect in pulmonary arteriovenous malformation. ClinNucl Med. 26(9):757-60, 2001