Embed Size (px)
Citation preview
UNITED STATES SECURITIES AND EXCHANGE COMMISSION
WASHINGTON, D.C. 20549
FORM 10-K
Commission File Number: 000-51609
InvenTrust Properties Corp. (Exact name of registrant as specified in its charter)
(855) 377-0510 (Registrant’s telephone number, including area code)
Securities registered pursuant to Section 12(b) of the Act: None
Securities registered pursuant to Section 12(g) of the Act: Common stock, $0.001 par value per share
(Title of Class)
Indicate by check mark if the registrant is a well-known seasoned issuer, as defined in Rule 405 of the Securities Act. Yes ¨ No x
Indicate by check mark if the registrant is not required to file reports pursuant to Section 13 or Section 15(d) of the Act. Yes ¨ No x
Indicate by check mark whether the registrant (1) has filed all reports required to be filed by Section 13 or 15(d) of the Securities Exchange Act of 1934 during the preceding 12 months (or for such shorter period that the registrant was required to file such reports), and (2) has been subject to the filing requirements for the past 90 days. Yes x No ¨
Indicate by check mark whether the Registrant has submitted electronically and posted on its corporate website, if any, every Interactive Data File required to be submitted and posted pursuant to Rule 405 of Regulation S-T (§232.405 of this chapter) during the preceding 12 months (or for such shorter period that the registrant was required to submit and post such files). Yes x No ¨
Indicate by check mark if disclosure of delinquent filers pursuant to Item 405 of Regulation S-K is not contained herein, and will not be contained, to the best of registrant’s knowledge, in definitive proxy or information statements incorporated by reference in Part III of this Form 10-K or any amendment to this Form 10-K. ¨
Indicate by check mark whether the registrant is a large accelerated filer, an accelerated filer, a non-accelerated filer or a smaller reporting company. (See definitions of “large accelerated filer,” “accelerated filer” and “smaller reporting company” in Rule 12b-2 of the Exchange Act).
If an emerging growth company, indicate by check mark if the registrant has elected not to use the extended transition period for complying with any new or revised financial accounting standards provided pursuant to Section 13(a) of the Exchange Act. ¨
Indicate by check mark whether the registrant is a shell company (as defined in Rule 12b-2 of the Exchange Act). Yes ¨ No x
There is no established market for the registrant’s shares of common stock. The aggregate market value of the registrant’s common stock held by non-affiliates of the registrant as of June 30, 2017 (the last business day of the registrant’s most recently completed second quarter) was approximately $2,544,848,170, based on the estimated per share value of $3.29, as established by the registrant as of May 1, 2017.
As of February 23, 2018, there were 774,311,254 shares of the registrant’s common stock outstanding.
DOCUMENTS INCORPORATED BY REFERENCE
Portions of the registrant’s definitive "Proxy Statement" for its annual stockholders' meeting to be held on May 9, 2018 are incorporated by reference in Part III of this Form 10-K.
Section 1: 10-K (10-K)
x ANNUAL REPORT PURSUANT TO SECTION 13 OR 15(d) OF THE SECURITIES EXCHANGE ACT OF 1934
For the fiscal year ended December 31, 2017
¨ TRANSITION REPORT PURSUANT TO SECTION 13 OR 15(d) OF THE SECURITIES EXCHANGE ACT OF 1934
For the transition period from to
Maryland 34-2019608
(State or other jurisdiction of incorporation or organization) (I.R.S. Employer Identification No.)
3025 Highland Parkway, Suite 350, Downers Grove, Illinois 60515
(Address of principal executive offices) (Zip Code)
Large accelerated filer ¨ Accelerated filer ¨
Non-accelerated filer x Smaller reporting company ¨
(Do not check if a smaller reporting company) Emerging growth company ¨
INVENTRUST PROPERTIES CORP.
TABLE OF CONTENTS
Page
Special Note Regarding Forward Looking Statements ii
Part I
Item 1. Business 1
Executive Officers of Registrant 1
Item 1A. Risk Factors 4
Item 1B. Unresolved Staff Comments 26
Item 2. Properties 27
Item 3. Legal Proceedings 28
Item 4. Mine Safety Disclosures 28
Part II
Item 5. Market for Registrant's Common equity, Related Stockholder Matters and Issuer Purchases of Equity Securities 29
Item 6. Selected Financial Data 32
Item 7. Management's Discussion and Analysis of Financial Condition and Results of Operations 35
Item 7A. Quantitative and Qualitative Disclosures About Market Risk 57
Item 8. Consolidated Financial Statements and Supplementary Data 58
Item 9. Changes in and Disagreements with Accountants on Accounting and Financial Disclosure 58
Item 9A. Controls and Procedures 58
Item 9B. Other Information 58
Part III
Item 10. Directors, Executive Officers and Corporate Governance 59
Item 11. Executive Compensation 59
Item 12. Security Ownership of Certain Beneficial Owners and Management and Related Stockholder Matters 59
Item 13. Certain Relationships and Related Transactions, and Director Independence 60
Item 14. Principal Accounting Fees and Services 60
Part IV
Item 15. Exhibits and Financial Statement Schedules 61
Signatures 64
SPECIAL NOTE REGARDING FORWARD-LOOKING STATEMENTS
Certain statements in this Annual Report on Form 10-K ("Annual Report"), other than purely historical information, are "forward-looking statements" within the meaning of the Private Securities Litigation Reform Act of 1995, Section 27A of the Securities Act of 1933, as amended, and Section 21E of the Securities Exchange Act of 1934 ("Exchange Act"), as amended. These statements include statements about InvenTrust Properties Corp.'s plans, objectives, strategies, financial performance and outlook, trends, the amount and timing of future cash distributions, prospects or future events and involve known and unknown risks that are difficult to predict. As a result, our actual financial results, performance, achievements or prospects may differ materially from those expressed or implied by these forward-looking statements. In some cases, you can identify forward-looking statements by the use of words such as "may," "could," "expect," "intend," "plan," "seek," "anticipate," "believe," "estimate," "guidance," "predict," "potential," "continue," "likely," "will," "would," "illustrative" and variations of these terms and similar expressions, or the negative of these terms or similar expressions. Such forward-looking statements are necessarily based upon estimates and assumptions that, while considered reasonable by us based on our knowledge and understanding of the business and industry, are inherently uncertain. These statements are not guarantees of future performance, and stockholders should not place undue reliance on forward-looking statements. There are a number of risks, uncertainties and other important factors, many of which are beyond our control, that could cause our actual results to differ materially from the forward-looking statements contained in this Annual Report. Such risks, uncertainties and other important factors, include, among others, the risks, uncertainties and factors set forth under "Part I, Item 1A. -- Risk Factors" and "Part II, Item 7 -- Management’s Discussion and Analysis of Financial Condition and Results of Operations,("MD&A")" and the risks and uncertainties related to the following:
• market, political and economic volatility experienced by the United States ("U.S.") economy or real estate industry as a whole, and the regional and local political and economic conditions in the markets in which our properties are located;
• our ability to complete a strategic transaction, enhance stockholder value and provide liquidity to stockholders;
• our ability to identify, execute and complete disposition opportunities and at expected valuations;
• our ability to identify, execute and complete acquisition opportunities and to integrate and successfully operate any investment properties acquired in the future and the risks associated with such investment properties;
• our ability to manage the risks of expanding, developing or re-developing some of our current and prospective investment properties;
• our transition to an integrated operating platform may not prove successful over the long term;
• loss of members of our senior management team or other key personnel;
• changes in governmental regulations and U.S. accounting standards or interpretations thereof;
• our ability to access capital for renovations and acquisitions on terms and at times that are acceptable to us;
• changes in the competitive environment in the leasing market and any other market in which we operate;
• forthcoming expirations of certain of our leases and our ability to re-lease such investment properties;
• our ability to collect rent from tenants or to rent space on favorable terms or at all;
• the impact of leasing and capital expenditures to improve our investment properties in order to retain and attract tenants;
• events beyond our control, such as war, terrorist attacks, including acts of domestic terrorism, natural disasters and severe weather incidents, and any uninsured or underinsured loss resulting therefrom;
• actions or failures by our joint venture partners, including development partners;
• the cost of compliance with and liabilities under environmental, health and safety laws;
• changes in real estate and zoning laws and increases in real property tax rates;
• the economic success and viability of our anchor retail tenants;
• our debt financing, including risk of default, loss and other restrictions placed on us;
• our ability to refinance maturing debt or to obtain new financing on attractive terms;
• future increases in interest rates;
• the availability of cash flow from operating activities to fund distributions;
• our investment in equity and debt securities and in companies we do not control;

These factors are not necessarily all of the important factors that could cause our actual results, performance or achievements to differ materially from those expressed in or implied by any of our forward-looking statements. Other unknown or unpredictable factors also could harm our business, financial condition, results of operations or cash flows. All forward-looking statements attributable to us or persons acting on our behalf are expressly qualified in their entirety by the cautionary statements set forth above. Forward-looking statements speak only as of the date they are made, and we do not undertake or assume any obligation to update publicly any of these forward-looking statements to reflect actual results, new information or future events, changes in assumptions or changes in other factors affecting forward-looking statements, except to the extent required by applicable law. If we update one or more forward-looking statements, no inference should be drawn that we will make additional updates with respect to those or other forward-looking statements.
• our status as a real estate investment trust ("REIT") for federal tax purposes;
• changes in federal, state or local tax law, including legislative, administrative, regulatory or other actions affecting REITs.; and
• the impact of changes in the tax code as a result of recent U.S. federal income tax reform and uncertainty as to how some of those changes may be applied.
PART I
References in this Annual Report to "we", "our", "us", "InvenTrust" and the "Company" are references to InvenTrust Properties Corp., and our business and operations conducted through our direct or indirect subsidiaries. Unless otherwise noted, all dollar amounts are stated in thousands, except share, per share, square foot and per square foot amounts.
Item 1. Business
General
InvenTrust Properties Corp. is a Maryland corporation and has elected to be taxed, and currently qualifies, as a REIT for federal tax purposes. We were initially formed as Inland American Real Estate Trust, Inc. on October 4, 2004 and changed our name to InvenTrust Properties Corp. in April 2015. We were formed to own, manage, acquire and develop a diversified portfolio of commercial real estate located throughout the United States and to own properties in development and partially own properties through joint ventures, as well as investments in marketable securities and other assets. On February 3, 2015, we completed the spin-off of Xenia Hotels & Resorts, Inc. ("Xenia"), which held our remaining lodging properties. On April 26, 2016, we completed the spin-off of Highlands REIT, Inc. ("Highlands"), which held our remaining non-core properties, and on June 23, 2016, we completed the sale of University House Communities Group, Inc. ("University House"), formerly our student housing platform. As of December 31, 2017, we no longer own a diversified portfolio and are now focused on being a multi-tenant retail platform.
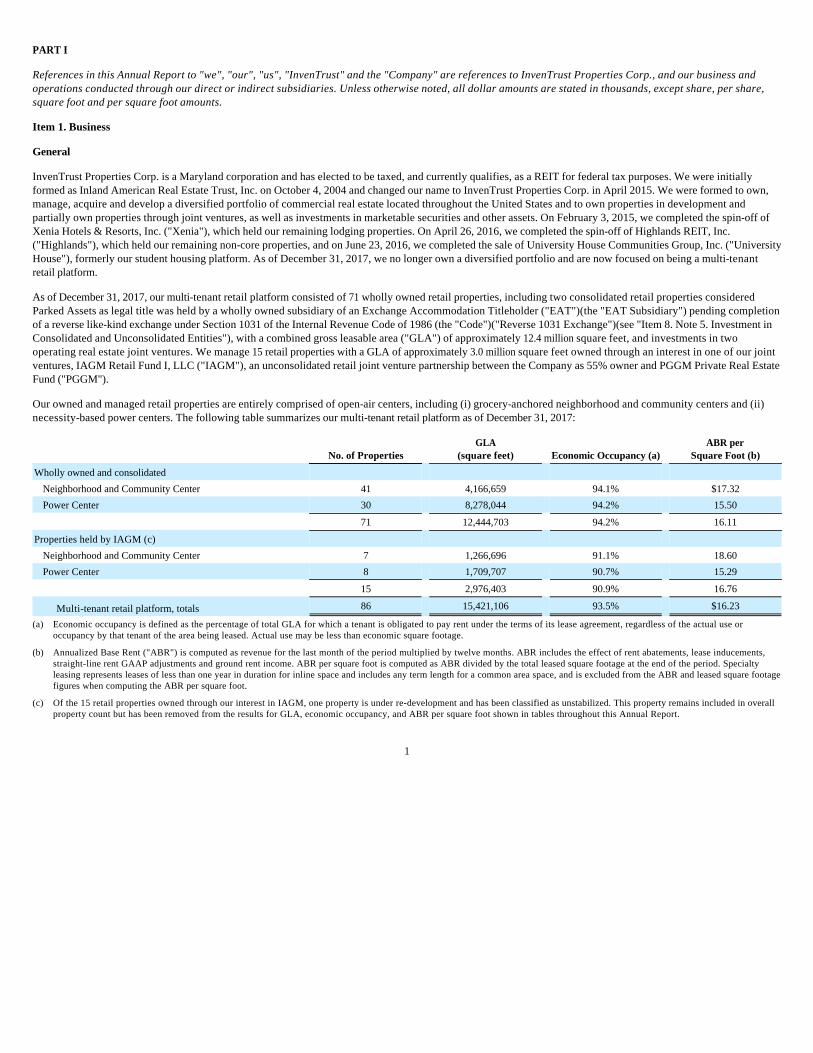
As of December 31, 2017, our multi-tenant retail platform consisted of 71 wholly owned retail properties, including two consolidated retail properties considered Parked Assets as legal title was held by a wholly owned subsidiary of an Exchange Accommodation Titleholder ("EAT")(the "EAT Subsidiary") pending completion of a reverse like-kind exchange under Section 1031 of the Internal Revenue Code of 1986 (the "Code")("Reverse 1031 Exchange")(see "Item 8. Note 5. Investment in Consolidated and Unconsolidated Entities"), with a combined gross leasable area ("GLA") of approximately 12.4 million square feet, and investments in two operating real estate joint ventures. We manage 15 retail properties with a GLA of approximately 3.0 million square feet owned through an interest in one of our joint ventures, IAGM Retail Fund I, LLC ("IAGM"), an unconsolidated retail joint venture partnership between the Company as 55% owner and PGGM Private Real Estate Fund ("PGGM").
Our owned and managed retail properties are entirely comprised of open-air centers, including (i) grocery-anchored neighborhood and community centers and (ii) necessity-based power centers. The following table summarizes our multi-tenant retail platform as of December 31, 2017:
1
No. of Properties GLA
(square feet) Economic Occupancy (a) ABR per
Square Foot (b)
Wholly owned and consolidated
Neighborhood and Community Center 41 4,166,659 94.1% $17.32
Power Center 30 8,278,044 94.2% 15.50
71 12,444,703 94.2% 16.11
Properties held by IAGM (c)
Neighborhood and Community Center 7 1,266,696 91.1% 18.60
Power Center 8 1,709,707 90.7% 15.29
15 2,976,403 90.9% 16.76
Multi-tenant retail platform, totals 86 15,421,106 93.5% $16.23
(a) Economic occupancy is defined as the percentage of total GLA for which a tenant is obligated to pay rent under the terms of its lease agreement, regardless of the actual use or occupancy by that tenant of the area being leased. Actual use may be less than economic square footage.
(b) Annualized Base Rent ("ABR") is computed as revenue for the last month of the period multiplied by twelve months. ABR includes the effect of rent abatements, lease inducements, straight-line rent GAAP adjustments and ground rent income. ABR per square foot is computed as ABR divided by the total leased square footage at the end of the period. Specialty leasing represents leases of less than one year in duration for inline space and includes any term length for a common area space, and is excluded from the ABR and leased square footage figures when computing the ABR per square foot.
(c) Of the 15 retail properties owned through our interest in IAGM, one property is under re-development and has been classified as unstabilized. This property remains included in overall property count but has been removed from the results for GLA, economic occupancy, and ABR per square foot shown in tables throughout this Annual Report.
Business Objective and Strategy
Our business objective is to operate as a pure-play multi-tenant retail REIT. We believe we are positioned to achieve our business objective by owning, leasing, redeveloping, acquiring and managing open-air centers in markets with above average population, employment and wage growth. We have identified 10-15 core markets within the metropolitan areas of Atlanta, Austin, Charlotte, Dallas-Fort Worth-Arlington, Denver, Houston, the greater Los Angeles and San Diego areas, suburban Washington D.C., Miami, Orlando, Raleigh-Durham, San Antonio and Tampa that meet this criteria.
We will seek to achieve our business objective and strategy through the following:
Acquire accretive retail properties in core markets. InvenTrust's targeted core markets include those with above average population, employment and wage growth. We believe these conditions create markets that will experience increasing demand for grocery-anchored and necessity-based retail centers which will enable us to capitalize on potential future rent increases while enjoying sustained occupancy at our centers.
Opportunistically dispose of retail properties with maximized values and retail properties not located in our core markets. We continue to opportunistically dispose of properties in low growth markets or where we believe the properties' values have been maximized. Through these types of dispositions, we expect the number of our markets will decrease from approximately 20 markets to our core 10-15 markets. Additionally, these types of dispositions will allow the Company to re-deploy resources into properties in our core markets.
Pursue re-development opportunities at our current retail properties. In 2016, we launched a coordinated program to increase rental income by maximizing existing re-development opportunities and identifying locations in our current multi-tenant retail platform where we can develop pad sites. In addition, we are working with our tenants to expand rentable square footage at select retail properties where demand warrants.
Maintain low leverage and a flexible capital structure. We continually evaluate the economic and credit environment and its impact on our business. We believe we are appropriately positioned to have significant liquidity to continue executing on our strategy. We expect to have the ability to repay, refinance or extend any of our debt, and we believe we have adequate sources of funds to meet short-term cash needs related to these refinancings or extensions.
We believe that the continuing refinement of our platform will position us for future success, maximize value for stockholders over time, and put us in a position to evaluate and ultimately execute on potential strategic transactions aimed at achieving liquidity and providing a return for our stockholders. While we believe in our ability to execute on our plan, the speed of its completion is uncertain and may be shortened or extended by external and macroeconomic factors including, among others, interest rate movements, local, regional, national and global economic performance, competitive factors, the impact of e-commerce on the retail industry, future retailer store closings, retailer bankruptcies, and government policy changes.
Competition
The commercial real estate retail market is highly competitive. We compete for tenants in all of our markets with other owners and operators of commercial rental properties. We compete based on a number of factors that include location, rental rates, suitability of the property’s design to tenants’ needs and the manner in which the property is operated and marketed. The number of competing properties in a particular market could have a material effect on a property’s occupancy levels, rental rates and operating income.
We compete with many third parties engaged in real estate investment activities, including other REITs, specialty finance companies, savings and loan associations, banks, mortgage bankers, insurance companies, mutual funds, institutional investors, investment banking firms, lenders, hedge funds, governmental bodies and other entities. There are also other REITs with investment objectives similar to ours and others may be formed in the future. In addition, these same entities seek financing through the same channels that we do. Therefore, we compete for funding in a market where funds for real estate investment may decrease, or grow less than the underlying demand.
2
• Acquire accretive retail properties in core markets;
• Opportunistically dispose of retail properties with maximized values and retail properties not located in our core markets;
• Pursue re-development opportunities at our current retail properties; and
• Maintain low leverage and a flexible capital structure.
Environmental Matters
Compliance with federal, state and local environmental laws has not had a material adverse effect on our business, assets, or results of operations, financial condition and ability to pay distributions, and we do not believe that our existing platform will require us to incur material expenditures to comply with these laws and regulations. However, we cannot predict the impact of unforeseen environmental contingencies or new or changed laws or regulations on our properties.
Tax Status
We have elected to be taxed as a REIT under Sections 856 through 860 of the Internal Revenue Code of 1986, as amended (the "Code"), beginning with the tax year ended December 31, 2005. Because we qualify for taxation as a REIT, we generally will not be subject to federal income tax on taxable income that we distribute to our stockholders. If we fail to qualify as a REIT in any taxable year, without the benefit of certain relief provisions, we will be subject to federal and state income tax on our taxable income at regular corporate rates. Even if we qualify for taxation as a REIT, we may be subject to certain state and local taxes on our income, property or net worth, respectively, and to federal income and excise taxes on our undistributed income.
Employees
As of December 31, 2017, we had 125 employees.
Access to Company Information
We electronically file our Annual Report on Form 10-K, Quarterly Reports on Form 10-Q, Current Reports on Form 8-K and all amendments to those reports with the Securities and Exchange Commission ("SEC"). The public may read and copy any of the reports that are filed with the SEC at the SEC’s Public Reference Room at 100 F Street, NE, Washington, DC 20549. The public may obtain information on the operation of the Public Reference Room by calling the SEC at (800)-SEC-0330. The SEC maintains a website at www.sec.gov that contains reports, proxy and information statements and other information regarding issuers that file electronically.
We make available, free of charge, by responding to requests addressed to our investor relations group, the Annual Report, Quarterly Reports on Form 10-Q, Current Reports on Form 8-K and all amendments to those reports on our website, www.inventrustproperties.com. These reports are available as soon as reasonably practicable after such material is electronically filed or furnished to the SEC.
Executive Officers of Registrant
Set forth below is information concerning our executive officers as of March 2, 2018.
Thomas P. McGuinness, 62. Mr. McGuinness currently serves as our President and Chief Executive Officer and is also a member of our board of directors. He has served as our President since we initiated our self-management transactions in March 2014 and as our Chief Executive Officer since November 2014. Prior to the self-management transactions, he served as our President and principal executive officer since September 2012 and President of our former business manager since January 2012. Prior to that time, Mr. McGuinness was the President of our former property manager. Mr. McGuinness previously served as the president of the Chicagoland Apartment Association and as the regional vice president of the National Apartment Association. He also served on the board of directors of the Apartment Building Owners and Managers Association, and was a trustee with the Service Employees’ Local No. 1 Health and Welfare Fund and its Pension Fund. Mr. McGuinness is an Executive Committee member of our retail joint venture entity IAGM.
Michael E. Podboy, 40. Mr. Podboy has served as our Executive Vice President - Chief Financial Officer, Chief Investment Officer and Treasurer since November 2015. He served as our Executive Vice President - Chief Investment Officer from November 2014 to November 2015 and as our Executive Vice President - Investments from March to November 2014. Mr. Podboy also served as the Senior Vice President of Non-Core Asset Management from January 2012 through March 2014 and the Vice President of Asset Management from May 2007 through December 2011, in each case for our former business manager. Mr. Podboy worked in public accounting and was a senior manager in the real estate division for KPMG LLP. He received a bachelor’s degree with a focus on accounting and computer science from the University of Saint Thomas in Minnesota. Mr. Podboy is an Executive Committee member of the Company’s retail joint venture entity IAGM.
3
Item 1A. Risk Factors
You should carefully consider each of the following risks described below and all of the other information in this Annual Report in evaluating us. Our business, financial condition, cash flows, results of operations and/or ability to pay distributions to our stockholders could be materially adversely affected by any of these risks. This Annual Report also contains forward-looking statements that involve risks and uncertainties. Our actual results could differ materially from those anticipated in these forward-looking statements as a result of certain factors, including the risks faced by us described below and elsewhere in this Annual Report. See “Special Note Regarding Forward-Looking Statements.”
Risks Related to Our Business
Economic, political and market conditions could negatively impact our business, results of operations and financial condition.
Our business may be affected by market and economic challenges experienced by the U.S. or global economies or the real estate industry as a whole (and, in particular, the retail sector); by the regional or local economic conditions in the markets in which our assets are located, including any dislocations in the credit markets; or by competitive business market conditions experienced by us and/or our retail tenants and shadow anchor retailers (anchor retailers that anchor our assets but whose properties are not owned or leased by us), such as challenges competing with e-commerce channels. For example, prolonged lower oil prices may negatively impact the economy in the Houston metropolitan area, where approximately 14% of our total annualized base rental income is concentrated. These conditions may materially affect our tenants, shadow anchor retailers, the value and performance of our assets and our ability to sell assets, as well as our ability to make principal and interest payments on, or refinance, outstanding debt when due. Challenging economic conditions may also impact the ability of certain of our tenants to enter into new leasing transactions or satisfy rental payments under existing leases. Specifically, these conditions may have the following consequences:
A consumer shift in retail shopping from brick and mortar stores to e-commerce, may have an adverse impact on our revenues and cash flow.
The majority of national retailers operating brick and mortar stores have made e-commerce sales an important part of their business model. Although many tenants at our retail properties either provide services or sell groceries, the shift to e-commerce sales may adversely impact our retail tenants' sales causing those retailers to adjust the size or number of retail locations in the future. This shift could adversely impact our occupancy and rental rates, which would, in turn, adversely impact our revenues and cash flows.
Our management and our board of directors are working on positioning the Company to explore various strategic transactions designed to provide liquidity for our stockholders. Such strategic transactions may not occur, and even if they do occur, they may not be successful in increasing stockholder value or providing liquidity for our stockholders.
4
• the financial condition of our tenants may be adversely affected, which may result in us having to increase concessions, reduce rental rates or make capital improvements in order to maintain occupancy levels or to negotiate for reduced space needs, which may result in a decrease in our occupancy levels and cash flows;
• significant job loss may occur, which may decrease demand for space and result in lower occupancy levels, which will result in decreased revenues and which could diminish the value of assets, which depend, in part, upon the cash flow generated by our assets;
• an increase in the number of bankruptcies or insolvency proceedings of our tenants and lease guarantors, which could delay our efforts to collect rent and any past due balances under the relevant leases and ultimately could preclude collection of these sums;
• our ability to borrow on terms and conditions that we find acceptable may be limited;
• consolidation in the retail sector, which could negatively impact the rental rates we are able to charge and occupancy levels;
• the amount of capital that is available to finance assets could diminish, which, in turn, could lead to a decline in asset values generally, slow asset transaction activity, and reduce the loan to value ratio upon which lenders are willing to lend;
• the value of certain of our assets may decrease below the amounts we paid for them, which would limit our ability to dispose of assets at attractive prices or for potential buyers to obtain debt financing secured by these assets and could reduce our ability to finance our business; and
• changing government regulations, including tax policies.
Our management and our board of directors are working on positioning the Company to explore various strategic transactions designed to ultimately provide liquidity for our stockholders. We do not know the timing or the form that any such strategic transaction might take. In addition, strategic transaction options are subject to factors that are outside of our control, such as economic and market conditions. Our board of directors may decide to apply to have our shares of common stock listed for trading on a national securities exchange or included for quotation on a national market system; seek to sell all or substantially all our assets, liquidate or engage in a merger transaction; contribute substantial assets to a joint venture in exchange for cash; sell our assets individually or approve a strategic transaction whose form we cannot yet reasonably anticipate. It is possible that no such strategic transaction will ever occur. Even if a strategic transaction does occur, it may not be successful in increasing share value or providing liquidity for our stockholders, and may have the opposite effect, eroding share value and failing to deliver any meaningful liquidity, in which case your investment would lose value.
Our ongoing business strategy involves the selling of assets; however, we may be unable to sell an asset at acceptable terms and conditions, if at all.
We intend to continue to hold our assets as long-term investments until such time as we determine that a sale or other disposition appears to be advantageous to achieve our investment objectives or until it appears such objectives will not be met. As we look to sell these assets, general economic conditions, market conditions, and asset-specific issues may negatively affect the value of our assets and therefore reduce our return on the investment or prevent us from selling the asset on acceptable terms or at all. Some of our leases contain provisions giving the tenant a right to purchase the asset, such as a right of first offer or right of first refusal, which may lessen our ability to freely control the sale of the asset. Debt levels currently exceed the value of certain assets and debt levels on other assets may exceed the value of those assets in the future, making it more difficult for us to rent, refinance or sell the assets, which may lead to the asset being subject to foreclosure, a deed in lieu of foreclosure or another transaction with a lender. In addition, real estate investments are relatively illiquid and often cannot be sold quickly, limiting our ability to sell our assets when we decide to do so, or in response to such changing economic or asset-specific issues. Further, economic conditions may prevent potential purchasers from obtaining financing on acceptable terms, if at all, thereby delaying or preventing our ability to sell our assets.
Our ongoing strategy depends, in part, upon completing future acquisitions and dispositions, and we may not be successful in identifying attractive acquisition opportunities and consummating these transactions.
As part of our strategy, we intend to tailor and grow our multi-tenant retail platform. We cannot assure you that we will be able to identify opportunities or complete transactions on commercially reasonable terms or at all, or that we will actually realize any anticipated benefits from such acquisitions or investments. There may be high barriers to entry in many key markets and scarcity of available acquisition and investment opportunities in desirable locations. We face significant competition for attractive investment opportunities from an indeterminate number of other real estate investors, including investors with significant capital resources such as domestic and foreign corporations and financial institutions, sovereign wealth funds, public and private REITs, private institutional investment funds, domestic and foreign high-net-worth individuals, life insurance companies and pension funds. As a result of competition, we may be unable to acquire additional properties as we desire or the purchase price may be significantly elevated. Similarly, we cannot assure you that we will be able to obtain financing for acquisitions or investments on attractive terms or at all, or that the ability to obtain financing will not be restricted by the terms of our credit facility or other indebtedness we may incur.
Additionally, we regularly review our business to identify properties or other assets that we believe are in markets or have certain characteristics that may not benefit us as much as properties in other markets or with different characteristics. One of our strategies is to selectively dispose of retail properties and use sale proceeds to fund our growth in markets and with properties that will enhance our multi-tenant retail platform. We cannot assure you that we will be able to consummate any such sales on commercially reasonable terms or at all, or that we will actually realize any anticipated benefits from such sales. Additionally, we may be unable to successfully identify attractive and suitable replacement assets even if we are successful in completing such dispositions. We may face delays in reinvesting net sales proceeds in new assets, which would impact the return we earn on our assets. Dispositions of real estate assets can be particularly difficult in a challenging economic environment when uncertainties exist about the impact of e-commerce on retailers and when financing alternatives are limited for potential buyers. Our inability to sell assets, or to sell such assets at attractive prices, could have an adverse impact on our ability to realize proceeds for reinvestment. In addition, even if we are successful in consummating sales of selected retail properties, such dispositions may result in losses.
Any such acquisitions, investments or dispositions could also demand significant attention from management that would otherwise be available for our regular business operations, which could harm our business.
5
Our ongoing strategy depends, in part, on expanding, developing or re-developing some of our current retail properties. We face risks with the expansion, development and re-development of properties that may impact our financial condition and results of operations.
We seek to expand, develop and re-develop some of our existing properties and such activity is subject to various risks. We may not be successful in identifying and pursuing expansion, development and re-development opportunities. In addition, like newly-acquired properties, expanded, developed and re-developed properties may not perform as well as expected. Risks include:
If an expansion, development, or re-development project is unsuccessful, either because it is not meeting our expectations when operational or was not completed according to project planning, we could lose our investment in the project and our results of operations could be materially adversely affected.
Our transition to an integrated operating platform may not be successful in the long term.
We completed our transition to an integrated operating platform with the self-management transaction at the beginning of 2015. To operate effectively as an integrated operating platform, we may incur additional costs or experience challenges. There may also be unforeseen costs, expenses and difficulties associated with self-providing the services previously provided by our former business manager and our former property managers. Such difficulties could cause us to incur additional costs, and our management’s attention could be diverted from most effectively managing our business and properties.
We are responsible for paying the salaries and benefits (including employee benefit plan costs) of all our employees as well as costs associated with legal, accounting, information technology, human resources, general office and other services. In addition, as a result of the dispositions of substantially all of our lodging, student housing and non-core assets in 2015 and 2016, our asset base has significantly decreased and therefore we no longer have the same level of cash flows available to us to pay our general and administrative expenses, some of which are relatively fixed. We also have become subject to potential liabilities that are commonly faced by employers, such as workers’ disability and compensation claims, potential labor disputes and other employee-related grievances. We have also issued equity awards to directors and employees, which dilute your investment. As a consequence, we cannot be certain that we will be successful managing our risks, costs and expenses, and that our financial performance will be maintained or improve. In addition, our financial condition and ability to pay distributions could be harmed.
If we lose or are unable to retain and obtain key personnel, our ability to implement our business strategies could be delayed or hindered.
We believe that our future success depends, in large part, on our ability to retain and hire highly-skilled managerial and operating personnel. Competition for persons with managerial and operational skills is intense, and we cannot assure you that we will be successful in retaining or attracting skilled personnel. If we lose or are unable to obtain the services of our executive officers and other key personnel, or do not establish or maintain the necessary strategic relationships, our ability to implement our business strategy could be delayed or hindered.
We are increasingly dependent on information technology ("IT"), and potential cyber-attacks, security problems, or other disruption present risks.
A cyber incident is considered to be any adverse event that threatens the confidentiality, integrity or availability of our information resources. More specifically, a cyber incident is an intentional attack or an unintentional event that can include an intruder gaining unauthorized access to systems to disrupt operations, corrupt data or steal confidential information. As our reliance on technology has increased, so have the risks posed to our systems, both internal and those we have outsourced. Our three primary risks that could directly result from the occurrence of a cyber incident include operational interruption, damage to
6
• Construction costs of a project may be higher than projected, potentially making a project unfeasible or unprofitable;
• We may lose cash flow during re-development periods;
• We may not be able to obtain financing, if needed, or to refinance loans on favorable terms, if at all;
• We may be unable to obtain zoning, occupancy or other governmental approvals or permits;
• We may be unable to find tenants for the properties;
• Occupancy rates and rents may not meet our projections and a project may not be profitable; and
• We may need the consent of third parties, such as anchor tenants, mortgage lenders and joint venture partners for such projects, and those consents may be withheld.
our relationships with our tenants and private data exposure. Our financial results and reputation may be negatively impacted by such an incident.
A failure of our IT infrastructure could adversely impact our business and operations.
We rely upon the capacity, reliability and security of our IT infrastructure and our ability to expand and continually update this infrastructure in response to changing needs of our business. We continue to face the challenge of integrating new systems and hardware into our operations. If there are technological impediments, unforeseen complications, errors or breakdowns in the IT infrastructure, the disruptions could have an adverse effect on our business and financial condition.
We disclose funds from operations ("FFO"), a non-GAAP (U.S. generally accepted accounting principles, or "GAAP") financial measure, in communications with investors, including documents filed with the SEC; however, FFO is not equivalent to our net income or loss as determined under GAAP, and you should consider GAAP measures to be more relevant to our operating performance.
We use internally, and disclose to investors, FFO, a non-GAAP financial measure. FFO is not equivalent to our net income or loss as determined under GAAP, and investors should consider GAAP measures to be more relevant to our operating performance. Because of the manner in which FFO differs from GAAP net income or loss, it may not be an accurate indicator of our operating performance. Furthermore, FFO is not necessarily indicative of cash flow available to fund cash needs and should not be considered as an alternative to cash flows from operations as an indication of our liquidity, or indicative of funds available to fund our cash needs, including our ability to make distributions to our stockholders. Neither the SEC nor any other regulatory body has passed judgment on the acceptability of the adjustments that we use to calculate FFO. Also, because not all companies calculate FFO the same way, comparisons with other companies may not be meaningful.
Risks Related to our Real Estate Assets
There are inherent risks with investments in real estate, including the relative illiquidity of such investments.
Investments in real estate are subject to varying degrees of risk. For example, an investment in real estate cannot generally be quickly sold, and we cannot predict whether we will be able to sell any asset we desire to on the terms set by us or acceptable to us, or the length of time needed to find a willing purchaser and to close the sale of such asset. Moreover, the Code imposes restrictions on a REIT’s ability to dispose of assets that are not applicable to other types of real estate companies. In particular, the tax laws applicable to REITs require that we hold our assets for investment, rather than primarily for sale in the ordinary course of business, which may cause us to forego or defer sales of assets that otherwise would be in our best interests. Therefore, we may not be able to vary our platform promptly in response to changing economic, financial and investment conditions and dispose of assets at opportune times or on favorable terms, which may adversely affect our cash flows and our ability to make distributions to stockholders.
Investments in real estate are also subject to adverse changes in general economic conditions. Among the factors that could impact our assets and the value of an investment in us are:
Our assets may be subject to impairment charges that may materially and adversely affect our financial results.
Economic and other conditions may adversely impact the valuation of our assets, resulting in impairment charges that could
7
• risks associated with the possibility that cost increases will outpace revenue increases and that in the event of an economic slowdown, the high proportion of fixed costs will make it difficult to reduce costs to the extent required to offset declining revenues;
• changes in tax laws and property taxes, or an increase in the assessed valuation of an asset for real estate tax purposes;
• adverse changes in the federal, state or local laws and regulations applicable to us, including those affecting zoning, fuel and energy consumption, water and environmental restrictions, and the related costs of compliance;
• changing market demographics;
• an inability to finance real estate assets on favorable terms, if at all;
• the ongoing need for owner-funded capital improvements and expenditures to maintain or upgrade assets;
• fluctuations in real estate values or potential impairments in the value of our assets;
• natural disasters, such as earthquakes, floods or other insured or uninsured losses; and
• changes in interest rates and availability, cost and terms of financing.
have a material adverse effect on our results of operations and earnings. On a regular basis, we evaluate our assets for impairments based on various factors, including changes in the projected cash flows of such assets and market conditions. If we determine that an impairment has occurred, we would be required to make an adjustment to the net carrying value of the asset, which could have a material adverse effect on our results of operations in the accounting period in which the adjustment is made. Furthermore, changes in estimated future cash flows due to a change in our plans, policies, or views of market and economic conditions could result in the recognition of additional impairment losses for already impaired assets, which, under the applicable accounting guidance, could be substantial and could materially adversely affect our results of operations.
We depend on tenants for our revenue, and accordingly, lease terminations, tenant defaults and bankruptcies could adversely affect the income produced by our assets.
Our business and financial condition depend on the financial stability of our tenants. Certain economic conditions may adversely affect one or more of our tenants. For example, business failures, downsizings, changing consumer tastes and e-commerce can contribute to reduced consumer demand for retail products and services, which would impact tenants of our retail properties. In addition, our retail properties typically are anchored by large, nationally recognized tenants, any of which may experience a downturn in its business that may weaken significantly its financial condition and thus the performance of the applicable shopping center. Further, mergers or consolidations among large retail establishments could result in the closure of existing stores or duplicate or geographically overlapping store locations, which could include tenants at our retail properties.
As a result of these factors, our tenants may delay lease commencements, decline to extend or renew their leases upon expiration, fail to make rental payments, or declare bankruptcy. Individual tenants may lease more than one asset or space at more than one asset. As a result, the financial failure of one tenant could increase vacancy at more than one asset or cause more than one lease to become non-performing. Any of these actions could result in the termination of the tenants’ leases, the expiration of existing leases without renewal or the loss of rental income attributable to the terminated or expired leases, any of which could have a material adverse effect on our financial condition, cash flows, results of operations, and our ability to pay distributions.
In the event of a tenant default or bankruptcy, we may experience delays in enforcing our rights as a landlord and may incur substantial costs in protecting our investment and re-leasing our asset. Specifically, a bankruptcy filing by, or relating to, one of our tenants or a lease guarantor would bar efforts by us to collect pre-bankruptcy debts from that tenant or lease guarantor, or its asset, unless we receive an order permitting us to do so from the bankruptcy court. In addition, we cannot evict a tenant solely because of bankruptcy. The bankruptcy of a tenant or lease guarantor could delay our efforts to collect past-due balances under the relevant leases, and could ultimately preclude collection of these sums. If a lease is rejected by a tenant in bankruptcy, we would have only a general, unsecured claim for damages. An unsecured claim would only be paid to the extent that funds are available and only in the same percentage as is paid to all other holders of general, unsecured claims. Restrictions under the bankruptcy laws further limit the amount of any other claims that we can make if a lease is rejected. As a result, it is likely that we would recover substantially less than the full value of the remaining rent during the term.
Our platform is subject to geographic concentration, which exposes us to risks of oversupply and competition in the relevant markets. Significant increases in the supply of certain property types without corresponding increases in demand in those markets could have a material adverse effect on our financial condition, our results of operations and our ability to pay distributions.
As of December 31, 2017, approximately 14%, 11%, and 10% of the total annualized base rental income of our portfolio was generated by properties located in the Houston, Dallas-Fort Worth-Arlington, and Austin metropolitan areas, respectively. An oversupply of retail properties in any of these markets, without a corresponding increase in demand, could have a material adverse effect on our financial condition, our results of operations and our ability to pay distributions.
Real estate is a competitive business.
We compete with numerous developers, owners and operators of commercial real estate assets in the leasing market, many of which own assets similar to, and in the same market areas as, our assets. In addition, some of these competitors may be willing to accept lower returns on their investments than we are, and many have greater resources than we have and may enjoy significant competitive advantages that result from, among other things, a lower cost of capital and enhanced operating efficiencies. Principal factors of competition include rents charged, attractiveness of location, the quality of the asset and breadth and quality of services provided. Our success depends upon, among other factors, trends affecting national and local economies, the financial condition and operating results of current and prospective tenants and customers, availability and cost of capital, construction and renovation costs, taxes, governmental regulations, legislation, job creation and population trends.
We also face competition from other real estate investment programs for buyers. We perceive there to be a smaller population
8
of potential buyers for certain types of assets that comprise our portfolio in comparison to assets in other real estate sectors, which may make it challenging for us to sell certain of our retail properties.
We may be unable to renew leases, lease vacant space or re-let space as leases expire, thereby increasing or prolonging vacancies, which could adversely affect our financial condition, cash flows and results of operations.
Our retail properties are currently 93.5% occupied. As of December 31, 2017, leases representing approximately 6.3% and 13.4% of our expiring gross leasable area of 14,418,402 square feet of our retail properties are scheduled to expire in 2018 and 2019, respectively (not taking into account any renewal options). We cannot assure you that leases will be renewed or that our properties will be re-leased on terms equal to or better than the current terms, or at all. We also may not be able to lease space which is currently not occupied on acceptable terms and conditions, if at all. In addition, some of our tenants have leases that include early termination provisions that permit the lessee to terminate all or a portion of its lease with us after a specified date or upon the occurrence of certain events with little or no liability to us. We may be required to offer substantial rent abatements, tenant improvements, early termination rights or below-market renewal options to retain these tenants or attract new ones. It is possible that, in order to lease currently vacant space, or space that may become vacant, we will be required to make rent or other concessions to tenants, accommodate requests for renovations, make tenant improvements and other improvements or provide additional services to our tenants. As a result, we may have to make significant capital or other expenditures in order to retain tenants whose leases expire or to attract new tenants. Portions of our assets may remain vacant for extended periods of time. If the rental rates for our assets decrease, our existing tenants do not renew their leases or we do not re-lease a significant portion of our available space and space for which leases will expire, our financial condition, cash flows and results of operations could be adversely affected.
We may be required to make significant expenditures to improve our properties in order to retain and attract tenants.
In order to retain tenants whose leases are expiring or to attract replacement tenants, we may be required to provide rent or other concessions, accommodate requests for renovations, build-to-suit remodeling and other improvements or provide additional services. As a result, we may have to pay for significant leasing costs or tenant improvements. Additionally, if we have insufficient capital reserves, we may need to raise capital to fund these expenditures. If we are unable to do so, we may be unable to fund the necessary or desirable improvements to our properties. This could result in non-renewals by tenants upon the expiration of their leases or an inability to attract new tenants, which would result in declines in revenues from operations and adversely affect our cash flows and results of operations.
Furthermore, deferring necessary improvements to a property may cause the property to suffer from a greater risk of obsolescence or a decline in value, or a greater risk of decreased cash flow as a result of fewer potential tenants being attracted to the property. If this happens, we may not be able to maintain projected rental rates for affected properties, and our results of operations may be negatively impacted.
Any difficulties in obtaining capital necessary to make tenant improvements, pay leasing commissions and make capital improvements at our assets could materially and adversely affect our financial condition and results of operations.
Ownership of real estate is a capital intensive business that requires significant capital expenditures to operate, maintain and renovate assets. Access to the capital that we need to lease, maintain and renovate existing assets is critical to the success of our business. We may not be able to fund tenant improvements, pay leasing commissions or fund capital improvements at our existing assets solely from cash provided from our operating activities. Consequently, we may have to rely upon the availability of debt, net proceeds from the dispositions of our assets or equity capital to fund tenant improvements, pay leasing commissions or fund capital improvements. The inability to do so could impair our ability to compete effectively and harm our business.
We are subject to risks from natural disasters and severe weather.
Natural disasters and severe weather such as earthquakes, wildfires, tornadoes, hurricanes, blizzards, hailstorms or floods may result in significant damage to our properties, disrupt operations at our properties and adversely affect both the value of our properties and the ability of our tenants and operators to make their scheduled rent payments to us. The extent of our casualty losses and loss in operating income in connection with such events is a function of the severity of the event and the total amount of exposure in the affected area. These losses may not be insured or insurable at commercially reasonable rates. When we have a geographic concentration, a single catastrophe or destructive weather event affecting a region may have a significant negative effect on our financial condition, results of operations, and cash flows. As a result, our operating and financial results may vary significantly from one period to the next. We also are exposed to the risk of an increased need for the maintenance and repair of our buildings due to inclement weather.
9
We may obtain only limited warranties when we purchase a property and would have only limited recourse if our due diligence did not identify any issues that lower the value of our property.
The seller of a property often sells the property to us in its "as is" condition on a "where is" basis and "with all faults," without any warranties of merchantability or fitness for a particular use or purpose. In addition, purchase agreements may contain only limited warranties, representations and indemnifications that will only survive for a limited period after the closing. The purchase of properties with limited warranties increases the risk that we may lose some or all of our invested capital in the property, as well as the loss of rental income from that property, and may also require additional investment to make the property suitable and competitive.
Actions of our joint venture partners could negatively impact our performance.
With respect to our joint venture investments, we are not in a position to exercise sole decision-making authority regarding the property or the joint venture. Consequently, our joint venture investments may involve risks not present with other methods of investing in real estate. For example, our joint venture partner may have economic or business interests or goals which are or which become inconsistent with our economic or business interests or goals or may take action contrary to our instructions or requests or contrary to our policies or objectives. We have experienced these events from time to time with our former joint venture partners, which in some cases has resulted in litigation. An adverse outcome in any lawsuit could have a material effect on our business, financial condition or results of operations. In addition, any litigation increases our expenses and prevents our officers and directors from focusing their time and effort on our portfolio and business plans. Our relationships with our joint venture partners are contractual in nature. These agreements may restrict our ability to sell our interest when we desire or on advantageous terms and may be terminated or dissolved and, in each event, we may not continue to own or operate the interests or assets underlying the relationship or may need to purchase the interests or assets at an above-market price to continue ownership. Such joint venture investments may involve other risks not otherwise present with a direct investment in real estate, including, for example:
An increase in real estate taxes may decrease our income from properties.
From time to time, the amount we pay for property taxes increases as either property values increase or assessment rates are adjusted. Increases in a property’s value or in the assessment rate result in an increase in the real estate taxes due on that property. If we are unable to pass the increase in taxes through to our tenants, our net operating income for the property will decrease.
Uninsured losses or premiums for insurance coverage may adversely affect a stockholder’s returns.
Various types of catastrophic losses, like windstorms, earthquakes and floods, and losses from foreign terrorist activities may not be insurable or may not be economically insurable. Even when insurable, these policies may have high deductibles and/or high premiums. Lenders may require such insurance. Our failure to obtain such insurance could constitute a default under loan agreements, and/or our lenders may force us to obtain such insurance at unfavorable rates, which could materially and adversely affect our profitability.
In the event of a substantial loss, our insurance coverage may not be sufficient to cover the full current market value or replacement cost of our lost investment. Should an uninsured loss or a loss in excess of insured limits occur, we could lose all or a portion of the capital we have invested in an asset, as well as the anticipated future revenue from the asset. In that event, we might nevertheless remain obligated for any mortgage debt or other financial obligations related to the asset. Inflation, changes in building codes and ordinances, environmental considerations and other factors might require us to come out of pocket to replace or renovate an asset after it has been damaged or destroyed. Under those circumstances, the insurance proceeds we receive might be inadequate to restore our economic position on the damaged or destroyed property, which could materially and adversely affect our profitability.
10
• the possibility that the investment may require additional capital that we or our joint venture partner does not have, which lack of capital could affect the performance of the investment or dilute our interest if our joint venture partner were to contribute our share of the capital;
• the possibility that our joint venture partner in an investment might breach a loan agreement or other agreement or otherwise, by action or inaction, act in a way detrimental to us or the investment;
• the possibility that we may incur liabilities as the result of the action taken by our joint venture partner; or
• that such joint venture partner may exercise buy/sell rights that force us to either acquire the entire investment, or dispose of our share, at a time, on terms and/or at a price that may not be consistent with our investment objectives.
In addition, insurance risks associated with potential terrorist acts could sharply increase the premiums we pay for coverage against property and casualty claims. With the enactment of the Terrorism Risk Insurance Program Reauthorization Act of 2007, United States insurers cannot exclude conventional, chemical, biological, nuclear and radiation terrorism losses. These insurers must make terrorism insurance available under their property and casualty insurance policies; however, this legislation does not regulate the pricing of such insurance. In many cases, mortgage lenders have begun to insist that commercial property owners purchase coverage against terrorism as a condition of providing mortgage loans. Such insurance policies may not be available at a reasonable cost, which could inhibit our ability to finance or refinance our assets. In such instances, we may be required to provide other financial support to cover potential losses. We may not have adequate coverage for such losses, which could materially and adversely affect our profitability.
We could incur material costs related to government regulation and litigation with respect to environmental matters, which could materially and adversely affect our revenues and profitability.
Our assets are subject to various U.S. federal, state and local environmental laws that impose liability for contamination. Under these laws, governmental entities have the authority to require us, as the current or former owner of an asset, to perform or pay for the clean-up of contamination (including hazardous substances, asbestos and asbestos-containing materials, waste or petroleum products) at, on, under or emanating from the asset and to pay for natural resource damages arising from such contamination. Such laws often impose liability without regard to whether the owner or operator or other responsible party knew of, or caused such contamination, and the liability may be joint and several. Because these laws also impose liability on persons who owned an asset at the time it became contaminated, it is possible we could incur cleanup costs or other environmental liabilities even after we sell assets. Contamination at, on, under or emanating from our assets also may expose us to liability to private parties for costs of remediation and/or personal injury or property damage. In addition, environmental laws may create liens on contaminated sites in favor of the government for damages and costs it incurs to address such contamination. If contamination is discovered on our assets, environmental laws also may impose restrictions on the manner in which the assets may be used or businesses may be operated, and these restrictions may require substantial expenditures. Moreover, environmental contamination can affect the value of an asset and, therefore, an owner’s ability to borrow funds using the asset as collateral or to sell the asset on favorable terms or at all. Furthermore, persons who sent waste to a waste disposal facility, such as a landfill or an incinerator, may be liable for costs associated with cleanup of that facility.
In addition, our assets are subject to various federal, state, and local environmental, health and safety laws and regulations that address a wide variety of issues, including, but not limited to, storage tanks, air emissions from emergency generators, storm water and wastewater discharges, lead-based paint, mold and mildew, and waste management. We may handle and use hazardous or regulated substances and wastes as part of their operations, which substances and wastes are subject to regulation. We may incur costs to comply with these environmental, health and safety laws and regulations and could be subject to fines and penalties for non-compliance with applicable requirements.
Environmental laws in the U.S. also require that owners or operators of buildings containing asbestos properly manage and maintain the asbestos, adequately inform or train those who may come into contact with asbestos and undertake special precautions, including removal or other abatement, if that asbestos is disturbed during building renovation or demolition. These laws may impose fines and penalties on building owners or operators who fail to comply with these requirements and may allow third parties to seek recovery from owners or operators for personal injury associated with exposure to asbestos. Some of our assets may contain asbestos-containing building materials.
When excessive moisture accumulates in buildings or on building materials, mold growth may occur, particularly if the moisture problem remains undiscovered or is not addressed over a period of time. Some molds may produce airborne toxins or irritants. Indoor air quality issues can also stem from inadequate ventilation, chemical contamination from indoor or outdoor sources, and other biological contaminants such as pollen, viruses and bacteria. Indoor exposure to airborne toxins or irritants above certain levels can be alleged to cause a variety of adverse health effects and symptoms, including allergic or other reactions. As a result, the presence of significant mold or other airborne contaminants at any of our assets could require us to undertake a costly remediation program to contain or remove the mold or other airborne contaminants from the affected asset or increase indoor ventilation. In addition, the presence of significant mold or other airborne contaminants could expose us to liability to third parties if property damage or personal injury occurs.
Liabilities and costs associated with environmental contamination at, on, under or emanating from our assets, defending against claims related to alleged or actual environmental issues, or complying with environmental, health and safety laws could be material and could materially and adversely affect us. We can make no assurances that changes in current laws or regulations or future laws or regulations will not impose additional or new material environmental liabilities or that the current environmental condition of our assets will not be affected by our operations, the condition of the assets in the vicinity of our assets, or by third parties unrelated to us. The discovery of material environmental liabilities at our assets could subject us to unanticipated significant costs, which could significantly reduce or eliminate our profitability and the cash available for distribution to our
11
stockholders.
Compliance or failure to comply with the Americans with Disabilities Act and other safety regulations and requirements could result in substantial costs.
Under the Americans with Disabilities Act of 1990 and the Accessibility Guidelines promulgated thereunder, which we refer to collectively as the ADA, all public accommodations must meet various federal requirements related to access and use by disabled persons. Compliance with the ADA’s requirements could require removal of access barriers, and non-compliance could result in the U.S. government imposing fines or in private litigants winning damages.
Our assets are also subject to various federal, state and local regulatory requirements, such as state and local fire and life safety requirements. If we fail to comply with these requirements, we could incur fines or private damage awards. We do not know whether existing requirements will change or whether compliance with future requirements would require significant unanticipated expenditures that would affect our cash flow and results of operations. If we incur substantial costs to comply with the ADA or other safety regulations and requirements, it could materially and adversely affect our revenues and profitability.
Risks Related to our Retail Assets
Our retail properties face considerable competition for the tenancy of our lessees and the business of retail shoppers.
There are numerous shopping venues that compete with our retail properties in attracting retailers to lease space and shoppers to patronize their properties. In addition, our retail tenants face changing consumer preferences and increasing competition from other forms of retailing, such as e-commerce websites and catalogues as well as other retail centers located within the geographic market areas of our retail properties that compete with our properties for customers. All these factors may adversely affect our tenants’ cash flows and, therefore, their ability to pay rent. To the extent that our tenants do not pay their rent or do not pay on a timely basis, it could have a negative impact on our financial condition and result of operations.
Retail conditions may adversely affect our income and our ability to make distributions to our stockholders.
A retail property’s revenues and value may be adversely affected by a number of factors, many of which apply to real estate investment generally, but which also include trends in the retail industry and perceptions by retailers or shoppers of the safety, convenience and attractiveness of the retail property. Our retail properties are public locations, and any incidents of crime or violence, including acts of terrorism, could result in a reduction of business traffic to tenant stores in our properties. Any such incidents may also expose us to civil liability or harm our reputation. In addition, to the extent that the investing public has a negative perception of the retail sector, the value of our retail properties may be negatively impacted.
An economic downturn could have an adverse impact on the retail industry generally. Slow or negative growth in the retail industry could result in defaults by retail tenants, which could have an adverse impact on our business, financial condition or result of operations.
An economic downturn could have an adverse impact on the retail industry generally. As a result, the retail industry could face reductions in sales revenues and increased bankruptcies. Adverse economic conditions may result in an increase in distressed or bankrupt retail companies, which in turn would result in an increase in defaults by tenants at our commercial properties. Such conditions may also affect shadow anchor retailers in some of our centers, which we cannot control. Although we do not generate revenue from shadow anchor retailers, their presence drives traffic to some of our centers. Additionally, slow economic growth could hinder new entrants into the retail market, which may make it difficult for us to fully lease our real properties. Tenant defaults and decreased demand for retail space would have an adverse impact on the value of our multi-tenant retail properties and our results of operations.
Our success depends on the success and continued presence of our anchor tenants.
Our properties are largely dependent on the operational success of their anchor tenants (those occupying 10,000 square feet or more). Anchor tenants occupy significant amounts of square footage, pay a significant portion of the total rents at a property and contribute to the success of other tenants by drawing consumers to a property. Our net income could be adversely affected by the loss of revenues in the event a significant tenant becomes bankrupt or insolvent, experiences a downturn in its business, materially defaults on its leases, does not renew its leases as they expire, or renews at a lower rental rate. In addition, if a significant tenant vacates a property, co-tenancy clauses may allow other tenants to modify or terminate their rent or lease obligations. Co-tenancy clauses have several variants and may allow a tenant to pay reduced levels of rent until a certain number of tenants open their stores within the same property.
12

We may be restricted from re-leasing space at our multi-tenant retail properties.
Leases with retail tenants may contain provisions giving the particular tenant the exclusive right to sell particular types of merchandise or provide specific types of services within the particular retail center. These provisions may limit the number and types of prospective tenants interested in leasing space in a particular retail property.
Our revenue will be impacted by the success and economic viability of our anchor retail tenants. Our reliance on single or significant tenants in certain buildings may decrease our ability to lease vacated space and adversely affect the returns on your investment.
In the retail sector, a tenant occupying all or a large portion of the gross leasable area of a retail center, commonly referred to as an anchor tenant, may become insolvent, may suffer a downturn in business or may decide not to renew its lease. Any of these events could result in a reduction or cessation in rental payments to us, which would adversely affect our financial condition and results of operations. A lease termination by an anchor tenant also could result in lease terminations or reductions in rent by other tenants whose leases may permit cancellation or rent reduction if another tenant’s lease is terminated. Similarly, the leases of some anchor tenants may permit the anchor tenant to transfer its lease to another retailer. The transfer to a new anchor tenant could reduce customer traffic in the retail center and thereby reduce the income generated by that retail center. A transfer of a lease to a new anchor tenant could also allow other tenants to make reduced rental payments or to terminate their leases in accordance with lease terms. If we are unable to re-lease the vacated space to a new anchor tenant, we may incur additional expenses in order to remodel the space to be able to re-lease the space to more than one tenant.
Our retail leases may contain co-tenancy provisions, which would have an adverse effect on our operation of such retail properties if exercised.
With respect to any multi-tenant retail properties we own or acquire, we may enter into leases containing co-tenancy provisions. Co-tenancy provisions may allow a tenant to exercise certain rights if, among other things, another tenant fails to open for business, delays its opening or ceases to operate, or if a percentage of the property’s gross leasable space or a particular portion of the property is not leased or subsequently becomes vacant. A tenant exercising co-tenancy rights may be able to abate minimum rent, reduce its share or the amount of its payments for common area operating expenses and property taxes or cancel its lease.
Risks Associated with Debt Financing
Volatility in the financial markets and challenging economic conditions could adversely affect our ability to secure debt financing on attractive terms and our ability to service any future indebtedness that we may incur.
The domestic and international commercial real estate debt markets could become very volatile as a result of, among other things, the tightening of underwriting standards by lenders and credit rating agencies, increased interest rates and changing regulations. This could result in less availability of credit and increasing costs for what is available. If the overall cost of borrowing increases, either by increases in the index rates or by increases in lender spreads, the increased costs may result in lower overall economic returns and potentially reducing future cash flow available for distribution. If these disruptions in the debt markets were to persist, our ability to borrow funds to finance activities related to real estate assets could be negatively impacted. In addition, we may find it difficult, costly or impossible to refinance indebtedness that is maturing.
Further, economic conditions could negatively impact commercial real estate fundamentals and result in declining values in our real estate portfolio and in the collateral securing any loan investments we may make, which could have various negative impacts. Specifically, the value of collateral securing any loan we hold could decrease below the outstanding principal amounts of such loans.
Borrowings may reduce the funds available for distribution and increase the risk of loss since defaults may cause us to lose the properties securing the loans.
We have acquired, and will continue to acquire, real estate assets by assuming existing financing or borrowing new monies. We may borrow money for other purposes to, among other things, satisfy the requirement that we distribute at least 90% of our “REIT taxable income,” subject to certain adjustments, annually or as is otherwise necessary or advisable to assure that we qualify as a REIT for federal income tax purposes. Over the long term, however, payments required on any amounts we borrow reduce the funds available for, among other things, capital expenditures for existing assets or distributions to our stockholders because cash otherwise available for these purposes is used to pay principal and interest on this debt.
If there is a shortfall between the cash flow from an asset and the cash flow needed to service mortgage debt on an asset, then the amount of cash flow from operations available for distributions to stockholders may be reduced. In addition, incurring
13
mortgage debt increases the risk of loss since defaults on indebtedness secured by an asset may result in lenders initiating foreclosure actions. In such a case, we could lose the asset securing the loan that is in default, thus reducing the value of your investment. For tax purposes, a foreclosure is treated as a sale of the asset or assets for a purchase price equal to the outstanding balance of the debt secured by the asset or assets. If the outstanding balance of the debt exceeds our tax basis in the asset or assets, we would recognize taxable gain on the foreclosure action and we would not receive any cash proceeds. We also may fully or partially guarantee any funds that subsidiaries borrow to operate assets. In these cases, we will likely be responsible to the lender for repaying the loans if the subsidiary is unable to do so. If any mortgage contains cross-collateralization or cross-default provisions, more than one asset may be affected by a default.
If we are unable to borrow at favorable rates, we may not be able to refinance existing loans at maturity.
If we are unable to borrow money at favorable rates, or at all, we may be unable to refinance existing loans at maturity. Further, we may enter into loan agreements or other credit arrangements that require us to pay interest on amounts we borrow at variable or “adjustable” rates. Increases in interest rates will increase our interest costs. If interest rates are higher when we refinance our loans, our expenses will increase, thereby reducing our cash flow. Further, during periods of rising interest rates, we may be forced to sell one or more of our assets earlier than anticipated in order to repay existing loans, which may not permit us to maximize the return on the particular assets being sold.
Our existing or future debt agreements will contain covenants that restrict certain aspects of our operations, and our failure to comply with those covenants could materially and adversely affect us.
The mortgages on our existing assets, and any future mortgages likely will, contain customary covenants such as those that limit our ability, without the prior consent of the lender, to further mortgage the applicable asset or to discontinue insurance coverage even if we believe that the insurance premiums are greater than the risk of loss being insured against. In addition, such loans contain negative covenants that, among other things, preclude certain changes of control, inhibit our ability to incur additional indebtedness or, under certain circumstances, restrict cash flow necessary to make distributions to our stockholders. Any credit facility or secured loans that we may enter into likely will contain customary financial covenants, restrictions, requirements and other limitations with which we must comply. While we may have plans to undertake certain alterations, developments, re-developments or leasing actions at a property, a lender may have approval rights that prevent us from moving forward. In addition, our continued ability to borrow under any credit facility that we may obtain will be subject to compliance with our financial and other covenants, including covenants relating to debt service coverage ratios, leverage ratios, and liquidity and net worth requirements, and our ability to meet these covenants will be adversely affected if our financial condition and cash flows are materially adversely affected or if general economic conditions deteriorate.
In addition, our failure to comply with these covenants, as well as our inability to make required payments, could cause a default under the applicable agreement, which could result in the acceleration of the debt and require us to repay such debt with capital obtained from other sources, which may not be available to us or may be available only on unattractive terms. Furthermore, if we default on secured debt, lenders can take possession of the asset or assets securing such debt. In addition, agreements may contain specific cross-default provisions with respect to specified other indebtedness, giving the lenders the right to declare a default on its debt and to enforce remedies, including acceleration of the maturity of such debt upon the occurrence of a default under such other indebtedness. If we default on any of our agreements, it could have a material adverse effect on our financial condition, cash flows or results of operations.
Our mortgage agreements contain certain provisions that may limit our ability to sell our properties.
In order to assign or transfer our rights and obligations under certain of our mortgage agreements, we generally must obtain the consent of the lender, pay a fee equal to a fixed percentage of the outstanding loan balance and pay any costs incurred by the lender in connection with any such assignment or transfer.
These provisions of our mortgage agreements may limit our ability to sell our properties which, in turn, could adversely impact the price realized from any such sale. To the extent we receive lower sale proceeds, we could experience a material adverse effect on our business, financial condition and results of operations and our ability to make distributions to stockholders.
Covenants applicable to current or future debt, such as those in our credit line and mortgages, could restrict our ability to make distributions to our stockholders and, as a result, we may be unable to make distributions necessary to qualify as a REIT, which could materially and adversely affect us and the value of our common stock.
In order to continue to qualify as a REIT, we generally are required to distribute at least 90% of our REIT taxable income, determined without regard to the dividends paid deduction and excluding net capital gain, each year to our stockholders. To the extent that we satisfy this distribution requirement, but distribute less than 100% of our REIT taxable income, we will be
14
subject to U.S. federal corporate income tax on our undistributed taxable income. In addition, we will be subject to a 4% nondeductible excise tax if the actual amount that we distribute to our stockholders in a calendar year is less than a minimum amount specified under the Code. If, as a result of covenants applicable to our current or future debt, we are restricted from making distributions to our stockholders, we may be unable to make distributions necessary for us to avoid U.S. federal corporate income and excise taxes and maintain our qualification as a REIT, which could materially and adversely affect us.
Interest-only indebtedness may increase our risk of default and ultimately may reduce our funds available for distribution to our stockholders.
We have obtained, and may continue to enter into mortgage indebtedness that does not require us to pay principal for all or a portion of the life of the debt instrument. During the period when no principal payments are required, the amount of each scheduled payment is less than that of a traditional amortizing mortgage loan. The principal balance of the mortgage loan is not reduced (except in the case of prepayments) because there are no scheduled monthly payments of principal required during this period. After the interest-only period, we may be required either to make scheduled payments of principal and interest or to make a lump-sum or “balloon” payment at or prior to maturity. These required principal or balloon payments will increase the amount of our scheduled payments and may increase our risk of default under the related mortgage loan if we do not have funds available or are unable to refinance the obligation. In addition, we may be forced to sell one or more of our properties or investments in real estate at times that may not permit us to realize the return on the investments we would have otherwise realized.
Increases in interest rates could increase the amount of our debt payments and adversely affect our ability to make distributions to our stockholders.
As of December 31, 2017, approximately $150.0 million of our debt bore interest at variable rates. Increases in interest rates on variable rate debt that has not otherwise been hedged through the use of swap agreements reduce the funds available for other needs, including distribution to our stockholders. As of December 31, 2017, approximately $520.8 million of our total indebtedness bore interest at rates that are fixed or were swapped to fixed. As fixed-rate debt matures, we may not be able to borrow at rates equal to or lower than the rates on the expiring debt. In addition, if rising interest rates cause us to need additional capital to repay indebtedness, we may be forced to sell one or more of our properties or investments in real estate at times that may not permit us to realize the return on the investments we would have otherwise realized.
Increases in interest rates would increase our interest expense on any variable rate debt, as well as any debt that must be refinanced at higher interest rates at the time of maturity. Our future earnings and cash flows could be adversely affected due to the increased requirement to service our debt and could reduce the amount we are able to distribute to our stockholders.
To hedge against interest rate fluctuations, we use derivative financial instruments, which may be costly and ineffective.
From time to time, we use derivative financial instruments to hedge exposures to changes in interest rates on certain loans secured by our assets. Our derivative instruments currently consist of interest rate swap contracts but may, in the future, include, interest rate cap or floor contracts, futures or forward contracts, options or repurchase agreements. Our actual hedging decisions are determined in light of the facts and circumstances existing at the time of the hedge. There is no assurance that our hedging strategy will achieve our objectives. We may be subject to costs, such as transaction fees or breakage costs, if we terminate these arrangements.
To the extent that we use derivative financial instruments to hedge against interest rate fluctuations, we are exposed to credit risk, basis risk and legal enforceability risks. In this context, credit risk is the failure of the counterparty to perform under the terms of the derivative contract. Basis risk occurs when the index upon which the contract is based is more or less variable than the index upon which the hedged asset or liability is based, thereby making the hedge less effective. Finally, legal enforceability risks encompass general contractual risks including the risk that the counterparty will breach the terms of, or fail to perform its obligations under, the derivative contract. A counterparty could fail, shut down, file for bankruptcy or be unable to pay out contracts. The business failure of a hedging counterparty with whom we enter into a hedging transaction will most likely result in a default. Default by a party with whom we enter into a hedging transaction may result in the loss of unrealized profits and force us to cover our resale commitments, if any, at the then-current market price. Additionally, it may not always be possible to dispose of or close out a hedging position without the consent of the hedging counterparty, and we may not be able to enter into an offsetting contract to cover our risk. We cannot provide assurance that a liquid secondary market will exist for hedging instruments purchased or sold, and we may be required to maintain a position until exercise or expiration, which could result in losses.
Further, the REIT provisions of the Code may limit our ability to hedge the risks inherent to our operations. We may be unable to manage these risks effectively.
15
We may be contractually obligated to purchase property even if we are unable to secure financing for the acquisition.
In some cases, we finance a portion of the purchase price for properties that we acquire. However, to ensure that our offers are as competitive as possible, we generally do not enter into contracts to purchase property that include financing contingencies. Thus, we may be contractually obligated to purchase a property even if we are unable to secure financing for the acquisition. In this event, we may choose to close on the property by using cash on hand, which would result in less cash available for other purposes, including funding operating costs or paying distributions to our stockholders. Alternatively, we may choose not to close on the acquisition of the property and default on the purchase contract. If we default on any purchase contract, we could lose our earnest money, become subject to liquidated or other contractual damages and remedies and suffer reputational harm in the commercial real estate market, which could make future sellers less likely to accept our bids or cause them to require a higher purchase price or more onerous contractual terms.
Our special purpose property-owning subsidiaries may default under non-recourse mortgage loans.
Some of our assets are or will be held in special-purpose property-owning subsidiaries. In the future, such special purpose property-owning subsidiaries may default and/or send notices of imminent default on non-recourse mortgage loans where the relevant asset is or will be suffering from cash shortfalls on operating expenses, leasing costs and/or debt service obligations. Any default by our special purpose property-owning subsidiaries under non-recourse mortgage loans would give the lenders the right to accelerate the payment on the loans and the right to foreclose on the asset underlying such loans. There are several potential outcomes on the default of a non-recourse mortgage loan, including foreclosure, a deed-in-lieu of foreclosure, a cooperative short sale, or a negotiated modification to the terms of the loan. There is no assurance that we will be able to achieve a favorable outcome on a cooperative or timely basis on any defaulted mortgage loan.
Risk Related to our Spin-off Transactions and the Sale of our Student Housing Platform
We could incur significant indemnification liabilities in connection with the spin-off transactions of our former subsidiaries and in connection with the sale of our student housing platform. It is also possible that our former subsidiaries will not satisfy their indemnification obligations to us, leaving us with significant liabilities for business and assets that we no longer own. Any of these outcomes could materially adversely affect our operations.
In 2015 we spun off Xenia and in 2016 we spun off Highlands by distributing 95% and 100%, respectively, of the shares of the common stock of these former subsidiaries to our shareholders. In connection with each of these spin-off transactions, we entered into a Separation and Distribution Agreement with Xenia or Highlands, as applicable, which provides for, among other things, the allocation between us and Xenia or Highlands, as applicable, of our assets, liabilities and obligations attributable to periods prior to, at and after the applicable share distribution. Among other things, each Separation and Distribution Agreement also provides that we will indemnify and be financially responsible for liabilities that may exist relating to the assets that were not included in the spun-off company or for certain liabilities relating to the spin-off transactions. Conversely, each of Xenia and Highlands agreed to indemnify us related to certain of their assets and businesses and for certain liabilities relating to the spin-off transactions. However, third parties could seek to hold us responsible for any of the liabilities that these former subsidiaries agreed to retain, and there can be no assurance that our former subsidiaries will be able to fully satisfy any indemnification obligations they owe to us in a timely manner or in full. As a result, we may be responsible for substantial liabilities under the Separation and Distribution Agreements or that relate to Xenia or Highlands.
In June 2016, we completed the sale of University House. In connection with this transaction, we entered into a Stock Purchase Agreement, as amended, in which we made customary representations, warranties and covenants. The survival period for our representations and warranties is generally fifteen months, with covenants and certain fundamental representations and warranties surviving for longer periods. As set forth in the Stock Purchase Agreement, we also may be required to indemnify the buyer against certain liabilities and obligations, and we may be subject to third-party claims arising out of such transaction. As a result, we may be responsible for liabilities under the Stock Purchase Agreement and such liabilities may be substantial.
Risks Related to Our Common Stock
Since InvenTrust shares are not currently traded on a national stock exchange, there is no established public market for our shares and you may not be able to sell your shares.
Our shares of common stock are not listed on a national securities exchange. There is no established public trading market for our shares and no assurance that one may develop. Our charter prohibits any persons or groups from owning more than 9.8% (in value or number of shares, whichever is more restrictive) of the aggregate of the outstanding shares of our stock or more than 9.8% (in value or number of shares, whichever is more restrictive) of the aggregate of the outstanding shares of our common stock unless exempted prospectively or retroactively by our board of directors. This may inhibit investors from
16
purchasing a large portion of our shares. Our charter also does not require our directors to seek stockholder approval to liquidate our assets by a specified date, nor does our charter require our directors to list our shares for trading on a national exchange by a specified date or provide any other type of liquidity to our stockholders. Although our management and board of directors are working on positioning the Company to explore various strategic alternatives, there is no assurance that we will be successful in identifying and executing on a strategic alternative. In addition, we do not know the timing or what form the alternative would take. Strategic transaction options are subject to factors that are outside of our control, such as economic and market conditions. If our board were to pursue a strategic alternative in the form of a listing event of our common stock on a national securities exchange or otherwise, there is no assurance that we would satisfy the listing requirements or that our shares would be approved for listing. Additionally, if and when a liquidity event occurs, there is no guarantee you will be able to liquidate your common stock at a price equal to your initial investment value or the current estimated share value. Our estimated share value is generally determined only once a year and is based on a number of assumptions and estimates that may not be accurate or complete and is subject to a number of limitations as described below.
The estimated value per share of our common stock is based on a number of assumptions and estimates that may not be accurate or complete and is also subject to a number of limitations.
On May 5, 2017, we announced an estimated value of our common stock equal to $3.29 per share. Our board of directors engaged Duff & Phelps, LLC ("Duff & Phelps"), an independent third-party valuation advisory firm that specializes in providing real estate valuation services, to advise the Audit Committee and the board of directors in their estimate of the per share value of our common stock on a fully diluted basis as of May 1, 2017. As with any methodology used to estimate value, the methodology employed by Duff & Phelps and the recommendations made by us were based upon a number of estimates and assumptions that may not have been accurate or complete. Further, different parties using different assumptions and estimates could have derived a different estimated value per share, which could be significantly different from our estimated value per share. The estimated per share value does not represent: (i) the expected price at which our shares would trade on a national securities exchange, (ii) the amount per share a stockholder would obtain if he, she or it tried to sell his, her or its shares or (iii) the amount per share stockholders would receive if we liquidated our assets and distributed the proceeds after paying all our expenses and liabilities. Furthermore, the estimated share value is generally determined only as of a particular date once a year and could be subject to significant volatility due to a variety of economic, political, market, competitive and other factors, which could cause the estimated share value to go up or down over time. Accordingly, with respect to the estimated value per share, we can give no assurance that:
There is no assurance that we will be able to continue paying cash distributions or that distributions will increase over time.
Historically we have paid, and we intend to continue to pay, regular cash distributions to our stockholders. We increased our annual distribution rate from $0.0675 per share of common stock to $0.0695 per share of common stock, beginning with the quarterly distribution paid in April 2017. The adjustment to the distribution rate equates to a 2017 calendar year total distribution of $0.069 per share (an annual rate of $0.0675 per share paid in January 2017, and an annual rate of $0.0695 per share paid in April, July and October 2017). As we execute on our retail strategy, our board expects to evaluate our distribution rate on a periodic basis. See "Outlook" for more information regarding our retail strategy.
Factors that can affect the availability and timing of cash distributions include our ability to earn positive yields on our real estate assets, the yields on securities in which we invest and our operating expense levels, and many others. Our portfolio
17
• a stockholder would be able to resell his, her or its shares at this estimated value;
• a stockholder would ultimately realize distributions per share equal to our estimated value per share upon liquidation of our assets and settlement of our liabilities or a sale of the Company;
• our shares would trade at a price equal to or greater than the estimated value per share if we listed them on a national securities exchange;
• the estimated transaction costs, closing costs and contingencies related to the disposition of our student housing platform and certain of our multi-tenant retail properties reflected in our estimated value were incurred at the level estimated by the Company;
• the methodology used to estimate our value per share would be acceptable to the Financial Industry Regulatory Authority ("FINRA") or that the estimated value per share will satisfy the applicable annual valuation requirements under the Employee Retirement Income Security Act of 1974, as amended ("ERISA"), and the Code with respect to employee benefit plans subject to ERISA and other retirement plans or accounts subject to Section 4975 of the Code; or
• this estimated value will increase, stay at the current level, or not continue to decrease, over time.
strategy may also affect our ability to pay our cash distributions if we are not able to timely reinvest the capital we receive from our property dispositions. There is no assurance that we will be able to continue paying distributions at the current level or that the amount of distributions will increase, or not continue to decrease, over time. Even if we are able to continue paying distributions, the actual amount and timing of distributions is determined by our board of directors in its discretion and typically depends on the amount of funds available for distribution, which depends on items such as current and projected cash requirements and tax considerations. As a result, our distribution rate and payment frequency may vary from time to time.
Funding distributions from sources other than cash flow from operating activities may negatively impact our ability to sustain or pay future distributions and result in us having less cash available for other uses, such as property purchases.
If our cash flow from operating activities is not sufficient to fully fund the payment of distributions, the level of our distributions may not be sustainable. For the year ended December 31, 2017, distributions were paid from cash flow from operations, distributions from unconsolidated entities and gain on sales of properties.
We may pay distributions from sources other than cash flow from operations or funds from operations, including funding such distributions from external financing sources, which may not be available at commercially attractive terms. To the extent that the aggregate amount of cash distributed with respect to our stock in any given year exceeds the amount of our current and accumulated earnings and profits allocable to such stock for the same period, the excess amount will be deemed a return of capital for federal income tax purposes, rather than a return on capital, to the extent of the stockholder's tax basis in our stock, and any remaining excess amount will be treated as capital gain. Furthermore, in the event that we are unable to fund future distributions from our cash flows from operating activities, the value of your shares upon any listing of our stock, the sale of our assets or any other liquidity event may be materially adversely affected.
At any time that we are not generating cash flow from operations sufficient to cover the current distribution rate, we may determine to pay lower distributions, or to fund all or a portion of our future distributions from other sources. If we utilize borrowings for the purpose of funding all or a portion of our distributions, we will incur additional interest expense. We have not established any limit on the extent to which we may use alternate sources of cash for distributions, except that, in accordance with the law of the State of Maryland and our organizational documents, generally, we may not make distributions that would: (i) cause us to be unable to pay our debts as they become due in the usual course of business, (ii) cause our total assets to be less than the sum of our total liabilities, or (iii) jeopardize our ability to maintain our qualification as a REIT for so long as the board of directors determines that it is in our best interests to continue to qualify as a REIT.
We may issue additional equity or debt securities in the future in order to raise capital. Additional issuances of equity securities would dilute the investment of our current stockholders.
Issuing additional equity securities to finance future developments and acquisitions instead of incurring additional debt would dilute the interests of our existing stockholders. Our ability to execute our business and growth plan depends on our access to an appropriate blend of capital, which could include a line of credit and other forms of secured and unsecured debt, equity financing, or joint ventures.
Risks Related to Our Organization and Structure
Stockholders have limited control over changes in our policies and operations.
Our board of directors determines our major policies, including our investment policies and strategies and policies regarding financing, debt and equity capitalization, REIT qualification and distributions. Our board of directors may amend or revise certain of these and other policies without a vote of the stockholders.
Stockholders’ interest in us will be diluted if we issue additional shares.
Stockholders do not have preemptive rights with respect to any shares issued by us in the future. Our charter authorizes our board of directors, without stockholder approval, to amend the charter from time to time to increase or decrease the aggregate number of shares of stock or the number of shares of stock of any class or series that the Company has authority to issue. Future issuances of common stock reduce the percentage of our shares owned by our current stockholders who do not participate in future stock issuances. Stockholders are not entitled to vote on whether or not we issue additional shares. In addition, depending on the terms and pricing of an additional offering of our shares and the value of our properties, our stockholders may experience dilution in the value of their shares. Further, our board could issue stock on terms and conditions that subordinate the rights of the holders of our current common stock or have the effect of delaying, deferring or preventing a change in control in us, including an extraordinary transaction (such as a merger, tender offer or sale of all or substantially all our assets) that might provide a premium price for our stockholders.
18
Increases in market interest rates may reduce demand for our common stock and result in a decline in the value of our common stock.
The value of our common stock may be influenced by the distribution yield on our common stock (i.e., the amount of our quarterly distributions as a percentage of the fair market value of our common stock) relative to market interest rates. An increase in market interest rates, which are currently low compared to historical levels, may lead prospective purchasers of our common stock to expect a higher distribution yield, which we may not be able, or may choose not, to provide. Higher interest rates would also likely increase our borrowing costs and decrease our operating results and cash available for distribution. Thus, higher market interest rates could cause the value of our common stock to decline.
Stockholders’ returns may be reduced if we are required to register as an investment company under the Investment Company Act.
We are not registered, and do not intend to register our company or any of our subsidiaries, as an investment company under the Investment Company Act of 1940, as amended (the "Investment Company Act"). If we or any of our subsidiaries become obligated to register as an investment company, the registered entity would have to comply with regulation under the Investment Company Act with respect to capital structure (including the registered entity’s ability to use borrowings), management, operations, transactions with affiliated persons (as defined in the Investment Company Act) and portfolio composition, including disclosure requirements and restrictions with respect to diversification and industry concentration, and other matters. Compliance with the Investment Company Act may not be feasible as it would limit our ability to make certain investments and require us to significantly restructure our operations and business plan. The costs we would incur and the limitations that would be imposed on us as a result of such compliance and restructuring would negatively affect the value of our common stock, our ability to make distributions and the sustainability of our business and investment strategies.
We believe that neither we nor any subsidiaries we own fall within the definition of an investment company under Section 3(a)(1) of the Investment Company Act because we primarily engage in the business of acquiring and owning real property, through our wholly or majority owned subsidiaries, each of which has at least 60% of its assets in real property. The company intends to conduct its operations, directly and through wholly or majority-owned subsidiaries, so that neither the company nor any of its subsidiaries is registered or will be required to register as an investment company under the Investment Company Act. Section 3(a)(1) of the Investment Company Act, in relevant part, defines an investment company as (i) any issuer that is, or holds itself out as being, engaged primarily in the business of investing, reinvesting or trading in securities, or (ii) any issuer that is engaged, or proposes to engage, in the business of investing, reinvesting, owning, holding or trading in securities and owns, or proposes to acquire, "investment securities" having a value exceeding 40% of the value of its total assets (exclusive of government securities and cash items) on an unconsolidated basis (the "40% Test"). The term "investment securities" generally includes all securities except government securities and securities of majority-owned subsidiaries that are not themselves investment companies and are not relying on the exemption from the definition of investment company under Section 3(c)(1) or Section 3(c)(7) of the Investment Company Act. We and our subsidiaries are primarily engaged in the business of investing in real property and, as such, we believe we and our subsidiaries should fall outside of the definition of an investment company under Section 3(a)(1)(A) of the Investment Company Act.
Accordingly, we believe that neither we nor any of our wholly and majority-owned subsidiaries are considered investment companies under either Section 3(a)(1)(A) or Section 3(a)(1)(C) of the Investment Company Act. We believe we and our wholly owned or majority owned subsidiaries are also able to rely on the exemption provided by Section 3(c)(5)(C) of the Investment Company Act. To rely upon Section 3(c)(5)(C) of the Investment Company Act as it has been interpreted by the SEC staff, an entity would have to invest at least 55% of its total assets in "mortgage and other liens on and interests in real estate," which we refer to as "qualifying real estate investments" and maintain an additional 25% of its total assets in qualifying real estate investments or other real estate-related assets. The remaining 20% of the entity’s assets can consist of miscellaneous assets. These criteria may limit what we buy, sell and hold.
We classify our assets for purposes of Section 3(c)(5)(C) based in large measure upon no-action letters issued by the SEC staff and other interpretive guidance provided by the SEC and its staff. The no-action positions are based on factual situations that may be substantially different from the factual situations we may face, and a number of these no-action positions were issued more than 20 years ago. Pursuant to this guidance, and depending on the characteristics of the specific investments, certain mortgage-backed securities, other mortgage-related instruments, joint venture investments and the equity securities of other entities may not constitute qualifying real estate assets, and therefore, we may limit our investments in these types of assets. The SEC or its staff may not concur with the way we classify our assets. Future revisions to the Investment Company Act or further guidance from the SEC or its staff may cause us to no longer be in compliance with the exemption from the definition of an "investment company" provided by Section 3(c)(5)(C) and may force us to re-evaluate our portfolio and our investment strategy. (e.g., in 2011 the SEC staff published a Concept Release in which it reviewed and questioned certain interpretative positions taken under Section 3(c)(5)(C)). To the extent that the SEC or its staff provides more specific or different guidance,
19
we may be required to adjust our strategy accordingly. Any additional guidance from the SEC or its staff could provide additional flexibility to us, or it could further inhibit our ability to pursue the strategies we have chosen.
A change in the value of any of our assets could cause us to fall within the definition of "investment company" and negatively affect our ability to be free from registration and regulation under the Investment Company Act. To avoid being required to register the company or any of its subsidiaries as an investment company under the Investment Company Act, we may be unable to sell assets we would otherwise want to sell and may need to sell assets we would otherwise wish to retain. Sales may be required under adverse market conditions, and we could be forced to accept a price below that which we would otherwise consider acceptable. In addition, we may have to acquire additional income or loss generating assets that we might not otherwise have acquired or may have to forgo opportunities to acquire interests in companies that we would otherwise want to acquire and would be important to our investment strategy. Any such selling, acquiring or holding of assets driven by Investment Company Act considerations could negatively affect the value of our common stock, our ability to make distributions and the sustainability of our business and investment strategies.
If we or our subsidiaries were required to register as an investment company but failed to do so, we or the applicable subsidiary would be prohibited from engaging in our or its business, and criminal and civil actions could be brought against us or the applicable subsidiary. If we or any of our subsidiaries were deemed an unregistered investment company, we or the applicable subsidiary could be subject to monetary penalties and injunctive relief and we or the applicable subsidiary could be unable to enforce contracts with third parties and third parties could seek to obtain rescission of transactions undertaken during the period we or the applicable subsidiary were deemed an unregistered investment company, unless the court found that under the circumstances, enforcement (or denial of rescission) would produce a more equitable result than no enforcement (or grant of rescission) and would not be inconsistent with the Investment Company Act.
Our rights and the rights of our stockholders to take action against our directors and officers are limited.
Under Maryland law generally, a director is required to perform his or her duties in good faith, in a manner he or she reasonably believes to be in our best interests and with the care that an ordinarily prudent person in a like position would use under similar circumstances. Under Maryland law, directors are presumed to have acted in accordance with this standard of conduct. In addition, our charter eliminates the liability of our directors and officers to us and our stockholders for money damages, except for liability resulting from:
Our charter and bylaws obligate us, to the maximum extent permitted by Maryland law in effect from time to time, to indemnify and to pay or reimburse reasonable expenses in advance of final disposition of a proceeding to any present or former director or officer who is made or threatened to be made a party to the proceeding by reason of his or her service to us in that capacity. As a result, we and our stockholders may have more limited rights against our directors and officers than might otherwise exist absent the current provisions in our charter and bylaws.
Our charter places limits on the amount of common stock that any person may own.
In order for us to qualify as a REIT under the Code, no more than 50% of the outstanding shares of our common stock may be beneficially owned, directly or indirectly, by five or fewer individuals at any time during the last half of each taxable year. Unless exempted by our board of directors, prospectively or retroactively, our charter prohibits any persons or groups from beneficially or constructively owning more than 9.8% (in value or number of shares, whichever is more restrictive) of the aggregate of the outstanding shares of our stock or more than 9.8% (in value or number of shares, whichever is more restrictive) of the aggregate of the outstanding shares of our common stock. These provisions may have the effect of delaying, deferring or preventing a change in control of us, including an extraordinary transaction such as a merger, tender offer or sale of all or substantially all of our assets that might involve a premium price for holders of our common stock.
Our charter permits our board of directors to issue preferred stock on terms that may subordinate the rights of the holders of our current common stock or discourage a third party from acquiring us.
Our board may classify or reclassify any unissued shares of common or preferred stock into other classes or series of stock and establish the preferences, conversion or other rights, voting powers, restrictions, limitations as to dividends and other distributions, qualifications, and terms or conditions of redemption of the stock and may amend our charter from time to time to increase or decrease the aggregate number of shares or the number of shares of any class or series that we have authority to issue without stockholder approval. Thus, our board of directors could authorize us to issue shares of preferred stock with terms
20
• actual receipt of an improper benefit or profit in money, property or services; or
• active and deliberate dishonesty by the director or officer that was established by a final judgment as being material to the cause of action adjudicated.
and conditions that could subordinate the rights of the holders of our common stock or shares of preferred stock or common stock that could have the effect of delaying, deferring or preventing a change in control of us, including an extraordinary transaction such as a merger, tender offer or sale of all or substantially all of our assets, that might provide a premium price for holders of our common stock.
Certain provisions of Maryland law could inhibit changes in control.
Certain provisions of the Maryland General Corporation Law (“MGCL”), may have the effect of deterring a third party from making a proposal to acquire us or of impeding a change in our control under circumstances that otherwise could provide the holders of our common stock with the opportunity to benefit from a sale of our common stock, including:
As permitted by Maryland law, we have elected, by resolution of our board of directors, to opt out of the business combination provisions of the MGCL, provided that such business combination has been approved by our board of directors (including a majority of directors who are not affiliated with the interested stockholder), and, pursuant to a provision in our bylaws, to exempt any acquisition of our stock from the control share provisions of the MGCL. However, our board of directors may by resolution elect to repeal the exemption from the business combination provisions of the MGCL and may by amendment to our bylaws opt into the control share provisions of the MGCL at any time in the future.
Certain provisions of the MGCL permit our board of directors, without stockholder approval and regardless of what is currently provided in our charter or bylaws, to adopt certain mechanisms, some of which (for example, a classified board) we do not have. These provisions may have the effect of limiting or precluding a third party from making an acquisition proposal for us or of delaying, deferring or preventing a change in our control under circumstances that otherwise could provide the holders of our common stock with the opportunity to benefit from a sale of our common stock.
If our board of directors were to elect to be subject to the provision of Subtitle 8 providing for a classified board or the business combination provisions of the MGCL or if the provisions of our bylaws opting out of the control share acquisition provisions of the MGCL were amended or rescinded, these provisions of the MGCL could have anti-takeover effects.
Our board of directors or a committee of our board of directors may change our investment policies without stockholder approval, which could alter the nature of your investment.
Our investment policies may change over time. The methods of implementing our investment policies may also vary, as new investment techniques are developed. Our investment policies, the methods for implementing them, and our other objectives, policies and procedures may be altered by our board of directors or a committee of our board of directors without the approval of our stockholders. As a result, the nature of your investment could change without your consent. A change in our investment strategy may, among other things, increase our exposure to interest rate risk, default risk and real property market fluctuations, all of which could materially and adversely affect our ability to achieve our investment objectives.
The failure of any bank in which we deposit our funds could reduce the amount of cash we have available to pay distributions and make additional investments.
We have deposited our cash and cash equivalents in several banking institutions in an attempt to minimize exposure to the failure of any one of these entities. However, the Federal Deposit Insurance Corporation ("FDIC") generally only insures limited amounts per depositor per insured bank. At December 31, 2017, we had cash and cash equivalents and restricted cash deposited in interest-bearing transaction accounts at certain financial institutions exceeding these federally insured levels. If any of the banking institutions in which we have deposited funds ultimately fails, we may lose our deposits over the federally insured levels. The loss of our deposits could reduce the amount of cash we have available to distribute or invest.
21
• "business combination" provisions that, subject to limitations, prohibit certain business combinations between us and an “interested stockholder” (defined generally as any person who beneficially owns, directly or indirectly, 10% or more of the voting power of our outstanding voting stock or an affiliate or associate of ours who was the beneficial owner, directly or indirectly, of 10% or more of the voting power of our then outstanding stock at any time within the two-year period immediately prior to the date in question) for five years after the most recent date on which the stockholder becomes an interested stockholder, and thereafter impose fair price and/or supermajority stockholder voting requirements on these combinations; and
• "control share" provisions that provide that "control shares" of our company (defined as voting shares that, when aggregated with other shares controlled by the stockholder, entitle the stockholder to exercise one of three increasing ranges of voting power in electing directors) acquired in a "control share acquisition" (defined as the direct or indirect acquisition of ownership or control of issued and outstanding control shares) have no voting rights except to the extent approved by our stockholders by the affirmative vote of at least two-thirds of all the votes entitled to be cast on the matter, excluding all interested shares.
Federal Income Tax Risks
Failure to remain qualified as a REIT would cause us to be taxed as a regular corporation, which would substantially reduce funds available for distributions to our stockholders.
Our qualification as a REIT depends on our ability to continue to meet requirements regarding our organization and ownership, distributions of our income, the nature and diversification of our income and assets as well as other tests imposed by the Code. We cannot assure you that our actual operations for any one taxable year will satisfy these requirements. Further, new legislation, regulations, administrative interpretations or court decisions could significantly affect our ability to qualify as a REIT or the federal income tax consequences of our qualification as a REIT. If we fail to qualify as a REIT in any taxable year, we will face serious tax consequences that will substantially reduce the funds available for distributions to our stockholders because:
In addition, if we fail to qualify as a REIT, we will no longer be required to make distributions. As a result of all these factors, our failure to qualify as a REIT could impair our ability to expand our business and raise capital, and it would adversely affect the value of our common stock.
REIT distribution requirements could adversely affect our liquidity and may force us to borrow funds or sell assets during unfavorable market conditions.
To satisfy the REIT distribution requirements, we may need to borrow funds on a short-term basis or sell assets sooner than anticipated, even if the then-prevailing market conditions are not favorable for these borrowings or sales. Our cash flows from operations may be insufficient to fund required distributions as a result of differences in timing between the actual receipt of income and the recognition of income for U.S. federal income tax purposes, or the effect of non-deductible capital expenditures, the creation of reserves or required debt service or amortization payments. The insufficiency of our cash flows to cover our distribution requirements could have an adverse impact on our ability to raise short- and long-term debt or sell equity securities in order to fund distributions required to maintain our qualification as a REIT.
Even if we continue to qualify as a REIT, we may face other tax liabilities that reduce our cash flows.
Even if we continue to qualify for taxation as a REIT, we may be subject to certain U.S. federal, state and local taxes on our income and assets, including taxes on any undistributed income, tax on income from some activities conducted as a result of a foreclosure, and state or local income, property and transfer taxes. In addition, our taxable REIT subsidiaries (“TRSs”) are subject to regular corporate federal, state and local taxes. Any of these taxes would decrease cash available for distributions to stockholders.
Failure to make required distributions would subject us to federal corporate income tax.
In order to continue to qualify as a REIT, we generally are required to distribute at least 90% of our REIT taxable income, determined without regard to the dividends paid deduction and excluding any net capital gain, annually to our stockholders (the “90% Distribution Requirement”). To the extent that we satisfy the 90% Distribution Requirement, but distribute less than 100% of our REIT taxable income, we will be subject to U.S. federal corporate income tax on our undistributed taxable income. In addition, we will be subject to a 4% nondeductible excise tax if the actual amount that we pay out to our stockholders in a calendar year is less than a minimum amount specified under the Code.
The prohibited transactions tax may limit our ability to dispose of our properties, and we could incur a material tax liability if the Internal Revenue Service (the "IRS") successfully asserts that the 100% prohibited transaction tax applies to some or all of our dispositions.
A REIT’s net income from prohibited transactions is subject to a 100% tax. In general, prohibited transactions are sales or other dispositions of assets, other than foreclosure property, held primarily for sale to customers in the ordinary course of business. We may be subject to the prohibited transactions tax equal to 100% of net gain upon a disposition of an asset. As part of our plan to refine our portfolio, we have selectively disposed of certain of our properties in the past and intend to make additional
22
• we would not be allowed a deduction for dividends paid to stockholders in computing our taxable income and would be subject to U.S. federal income tax at regular corporate rates;
• we could be subject to the U.S. federal alternative minimum tax for the tax years prior to January 1, 2018 and possibly increased state and local taxes; and
• unless we are entitled to relief under certain U.S. federal income tax laws, we could not re-elect REIT status until the fifth calendar year after the year in which we failed to qualify as a REIT.
dispositions of our assets in the future. Although a safe harbor to the characterization of the sale of property by a REIT as a prohibited transaction is available, not all of our past dispositions have qualified for that safe harbor and some or all of our future dispositions may not qualify for that safe harbor. We believe that our past dispositions will not be treated as prohibited transactions, and we intend to avoid disposing of property that may be characterized as held primarily for sale to customers in the ordinary course of business. To avoid the prohibited transaction tax, we may choose not to engage in certain sales of our assets or may conduct such sales through a TRS, which would be subject to federal, state and local income taxation. Moreover, no assurance can be provided that the IRS will not assert that some or all of our future dispositions are subject to the 100% prohibited transactions tax. If the IRS successfully imposes the 100% prohibited transactions tax on some or all of our dispositions, the resulting tax liability could be material.
We may fail to qualify as a REIT if the IRS successfully challenges the valuation of our common stock used for purposes of our DRP.
In order to satisfy the 90% Distribution Requirement, the dividends we paid during our 2014 and prior taxable years must not have been "preferential." For our 2014 and prior taxable years and for any future taxable year in which we do not qualify as a "publicly offered REIT" (i.e., a REIT required to file annual and periodic reports with the SEC), a dividend determined to be preferential will not qualify for the dividends paid deduction. To have avoided paying preferential dividends, we must have treated every stockholder of a class of stock with respect to which we made a distribution the same as every other shareholder of that class, and we must not have treated any class of stock other than according to its dividend rights as a class. For example, if certain shareholders received a distribution that was more or less (on a per-share basis) than the distributions received by other stockholders of the same class, the distribution would be preferential. If any part of a distribution was preferential, none of that distribution would be applied towards satisfying the 90% Distribution Requirement.
We suspended our DRP in August 2014, but we may reactivate our DRP in the future. Stockholders who participated in our DRP received distributions in the form of shares of our common stock rather than in cash. Immediately prior to the suspension of our DRP, the purchase price per share under our DRP was equal to 100% of the "market price" of a share of our common stock. Because our common stock was not, and is not yet, listed for trading, for these purposes, "market price" means the fair market value of a share of our common stock, as estimated by us. In the past, our DRP has offered participants the opportunity to acquire newly-issued shares of our common stock at a discount to the "market price." Pursuant to an IRS ruling, the prohibition on preferential dividends does not prohibit a REIT from offering shares under a distribution reinvestment plan at discounts of up to 5% of fair market value, but a discount in excess of 5% of the fair market value of the shares would be considered a preferential dividend. Any discount we have offered in the past was intended to fall within the safe harbor for such discounts set forth in the ruling published by the IRS. However, the fair market value of our common stock has not been susceptible to a definitive determination. If the purchase price under our DRP is deemed to have been at more than a 5% discount at any time, we would be treated as having paid one or more preferential dividends. Similarly, we would be treated as having paid one or more preferential dividends if the IRS successfully asserted that the value of the common stock distributions paid to stockholders participating in our DRP exceeded on a per-share basis the cash distribution paid to our other stockholders, which could occur if the IRS successfully asserted that the fair market value of our common stock exceeded the "market value" used for purposes of calculating the distributions under our DRP. If we are determined to have paid preferential dividends as a result of our DRP, we would likely fail to qualify as a REIT.
The stock ownership limit imposed by the Code for REITs and our charter may restrict our business combination opportunities and you may be restricted from acquiring or transferring certain amounts of our common stock.
The stock ownership restrictions of the Code for REITs and the 9.8% stock ownership limit in our charter may restrict our business combination opportunities and restrict your ability to acquire or transfer certain amounts of our common stock.
In order to continue to qualify as a REIT, five or fewer individuals, as defined in the Code, may not own, beneficially or constructively, more than 50% in value of our issued and outstanding stock at any time during the last half of a taxable year. Attribution rules in the Code determine if any individual or entity beneficially or constructively owns our capital stock under this requirement. Additionally, at least 100 persons must beneficially own our capital stock during at least 335 days of a taxable year. To help ensure that we satisfy these tests, our charter restricts the acquisition and ownership of shares of our capital stock. However, these ownership limits might delay or prevent a transaction or a change in our control or other business combination opportunities.
Our charter authorizes our directors to take such actions as are necessary and desirable to preserve our qualification as a REIT. Unless exempted by our board of directors (prospectively or retroactively), our charter prohibits any persons or groups from beneficially or constructively owning more than 9.8% (in value or number of shares, whichever is more restrictive) of the aggregate of the outstanding shares of our stock or more than 9.8% (in value or number of shares, whichever is more restrictive) of the aggregate of the outstanding shares of our common stock. Our board of directors may not grant an exemption
23

from these restrictions to any proposed transferee whose ownership in excess of the 9.8% stock ownership limit would result in our failing to qualify as a REIT. These restrictions on transferability and ownership will not apply, however, if our board of directors determines that it is no longer in our best interest to attempt to, or continue to, qualify as a REIT or that compliance is no longer required in order for us to qualify as a REIT.
If our leases are not respected as true leases for federal income tax purposes, we would fail to qualify as a REIT.
To qualify as a REIT, we must satisfy two gross income tests, pursuant to which specified percentages of our gross income must be passive income such as rent. For the rent we receive under our leases to be treated as qualifying income for purposes of the gross income tests, the leases must be respected as true leases for federal income tax purposes and must not be treated as service contracts, joint ventures or some other type of arrangement. There are no controlling Treasury regulations, published rulings or judicial decisions involving leases with terms substantially the same as our former hotel leases that discuss whether such leases constitute true leases for federal income tax purposes. We believe that all our leases, including our former hotel leases, will be respected as true leases for federal income tax purposes. There can be no assurance, however, that the IRS will agree with this characterization. If a significant portion of our leases were not respected as true leases for federal income tax purposes, we would not be able to satisfy either of the two gross income tests and we would likely lose our REIT status.
We may fail to qualify as a REIT as a result of our investments in joint ventures and other REITs.
We have owned, and intend to continue to own, limited partner or non-managing member interests in partnerships and limited liability companies that are joint ventures. In addition, we have owned, and intend to continue to own, significant equity ownership interests in other REITs. If a partnership or limited liability company in which we own an interest takes or expects to take actions that could jeopardize our qualification as a REIT or require us to pay tax, we may be forced to dispose of our interest in such entity. In addition, it is possible that a partnership or limited liability company could take an action which could cause us to fail a REIT gross income or asset test, and that we would not become aware of such action in time to dispose of our interest in the partnership or limited liability company or take other corrective action on a timely basis. Similarly, if one of the REITs in which we own or have owned a significant equity interest were to fail to qualify as a REIT, we would likely fail to satisfy one or more of the REIT gross income and asset tests. If we failed to satisfy a REIT gross income or asset test as a result of an investment in a joint venture or another REIT, we would fail to continue to qualify as a REIT unless we are able to qualify for a statutory REIT "savings" provisions, which may require us to pay a significant penalty tax to maintain our REIT qualification.
If our former hotel managers did not qualify as "eligible independent contractors", we would fail to qualify as a REIT.
Rent paid by a lessee that is a "related party tenant" of ours will not be qualifying income for purposes of the two gross income tests applicable to REITs. Prior to the disposition of our hotel portfolio, we leased our hotels to certain of our TRSs. A TRS will not be treated as a "related party tenant," and will not be treated as directly operating a lodging facility, which is prohibited, to the extent that hotels that a TRS leases are managed by an "eligible independent contractor."
We believe that the rent paid by our TRSs that leased our former hotels was qualifying income for purposes of the REIT gross income tests and that our TRSs qualified to be treated as "taxable REIT subsidiaries" for federal income tax purposes, but there can be no assurance that the IRS will not challenge this treatment or that a court would not sustain such a challenge. If the IRS successfully challenged this treatment, we would likely fail to satisfy the asset tests applicable to REITs and a significant portion of our income would fail to qualify for the gross income tests. If we failed to satisfy either the asset or gross income tests, we would likely lose our REIT qualification for federal income tax purposes, unless we qualified for certain statutory relief provisions.
If our former hotel managers did not qualify as "eligible independent contractors," we may be deemed to have failed to qualify as a REIT. Each of the hotel management companies that entered into a management contract with our TRSs that leased our former hotels must have qualified as an "eligible independent contractor" under the REIT rules in order for the rent paid to us by TRSs to be qualifying income for gross income tests. Among other requirements, in order to qualify as an eligible independent contractor, (i) a manager must be actively engaged in the trade or business of operating hotels for third parties at the time the manager enters into a management contract with a TRS lessee and (ii) the manager must not own more than 35% of our outstanding shares (by value) and no person or group of persons can own more than 35% of our outstanding shares and the ownership interests of the manager. Although we believe that all our former hotel managers qualified as eligible independent contractors, no complete assurance can be provided that the IRS will not successfully challenge that position.
24
Dividends payable by REITs do not qualify for the reduced tax rates available for some dividends.
The maximum tax rate applicable to "qualified dividend income" payable to U.S. stockholders that are taxed at individual rates is 20%. Dividends payable by REITs, however, are generally not eligible for the reduced rates on qualified dividend income. Effective January 1, 2018, the 2017 Tax Legislation allows individual investors to be taxed at a 20% deduction on a REIT's ordinary dividends. The more favorable rates applicable to regular corporate qualified dividends could cause investors who are taxed at individual rates to perceive investments in REITs to be relatively less attractive than investments in the stocks of non-REIT corporations that pay dividends treated as qualified dividend income, which could adversely affect the value of the shares of REITs, including our common stock.
Complying with REIT requirements may limit our ability to hedge effectively.
The REIT provisions of the Code may limit our ability to hedge the risks inherent to our operations. Under current law, any income that we generate from derivatives or other transactions intended to hedge our interest rate risk with respect to borrowings made, or to be made, to acquire or carry real estate assets generally will not constitute gross income for purposes of the 75% and 95% income requirements applicable to REITs, provided that we properly identify the hedging transaction pursuant to the applicable sections of the Code and Treasury Regulations. To the extent that we enter into other types of hedging transactions, the income from those transactions is likely to be treated as non-qualifying income for purposes of both gross income tests. As a result of these rules, we may be required to limit the use of hedging techniques that might otherwise be advantageous, which could result in greater risks associated with interest rate or other changes than we would otherwise incur.
The ability of our board of directors to revoke our REIT qualification without stockholder approval may cause adverse consequences to our stockholders.
Our charter provides that our board of directors may revoke or otherwise terminate our REIT election, without the approval of our stockholders, if it determines that it is no longer in our best interest to attempt to, or continue to qualify as a REIT. If we cease to be a REIT, we would become subject to U.S. federal income tax on our taxable income and would no longer be required to distribute most of our taxable income to our stockholders, which may have adverse consequences on our total return to our stockholders.
We may be subject to adverse legislative or regulatory tax changes that could reduce the value of our common stock.
At any time, the U.S. federal income tax laws governing REITs or the administrative interpretations of those laws may be amended. We cannot predict when or if any new U.S. federal income tax law, regulation, or administrative interpretation, or any amendment to any existing federal income tax law, regulation or administrative interpretation, will be adopted, promulgated or become effective and any such law, regulation, or interpretation may take effect retroactively. We and our stockholders could be adversely affected by any such change in, or any new, U.S. federal income tax law, regulation or administrative interpretation. In addition, the law relating to the tax treatment of other entities, or an investment in other entities, could change, making an investment in such other entities more attractive relative to an investment in a REIT.
The 2017 Tax Legislation has significantly changed the U.S. federal income taxation of U.S. businesses and their owners, including REITs and their stockholders. Changes made by the 2017 Tax Legislation that could affect us and our stockholders include, among others:
25
• temporarily reducing individual U.S. federal income tax rates on ordinary income; the highest individual U.S. federal income tax rate has been reduced from 39.6% to 37% for taxable years beginning after December 31, 2017 and before January 1, 2026;
• permanently eliminating the progressive corporate tax rate structure, which previously imposed a maximum corporate tax rate of 35%, and replacing it with a flat corporate tax rate of 21%;
• permitting a deduction for certain pass-through business income, including dividends received by our stockholders from us that are not designated by us as capital gain dividends or qualified dividend income, which will allow individuals, trusts, and estates to deduct up to 20% of such amounts for taxable years beginning after December 31, 2017 and before January 1, 2026;
• reducing the highest rate of withholding with respect to our distributions to non-U.S. stockholders that are treated as attributable to gains from the sale or exchange of U.S. real property interests from 35% to 21%;
Many of these changes that are applicable to us are effective beginning with our 2018 taxable year, without any transition periods or grandfathering for existing transactions. The legislation is unclear in many respects and could be subject to potential amendments and technical corrections, as well as interpretations and implementing regulations by the IRS and the U.S. Department of the Treasury, any of which could lessen or increase the impact of the legislation. In addition, it is unclear how these U.S. federal income tax changes will affect state and local taxation, which often uses federal taxable income as a starting point for computing state and local tax liabilities. While some of the changes made by the tax legislation may adversely affect us in one or more reporting periods and prospectively, other changes may be beneficial on a going forward basis. We continue to work with our tax advisors and auditors to determine the full impact that the 2017 Tax Legislation as a whole will have on us.
Item 1B. Unresolved Staff Comments
None.
26
• limiting our deduction for net operating losses arising in taxable years beginning after December 31, 2017 to 80% of our REIT taxable income (determined without regard to the dividends paid reduction);
• generally limiting the deduction for net business interest expense in excess of 30% of a business's "adjusted taxable income," except for taxpayers that engage in certain real estate businesses (including most equity REITs) and elect out of this rule (provided that such electing taxpayers must use an alternative depreciation system with longer depreciation periods); and
• eliminating the corporate alternative minimum tax.
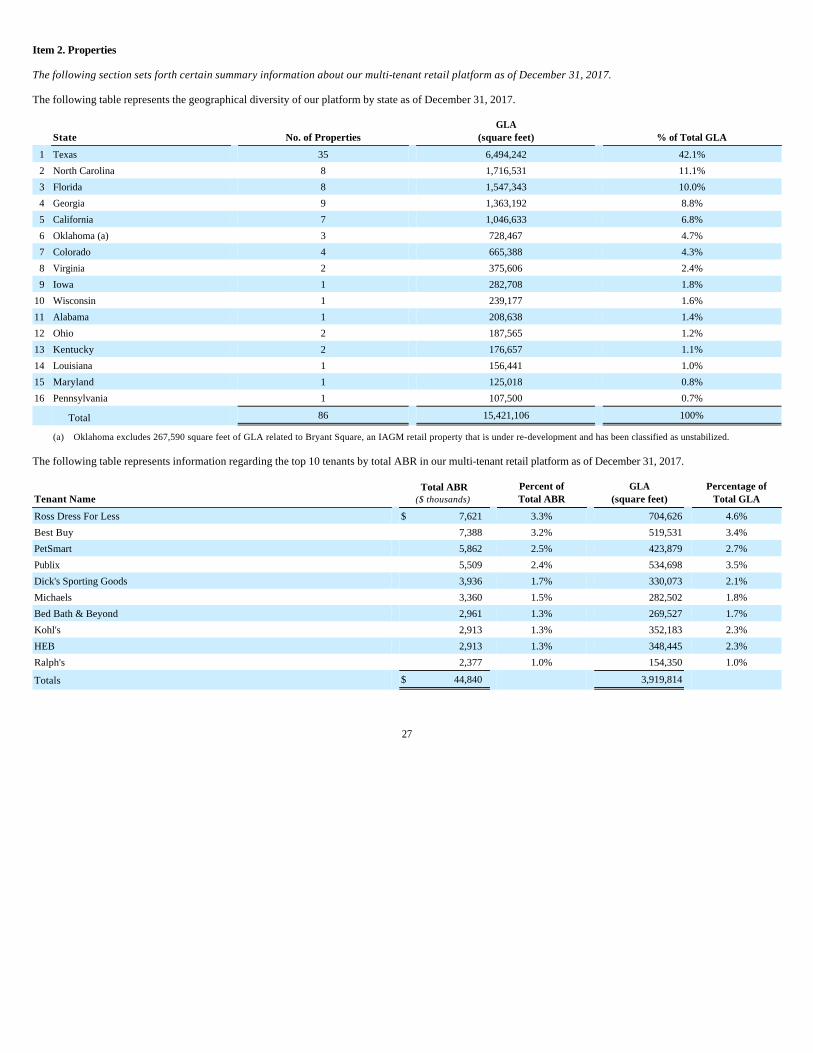
Item 2. Properties
The following section sets forth certain summary information about our multi-tenant retail platform as of December 31, 2017.
The following table represents the geographical diversity of our platform by state as of December 31, 2017.
The following table represents information regarding the top 10 tenants by total ABR in our multi-tenant retail platform as of December 31, 2017.
27
State No. of Properties GLA
(square feet) % of Total GLA
1 Texas 35 6,494,242 42.1%
2 North Carolina 8 1,716,531 11.1%
3 Florida 8 1,547,343 10.0%
4 Georgia 9 1,363,192 8.8%
5 California 7 1,046,633 6.8%
6 Oklahoma (a) 3 728,467 4.7%
7 Colorado 4 665,388 4.3%
8 Virginia 2 375,606 2.4%
9 Iowa 1 282,708 1.8%
10 Wisconsin 1 239,177 1.6%
11 Alabama 1 208,638 1.4%
12 Ohio 2 187,565 1.2%
13 Kentucky 2 176,657 1.1%
14 Louisiana 1 156,441 1.0%
15 Maryland 1 125,018 0.8%
16 Pennsylvania 1 107,500 0.7%
Total 86 15,421,106 100%
(a) Oklahoma excludes 267,590 square feet of GLA related to Bryant Square, an IAGM retail property that is under re-development and has been classified as unstabilized.
Tenant Name Total ABR
($ thousands) Percent of Total ABR
GLA (square feet)
Percentage of Total GLA
Ross Dress For Less $ 7,621 3.3% 704,626 4.6%
Best Buy 7,388 3.2% 519,531 3.4%
PetSmart 5,862 2.5% 423,879 2.7%
Publix 5,509 2.4% 534,698 3.5%
Dick's Sporting Goods 3,936 1.7% 330,073 2.1%
Michaels 3,360 1.5% 282,502 1.8%
Bed Bath & Beyond 2,961 1.3% 269,527 1.7%
Kohl's 2,913 1.3% 352,183 2.3%
HEB 2,913 1.3% 348,445 2.3%
Ralph's 2,377 1.0% 154,350 1.0%
Totals $ 44,840 3,919,814
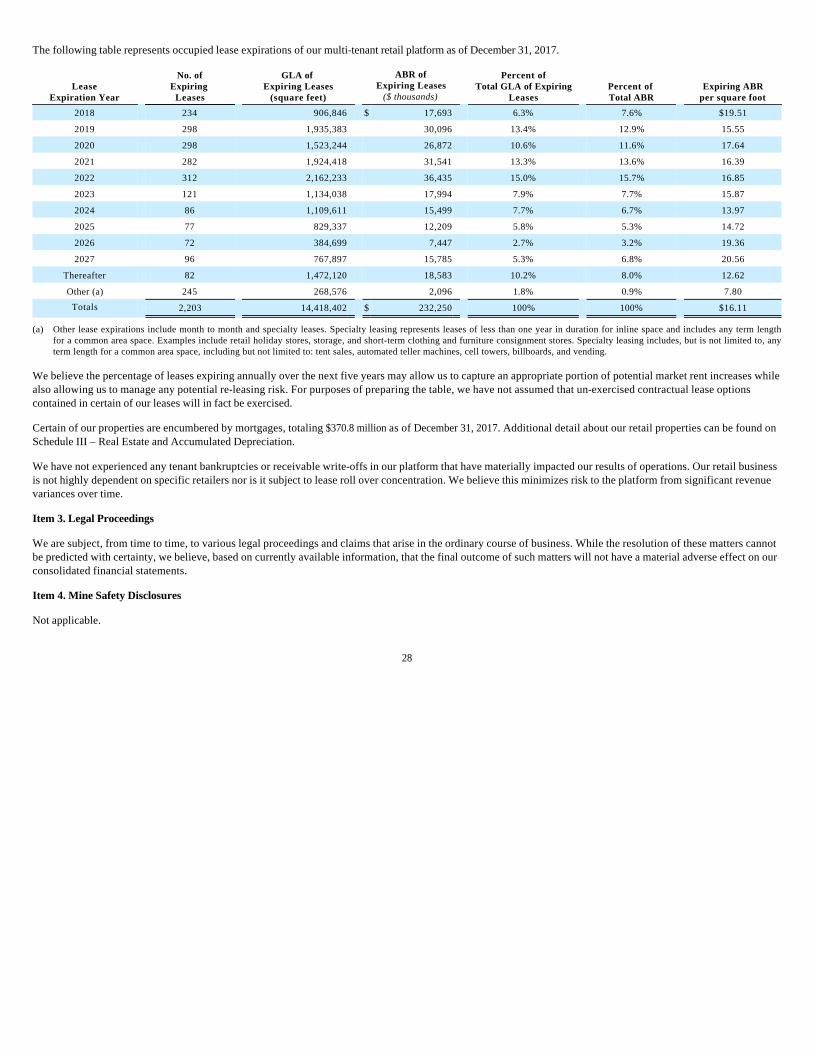
The following table represents occupied lease expirations of our multi-tenant retail platform as of December 31, 2017.
We believe the percentage of leases expiring annually over the next five years may allow us to capture an appropriate portion of potential market rent increases while also allowing us to manage any potential re-leasing risk. For purposes of preparing the table, we have not assumed that un-exercised contractual lease options contained in certain of our leases will in fact be exercised.
Certain of our properties are encumbered by mortgages, totaling $370.8 million as of December 31, 2017. Additional detail about our retail properties can be found on Schedule III – Real Estate and Accumulated Depreciation.
We have not experienced any tenant bankruptcies or receivable write-offs in our platform that have materially impacted our results of operations. Our retail business is not highly dependent on specific retailers nor is it subject to lease roll over concentration. We believe this minimizes risk to the platform from significant revenue variances over time.
Item 3. Legal Proceedings
We are subject, from time to time, to various legal proceedings and claims that arise in the ordinary course of business. While the resolution of these matters cannot be predicted with certainty, we believe, based on currently available information, that the final outcome of such matters will not have a material adverse effect on our consolidated financial statements.
Item 4. Mine Safety Disclosures
Not applicable.
28
Lease Expiration Year
No. of Expiring
Leases
GLA of Expiring Leases
(square feet)
ABR of Expiring Leases
($ thousands)
Percent of Total GLA of Expiring
Leases Percent of Total ABR
Expiring ABR per square foot
2018 234 906,846 $ 17,693 6.3% 7.6% $19.51
2019 298 1,935,383 30,096 13.4% 12.9% 15.55
2020 298 1,523,244 26,872 10.6% 11.6% 17.64
2021 282 1,924,418 31,541 13.3% 13.6% 16.39
2022 312 2,162,233 36,435 15.0% 15.7% 16.85
2023 121 1,134,038 17,994 7.9% 7.7% 15.87
2024 86 1,109,611 15,499 7.7% 6.7% 13.97
2025 77 829,337 12,209 5.8% 5.3% 14.72
2026 72 384,699 7,447 2.7% 3.2% 19.36
2027 96 767,897 15,785 5.3% 6.8% 20.56
Thereafter 82 1,472,120 18,583 10.2% 8.0% 12.62
Other (a) 245 268,576 2,096 1.8% 0.9% 7.80
Totals 2,203 14,418,402 $ 232,250 100% 100% $16.11
(a) Other lease expirations include month to month and specialty leases. Specialty leasing represents leases of less than one year in duration for inline space and includes any term length for a common area space. Examples include retail holiday stores, storage, and short-term clothing and furniture consignment stores. Specialty leasing includes, but is not limited to, any term length for a common area space, including but not limited to: tent sales, automated teller machines, cell towers, billboards, and vending.
PART II
Item 5. Market for Registrant’s Common Equity, Related Stockholder Matters and Issuer Purchases of Equity Securities.
Market Information
Our shares of common stock are not listed on a national securities exchange and there is not otherwise an established public trading market for our shares. We publish an estimated per share value of our common stock to assist broker dealers that sold our common stock in our initial and follow-on "best efforts" offerings to comply with the rules published by FINRA. On May 5, 2017, we announced an estimated value of our common stock as of May 1, 2017 equal to $3.29 per share.
The Audit Committee of our Board of Directors and our Board engaged Duff & Phelps, an independent third-party global valuation advisory and corporate finance consulting firm that specializes in providing real estate valuation services, to advise the Audit Committee and the Board in their estimate of the per share value of our common stock on a fully diluted basis as of May 1, 2017. Duff & Phelps has extensive experience estimating the fair values of commercial real estate. The report furnished to the Audit Committee and the Board by Duff & Phelps complies with the reporting requirements set forth under Standard Rule 2-2(b) of the Uniform Standards of Professional Appraisal Practice and is certified by a member of the Appraisal Institute with the MAI designation. The Duff & Phelps report, dated May 1, 2017, reflects values as of May 1, 2017.
Duff & Phelps does not have any direct or indirect interests in any transaction with us or in any currently proposed transaction to which we are a party, and there are no conflicts of interest between Duff & Phelps, on one hand, and the Company or any of our directors, on the other. In the ordinary course of business, Duff & Phelps provides services to us in connection with the allocation of the purchase price of acquired properties for accounting and financial reporting purposes.
The Board is ultimately and solely responsible for the determination of the estimated value per share of our common stock. The estimated value per share was determined and approved by the Board based on the recommendation of the Audit Committee.
Duff & Phelps provided a range of per share values for the Audit Committee and the Board to consider and utilized the "net asset value" or "NAV" method. This method is based on the fair value of real estate, real estate related investments and all other assets, less the fair value of total liabilities. The fair value estimate of the real estate assets is equal to the sum of its individual real estate values. Generally, Duff & Phelps estimated the value of our real estate and real estate-related assets at our ownership interest using the income capitalization approach, which included using a discounted cash flow calculation of projected net operating income, less capital expenditures, for each property for the ten-year hold period ending April 30, 2027 or the residual stabilized year, and applying a market supported discount rate and capitalization rate. For acquisitions after January 1, 2017 and properties under contract for sale, Duff & Phelps valued the assets at the contractual purchase price. For all other assets, including cash, other current assets, non-retail joint ventures, land developments and marketable securities, fair value was determined separately. A fair value of our long-term debt obligations, including current liabilities, was also estimated by Duff & Phelps, by comparing market interest rates to the contract rates on our long-term debt and discounting to present value the difference in future payments. For loans currently in default or assets valued near the outstanding debt balance, Duff & Phelps excluded a fair value estimate of the debt.
Duff & Phelps completed its work in conformance with Investment Program Association Practice Guideline 2013-01, "Valuations of Publicly Registered Non-Listed REITs," dated April 29, 2013 and guidelines published by FINRA. In addition, Duff & Phelps determined NAV in a manner consistent with the definition of fair value under U.S. GAAP set forth in Financial Accounting Standards Board ("FASB") Topic ASC 820.
The net asset value per share provided by Duff & Phelps was estimated by subtracting the fair value of the total liabilities from the fair value of the total assets and then dividing the result by the number of shares of common stock outstanding on a fully diluted basis as of May 1, 2017. Duff & Phelps then applied a discount rate sensitivity analysis on the discount rates used to value the retail properties and the office property, as described in more detail below, resulting in a value range of $3.24 to $3.51 per share. The mid-point in that range was $3.37.
On May 1, 2017, our Audit Committee and our Board met to review and discuss Duff & Phelps’s report. Following this review, the Audit Committee recommended and the Board unanimously determined a new estimated per share value of our common stock of $3.29 as of May 1, 2017. In establishing the estimated per share value, the Audit Committee and the Board considered the Duff & Phelps analysis and other factors. Based on this review, the Audit Committee recommended and the Board determined it was appropriate to reduce the Duff & Phelps mid-point value to account for: (i) current U.S. economic conditions, including political effects on the economy, interest rate changes and overall market conditions; (ii) industry-specific trends and data (i.e., store closings and bankruptcies); and (iii) e-commerce sales growth and the perception of the Internet's impact on
29
retail sales. In addition, the Audit Committee recommended and the Board determined it was also appropriate to deduct estimated closing costs, transaction fees and contingencies related to the planned disposition of certain properties pursuant to our strategic plan. However, there are no assurances that such costs will be incurred at the level estimated by the Company. The timing of dispositions is subject to economic and market conditions, and we may not be successful in selling such properties on acceptable terms or at all.
As with any methodology used to estimate value, the methodology employed and the recommendations made by the Company were based upon a number of estimates and assumptions that may not be accurate or complete. Further, different parties using different assumptions and estimates could derive a different estimated value per share, which could be significantly different from our estimated value per share. The estimated per share value does not represent (i) the amount at which our shares would trade at on a national securities exchange, (ii) the amount a stockholder would obtain if he or she tried to sell his or her shares, or (iii) the amount stockholders would receive if we liquidated our assets and distributed the proceeds after paying all of our expenses and liabilities. Accordingly, with respect to the estimated value per share, we can give no assurance that:
The estimated value per share was determined by our Board of Directors on May 1, 2017 and reflects the fact that the estimate was calculated at a moment in time. The value of our shares will likely change over time and will be influenced by changes to the value of our individual assets as well as changes and developments in the real estate (and, in particular, retail real estate) and capital markets. Nevertheless, stockholders should not rely on the estimated value per share in making a decision to buy or sell shares of our common stock.
Stockholders
As of February 23, 2018, we had 155,898 stockholders of record.
Distributions
We have been paying cash distributions since October 2005. In October 2015, we moved from monthly to quarterly distributions. Our distributions are paid one quarter in arrears. During the years ended December 31, 2017 and 2016, we paid cash distributions of $53.4 million and $98.6 million, respectively. For Federal income tax purposes for the years ended December 31, 2017, $0.069 per share, or 100%, of the Company's total distributions would be treated as a non-taxable return of capital and will reduce the tax basis of each share of the Company's common stock held. For the year ended December 31, 2016, $0.150 per share, or 31.9%, of the total distribution paid of $0.470 per share were treated as a return of capital. Of the remaining portion of the distributions paid for the year ended December 31, 2016, $0.080 per share, or 17.0%, were treated as ordinary dividends and $0.240 per share, or 51.1%, were treated as capital gains dividends. Included in the distributions in 2016 was the Highlands' stock distribution to our shareholders as a result of the Highlands spin-off.
Notification Regarding Payments of Distributions
Stockholders should be aware that the method by which a stockholder has chosen to receive his or her distributions affects the timing of the stockholder's receipt of those distributions. Specifically, under our transfer agent's payment processing procedures, distributions are paid in the following manner:
30
• a stockholder would be able to resell his or her shares at this estimated value;
• a stockholder would ultimately realize distributions per share equal to our estimated value per share upon liquidation of our assets and settlement of our liabilities or a sale of the Company;
• our shares would trade at a price equal to or greater than the estimated value per share if we listed them on a national securities exchange;
• the estimated transaction costs, closing costs and contingencies related to the disposition of certain of our retail properties reflected in our estimated value will be incurred at the level estimated by the Company;
• the methodology used to estimate our value per share would be acceptable to FINRA or that the estimated value per share will satisfy the applicable annual valuation requirements under the Employee Retirement Income Security Act of 1974, as amended ("ERISA") and the Code, with respect to employee benefit plans subject to ERISA and other retirement plans or accounts subject to Section 4975 of the Code; or
• this estimated value will increase, stay at the current level, or not continue to decrease, over time.
(1) those stockholders who have chosen to receive their distributions via wire transfer receive their distributions on the distribution payment date (as determined by our board of directors);
(2) those stockholders who have chosen to receive their distributions by paper check are typically mailed those checks on the distribution payment date, but sometimes paper checks are mailed on the day following the distribution payment date; and
(3) for those stockholders holding shares through a broker or other nominee, the distribution payments are wired, or paper checks are mailed, to the broker or other nominee on the day following the distribution payment date.
All stockholders who hold shares directly in record name may change at any time the method through which they receive their distributions from our transfer agent, and those stockholders will not have to pay any fees to us or our transfer agent to make such a change. Accordingly, each stockholder may select the timing of receipt of distributions from our transfer agent by selecting the method above that corresponds to the desired timing for receipt of the distributions. Because all stockholders may elect to have their distributions sent via wire transfer on the distribution payment date, we treat all of our stockholders, regardless of the method by which they have chosen to receive their distributions, as having constructively received their distributions from us on the distribution payment date for Federal income tax purposes.
Stockholders who hold shares directly in record name and who would like to change their distribution payment method should complete a "Change of Distribution Election Form." The form is available on our website under "Investor Relations-Forms page."
We note that the payment method for stockholders who hold shares through a broker or nominee is determined by the broker or nominee. Similarly, the payment method for stockholders who hold shares in a tax-deferred account, such as an individual retirement account, is generally determined by the custodian for the account. Stockholders that currently hold shares through a broker or other nominee and would like to receive distributions via wire transfer or paper check should contact their broker or other nominee regarding their processes for transferring shares to record name ownership. Similarly, stockholders who hold shares in a tax-deferred account may need to hold shares outside of their tax-deferred accounts to change the method through which they receive their distributions. Stockholders who hold shares through a tax-deferred account and who would like to change the method through which they receive their distributions should contact their custodians regarding the transfer process and should consult their tax advisor regarding the consequences of transferring shares outside of a tax-deferred account.
Recent Sales of Unregistered Securities
None.
31
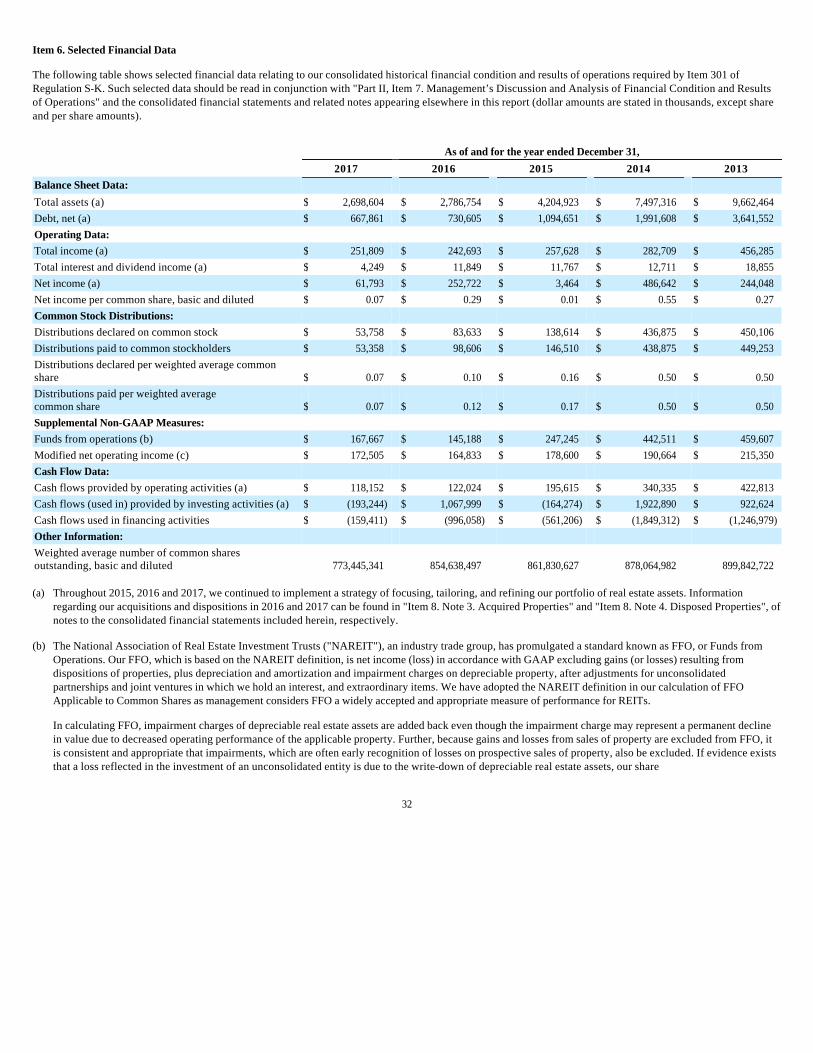
Item 6. Selected Financial Data
The following table shows selected financial data relating to our consolidated historical financial condition and results of operations required by Item 301 of Regulation S-K. Such selected data should be read in conjunction with "Part II, Item 7. Management’s Discussion and Analysis of Financial Condition and Results of Operations" and the consolidated financial statements and related notes appearing elsewhere in this report (dollar amounts are stated in thousands, except share and per share amounts).
In calculating FFO, impairment charges of depreciable real estate assets are added back even though the impairment charge may represent a permanent decline in value due to decreased operating performance of the applicable property. Further, because gains and losses from sales of property are excluded from FFO, it is consistent and appropriate that impairments, which are often early recognition of losses on prospective sales of property, also be excluded. If evidence exists that a loss reflected in the investment of an unconsolidated entity is due to the write-down of depreciable real estate assets, our share
32
As of and for the year ended December 31,
2017 2016 2015 2014 2013
Balance Sheet Data:
Total assets (a) $ 2,698,604 $ 2,786,754 $ 4,204,923 $ 7,497,316 $ 9,662,464 Debt, net (a) $ 667,861 $ 730,605 $ 1,094,651 $ 1,991,608 $ 3,641,552 Operating Data:
Total income (a) $ 251,809 $ 242,693 $ 257,628 $ 282,709 $ 456,285 Total interest and dividend income (a) $ 4,249 $ 11,849 $ 11,767 $ 12,711 $ 18,855 Net income (a) $ 61,793 $ 252,722 $ 3,464 $ 486,642 $ 244,048 Net income per common share, basic and diluted $ 0.07 $ 0.29 $ 0.01 $ 0.55 $ 0.27 Common Stock Distributions:
Distributions declared on common stock $ 53,758 $ 83,633 $ 138,614 $ 436,875 $ 450,106 Distributions paid to common stockholders $ 53,358 $ 98,606 $ 146,510 $ 438,875 $ 449,253 Distributions declared per weighted average common share $ 0.07 $ 0.10 $ 0.16 $ 0.50 $ 0.50 Distributions paid per weighted average common share $ 0.07 $ 0.12 $ 0.17 $ 0.50 $ 0.50 Supplemental Non-GAAP Measures:
Funds from operations (b) $ 167,667 $ 145,188 $ 247,245 $ 442,511 $ 459,607 Modified net operating income (c) $ 172,505 $ 164,833 $ 178,600 $ 190,664 $ 215,350 Cash Flow Data:
Cash flows provided by operating activities (a) $ 118,152 $ 122,024 $ 195,615 $ 340,335 $ 422,813 Cash flows (used in) provided by investing activities (a) $ (193,244 ) $ 1,067,999 $ (164,274 ) $ 1,922,890 $ 922,624 Cash flows used in financing activities $ (159,411 ) $ (996,058 ) $ (561,206 ) $ (1,849,312 ) $ (1,246,979 )
Other Information:
Weighted average number of common shares outstanding, basic and diluted 773,445,341 854,638,497 861,830,627 878,064,982 899,842,722
(a) Throughout 2015, 2016 and 2017, we continued to implement a strategy of focusing, tailoring, and refining our portfolio of real estate assets. Information regarding our acquisitions and dispositions in 2016 and 2017 can be found in "Item 8. Note 3. Acquired Properties" and "Item 8. Note 4. Disposed Properties", of notes to the consolidated financial statements included herein, respectively.
(b) The National Association of Real Estate Investment Trusts ("NAREIT"), an industry trade group, has promulgated a standard known as FFO, or Funds from Operations. Our FFO, which is based on the NAREIT definition, is net income (loss) in accordance with GAAP excluding gains (or losses) resulting from dispositions of properties, plus depreciation and amortization and impairment charges on depreciable property, after adjustments for unconsolidated partnerships and joint ventures in which we hold an interest, and extraordinary items. We have adopted the NAREIT definition in our calculation of FFO Applicable to Common Shares as management considers FFO a widely accepted and appropriate measure of performance for REITs.
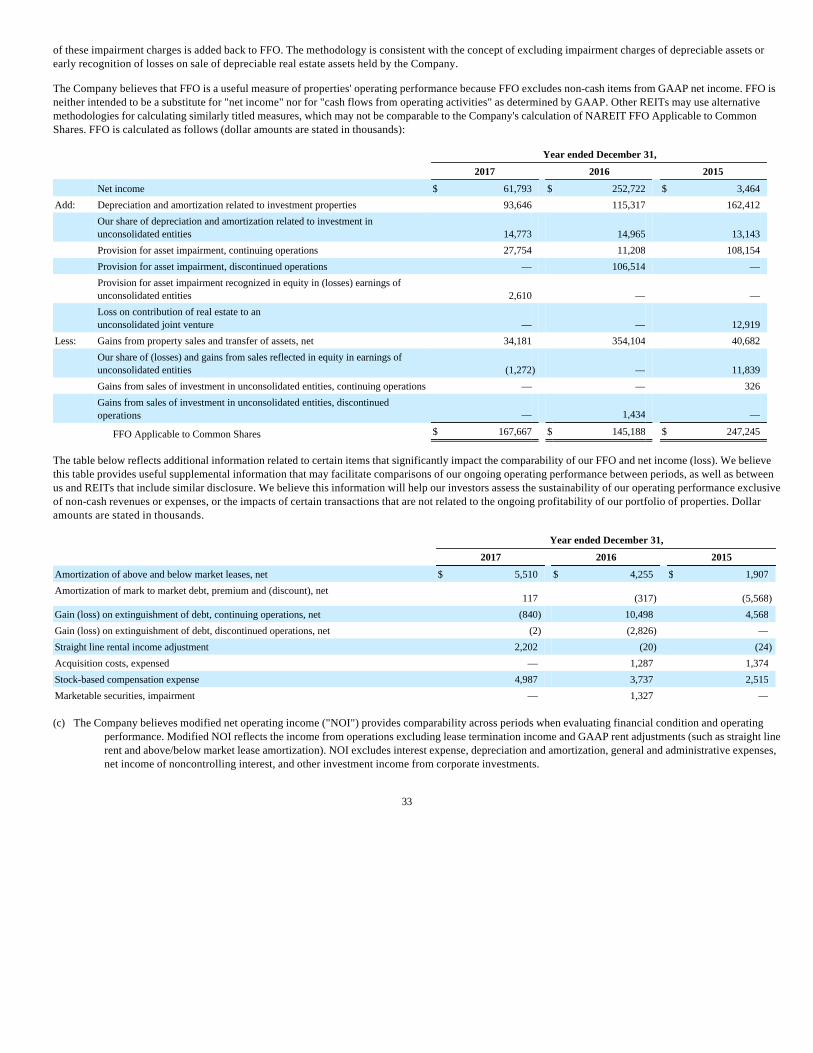
of these impairment charges is added back to FFO. The methodology is consistent with the concept of excluding impairment charges of depreciable assets or early recognition of losses on sale of depreciable real estate assets held by the Company.
The Company believes that FFO is a useful measure of properties' operating performance because FFO excludes non-cash items from GAAP net income. FFO is neither intended to be a substitute for "net income" nor for "cash flows from operating activities" as determined by GAAP. Other REITs may use alternative methodologies for calculating similarly titled measures, which may not be comparable to the Company's calculation of NAREIT FFO Applicable to Common Shares. FFO is calculated as follows (dollar amounts are stated in thousands):
The table below reflects additional information related to certain items that significantly impact the comparability of our FFO and net income (loss). We believe this table provides useful supplemental information that may facilitate comparisons of our ongoing operating performance between periods, as well as between us and REITs that include similar disclosure. We believe this information will help our investors assess the sustainability of our operating performance exclusive of non-cash revenues or expenses, or the impacts of certain transactions that are not related to the ongoing profitability of our portfolio of properties. Dollar amounts are stated in thousands.
33
Year ended December 31,
2017 2016 2015
Net income $ 61,793 $ 252,722 $ 3,464 Add: Depreciation and amortization related to investment properties 93,646 115,317 162,412
Our share of depreciation and amortization related to investment in unconsolidated entities 14,773 14,965 13,143
Provision for asset impairment, continuing operations 27,754 11,208 108,154 Provision for asset impairment, discontinued operations — 106,514 —
Provision for asset impairment recognized in equity in (losses) earnings of unconsolidated entities 2,610 — —
Loss on contribution of real estate to an unconsolidated joint venture — — 12,919
Less: Gains from property sales and transfer of assets, net 34,181 354,104 40,682
Our share of (losses) and gains from sales reflected in equity in earnings of unconsolidated entities (1,272 ) — 11,839
Gains from sales of investment in unconsolidated entities, continuing operations — — 326
Gains from sales of investment in unconsolidated entities, discontinued operations — 1,434 —
FFO Applicable to Common Shares $ 167,667 $ 145,188 $ 247,245
Year ended December 31,
2017 2016 2015
Amortization of above and below market leases, net $ 5,510 $ 4,255 $ 1,907 Amortization of mark to market debt, premium and (discount), net
117 (317) (5,568)
Gain (loss) on extinguishment of debt, continuing operations, net (840) 10,498 4,568 Gain (loss) on extinguishment of debt, discontinued operations, net (2) (2,826) — Straight line rental income adjustment 2,202 (20) (24)
Acquisition costs, expensed — 1,287 1,374 Stock-based compensation expense 4,987 3,737 2,515 Marketable securities, impairment — 1,327 —
(c) The Company believes modified net operating income ("NOI") provides comparability across periods when evaluating financial condition and operating performance. Modified NOI reflects the income from operations excluding lease termination income and GAAP rent adjustments (such as straight line rent and above/below market lease amortization). NOI excludes interest expense, depreciation and amortization, general and administrative expenses, net income of noncontrolling interest, and other investment income from corporate investments.
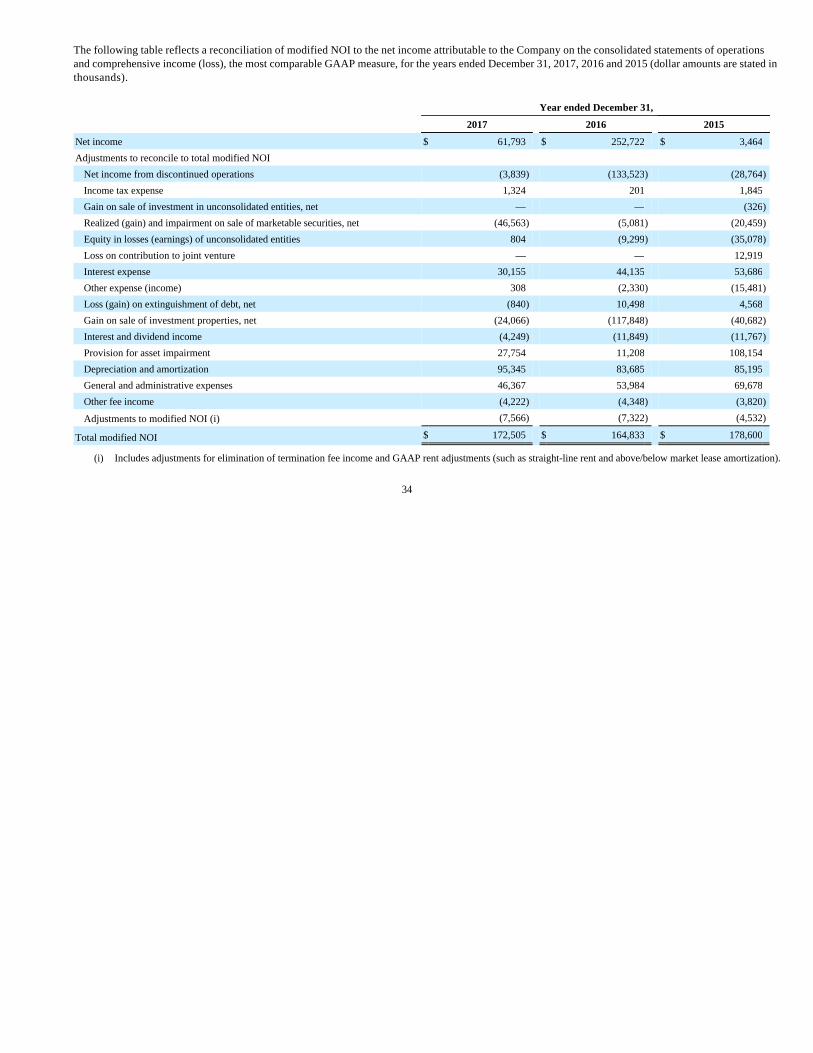
The following table reflects a reconciliation of modified NOI to the net income attributable to the Company on the consolidated statements of operations and comprehensive income (loss), the most comparable GAAP measure, for the years ended December 31, 2017, 2016 and 2015 (dollar amounts are stated in thousands).
34
Year ended December 31,
2017 2016 2015
Net income $ 61,793 $ 252,722 $ 3,464 Adjustments to reconcile to total modified NOI
Net income from discontinued operations (3,839) (133,523) (28,764)
Income tax expense 1,324 201 1,845 Gain on sale of investment in unconsolidated entities, net — — (326)
Realized (gain) and impairment on sale of marketable securities, net (46,563) (5,081) (20,459)
Equity in losses (earnings) of unconsolidated entities 804 (9,299) (35,078)
Loss on contribution to joint venture — — 12,919 Interest expense 30,155 44,135 53,686 Other expense (income) 308 (2,330) (15,481)
Loss (gain) on extinguishment of debt, net (840) 10,498 4,568 Gain on sale of investment properties, net (24,066) (117,848) (40,682)
Interest and dividend income (4,249) (11,849) (11,767)
Provision for asset impairment 27,754 11,208 108,154 Depreciation and amortization 95,345 83,685 85,195 General and administrative expenses 46,367 53,984 69,678 Other fee income (4,222) (4,348) (3,820)
Adjustments to modified NOI (i) (7,566) (7,322) (4,532)
Total modified NOI $ 172,505 $ 164,833 $ 178,600
(i) Includes adjustments for elimination of termination fee income and GAAP rent adjustments (such as straight-line rent and above/below market lease amortization).
The following discussion and analysis of our financial condition and results of operations should be read in conjunction with "Part II, Item 6. Selected Financial Data" and our consolidated financial statements included in this Annual Report. In addition to historical data, this discussion contains forward-looking statements about our business, operations and financial performance based on current expectations that involve risks, uncertainties and assumptions. Our actual results may differ materially from those discussed in the forward-looking statements as a result of various factors, including but not limited to those discussed in "Special Note Regarding Forward-Looking Statements" and "Part I, Item 1A. Risk Factors" included elsewhere in this Annual Report.
Item 7. Management’s Discussion and Analysis of Financial Condition and Results of Operations
The following discussion and analysis relates to the years ended December 31, 2017, 2016 and 2015 and as of December 31, 2017 and 2016. You should read the following discussion and analysis along with our consolidated financial statements and the related notes included in this Annual Report. Unless otherwise noted, all dollar amounts are stated in thousands, except per share and per square foot amounts.
Executive Summary
InvenTrust Properties Corp. is a premier, pure-play retail REIT that owns, leases, redevelops, acquires and manages open-air centers in key growth markets with favorable demographics. We seek to continue to execute our strategy to enhance our multi-tenant retail platform by acquiring the right centers in the right markets, driven by focused and disciplined capital allocation.
During the year ended December 31, 2017, we continued to execute on our strategy by acquiring properties in our targeted core markets as well as opportunistically disposing of properties in low growth markets or where we believe the properties' values have been maximized. We are redeploying the proceeds from these sales with a disciplined approach into strategic retail properties and intend to continue to do so. We believe these opportunistic disposals will enhance the overall value of our multi-tenant retail platform over time. However, our disposition activity could continue to cause us to experience dilution in financial operating performance during the period we dispose of properties.
In evaluating our financial condition and operating performance, management focuses on the following financial and non-financial indicators, discussed in further detail herein:
35
• Property NOI, which excludes interest expense, depreciation and amortization, general and administrative expenses, net income of noncontrolling interest, and interest and dividends from corporate investments;
• Modified NOI, which reflects property NOI exclusive of lease termination income and GAAP rent adjustments (such as straight-line rent and above/below market lease amortization);
• FFO Applicable to Common Shares, a supplemental non-GAAP measure;
• Cash flow from operations as determined in accordance with GAAP;
• Economic and physical occupancy and rental rates;
• Leasing activity and lease rollover;
• Management of operating expenses;
• Management of general and administrative expenses;
• Debt maturities and leverage ratios; and
• Liquidity levels.
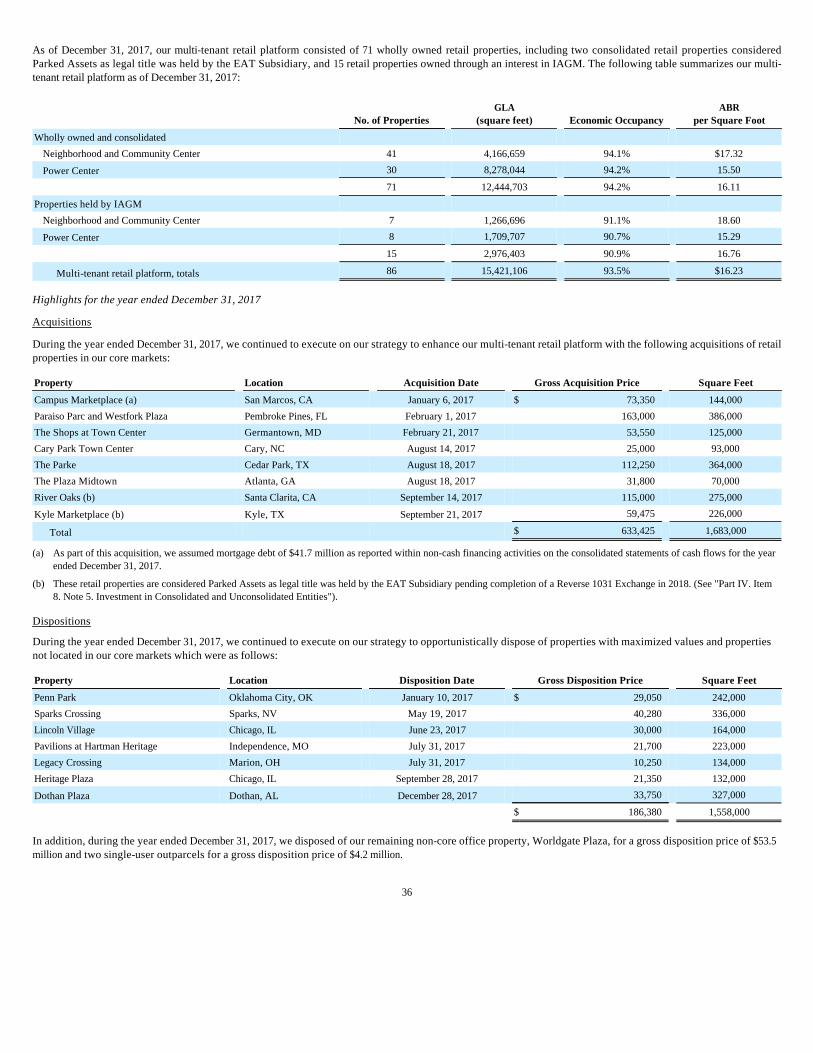
As of December 31, 2017, our multi-tenant retail platform consisted of 71 wholly owned retail properties, including two consolidated retail properties considered Parked Assets as legal title was held by the EAT Subsidiary, and 15 retail properties owned through an interest in IAGM. The following table summarizes our multi-tenant retail platform as of December 31, 2017:
Highlights for the year ended December 31, 2017
Acquisitions
During the year ended December 31, 2017, we continued to execute on our strategy to enhance our multi-tenant retail platform with the following acquisitions of retail properties in our core markets:
Dispositions
During the year ended December 31, 2017, we continued to execute on our strategy to opportunistically dispose of properties with maximized values and properties not located in our core markets which were as follows:
In addition, during the year ended December 31, 2017, we disposed of our remaining non-core office property, Worldgate Plaza, for a gross disposition price of $53.5 million and two single-user outparcels for a gross disposition price of $4.2 million.
36
No. of Properties GLA
(square feet) Economic Occupancy ABR
per Square Foot
Wholly owned and consolidated
Neighborhood and Community Center 41 4,166,659 94.1% $17.32
Power Center 30 8,278,044 94.2% 15.50
71 12,444,703 94.2% 16.11
Properties held by IAGM
Neighborhood and Community Center 7 1,266,696 91.1% 18.60
Power Center 8 1,709,707 90.7% 15.29
15 2,976,403 90.9% 16.76
Multi-tenant retail platform, totals 86 15,421,106 93.5% $16.23
Property Location Acquisition Date Gross Acquisition Price Square Feet
Campus Marketplace (a) San Marcos, CA January 6, 2017 $ 73,350 144,000
Paraiso Parc and Westfork Plaza Pembroke Pines, FL February 1, 2017 163,000 386,000
The Shops at Town Center Germantown, MD February 21, 2017 53,550 125,000
Cary Park Town Center Cary, NC August 14, 2017 25,000 93,000
The Parke Cedar Park, TX August 18, 2017 112,250 364,000
The Plaza Midtown Atlanta, GA August 18, 2017 31,800 70,000
River Oaks (b) Santa Clarita, CA September 14, 2017 115,000 275,000
Kyle Marketplace (b) Kyle, TX September 21, 2017 59,475 226,000
Total $ 633,425 1,683,000
(a) As part of this acquisition, we assumed mortgage debt of $41.7 million as reported within non-cash financing activities on the consolidated statements of cash flows for the year ended December 31, 2017.
(b) These retail properties are considered Parked Assets as legal title was held by the EAT Subsidiary pending completion of a Reverse 1031 Exchange in 2018. (See "Part IV. Item 8. Note 5. Investment in Consolidated and Unconsolidated Entities").
Property Location Disposition Date Gross Disposition Price Square Feet
Penn Park Oklahoma City, OK January 10, 2017 $ 29,050 242,000
Sparks Crossing Sparks, NV May 19, 2017 40,280 336,000
Lincoln Village Chicago, IL June 23, 2017 30,000 164,000
Pavilions at Hartman Heritage Independence, MO July 31, 2017 21,700 223,000
Legacy Crossing Marion, OH July 31, 2017 10,250 134,000
Heritage Plaza Chicago, IL September 28, 2017 21,350 132,000
Dothan Plaza Dothan, AL December 28, 2017 33,750 327,000
$ 186,380 1,558,000
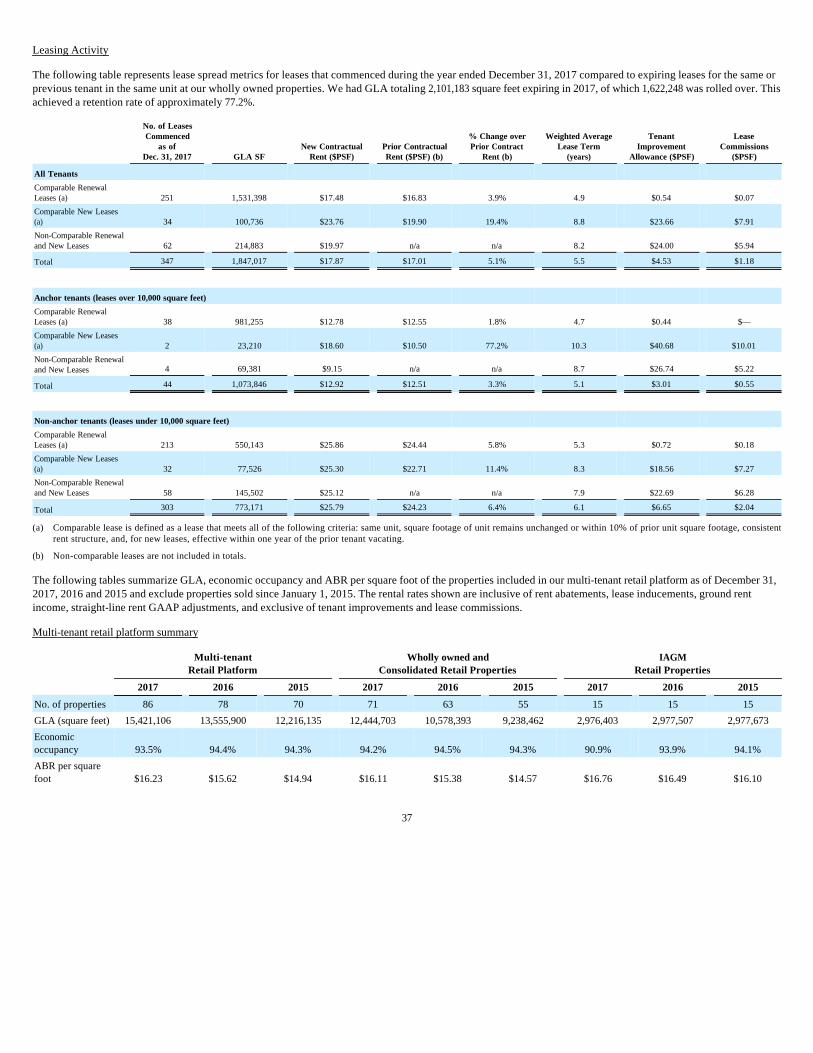
Leasing Activity
The following table represents lease spread metrics for leases that commenced during the year ended December 31, 2017 compared to expiring leases for the same or previous tenant in the same unit at our wholly owned properties. We had GLA totaling 2,101,183 square feet expiring in 2017, of which 1,622,248 was rolled over. This achieved a retention rate of approximately 77.2%.
The following tables summarize GLA, economic occupancy and ABR per square foot of the properties included in our multi-tenant retail platform as of December 31, 2017, 2016 and 2015 and exclude properties sold since January 1, 2015. The rental rates shown are inclusive of rent abatements, lease inducements, ground rent income, straight-line rent GAAP adjustments, and exclusive of tenant improvements and lease commissions.
Multi-tenant retail platform summary
37
No. of Leases Commenced
as of Dec. 31, 2017 GLA SF
New Contractual Rent ($PSF)
Prior Contractual Rent ($PSF) (b)
% Change over Prior Contract
Rent (b)
Weighted Average Lease Term
(years)
Tenant Improvement
Allowance ($PSF)
Lease Commissions
($PSF)
All Tenants Comparable Renewal Leases (a) 251 1,531,398 $17.48 $16.83 3.9% 4.9 $0.54 $0.07
Comparable New Leases (a) 34 100,736 $23.76 $19.90 19.4% 8.8 $23.66 $7.91
Non-Comparable Renewal and New Leases 62 214,883 $19.97 n/a n/a 8.2 $24.00 $5.94
Total 347 1,847,017 $17.87 $17.01 5.1% 5.5 $4.53 $1.18
Anchor tenants (leases over 10,000 square feet) Comparable Renewal Leases (a) 38 981,255 $12.78 $12.55 1.8% 4.7 $0.44 $—
Comparable New Leases (a) 2 23,210 $18.60 $10.50 77.2% 10.3 $40.68 $10.01
Non-Comparable Renewal and New Leases 4 69,381 $9.15 n/a n/a 8.7 $26.74 $5.22
Total 44 1,073,846 $12.92 $12.51 3.3% 5.1 $3.01 $0.55
Non-anchor tenants (leases under 10,000 square feet) Comparable Renewal Leases (a) 213 550,143 $25.86 $24.44 5.8% 5.3 $0.72 $0.18
Comparable New Leases (a) 32 77,526 $25.30 $22.71 11.4% 8.3 $18.56 $7.27
Non-Comparable Renewal and New Leases 58 145,502 $25.12 n/a n/a 7.9 $22.69 $6.28
Total 303 773,171 $25.79 $24.23 6.4% 6.1 $6.65 $2.04
(a) Comparable lease is defined as a lease that meets all of the following criteria: same unit, square footage of unit remains unchanged or within 10% of prior unit square footage, consistent rent structure, and, for new leases, effective within one year of the prior tenant vacating.
(b) Non-comparable leases are not included in totals.
Multi-tenant
Retail Platform Wholly owned and
Consolidated Retail Properties IAGM
Retail Properties
2017 2016 2015 2017 2016 2015 2017 2016 2015
No. of properties 86 78 70 71 63 55 15 15 15
GLA (square feet) 15,421,106 13,555,900 12,216,135 12,444,703 10,578,393 9,238,462 2,976,403 2,977,507 2,977,673
Economic occupancy 93.5% 94.4% 94.3% 94.2% 94.5% 94.3% 90.9% 93.9% 94.1%
ABR per square foot $16.23 $15.62 $14.94 $16.11 $15.38 $14.57 $16.76 $16.49 $16.10
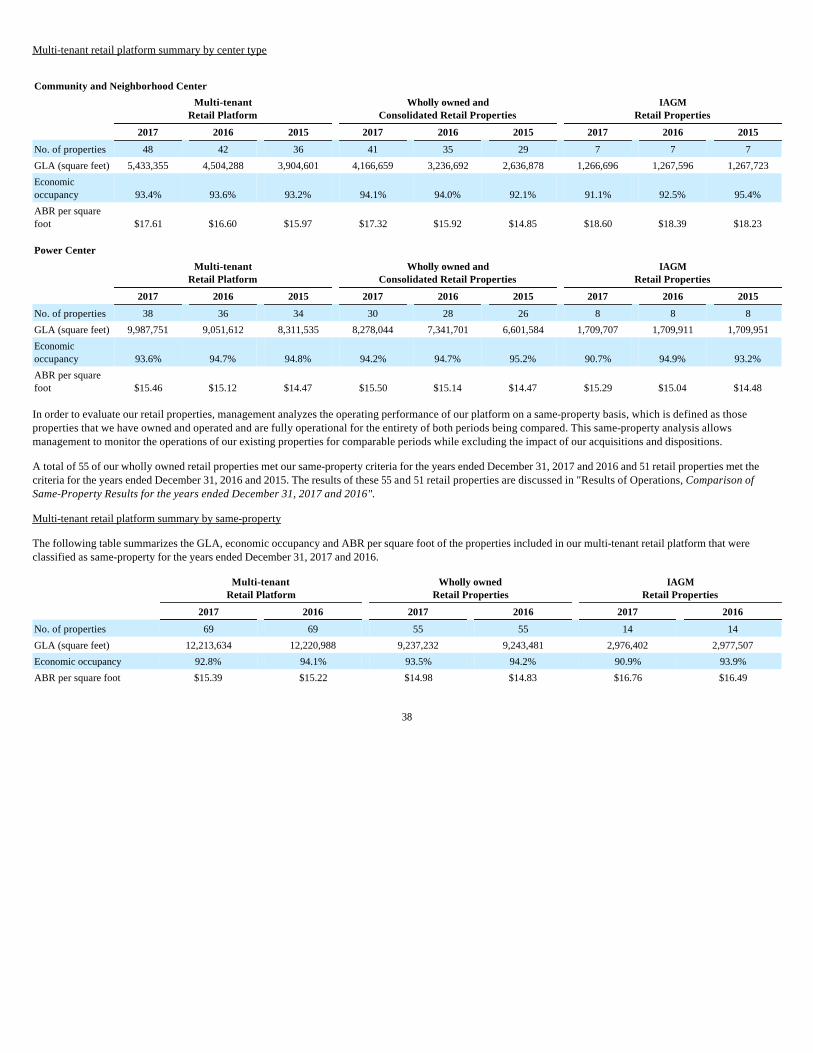
Multi-tenant retail platform summary by center type
In order to evaluate our retail properties, management analyzes the operating performance of our platform on a same-property basis, which is defined as those properties that we have owned and operated and are fully operational for the entirety of both periods being compared. This same-property analysis allows management to monitor the operations of our existing properties for comparable periods while excluding the impact of our acquisitions and dispositions.
A total of 55 of our wholly owned retail properties met our same-property criteria for the years ended December 31, 2017 and 2016 and 51 retail properties met the criteria for the years ended December 31, 2016 and 2015. The results of these 55 and 51 retail properties are discussed in "Results of Operations, Comparison of Same-Property Results for the years ended December 31, 2017 and 2016".
Multi-tenant retail platform summary by same-property
The following table summarizes the GLA, economic occupancy and ABR per square foot of the properties included in our multi-tenant retail platform that were classified as same-property for the years ended December 31, 2017 and 2016.
38
Community and Neighborhood Center
Multi-tenant
Retail Platform Wholly owned and
Consolidated Retail Properties IAGM
Retail Properties
2017 2016 2015 2017 2016 2015 2017 2016 2015
No. of properties 48 42 36 41 35 29 7 7 7
GLA (square feet) 5,433,355 4,504,288 3,904,601 4,166,659 3,236,692 2,636,878 1,266,696 1,267,596 1,267,723
Economic occupancy 93.4% 93.6% 93.2% 94.1% 94.0% 92.1% 91.1% 92.5% 95.4%
ABR per square foot $17.61 $16.60 $15.97 $17.32 $15.92 $14.85 $18.60 $18.39 $18.23
Power Center
Multi-tenant
Retail Platform Wholly owned and
Consolidated Retail Properties IAGM
Retail Properties
2017 2016 2015 2017 2016 2015 2017 2016 2015
No. of properties 38 36 34 30 28 26 8 8 8
GLA (square feet) 9,987,751 9,051,612 8,311,535 8,278,044 7,341,701 6,601,584 1,709,707 1,709,911 1,709,951
Economic occupancy 93.6% 94.7% 94.8% 94.2% 94.7% 95.2% 90.7% 94.9% 93.2%
ABR per square foot $15.46 $15.12 $14.47 $15.50 $15.14 $14.47 $15.29 $15.04 $14.48
Multi-tenant
Retail Platform Wholly owned
Retail Properties IAGM
Retail Properties
2017 2016 2017 2016 2017 2016
No. of properties 69 69 55 55 14 14
GLA (square feet) 12,213,634 12,220,988 9,237,232 9,243,481 2,976,402 2,977,507
Economic occupancy 92.8% 94.1% 93.5% 94.2% 90.9% 93.9%
ABR per square foot $15.39 $15.22 $14.98 $14.83 $16.76 $16.49
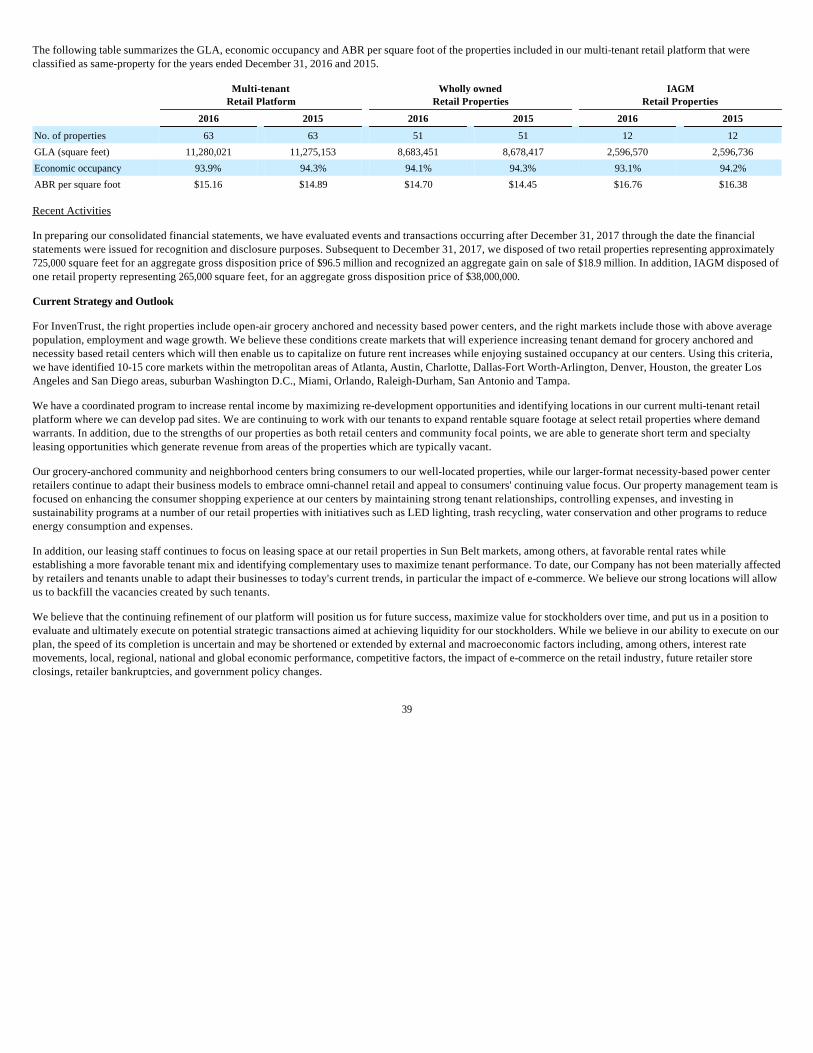
The following table summarizes the GLA, economic occupancy and ABR per square foot of the properties included in our multi-tenant retail platform that were classified as same-property for the years ended December 31, 2016 and 2015.
Recent Activities
In preparing our consolidated financial statements, we have evaluated events and transactions occurring after December 31, 2017 through the date the financial statements were issued for recognition and disclosure purposes. Subsequent to December 31, 2017, we disposed of two retail properties representing approximately 725,000 square feet for an aggregate gross disposition price of $96.5 million and recognized an aggregate gain on sale of $18.9 million. In addition, IAGM disposed of one retail property representing 265,000 square feet, for an aggregate gross disposition price of $38,000,000.
Current Strategy and Outlook
For InvenTrust, the right properties include open-air grocery anchored and necessity based power centers, and the right markets include those with above average population, employment and wage growth. We believe these conditions create markets that will experience increasing tenant demand for grocery anchored and necessity based retail centers which will then enable us to capitalize on future rent increases while enjoying sustained occupancy at our centers. Using this criteria, we have identified 10-15 core markets within the metropolitan areas of Atlanta, Austin, Charlotte, Dallas-Fort Worth-Arlington, Denver, Houston, the greater Los Angeles and San Diego areas, suburban Washington D.C., Miami, Orlando, Raleigh-Durham, San Antonio and Tampa.
We have a coordinated program to increase rental income by maximizing re-development opportunities and identifying locations in our current multi-tenant retail platform where we can develop pad sites. We are continuing to work with our tenants to expand rentable square footage at select retail properties where demand warrants. In addition, due to the strengths of our properties as both retail centers and community focal points, we are able to generate short term and specialty leasing opportunities which generate revenue from areas of the properties which are typically vacant.
Our grocery-anchored community and neighborhood centers bring consumers to our well-located properties, while our larger-format necessity-based power center retailers continue to adapt their business models to embrace omni-channel retail and appeal to consumers' continuing value focus. Our property management team is focused on enhancing the consumer shopping experience at our centers by maintaining strong tenant relationships, controlling expenses, and investing in sustainability programs at a number of our retail properties with initiatives such as LED lighting, trash recycling, water conservation and other programs to reduce energy consumption and expenses.
In addition, our leasing staff continues to focus on leasing space at our retail properties in Sun Belt markets, among others, at favorable rental rates while establishing a more favorable tenant mix and identifying complementary uses to maximize tenant performance. To date, our Company has not been materially affected by retailers and tenants unable to adapt their businesses to today's current trends, in particular the impact of e-commerce. We believe our strong locations will allow us to backfill the vacancies created by such tenants.
We believe that the continuing refinement of our platform will position us for future success, maximize value for stockholders over time, and put us in a position to evaluate and ultimately execute on potential strategic transactions aimed at achieving liquidity for our stockholders. While we believe in our ability to execute on our plan, the speed of its completion is uncertain and may be shortened or extended by external and macroeconomic factors including, among others, interest rate movements, local, regional, national and global economic performance, competitive factors, the impact of e-commerce on the retail industry, future retailer store closings, retailer bankruptcies, and government policy changes.
39
Multi-tenant
Retail Platform Wholly owned
Retail Properties IAGM
Retail Properties
2016 2015 2016 2015 2016 2015
No. of properties 63 63 51 51 12 12
GLA (square feet) 11,280,021 11,275,153 8,683,451 8,678,417 2,596,570 2,596,736
Economic occupancy 93.9% 94.3% 94.1% 94.3% 93.1% 94.2%
ABR per square foot $15.16 $14.89 $14.70 $14.45 $16.76 $16.38
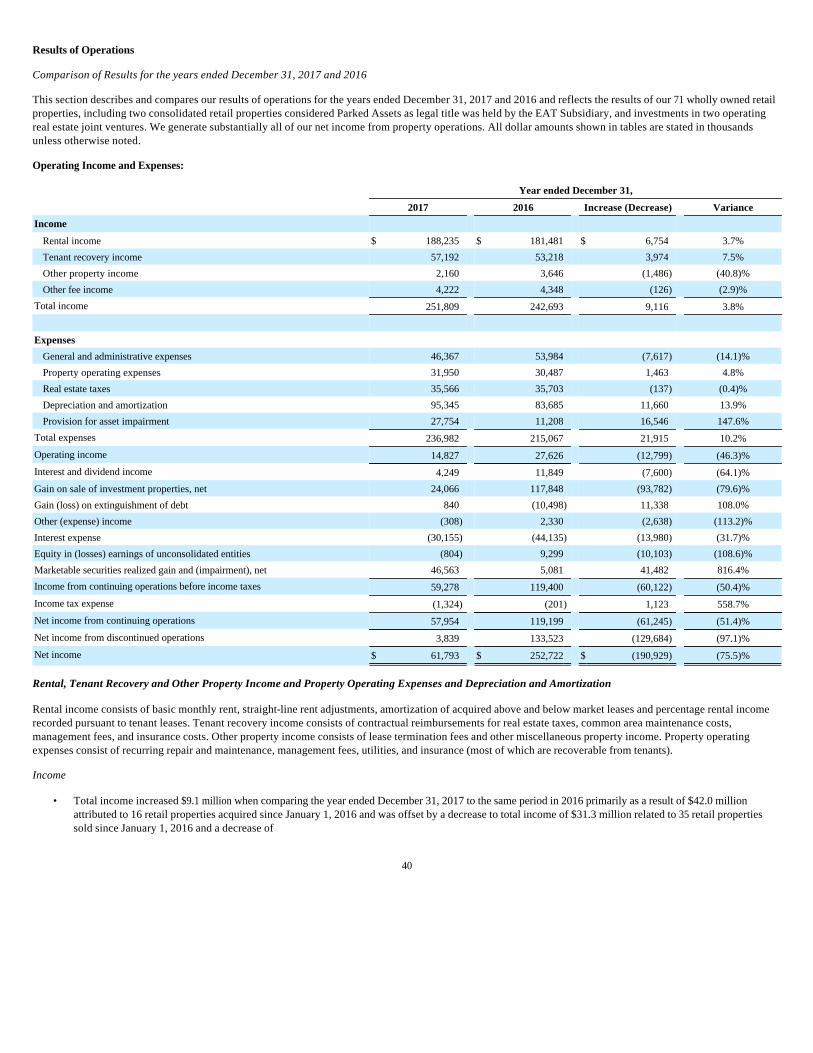
Results of Operations
Comparison of Results for the years ended December 31, 2017 and 2016
This section describes and compares our results of operations for the years ended December 31, 2017 and 2016 and reflects the results of our 71 wholly owned retail properties, including two consolidated retail properties considered Parked Assets as legal title was held by the EAT Subsidiary, and investments in two operating real estate joint ventures. We generate substantially all of our net income from property operations. All dollar amounts shown in tables are stated in thousands unless otherwise noted.
Operating Income and Expenses:
Rental, Tenant Recovery and Other Property Income and Property Operating Expenses and Depreciation and Amortization
Rental income consists of basic monthly rent, straight-line rent adjustments, amortization of acquired above and below market leases and percentage rental income recorded pursuant to tenant leases. Tenant recovery income consists of contractual reimbursements for real estate taxes, common area maintenance costs, management fees, and insurance costs. Other property income consists of lease termination fees and other miscellaneous property income. Property operating expenses consist of recurring repair and maintenance, management fees, utilities, and insurance (most of which are recoverable from tenants).
Income
40
Year ended December 31,
2017 2016 Increase (Decrease) Variance
Income
Rental income $ 188,235 $ 181,481 $ 6,754 3.7%
Tenant recovery income 57,192 53,218 3,974 7.5%
Other property income 2,160 3,646 (1,486 ) (40.8)%
Other fee income 4,222 4,348 (126 ) (2.9)%
Total income 251,809 242,693 9,116 3.8%
Expenses
General and administrative expenses 46,367 53,984 (7,617 ) (14.1)%
Property operating expenses 31,950 30,487 1,463 4.8%
Real estate taxes 35,566 35,703 (137 ) (0.4)%
Depreciation and amortization 95,345 83,685 11,660 13.9%
Provision for asset impairment 27,754 11,208 16,546 147.6%
Total expenses 236,982 215,067 21,915 10.2%
Operating income 14,827 27,626 (12,799 ) (46.3)%
Interest and dividend income 4,249 11,849 (7,600 ) (64.1)%
Gain on sale of investment properties, net 24,066 117,848 (93,782 ) (79.6)%
Gain (loss) on extinguishment of debt 840 (10,498 ) 11,338 108.0%
Other (expense) income (308 ) 2,330 (2,638 ) (113.2)%
Interest expense (30,155 ) (44,135 ) (13,980 ) (31.7)%
Equity in (losses) earnings of unconsolidated entities (804 ) 9,299 (10,103 ) (108.6)%
Marketable securities realized gain and (impairment), net 46,563 5,081 41,482 816.4%
Income from continuing operations before income taxes 59,278 119,400 (60,122 ) (50.4)%
Income tax expense (1,324 ) (201 ) 1,123 558.7%
Net income from continuing operations 57,954 119,199 (61,245 ) (51.4)%
Net income from discontinued operations 3,839 133,523 (129,684 ) (97.1)%
Net income $ 61,793 $ 252,722 $ (190,929 ) (75.5)%
• Total income increased $9.1 million when comparing the year ended December 31, 2017 to the same period in 2016 primarily as a result of $42.0 million attributed to 16 retail properties acquired since January 1, 2016 and was offset by a decrease to total income of $31.3 million related to 35 retail properties sold since January 1, 2016 and a decrease of
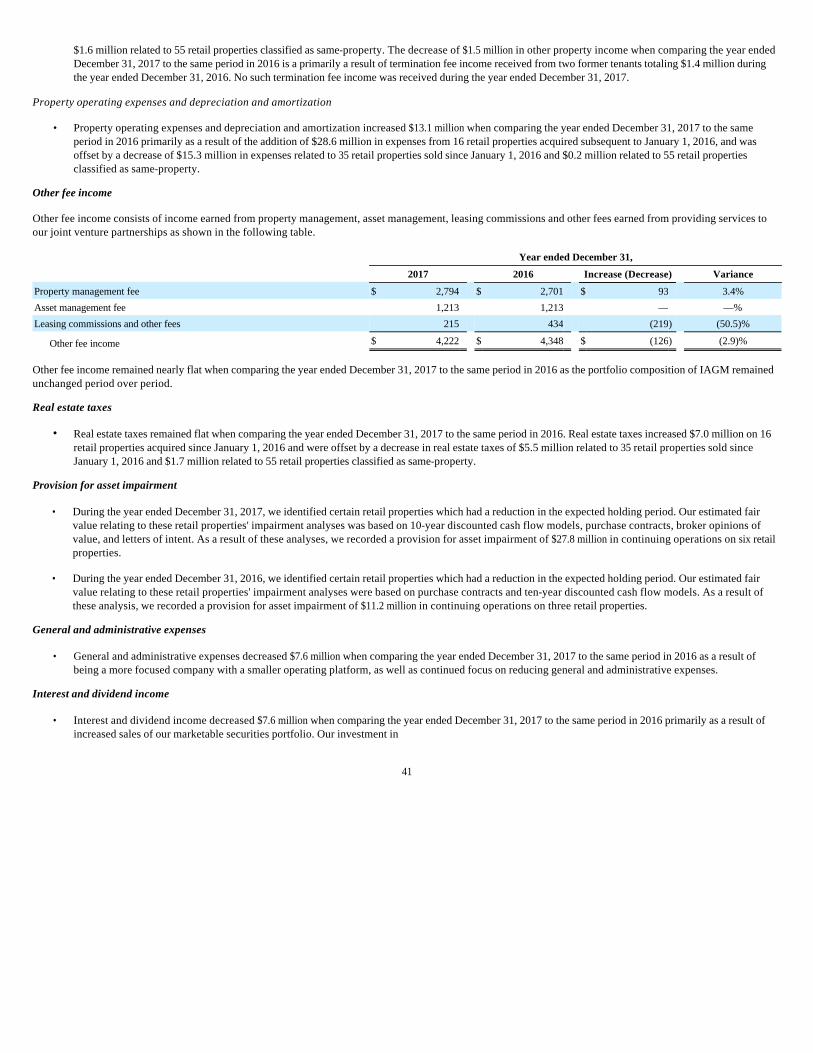
$1.6 million related to 55 retail properties classified as same-property. The decrease of $1.5 million in other property income when comparing the year ended December 31, 2017 to the same period in 2016 is a primarily a result of termination fee income received from two former tenants totaling $1.4 million during the year ended December 31, 2016. No such termination fee income was received during the year ended December 31, 2017.
Property operating expenses and depreciation and amortization
Other fee income
Other fee income consists of income earned from property management, asset management, leasing commissions and other fees earned from providing services to our joint venture partnerships as shown in the following table.
Other fee income remained nearly flat when comparing the year ended December 31, 2017 to the same period in 2016 as the portfolio composition of IAGM remained unchanged period over period.
Real estate taxes
Provision for asset impairment
General and administrative expenses
Interest and dividend income
41
• Property operating expenses and depreciation and amortization increased $13.1 million when comparing the year ended December 31, 2017 to the same period in 2016 primarily as a result of the addition of $28.6 million in expenses from 16 retail properties acquired subsequent to January 1, 2016, and was offset by a decrease of $15.3 million in expenses related to 35 retail properties sold since January 1, 2016 and $0.2 million related to 55 retail properties classified as same-property.
Year ended December 31,
2017 2016 Increase (Decrease) Variance
Property management fee $ 2,794 $ 2,701 $ 93 3.4%
Asset management fee 1,213 1,213 — —%
Leasing commissions and other fees 215 434 (219 ) (50.5)%
Other fee income $ 4,222 $ 4,348 $ (126 ) (2.9)%
• Real estate taxes remained flat when comparing the year ended December 31, 2017 to the same period in 2016. Real estate taxes increased $7.0 million on 16 retail properties acquired since January 1, 2016 and were offset by a decrease in real estate taxes of $5.5 million related to 35 retail properties sold since January 1, 2016 and $1.7 million related to 55 retail properties classified as same-property.
• During the year ended December 31, 2017, we identified certain retail properties which had a reduction in the expected holding period. Our estimated fair value relating to these retail properties' impairment analyses was based on 10-year discounted cash flow models, purchase contracts, broker opinions of value, and letters of intent. As a result of these analyses, we recorded a provision for asset impairment of $27.8 million in continuing operations on six retail properties.
• During the year ended December 31, 2016, we identified certain retail properties which had a reduction in the expected holding period. Our estimated fair value relating to these retail properties' impairment analyses were based on purchase contracts and ten-year discounted cash flow models. As a result of these analysis, we recorded a provision for asset impairment of $11.2 million in continuing operations on three retail properties.
• General and administrative expenses decreased $7.6 million when comparing the year ended December 31, 2017 to the same period in 2016 as a result of being a more focused company with a smaller operating platform, as well as continued focus on reducing general and administrative expenses.
• Interest and dividend income decreased $7.6 million when comparing the year ended December 31, 2017 to the same period in 2016 primarily as a result of increased sales of our marketable securities portfolio. Our investment in
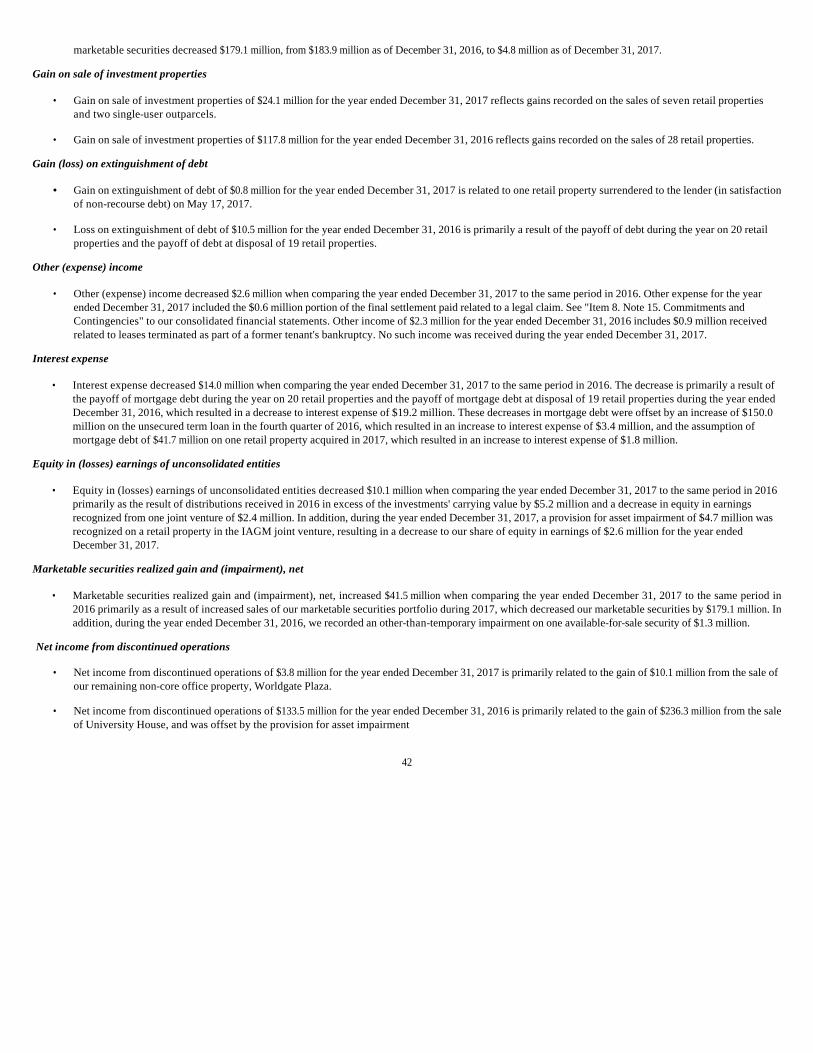
marketable securities decreased $179.1 million, from $183.9 million as of December 31, 2016, to $4.8 million as of December 31, 2017.
Gain on sale of investment properties
Gain (loss) on extinguishment of debt
Other (expense) income
Interest expense
Equity in (losses) earnings of unconsolidated entities
Marketable securities realized gain and (impairment), net
Net income from discontinued operations
42
• Gain on sale of investment properties of $24.1 million for the year ended December 31, 2017 reflects gains recorded on the sales of seven retail properties and two single-user outparcels.
• Gain on sale of investment properties of $117.8 million for the year ended December 31, 2016 reflects gains recorded on the sales of 28 retail properties.
• Gain on extinguishment of debt of $0.8 million for the year ended December 31, 2017 is related to one retail property surrendered to the lender (in satisfaction of non-recourse debt) on May 17, 2017.
• Loss on extinguishment of debt of $10.5 million for the year ended December 31, 2016 is primarily a result of the payoff of debt during the year on 20 retail properties and the payoff of debt at disposal of 19 retail properties.
• Other (expense) income decreased $2.6 million when comparing the year ended December 31, 2017 to the same period in 2016. Other expense for the year ended December 31, 2017 included the $0.6 million portion of the final settlement paid related to a legal claim. See "Item 8. Note 15. Commitments and Contingencies" to our consolidated financial statements. Other income of $2.3 million for the year ended December 31, 2016 includes $0.9 million received related to leases terminated as part of a former tenant's bankruptcy. No such income was received during the year ended December 31, 2017.
• Interest expense decreased $14.0 million when comparing the year ended December 31, 2017 to the same period in 2016. The decrease is primarily a result of the payoff of mortgage debt during the year on 20 retail properties and the payoff of mortgage debt at disposal of 19 retail properties during the year ended December 31, 2016, which resulted in a decrease to interest expense of $19.2 million. These decreases in mortgage debt were offset by an increase of $150.0 million on the unsecured term loan in the fourth quarter of 2016, which resulted in an increase to interest expense of $3.4 million, and the assumption of mortgage debt of $41.7 million on one retail property acquired in 2017, which resulted in an increase to interest expense of $1.8 million.
• Equity in (losses) earnings of unconsolidated entities decreased $10.1 million when comparing the year ended December 31, 2017 to the same period in 2016 primarily as the result of distributions received in 2016 in excess of the investments' carrying value by $5.2 million and a decrease in equity in earnings recognized from one joint venture of $2.4 million. In addition, during the year ended December 31, 2017, a provision for asset impairment of $4.7 million was recognized on a retail property in the IAGM joint venture, resulting in a decrease to our share of equity in earnings of $2.6 million for the year ended December 31, 2017.
• Marketable securities realized gain and (impairment), net, increased $41.5 million when comparing the year ended December 31, 2017 to the same period in 2016 primarily as a result of increased sales of our marketable securities portfolio during 2017, which decreased our marketable securities by $179.1 million. In addition, during the year ended December 31, 2016, we recorded an other-than-temporary impairment on one available-for-sale security of $1.3 million.
• Net income from discontinued operations of $3.8 million for the year ended December 31, 2017 is primarily related to the gain of $10.1 million from the sale of our remaining non-core office property, Worldgate Plaza.
• Net income from discontinued operations of $133.5 million for the year ended December 31, 2016 is primarily related to the gain of $236.3 million from the sale of University House, and was offset by the provision for asset impairment
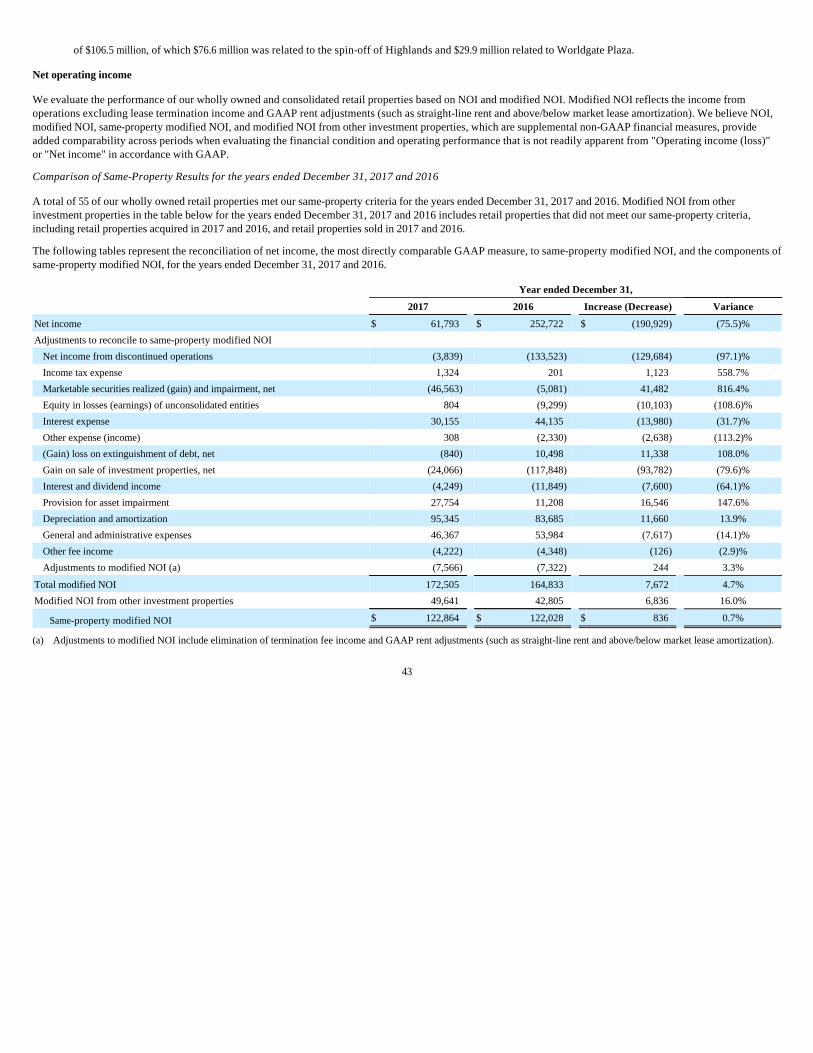
of $106.5 million, of which $76.6 million was related to the spin-off of Highlands and $29.9 million related to Worldgate Plaza.
Net operating income
We evaluate the performance of our wholly owned and consolidated retail properties based on NOI and modified NOI. Modified NOI reflects the income from operations excluding lease termination income and GAAP rent adjustments (such as straight-line rent and above/below market lease amortization). We believe NOI, modified NOI, same-property modified NOI, and modified NOI from other investment properties, which are supplemental non-GAAP financial measures, provide added comparability across periods when evaluating the financial condition and operating performance that is not readily apparent from "Operating income (loss)" or "Net income" in accordance with GAAP.
Comparison of Same-Property Results for the years ended December 31, 2017 and 2016
A total of 55 of our wholly owned retail properties met our same-property criteria for the years ended December 31, 2017 and 2016. Modified NOI from other investment properties in the table below for the years ended December 31, 2017 and 2016 includes retail properties that did not meet our same-property criteria, including retail properties acquired in 2017 and 2016, and retail properties sold in 2017 and 2016.
The following tables represent the reconciliation of net income, the most directly comparable GAAP measure, to same-property modified NOI, and the components of same-property modified NOI, for the years ended December 31, 2017 and 2016.
43
Year ended December 31,
2017 2016 Increase (Decrease) Variance
Net income $ 61,793 $ 252,722 $ (190,929 ) (75.5)%
Adjustments to reconcile to same-property modified NOI
Net income from discontinued operations (3,839 ) (133,523 ) (129,684 ) (97.1)%
Income tax expense 1,324 201 1,123 558.7%
Marketable securities realized (gain) and impairment, net (46,563 ) (5,081 ) 41,482 816.4%
Equity in losses (earnings) of unconsolidated entities 804 (9,299 ) (10,103 ) (108.6)%
Interest expense 30,155 44,135 (13,980 ) (31.7)%
Other expense (income) 308 (2,330 ) (2,638 ) (113.2)%
(Gain) loss on extinguishment of debt, net (840 ) 10,498 11,338 108.0%
Gain on sale of investment properties, net (24,066 ) (117,848 ) (93,782 ) (79.6)%
Interest and dividend income (4,249 ) (11,849 ) (7,600 ) (64.1)%
Provision for asset impairment 27,754 11,208 16,546 147.6%
Depreciation and amortization 95,345 83,685 11,660 13.9%
General and administrative expenses 46,367 53,984 (7,617 ) (14.1)%
Other fee income (4,222 ) (4,348 ) (126 ) (2.9)%
Adjustments to modified NOI (a) (7,566 ) (7,322 ) 244 3.3%
Total modified NOI 172,505 164,833 7,672 4.7%
Modified NOI from other investment properties 49,641 42,805 6,836 16.0%
Same-property modified NOI $ 122,864 $ 122,028 $ 836 0.7%
(a) Adjustments to modified NOI include elimination of termination fee income and GAAP rent adjustments (such as straight-line rent and above/below market lease amortization).
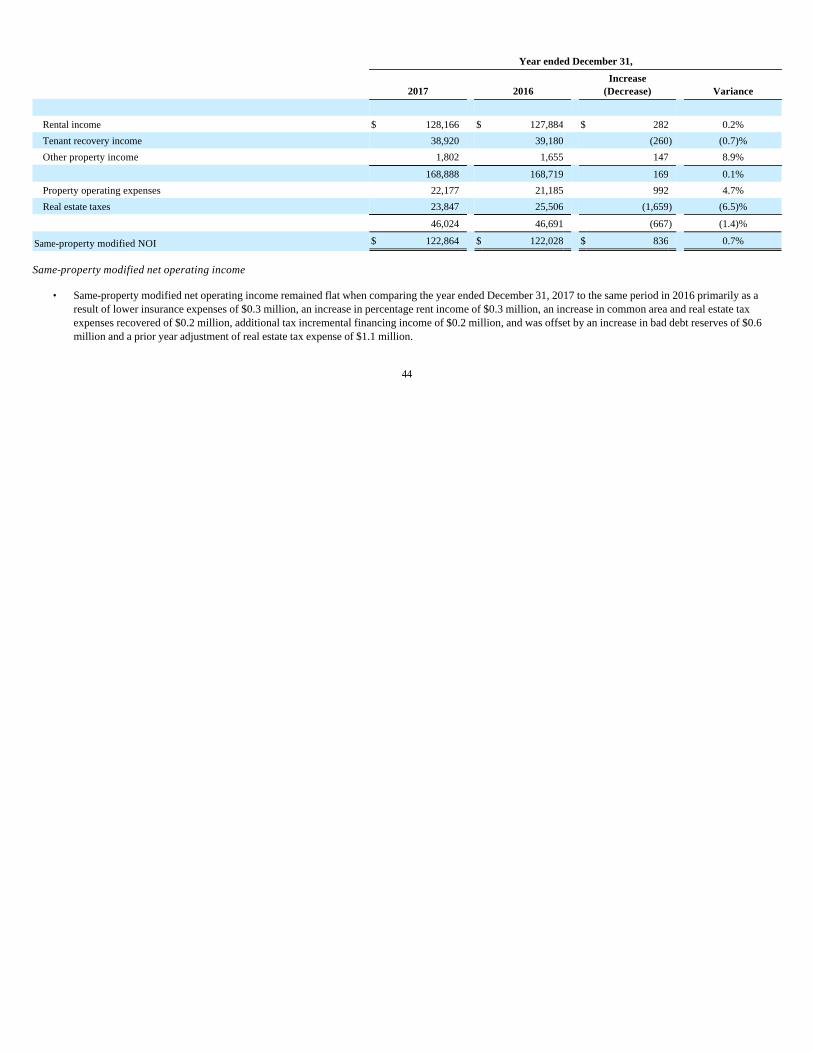
Same-property modified net operating income
44
Year ended December 31,
2017 2016 Increase
(Decrease) Variance
Rental income $ 128,166 $ 127,884 $ 282 0.2%
Tenant recovery income 38,920 39,180 (260 ) (0.7)%
Other property income 1,802 1,655 147 8.9%
168,888 168,719 169 0.1%
Property operating expenses 22,177 21,185 992 4.7%
Real estate taxes 23,847 25,506 (1,659 ) (6.5)%
46,024 46,691 (667 ) (1.4)%
Same-property modified NOI $ 122,864 $ 122,028 $ 836 0.7%
• Same-property modified net operating income remained flat when comparing the year ended December 31, 2017 to the same period in 2016 primarily as a result of lower insurance expenses of $0.3 million, an increase in percentage rent income of $0.3 million, an increase in common area and real estate tax expenses recovered of $0.2 million, additional tax incremental financing income of $0.2 million, and was offset by an increase in bad debt reserves of $0.6 million and a prior year adjustment of real estate tax expense of $1.1 million.
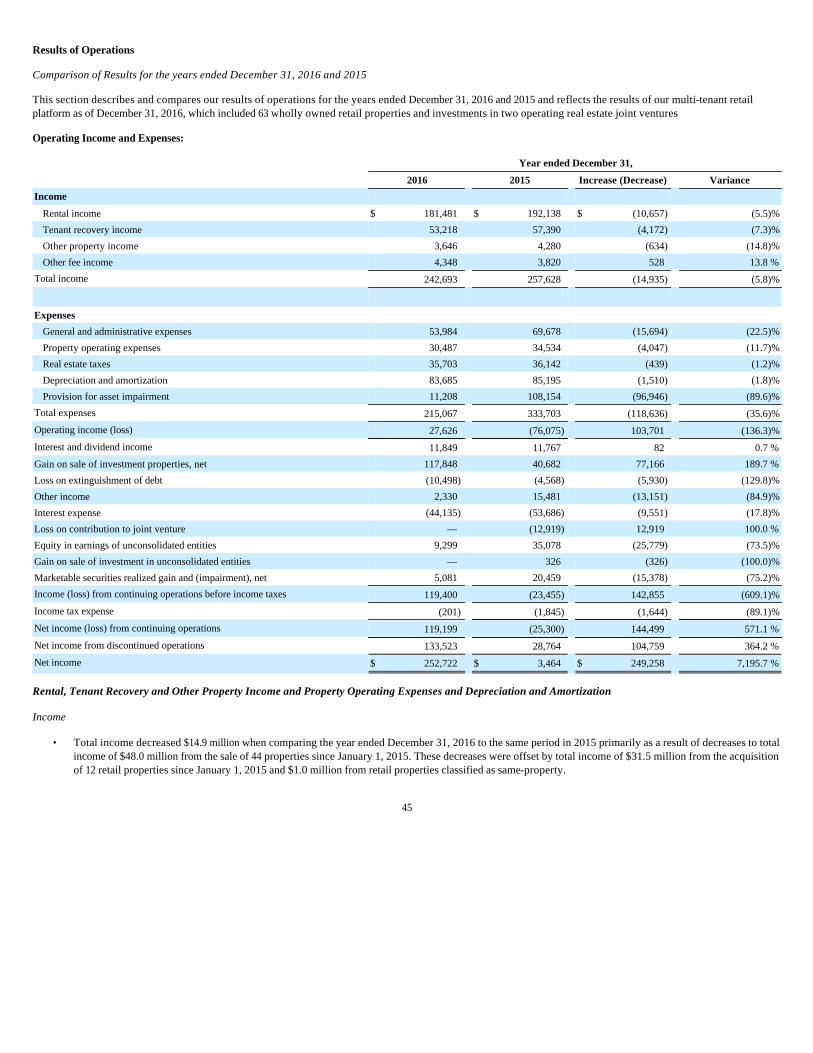
Results of Operations
Comparison of Results for the years ended December 31, 2016 and 2015
This section describes and compares our results of operations for the years ended December 31, 2016 and 2015 and reflects the results of our multi-tenant retail platform as of December 31, 2016, which included 63 wholly owned retail properties and investments in two operating real estate joint ventures
Operating Income and Expenses:
Rental, Tenant Recovery and Other Property Income and Property Operating Expenses and Depreciation and Amortization
Income
45
Year ended December 31,
2016 2015 Increase (Decrease) Variance
Income
Rental income $ 181,481 $ 192,138 $ (10,657 ) (5.5 )%
Tenant recovery income 53,218 57,390 (4,172 ) (7.3 )%
Other property income 3,646 4,280 (634 ) (14.8 )%
Other fee income 4,348 3,820 528 13.8 %
Total income 242,693 257,628 (14,935 ) (5.8 )%
Expenses
General and administrative expenses 53,984 69,678 (15,694 ) (22.5 )%
Property operating expenses 30,487 34,534 (4,047 ) (11.7 )%
Real estate taxes 35,703 36,142 (439 ) (1.2 )%
Depreciation and amortization 83,685 85,195 (1,510 ) (1.8 )%
Provision for asset impairment 11,208 108,154 (96,946 ) (89.6 )%
Total expenses 215,067 333,703 (118,636 ) (35.6 )%
Operating income (loss) 27,626 (76,075 ) 103,701 (136.3 )%
Interest and dividend income 11,849 11,767 82 0.7 %
Gain on sale of investment properties, net 117,848 40,682 77,166 189.7 %
Loss on extinguishment of debt (10,498 ) (4,568 ) (5,930 ) (129.8 )%
Other income 2,330 15,481 (13,151 ) (84.9 )%
Interest expense (44,135 ) (53,686 ) (9,551 ) (17.8 )%
Loss on contribution to joint venture — (12,919 ) 12,919 100.0 %
Equity in earnings of unconsolidated entities 9,299 35,078 (25,779 ) (73.5 )%
Gain on sale of investment in unconsolidated entities — 326 (326 ) (100.0 )%
Marketable securities realized gain and (impairment), net 5,081 20,459 (15,378 ) (75.2 )%
Income (loss) from continuing operations before income taxes 119,400 (23,455 ) 142,855 (609.1 )%
Income tax expense (201 ) (1,845 ) (1,644 ) (89.1 )%
Net income (loss) from continuing operations 119,199 (25,300 ) 144,499 571.1 %
Net income from discontinued operations 133,523 28,764 104,759 364.2 %
Net income $ 252,722 $ 3,464 $ 249,258 7,195.7 %
• Total income decreased $14.9 million when comparing the year ended December 31, 2016 to the same period in 2015 primarily as a result of decreases to total income of $48.0 million from the sale of 44 properties since January 1, 2015. These decreases were offset by total income of $31.5 million from the acquisition of 12 retail properties since January 1, 2015 and $1.0 million from retail properties classified as same-property.
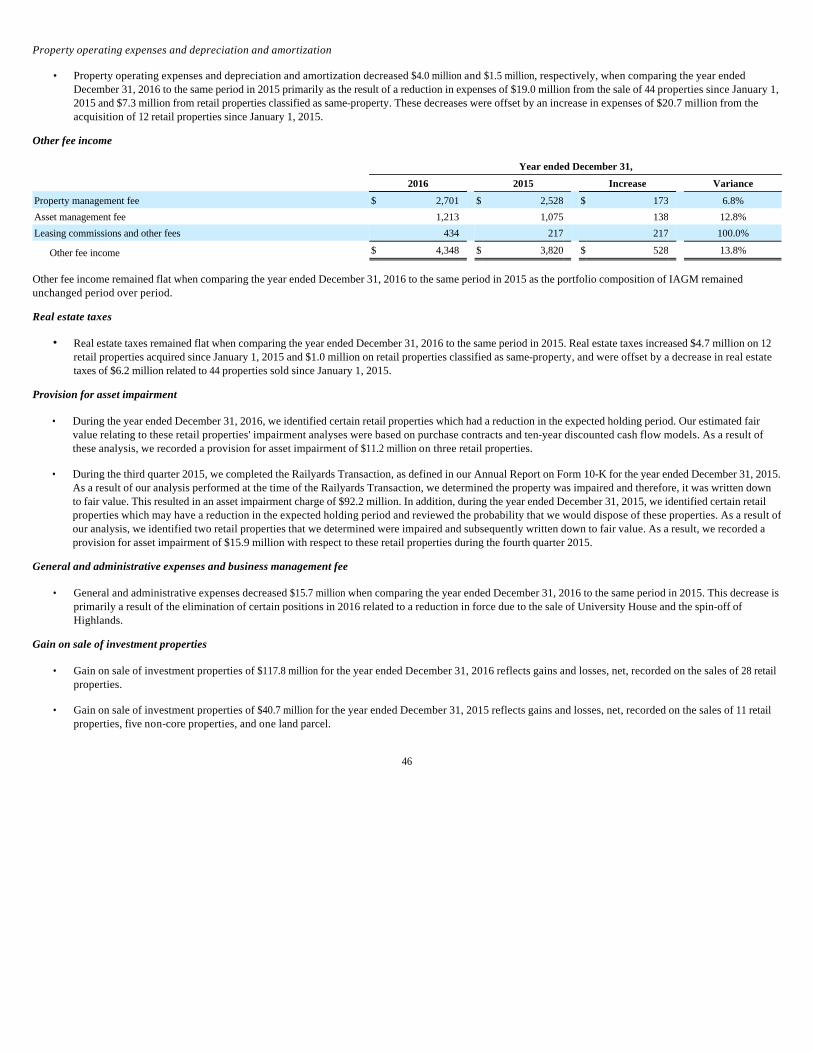
Property operating expenses and depreciation and amortization
Other fee income
Other fee income remained flat when comparing the year ended December 31, 2016 to the same period in 2015 as the portfolio composition of IAGM remained unchanged period over period.
Real estate taxes
Provision for asset impairment
General and administrative expenses and business management fee
Gain on sale of investment properties
46
• Property operating expenses and depreciation and amortization decreased $4.0 million and $1.5 million, respectively, when comparing the year ended December 31, 2016 to the same period in 2015 primarily as the result of a reduction in expenses of $19.0 million from the sale of 44 properties since January 1, 2015 and $7.3 million from retail properties classified as same-property. These decreases were offset by an increase in expenses of $20.7 million from the acquisition of 12 retail properties since January 1, 2015.
Year ended December 31,
2016 2015 Increase Variance
Property management fee $ 2,701 $ 2,528 $ 173 6.8%
Asset management fee 1,213 1,075 138 12.8%
Leasing commissions and other fees 434 217 217 100.0%
Other fee income $ 4,348 $ 3,820 $ 528 13.8%
• Real estate taxes remained flat when comparing the year ended December 31, 2016 to the same period in 2015. Real estate taxes increased $4.7 million on 12 retail properties acquired since January 1, 2015 and $1.0 million on retail properties classified as same-property, and were offset by a decrease in real estate taxes of $6.2 million related to 44 properties sold since January 1, 2015.
• During the year ended December 31, 2016, we identified certain retail properties which had a reduction in the expected holding period. Our estimated fair value relating to these retail properties' impairment analyses were based on purchase contracts and ten-year discounted cash flow models. As a result of these analysis, we recorded a provision for asset impairment of $11.2 million on three retail properties.
• During the third quarter 2015, we completed the Railyards Transaction, as defined in our Annual Report on Form 10-K for the year ended December 31, 2015. As a result of our analysis performed at the time of the Railyards Transaction, we determined the property was impaired and therefore, it was written down to fair value. This resulted in an asset impairment charge of $92.2 million. In addition, during the year ended December 31, 2015, we identified certain retail properties which may have a reduction in the expected holding period and reviewed the probability that we would dispose of these properties. As a result of our analysis, we identified two retail properties that we determined were impaired and subsequently written down to fair value. As a result, we recorded a provision for asset impairment of $15.9 million with respect to these retail properties during the fourth quarter 2015.
• General and administrative expenses decreased $15.7 million when comparing the year ended December 31, 2016 to the same period in 2015. This decrease is primarily a result of the elimination of certain positions in 2016 related to a reduction in force due to the sale of University House and the spin-off of Highlands.
• Gain on sale of investment properties of $117.8 million for the year ended December 31, 2016 reflects gains and losses, net, recorded on the sales of 28 retail properties.
• Gain on sale of investment properties of $40.7 million for the year ended December 31, 2015 reflects gains and losses, net, recorded on the sales of 11 retail properties, five non-core properties, and one land parcel.
Loss on extinguishment of debt
Other income
Interest expense
Loss on contribution to joint venture
Equity in earnings of unconsolidated entities
Our equity in earnings of unconsolidated entities includes our share of the unconsolidated entities' operating income or loss.
Gain on sale of investment in unconsolidated entities, net
Marketable securities realized gain and (impairment), net
47
• Loss on extinguishment of debt of $10.5 million for the year ended December 31, 2016 is primarily a result of the payoff of debt on 20 retail properties and the payoff of debt at disposal of 19 retail properties.
• Loss on extinguishment of debt of $4.6 million for the year ended December 31, 2015 is primarily a result of a loss of $5.8 million on debt extinguishment on the sale of eleven retail properties during the year ended December 31, 2015. These losses were offset by a gain of $2.7 million on debt extinguishment related to one non-core property sold during the year ended December 31, 2015.
• Other income decreased $13.2 million when comparing the year ended December 31, 2016 to the same period in 2015. Other income of $2.3 million for the year ended December 31, 2016 included $0.9 million of income related to leases terminated as part of a former tenant's bankruptcy. Other income of $15.5 million is primarily related to $7.3 million received as settlement from the derivative lawsuit (as previously disclosed in our Annual Report on Form 10-K for the fiscal year ended December 31, 2015, $6.2 million in income recognized after proceeds received on two note receivables were higher than the previously impaired carrying balances, and property management fee income received from the IAGM joint venture that was previously paid to Inland American Holdco Management LLC.
• Interest expense decreased $9.6 million when comparing the year ended December 31, 2016 to the same period in 2015. This decrease is primarily a result of the payoff of mortgage debt on 20 properties and the payoff of mortgage debt at disposal of 19 properties during the year ended December 31, 2016, which resulted in a decrease to interest expense of $21.3 million. The decrease in interest expense resulting from a decrease in mortgage debt was offset by of $1.1 million resulting from mortgage debt on retail properties acquired since January 1, 2015, a decrease in capitalized interest of $4.4 million as a result of the Railyards Transaction on September 30, 2015, and an increase in interest expense of $4.5 million related to our corporate debt.
• On September 30, 2015, we completed the Railyards Transaction. We recognized a loss on contribution of $12.9 million for the year ended December 31, 2015 on the Railyards Transaction due to the difference between the carrying value of the land and the fair value of the retained equity interest in the joint venture.
• Equity in earnings of unconsolidated entities decreased $25.8 million when comparing the year ended December 31, 2016 to the same period in 2015 primarily as the result of recognizing $11.9 million from the sale of assets within two joint ventures and receiving nonrecurring distributions that were in excess of the investments' carrying value by $17.8 million.
• For the year ended December 31, 2015, we recognized a gain of $0.3 million on the dissolution of one joint venture subsequent to the receipt of the final cash distribution from the joint venture's wind down activities.
• For the year ended December 31, 2016, we realized a $6.4 million gain on the sale of marketable securities. This realized gain was offset by an impairment of $1.3 million on one marketable security during the year ended December 31, 2016, resulting in a net realized gain on sale of marketable securities of $5.1 million.
• For the year ended December 31, 2015, we realized a $5.1 million net gain on the sale of marketable securities as a result of sales.
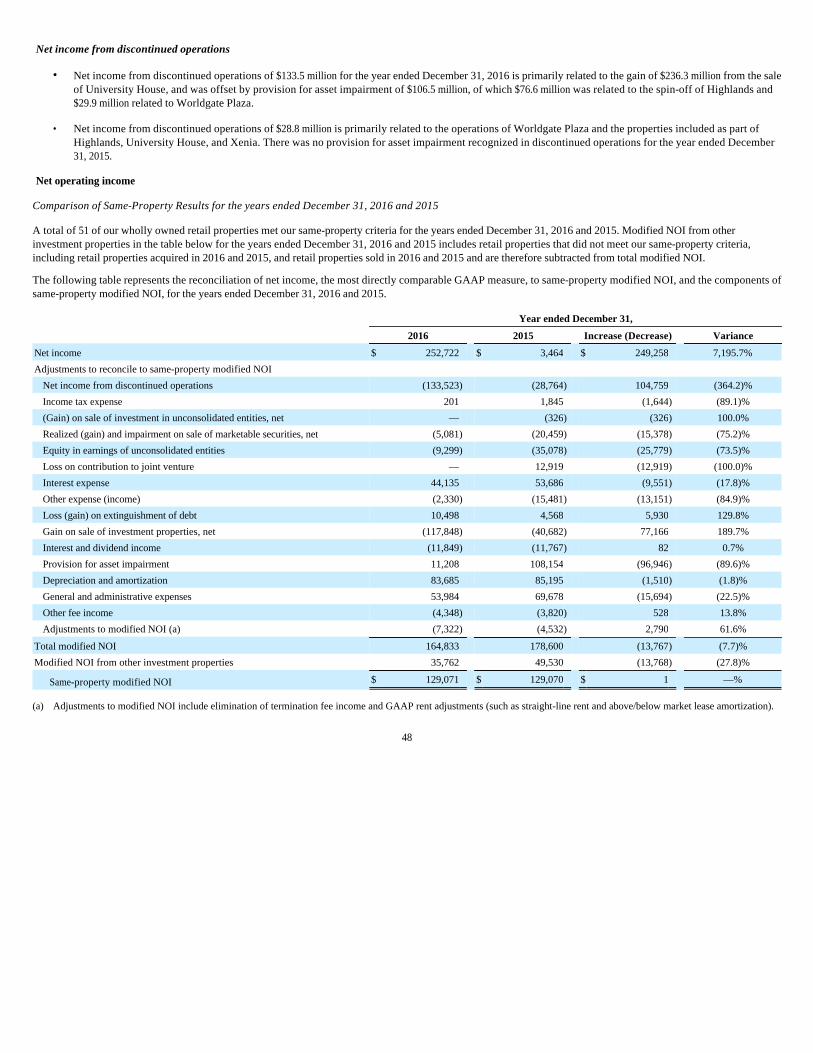
Net income from discontinued operations
Net operating income
Comparison of Same-Property Results for the years ended December 31, 2016 and 2015
A total of 51 of our wholly owned retail properties met our same-property criteria for the years ended December 31, 2016 and 2015. Modified NOI from other investment properties in the table below for the years ended December 31, 2016 and 2015 includes retail properties that did not meet our same-property criteria, including retail properties acquired in 2016 and 2015, and retail properties sold in 2016 and 2015 and are therefore subtracted from total modified NOI.
The following table represents the reconciliation of net income, the most directly comparable GAAP measure, to same-property modified NOI, and the components of same-property modified NOI, for the years ended December 31, 2016 and 2015.
48
• Net income from discontinued operations of $133.5 million for the year ended December 31, 2016 is primarily related to the gain of $236.3 million from the sale of University House, and was offset by provision for asset impairment of $106.5 million, of which $76.6 million was related to the spin-off of Highlands and $29.9 million related to Worldgate Plaza.
• Net income from discontinued operations of $28.8 million is primarily related to the operations of Worldgate Plaza and the properties included as part of Highlands, University House, and Xenia. There was no provision for asset impairment recognized in discontinued operations for the year ended December 31, 2015.
Year ended December 31,
2016 2015 Increase (Decrease) Variance
Net income $ 252,722 $ 3,464 $ 249,258 7,195.7%
Adjustments to reconcile to same-property modified NOI
Net income from discontinued operations (133,523 ) (28,764 ) 104,759 (364.2)%
Income tax expense 201 1,845 (1,644 ) (89.1)%
(Gain) on sale of investment in unconsolidated entities, net — (326 ) (326 ) 100.0%
Realized (gain) and impairment on sale of marketable securities, net (5,081 ) (20,459 ) (15,378 ) (75.2)%
Equity in earnings of unconsolidated entities (9,299 ) (35,078 ) (25,779 ) (73.5)%
Loss on contribution to joint venture — 12,919 (12,919 ) (100.0)%
Interest expense 44,135 53,686 (9,551 ) (17.8)%
Other expense (income) (2,330 ) (15,481 ) (13,151 ) (84.9)%
Loss (gain) on extinguishment of debt 10,498 4,568 5,930 129.8%
Gain on sale of investment properties, net (117,848 ) (40,682 ) 77,166 189.7%
Interest and dividend income (11,849 ) (11,767 ) 82 0.7%
Provision for asset impairment 11,208 108,154 (96,946 ) (89.6)%
Depreciation and amortization 83,685 85,195 (1,510 ) (1.8)%
General and administrative expenses 53,984 69,678 (15,694 ) (22.5)%
Other fee income (4,348 ) (3,820 ) 528 13.8%
Adjustments to modified NOI (a) (7,322 ) (4,532 ) 2,790 61.6%
Total modified NOI 164,833 178,600 (13,767 ) (7.7)%
Modified NOI from other investment properties 35,762 49,530 (13,768 ) (27.8)%
Same-property modified NOI $ 129,071 $ 129,070 $ 1 —%
(a) Adjustments to modified NOI include elimination of termination fee income and GAAP rent adjustments (such as straight-line rent and above/below market lease amortization).
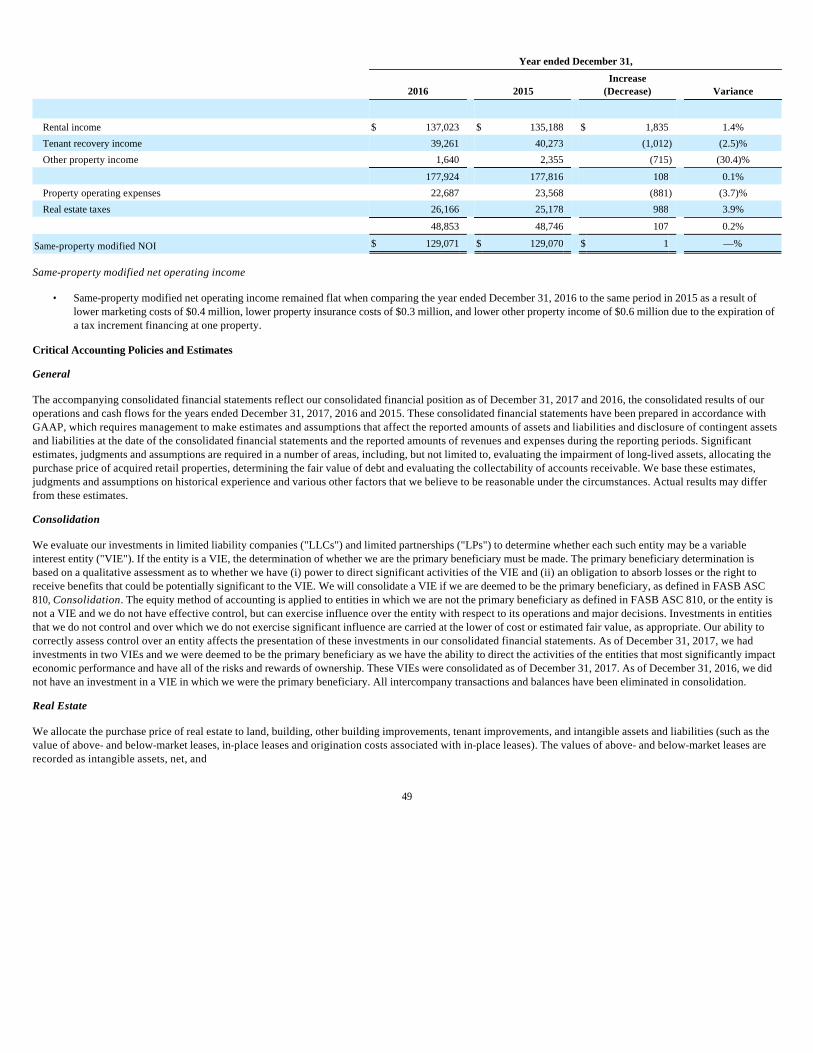
Same-property modified net operating income
Critical Accounting Policies and Estimates
General
The accompanying consolidated financial statements reflect our consolidated financial position as of December 31, 2017 and 2016, the consolidated results of our operations and cash flows for the years ended December 31, 2017, 2016 and 2015. These consolidated financial statements have been prepared in accordance with GAAP, which requires management to make estimates and assumptions that affect the reported amounts of assets and liabilities and disclosure of contingent assets and liabilities at the date of the consolidated financial statements and the reported amounts of revenues and expenses during the reporting periods. Significant estimates, judgments and assumptions are required in a number of areas, including, but not limited to, evaluating the impairment of long-lived assets, allocating the purchase price of acquired retail properties, determining the fair value of debt and evaluating the collectability of accounts receivable. We base these estimates, judgments and assumptions on historical experience and various other factors that we believe to be reasonable under the circumstances. Actual results may differ from these estimates.
Consolidation
We evaluate our investments in limited liability companies ("LLCs") and limited partnerships ("LPs") to determine whether each such entity may be a variable interest entity ("VIE"). If the entity is a VIE, the determination of whether we are the primary beneficiary must be made. The primary beneficiary determination is based on a qualitative assessment as to whether we have (i) power to direct significant activities of the VIE and (ii) an obligation to absorb losses or the right to receive benefits that could be potentially significant to the VIE. We will consolidate a VIE if we are deemed to be the primary beneficiary, as defined in FASB ASC 810, Consolidation. The equity method of accounting is applied to entities in which we are not the primary beneficiary as defined in FASB ASC 810, or the entity is not a VIE and we do not have effective control, but can exercise influence over the entity with respect to its operations and major decisions. Investments in entities that we do not control and over which we do not exercise significant influence are carried at the lower of cost or estimated fair value, as appropriate. Our ability to correctly assess control over an entity affects the presentation of these investments in our consolidated financial statements. As of December 31, 2017, we had investments in two VIEs and we were deemed to be the primary beneficiary as we have the ability to direct the activities of the entities that most significantly impact economic performance and have all of the risks and rewards of ownership. These VIEs were consolidated as of December 31, 2017. As of December 31, 2016, we did not have an investment in a VIE in which we were the primary beneficiary. All intercompany transactions and balances have been eliminated in consolidation.
Real Estate
We allocate the purchase price of real estate to land, building, other building improvements, tenant improvements, and intangible assets and liabilities (such as the value of above- and below-market leases, in-place leases and origination costs associated with in-place leases). The values of above- and below-market leases are recorded as intangible assets, net, and
49
Year ended December 31,
2016 2015 Increase
(Decrease) Variance
Rental income $ 137,023 $ 135,188 $ 1,835 1.4%
Tenant recovery income 39,261 40,273 (1,012 ) (2.5)%
Other property income 1,640 2,355 (715 ) (30.4)%
177,924 177,816 108 0.1%
Property operating expenses 22,687 23,568 (881 ) (3.7)%
Real estate taxes 26,166 25,178 988 3.9%
48,853 48,746 107 0.2%
Same-property modified NOI $ 129,071 $ 129,070 $ 1 —%
• Same-property modified net operating income remained flat when comparing the year ended December 31, 2016 to the same period in 2015 as a result of lower marketing costs of $0.4 million, lower property insurance costs of $0.3 million, and lower other property income of $0.6 million due to the expiration of a tax increment financing at one property.
intangible liabilities, net, respectively, in the consolidated balance sheets, and are amortized as either a decrease (in the case of above-market leases) or an increase (in the case of below-market leases) to rental income over the remaining term of the associated tenant lease. The values associated with in-place leases are recorded in intangible assets, net in the consolidated balance sheets and are amortized to depreciation and amortization expense in the consolidated statements of operations and comprehensive income (loss) over the remaining lease term.
The difference between the contractual rental rates and our estimate of market rental rates is measured over a period equal to the remaining non-cancelable term of the leases, including significantly below-market renewal options. For the amortization period, the remaining term of leases with renewal options at terms below market reflect the assumed exercise of such below-market renewal options, if reasonably assured.
We perform, with the assistance of a third-party valuation specialist, the following procedures for properties we acquire:
We recognize gains and losses from sales of investment properties and land at the time of sale using the full accrual method when the following criteria are met: sales are consummated; usual risks and rewards of ownership have been transferred to buyers; we have no substantial continuing involvement with the property; and any sales related receivables are not subject to future subordination. If these criteria are not all met, we defer the gains and recognize them when the criteria are met. If the full accrual method is not followed, the possible alternative is to use either the installment, deposit or cost recovery methods, as appropriate in the circumstances.
Prior to our adoption of FASB ASU No. 2017-01, Clarifying the Definition of a Business (see Recently Adopted Accounting Pronouncements for details), all costs related to finding, analyzing and negotiating a transaction were expensed as incurred as a general and administrative expense, whether or not the acquisition was completed. Beginning with assets acquired during the fourth quarter of 2016, we began capitalizing acquisition costs of completed transactions in accordance with ASU No. 2017-01 to the extent our acquisitions qualify as asset acquisitions under this guidance.
Investment Properties Held for Sale
In determining whether to classify an investment property as held for sale, we consider whether: (i) management has committed to a plan to sell the investment property; (ii) the investment property is available for immediate sale, in its present condition; (iii) we have initiated a program to locate a buyer; (iv) we believe that the sale of the investment property is probable; (v) we have received a significant non-refundable deposit for the purchase of the property; (vi) we are actively marketing the investment property for sale at a price that is reasonable in relation to its estimated fair value; and (vii) actions required for us to complete the plan indicate that it is unlikely that any significant changes will be made to the plan.
If all of the above criteria are met, we classify the investment property as held for sale. When these criteria are met, we suspend depreciation on the investment properties held for sale, including depreciation for tenant improvements and additions, as well as on the amortization of acquired in-place leases. The properties held for sale and associated liabilities are classified separately on the consolidated balance sheets. Such properties are recorded at the lesser of the carrying value or estimated fair value. Additionally, if the sale represents a strategic shift that has (or will have) a major effect on our results and operations, the assets, liabilities and operations for the periods presented are classified on the consolidated balance sheets and consolidated statements of operations and comprehensive income (loss) as discontinued operations for all periods presented.
50
• Estimate the value of the property "as if vacant" as of the acquisition date;
• Allocate the value of the property among land, building, and other building improvements and determine the associated useful life for each;
• Calculate the value and associated life of above- and below-market leases on a tenant-by-tenant basis. The difference between the contractual rental rates and our estimate of market rental rates is measured over a period equal to the remaining term of the leases (using a discount rate which reflects the risks associated with the leases acquired, including geographical location, size of leased area, tenant profile and credit risk);
• Estimate the fair value of the tenant improvements, legal costs and leasing commissions incurred to obtain the leases and calculate the associated useful life for each;
• Estimate the fair value of assumed debt, if any; and
• Estimate the intangible value of the in-place leases based on lease execution costs of similar leases as well as lost rent payments during an assumed lease-up period and their associated useful lives on a tenant-by-tenant basis.
Impairment of Long Lived Assets
We assess the carrying values of the respective long-lived assets, whenever events or changes in circumstances indicate that the carrying amounts of these assets may not be fully recoverable, such as a reduction in the expected holding period of the asset. If it is determined that the carrying value is not recoverable because the expected undiscounted cash flows do not exceed carrying value, we record an impairment loss to the extent that the carrying value exceeds estimated fair value. The valuation and possible subsequent impairment of investment properties is a significant estimate that can and does change based on our continuous process of analyzing each property and reviewing assumptions about uncertain inherent factors, as well as the economic condition of the property at a particular point in time.
The use of projected future cash flows and related holding period is based on assumptions that are consistent with the estimates of future expectations and the strategic plan we use to manage our underlying business. However assumptions and estimates about future cash flows and capitalization rates are complex and subjective. Changes in economic and operating conditions and our ultimate investment intent that occur subsequent to the impairment analyses could impact these assumptions and result in future or additional impairment charges of the real estate properties.
On a periodic basis, management assesses whether there are any indicators that the carrying value of our investments in unconsolidated entities may be other than temporarily impaired. To the extent impairment has occurred, the loss is measured as the excess of the carrying value of the investment over the estimated fair value of the investment. The estimated fair value of the underlying investment includes a review of expected cash flows generated from operations of the property.
Real Estate Capitalization and Depreciation
Real estate is reflected at cost less accumulated depreciation within investment property on the consolidated balance sheet. Ordinary repairs and maintenance are expensed as incurred.
Depreciation expense is computed using the straight line method. Building within investment property on the consolidated balance sheet is depreciated based upon an estimated useful life of 30 years, and 5-15 years for furniture, fixtures and equipment and site improvements within other improvements in building and other improvements on the consolidated balance sheet. The estimated useful lives of our assets is a subjective assessment.
Tenant improvements are amortized on a straight line basis over the lesser of the life of the tenant improvement or the lease term as a component of depreciation and amortization expense on the consolidated statement of operations.
Direct and indirect costs that are clearly related to the construction and improvements of investment properties are capitalized. Costs incurred for property taxes and insurance are capitalized during periods in which activities necessary to get the property ready for its intended use are in progress. Interest costs are also capitalized during such periods. Additionally, we treat investments accounted for by the equity method as assets qualifying for interest capitalization provided (1) the investee has activities in progress necessary to commence its planned principal operations and (2) the investee’s activities include qualifying expenditures.
Revenue Recognition
We commence revenue recognition on leases based on a number of factors. In most cases, revenue recognition under a lease begins when the lessee takes possession of or controls the physical use of the leased asset. Generally, this occurs on the lease commencement date. The determination of who is the owner, for accounting purposes, of the tenant improvements determines the nature of the leased asset and when revenue recognition under a lease begins. If we are the owner, for accounting purposes, of the tenant improvements, then the leased asset is the finished space and revenue recognition begins when the lessee takes possession of the finished space, typically when the improvements are substantially complete. If we conclude we are not the owner, for accounting purposes, of the tenant improvements (the lessee is the owner), then the leased asset is the unimproved space and any tenant improvement allowances funded under the lease are treated as lease incentives which reduces revenue recognized over the term of the lease. In these circumstances, we begin revenue recognition when the lessee takes possession of the unimproved space for the lessee to construct their own improvements. We consider a number of different factors to evaluate whether we or the lessee is the owner of the tenant improvements for accounting purposes. These factors include:
51
• whether the lease stipulates how and on what a tenant improvement allowance may be spent;
• whether the tenant or landlord retains legal title to the improvements;
• the uniqueness of the improvements;
• the expected economic life of the tenant improvements relative to the length of the lease; and
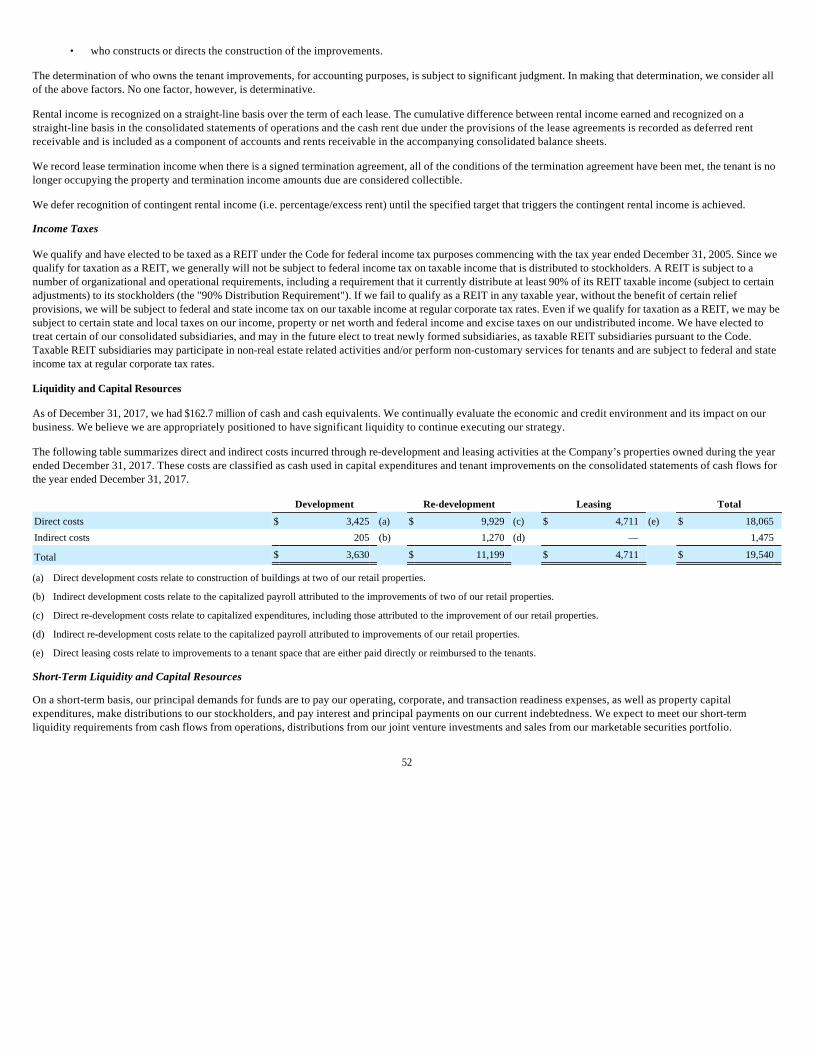
The determination of who owns the tenant improvements, for accounting purposes, is subject to significant judgment. In making that determination, we consider all of the above factors. No one factor, however, is determinative.
Rental income is recognized on a straight-line basis over the term of each lease. The cumulative difference between rental income earned and recognized on a straight-line basis in the consolidated statements of operations and the cash rent due under the provisions of the lease agreements is recorded as deferred rent receivable and is included as a component of accounts and rents receivable in the accompanying consolidated balance sheets.
We record lease termination income when there is a signed termination agreement, all of the conditions of the termination agreement have been met, the tenant is no longer occupying the property and termination income amounts due are considered collectible.
We defer recognition of contingent rental income (i.e. percentage/excess rent) until the specified target that triggers the contingent rental income is achieved.
Income Taxes
We qualify and have elected to be taxed as a REIT under the Code for federal income tax purposes commencing with the tax year ended December 31, 2005. Since we qualify for taxation as a REIT, we generally will not be subject to federal income tax on taxable income that is distributed to stockholders. A REIT is subject to a number of organizational and operational requirements, including a requirement that it currently distribute at least 90% of its REIT taxable income (subject to certain adjustments) to its stockholders (the "90% Distribution Requirement"). If we fail to qualify as a REIT in any taxable year, without the benefit of certain relief provisions, we will be subject to federal and state income tax on our taxable income at regular corporate tax rates. Even if we qualify for taxation as a REIT, we may be subject to certain state and local taxes on our income, property or net worth and federal income and excise taxes on our undistributed income. We have elected to treat certain of our consolidated subsidiaries, and may in the future elect to treat newly formed subsidiaries, as taxable REIT subsidiaries pursuant to the Code. Taxable REIT subsidiaries may participate in non-real estate related activities and/or perform non-customary services for tenants and are subject to federal and state income tax at regular corporate tax rates.
Liquidity and Capital Resources
As of December 31, 2017, we had $162.7 million of cash and cash equivalents. We continually evaluate the economic and credit environment and its impact on our business. We believe we are appropriately positioned to have significant liquidity to continue executing our strategy.
The following table summarizes direct and indirect costs incurred through re-development and leasing activities at the Company’s properties owned during the year ended December 31, 2017. These costs are classified as cash used in capital expenditures and tenant improvements on the consolidated statements of cash flows for the year ended December 31, 2017.
Short-Term Liquidity and Capital Resources
On a short-term basis, our principal demands for funds are to pay our operating, corporate, and transaction readiness expenses, as well as property capital expenditures, make distributions to our stockholders, and pay interest and principal payments on our current indebtedness. We expect to meet our short-term liquidity requirements from cash flows from operations, distributions from our joint venture investments and sales from our marketable securities portfolio.
52
• who constructs or directs the construction of the improvements.
Development Re-development Leasing Total
Direct costs $ 3,425 (a) $ 9,929 (c) $ 4,711 (e) $ 18,065 Indirect costs 205 (b) 1,270 (d) — 1,475
Total $ 3,630 $ 11,199 $ 4,711 $ 19,540
(a) Direct development costs relate to construction of buildings at two of our retail properties.
(b) Indirect development costs relate to the capitalized payroll attributed to the improvements of two of our retail properties.
(c) Direct re-development costs relate to capitalized expenditures, including those attributed to the improvement of our retail properties.
(d) Indirect re-development costs relate to the capitalized payroll attributed to improvements of our retail properties.
(e) Direct leasing costs relate to improvements to a tenant space that are either paid directly or reimbursed to the tenants.
Our board of directors approved an increase to our annual distribution rate effective for the quarterly distribution paid in April 2017. As we execute on our retail strategy, our board has been and will continue evaluating our distribution rate and, if the board deems appropriate, adjust the rate to take into account our progress in refining and balancing our multi-tenant retail platform.
Long-Term Liquidity and Capital Resources
Strategic disposition transactions have reduced our cash flows from operations. On April 28, 2016, we completed the spin-off of Highlands, which held substantially all of the remaining properties included in our non-core segment. In addition, on June 21, 2016, we sold our student housing platform, University House.
Following the completion of the Highlands spin-off and the sale of University House, our objectives are to maximize revenue generated by our existing retail properties, to further enhance the value of our retail properties to produce attractive current yield and long-term risk-adjusted returns for our stockholders and to generate sustainable and predictable cash flow from our operations to distribute to our stockholders. We believe the repositioning and growing of our retail properties will increase our operating cash flows over time.
Our primary sources and uses of capital are as follows:
Sources
Uses
We may, from time to time, seek to retire or purchase additional amounts of our outstanding equity and/or debt securities through cash purchases or exchanges for other securities. Such purchases or exchanges, if any, will depend on our liquidity requirements, contractual restrictions, and other factors. The amounts involved may be material.
Acquisitions and Dispositions of Real Estate Investments
During the year ended December 31, 2017, we acquired six wholly owned and two consolidated retail properties considered Parked Assets as legal title was held by the EAT Subsidiary. During the year ended December 31, 2016, we acquired eight retail properties. These 2017 and 2016 acquisitions were funded with available cash, disposition proceeds, and mortgage indebtedness. We invested net cash of approximately $500.1 million and $419.6 million during the years ended December 31, 2017 and 2016 for these acquisitions, respectively.
During the year ended December 31, 2017, we disposed of seven retail properties, one non-core property, and two single-user outparcels for an aggregate gross disposition price of $244.1 million. During the year ended December 31, 2016, we disposed of 17 student housing properties as part of the sale of University House, 28 retail properties, one student housing property, and one non-core property for a total of $1,924.4 million. On April 28, 2016 we completed the spin-off of Highlands, which consisted of seven single- and multi-tenant office properties, two industrial properties, six retail properties, two correctional facilities, four parcels of unimproved land and one bank branch through the pro rata taxable distribution of 100% of the outstanding common stock of Highlands to holders of record of our common stock as of the close of business on April 25, 2016, the record date.
53
• cash flows from our real estate investments, which consists of our retail properties;
• distributions from our joint venture investments;
• proceeds from sales of properties and marketable securities;
• proceeds from borrowings on properties; and
• proceeds from corporate borrowings.
• to pay our operating expenses;
• to make distributions to our stockholders;
• to service or pay down our debt;
• to fund capital expenditures and leasing related costs;
• to invest in properties; and
• to fund development or re-development investments.
Distributions
We declared cash distributions to our stockholders during the period from January 1, 2017 to December 31, 2017 totaling $53.8 million. During the year ended December 31, 2017, we paid cash distributions of $53.4 million. As we execute on our retail strategy, our board has been and expects to continue evaluating our distribution rate on a periodic basis. See "Current Strategy and Outlook" for more information regarding our retail strategy. The following table presents a historical summary of distributions declared, paid and reinvested.
Borrowings
Mortgages payable, maturities
As of December 31, 2017, scheduled maturities for the Company's outstanding mortgage indebtedness occur through June 2037, as follows:
Credit agreements, maturities
As of December 31, 2017, the Company had the following borrowings outstanding under its term loan credit facility:
54
Year ended December 31,
2017 2016 2015 2014 2013
Distributions declared $ 53,758 $ 83,633 $ 138,614 $ 436,875 $ 450,106 Distributions paid 53,358 98,606 146,510 438,875 449,253 Distributions reinvested — — — 95,832 181,630
Maturities during the year ending December 31,
2018 2019 2020 2021 2022 Thereafter Total
Mortgages payable $ 103,905 $ — $ 41,000 $ 12,828 $ 68,260 $ 144,811 $ 370,804
Aggregate
Principal Balance Interest
Rate Maturity
Date
Unsecured term loan credit facility, 5 year - swapped to fixed rate (a) $ 90,000 2.6510% 1/15/2021
Unsecured term loan credit facility, 5 year - swapped to fixed rate (b) 60,000 2.6525% 1/15/2021
Unsecured term loan credit facility, 5 year - variable rate (c) 50,000 2.6607% 1/15/2021
Unsecured term loan credit facility, 7 year - variable rate (d) 100,000 2.9607% 11/5/2022
Total unsecured term loans $ 300,000
(a) The Company swapped $90,000 of variable rate debt at an interest rate of 1-Month LIBOR plus 1.3% to a fixed rate of 2.6510%. The swap has an effective date of December 10, 2015, a termination date of December 1, 2019, and a notional amount of $90,000.
(b) The Company swapped $60,000 of variable rate debt at an interest rate of 1-Month LIBOR plus 1.3% to a fixed rate of 2.6525%. The swap has an effective date of December 10, 2015, a termination date of December 1, 2019, and a notional amount of $60,000.
(c) Interest rate reflects 1-Month LIBOR plus 1.3% as of December 31, 2017 and 2016.
(d) Interest rate reflects 1-Month LIBOR plus 1.6% as of December 31, 2017 and 2016.
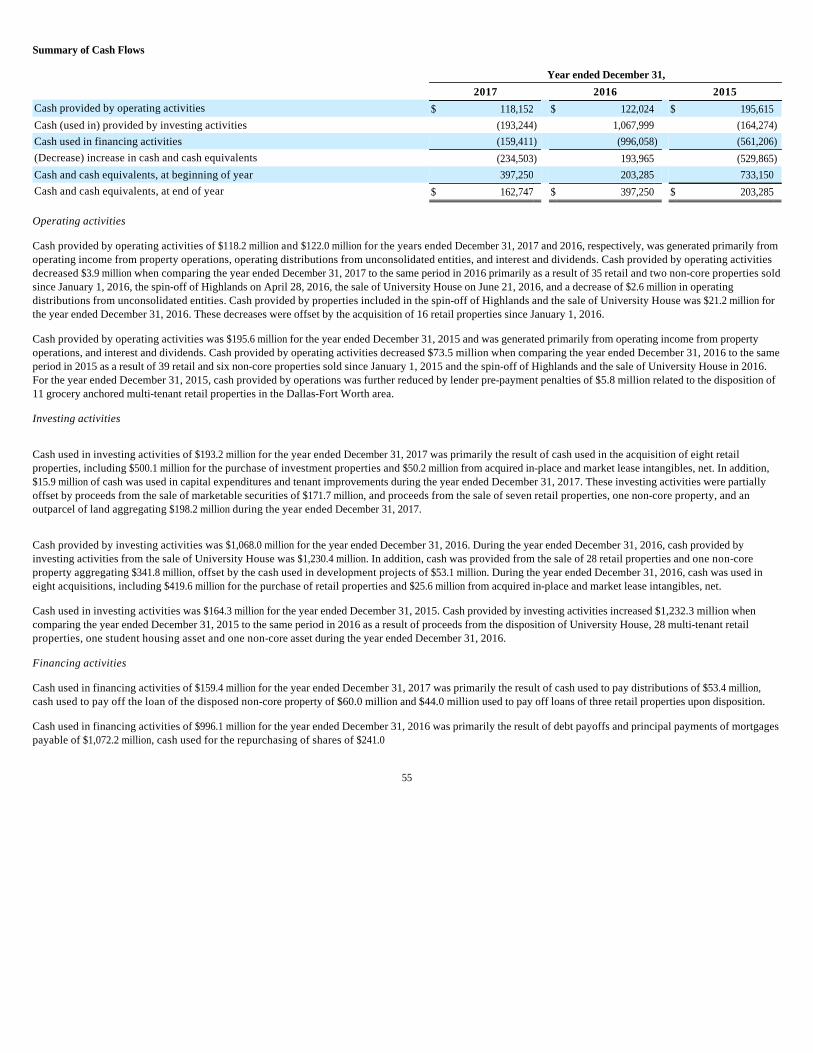
Summary of Cash Flows
Operating activities
Cash provided by operating activities of $118.2 million and $122.0 million for the years ended December 31, 2017 and 2016, respectively, was generated primarily from operating income from property operations, operating distributions from unconsolidated entities, and interest and dividends. Cash provided by operating activities decreased $3.9 million when comparing the year ended December 31, 2017 to the same period in 2016 primarily as a result of 35 retail and two non-core properties sold since January 1, 2016, the spin-off of Highlands on April 28, 2016, the sale of University House on June 21, 2016, and a decrease of $2.6 million in operating distributions from unconsolidated entities. Cash provided by properties included in the spin-off of Highlands and the sale of University House was $21.2 million for the year ended December 31, 2016. These decreases were offset by the acquisition of 16 retail properties since January 1, 2016.
Cash provided by operating activities was $195.6 million for the year ended December 31, 2015 and was generated primarily from operating income from property operations, and interest and dividends. Cash provided by operating activities decreased $73.5 million when comparing the year ended December 31, 2016 to the same period in 2015 as a result of 39 retail and six non-core properties sold since January 1, 2015 and the spin-off of Highlands and the sale of University House in 2016. For the year ended December 31, 2015, cash provided by operations was further reduced by lender pre-payment penalties of $5.8 million related to the disposition of 11 grocery anchored multi-tenant retail properties in the Dallas-Fort Worth area.
Investing activities
Cash used in investing activities of $193.2 million for the year ended December 31, 2017 was primarily the result of cash used in the acquisition of eight retail properties, including $500.1 million for the purchase of investment properties and $50.2 million from acquired in-place and market lease intangibles, net. In addition, $15.9 million of cash was used in capital expenditures and tenant improvements during the year ended December 31, 2017. These investing activities were partially offset by proceeds from the sale of marketable securities of $171.7 million, and proceeds from the sale of seven retail properties, one non-core property, and an outparcel of land aggregating $198.2 million during the year ended December 31, 2017.
Cash provided by investing activities was $1,068.0 million for the year ended December 31, 2016. During the year ended December 31, 2016, cash provided by investing activities from the sale of University House was $1,230.4 million. In addition, cash was provided from the sale of 28 retail properties and one non-core property aggregating $341.8 million, offset by the cash used in development projects of $53.1 million. During the year ended December 31, 2016, cash was used in eight acquisitions, including $419.6 million for the purchase of retail properties and $25.6 million from acquired in-place and market lease intangibles, net.
Cash used in investing activities was $164.3 million for the year ended December 31, 2015. Cash provided by investing activities increased $1,232.3 million when comparing the year ended December 31, 2015 to the same period in 2016 as a result of proceeds from the disposition of University House, 28 multi-tenant retail properties, one student housing asset and one non-core asset during the year ended December 31, 2016.
Financing activities
Cash used in financing activities of $159.4 million for the year ended December 31, 2017 was primarily the result of cash used to pay distributions of $53.4 million, cash used to pay off the loan of the disposed non-core property of $60.0 million and $44.0 million used to pay off loans of three retail properties upon disposition.
Cash used in financing activities of $996.1 million for the year ended December 31, 2016 was primarily the result of debt payoffs and principal payments of mortgages payable of $1,072.2 million, cash used for the repurchasing of shares of $241.0
55
Year ended December 31,
2017 2016 2015
Cash provided by operating activities $ 118,152 $ 122,024 $ 195,615 Cash (used in) provided by investing activities (193,244 ) 1,067,999 (164,274 )
Cash used in financing activities (159,411 ) (996,058 ) (561,206 )
(Decrease) increase in cash and cash equivalents (234,503 ) 193,965 (529,865 )
Cash and cash equivalents, at beginning of year 397,250 203,285 733,150 Cash and cash equivalents, at end of year $ 162,747 $ 397,250 $ 203,285
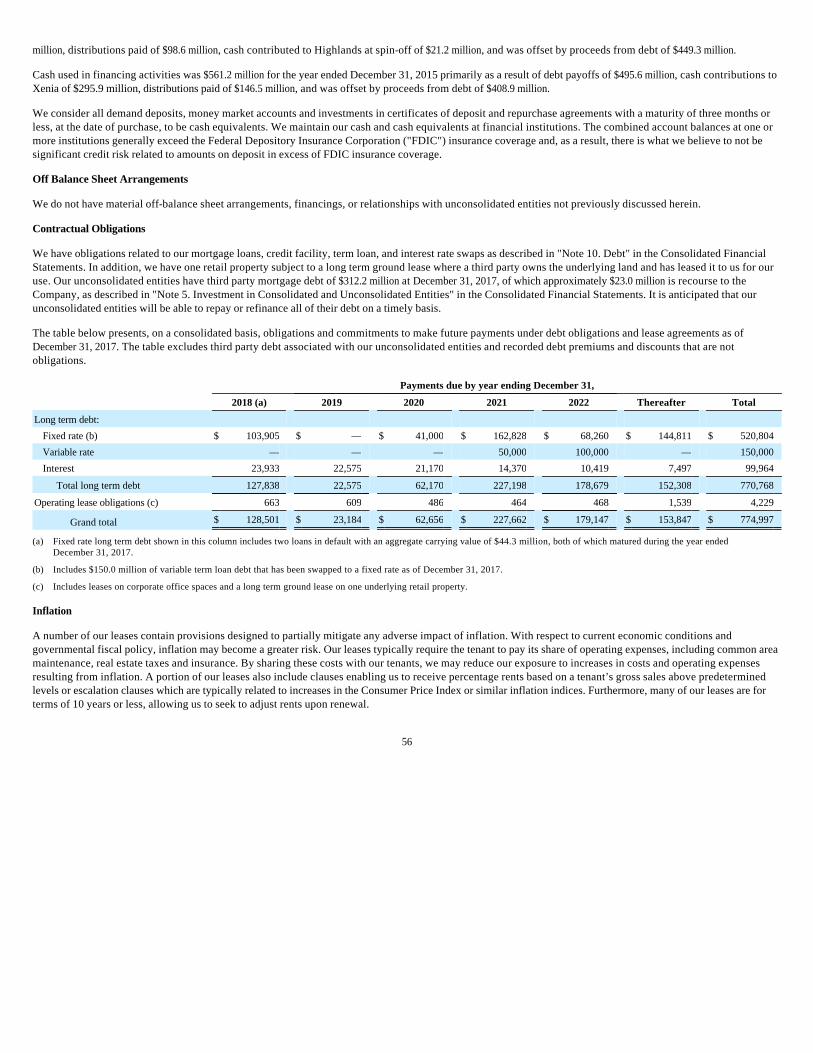
million, distributions paid of $98.6 million, cash contributed to Highlands at spin-off of $21.2 million, and was offset by proceeds from debt of $449.3 million.
Cash used in financing activities was $561.2 million for the year ended December 31, 2015 primarily as a result of debt payoffs of $495.6 million, cash contributions to Xenia of $295.9 million, distributions paid of $146.5 million, and was offset by proceeds from debt of $408.9 million.
We consider all demand deposits, money market accounts and investments in certificates of deposit and repurchase agreements with a maturity of three months or less, at the date of purchase, to be cash equivalents. We maintain our cash and cash equivalents at financial institutions. The combined account balances at one or more institutions generally exceed the Federal Depository Insurance Corporation ("FDIC") insurance coverage and, as a result, there is what we believe to not be significant credit risk related to amounts on deposit in excess of FDIC insurance coverage.
Off Balance Sheet Arrangements
We do not have material off-balance sheet arrangements, financings, or relationships with unconsolidated entities not previously discussed herein.
Contractual Obligations
We have obligations related to our mortgage loans, credit facility, term loan, and interest rate swaps as described in "Note 10. Debt" in the Consolidated Financial Statements. In addition, we have one retail property subject to a long term ground lease where a third party owns the underlying land and has leased it to us for our use. Our unconsolidated entities have third party mortgage debt of $312.2 million at December 31, 2017, of which approximately $23.0 million is recourse to the Company, as described in "Note 5. Investment in Consolidated and Unconsolidated Entities" in the Consolidated Financial Statements. It is anticipated that our unconsolidated entities will be able to repay or refinance all of their debt on a timely basis.
The table below presents, on a consolidated basis, obligations and commitments to make future payments under debt obligations and lease agreements as of December 31, 2017. The table excludes third party debt associated with our unconsolidated entities and recorded debt premiums and discounts that are not obligations.
Inflation
A number of our leases contain provisions designed to partially mitigate any adverse impact of inflation. With respect to current economic conditions and governmental fiscal policy, inflation may become a greater risk. Our leases typically require the tenant to pay its share of operating expenses, including common area maintenance, real estate taxes and insurance. By sharing these costs with our tenants, we may reduce our exposure to increases in costs and operating expenses resulting from inflation. A portion of our leases also include clauses enabling us to receive percentage rents based on a tenant’s gross sales above predetermined levels or escalation clauses which are typically related to increases in the Consumer Price Index or similar inflation indices. Furthermore, many of our leases are for terms of 10 years or less, allowing us to seek to adjust rents upon renewal.
56
Payments due by year ending December 31,
2018 (a) 2019 2020 2021 2022 Thereafter Total
Long term debt:
Fixed rate (b) $ 103,905 $ — $ 41,000 $ 162,828 $ 68,260 $ 144,811 $ 520,804 Variable rate — — — 50,000 100,000 — 150,000 Interest 23,933 22,575 21,170 14,370 10,419 7,497 99,964
Total long term debt 127,838 22,575 62,170 227,198 178,679 152,308 770,768 Operating lease obligations (c) 663 609 486 464 468 1,539 4,229
Grand total $ 128,501 $ 23,184 $ 62,656 $ 227,662 $ 179,147 $ 153,847 $ 774,997
(a) Fixed rate long term debt shown in this column includes two loans in default with an aggregate carrying value of $44.3 million, both of which matured during the year ended December 31, 2017.
(b) Includes $150.0 million of variable term loan debt that has been swapped to a fixed rate as of December 31, 2017.
(c) Includes leases on corporate office spaces and a long term ground lease on one underlying retail property.
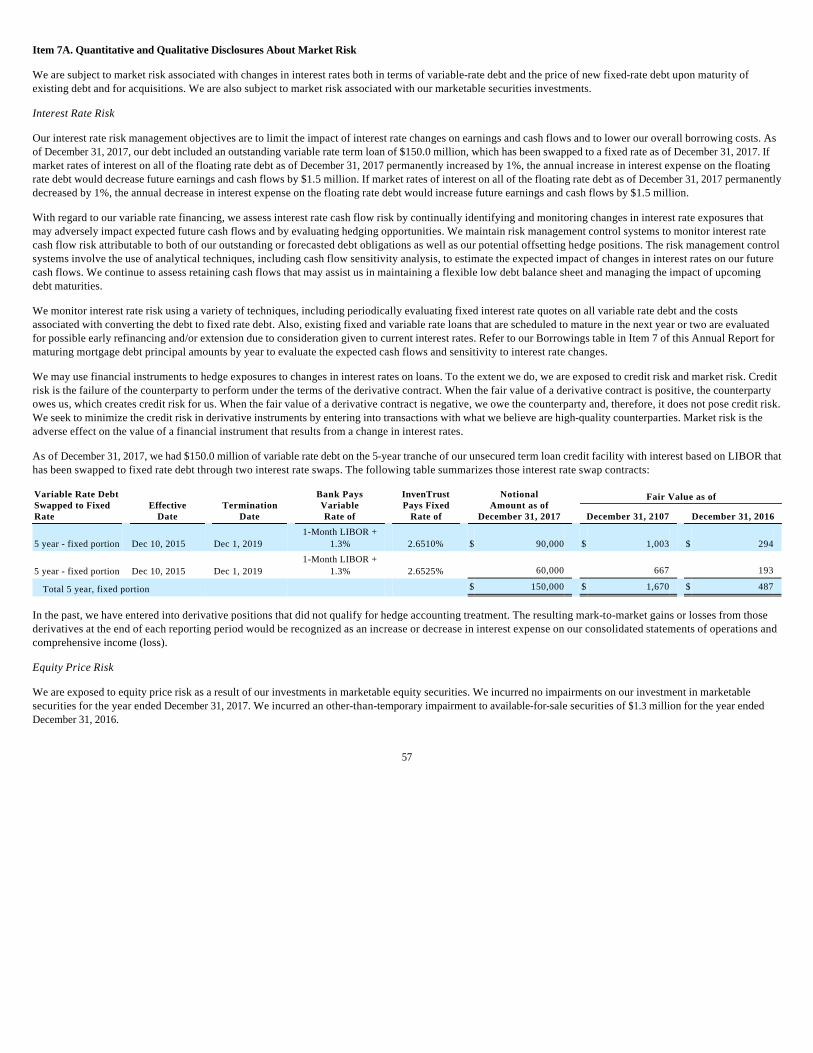
Item 7A. Quantitative and Qualitative Disclosures About Market Risk
We are subject to market risk associated with changes in interest rates both in terms of variable-rate debt and the price of new fixed-rate debt upon maturity of existing debt and for acquisitions. We are also subject to market risk associated with our marketable securities investments.
Interest Rate Risk
Our interest rate risk management objectives are to limit the impact of interest rate changes on earnings and cash flows and to lower our overall borrowing costs. As of December 31, 2017, our debt included an outstanding variable rate term loan of $150.0 million, which has been swapped to a fixed rate as of December 31, 2017. If market rates of interest on all of the floating rate debt as of December 31, 2017 permanently increased by 1%, the annual increase in interest expense on the floating rate debt would decrease future earnings and cash flows by $1.5 million. If market rates of interest on all of the floating rate debt as of December 31, 2017 permanently decreased by 1%, the annual decrease in interest expense on the floating rate debt would increase future earnings and cash flows by $1.5 million.
With regard to our variable rate financing, we assess interest rate cash flow risk by continually identifying and monitoring changes in interest rate exposures that may adversely impact expected future cash flows and by evaluating hedging opportunities. We maintain risk management control systems to monitor interest rate cash flow risk attributable to both of our outstanding or forecasted debt obligations as well as our potential offsetting hedge positions. The risk management control systems involve the use of analytical techniques, including cash flow sensitivity analysis, to estimate the expected impact of changes in interest rates on our future cash flows. We continue to assess retaining cash flows that may assist us in maintaining a flexible low debt balance sheet and managing the impact of upcoming debt maturities.
We monitor interest rate risk using a variety of techniques, including periodically evaluating fixed interest rate quotes on all variable rate debt and the costs associated with converting the debt to fixed rate debt. Also, existing fixed and variable rate loans that are scheduled to mature in the next year or two are evaluated for possible early refinancing and/or extension due to consideration given to current interest rates. Refer to our Borrowings table in Item 7 of this Annual Report for maturing mortgage debt principal amounts by year to evaluate the expected cash flows and sensitivity to interest rate changes.
We may use financial instruments to hedge exposures to changes in interest rates on loans. To the extent we do, we are exposed to credit risk and market risk. Credit risk is the failure of the counterparty to perform under the terms of the derivative contract. When the fair value of a derivative contract is positive, the counterparty owes us, which creates credit risk for us. When the fair value of a derivative contract is negative, we owe the counterparty and, therefore, it does not pose credit risk. We seek to minimize the credit risk in derivative instruments by entering into transactions with what we believe are high-quality counterparties. Market risk is the adverse effect on the value of a financial instrument that results from a change in interest rates.
As of December 31, 2017, we had $150.0 million of variable rate debt on the 5-year tranche of our unsecured term loan credit facility with interest based on LIBOR that has been swapped to fixed rate debt through two interest rate swaps. The following table summarizes those interest rate swap contracts:
In the past, we have entered into derivative positions that did not qualify for hedge accounting treatment. The resulting mark-to-market gains or losses from those derivatives at the end of each reporting period would be recognized as an increase or decrease in interest expense on our consolidated statements of operations and comprehensive income (loss).
Equity Price Risk
We are exposed to equity price risk as a result of our investments in marketable equity securities. We incurred no impairments on our investment in marketable securities for the year ended December 31, 2017. We incurred an other-than-temporary impairment to available-for-sale securities of $1.3 million for the year ended December 31, 2016.
57
Variable Rate Debt Swapped to Fixed Rate
Effective
Date
Termination
Date
Bank Pays Variable Rate of
InvenTrust Pays Fixed
Rate of
Notional Amount as of
December 31, 2017
Fair Value as of
December 31, 2107 December 31, 2016
5 year - fixed portion Dec 10, 2015 Dec 1, 2019 1-Month LIBOR +
1.3% 2.6510% $ 90,000 $ 1,003 $ 294
5 year - fixed portion Dec 10, 2015 Dec 1, 2019 1-Month LIBOR +
1.3% 2.6525% 60,000 667 193
Total 5 year, fixed portion $ 150,000 $ 1,670 $ 487
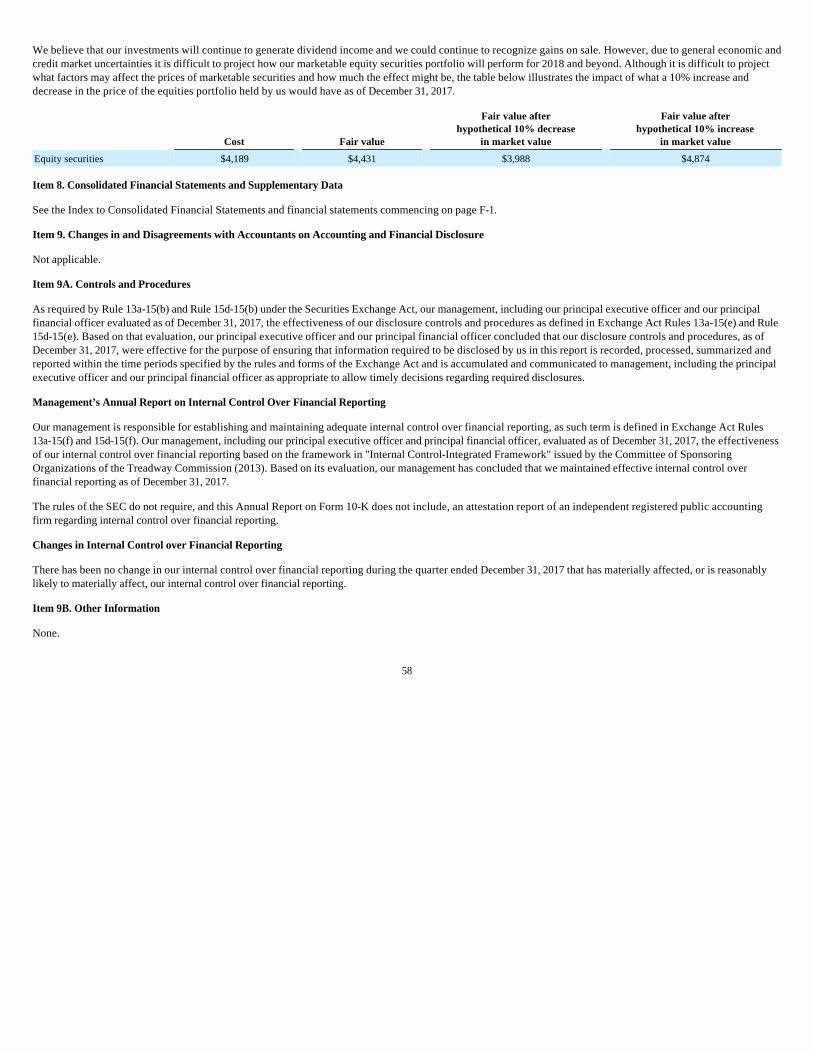
We believe that our investments will continue to generate dividend income and we could continue to recognize gains on sale. However, due to general economic and credit market uncertainties it is difficult to project how our marketable equity securities portfolio will perform for 2018 and beyond. Although it is difficult to project what factors may affect the prices of marketable securities and how much the effect might be, the table below illustrates the impact of what a 10% increase and decrease in the price of the equities portfolio held by us would have as of December 31, 2017.
Item 8. Consolidated Financial Statements and Supplementary Data
See the Index to Consolidated Financial Statements and financial statements commencing on page F-1.
Item 9. Changes in and Disagreements with Accountants on Accounting and Financial Disclosure
Not applicable.
Item 9A. Controls and Procedures
As required by Rule 13a-15(b) and Rule 15d-15(b) under the Securities Exchange Act, our management, including our principal executive officer and our principal financial officer evaluated as of December 31, 2017, the effectiveness of our disclosure controls and procedures as defined in Exchange Act Rules 13a-15(e) and Rule 15d-15(e). Based on that evaluation, our principal executive officer and our principal financial officer concluded that our disclosure controls and procedures, as of December 31, 2017, were effective for the purpose of ensuring that information required to be disclosed by us in this report is recorded, processed, summarized and reported within the time periods specified by the rules and forms of the Exchange Act and is accumulated and communicated to management, including the principal executive officer and our principal financial officer as appropriate to allow timely decisions regarding required disclosures.
Management’s Annual Report on Internal Control Over Financial Reporting
Our management is responsible for establishing and maintaining adequate internal control over financial reporting, as such term is defined in Exchange Act Rules 13a-15(f) and 15d-15(f). Our management, including our principal executive officer and principal financial officer, evaluated as of December 31, 2017, the effectiveness of our internal control over financial reporting based on the framework in "Internal Control-Integrated Framework" issued by the Committee of Sponsoring Organizations of the Treadway Commission (2013). Based on its evaluation, our management has concluded that we maintained effective internal control over financial reporting as of December 31, 2017.
The rules of the SEC do not require, and this Annual Report on Form 10-K does not include, an attestation report of an independent registered public accounting firm regarding internal control over financial reporting.
Changes in Internal Control over Financial Reporting
There has been no change in our internal control over financial reporting during the quarter ended December 31, 2017 that has materially affected, or is reasonably likely to materially affect, our internal control over financial reporting.
Item 9B. Other Information
None.
58
Cost Fair value
Fair value after hypothetical 10% decrease
in market value
Fair value after hypothetical 10% increase
in market value
Equity securities $4,189 $4,431 $3,988 $4,874
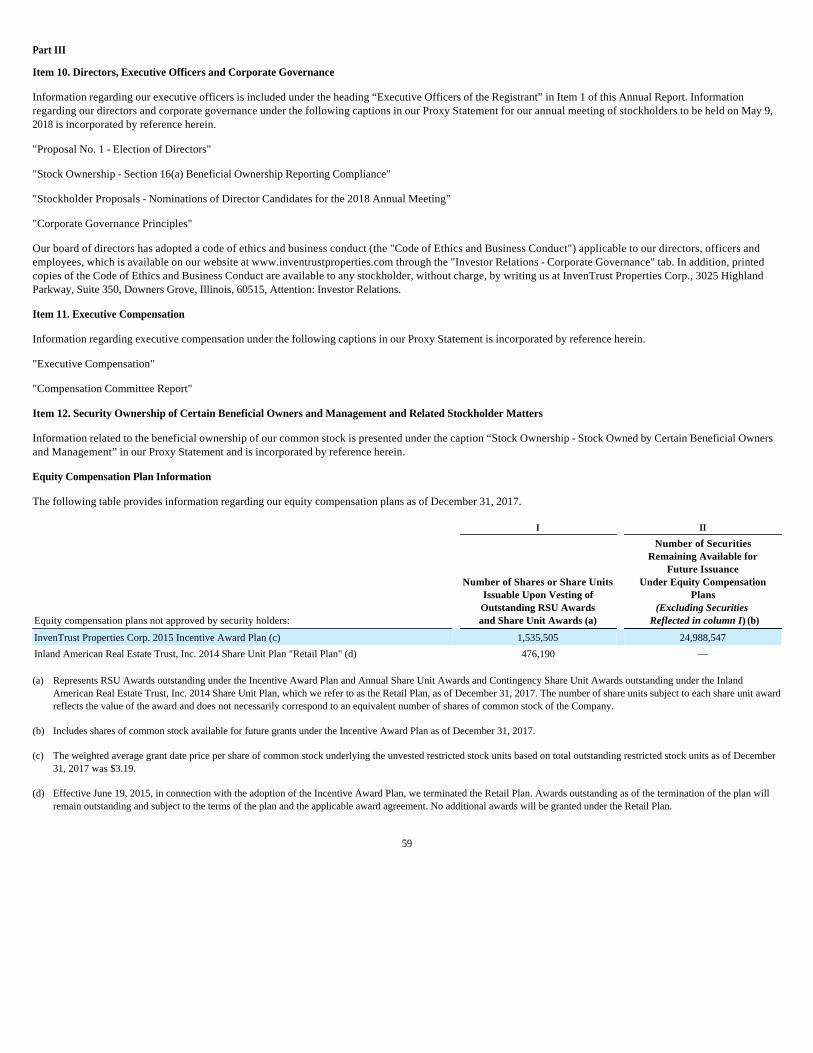
Part III
Item 10. Directors, Executive Officers and Corporate Governance
Information regarding our executive officers is included under the heading “Executive Officers of the Registrant” in Item 1 of this Annual Report. Information regarding our directors and corporate governance under the following captions in our Proxy Statement for our annual meeting of stockholders to be held on May 9, 2018 is incorporated by reference herein.
"Proposal No. 1 - Election of Directors"
"Stock Ownership - Section 16(a) Beneficial Ownership Reporting Compliance"
"Stockholder Proposals - Nominations of Director Candidates for the 2018 Annual Meeting"
"Corporate Governance Principles"
Our board of directors has adopted a code of ethics and business conduct (the "Code of Ethics and Business Conduct") applicable to our directors, officers and employees, which is available on our website at www.inventrustproperties.com through the "Investor Relations - Corporate Governance" tab. In addition, printed copies of the Code of Ethics and Business Conduct are available to any stockholder, without charge, by writing us at InvenTrust Properties Corp., 3025 Highland Parkway, Suite 350, Downers Grove, Illinois, 60515, Attention: Investor Relations.
Item 11. Executive Compensation
Information regarding executive compensation under the following captions in our Proxy Statement is incorporated by reference herein.
"Executive Compensation"
"Compensation Committee Report"
Item 12. Security Ownership of Certain Beneficial Owners and Management and Related Stockholder Matters
Information related to the beneficial ownership of our common stock is presented under the caption “Stock Ownership - Stock Owned by Certain Beneficial Owners and Management” in our Proxy Statement and is incorporated by reference herein.
Equity Compensation Plan Information
The following table provides information regarding our equity compensation plans as of December 31, 2017.
59
I II
Equity compensation plans not approved by security holders:
Number of Shares or Share Units Issuable Upon Vesting of Outstanding RSU Awards and Share Unit Awards (a)
Number of Securities Remaining Available for
Future Issuance Under Equity Compensation
Plans (Excluding Securities
Reflected in column I) (b)
InvenTrust Properties Corp. 2015 Incentive Award Plan (c) 1,535,505 24,988,547
Inland American Real Estate Trust, Inc. 2014 Share Unit Plan "Retail Plan" (d) 476,190 —
(a) Represents RSU Awards outstanding under the Incentive Award Plan and Annual Share Unit Awards and Contingency Share Unit Awards outstanding under the Inland American Real Estate Trust, Inc. 2014 Share Unit Plan, which we refer to as the Retail Plan, as of December 31, 2017. The number of share units subject to each share unit award reflects the value of the award and does not necessarily correspond to an equivalent number of shares of common stock of the Company.
(b) Includes shares of common stock available for future grants under the Incentive Award Plan as of December 31, 2017.
(c) The weighted average grant date price per share of common stock underlying the unvested restricted stock units based on total outstanding restricted stock units as of December 31, 2017 was $3.19.
(d) Effective June 19, 2015, in connection with the adoption of the Incentive Award Plan, we terminated the Retail Plan. Awards outstanding as of the termination of the plan will remain outstanding and subject to the terms of the plan and the applicable award agreement. No additional awards will be granted under the Retail Plan.

Item 13. Certain Relationships and Related Transactions, and Director Independence
Information regarding certain relationships and related transactions, and director independence under the following captions in our Proxy Statement is incorporated by reference herein.
"Certain Relationships and Related Person Transactions"
"Corporate Governance Principles - Director Independence"
Item 14. Principal Accounting Fees and Services
Information regarding principal accounting fees and services under the caption "Proposal No. 2 - Ratify Appointment of KPMG LLP" in our Proxy Statement is incorporated by reference herein.
60
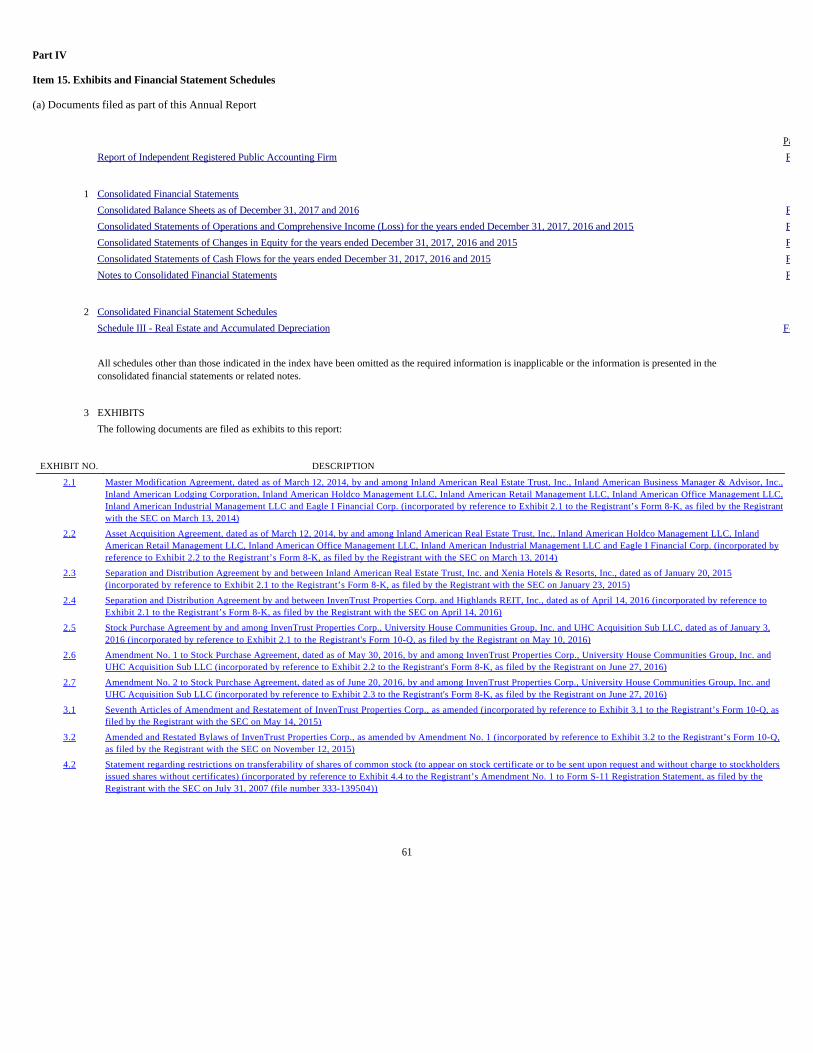
Part IV
Item 15. Exhibits and Financial Statement Schedules
(a) Documents filed as part of this Annual Report
61
Page
Report of Independent Registered Public Accounting Firm F
1 Consolidated Financial Statements
Consolidated Balance Sheets as of December 31, 2017 and 2016 F
Consolidated Statements of Operations and Comprehensive Income (Loss) for the years ended December 31, 2017, 2016 and 2015 F
Consolidated Statements of Changes in Equity for the years ended December 31, 2017, 2016 and 2015 F
Consolidated Statements of Cash Flows for the years ended December 31, 2017, 2016 and 2015 F
Notes to Consolidated Financial Statements F
2 Consolidated Financial Statement Schedules
Schedule III - Real Estate and Accumulated Depreciation F-
All schedules other than those indicated in the index have been omitted as the required information is inapplicable or the information is presented in the consolidated financial statements or related notes.
3 EXHIBITS
The following documents are filed as exhibits to this report:
EXHIBIT NO. DESCRIPTION
2.1 Master Modification Agreement, dated as of March 12, 2014, by and among Inland American Real Estate Trust, Inc., Inland American Business Manager & Advisor, Inc., Inland American Lodging Corporation, Inland American Holdco Management LLC, Inland American Retail Management LLC, Inland American Office Management LLC, Inland American Industrial Management LLC and Eagle I Financial Corp. (incorporated by reference to Exhibit 2.1 to the Registrant’s Form 8-K, as filed by the Registrant with the SEC on March 13, 2014)
2.2 Asset Acquisition Agreement, dated as of March 12, 2014, by and among Inland American Real Estate Trust, Inc., Inland American Holdco Management LLC, Inland American Retail Management LLC, Inland American Office Management LLC, Inland American Industrial Management LLC and Eagle I Financial Corp. (incorporated by reference to Exhibit 2.2 to the Registrant’s Form 8-K, as filed by the Registrant with the SEC on March 13, 2014)
2.3 Separation and Distribution Agreement by and between Inland American Real Estate Trust, Inc. and Xenia Hotels & Resorts, Inc., dated as of January 20, 2015 (incorporated by reference to Exhibit 2.1 to the Registrant’s Form 8-K, as filed by the Registrant with the SEC on January 23, 2015)
2.4 Separation and Distribution Agreement by and between InvenTrust Properties Corp. and Highlands REIT, Inc., dated as of April 14, 2016 (incorporated by reference to Exhibit 2.1 to the Registrant’s Form 8-K, as filed by the Registrant with the SEC on April 14, 2016)
2.5 Stock Purchase Agreement by and among InvenTrust Properties Corp., University House Communities Group, Inc. and UHC Acquisition Sub LLC, dated as of January 3, 2016 (incorporated by reference to Exhibit 2.1 to the Registrant's Form 10-Q, as filed by the Registrant on May 10, 2016)
2.6 Amendment No. 1 to Stock Purchase Agreement, dated as of May 30, 2016, by and among InvenTrust Properties Corp., University House Communities Group, Inc. and UHC Acquisition Sub LLC (incorporated by reference to Exhibit 2.2 to the Registrant's Form 8-K, as filed by the Registrant on June 27, 2016)
2.7 Amendment No. 2 to Stock Purchase Agreement, dated as of June 20, 2016, by and among InvenTrust Properties Corp., University House Communities Group, Inc. and UHC Acquisition Sub LLC (incorporated by reference to Exhibit 2.3 to the Registrant's Form 8-K, as filed by the Registrant on June 27, 2016)
3.1 Seventh Articles of Amendment and Restatement of InvenTrust Properties Corp., as amended (incorporated by reference to Exhibit 3.1 to the Registrant’s Form 10-Q, as filed by the Registrant with the SEC on May 14, 2015)
3.2 Amended and Restated Bylaws of InvenTrust Properties Corp., as amended by Amendment No. 1 (incorporated by reference to Exhibit 3.2 to the Registrant’s Form 10-Q, as filed by the Registrant with the SEC on November 12, 2015)
4.2 Statement regarding restrictions on transferability of shares of common stock (to appear on stock certificate or to be sent upon request and without charge to stockholders issued shares without certificates) (incorporated by reference to Exhibit 4.4 to the Registrant’s Amendment No. 1 to Form S-11 Registration Statement, as filed by the Registrant with the SEC on July 31, 2007 (file number 333-139504))
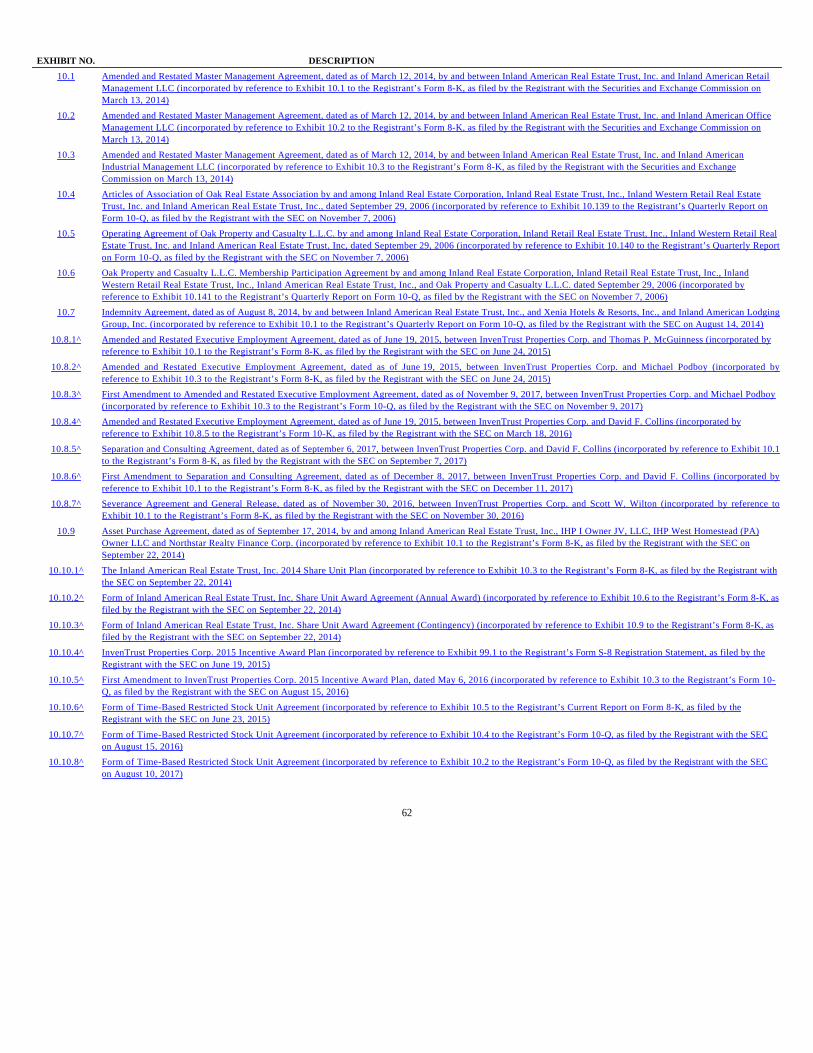
62
EXHIBIT NO. DESCRIPTION
10.1 Amended and Restated Master Management Agreement, dated as of March 12, 2014, by and between Inland American Real Estate Trust, Inc. and Inland American Retail Management LLC (incorporated by reference to Exhibit 10.1 to the Registrant’s Form 8-K, as filed by the Registrant with the Securities and Exchange Commission on March 13, 2014)
10.2 Amended and Restated Master Management Agreement, dated as of March 12, 2014, by and between Inland American Real Estate Trust, Inc. and Inland American Office Management LLC (incorporated by reference to Exhibit 10.2 to the Registrant’s Form 8-K, as filed by the Registrant with the Securities and Exchange Commission on March 13, 2014)
10.3 Amended and Restated Master Management Agreement, dated as of March 12, 2014, by and between Inland American Real Estate Trust, Inc. and Inland American Industrial Management LLC (incorporated by reference to Exhibit 10.3 to the Registrant’s Form 8-K, as filed by the Registrant with the Securities and Exchange Commission on March 13, 2014)
10.4 Articles of Association of Oak Real Estate Association by and among Inland Real Estate Corporation, Inland Real Estate Trust, Inc., Inland Western Retail Real Estate Trust, Inc. and Inland American Real Estate Trust, Inc., dated September 29, 2006 (incorporated by reference to Exhibit 10.139 to the Registrant’s Quarterly Report on Form 10-Q, as filed by the Registrant with the SEC on November 7, 2006)
10.5 Operating Agreement of Oak Property and Casualty L.L.C. by and among Inland Real Estate Corporation, Inland Retail Real Estate Trust, Inc., Inland Western Retail Real Estate Trust, Inc. and Inland American Real Estate Trust, Inc, dated September 29, 2006 (incorporated by reference to Exhibit 10.140 to the Registrant’s Quarterly Report on Form 10-Q, as filed by the Registrant with the SEC on November 7, 2006)
10.6 Oak Property and Casualty L.L.C. Membership Participation Agreement by and among Inland Real Estate Corporation, Inland Retail Real Estate Trust, Inc., Inland Western Retail Real Estate Trust, Inc., Inland American Real Estate Trust, Inc., and Oak Property and Casualty L.L.C. dated September 29, 2006 (incorporated by reference to Exhibit 10.141 to the Registrant’s Quarterly Report on Form 10-Q, as filed by the Registrant with the SEC on November 7, 2006)
10.7 Indemnity Agreement, dated as of August 8, 2014, by and between Inland American Real Estate Trust, Inc., and Xenia Hotels & Resorts, Inc., and Inland American Lodging Group, Inc. (incorporated by reference to Exhibit 10.1 to the Registrant’s Quarterly Report on Form 10-Q, as filed by the Registrant with the SEC on August 14, 2014)
10.8.1^ Amended and Restated Executive Employment Agreement, dated as of June 19, 2015, between InvenTrust Properties Corp. and Thomas P. McGuinness (incorporated by reference to Exhibit 10.1 to the Registrant’s Form 8-K, as filed by the Registrant with the SEC on June 24, 2015)
10.8.2^ Amended and Restated Executive Employment Agreement, dated as of June 19, 2015, between InvenTrust Properties Corp. and Michael Podboy (incorporated by reference to Exhibit 10.3 to the Registrant’s Form 8-K, as filed by the Registrant with the SEC on June 24, 2015)
10.8.3^ First Amendment to Amended and Restated Executive Employment Agreement, dated as of November 9, 2017, between InvenTrust Properties Corp. and Michael Podboy (incorporated by reference to Exhibit 10.3 to the Registrant’s Form 10-Q, as filed by the Registrant with the SEC on November 9, 2017)
10.8.4^ Amended and Restated Executive Employment Agreement, dated as of June 19, 2015, between InvenTrust Properties Corp. and David F. Collins (incorporated by reference to Exhibit 10.8.5 to the Registrant’s Form 10-K, as filed by the Registrant with the SEC on March 18, 2016)
10.8.5^ Separation and Consulting Agreement, dated as of September 6, 2017, between InvenTrust Properties Corp. and David F. Collins (incorporated by reference to Exhibit 10.1 to the Registrant’s Form 8-K, as filed by the Registrant with the SEC on September 7, 2017)
10.8.6^ First Amendment to Separation and Consulting Agreement, dated as of December 8, 2017, between InvenTrust Properties Corp. and David F. Collins (incorporated by reference to Exhibit 10.1 to the Registrant’s Form 8-K, as filed by the Registrant with the SEC on December 11, 2017)
10.8.7^ Severance Agreement and General Release, dated as of November 30, 2016, between InvenTrust Properties Corp. and Scott W. Wilton (incorporated by reference to Exhibit 10.1 to the Registrant’s Form 8-K, as filed by the Registrant with the SEC on November 30, 2016)
10.9 Asset Purchase Agreement, dated as of September 17, 2014, by and among Inland American Real Estate Trust, Inc., IHP I Owner JV, LLC, IHP West Homestead (PA) Owner LLC and Northstar Realty Finance Corp. (incorporated by reference to Exhibit 10.1 to the Registrant’s Form 8-K, as filed by the Registrant with the SEC on September 22, 2014)
10.10.1^ The Inland American Real Estate Trust, Inc. 2014 Share Unit Plan (incorporated by reference to Exhibit 10.3 to the Registrant’s Form 8-K, as filed by the Registrant with the SEC on September 22, 2014)
10.10.2^ Form of Inland American Real Estate Trust, Inc. Share Unit Award Agreement (Annual Award) (incorporated by reference to Exhibit 10.6 to the Registrant’s Form 8-K, as filed by the Registrant with the SEC on September 22, 2014)
10.10.3^ Form of Inland American Real Estate Trust, Inc. Share Unit Award Agreement (Contingency) (incorporated by reference to Exhibit 10.9 to the Registrant’s Form 8-K, as filed by the Registrant with the SEC on September 22, 2014)
10.10.4^ InvenTrust Properties Corp. 2015 Incentive Award Plan (incorporated by reference to Exhibit 99.1 to the Registrant’s Form S-8 Registration Statement, as filed by the Registrant with the SEC on June 19, 2015)
10.10.5^ First Amendment to InvenTrust Properties Corp. 2015 Incentive Award Plan, dated May 6, 2016 (incorporated by reference to Exhibit 10.3 to the Registrant’s Form 10-Q, as filed by the Registrant with the SEC on August 15, 2016)
10.10.6^ Form of Time-Based Restricted Stock Unit Agreement (incorporated by reference to Exhibit 10.5 to the Registrant’s Current Report on Form 8-K, as filed by the Registrant with the SEC on June 23, 2015)
10.10.7^ Form of Time-Based Restricted Stock Unit Agreement (incorporated by reference to Exhibit 10.4 to the Registrant’s Form 10-Q, as filed by the Registrant with the SEC on August 15, 2016)
10.10.8^ Form of Time-Based Restricted Stock Unit Agreement (incorporated by reference to Exhibit 10.2 to the Registrant’s Form 10-Q, as filed by the Registrant with the SEC on August 10, 2017)
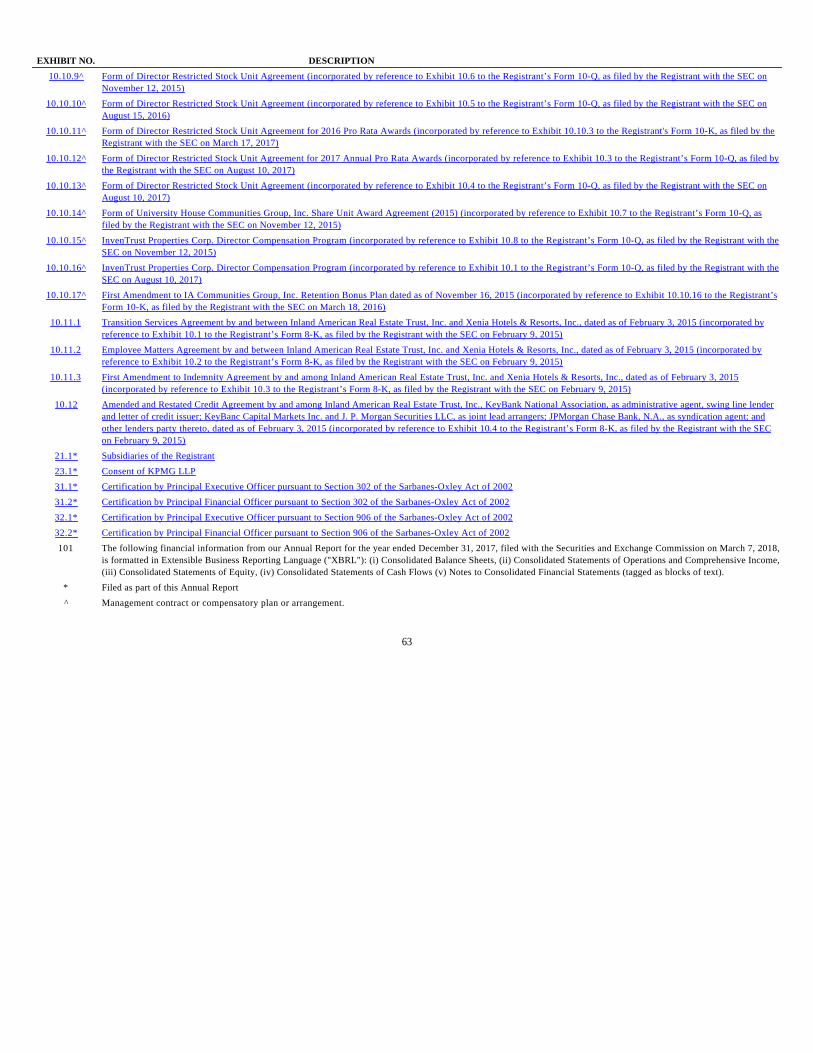
63
EXHIBIT NO. DESCRIPTION
10.10.9^ Form of Director Restricted Stock Unit Agreement (incorporated by reference to Exhibit 10.6 to the Registrant’s Form 10-Q, as filed by the Registrant with the SEC on November 12, 2015)
10.10.10^ Form of Director Restricted Stock Unit Agreement (incorporated by reference to Exhibit 10.5 to the Registrant’s Form 10-Q, as filed by the Registrant with the SEC on August 15, 2016)
10.10.11^ Form of Director Restricted Stock Unit Agreement for 2016 Pro Rata Awards (incorporated by reference to Exhibit 10.10.3 to the Registrant's Form 10-K, as filed by the Registrant with the SEC on March 17, 2017)
10.10.12^ Form of Director Restricted Stock Unit Agreement for 2017 Annual Pro Rata Awards (incorporated by reference to Exhibit 10.3 to the Registrant’s Form 10-Q, as filed by the Registrant with the SEC on August 10, 2017)
10.10.13^ Form of Director Restricted Stock Unit Agreement (incorporated by reference to Exhibit 10.4 to the Registrant’s Form 10-Q, as filed by the Registrant with the SEC on August 10, 2017)
10.10.14^ Form of University House Communities Group, Inc. Share Unit Award Agreement (2015) (incorporated by reference to Exhibit 10.7 to the Registrant’s Form 10-Q, as filed by the Registrant with the SEC on November 12, 2015)
10.10.15^ InvenTrust Properties Corp. Director Compensation Program (incorporated by reference to Exhibit 10.8 to the Registrant’s Form 10-Q, as filed by the Registrant with the SEC on November 12, 2015)
10.10.16^ InvenTrust Properties Corp. Director Compensation Program (incorporated by reference to Exhibit 10.1 to the Registrant’s Form 10-Q, as filed by the Registrant with the SEC on August 10, 2017)
10.10.17^ First Amendment to IA Communities Group, Inc. Retention Bonus Plan dated as of November 16, 2015 (incorporated by reference to Exhibit 10.10.16 to the Registrant’s Form 10-K, as filed by the Registrant with the SEC on March 18, 2016)
10.11.1 Transition Services Agreement by and between Inland American Real Estate Trust, Inc. and Xenia Hotels & Resorts, Inc., dated as of February 3, 2015 (incorporated by reference to Exhibit 10.1 to the Registrant’s Form 8-K, as filed by the Registrant with the SEC on February 9, 2015)
10.11.2 Employee Matters Agreement by and between Inland American Real Estate Trust, Inc. and Xenia Hotels & Resorts, Inc., dated as of February 3, 2015 (incorporated by reference to Exhibit 10.2 to the Registrant’s Form 8-K, as filed by the Registrant with the SEC on February 9, 2015)
10.11.3 First Amendment to Indemnity Agreement by and among Inland American Real Estate Trust, Inc. and Xenia Hotels & Resorts, Inc., dated as of February 3, 2015 (incorporated by reference to Exhibit 10.3 to the Registrant’s Form 8-K, as filed by the Registrant with the SEC on February 9, 2015)
10.12 Amended and Restated Credit Agreement by and among Inland American Real Estate Trust, Inc., KeyBank National Association, as administrative agent, swing line lender and letter of credit issuer; KeyBanc Capital Markets Inc. and J. P. Morgan Securities LLC, as joint lead arrangers; JPMorgan Chase Bank, N.A., as syndication agent; and other lenders party thereto, dated as of February 3, 2015 (incorporated by reference to Exhibit 10.4 to the Registrant’s Form 8-K, as filed by the Registrant with the SEC on February 9, 2015)
21.1* Subsidiaries of the Registrant
23.1* Consent of KPMG LLP
31.1* Certification by Principal Executive Officer pursuant to Section 302 of the Sarbanes-Oxley Act of 2002
31.2* Certification by Principal Financial Officer pursuant to Section 302 of the Sarbanes-Oxley Act of 2002
32.1* Certification by Principal Executive Officer pursuant to Section 906 of the Sarbanes-Oxley Act of 2002
32.2* Certification by Principal Financial Officer pursuant to Section 906 of the Sarbanes-Oxley Act of 2002
101 The following financial information from our Annual Report for the year ended December 31, 2017, filed with the Securities and Exchange Commission on March 7, 2018, is formatted in Extensible Business Reporting Language ("XBRL"): (i) Consolidated Balance Sheets, (ii) Consolidated Statements of Operations and Comprehensive Income, (iii) Consolidated Statements of Equity, (iv) Consolidated Statements of Cash Flows (v) Notes to Consolidated Financial Statements (tagged as blocks of text).
* Filed as part of this Annual Report
^ Management contract or compensatory plan or arrangement.
SIGNATURES
Pursuant to the requirements of Section 13 or 15(d) of the Securities and Exchange Act of 1934, the registrant has duly caused this report to be signed on its behalf by the undersigned, thereunto duly authorized.
INVENTRUST PROPERTIES CORP.
Pursuant to the requirements of the Securities Act of 1934, this report has been signed below by the following persons on behalf of the registrant and in the capacities and on the dates indicated.
64
By: /s/ Thomas P. McGuinness Name: Thomas P. McGuinness
President and Chief Executive Officer (Principal Executive Officer)
Date: March 7, 2018
Signature Title Date
By: /s/ Thomas P. McGuinness President and Chief Executive Officer (Principal Executive Officer) March 7, 2018
Name: Thomas P. McGuinness
By: /s/ Michael E. Podboy Executive Vice President, Chief Financial Officer, Chief Investment Officer and Treasurer (Principal Financial Officer)
March 7, 2018
Name: Michael E. Podboy
By: /s/ Adam M. Jaworski Senior Vice President, Chief Accounting Officer (Principal Accounting Officer) March 7, 2018
Name: Adam M. Jaworski
By: /s/ Stuart Aitken Director March 7, 2018
Name: Stuart Aitken
By: /s/ Thomas F. Glavin Director March 7, 2018
Name: Thomas F. Glavin
By: /s/ Scott A. Nelson Director March 7, 2018
Name: Scott A. Nelson
By: /s/ Paula J. Saban Director March 7, 2018
Name: Paula J. Saban
By: /s/ Michael A. Stein Director March 7, 2018
Name: Michael A. Stein
By: /s/ Julian E. Whitehurst Director March 7, 2018
Name: Julian E. Whitehurst
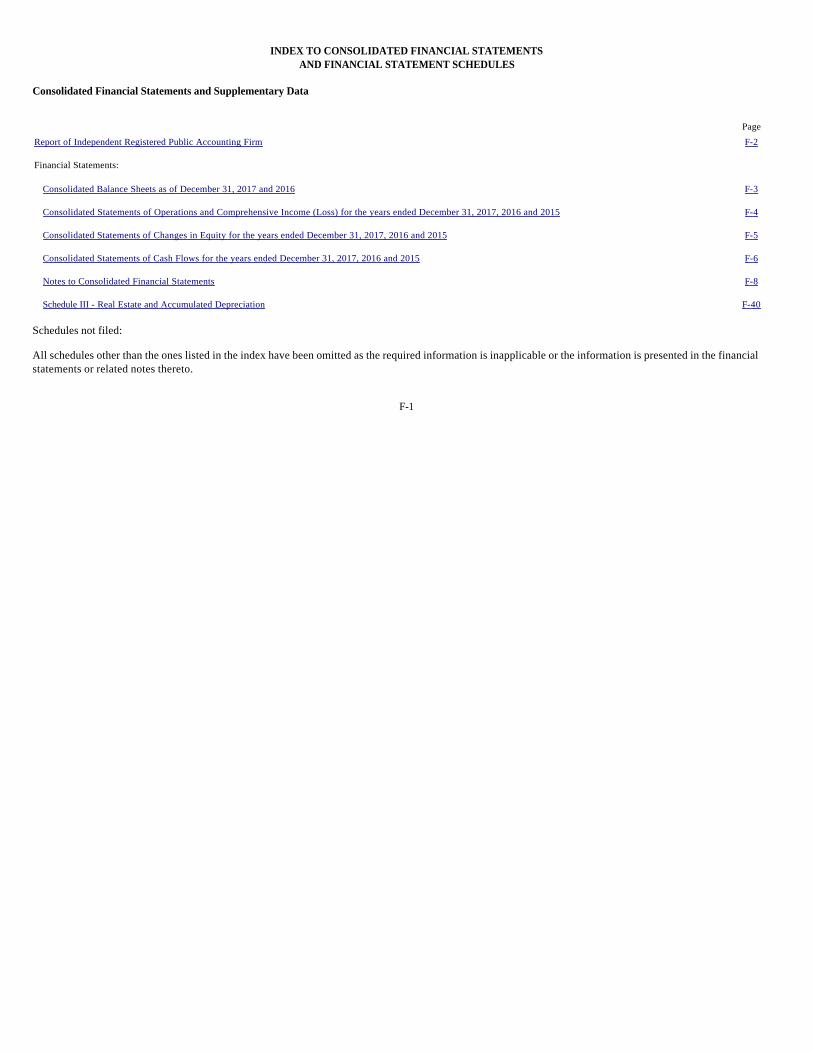
INDEX TO CONSOLIDATED FINANCIAL STATEMENTS
AND FINANCIAL STATEMENT SCHEDULES Consolidated Financial Statements and Supplementary Data
Schedules not filed:
All schedules other than the ones listed in the index have been omitted as the required information is inapplicable or the information is presented in the financial statements or related notes thereto.
F-1
Page
Report of Independent Registered Public Accounting Firm F-2
Financial Statements:
Consolidated Balance Sheets as of December 31, 2017 and 2016 F-3
Consolidated Statements of Operations and Comprehensive Income (Loss) for the years ended December 31, 2017, 2016 and 2015 F-4
Consolidated Statements of Changes in Equity for the years ended December 31, 2017, 2016 and 2015 F-5
Consolidated Statements of Cash Flows for the years ended December 31, 2017, 2016 and 2015 F-6
Notes to Consolidated Financial Statements F-8
Schedule III - Real Estate and Accumulated Depreciation F-40

Report of Independent Registered Public Accounting Firm
To the Stockholders and Board of Directors
InvenTrust Properties Corp.:
Opinion on the Consolidated Financial Statements
We have audited the accompanying consolidated balance sheets of InvenTrust Properties Corp. and subsidiaries (the "Company") as of December 31, 2017 and 2016, the related consolidated statements of operations and comprehensive income (loss), changes in equity, and cash flows for each of the years in the three-year period ended December 31, 2017, and the related notes and financial statement schedule III (collectively, the "consolidated financial statements"). In our opinion, the consolidated financial statements present fairly, in all material respects, the financial position of the Company as of December 31, 2017 and 2016, and the results of its operations and its cash flows for each of the years in the three-year period ended December 31, 2017, in conformity with U.S. generally accepted accounting principles.
Basis for Opinion
These consolidated financial statements are the responsibility of the Company’s management. Our responsibility is to express an opinion on these consolidated financial statements based on our audits. We are a public accounting firm registered with the Public Company Accounting Oversight Board (United States) ("PCAOB") and are required to be independent with respect to the Company in accordance with the U.S. federal securities laws and the applicable rules and regulations of the Securities and Exchange Commission and the PCAOB.
We conducted our audits in accordance with the standards of the PCAOB. Those standards require that we plan and perform the audit to obtain reasonable assurance about whether the consolidated financial statements are free of material misstatement, whether due to error or fraud. The Company is not required to have, nor were we engaged to perform, an audit of its internal control over financial reporting. As part of our audits, we are required to obtain an understanding of internal control over financial reporting but not for the purpose of expressing an opinion on the effectiveness of the Company’s internal control over financial reporting. Accordingly, we express no such opinion.
Our audits included performing procedures to assess the risks of material misstatement of the consolidated financial statements, whether due to error or fraud, and performing procedures that respond to those risks. Such procedures included examining, on a test basis, evidence regarding the amounts and disclosures in the consolidated financial statements. Our audits also included evaluating the accounting principles used and significant estimates made by management, as well as evaluating the overall presentation of the consolidated financial statements. We believe that our audits provide a reasonable basis for our opinion.
/s/ KPMG LLP
We have served as the Company’s auditor since 2005.
Chicago, Illinois March 7, 2018
F-2
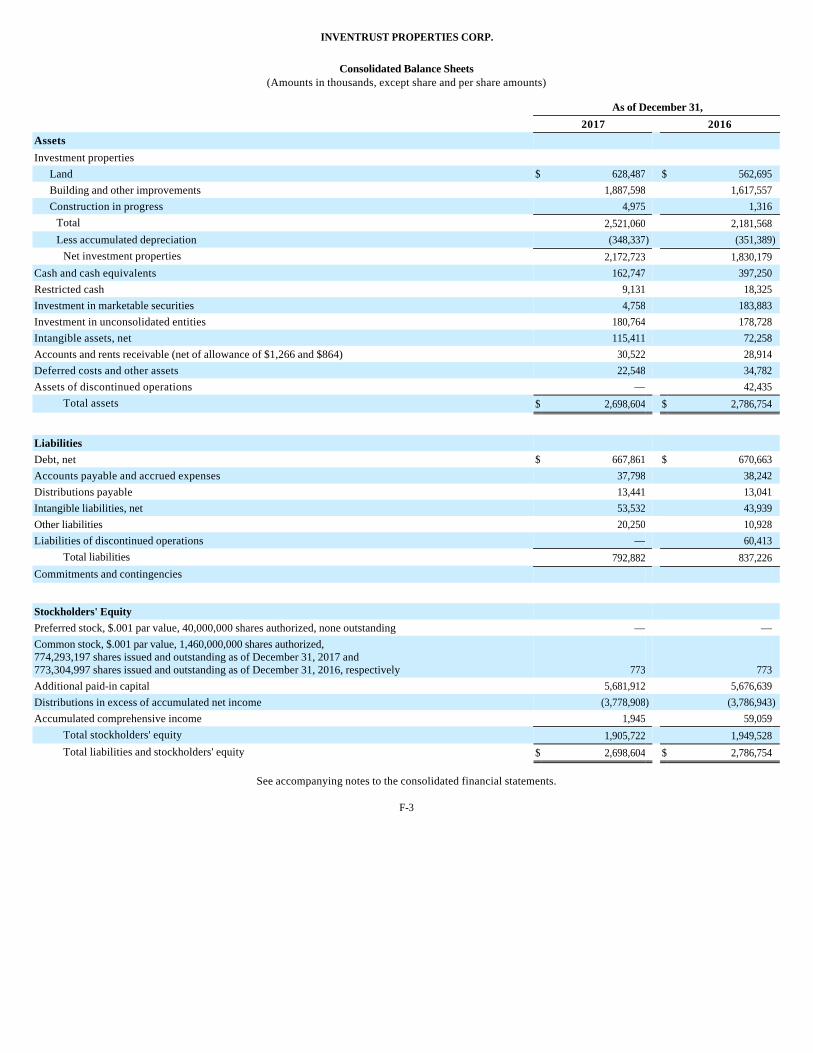
INVENTRUST PROPERTIES CORP.
Consolidated Balance Sheets (Amounts in thousands, except share and per share amounts)
See accompanying notes to the consolidated financial statements.
F-3
As of December 31,
2017 2016
Assets
Investment properties
Land $ 628,487 $ 562,695 Building and other improvements 1,887,598 1,617,557 Construction in progress 4,975 1,316
Total 2,521,060 2,181,568 Less accumulated depreciation (348,337 ) (351,389 )
Net investment properties 2,172,723 1,830,179 Cash and cash equivalents 162,747 397,250 Restricted cash 9,131 18,325 Investment in marketable securities 4,758 183,883 Investment in unconsolidated entities 180,764 178,728 Intangible assets, net 115,411 72,258 Accounts and rents receivable (net of allowance of $1,266 and $864) 30,522 28,914 Deferred costs and other assets 22,548 34,782 Assets of discontinued operations — 42,435
Total assets $ 2,698,604 $ 2,786,754
Liabilities
Debt, net $ 667,861 $ 670,663 Accounts payable and accrued expenses 37,798 38,242 Distributions payable 13,441 13,041 Intangible liabilities, net 53,532 43,939 Other liabilities 20,250 10,928 Liabilities of discontinued operations — 60,413
Total liabilities 792,882 837,226 Commitments and contingencies
Stockholders' Equity
Preferred stock, $.001 par value, 40,000,000 shares authorized, none outstanding — — Common stock, $.001 par value, 1,460,000,000 shares authorized, 774,293,197 shares issued and outstanding as of December 31, 2017 and 773,304,997 shares issued and outstanding as of December 31, 2016, respectively 773 773 Additional paid-in capital 5,681,912 5,676,639 Distributions in excess of accumulated net income (3,778,908 ) (3,786,943 )
Accumulated comprehensive income 1,945 59,059 Total stockholders' equity 1,905,722 1,949,528 Total liabilities and stockholders' equity $ 2,698,604 $ 2,786,754
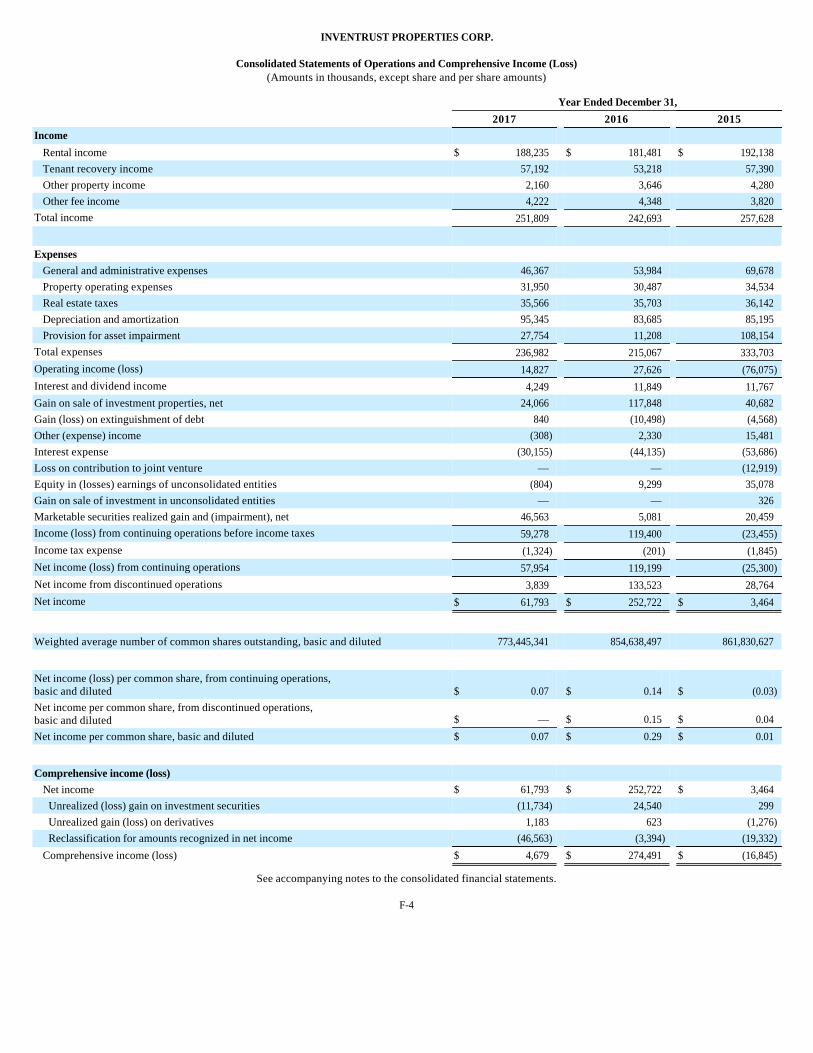
INVENTRUST PROPERTIES CORP.
Consolidated Statements of Operations and Comprehensive Income (Loss) (Amounts in thousands, except share and per share amounts)
See accompanying notes to the consolidated financial statements.
F-4
Year Ended December 31,
2017 2016 2015
Income
Rental income $ 188,235 $ 181,481 $ 192,138 Tenant recovery income 57,192 53,218 57,390 Other property income 2,160 3,646 4,280 Other fee income 4,222 4,348 3,820
Total income 251,809 242,693 257,628
Expenses
General and administrative expenses 46,367 53,984 69,678 Property operating expenses 31,950 30,487 34,534 Real estate taxes 35,566 35,703 36,142 Depreciation and amortization 95,345 83,685 85,195 Provision for asset impairment 27,754 11,208 108,154
Total expenses 236,982 215,067 333,703 Operating income (loss) 14,827 27,626 (76,075 )
Interest and dividend income 4,249 11,849 11,767 Gain on sale of investment properties, net 24,066 117,848 40,682 Gain (loss) on extinguishment of debt 840 (10,498 ) (4,568 )
Other (expense) income (308 ) 2,330 15,481 Interest expense (30,155 ) (44,135 ) (53,686 )
Loss on contribution to joint venture — — (12,919 )
Equity in (losses) earnings of unconsolidated entities (804 ) 9,299 35,078 Gain on sale of investment in unconsolidated entities — — 326 Marketable securities realized gain and (impairment), net 46,563 5,081 20,459 Income (loss) from continuing operations before income taxes 59,278 119,400 (23,455 )
Income tax expense (1,324 ) (201 ) (1,845 )
Net income (loss) from continuing operations 57,954 119,199 (25,300 )
Net income from discontinued operations 3,839 133,523 28,764 Net income $ 61,793 $ 252,722 $ 3,464
Weighted average number of common shares outstanding, basic and diluted 773,445,341 854,638,497 861,830,627
Net income (loss) per common share, from continuing operations, basic and diluted $ 0.07 $ 0.14 $ (0.03 )
Net income per common share, from discontinued operations, basic and diluted $ — $ 0.15 $ 0.04 Net income per common share, basic and diluted $ 0.07 $ 0.29 $ 0.01
Comprehensive income (loss)
Net income $ 61,793 $ 252,722 $ 3,464 Unrealized (loss) gain on investment securities (11,734 ) 24,540 299 Unrealized gain (loss) on derivatives 1,183 623 (1,276 )
Reclassification for amounts recognized in net income (46,563 ) (3,394 ) (19,332 )
Comprehensive income (loss) $ 4,679 $ 274,491 $ (16,845 )
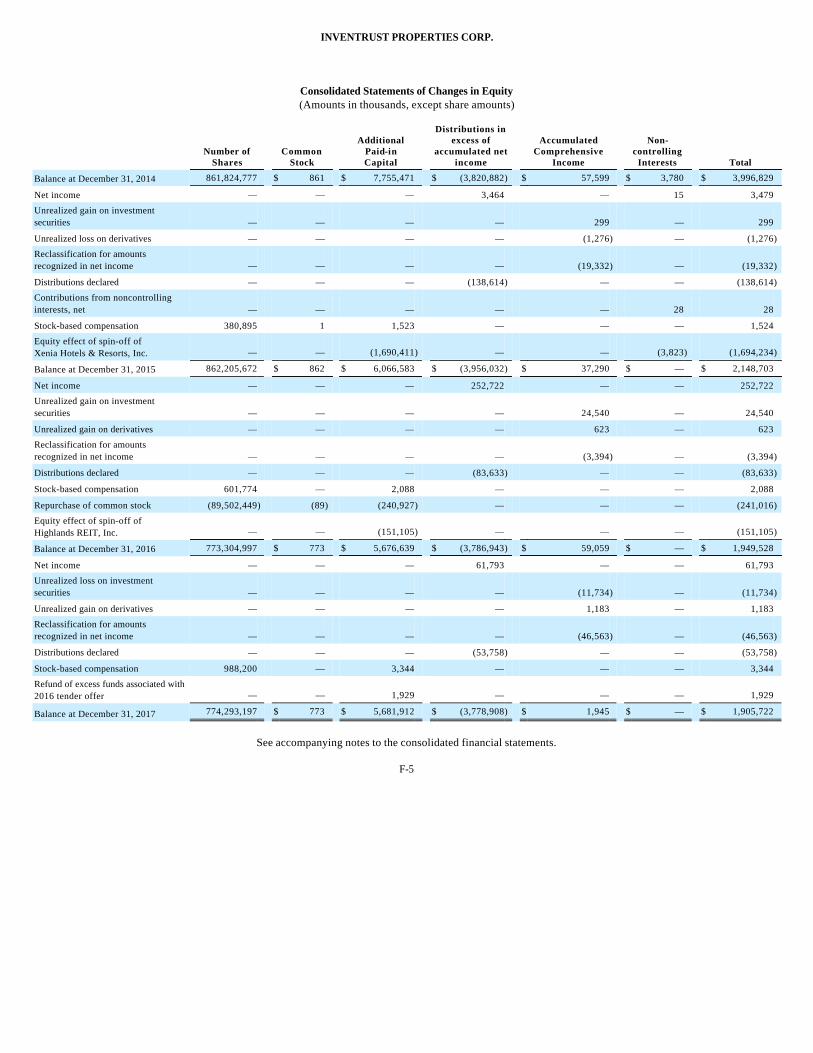
INVENTRUST PROPERTIES CORP.
Consolidated Statements of Changes in Equity (Amounts in thousands, except share amounts)
See accompanying notes to the consolidated financial statements.
F-5
Number of
Shares Common
Stock
Additional Paid-in Capital
Distributions in excess of
accumulated net income
Accumulated Comprehensive
Income
Non-controlling
Interests Total
Balance at December 31, 2014 861,824,777 $ 861 $ 7,755,471 $ (3,820,882) $ 57,599 $ 3,780 $ 3,996,829 Net income — — — 3,464 — 15 3,479 Unrealized gain on investment securities — — — — 299 — 299 Unrealized loss on derivatives — — — — (1,276) — (1,276)
Reclassification for amounts recognized in net income — — — — (19,332) — (19,332)
Distributions declared — — — (138,614) — — (138,614)
Contributions from noncontrolling interests, net — — — — — 28 28 Stock-based compensation 380,895 1 1,523 — — — 1,524 Equity effect of spin-off of Xenia Hotels & Resorts, Inc. — — (1,690,411) — — (3,823) (1,694,234)
Balance at December 31, 2015 862,205,672 $ 862 $ 6,066,583 $ (3,956,032) $ 37,290 $ — $ 2,148,703 Net income — — — 252,722 — — 252,722 Unrealized gain on investment securities — — — — 24,540 — 24,540 Unrealized gain on derivatives — — — — 623 — 623 Reclassification for amounts recognized in net income — — — — (3,394) — (3,394)
Distributions declared — — — (83,633) — — (83,633)
Stock-based compensation 601,774 — 2,088 — — — 2,088 Repurchase of common stock (89,502,449) (89) (240,927) — — — (241,016)
Equity effect of spin-off of Highlands REIT, Inc. — — (151,105) — — — (151,105)
Balance at December 31, 2016 773,304,997 $ 773 $ 5,676,639 $ (3,786,943) $ 59,059 $ — $ 1,949,528 Net income — — — 61,793 — — 61,793 Unrealized loss on investment securities — — — — (11,734) — (11,734)
Unrealized gain on derivatives — — — — 1,183 — 1,183 Reclassification for amounts recognized in net income — — — — (46,563) — (46,563)
Distributions declared — — — (53,758) — — (53,758)
Stock-based compensation 988,200 — 3,344 — — — 3,344 Refund of excess funds associated with 2016 tender offer — — 1,929 — — — 1,929
Balance at December 31, 2017 774,293,197 $ 773 $ 5,681,912 $ (3,778,908) $ 1,945 $ — $ 1,905,722
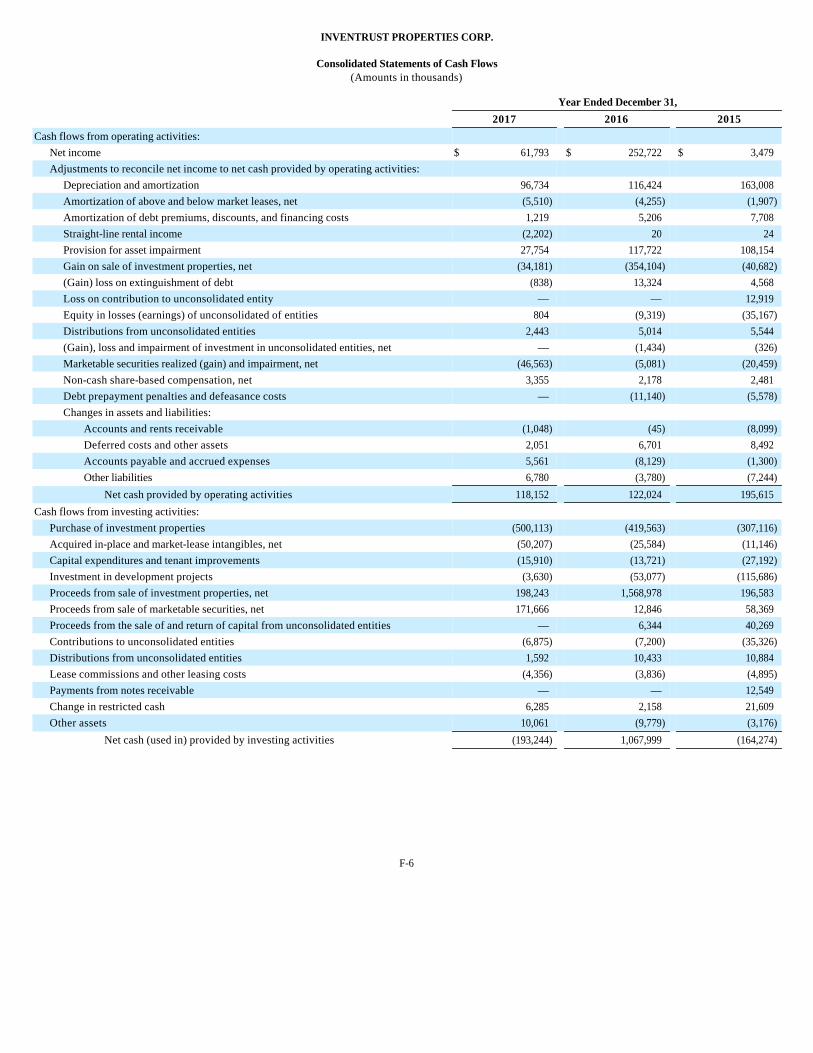
INVENTRUST PROPERTIES CORP.
Consolidated Statements of Cash Flows (Amounts in thousands)
F-6
Year Ended December 31,
2017 2016 2015
Cash flows from operating activities:
Net income $ 61,793 $ 252,722 $ 3,479 Adjustments to reconcile net income to net cash provided by operating activities:
Depreciation and amortization 96,734 116,424 163,008 Amortization of above and below market leases, net (5,510) (4,255) (1,907)
Amortization of debt premiums, discounts, and financing costs 1,219 5,206 7,708 Straight-line rental income (2,202) 20 24 Provision for asset impairment 27,754 117,722 108,154 Gain on sale of investment properties, net (34,181) (354,104) (40,682)
(Gain) loss on extinguishment of debt (838) 13,324 4,568 Loss on contribution to unconsolidated entity — — 12,919 Equity in losses (earnings) of unconsolidated of entities 804 (9,319) (35,167)
Distributions from unconsolidated entities 2,443 5,014 5,544 (Gain), loss and impairment of investment in unconsolidated entities, net — (1,434) (326)
Marketable securities realized (gain) and impairment, net (46,563) (5,081) (20,459)
Non-cash share-based compensation, net 3,355 2,178 2,481 Debt prepayment penalties and defeasance costs — (11,140) (5,578)
Changes in assets and liabilities:
Accounts and rents receivable (1,048) (45) (8,099)
Deferred costs and other assets 2,051 6,701 8,492 Accounts payable and accrued expenses 5,561 (8,129) (1,300)
Other liabilities 6,780 (3,780) (7,244)
Net cash provided by operating activities 118,152 122,024 195,615 Cash flows from investing activities:
Purchase of investment properties (500,113) (419,563) (307,116)
Acquired in-place and market-lease intangibles, net (50,207) (25,584) (11,146)
Capital expenditures and tenant improvements (15,910) (13,721) (27,192)
Investment in development projects (3,630) (53,077) (115,686)
Proceeds from sale of investment properties, net 198,243 1,568,978 196,583 Proceeds from sale of marketable securities, net 171,666 12,846 58,369 Proceeds from the sale of and return of capital from unconsolidated entities — 6,344 40,269 Contributions to unconsolidated entities (6,875) (7,200) (35,326)
Distributions from unconsolidated entities 1,592 10,433 10,884 Lease commissions and other leasing costs (4,356) (3,836) (4,895)
Payments from notes receivable — — 12,549 Change in restricted cash 6,285 2,158 21,609 Other assets 10,061 (9,779) (3,176)
Net cash (used in) provided by investing activities (193,244) 1,067,999 (164,274)
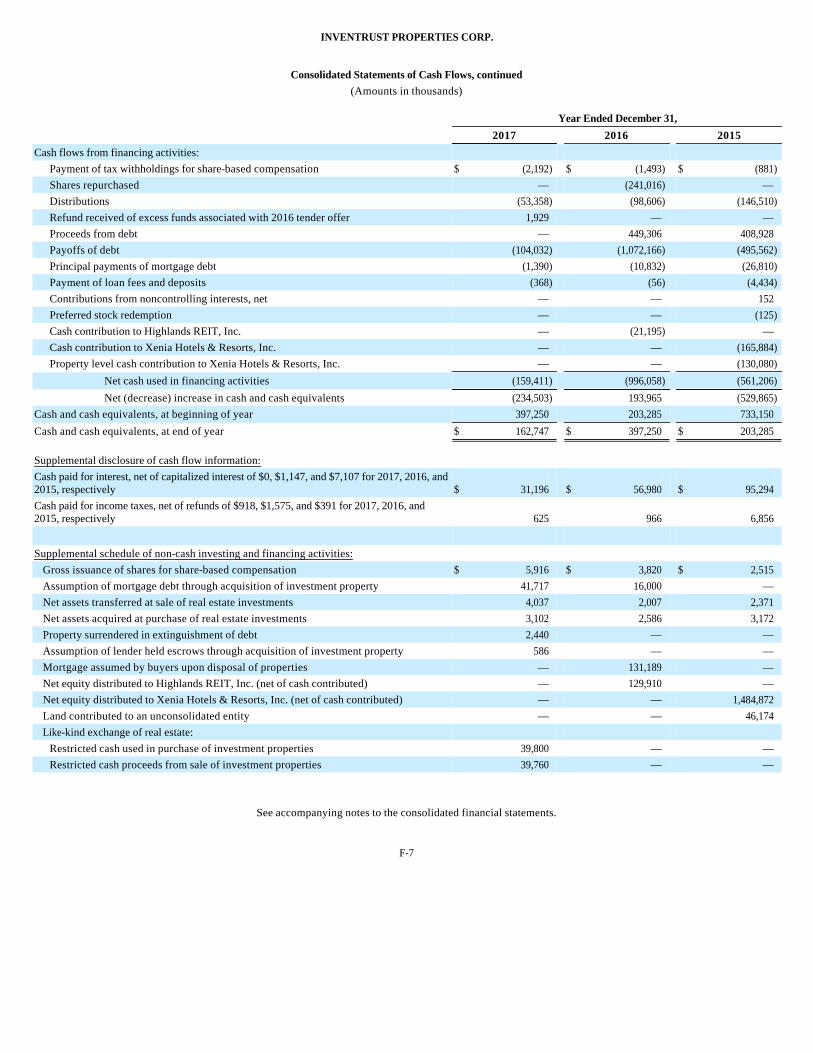
INVENTRUST PROPERTIES CORP.
See accompanying notes to the consolidated financial statements.
F-7
Consolidated Statements of Cash Flows, continued
(Amounts in thousands)
Year Ended December 31,
2017 2016 2015
Cash flows from financing activities:
Payment of tax withholdings for share-based compensation $ (2,192) $ (1,493) $ (881)
Shares repurchased — (241,016) — Distributions (53,358) (98,606) (146,510)
Refund received of excess funds associated with 2016 tender offer 1,929 — — Proceeds from debt — 449,306 408,928 Payoffs of debt (104,032) (1,072,166) (495,562)
Principal payments of mortgage debt (1,390) (10,832) (26,810)
Payment of loan fees and deposits (368) (56) (4,434)
Contributions from noncontrolling interests, net — — 152 Preferred stock redemption — — (125)
Cash contribution to Highlands REIT, Inc. — (21,195) — Cash contribution to Xenia Hotels & Resorts, Inc. — — (165,884)
Property level cash contribution to Xenia Hotels & Resorts, Inc. — — (130,080)
Net cash used in financing activities (159,411) (996,058) (561,206)
Net (decrease) increase in cash and cash equivalents (234,503) 193,965 (529,865)
Cash and cash equivalents, at beginning of year 397,250 203,285 733,150 Cash and cash equivalents, at end of year $ 162,747 $ 397,250 $ 203,285
Supplemental disclosure of cash flow information:
Cash paid for interest, net of capitalized interest of $0, $1,147, and $7,107 for 2017, 2016, and 2015, respectively $ 31,196 $ 56,980 $ 95,294 Cash paid for income taxes, net of refunds of $918, $1,575, and $391 for 2017, 2016, and 2015, respectively 625 966 6,856
Supplemental schedule of non-cash investing and financing activities:
Gross issuance of shares for share-based compensation $ 5,916 $ 3,820 $ 2,515 Assumption of mortgage debt through acquisition of investment property 41,717 16,000 — Net assets transferred at sale of real estate investments 4,037 2,007 2,371 Net assets acquired at purchase of real estate investments 3,102 2,586 3,172 Property surrendered in extinguishment of debt 2,440 — — Assumption of lender held escrows through acquisition of investment property 586 — — Mortgage assumed by buyers upon disposal of properties — 131,189 — Net equity distributed to Highlands REIT, Inc. (net of cash contributed) — 129,910 — Net equity distributed to Xenia Hotels & Resorts, Inc. (net of cash contributed) — — 1,484,872 Land contributed to an unconsolidated entity — — 46,174 Like-kind exchange of real estate:
Restricted cash used in purchase of investment properties 39,800 — — Restricted cash proceeds from sale of investment properties 39,760 — —
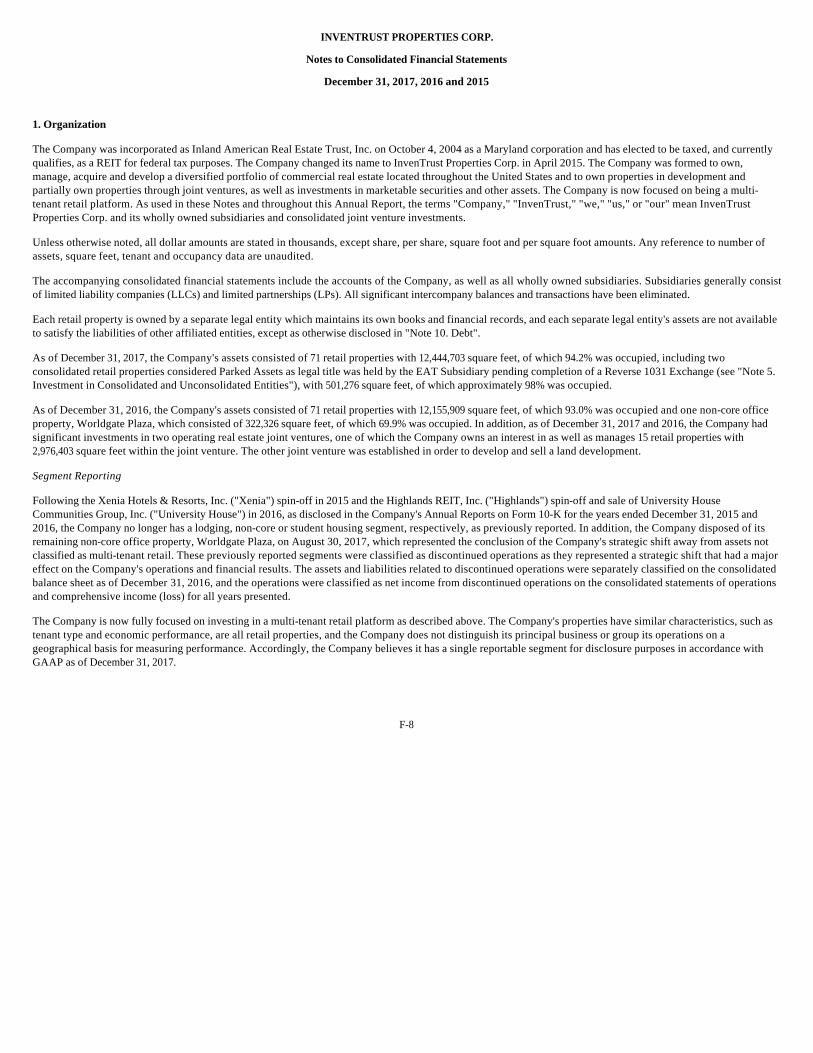
INVENTRUST PROPERTIES CORP.
Notes to Consolidated Financial Statements
December 31, 2017, 2016 and 2015
1. Organization
The Company was incorporated as Inland American Real Estate Trust, Inc. on October 4, 2004 as a Maryland corporation and has elected to be taxed, and currently qualifies, as a REIT for federal tax purposes. The Company changed its name to InvenTrust Properties Corp. in April 2015. The Company was formed to own, manage, acquire and develop a diversified portfolio of commercial real estate located throughout the United States and to own properties in development and partially own properties through joint ventures, as well as investments in marketable securities and other assets. The Company is now focused on being a multi-tenant retail platform. As used in these Notes and throughout this Annual Report, the terms "Company," "InvenTrust," "we," "us," or "our" mean InvenTrust Properties Corp. and its wholly owned subsidiaries and consolidated joint venture investments.
Unless otherwise noted, all dollar amounts are stated in thousands, except share, per share, square foot and per square foot amounts. Any reference to number of assets, square feet, tenant and occupancy data are unaudited.
The accompanying consolidated financial statements include the accounts of the Company, as well as all wholly owned subsidiaries. Subsidiaries generally consist of limited liability companies (LLCs) and limited partnerships (LPs). All significant intercompany balances and transactions have been eliminated.
Each retail property is owned by a separate legal entity which maintains its own books and financial records, and each separate legal entity's assets are not available to satisfy the liabilities of other affiliated entities, except as otherwise disclosed in "Note 10. Debt".
As of December 31, 2017, the Company's assets consisted of 71 retail properties with 12,444,703 square feet, of which 94.2% was occupied, including two consolidated retail properties considered Parked Assets as legal title was held by the EAT Subsidiary pending completion of a Reverse 1031 Exchange (see "Note 5. Investment in Consolidated and Unconsolidated Entities"), with 501,276 square feet, of which approximately 98% was occupied.
As of December 31, 2016, the Company's assets consisted of 71 retail properties with 12,155,909 square feet, of which 93.0% was occupied and one non-core office property, Worldgate Plaza, which consisted of 322,326 square feet, of which 69.9% was occupied. In addition, as of December 31, 2017 and 2016, the Company had significant investments in two operating real estate joint ventures, one of which the Company owns an interest in as well as manages 15 retail properties with 2,976,403 square feet within the joint venture. The other joint venture was established in order to develop and sell a land development.
Segment Reporting
Following the Xenia Hotels & Resorts, Inc. ("Xenia") spin-off in 2015 and the Highlands REIT, Inc. ("Highlands") spin-off and sale of University House Communities Group, Inc. ("University House") in 2016, as disclosed in the Company's Annual Reports on Form 10-K for the years ended December 31, 2015 and 2016, the Company no longer has a lodging, non-core or student housing segment, respectively, as previously reported. In addition, the Company disposed of its remaining non-core office property, Worldgate Plaza, on August 30, 2017, which represented the conclusion of the Company's strategic shift away from assets not classified as multi-tenant retail. These previously reported segments were classified as discontinued operations as they represented a strategic shift that had a major effect on the Company's operations and financial results. The assets and liabilities related to discontinued operations were separately classified on the consolidated balance sheet as of December 31, 2016, and the operations were classified as net income from discontinued operations on the consolidated statements of operations and comprehensive income (loss) for all years presented.
The Company is now fully focused on investing in a multi-tenant retail platform as described above. The Company's properties have similar characteristics, such as tenant type and economic performance, are all retail properties, and the Company does not distinguish its principal business or group its operations on a geographical basis for measuring performance. Accordingly, the Company believes it has a single reportable segment for disclosure purposes in accordance with GAAP as of December 31, 2017.
F-8
INVENTRUST PROPERTIES CORP.
Notes to Consolidated Financial Statements
December 31, 2017, 2016 and 2015
2. Basis of Presentation and Summary of Significant Accounting Policies
The accompanying consolidated financial statements reflect the consolidated financial position of the Company as of December 31, 2017 and 2016 and the consolidated results of its operations and cash flows for the years ended December 31, 2017, 2016 and 2015. These consolidated financial statements have been prepared in accordance with GAAP, which requires management to make estimates and assumptions that affect the reported amounts of assets and liabilities and disclosure of contingent assets and liabilities at the date of the consolidated financial statements and the reported amounts of revenues and expenses during the reporting periods. Significant estimates, judgments and assumptions are required in a number of areas, including, but not limited to, evaluating the impairment of long-lived assets, allocating the purchase price of acquired assets, determining the fair value of debt and evaluating the collectability of accounts receivable. The Company bases these estimates, judgments and assumptions on historical experience and various other factors that the Company believes to be reasonable under the circumstances. Actual results may differ from these estimates.
Reclassifications
Certain reclassifications have been made to the consolidated balance sheet as of December 31, 2016 and the consolidated statements of operations and comprehensive income (loss) for the years ended December 31, 2016 and 2015 to reflect the results of Worldgate Plaza (sold on August 30, 2017), Highlands (spun off on April 28, 2016), and University House (sold on June 21, 2016) as discontinued operations.
Certain reclassifications have been made to the consolidated statements of cash flows for the years ended December 31, 2016 and 2015 to classify cash remitted for payment of tax withholdings for share-based compensation from a change in accounts payable and accrued expenses to payment of tax withholdings for share-based compensation of $1,493 and $881, respectively.
Consolidation
The Company evaluates its investments in LLCs and LPs to determine whether each such entity may be a VIE. If the entity is a VIE, the determination of whether the Company is the primary beneficiary must be made. The primary beneficiary determination is based on a qualitative assessment as to whether the Company has (i) power to direct significant activities of the VIE and (ii) an obligation to absorb losses or the right to receive benefits that could be potentially significant to the VIE. The Company will consolidate a VIE if it is deemed to be the primary beneficiary, as defined in FASB ASC 810, Consolidation. The equity method of accounting is applied to entities in which the Company is not the primary beneficiary as defined in FASB ASC 810, or the entity is not a VIE and the Company does not have effective control, but can exercise influence over the entity with respect to its operations and major decisions. Investments in entities that the Company does not control and over which it does not exercise significant influence are carried at the lower of cost or estimated fair value, as appropriate. The Company’s ability to correctly assess control over an entity affects the presentation of these investments in the Company’s consolidated financial statements.
At December 31, 2017, the Company holds an investment in River Oaks and Kyle Marketplace which are each deemed to be a VIE. The Company was deemed to be the primary beneficiary as it has the ability to direct the activities of the entity that most significantly impact its economic performance and has all of the risks and rewards of ownership. Accordingly, the Company has consolidated each VIE.
At December 31, 2017, the Company holds an investment in a property consisting of wholly owned multi-tenant retail space and an undivided interest in certain common elements as tenants-in-common. The ownership of the common elements were deemed to not be subject to joint control, as the other tenant-in-common lacked the ability to effectively participate in the decisions that most significantly impact economic performance. Accordingly, the Company has applied proportionate consolidation of the common elements. All intercompany transactions and balances have been eliminated in consolidation.
At December 31, 2016, the Company did not have an investment in a VIE in which the Company was the primary beneficiary.
Real Estate
The Company allocates the purchase price of real estate to land, building, other building improvements, tenant improvements, and intangible assets and liabilities (such as the value of above- and below-market leases, in-place leases and origination costs associated with in-place leases). The values of above- and below-market leases are recorded as intangible assets, net, and intangible liabilities, net, respectively, in the consolidated balance sheets, and are amortized as either a decrease (in the case of
F-9
INVENTRUST PROPERTIES CORP.
Notes to Consolidated Financial Statements
December 31, 2017, 2016 and 2015
above-market leases) or an increase (in the case of below-market leases) to rental income over the remaining term of the associated tenant lease. The values, if any, associated with in-place leases are recorded in intangible assets, net in the consolidated balance sheets and are amortized to depreciation and amortization expense in the consolidated statements of operations and comprehensive income (loss) over the remaining lease term.
The difference between the contractual rental rates and the Company’s estimate of market rental rates is measured over a period equal to the remaining non-cancelable term of the leases, including significantly below-market renewal options. For the amortization period, the remaining term of leases with renewal options at terms below market reflect the assumed exercise of such below-market renewal options, if reasonably assured.
If a tenant vacates its space prior to the contractual expiration of the lease and no rental payments are being made on the lease, any unamortized balance of the related intangible asset or liability is written off. Tenant improvements are depreciated and origination costs are amortized over the remaining term of the lease or charged against earnings if the lease is terminated prior to its contractual expiration date.
The Company performs, with the assistance of a third-party valuation specialist, the following procedures for assets the Company acquires:
Prior to the Company's adoption of FASB ASU No. 2017-01, Clarifying the Definition of a Business (see Recently Adopted Accounting Pronouncements for details), all costs related to finding, analyzing and negotiating a transaction were expensed as incurred as a general and administrative expense in the consolidated statements of operations and comprehensive income (loss), whether or not the acquisition was completed. Beginning with assets acquired during the fourth quarter of 2016, the Company began capitalizing acquisition costs of completed transactions in accordance with ASU No. 2017-01 to the extent its acquisitions qualify as asset acquisitions under this guidance.
For acquisitions deemed to be business combinations, the allocation of consideration exchanged to the assets acquired and liabilities assumed is based on the Company’s preliminary estimates and is subject to change based on the final determination of the estimated fair value attributable to the acquired assets and assumed liabilities at the time the acquisition is consummated. This time frame is referred to as the measurement period. The asset acquisition guidance does not address the concept of a measurement period, and therefore the Company does not apply a measurement period for acquisitions qualifying as asset acquisitions under this guidance.
The Company recognizes gains and losses from sales of investment properties and land at the time of sale using the full accrual method when the following criteria are met: sales are consummated; usual risks and rewards of ownership have been transferred to buyers; the Company has no substantial continuing involvement with the property; and any sales related receivables are not subject to future subordination. If these criteria are not all met, the Company defers the gains and recognize them when the criteria are met. If the full accrual method is not followed, the Company uses either the installment, deposit or cost recovery methods, as appropriate in the circumstances.
F-10
• Estimate the value of the property "as if vacant" as of the acquisition date;
• Allocate the value of the property among land, building, and other building improvements and determine the associated useful life for each;
• Calculate the value and associated life of above- and below-market leases on a tenant-by-tenant basis. The difference between the contractual rental rates and the Company’s estimate of market rental rates is measured over a period equal to the remaining term of the leases (using a discount rate which reflects the risks associated with the leases acquired, including geographical location, size of leased area, tenant profile and credit risk);
• Estimate the fair value of the tenant improvements, legal costs and leasing commissions incurred to obtain the leases and calculate the associated useful life for each;
• Estimate the fair value of assumed debt, if any; and
• Estimate the intangible value of the in-place leases based on lease execution costs of similar leases as well as lost rent payments during an assumed lease-up period and their associated useful lives on a tenant-by-tenant basis.
INVENTRUST PROPERTIES CORP.
Notes to Consolidated Financial Statements
December 31, 2017, 2016 and 2015
Cash and Cash Equivalents
The Company considers all demand deposits, money market accounts and investments in certificates of deposit and repurchase agreements purchased with a maturity of three months or less, at the date of purchase, to be cash equivalents. The combined account balances held by the Company at one or more institutions periodically exceed the FDIC insurance coverage and, as a result, there is credit risk related to amounts on deposit in excess of FDIC insurance coverage. The Company believes that the risk is not significant, as the Company does not anticipate that financial institutions it uses will not perform.
Restricted Cash
Restricted cash is primarily comprised of amounts related to loan origination (escrow deposits), operating real estate (escrows for taxes, insurance, capital expenditures and payments required under certain lease agreements), and post-acquisition escrows.
Investment Properties Held for Sale
In determining whether to classify an investment property as held for sale, the Company considers whether: (i) management has committed to a plan to sell the investment property; (ii) the investment property is available for immediate sale, in its present condition; (iii) the Company has initiated a program to locate a buyer; (iv) the Company believes that the sale of the investment property is probable; (v) the Company has received a significant non-refundable deposit for the purchase of the property; (vi) the Company is actively marketing the investment property for sale at a price that is reasonable in relation to its estimated fair value; and (vii) actions required for the Company to complete the plan indicate that it is unlikely that any significant changes will be made to the plan.
If all of the above criteria are met, the Company classifies the investment property as held for sale. When these criteria are met, the Company suspends depreciation on the investment properties held for sale, including depreciation for tenant improvements and additions, as well as the amortization of acquired in-place leases. The properties held for sale and associated liabilities are classified separately on the consolidated balance sheets. Such properties are recorded at the lesser of the carrying value or estimated fair value less costs to sell. Additionally, if the sale represents a strategic shift that has (or will have) a major effect on the entity's results and operations, the operations for the periods presented are classified on the consolidated statements of operations and comprehensive income (loss) as discontinued operations for all periods presented.
Impairment of Long Lived Assets
The Company assesses the carrying values of the respective long-lived assets, whenever events or changes in circumstances indicate that the carrying amounts of these assets may not be fully recoverable, such as a reduction in the expected holding period of the asset. If it is determined that the carrying value is not recoverable because the expected undiscounted cash flows do not exceed carrying value, the Company records an impairment loss to the extent that the carrying value exceeds estimated fair value. The valuation and possible subsequent impairment of investment properties is a significant estimate that can and does change based on the Company's continuous process of analyzing each property's economic condition at a point in time and reviewing assumptions about uncertain inherent factors, including observable inputs such as contractual revenues and unobservable inputs such as forecasted revenues and expenses and estimated net disposition proceeds. These unobservable inputs are based on market conditions and the Company's expected growth rates.
However, assumptions and estimates about future cash flows and capitalization rates are complex and subjective. Changes in economic and operating conditions and the Company’s ultimate investment intent that occur subsequent to the impairment analyses could impact these assumptions and result in future or additional impairment charges of the real estate properties.
On a periodic basis, management assesses whether there are any indicators that the carrying value of the Company’s investments in unconsolidated entities may be other than temporarily impaired. To the extent impairment has occurred, the loss is measured as the excess of the carrying value of the investment over the estimated fair value of the investment. The estimated fair value of the underlying investment includes a review of expected cash flows generated from operations of the property.
Real Estate Capitalization and Depreciation
Real estate is reflected at cost less accumulated depreciation within investment property on the consolidated balance sheet. Ordinary repairs and maintenance are expensed as incurred.
F-11
INVENTRUST PROPERTIES CORP.
Notes to Consolidated Financial Statements
December 31, 2017, 2016 and 2015
Depreciation expense is computed using the straight line method. Building within investment property on the consolidated balance sheet is depreciated based upon an estimated useful life of 30 years, and 5-15 years for furniture, fixtures and equipment and site improvements within other improvements in building and other improvements on the consolidated balance sheet. The estimated useful lives of our assets is a subjective assessment.
Tenant improvements are amortized on a straight line basis over the lesser of the life of the tenant improvement or the lease term as a component of depreciation and amortization expense on the consolidated statement of operations.
Direct and indirect costs that are clearly related to the construction and improvements of investment properties are capitalized. Costs incurred for property taxes and insurance are capitalized during periods in which activities necessary to get the property ready for its intended use are in progress. Interest costs, if significant, are also capitalized during such periods. Additionally, the Company treats investments accounted for by the equity method as assets qualifying for interest capitalization provided (1) the investee has activities in progress necessary to commence its planned principal operations and (2) the investee’s activities include the use of such funds to acquire qualifying assets.
The Company makes subjective assessments as to the useful lives of the Company’s assets. These assessments have a direct impact on the Company’s results of operations. Should the Company lengthen the expected useful life of an asset, it would be depreciated over a longer period, resulting in less annual depreciation expense and higher annual net income. Should the Company shorten the expected useful life of an asset, it would be depreciated over a shorter period resulting in more annual depreciation expense and lower annual net income.
Derivative Instruments
In the normal course of business, the Company is exposed to the effect of interest rate changes. The Company limits these risks by following established risk management policies and procedures including the use of derivatives to hedge interest rate risk on debt instruments.
The Company has a policy of only entering into contracts with established financial institutions based upon their credit ratings and other factors. When viewed in conjunction with the underlying and offsetting exposure that the derivatives are designed to hedge, the Company has not sustained a material loss from those instruments nor does it anticipate any material adverse effect on its net income or financial position in the future from the use of derivatives.
The Company recognizes all derivatives in the consolidated balance sheets at fair value. Additionally, the fair value adjustments will affect either equity or net income depending on whether the derivative instruments qualify as a hedge for accounting purposes and, if so, the nature of the hedging activity. When the terms of an underlying transaction are modified, or when the underlying transaction is terminated or completed, all changes in the fair value of the instrument are marked-to-market with changes in value included in net income each period until the instrument matures. Any derivative instrument used for risk management that does not meet the criteria for hedge accounting is marked-to-market each period in the consolidated statements of operations and comprehensive income (loss). The Company does not use derivatives for trading or speculative purposes.
Fair Value Measurements
The carrying amounts of cash and cash equivalents, restricted cash and escrows, accounts and rents receivables, other assets, accounts payable, accrued expenses and other liabilities reasonably approximates fair value, in management’s judgment, because of their short-term nature. Fair value information relating to marketable securities, real estate related bonds, derivative financial instruments, investment properties, investments in unconsolidated entities and debt is provided in "Note 11-Fair Value Measurements".
Revenue Recognition
The Company commences revenue recognition on its leases based on a number of factors. In most cases, revenue recognition under a lease begins when the lessee takes possession of or controls the physical use of the leased asset. Generally, this occurs on the lease commencement date. The determination of who is the owner, for accounting purposes, of the tenant improvements determines the nature of the leased asset and when revenue recognition under a lease begins. If the Company is the owner, for accounting purposes, of the tenant improvements, then the leased asset is the finished space and revenue recognition begins when the lessee takes possession of the finished space, typically when the improvements are substantially complete. If the Company concludes it is not the owner, for accounting purposes, of the tenant improvements (the lessee is the owner), then the
F-12
INVENTRUST PROPERTIES CORP.
Notes to Consolidated Financial Statements
December 31, 2017, 2016 and 2015
leased asset is the unimproved space and any tenant improvement allowances funded under the lease are treated as lease incentives which reduces revenue recognized over the term of the lease. In these circumstances, the Company begins revenue recognition when the lessee takes possession of the unimproved space for the lessee to construct their own improvements. The Company considers a number of different factors to evaluate whether it or the lessee is the owner of the tenant improvements for accounting purposes. These factors include:
The determination of who owns the tenant improvements, for accounting purposes, is subject to significant judgment. In making that determination, the Company considers all of the above factors. No one factor, however, necessarily is determinative.
Rental income is recognized on a straight-line basis over the term of each lease. The cumulative difference between rental income earned and recognized on a straight-line basis in the consolidated statements of operations and the cash rent due under the provisions of the lease agreements is recorded as deferred rent receivable and is included as a component of accounts and rents receivable in the accompanying consolidated balance sheets.
Some leases provide for the payment of fixed base rent paid monthly in advance, and for the reimbursement by tenants to the Company, for the tenant’s pro rata share of certain operating expenses including real estate taxes, special assessments, insurance, utilities, common area maintenance, management fees, and certain building repairs paid by the landlord and recoverable under the terms of the lease. Under these leases, the landlord pays all expenses and is reimbursed by the tenant for the tenant’s pro rata share of recoverable expenses paid. These expenses are included within property operating expenses and reimbursements are included in tenant recovery income on the consolidated statements of operations and comprehensive income (loss).
The Company records lease termination income when there is a signed termination agreement, all of the conditions of the termination agreement have been met, the tenant is no longer occupying the property and termination income amounts due are considered collectible.
The Company defers recognition of contingent rental income (i.e. percentage/excess rent) until the specified target that triggers the contingent rental income is achieved.
Income Taxes
The Company is qualified and has elected to be taxed as a REIT under the Code for federal income tax purposes commencing with the tax year ended December 31, 2005. Since the Company qualifies for taxation as a REIT, the Company generally will not be subject to federal income tax on taxable income that is distributed to stockholders. A REIT is subject to a number of organizational and operational requirements, including a requirement that it currently distribute at least 90% of its REIT taxable income (subject to certain adjustments) to its stockholders (the "90% Distribution Requirement"). If the Company fails to qualify as a REIT in any taxable year, without the benefit of certain relief provisions, the Company will be subject to federal and state income tax on its taxable income at regular corporate tax rates. Even if the Company qualifies for taxation as a REIT, the Company may be subject to certain state and local taxes on its income, property or net worth and federal income and excise taxes on its undistributed income.
The Company has elected to treat certain of its consolidated subsidiaries, and may in the future elect to treat newly formed subsidiaries, as taxable REIT subsidiaries pursuant to the Code. Taxable REIT subsidiaries may participate in non-real estate related activities and/or perform non-customary services for tenants and are subject to federal and state income tax at regular corporate tax rates.
F-13
• whether the lease stipulates how and on what a tenant improvement allowance may be spent;
• whether the tenant or landlord retains legal title to the improvements;
• the uniqueness of the improvements;
• the expected economic life of the tenant improvements relative to the length of the lease; and
• who constructs or directs the construction of the improvements.
INVENTRUST PROPERTIES CORP.
Notes to Consolidated Financial Statements
December 31, 2017, 2016 and 2015
The Company accounts for income taxes using the asset and liability method under which deferred tax assets and liabilities are recognized for the estimated future tax consequences attributed to differences between the financial statement carrying amounts of existing assets and liabilities and their respective tax basis. Deferred tax assets and liabilities are measured using enacted tax rates in effect for the year in which those temporary differences are expected to be recovered or settled.
Deferred tax assets are recognized only to the extent that it is more likely than not that they will be realized based on consideration of available evidence, including future reversal of existing taxable temporary differences, future projected taxable income, and tax-planning strategies. In assessing the realizability of deferred tax assets, management considers whether it is more likely than not that some portion or all of the deferred tax assets will not be realized. The ultimate realization of deferred tax assets is dependent upon the generation of future taxable income during the periods in which those temporary differences become deductible. The Company's analysis in determining the deferred tax asset valuation allowance involves management judgment and assumptions.
Share Based Compensation
In accordance with FASB ASC Topic 718, Accounting for Share Based Compensation, companies are required to recognize in the consolidated statements of operations and comprehensive income (loss) the grant-date fair value of stock options and other equity based compensation issued to employees and directors. Under FASB ASC Topic 718, the way an award is classified will affect the measurement of compensation cost. Equity classified awards are measured at grant date fair value, and amortized on a straight-line basis over the vesting period and are not subsequently re-measured. At December 31, 2017, the Company had one share based compensation plan, which is discussed in "Note 14. Stock-Based Compensation". The compensation cost is based on awards that are scheduled to vest and adjusted for forfeitures at the time the forfeitures occur.
Recently Issued Accounting Pronouncements Adopted
In January 2017, the Financial Accounting Standards Board ("FASB") issued Accounting Standards Update ("ASU") No. 2017-01, Clarifying the Definition of a Business, with the objective of providing guidance to assist entities with evaluating whether transactions should be accounted for as acquisitions or disposals of assets or businesses. The Company expects that the revised guidance will result in most of the Company's real estate transactions being classified as asset acquisitions and asset disposals. The guidance is effective beginning January 1, 2018. Early adoption is permitted. The Company early adopted ASU No. 2017-01 as of October 1, 2016.
In March 2016, the FASB issued ASU No. 2016-09, Compensation – Stock Compensation, which outlines improvements to employee share-based payment accounting. The new standard impacts certain aspects of the accounting for share-based payment transactions, including income tax consequences, classification of awards as either equity or liabilities, and classification on the statement of cash flows. In accordance with ASU No. 2016-09, all cash payments to tax authorities in connection with shares withheld to meet statutory tax withholding requirements are presented as a financing activity in the statement of cash flows and the Company accounts for stock-based compensation forfeitures as they occur. The Company adopted ASU No. 2016-09 as of January 1, 2017.
Recently Issued Accounting Pronouncements Not Yet Adopted
In May 2014, the FASB issued ASU No. 2014-09, Revenue from Contracts with Customers, which requires an entity to recognize revenue to depict the transfer of promised goods or services to customers in an amount that reflects the consideration to which the entity expects to be entitled in exchange for those promised goods or services. The ASU will replace most existing revenue recognition guidance in GAAP when it becomes effective, although it will not affect the accounting for revenue deemed to be related to lease components of contracts. In April 2015, the FASB approved an amendment to the ASU, deferring the effective date one year to annual reporting periods beginning after December 15, 2017 for public entities. Early adoption is permitted for annual reporting periods beginning after December 15, 2016, including interim reporting periods within that reporting period. The standard permits the use of either the retrospective or cumulative effect transition method.
The Company has completed an assessment of revenue streams, concluding the majority of the Company’s tenant-related revenue pertains to lease components, and will be governed by the recently issued leasing guidance discussed below. Based on the Company's assessment, the revenue reported as other fee income on the consolidated statements of operations and comprehensive income (loss) will represent the Company's primary application of the new standard upon adoption. The Company will utilize the single practical expedient available and apply the guidance to new and modified contracts entered into subsequent to the date of initial application. The Company intends to implement the standard retrospectively with the
F-14
INVENTRUST PROPERTIES CORP.
Notes to Consolidated Financial Statements
December 31, 2017, 2016 and 2015
cumulative effect recognized in retained earnings, if any, at the date of initial application. Based on the Company's assessment, the implementation of the new standard will generally not change the timing or pattern of revenue recognition for other fee income. As a result, upon adoption of ASU No. 2014-09 on January 1, 2018, the cumulative effect recognized in retained earnings at the date of initial application will be immaterial. Although the timing and pattern of revenue recognition for other fee income will not materially change, the new standard will generally require incremental disclosures pertaining to, among others, the disaggregation of revenue, contract balances, performance obligations, costs to obtain or fulfill a contract, and significant judgments in the application of the new standard.
In January 2016, the FASB issued ASU No. 2016-01, Recognition and Measurement of Financial Assets and Financial Liabilities, which (a) requires equity investments (except those accounted for under the equity method of accounting or those that result in consolidation of the investee) to be measured at fair value with changes in fair value recognized in net income; (b) simplifies the impairment assessment of equity investments without readily determinable fair values by requiring a qualitative assessment to identify impairment; (c) eliminates the requirement to disclose the fair value of financial instruments measured at amortized cost for entities that are not public business entities; (d) eliminates the requirement for public business entities to disclose the method(s) and significant assumptions used to estimate the fair value that is required to be disclosed for financial instruments measured at amortized cost on the balance sheet; (e) requires public business entities to use the exit price notion when measuring the fair value of financial instruments for disclosure purposes; (f) requires separate presentation of financial assets and financial liabilities by measurement category and form of financial asset on the balance sheet or the accompanying notes to the financial statements; and (g) clarifies that an entity should evaluate the need for a valuation allowance on a deferred tax asset related to available-for-sale securities in combination with the entity’s other deferred tax assets. ASU No. 2016-01 will be effective for annual reporting periods, including interim periods within those annual periods, beginning after December 15, 2017. Entities may early adopt the provisions related to the recognition of changes in fair value of financial liabilities. Entities must apply the standard using a cumulative effect adjustment to the balance sheet as of the beginning of the fiscal year of adoption. The Company’s investments in marketable securities on the consolidated balance sheets are currently classified as available-for-sale and measured at fair value each reporting period. Changes in fair value are currently recorded through comprehensive income. Upon adoption of ASU No. 2016-01 on January 1, 2018, the net unrealized gain of $275 on available-for-sale equity securities will be reclassified to beginning retained earnings. All subsequent changes in the fair value of the Company’s investments that have readily determinable fair values will be recognized through net income. ASU No. 2016-01 will not require incremental disclosures upon adoption, as all of the Company's investments in marketable securities have readily determinable fair values. The new guidance requires the Company to classify cash flows from purchases and sales of equity investments on the basis of the nature and purpose for which it acquired the ownership interests. The Company anticipates classifying proceeds from sale of equity investments as an investing activity. As changes in the fair value of equity investments will be reflected in net income, the Company will adjust net income for the unrealized gain or loss to determine cash flows from operating activities.
In February 2016, the FASB issued ASU No. 2016-02, Leases, amending the existing guidance for lease accounting for both parties to a lease contract (i.e. lessees and lessors). For lessees, the new standard requires application of a dual approach, classifying leases as either finance or operating leases based on the principle of whether or not the lease is effectively a financed purchase by the lessee. This classification will determine whether lease expense is recognized based on an effective interest method or on a straight-line basis over the term of the lease. A lessee is also required to record a right-of-use asset ("ROU") and a lease liability for all leases with a term of greater than 12 months regardless of their classification. Leases with a term of 12 months or less will be accounted for similar to existing guidance for operating leases today. For lessors, the new standard requires accounting for leases using a method that is substantially equivalent to existing guidance for sales-type leases, direct financing leases and operating leases. ASU No. 2016-02 will be effective for annual reporting periods beginning after December 15, 2018, and early adoption is permitted as of the standard's issuance date. The new standard requires a modified retrospective transition method for all leases existing at the date of initial application, with an option to use certain practical expedients available.
As a lessee, the Company believes the most significant change relates to the recognition of a new ROU asset and lease liability on the consolidated balance sheets for its corporate office leases, as well as a ground lease agreement where the Company is the lessee (see Note 15). Currently, the Company accounts for the office and ground lease arrangements as operating leases. These leases are currently not material to the Company’s consolidated financial statements, however, the Company will continue to assess the materiality of the office and ground lease arrangements through the effective date of January 1, 2019.
As a lessor, the Company believes substantially all of the Company's leases will continue to be classified as operating leases under the new standard. Based on the current requirements of the standard, Common area maintenance ("CAM"), utility
F-15
INVENTRUST PROPERTIES CORP.
Notes to Consolidated Financial Statements
December 31, 2017, 2016 and 2015
recovery services, and non-routine major maintenance provided for in tenant lease contracts will be accounted for as non-lease components. Most significantly for the real estate industry, revenue deemed to be related to non-lease components of contracts is within the scope of ASU No. 2014-09, Revenue from Contracts with Customers. As a result, we will be required to recognize revenues associated with tenant leases separately from revenues associated with CAM, utility recovery services, or non-routine major maintenance. The Company also has certain lease arrangements with its tenants for space at its retail assets in which the contractual amounts due under the lease from the lessee are not allocated between the rental and expense reimbursement components ("Gross Leases"). Presently, the aggregate revenue earned under Gross Leases is classified as rental income in the consolidated statements of operations. Under the new standard, the Company anticipates it will be required to allocate the embedded revenue associated with these reimbursements under its Gross Leases, which represent an immaterial portion of the Company’s lease portfolio, and separately present such amounts in its consolidated statements of operations. Lastly, due to the new standard’s narrowed definition of initial direct costs, the Company expects to expense as incurred certain lease origination costs currently capitalized and amortized to expense over the lease term. However, the Company does not believe this change will have a material impact on its consolidated financial statements.
On November 29, 2017, the FASB met to discuss feedback from stakeholders regarding implementation of the new leasing standard. Among other topics, the FASB considered feedback indicating the costs of complying with the new leasing standard's current separation and allocation requirements of non-lease components (i.e. CAM, utility recovery services, and non-routine major maintenance) by lessors may outweigh the benefits, specifically when the separation and allocation guidance only affects presentation and disclosure. The FASB tentatively decided to amend the new leasing standard to provide lessors with an optional practical expedient that may be elected by class of underlying asset. A lessor that elects the practical expedient would not be required to separate lease and non-lease components, provided that the timing and pattern of revenue recognition for the components are the same and the combined, single unit of account would be classified as an operating lease. The lessor would also be required to disclose that it has elected the expedient and the nature of the items that are being combined. Generally, the patterns of revenue recognition for the lease and non-lease components of the Company are the same, and the Company believes substantially all of the Company's leases will continue to be classified as operating leases under the new standard. The Company believes the election of this proposed practical expedient will provide relief, as the separation and allocation guidance generally only affects presentation and disclosure. The Company will continue to evaluate the impact of this guidance and proposed practical expedient until adoption on January 1, 2019.
In June 2016, the FASB issued ASU 2016-13, Financial Instruments - Credit Losses. This guidance is effective January 1, 2020, with early adoption permitted beginning January 1, 2019, and replaces the current incurred loss impairment methodology with a methodology that reflects expected credit losses. Financial assets that are measured at amortized cost will be required to be presented at the net amount expected to be collected with an allowance for credit losses deducted from the amortized cost basis. In addition, an entity must consider broader information in developing its expected credit loss estimate, including the use of forecasted information. Generally, the pronouncement requires a modified retrospective method of adoption. The Company anticipates the adoption of this standard on January 1, 2020, through which the Company will continue to evaluate the impact on the consolidated financial statements.
In August 2016, the FASB issued ASU No. 2016-15, Statement of Cash Flows. This guidance is intended to reduce the existing diversity in practice in how certain cash receipts and cash payments are presented and classified in the statement of cash flows. The core principle of the ASU requires the classification of eight specific issues identified under Accounting Standards Codification ("ASC") ASC 230, Statement of Cash Flows, to be presented as either financing, investing or operating, or some combination thereof, depending upon the nature of the cash flows. ASU No. 2016-15 will be effective for annual reporting periods, including interim periods within those annual periods, beginning after December 15, 2017, and early adoption is permitted. Entities are required to use a retrospective transition method for each period presented. Of the eight specific issues identified, the following clarifications are most pertinent to the Company: (a) cash payments for debt prepayment and extinguishment costs; (b) cash proceeds from the settlement of insurance claims; and (c) distributions from equity method investments. Upon adoption of ASU No. 2016-15 on January 1, 2018, the Company will present debt prepayment and extinguishment costs as cash outflows from financing activities, present cash proceeds from the settlement of insurance claims based on the nature of the loss, and present distributions from equity method investments as investing or operating, or some combination thereof, based on our accounting policy election. The Company currently utilizes the nature of the distribution approach regarding distributions from equity method investments, which will be formalized as an accounting policy effective January 1, 2018. Under this approach, each distribution is evaluated on the basis of the source of the payment and classified as either operating cash inflows or investing cash inflows.
F-16
INVENTRUST PROPERTIES CORP.
Notes to Consolidated Financial Statements
December 31, 2017, 2016 and 2015
In November 2016, the FASB issued ASU No. 2016-18, Statement of Cash Flows. The guidance is intended to reduce the existing diversity in practice of how certain transfers between cash and restricted cash are classified as operating, investing, or financing activities within the statement of cash flows. ASU No. 2016-18 will be effective for annual reporting periods beginning after December 31, 2017, and interim periods within those fiscal years. Early adoption is permitted. This guidance requires a retrospective transition method of adoption for each period presented. Under the standard, entities are required to explain the changes in the combined total of restricted and unrestricted cash in the statement of cash flows. As a result, a transfer between restricted and unrestricted cash accounts will not be reported as a cash flow. All cash receipts/payments with third parties directly to/from restricted cash accounts will be reported as operating, investing, or financing cash flows, as appropriate. Upon adoption of ASU No. 2016-18 on January 1, 2018, the Company will include amounts generally described as restricted cash and restricted cash equivalents with cash and cash equivalents when reconciling the beginning-of-period and end-of-period total amounts shown on the statement of cash flows.
In February 2017, the FASB issued ASU No. 2017-05, Other Income-Gains and Losses from the Derecognition of Nonfinancial Assets. The new guidance is required to be adopted concurrently with the amendments in ASU 2014-09, Revenue from Contracts with Customers. The standard, which adds guidance for partial sales of nonfinancial assets and clarifies the scope of Subtopic 610-20, Gains and Losses from the Derecognition of Nonfinancial Assets, applies to the derecognition of all nonfinancial assets (including real estate) for which the counterparty is not a customer. Public entities should apply the amendments in this standard to annual periods beginning after December 15, 2017, including interim periods within those periods. Upon adoption of ASU No. 2017-05 on January 1, 2018, the Company will account for dispositions of real estate to a noncustomer counterparty in accordance with Subtopic 610-20, Gains and Losses from the Derecognition of Nonfinancial Assets. The Company intends to adopt this guidance on a modified retrospective basis and does not expect its adoption will have a significant impact on the consolidated financial statements.
In May 2017, the FASB issued ASU No. 2017-09, Compensation - Stock Compensation. The new guidance clarifies which changes in terms or conditions of share-based payment awards would require an entity to apply modification accounting. The standard is effective on January 1, 2018, with early adoption permitted. The Company anticipates the adoption of this standard on January 1, 2018, and does not expect its adoption will have a significant impact on the consolidated financial statements. In August 2017, the FASB issued ASU No. 2017-12, Derivatives and Hedging: Targeted Improvements to Accounting for Hedging Activities. This guidance is intended to better align financial reporting for hedging activities with the economic objectives of those activities. The transition guidance provides the option of early adopting the new standard using a modified retrospective transition method in any interim period, or alternatively requires adoption for fiscal years beginning after December 15, 2018. This adoption method will require the Company to recognize the cumulative effect of initially applying the ASU as an adjustment to accumulated comprehensive income with a corresponding adjustment to the opening balance of retained earnings as of the beginning of the fiscal year that it adopts the update. The Company anticipates the adoption of this standard on January 1, 2019, and does not expect its adoption will have a significant impact on the consolidated financial statements.
F-17
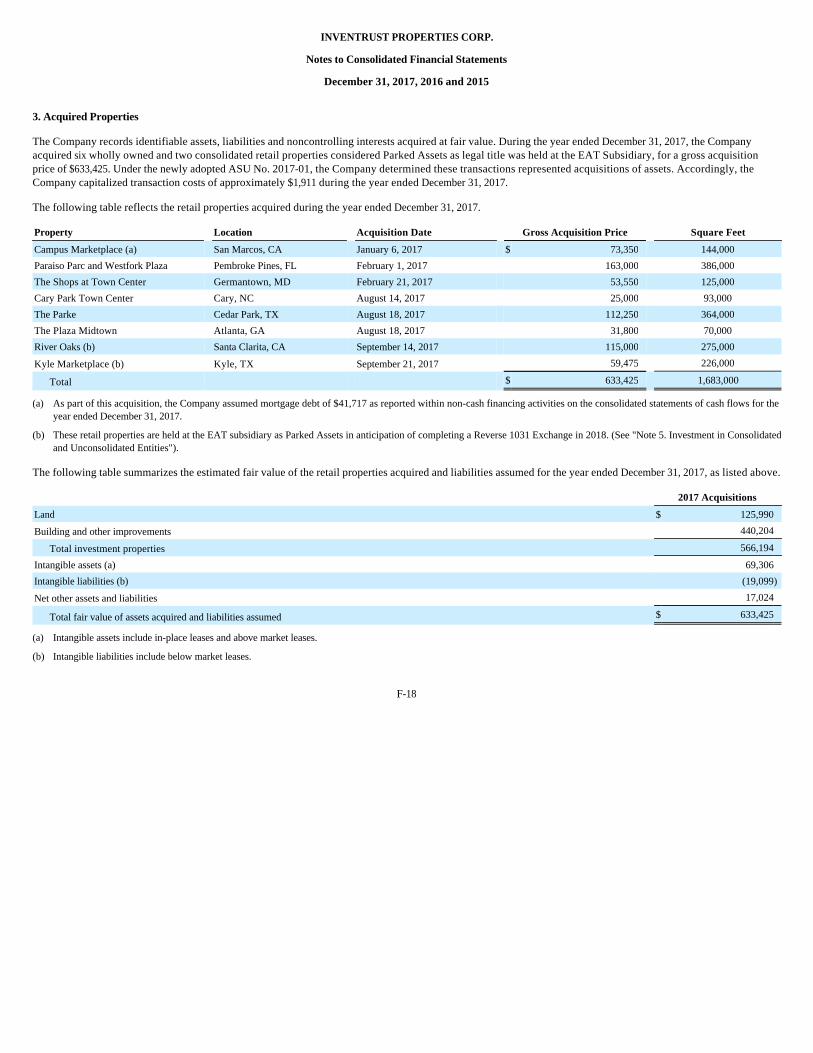
INVENTRUST PROPERTIES CORP.
Notes to Consolidated Financial Statements
December 31, 2017, 2016 and 2015
3. Acquired Properties
The Company records identifiable assets, liabilities and noncontrolling interests acquired at fair value. During the year ended December 31, 2017, the Company acquired six wholly owned and two consolidated retail properties considered Parked Assets as legal title was held at the EAT Subsidiary, for a gross acquisition price of $633,425. Under the newly adopted ASU No. 2017-01, the Company determined these transactions represented acquisitions of assets. Accordingly, the Company capitalized transaction costs of approximately $1,911 during the year ended December 31, 2017.
The following table reflects the retail properties acquired during the year ended December 31, 2017.
The following table summarizes the estimated fair value of the retail properties acquired and liabilities assumed for the year ended December 31, 2017, as listed above.
F-18
Property Location Acquisition Date Gross Acquisition Price Square Feet
Campus Marketplace (a) San Marcos, CA January 6, 2017 $ 73,350 144,000
Paraiso Parc and Westfork Plaza Pembroke Pines, FL February 1, 2017 163,000 386,000
The Shops at Town Center Germantown, MD February 21, 2017 53,550 125,000
Cary Park Town Center Cary, NC August 14, 2017 25,000 93,000
The Parke Cedar Park, TX August 18, 2017 112,250 364,000
The Plaza Midtown Atlanta, GA August 18, 2017 31,800 70,000
River Oaks (b) Santa Clarita, CA September 14, 2017 115,000 275,000
Kyle Marketplace (b) Kyle, TX September 21, 2017 59,475 226,000
Total $ 633,425 1,683,000
(a) As part of this acquisition, the Company assumed mortgage debt of $41,717 as reported within non-cash financing activities on the consolidated statements of cash flows for the year ended December 31, 2017.
(b) These retail properties are held at the EAT subsidiary as Parked Assets in anticipation of completing a Reverse 1031 Exchange in 2018. (See "Note 5. Investment in Consolidated and Unconsolidated Entities").
2017 Acquisitions
Land $ 125,990 Building and other improvements 440,204
Total investment properties 566,194 Intangible assets (a) 69,306 Intangible liabilities (b) (19,099)
Net other assets and liabilities 17,024
Total fair value of assets acquired and liabilities assumed $ 633,425
(a) Intangible assets include in-place leases and above market leases.
(b) Intangible liabilities include below market leases.
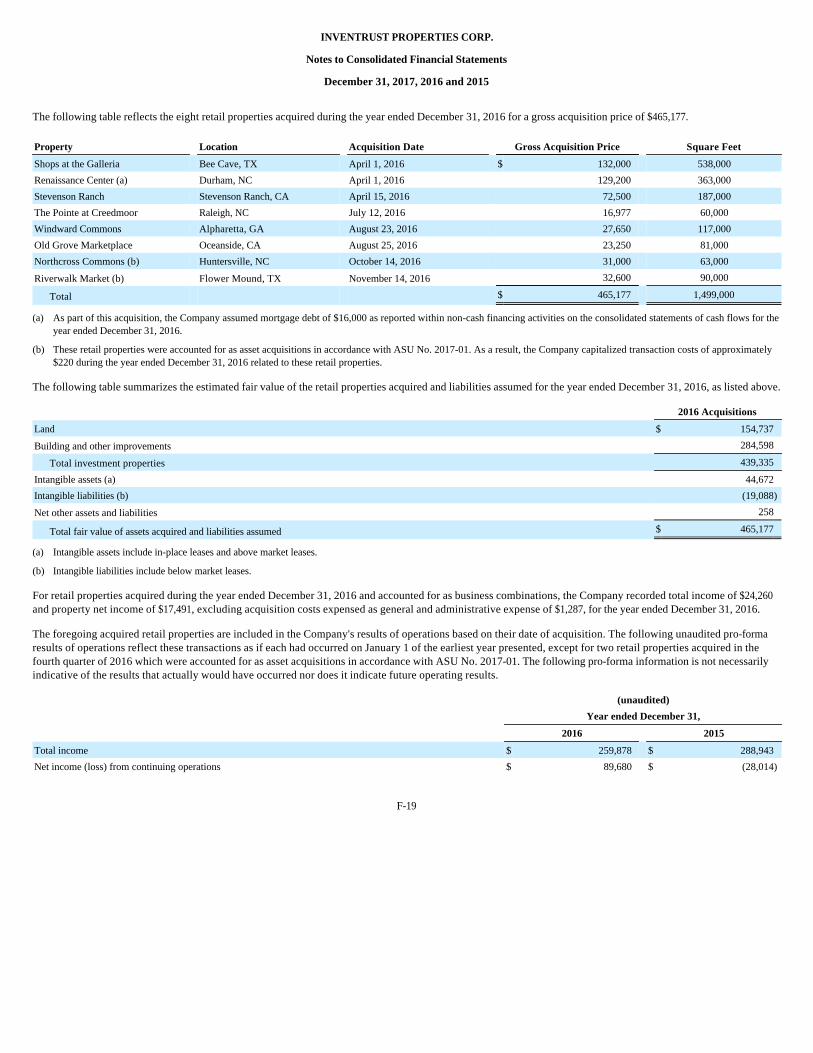
INVENTRUST PROPERTIES CORP.
Notes to Consolidated Financial Statements
December 31, 2017, 2016 and 2015
The following table reflects the eight retail properties acquired during the year ended December 31, 2016 for a gross acquisition price of $465,177.
The following table summarizes the estimated fair value of the retail properties acquired and liabilities assumed for the year ended December 31, 2016, as listed above.
For retail properties acquired during the year ended December 31, 2016 and accounted for as business combinations, the Company recorded total income of $24,260 and property net income of $17,491, excluding acquisition costs expensed as general and administrative expense of $1,287, for the year ended December 31, 2016.
The foregoing acquired retail properties are included in the Company's results of operations based on their date of acquisition. The following unaudited pro-forma results of operations reflect these transactions as if each had occurred on January 1 of the earliest year presented, except for two retail properties acquired in the fourth quarter of 2016 which were accounted for as asset acquisitions in accordance with ASU No. 2017-01. The following pro-forma information is not necessarily indicative of the results that actually would have occurred nor does it indicate future operating results.
F-19
Property Location Acquisition Date Gross Acquisition Price Square Feet
Shops at the Galleria Bee Cave, TX April 1, 2016 $ 132,000 538,000
Renaissance Center (a) Durham, NC April 1, 2016 129,200 363,000
Stevenson Ranch Stevenson Ranch, CA April 15, 2016 72,500 187,000
The Pointe at Creedmoor Raleigh, NC July 12, 2016 16,977 60,000
Windward Commons Alpharetta, GA August 23, 2016 27,650 117,000
Old Grove Marketplace Oceanside, CA August 25, 2016 23,250 81,000
Northcross Commons (b) Huntersville, NC October 14, 2016 31,000 63,000
Riverwalk Market (b) Flower Mound, TX November 14, 2016 32,600 90,000
Total $ 465,177 1,499,000
(a) As part of this acquisition, the Company assumed mortgage debt of $16,000 as reported within non-cash financing activities on the consolidated statements of cash flows for the year ended December 31, 2016.
(b) These retail properties were accounted for as asset acquisitions in accordance with ASU No. 2017-01. As a result, the Company capitalized transaction costs of approximately $220 during the year ended December 31, 2016 related to these retail properties.
2016 Acquisitions
Land $ 154,737 Building and other improvements 284,598
Total investment properties 439,335 Intangible assets (a) 44,672 Intangible liabilities (b) (19,088)
Net other assets and liabilities 258
Total fair value of assets acquired and liabilities assumed $ 465,177
(a) Intangible assets include in-place leases and above market leases.
(b) Intangible liabilities include below market leases.
(unaudited)
Year ended December 31,
2016 2015
Total income $ 259,878 $ 288,943 Net income (loss) from continuing operations $ 89,680 $ (28,014)
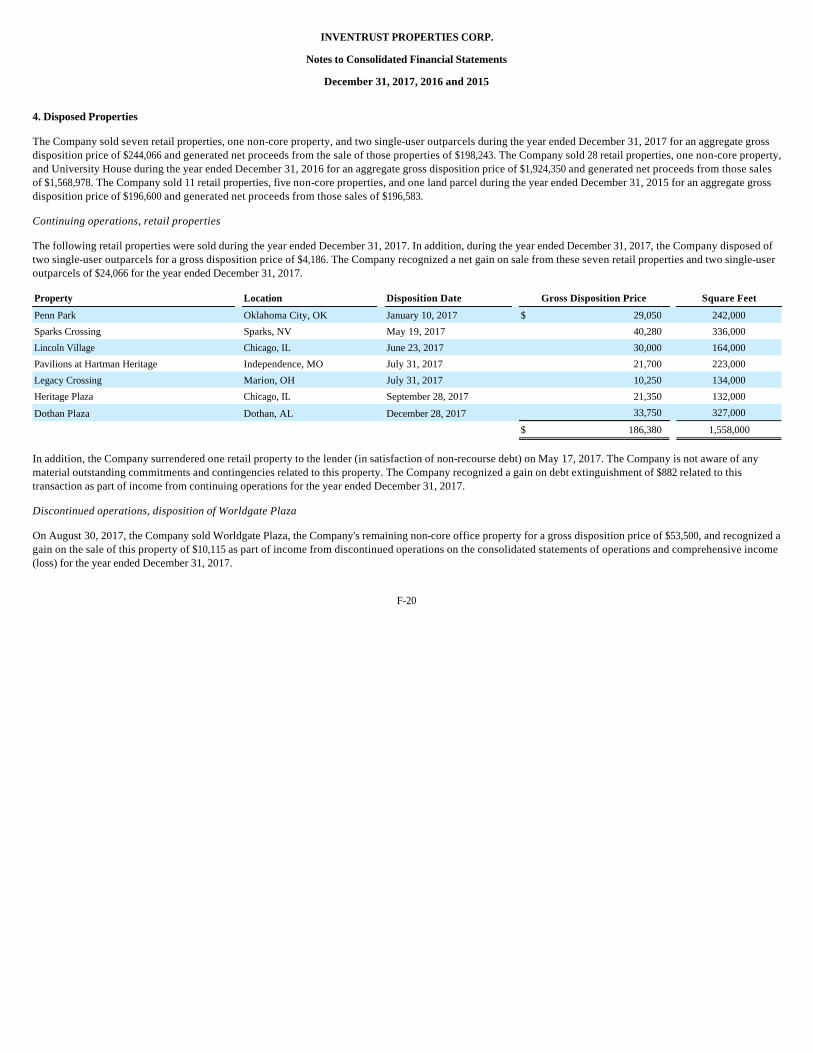
INVENTRUST PROPERTIES CORP.
Notes to Consolidated Financial Statements
December 31, 2017, 2016 and 2015
4. Disposed Properties
The Company sold seven retail properties, one non-core property, and two single-user outparcels during the year ended December 31, 2017 for an aggregate gross disposition price of $244,066 and generated net proceeds from the sale of those properties of $198,243. The Company sold 28 retail properties, one non-core property, and University House during the year ended December 31, 2016 for an aggregate gross disposition price of $1,924,350 and generated net proceeds from those sales of $1,568,978. The Company sold 11 retail properties, five non-core properties, and one land parcel during the year ended December 31, 2015 for an aggregate gross disposition price of $196,600 and generated net proceeds from those sales of $196,583.
Continuing operations, retail properties
The following retail properties were sold during the year ended December 31, 2017. In addition, during the year ended December 31, 2017, the Company disposed of two single-user outparcels for a gross disposition price of $4,186. The Company recognized a net gain on sale from these seven retail properties and two single-user outparcels of $24,066 for the year ended December 31, 2017.
In addition, the Company surrendered one retail property to the lender (in satisfaction of non-recourse debt) on May 17, 2017. The Company is not aware of any material outstanding commitments and contingencies related to this property. The Company recognized a gain on debt extinguishment of $882 related to this transaction as part of income from continuing operations for the year ended December 31, 2017.
Discontinued operations, disposition of Worldgate Plaza
On August 30, 2017, the Company sold Worldgate Plaza, the Company's remaining non-core office property for a gross disposition price of $53,500, and recognized a gain on the sale of this property of $10,115 as part of income from discontinued operations on the consolidated statements of operations and comprehensive income (loss) for the year ended December 31, 2017.
F-20
Property Location Disposition Date Gross Disposition Price Square Feet
Penn Park Oklahoma City, OK January 10, 2017 $ 29,050 242,000
Sparks Crossing Sparks, NV May 19, 2017 40,280 336,000
Lincoln Village Chicago, IL June 23, 2017 30,000 164,000
Pavilions at Hartman Heritage Independence, MO July 31, 2017 21,700 223,000
Legacy Crossing Marion, OH July 31, 2017 10,250 134,000
Heritage Plaza Chicago, IL September 28, 2017 21,350 132,000
Dothan Plaza Dothan, AL December 28, 2017 33,750 327,000
$ 186,380 1,558,000
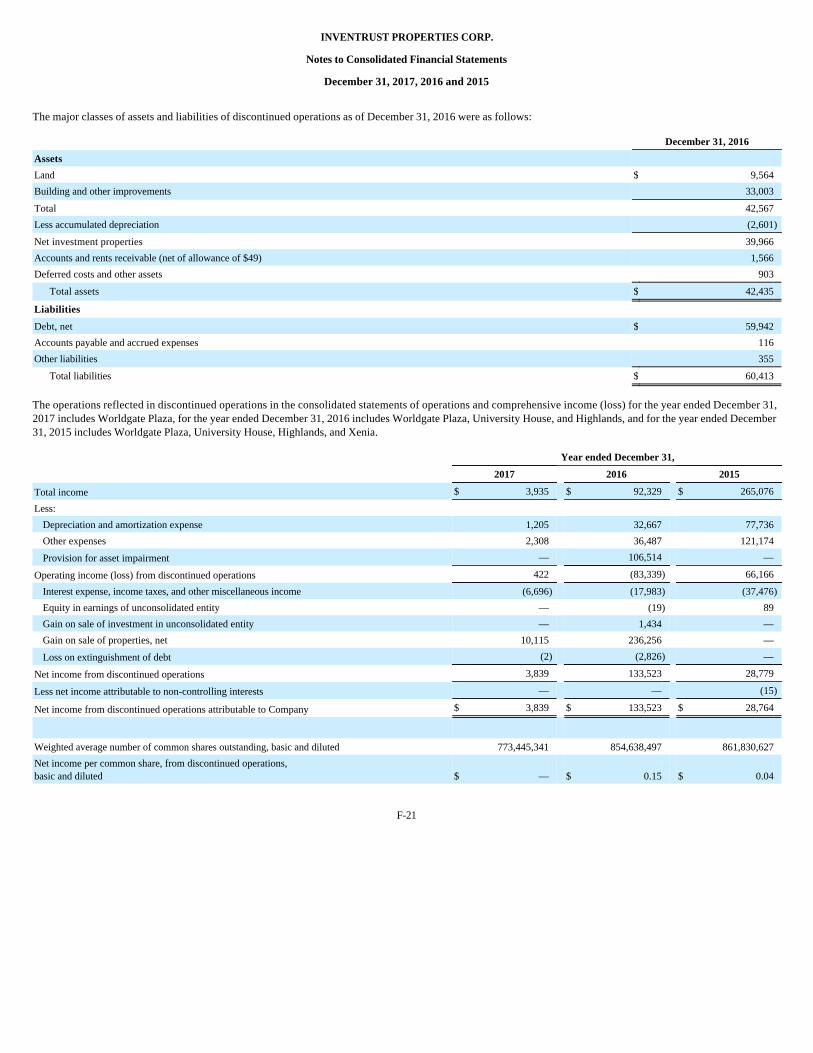
INVENTRUST PROPERTIES CORP.
Notes to Consolidated Financial Statements
December 31, 2017, 2016 and 2015
The major classes of assets and liabilities of discontinued operations as of December 31, 2016 were as follows:
The operations reflected in discontinued operations in the consolidated statements of operations and comprehensive income (loss) for the year ended December 31, 2017 includes Worldgate Plaza, for the year ended December 31, 2016 includes Worldgate Plaza, University House, and Highlands, and for the year ended December 31, 2015 includes Worldgate Plaza, University House, Highlands, and Xenia.
F-21
December 31, 2016
Assets
Land $ 9,564 Building and other improvements 33,003 Total 42,567 Less accumulated depreciation (2,601)
Net investment properties 39,966 Accounts and rents receivable (net of allowance of $49) 1,566 Deferred costs and other assets 903
Total assets $ 42,435
Liabilities
Debt, net $ 59,942 Accounts payable and accrued expenses 116 Other liabilities 355
Total liabilities $ 60,413
Year ended December 31,
2017 2016 2015
Total income $ 3,935 $ 92,329 $ 265,076 Less:
Depreciation and amortization expense 1,205 32,667 77,736 Other expenses 2,308 36,487 121,174 Provision for asset impairment — 106,514 —
Operating income (loss) from discontinued operations 422 (83,339) 66,166 Interest expense, income taxes, and other miscellaneous income (6,696) (17,983) (37,476)
Equity in earnings of unconsolidated entity — (19) 89 Gain on sale of investment in unconsolidated entity — 1,434 — Gain on sale of properties, net 10,115 236,256 — Loss on extinguishment of debt (2) (2,826) —
Net income from discontinued operations 3,839 133,523 28,779
Less net income attributable to non-controlling interests — — (15)
Net income from discontinued operations attributable to Company $ 3,839 $ 133,523 $ 28,764
Weighted average number of common shares outstanding, basic and diluted 773,445,341 854,638,497 861,830,627 Net income per common share, from discontinued operations, basic and diluted $ — $ 0.15 $ 0.04
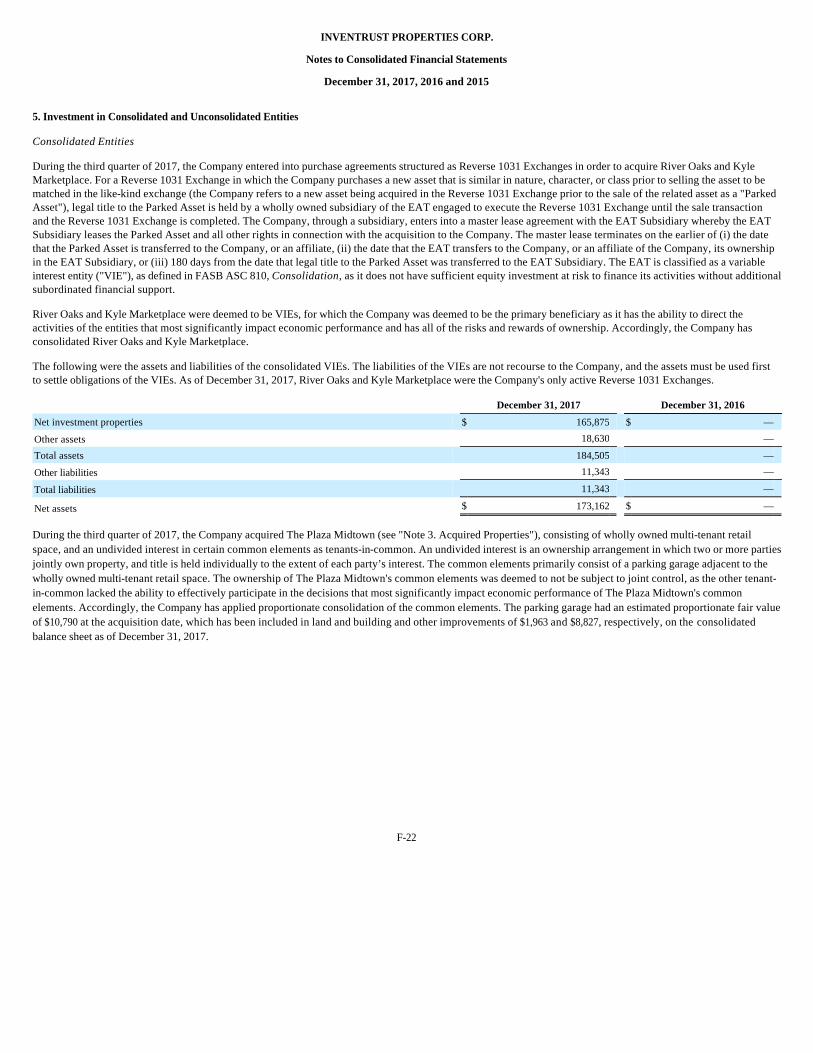
INVENTRUST PROPERTIES CORP.
Notes to Consolidated Financial Statements
December 31, 2017, 2016 and 2015
5. Investment in Consolidated and Unconsolidated Entities
Consolidated Entities
During the third quarter of 2017, the Company entered into purchase agreements structured as Reverse 1031 Exchanges in order to acquire River Oaks and Kyle Marketplace. For a Reverse 1031 Exchange in which the Company purchases a new asset that is similar in nature, character, or class prior to selling the asset to be matched in the like-kind exchange (the Company refers to a new asset being acquired in the Reverse 1031 Exchange prior to the sale of the related asset as a "Parked Asset"), legal title to the Parked Asset is held by a wholly owned subsidiary of the EAT engaged to execute the Reverse 1031 Exchange until the sale transaction and the Reverse 1031 Exchange is completed. The Company, through a subsidiary, enters into a master lease agreement with the EAT Subsidiary whereby the EAT Subsidiary leases the Parked Asset and all other rights in connection with the acquisition to the Company. The master lease terminates on the earlier of (i) the date that the Parked Asset is transferred to the Company, or an affiliate, (ii) the date that the EAT transfers to the Company, or an affiliate of the Company, its ownership in the EAT Subsidiary, or (iii) 180 days from the date that legal title to the Parked Asset was transferred to the EAT Subsidiary. The EAT is classified as a variable interest entity ("VIE"), as defined in FASB ASC 810, Consolidation, as it does not have sufficient equity investment at risk to finance its activities without additional subordinated financial support.
River Oaks and Kyle Marketplace were deemed to be VIEs, for which the Company was deemed to be the primary beneficiary as it has the ability to direct the activities of the entities that most significantly impact economic performance and has all of the risks and rewards of ownership. Accordingly, the Company has consolidated River Oaks and Kyle Marketplace.
The following were the assets and liabilities of the consolidated VIEs. The liabilities of the VIEs are not recourse to the Company, and the assets must be used first to settle obligations of the VIEs. As of December 31, 2017, River Oaks and Kyle Marketplace were the Company's only active Reverse 1031 Exchanges.
During the third quarter of 2017, the Company acquired The Plaza Midtown (see "Note 3. Acquired Properties"), consisting of wholly owned multi-tenant retail space, and an undivided interest in certain common elements as tenants-in-common. An undivided interest is an ownership arrangement in which two or more parties jointly own property, and title is held individually to the extent of each party’s interest. The common elements primarily consist of a parking garage adjacent to the wholly owned multi-tenant retail space. The ownership of The Plaza Midtown's common elements was deemed to not be subject to joint control, as the other tenant-in-common lacked the ability to effectively participate in the decisions that most significantly impact economic performance of The Plaza Midtown's common elements. Accordingly, the Company has applied proportionate consolidation of the common elements. The parking garage had an estimated proportionate fair value of $10,790 at the acquisition date, which has been included in land and building and other improvements of $1,963 and $8,827, respectively, on the consolidated balance sheet as of December 31, 2017.
F-22
December 31, 2017 December 31, 2016
Net investment properties $ 165,875 $ — Other assets 18,630 — Total assets 184,505 — Other liabilities 11,343 —
Total liabilities 11,343 —
Net assets $ 173,162 $ —
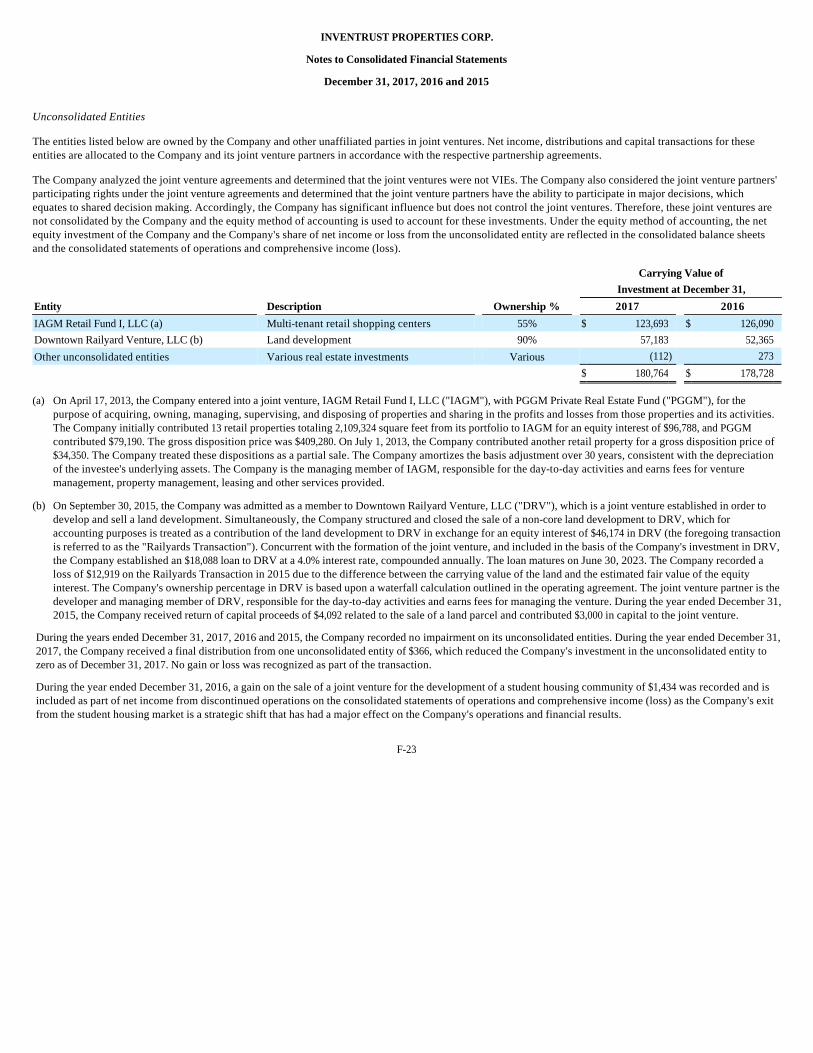
INVENTRUST PROPERTIES CORP.
Notes to Consolidated Financial Statements
December 31, 2017, 2016 and 2015
Unconsolidated Entities
The entities listed below are owned by the Company and other unaffiliated parties in joint ventures. Net income, distributions and capital transactions for these entities are allocated to the Company and its joint venture partners in accordance with the respective partnership agreements.
The Company analyzed the joint venture agreements and determined that the joint ventures were not VIEs. The Company also considered the joint venture partners' participating rights under the joint venture agreements and determined that the joint venture partners have the ability to participate in major decisions, which equates to shared decision making. Accordingly, the Company has significant influence but does not control the joint ventures. Therefore, these joint ventures are not consolidated by the Company and the equity method of accounting is used to account for these investments. Under the equity method of accounting, the net equity investment of the Company and the Company's share of net income or loss from the unconsolidated entity are reflected in the consolidated balance sheets and the consolidated statements of operations and comprehensive income (loss).
During the years ended December 31, 2017, 2016 and 2015, the Company recorded no impairment on its unconsolidated entities. During the year ended December 31, 2017, the Company received a final distribution from one unconsolidated entity of $366, which reduced the Company's investment in the unconsolidated entity to zero as of December 31, 2017. No gain or loss was recognized as part of the transaction.
During the year ended December 31, 2016, a gain on the sale of a joint venture for the development of a student housing community of $1,434 was recorded and is included as part of net income from discontinued operations on the consolidated statements of operations and comprehensive income (loss) as the Company's exit from the student housing market is a strategic shift that has had a major effect on the Company's operations and financial results.
F-23
Carrying Value of
Investment at December 31,
Entity Description Ownership % 2017 2016
IAGM Retail Fund I, LLC (a) Multi-tenant retail shopping centers 55% $ 123,693 $ 126,090 Downtown Railyard Venture, LLC (b) Land development 90% 57,183 52,365 Other unconsolidated entities Various real estate investments Various (112) 273
$ 180,764 $ 178,728
(a) On April 17, 2013, the Company entered into a joint venture, IAGM Retail Fund I, LLC ("IAGM"), with PGGM Private Real Estate Fund ("PGGM"), for the purpose of acquiring, owning, managing, supervising, and disposing of properties and sharing in the profits and losses from those properties and its activities. The Company initially contributed 13 retail properties totaling 2,109,324 square feet from its portfolio to IAGM for an equity interest of $96,788, and PGGM contributed $79,190. The gross disposition price was $409,280. On July 1, 2013, the Company contributed another retail property for a gross disposition price of $34,350. The Company treated these dispositions as a partial sale. The Company amortizes the basis adjustment over 30 years, consistent with the depreciation of the investee's underlying assets. The Company is the managing member of IAGM, responsible for the day-to-day activities and earns fees for venture management, property management, leasing and other services provided.
(b) On September 30, 2015, the Company was admitted as a member to Downtown Railyard Venture, LLC ("DRV"), which is a joint venture established in order to develop and sell a land development. Simultaneously, the Company structured and closed the sale of a non-core land development to DRV, which for accounting purposes is treated as a contribution of the land development to DRV in exchange for an equity interest of $46,174 in DRV (the foregoing transaction is referred to as the "Railyards Transaction"). Concurrent with the formation of the joint venture, and included in the basis of the Company's investment in DRV, the Company established an $18,088 loan to DRV at a 4.0% interest rate, compounded annually. The loan matures on June 30, 2023. The Company recorded a loss of $12,919 on the Railyards Transaction in 2015 due to the difference between the carrying value of the land and the estimated fair value of the equity interest. The Company's ownership percentage in DRV is based upon a waterfall calculation outlined in the operating agreement. The joint venture partner is the developer and managing member of DRV, responsible for the day-to-day activities and earns fees for managing the venture. During the year ended December 31, 2015, the Company received return of capital proceeds of $4,092 related to the sale of a land parcel and contributed $3,000 in capital to the joint venture.
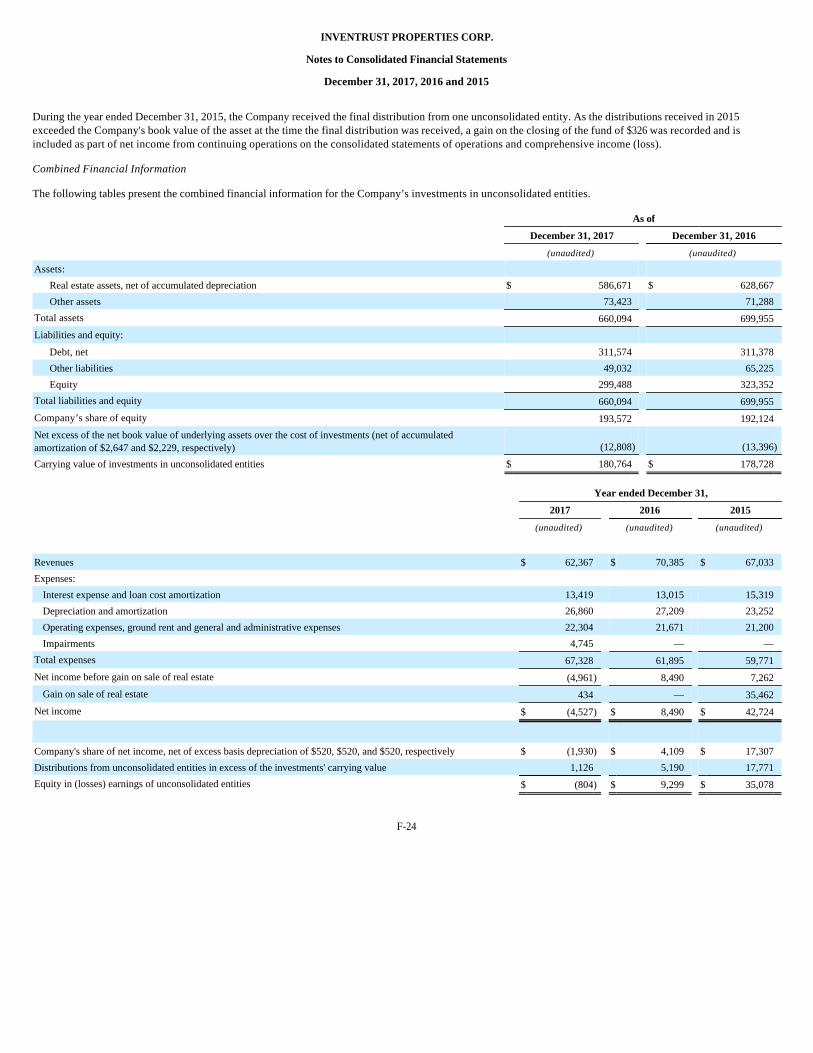
INVENTRUST PROPERTIES CORP.
Notes to Consolidated Financial Statements
December 31, 2017, 2016 and 2015
During the year ended December 31, 2015, the Company received the final distribution from one unconsolidated entity. As the distributions received in 2015 exceeded the Company's book value of the asset at the time the final distribution was received, a gain on the closing of the fund of $326 was recorded and is included as part of net income from continuing operations on the consolidated statements of operations and comprehensive income (loss).
Combined Financial Information
The following tables present the combined financial information for the Company’s investments in unconsolidated entities.
F-24
As of
December 31, 2017 December 31, 2016
(unaudited) (unaudited)
Assets:
Real estate assets, net of accumulated depreciation $ 586,671 $ 628,667 Other assets 73,423 71,288
Total assets 660,094 699,955 Liabilities and equity:
Debt, net 311,574 311,378 Other liabilities 49,032 65,225 Equity 299,488 323,352
Total liabilities and equity 660,094 699,955 Company’s share of equity 193,572 192,124 Net excess of the net book value of underlying assets over the cost of investments (net of accumulated amortization of $2,647 and $2,229, respectively) (12,808) (13,396)
Carrying value of investments in unconsolidated entities $ 180,764 $ 178,728
Year ended December 31,
2017 2016 2015
(unaudited) (unaudited) (unaudited)
Revenues $ 62,367 $ 70,385 $ 67,033 Expenses:
Interest expense and loan cost amortization 13,419 13,015 15,319 Depreciation and amortization 26,860 27,209 23,252 Operating expenses, ground rent and general and administrative expenses 22,304 21,671 21,200 Impairments 4,745 — —
Total expenses 67,328 61,895 59,771 Net income before gain on sale of real estate (4,961) 8,490 7,262
Gain on sale of real estate 434 — 35,462 Net income $ (4,527) $ 8,490 $ 42,724
Company's share of net income, net of excess basis depreciation of $520, $520, and $520, respectively $ (1,930) $ 4,109 $ 17,307 Distributions from unconsolidated entities in excess of the investments' carrying value 1,126 5,190 17,771 Equity in (losses) earnings of unconsolidated entities $ (804) $ 9,299 $ 35,078
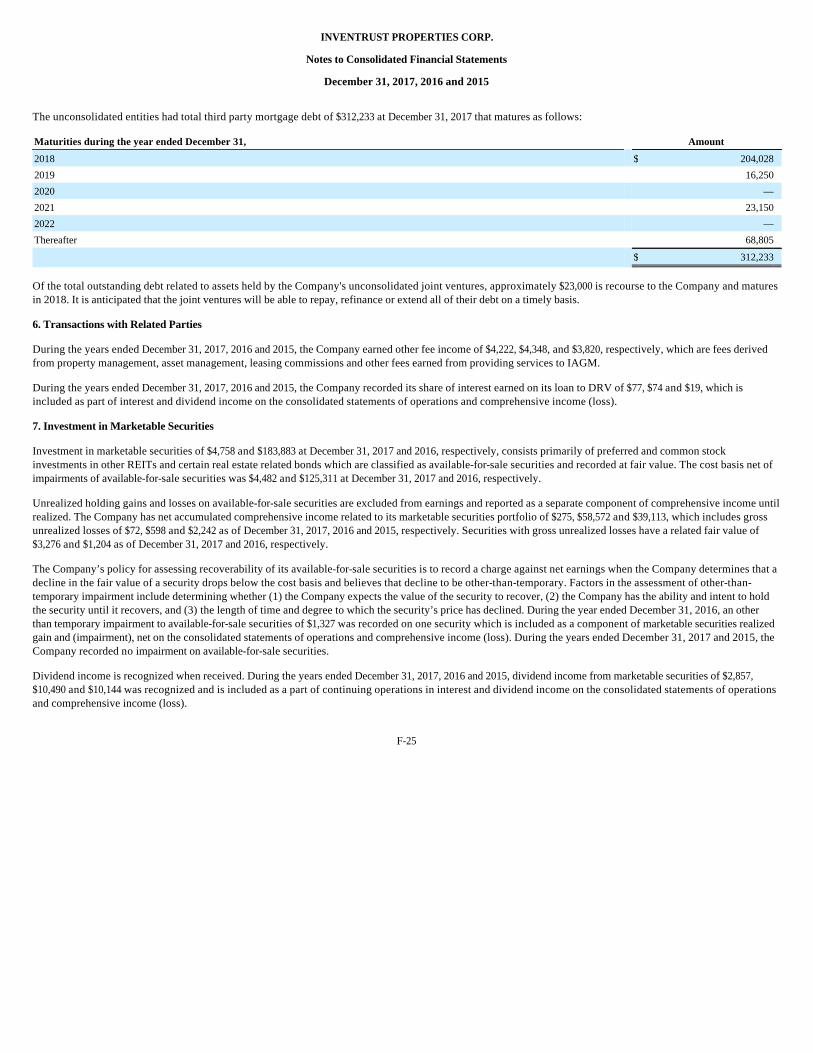
INVENTRUST PROPERTIES CORP.
Notes to Consolidated Financial Statements
December 31, 2017, 2016 and 2015
The unconsolidated entities had total third party mortgage debt of $312,233 at December 31, 2017 that matures as follows:
Of the total outstanding debt related to assets held by the Company's unconsolidated joint ventures, approximately $23,000 is recourse to the Company and matures in 2018. It is anticipated that the joint ventures will be able to repay, refinance or extend all of their debt on a timely basis.
6. Transactions with Related Parties
During the years ended December 31, 2017, 2016 and 2015, the Company earned other fee income of $4,222, $4,348, and $3,820, respectively, which are fees derived from property management, asset management, leasing commissions and other fees earned from providing services to IAGM.
During the years ended December 31, 2017, 2016 and 2015, the Company recorded its share of interest earned on its loan to DRV of $77, $74 and $19, which is included as part of interest and dividend income on the consolidated statements of operations and comprehensive income (loss).
7. Investment in Marketable Securities
Investment in marketable securities of $4,758 and $183,883 at December 31, 2017 and 2016, respectively, consists primarily of preferred and common stock investments in other REITs and certain real estate related bonds which are classified as available-for-sale securities and recorded at fair value. The cost basis net of impairments of available-for-sale securities was $4,482 and $125,311 at December 31, 2017 and 2016, respectively.
Unrealized holding gains and losses on available-for-sale securities are excluded from earnings and reported as a separate component of comprehensive income until realized. The Company has net accumulated comprehensive income related to its marketable securities portfolio of $275, $58,572 and $39,113, which includes gross unrealized losses of $72, $598 and $2,242 as of December 31, 2017, 2016 and 2015, respectively. Securities with gross unrealized losses have a related fair value of $3,276 and $1,204 as of December 31, 2017 and 2016, respectively.
The Company’s policy for assessing recoverability of its available-for-sale securities is to record a charge against net earnings when the Company determines that a decline in the fair value of a security drops below the cost basis and believes that decline to be other-than-temporary. Factors in the assessment of other-than-temporary impairment include determining whether (1) the Company expects the value of the security to recover, (2) the Company has the ability and intent to hold the security until it recovers, and (3) the length of time and degree to which the security’s price has declined. During the year ended December 31, 2016, an other than temporary impairment to available-for-sale securities of $1,327 was recorded on one security which is included as a component of marketable securities realized gain and (impairment), net on the consolidated statements of operations and comprehensive income (loss). During the years ended December 31, 2017 and 2015, the Company recorded no impairment on available-for-sale securities.
Dividend income is recognized when received. During the years ended December 31, 2017, 2016 and 2015, dividend income from marketable securities of $2,857, $10,490 and $10,144 was recognized and is included as a part of continuing operations in interest and dividend income on the consolidated statements of operations and comprehensive income (loss).
F-25
Maturities during the year ended December 31, Amount
2018 $ 204,028 2019 16,250 2020 — 2021 23,150 2022 — Thereafter 68,805
$ 312,233
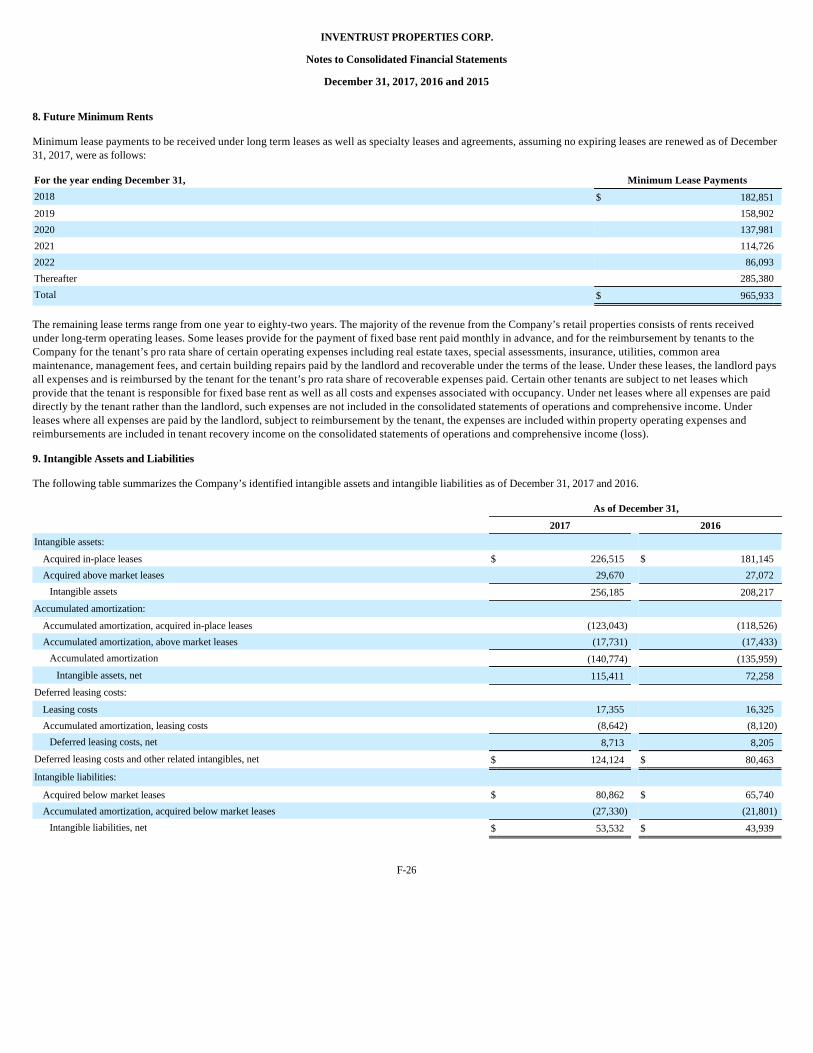
INVENTRUST PROPERTIES CORP.
Notes to Consolidated Financial Statements
December 31, 2017, 2016 and 2015
8. Future Minimum Rents
Minimum lease payments to be received under long term leases as well as specialty leases and agreements, assuming no expiring leases are renewed as of December 31, 2017, were as follows:
The remaining lease terms range from one year to eighty-two years. The majority of the revenue from the Company’s retail properties consists of rents received under long-term operating leases. Some leases provide for the payment of fixed base rent paid monthly in advance, and for the reimbursement by tenants to the Company for the tenant’s pro rata share of certain operating expenses including real estate taxes, special assessments, insurance, utilities, common area maintenance, management fees, and certain building repairs paid by the landlord and recoverable under the terms of the lease. Under these leases, the landlord pays all expenses and is reimbursed by the tenant for the tenant’s pro rata share of recoverable expenses paid. Certain other tenants are subject to net leases which provide that the tenant is responsible for fixed base rent as well as all costs and expenses associated with occupancy. Under net leases where all expenses are paid directly by the tenant rather than the landlord, such expenses are not included in the consolidated statements of operations and comprehensive income. Under leases where all expenses are paid by the landlord, subject to reimbursement by the tenant, the expenses are included within property operating expenses and reimbursements are included in tenant recovery income on the consolidated statements of operations and comprehensive income (loss).
9. Intangible Assets and Liabilities
The following table summarizes the Company’s identified intangible assets and intangible liabilities as of December 31, 2017 and 2016.
F-26
For the year ending December 31, Minimum Lease Payments
2018 $ 182,851 2019 158,902 2020 137,981 2021 114,726 2022 86,093 Thereafter 285,380 Total $ 965,933
As of December 31,
2017 2016
Intangible assets:
Acquired in-place leases $ 226,515 $ 181,145 Acquired above market leases 29,670 27,072
Intangible assets 256,185 208,217 Accumulated amortization:
Accumulated amortization, acquired in-place leases (123,043 ) (118,526 )
Accumulated amortization, above market leases (17,731 ) (17,433 )
Accumulated amortization (140,774 ) (135,959 )
Intangible assets, net 115,411 72,258 Deferred leasing costs:
Leasing costs 17,355 16,325 Accumulated amortization, leasing costs (8,642 ) (8,120 )
Deferred leasing costs, net 8,713 8,205 Deferred leasing costs and other related intangibles, net $ 124,124 $ 80,463 Intangible liabilities:
Acquired below market leases $ 80,862 $ 65,740 Accumulated amortization, acquired below market leases (27,330 ) (21,801 )
Intangible liabilities, net $ 53,532 $ 43,939
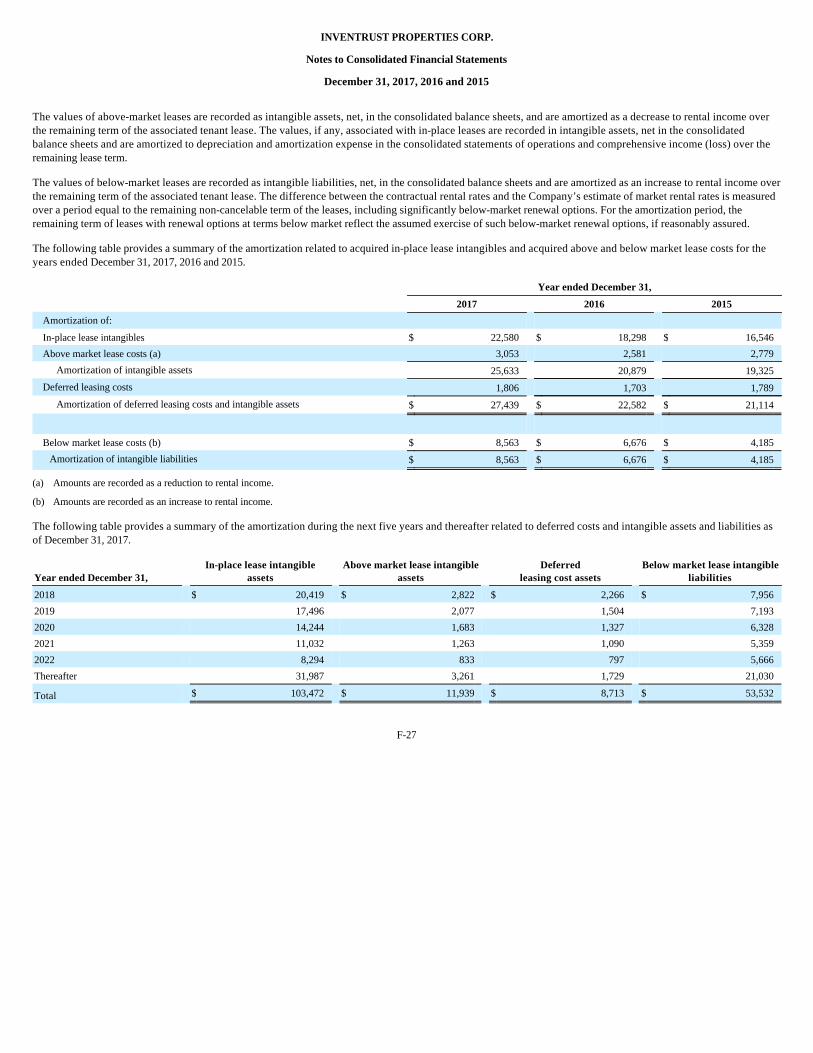
INVENTRUST PROPERTIES CORP.
Notes to Consolidated Financial Statements
December 31, 2017, 2016 and 2015
The values of above-market leases are recorded as intangible assets, net, in the consolidated balance sheets, and are amortized as a decrease to rental income over the remaining term of the associated tenant lease. The values, if any, associated with in-place leases are recorded in intangible assets, net in the consolidated balance sheets and are amortized to depreciation and amortization expense in the consolidated statements of operations and comprehensive income (loss) over the remaining lease term.
The values of below-market leases are recorded as intangible liabilities, net, in the consolidated balance sheets and are amortized as an increase to rental income over the remaining term of the associated tenant lease. The difference between the contractual rental rates and the Company’s estimate of market rental rates is measured over a period equal to the remaining non-cancelable term of the leases, including significantly below-market renewal options. For the amortization period, the remaining term of leases with renewal options at terms below market reflect the assumed exercise of such below-market renewal options, if reasonably assured.
The following table provides a summary of the amortization related to acquired in-place lease intangibles and acquired above and below market lease costs for the years ended December 31, 2017, 2016 and 2015.
The following table provides a summary of the amortization during the next five years and thereafter related to deferred costs and intangible assets and liabilities as of December 31, 2017.
F-27
Year ended December 31,
2017 2016 2015
Amortization of:
In-place lease intangibles $ 22,580 $ 18,298 $ 16,546 Above market lease costs (a) 3,053 2,581 2,779
Amortization of intangible assets 25,633 20,879 19,325 Deferred leasing costs 1,806 1,703 1,789
Amortization of deferred leasing costs and intangible assets $ 27,439 $ 22,582 $ 21,114
Below market lease costs (b) $ 8,563 $ 6,676 $ 4,185 Amortization of intangible liabilities $ 8,563 $ 6,676 $ 4,185
(a) Amounts are recorded as a reduction to rental income.
(b) Amounts are recorded as an increase to rental income.
Year ended December 31, In-place lease intangible
assets Above market lease intangible
assets Deferred
leasing cost assets Below market lease intangible
liabilities
2018 $ 20,419 $ 2,822 $ 2,266 $ 7,956 2019 17,496 2,077 1,504 7,193 2020 14,244 1,683 1,327 6,328 2021 11,032 1,263 1,090 5,359 2022 8,294 833 797 5,666 Thereafter 31,987 3,261 1,729 21,030
Total $ 103,472 $ 11,939 $ 8,713 $ 53,532
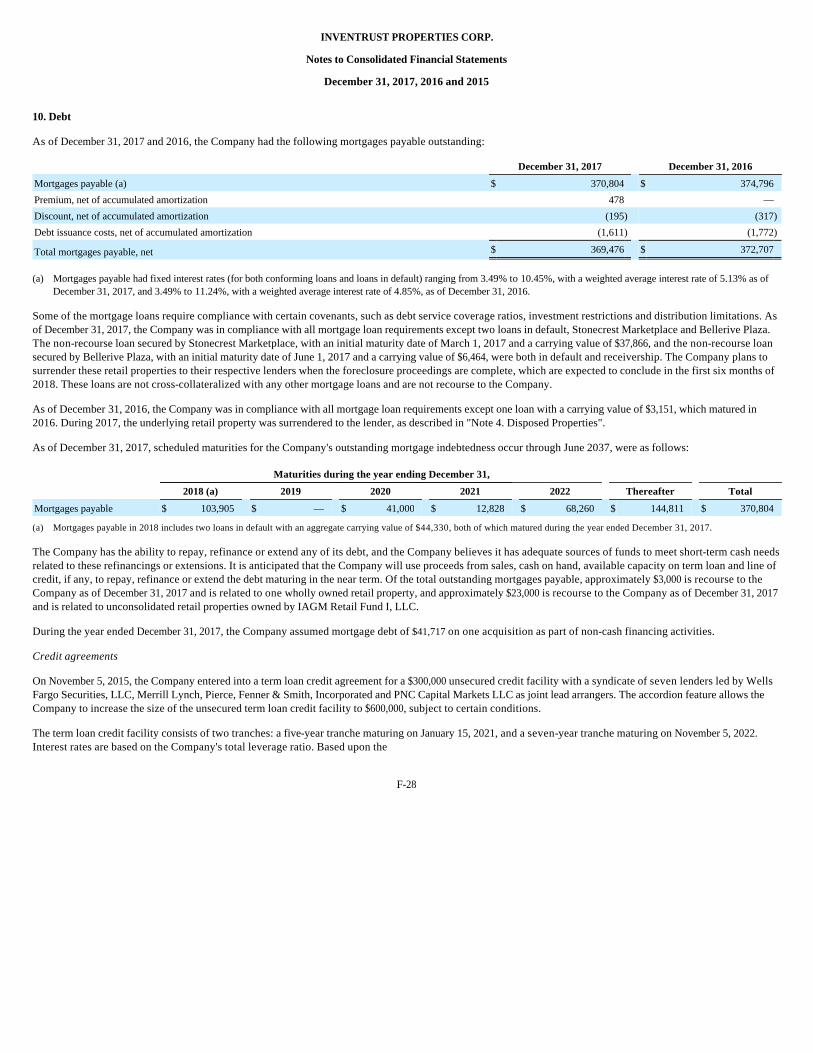
INVENTRUST PROPERTIES CORP.
Notes to Consolidated Financial Statements
December 31, 2017, 2016 and 2015
10. Debt
As of December 31, 2017 and 2016, the Company had the following mortgages payable outstanding:
Some of the mortgage loans require compliance with certain covenants, such as debt service coverage ratios, investment restrictions and distribution limitations. As of December 31, 2017, the Company was in compliance with all mortgage loan requirements except two loans in default, Stonecrest Marketplace and Bellerive Plaza. The non-recourse loan secured by Stonecrest Marketplace, with an initial maturity date of March 1, 2017 and a carrying value of $37,866, and the non-recourse loan secured by Bellerive Plaza, with an initial maturity date of June 1, 2017 and a carrying value of $6,464, were both in default and receivership. The Company plans to surrender these retail properties to their respective lenders when the foreclosure proceedings are complete, which are expected to conclude in the first six months of 2018. These loans are not cross-collateralized with any other mortgage loans and are not recourse to the Company.
As of December 31, 2016, the Company was in compliance with all mortgage loan requirements except one loan with a carrying value of $3,151, which matured in 2016. During 2017, the underlying retail property was surrendered to the lender, as described in "Note 4. Disposed Properties".
As of December 31, 2017, scheduled maturities for the Company's outstanding mortgage indebtedness occur through June 2037, were as follows:
The Company has the ability to repay, refinance or extend any of its debt, and the Company believes it has adequate sources of funds to meet short-term cash needs related to these refinancings or extensions. It is anticipated that the Company will use proceeds from sales, cash on hand, available capacity on term loan and line of credit, if any, to repay, refinance or extend the debt maturing in the near term. Of the total outstanding mortgages payable, approximately $3,000 is recourse to the Company as of December 31, 2017 and is related to one wholly owned retail property, and approximately $23,000 is recourse to the Company as of December 31, 2017 and is related to unconsolidated retail properties owned by IAGM Retail Fund I, LLC.
During the year ended December 31, 2017, the Company assumed mortgage debt of $41,717 on one acquisition as part of non-cash financing activities.
Credit agreements
On November 5, 2015, the Company entered into a term loan credit agreement for a $300,000 unsecured credit facility with a syndicate of seven lenders led by Wells Fargo Securities, LLC, Merrill Lynch, Pierce, Fenner & Smith, Incorporated and PNC Capital Markets LLC as joint lead arrangers. The accordion feature allows the Company to increase the size of the unsecured term loan credit facility to $600,000, subject to certain conditions.
The term loan credit facility consists of two tranches: a five-year tranche maturing on January 15, 2021, and a seven-year tranche maturing on November 5, 2022. Interest rates are based on the Company's total leverage ratio. Based upon the
F-28
December 31, 2017 December 31, 2016
Mortgages payable (a) $ 370,804 $ 374,796 Premium, net of accumulated amortization 478 — Discount, net of accumulated amortization (195 ) (317 )
Debt issuance costs, net of accumulated amortization (1,611 ) (1,772 )
Total mortgages payable, net $ 369,476 $ 372,707
(a) Mortgages payable had fixed interest rates (for both conforming loans and loans in default) ranging from 3.49% to 10.45%, with a weighted average interest rate of 5.13% as of December 31, 2017, and 3.49% to 11.24%, with a weighted average interest rate of 4.85%, as of December 31, 2016.
Maturities during the year ending December 31,
2018 (a) 2019 2020 2021 2022 Thereafter Total
Mortgages payable $ 103,905 $ — $ 41,000 $ 12,828 $ 68,260 $ 144,811 $ 370,804
(a) Mortgages payable in 2018 includes two loans in default with an aggregate carrying value of $44,330, both of which matured during the year ended December 31, 2017.
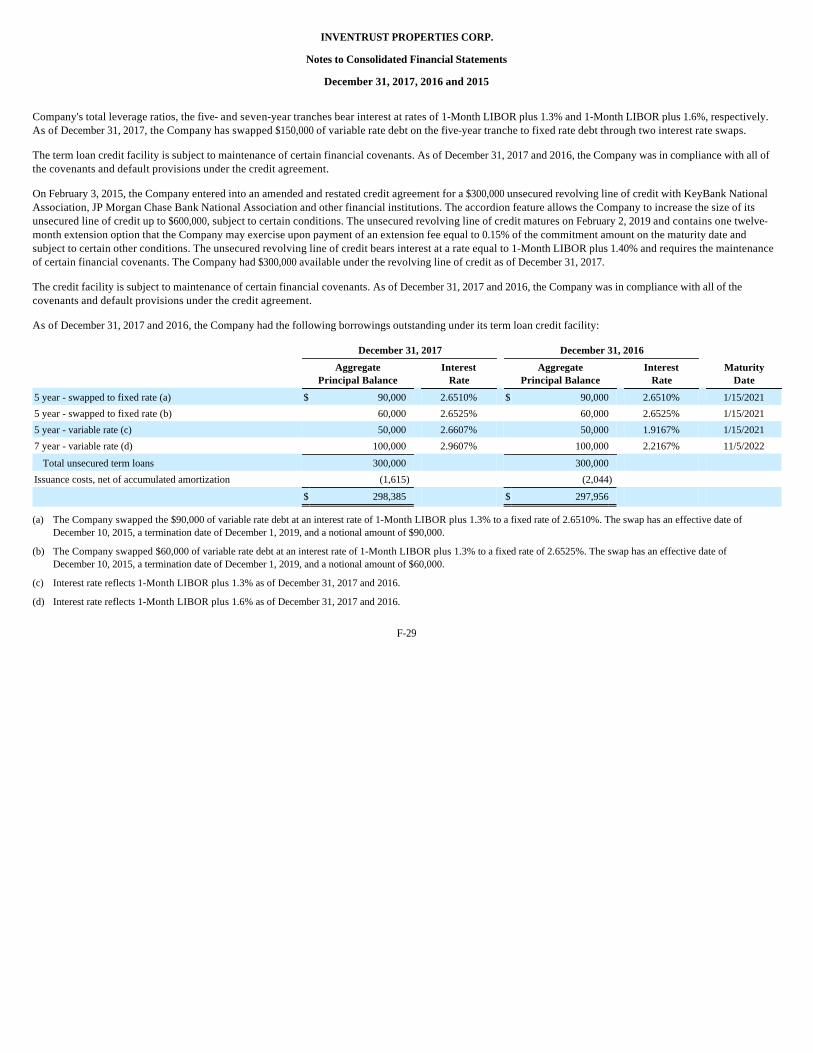
INVENTRUST PROPERTIES CORP.
Notes to Consolidated Financial Statements
December 31, 2017, 2016 and 2015
Company's total leverage ratios, the five- and seven-year tranches bear interest at rates of 1-Month LIBOR plus 1.3% and 1-Month LIBOR plus 1.6%, respectively. As of December 31, 2017, the Company has swapped $150,000 of variable rate debt on the five-year tranche to fixed rate debt through two interest rate swaps.
The term loan credit facility is subject to maintenance of certain financial covenants. As of December 31, 2017 and 2016, the Company was in compliance with all of the covenants and default provisions under the credit agreement.
On February 3, 2015, the Company entered into an amended and restated credit agreement for a $300,000 unsecured revolving line of credit with KeyBank National Association, JP Morgan Chase Bank National Association and other financial institutions. The accordion feature allows the Company to increase the size of its unsecured line of credit up to $600,000, subject to certain conditions. The unsecured revolving line of credit matures on February 2, 2019 and contains one twelve-month extension option that the Company may exercise upon payment of an extension fee equal to 0.15% of the commitment amount on the maturity date and subject to certain other conditions. The unsecured revolving line of credit bears interest at a rate equal to 1-Month LIBOR plus 1.40% and requires the maintenance of certain financial covenants. The Company had $300,000 available under the revolving line of credit as of December 31, 2017.
The credit facility is subject to maintenance of certain financial covenants. As of December 31, 2017 and 2016, the Company was in compliance with all of the covenants and default provisions under the credit agreement.
As of December 31, 2017 and 2016, the Company had the following borrowings outstanding under its term loan credit facility:
F-29
December 31, 2017 December 31, 2016
Aggregate
Principal Balance Interest
Rate Aggregate
Principal Balance Interest
Rate Maturity
Date
5 year - swapped to fixed rate (a) $ 90,000 2.6510% $ 90,000 2.6510% 1/15/2021
5 year - swapped to fixed rate (b) 60,000 2.6525% 60,000 2.6525% 1/15/2021
5 year - variable rate (c) 50,000 2.6607% 50,000 1.9167% 1/15/2021
7 year - variable rate (d) 100,000 2.9607% 100,000 2.2167% 11/5/2022
Total unsecured term loans 300,000 300,000
Issuance costs, net of accumulated amortization (1,615 ) (2,044 )
$ 298,385 $ 297,956
(a) The Company swapped the $90,000 of variable rate debt at an interest rate of 1-Month LIBOR plus 1.3% to a fixed rate of 2.6510%. The swap has an effective date of December 10, 2015, a termination date of December 1, 2019, and a notional amount of $90,000.
(b) The Company swapped $60,000 of variable rate debt at an interest rate of 1-Month LIBOR plus 1.3% to a fixed rate of 2.6525%. The swap has an effective date of December 10, 2015, a termination date of December 1, 2019, and a notional amount of $60,000.
(c) Interest rate reflects 1-Month LIBOR plus 1.3% as of December 31, 2017 and 2016.
(d) Interest rate reflects 1-Month LIBOR plus 1.6% as of December 31, 2017 and 2016.
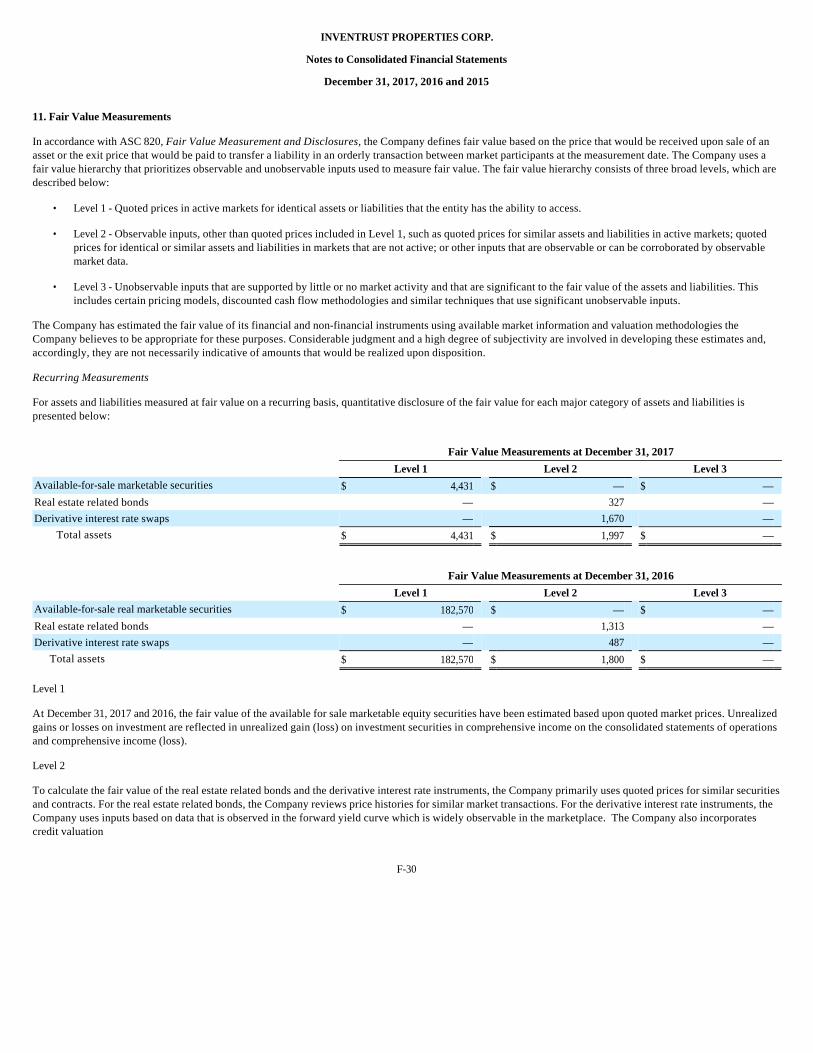
INVENTRUST PROPERTIES CORP.
Notes to Consolidated Financial Statements
December 31, 2017, 2016 and 2015
11. Fair Value Measurements
In accordance with ASC 820, Fair Value Measurement and Disclosures, the Company defines fair value based on the price that would be received upon sale of an asset or the exit price that would be paid to transfer a liability in an orderly transaction between market participants at the measurement date. The Company uses a fair value hierarchy that prioritizes observable and unobservable inputs used to measure fair value. The fair value hierarchy consists of three broad levels, which are described below:
The Company has estimated the fair value of its financial and non-financial instruments using available market information and valuation methodologies the Company believes to be appropriate for these purposes. Considerable judgment and a high degree of subjectivity are involved in developing these estimates and, accordingly, they are not necessarily indicative of amounts that would be realized upon disposition.
Recurring Measurements
For assets and liabilities measured at fair value on a recurring basis, quantitative disclosure of the fair value for each major category of assets and liabilities is presented below:
Level 1
At December 31, 2017 and 2016, the fair value of the available for sale marketable equity securities have been estimated based upon quoted market prices. Unrealized gains or losses on investment are reflected in unrealized gain (loss) on investment securities in comprehensive income on the consolidated statements of operations and comprehensive income (loss).
Level 2
To calculate the fair value of the real estate related bonds and the derivative interest rate instruments, the Company primarily uses quoted prices for similar securities and contracts. For the real estate related bonds, the Company reviews price histories for similar market transactions. For the derivative interest rate instruments, the Company uses inputs based on data that is observed in the forward yield curve which is widely observable in the marketplace. The Company also incorporates credit valuation
F-30
• Level 1 - Quoted prices in active markets for identical assets or liabilities that the entity has the ability to access.
• Level 2 - Observable inputs, other than quoted prices included in Level 1, such as quoted prices for similar assets and liabilities in active markets; quoted prices for identical or similar assets and liabilities in markets that are not active; or other inputs that are observable or can be corroborated by observable market data.
• Level 3 - Unobservable inputs that are supported by little or no market activity and that are significant to the fair value of the assets and liabilities. This includes certain pricing models, discounted cash flow methodologies and similar techniques that use significant unobservable inputs.
Fair Value Measurements at December 31, 2017
Level 1 Level 2 Level 3
Available-for-sale marketable securities $ 4,431 $ — $ — Real estate related bonds — 327 — Derivative interest rate swaps — 1,670 —
Total assets $ 4,431 $ 1,997 $ —
Fair Value Measurements at December 31, 2016
Level 1 Level 2 Level 3
Available-for-sale real marketable securities $ 182,570 $ — $ — Real estate related bonds — 1,313 — Derivative interest rate swaps — 487 —
Total assets $ 182,570 $ 1,800 $ —
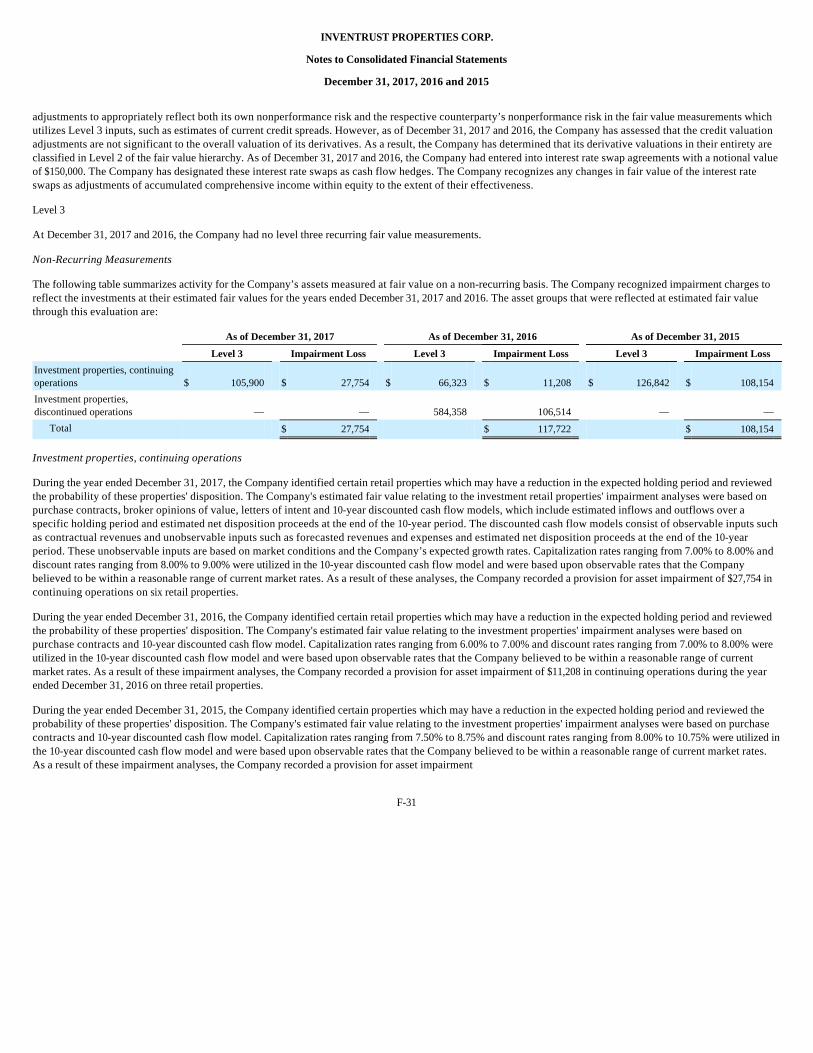
INVENTRUST PROPERTIES CORP.
Notes to Consolidated Financial Statements
December 31, 2017, 2016 and 2015
adjustments to appropriately reflect both its own nonperformance risk and the respective counterparty’s nonperformance risk in the fair value measurements which utilizes Level 3 inputs, such as estimates of current credit spreads. However, as of December 31, 2017 and 2016, the Company has assessed that the credit valuation adjustments are not significant to the overall valuation of its derivatives. As a result, the Company has determined that its derivative valuations in their entirety are classified in Level 2 of the fair value hierarchy. As of December 31, 2017 and 2016, the Company had entered into interest rate swap agreements with a notional value of $150,000. The Company has designated these interest rate swaps as cash flow hedges. The Company recognizes any changes in fair value of the interest rate swaps as adjustments of accumulated comprehensive income within equity to the extent of their effectiveness.
Level 3
At December 31, 2017 and 2016, the Company had no level three recurring fair value measurements.
Non-Recurring Measurements
The following table summarizes activity for the Company’s assets measured at fair value on a non-recurring basis. The Company recognized impairment charges to reflect the investments at their estimated fair values for the years ended December 31, 2017 and 2016. The asset groups that were reflected at estimated fair value through this evaluation are:
Investment properties, continuing operations
During the year ended December 31, 2017, the Company identified certain retail properties which may have a reduction in the expected holding period and reviewed the probability of these properties' disposition. The Company's estimated fair value relating to the investment retail properties' impairment analyses were based on purchase contracts, broker opinions of value, letters of intent and 10-year discounted cash flow models, which include estimated inflows and outflows over a specific holding period and estimated net disposition proceeds at the end of the 10-year period. The discounted cash flow models consist of observable inputs such as contractual revenues and unobservable inputs such as forecasted revenues and expenses and estimated net disposition proceeds at the end of the 10-year period. These unobservable inputs are based on market conditions and the Company’s expected growth rates. Capitalization rates ranging from 7.00% to 8.00% and discount rates ranging from 8.00% to 9.00% were utilized in the 10-year discounted cash flow model and were based upon observable rates that the Company believed to be within a reasonable range of current market rates. As a result of these analyses, the Company recorded a provision for asset impairment of $27,754 in continuing operations on six retail properties.
During the year ended December 31, 2016, the Company identified certain retail properties which may have a reduction in the expected holding period and reviewed the probability of these properties' disposition. The Company's estimated fair value relating to the investment properties' impairment analyses were based on purchase contracts and 10-year discounted cash flow model. Capitalization rates ranging from 6.00% to 7.00% and discount rates ranging from 7.00% to 8.00% were utilized in the 10-year discounted cash flow model and were based upon observable rates that the Company believed to be within a reasonable range of current market rates. As a result of these impairment analyses, the Company recorded a provision for asset impairment of $11,208 in continuing operations during the year ended December 31, 2016 on three retail properties.
During the year ended December 31, 2015, the Company identified certain properties which may have a reduction in the expected holding period and reviewed the probability of these properties' disposition. The Company's estimated fair value relating to the investment properties' impairment analyses were based on purchase contracts and 10-year discounted cash flow model. Capitalization rates ranging from 7.50% to 8.75% and discount rates ranging from 8.00% to 10.75% were utilized in the 10-year discounted cash flow model and were based upon observable rates that the Company believed to be within a reasonable range of current market rates. As a result of these impairment analyses, the Company recorded a provision for asset impairment
F-31
As of December 31, 2017 As of December 31, 2016 As of December 31, 2015
Level 3 Impairment Loss Level 3 Impairment Loss Level 3 Impairment Loss
Investment properties, continuing operations $ 105,900 $ 27,754 $ 66,323 $ 11,208 $ 126,842 $ 108,154 Investment properties, discontinued operations — — 584,358 106,514 — —
Total $ 27,754 $ 117,722 $ 108,154
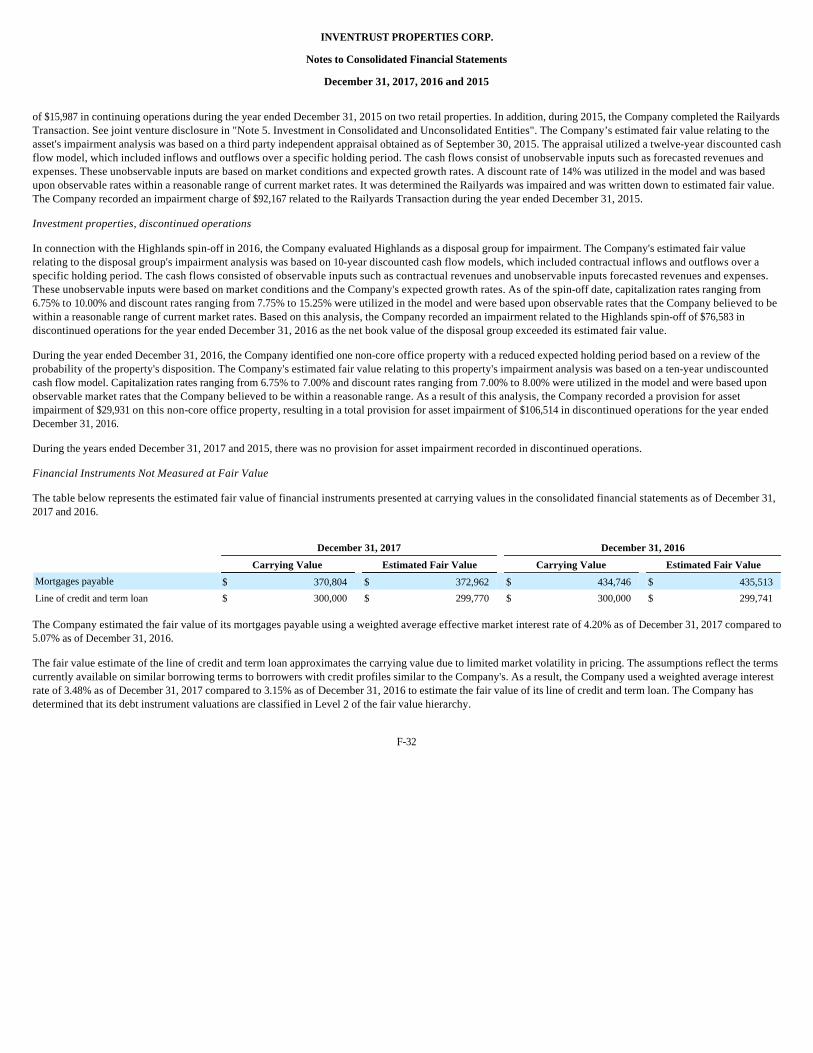
INVENTRUST PROPERTIES CORP.
Notes to Consolidated Financial Statements
December 31, 2017, 2016 and 2015
of $15,987 in continuing operations during the year ended December 31, 2015 on two retail properties. In addition, during 2015, the Company completed the Railyards Transaction. See joint venture disclosure in "Note 5. Investment in Consolidated and Unconsolidated Entities". The Company’s estimated fair value relating to the asset's impairment analysis was based on a third party independent appraisal obtained as of September 30, 2015. The appraisal utilized a twelve-year discounted cash flow model, which included inflows and outflows over a specific holding period. The cash flows consist of unobservable inputs such as forecasted revenues and expenses. These unobservable inputs are based on market conditions and expected growth rates. A discount rate of 14% was utilized in the model and was based upon observable rates within a reasonable range of current market rates. It was determined the Railyards was impaired and was written down to estimated fair value. The Company recorded an impairment charge of $92,167 related to the Railyards Transaction during the year ended December 31, 2015.
Investment properties, discontinued operations
In connection with the Highlands spin-off in 2016, the Company evaluated Highlands as a disposal group for impairment. The Company's estimated fair value relating to the disposal group's impairment analysis was based on 10-year discounted cash flow models, which included contractual inflows and outflows over a specific holding period. The cash flows consisted of observable inputs such as contractual revenues and unobservable inputs forecasted revenues and expenses. These unobservable inputs were based on market conditions and the Company's expected growth rates. As of the spin-off date, capitalization rates ranging from 6.75% to 10.00% and discount rates ranging from 7.75% to 15.25% were utilized in the model and were based upon observable rates that the Company believed to be within a reasonable range of current market rates. Based on this analysis, the Company recorded an impairment related to the Highlands spin-off of $76,583 in discontinued operations for the year ended December 31, 2016 as the net book value of the disposal group exceeded its estimated fair value.
During the year ended December 31, 2016, the Company identified one non-core office property with a reduced expected holding period based on a review of the probability of the property's disposition. The Company's estimated fair value relating to this property's impairment analysis was based on a ten-year undiscounted cash flow model. Capitalization rates ranging from 6.75% to 7.00% and discount rates ranging from 7.00% to 8.00% were utilized in the model and were based upon observable market rates that the Company believed to be within a reasonable range. As a result of this analysis, the Company recorded a provision for asset impairment of $29,931 on this non-core office property, resulting in a total provision for asset impairment of $106,514 in discontinued operations for the year ended December 31, 2016.
During the years ended December 31, 2017 and 2015, there was no provision for asset impairment recorded in discontinued operations.
Financial Instruments Not Measured at Fair Value
The table below represents the estimated fair value of financial instruments presented at carrying values in the consolidated financial statements as of December 31, 2017 and 2016.
The Company estimated the fair value of its mortgages payable using a weighted average effective market interest rate of 4.20% as of December 31, 2017 compared to 5.07% as of December 31, 2016.
The fair value estimate of the line of credit and term loan approximates the carrying value due to limited market volatility in pricing. The assumptions reflect the terms currently available on similar borrowing terms to borrowers with credit profiles similar to the Company's. As a result, the Company used a weighted average interest rate of 3.48% as of December 31, 2017 compared to 3.15% as of December 31, 2016 to estimate the fair value of its line of credit and term loan. The Company has determined that its debt instrument valuations are classified in Level 2 of the fair value hierarchy.
F-32
December 31, 2017 December 31, 2016
Carrying Value Estimated Fair Value Carrying Value Estimated Fair Value
Mortgages payable $ 370,804 $ 372,962 $ 434,746 $ 435,513 Line of credit and term loan $ 300,000 $ 299,770 $ 300,000 $ 299,741
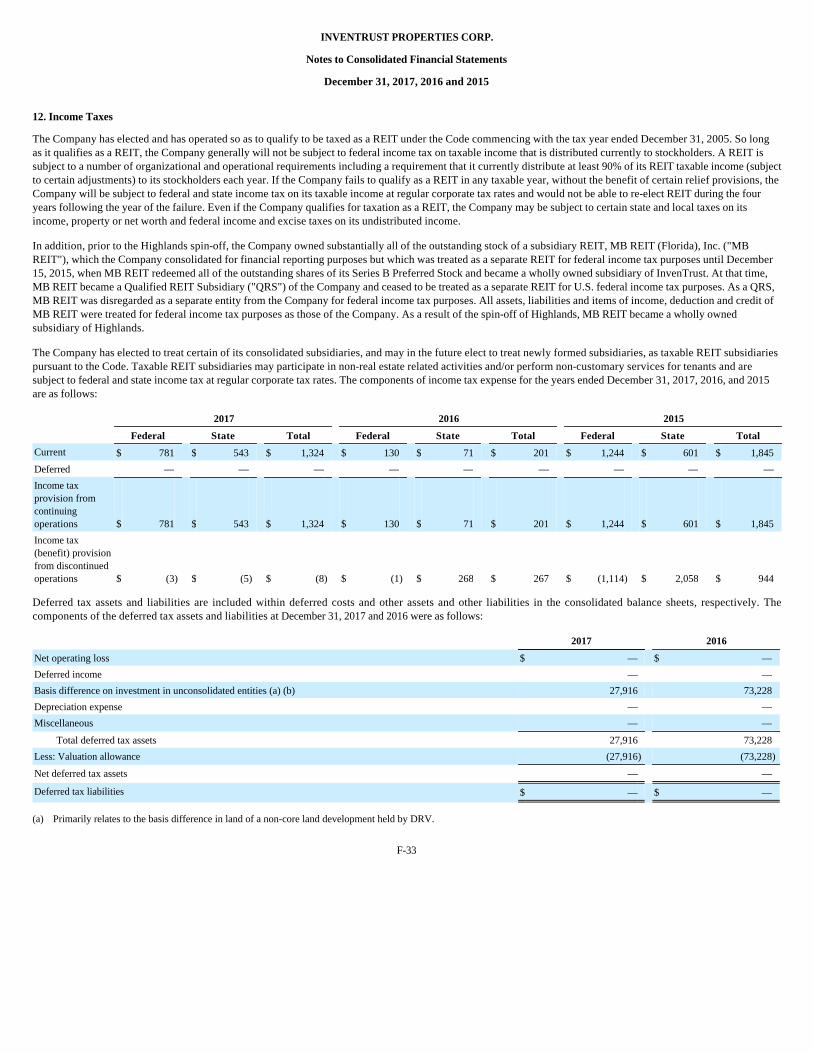
INVENTRUST PROPERTIES CORP.
Notes to Consolidated Financial Statements
December 31, 2017, 2016 and 2015
12. Income Taxes
The Company has elected and has operated so as to qualify to be taxed as a REIT under the Code commencing with the tax year ended December 31, 2005. So long as it qualifies as a REIT, the Company generally will not be subject to federal income tax on taxable income that is distributed currently to stockholders. A REIT is subject to a number of organizational and operational requirements including a requirement that it currently distribute at least 90% of its REIT taxable income (subject to certain adjustments) to its stockholders each year. If the Company fails to qualify as a REIT in any taxable year, without the benefit of certain relief provisions, the Company will be subject to federal and state income tax on its taxable income at regular corporate tax rates and would not be able to re-elect REIT during the four years following the year of the failure. Even if the Company qualifies for taxation as a REIT, the Company may be subject to certain state and local taxes on its income, property or net worth and federal income and excise taxes on its undistributed income.
In addition, prior to the Highlands spin-off, the Company owned substantially all of the outstanding stock of a subsidiary REIT, MB REIT (Florida), Inc. ("MB REIT"), which the Company consolidated for financial reporting purposes but which was treated as a separate REIT for federal income tax purposes until December 15, 2015, when MB REIT redeemed all of the outstanding shares of its Series B Preferred Stock and became a wholly owned subsidiary of InvenTrust. At that time, MB REIT became a Qualified REIT Subsidiary ("QRS") of the Company and ceased to be treated as a separate REIT for U.S. federal income tax purposes. As a QRS, MB REIT was disregarded as a separate entity from the Company for federal income tax purposes. All assets, liabilities and items of income, deduction and credit of MB REIT were treated for federal income tax purposes as those of the Company. As a result of the spin-off of Highlands, MB REIT became a wholly owned subsidiary of Highlands.
The Company has elected to treat certain of its consolidated subsidiaries, and may in the future elect to treat newly formed subsidiaries, as taxable REIT subsidiaries pursuant to the Code. Taxable REIT subsidiaries may participate in non-real estate related activities and/or perform non-customary services for tenants and are subject to federal and state income tax at regular corporate tax rates. The components of income tax expense for the years ended December 31, 2017, 2016, and 2015 are as follows:
Deferred tax assets and liabilities are included within deferred costs and other assets and other liabilities in the consolidated balance sheets, respectively. The components of the deferred tax assets and liabilities at December 31, 2017 and 2016 were as follows:
F-33
2017 2016 2015
Federal State Total Federal State Total Federal State Total
Current $ 781 $ 543 $ 1,324 $ 130 $ 71 $ 201 $ 1,244 $ 601 $ 1,845 Deferred — — — — — — — — — Income tax provision from continuing operations $ 781 $ 543 $ 1,324 $ 130 $ 71 $ 201 $ 1,244 $ 601 $ 1,845 Income tax (benefit) provision from discontinued operations $ (3 ) $ (5 ) $ (8 ) $ (1 ) $ 268 $ 267 $ (1,114 ) $ 2,058 $ 944
2017 2016
Net operating loss $ — $ — Deferred income — — Basis difference on investment in unconsolidated entities (a) (b) 27,916 73,228 Depreciation expense — — Miscellaneous — —
Total deferred tax assets 27,916 73,228 Less: Valuation allowance (27,916) (73,228)
Net deferred tax assets — —
Deferred tax liabilities $ — $ —
(a) Primarily relates to the basis difference in land of a non-core land development held by DRV.
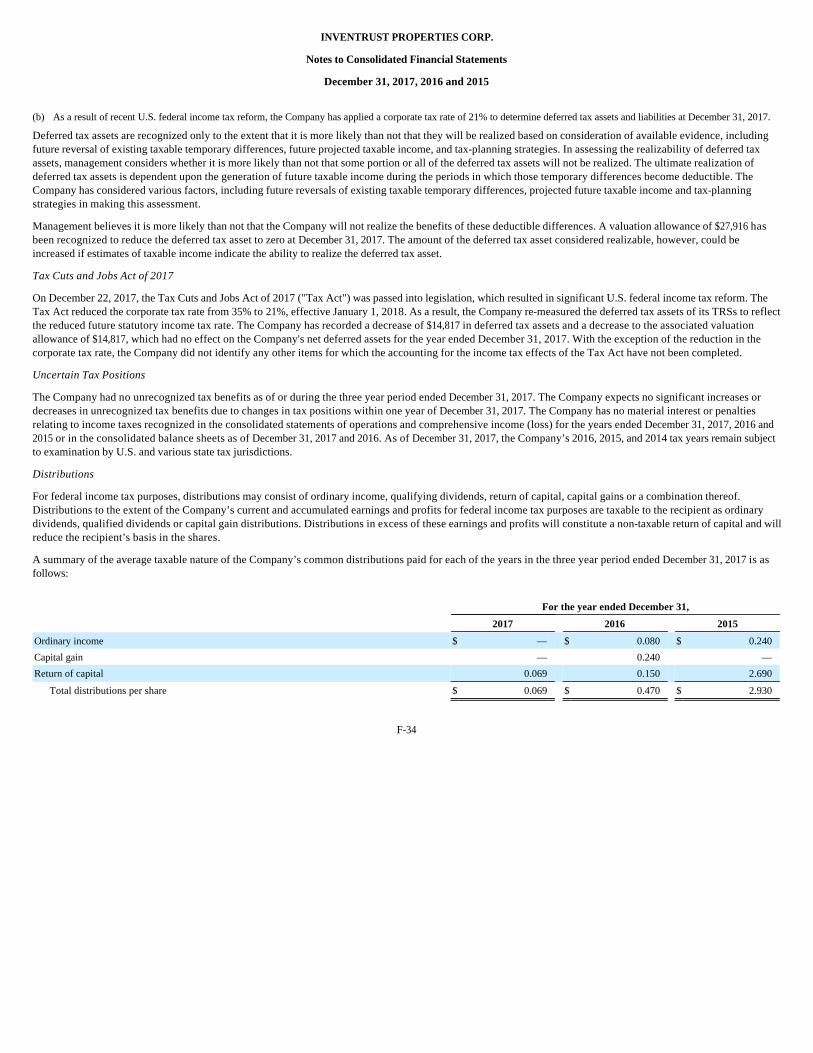
INVENTRUST PROPERTIES CORP.
Notes to Consolidated Financial Statements
December 31, 2017, 2016 and 2015
Deferred tax assets are recognized only to the extent that it is more likely than not that they will be realized based on consideration of available evidence, including future reversal of existing taxable temporary differences, future projected taxable income, and tax-planning strategies. In assessing the realizability of deferred tax assets, management considers whether it is more likely than not that some portion or all of the deferred tax assets will not be realized. The ultimate realization of deferred tax assets is dependent upon the generation of future taxable income during the periods in which those temporary differences become deductible. The Company has considered various factors, including future reversals of existing taxable temporary differences, projected future taxable income and tax-planning strategies in making this assessment.
Management believes it is more likely than not that the Company will not realize the benefits of these deductible differences. A valuation allowance of $27,916 has been recognized to reduce the deferred tax asset to zero at December 31, 2017. The amount of the deferred tax asset considered realizable, however, could be increased if estimates of taxable income indicate the ability to realize the deferred tax asset.
Tax Cuts and Jobs Act of 2017
On December 22, 2017, the Tax Cuts and Jobs Act of 2017 ("Tax Act") was passed into legislation, which resulted in significant U.S. federal income tax reform. The Tax Act reduced the corporate tax rate from 35% to 21%, effective January 1, 2018. As a result, the Company re-measured the deferred tax assets of its TRSs to reflect the reduced future statutory income tax rate. The Company has recorded a decrease of $14,817 in deferred tax assets and a decrease to the associated valuation allowance of $14,817, which had no effect on the Company's net deferred assets for the year ended December 31, 2017. With the exception of the reduction in the corporate tax rate, the Company did not identify any other items for which the accounting for the income tax effects of the Tax Act have not been completed.
Uncertain Tax Positions
The Company had no unrecognized tax benefits as of or during the three year period ended December 31, 2017. The Company expects no significant increases or decreases in unrecognized tax benefits due to changes in tax positions within one year of December 31, 2017. The Company has no material interest or penalties relating to income taxes recognized in the consolidated statements of operations and comprehensive income (loss) for the years ended December 31, 2017, 2016 and 2015 or in the consolidated balance sheets as of December 31, 2017 and 2016. As of December 31, 2017, the Company’s 2016, 2015, and 2014 tax years remain subject to examination by U.S. and various state tax jurisdictions.
Distributions
For federal income tax purposes, distributions may consist of ordinary income, qualifying dividends, return of capital, capital gains or a combination thereof. Distributions to the extent of the Company’s current and accumulated earnings and profits for federal income tax purposes are taxable to the recipient as ordinary dividends, qualified dividends or capital gain distributions. Distributions in excess of these earnings and profits will constitute a non-taxable return of capital and will reduce the recipient’s basis in the shares.
A summary of the average taxable nature of the Company’s common distributions paid for each of the years in the three year period ended December 31, 2017 is as follows:
F-34
(b) As a result of recent U.S. federal income tax reform, the Company has applied a corporate tax rate of 21% to determine deferred tax assets and liabilities at December 31, 2017.
For the year ended December 31,
2017 2016 2015
Ordinary income $ — $ 0.080 $ 0.240 Capital gain — 0.240 — Return of capital 0.069 0.150 2.690
Total distributions per share $ 0.069 $ 0.470 $ 2.930
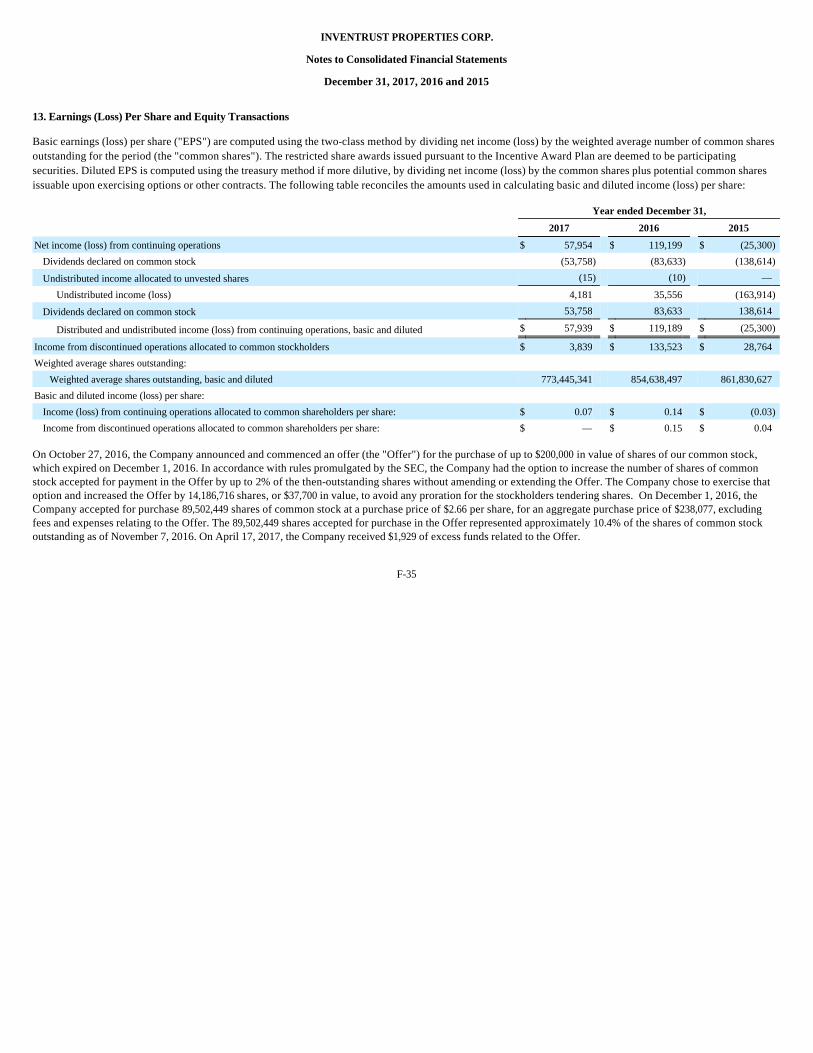
INVENTRUST PROPERTIES CORP.
Notes to Consolidated Financial Statements
December 31, 2017, 2016 and 2015
13. Earnings (Loss) Per Share and Equity Transactions
Basic earnings (loss) per share ("EPS") are computed using the two-class method by dividing net income (loss) by the weighted average number of common shares outstanding for the period (the "common shares"). The restricted share awards issued pursuant to the Incentive Award Plan are deemed to be participating securities. Diluted EPS is computed using the treasury method if more dilutive, by dividing net income (loss) by the common shares plus potential common shares issuable upon exercising options or other contracts. The following table reconciles the amounts used in calculating basic and diluted income (loss) per share:
On October 27, 2016, the Company announced and commenced an offer (the "Offer") for the purchase of up to $200,000 in value of shares of our common stock, which expired on December 1, 2016. In accordance with rules promulgated by the SEC, the Company had the option to increase the number of shares of common stock accepted for payment in the Offer by up to 2% of the then-outstanding shares without amending or extending the Offer. The Company chose to exercise that option and increased the Offer by 14,186,716 shares, or $37,700 in value, to avoid any proration for the stockholders tendering shares. On December 1, 2016, the Company accepted for purchase 89,502,449 shares of common stock at a purchase price of $2.66 per share, for an aggregate purchase price of $238,077, excluding fees and expenses relating to the Offer. The 89,502,449 shares accepted for purchase in the Offer represented approximately 10.4% of the shares of common stock outstanding as of November 7, 2016. On April 17, 2017, the Company received $1,929 of excess funds related to the Offer.
F-35
Year ended December 31,
2017 2016 2015
Net income (loss) from continuing operations $ 57,954 $ 119,199 $ (25,300)
Dividends declared on common stock (53,758) (83,633) (138,614)
Undistributed income allocated to unvested shares (15) (10) — Undistributed income (loss) 4,181 35,556 (163,914)
Dividends declared on common stock 53,758 83,633 138,614
Distributed and undistributed income (loss) from continuing operations, basic and diluted $ 57,939 $ 119,189 $ (25,300)
Income from discontinued operations allocated to common stockholders $ 3,839 $ 133,523 $ 28,764 Weighted average shares outstanding:
Weighted average shares outstanding, basic and diluted 773,445,341 854,638,497 861,830,627 Basic and diluted income (loss) per share:
Income (loss) from continuing operations allocated to common shareholders per share: $ 0.07 $ 0.14 $ (0.03)
Income from discontinued operations allocated to common shareholders per share: $ — $ 0.15 $ 0.04

INVENTRUST PROPERTIES CORP.
Notes to Consolidated Financial Statements
December 31, 2017, 2016 and 2015
14. Stock-Based Compensation
Share Unit Plans
During 2014, the Company adopted the following three long-term incentive plans: (1) the Inland American Real Estate Trust, Inc. 2014 Share Unit Plan (the "Retail Plan"), with respect to the Company's retail business; (2) the Xenia Hotels & Resorts, Inc. 2014 Share Unit Plan (the "Lodging Plan"), with respect to the Company's lodging business; and (3) the Inland American Communities Group, Inc. 2014 Share Unit Plan (the "Student Housing Plan"), with respect to the Company's student housing business (collectively, the "Share Unit Plans"). Each Share Unit Plan provided for the grant of "share unit" awards to eligible participants. The value of a "share unit" was estimated based on a phantom capitalization of the Company's retail/non-core business, lodging business and student housing business, and does not necessarily correspond to the value of a share of common stock of the Company, Xenia or Inland American Communities Group, Inc. (University House Communities Group, Inc.), as applicable. Vesting of the share units is conditioned upon the occurrence of a triggering event, such as a listing or a change in control of the applicable business, and if no triggering event occurs within five years following the applicable grant date, then the share units are forfeited. The Company does not recognize share-based compensation expense with respect to the Share Unit Plans until the occurrence of a triggering event.
On January 9, 2015, in connection with the spin-off of the lodging business, the Company terminated the Lodging Plan. No new share unit awards will be made under the Lodging Plan, and the Lodging Plan will be maintained by Xenia going forward with respect to awards outstanding as of the termination of the plan.
As of June 19, 2015, in connection with the adoption of the Incentive Award Plan (as defined below), the Company terminated the Retail Plan. Awards outstanding as of June 19, 2015 with a grant date value of $7,845 under the Retail Plan will remain outstanding and subject to the terms of the Retail Plan and the applicable award agreement. No additional awards will be granted under the Retail Plan.
The closing of the student housing platform sale on June 21, 2016 was a triggering event under the Student Housing Plan. As of June 20, 2016, share unit awards granted in 2016, 2015 and 2014 with an aggregate vested value of $2,246, $1,796, and $833, respectively, were outstanding under the Student Housing Plan, and were paid as part of the closing of the student housing platform sale and recorded as an offset of the gain on the student housing platform sale, which was included in discontinued operations on the consolidated statements of operations and comprehensive income (loss) for year ended December 31, 2016. Certain share unit awards vested under the Student Housing Plan during the year ended December 31, 2016, with an aggregate value of $313, were included in continuing operations on the consolidated statements of operations and comprehensive income (loss).
As a triggering event has not occurred with respect to the Company's retail business, the Company did not recognize stock-based compensation expense related to the Retail Plan for the years ended December 31, 2017, 2016, or 2015.
F-36
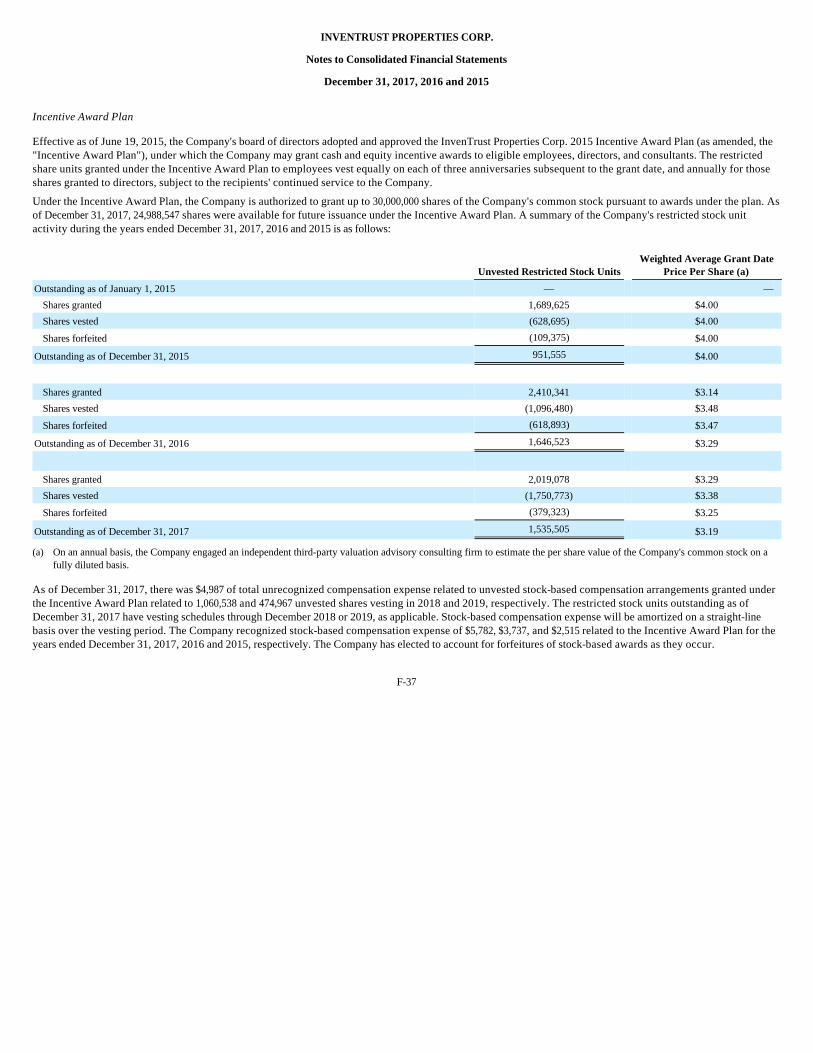
INVENTRUST PROPERTIES CORP.
Notes to Consolidated Financial Statements
December 31, 2017, 2016 and 2015
Incentive Award Plan
Effective as of June 19, 2015, the Company's board of directors adopted and approved the InvenTrust Properties Corp. 2015 Incentive Award Plan (as amended, the "Incentive Award Plan"), under which the Company may grant cash and equity incentive awards to eligible employees, directors, and consultants. The restricted share units granted under the Incentive Award Plan to employees vest equally on each of three anniversaries subsequent to the grant date, and annually for those shares granted to directors, subject to the recipients' continued service to the Company.
Under the Incentive Award Plan, the Company is authorized to grant up to 30,000,000 shares of the Company's common stock pursuant to awards under the plan. As of December 31, 2017, 24,988,547 shares were available for future issuance under the Incentive Award Plan. A summary of the Company's restricted stock unit activity during the years ended December 31, 2017, 2016 and 2015 is as follows:
As of December 31, 2017, there was $4,987 of total unrecognized compensation expense related to unvested stock-based compensation arrangements granted under the Incentive Award Plan related to 1,060,538 and 474,967 unvested shares vesting in 2018 and 2019, respectively. The restricted stock units outstanding as of December 31, 2017 have vesting schedules through December 2018 or 2019, as applicable. Stock-based compensation expense will be amortized on a straight-line basis over the vesting period. The Company recognized stock-based compensation expense of $5,782, $3,737, and $2,515 related to the Incentive Award Plan for the years ended December 31, 2017, 2016 and 2015, respectively. The Company has elected to account for forfeitures of stock-based awards as they occur.
F-37
Unvested Restricted Stock Units Weighted Average Grant Date
Price Per Share (a)
Outstanding as of January 1, 2015 — — Shares granted 1,689,625 $4.00
Shares vested (628,695) $4.00
Shares forfeited (109,375) $4.00
Outstanding as of December 31, 2015 951,555 $4.00
Shares granted 2,410,341 $3.14
Shares vested (1,096,480) $3.48
Shares forfeited (618,893) $3.47
Outstanding as of December 31, 2016 1,646,523 $3.29
Shares granted 2,019,078 $3.29
Shares vested (1,750,773) $3.38
Shares forfeited (379,323) $3.25
Outstanding as of December 31, 2017 1,535,505 $3.19
(a) On an annual basis, the Company engaged an independent third-party valuation advisory consulting firm to estimate the per share value of the Company's common stock on a fully diluted basis.

INVENTRUST PROPERTIES CORP.
Notes to Consolidated Financial Statements
December 31, 2017, 2016 and 2015
15. Commitments and Contingencies
The Company is subject, from time to time, to various types of third-party legal claims or litigation that arise in the ordinary course of business, including, but not limited to, property loss claims, personal injury or other damages resulting from contact with the Company’s properties. These claims and lawsuits and any resulting damages are generally covered by the Company's insurance policies. The Company accrues for legal costs associated with loss contingencies when these costs are probable and reasonably estimable. While the resolution of these matters cannot be predicted with certainty, management does not expect, based on currently available information, that the final outcome of any pending claims or legal proceedings will have a material adverse effect on the financial condition, results of operations or cash flows of the Company.
Legacy Corner Apartments
As previously disclosed in our Quarterly Report for the quarter ended June 30, 2017, on September 6, 2013, a former tenant at the Legacy Corner Apartments property in Midwest City, Oklahoma filed a complaint in the District Court of Oklahoma County against the Company and other named defendants, Case No. CJ-2013-5011, alleging premises liability and negligent maintenance. At December 31, 2016, based on the facts and circumstances of this case, the Company believed it had a viable defense and was prepared to defend the suit vigorously. Due to the pendency of the Company's defenses and insurance policies, together with the inherent difficulty and uncertainty of predicting the outcome of litigation generally, the Company did not believe a loss associated with compensatory damages was probable. Furthermore, the Company did not believe a risk of loss associated with punitive damages, which would be awarded due to gross negligence, was probable based on the information known, nor did the Company know an estimated range of uninsured punitive damages. Accordingly, at December 31, 2016, no loss contingency amounts related to this case had been accrued.
The jury trial commenced on April 3, 2017. On April 12, 2017, the jury entered a verdict against the Company’s subsidiary and the other named defendants in favor of the plaintiff of $6,000 in compensatory damages and $6,000 in punitive damages. The compensatory portion of the verdict is fully insured by the Company’s insurance policies. However, the Company's insurance carrier served the Company with a reservation of rights letter stating that insurance coverage may not be provided for punitive damages awarded in this case. As a result, the Company’s potential loss contingency exposure was $6,000. The Company had been advised by counsel that the Company had several potential mitigating factors available to it, which should have resulted in a reduced punitive award. Based on GAAP standards, the Company accrued for a potential loss contingency of $3,000 on the consolidated statement of operations and comprehensive (loss) income as part of other (expense) income for the three months ended March 31, 2017.
On July 27, 2017, the plaintiff asserted a demand against the Company’s subsidiary and the other named defendants to settle the lawsuit through arbitration in exchange for an amount less than the total damages awarded. Subsequent to negotiations with the Company's insurance carrier, the Company recorded a $2,447 credit to other expenses related to the partial reversal of its previously recorded loss contingency of $3,000 as of March 31, 2017, to reflect the $553 portion of the final settlement paid by the Company during the year ended December 31, 2017.
University House Communities Group, Inc., Indemnity Claims
The Company received an indemnity notice from UHC Acquisition Sub LLC ("UHC") regarding certain matters under the Stock Purchase Agreement, dated January 3, 2016, for University House Communities Group, Inc., which was sold in June 2016. The notice sets forth various items for which UHC believes they are entitled to indemnification from the Company. In the normal course of property dispositions, pursuant to the purchase and sale agreements, certain indemnification claims can be made against the Company by the purchaser, in which the Company will continue to make adjustments to the financial statements, as necessary, based on those claims. Based on the facts and circumstances of the indemnification claims made, guidance provided by third-party specialists and counsel, and management’s initial and ongoing assessment of the UHC claims, the Company accrued a potential loss contingency on the consolidated financial statements as of and for the year ended December 31, 2017; the impact of the accrual was not material to the overall consolidated financial statements. Management has accrued their best estimate of the potential loss related to these claims, but, due to the preliminary nature of this matter, the ultimate resolution could result in a loss of up to $5,000 in excess of the amount accrued.
Leasing commitments
One of the Company’s retail properties is subject to a ground lease. The Company records ground rent expense on a straight-line basis over the term of the lease. The lease requires rental payments based upon the appraised value of the property at
F-38
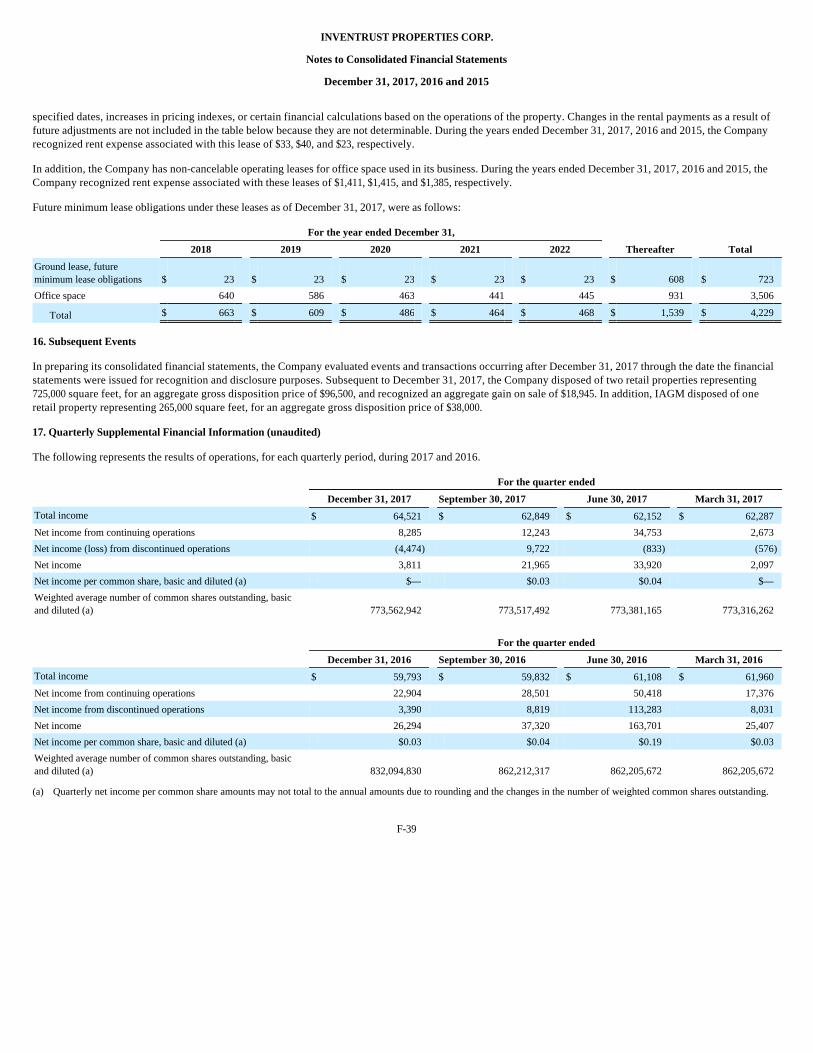
INVENTRUST PROPERTIES CORP.
Notes to Consolidated Financial Statements
December 31, 2017, 2016 and 2015
specified dates, increases in pricing indexes, or certain financial calculations based on the operations of the property. Changes in the rental payments as a result of future adjustments are not included in the table below because they are not determinable. During the years ended December 31, 2017, 2016 and 2015, the Company recognized rent expense associated with this lease of $33, $40, and $23, respectively.
In addition, the Company has non-cancelable operating leases for office space used in its business. During the years ended December 31, 2017, 2016 and 2015, the Company recognized rent expense associated with these leases of $1,411, $1,415, and $1,385, respectively.
Future minimum lease obligations under these leases as of December 31, 2017, were as follows:
16. Subsequent Events
In preparing its consolidated financial statements, the Company evaluated events and transactions occurring after December 31, 2017 through the date the financial statements were issued for recognition and disclosure purposes. Subsequent to December 31, 2017, the Company disposed of two retail properties representing 725,000 square feet, for an aggregate gross disposition price of $96,500, and recognized an aggregate gain on sale of $18,945. In addition, IAGM disposed of one retail property representing 265,000 square feet, for an aggregate gross disposition price of $38,000.
17. Quarterly Supplemental Financial Information (unaudited)
The following represents the results of operations, for each quarterly period, during 2017 and 2016.
F-39
For the year ended December 31,
2018 2019 2020 2021 2022 Thereafter Total
Ground lease, future minimum lease obligations $ 23 $ 23 $ 23 $ 23 $ 23 $ 608 $ 723 Office space 640 586 463 441 445 931 3,506
Total $ 663 $ 609 $ 486 $ 464 $ 468 $ 1,539 $ 4,229
For the quarter ended
December 31, 2017 September 30, 2017 June 30, 2017 March 31, 2017
Total income $ 64,521 $ 62,849 $ 62,152 $ 62,287 Net income from continuing operations 8,285 12,243 34,753 2,673 Net income (loss) from discontinued operations (4,474) 9,722 (833) (576)
Net income 3,811 21,965 33,920 2,097 Net income per common share, basic and diluted (a) $— $0.03 $0.04 $— Weighted average number of common shares outstanding, basic and diluted (a) 773,562,942 773,517,492 773,381,165 773,316,262
For the quarter ended
December 31, 2016 September 30, 2016 June 30, 2016 March 31, 2016
Total income $ 59,793 $ 59,832 $ 61,108 $ 61,960 Net income from continuing operations 22,904 28,501 50,418 17,376 Net income from discontinued operations 3,390 8,819 113,283 8,031 Net income 26,294 37,320 163,701 25,407 Net income per common share, basic and diluted (a) $0.03 $0.04 $0.19 $0.03 Weighted average number of common shares outstanding, basic and diluted (a) 832,094,830 862,212,317 862,205,672 862,205,672
(a) Quarterly net income per common share amounts may not total to the annual amounts due to rounding and the changes in the number of weighted common shares outstanding.
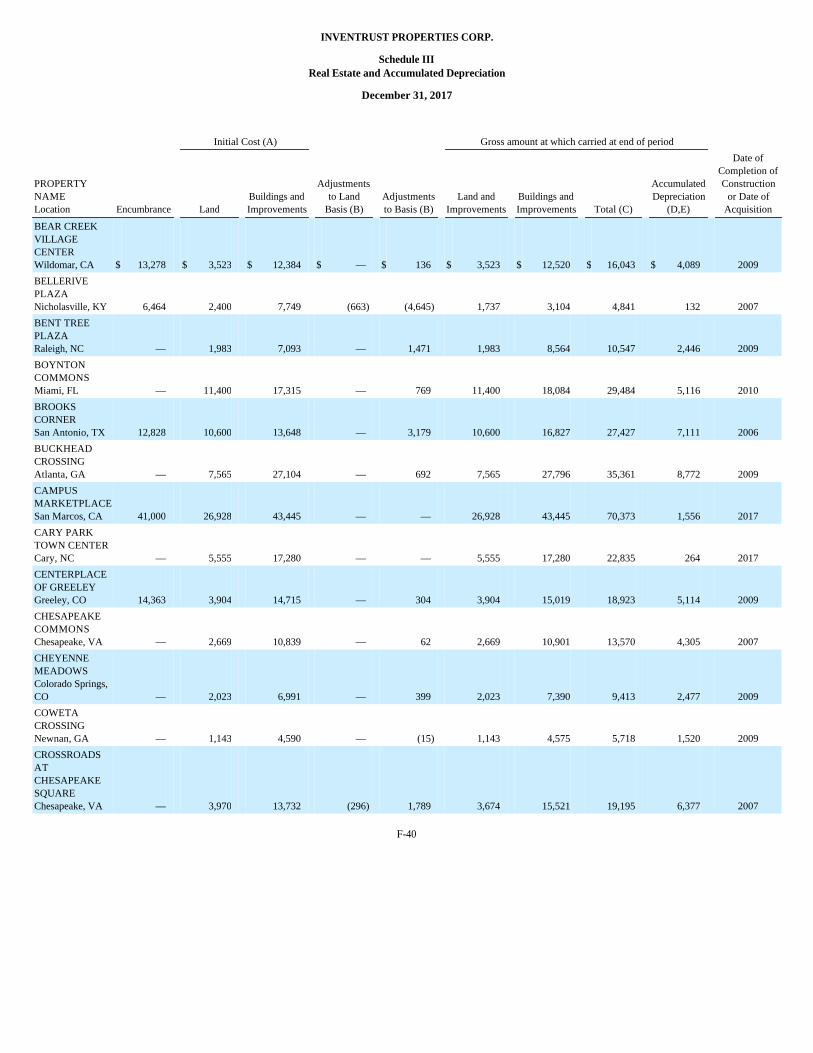
INVENTRUST PROPERTIES CORP.
Schedule III Real Estate and Accumulated Depreciation
December 31, 2017
F-40
Initial Cost (A) Gross amount at which carried at end of period
PROPERTY NAME Location Encumbrance Land
Buildings and Improvements
Adjustments to Land
Basis (B) Adjustments to Basis (B)
Land and Improvements
Buildings and Improvements Total (C)
Accumulated Depreciation
(D,E)
Date of Completion of Construction
or Date of Acquisition
BEAR CREEK VILLAGE CENTER Wildomar, CA $ 13,278 $ 3,523 $ 12,384 $ — $ 136 $ 3,523 $ 12,520 $ 16,043 $ 4,089 2009
BELLERIVE PLAZA Nicholasville, KY 6,464 2,400 7,749 (663 ) (4,645 ) 1,737 3,104 4,841 132 2007
BENT TREE PLAZA Raleigh, NC — 1,983 7,093 — 1,471 1,983 8,564 10,547 2,446 2009
BOYNTON COMMONS Miami, FL — 11,400 17,315 — 769 11,400 18,084 29,484 5,116 2010
BROOKS CORNER San Antonio, TX 12,828 10,600 13,648 — 3,179 10,600 16,827 27,427 7,111 2006
BUCKHEAD CROSSING Atlanta, GA — 7,565 27,104 — 692 7,565 27,796 35,361 8,772 2009
CAMPUS MARKETPLACE San Marcos, CA 41,000 26,928 43,445 — — 26,928 43,445 70,373 1,556 2017
CARY PARK TOWN CENTER Cary, NC — 5,555 17,280 — — 5,555 17,280 22,835 264 2017
CENTERPLACE OF GREELEY Greeley, CO 14,363 3,904 14,715 — 304 3,904 15,019 18,923 5,114 2009
CHESAPEAKE COMMONS Chesapeake, VA — 2,669 10,839 — 62 2,669 10,901 13,570 4,305 2007
CHEYENNE MEADOWS Colorado Springs, CO — 2,023 6,991 — 399 2,023 7,390 9,413 2,477 2009
COWETA CROSSING Newnan, GA — 1,143 4,590 — (15 ) 1,143 4,575 5,718 1,520 2009
CROSSROADS AT CHESAPEAKE SQUARE Chesapeake, VA — 3,970 13,732 (296 ) 1,789 3,674 15,521 19,195 6,377 2007
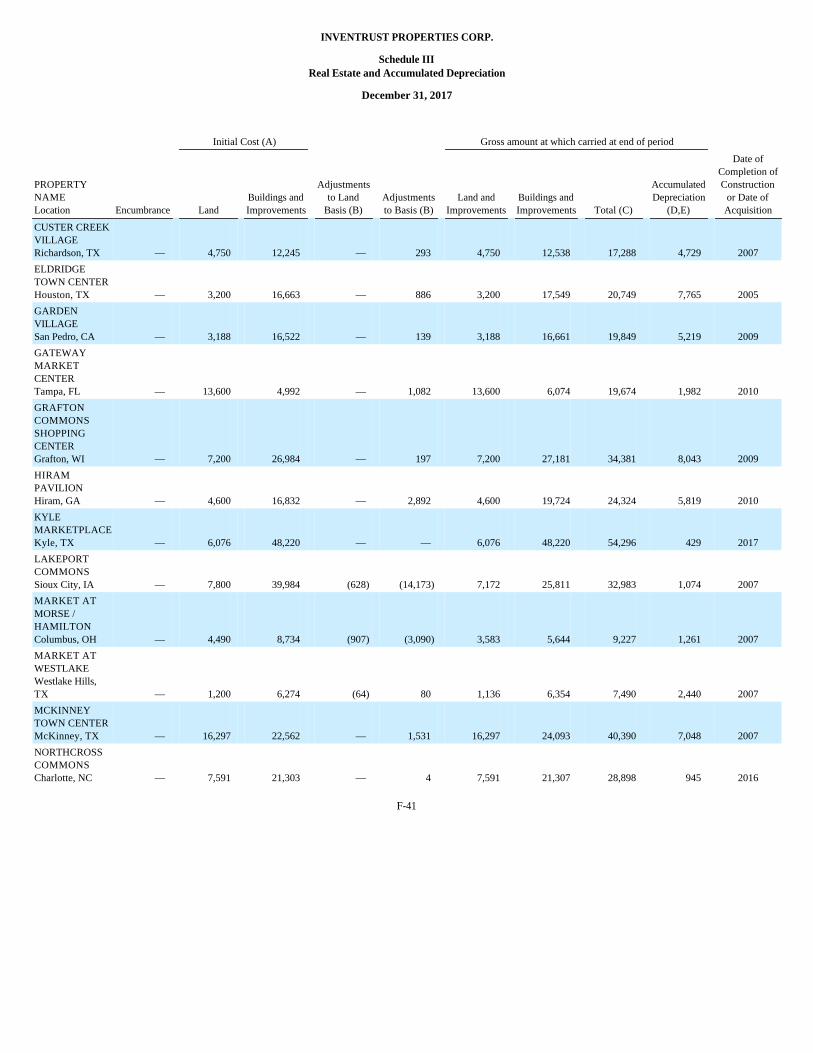
INVENTRUST PROPERTIES CORP.
Schedule III Real Estate and Accumulated Depreciation
December 31, 2017
F-41
Initial Cost (A) Gross amount at which carried at end of period
PROPERTY NAME Location Encumbrance Land
Buildings and Improvements
Adjustments to Land
Basis (B) Adjustments to Basis (B)
Land and Improvements
Buildings and Improvements Total (C)
Accumulated Depreciation
(D,E)
Date of Completion of Construction
or Date of Acquisition
CUSTER CREEK VILLAGE Richardson, TX — 4,750 12,245 — 293 4,750 12,538 17,288 4,729 2007
ELDRIDGE TOWN CENTER Houston, TX — 3,200 16,663 — 886 3,200 17,549 20,749 7,765 2005
GARDEN VILLAGE San Pedro, CA — 3,188 16,522 — 139 3,188 16,661 19,849 5,219 2009
GATEWAY MARKET CENTER Tampa, FL — 13,600 4,992 — 1,082 13,600 6,074 19,674 1,982 2010
GRAFTON COMMONS SHOPPING CENTER Grafton, WI — 7,200 26,984 — 197 7,200 27,181 34,381 8,043 2009
HIRAM PAVILION Hiram, GA — 4,600 16,832 — 2,892 4,600 19,724 24,324 5,819 2010
KYLE MARKETPLACE Kyle, TX — 6,076 48,220 — — 6,076 48,220 54,296 429 2017
LAKEPORT COMMONS Sioux City, IA — 7,800 39,984 (628) (14,173) 7,172 25,811 32,983 1,074 2007
MARKET AT MORSE / HAMILTON Columbus, OH — 4,490 8,734 (907) (3,090) 3,583 5,644 9,227 1,261 2007
MARKET AT WESTLAKE Westlake Hills, TX — 1,200 6,274 (64) 80 1,136 6,354 7,490 2,440 2007
MCKINNEY TOWN CENTER McKinney, TX — 16,297 22,562 — 1,531 16,297 24,093 40,390 7,048 2007
NORTHCROSS COMMONS Charlotte, NC — 7,591 21,303 — 4 7,591 21,307 28,898 945 2016
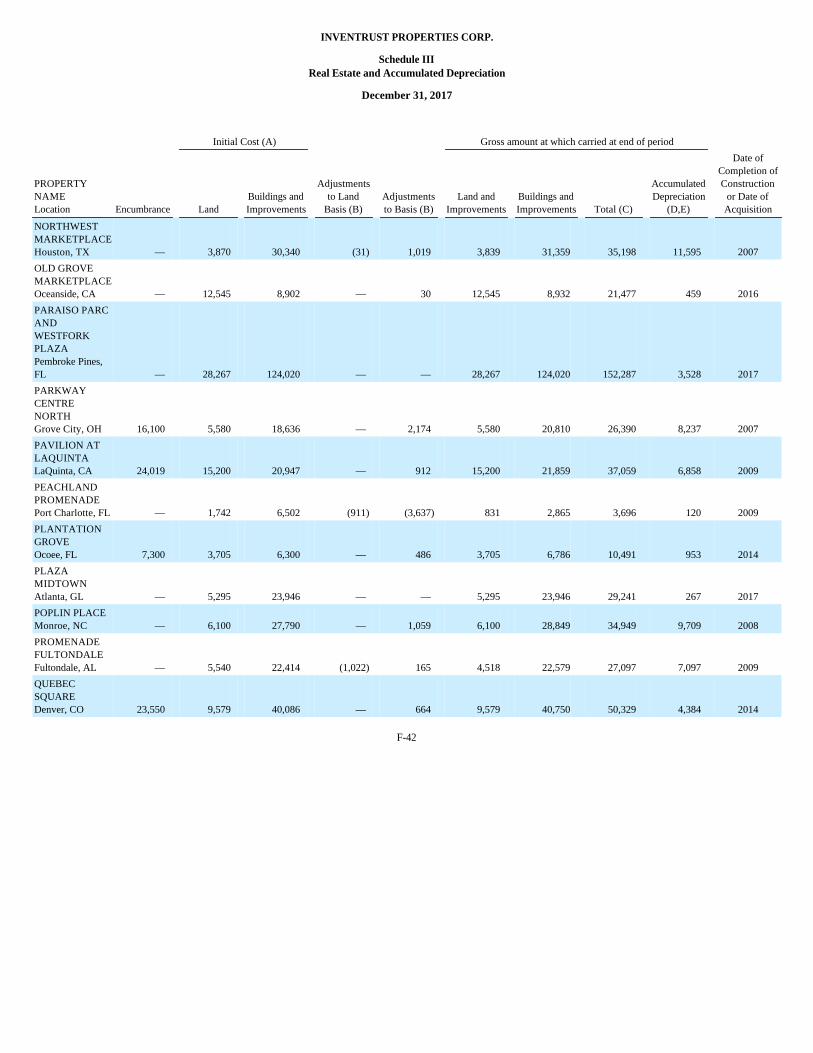
INVENTRUST PROPERTIES CORP.
Schedule III Real Estate and Accumulated Depreciation
December 31, 2017
F-42
Initial Cost (A) Gross amount at which carried at end of period
PROPERTY NAME Location Encumbrance Land
Buildings and Improvements
Adjustments to Land
Basis (B) Adjustments to Basis (B)
Land and Improvements
Buildings and Improvements Total (C)
Accumulated Depreciation
(D,E)
Date of Completion of Construction
or Date of Acquisition
NORTHWEST MARKETPLACE Houston, TX — 3,870 30,340 (31 ) 1,019 3,839 31,359 35,198 11,595 2007
OLD GROVE MARKETPLACE Oceanside, CA — 12,545 8,902 — 30 12,545 8,932 21,477 459 2016
PARAISO PARC AND WESTFORK PLAZA Pembroke Pines, FL — 28,267 124,020 — — 28,267 124,020 152,287 3,528 2017
PARKWAY CENTRE NORTH Grove City, OH 16,100 5,580 18,636 — 2,174 5,580 20,810 26,390 8,237 2007
PAVILION AT LAQUINTA LaQuinta, CA 24,019 15,200 20,947 — 912 15,200 21,859 37,059 6,858 2009
PEACHLAND PROMENADE Port Charlotte, FL — 1,742 6,502 (911 ) (3,637 ) 831 2,865 3,696 120 2009
PLANTATION GROVE Ocoee, FL 7,300 3,705 6,300 — 486 3,705 6,786 10,491 953 2014
PLAZA MIDTOWN Atlanta, GL — 5,295 23,946 — — 5,295 23,946 29,241 267 2017
POPLIN PLACE Monroe, NC — 6,100 27,790 — 1,059 6,100 28,849 34,949 9,709 2008
PROMENADE FULTONDALE Fultondale, AL — 5,540 22,414 (1,022 ) 165 4,518 22,579 27,097 7,097 2009
QUEBEC SQUARE Denver, CO 23,550 9,579 40,086 — 664 9,579 40,750 50,329 4,384 2014
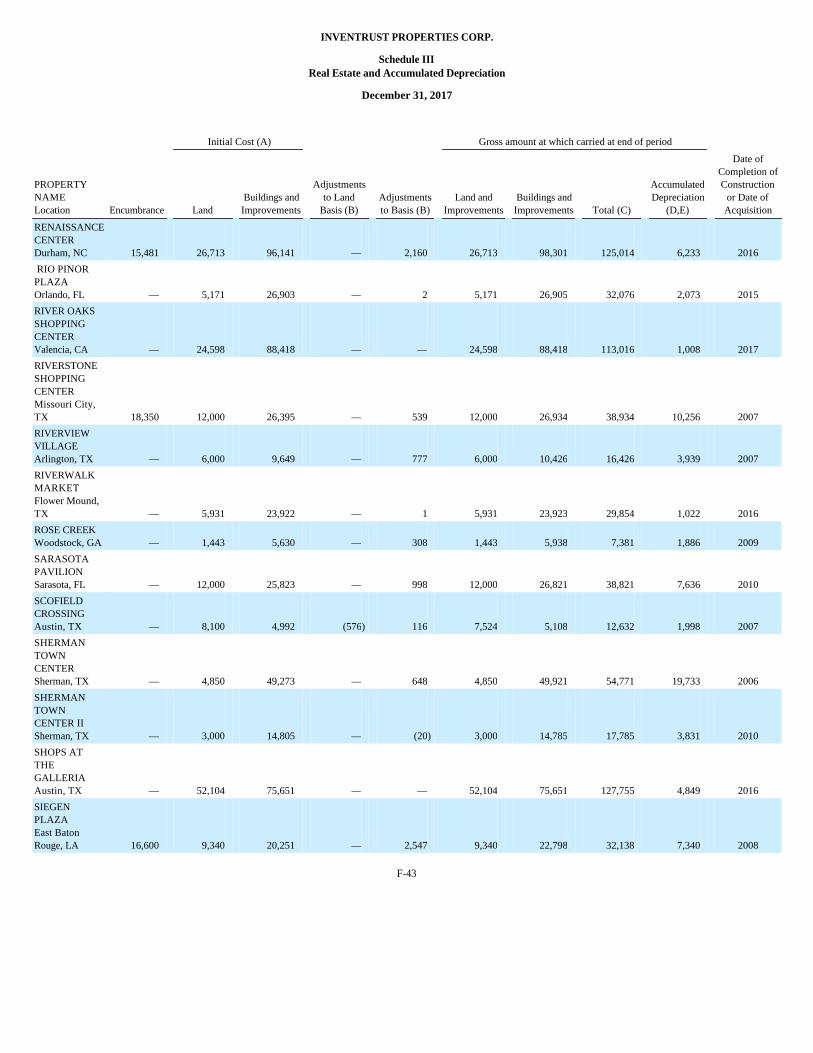
INVENTRUST PROPERTIES CORP.
Schedule III Real Estate and Accumulated Depreciation
December 31, 2017
F-43
Initial Cost (A) Gross amount at which carried at end of period
PROPERTY NAME Location Encumbrance Land
Buildings and Improvements
Adjustments to Land
Basis (B) Adjustments to Basis (B)
Land and Improvements
Buildings and Improvements Total (C)
Accumulated Depreciation
(D,E)
Date of Completion of Construction
or Date of Acquisition
RENAISSANCE CENTER Durham, NC 15,481 26,713 96,141 — 2,160 26,713 98,301 125,014 6,233 2016
RIO PINOR PLAZA Orlando, FL — 5,171 26,903 — 2 5,171 26,905 32,076 2,073 2015
RIVER OAKS SHOPPING CENTER Valencia, CA — 24,598 88,418 — — 24,598 88,418 113,016 1,008 2017
RIVERSTONE SHOPPING CENTER Missouri City, TX 18,350 12,000 26,395 — 539 12,000 26,934 38,934 10,256 2007
RIVERVIEW VILLAGE Arlington, TX — 6,000 9,649 — 777 6,000 10,426 16,426 3,939 2007
RIVERWALK MARKET Flower Mound, TX — 5,931 23,922 — 1 5,931 23,923 29,854 1,022 2016
ROSE CREEK Woodstock, GA — 1,443 5,630 — 308 1,443 5,938 7,381 1,886 2009
SARASOTA PAVILION Sarasota, FL — 12,000 25,823 — 998 12,000 26,821 38,821 7,636 2010
SCOFIELD CROSSING Austin, TX — 8,100 4,992 (576) 116 7,524 5,108 12,632 1,998 2007
SHERMAN TOWN CENTER Sherman, TX — 4,850 49,273 — 648 4,850 49,921 54,771 19,733 2006
SHERMAN TOWN CENTER II Sherman, TX — 3,000 14,805 — (20) 3,000 14,785 17,785 3,831 2010
SHOPS AT THE GALLERIA Austin, TX — 52,104 75,651 — — 52,104 75,651 127,755 4,849 2016
SIEGEN PLAZA East Baton Rouge, LA 16,600 9,340 20,251 — 2,547 9,340 22,798 32,138 7,340 2008
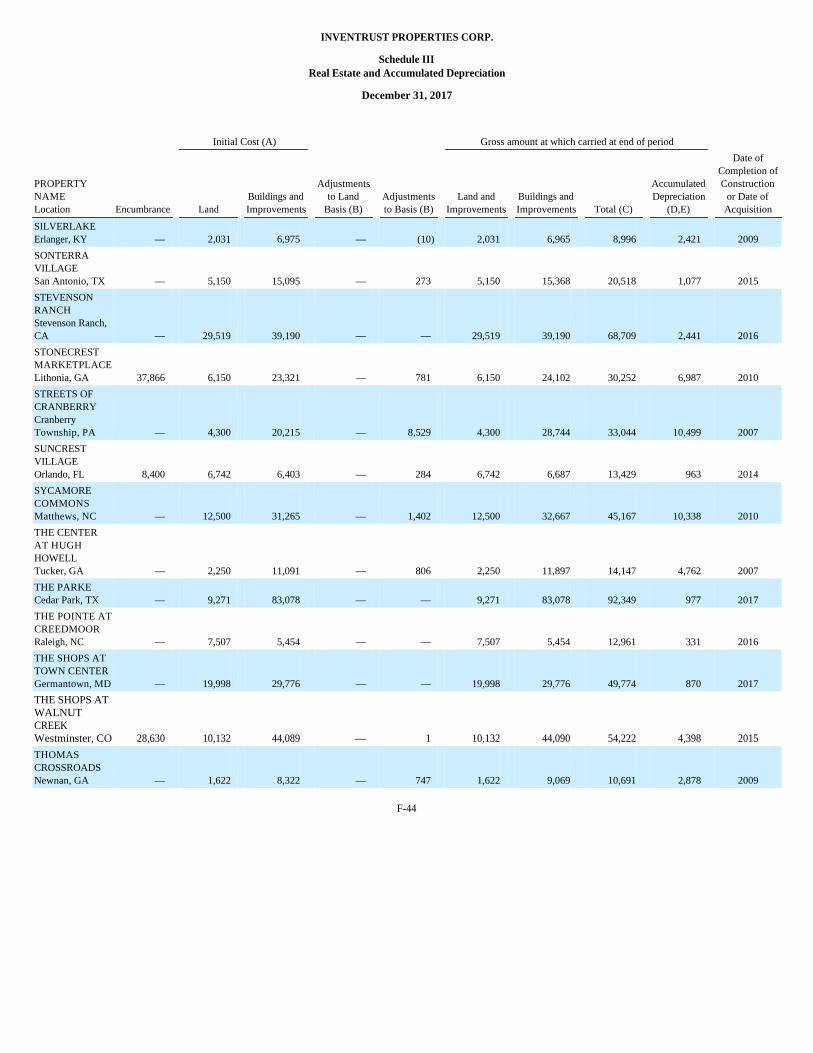
INVENTRUST PROPERTIES CORP.
Schedule III Real Estate and Accumulated Depreciation
December 31, 2017
F-44
Initial Cost (A) Gross amount at which carried at end of period
PROPERTY NAME Location Encumbrance Land
Buildings and Improvements
Adjustments to Land
Basis (B) Adjustments to Basis (B)
Land and Improvements
Buildings and Improvements Total (C)
Accumulated Depreciation
(D,E)
Date of Completion of Construction
or Date of Acquisition
SILVERLAKE Erlanger, KY — 2,031 6,975 — (10 ) 2,031 6,965 8,996 2,421 2009
SONTERRA VILLAGE San Antonio, TX — 5,150 15,095 — 273 5,150 15,368 20,518 1,077 2015
STEVENSON RANCH Stevenson Ranch, CA — 29,519 39,190 — — 29,519 39,190 68,709 2,441 2016
STONECREST MARKETPLACE Lithonia, GA 37,866 6,150 23,321 — 781 6,150 24,102 30,252 6,987 2010
STREETS OF CRANBERRY Cranberry Township, PA — 4,300 20,215 — 8,529 4,300 28,744 33,044 10,499 2007
SUNCREST VILLAGE Orlando, FL 8,400 6,742 6,403 — 284 6,742 6,687 13,429 963 2014
SYCAMORE COMMONS Matthews, NC — 12,500 31,265 — 1,402 12,500 32,667 45,167 10,338 2010
THE CENTER AT HUGH HOWELL Tucker, GA — 2,250 11,091 — 806 2,250 11,897 14,147 4,762 2007
THE PARKE Cedar Park, TX — 9,271 83,078 — — 9,271 83,078 92,349 977 2017
THE POINTE AT CREEDMOOR Raleigh, NC — 7,507 5,454 — — 7,507 5,454 12,961 331 2016
THE SHOPS AT TOWN CENTER Germantown, MD — 19,998 29,776 — — 19,998 29,776 49,774 870 2017
THE SHOPS AT WALNUT CREEK Westminster, CO 28,630 10,132 44,089 — 1 10,132 44,090 54,222 4,398 2015
THOMAS CROSSROADS Newnan, GA — 1,622 8,322 — 747 1,622 9,069 10,691 2,878 2009
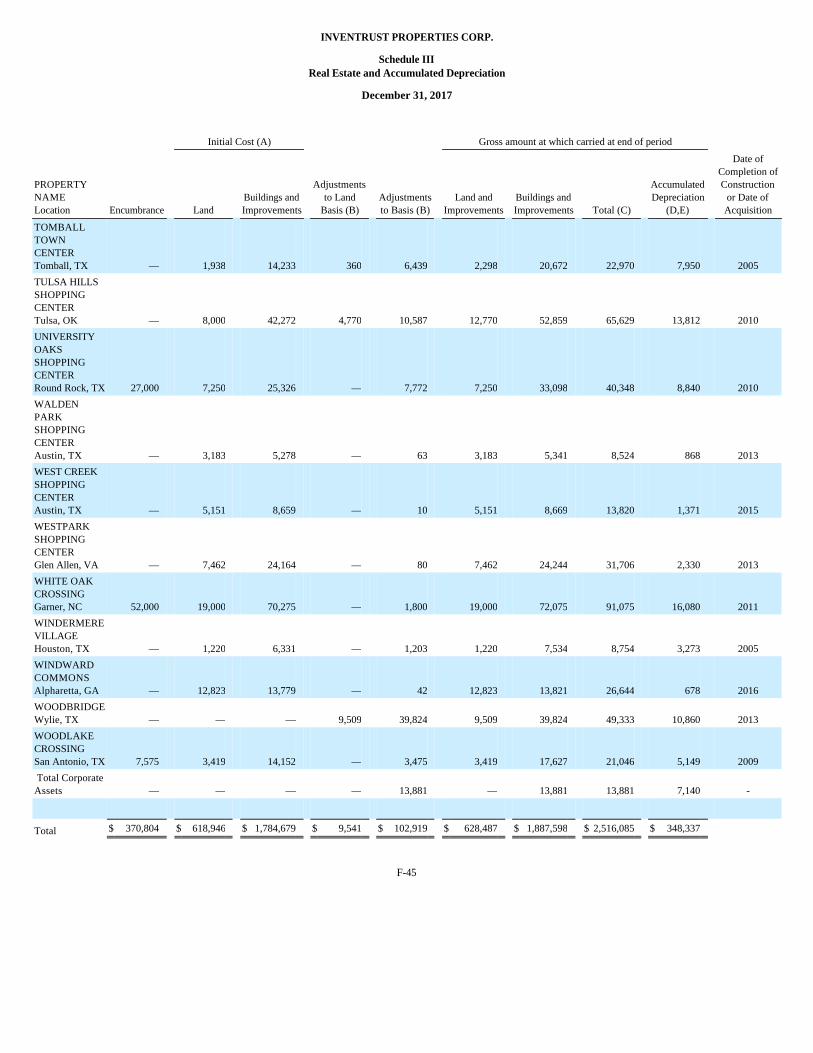
INVENTRUST PROPERTIES CORP.
Schedule III Real Estate and Accumulated Depreciation
December 31, 2017
F-45
Initial Cost (A) Gross amount at which carried at end of period
PROPERTY NAME Location Encumbrance Land
Buildings and Improvements
Adjustments to Land
Basis (B) Adjustments to Basis (B)
Land and Improvements
Buildings and Improvements Total (C)
Accumulated Depreciation
(D,E)
Date of Completion of Construction
or Date of Acquisition
TOMBALL TOWN CENTER Tomball, TX — 1,938 14,233 360 6,439 2,298 20,672 22,970 7,950 2005
TULSA HILLS SHOPPING CENTER Tulsa, OK — 8,000 42,272 4,770 10,587 12,770 52,859 65,629 13,812 2010
UNIVERSITY OAKS SHOPPING CENTER Round Rock, TX 27,000 7,250 25,326 — 7,772 7,250 33,098 40,348 8,840 2010
WALDEN PARK SHOPPING CENTER Austin, TX — 3,183 5,278 — 63 3,183 5,341 8,524 868 2013
WEST CREEK SHOPPING CENTER Austin, TX — 5,151 8,659 — 10 5,151 8,669 13,820 1,371 2015
WESTPARK SHOPPING CENTER Glen Allen, VA — 7,462 24,164 — 80 7,462 24,244 31,706 2,330 2013
WHITE OAK CROSSING Garner, NC 52,000 19,000 70,275 — 1,800 19,000 72,075 91,075 16,080 2011
WINDERMERE VILLAGE Houston, TX — 1,220 6,331 — 1,203 1,220 7,534 8,754 3,273 2005
WINDWARD COMMONS Alpharetta, GA — 12,823 13,779 — 42 12,823 13,821 26,644 678 2016
WOODBRIDGE Wylie, TX — — — 9,509 39,824 9,509 39,824 49,333 10,860 2013
WOODLAKE CROSSING San Antonio, TX 7,575 3,419 14,152 — 3,475 3,419 17,627 21,046 5,149 2009
Total Corporate Assets — — — — 13,881 — 13,881 13,881 7,140 -
Total $ 370,804 $ 618,946 $ 1,784,679 $ 9,541 $ 102,919 $ 628,487 $ 1,887,598 $ 2,516,085 $ 348,337
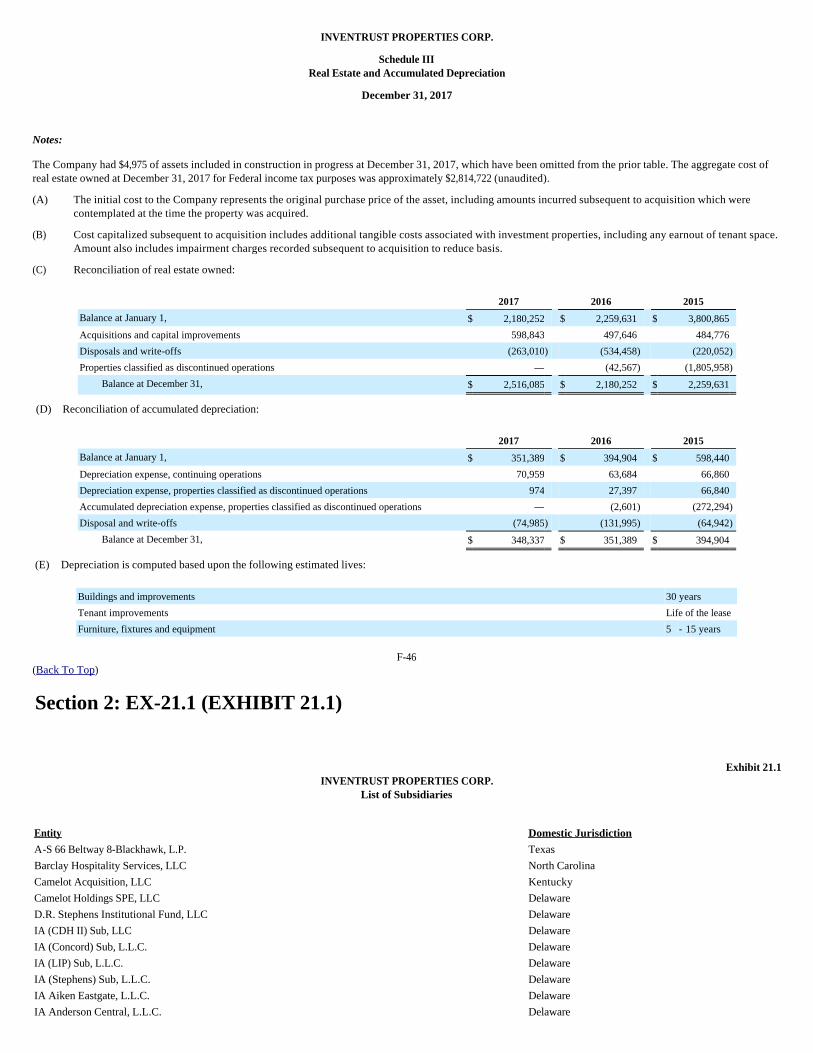
INVENTRUST PROPERTIES CORP.
Schedule III Real Estate and Accumulated Depreciation
December 31, 2017
Notes:
The Company had $4,975 of assets included in construction in progress at December 31, 2017, which have been omitted from the prior table. The aggregate cost of real estate owned at December 31, 2017 for Federal income tax purposes was approximately $2,814,722 (unaudited).
(D) Reconciliation of accumulated depreciation:
(E) Depreciation is computed based upon the following estimated lives:
F-46
(Back To Top)
Exhibit 21.1 INVENTRUST PROPERTIES CORP.
List of Subsidiaries
(A) The initial cost to the Company represents the original purchase price of the asset, including amounts incurred subsequent to acquisition which were contemplated at the time the property was acquired.
(B) Cost capitalized subsequent to acquisition includes additional tangible costs associated with investment properties, including any earnout of tenant space. Amount also includes impairment charges recorded subsequent to acquisition to reduce basis.
(C) Reconciliation of real estate owned:
2017 2016 2015
Balance at January 1, $ 2,180,252 $ 2,259,631 $ 3,800,865 Acquisitions and capital improvements 598,843 497,646 484,776 Disposals and write-offs (263,010 ) (534,458 ) (220,052 )
Properties classified as discontinued operations — (42,567 ) (1,805,958 )
Balance at December 31, $ 2,516,085 $ 2,180,252 $ 2,259,631
2017 2016 2015
Balance at January 1, $ 351,389 $ 394,904 $ 598,440 Depreciation expense, continuing operations 70,959 63,684 66,860 Depreciation expense, properties classified as discontinued operations 974 27,397 66,840 Accumulated depreciation expense, properties classified as discontinued operations — (2,601 ) (272,294 )
Disposal and write-offs (74,985 ) (131,995 ) (64,942 )
Balance at December 31, $ 348,337 $ 351,389 $ 394,904
Buildings and improvements 30 years
Tenant improvements Life of the lease
Furniture, fixtures and equipment 5 - 15 years
Section 2: EX-21.1 (EXHIBIT 21.1)
Entity Domestic Jurisdiction
A-S 66 Beltway 8-Blackhawk, L.P. Texas
Barclay Hospitality Services, LLC North Carolina
Camelot Acquisition, LLC Kentucky
Camelot Holdings SPE, LLC Delaware
D.R. Stephens Institutional Fund, LLC Delaware
IA (CDH II) Sub, LLC Delaware
IA (Concord) Sub, L.L.C. Delaware
IA (LIP) Sub, L.L.C. Delaware
IA (Stephens) Sub, L.L.C. Delaware
IA Aiken Eastgate, L.L.C. Delaware
IA Anderson Central, L.L.C. Delaware
IA Arlington Riverview GP, L.L.C. Delaware
IA Arlington Riverview Limited Partnership Illinois
IA Arlington Riverview LP, L.L.C. Delaware
IA Atlanta Buckhead Member, L.L.C. Delaware
IA Atlanta Buckhead, L.L.C. Delaware
IA Augusta Fury's Ferry, L.L.C. Delaware
IA Austin Scofield GP, L.L.C. Delaware
IA Austin Scofield Limited Partnership Illinois
IA Austin Scofield LP, L.L.C. Delaware
IA Austin Walden Park, L.L.C. Delaware
IA Austin West Creek, L.L.C. Delaware
IA Baton Rouge Siegen, L.L.C. Delaware
IA Birmingham Southgate, L.L.C. Delaware
IA Bloomington Fields, L.L.C. Delaware
IA Boynton Beach Congress, L.L.C. Delaware
IA Branch Portfolio, L.L.C. Delaware
IA Brandon Centre, L.L.C. Delaware
IA Carol Stream Heritage I, L.L.C. Delaware
IA Carol Stream Heritage II, L.L.C. Delaware
IA Cartersville Bartow II, L.L.C. Delaware
IA Cartersville Bartow, L.L.C. Delaware
IA CFG Pennsylvania Portfolio DST Delaware
IA Chesapeake Commons, L.L.C. Delaware
IA Chesapeake Crossroads, L.L.C. Delaware
IA Chicago Lincoln II, L.L.C. Delaware
IA Chicago Lincoln, L.L.C. Delaware
IA Cobalt Investors, L.L.C. Delaware
IA Colorado Springs Cheyenne, L.L.C. Delaware
IA Columbia Rosewood, L.L.C. Delaware
IA Continental Cranberry Specialty Partner, L.P. Delaware
IA Continental Morse, L.L.C. Delaware
IA Cranberry General Partner DST Delaware
IA Cranberry Limited Partner DST Delaware
IA Cranberry Specialty GP DST Delaware
IA Cranberry Specialty, L.P. Illinois
IA Cypress Cyfair GP, L.L.C. Delaware
IA Cypress CyFair Limited Partnership Illinois
IA Cypress Cyfair LP, L.L.C. Delaware
IA Dallas Prestonwood GP, L.L.C. Delaware
IA Dallas Prestonwood Limited Partnership Illinois
IA Dallas Prestonwood LP, L.L.C. Delaware
IA Denver Quebec Square, L.L.C. Delaware
IA Devens Barnum, L.L.C. Delaware
IA Dothan Pavilion, L.L.C. Delaware
IA Edmond Bryant, L.L.C. Delaware
IA Edmond Legacy Woods, L.L.C. Delaware
IA Englewood Merchants Member, L.L.C. Delaware
IA Englewood Merchants, L.L.C. Delaware
IA Erlanger Silverlake, L.L.C. Delaware
IA Finance North Pointe Lender, LLC Delaware
IA Fultondale Promenade, L.L.C. Delaware
IA Gahanna Morse, L.L.C. Delaware
IA Garner White Oak, L.L.C. Delaware
IA Grafton Port Washington, L.L.C. Delaware
IA Greeley Centerplace Holding, L.L.C. Delaware
IA Greeley Centerplace, L.L.C. Delaware
IA Grove City Stringtown Outlot, L.L.C. Delaware
IA Grove City Stringtown, L.L.C. Delaware
IA Hendersonville Indian Lake Member, L.L.C. Delaware
IA Hendersonville Indian Lake, L.L.C. Delaware
IA Herndon Worldgate, L.L.C. Delaware
IA High Ridge Gravois II, L.L.C. Delaware
IA High Ridge Gravois, L.L.C. Delaware
IA Hiram Smith II, L.L.C. Delaware
IA Hiram Smith, L.L.C. Delaware
IA Holding TRS, Inc. Delaware
IA Homewood Washington Park, L.L.C. Delaware
IA Houston Antoine Outlot GP, L.L.C. Delaware
IA Houston Antoine Outlot Limited Partnership Illinois
IA Houston Antoine Outlot LP, L.L.C. Delaware
IA Houston Northwest GP, L.L.C. Delaware
IA Houston Northwest Limited Partnership Illinois
IA Houston Northwest LP, L.L.C. Delaware
IA Independence Hartman, L.L.C. Delaware
IA Jacksonville Gateway, L.L.C. Delaware
IA Laquinta Pavilion, L.L.C. Delaware
IA Lauderhill Universal, L.L.C. Delaware
IA League City Bay Colony GP, L.L.C. Delaware
IA League City Bay Colony Limited Partnership Illinois
IA League City Bay Colony LP, L.L.C. Delaware
IA League City Victory Lakes GP, L.L.C. Delaware
IA League City Victory Lakes Limited Partnership Illinois
IA League City Victory Lakes LP, L.L.C. Delaware
IA Lexington Bellerive, L.L.C. Delaware
IA Lithonia Stonecrest, L.L.C. Delaware
IA Lodging Associates, Inc. Delaware
IA Lodging Corporation Delaware
IA Lodging Operations TRS, Inc. Delaware
IA Lodging West Homestead Waterfront DST Delaware
IA Lodging West Homestead Waterfront TRS DST Delaware
IA Louisville Westport SPE, L.L.C. Delaware
IA Louisville Westport, L.L.C. Delaware
IA Lynchburg Wards, L.L.C. Delaware
IA MAC Corporation Delaware
IA Marion Legacy, L.L.C. Delaware
IA Matthews Sycamore, L.L.C. Delaware
IA Mckinney Towne Crossing GP, L.L.C. Delaware
IA McKinney Towne Crossing Limited Partnership Illinois
IA Mckinney Towne Crossing LP, L.L.C. Delaware
IA Middleburg Crossings, L.L.C. Delaware
IA Midwest City Legacy Corner, L.L.C. Delaware
IA Missouri City Riverstone GP, L.L.C. Delaware
IA Missouri City Riverstone Limited Partnership Illinois
IA Missouri City Riverstone LP, L.L.C. Delaware
IA Monroe Poplin, L.L.C. Delaware
IA Morse Member, L.L.C. Delaware
IA Nashville Donelson, L.L.C. Delaware
IA Newnan Coweta, L.L.C. Delaware
IA Newnan Thomas, L.L.C. Delaware
IA Ocoee Plantation Grove, L.L.C. Delaware
IA Oklahoma City Legacy Crossing, L.L.C. Delaware
IA Oklahoma City Penn, L.L.C. Delaware
IA Oklahoma City Rockwell, L.L.C. Delaware
IA Omaha L Street, L.L.C. Delaware
IA Orchard Hotels, Inc. Delaware
IA Orchard TRS Holding, Inc. Delaware
IA Orlando Suncrest Village, L.L.C. Delaware
IA Port Charlotte Peachland, L.L.C. Delaware
IA Raleigh Bent Tree, L.L.C. Delaware
IA Richardson Custer Creek GP, L.L.C. Delaware
IA Richardson Custer Creek Limited Partnership Illinois
IA Richardson Custer Creek LP, L.L.C. Delaware
IA Round Rock University Oaks GP, L.L.C. Delaware
IA Round Rock University Oaks Limited Partnership Illinois
IA Round Rock University Oaks LP, L.L.C. Delaware
IA Sacramento Development VP, L.L.C. Delaware
IA Sacramento Holdings, L.L.C. Delaware
IA Sacramento Rail, L.L.C. Delaware
IA Salem-Concord Holdings, L.L.C. Delaware
IA Salisbury SPE, L. L. C. Delaware
IA Salisbury, L.L.C. Delaware
IA San Antonio Stone Ridge, L.L.C. Delaware
IA San Antonio Westover Outlot, L.L.C. Delaware
IA San Antonio Westover, L.L.C. Delaware
IA San Antonio Woodlake GP, L.L.C. Delaware
IA San Antonio Woodlake Limited Partnership Illinois
IA San Antonio Woodlake LP, L.L.C. Delaware
IA San Pedro Garden, L.L.C. Delaware
IA Sarasota Tamiami, L.L.C. Delaware
IA Select Lodging TRS Holding, Inc. Delaware
IA Select Lodging, LLC Delaware
IA Sherman Town Center II GP, L.L.C. Delaware
IA Sherman Town Center II Limited Partnership Illinois
IA Sherman Town Center II LP, L.L.C. Delaware
IA Simpsonville Fairview, L.L.C. Delaware
IA South Frisco Village, L.L.C. Delaware
IA Sparks Crossing, L.L.C. Delaware
IA St. Petersburg Gateway, L.L.C. Delaware
IA Tacoma James, L.L.C. Delaware
IA Tucker Hugh Howell, L.L.C. Delaware
IA Tulsa 71st II, L.L.C. Delaware
IA Tulsa 71st, L.L.C. Delaware
IA Urban Hotels, Inc. Delaware
IA Warner Robins City, L.L.C. Delaware
IA West Palm Beach Paradise, L.L.C. Delaware
IA Westlake GP, L.L.C. Delaware
IA Westlake Limited Partnership Illinois
IA Westlake LP, L.L.C. Delaware
IA Wheeling Loan Investment, L.L.C. Delaware
IA Wildomar Bear Creek, L.L.C. Delaware
IA Wilson Heritage, L.L.C. Delaware
IA Woodstock Rose Creek, L.L.C. Delaware
IA Wylie Woodbridge LP, L.L.C. Delaware
IA/Stephens (Fremont Tech) Ventures, LLC Delaware
IAGM REIT I, LLC Delaware
IAGM Retail Fund I Member, L.L.C. Delaware
IAGM Retail Fund I,L.L.C. Delaware
Inland American Mckinney Towne Crossing Outlots GP, L.L.C. Delaware
Inland American Mckinney Towne Crossing Outlots Limited Partnership Illinois
Inland American Mckinney Towne Crossing Outlots LP, L.L.C. Delaware
Intech Retail Associates One, LLC Indiana
InvenTrust Properties Corp. Maryland
InvenTrust Property Management, LLC Delaware
IVT Acquisitions Corp. Delaware
IVT Campus Marketplace San Marcos, LLC Delaware
IVT Cary Park Town Center, LLC Delaware
IVT Creedmoor Raleigh, L.L.C. Delaware
IVT Highlands at Flower Mound GP, LLC Delaware
IVT Highlands at Flower Mound LP, LLC Delaware
IVT Highlands at Flower Mound, LP Illinois
IVT Kyle Marketplace, LLC Delaware
IVT Northcross Center Huntersville, LLC Delaware
IVT Old Grove Marketplace Oceanside, LLC Delaware
IVT OP GP, LLC Delaware
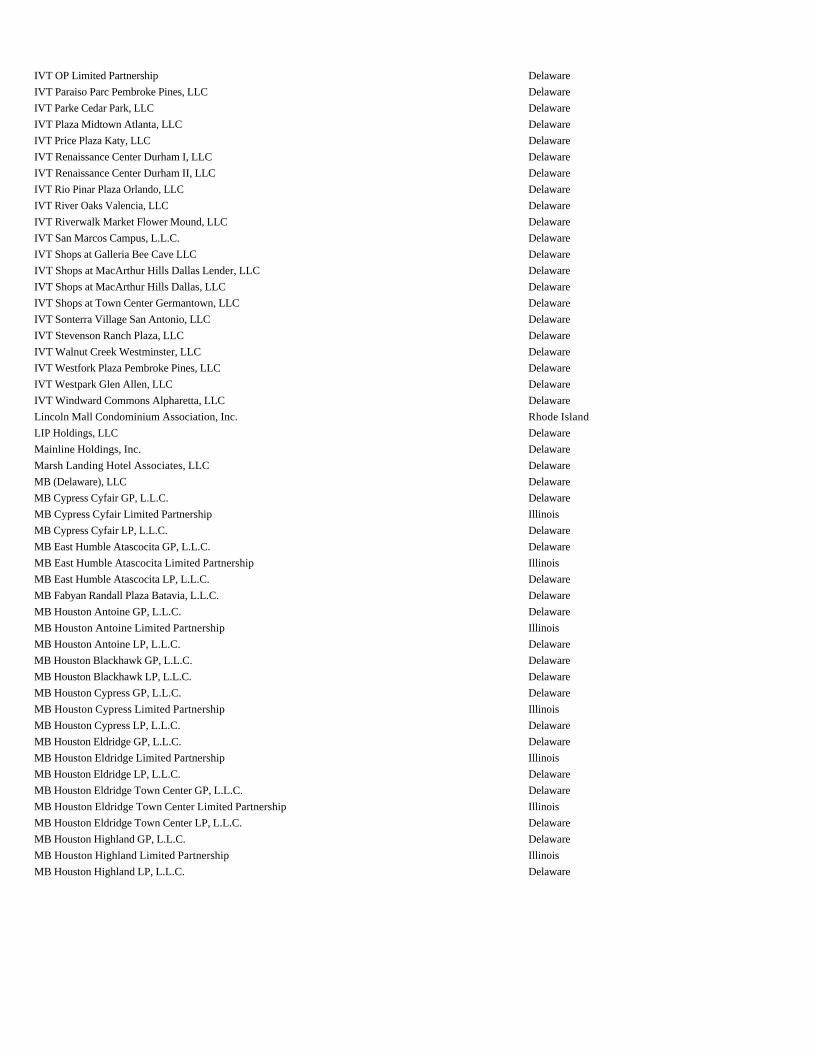
IVT OP Limited Partnership Delaware
IVT Paraiso Parc Pembroke Pines, LLC Delaware
IVT Parke Cedar Park, LLC Delaware
IVT Plaza Midtown Atlanta, LLC Delaware
IVT Price Plaza Katy, LLC Delaware
IVT Renaissance Center Durham I, LLC Delaware
IVT Renaissance Center Durham II, LLC Delaware
IVT Rio Pinar Plaza Orlando, LLC Delaware
IVT River Oaks Valencia, LLC Delaware
IVT Riverwalk Market Flower Mound, LLC Delaware
IVT San Marcos Campus, L.L.C. Delaware
IVT Shops at Galleria Bee Cave LLC Delaware
IVT Shops at MacArthur Hills Dallas Lender, LLC Delaware
IVT Shops at MacArthur Hills Dallas, LLC Delaware
IVT Shops at Town Center Germantown, LLC Delaware
IVT Sonterra Village San Antonio, LLC Delaware
IVT Stevenson Ranch Plaza, LLC Delaware
IVT Walnut Creek Westminster, LLC Delaware
IVT Westfork Plaza Pembroke Pines, LLC Delaware
IVT Westpark Glen Allen, LLC Delaware
IVT Windward Commons Alpharetta, LLC Delaware
Lincoln Mall Condominium Association, Inc. Rhode Island
LIP Holdings, LLC Delaware
Mainline Holdings, Inc. Delaware
Marsh Landing Hotel Associates, LLC Delaware
MB (Delaware), LLC Delaware
MB Cypress Cyfair GP, L.L.C. Delaware
MB Cypress Cyfair Limited Partnership Illinois
MB Cypress Cyfair LP, L.L.C. Delaware
MB East Humble Atascocita GP, L.L.C. Delaware
MB East Humble Atascocita Limited Partnership Illinois
MB East Humble Atascocita LP, L.L.C. Delaware
MB Fabyan Randall Plaza Batavia, L.L.C. Delaware
MB Houston Antoine GP, L.L.C. Delaware
MB Houston Antoine Limited Partnership Illinois
MB Houston Antoine LP, L.L.C. Delaware
MB Houston Blackhawk GP, L.L.C. Delaware
MB Houston Blackhawk LP, L.L.C. Delaware
MB Houston Cypress GP, L.L.C. Delaware
MB Houston Cypress Limited Partnership Illinois
MB Houston Cypress LP, L.L.C. Delaware
MB Houston Eldridge GP, L.L.C. Delaware
MB Houston Eldridge Limited Partnership Illinois
MB Houston Eldridge LP, L.L.C. Delaware
MB Houston Eldridge Town Center GP, L.L.C. Delaware
MB Houston Eldridge Town Center Limited Partnership Illinois
MB Houston Eldridge Town Center LP, L.L.C. Delaware
MB Houston Highland GP, L.L.C. Delaware
MB Houston Highland Limited Partnership Illinois
MB Houston Highland LP, L.L.C. Delaware
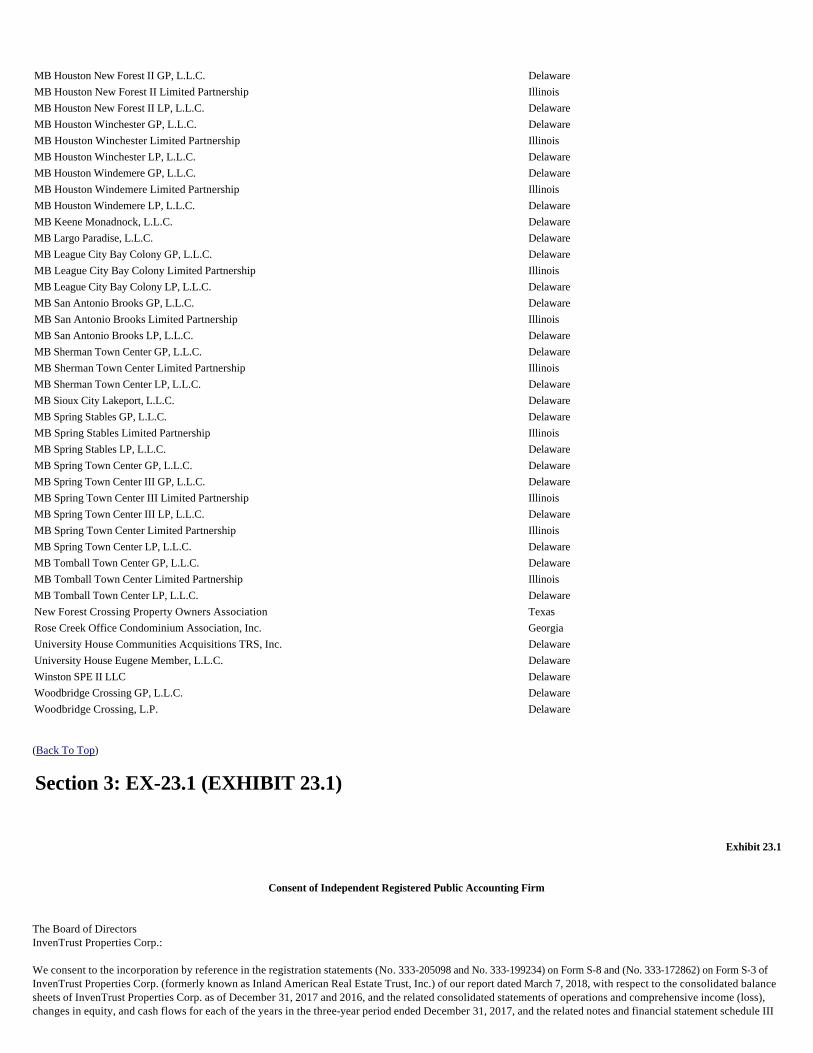
(Back To Top)
Exhibit 23.1
Consent of Independent Registered Public Accounting Firm
The Board of Directors InvenTrust Properties Corp.: We consent to the incorporation by reference in the registration statements (No. 333-205098 and No. 333-199234) on Form S-8 and (No. 333-172862) on Form S-3 of InvenTrust Properties Corp. (formerly known as Inland American Real Estate Trust, Inc.) of our report dated March 7, 2018, with respect to the consolidated balance sheets of InvenTrust Properties Corp. as of December 31, 2017 and 2016, and the related consolidated statements of operations and comprehensive income (loss), changes in equity, and cash flows for each of the years in the three-year period ended December 31, 2017, and the related notes and financial statement schedule III
MB Houston New Forest II GP, L.L.C. Delaware
MB Houston New Forest II Limited Partnership Illinois
MB Houston New Forest II LP, L.L.C. Delaware
MB Houston Winchester GP, L.L.C. Delaware
MB Houston Winchester Limited Partnership Illinois
MB Houston Winchester LP, L.L.C. Delaware
MB Houston Windemere GP, L.L.C. Delaware
MB Houston Windemere Limited Partnership Illinois
MB Houston Windemere LP, L.L.C. Delaware
MB Keene Monadnock, L.L.C. Delaware
MB Largo Paradise, L.L.C. Delaware
MB League City Bay Colony GP, L.L.C. Delaware
MB League City Bay Colony Limited Partnership Illinois
MB League City Bay Colony LP, L.L.C. Delaware
MB San Antonio Brooks GP, L.L.C. Delaware
MB San Antonio Brooks Limited Partnership Illinois
MB San Antonio Brooks LP, L.L.C. Delaware
MB Sherman Town Center GP, L.L.C. Delaware
MB Sherman Town Center Limited Partnership Illinois
MB Sherman Town Center LP, L.L.C. Delaware
MB Sioux City Lakeport, L.L.C. Delaware
MB Spring Stables GP, L.L.C. Delaware
MB Spring Stables Limited Partnership Illinois
MB Spring Stables LP, L.L.C. Delaware
MB Spring Town Center GP, L.L.C. Delaware
MB Spring Town Center III GP, L.L.C. Delaware
MB Spring Town Center III Limited Partnership Illinois
MB Spring Town Center III LP, L.L.C. Delaware
MB Spring Town Center Limited Partnership Illinois
MB Spring Town Center LP, L.L.C. Delaware
MB Tomball Town Center GP, L.L.C. Delaware
MB Tomball Town Center Limited Partnership Illinois
MB Tomball Town Center LP, L.L.C. Delaware
New Forest Crossing Property Owners Association Texas
Rose Creek Office Condominium Association, Inc. Georgia
University House Communities Acquisitions TRS, Inc. Delaware
University House Eugene Member, L.L.C. Delaware
Winston SPE II LLC Delaware
Woodbridge Crossing GP, L.L.C. Delaware
Woodbridge Crossing, L.P. Delaware
Section 3: EX-23.1 (EXHIBIT 23.1)
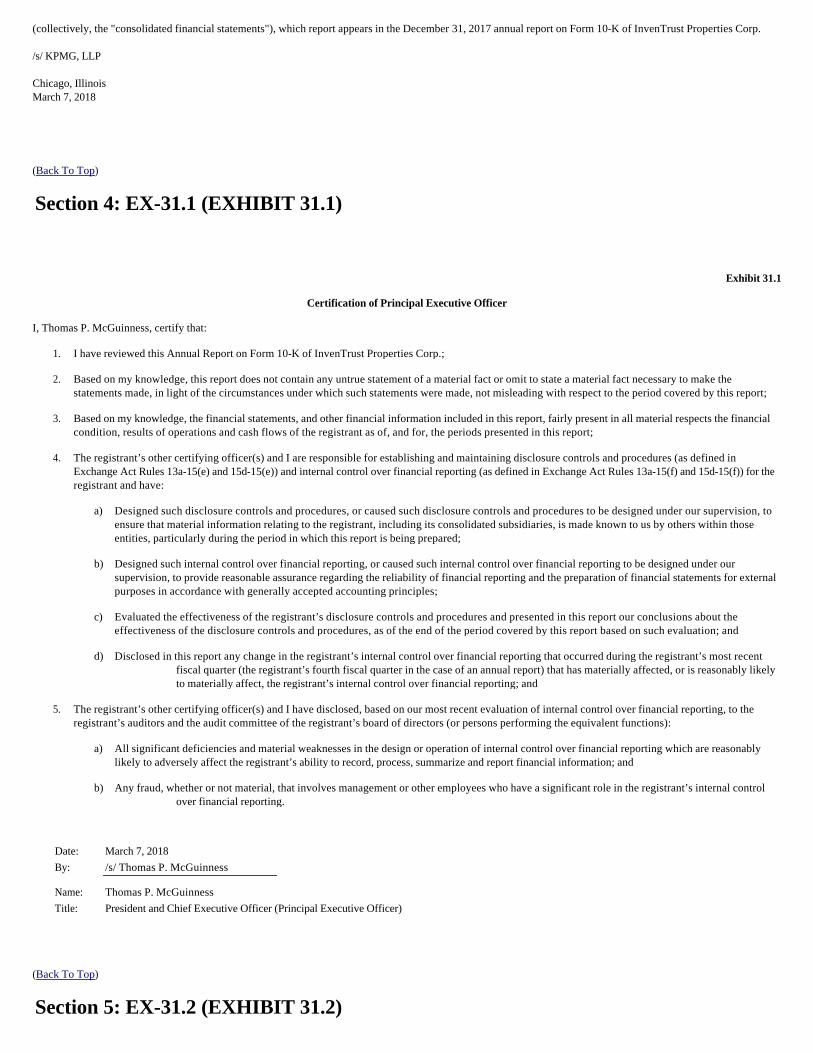
(collectively, the "consolidated financial statements"), which report appears in the December 31, 2017 annual report on Form 10-K of InvenTrust Properties Corp. /s/ KPMG, LLP Chicago, Illinois March 7, 2018
(Back To Top)
Exhibit 31.1
Certification of Principal Executive Officer
I, Thomas P. McGuinness, certify that:
(Back To Top)
Section 4: EX-31.1 (EXHIBIT 31.1)
1. I have reviewed this Annual Report on Form 10-K of InvenTrust Properties Corp.;
2. Based on my knowledge, this report does not contain any untrue statement of a material fact or omit to state a material fact necessary to make the statements made, in light of the circumstances under which such statements were made, not misleading with respect to the period covered by this report;
3. Based on my knowledge, the financial statements, and other financial information included in this report, fairly present in all material respects the financial condition, results of operations and cash flows of the registrant as of, and for, the periods presented in this report;
4. The registrant’s other certifying officer(s) and I are responsible for establishing and maintaining disclosure controls and procedures (as defined in Exchange Act Rules 13a-15(e) and 15d-15(e)) and internal control over financial reporting (as defined in Exchange Act Rules 13a-15(f) and 15d-15(f)) for the registrant and have:
a) Designed such disclosure controls and procedures, or caused such disclosure controls and procedures to be designed under our supervision, to ensure that material information relating to the registrant, including its consolidated subsidiaries, is made known to us by others within those entities, particularly during the period in which this report is being prepared;
b) Designed such internal control over financial reporting, or caused such internal control over financial reporting to be designed under our supervision, to provide reasonable assurance regarding the reliability of financial reporting and the preparation of financial statements for external purposes in accordance with generally accepted accounting principles;
c) Evaluated the effectiveness of the registrant’s disclosure controls and procedures and presented in this report our conclusions about the effectiveness of the disclosure controls and procedures, as of the end of the period covered by this report based on such evaluation; and
d) Disclosed in this report any change in the registrant’s internal control over financial reporting that occurred during the registrant’s most recent fiscal quarter (the registrant’s fourth fiscal quarter in the case of an annual report) that has materially affected, or is reasonably likely to materially affect, the registrant’s internal control over financial reporting; and
5. The registrant’s other certifying officer(s) and I have disclosed, based on our most recent evaluation of internal control over financial reporting, to the registrant’s auditors and the audit committee of the registrant’s board of directors (or persons performing the equivalent functions):
a) All significant deficiencies and material weaknesses in the design or operation of internal control over financial reporting which are reasonably likely to adversely affect the registrant’s ability to record, process, summarize and report financial information; and
b) Any fraud, whether or not material, that involves management or other employees who have a significant role in the registrant’s internal control over financial reporting.
Date: March 7, 2018
By: /s/ Thomas P. McGuinness
Name: Thomas P. McGuinness
Title: President and Chief Executive Officer (Principal Executive Officer)
Section 5: EX-31.2 (EXHIBIT 31.2)
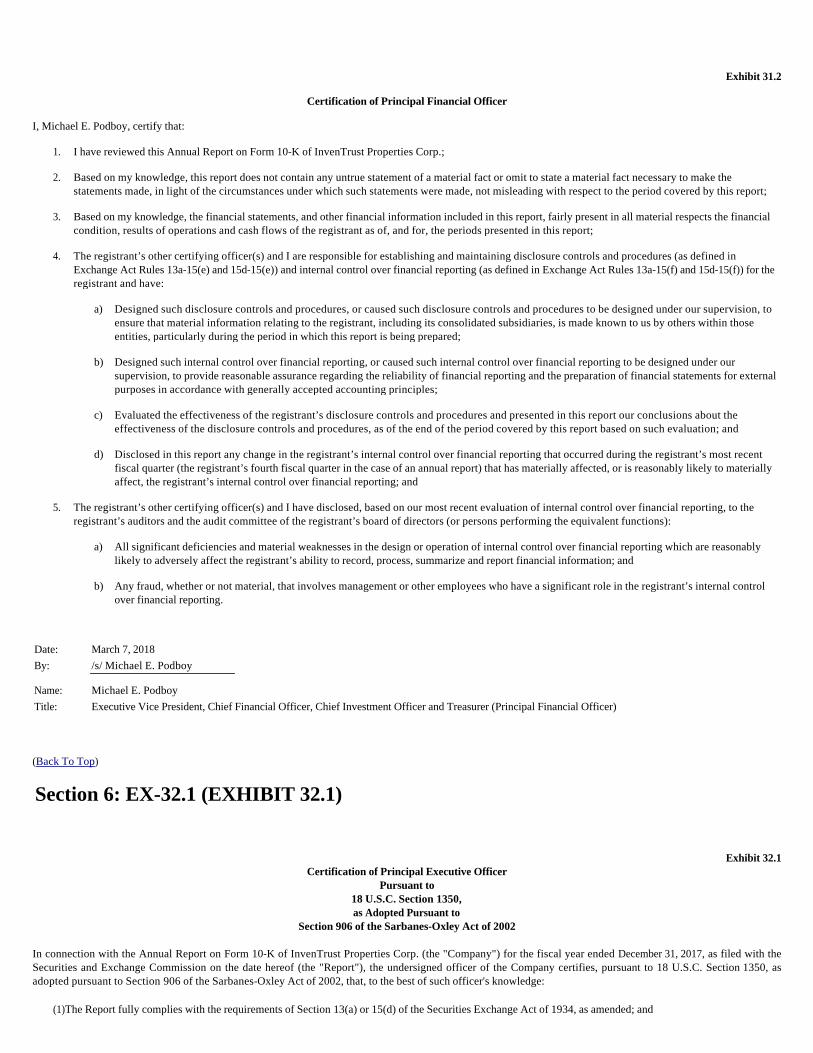
Exhibit 31.2
Certification of Principal Financial Officer
I, Michael E. Podboy, certify that:
(Back To Top)
Exhibit 32.1 Certification of Principal Executive Officer
Pursuant to 18 U.S.C. Section 1350, as Adopted Pursuant to
Section 906 of the Sarbanes-Oxley Act of 2002
In connection with the Annual Report on Form 10-K of InvenTrust Properties Corp. (the "Company") for the fiscal year ended December 31, 2017, as filed with the Securities and Exchange Commission on the date hereof (the "Report"), the undersigned officer of the Company certifies, pursuant to 18 U.S.C. Section 1350, as adopted pursuant to Section 906 of the Sarbanes-Oxley Act of 2002, that, to the best of such officer's knowledge:
1. I have reviewed this Annual Report on Form 10-K of InvenTrust Properties Corp.;
2. Based on my knowledge, this report does not contain any untrue statement of a material fact or omit to state a material fact necessary to make the statements made, in light of the circumstances under which such statements were made, not misleading with respect to the period covered by this report;
3. Based on my knowledge, the financial statements, and other financial information included in this report, fairly present in all material respects the financial condition, results of operations and cash flows of the registrant as of, and for, the periods presented in this report;
4. The registrant’s other certifying officer(s) and I are responsible for establishing and maintaining disclosure controls and procedures (as defined in Exchange Act Rules 13a-15(e) and 15d-15(e)) and internal control over financial reporting (as defined in Exchange Act Rules 13a-15(f) and 15d-15(f)) for the registrant and have:
a) Designed such disclosure controls and procedures, or caused such disclosure controls and procedures to be designed under our supervision, to ensure that material information relating to the registrant, including its consolidated subsidiaries, is made known to us by others within those entities, particularly during the period in which this report is being prepared;
b) Designed such internal control over financial reporting, or caused such internal control over financial reporting to be designed under our supervision, to provide reasonable assurance regarding the reliability of financial reporting and the preparation of financial statements for external purposes in accordance with generally accepted accounting principles;
c) Evaluated the effectiveness of the registrant’s disclosure controls and procedures and presented in this report our conclusions about the effectiveness of the disclosure controls and procedures, as of the end of the period covered by this report based on such evaluation; and
d) Disclosed in this report any change in the registrant’s internal control over financial reporting that occurred during the registrant’s most recent fiscal quarter (the registrant’s fourth fiscal quarter in the case of an annual report) that has materially affected, or is reasonably likely to materially affect, the registrant’s internal control over financial reporting; and
5. The registrant’s other certifying officer(s) and I have disclosed, based on our most recent evaluation of internal control over financial reporting, to the registrant’s auditors and the audit committee of the registrant’s board of directors (or persons performing the equivalent functions):
a) All significant deficiencies and material weaknesses in the design or operation of internal control over financial reporting which are reasonably likely to adversely affect the registrant’s ability to record, process, summarize and report financial information; and
b) Any fraud, whether or not material, that involves management or other employees who have a significant role in the registrant’s internal control over financial reporting.
Date: March 7, 2018
By: /s/ Michael E. Podboy
Name: Michael E. Podboy
Title: Executive Vice President, Chief Financial Officer, Chief Investment Officer and Treasurer (Principal Financial Officer)
Section 6: EX-32.1 (EXHIBIT 32.1)
(1) The Report fully complies with the requirements of Section 13(a) or 15(d) of the Securities Exchange Act of 1934, as amended; and
A signed original of this written statement required by Section 906 has been provided to the Company and will be retained by the Company and furnished to the Securities and Exchange Commission or its staff upon request. The foregoing certification is being furnished solely pursuant to 18 U.S.C. Section 1350 and is not being filed as a part of the Report or on a separate disclosure document.
(Back To Top)
Exhibit 32.2 Certification of the Principal Financial Officer
Pursuant to 18 U.S.C. Section 1350, as Adopted Pursuant to
Section 906 of the Sarbanes-Oxley Act of 2002
In connection with the Annual Report on Form 10-K of InvenTrust Properties Corp. (the "Company") for the fiscal year ended December 31, 2017, as filed with the Securities and Exchange Commission on the date hereof (the “Report”), the undersigned officer of the Company certifies, pursuant to 18 U.S.C. Section 1350, as adopted pursuant to Section 906 of the Sarbanes-Oxley Act of 2002, that, to the best of such officer's knowledge:
A signed original of this written statement required by Section 906 has been provided to the Company and will be retained by the Company and furnished to the Securities and Exchange Commission or its staff upon request. The foregoing certification is being furnished solely pursuant to 18 U.S.C. Section 1350 and is not being filed as a part of the Report or on a separate disclosure document.
(Back To Top)
(2) The information contained in the Report fairly presents, in all material respects, the financial condition and results of operations of the Company.
Date: March 7, 2018
By: /s/ Thomas P. McGuinness
Name: Thomas P. McGuinness
Title: President and Chief Executive Officer (Principal Executive Officer)
Section 7: EX-32.2 (EXHIBIT 32.2)
(1) The Report fully complies with the requirements of Section 13(a) or 15(d) of the Securities Exchange Act of 1934, as amended; and
(2) The information contained in the Report fairly presents, in all material respects, the financial condition and results of operations of the Company.
Date: March 7, 2018
By: /s/ Michael E. Podboy
Name: Michael E. Podboy
Title: Executive Vice President, Chief Financial Officer, Chief Investment Officer and Treasurer (Principal Financial Officer)


![FORM 10-K - ROFIN · knowledge, in definitive proxy or information statements incorporated by reference in Part III of this Form 10-K or any amendment to this Form 10-K. [X] The aggregate](https://img.pdfslide.us/doc/110x75/5e80b1177a3ef5708955d0de/form-10-k-rofin-knowledge-in-definitive-proxy-or-information-statements-incorporated.jpg)