Embed Size (px)
Citation preview
Sect.3-1 Basic Concepts of Probability
Probability ExperimentsSwbat learn how to identify the sample space of a
probability experiment and to identify simple events.How to distinguish among classical Probability, empirical
Probability, and subjective Probability.How to find the Probability of the complement of an event.;
Introduction
• When weather forecasters say there is a 90% chance of rain or a physician says there is a 35% chance of a successful surgery, they are stating the likelihood or Probability that specific event will occur. Decisions such as should you wash your car or proceed with a surgery are often based on these Probabilities.
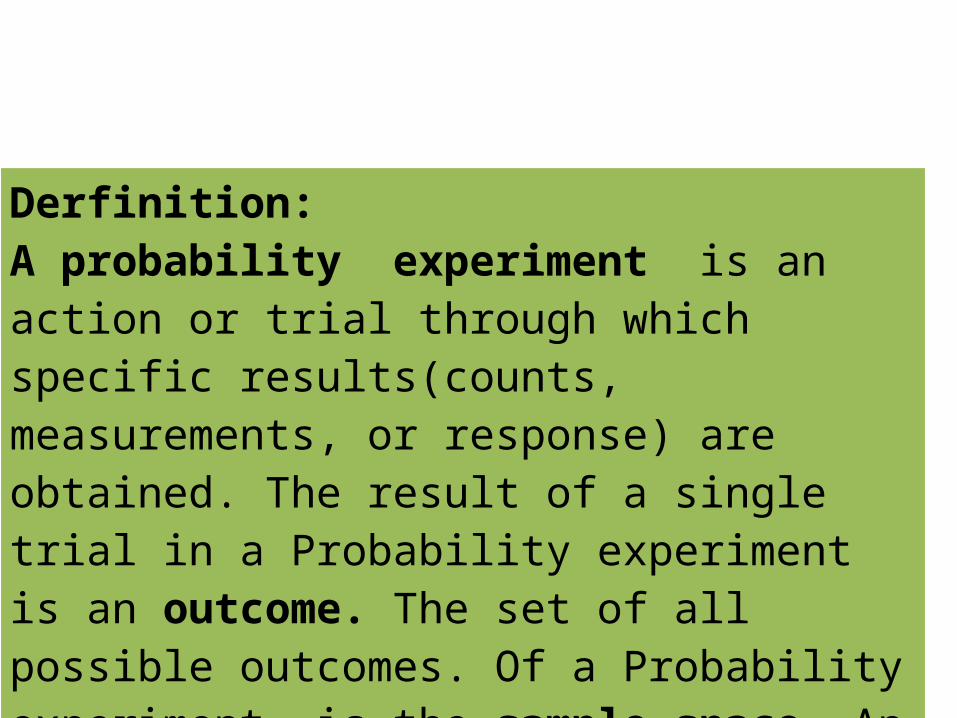
Derfinition:A probability experiment is an action or trial through which specific results(counts, measurements, or response) are obtained. The result of a single trial in a Probability experiment is an outcome. The set of all possible outcomes. Of a Probability experiment is the sample space. An event consists of one or more outcomes and is a subset of the sample space
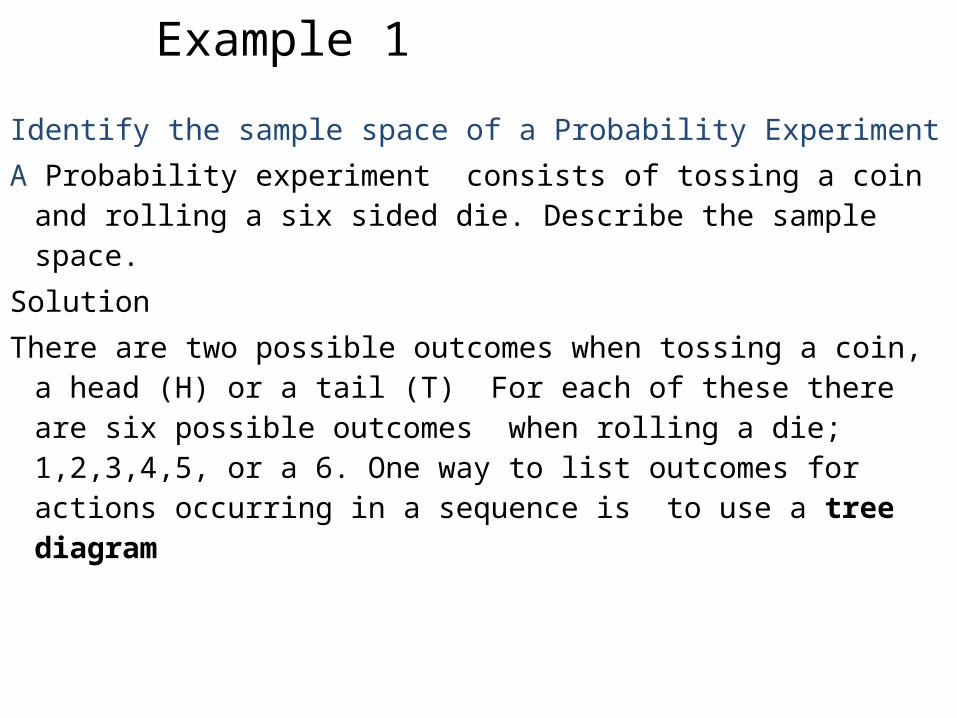
Example 1
Identify the sample space of a Probability ExperimentA Probability experiment consists of tossing a coin and
rolling a six sided die. Describe the sample space.SolutionThere are two possible outcomes when tossing a coin, a
head (H) or a tail (T) For each of these there are six possible outcomes when rolling a die; 1,2,3,4,5, or a 6. One way to list outcomes for actions occurring in a sequence is to use a tree diagram
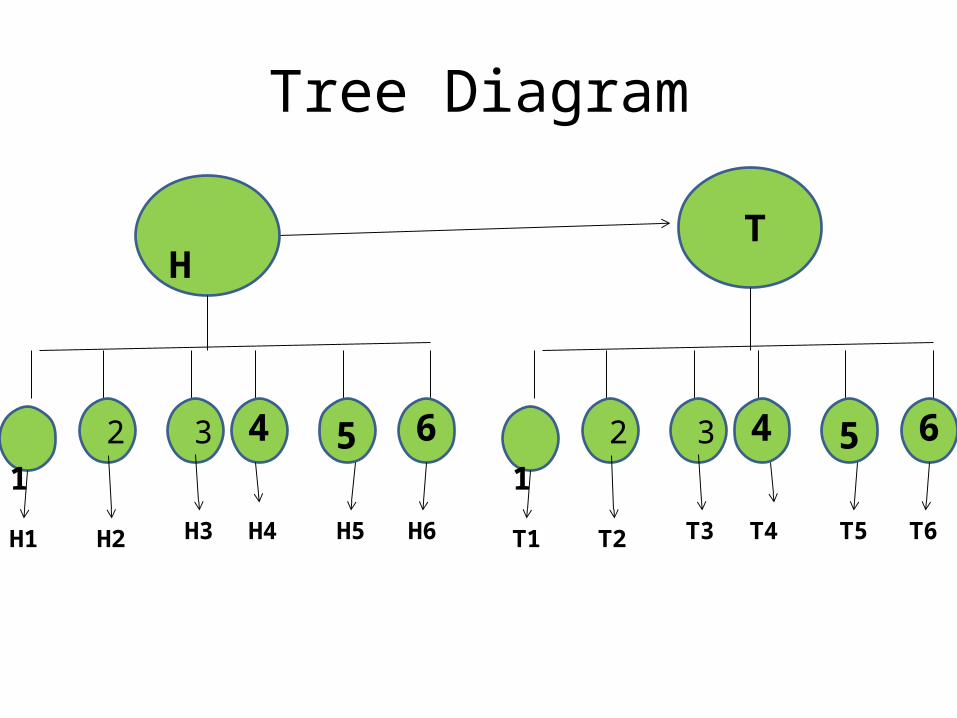
Tree Diagram
H T
1 2 3 4 5 6
H1 H2 H3 H4 H5 H6
1 2 3 4 5 6
T1 T2 T3 T4 T5 T6
From the tree diagram the sample space has 12 outcomes.
{H1, H2, H3, H4, H5, H6, T1, T2, T3, T4, T5, T6}
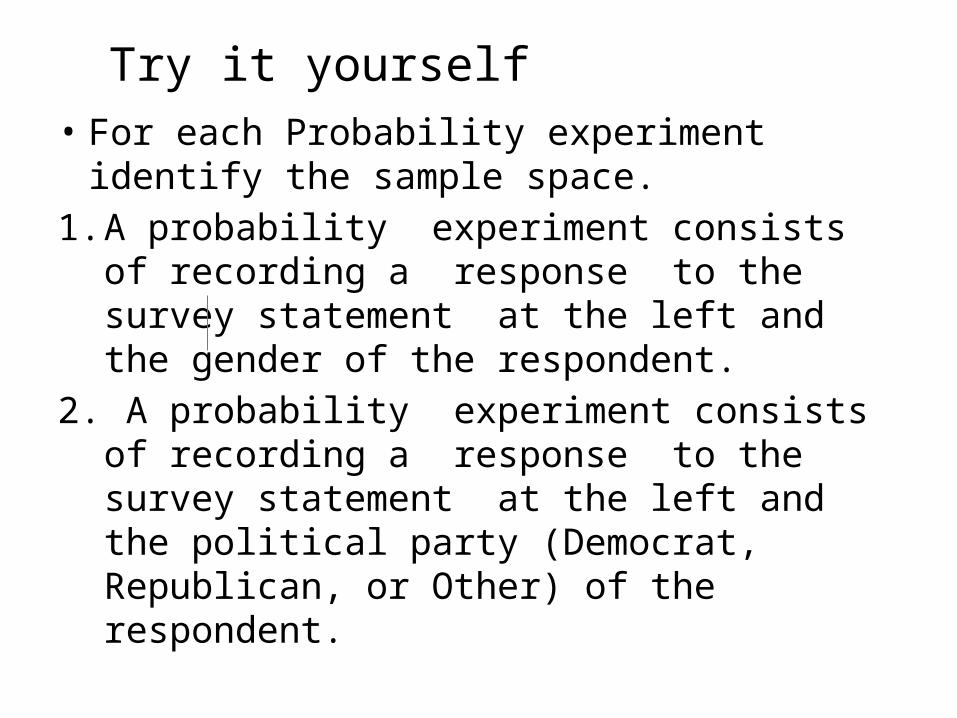
Try it yourself• For each Probability experiment identify the
sample space.1. A probability experiment consists of recording
a response to the survey statement at the left and the gender of the respondent.
2. A probability experiment consists of recording a response to the survey statement at the left and the political party (Democrat, Republican, or Other) of the respondent.
Start a tree diagram by forming a branch for each possible response to the survey.
b. At the end of each survey response branch , draw a new branch for each possible outcome.
C. Find the number of outcomes in the sample space.
d. List the sample space.
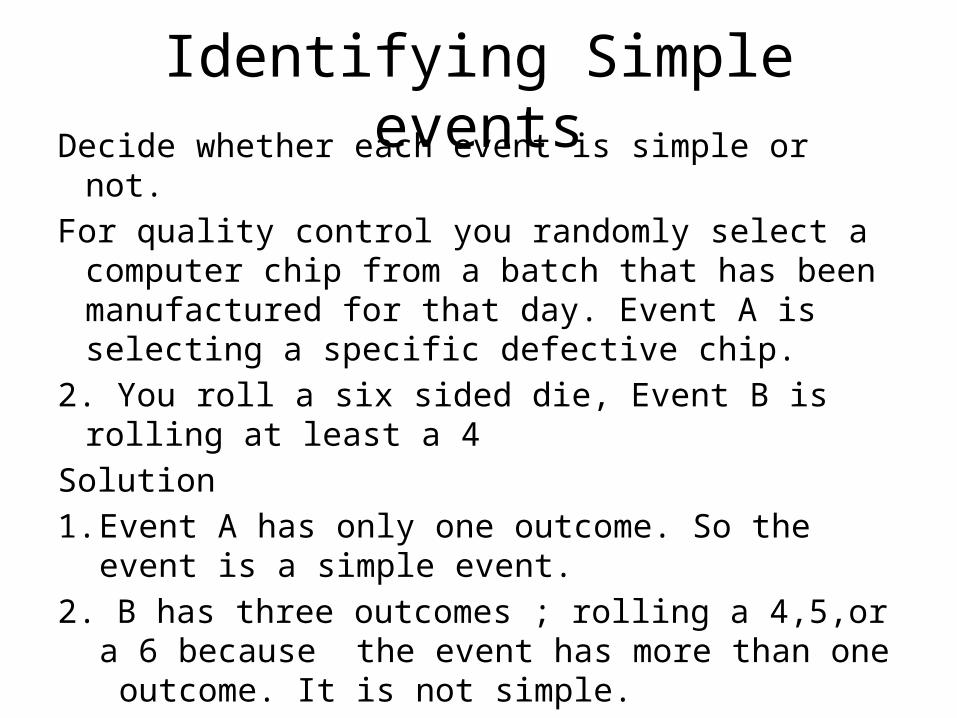
Identifying Simple eventsDecide whether each event is simple or not.For quality control you randomly select a computer
chip from a batch that has been manufactured for that day. Event A is selecting a specific defective chip.
2. You roll a six sided die, Event B is rolling at least a 4Solution1. Event A has only one outcome. So the event is a
simple event.2. B has three outcomes ; rolling a 4,5,or a 6 because
the event has more than one outcome. It is not simple.

Types of Probability
• Classical or theoretical probability is used when each outcome in a sample space is equally likely to occur. The classical probability for an event E is given by
P(E) = Number of outcomes in E total number of outcomes in sample space
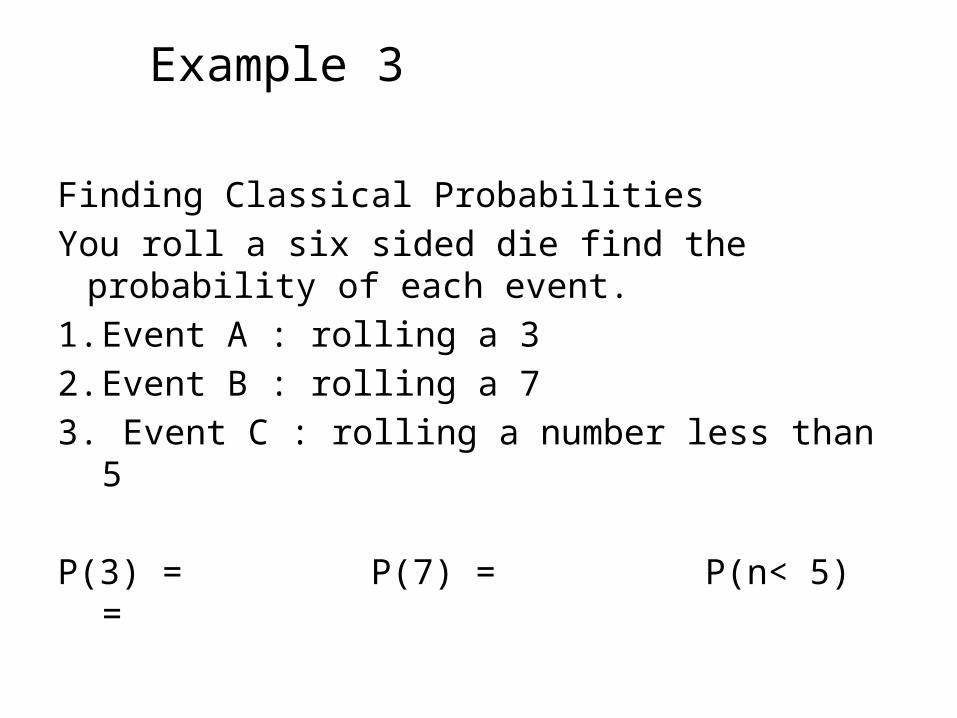
Example 3
Finding Classical ProbabilitiesYou roll a six sided die find the probability of
each event.1. Event A : rolling a 32. Event B : rolling a 73. Event C : rolling a number less than 5
P(3) = P(7) = P(n< 5) =
Try it yourself
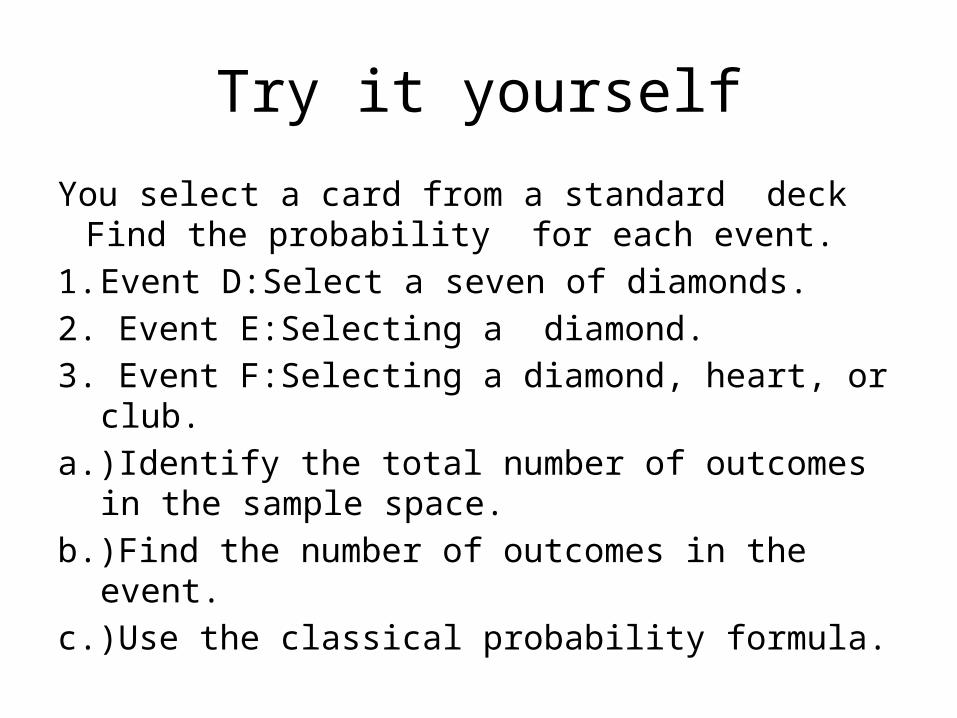
You select a card from a standard deck Find the probability for each event.
1. Event D:Select a seven of diamonds.2. Event E:Selecting a diamond.3. Event F:Selecting a diamond, heart, or club.a.)Identify the total number of outcomes in the
sample space.b.)Find the number of outcomes in the event.c.)Use the classical probability formula.
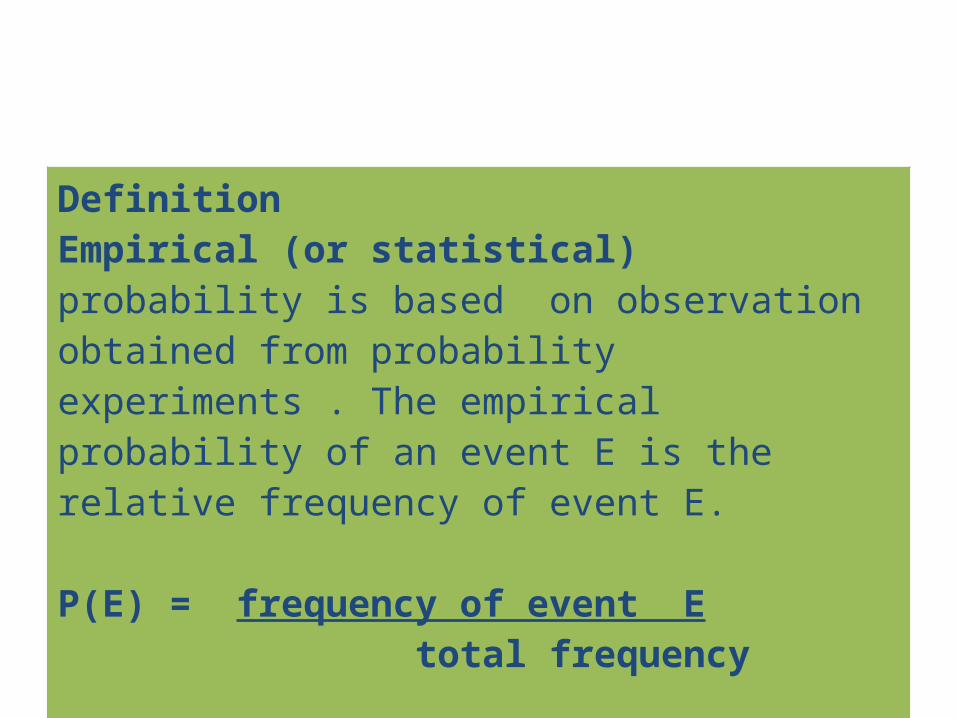
DefinitionEmpirical (or statistical) probability is based on observation obtained from probability experiments . The empirical probability of an event E is the relative frequency of event E.
P(E) = frequency of event E total frequency
Homework day 11-10 pg125
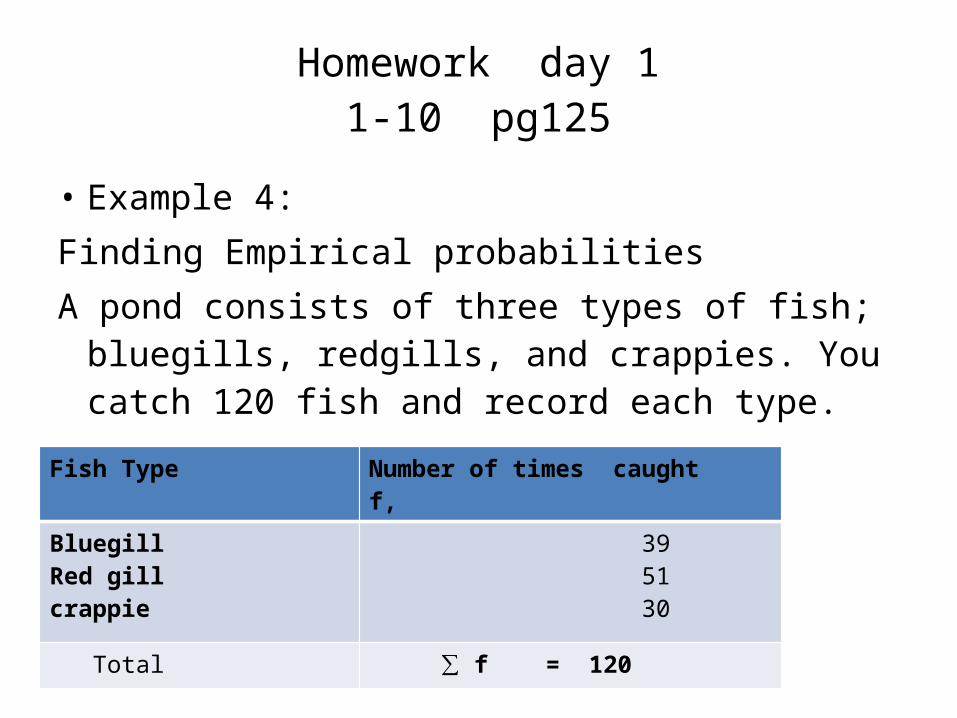
• Example 4:Finding Empirical probabilitiesA pond consists of three types of fish; bluegills,
redgills, and crappies. You catch 120 fish and record each type.
Fish Type Number of times caught f,
BluegillRed gillcrappie
39 51 30
Total ∑ f = 120
Try it yourself
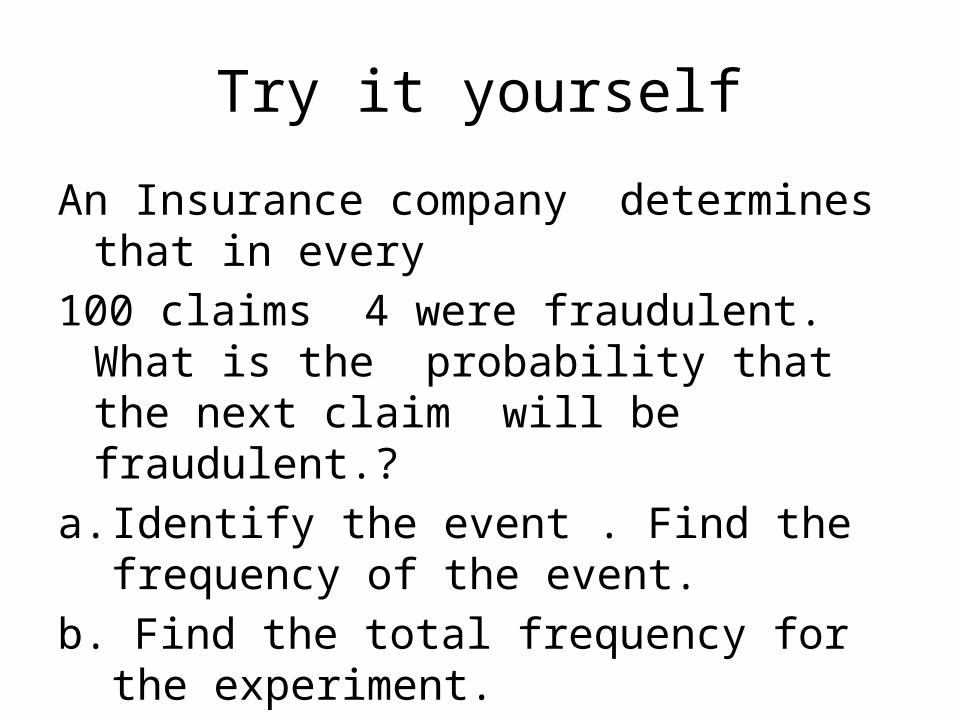
An Insurance company determines that in every100 claims 4 were fraudulent. What is the
probability that the next claim will be fraudulent.?
a. Identify the event . Find the frequency of the event.
b. Find the total frequency for the experiment.c. Find the relative frequency of the event.
Law of large numbers
As an experiment is repeated over and over, the empirical probability of an event approaches the theoretical (actual) probability of the event.
The more an experiment is repeated the closer it comes to the theoretical probability of the event.
Example 5 Using frequency distributions to find Probabilities
You survey a sample of 1000 employees at a company and record the age of each. The results are shown below in the frequency distribution. If you randomly select another employee what is the probability that the age will be between 25 and 34 years old?
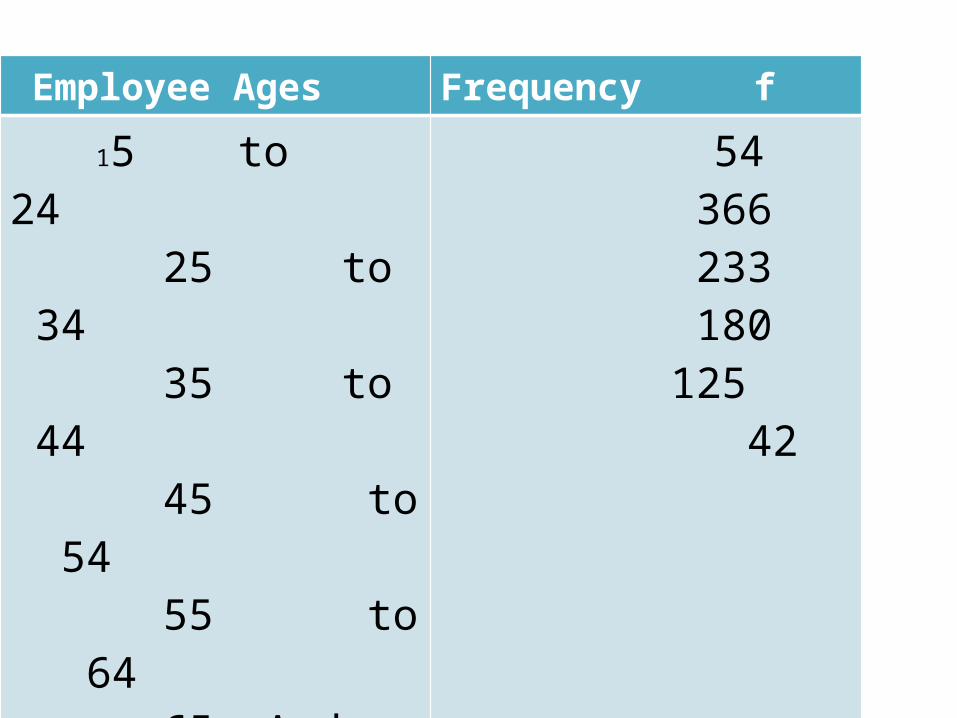
Employee Ages Frequency f 15 to 24 25 to 34 35 to 44 45 to 54 55 to 64 65 And over
54 366 233 180 125 42
Total ∑ f = 1000
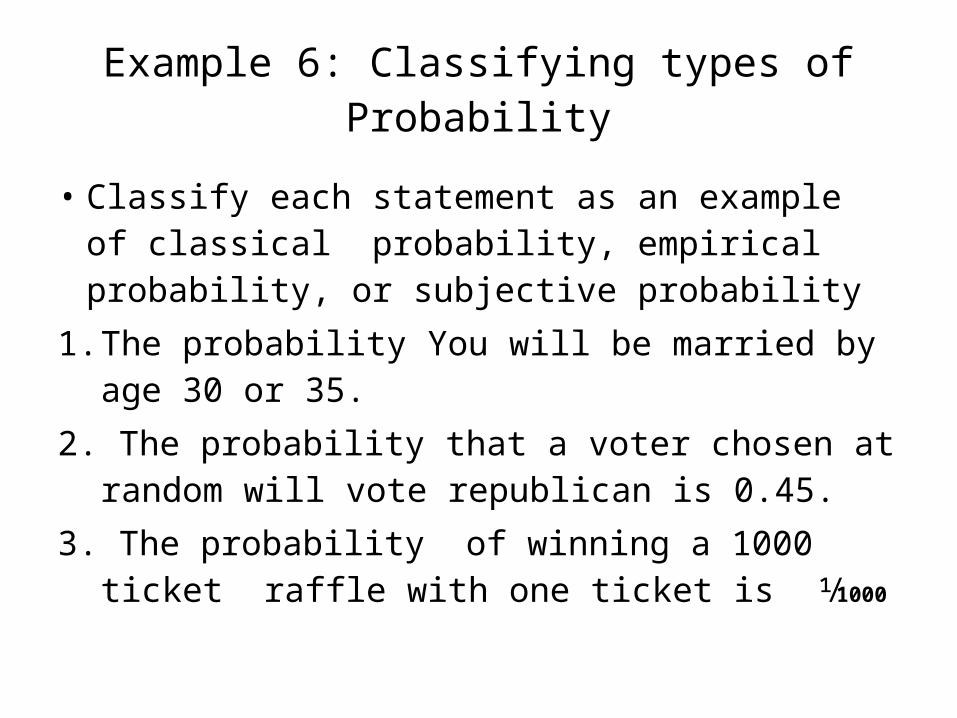
Example 6: Classifying types of Probability
• Classify each statement as an example of classical probability, empirical probability, or subjective probability
1. The probability You will be married by age 30 or 35.
2. The probability that a voter chosen at random will vote republican is 0.45.
3. The probability of winning a 1000 ticket raffle with one ticket is ⅟1000
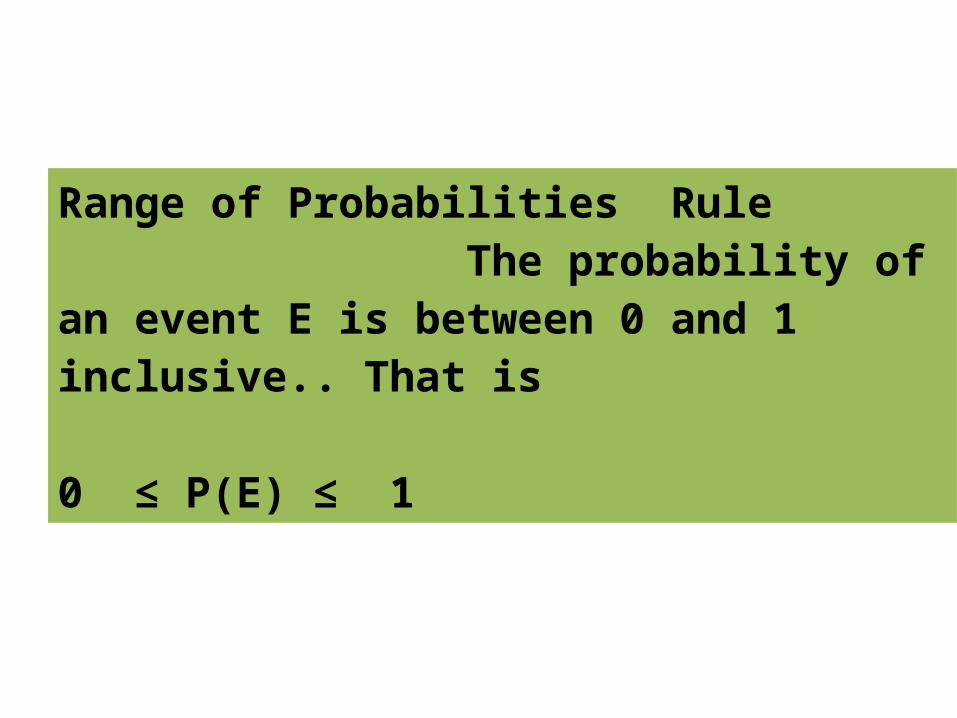
Range of Probabilities Rule The probability of an event E is between 0 and 1 inclusive.. That is 0 ≤ P(E) ≤ 1
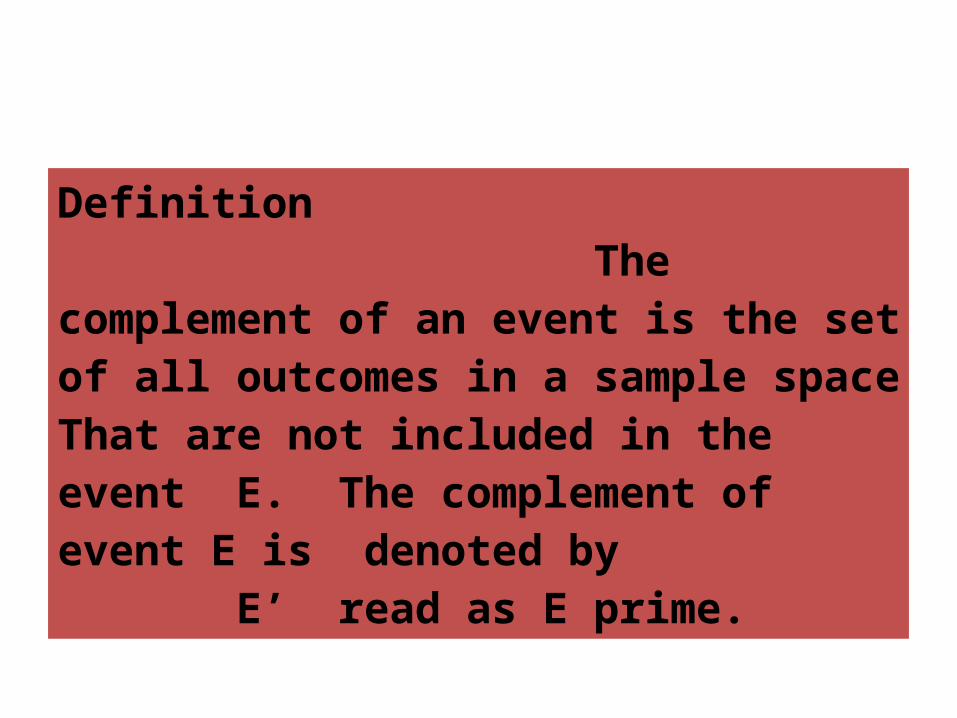
Definition The complement of an event is the set of all outcomes in a sample space That are not included in the event E. The complement of event E is denoted by E’ read as E prime.
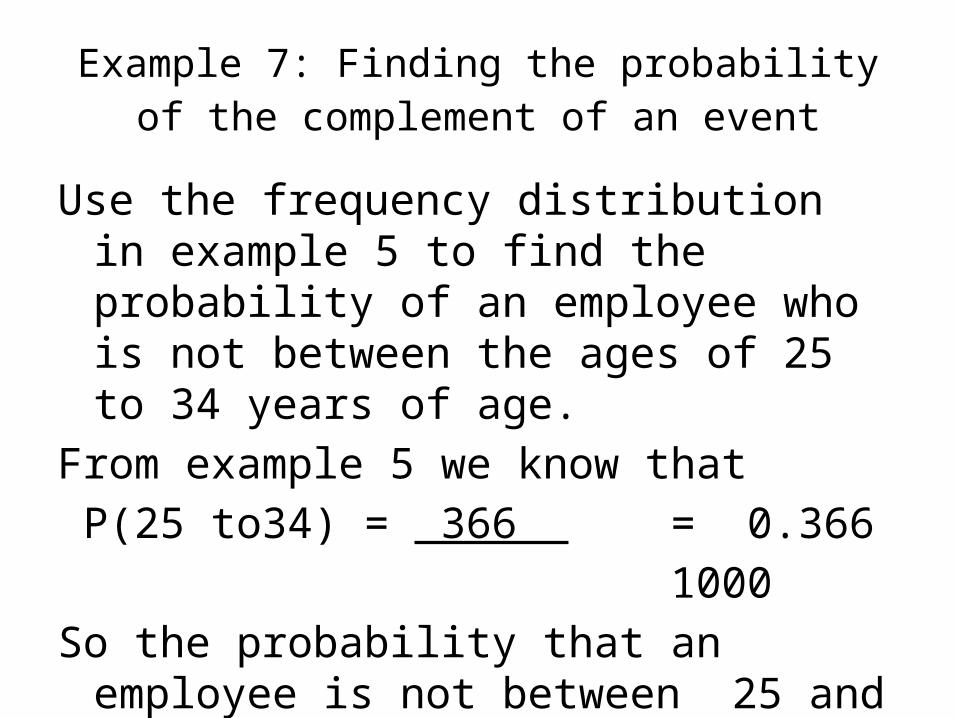
Example 7: Finding the probability of the complement of an event
Use the frequency distribution in example 5 to find the probability of an employee who is not between the ages of 25 to 34 years of age.
From example 5 we know that P(25 to34) = 366 = 0.366 1000So the probability that an employee is not
between 25 and 34 is P(age is not 25 to 34) = 1 – 0.366 = 0.634
Homework 11-22 pgs 125-126