Embed Size (px)
Citation preview
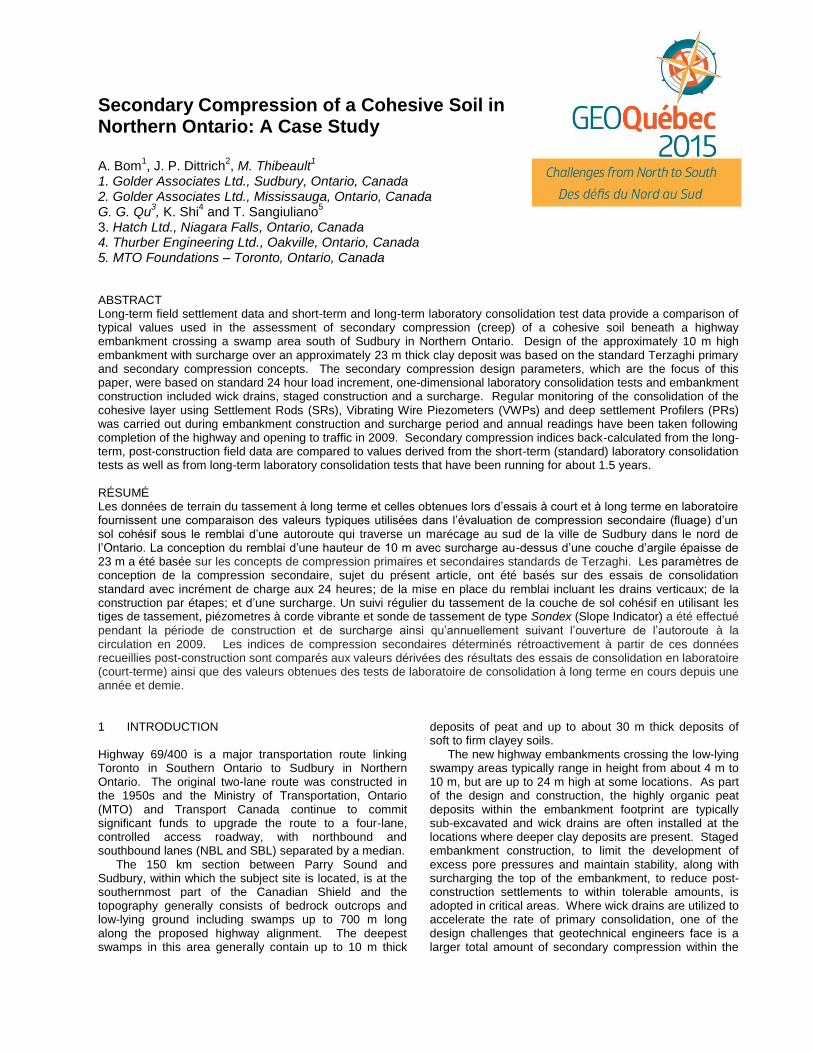
Secondary Compression of a Cohesive Soil in Northern Ontario: A Case Study A. Bom
1, J. P. Dittrich
2, M. Thibeault
1
1. Golder Associates Ltd., Sudbury, Ontario, Canada 2. Golder Associates Ltd., Mississauga, Ontario, Canada G. G. Qu
3, K. Shi
4 and T. Sangiuliano
5
3. Hatch Ltd., Niagara Falls, Ontario, Canada 4. Thurber Engineering Ltd., Oakville, Ontario, Canada 5. MTO Foundations – Toronto, Ontario, Canada ABSTRACT Long-term field settlement data and short-term and long-term laboratory consolidation test data provide a comparison of typical values used in the assessment of secondary compression (creep) of a cohesive soil beneath a highway embankment crossing a swamp area south of Sudbury in Northern Ontario. Design of the approximately 10 m high embankment with surcharge over an approximately 23 m thick clay deposit was based on the standard Terzaghi primary and secondary compression concepts. The secondary compression design parameters, which are the focus of this paper, were based on standard 24 hour load increment, one-dimensional laboratory consolidation tests and embankment construction included wick drains, staged construction and a surcharge. Regular monitoring of the consolidation of the cohesive layer using Settlement Rods (SRs), Vibrating Wire Piezometers (VWPs) and deep settlement Profilers (PRs) was carried out during embankment construction and surcharge period and annual readings have been taken following completion of the highway and opening to traffic in 2009. Secondary compression indices back-calculated from the long-term, post-construction field data are compared to values derived from the short-term (standard) laboratory consolidation tests as well as from long-term laboratory consolidation tests that have been running for about 1.5 years. RÉSUMÉ Les données de terrain du tassement à long terme et celles obtenues lors d’essais à court et à long terme en laboratoire fournissent une comparaison des valeurs typiques utilisées dans l’évaluation de compression secondaire (fluage) d’un sol cohésif sous le remblai d’une autoroute qui traverse un marécage au sud de la ville de Sudbury dans le nord de l’Ontario. La conception du remblai d’une hauteur de 10 m avec surcharge au-dessus d’une couche d’argile épaisse de 23 m a été basée sur les concepts de compression primaires et secondaires standards de Terzaghi. Les paramètres de conception de la compression secondaire, sujet du présent article, ont été basés sur des essais de consolidation standard avec incrément de charge aux 24 heures; de la mise en place du remblai incluant les drains verticaux; de la construction par étapes; et d’une surcharge. Un suivi régulier du tassement de la couche de sol cohésif en utilisant les tiges de tassement, piézometres à corde vibrante et sonde de tassement de type Sondex (Slope Indicator) a été effectué pendant la période de construction et de surcharge ainsi qu’annuellement suivant l’ouverture de l’autoroute à la circulation en 2009. Les indices de compression secondaires déterminés rétroactivement à partir de ces données recueillies post-construction sont comparés aux valeurs dérivées des résultats des essais de consolidation en laboratoire (court-terme) ainsi que des valeurs obtenues des tests de laboratoire de consolidation à long terme en cours depuis une année et demie. 1 INTRODUCTION Highway 69/400 is a major transportation route linking Toronto in Southern Ontario to Sudbury in Northern Ontario. The original two-lane route was constructed in the 1950s and the Ministry of Transportation, Ontario (MTO) and Transport Canada continue to commit significant funds to upgrade the route to a four-lane, controlled access roadway, with northbound and southbound lanes (NBL and SBL) separated by a median.
The 150 km section between Parry Sound and Sudbury, within which the subject site is located, is at the southernmost part of the Canadian Shield and the topography generally consists of bedrock outcrops and low-lying ground including swamps up to 700 m long along the proposed highway alignment. The deepest swamps in this area generally contain up to 10 m thick
deposits of peat and up to about 30 m thick deposits of soft to firm clayey soils.
The new highway embankments crossing the low-lying swampy areas typically range in height from about 4 m to 10 m, but are up to 24 m high at some locations. As part of the design and construction, the highly organic peat deposits within the embankment footprint are typically sub-excavated and wick drains are often installed at the locations where deeper clay deposits are present. Staged embankment construction, to limit the development of excess pore pressures and maintain stability, along with surcharging the top of the embankment, to reduce post-construction settlements to within tolerable amounts, is adopted in critical areas. Where wick drains are utilized to accelerate the rate of primary consolidation, one of the design challenges that geotechnical engineers face is a larger total amount of secondary compression within the
design life of the embankment. This is due to the fact that the more significant portion of secondary compression (i.e. creep after the end of primary consolidation) manifests itself following substantial completion of the primary consolidation and generally follows a trend of a certain magnitude of creep settlement per log-cycle of time. When the time to reach substantial completion of primary consolidation (e.g. U = 95%) is long (or is a significant portion of the embankment design life), the magnitude of secondary compression and its effect on the long-term performance of the embankment, within the design life, will be of relatively less importance. However, when the time to reach substantial completion of primary consolidation is short relative to the embankment design life (i.e. which is the case for wick drain design), the magnitude of secondary compression and its effect on the long-term performance of the embankment within the design life is of much more importance.
For the purpose of developing a better appreciation of the magnitude and rate of secondary compression, this case study presents a comparison of the coefficient of secondary compression from the following data sources:
6 short-term standard (24 hour load increment) one-dimensional laboratory consolidation tests, on 3 samples collected at the design phase and 3 samples collected post-construction;
Long-term field settlement monitoring carried out post-construction and completion of the embankment; and,
2 long-term one-dimensional laboratory consolidation tests from samples collected post-construction.
2 DEFINITION OF SECONDARY COMPRESSION
PARAMETERS For the purposes of presenting the results of the laboratory testing and field monitoring data, the following definitions of secondary compression parameters are utilized:
Sα = Δ S / Δ log t [1] Cαε = Sα / Ho [2] Cαe = Cαε * (1+eo) [3]
where: Sα = the slope or change in deflection per log-cycle for a specific stress level (in lab) or profiler magnet (in field); Cαε = the modified coefficient of secondary compression (also known as modified secondary compression index); Cαe = the coefficient of secondary compression (also known as the secondary compression index); Ho = the initial thickness of the clay layer prior to the start of loading; and, eo = the initial void ratio prior to the start of loading. 3 DESIGN AND CONSTRUCTION HISTORY The study site is located in the southern limits of the Greater City of Sudbury, Ontario, near the community of Wanup, and consists of an approximately 500 m long swamp area with bedrock outcrops exposed on either side
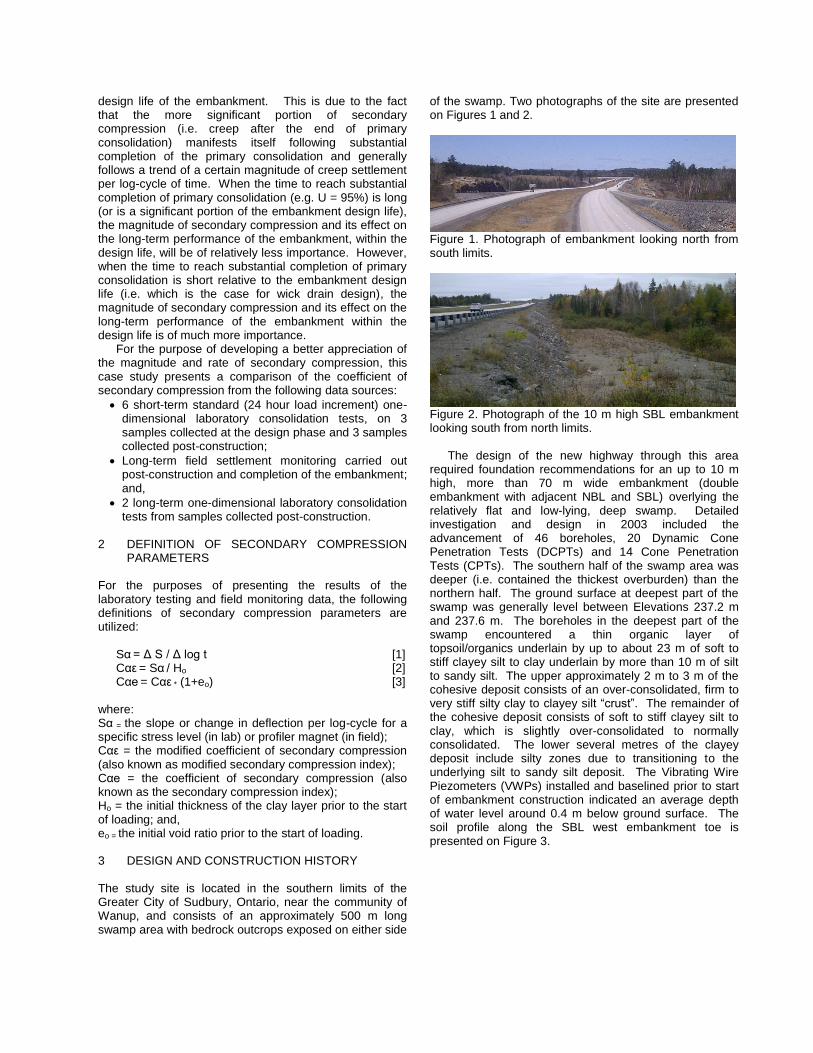
of the swamp. Two photographs of the site are presented on Figures 1 and 2.
Figure 1. Photograph of embankment looking north from south limits.
Figure 2. Photograph of the 10 m high SBL embankment looking south from north limits.
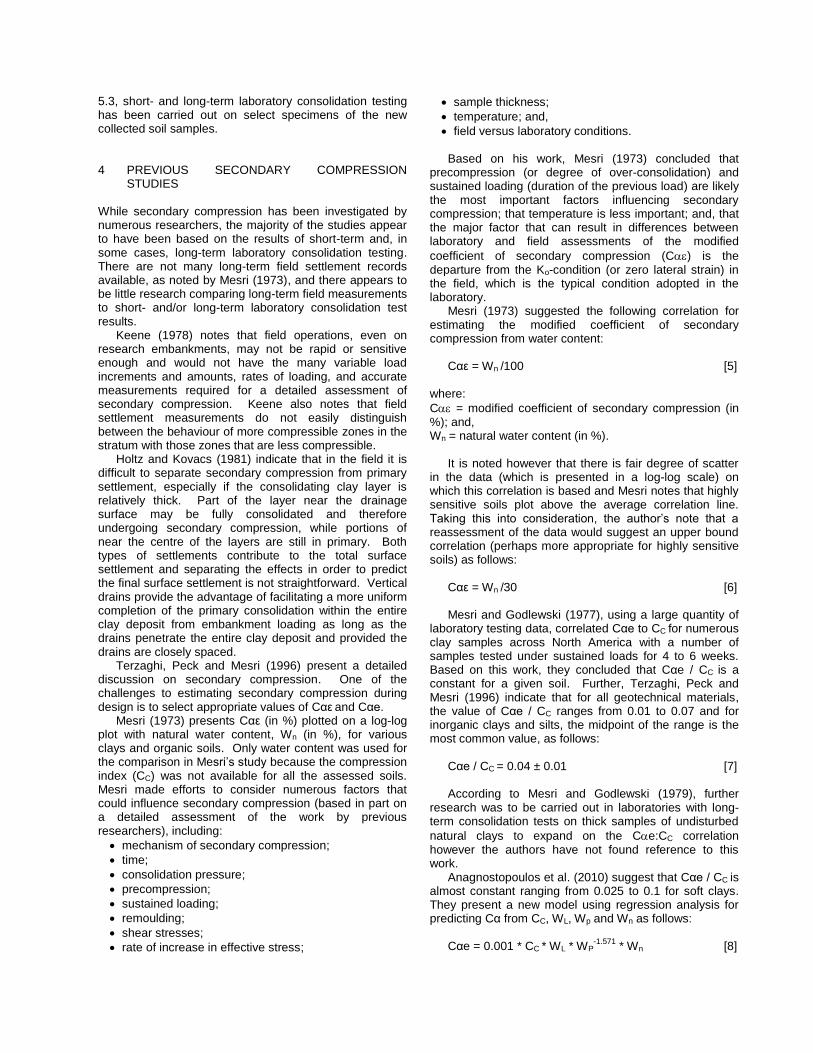
The design of the new highway through this area required foundation recommendations for an up to 10 m high, more than 70 m wide embankment (double embankment with adjacent NBL and SBL) overlying the relatively flat and low-lying, deep swamp. Detailed investigation and design in 2003 included the advancement of 46 boreholes, 20 Dynamic Cone Penetration Tests (DCPTs) and 14 Cone Penetration Tests (CPTs). The southern half of the swamp area was deeper (i.e. contained the thickest overburden) than the northern half. The ground surface at deepest part of the swamp was generally level between Elevations 237.2 m and 237.6 m. The boreholes in the deepest part of the swamp encountered a thin organic layer of topsoil/organics underlain by up to about 23 m of soft to stiff clayey silt to clay underlain by more than 10 m of silt to sandy silt. The upper approximately 2 m to 3 m of the cohesive deposit consists of an over-consolidated, firm to very stiff silty clay to clayey silt “crust”. The remainder of the cohesive deposit consists of soft to stiff clayey silt to clay, which is slightly over-consolidated to normally consolidated. The lower several metres of the clayey deposit include silty zones due to transitioning to the underlying silt to sandy silt deposit. The Vibrating Wire Piezometers (VWPs) installed and baselined prior to start of embankment construction indicated an average depth of water level around 0.4 m below ground surface. The soil profile along the SBL west embankment toe is presented on Figure 3.
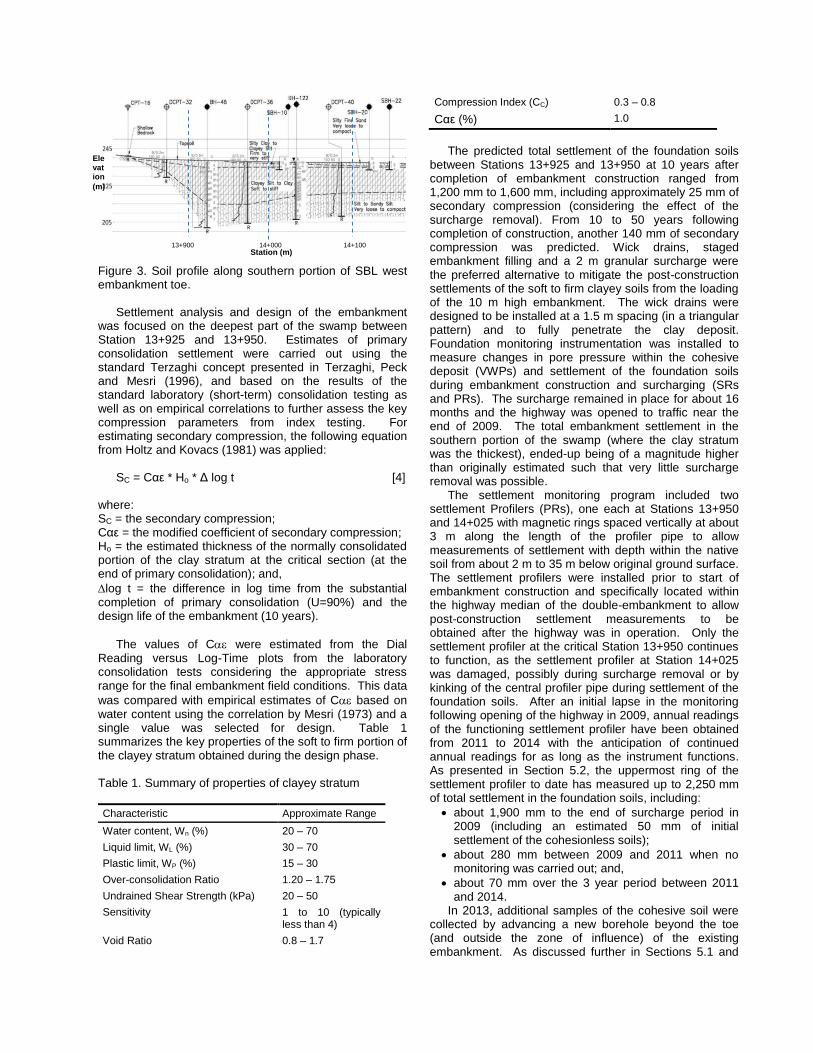
Figure 3. Soil profile along southern portion of SBL west embankment toe.
Settlement analysis and design of the embankment
was focused on the deepest part of the swamp between Station 13+925 and 13+950. Estimates of primary consolidation settlement were carried out using the standard Terzaghi concept presented in Terzaghi, Peck and Mesri (1996), and based on the results of the standard laboratory (short-term) consolidation testing as well as on empirical correlations to further assess the key compression parameters from index testing. For estimating secondary compression, the following equation from Holtz and Kovacs (1981) was applied:
SC = Cαε * Ho * Δ log t [4]
where: SC = the secondary compression; Cαε = the modified coefficient of secondary compression; Ho = the estimated thickness of the normally consolidated portion of the clay stratum at the critical section (at the end of primary consolidation); and,
log t = the difference in log time from the substantial completion of primary consolidation (U=90%) and the design life of the embankment (10 years).
The values of C were estimated from the Dial Reading versus Log-Time plots from the laboratory consolidation tests considering the appropriate stress range for the final embankment field conditions. This data
was compared with empirical estimates of C based on water content using the correlation by Mesri (1973) and a single value was selected for design. Table 1 summarizes the key properties of the soft to firm portion of the clayey stratum obtained during the design phase. Table 1. Summary of properties of clayey stratum
Characteristic Approximate Range
Water content, Wn (%) 20 – 70
Liquid limit, WL (%) 30 – 70
Plastic limit, WP (%) 15 – 30
Over-consolidation Ratio 1.20 – 1.75
Undrained Shear Strength (kPa) 20 – 50
Sensitivity 1 to 10 (typically less than 4)
Void Ratio 0.8 – 1.7
Compression Index (CC) 0.3 – 0.8
Cαε (%) 1.0
The predicted total settlement of the foundation soils
between Stations 13+925 and 13+950 at 10 years after completion of embankment construction ranged from 1,200 mm to 1,600 mm, including approximately 25 mm of secondary compression (considering the effect of the surcharge removal). From 10 to 50 years following completion of construction, another 140 mm of secondary compression was predicted. Wick drains, staged embankment filling and a 2 m granular surcharge were the preferred alternative to mitigate the post-construction settlements of the soft to firm clayey soils from the loading of the 10 m high embankment. The wick drains were designed to be installed at a 1.5 m spacing (in a triangular pattern) and to fully penetrate the clay deposit. Foundation monitoring instrumentation was installed to measure changes in pore pressure within the cohesive deposit (VWPs) and settlement of the foundation soils during embankment construction and surcharging (SRs and PRs). The surcharge remained in place for about 16 months and the highway was opened to traffic near the end of 2009. The total embankment settlement in the southern portion of the swamp (where the clay stratum was the thickest), ended-up being of a magnitude higher than originally estimated such that very little surcharge removal was possible.
The settlement monitoring program included two settlement Profilers (PRs), one each at Stations 13+950 and 14+025 with magnetic rings spaced vertically at about 3 m along the length of the profiler pipe to allow measurements of settlement with depth within the native soil from about 2 m to 35 m below original ground surface. The settlement profilers were installed prior to start of embankment construction and specifically located within the highway median of the double-embankment to allow post-construction settlement measurements to be obtained after the highway was in operation. Only the settlement profiler at the critical Station 13+950 continues to function, as the settlement profiler at Station 14+025 was damaged, possibly during surcharge removal or by kinking of the central profiler pipe during settlement of the foundation soils. After an initial lapse in the monitoring following opening of the highway in 2009, annual readings of the functioning settlement profiler have been obtained from 2011 to 2014 with the anticipation of continued annual readings for as long as the instrument functions. As presented in Section 5.2, the uppermost ring of the settlement profiler to date has measured up to 2,250 mm of total settlement in the foundation soils, including:
about 1,900 mm to the end of surcharge period in 2009 (including an estimated 50 mm of initial settlement of the cohesionless soils);
about 280 mm between 2009 and 2011 when no monitoring was carried out; and,
about 70 mm over the 3 year period between 2011 and 2014.
In 2013, additional samples of the cohesive soil were collected by advancing a new borehole beyond the toe (and outside the zone of influence) of the existing embankment. As discussed further in Sections 5.1 and
Station (m) 13+900 14+000 14+100
Elevation
(m)
5.3, short- and long-term laboratory consolidation testing has been carried out on select specimens of the new collected soil samples.
4 PREVIOUS SECONDARY COMPRESSION STUDIES
While secondary compression has been investigated by numerous researchers, the majority of the studies appear to have been based on the results of short-term and, in some cases, long-term laboratory consolidation testing. There are not many long-term field settlement records available, as noted by Mesri (1973), and there appears to be little research comparing long-term field measurements to short- and/or long-term laboratory consolidation test results.
Keene (1978) notes that field operations, even on research embankments, may not be rapid or sensitive enough and would not have the many variable load increments and amounts, rates of loading, and accurate measurements required for a detailed assessment of secondary compression. Keene also notes that field settlement measurements do not easily distinguish between the behaviour of more compressible zones in the stratum with those zones that are less compressible.
Holtz and Kovacs (1981) indicate that in the field it is difficult to separate secondary compression from primary settlement, especially if the consolidating clay layer is relatively thick. Part of the layer near the drainage surface may be fully consolidated and therefore undergoing secondary compression, while portions of near the centre of the layers are still in primary. Both types of settlements contribute to the total surface settlement and separating the effects in order to predict the final surface settlement is not straightforward. Vertical drains provide the advantage of facilitating a more uniform completion of the primary consolidation within the entire clay deposit from embankment loading as long as the drains penetrate the entire clay deposit and provided the drains are closely spaced.
Terzaghi, Peck and Mesri (1996) present a detailed discussion on secondary compression. One of the challenges to estimating secondary compression during design is to select appropriate values of Cαε and Cαe.
Mesri (1973) presents Cαε (in %) plotted on a log-log plot with natural water content, Wn (in %), for various clays and organic soils. Only water content was used for the comparison in Mesri’s study because the compression index (CC) was not available for all the assessed soils. Mesri made efforts to consider numerous factors that could influence secondary compression (based in part on a detailed assessment of the work by previous researchers), including:
mechanism of secondary compression;
time;
consolidation pressure;
precompression;
sustained loading;
remoulding;
shear stresses;
rate of increase in effective stress;
sample thickness;
temperature; and,
field versus laboratory conditions. Based on his work, Mesri (1973) concluded that
precompression (or degree of over-consolidation) and sustained loading (duration of the previous load) are likely the most important factors influencing secondary compression; that temperature is less important; and, that the major factor that can result in differences between laboratory and field assessments of the modified
coefficient of secondary compression (C) is the departure from the Ko-condition (or zero lateral strain) in the field, which is the typical condition adopted in the laboratory.
Mesri (1973) suggested the following correlation for estimating the modified coefficient of secondary compression from water content:
Cαε = Wn /100 [5]
where:
C = modified coefficient of secondary compression (in %); and, Wn = natural water content (in %).
It is noted however that there is fair degree of scatter in the data (which is presented in a log-log scale) on which this correlation is based and Mesri notes that highly sensitive soils plot above the average correlation line. Taking this into consideration, the author’s note that a reassessment of the data would suggest an upper bound correlation (perhaps more appropriate for highly sensitive soils) as follows:
Cαε = Wn /30 [6] Mesri and Godlewski (1977), using a large quantity of
laboratory testing data, correlated Cαe to CC for numerous clay samples across North America with a number of samples tested under sustained loads for 4 to 6 weeks. Based on this work, they concluded that Cαe / CC is a constant for a given soil. Further, Terzaghi, Peck and Mesri (1996) indicate that for all geotechnical materials, the value of Cαe / CC ranges from 0.01 to 0.07 and for inorganic clays and silts, the midpoint of the range is the most common value, as follows:
Cαe / CC = 0.04 ± 0.01 [7] According to Mesri and Godlewski (1979), further
research was to be carried out in laboratories with long-term consolidation tests on thick samples of undisturbed
natural clays to expand on the Ce:CC correlation however the authors have not found reference to this work.
Anagnostopoulos et al. (2010) suggest that Cαe / CC is almost constant ranging from 0.025 to 0.1 for soft clays. They present a new model using regression analysis for predicting Cα from CC, WL, Wp and Wn as follows:
Cαe = 0.001 * CC * WL * WP
-1.571 * Wn [8]
where:
Ce = coefficient of secondary compression; WL, Wp, = liquid and plastic limits (in %); and, Wn = natural water content (in %).
Their nonlinear regression analysis model was based
on laboratory consolidation testing of 13 soil types collected from different depths and locations across Thessaloniki, Greece. The index properties for each of the 13 soils are tabulated in the paper and the soil types are classified by the USCS Classification System as follows:
5 high plastic clays (CH);
3 low plastic silts (ML);
1 high plastic silts (MH); and
4 high plastic organic soils (OH). Tomory et al. (2013), based on the results of more
than 60 standard (short-term) laboratory consolidation tests from cohesive soil samples obtained in Northern Ontario, proposed the following correlation of Cαe with water content for normally consolidated cohesive soil, based on a linear regression analysis:
Cαe = 0.0006 Wn – 0.0084 [9]
where:
Ce = coefficient of secondary compression (in decimal form); and, Wn = natural water content (in %).
There are a number of test embankment fills that have
been the subject of much research for several decades, such as at Gloucester, Ontario (McRostie and Crawford, 2001), Berthierville, Québec (Leroueil, 2006) and Onsoy, Norway (Berre, 2014). However, there doesn’t appear to have been much focus on a comparison between the long-term field data and secondary compression estimated from short- and/or long-term consolidation testing in these studies.
Elasto-viscoplasticity (EVP) theory can be used for the prediction of secondary compression. Due to the complexity of most types of EVP models, their use has not been widely adopted in typical engineering practice. However, practical design approaches based on the theory of these more sophisticated methods are being developed and refined (Qu et al., 2014). It is the hope that the laboratory and field data from this study (and others) can be used to further develop and verify these models. As such, the data from the current case study is a practical application for comparing long-term, post-construction in situ secondary compression measurements for an existing fill embankment to predictions/estimates from short- and long-term laboratory consolidation test results. 5 RESULTS OF LABORATORY TESTING AND
FIELD MONITORING Sections 5.1 to 5.3 present a summary of results for the study site from the short-term laboratory consolidation tests, the in situ field settlement monitoring and the long-
term laboratory consolidation tests, respectively. For the purposes of comparing laboratory values of Cαε and Cαe with the values from the field data at similar effective stress levels, the following approximate short-term laboratory consolidation pressures were considered: 300 kPa, 600 kPa and 1200 kPa for each sample depth. It is noted that each of these stress levels is greater than the estimated preconsolidation stress for the portion of the clayey stratum below the near surface crust. For the long-term laboratory consolidation tests, samples were selected at depths of 5 m and 16 m and the following long-term sustained stress levels were applied to the test specimens: 250 kPa and 340 kPa. These test stress levels are representative of the in-situ vertical effective stress conditions at the end of embankment construction at the critical section. The results presented in Sections 5.1 to 5.3 are discussed with the focus on the following four plots:
The method for estimating Sα consistent with
Equation 1;
Plot of Cαe by depth;
Plot of Cαε versus water content consistent with
Mesri (1973); and, Plot of Cαe versus CC consistent with Mesri and
Godlewski (1977).
5.1 Short-Term Laboratory Consolidation Tests In 2003 and 2004 during the initial design stage of the embankment, three (3) standard one-dimensional laboratory consolidation tests were completed on samples obtained from the foundation investigation at depths of 8 m, 11 m and 14 m below original ground surface. A ‘quick’ consolidation test was also performed on another sample at a different depth, but given the nature of this test, this test data was not used to assess secondary compression and it is not discussed further in this paper. In 2013, an additional 3 standard consolidation tests were completed on samples recovered at 5 m and 16 m depths below ground surface. Two tests were completed at 16 m depth due to the transition at this depth from clay to silt, with one test completed on a sample with more silt content and a second test on a sample with a higher clay content. The consolidation tests were completed with 24 hour loading increments, with a total test time about 14 days, and with a ring height of 2.548 cm and a ring diameter of 6.32 cm.
Figure 4 shows the results from a typical stress increment for one of the short-term consolidation test samples and the linear portion at the end of the curve from which Sα is estimated. A plot of the Cαe by depth for the 300 kPa, 600 kPa and 1,200 kPa load increments from the 6 standard consolidation tests is presented on Figure 5. Figure 6 presents a plot of Cαε versus water content for the 3 load increments from each of the short-term consolidation tests while Figure 7 presents a plot of Cαe versus CC. Note that the value of CC presented in Figure 7 is estimated over a range of stresses and not specific to the stress increment of which Cαe is estimated.
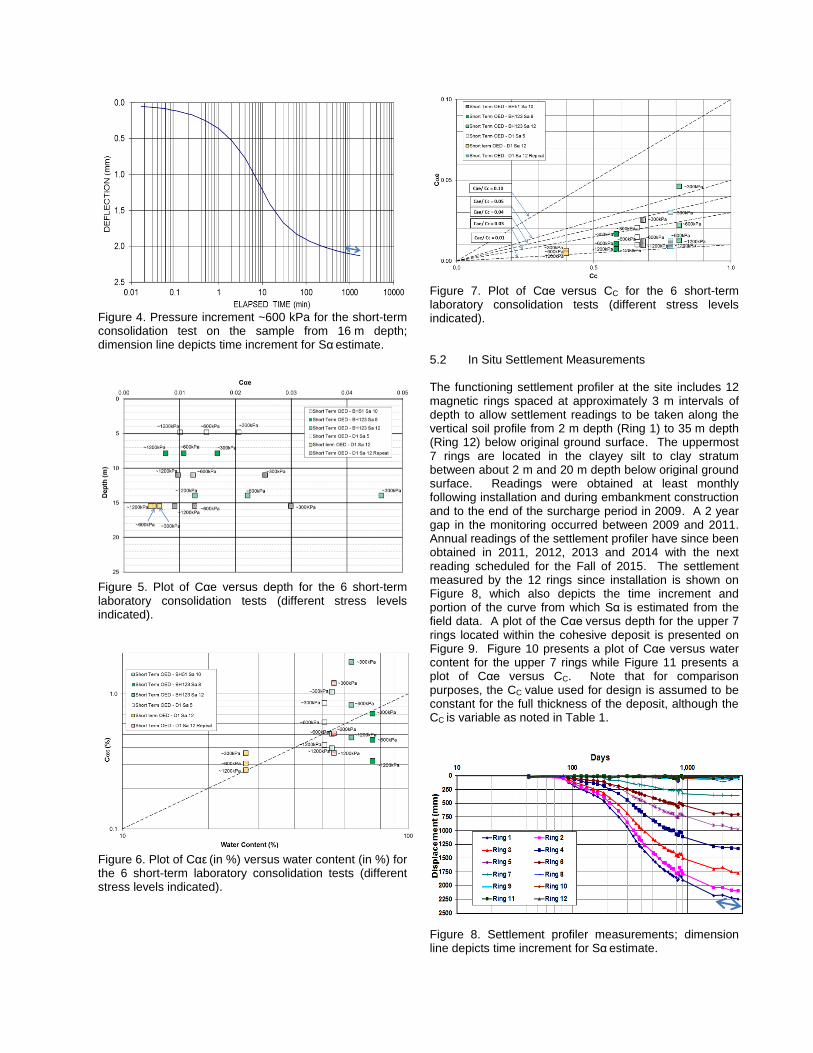
Figure 4. Pressure increment ~600 kPa for the short-term consolidation test on the sample from 16 m depth; dimension line depicts time increment for Sα estimate.
Figure 5. Plot of Cαe versus depth for the 6 short-term laboratory consolidation tests (different stress levels indicated).
Figure 6. Plot of Cαε (in %) versus water content (in %) for the 6 short-term laboratory consolidation tests (different stress levels indicated).
Figure 7. Plot of Cαe versus CC for the 6 short-term laboratory consolidation tests (different stress levels indicated). 5.2 In Situ Settlement Measurements The functioning settlement profiler at the site includes 12 magnetic rings spaced at approximately 3 m intervals of depth to allow settlement readings to be taken along the vertical soil profile from 2 m depth (Ring 1) to 35 m depth (Ring 12) below original ground surface. The uppermost 7 rings are located in the clayey silt to clay stratum between about 2 m and 20 m depth below original ground surface. Readings were obtained at least monthly following installation and during embankment construction and to the end of the surcharge period in 2009. A 2 year gap in the monitoring occurred between 2009 and 2011. Annual readings of the settlement profiler have since been obtained in 2011, 2012, 2013 and 2014 with the next reading scheduled for the Fall of 2015. The settlement measured by the 12 rings since installation is shown on Figure 8, which also depicts the time increment and portion of the curve from which Sα is estimated from the field data. A plot of the Cαe versus depth for the upper 7 rings located within the cohesive deposit is presented on Figure 9. Figure 10 presents a plot of Cαe versus water content for the upper 7 rings while Figure 11 presents a plot of Cαe versus CC. Note that for comparison purposes, the CC value used for design is assumed to be constant for the full thickness of the deposit, although the CC is variable as noted in Table 1.
Figure 8. Settlement profiler measurements; dimension line depicts time increment for Sα estimate.
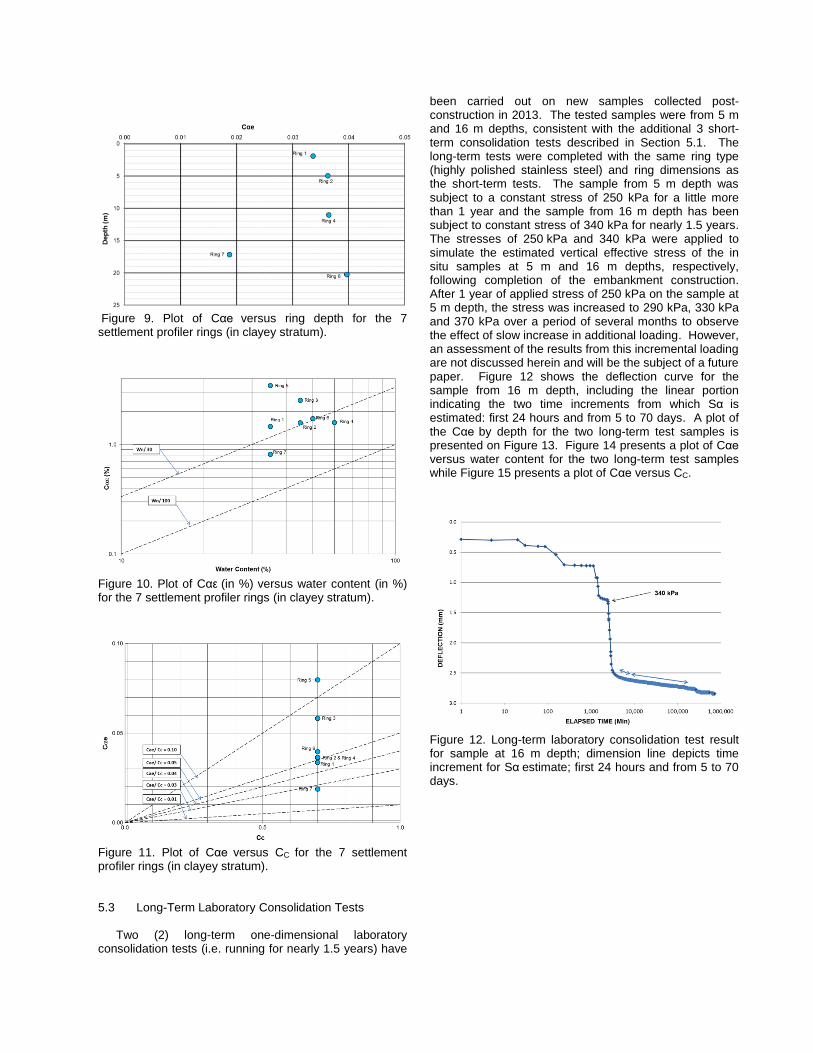
Figure 9. Plot of Cαe versus ring depth for the 7 settlement profiler rings (in clayey stratum).
Figure 10. Plot of Cαε (in %) versus water content (in %) for the 7 settlement profiler rings (in clayey stratum).
Figure 11. Plot of Cαe versus CC for the 7 settlement profiler rings (in clayey stratum). 5.3 Long-Term Laboratory Consolidation Tests
Two (2) long-term one-dimensional laboratory consolidation tests (i.e. running for nearly 1.5 years) have
been carried out on new samples collected post-construction in 2013. The tested samples were from 5 m and 16 m depths, consistent with the additional 3 short-term consolidation tests described in Section 5.1. The long-term tests were completed with the same ring type (highly polished stainless steel) and ring dimensions as the short-term tests. The sample from 5 m depth was subject to a constant stress of 250 kPa for a little more than 1 year and the sample from 16 m depth has been subject to constant stress of 340 kPa for nearly 1.5 years. The stresses of 250 kPa and 340 kPa were applied to simulate the estimated vertical effective stress of the in situ samples at 5 m and 16 m depths, respectively, following completion of the embankment construction. After 1 year of applied stress of 250 kPa on the sample at 5 m depth, the stress was increased to 290 kPa, 330 kPa and 370 kPa over a period of several months to observe the effect of slow increase in additional loading. However, an assessment of the results from this incremental loading are not discussed herein and will be the subject of a future paper. Figure 12 shows the deflection curve for the sample from 16 m depth, including the linear portion indicating the two time increments from which Sα is estimated: first 24 hours and from 5 to 70 days. A plot of the Cαe by depth for the two long-term test samples is presented on Figure 13. Figure 14 presents a plot of Cαe versus water content for the two long-term test samples while Figure 15 presents a plot of Cαe versus CC.
Figure 12. Long-term laboratory consolidation test result for sample at 16 m depth; dimension line depicts time increment for Sα estimate; first 24 hours and from 5 to 70 days.
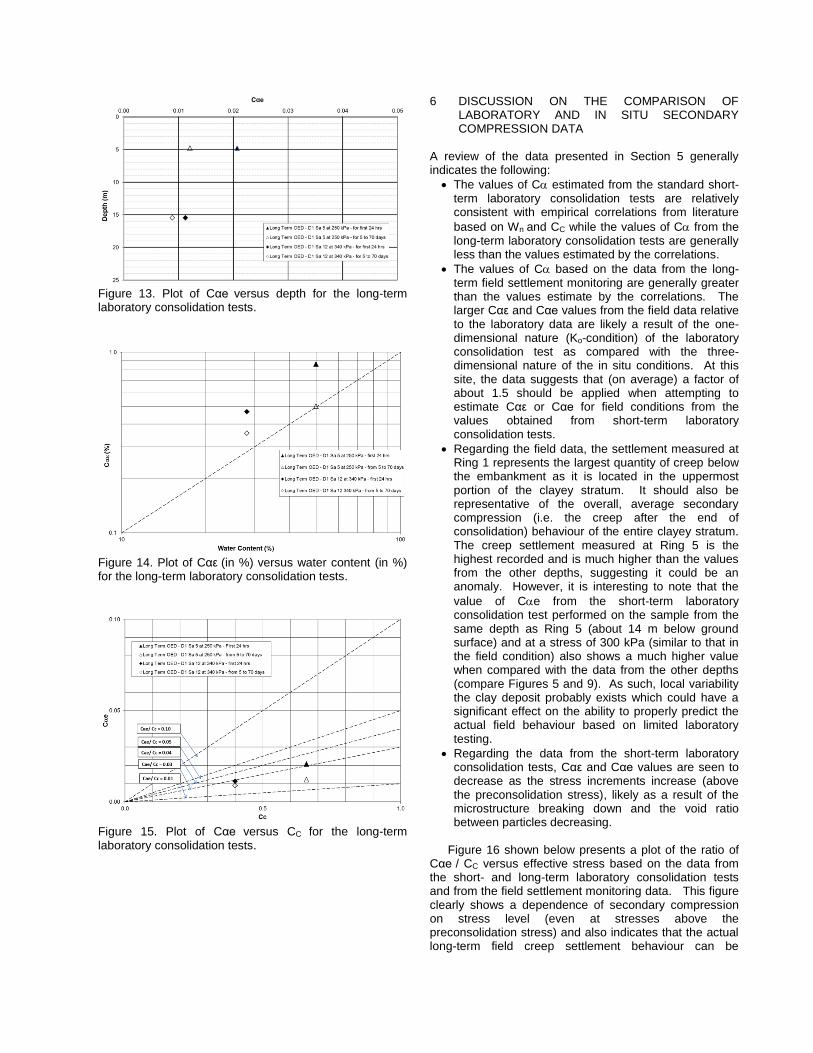
Figure 13. Plot of Cαe versus depth for the long-term laboratory consolidation tests.
Figure 14. Plot of Cαε (in %) versus water content (in %) for the long-term laboratory consolidation tests.
Figure 15. Plot of Cαe versus CC for the long-term laboratory consolidation tests.
6 DISCUSSION ON THE COMPARISON OF LABORATORY AND IN SITU SECONDARY COMPRESSION DATA
A review of the data presented in Section 5 generally indicates the following:
The values of C estimated from the standard short-term laboratory consolidation tests are relatively consistent with empirical correlations from literature
based on Wn and CC while the values of C from the long-term laboratory consolidation tests are generally less than the values estimated by the correlations.
The values of C based on the data from the long-term field settlement monitoring are generally greater than the values estimate by the correlations. The larger Cαε and Cαe values from the field data relative to the laboratory data are likely a result of the one-dimensional nature (Ko-condition) of the laboratory consolidation test as compared with the three-dimensional nature of the in situ conditions. At this site, the data suggests that (on average) a factor of about 1.5 should be applied when attempting to estimate Cαε or Cαe for field conditions from the values obtained from short-term laboratory consolidation tests.
Regarding the field data, the settlement measured at Ring 1 represents the largest quantity of creep below the embankment as it is located in the uppermost portion of the clayey stratum. It should also be representative of the overall, average secondary compression (i.e. the creep after the end of consolidation) behaviour of the entire clayey stratum. The creep settlement measured at Ring 5 is the highest recorded and is much higher than the values from the other depths, suggesting it could be an anomaly. However, it is interesting to note that the
value of Ce from the short-term laboratory consolidation test performed on the sample from the same depth as Ring 5 (about 14 m below ground surface) and at a stress of 300 kPa (similar to that in the field condition) also shows a much higher value when compared with the data from the other depths (compare Figures 5 and 9). As such, local variability the clay deposit probably exists which could have a significant effect on the ability to properly predict the actual field behaviour based on limited laboratory testing.
Regarding the data from the short-term laboratory consolidation tests, Cαε and Cαe values are seen to decrease as the stress increments increase (above the preconsolidation stress), likely as a result of the microstructure breaking down and the void ratio between particles decreasing.
Figure 16 shown below presents a plot of the ratio of
Cαe / CC versus effective stress based on the data from the short- and long-term laboratory consolidation tests and from the field settlement monitoring data. This figure clearly shows a dependence of secondary compression on stress level (even at stresses above the preconsolidation stress) and also indicates that the actual long-term field creep settlement behaviour can be
significantly greater than that estimated from laboratory testing (and by extension, from empirical correlations). For future studies, the estimation of CC should consider the stress range over which Cαe is estimated.
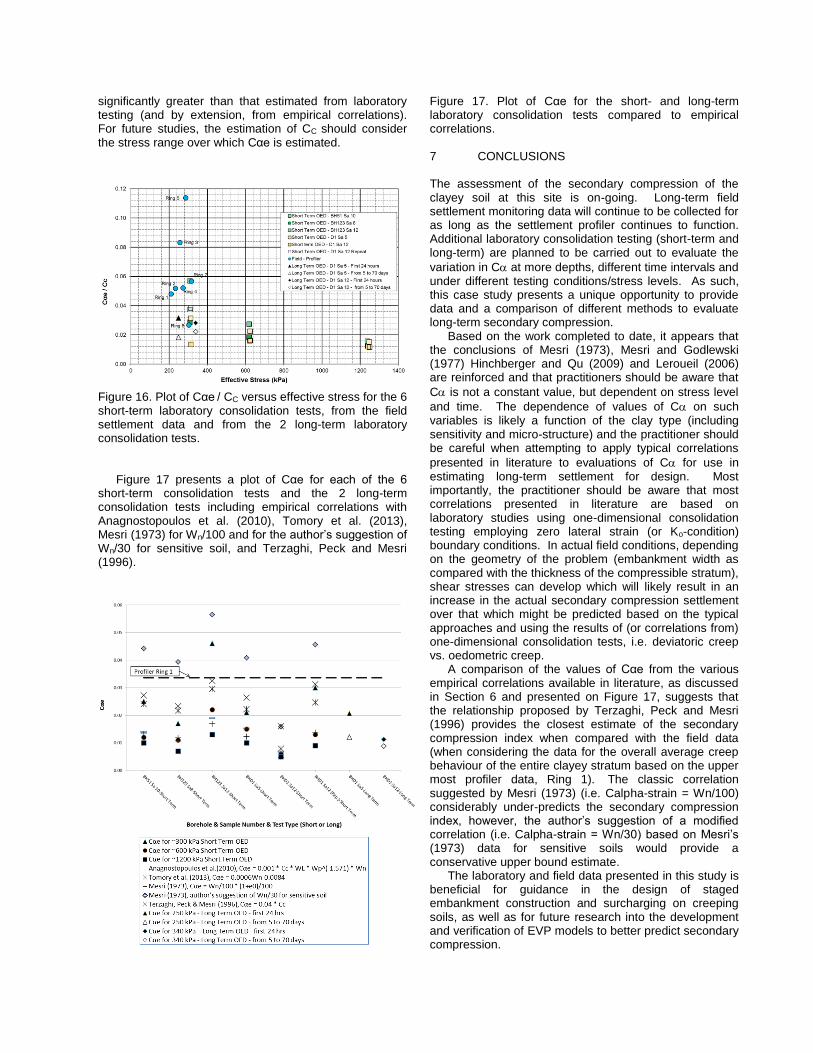
Figure 16. Plot of Cαe / CC versus effective stress for the 6 short-term laboratory consolidation tests, from the field settlement data and from the 2 long-term laboratory consolidation tests.
Figure 17 presents a plot of Cαe for each of the 6 short-term consolidation tests and the 2 long-term consolidation tests including empirical correlations with Anagnostopoulos et al. (2010), Tomory et al. (2013), Mesri (1973) for Wn/100 and for the author’s suggestion of Wn/30 for sensitive soil, and Terzaghi, Peck and Mesri (1996).
Figure 17. Plot of Cαe for the short- and long-term laboratory consolidation tests compared to empirical correlations. 7 CONCLUSIONS The assessment of the secondary compression of the clayey soil at this site is on-going. Long-term field settlement monitoring data will continue to be collected for as long as the settlement profiler continues to function. Additional laboratory consolidation testing (short-term and long-term) are planned to be carried out to evaluate the
variation in C at more depths, different time intervals and under different testing conditions/stress levels. As such, this case study presents a unique opportunity to provide data and a comparison of different methods to evaluate long-term secondary compression.
Based on the work completed to date, it appears that the conclusions of Mesri (1973), Mesri and Godlewski (1977) Hinchberger and Qu (2009) and Leroueil (2006) are reinforced and that practitioners should be aware that
C is not a constant value, but dependent on stress level
and time. The dependence of values of C on such variables is likely a function of the clay type (including sensitivity and micro-structure) and the practitioner should be careful when attempting to apply typical correlations
presented in literature to evaluations of C for use in estimating long-term settlement for design. Most importantly, the practitioner should be aware that most correlations presented in literature are based on laboratory studies using one-dimensional consolidation testing employing zero lateral strain (or Ko-condition) boundary conditions. In actual field conditions, depending on the geometry of the problem (embankment width as compared with the thickness of the compressible stratum), shear stresses can develop which will likely result in an increase in the actual secondary compression settlement over that which might be predicted based on the typical approaches and using the results of (or correlations from) one-dimensional consolidation tests, i.e. deviatoric creep vs. oedometric creep.
A comparison of the values of Cαe from the various empirical correlations available in literature, as discussed in Section 6 and presented on Figure 17, suggests that the relationship proposed by Terzaghi, Peck and Mesri (1996) provides the closest estimate of the secondary compression index when compared with the field data (when considering the data for the overall average creep behaviour of the entire clayey stratum based on the upper most profiler data, Ring 1). The classic correlation suggested by Mesri (1973) (i.e. Calpha-strain = Wn/100) considerably under-predicts the secondary compression index, however, the author’s suggestion of a modified correlation (i.e. Calpha-strain = Wn/30) based on Mesri’s (1973) data for sensitive soils would provide a conservative upper bound estimate.
The laboratory and field data presented in this study is beneficial for guidance in the design of staged embankment construction and surcharging on creeping soils, as well as for future research into the development and verification of EVP models to better predict secondary compression.
ACKNOWLEDGEMENTS The writers would like to acknowledge the support from Adam Core, Sarah Poot and Andre Zerwer of Golder Associates Ltd. in Sudbury, Ontario. REFERENCES Anagnostopoulos, C.A. and Grammatikopoulos, I.N. 2011.
A New Model for the Prediction of Secondary Compression Index of Soft Compressible Soils. Bulletin of Engineering Geology and the Environment, 70: 423-427.
Berre, T. 2014. Test Fill on Soft Plastic Marine Clay at Onsoy, Norway. Canadian Geotechnical Journal, 51: 30-50.
Hinchberger, S. D. and G. Qu 2009. Viscoplastic constitutive approach for rate-sensitive clays. Canadian Geotechnical Journal, 46: 609-626
Holtz, R. and Kovacs, W. 1981. An Introduction to Geotechnical Engineering. Prentice Hall, Inc., Englewood Cliffs, New Jersey.
Keene, P. 1978. Time-and Stress-Compressibility Interrelationship, A Discussion. Journal of the Geotechnical Engineering Division, ASCE, 104: 506-508.
Leroueil, S. 2006. Suklje’s Memorial Lecture – The isotache approach: Where are we fifty years after its development by Professor Suklje?. Proc. European-Danube Conf. on Geotechnical Engineering, Ljubljana,
Vol.1: 55-88. McRostie, G.C. and Crawford, C.B. 2001. Canadian
Geotechnical Resourch Site No.1 at Gloucester. Canadian Geotechnical Journal, 38: 1134-1141.
Mesri, G. 1973. Coefficient of Secondary Compression, Journal of the Soil Mechanics and Foundations Division, ASCE, 99: 123-137.
Mesri, G. and Godlewski, P.M. 1977. Time- and Stress-Compressibility Interrelationship, Journal of the Geotechnical Engineering Division, ASCE, 103:417-430.
Mesri, G. and Godlewski, P.M. 1979. Time- and Stress-Compressibility Interrelationship, Closure, Journal of the Geotechnical Engineering Division, ASCE, 105:106-113.
Qu, G., Hinchberger, S., Shi, K. and Dittrich, J.P. 2014. An EVP Approach for Embankment Surcharge Design, 67
th Canadian Geotechnical Conference,
CGS, Regina, Saskatchewan. Terzaghi, K., Peck, R.B. and Mesri, G 1996. Soil
Mechanics in Engineering Practice, 2nd ed., John
Wiley & Sons, Inc., New York, NY, USA. Tomory, A., Grabinsky, M., Dittrich, J.P. and Bom, A.
2013. Engineering Properties of Cohesive Soils in Northern Ontario, 66
th Canadian Geotechnical
Conference, CGS, Montréal, Québec.